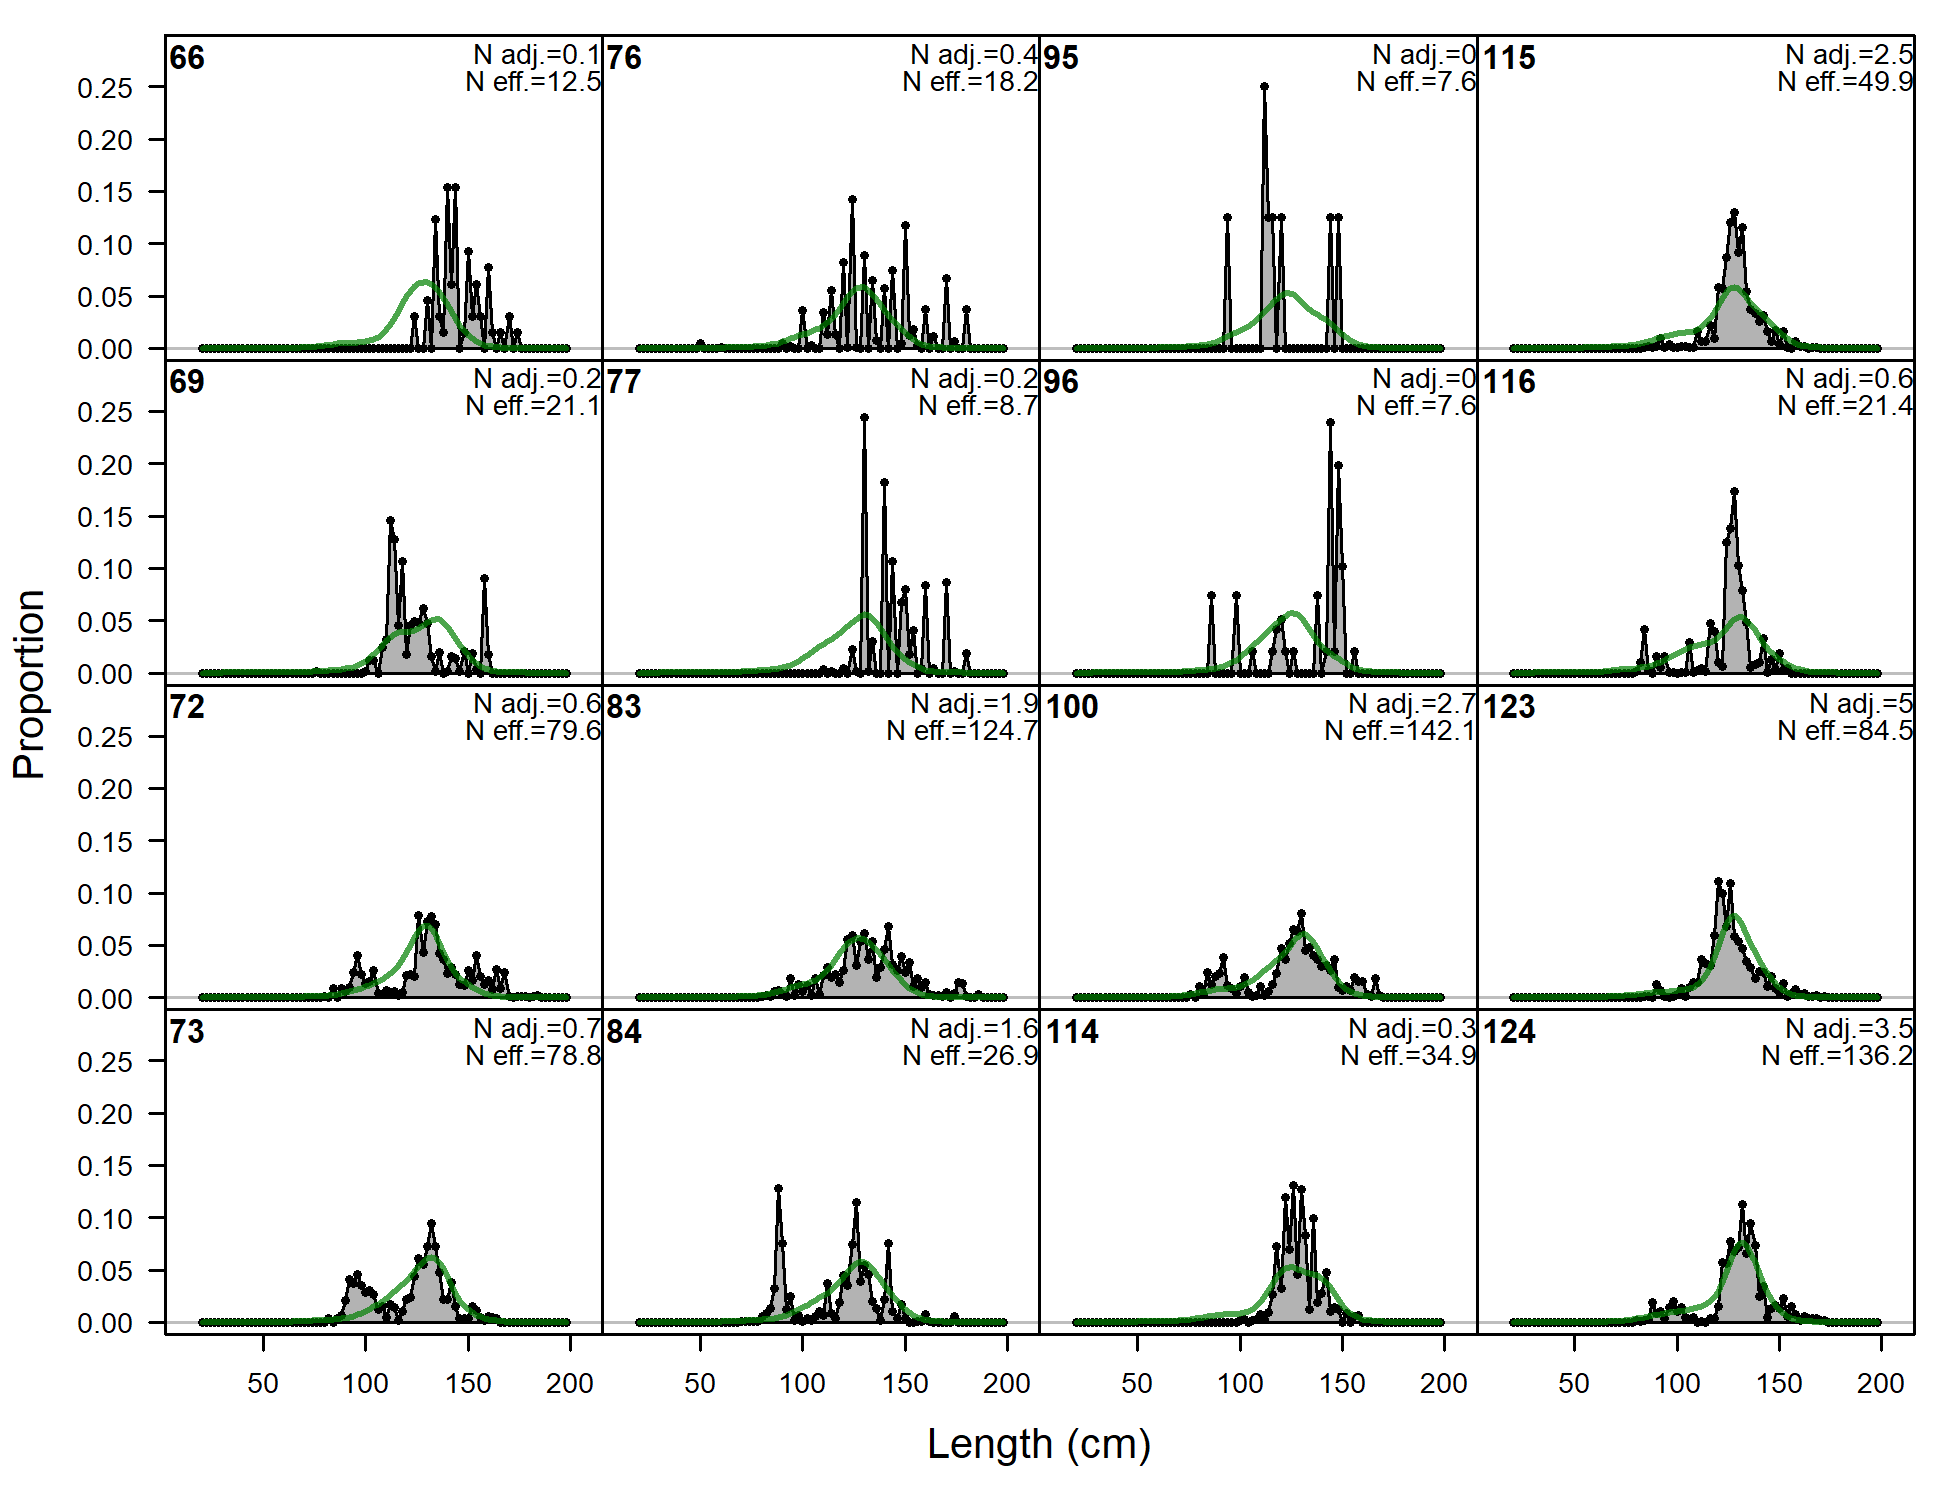
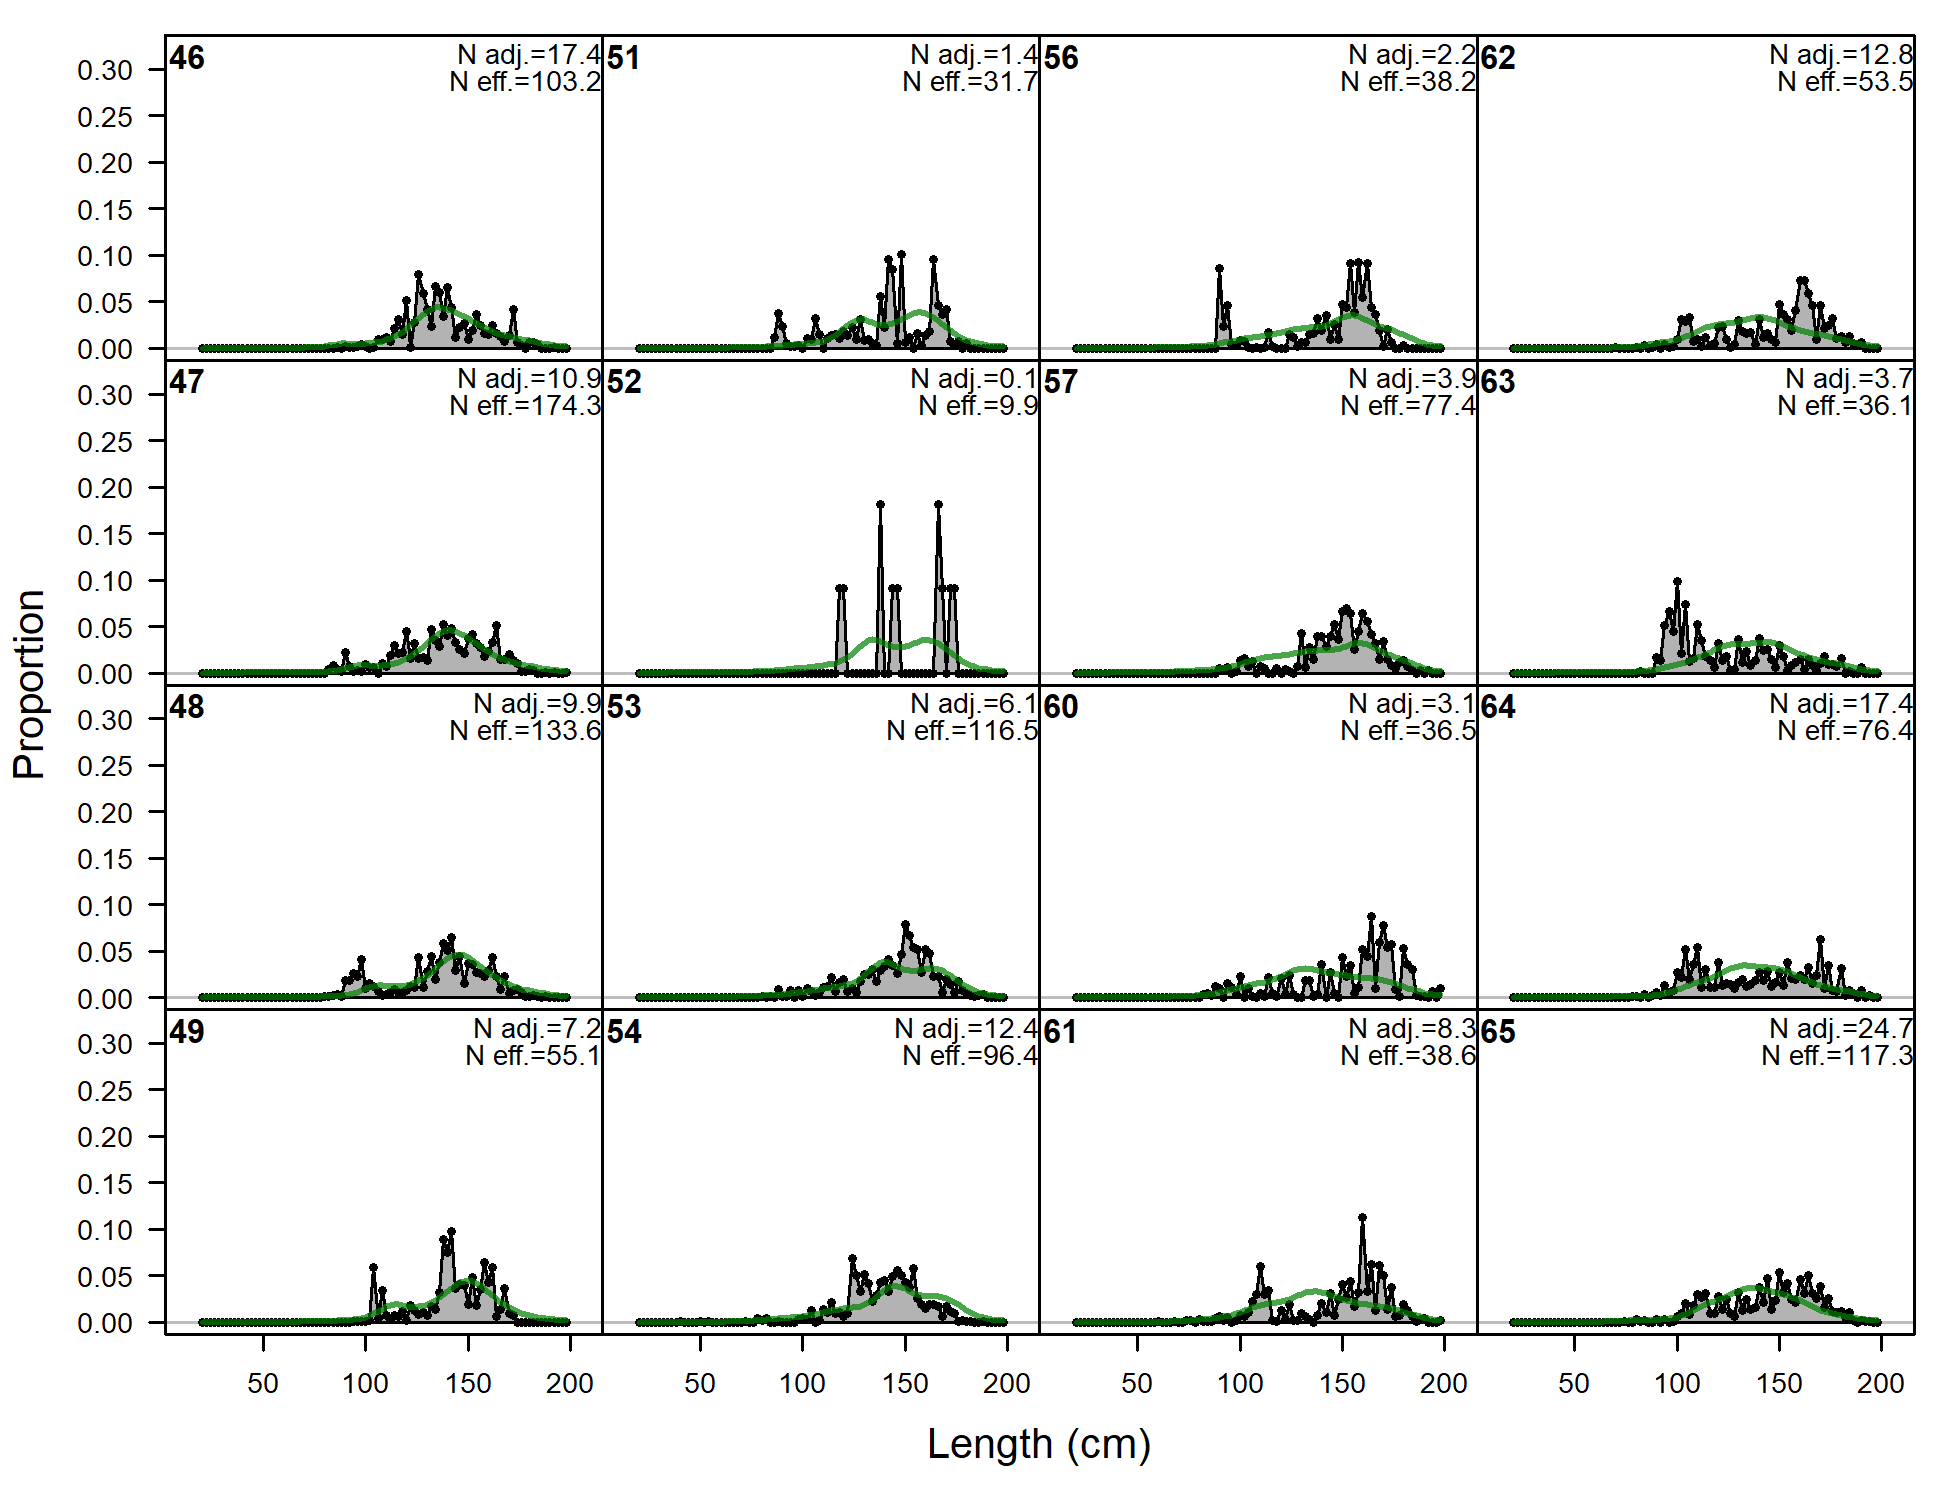
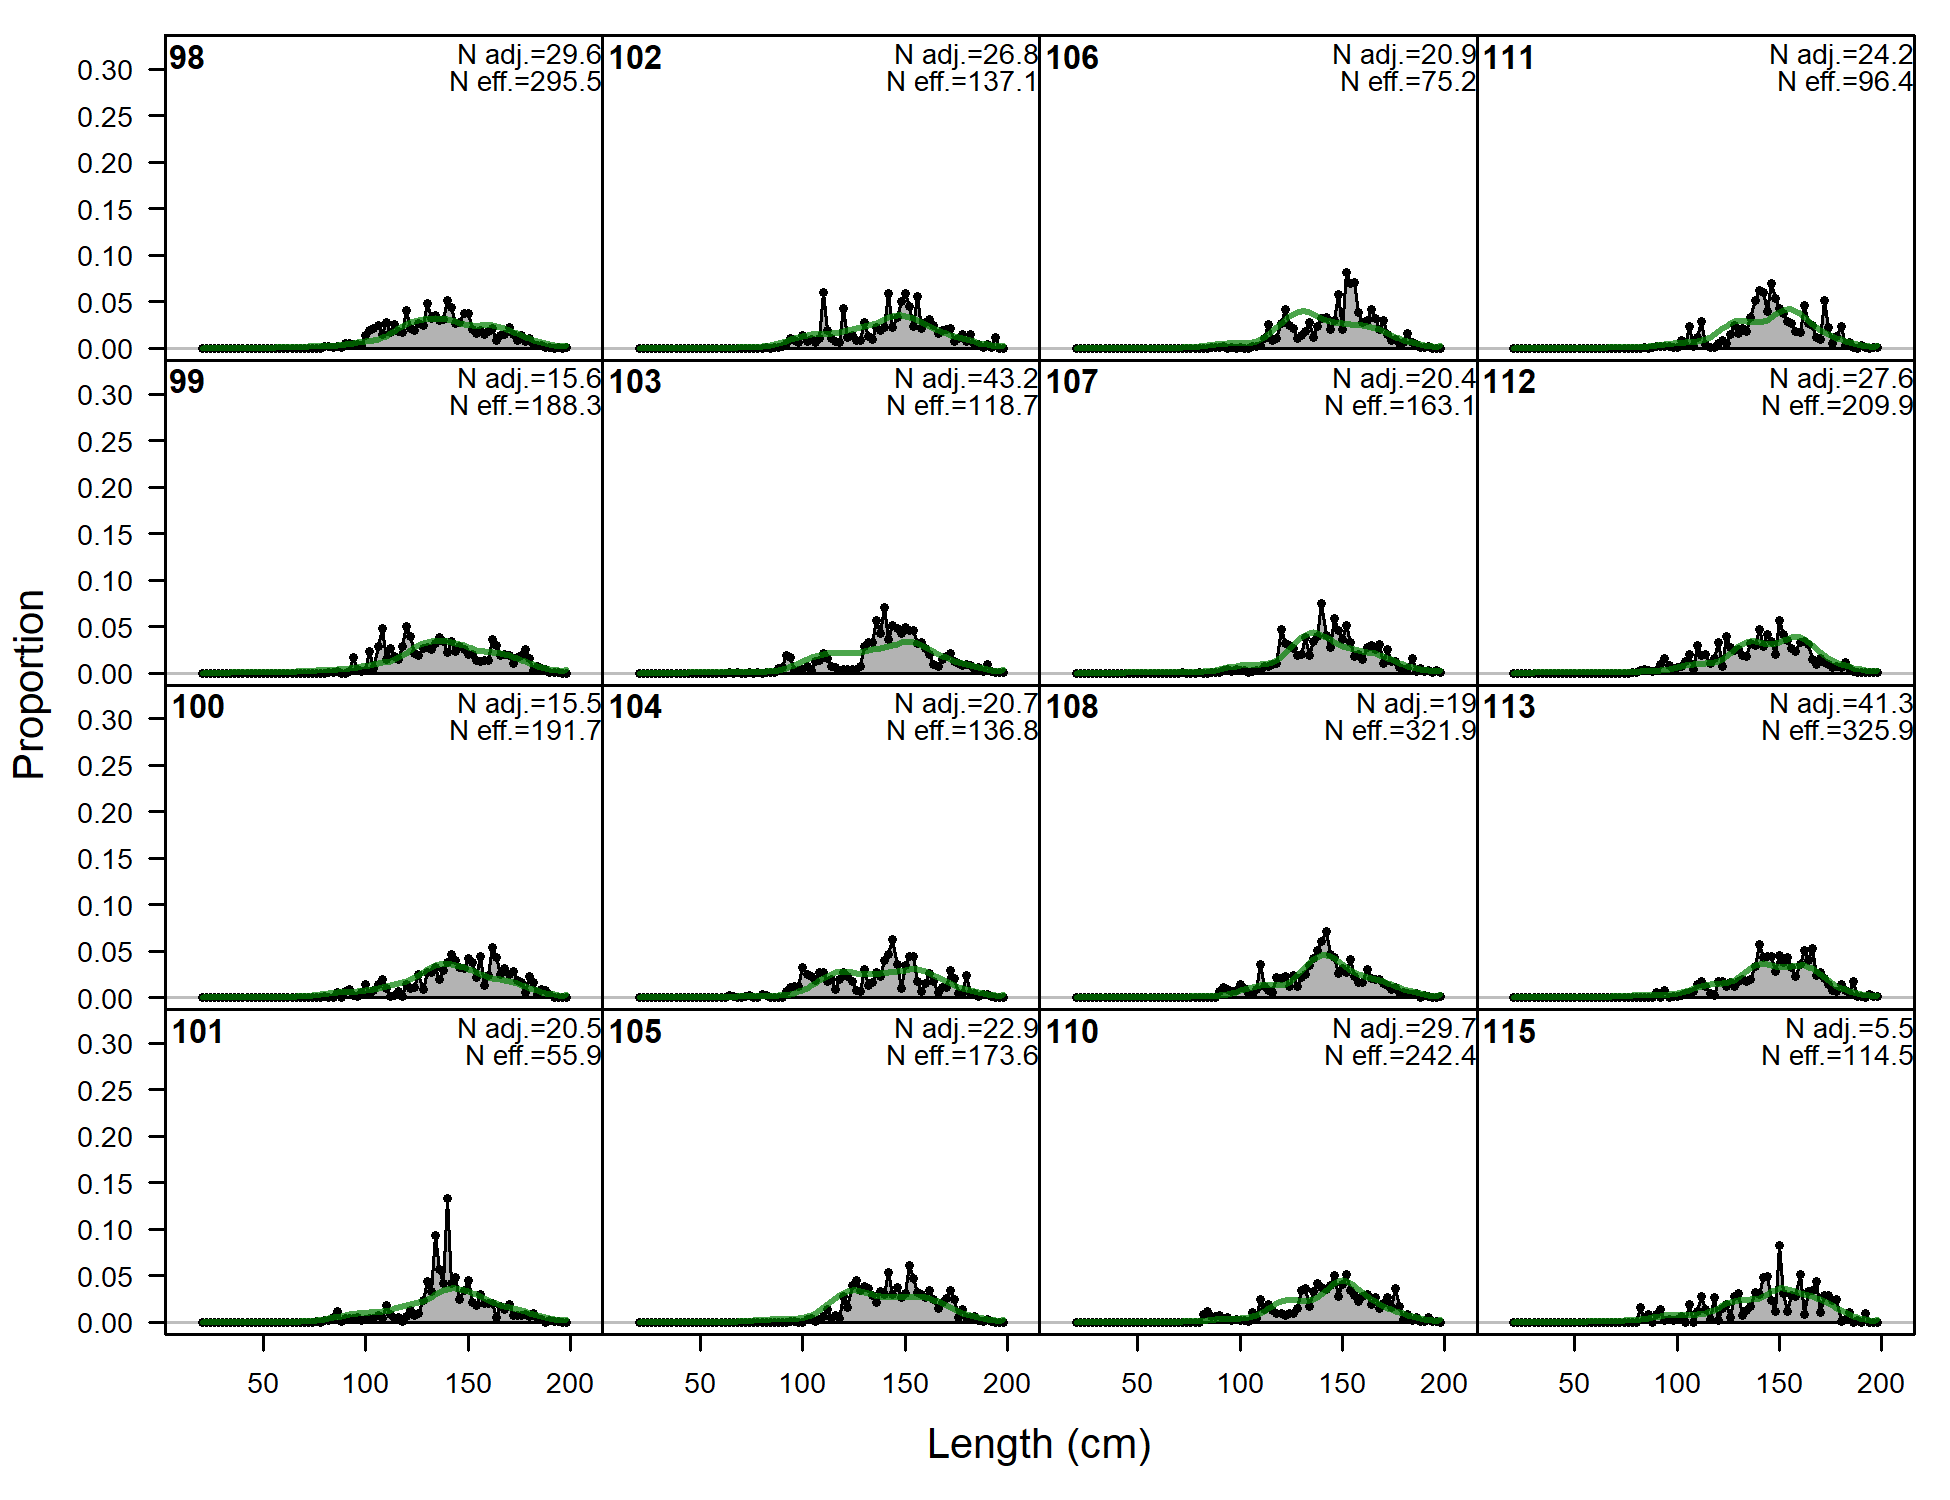
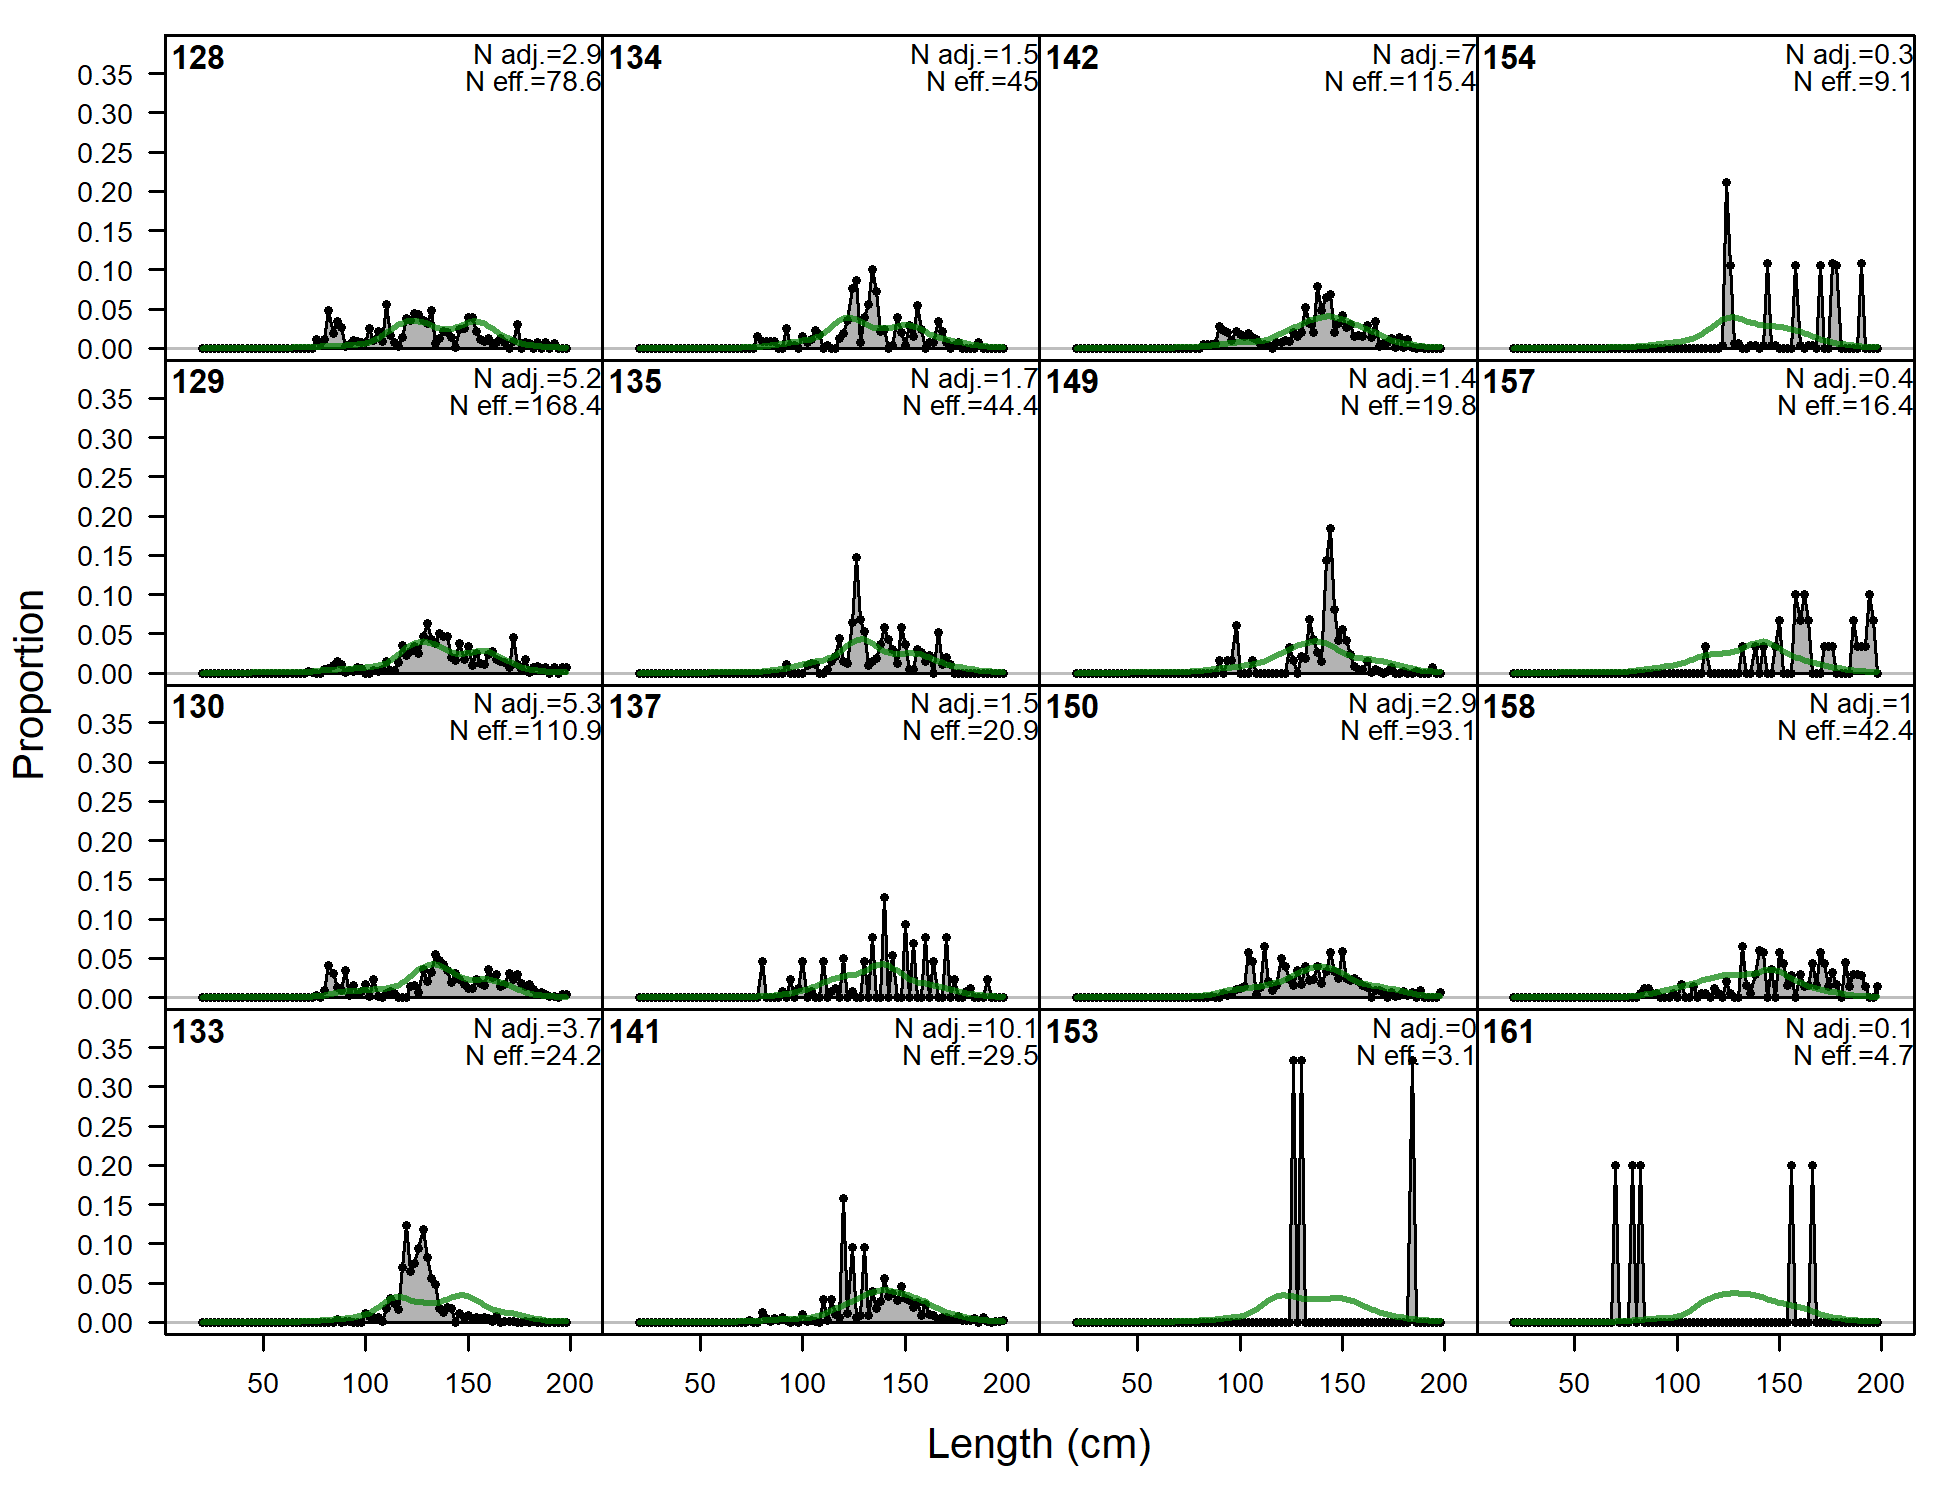
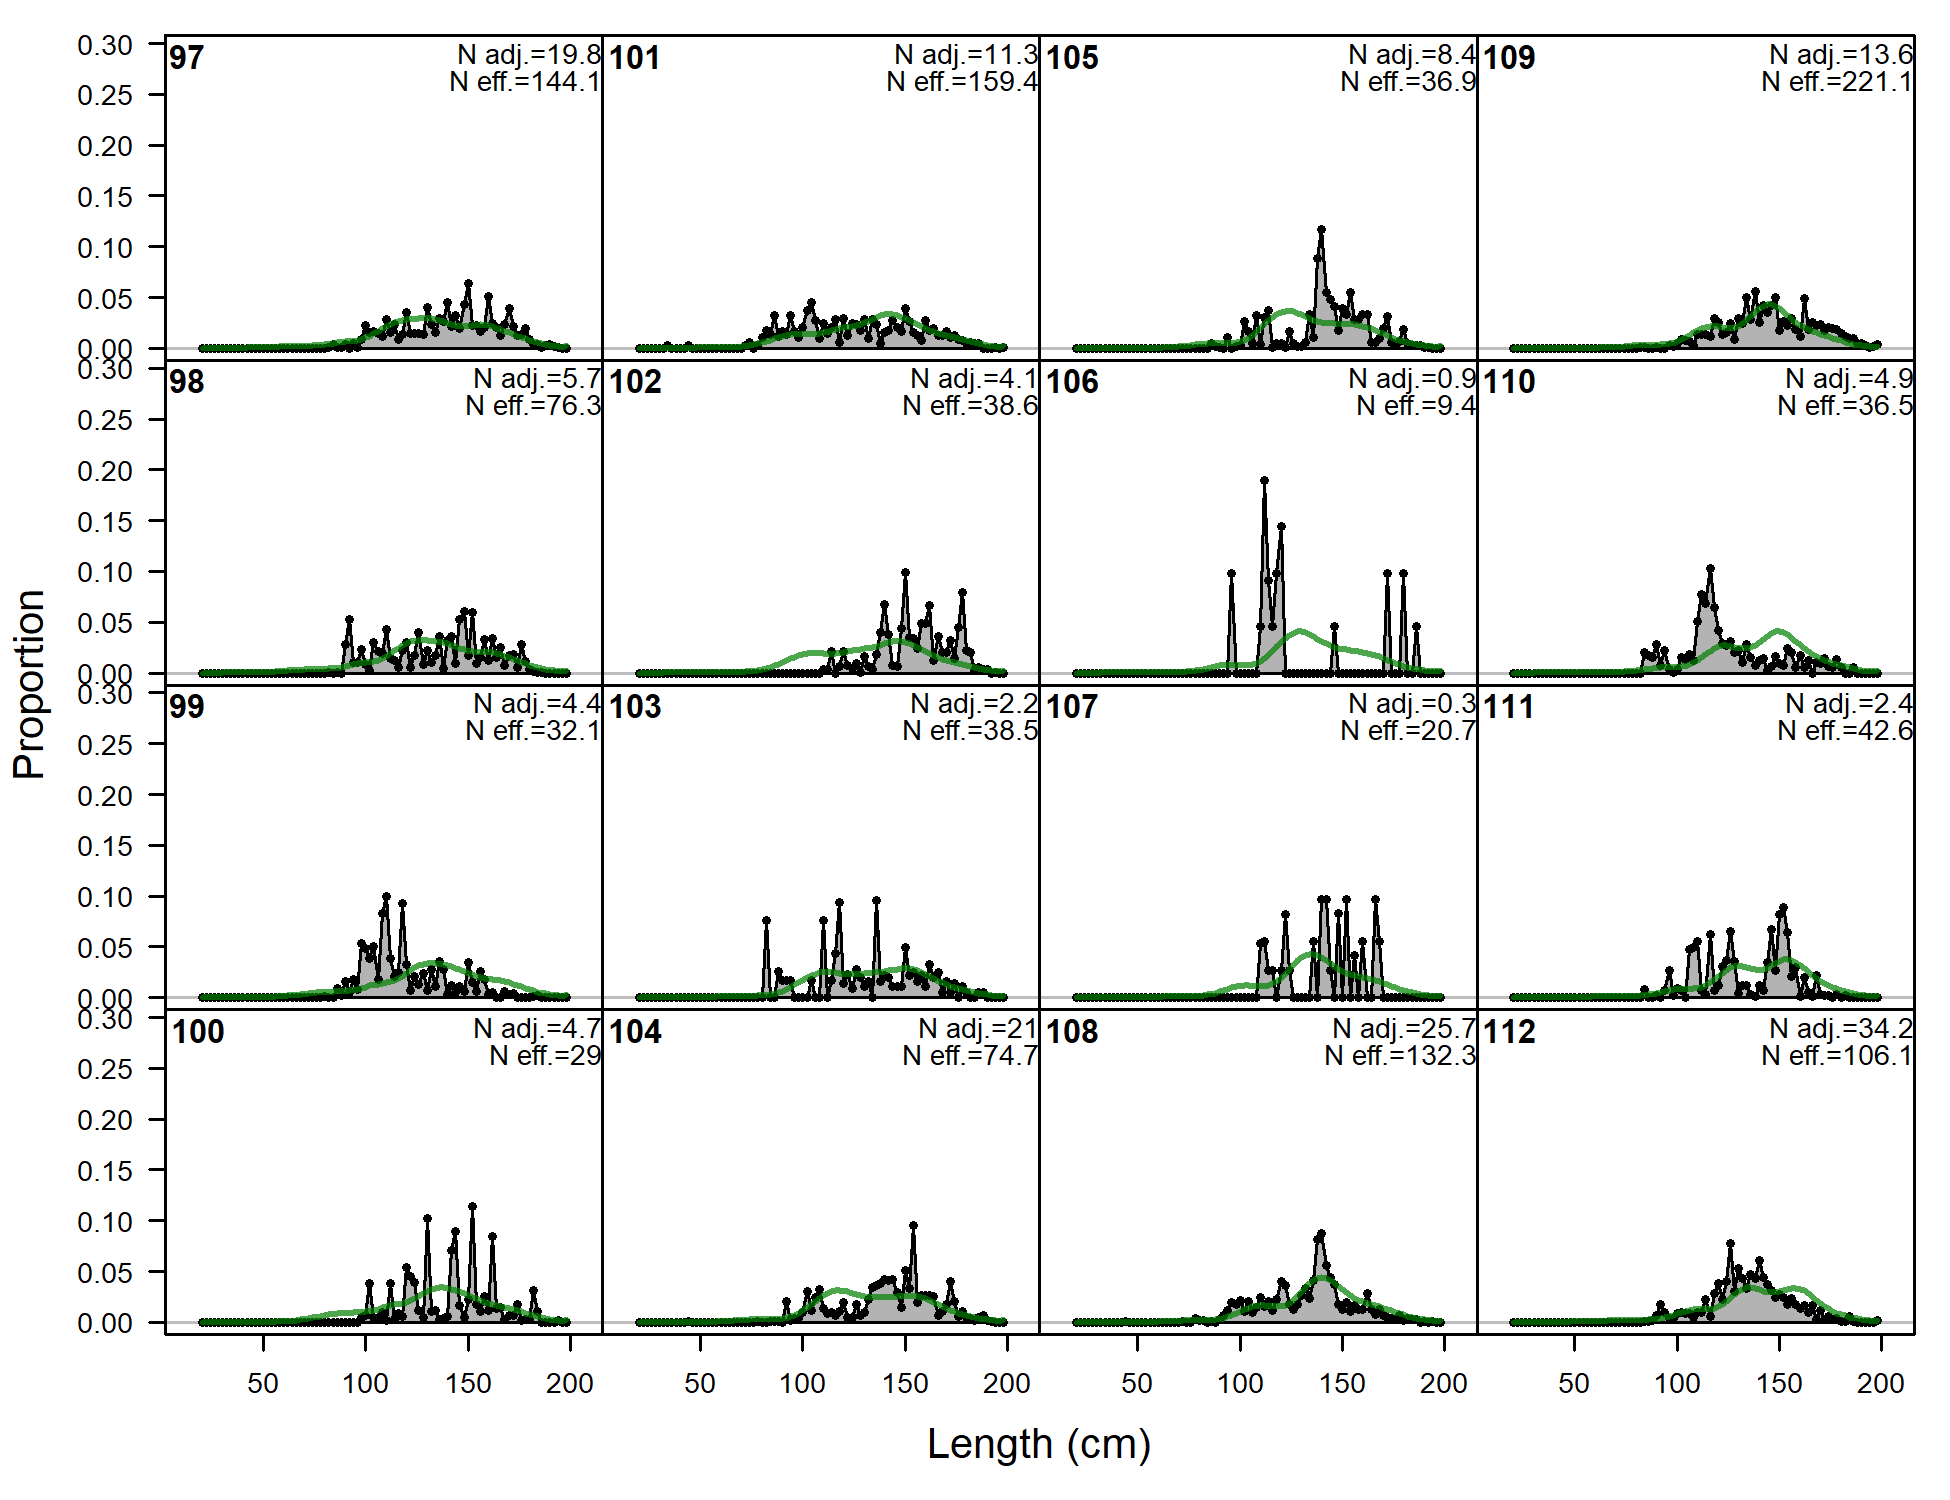
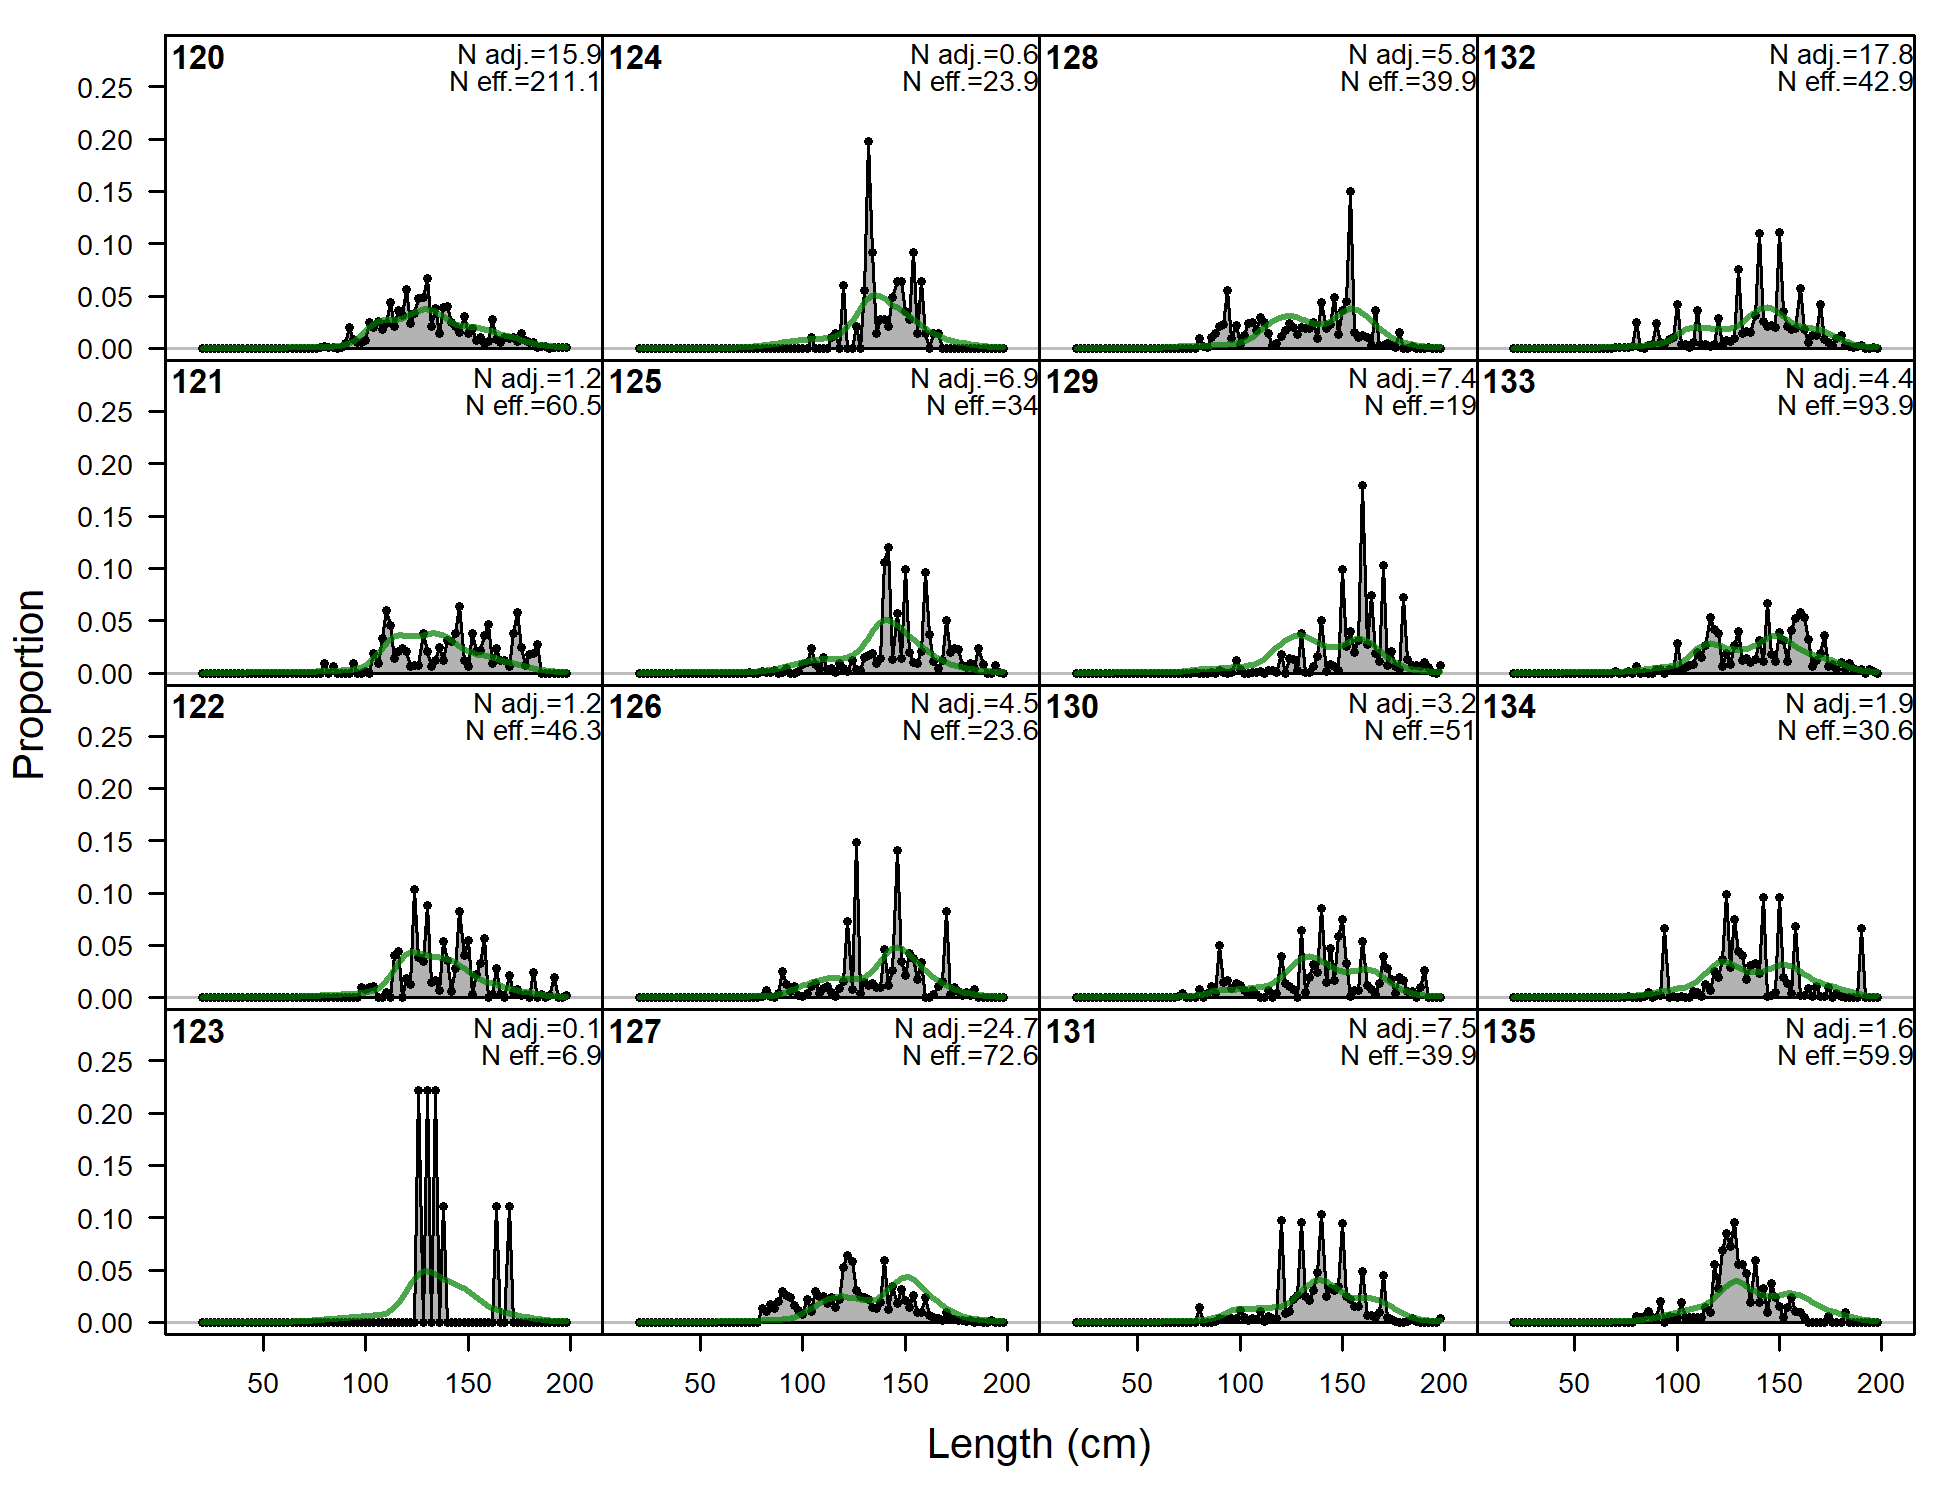
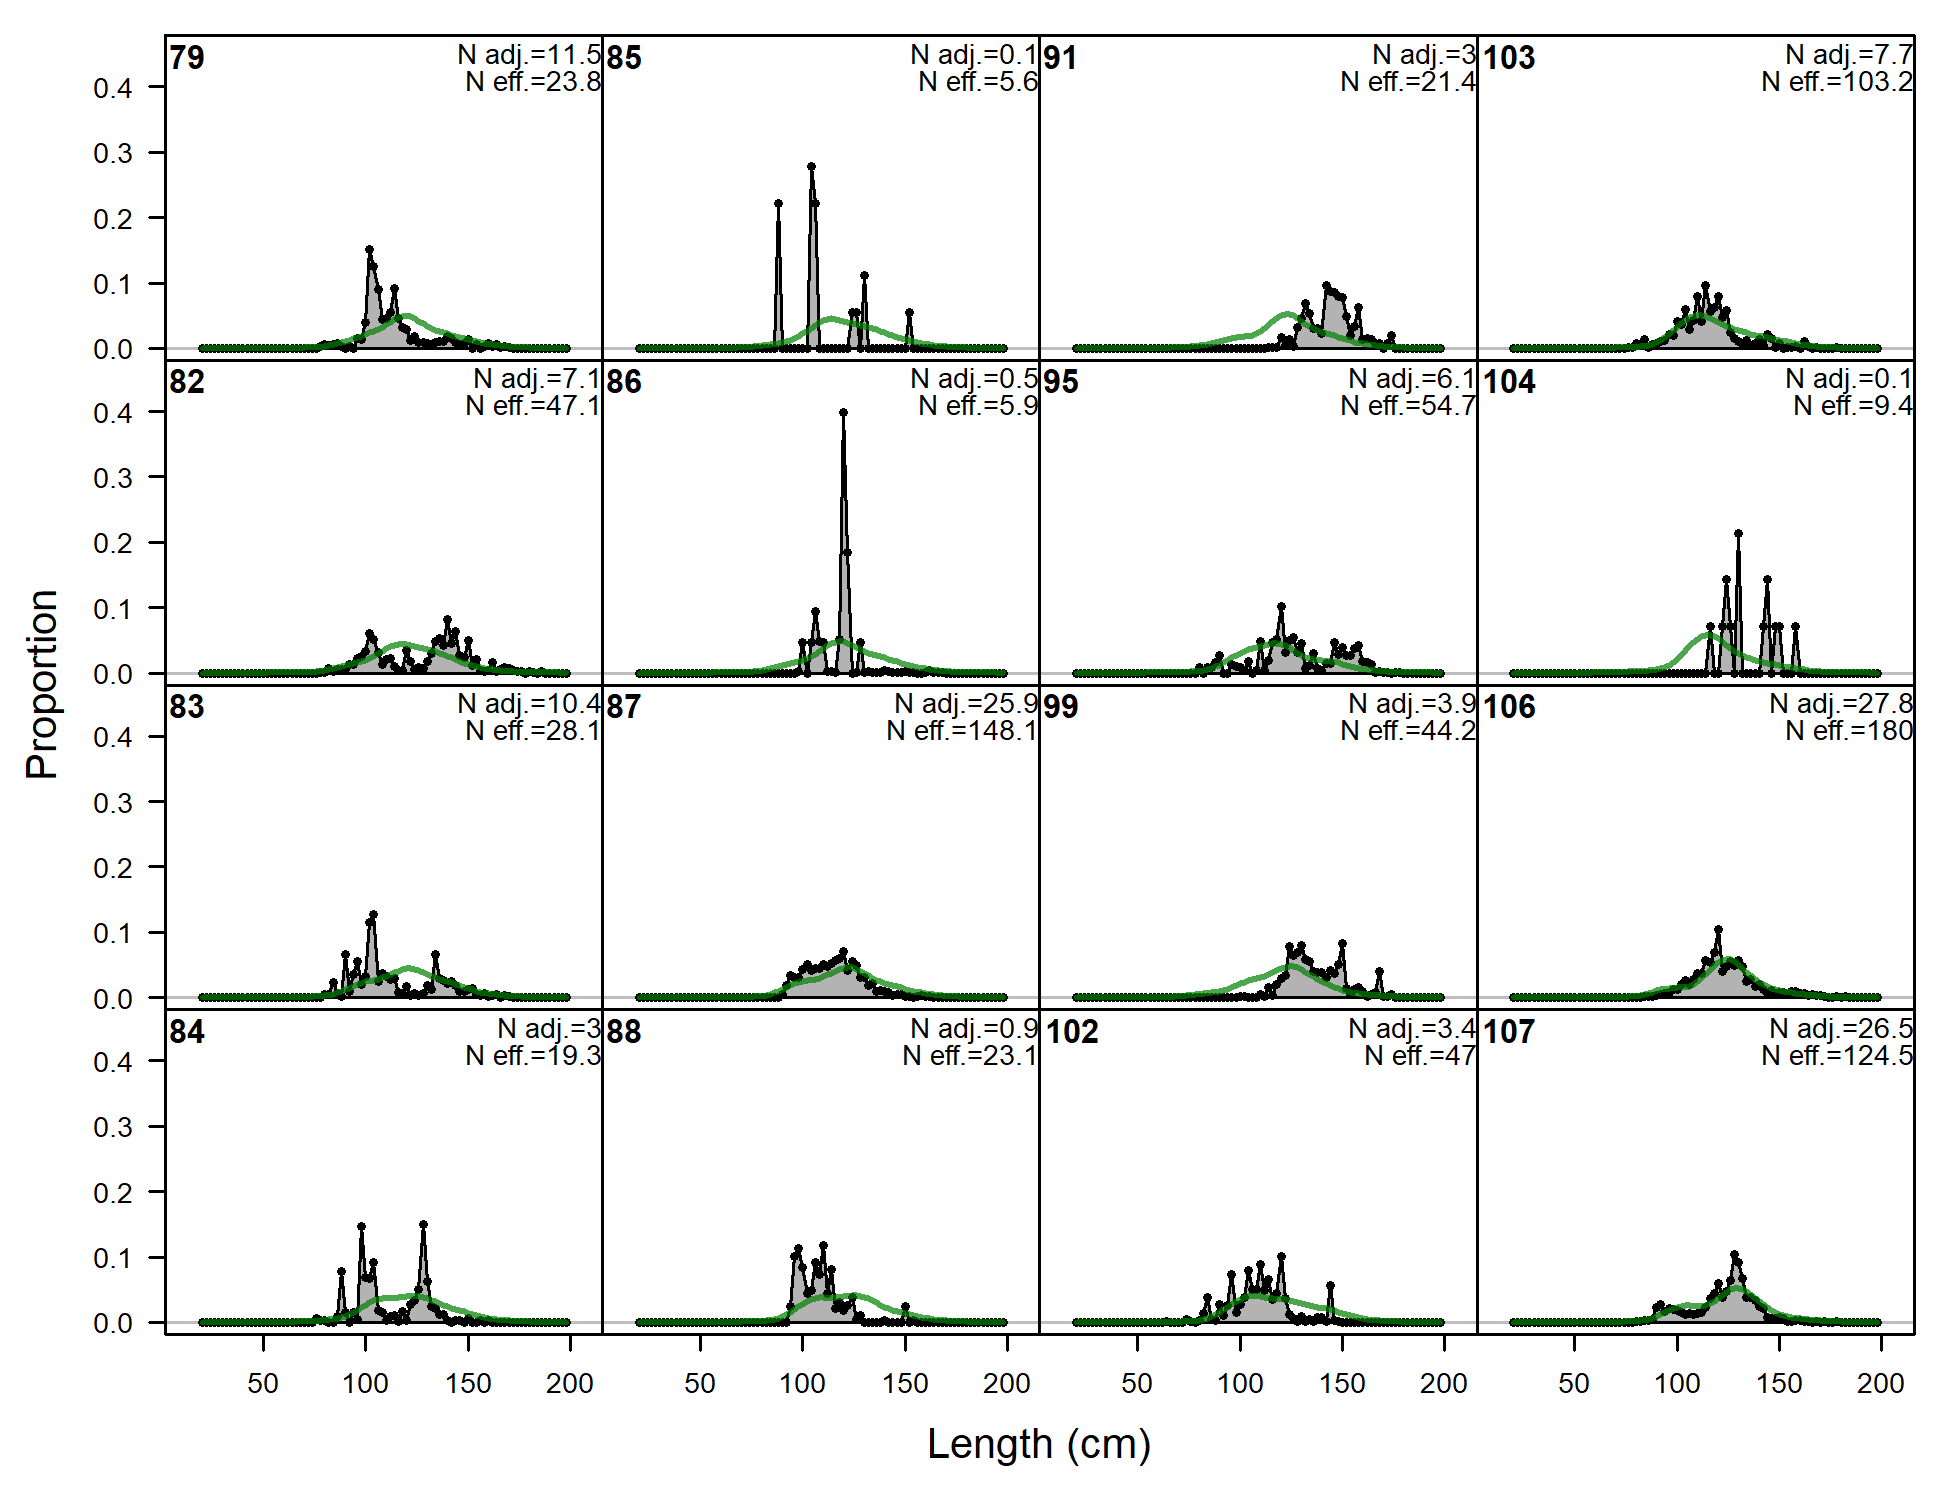
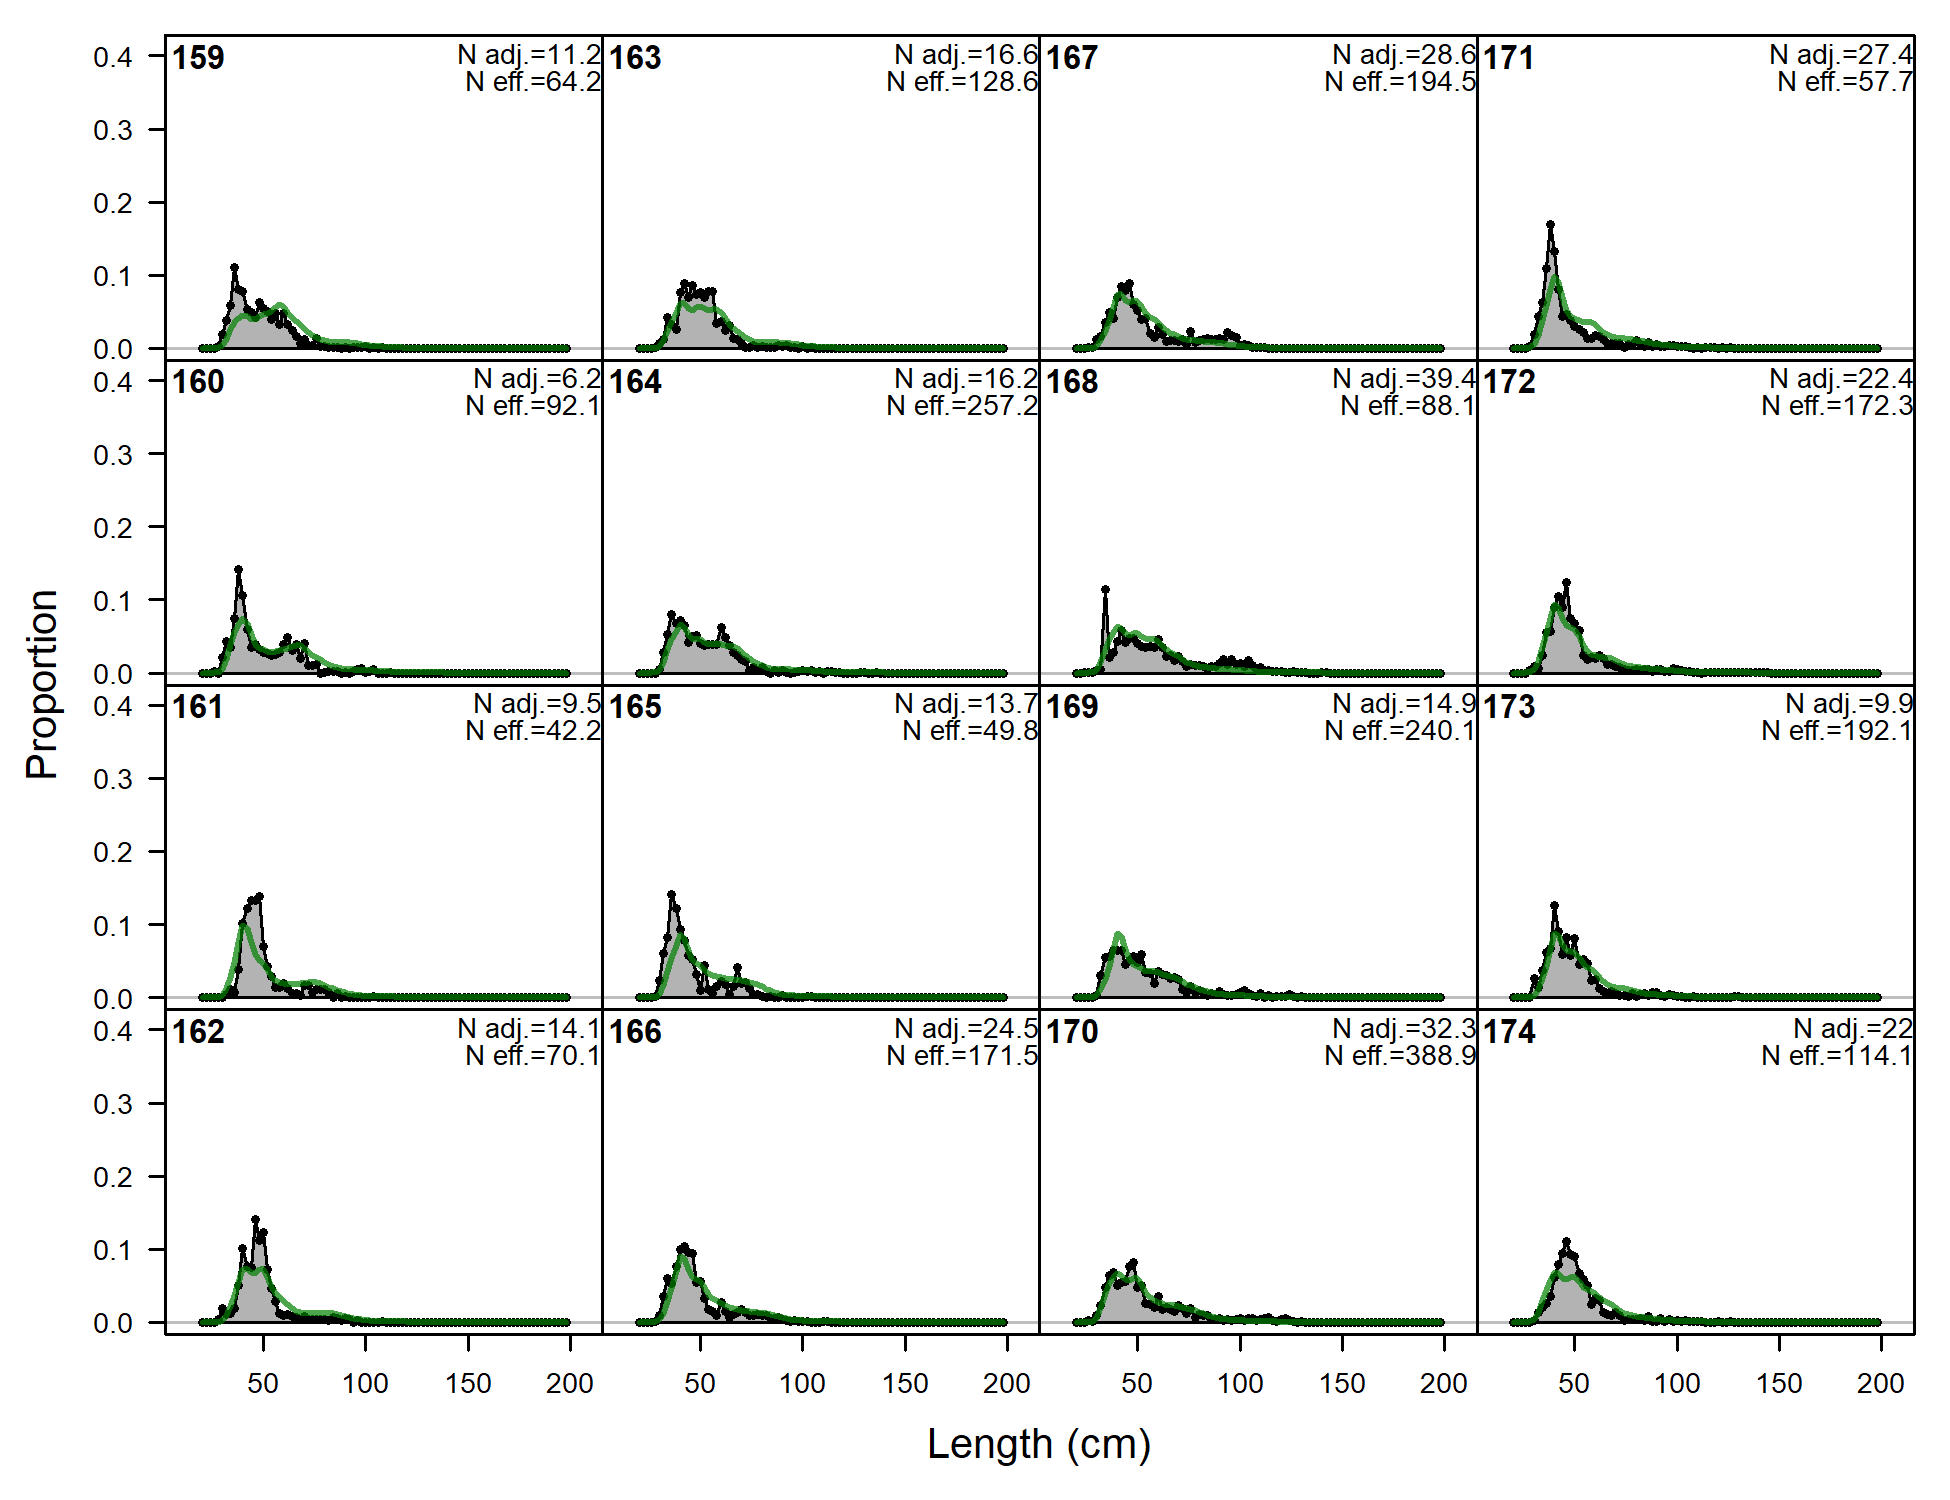
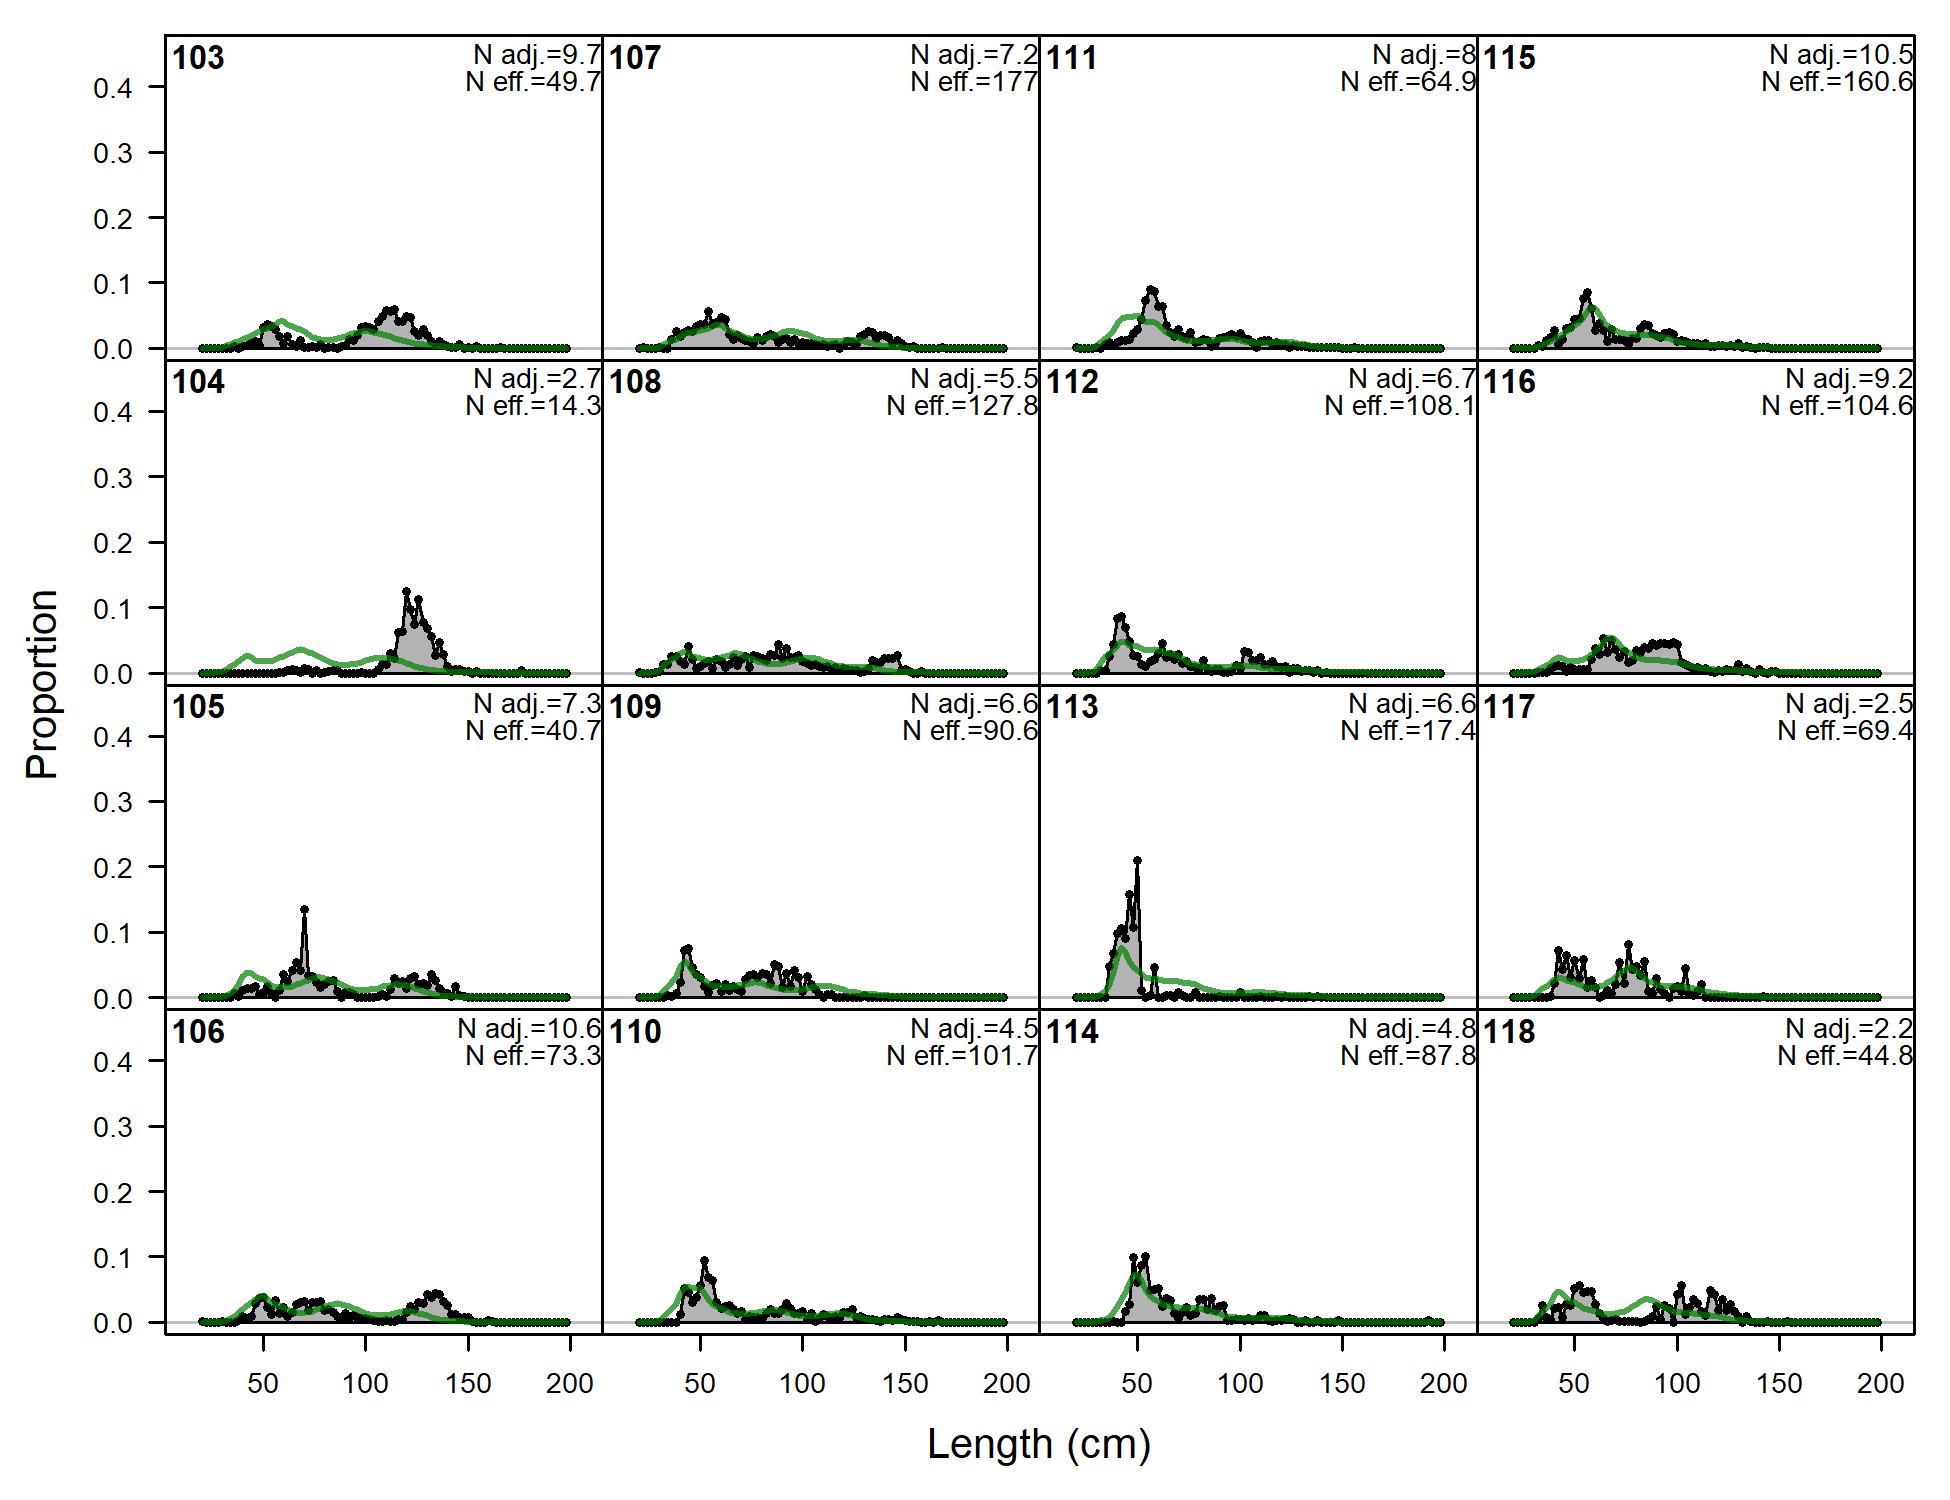
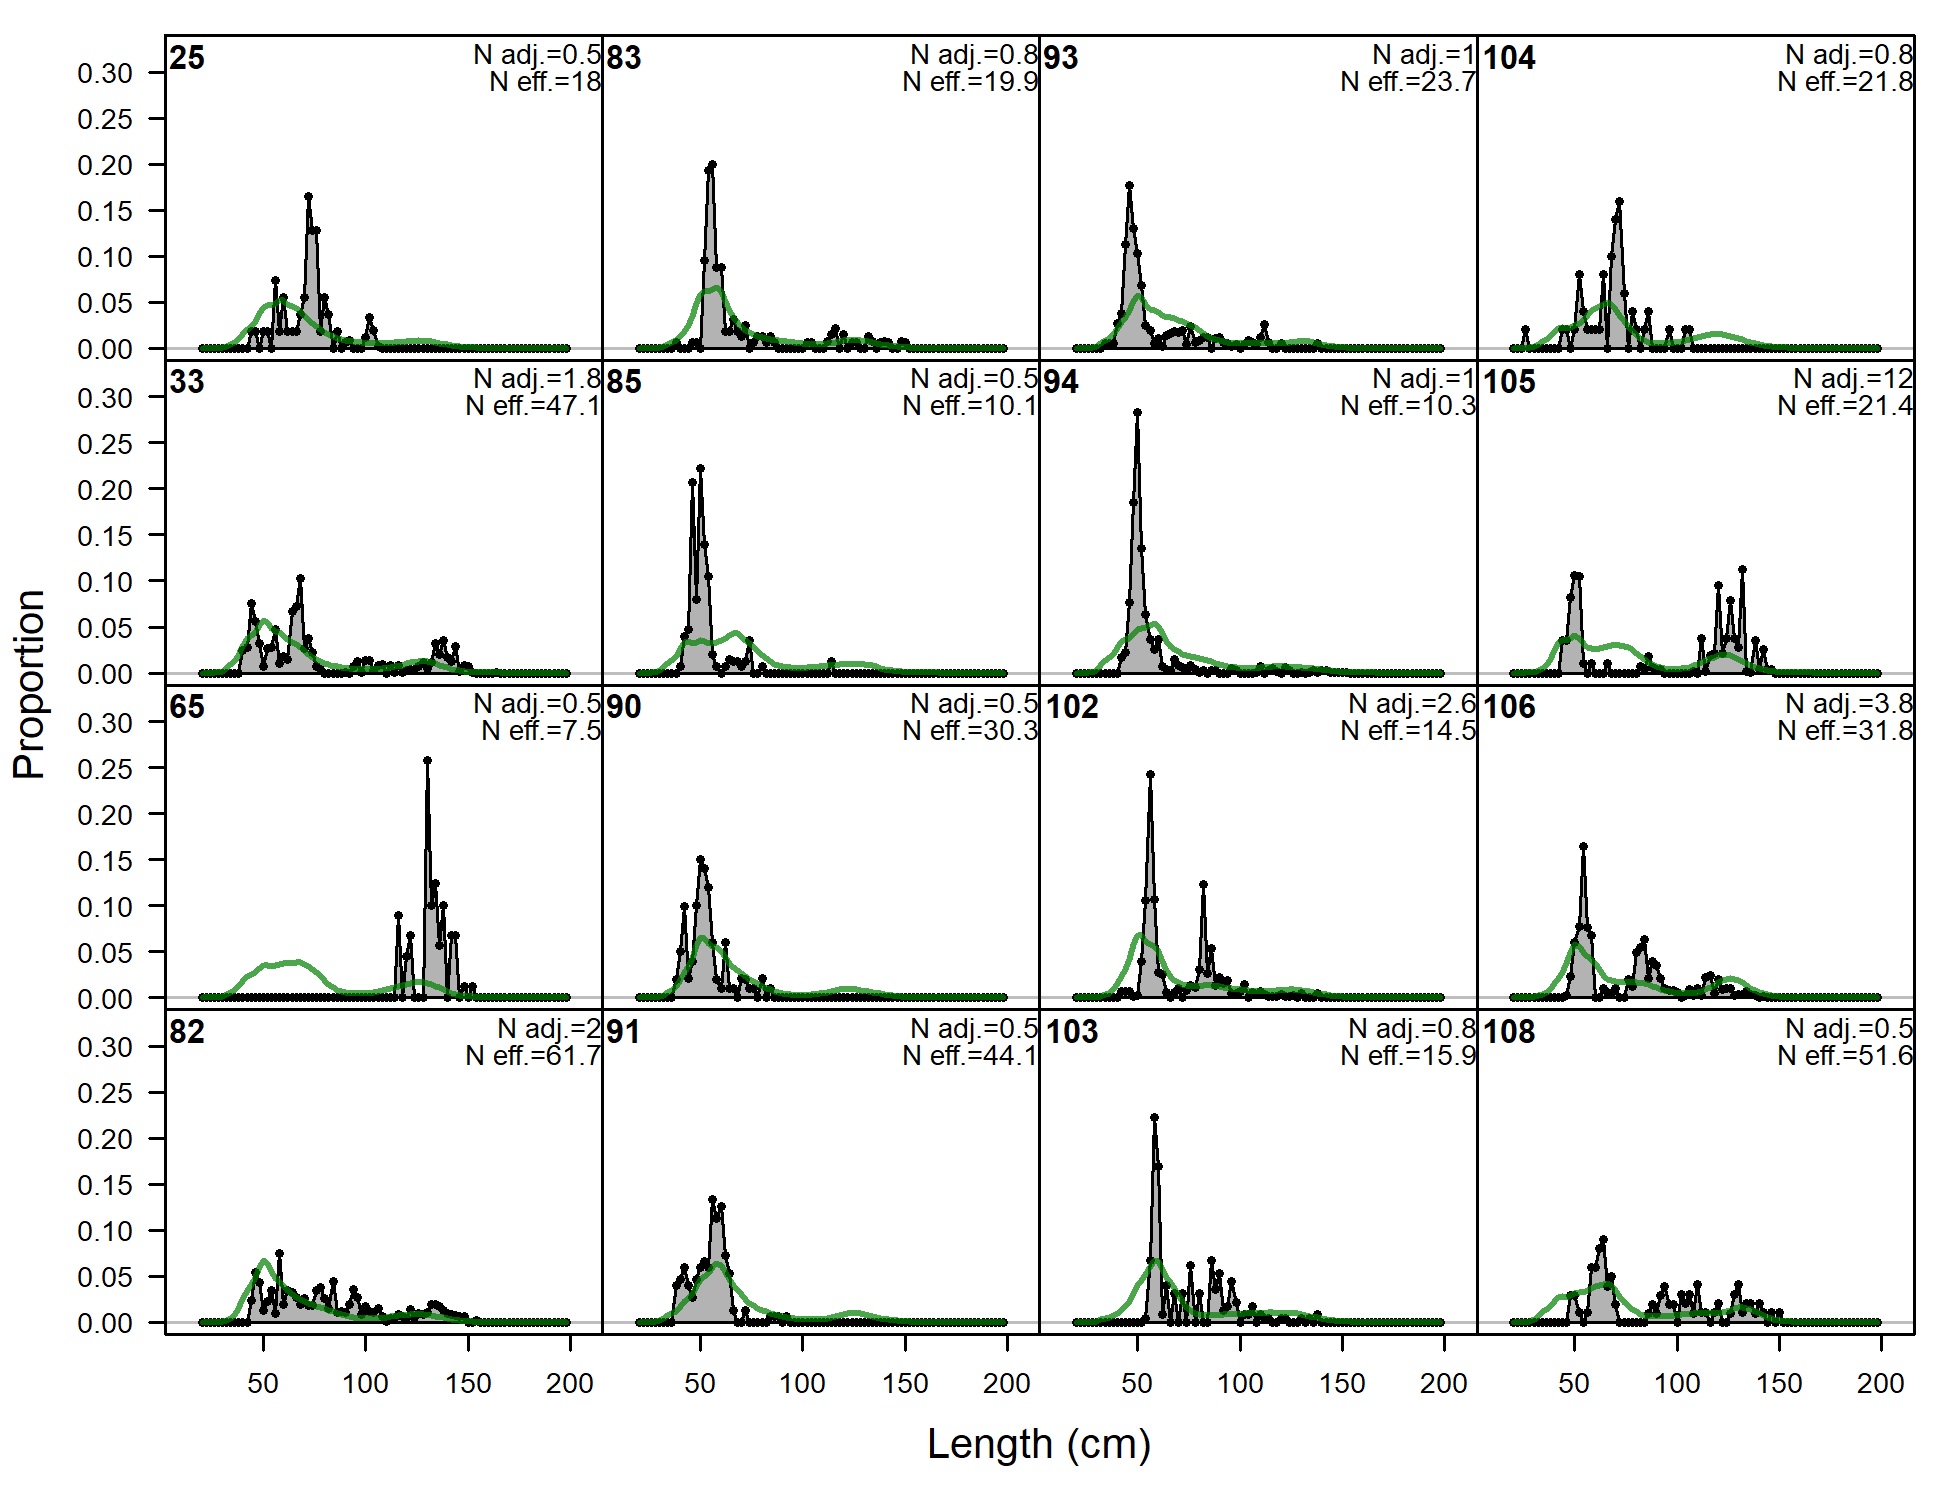
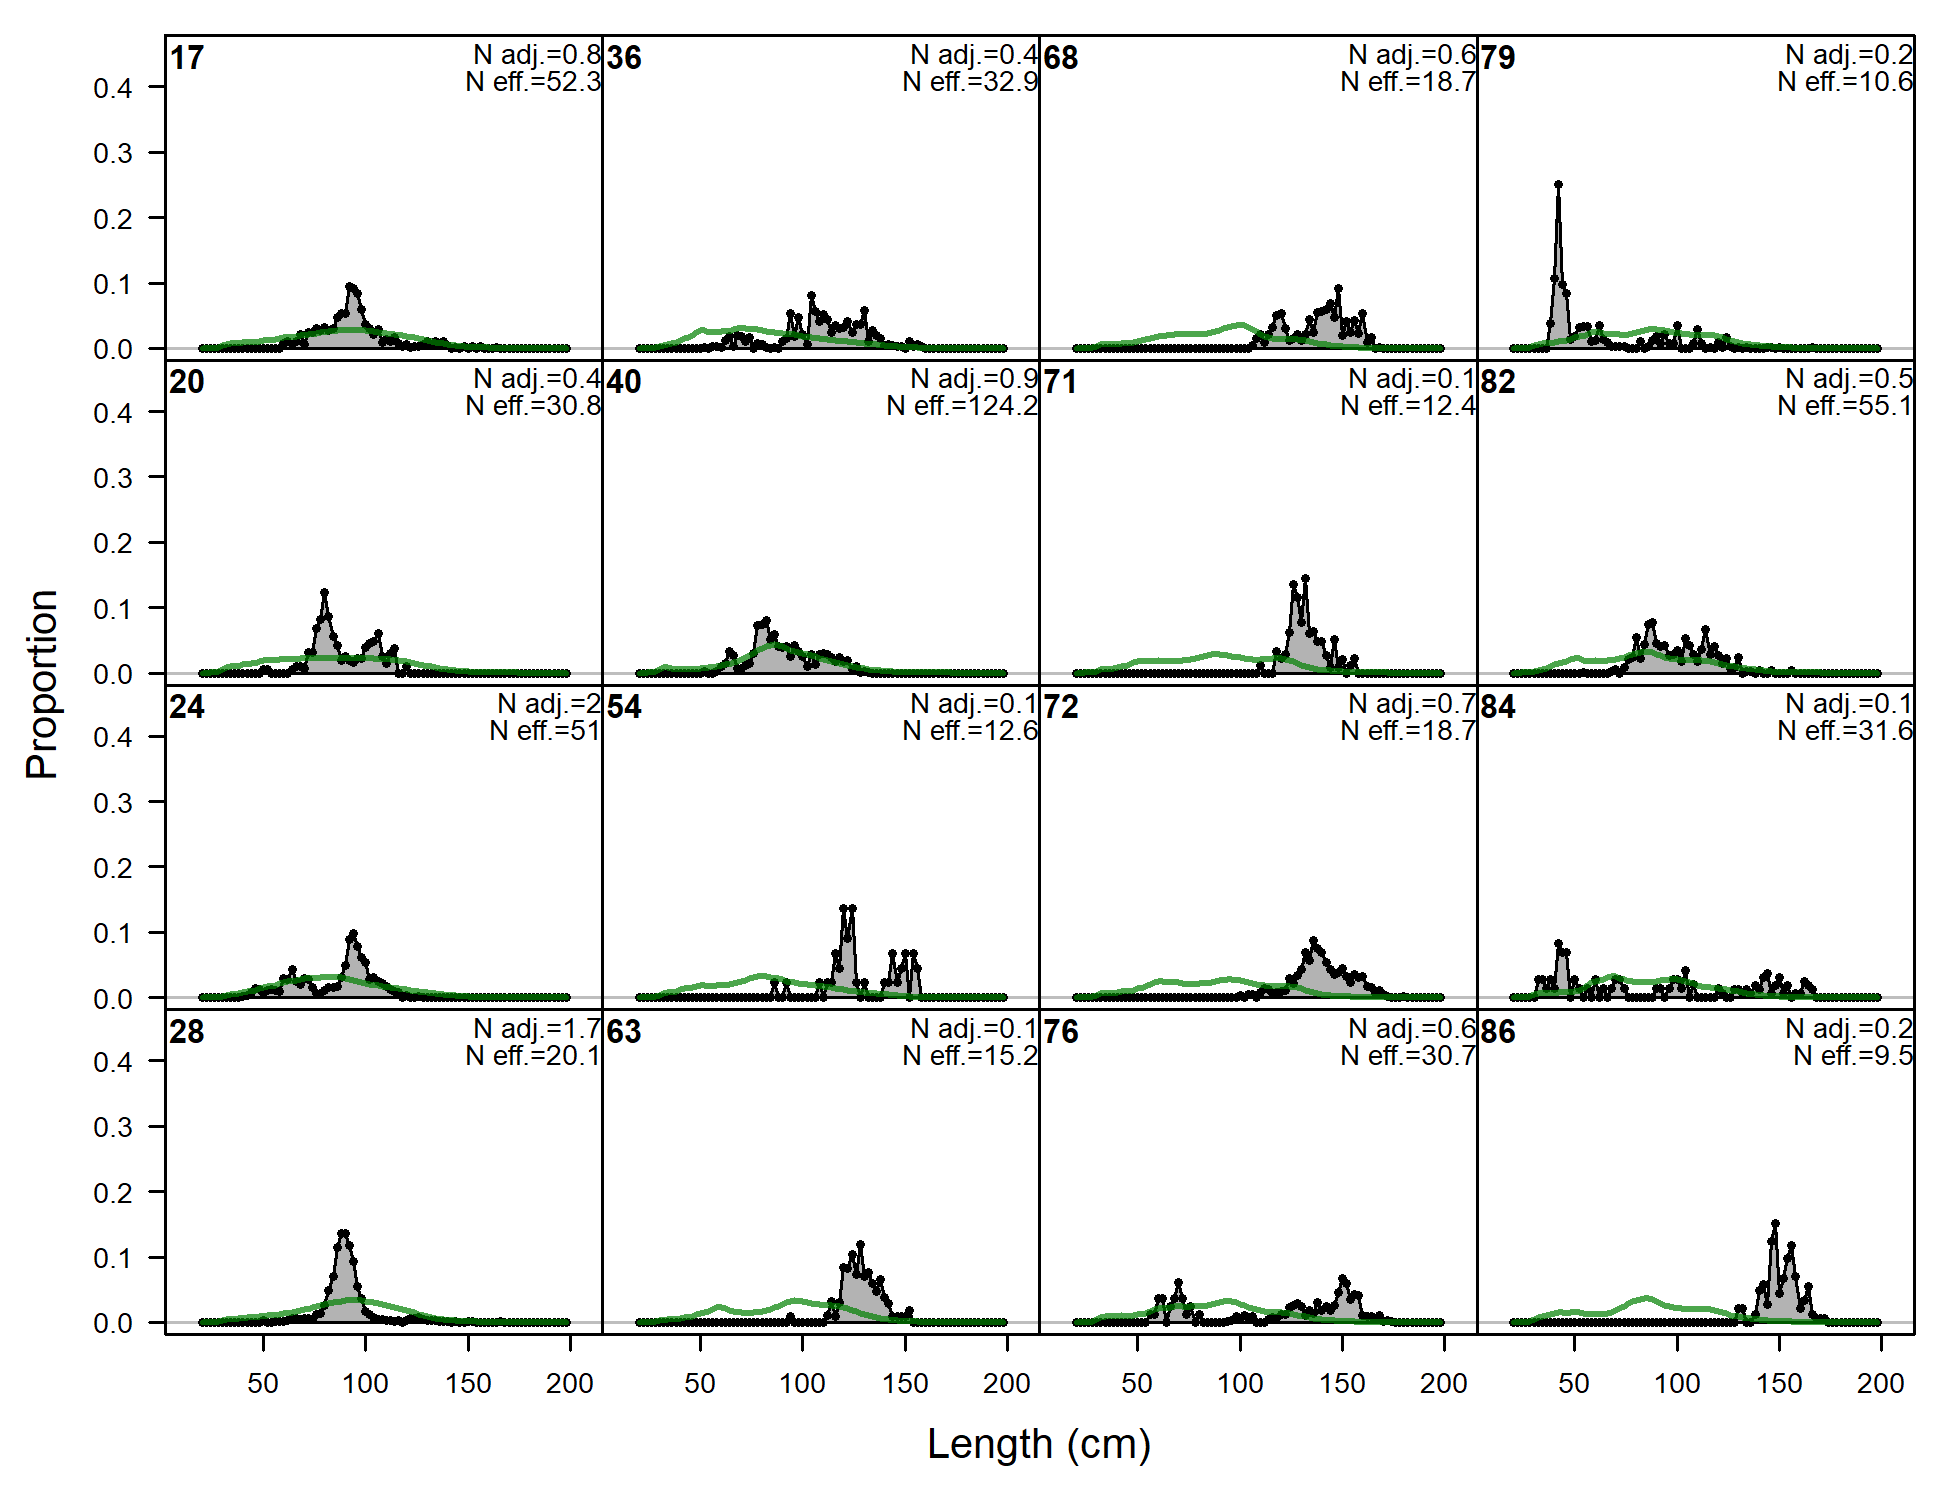
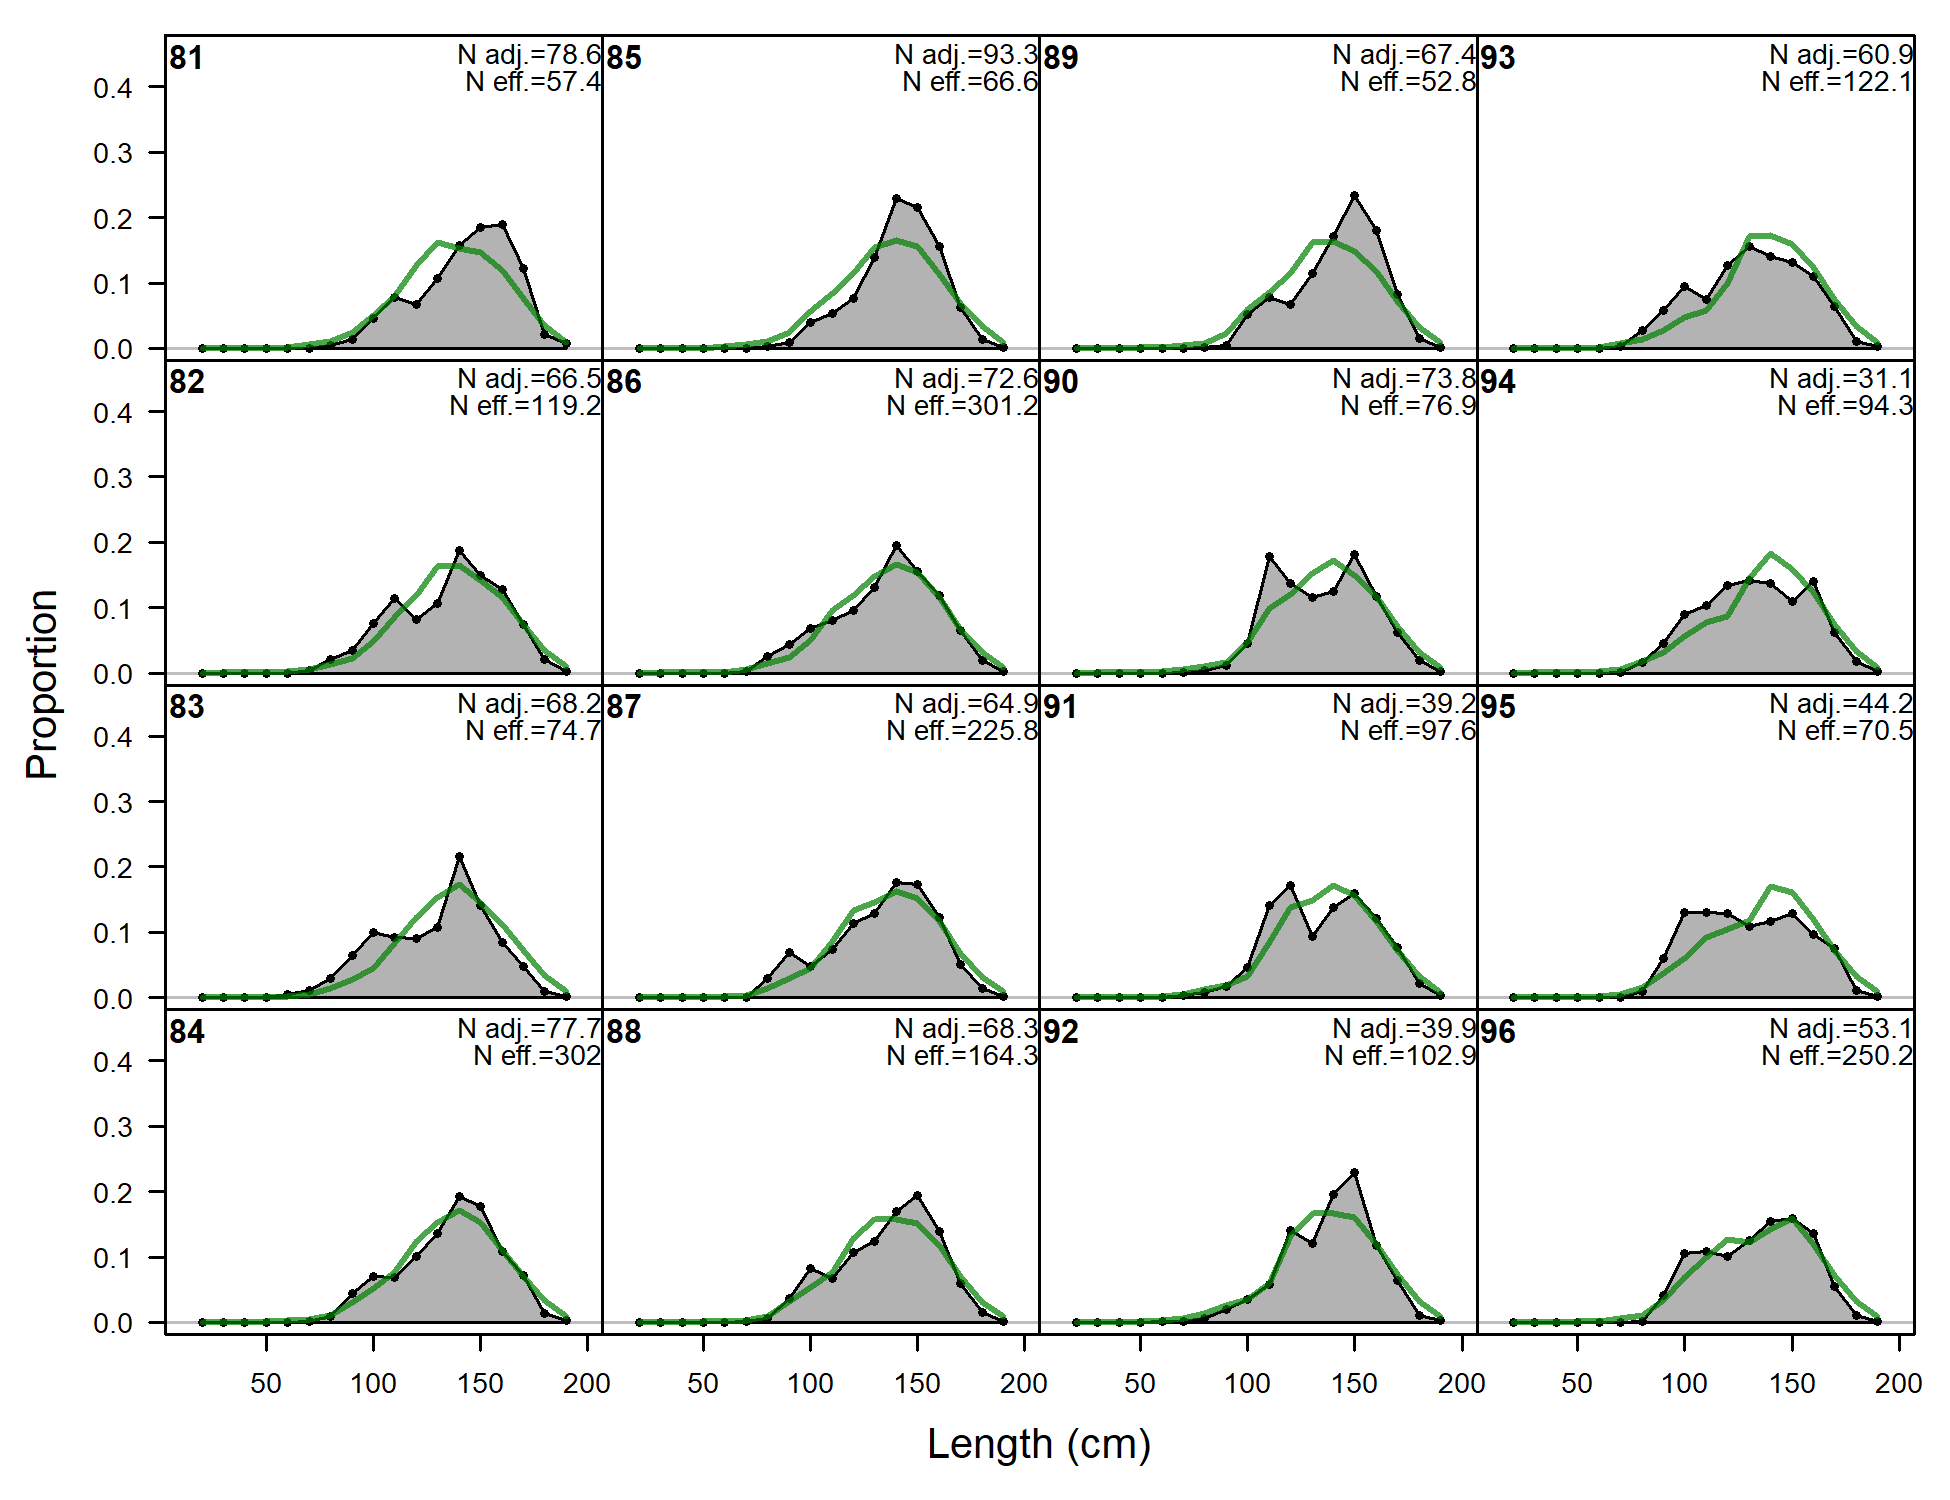
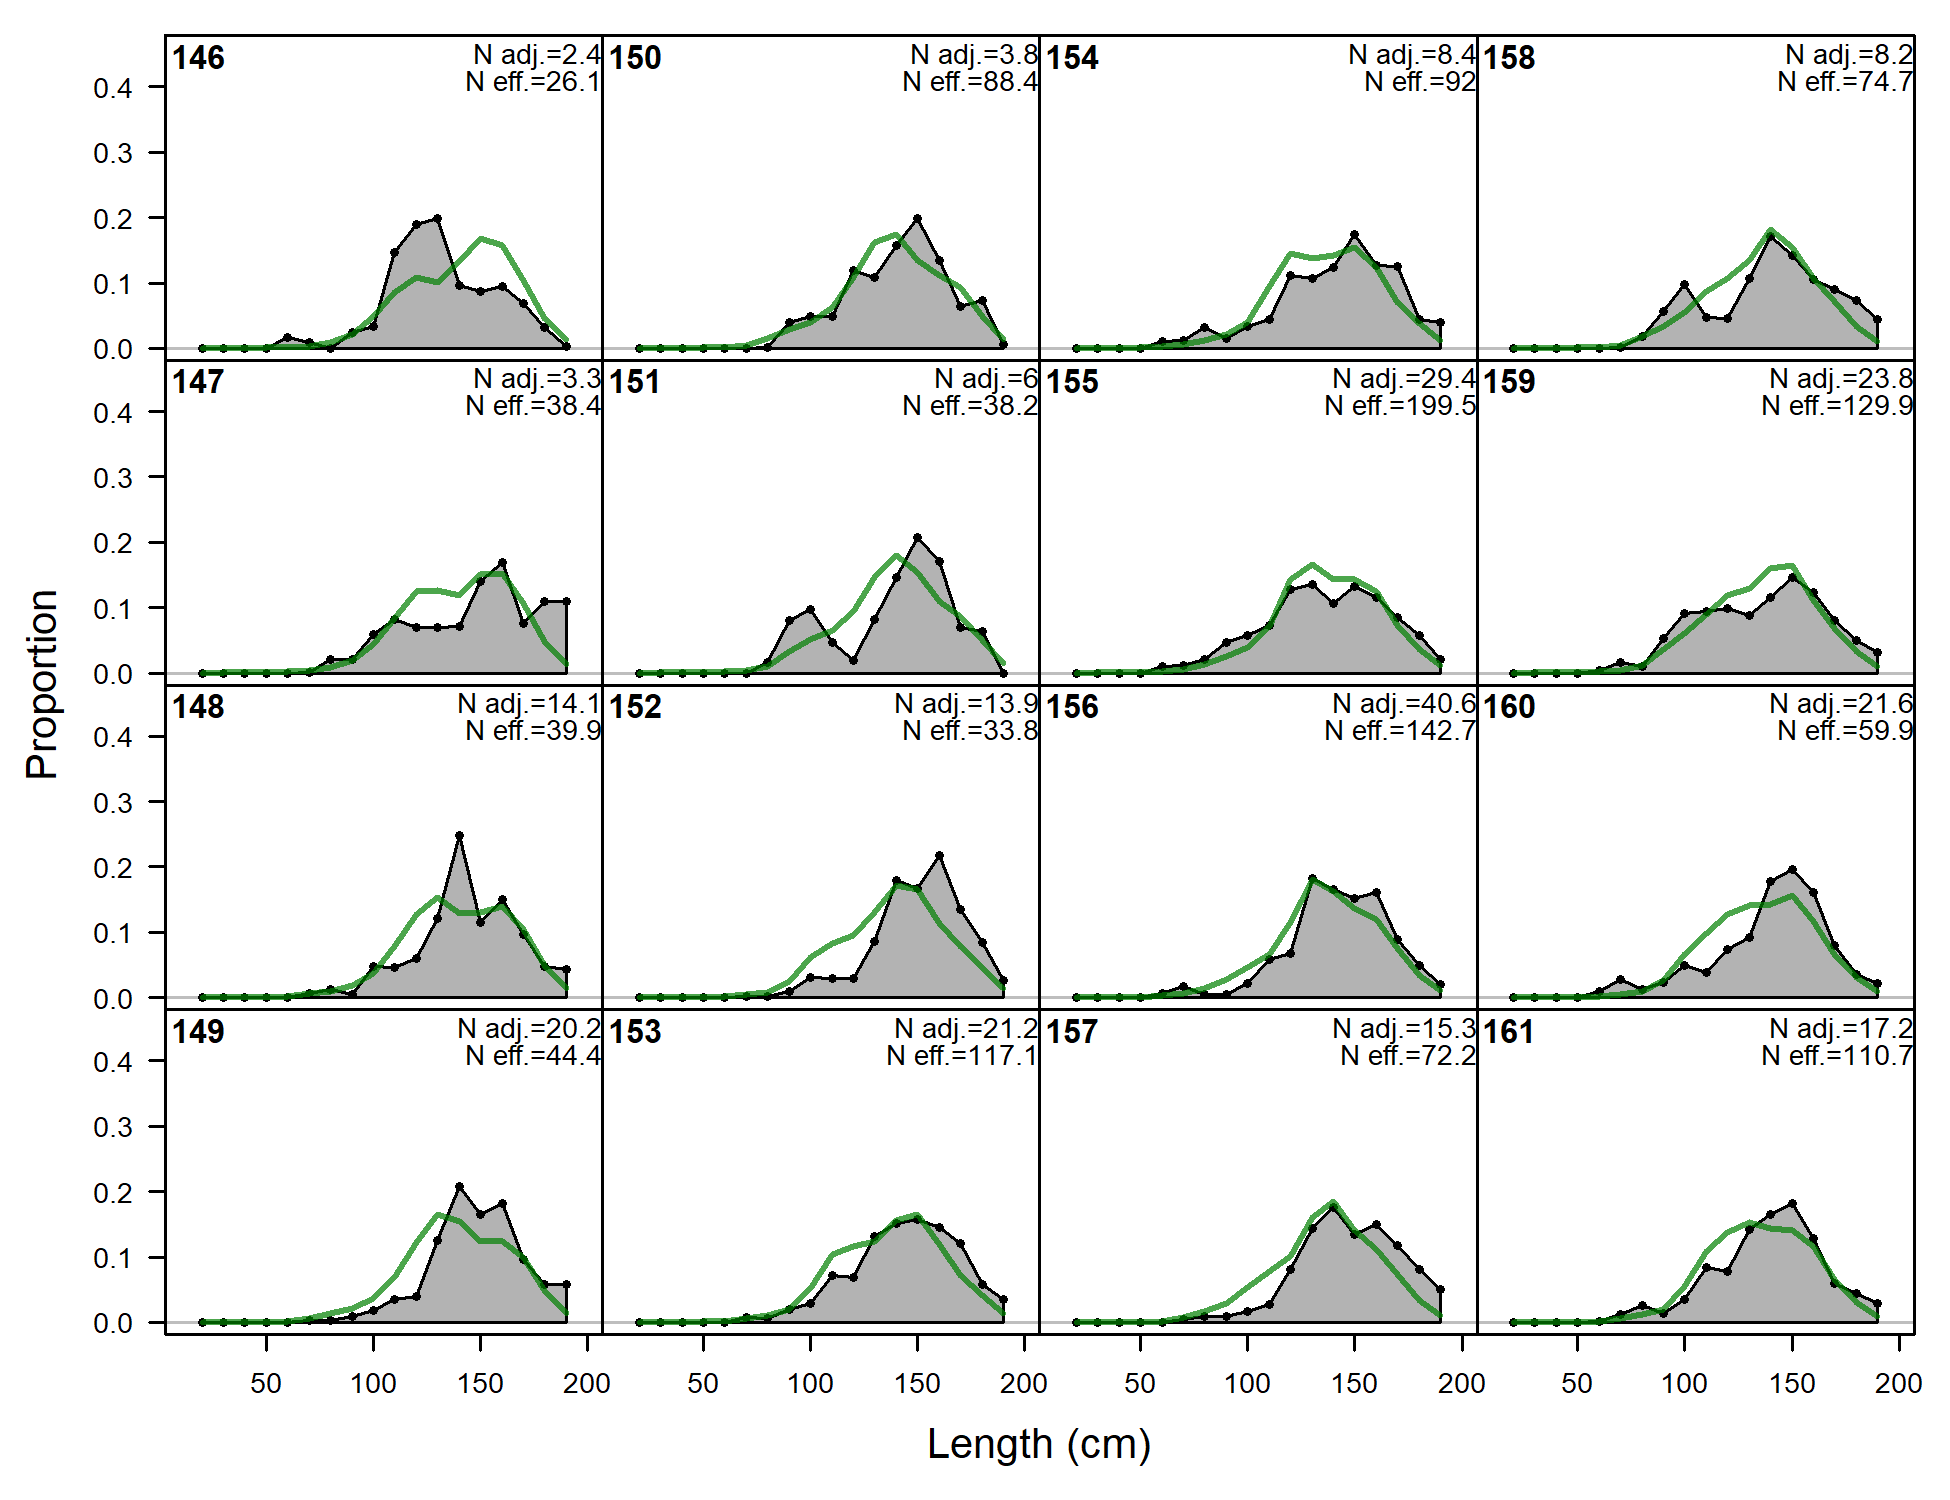
Length comps, whole catch, A1-LL-n (plot 1 of 2).
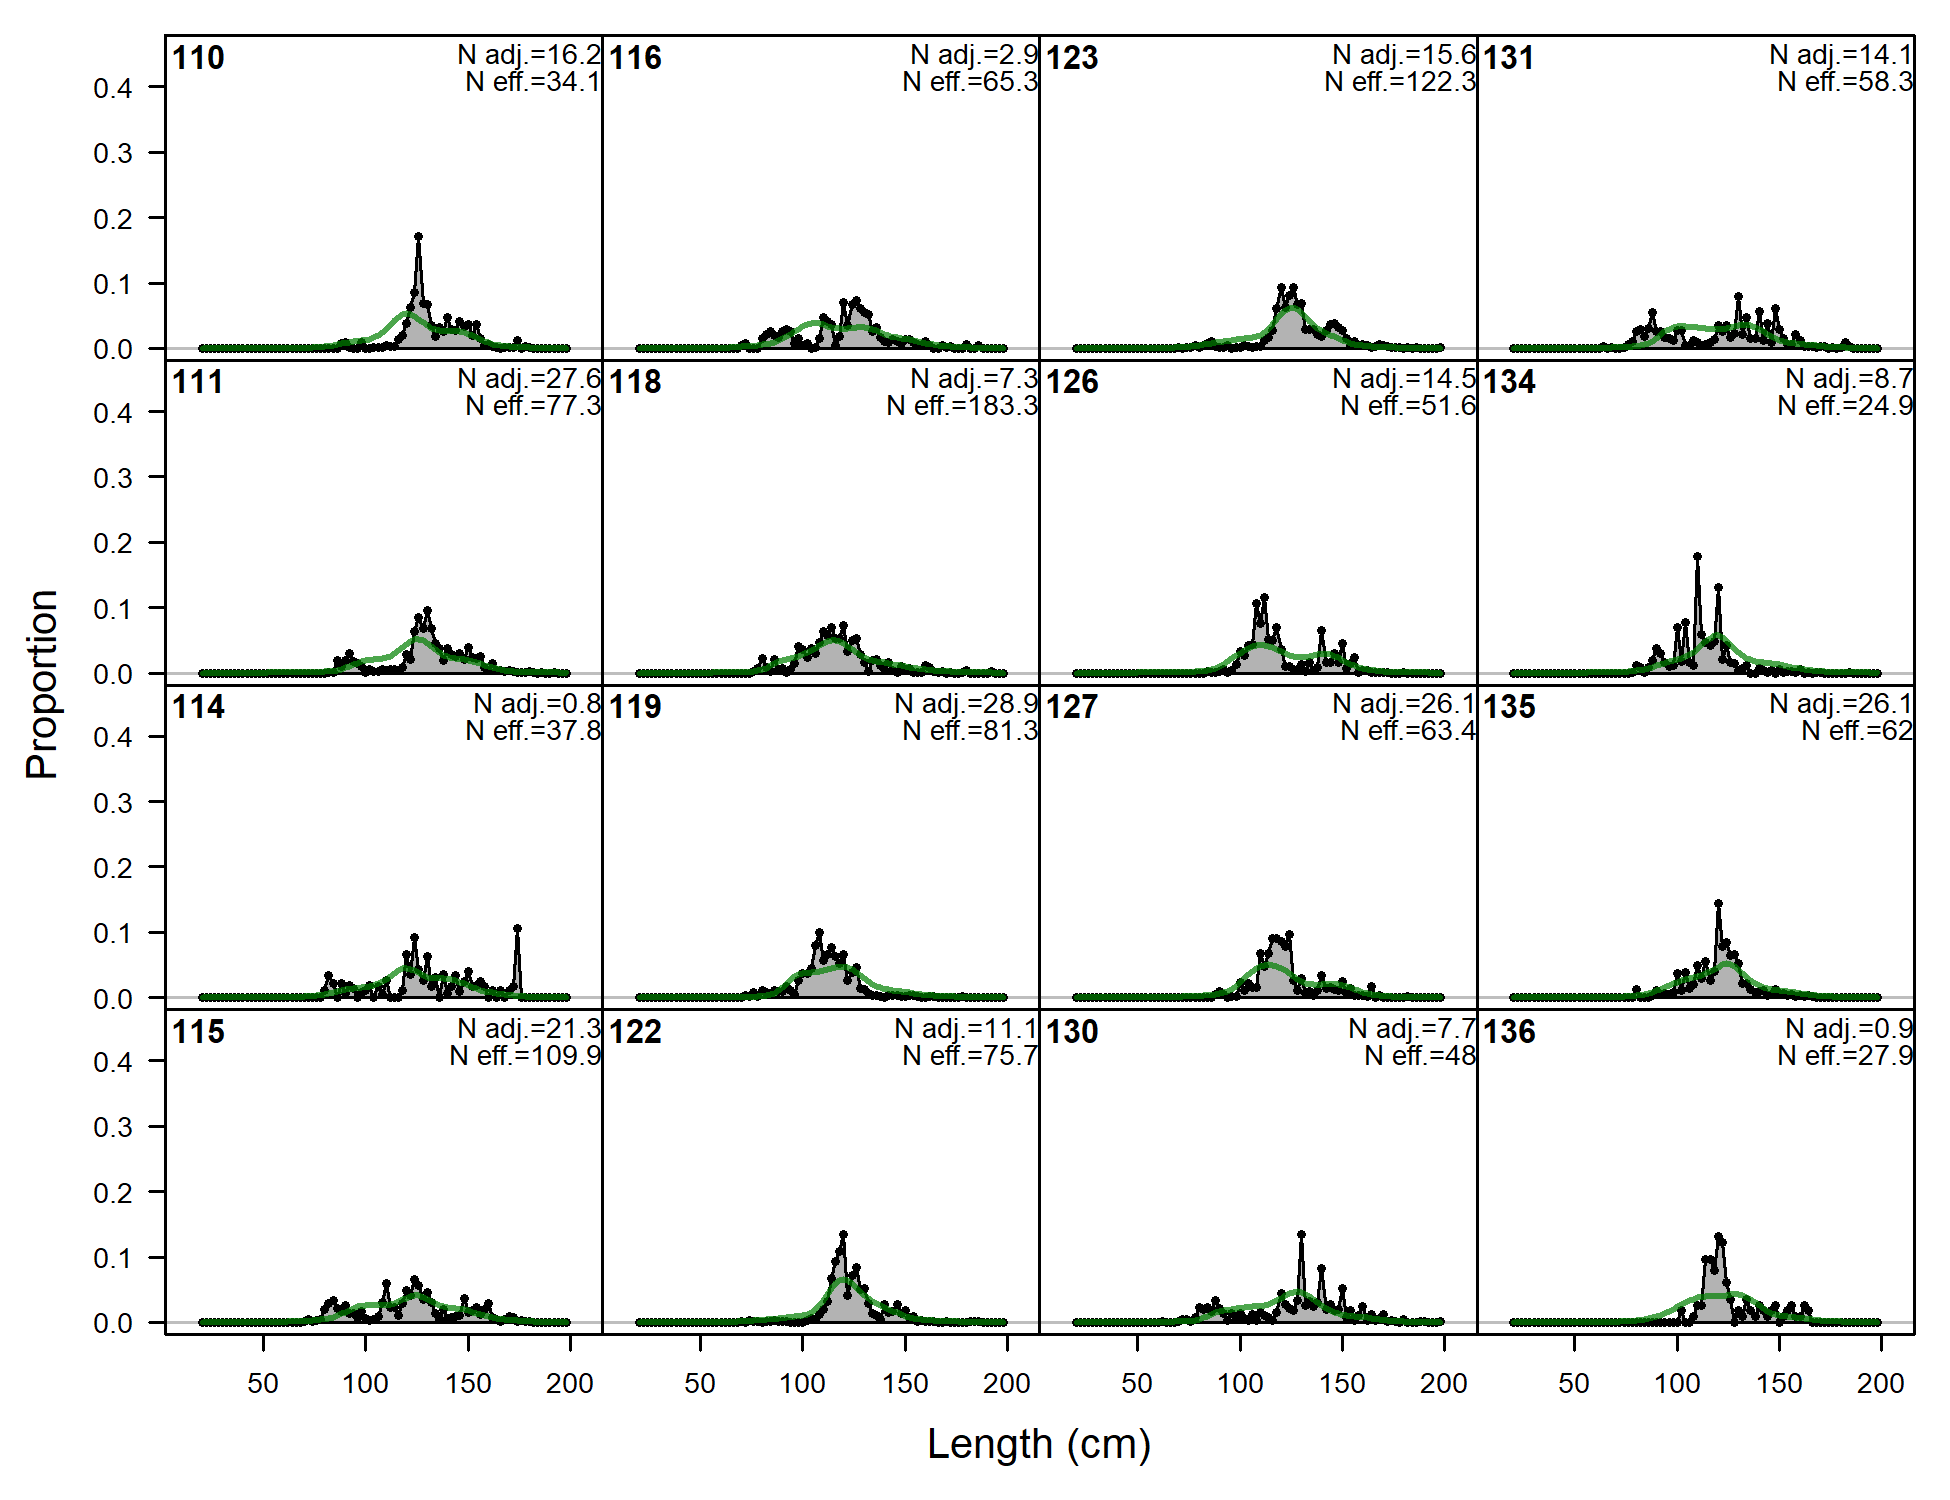
'N adj.' is the input sample size after data-weighting adjustment. N eff. is the calculated effective sample size used in the McAllister-Iannelli tuning method.
file: comp_lenfit_flt1mkt0_page1.png
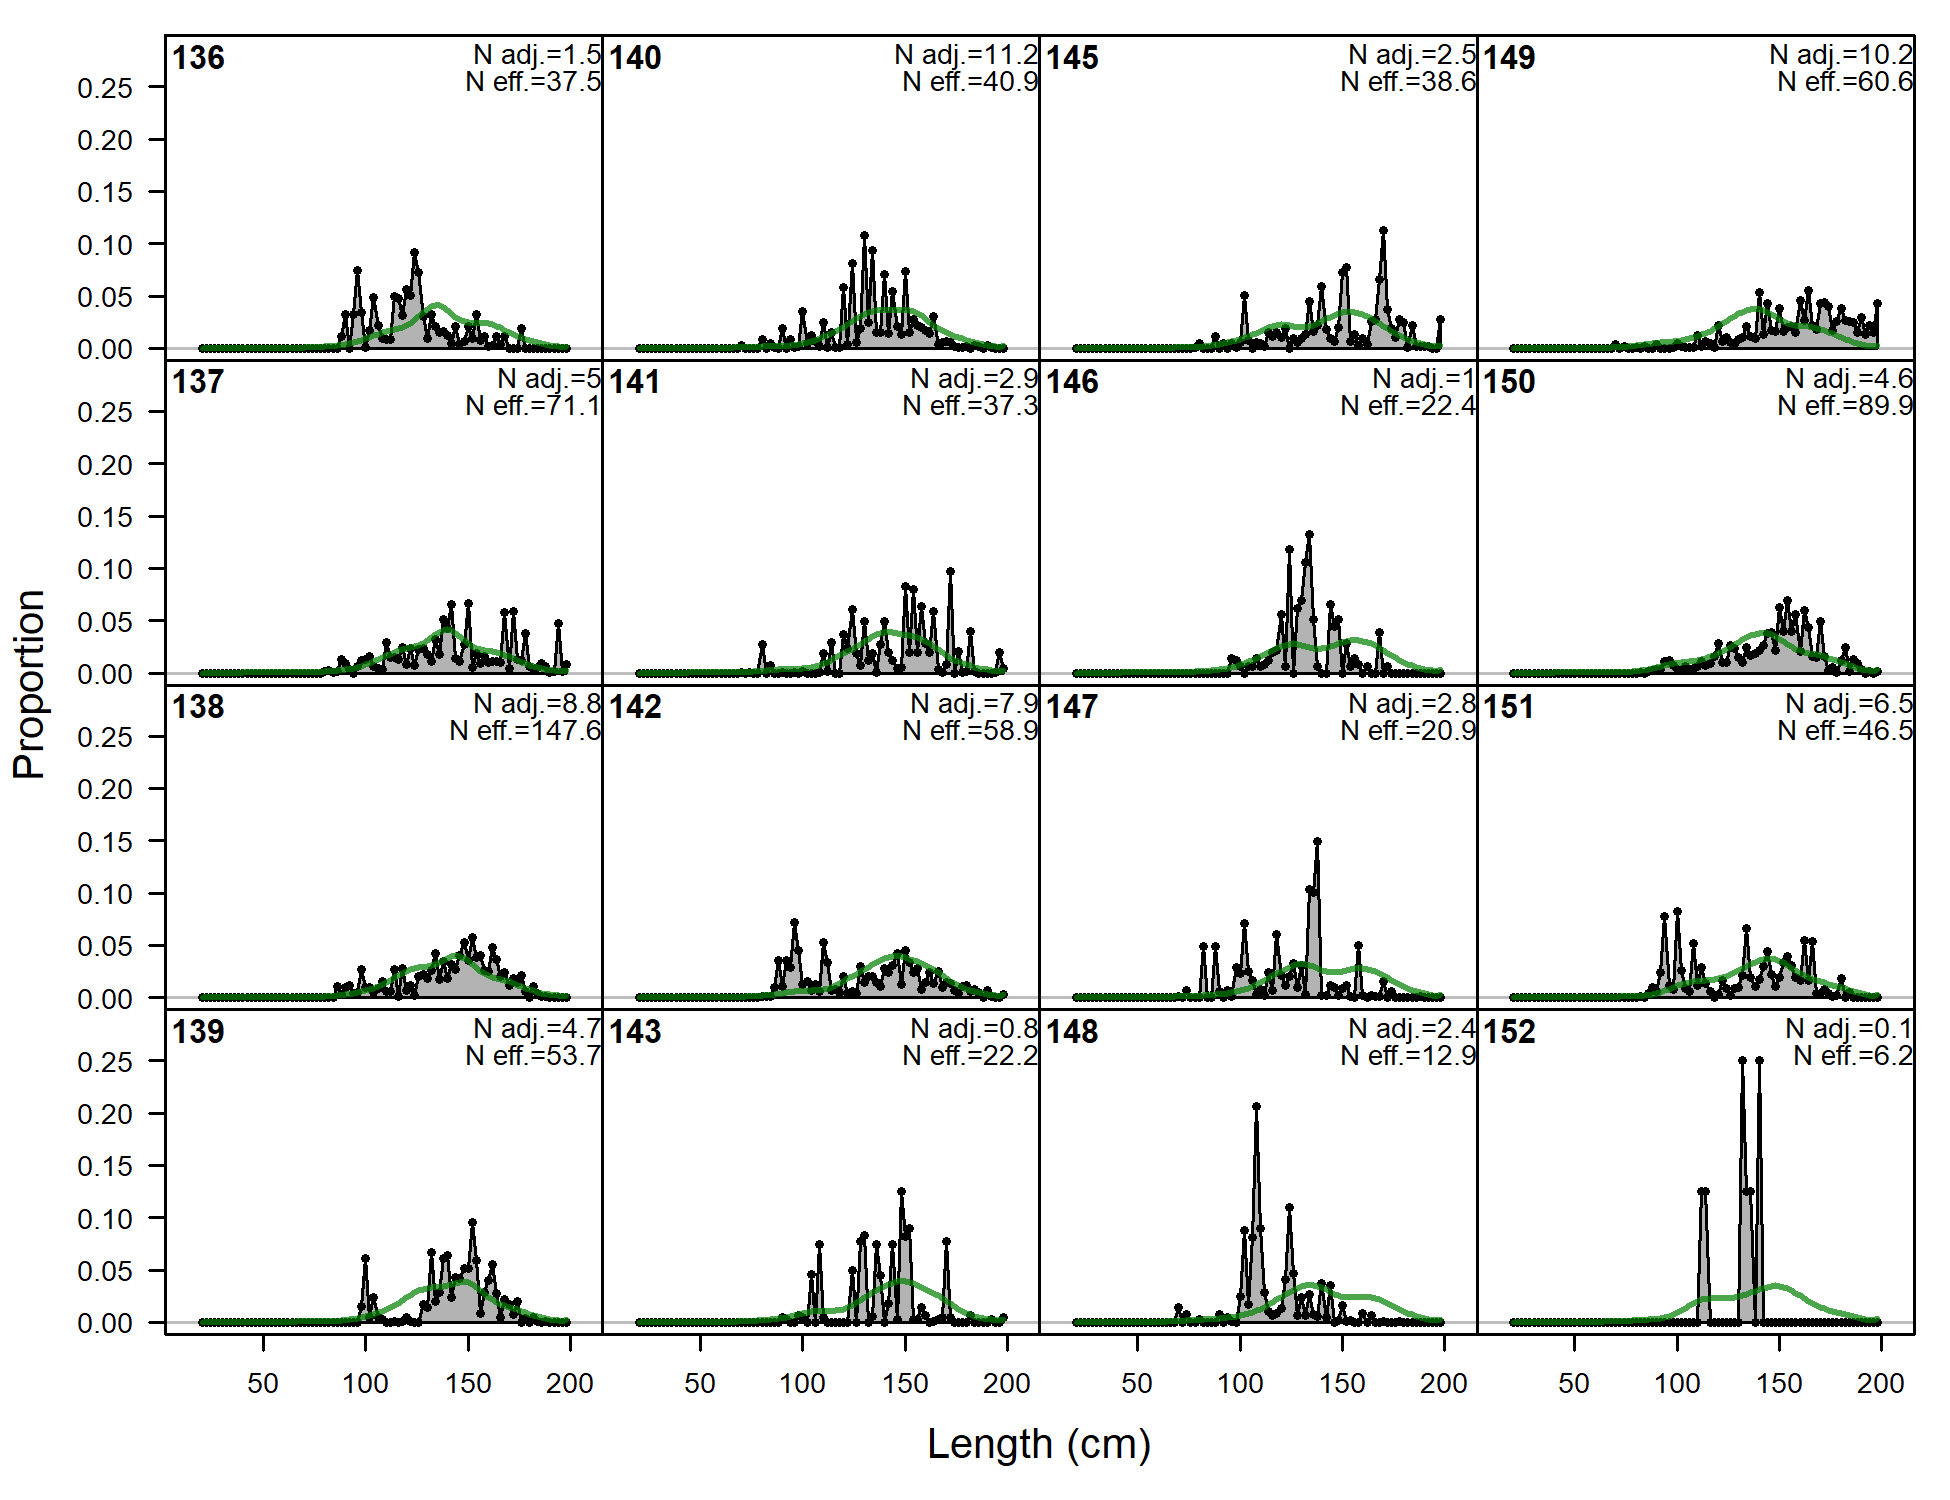
Length comps, whole catch, A1-LL-n (plot 1 of 2).
'N adj.' is the input sample size after data-weighting adjustment. N eff. is the calculated effective sample size used in the McAllister-Iannelli tuning method.
file: comp_lenfit_flt1mkt0_page1.png
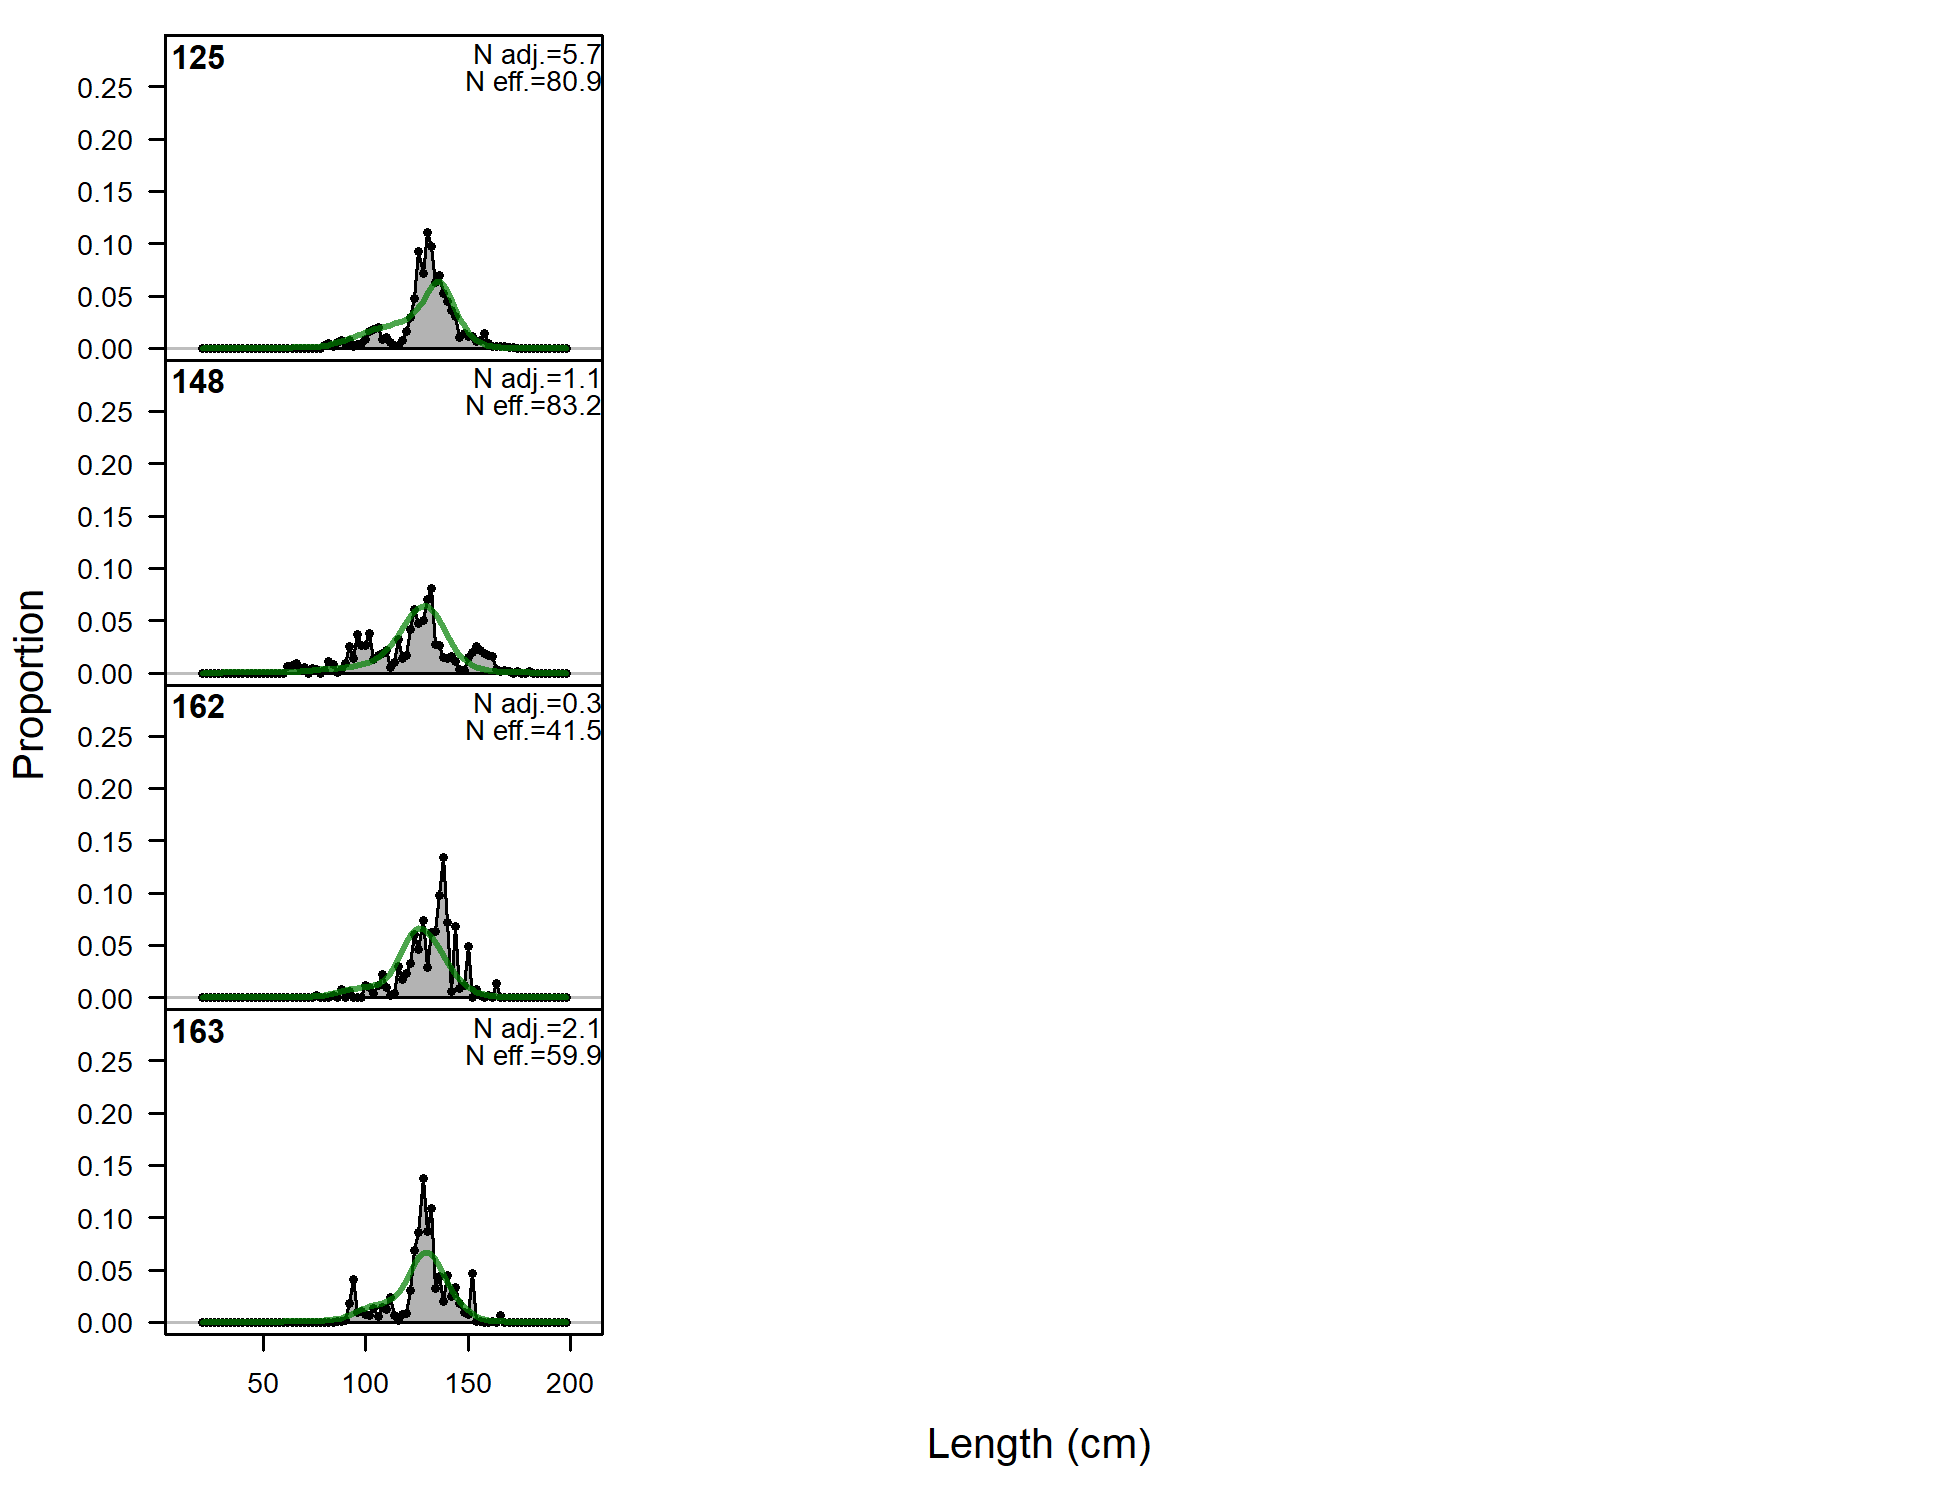
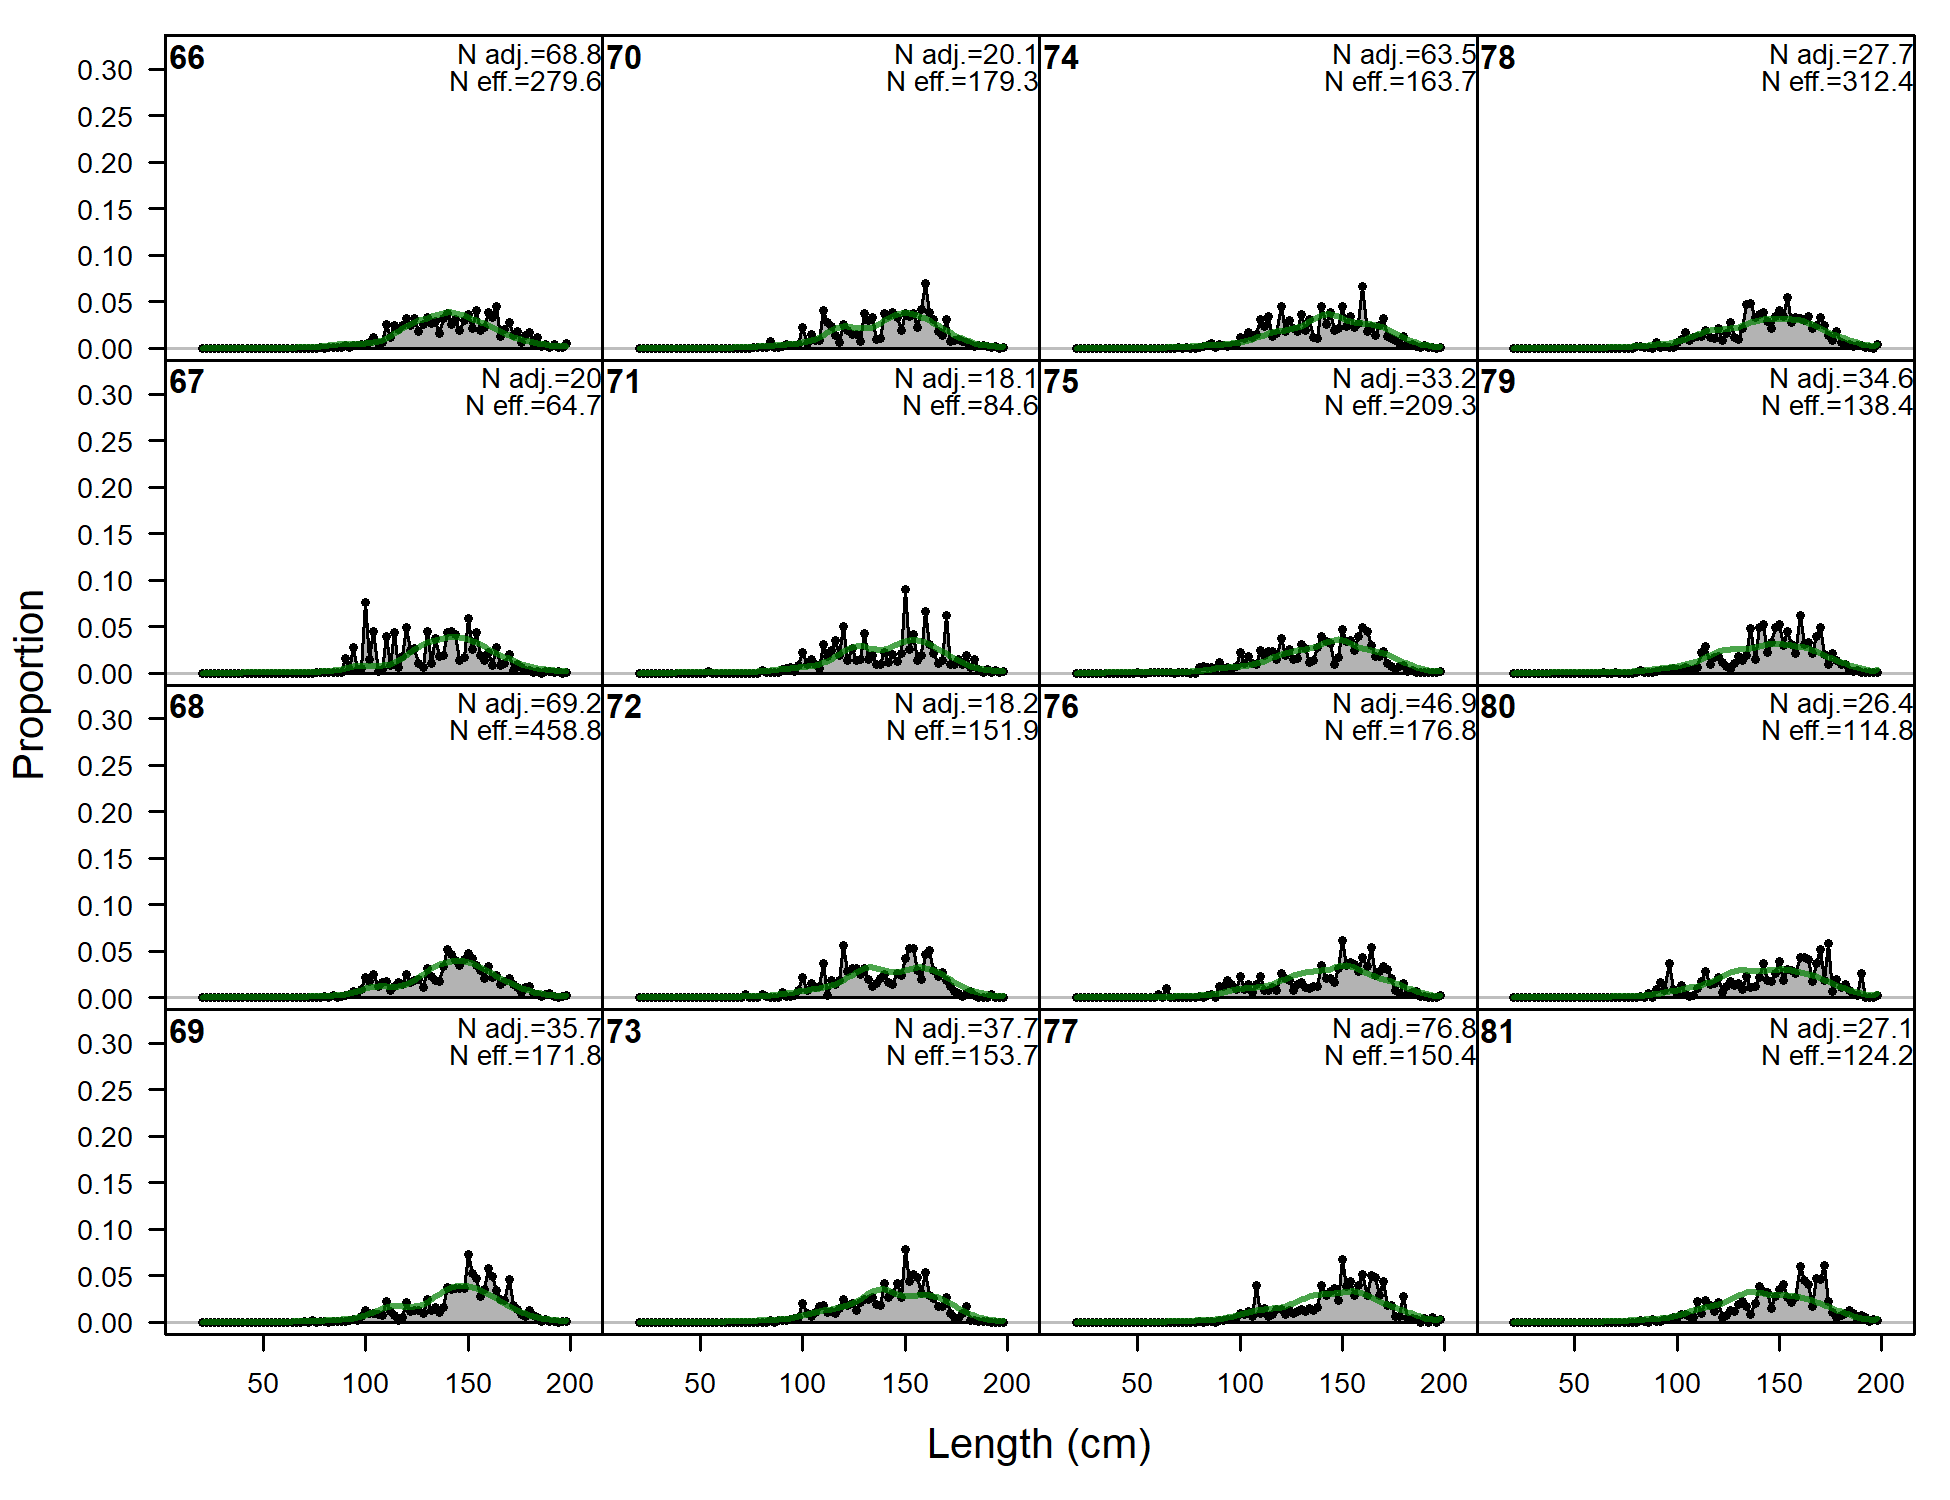
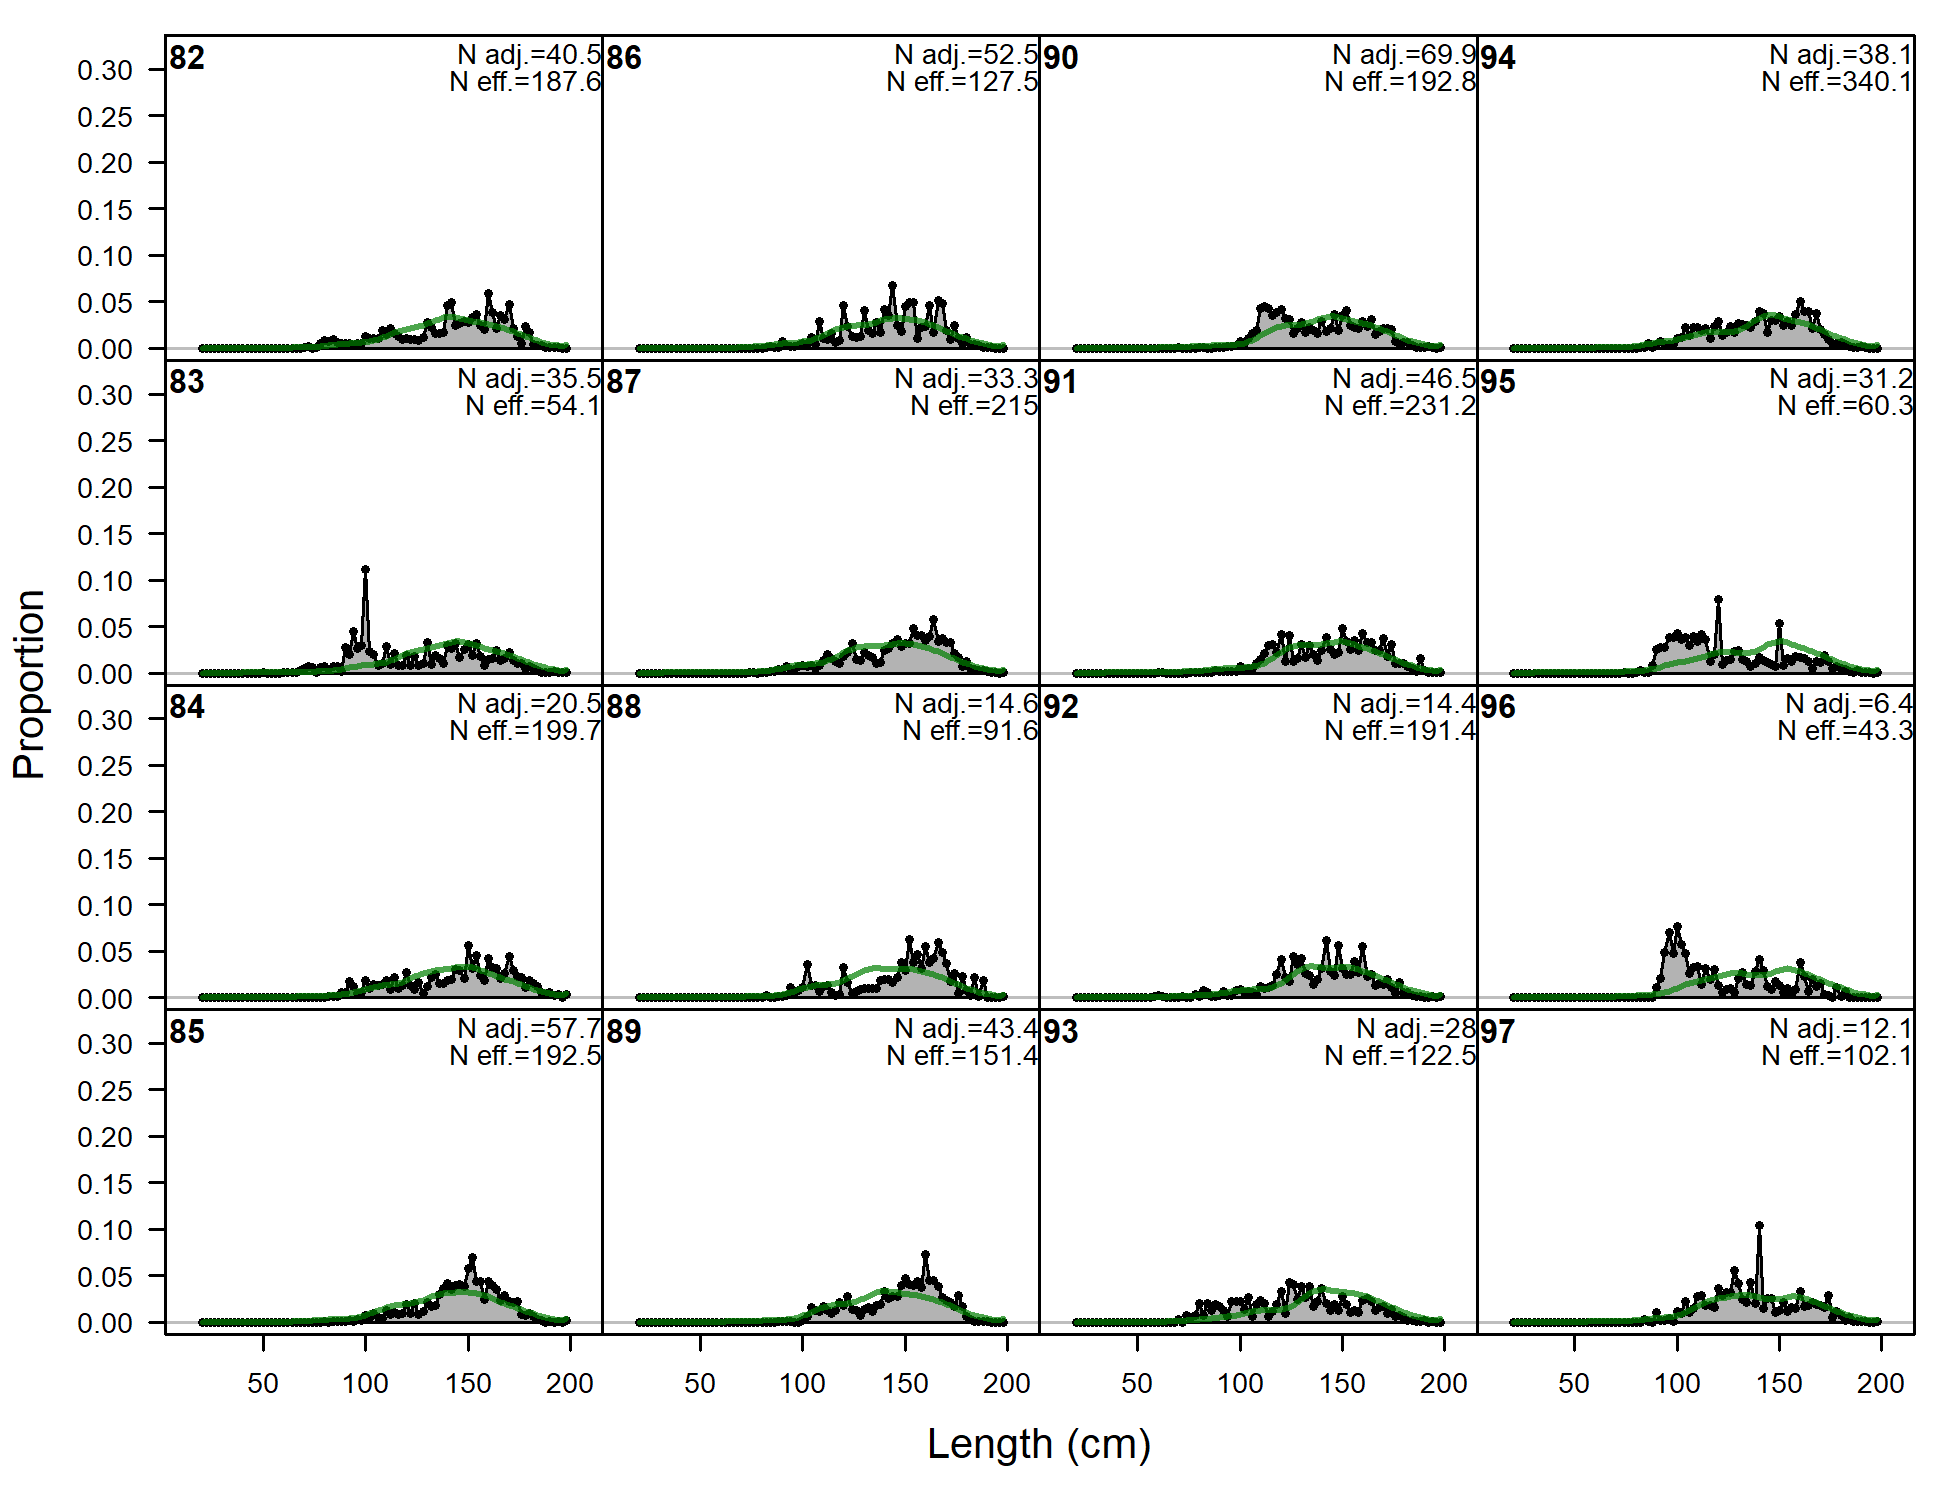
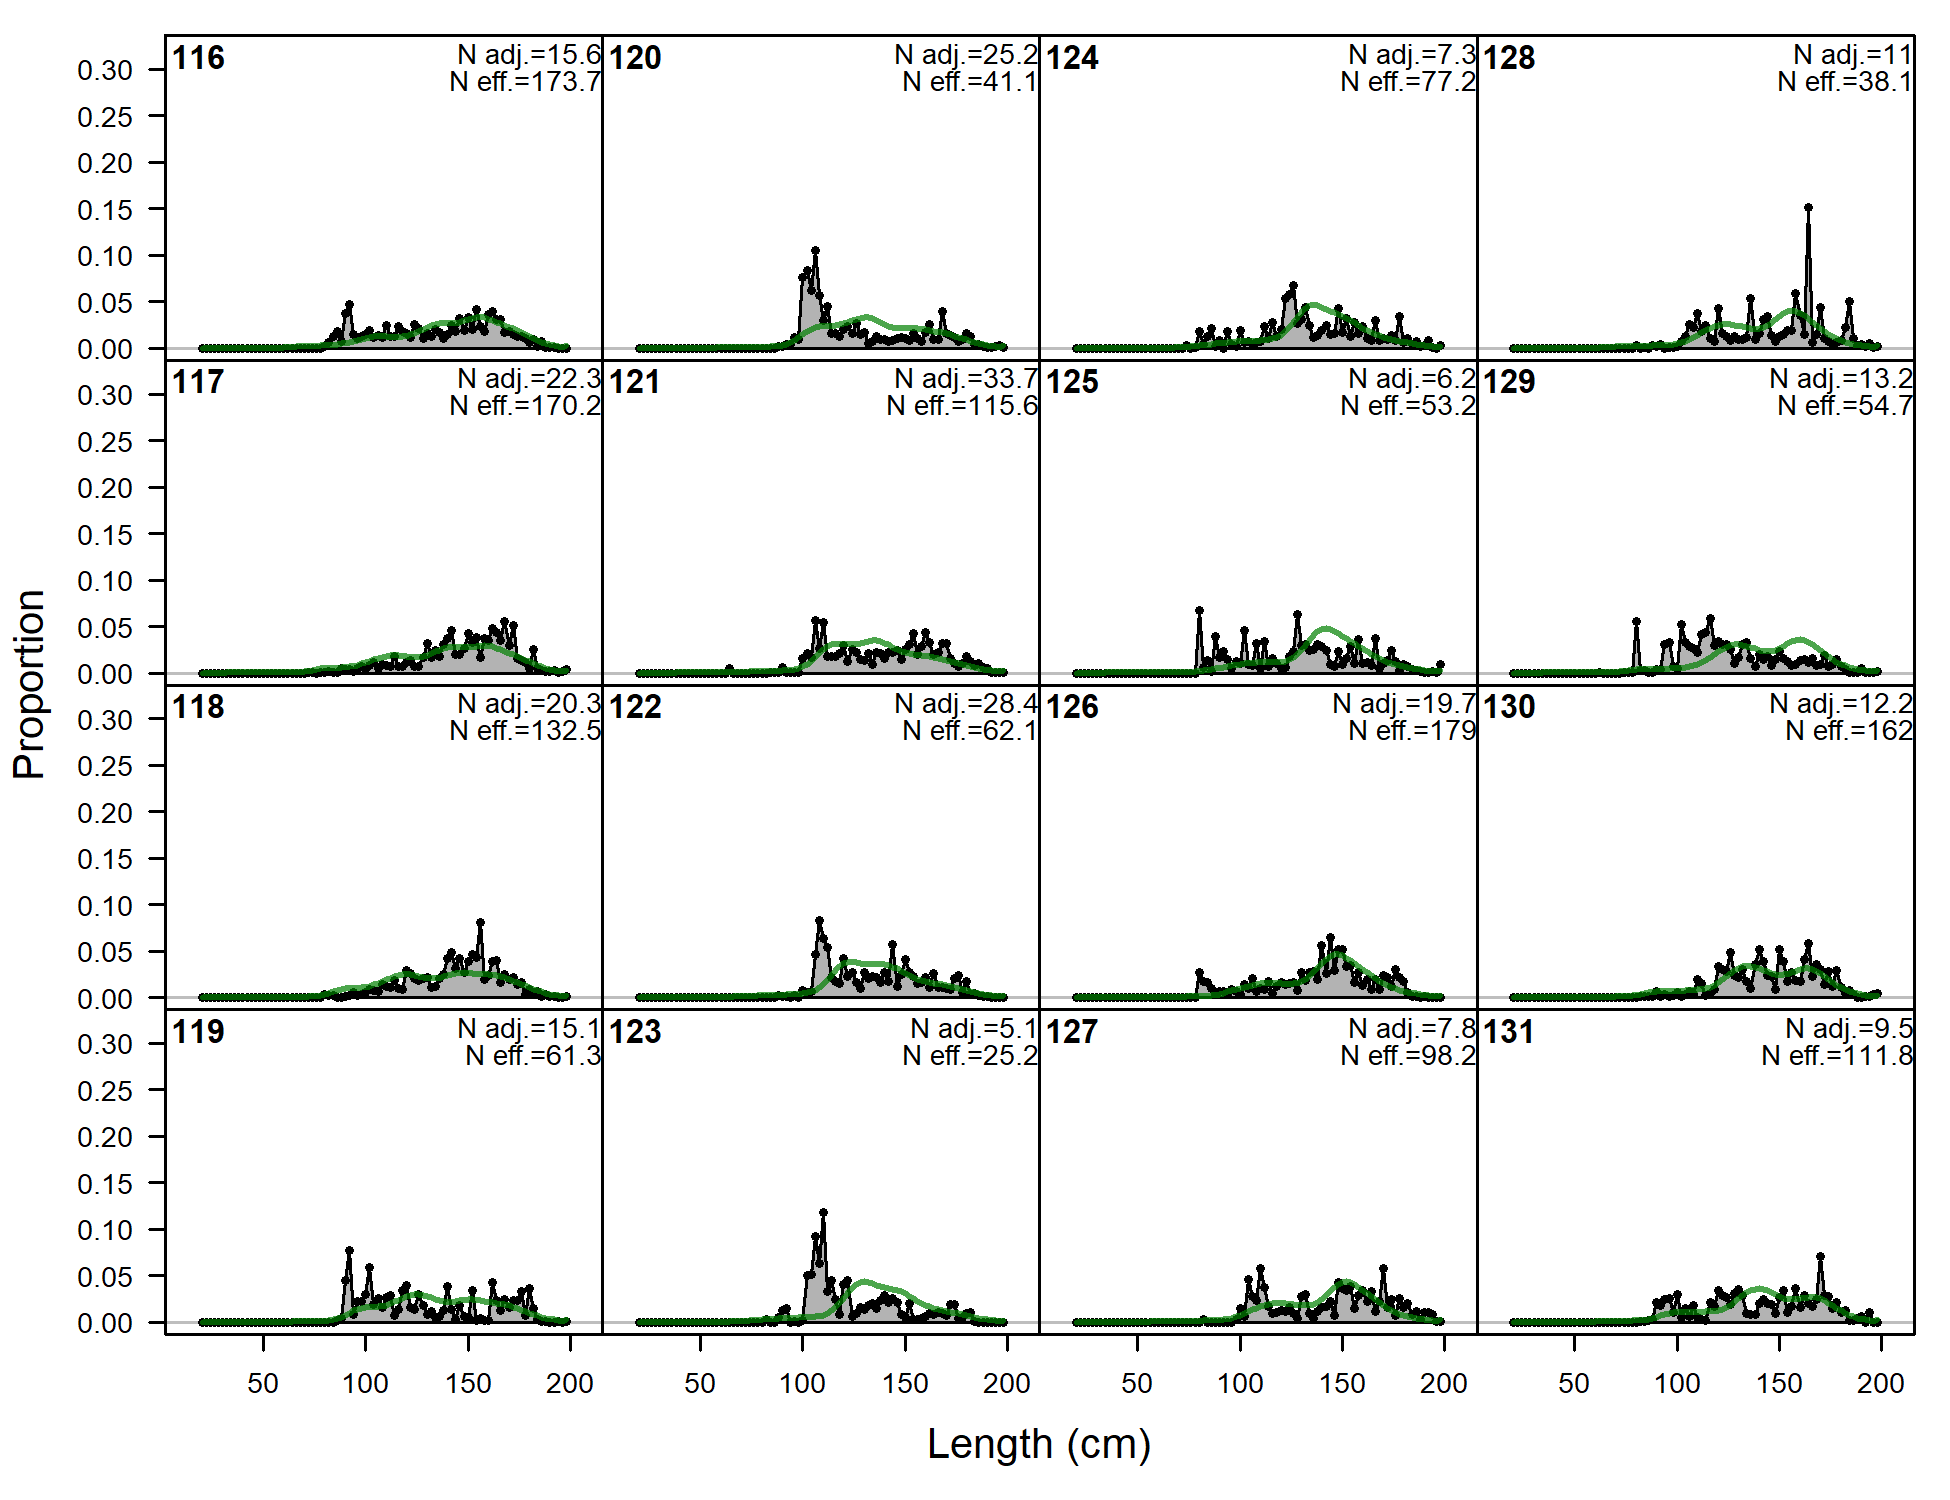
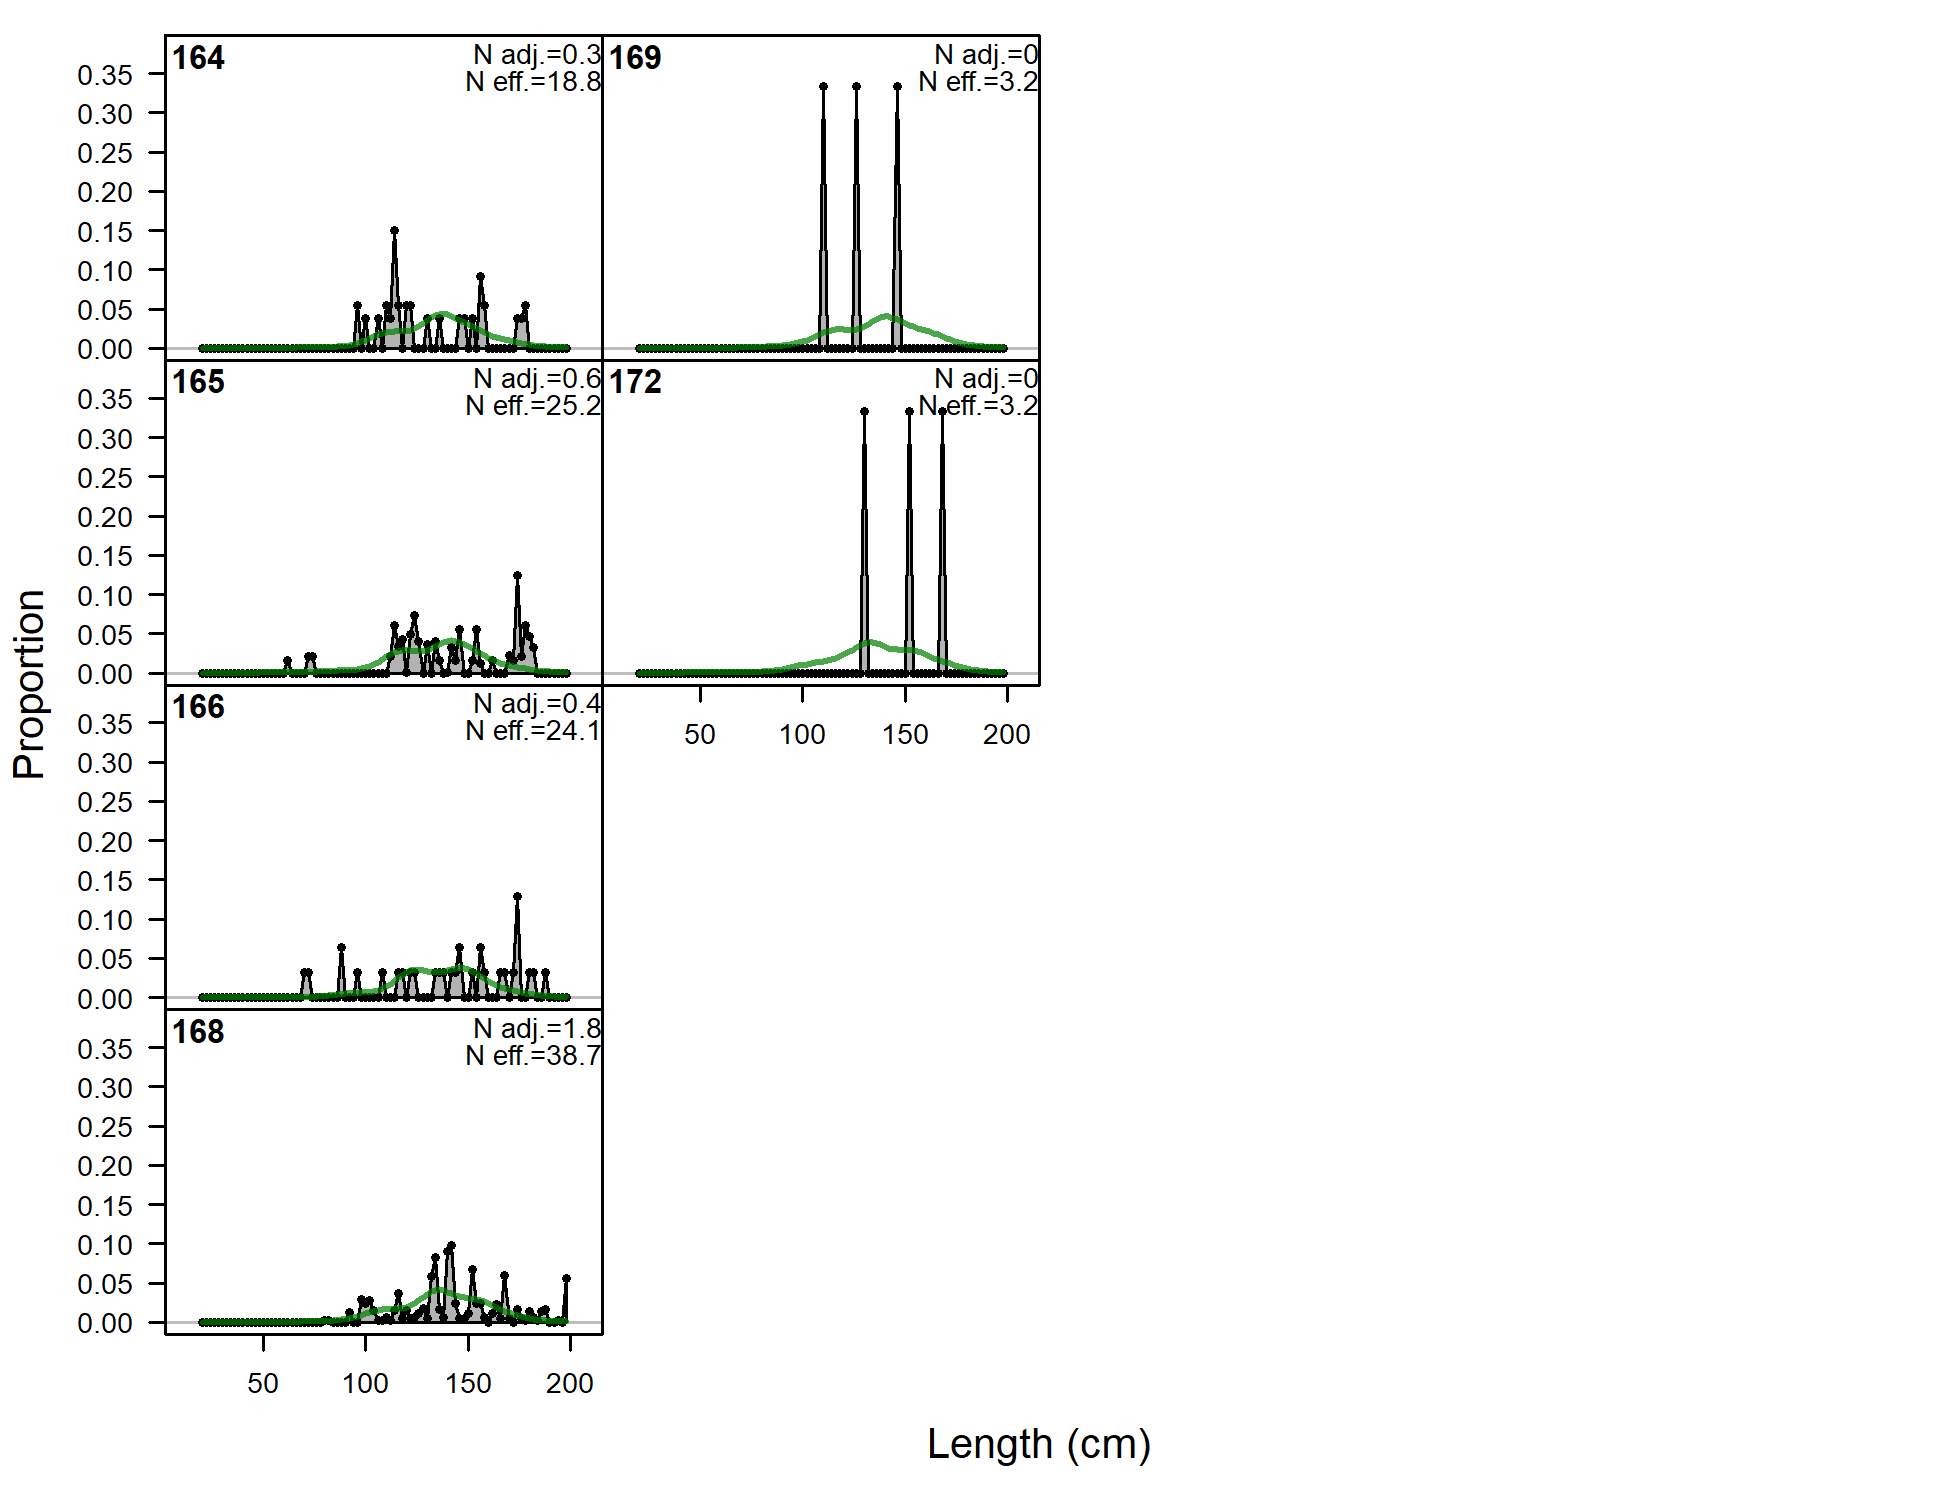
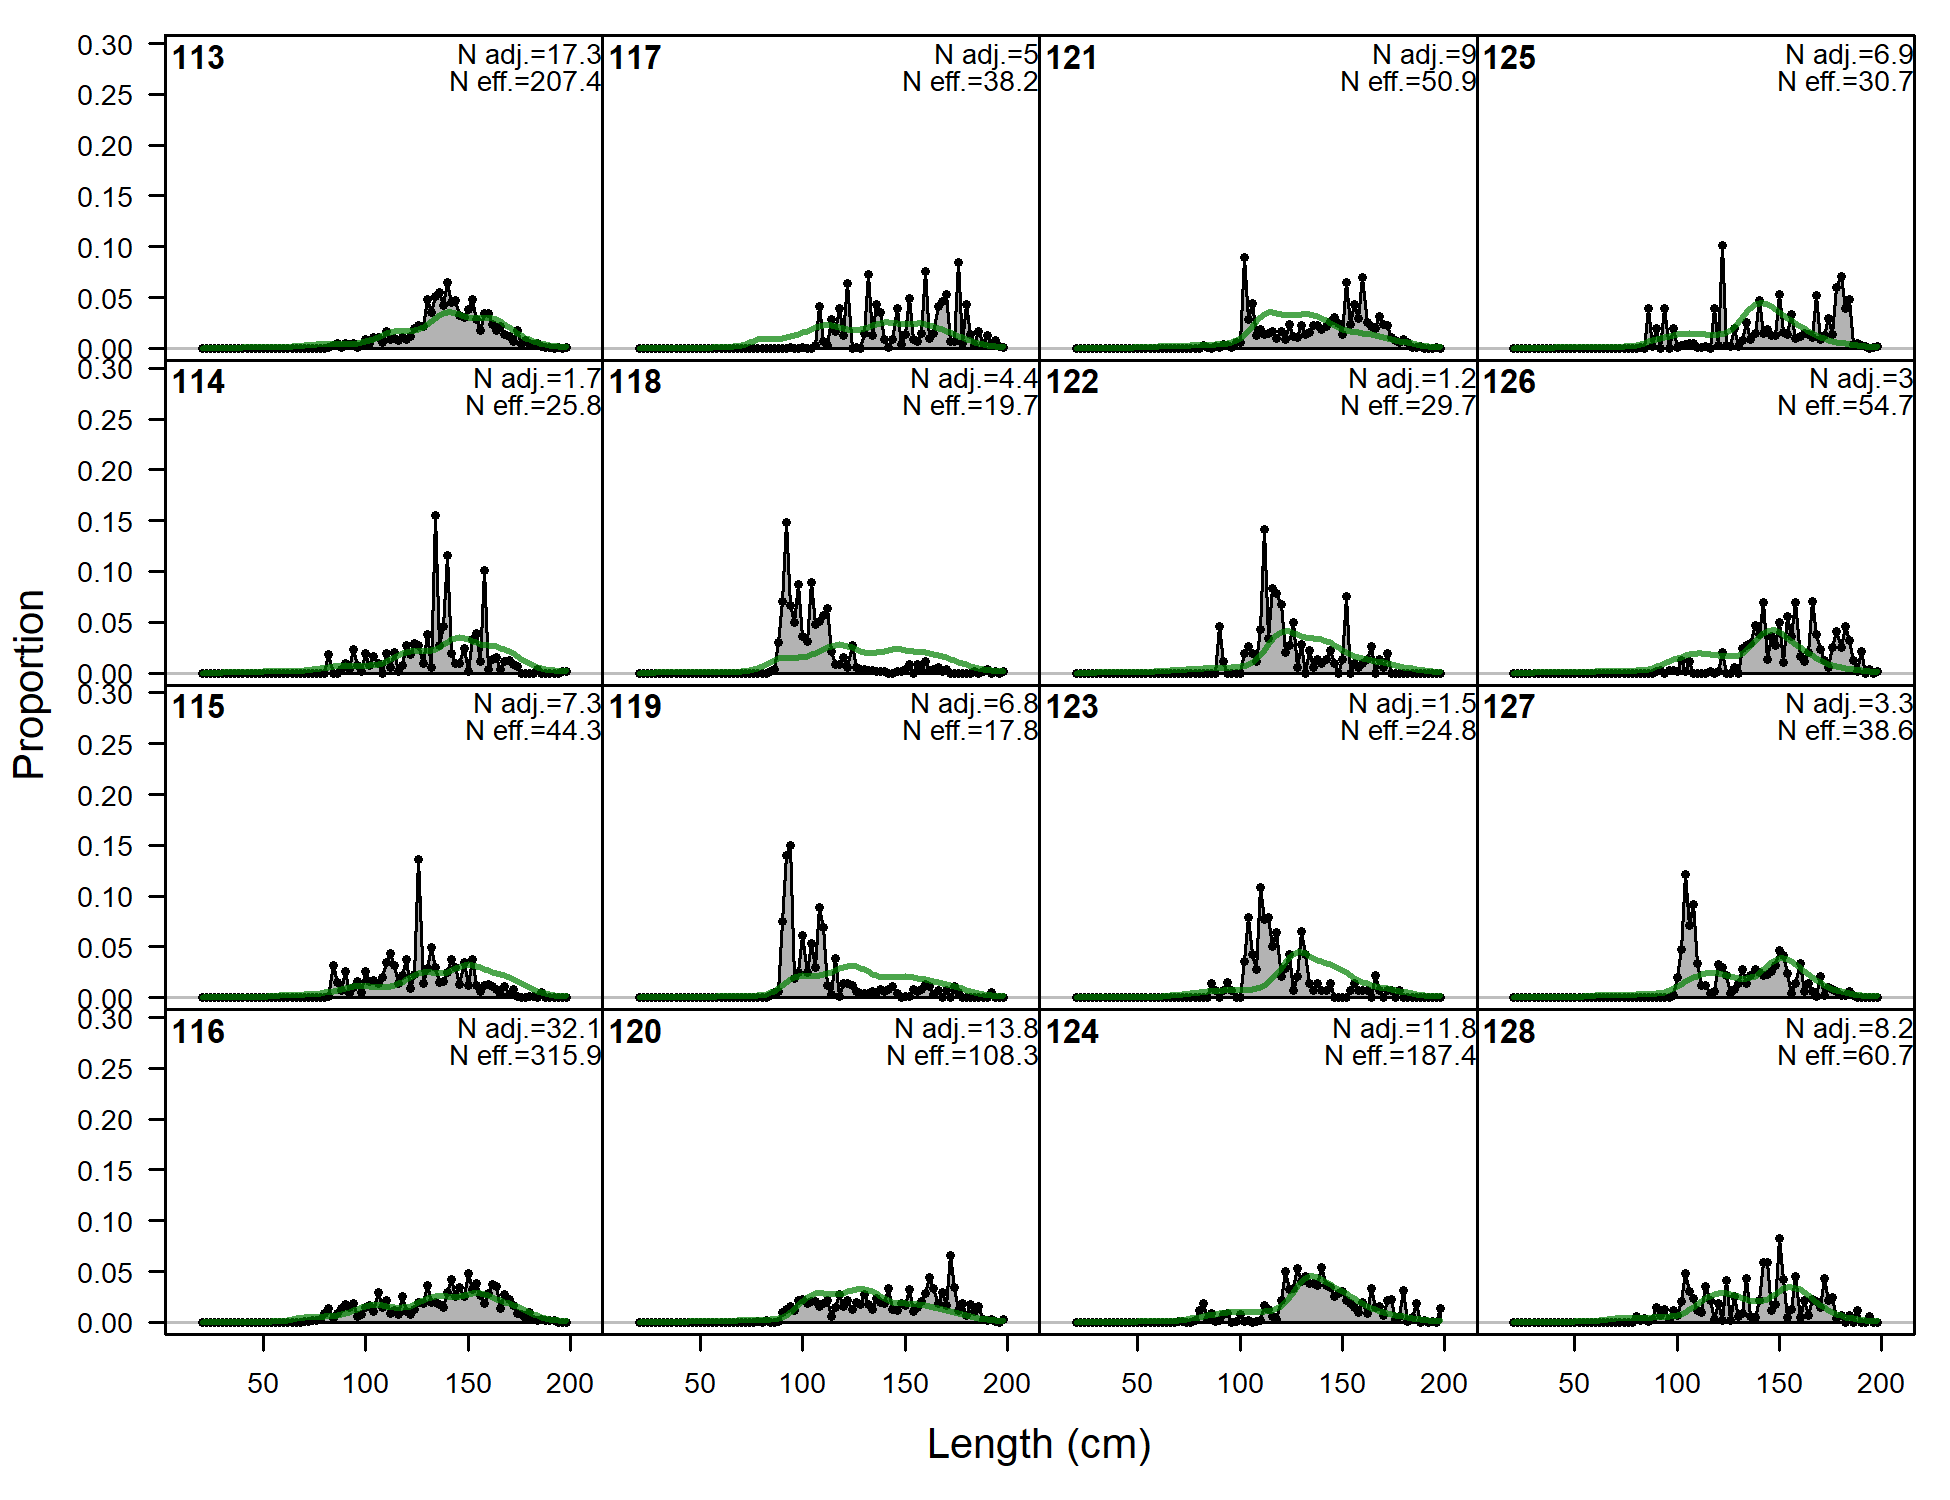
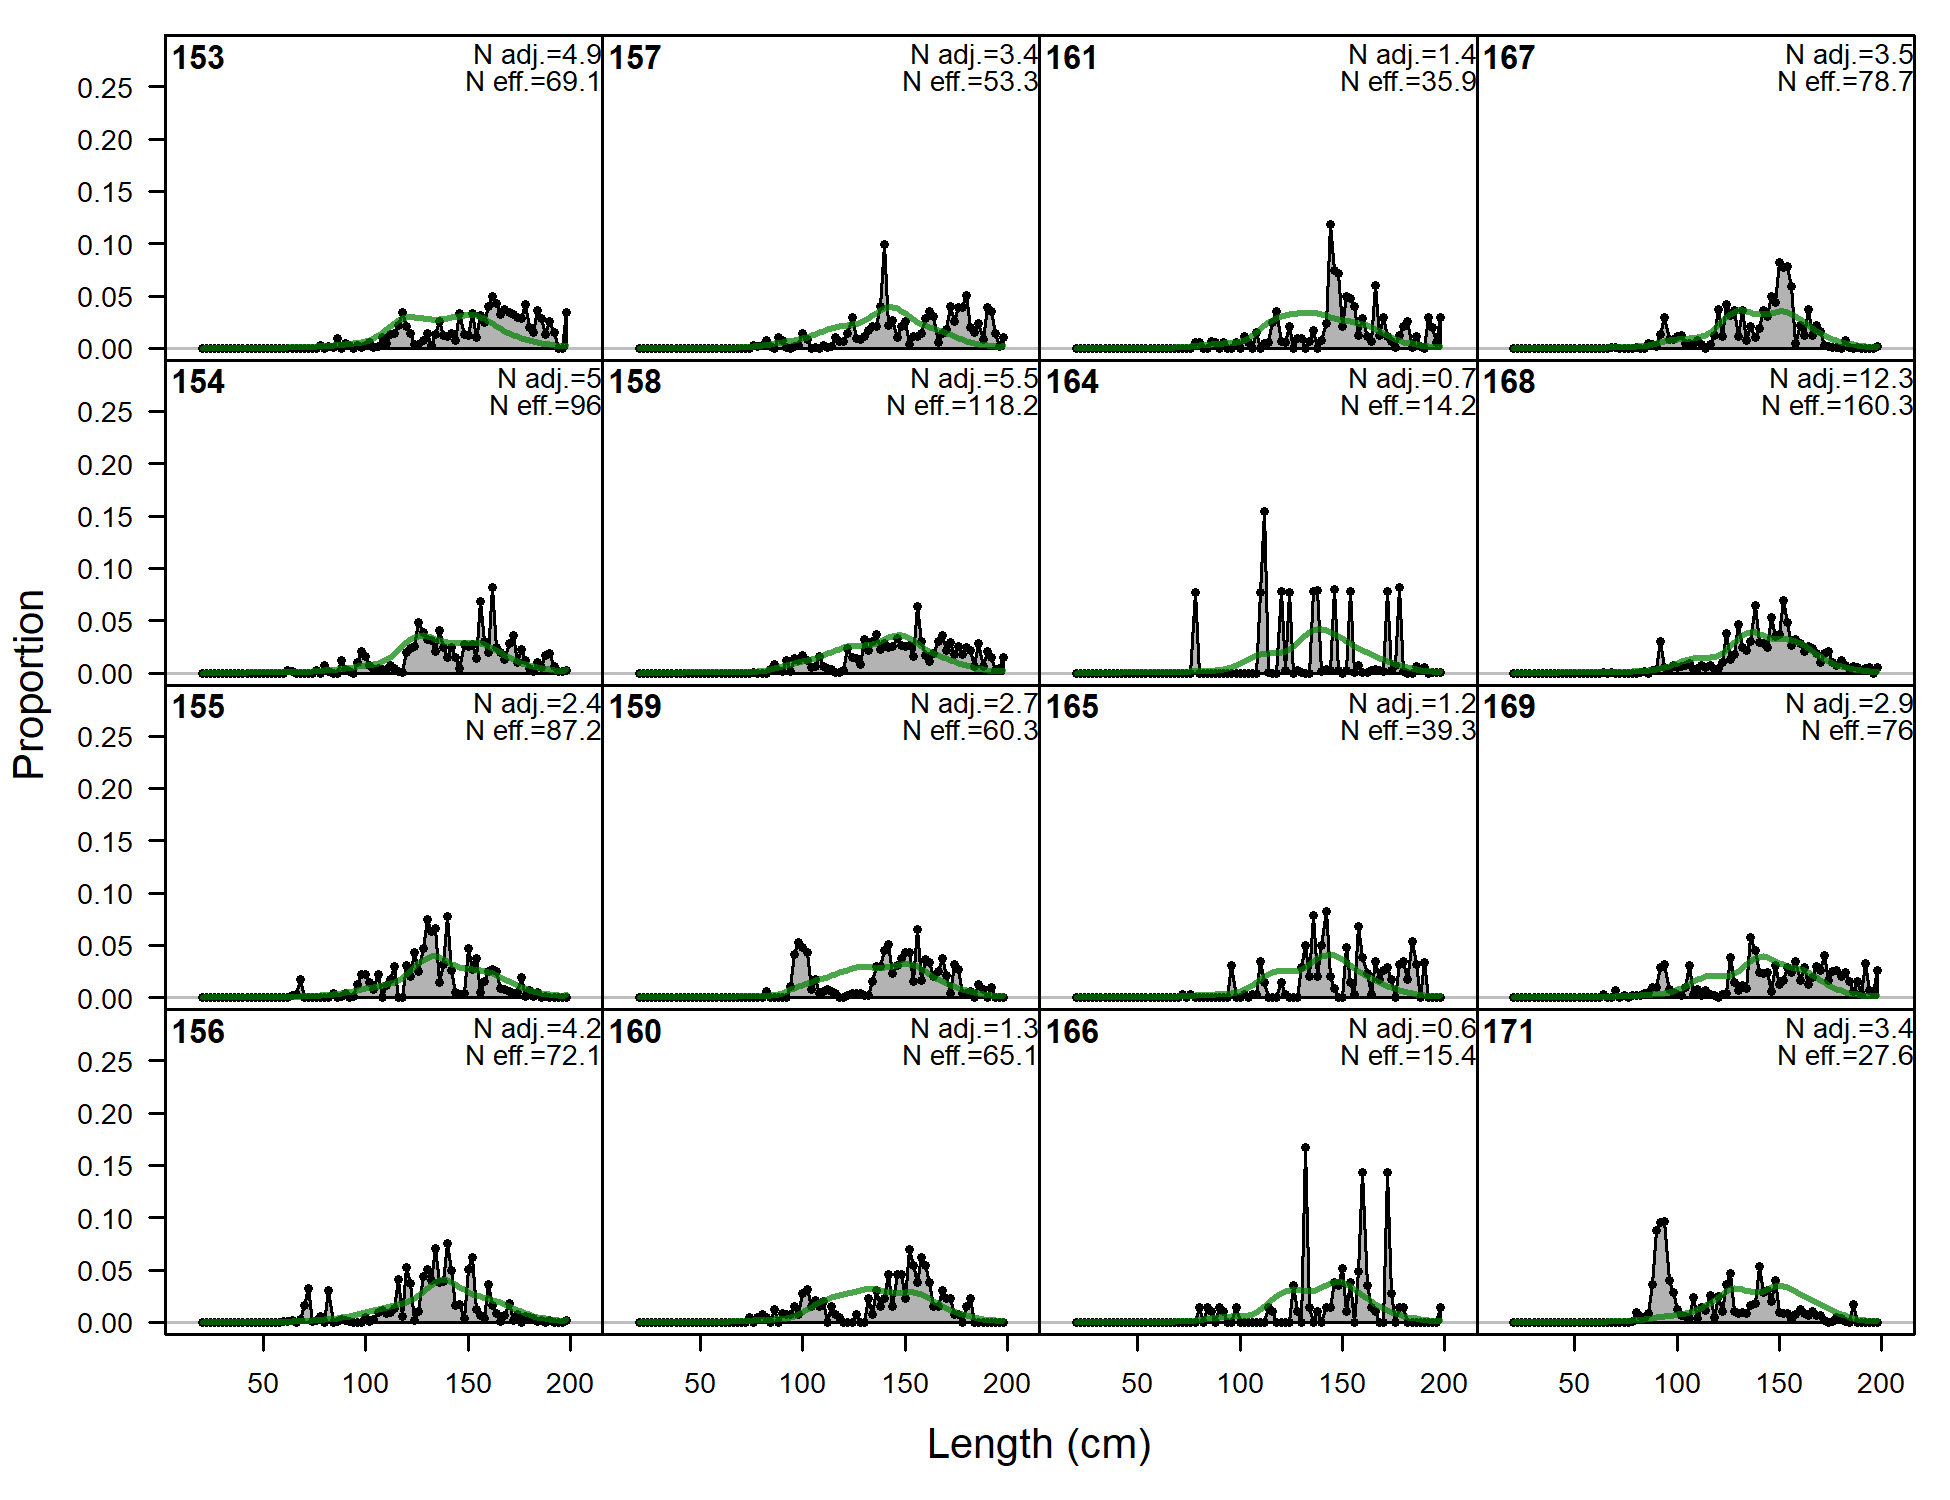
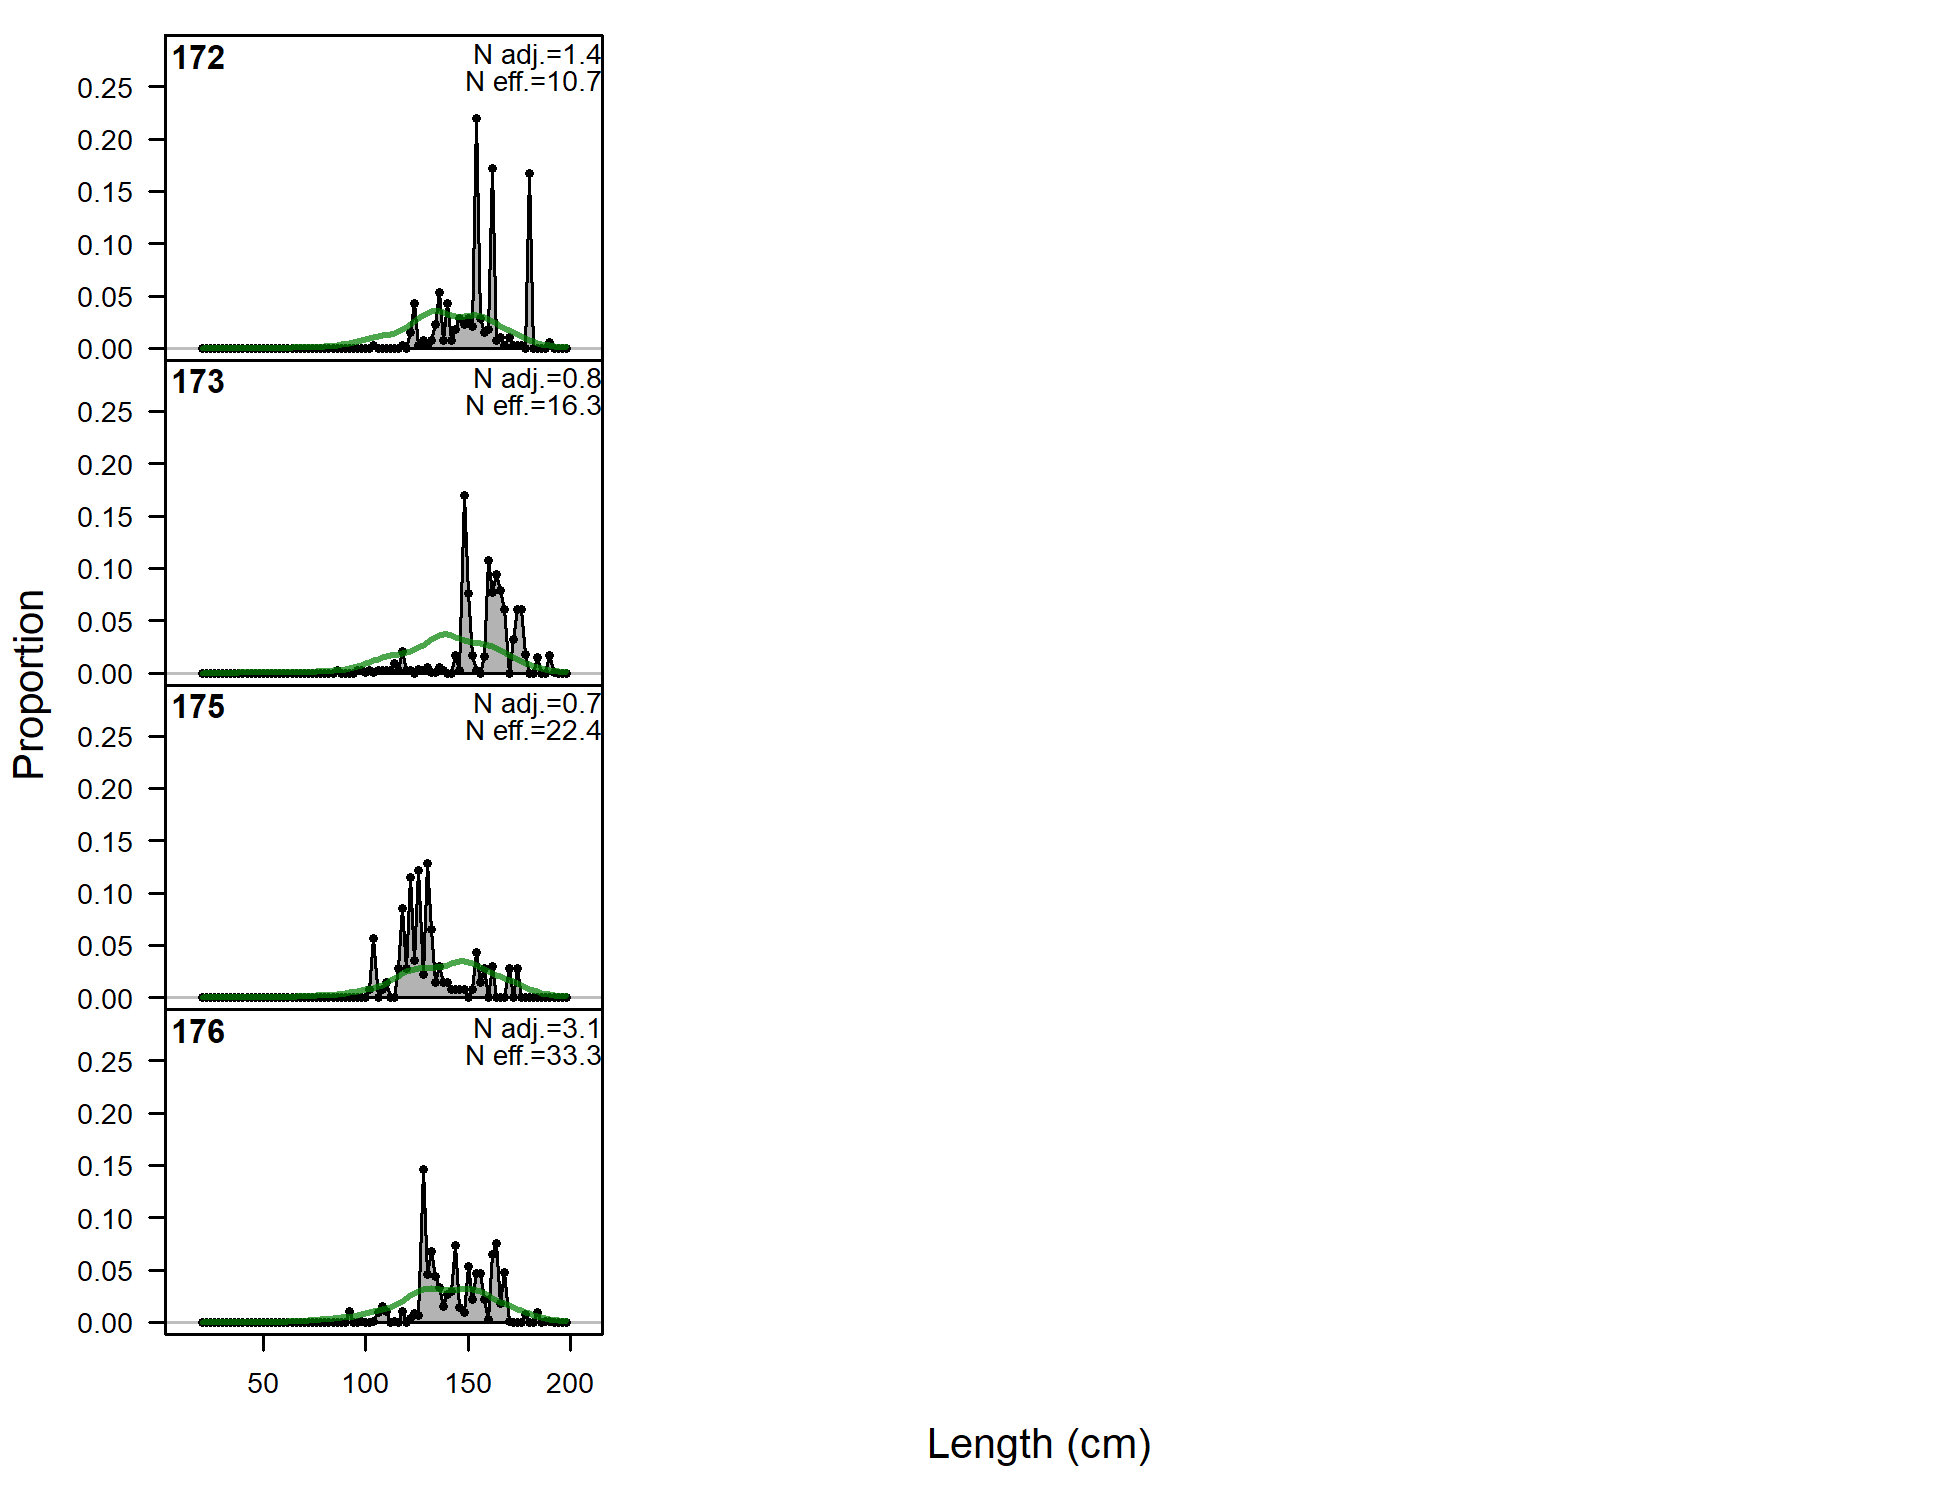
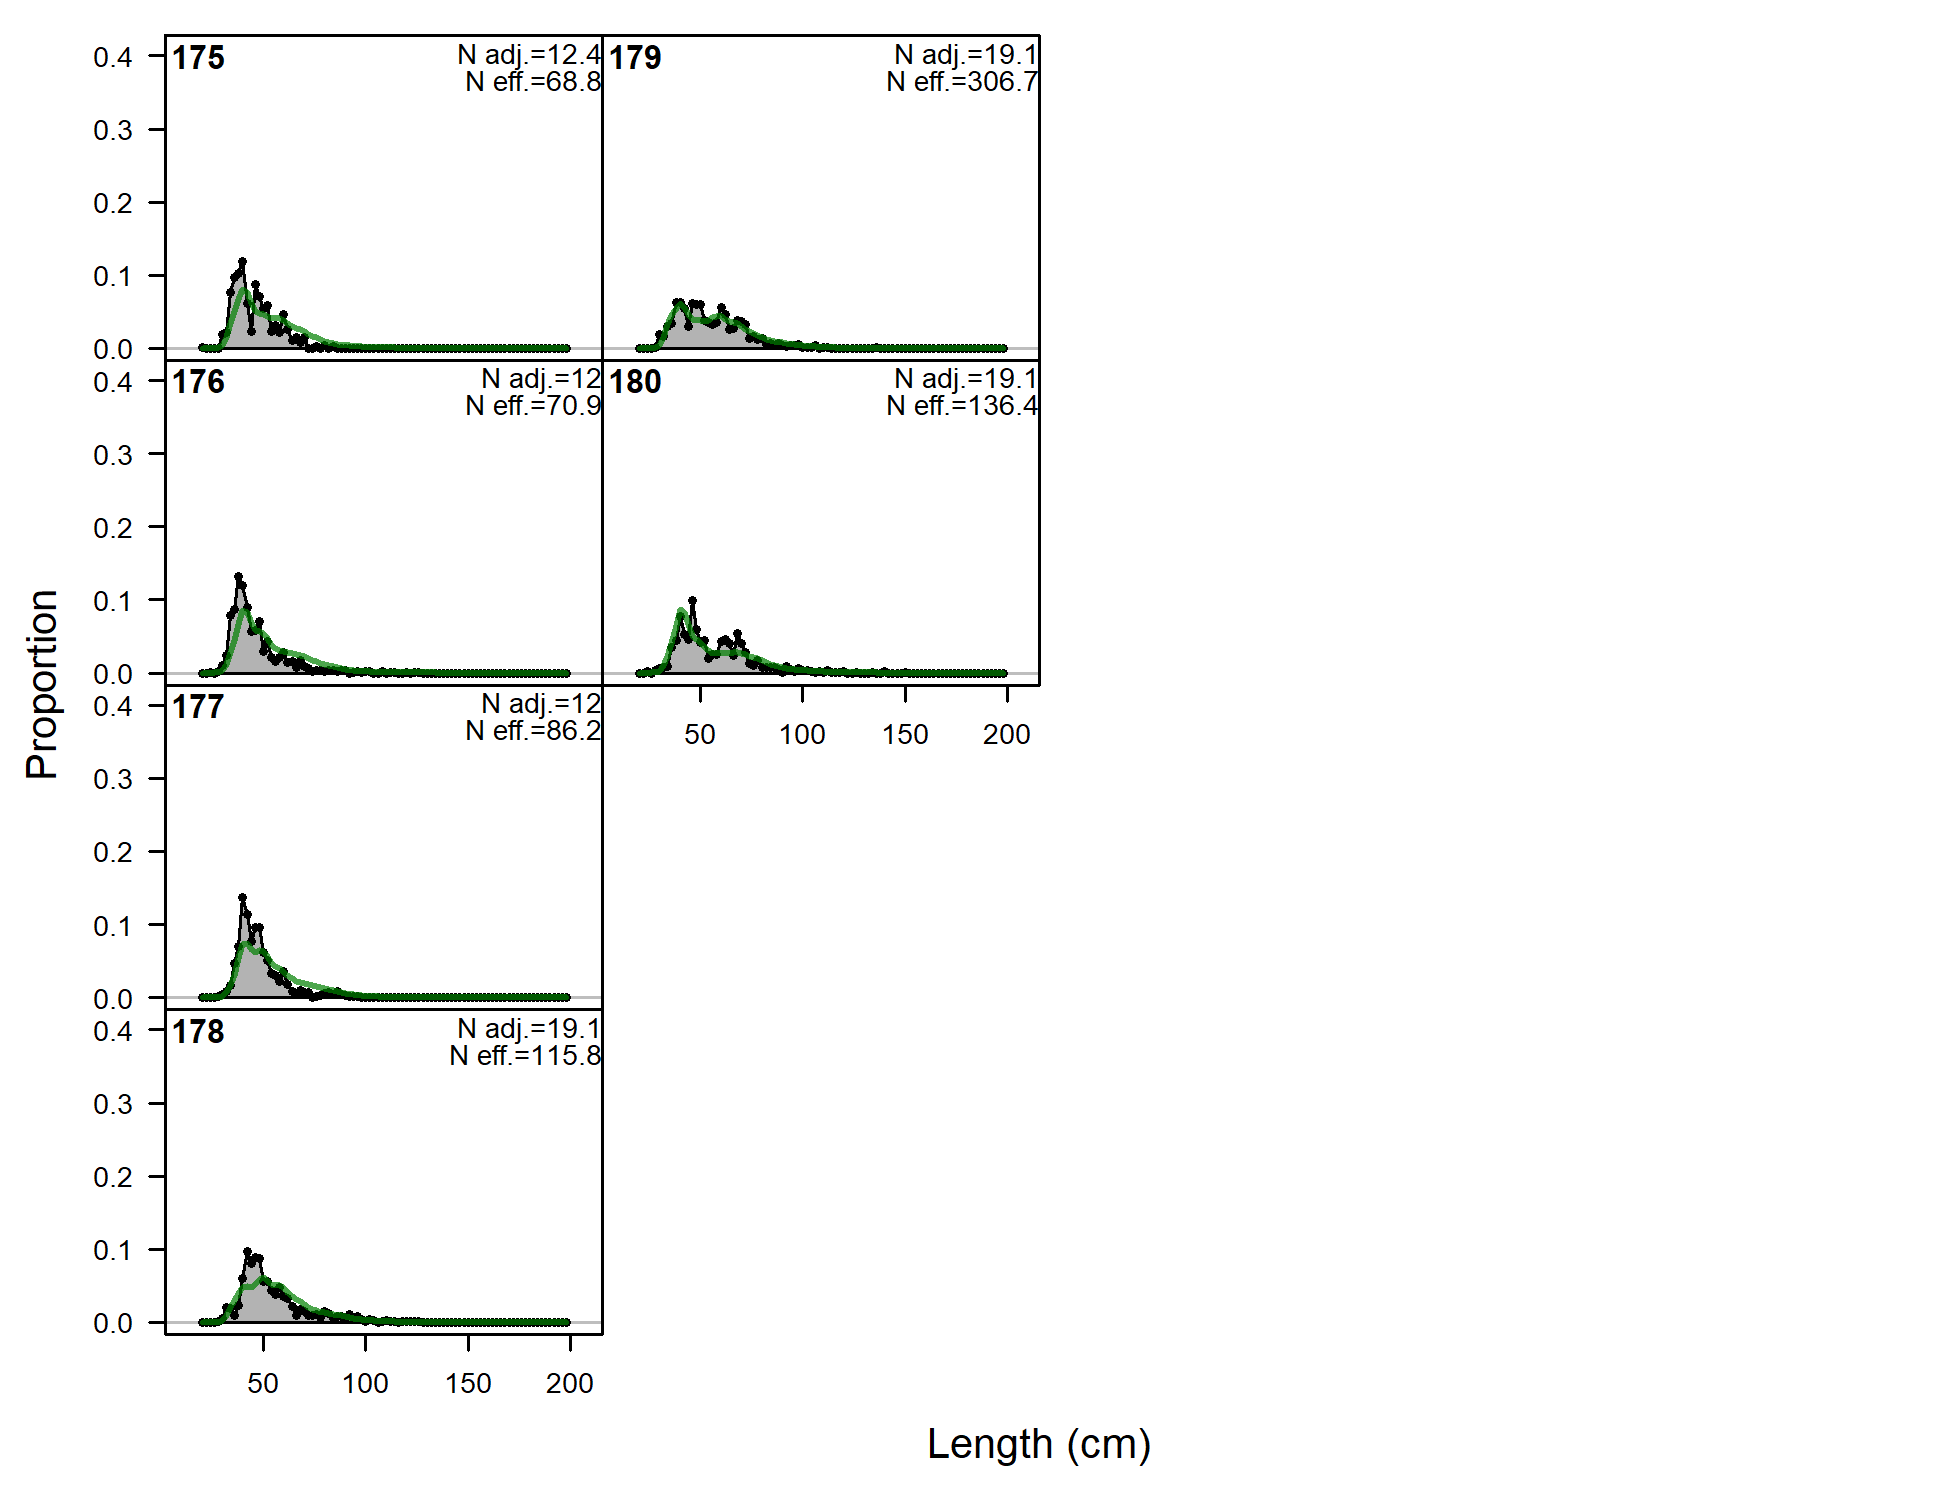
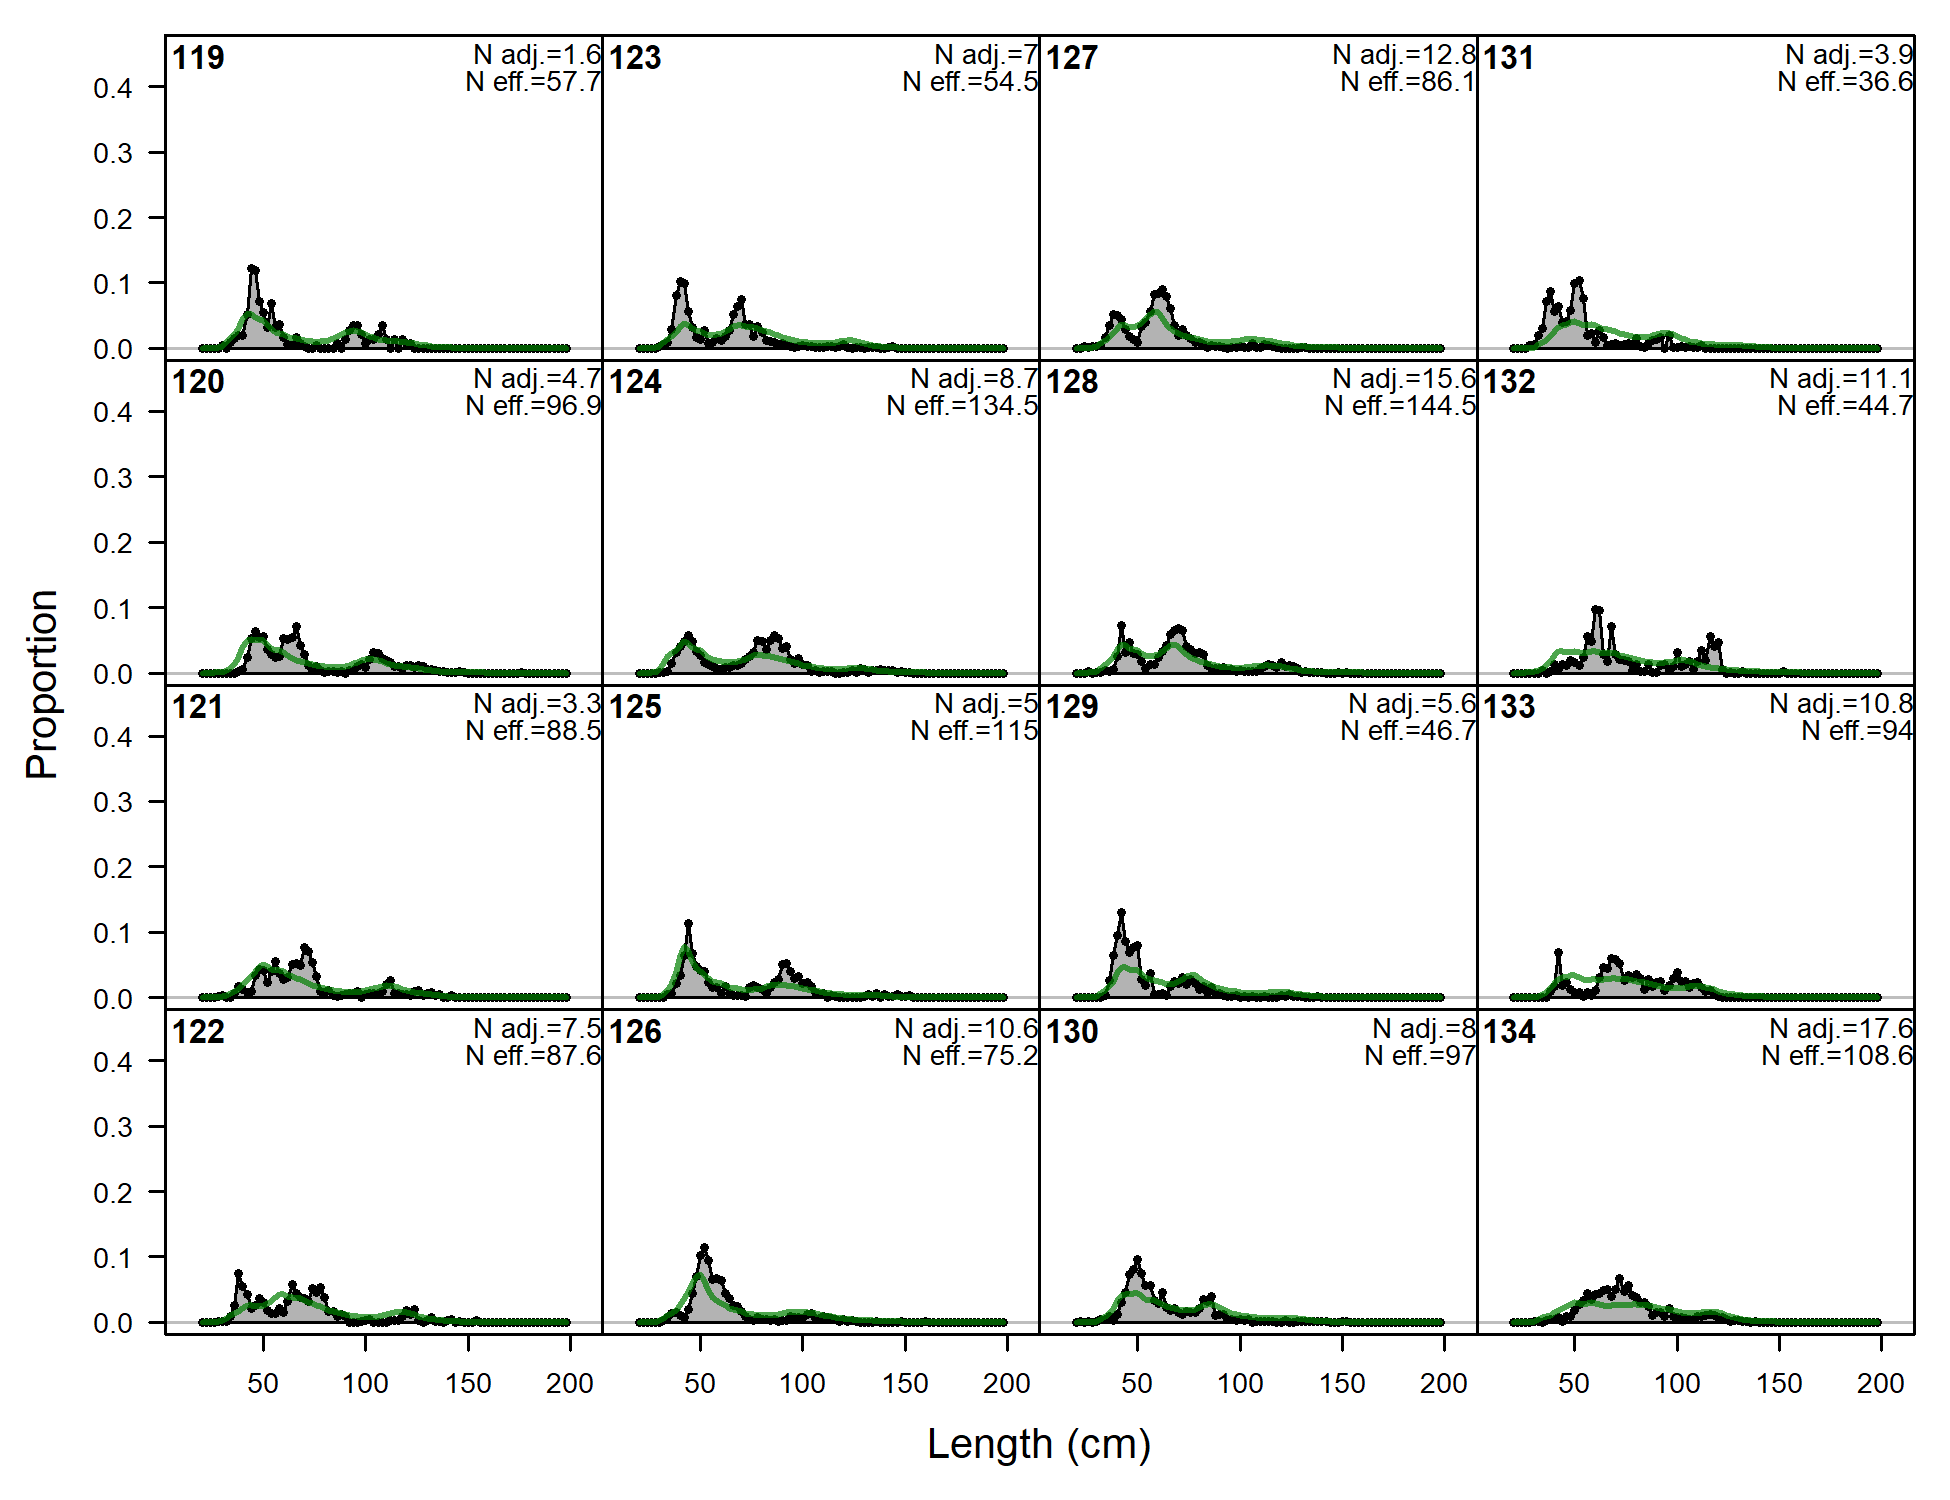
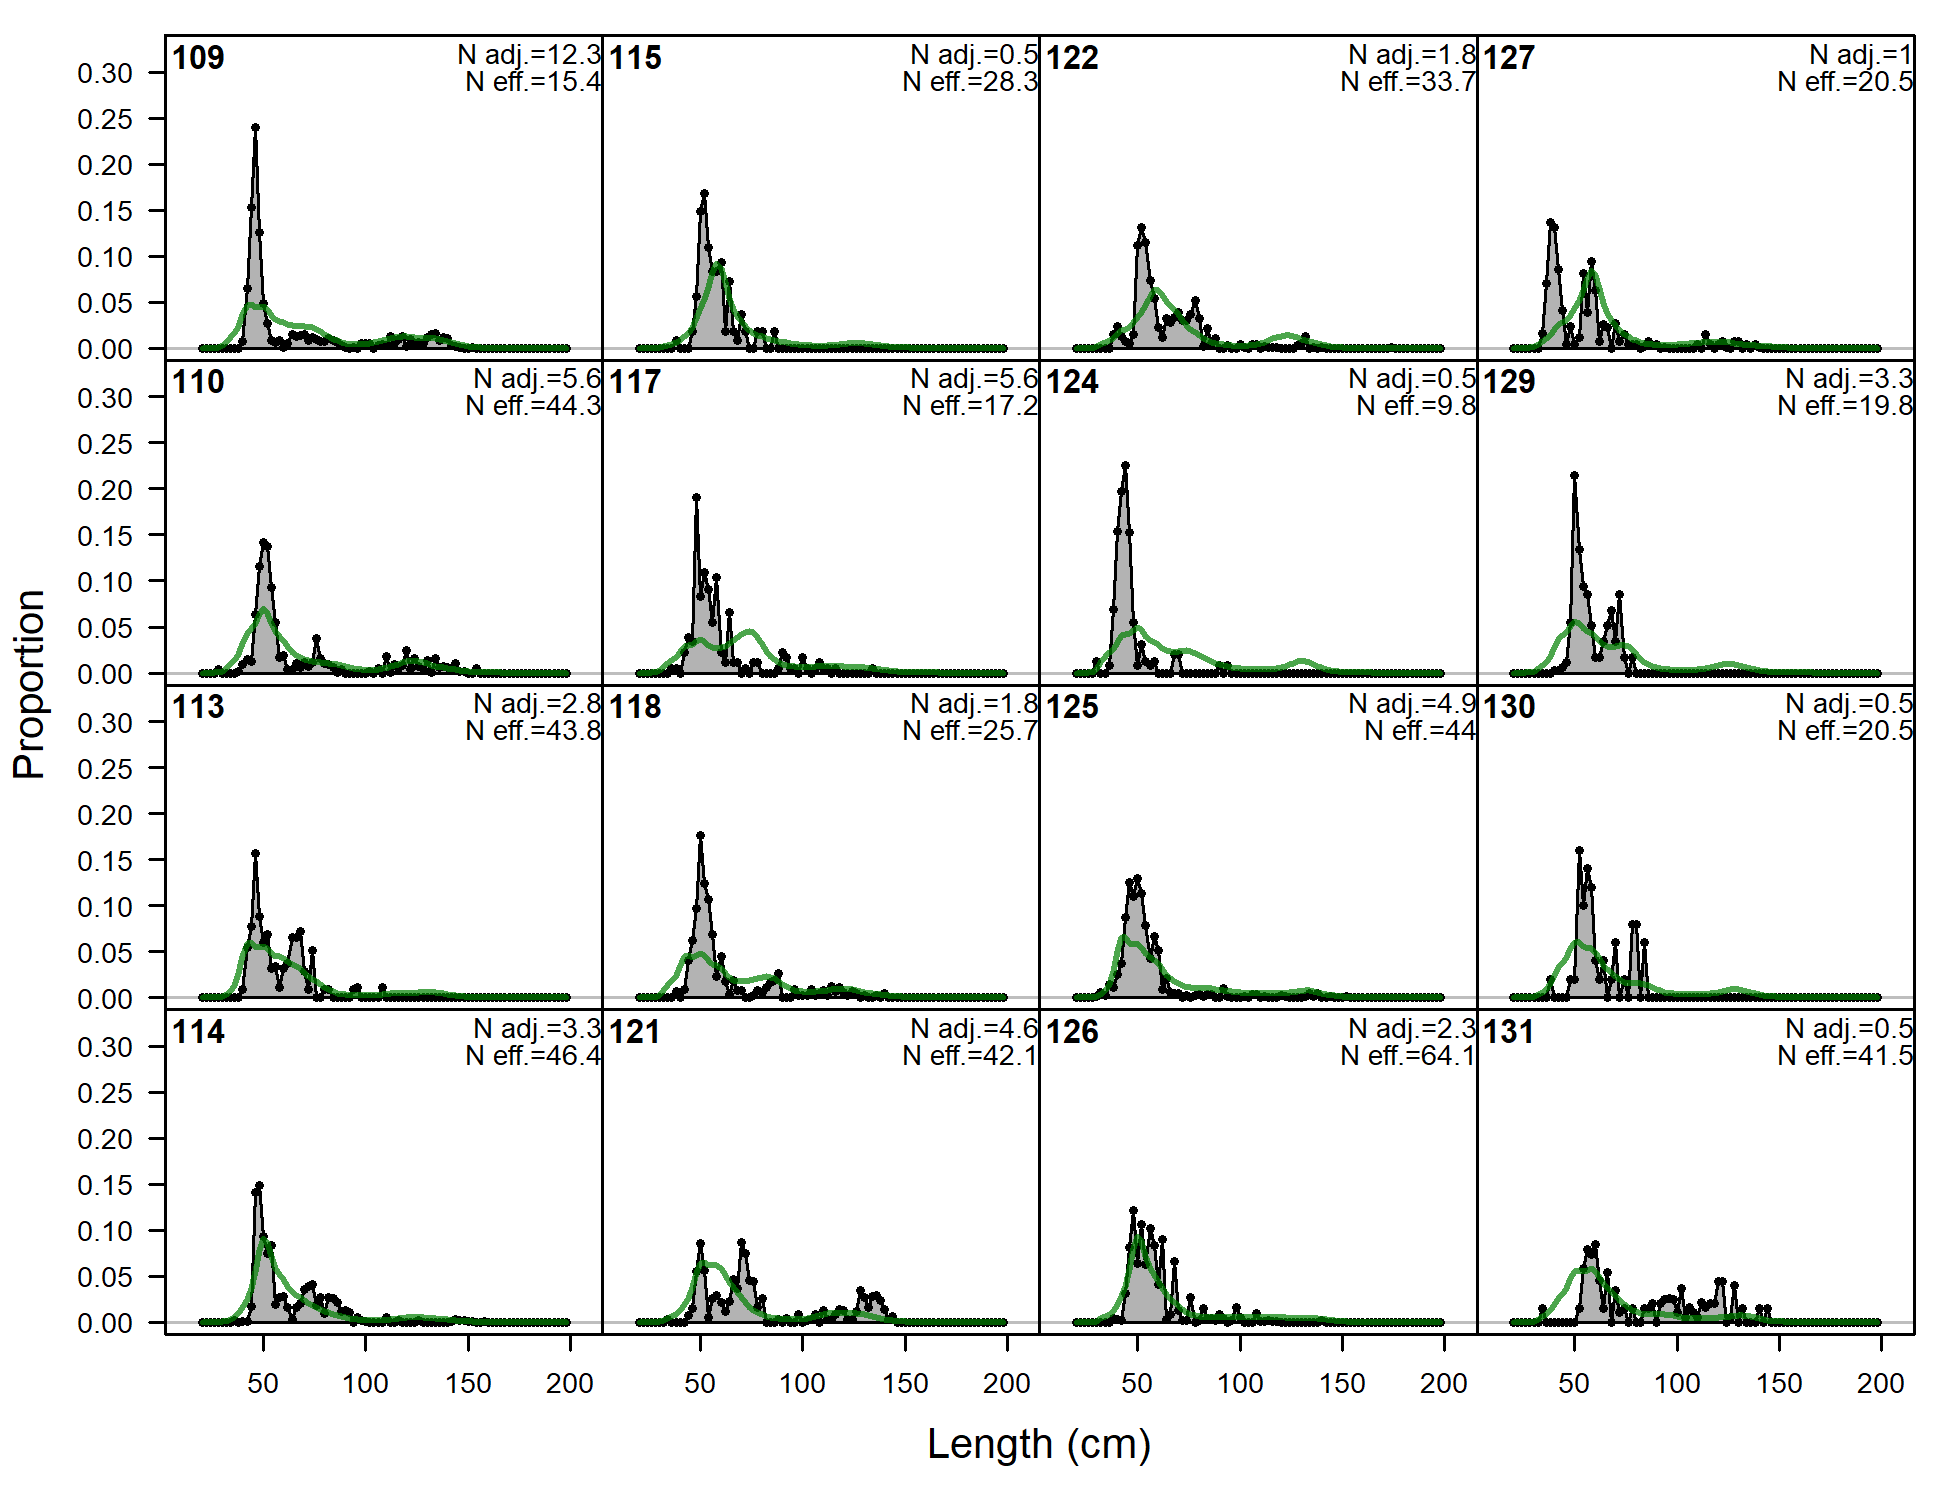
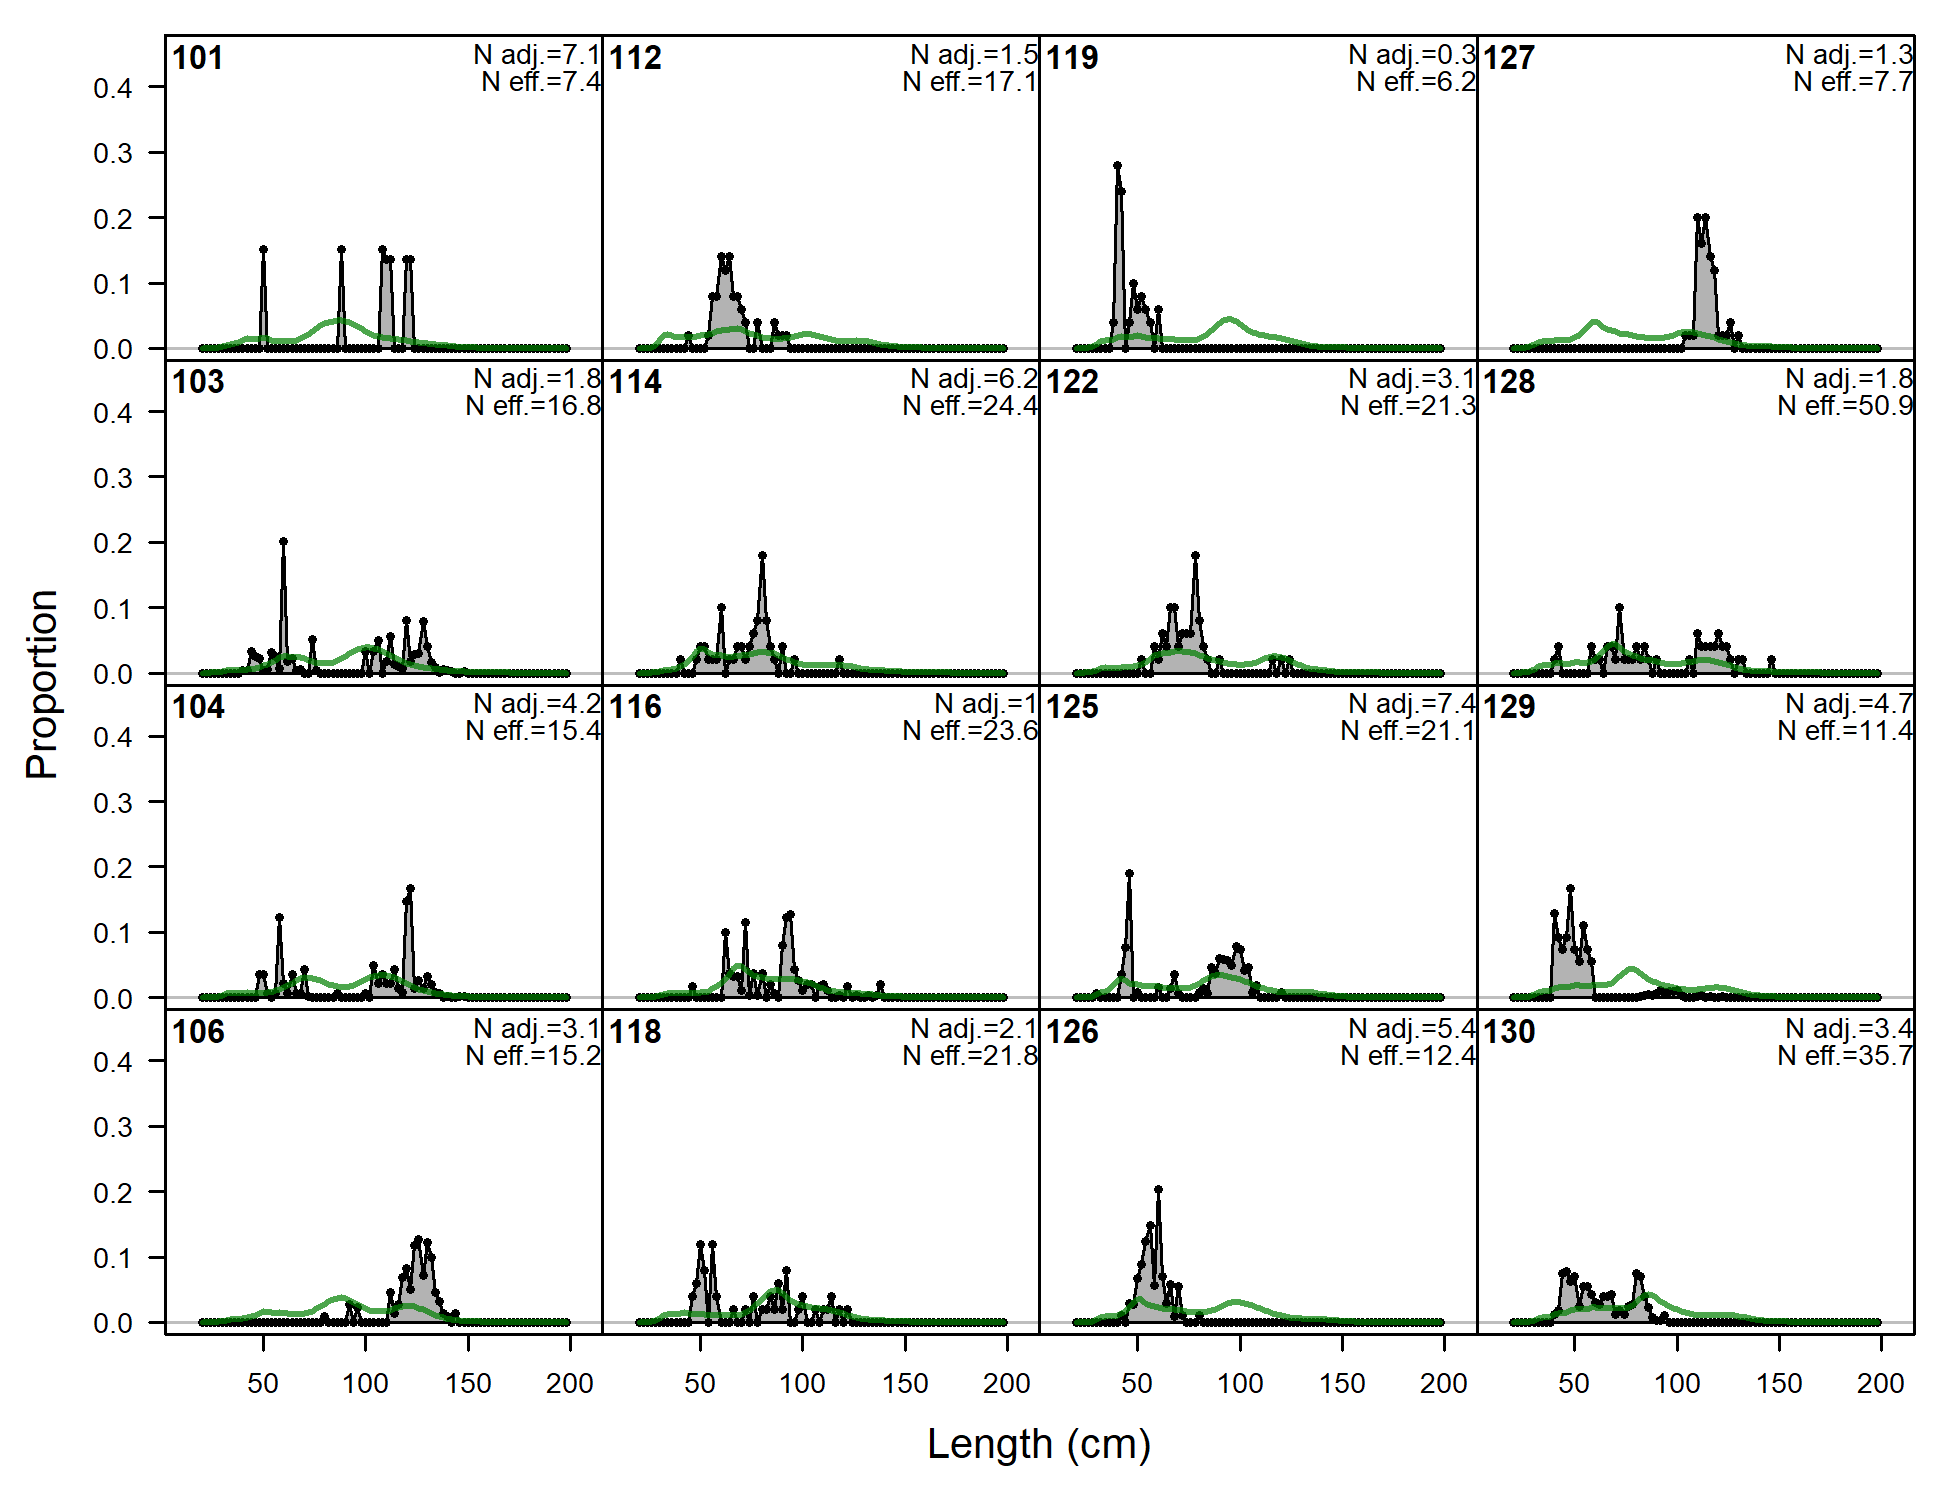
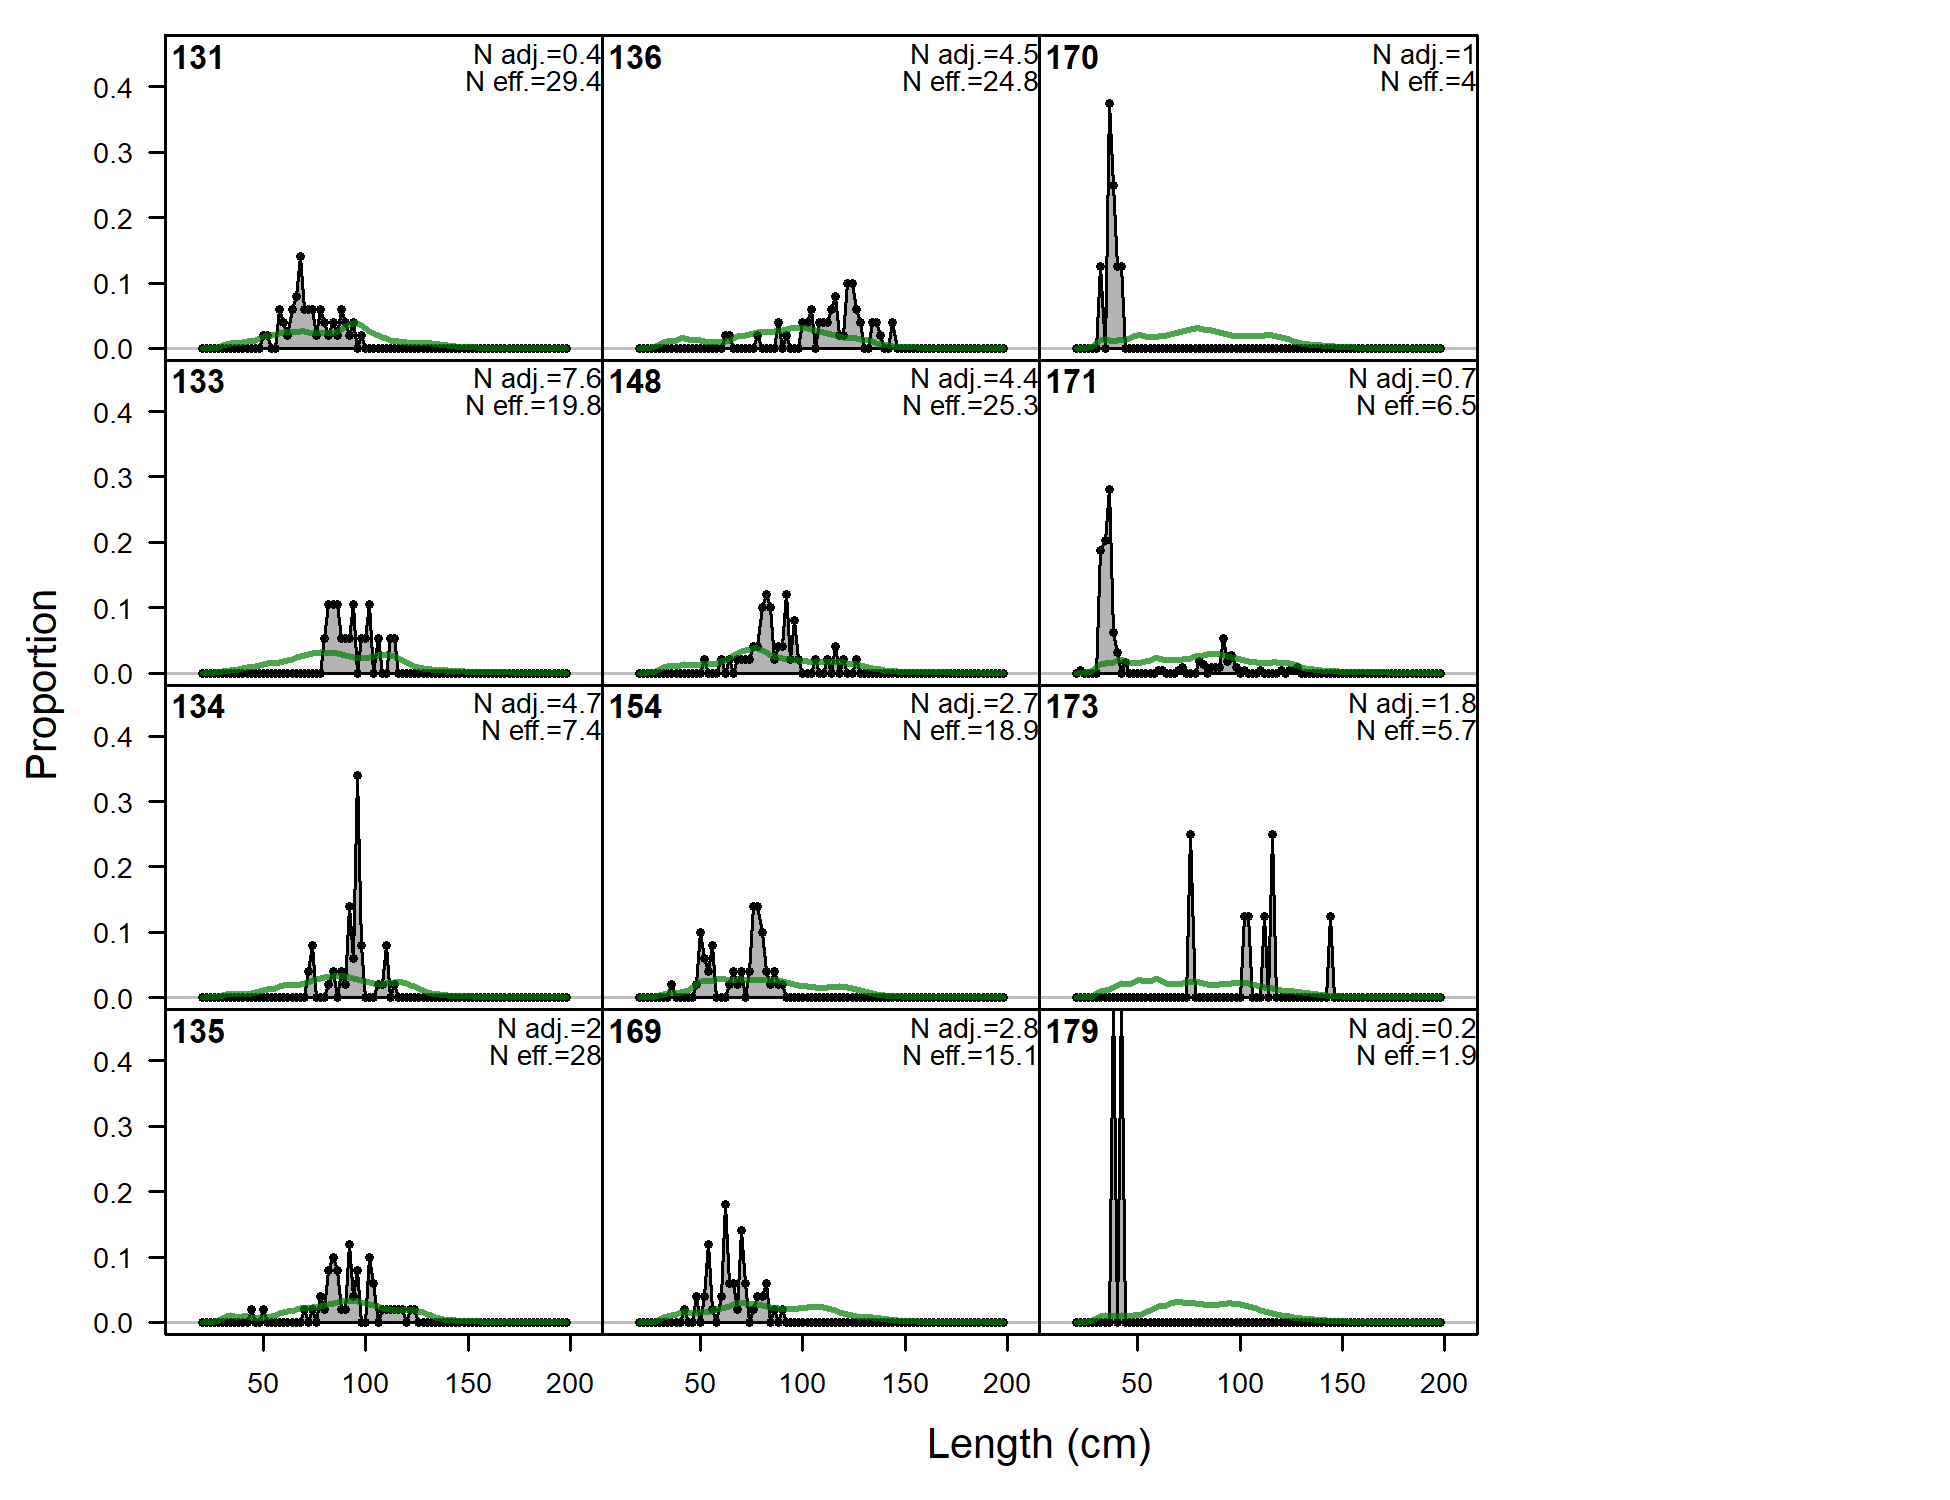
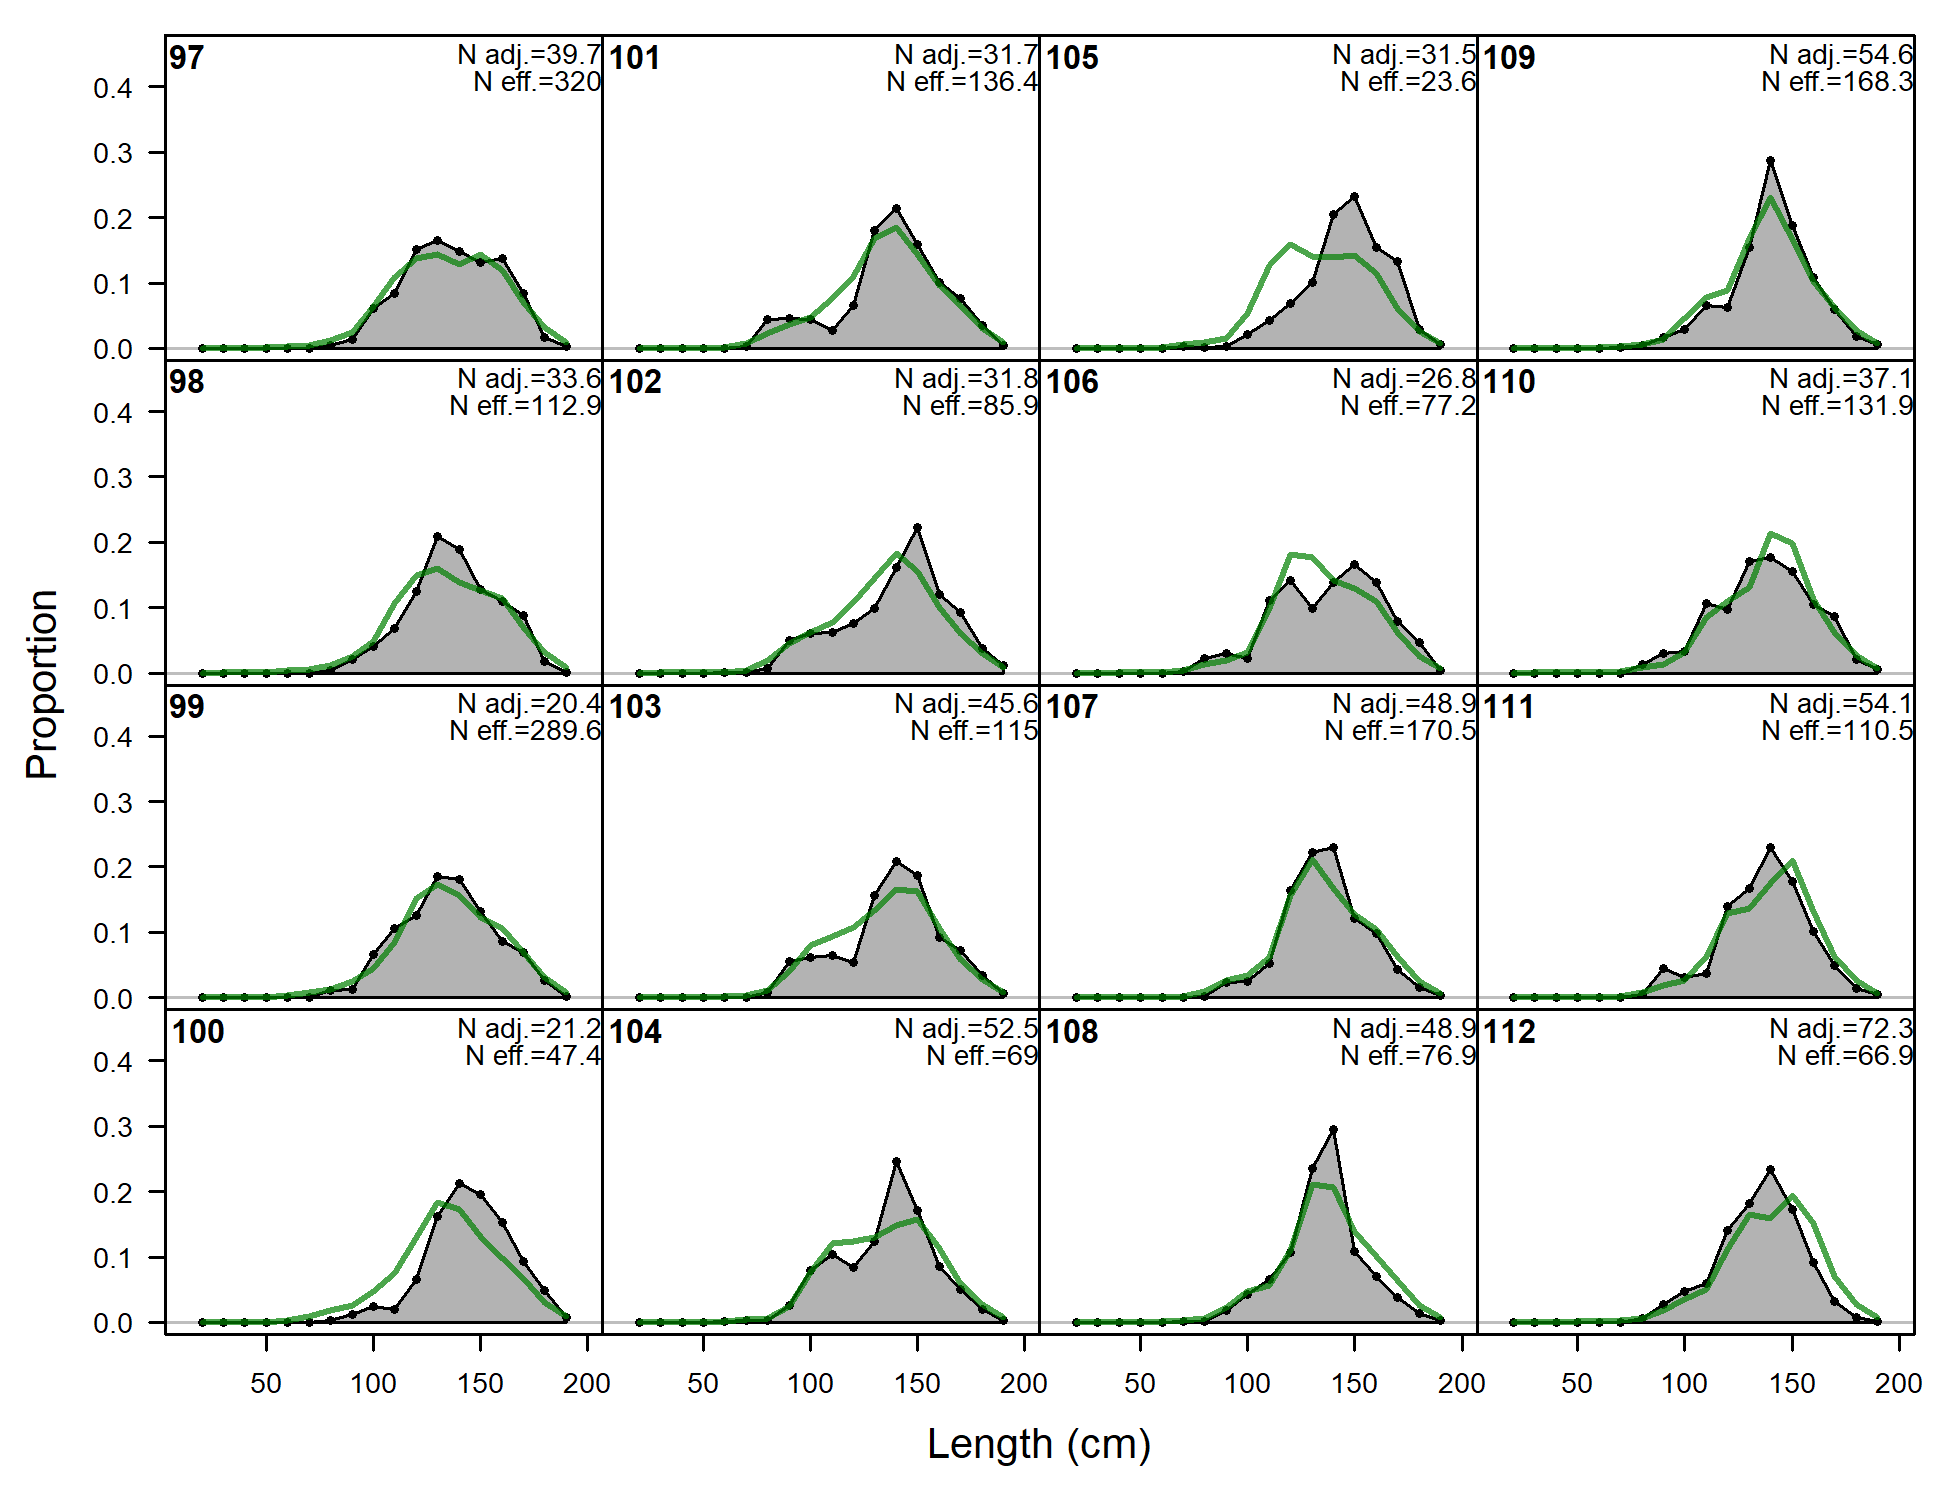
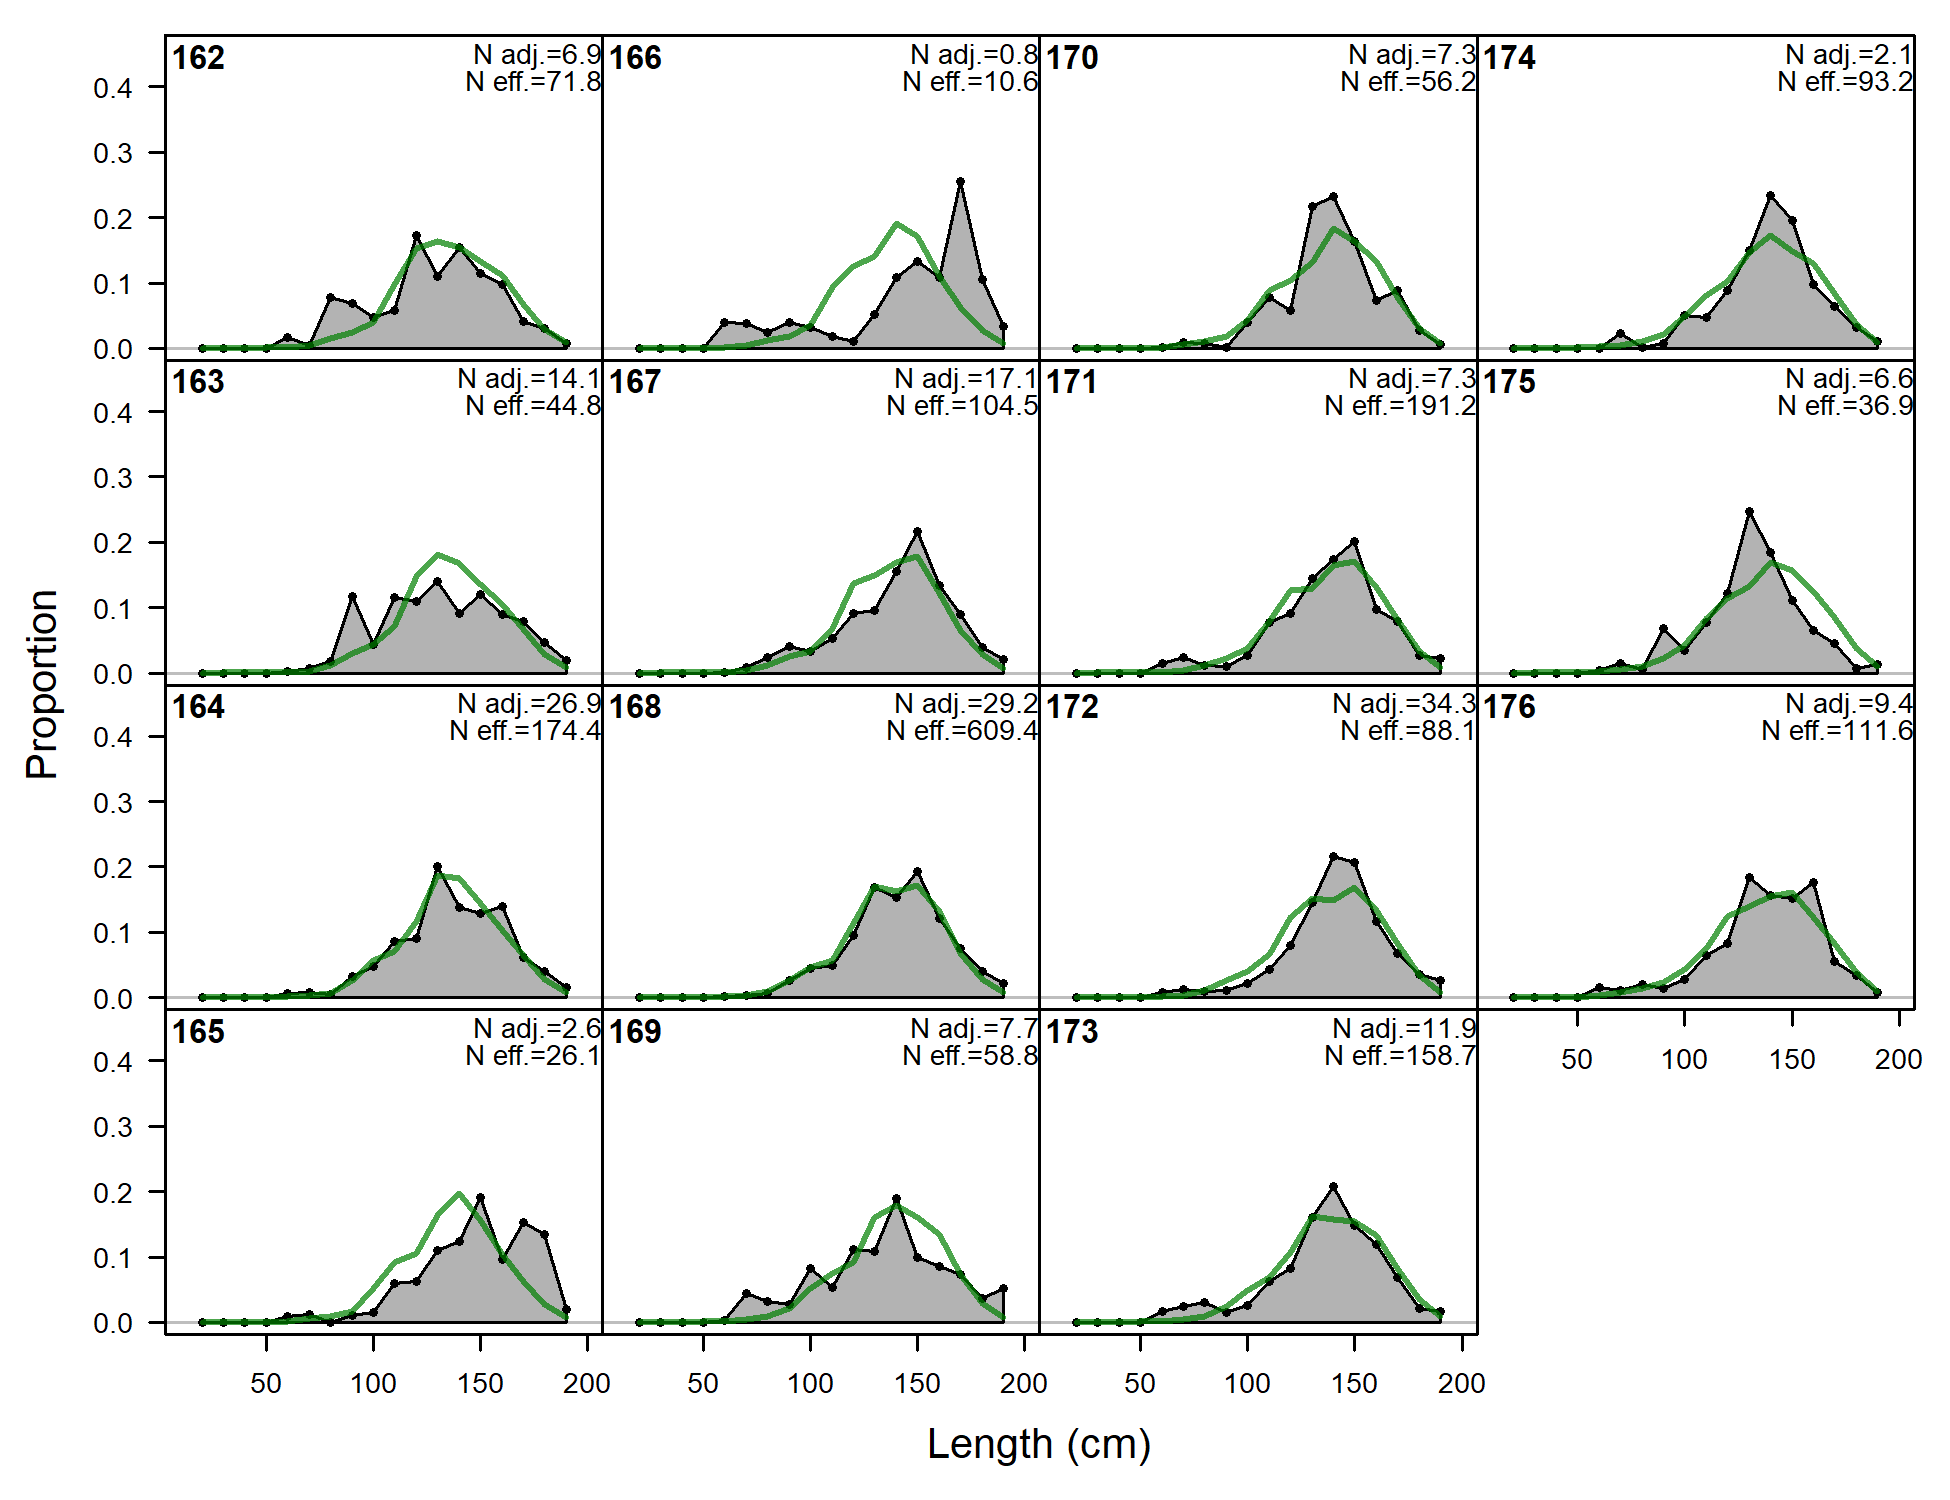
Length comps, whole catch, A1-LL-n (plot 2 of 2)
file: comp_lenfit_flt1mkt0_page2.png
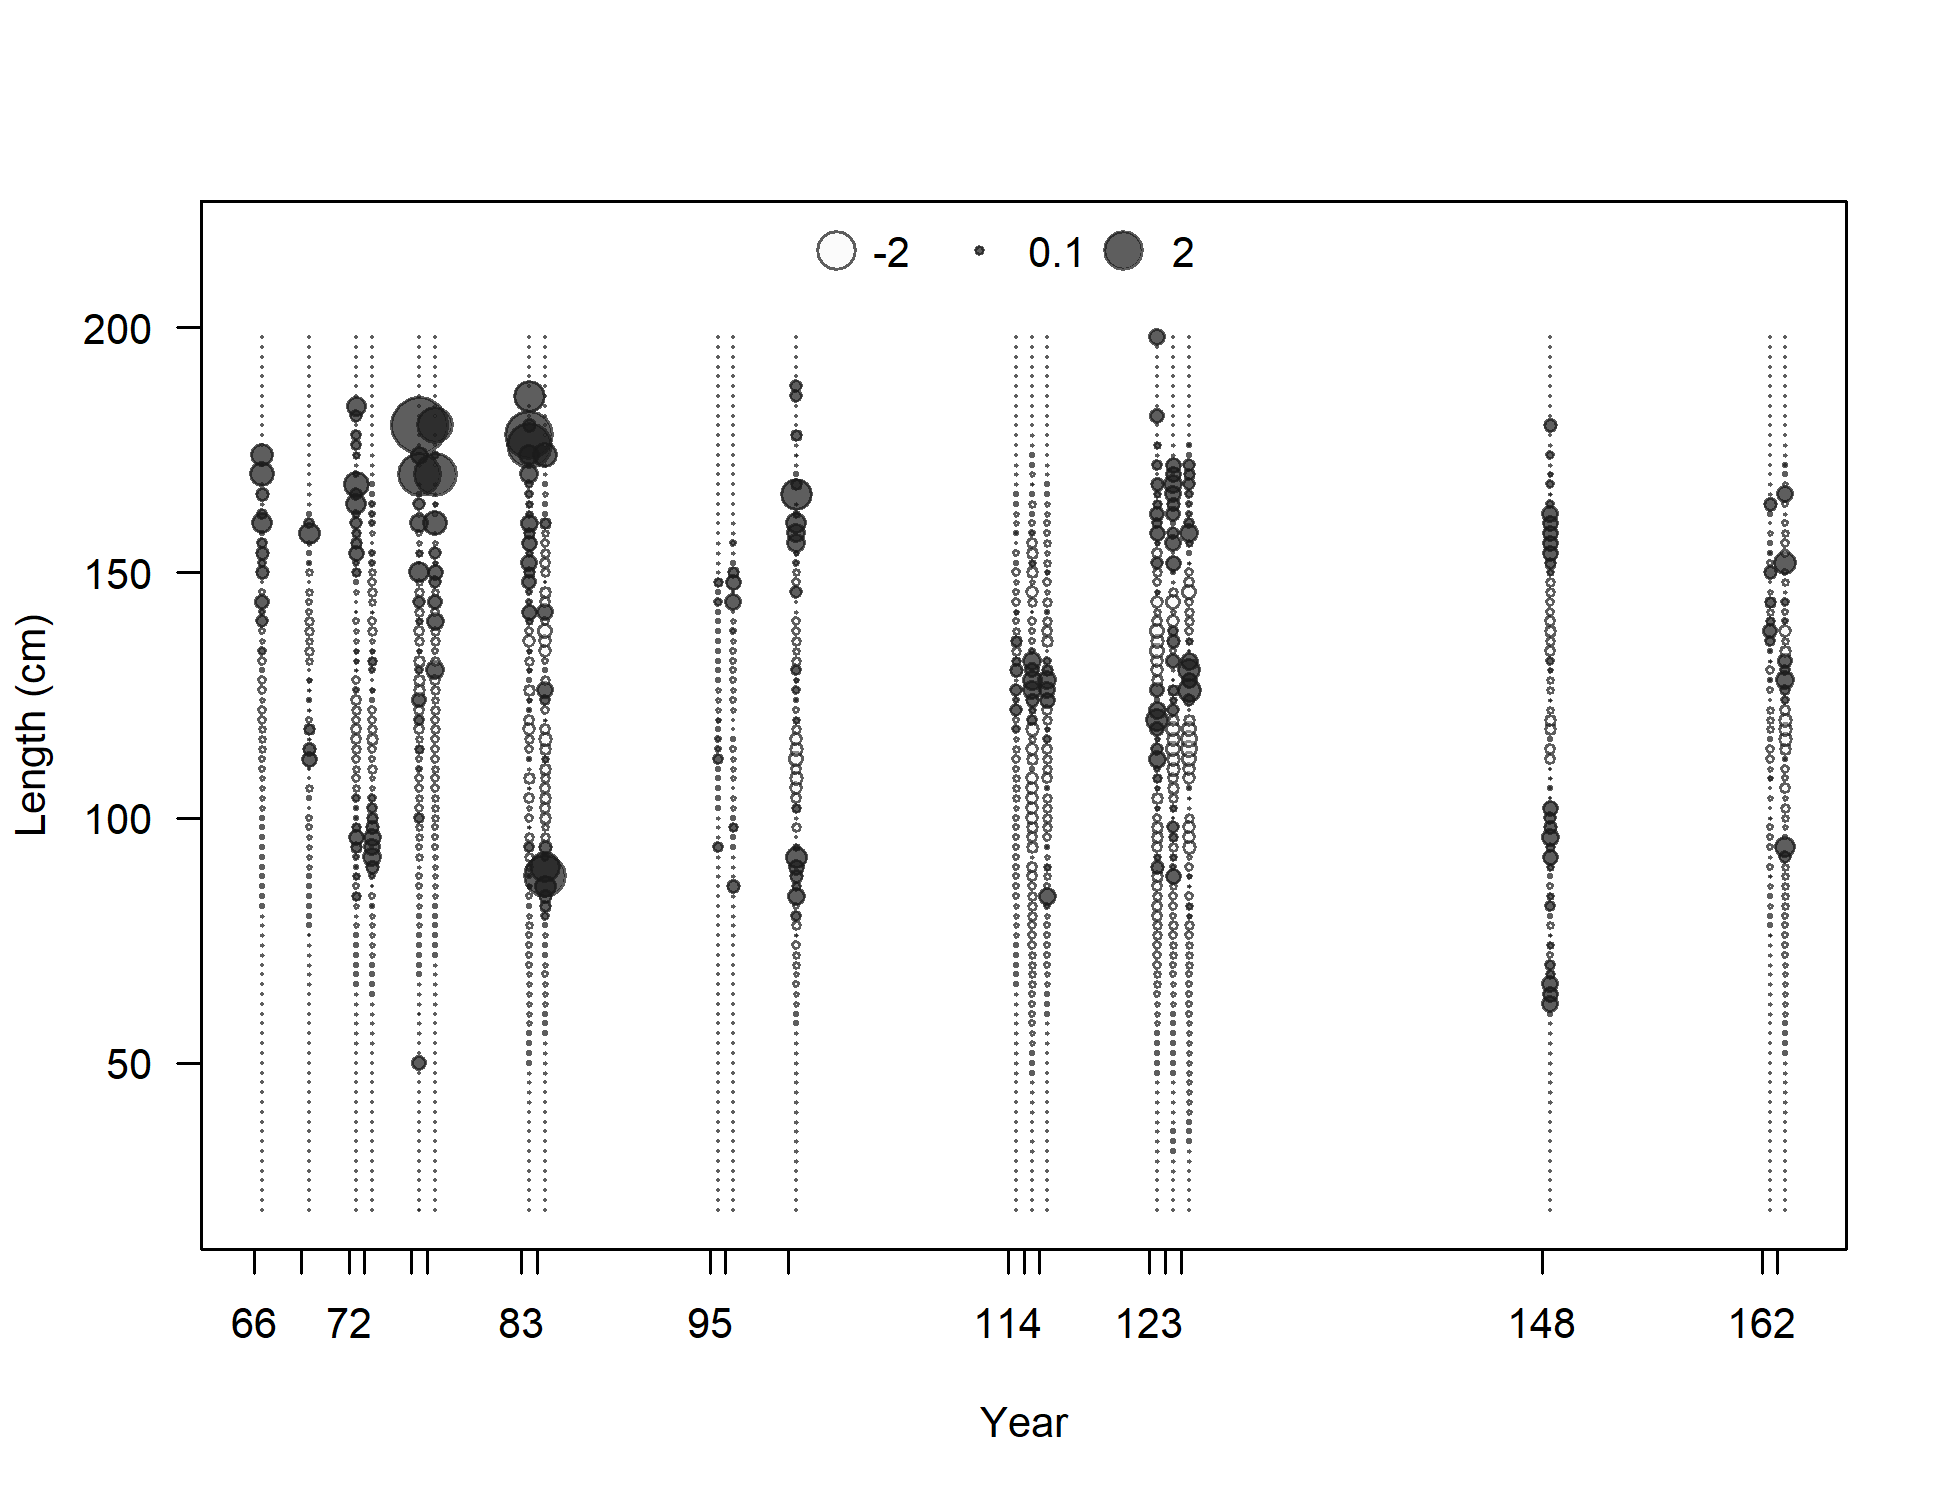
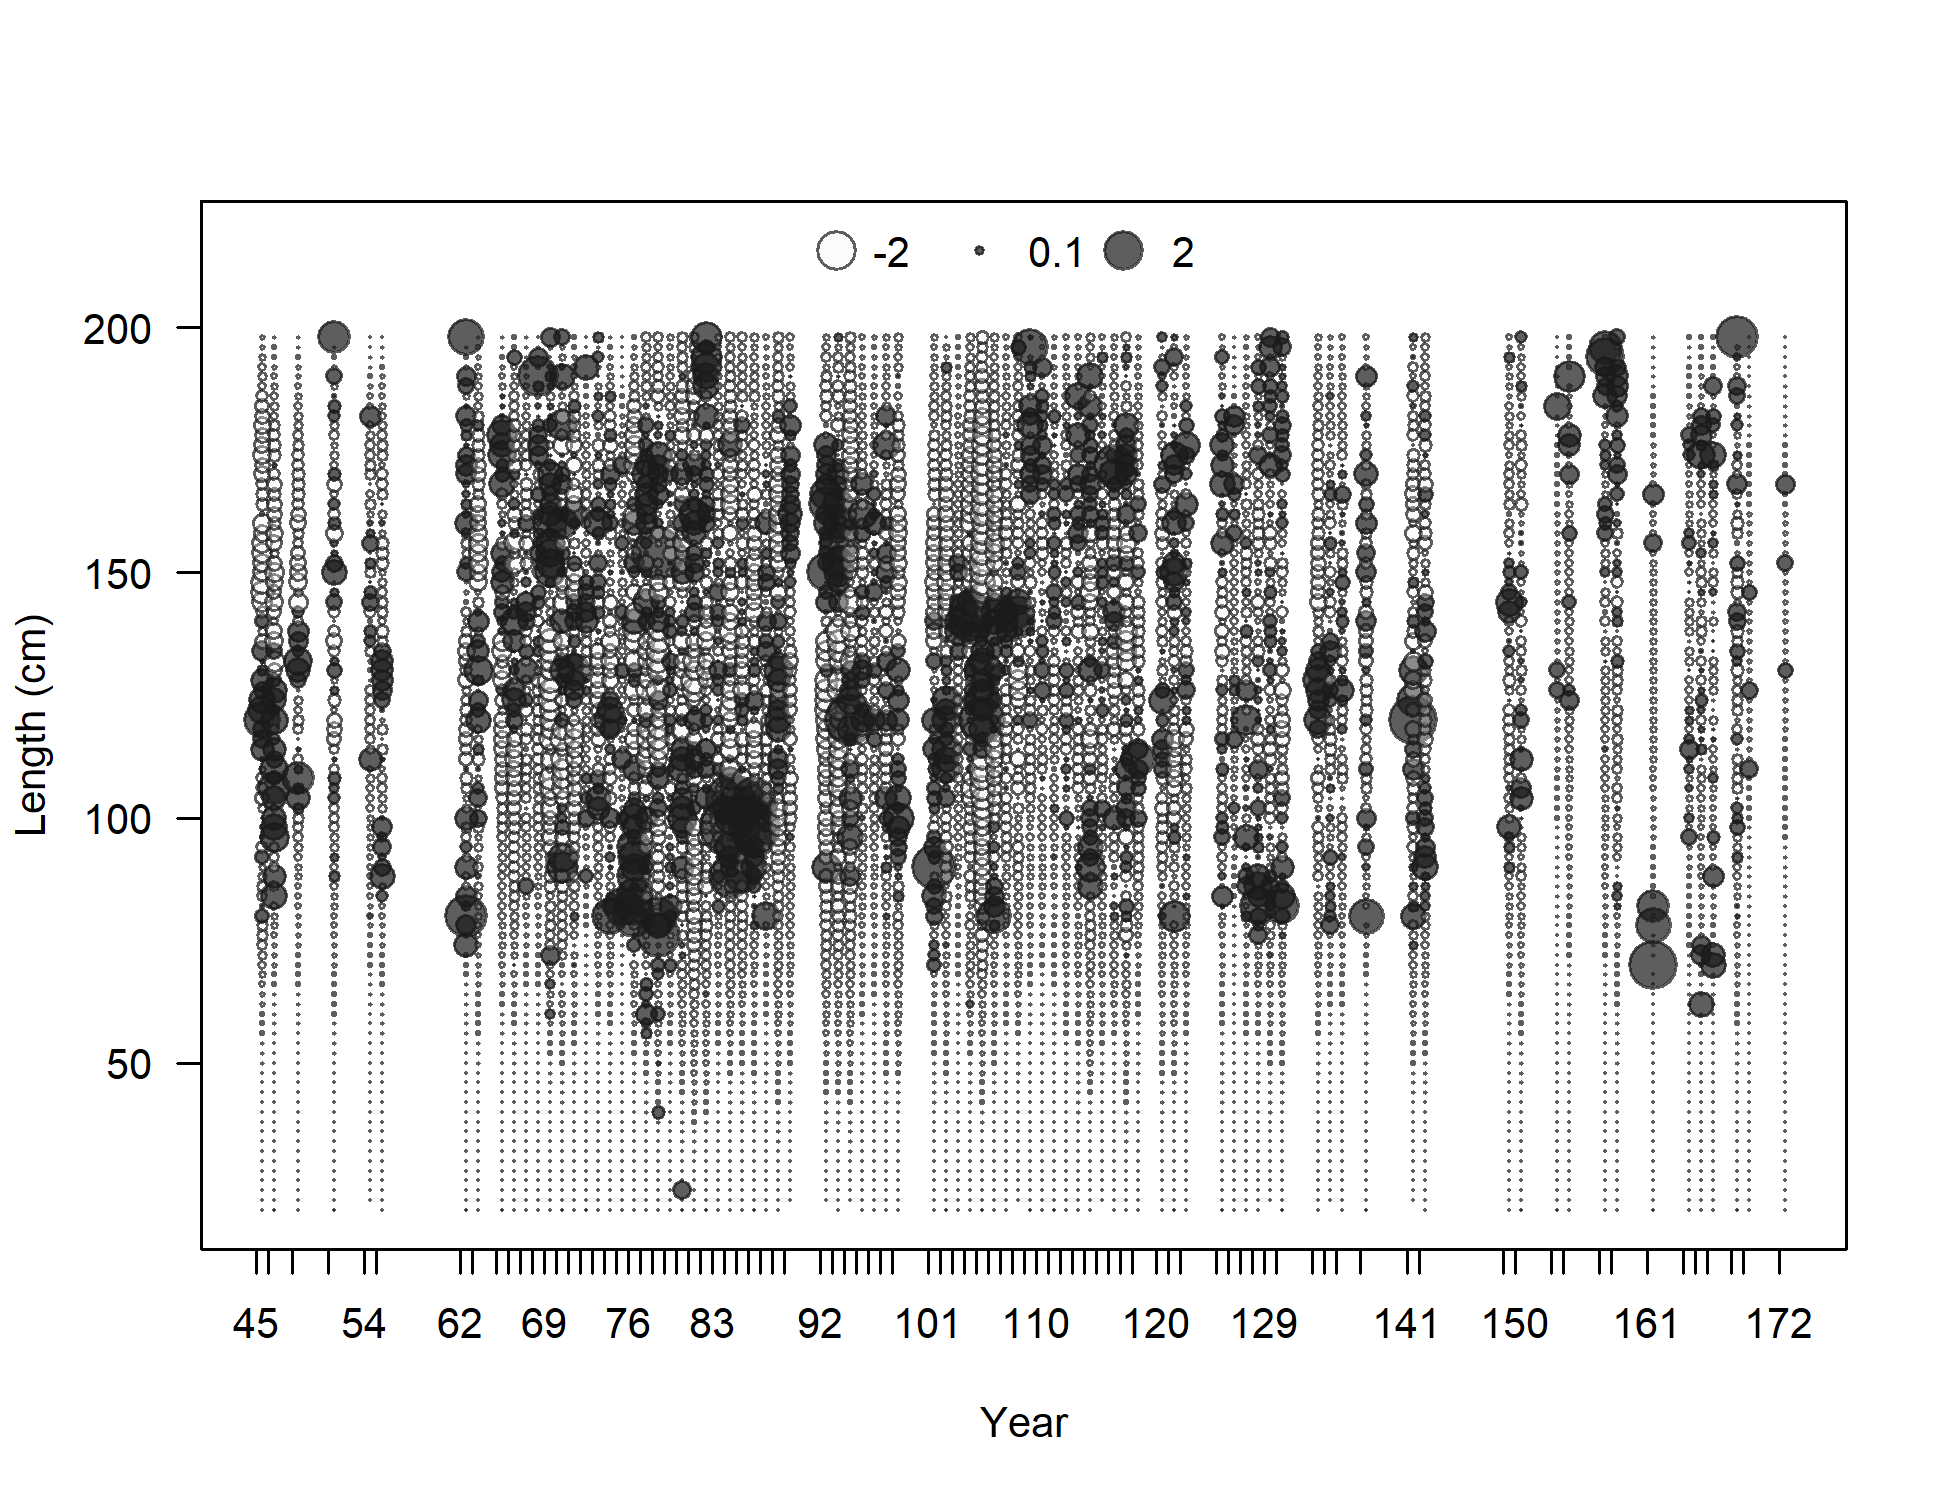
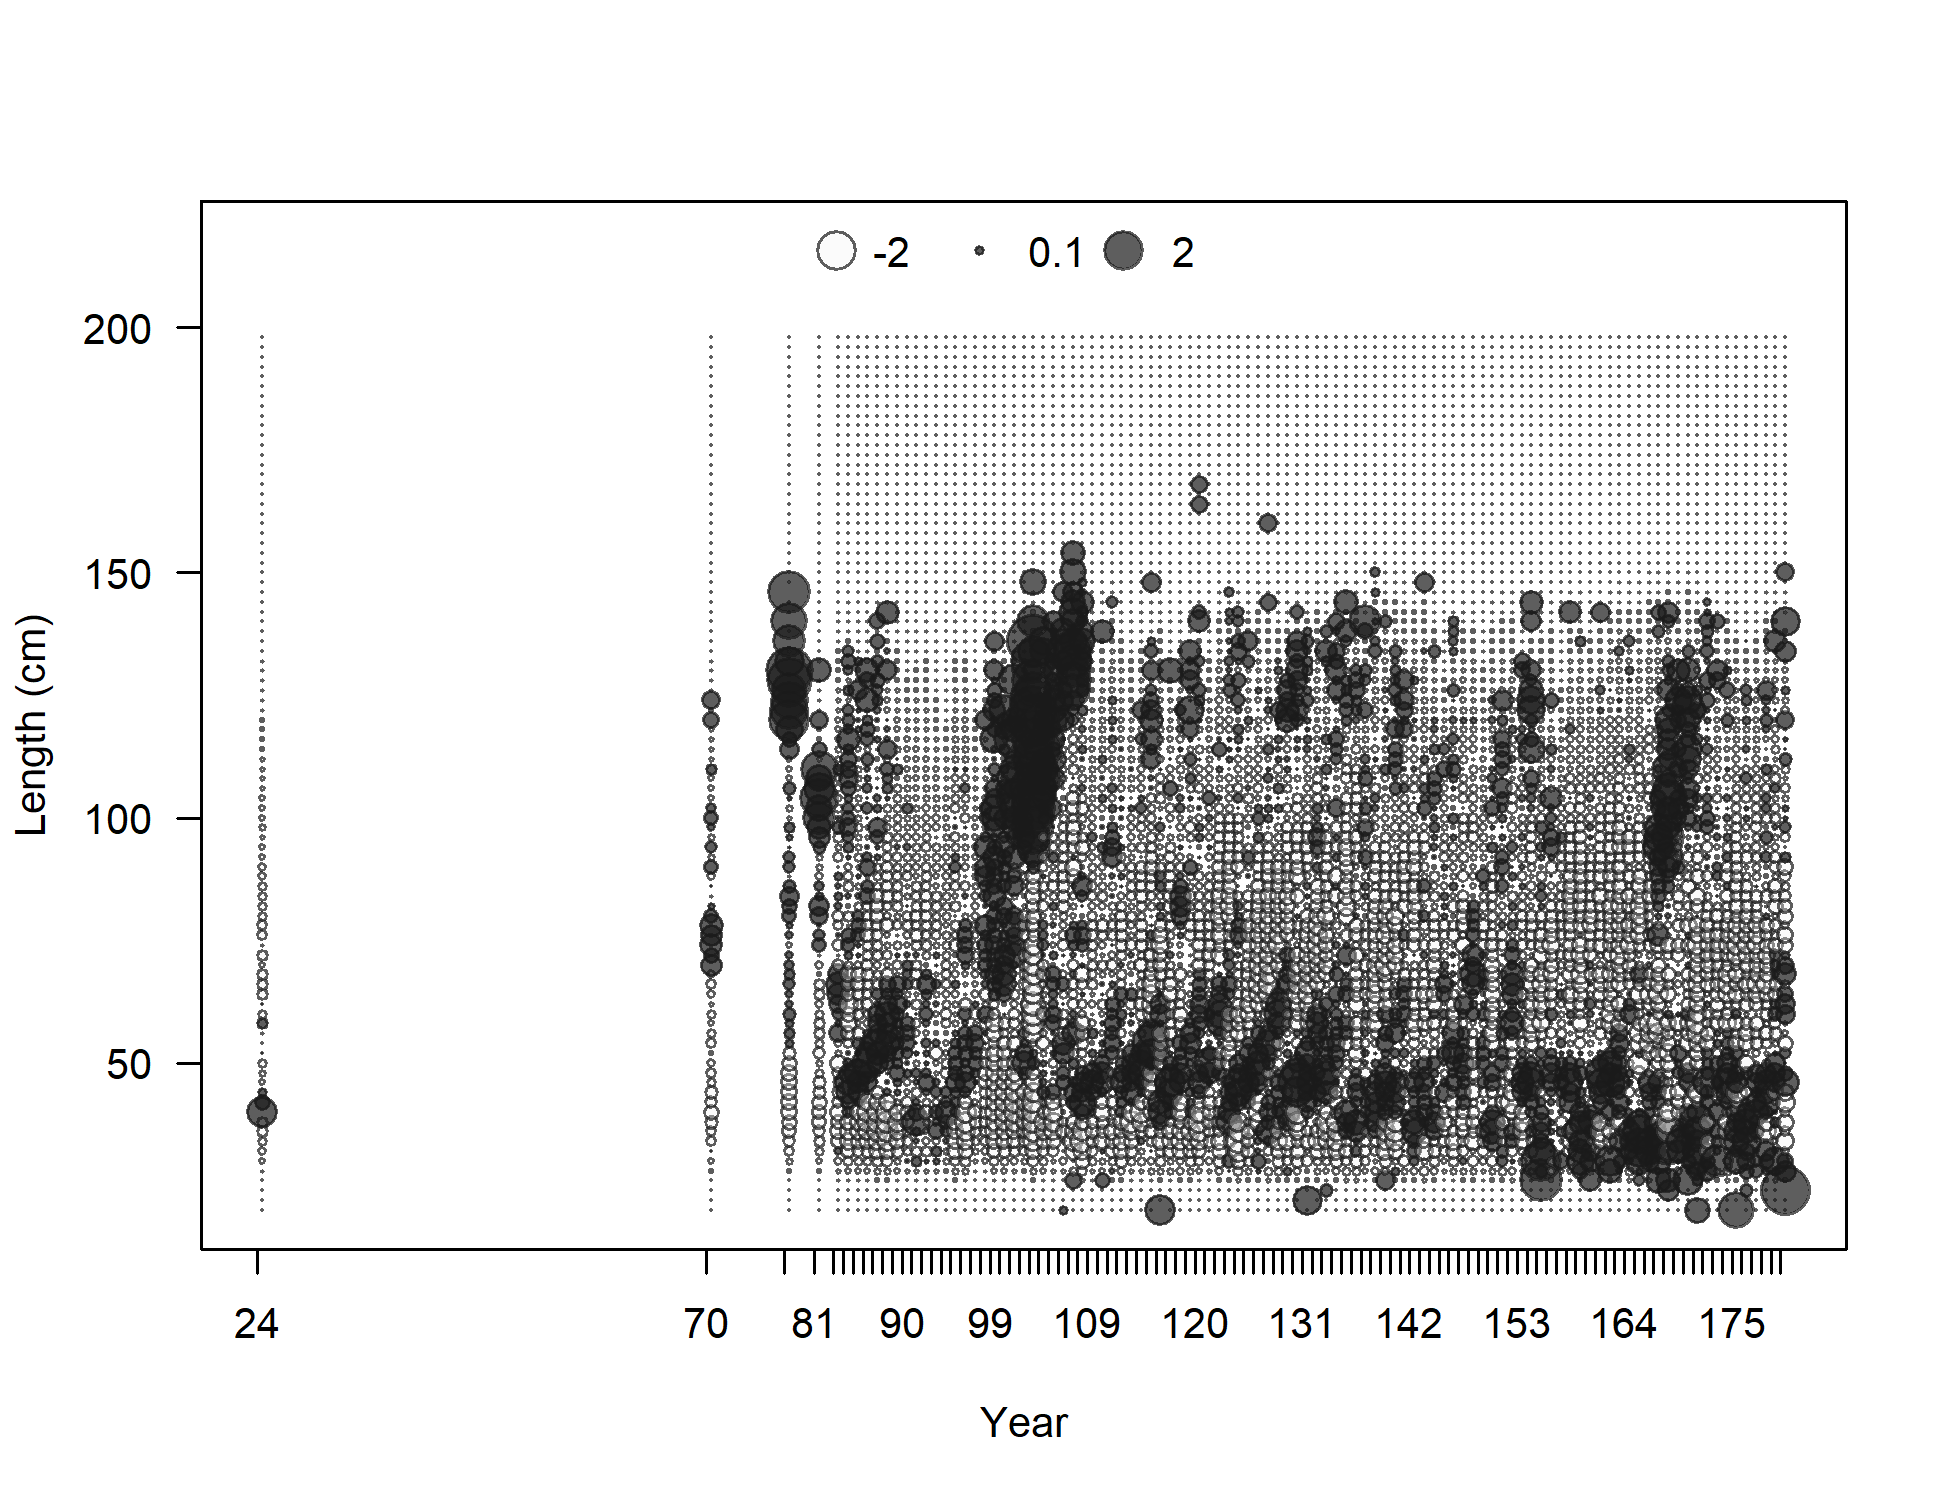
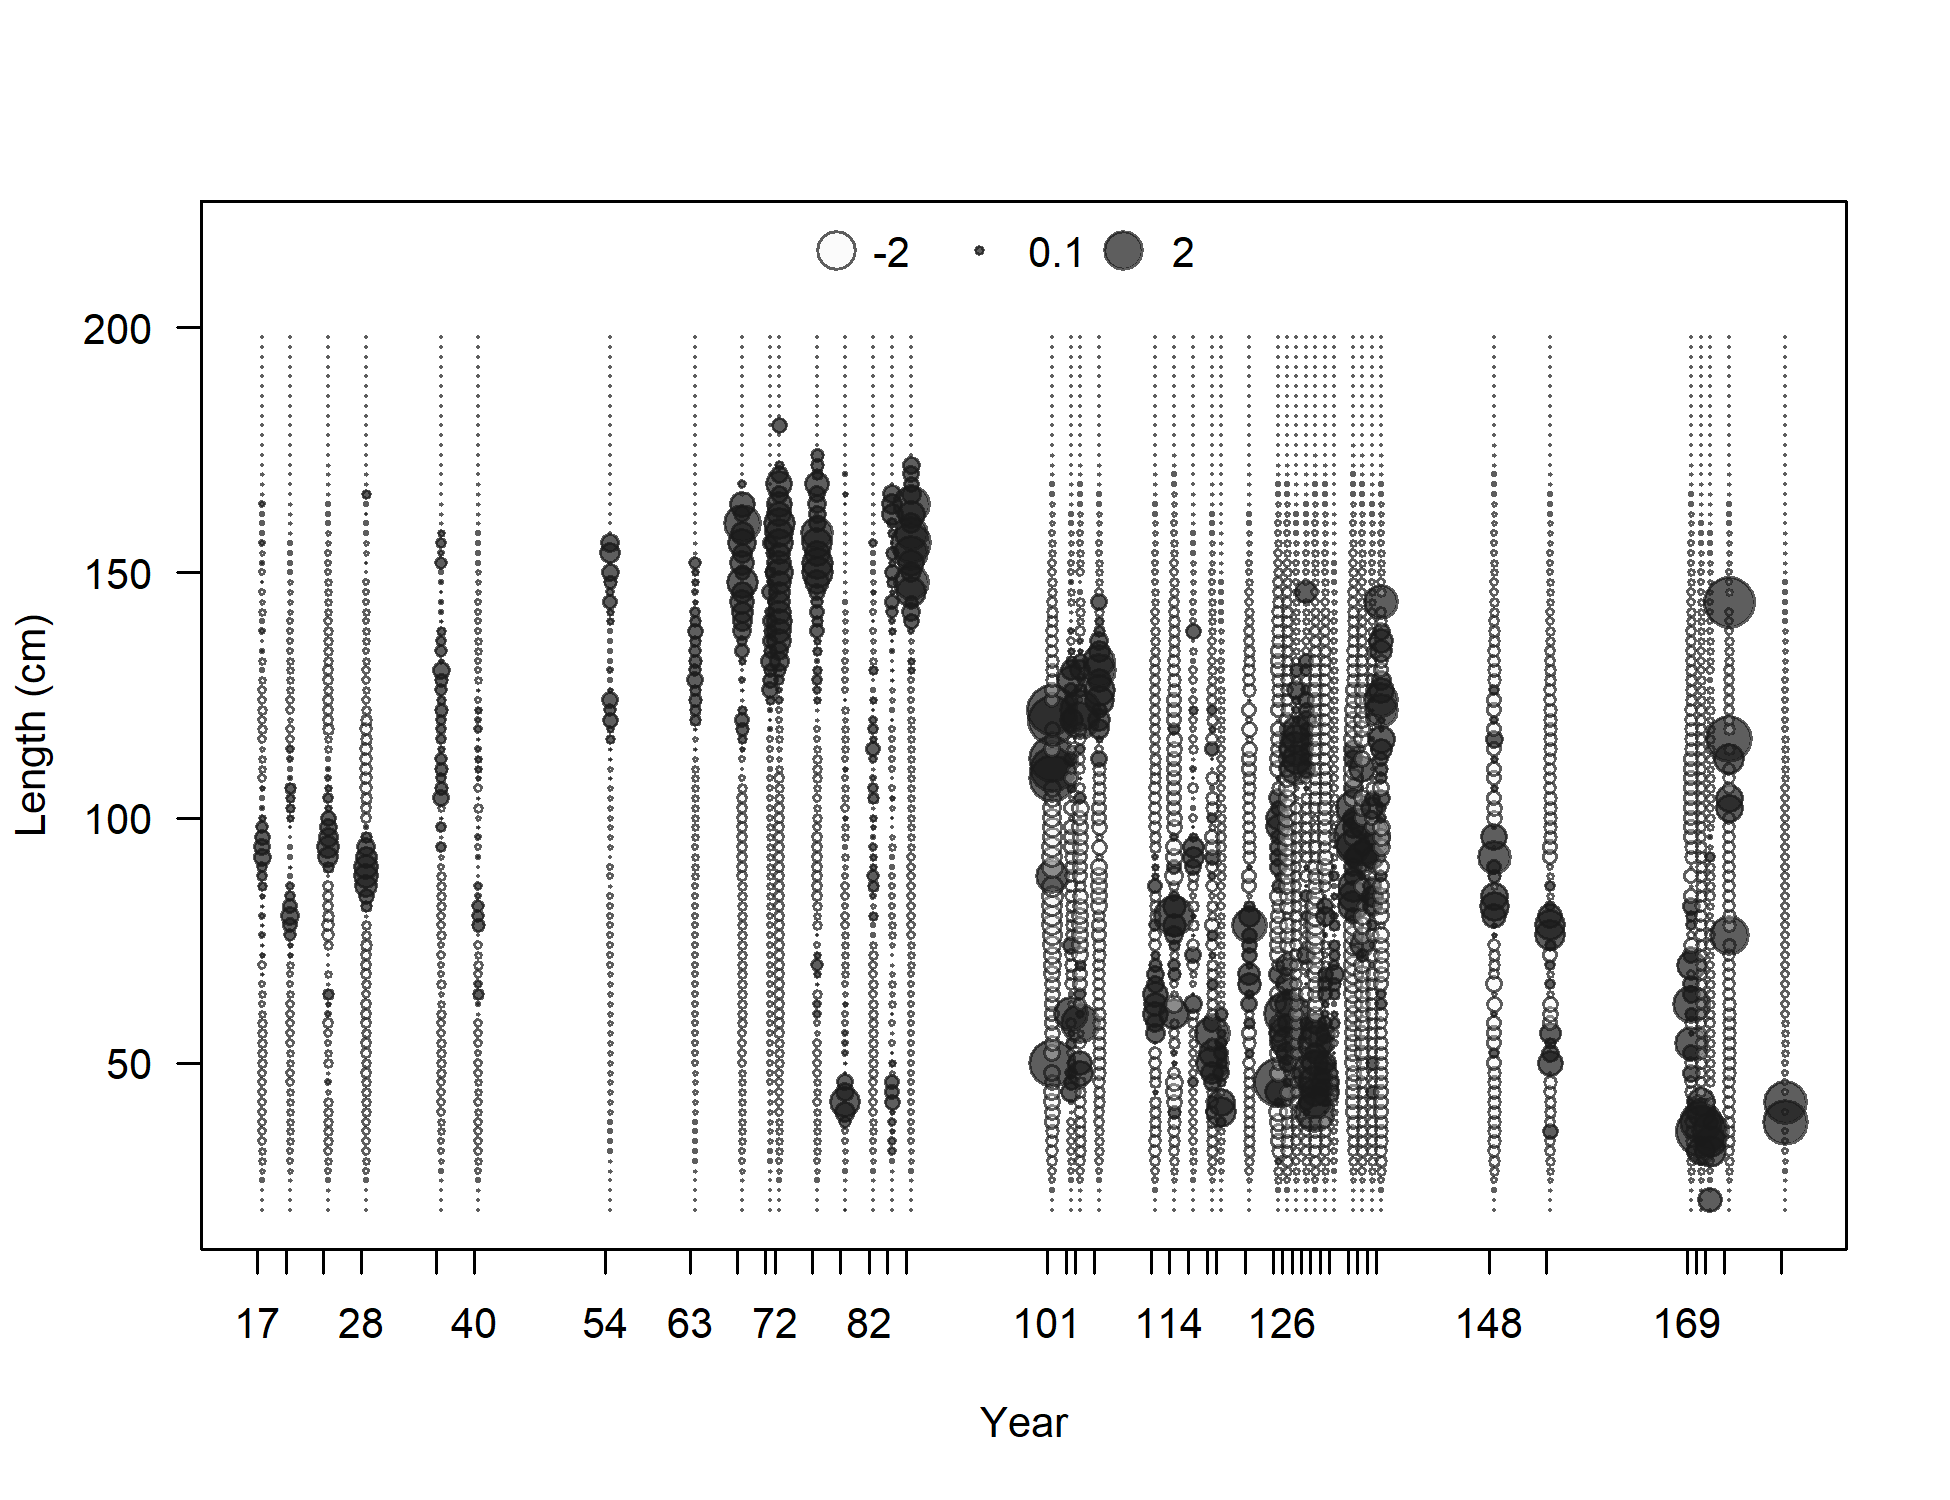
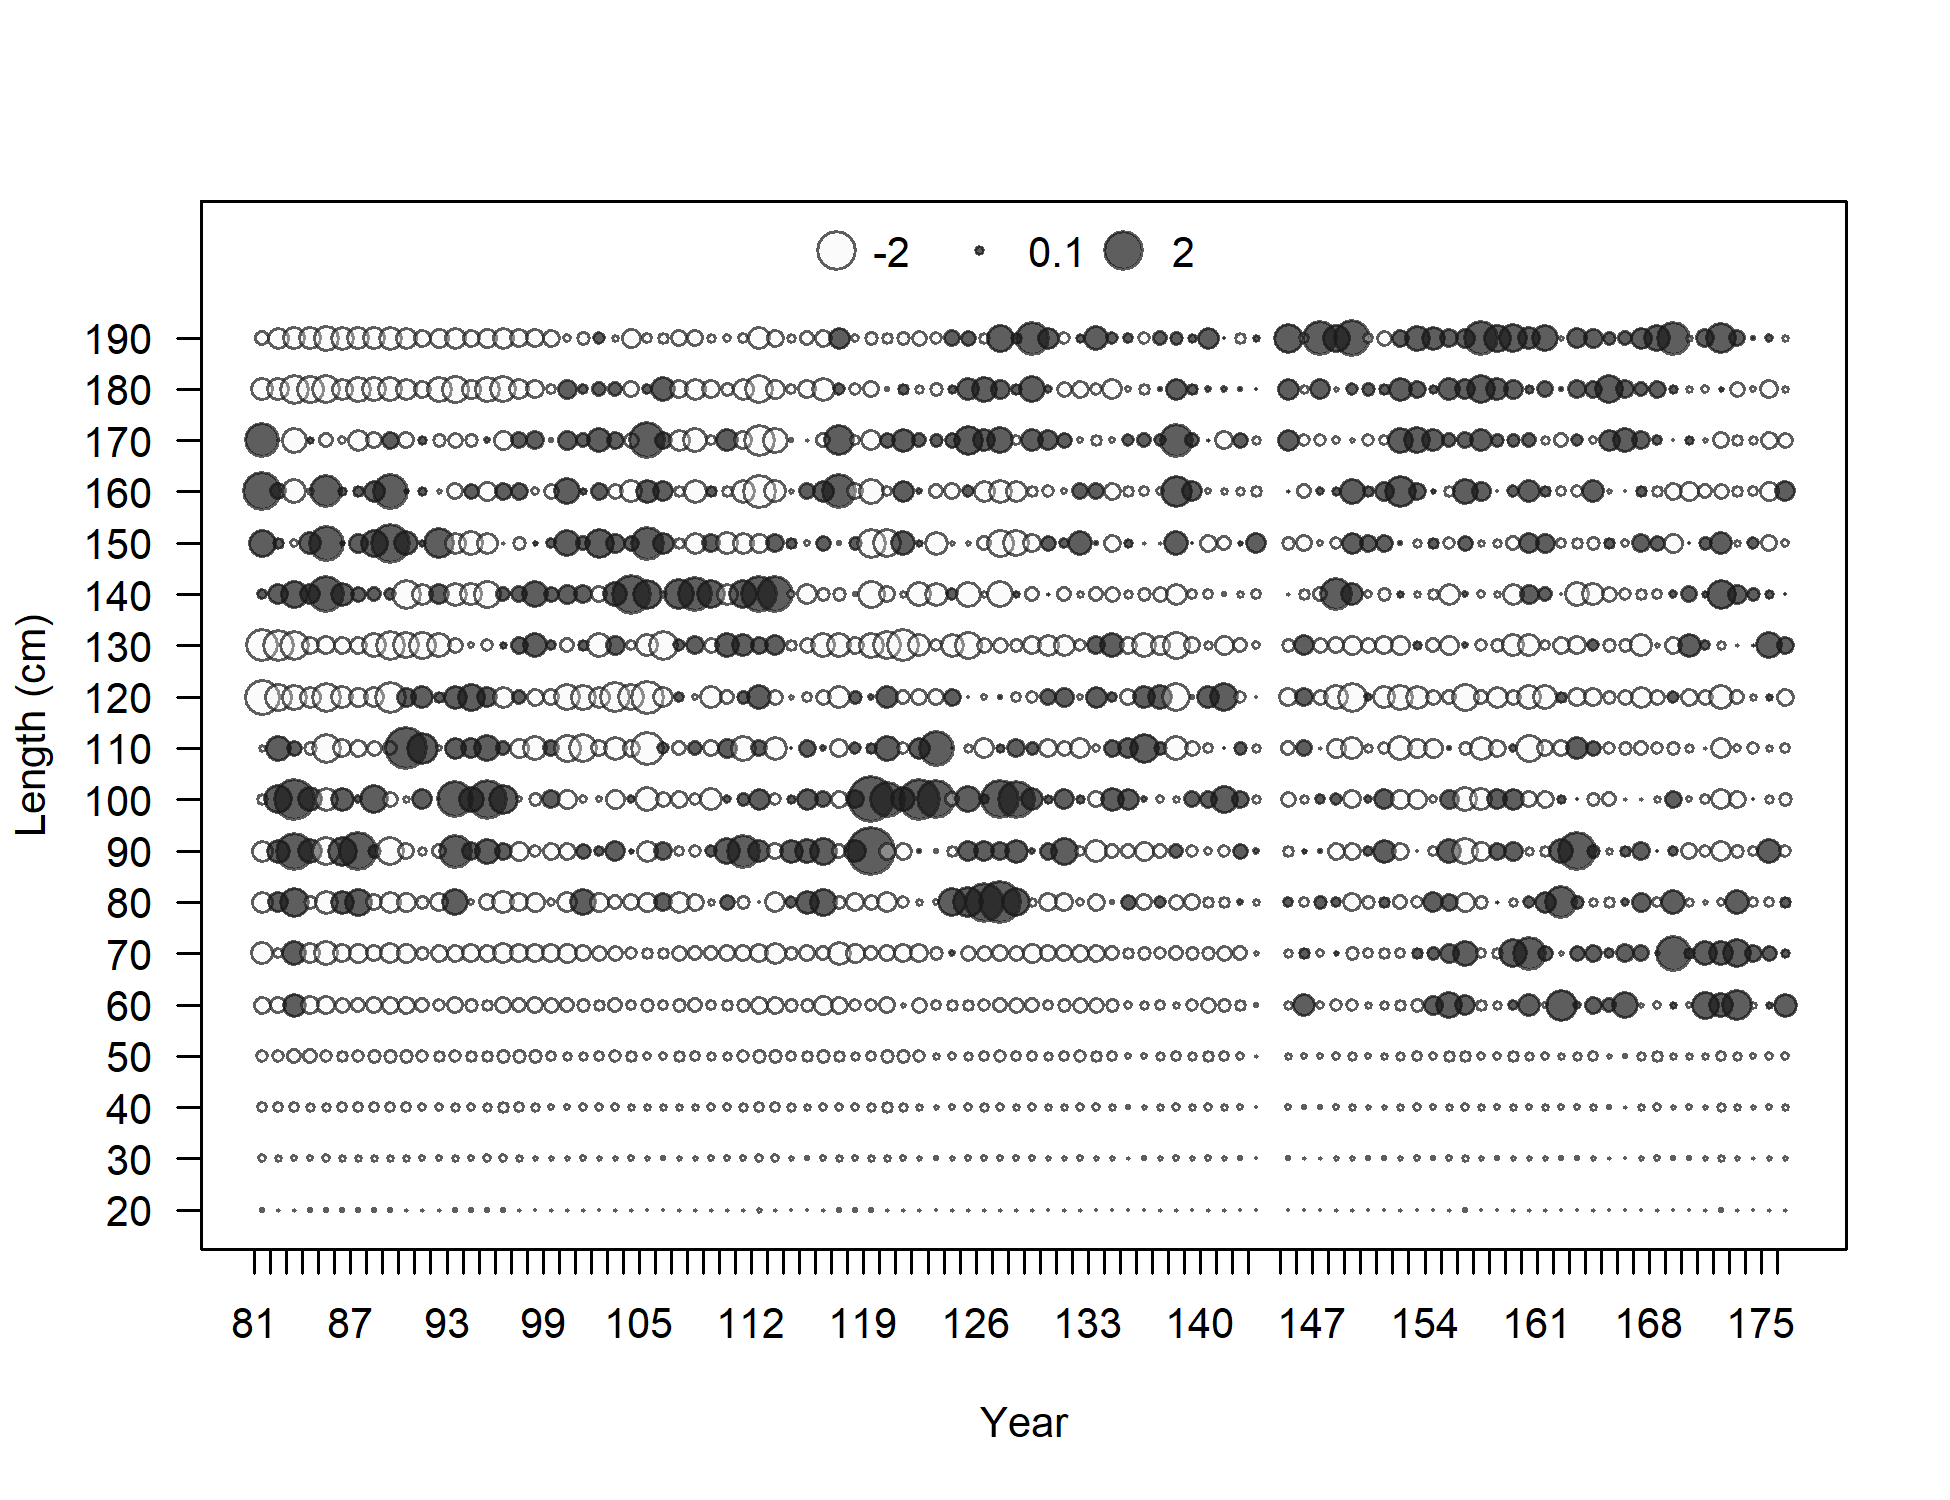
Pearson residuals, whole catch, A1-LL-n (max=4.32) (plot 2 of 2)
Closed bubbles are positive residuals (observed > expected) and open bubbles are negative residuals (observed < expected).
file: comp_lenfit_residsflt1mkt0_page2.png
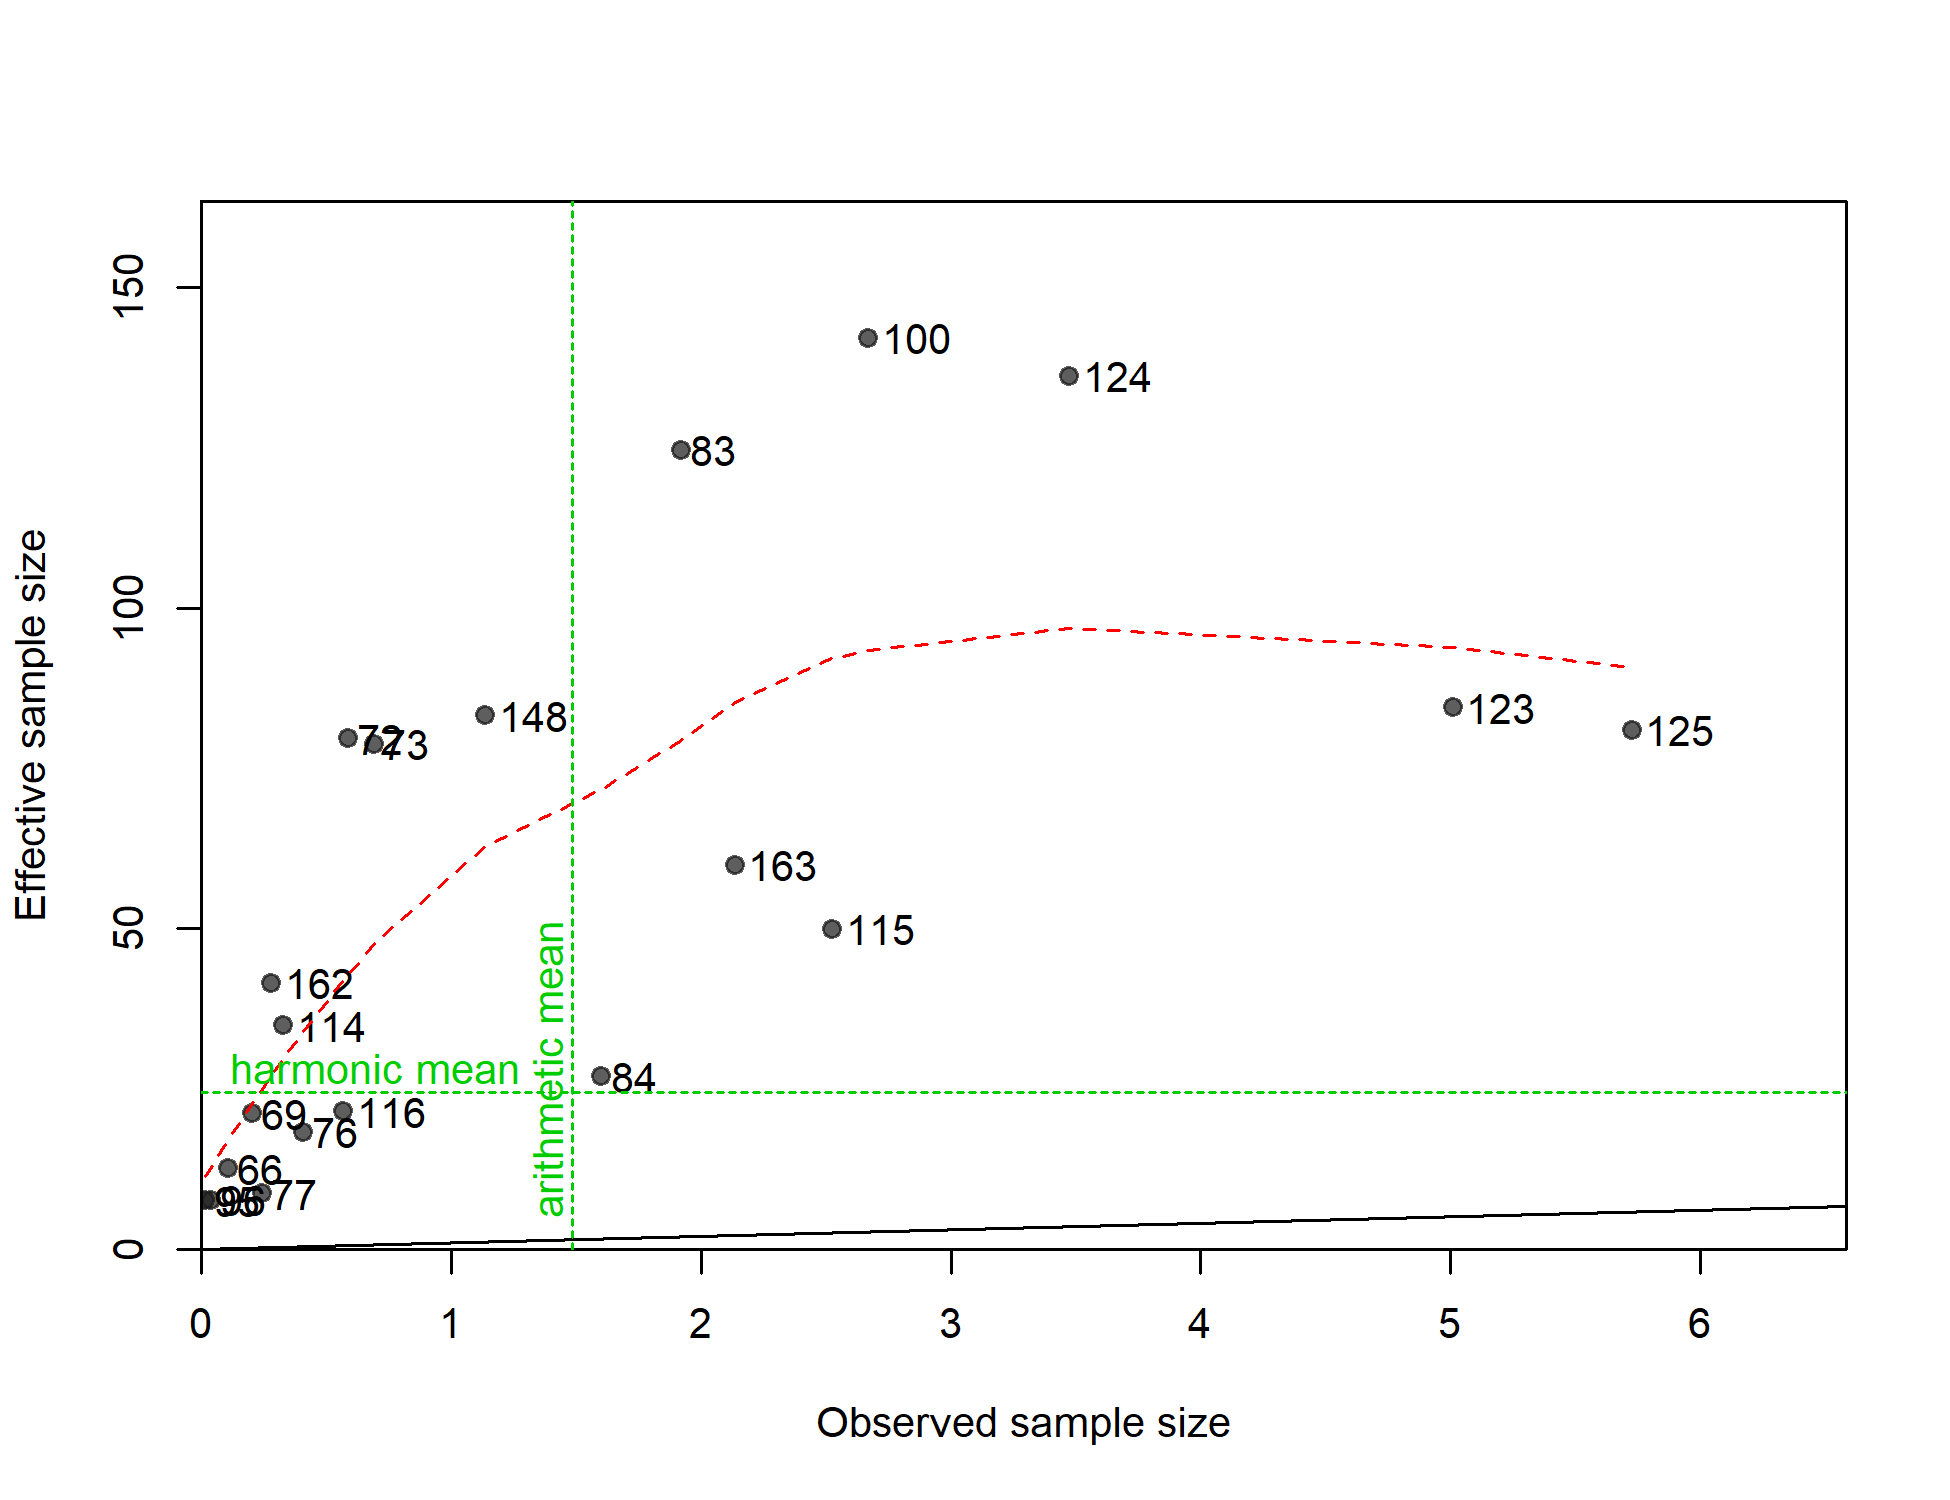
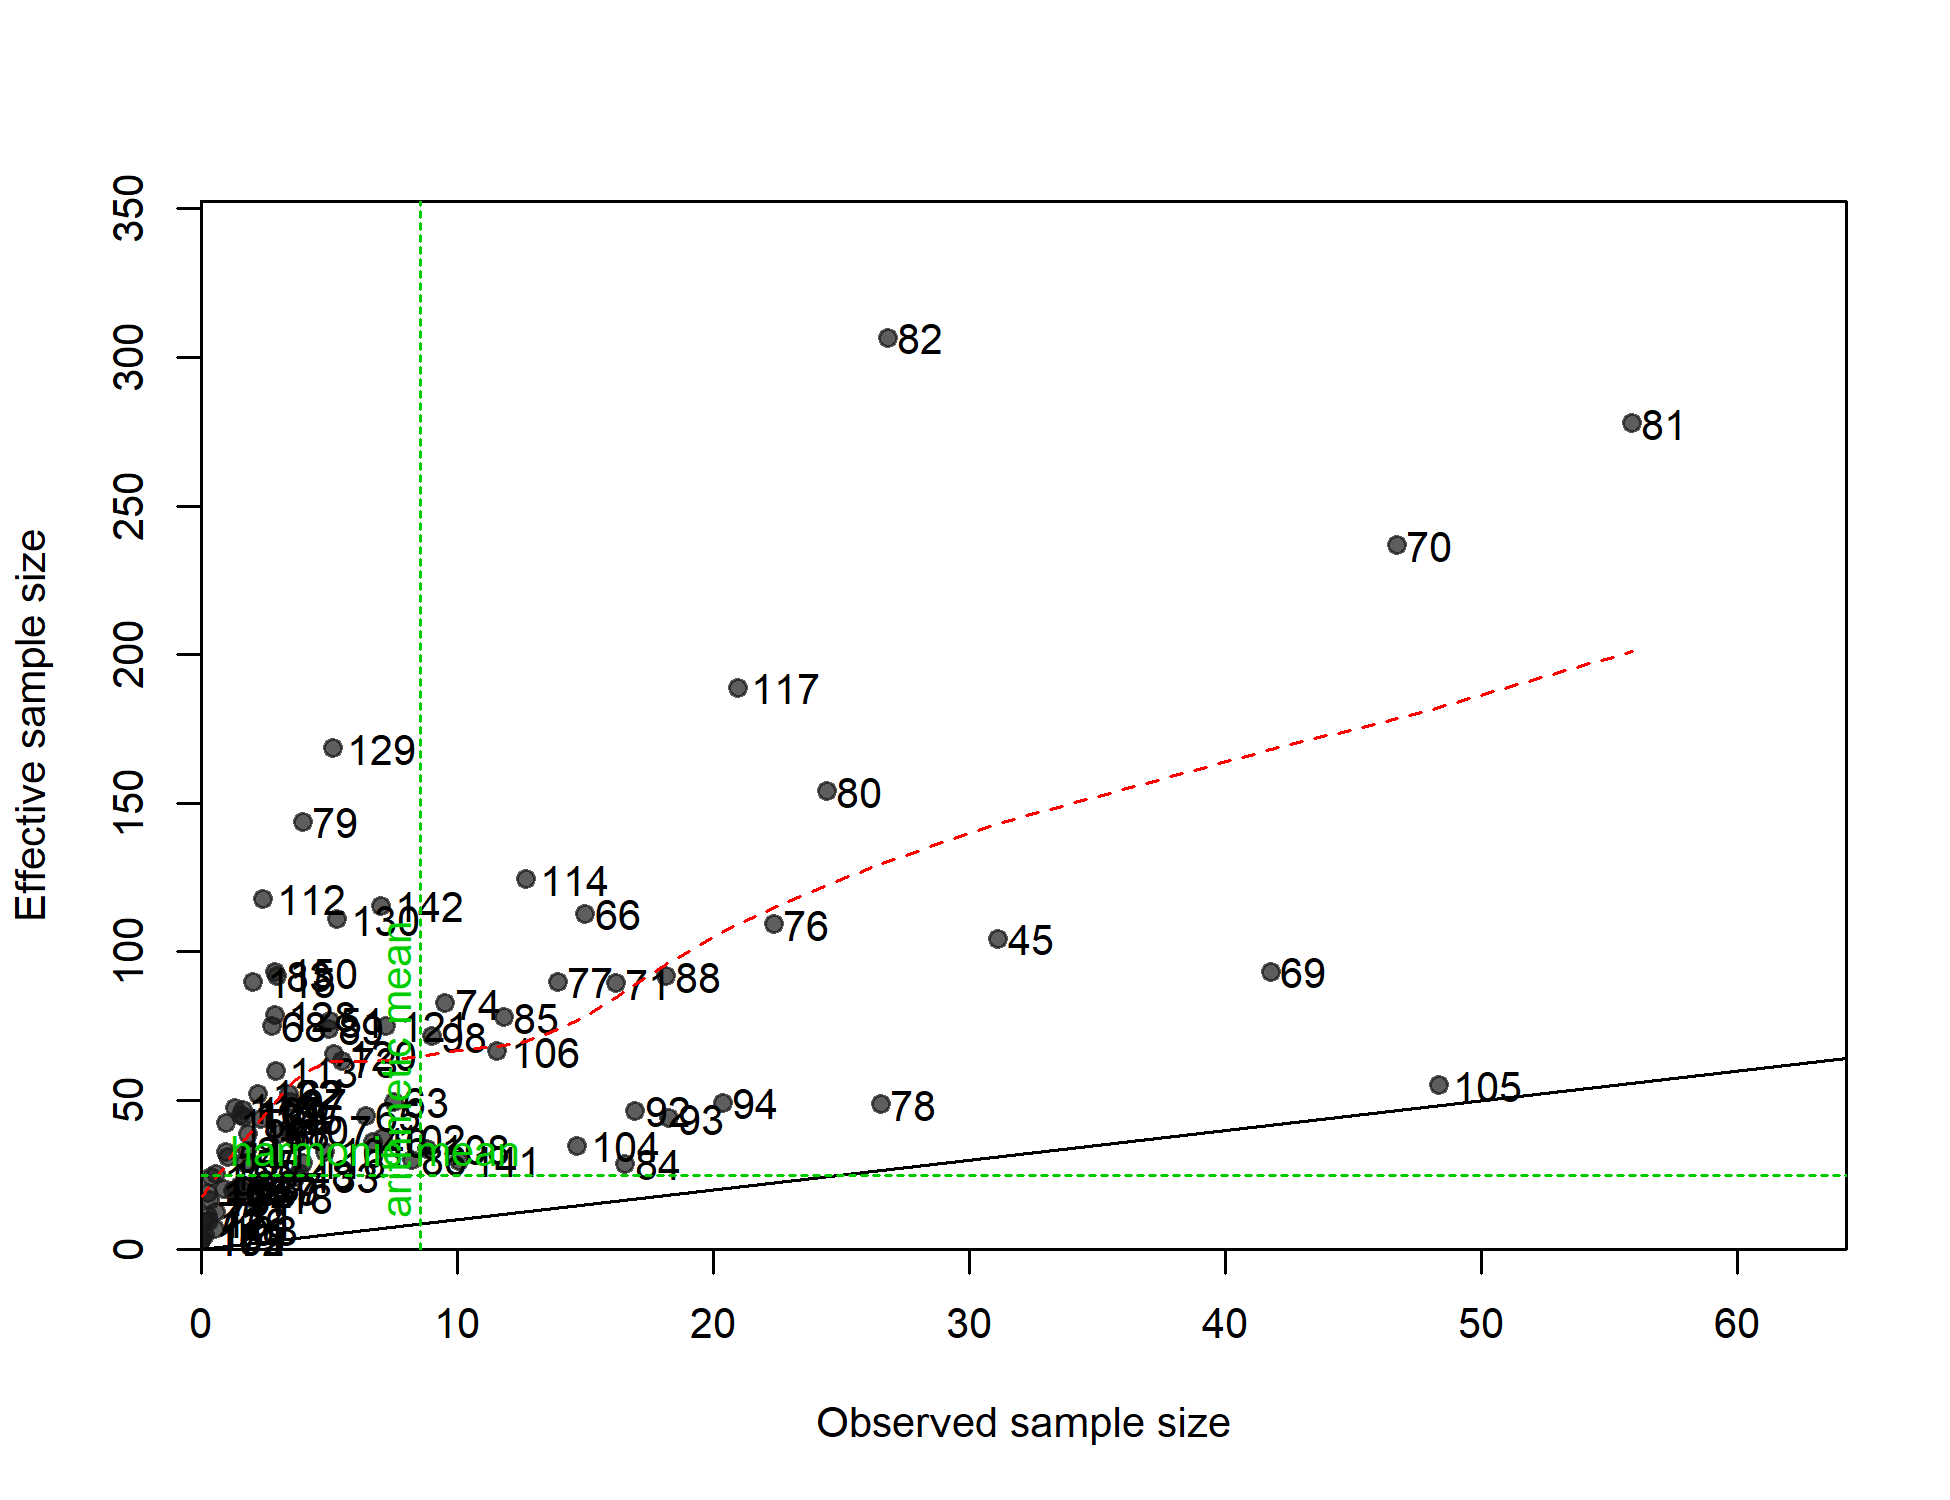
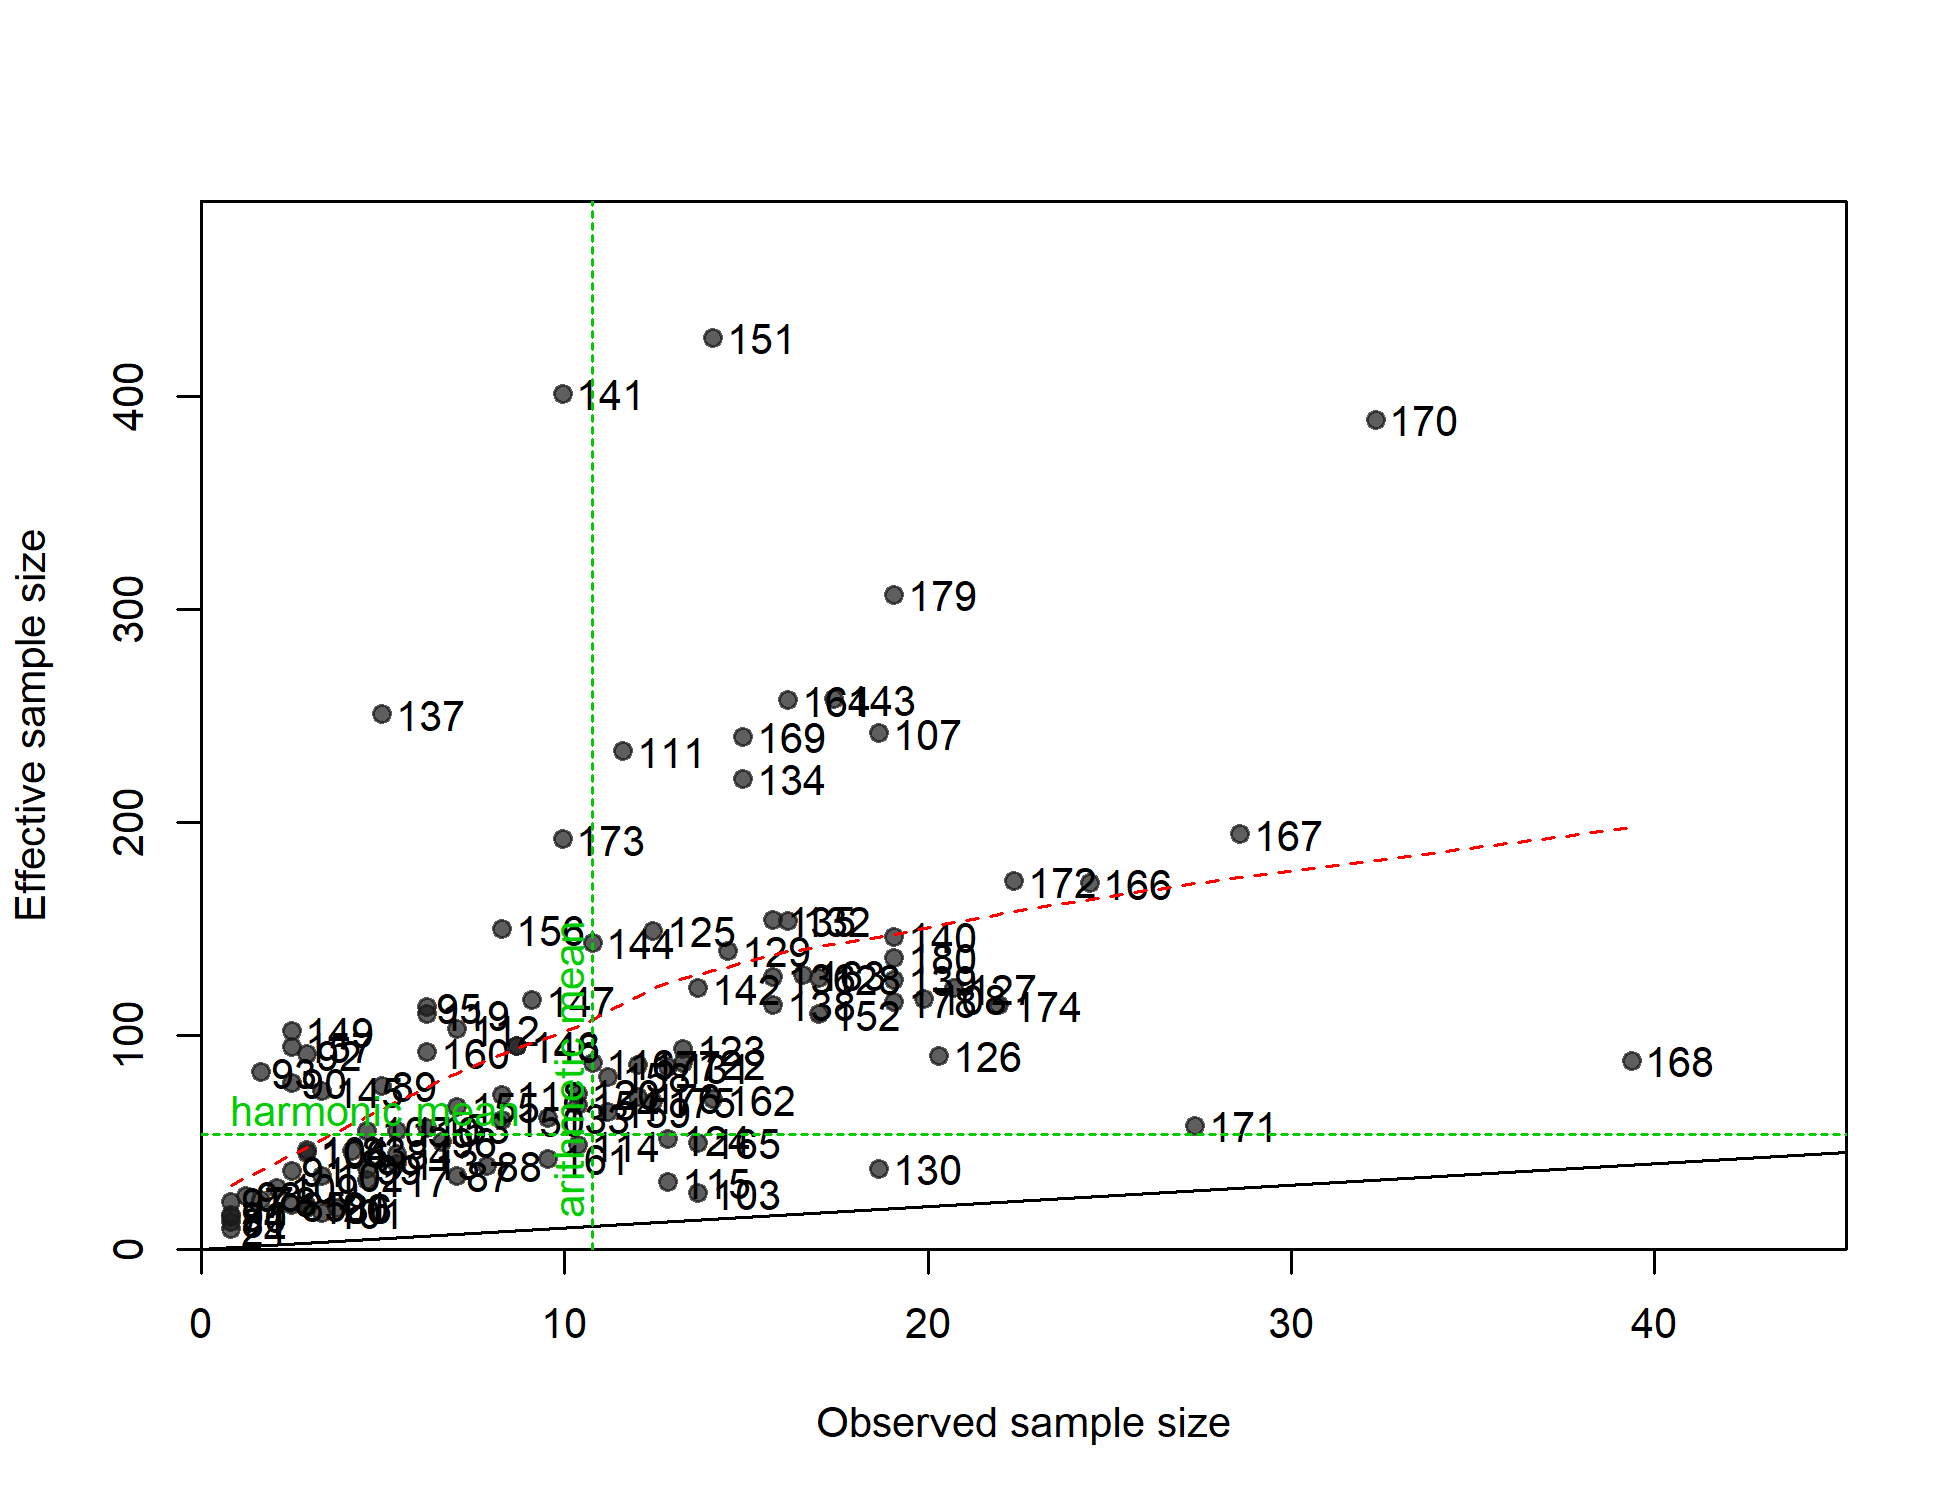
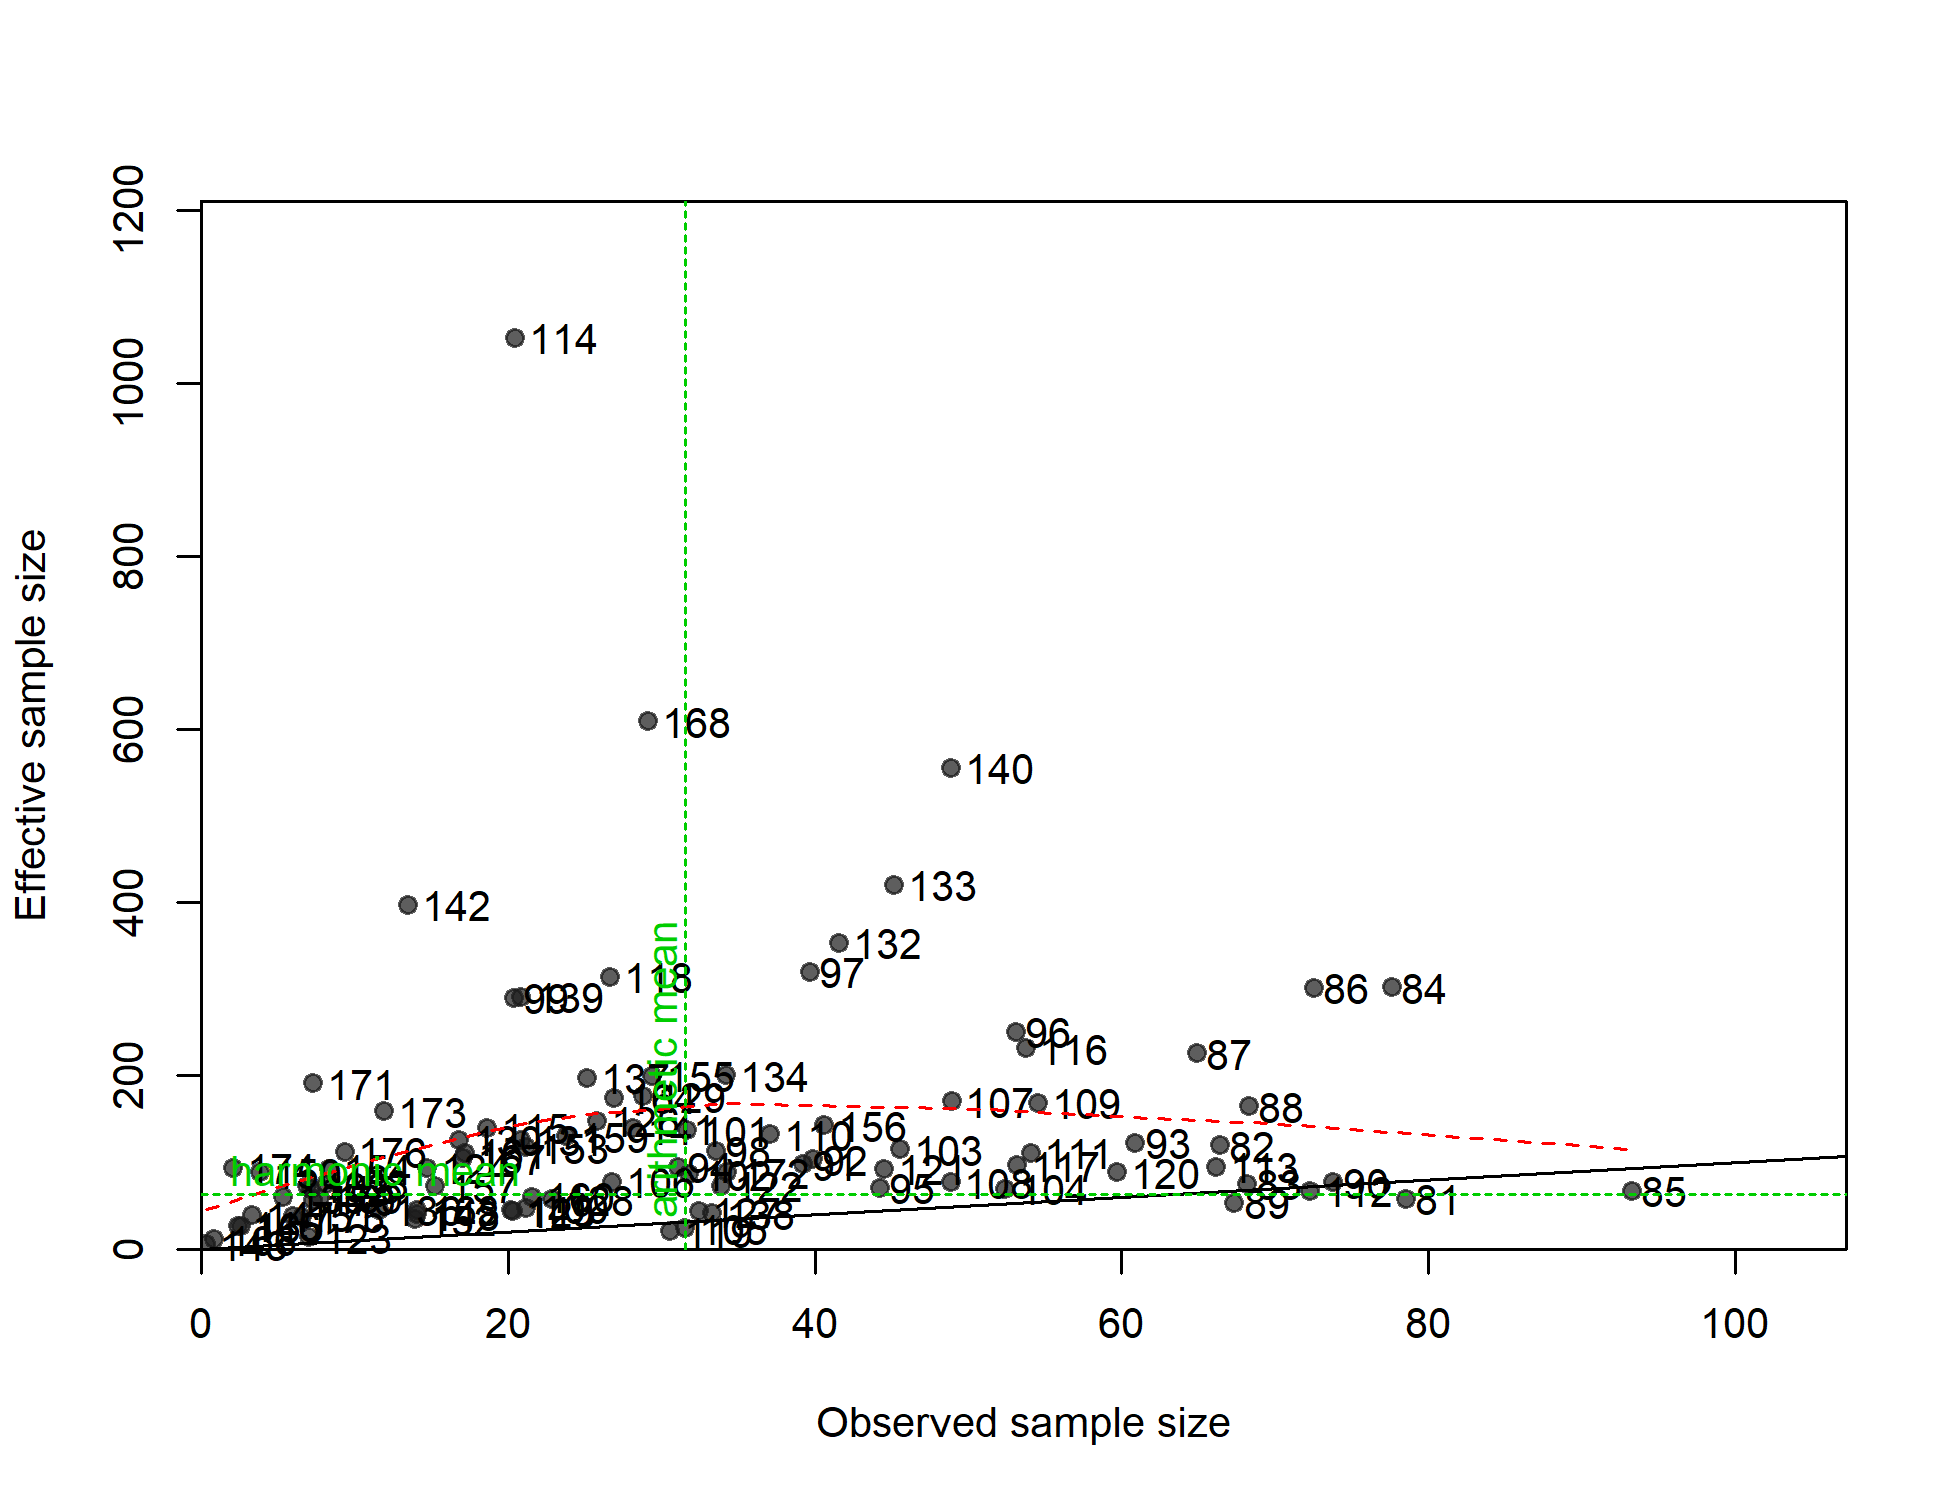
N-EffN comparison, Length comps, whole catch, A1-LL-n
file: comp_lenfit_sampsize_flt1mkt0.png
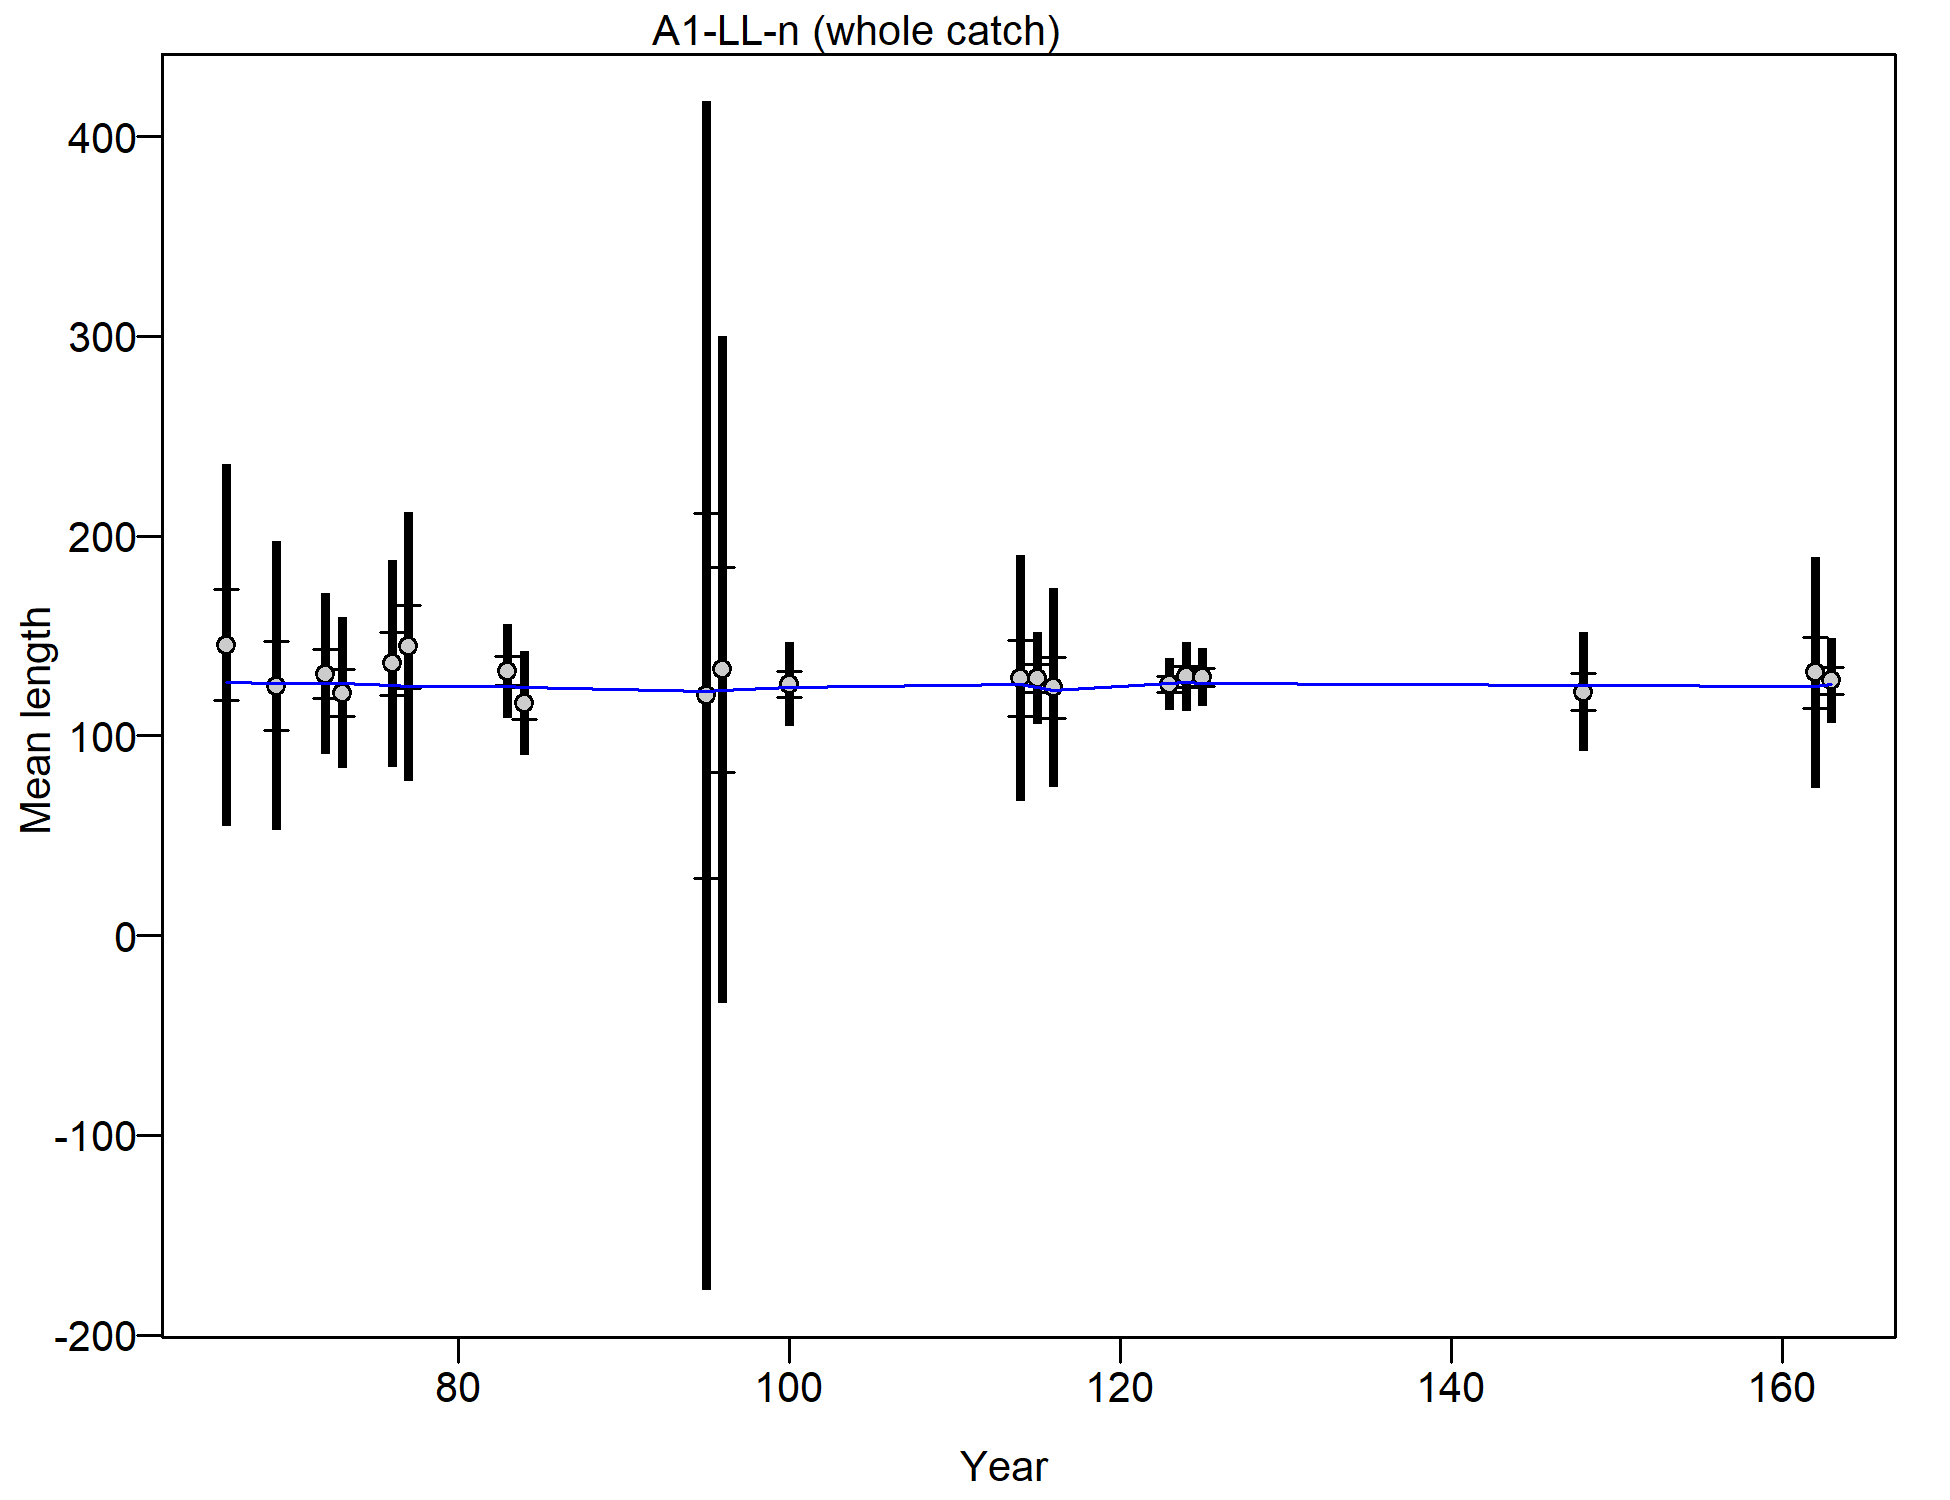
Mean length for A1-LL-n with 95% confidence intervals based on current samples sizes.
Francis data weighting method TA1.8: thinner intervals (with capped ends) show result of further adjusting sample sizes based on suggested multiplier (with 95% interval) for len data from A1-LL-n:
10.6291 (6.5878-27.1363)
For more info, see
Francis, R.I.C.C. (2011). Data weighting in statistical fisheries stock assessment models. Can. J. Fish. Aquat. Sci. 68: 1124-1138. https://doi.org/10.1139/f2011-025
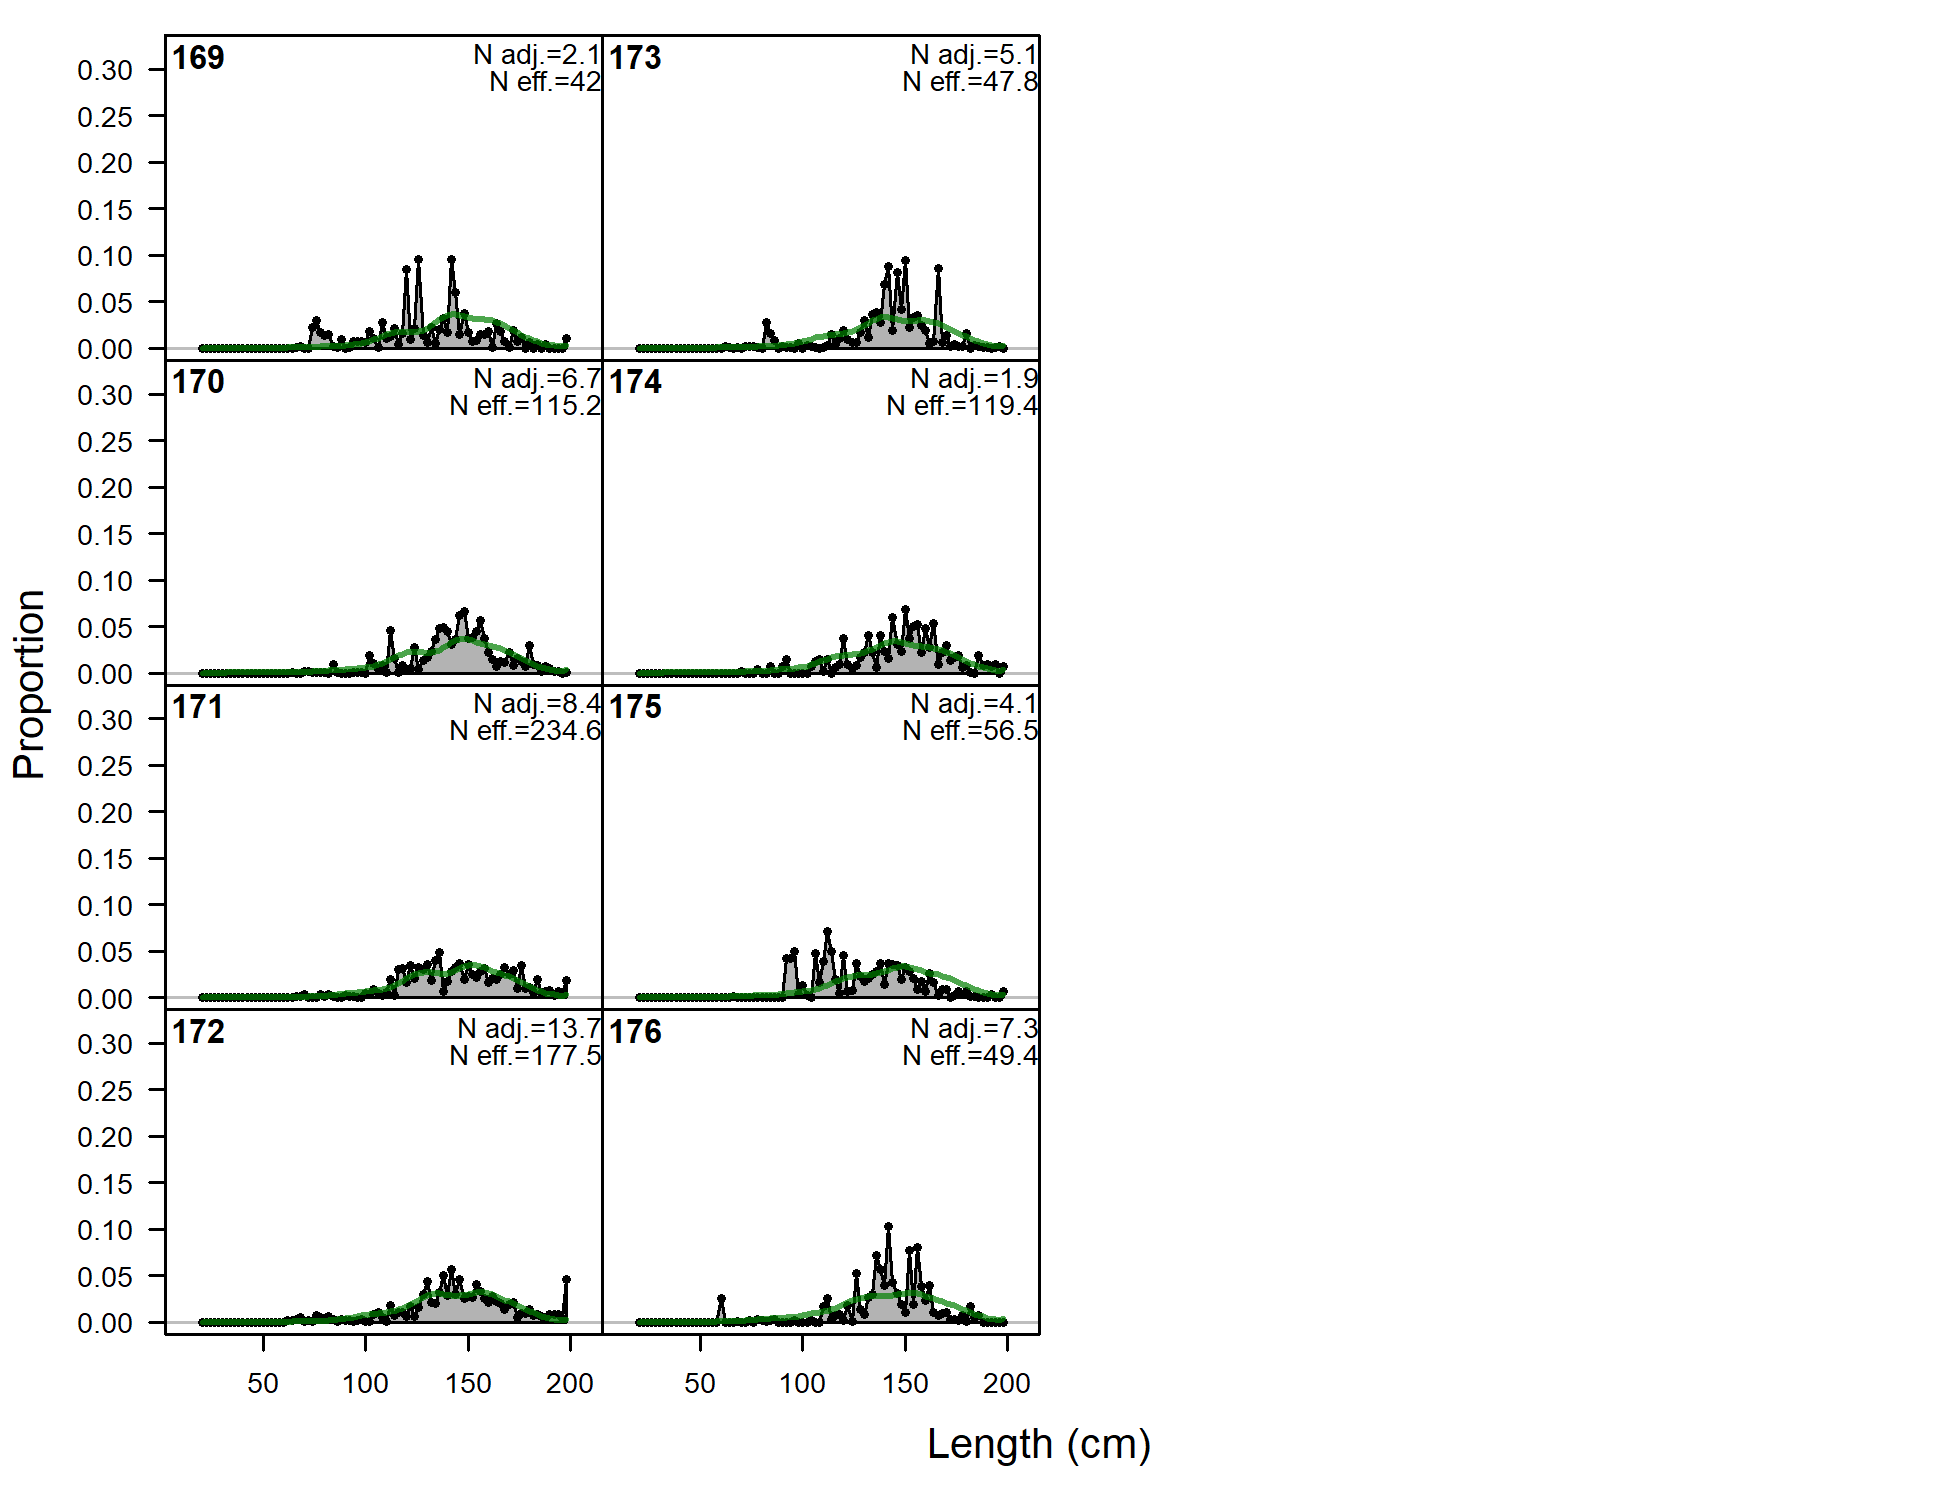
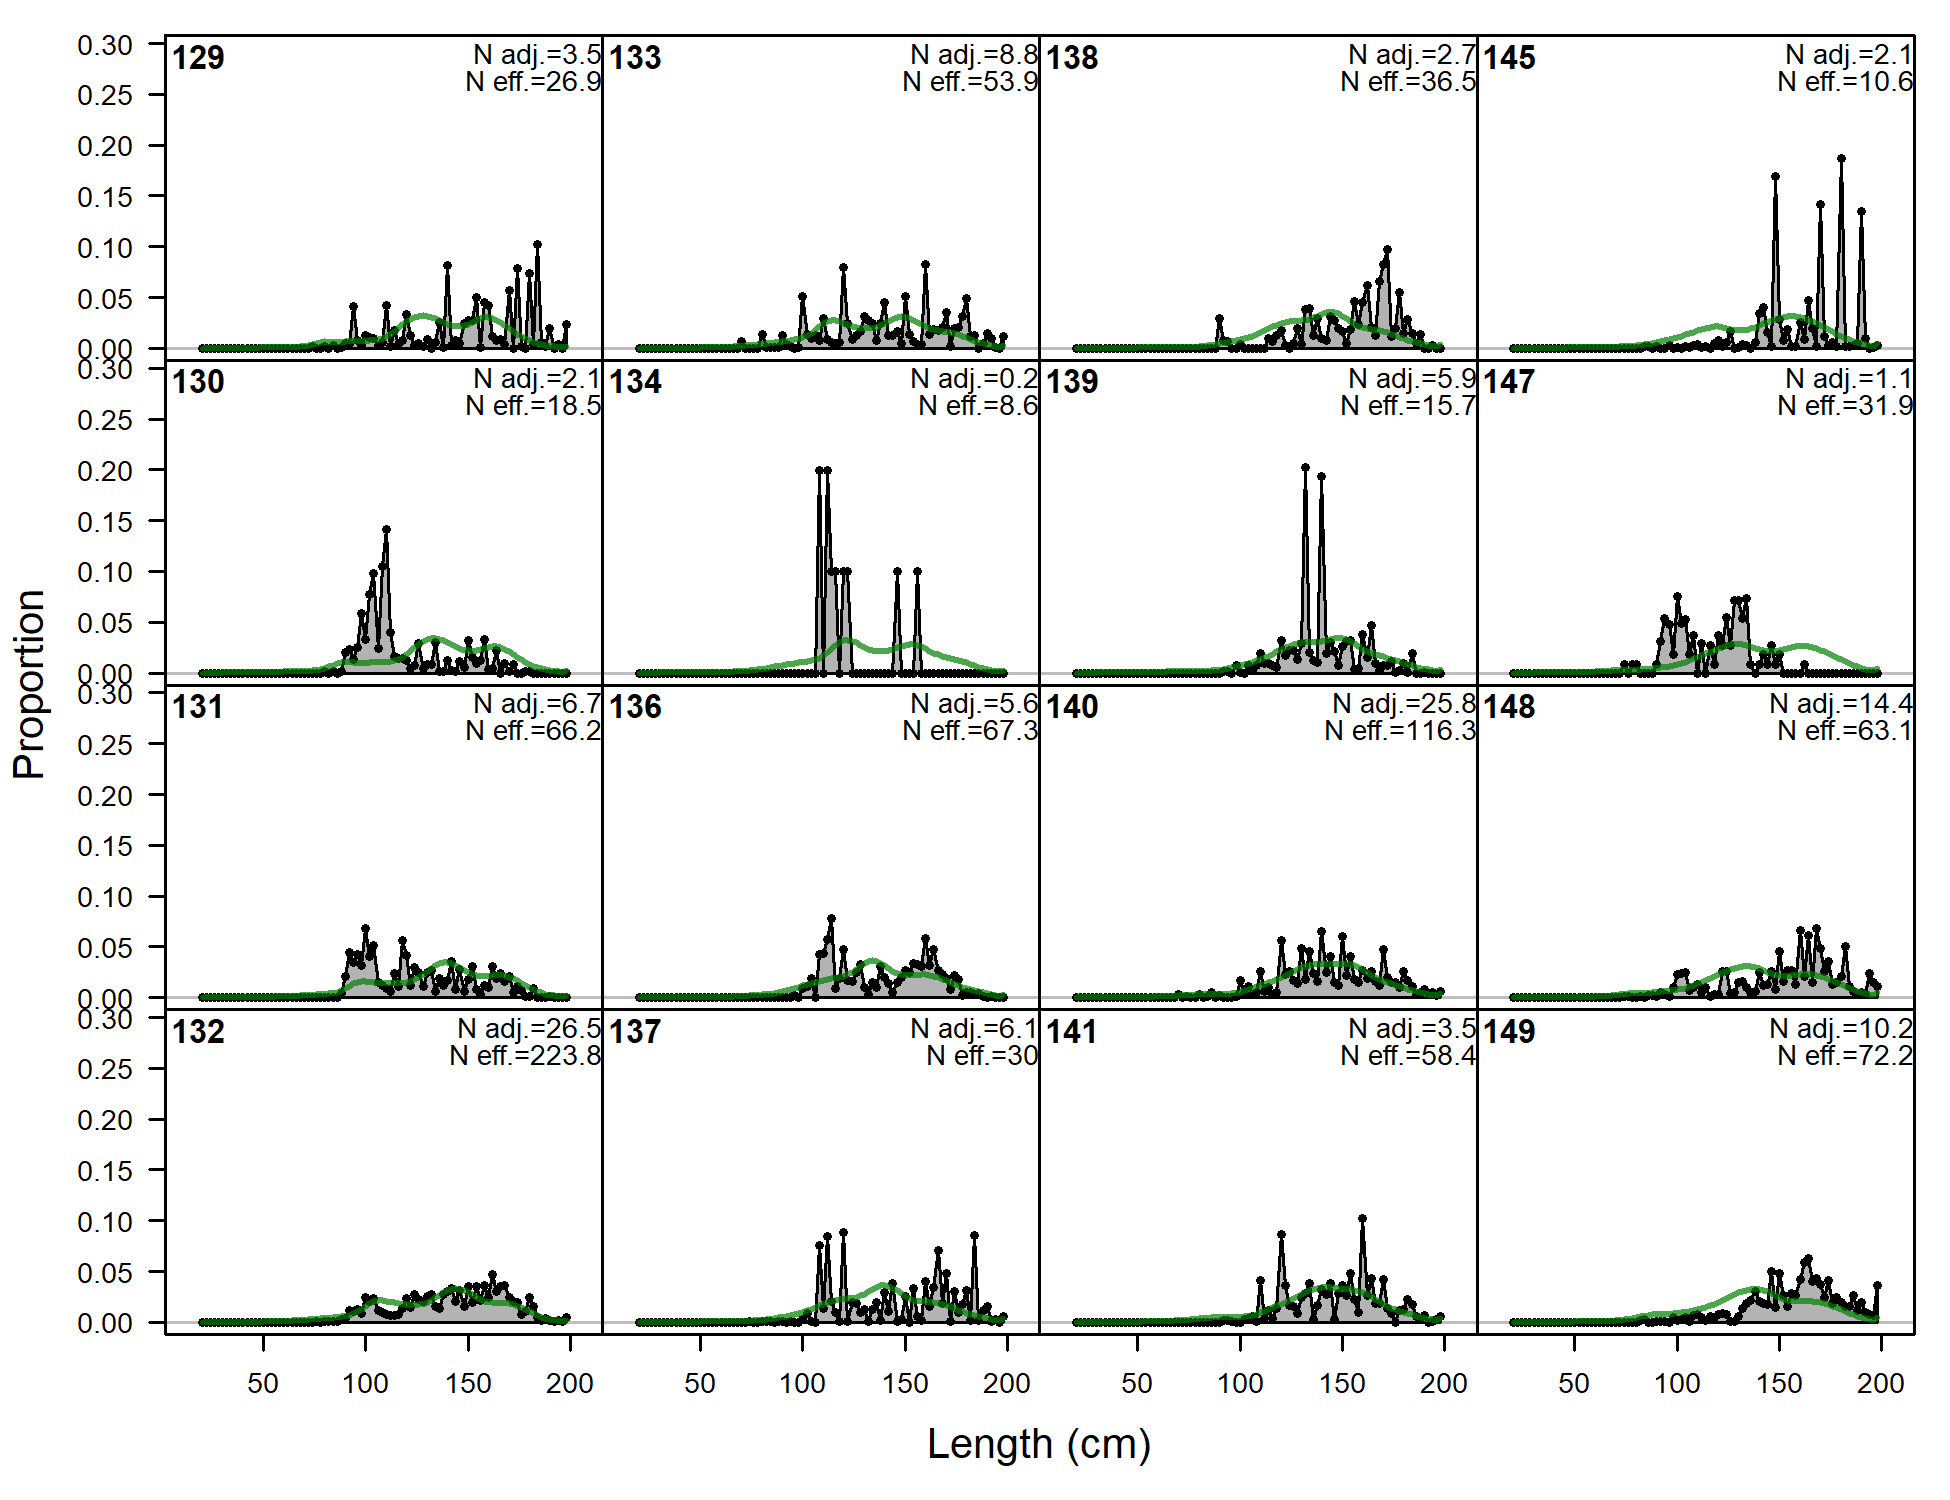
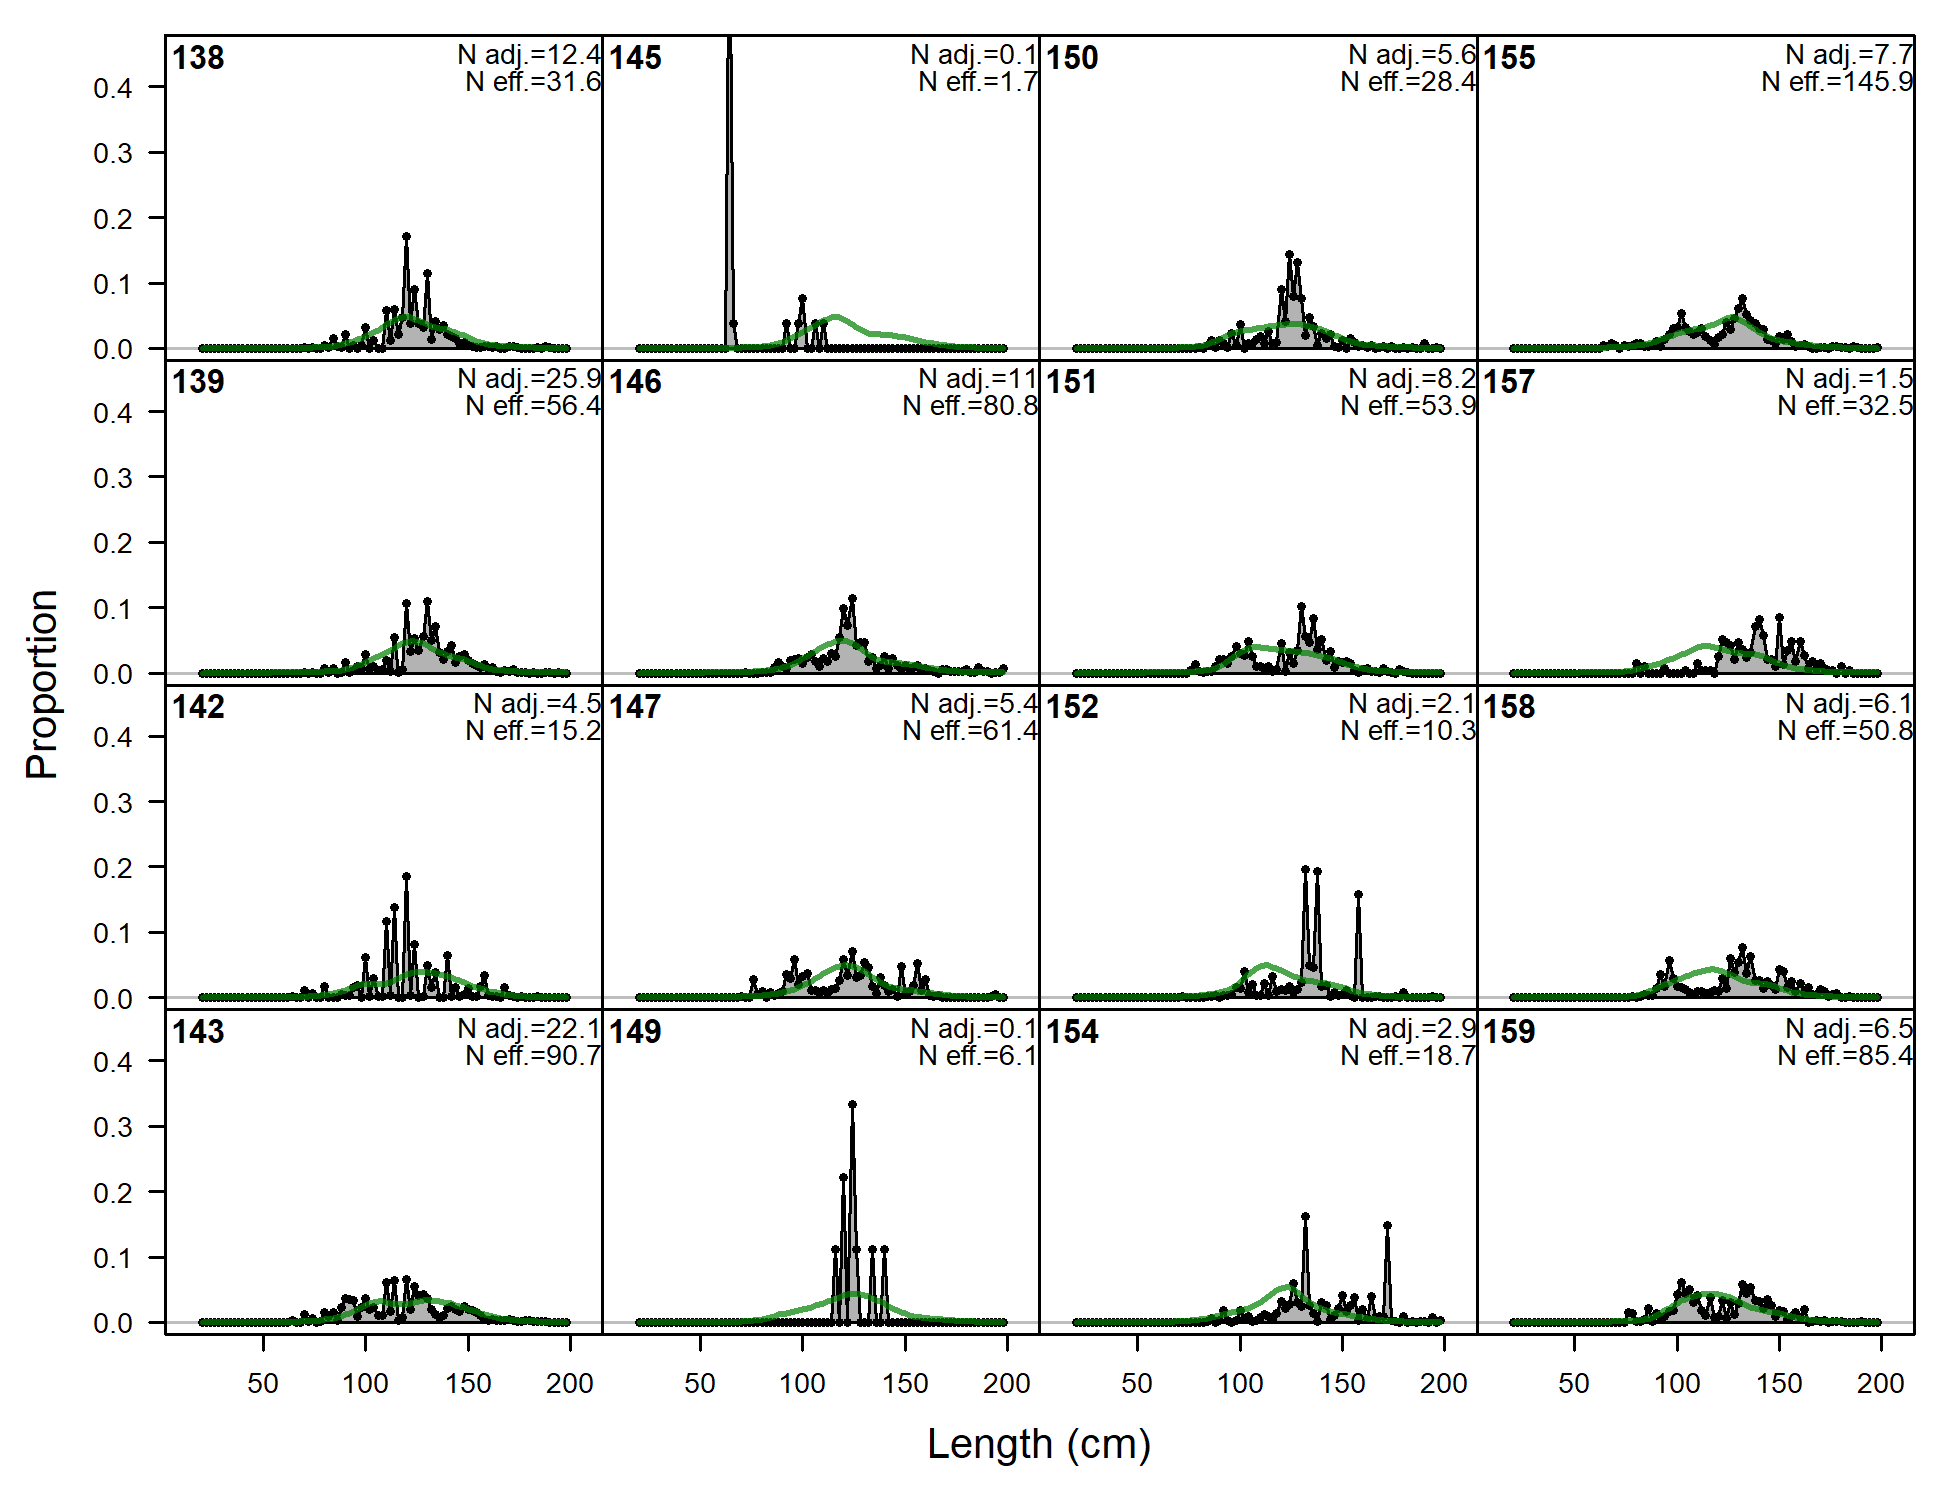
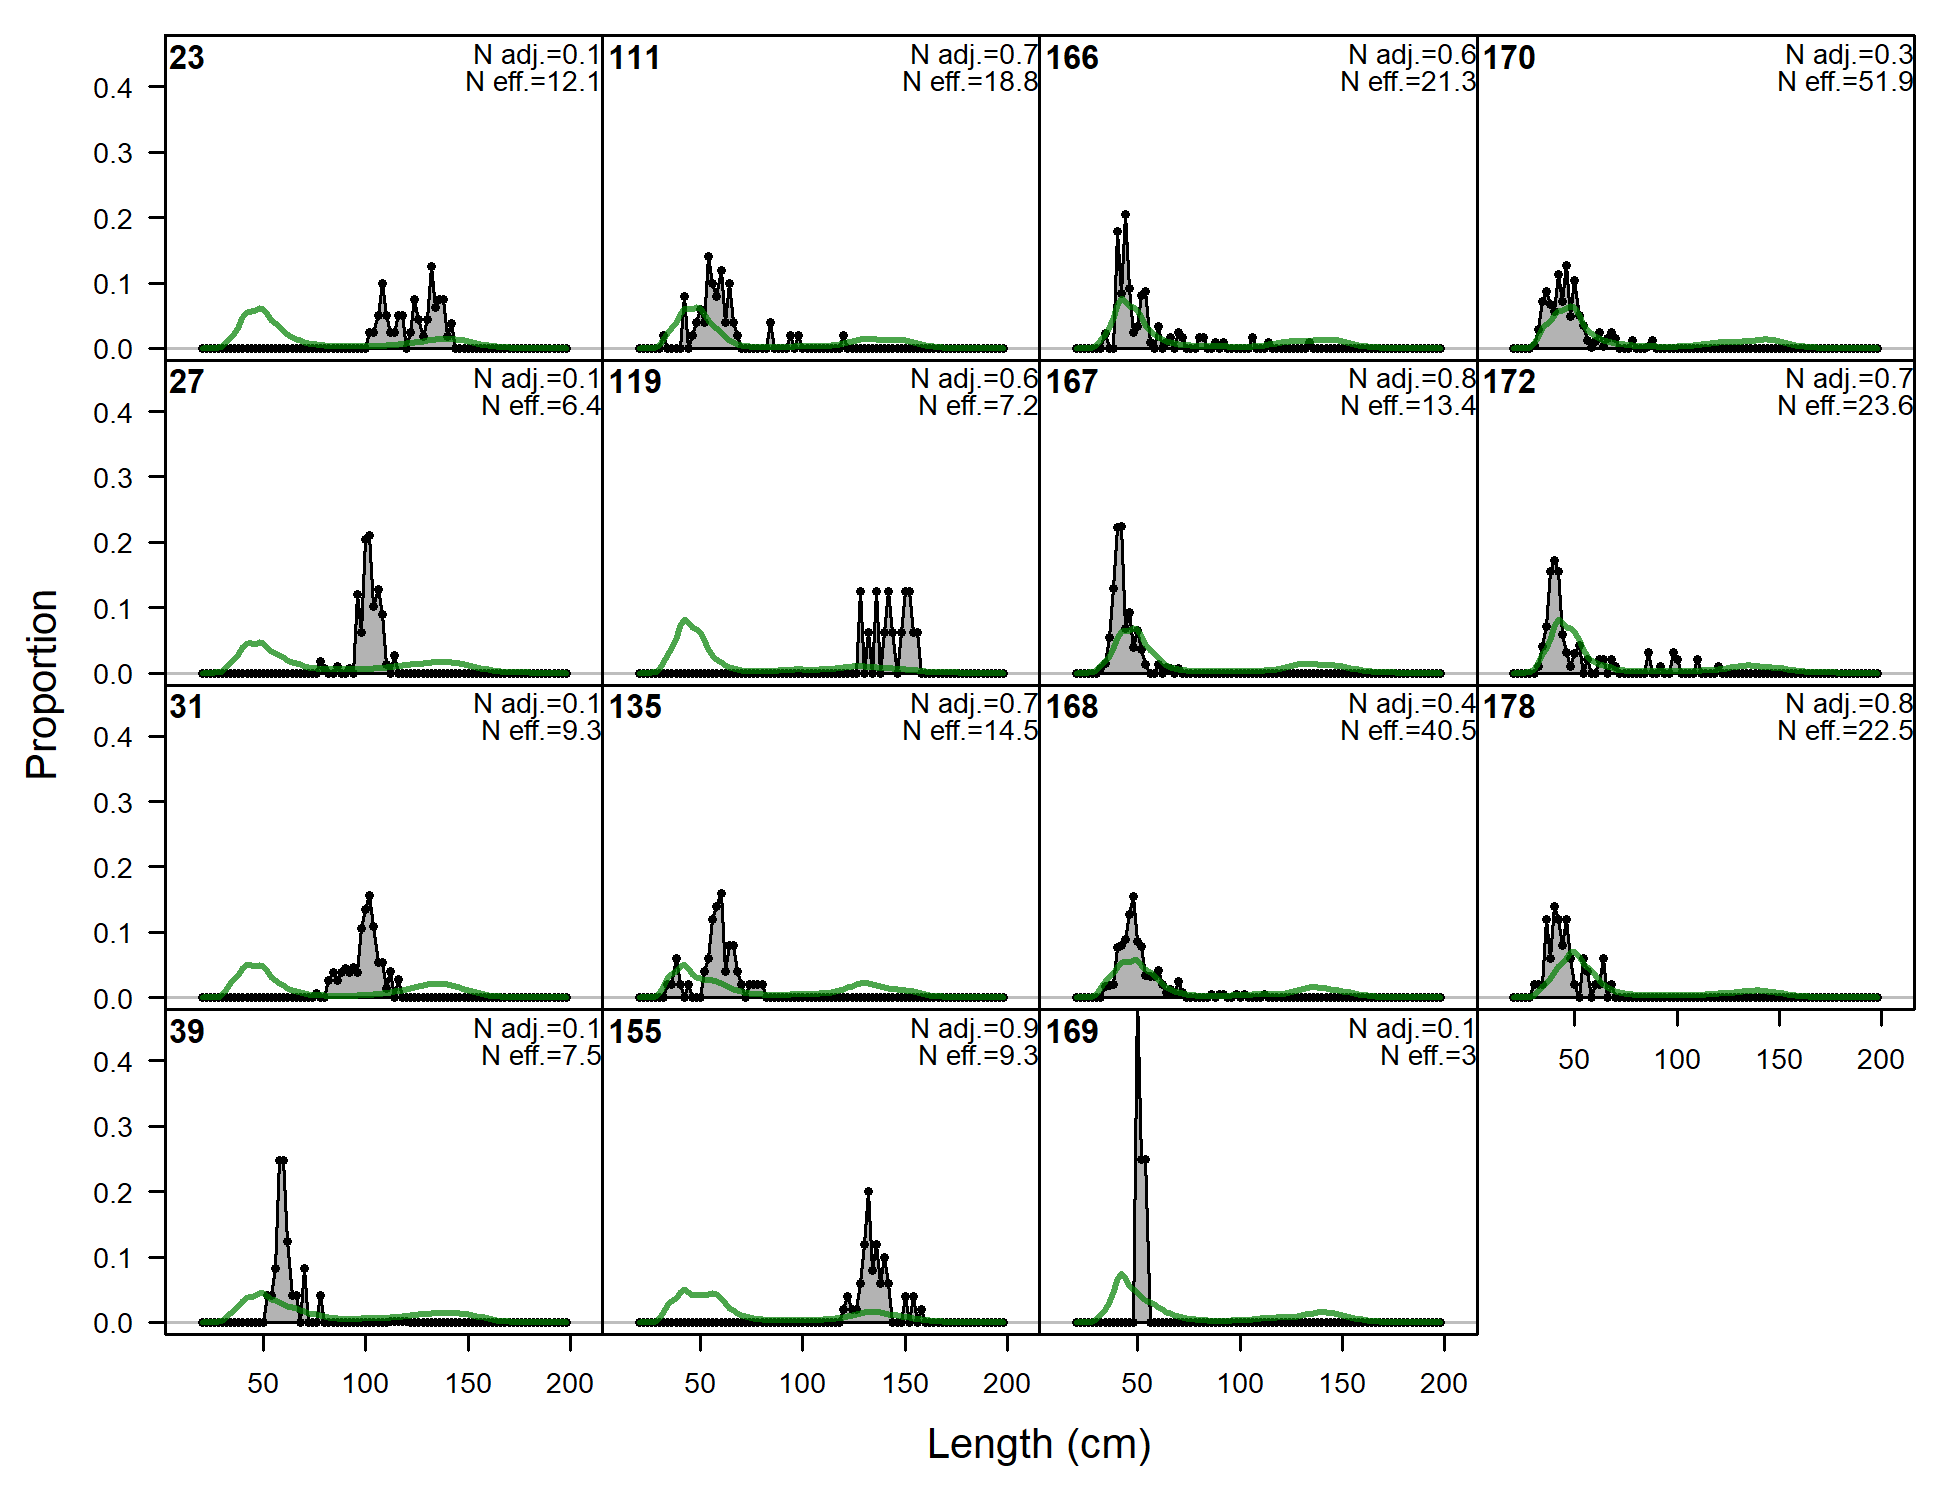
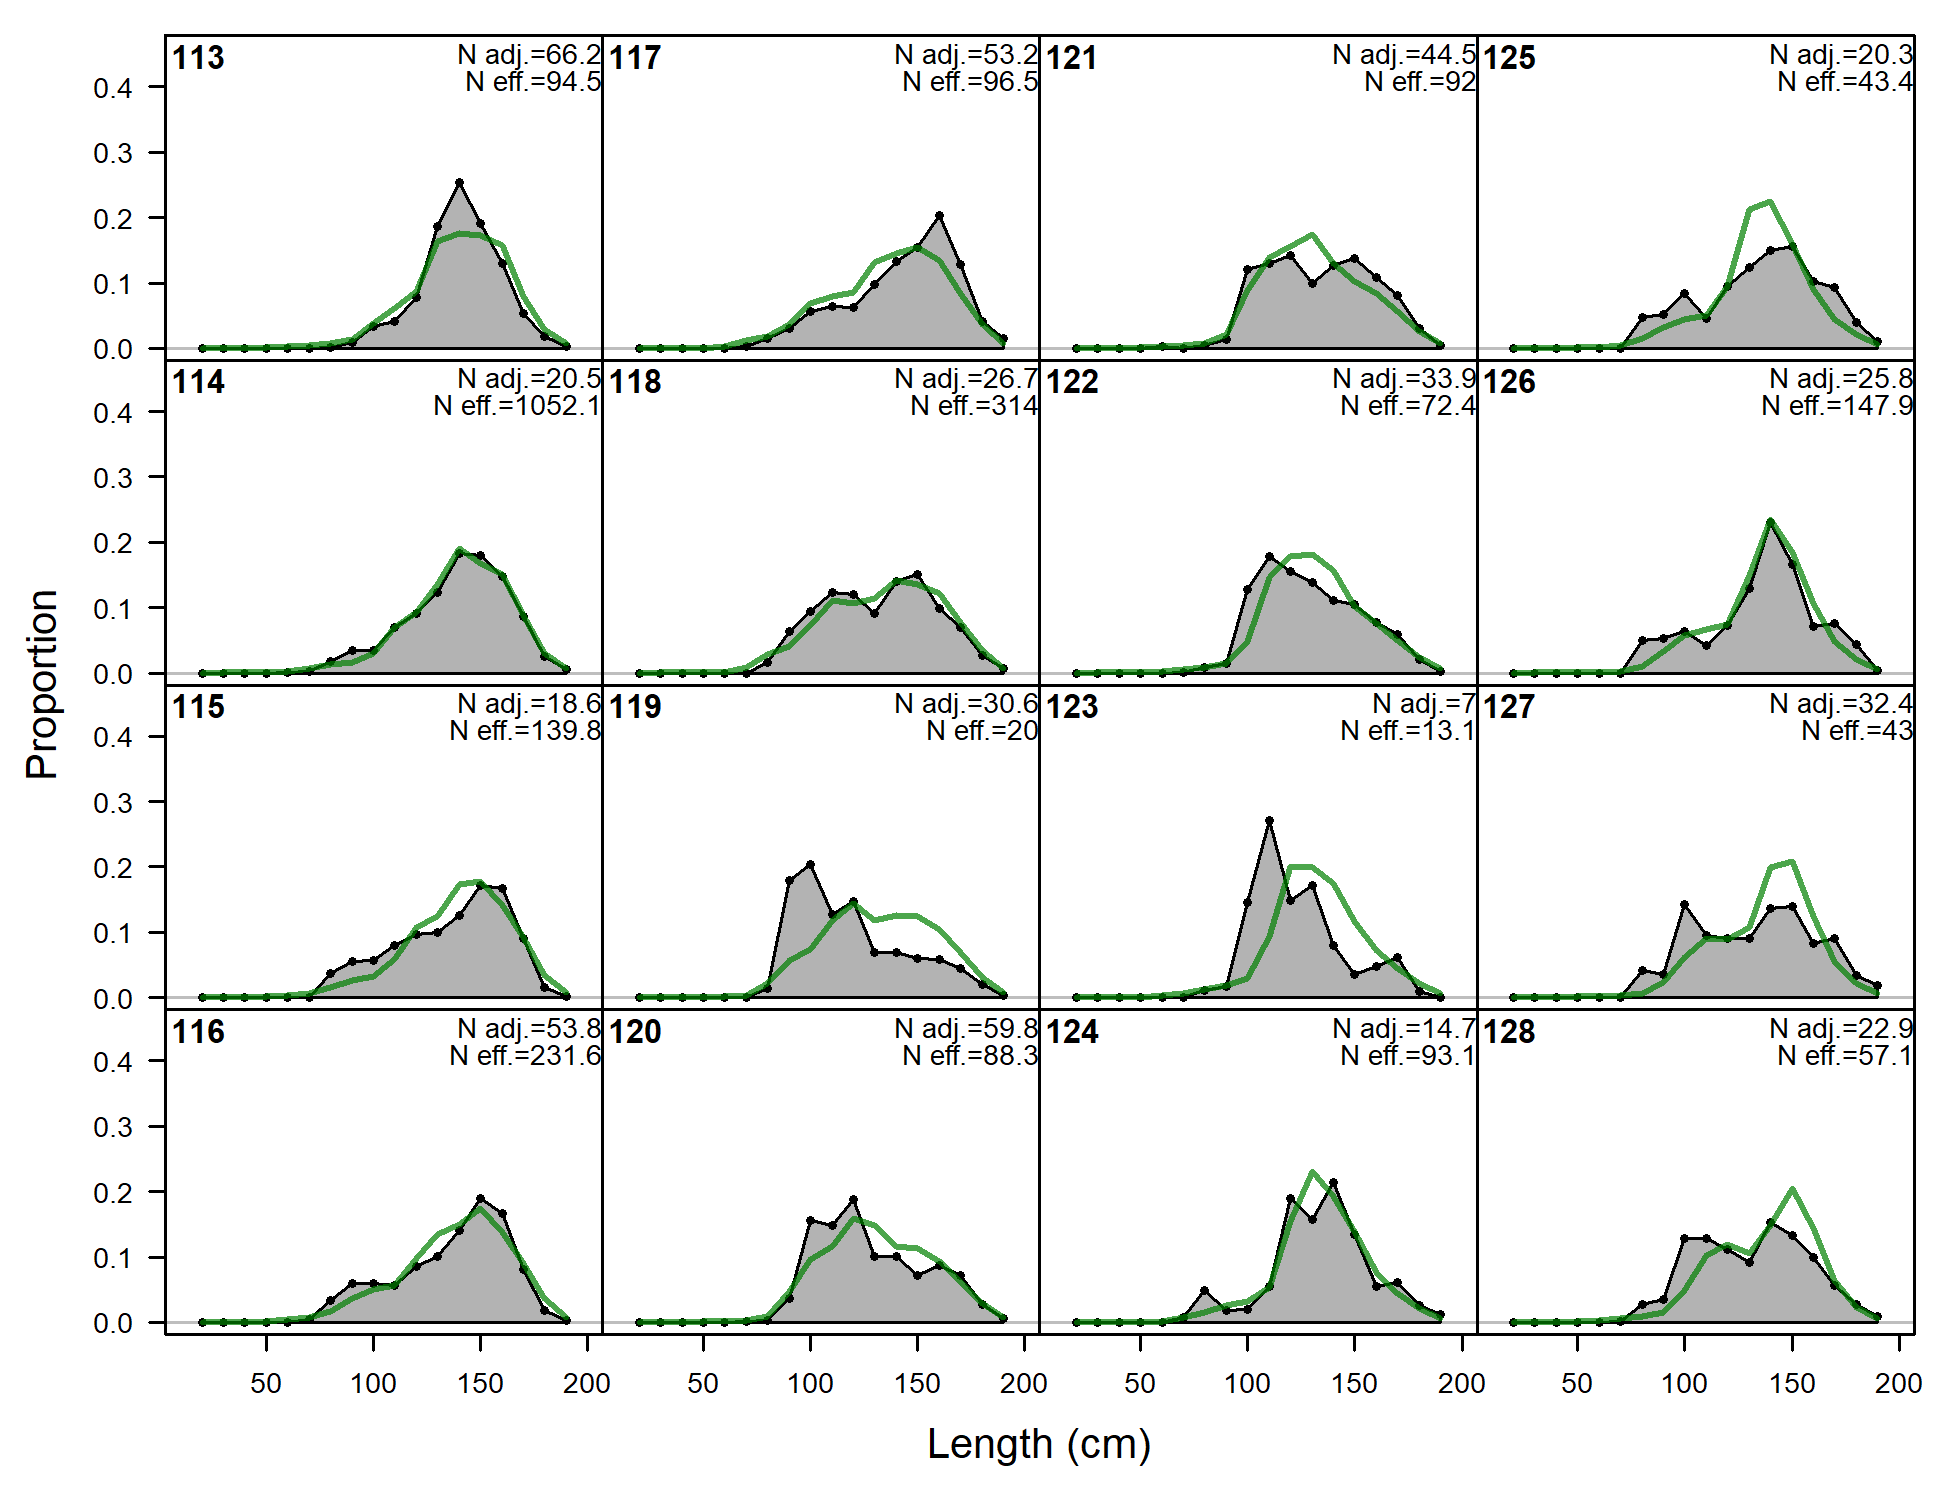
Length comps, whole catch, A2-LL-n (plot 1 of 8).
'N adj.' is the input sample size after data-weighting adjustment. N eff. is the calculated effective sample size used in the McAllister-Iannelli tuning method.
file: comp_lenfit_flt2mkt0_page1.png
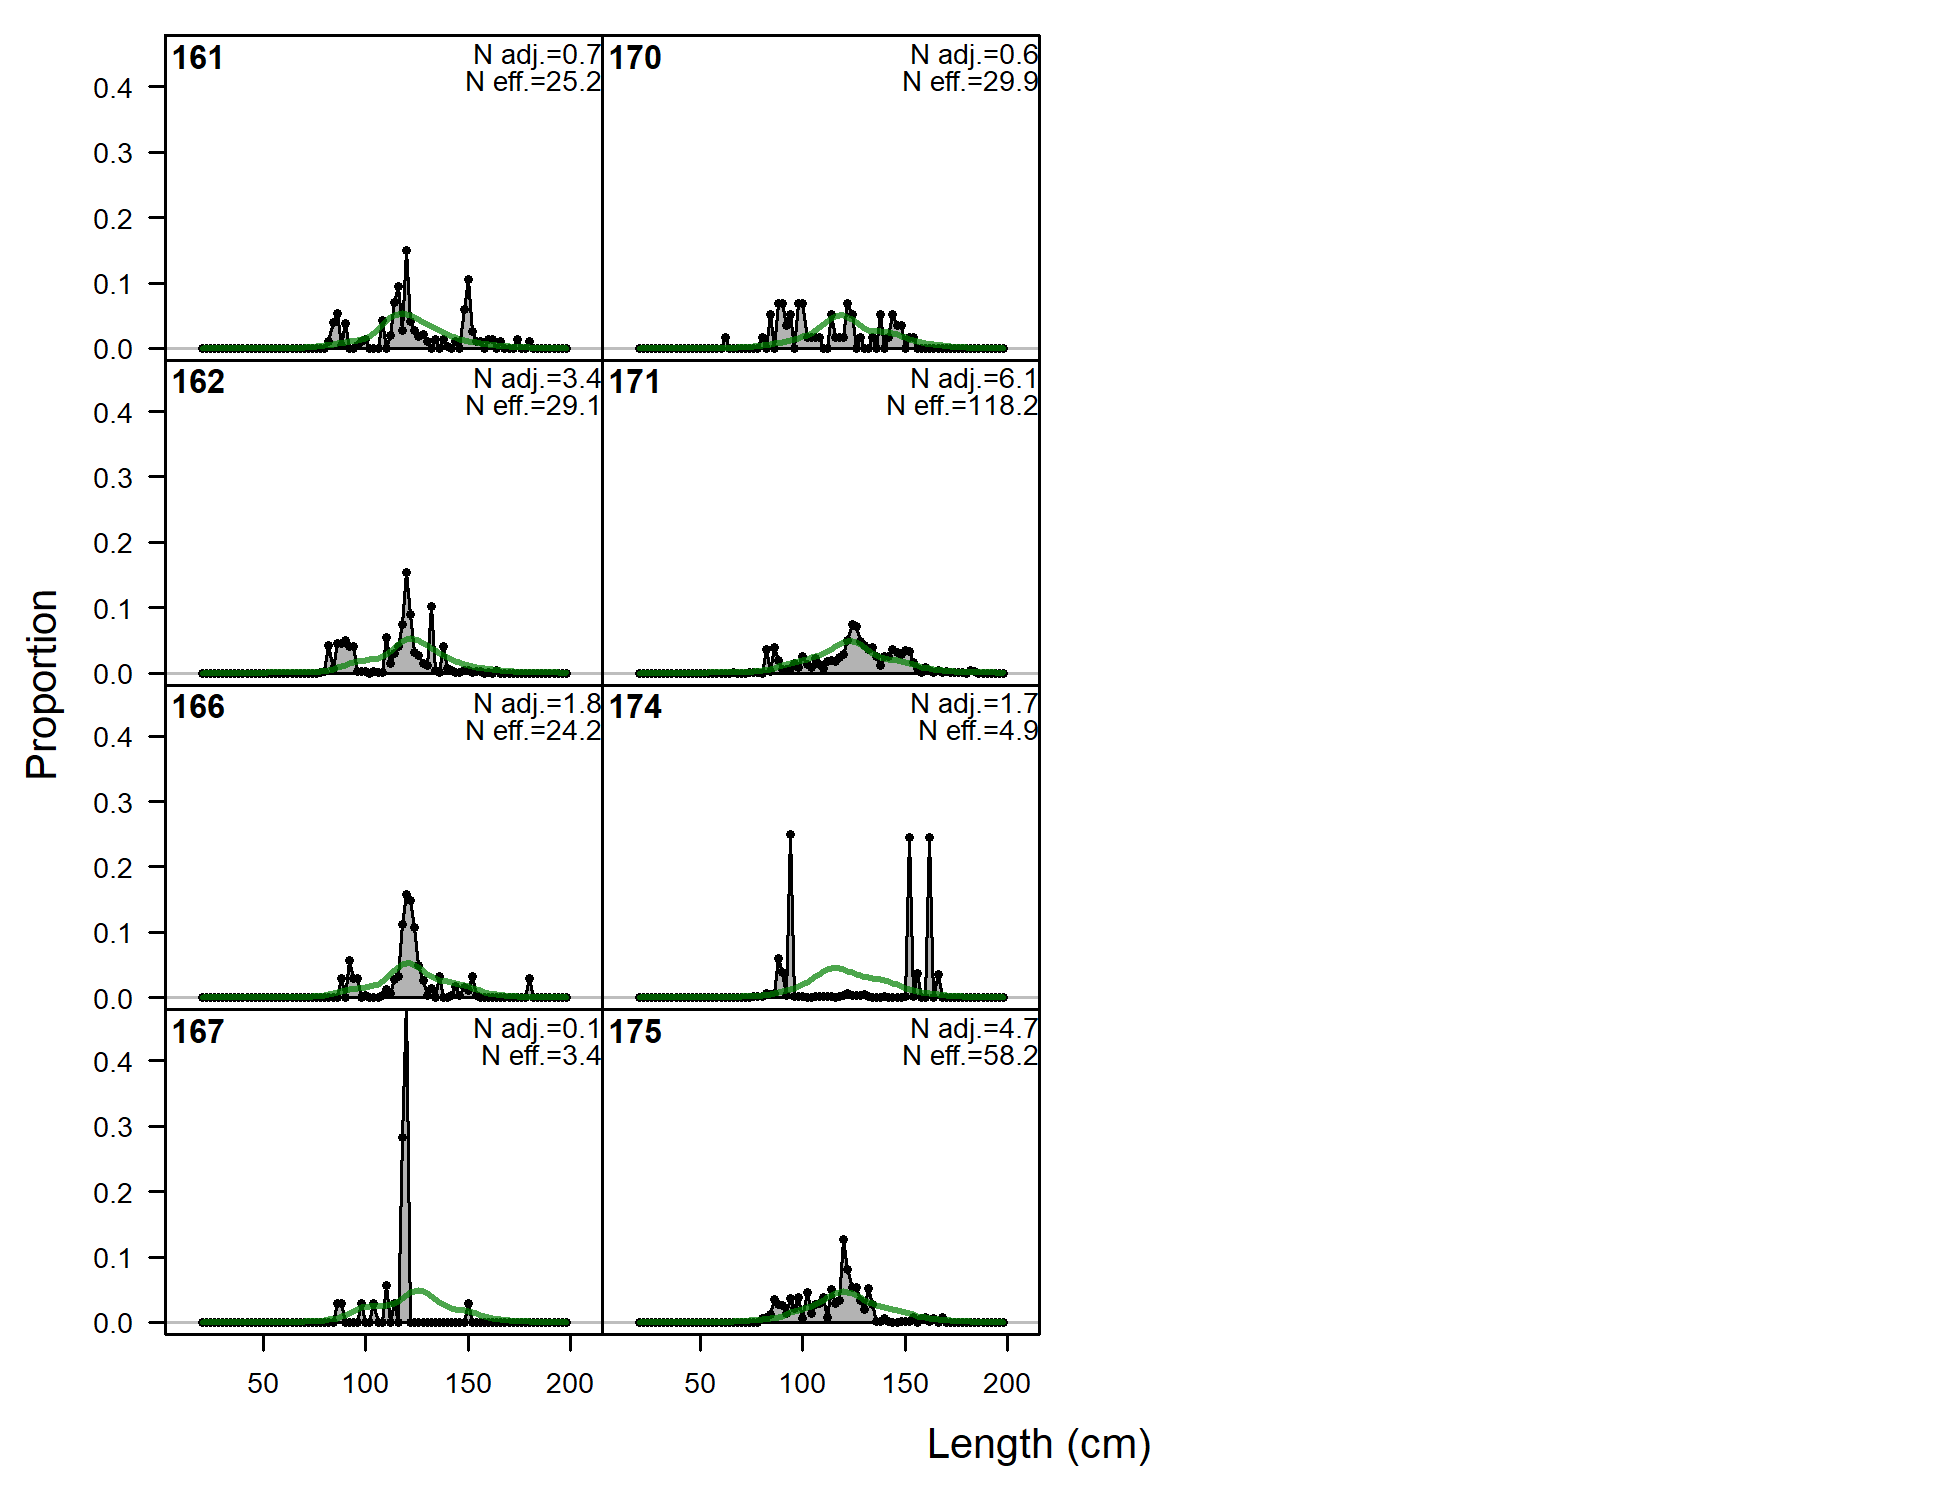
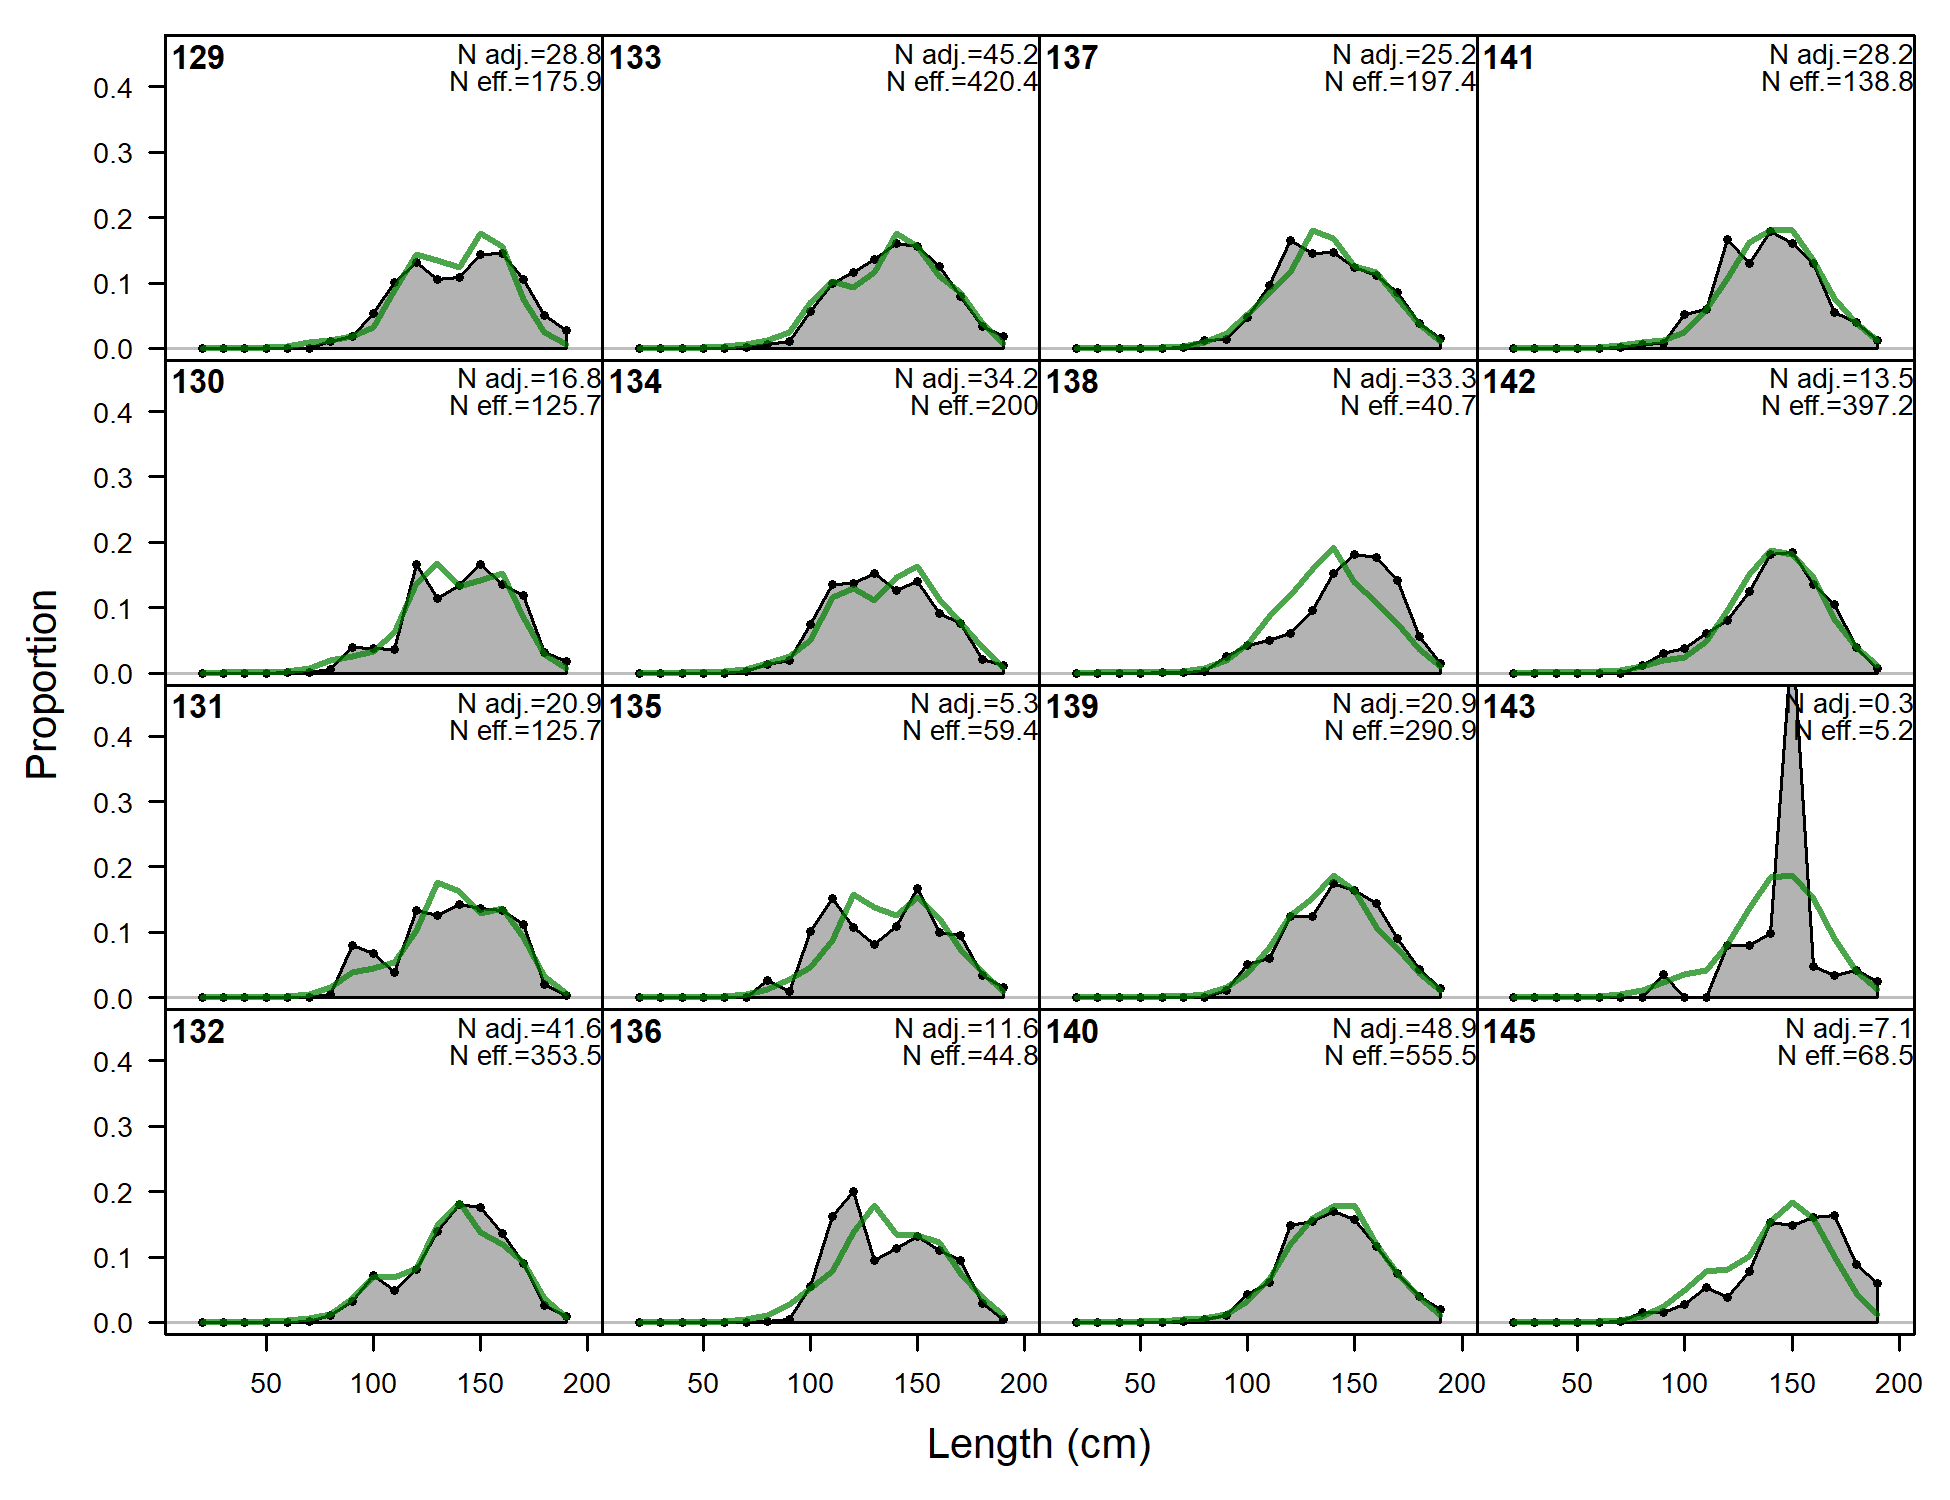
Length comps, whole catch, A2-LL-n (plot 2 of 8)
file: comp_lenfit_flt2mkt0_page2.png
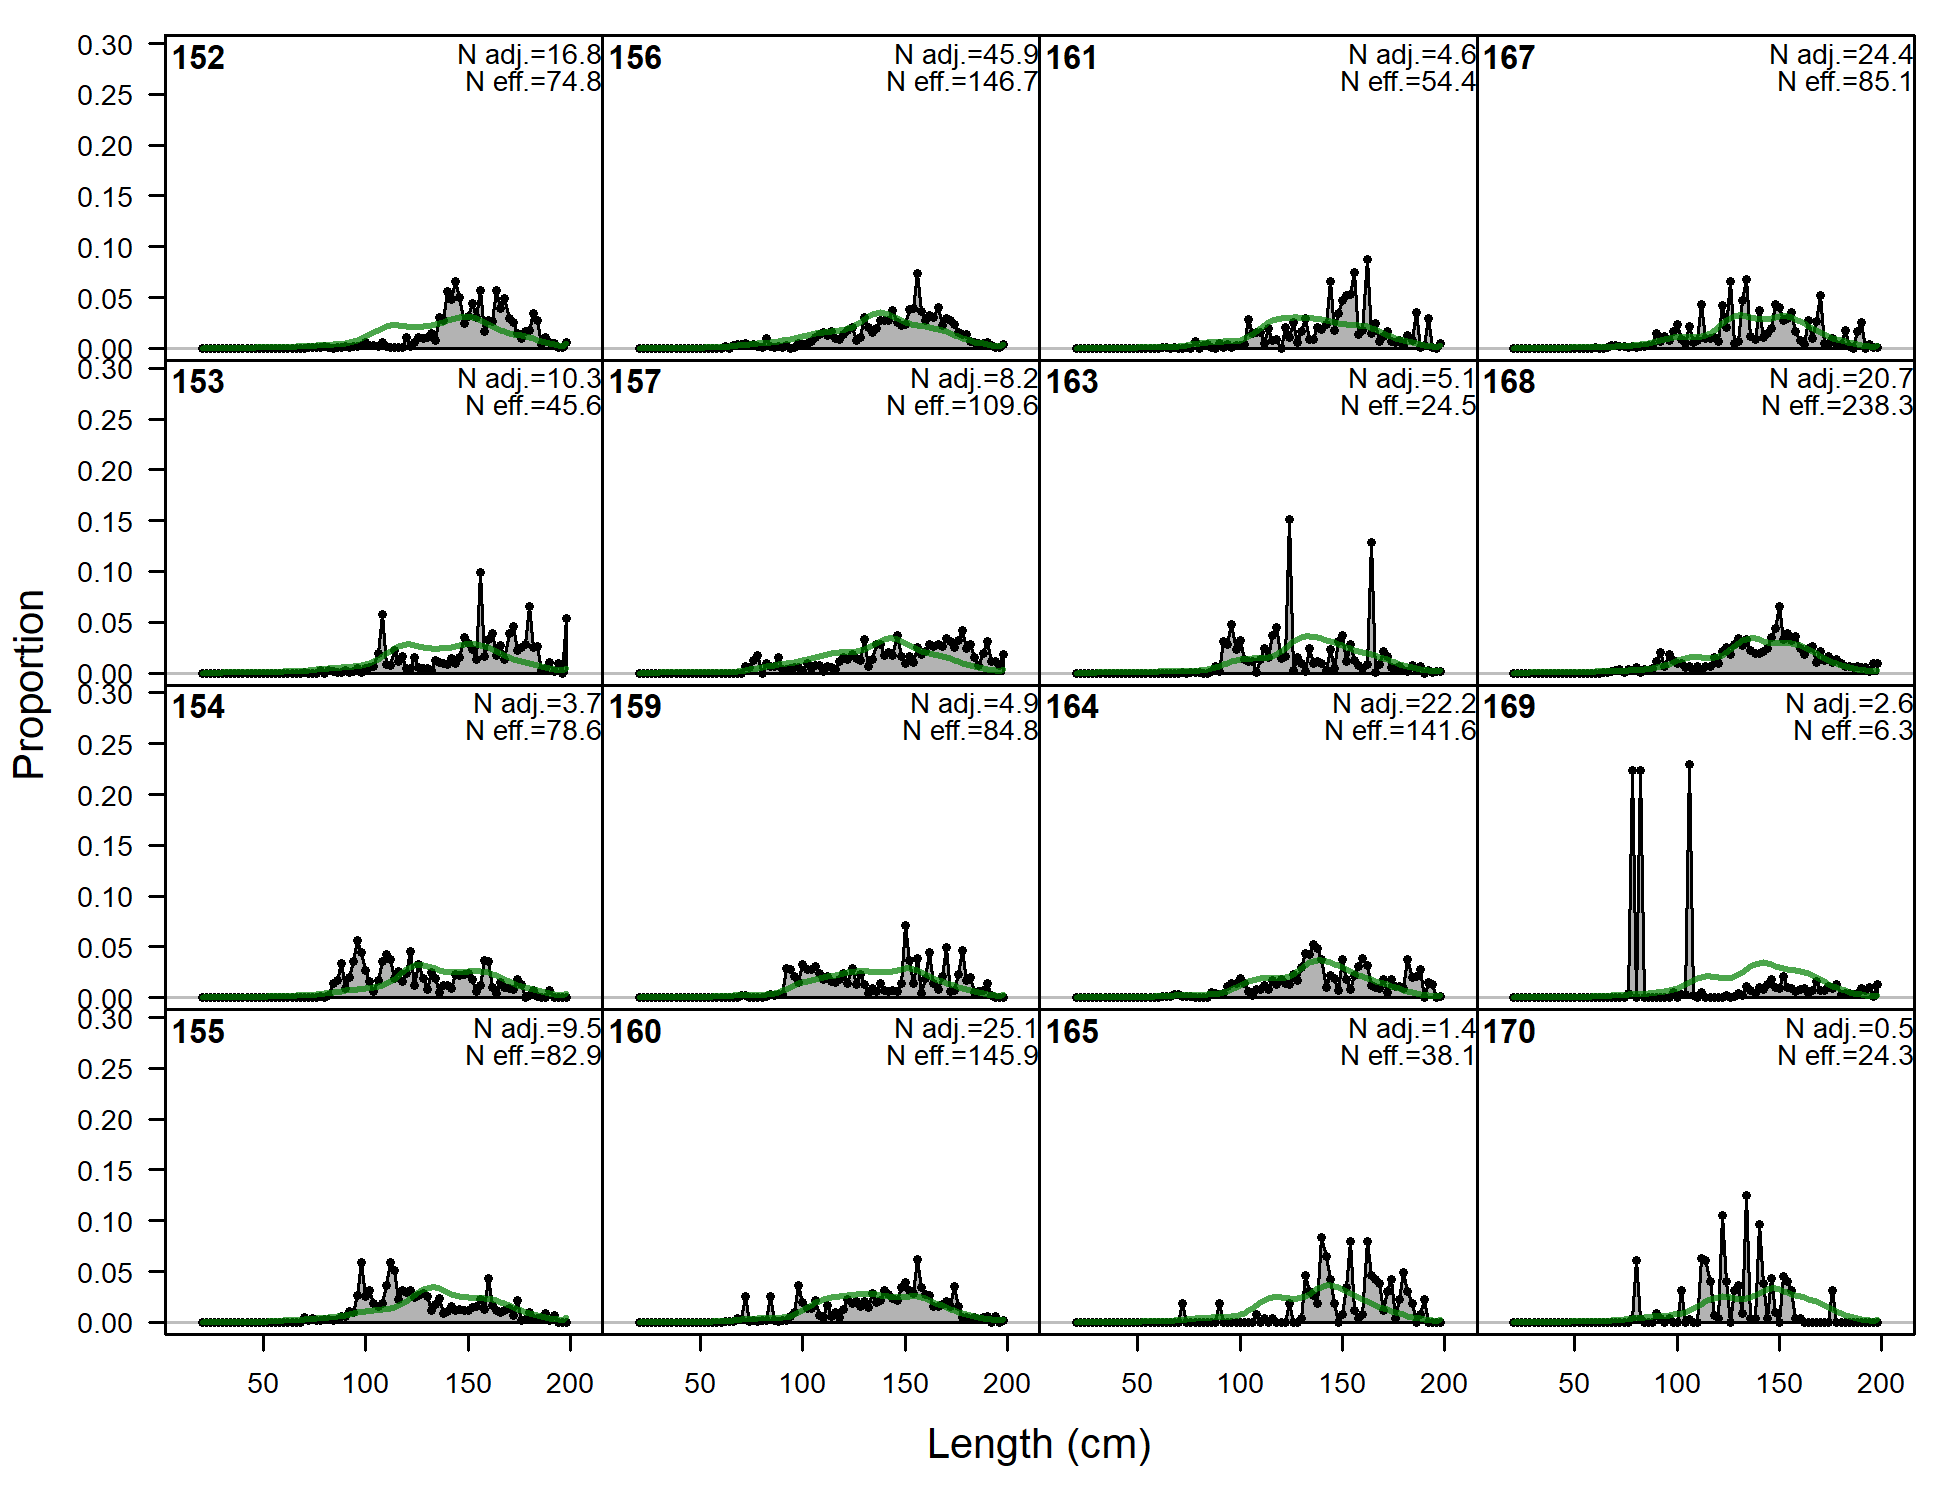
Length comps, whole catch, A2-LL-n (plot 3 of 8)
file: comp_lenfit_flt2mkt0_page3.png
Length comps, whole catch, A2-LL-n (plot 4 of 8)
file: comp_lenfit_flt2mkt0_page4.png
Length comps, whole catch, A2-LL-n (plot 5 of 8)
file: comp_lenfit_flt2mkt0_page5.png
Length comps, whole catch, A2-LL-n (plot 6 of 8)
file: comp_lenfit_flt2mkt0_page6.png
Length comps, whole catch, A2-LL-n (plot 7 of 8)
file: comp_lenfit_flt2mkt0_page7.png
Length comps, whole catch, A2-LL-n (plot 8 of 8)
file: comp_lenfit_flt2mkt0_page8.png
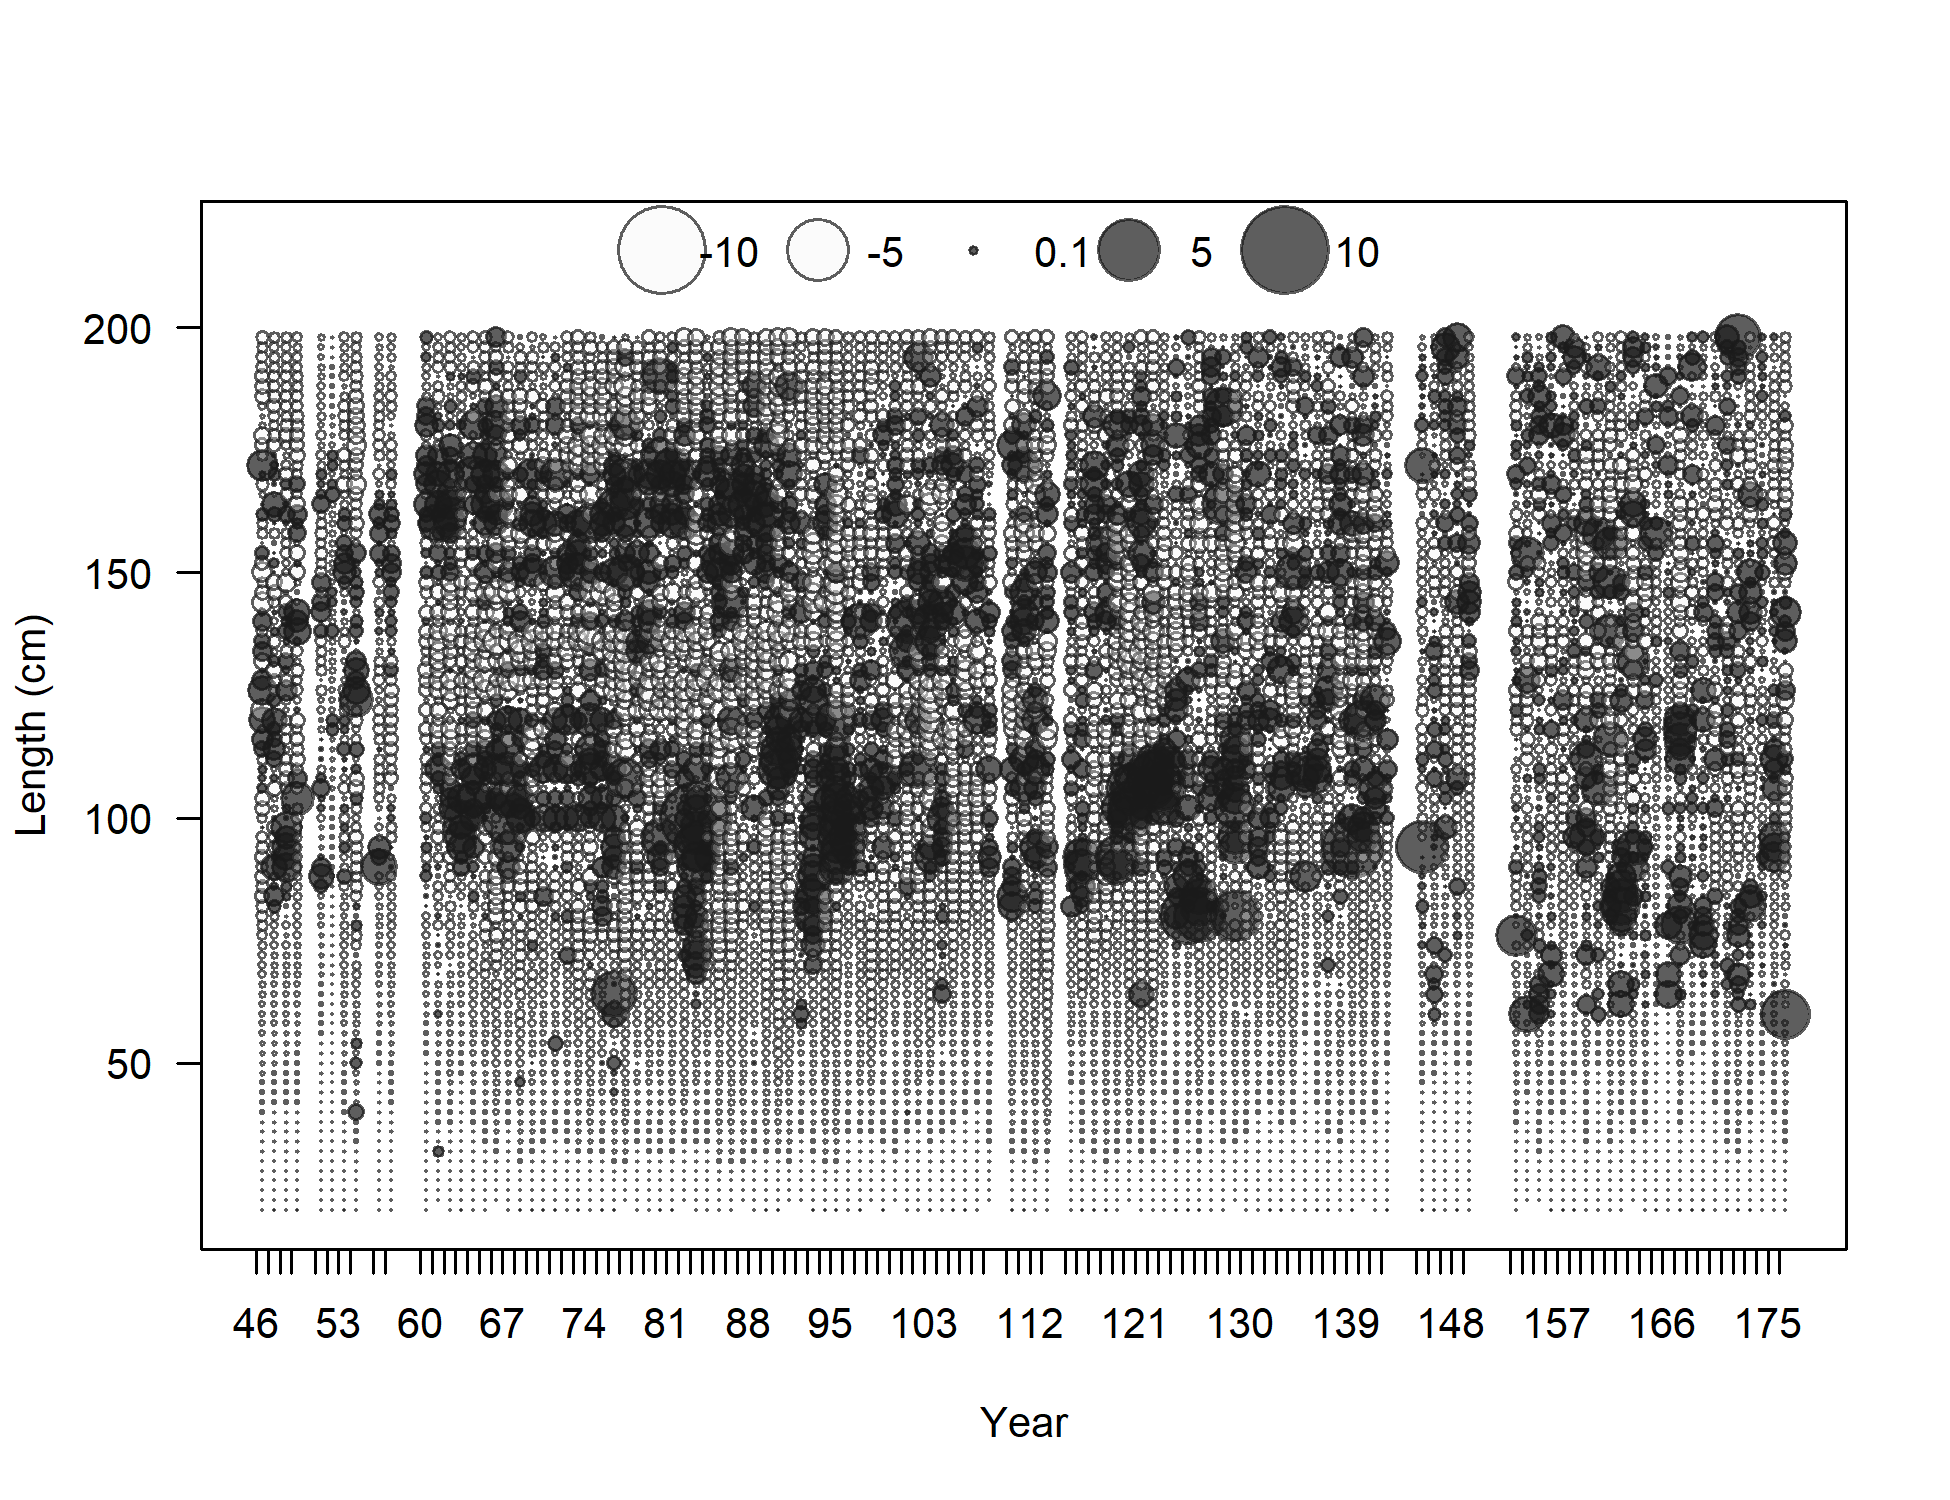
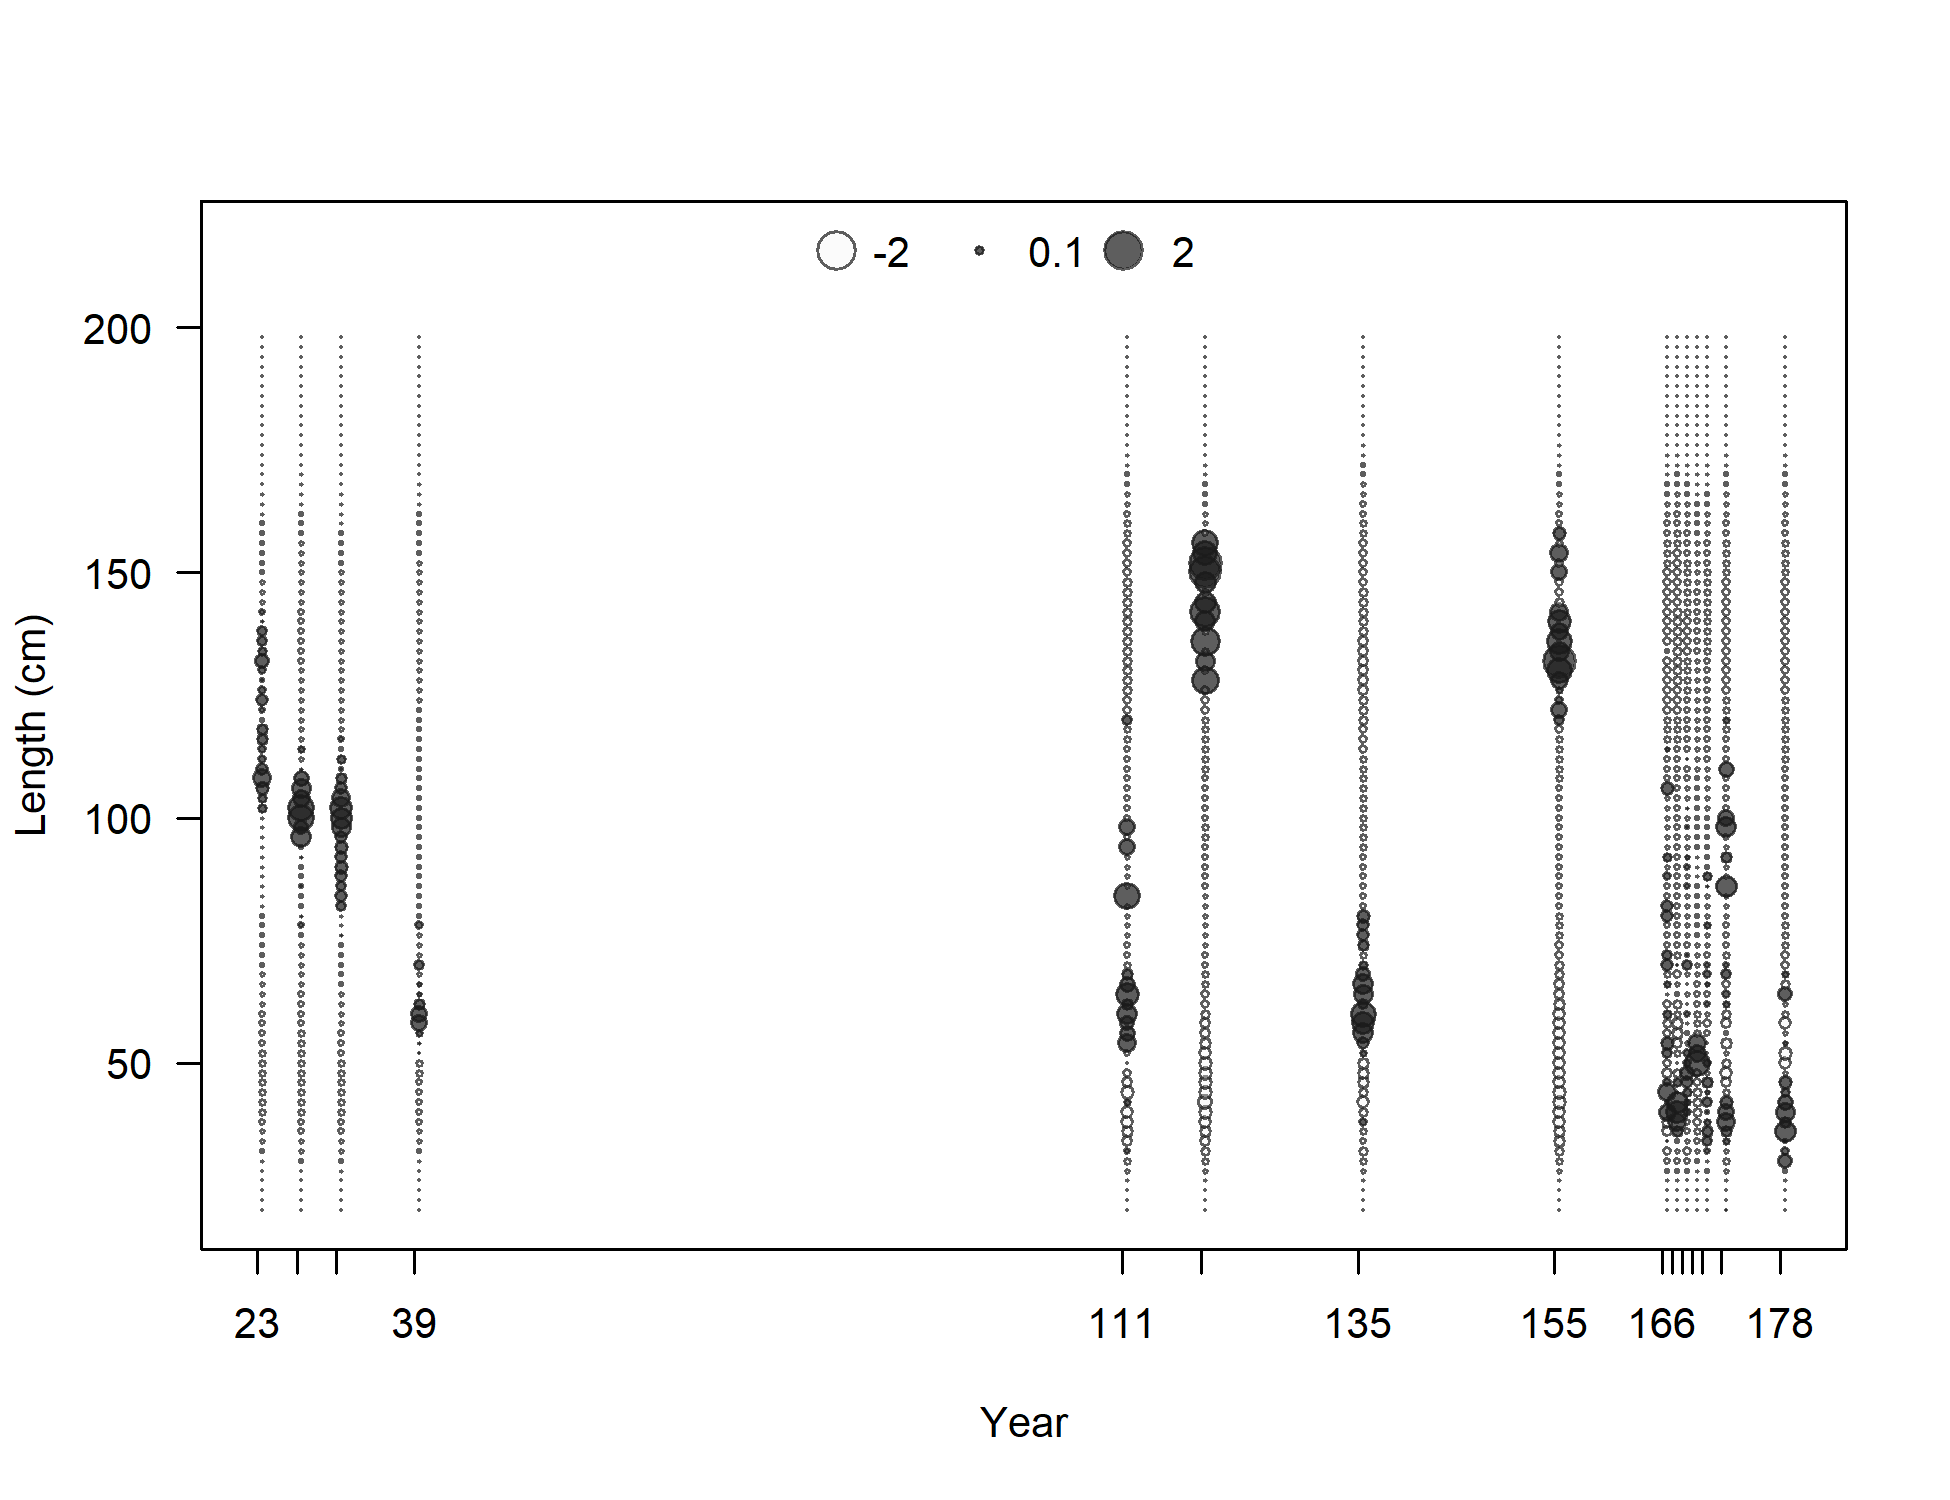
Pearson residuals, whole catch, A2-LL-n (max=6.81) (plot 8 of 8)
Closed bubbles are positive residuals (observed > expected) and open bubbles are negative residuals (observed < expected).
file: comp_lenfit_residsflt2mkt0_page8.png
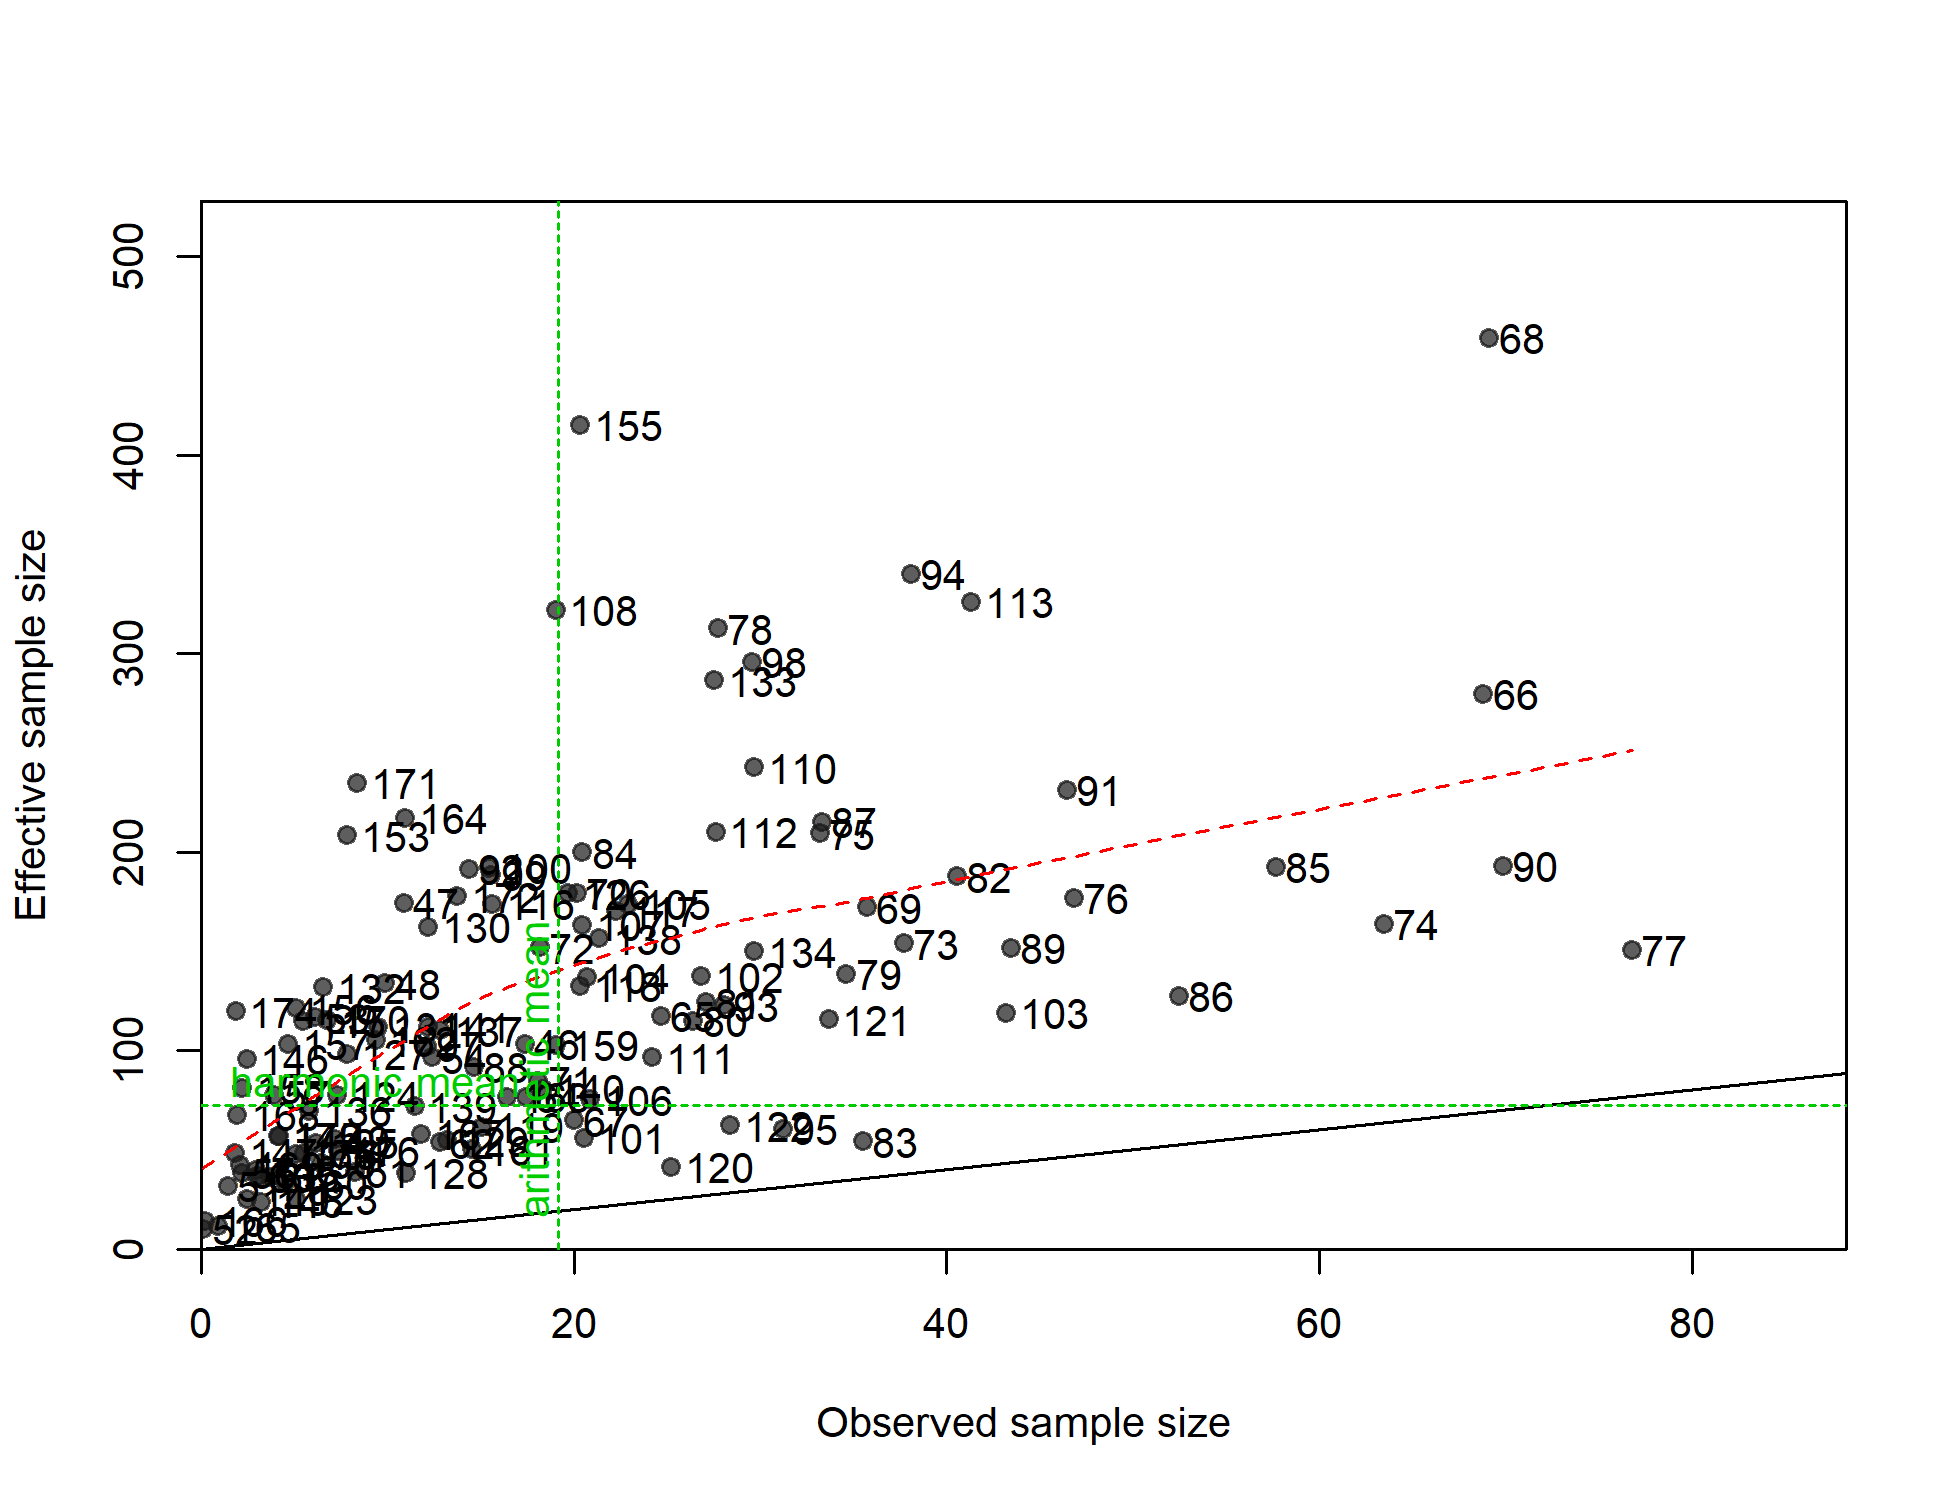
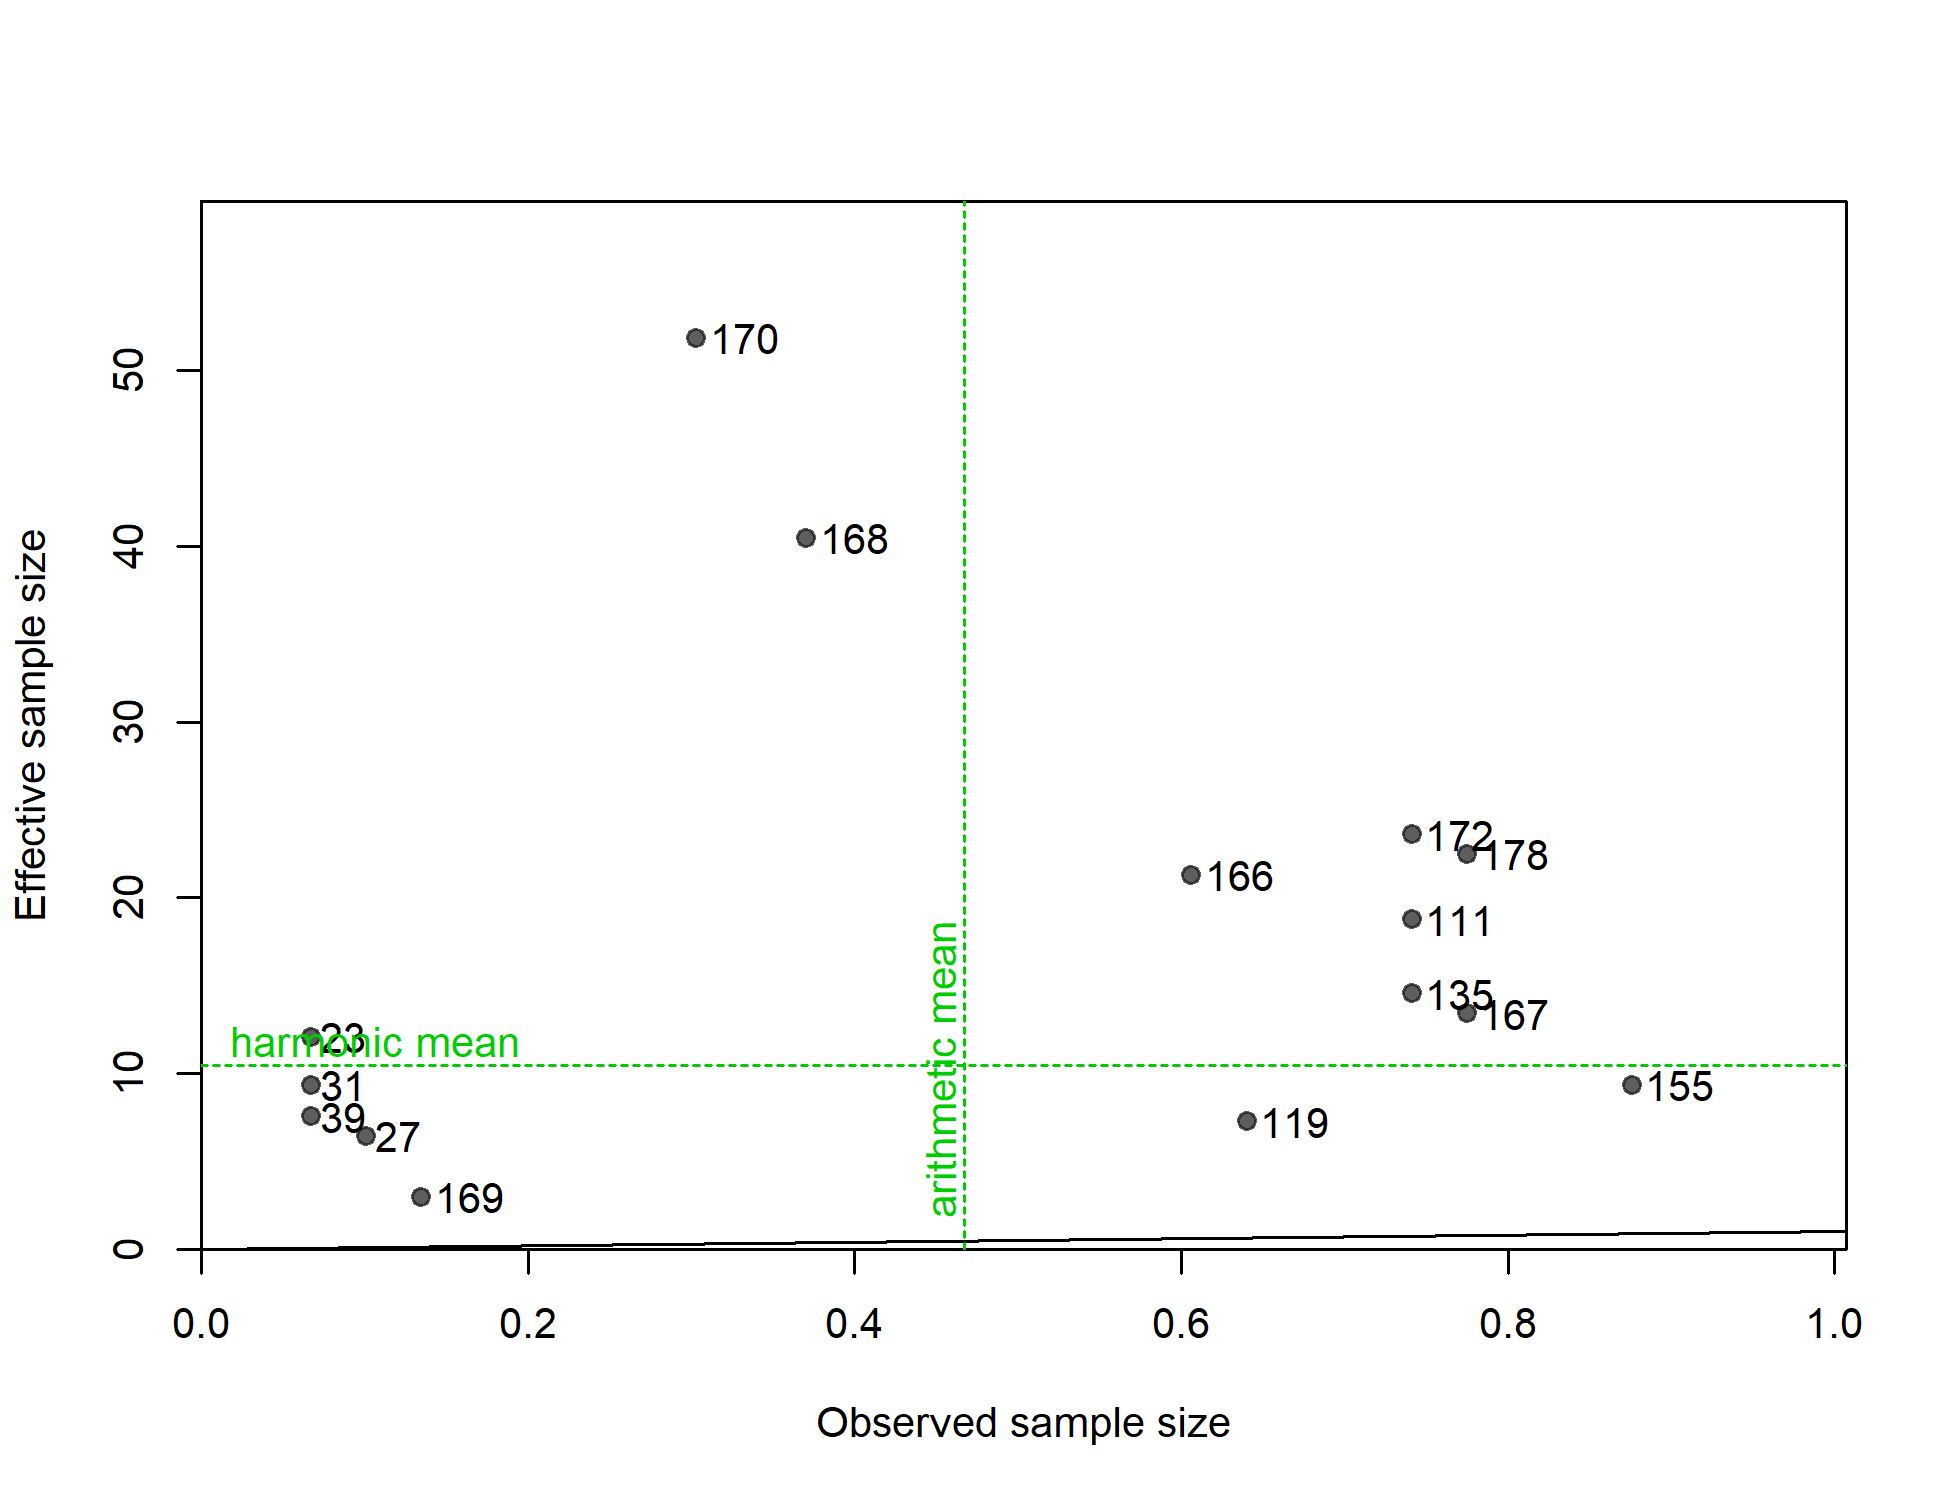
N-EffN comparison, Length comps, whole catch, A2-LL-n
file: comp_lenfit_sampsize_flt2mkt0.png
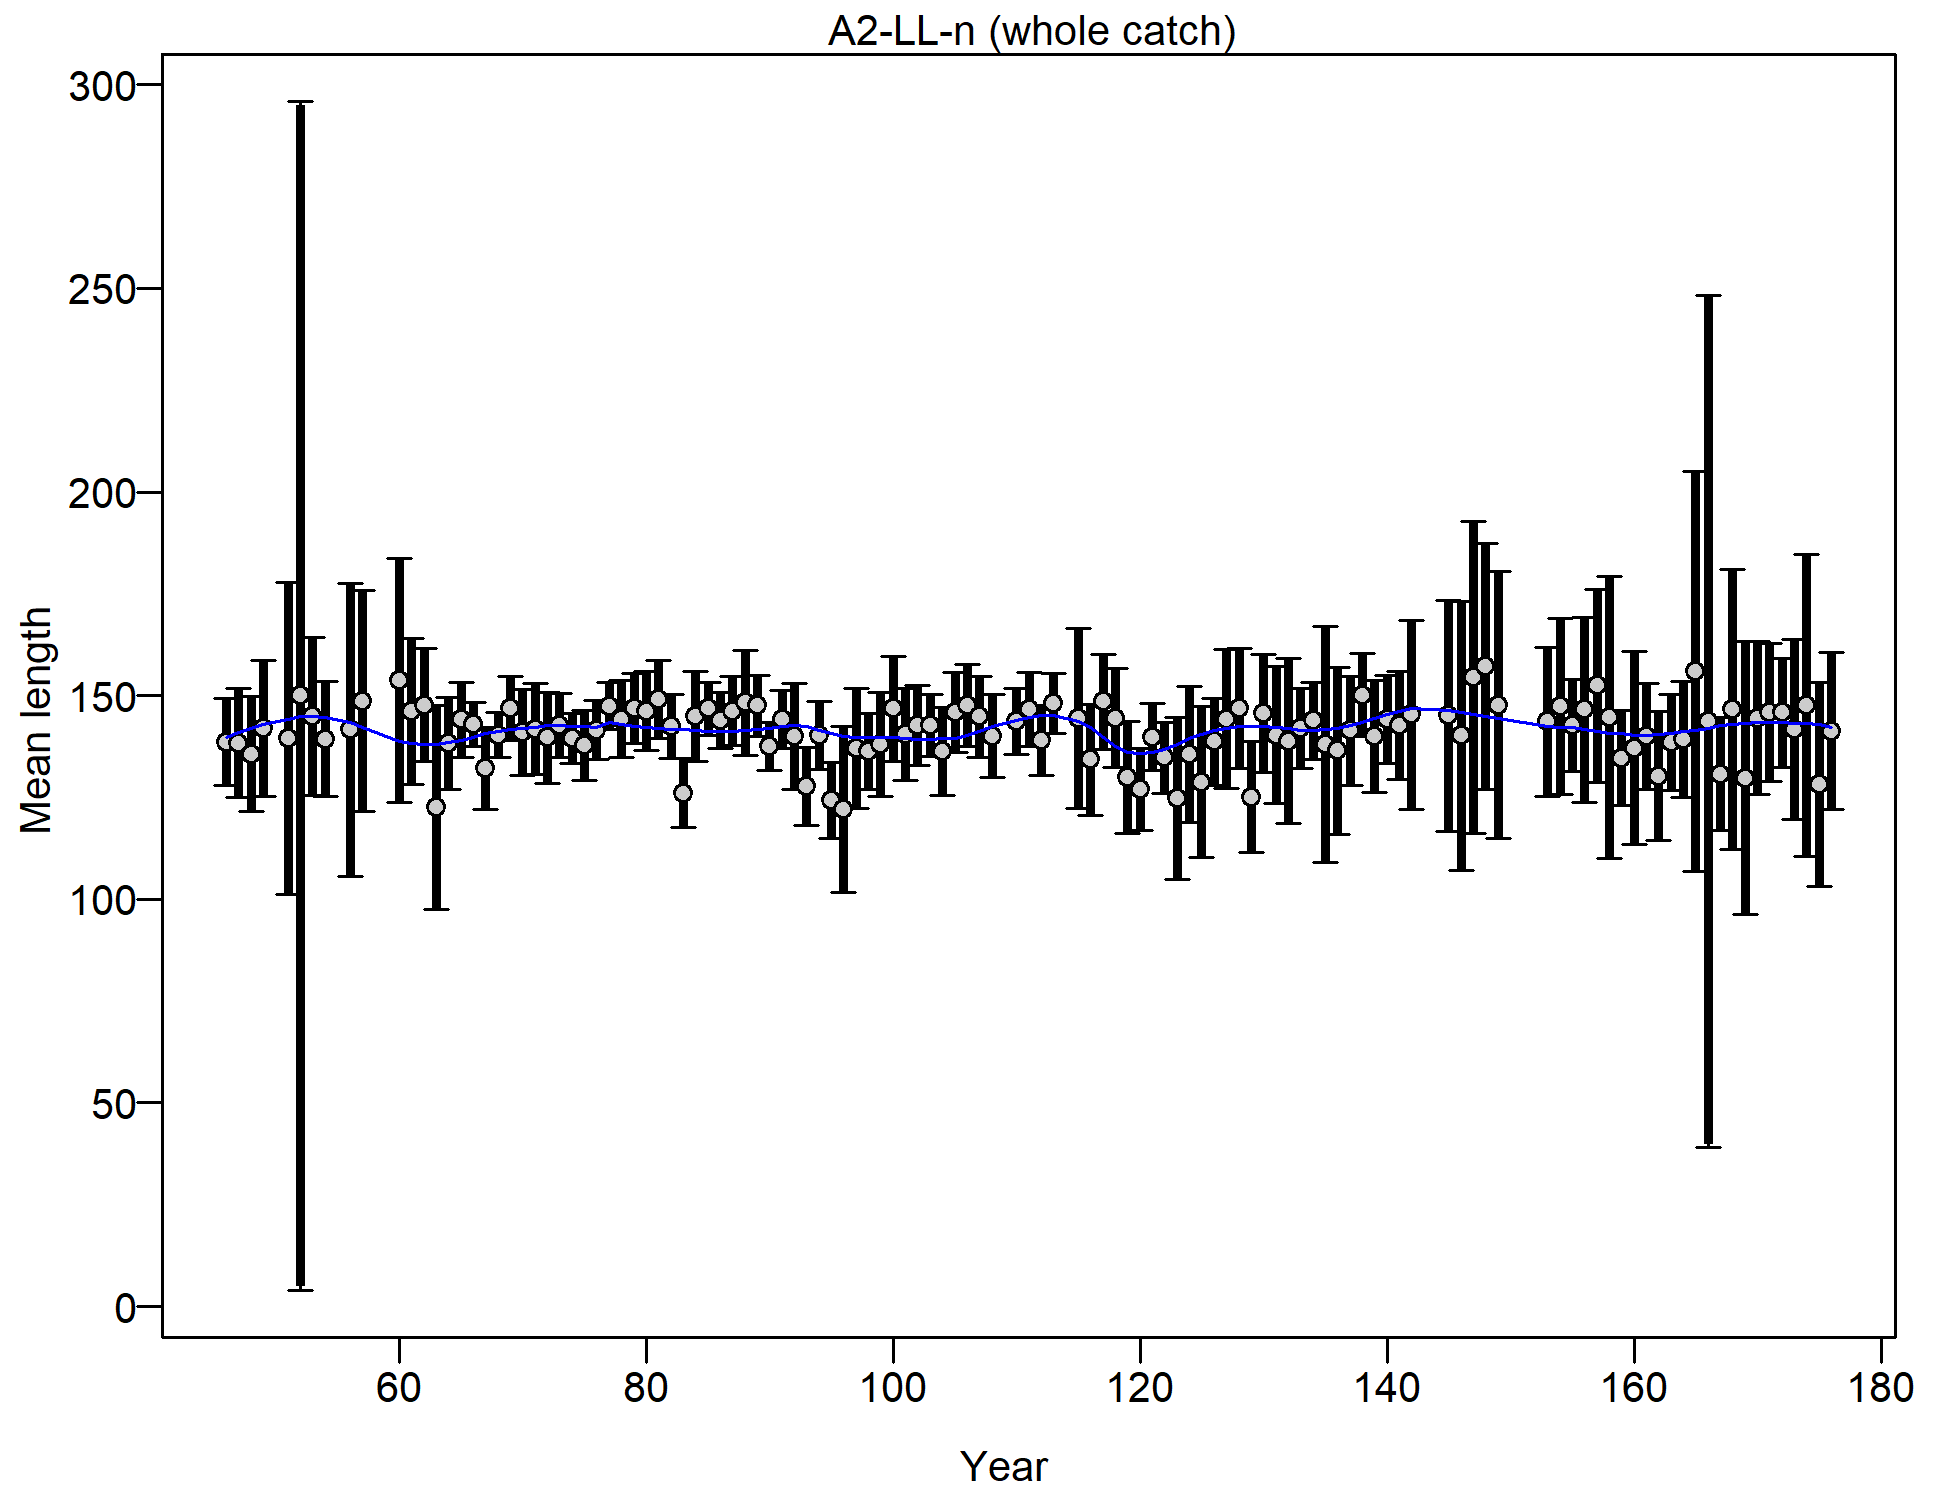
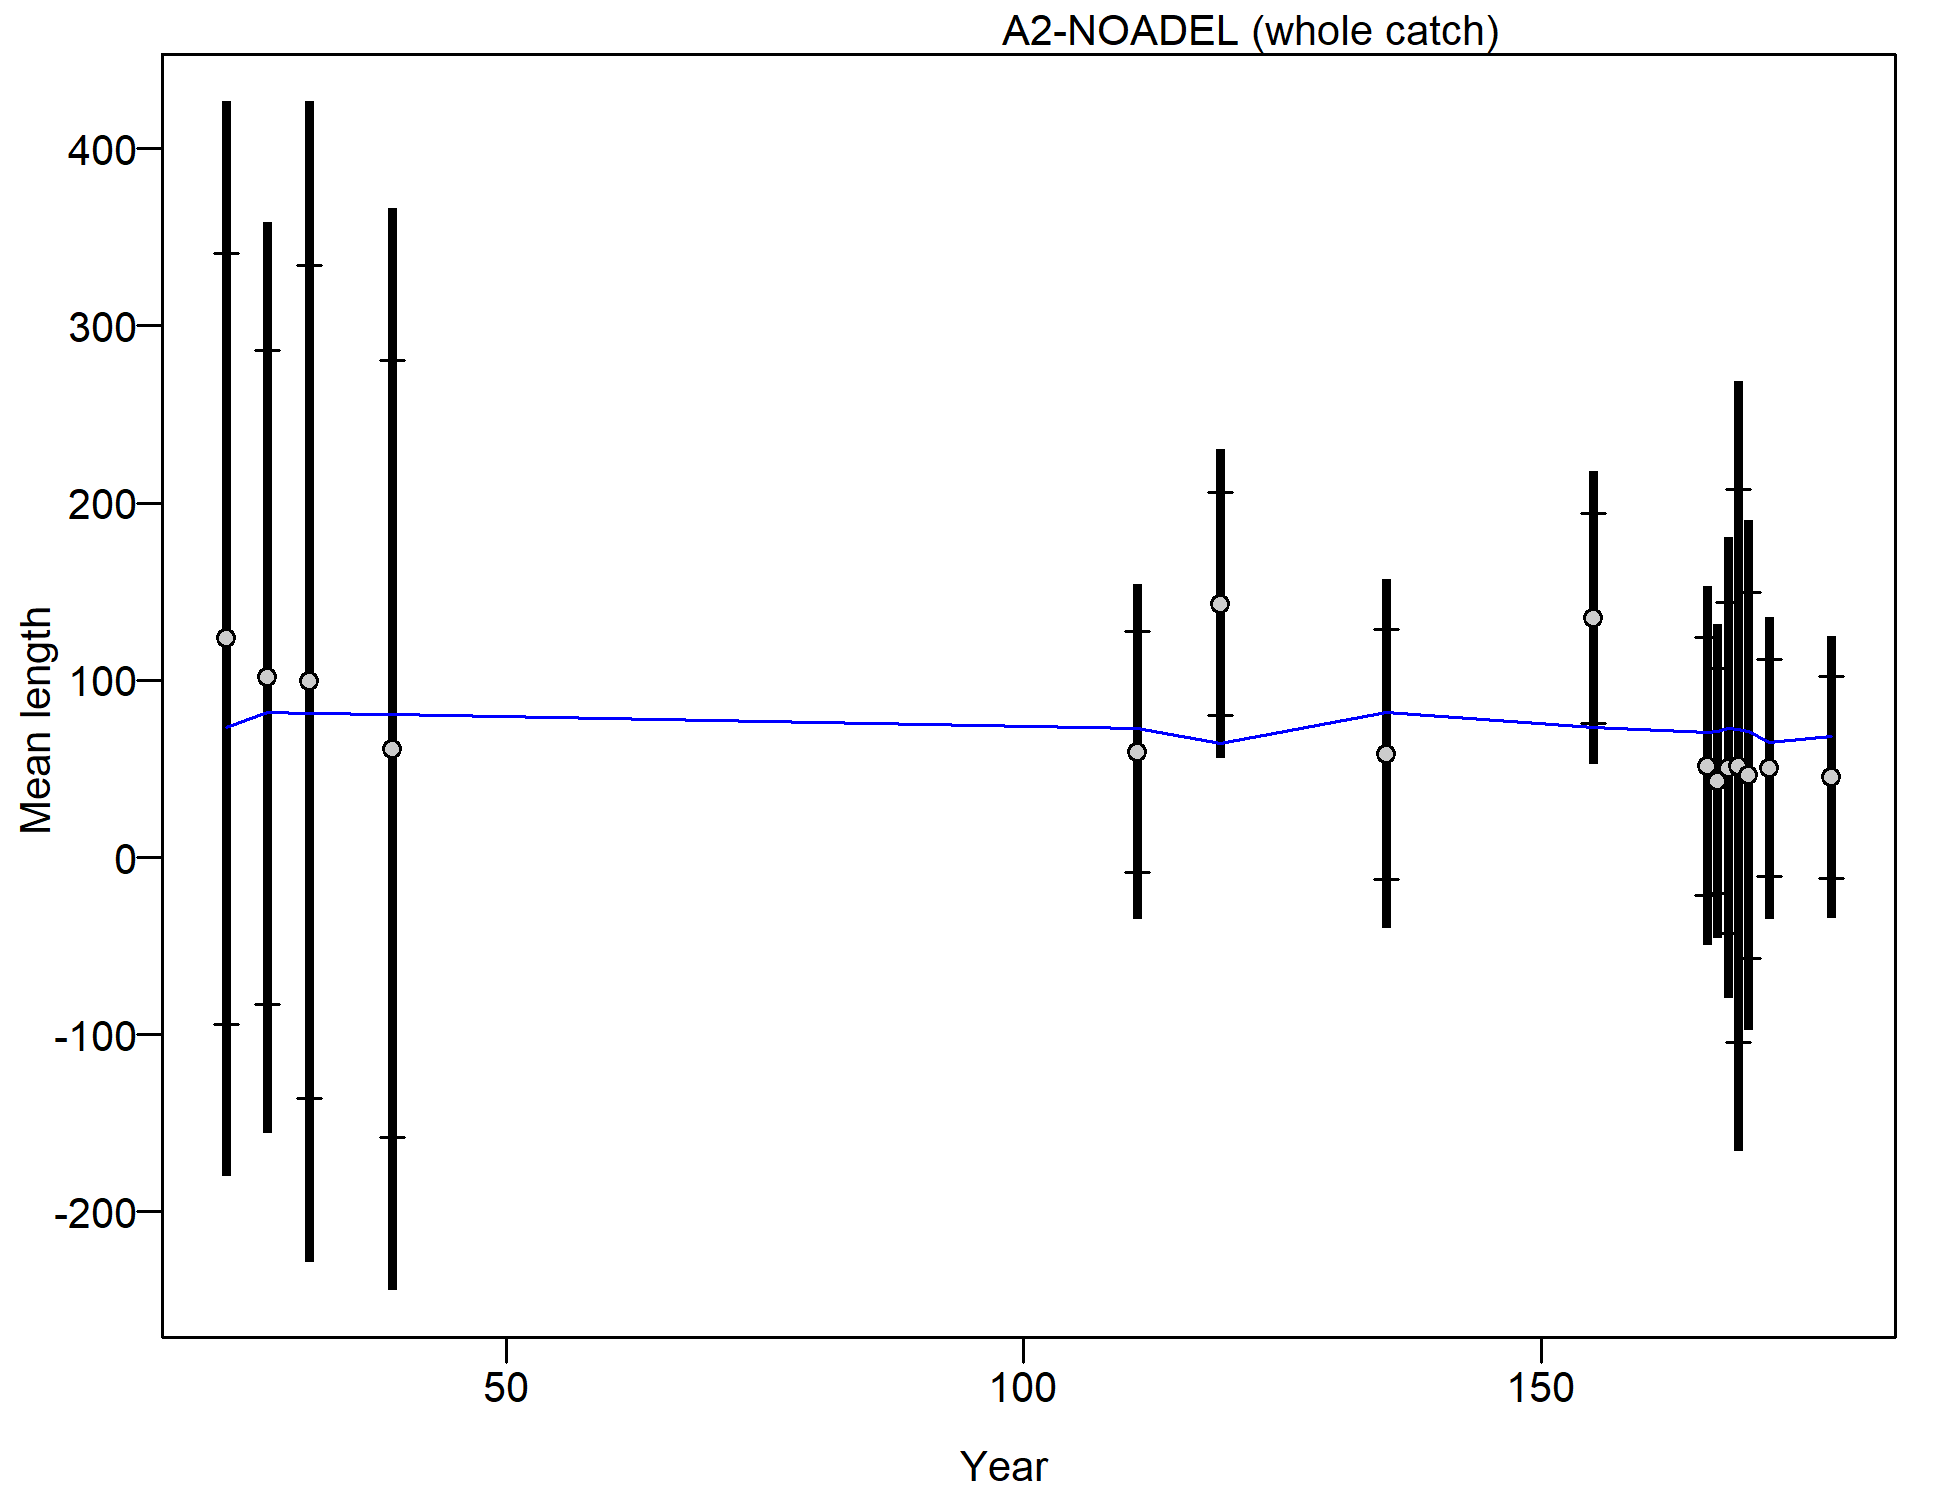
Mean length for A2-LL-n with 95% confidence intervals based on current samples sizes.
Francis data weighting method TA1.8: thinner intervals (with capped ends) show result of further adjusting sample sizes based on suggested multiplier (with 95% interval) for len data from A2-LL-n:
0.9878 (0.7168-1.4652)
For more info, see
Francis, R.I.C.C. (2011). Data weighting in statistical fisheries stock assessment models. Can. J. Fish. Aquat. Sci. 68: 1124-1138. https://doi.org/10.1139/f2011-025
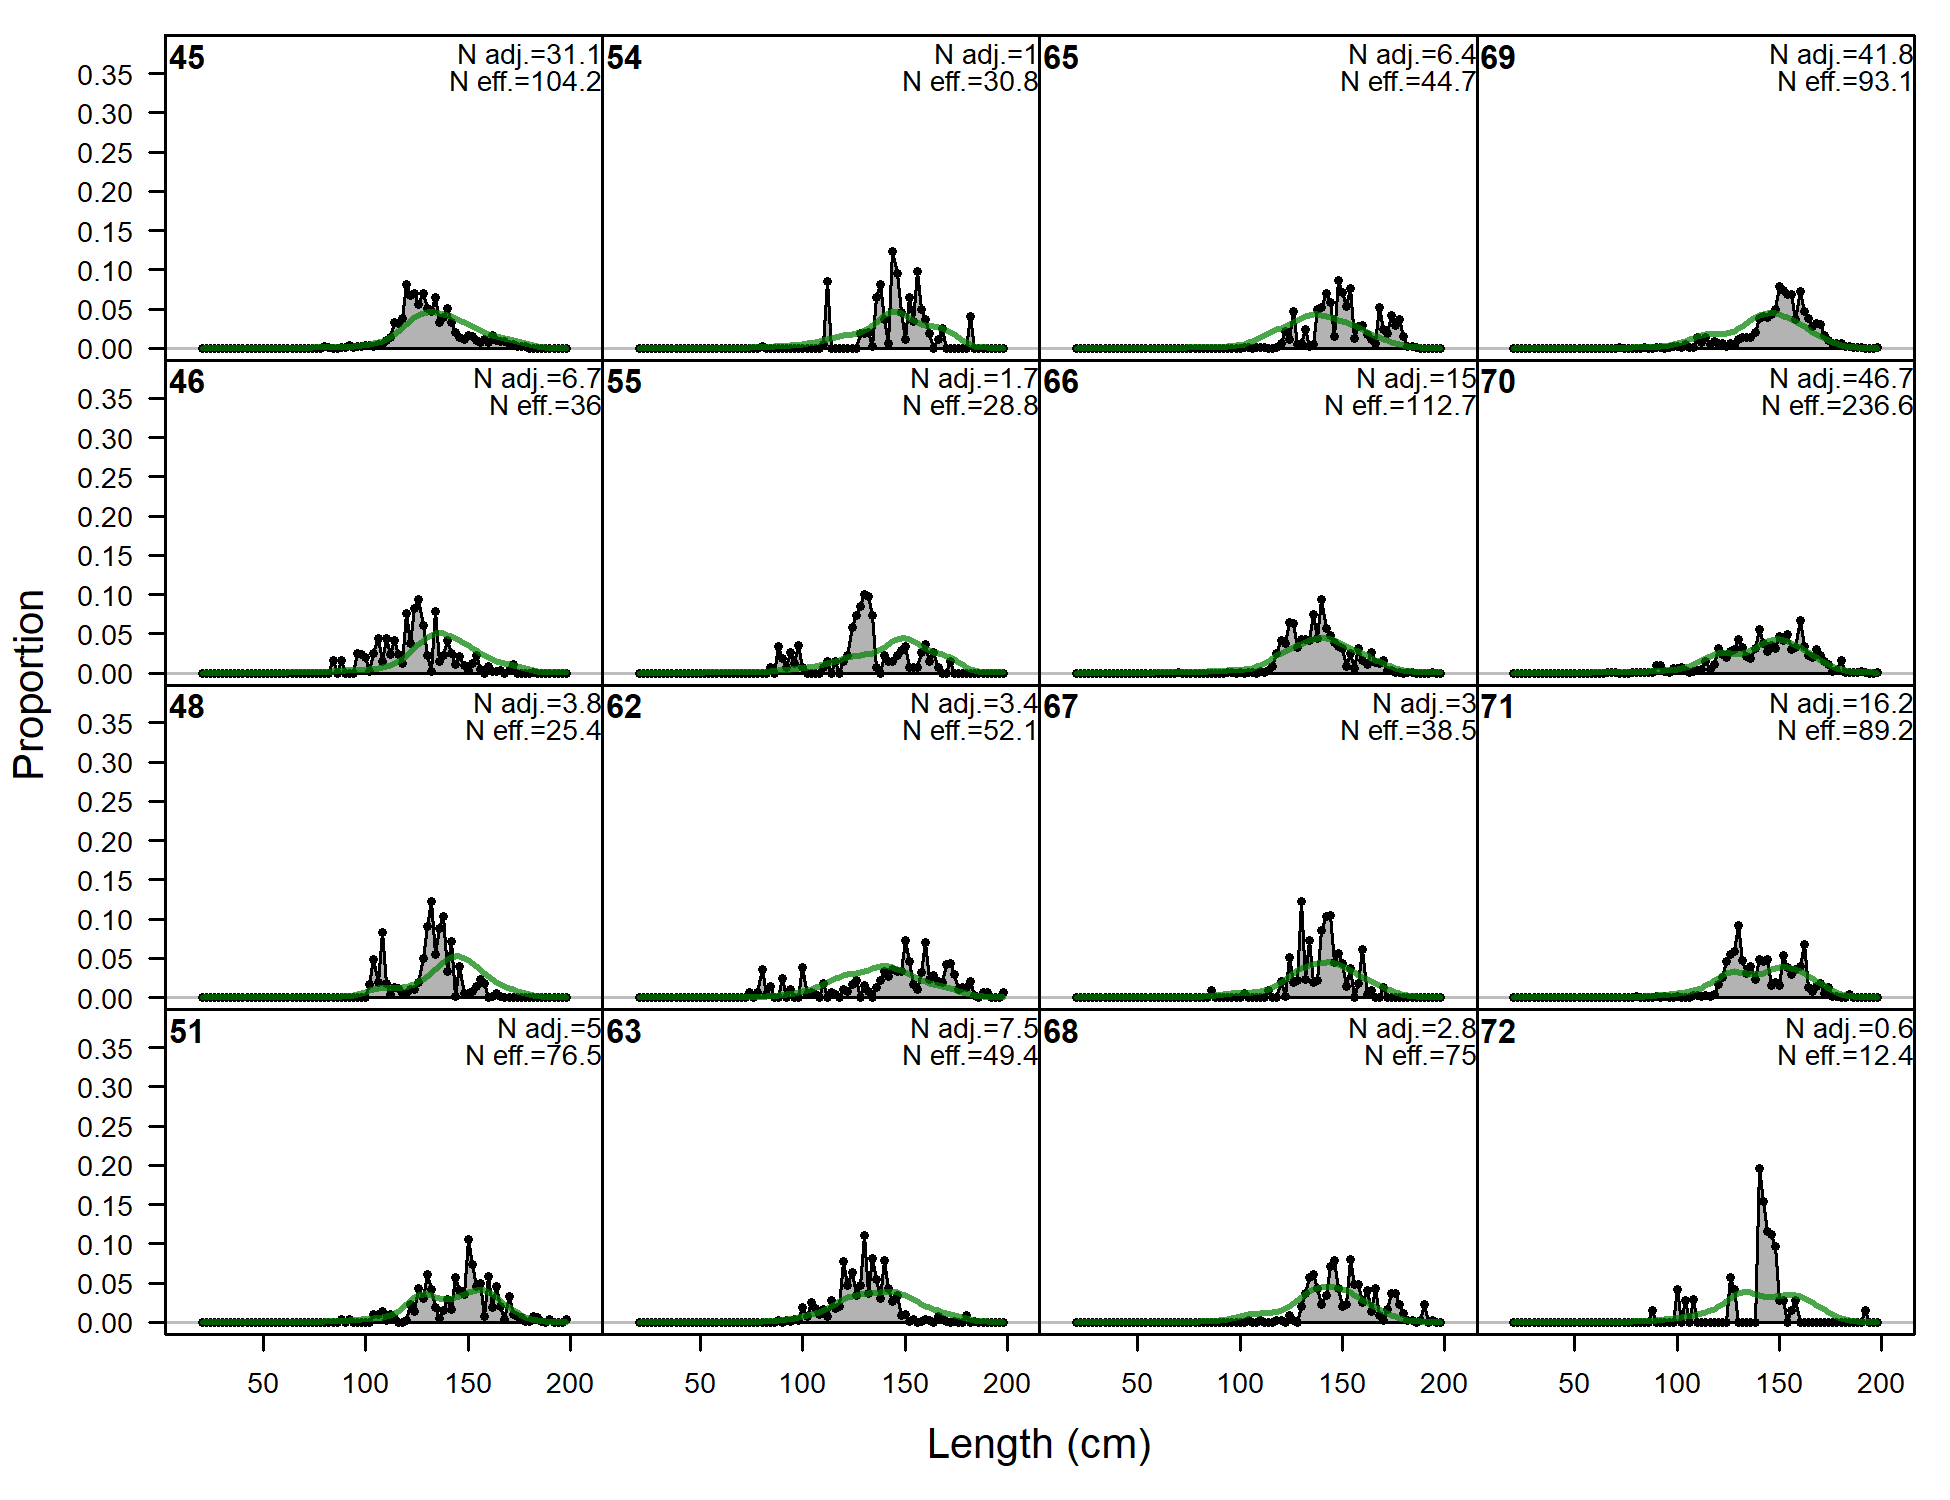
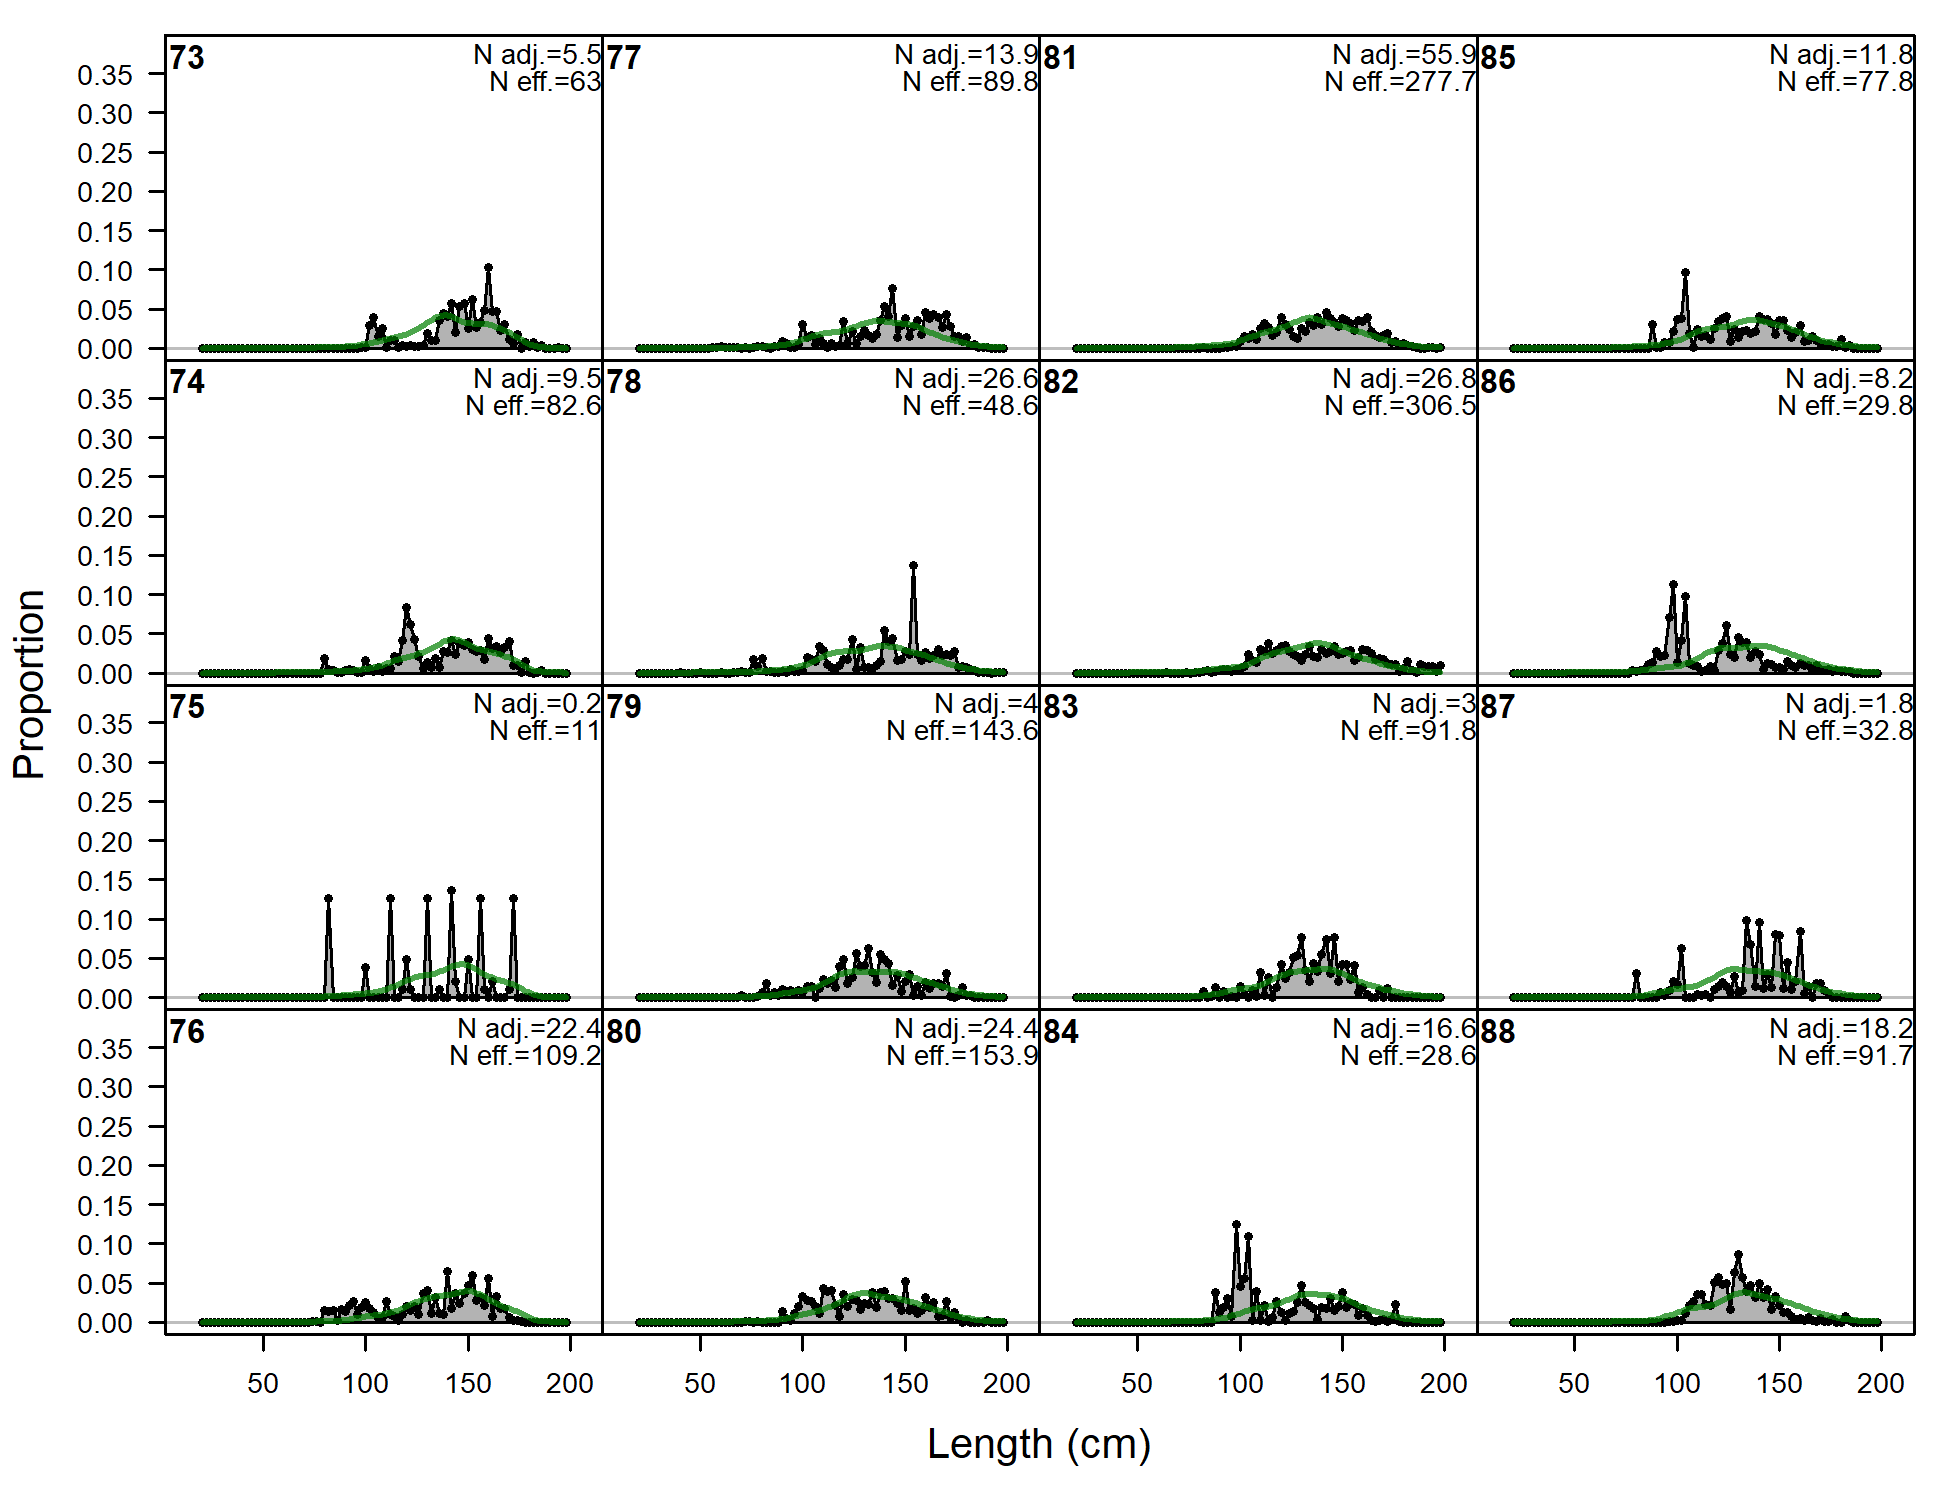
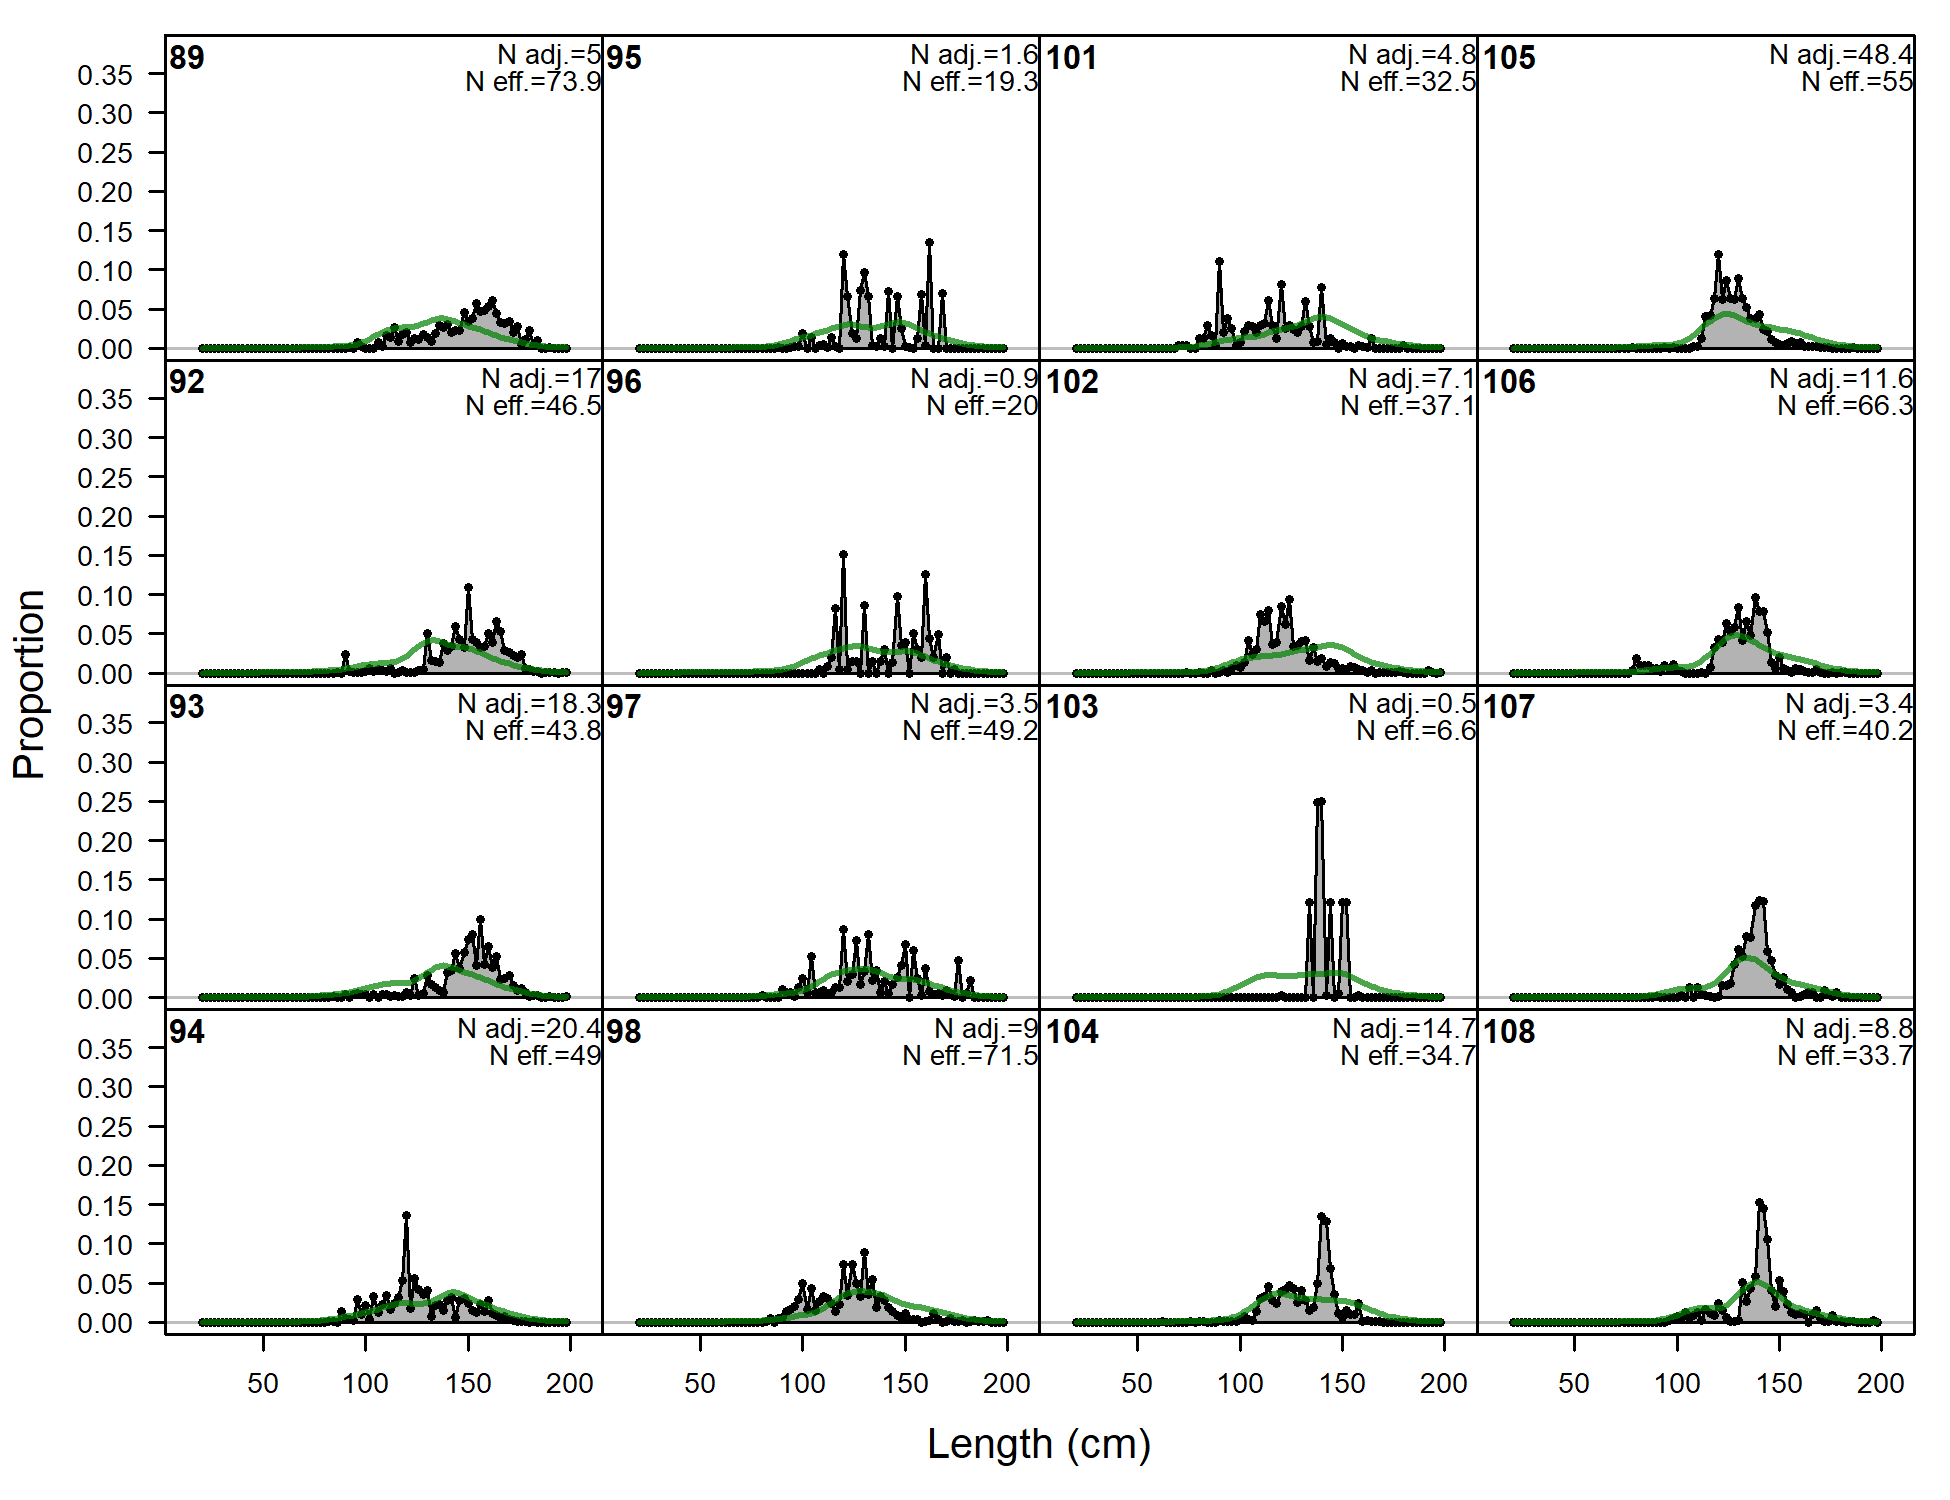
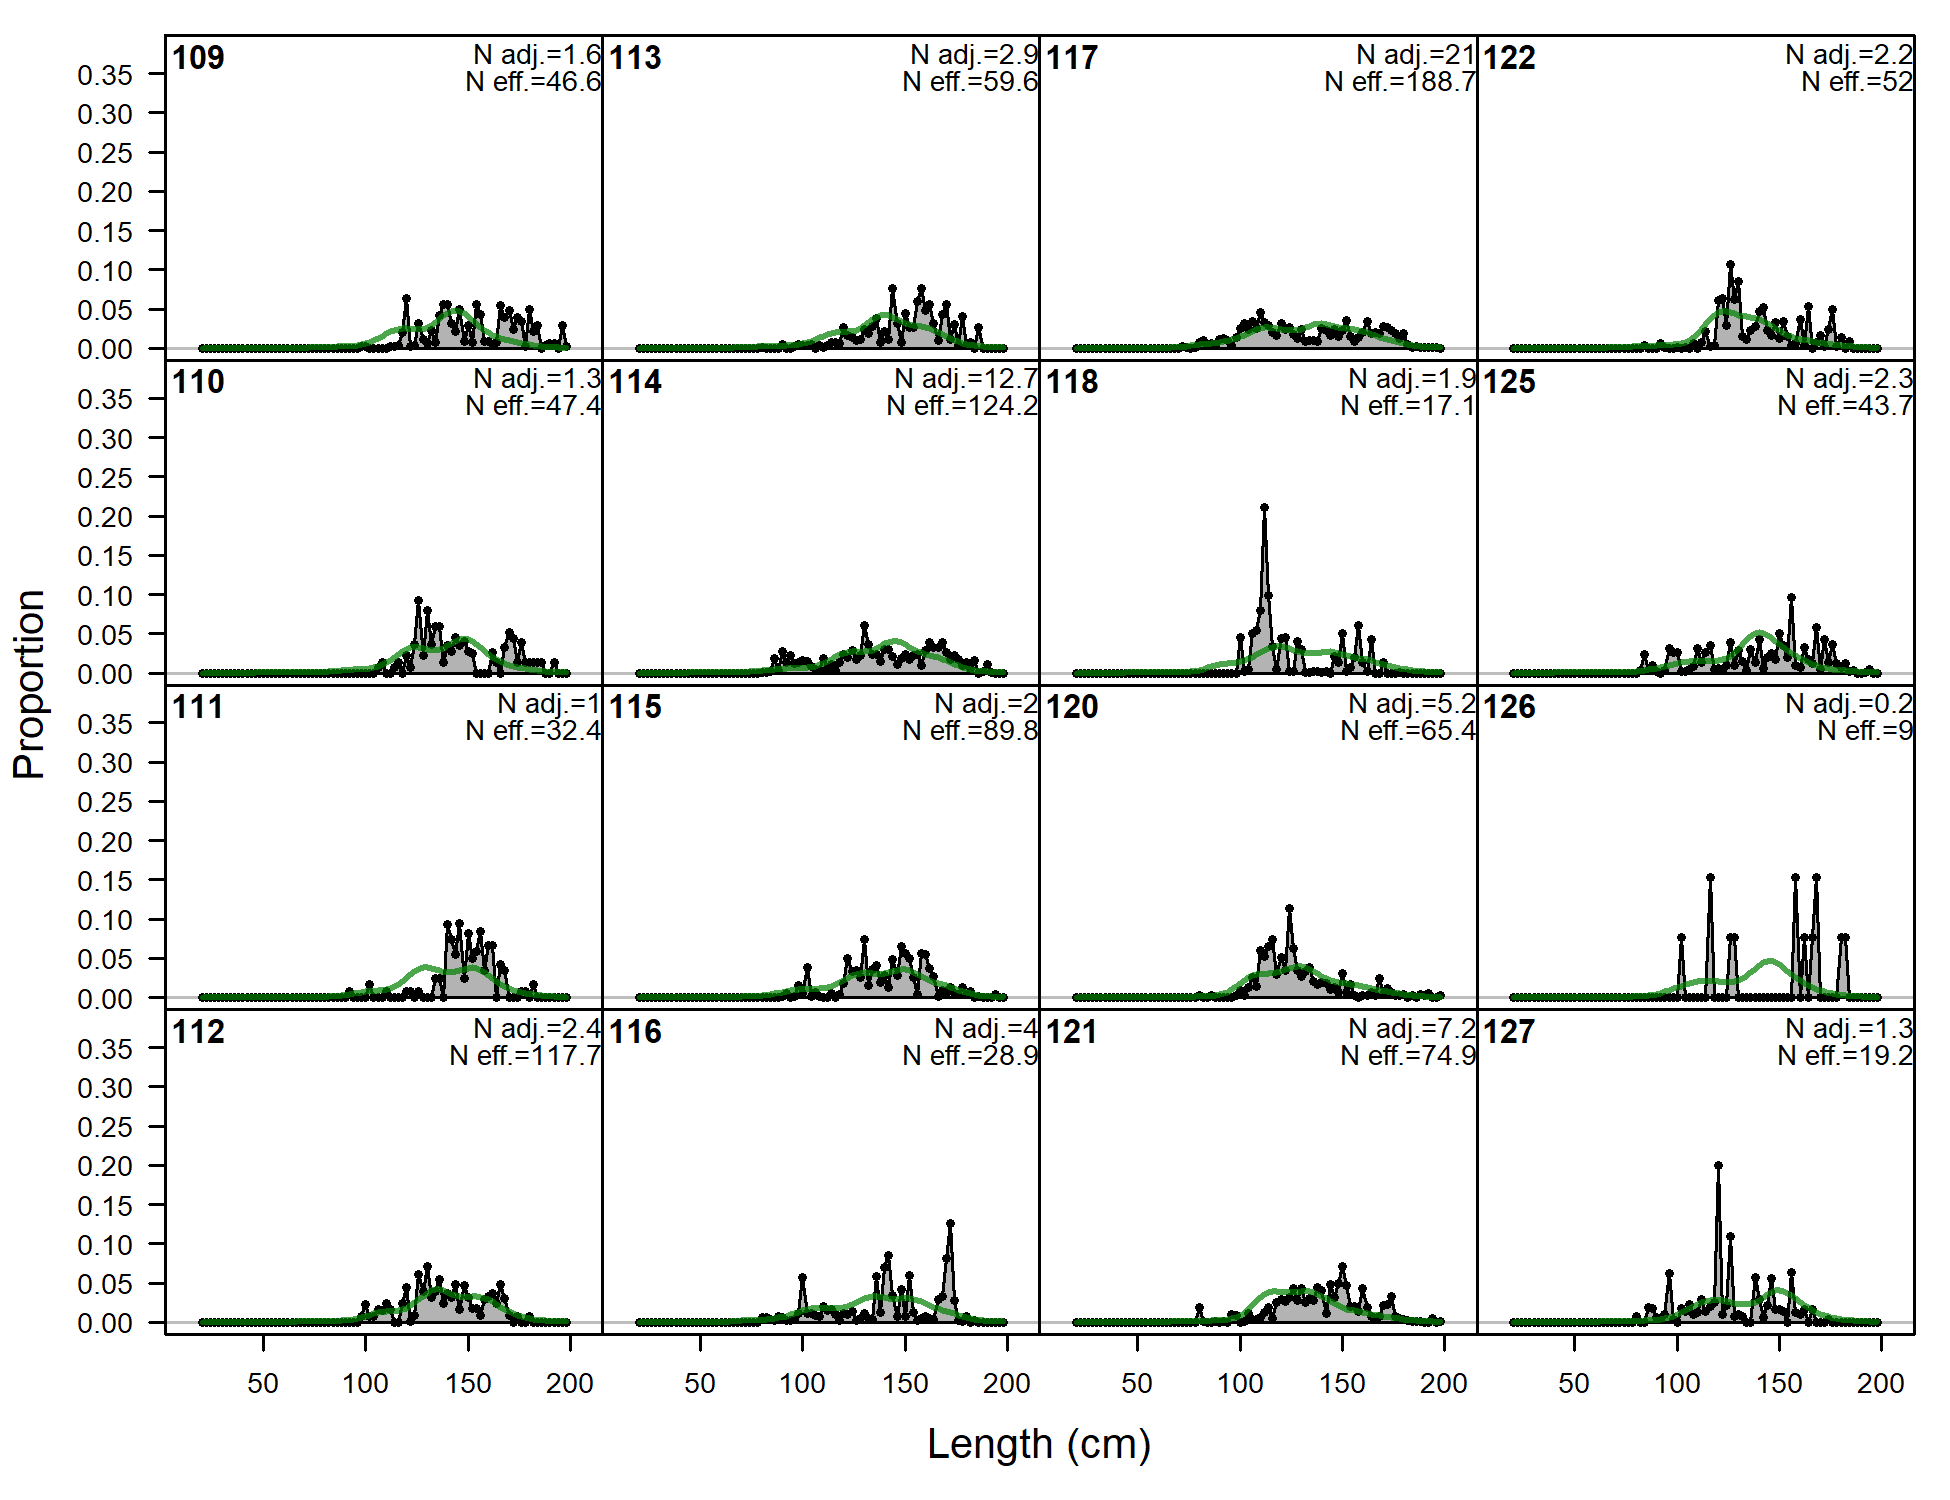
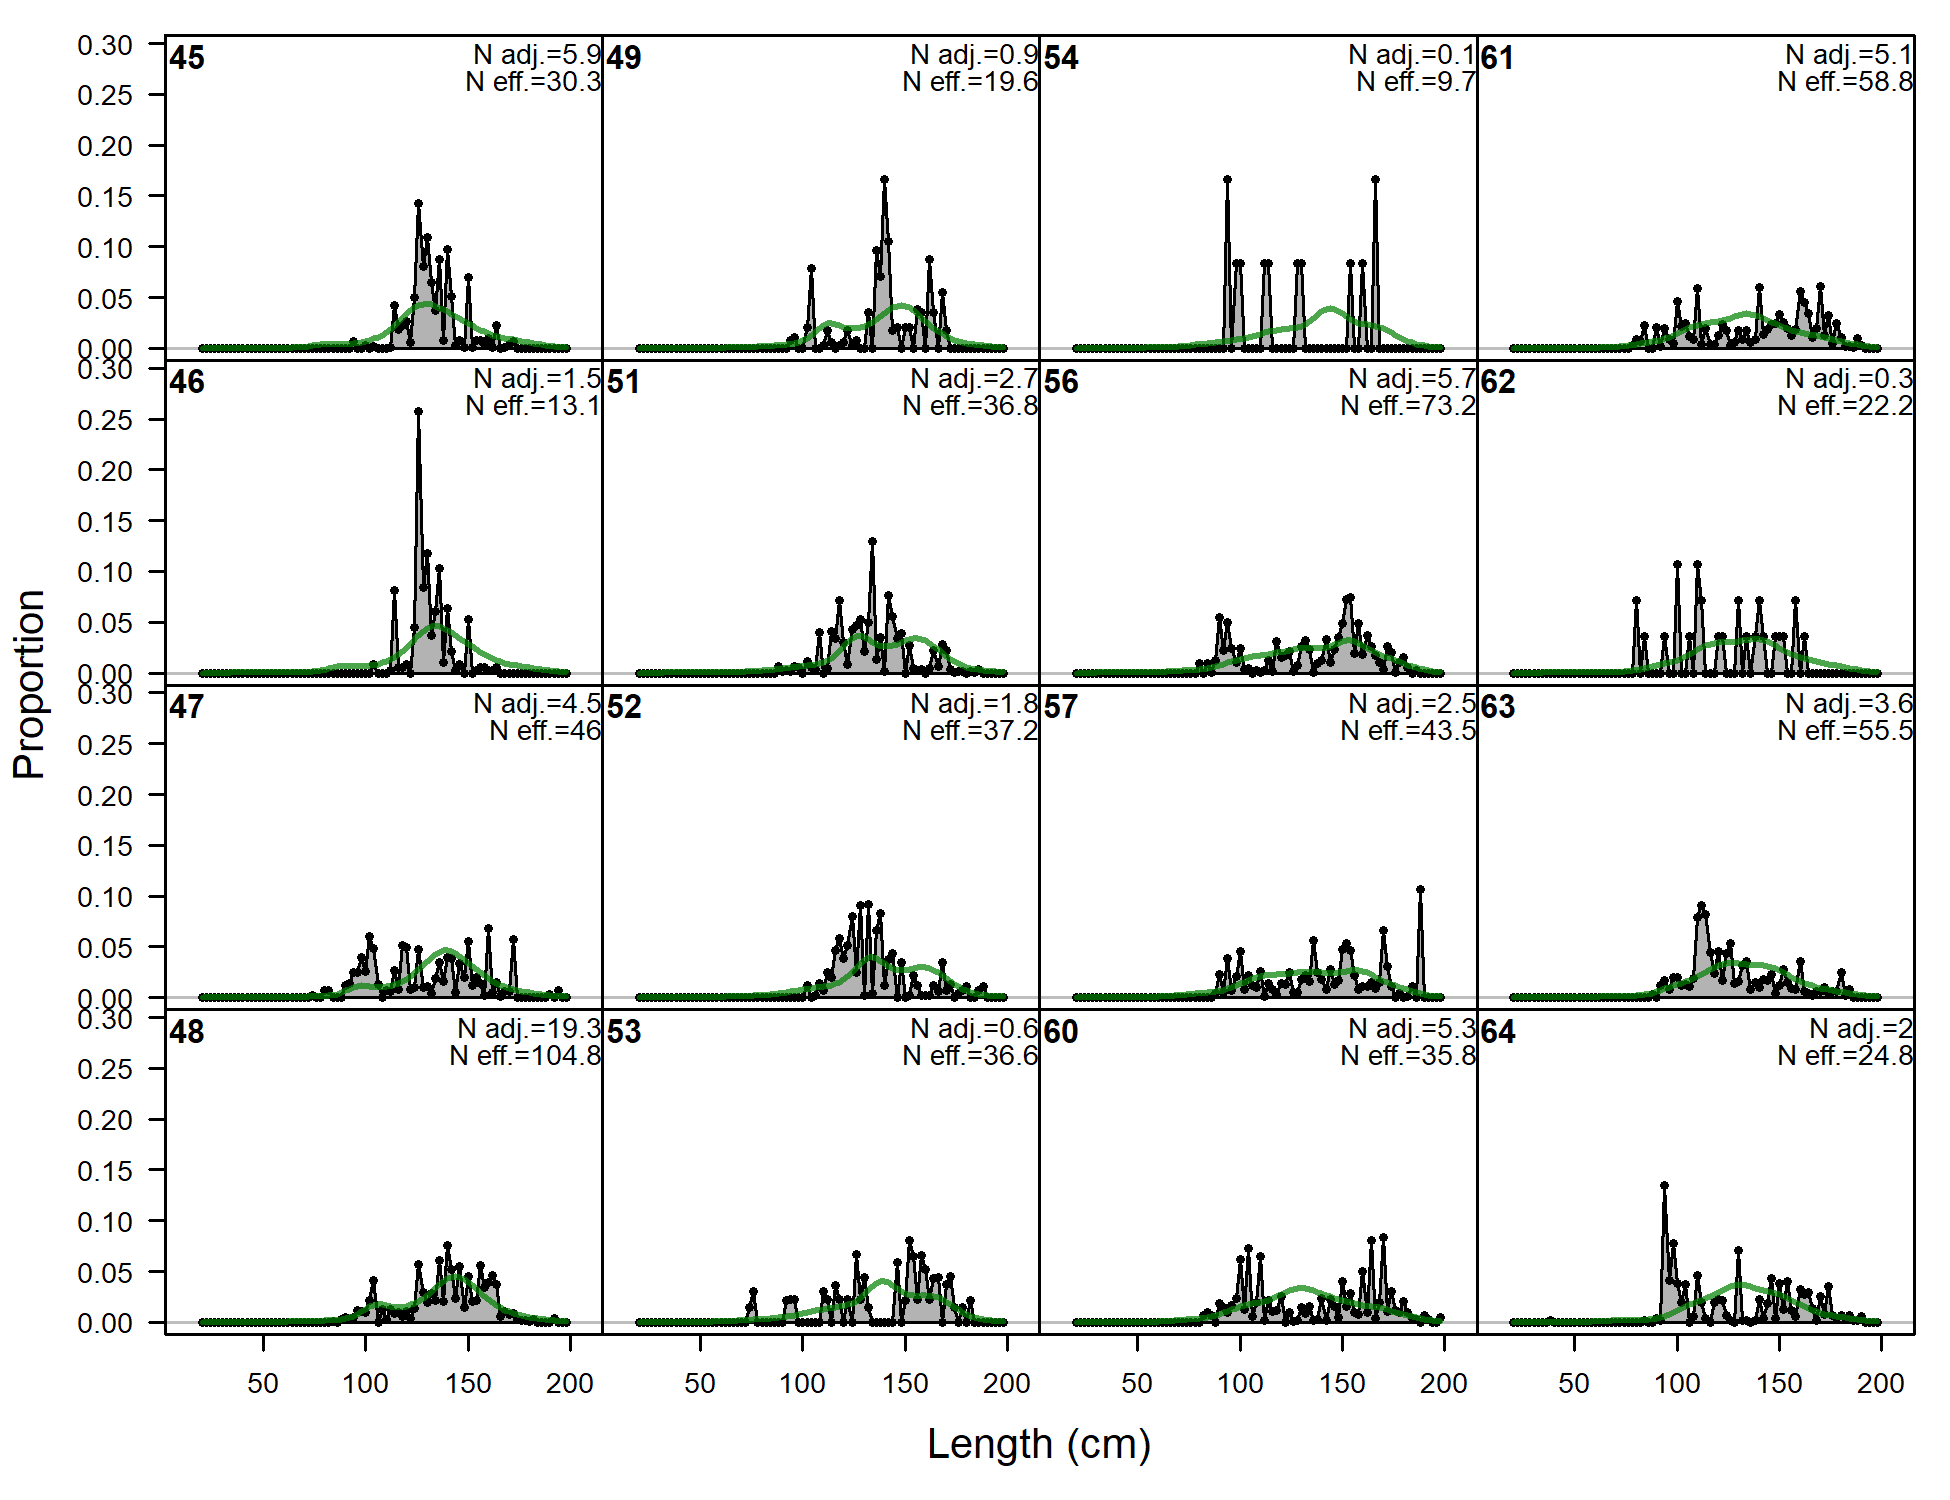
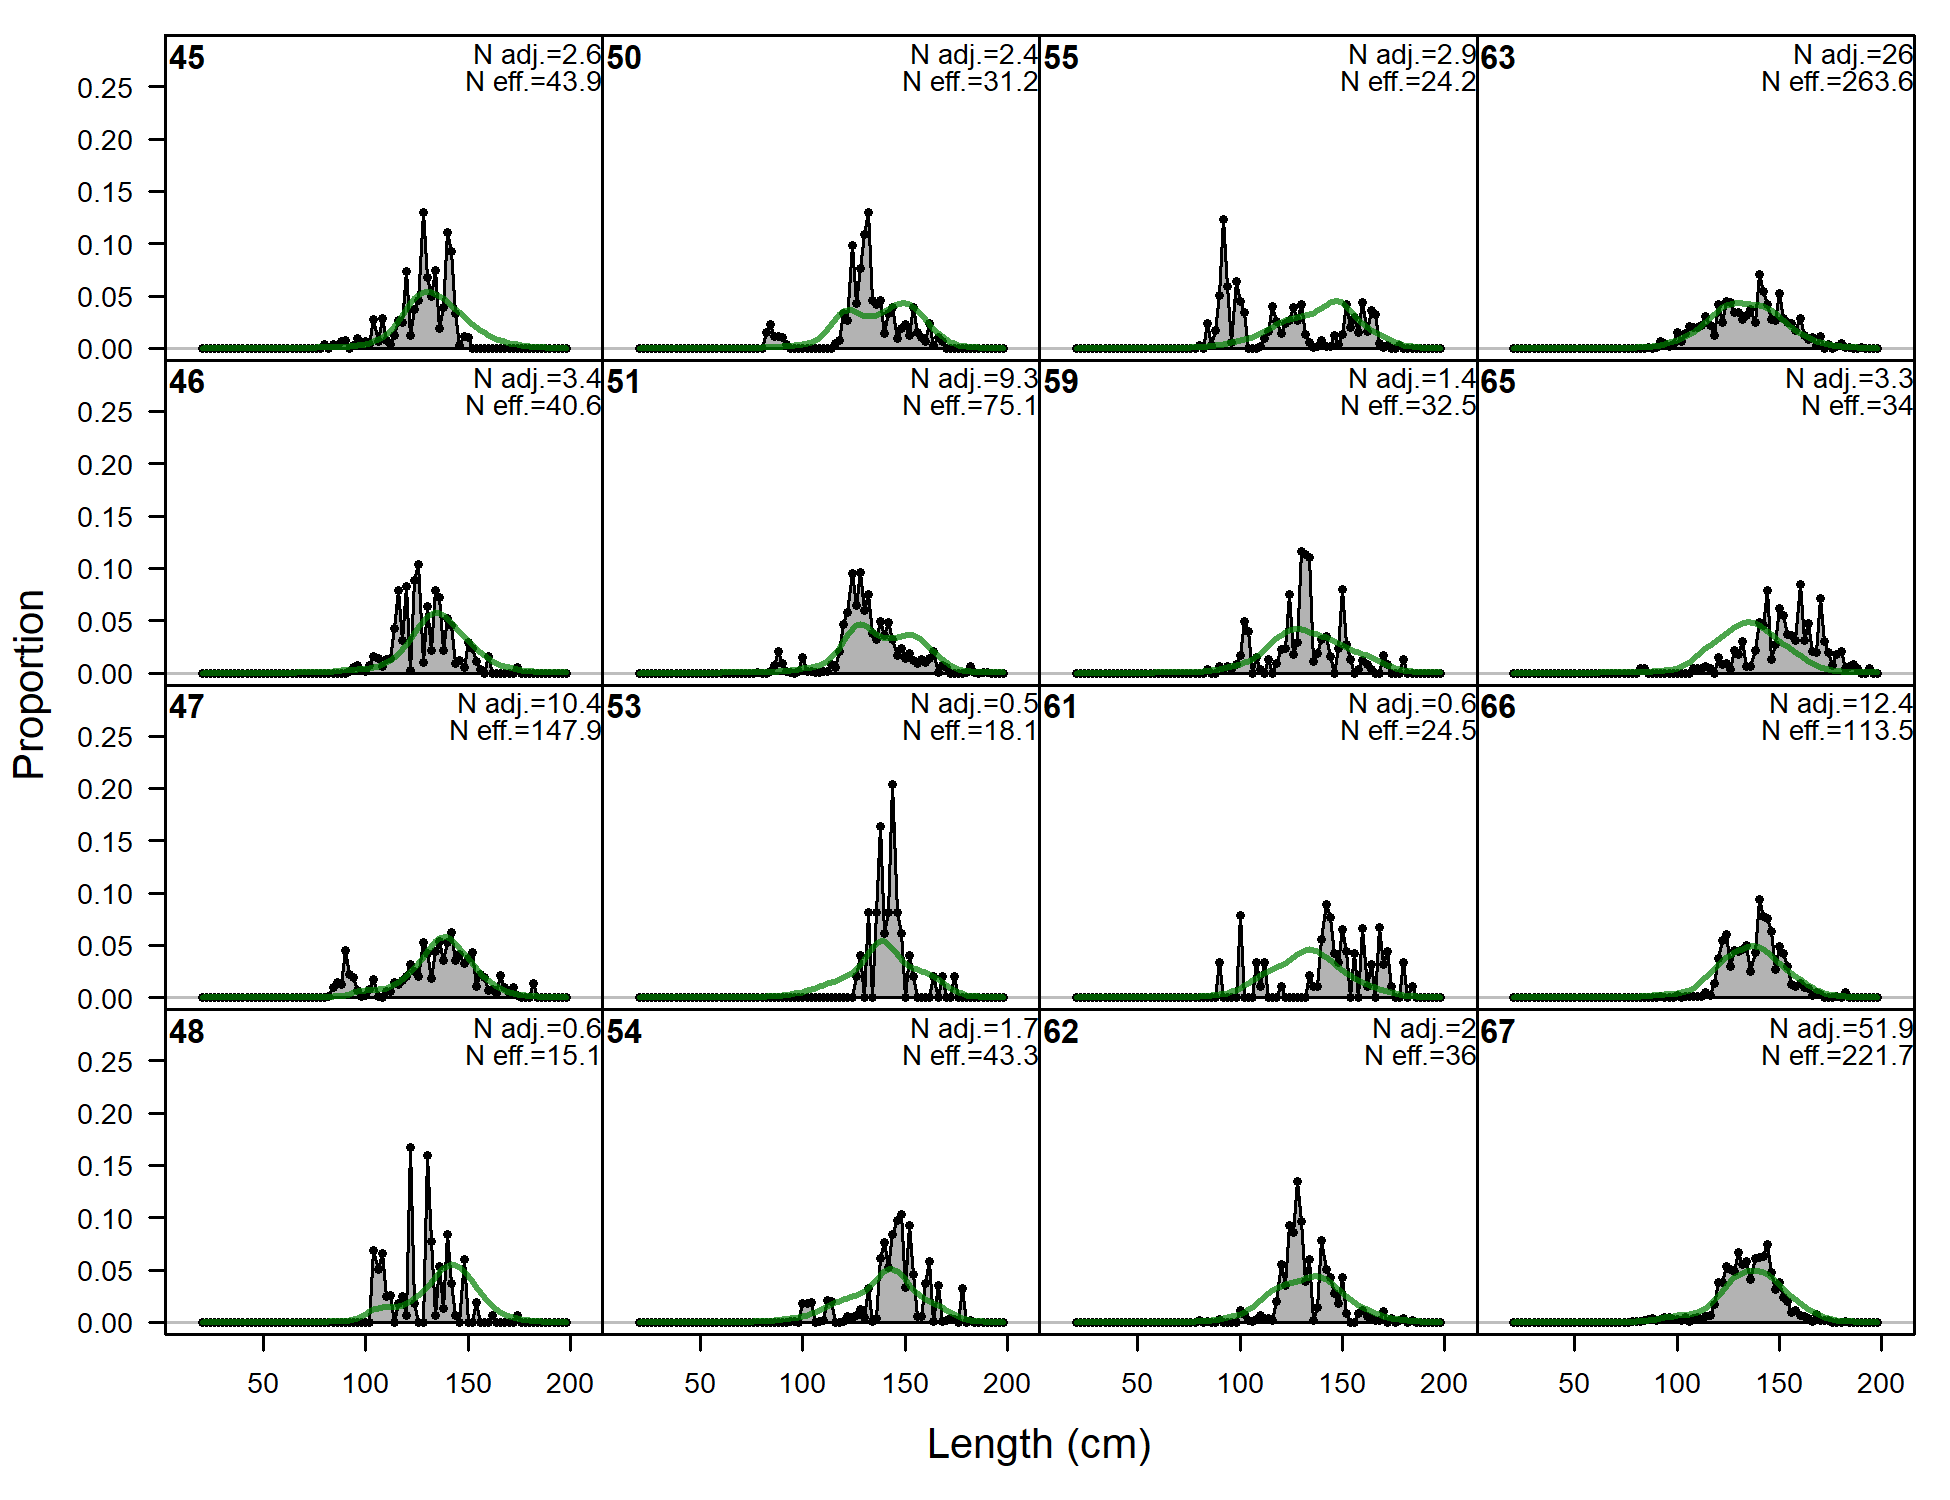
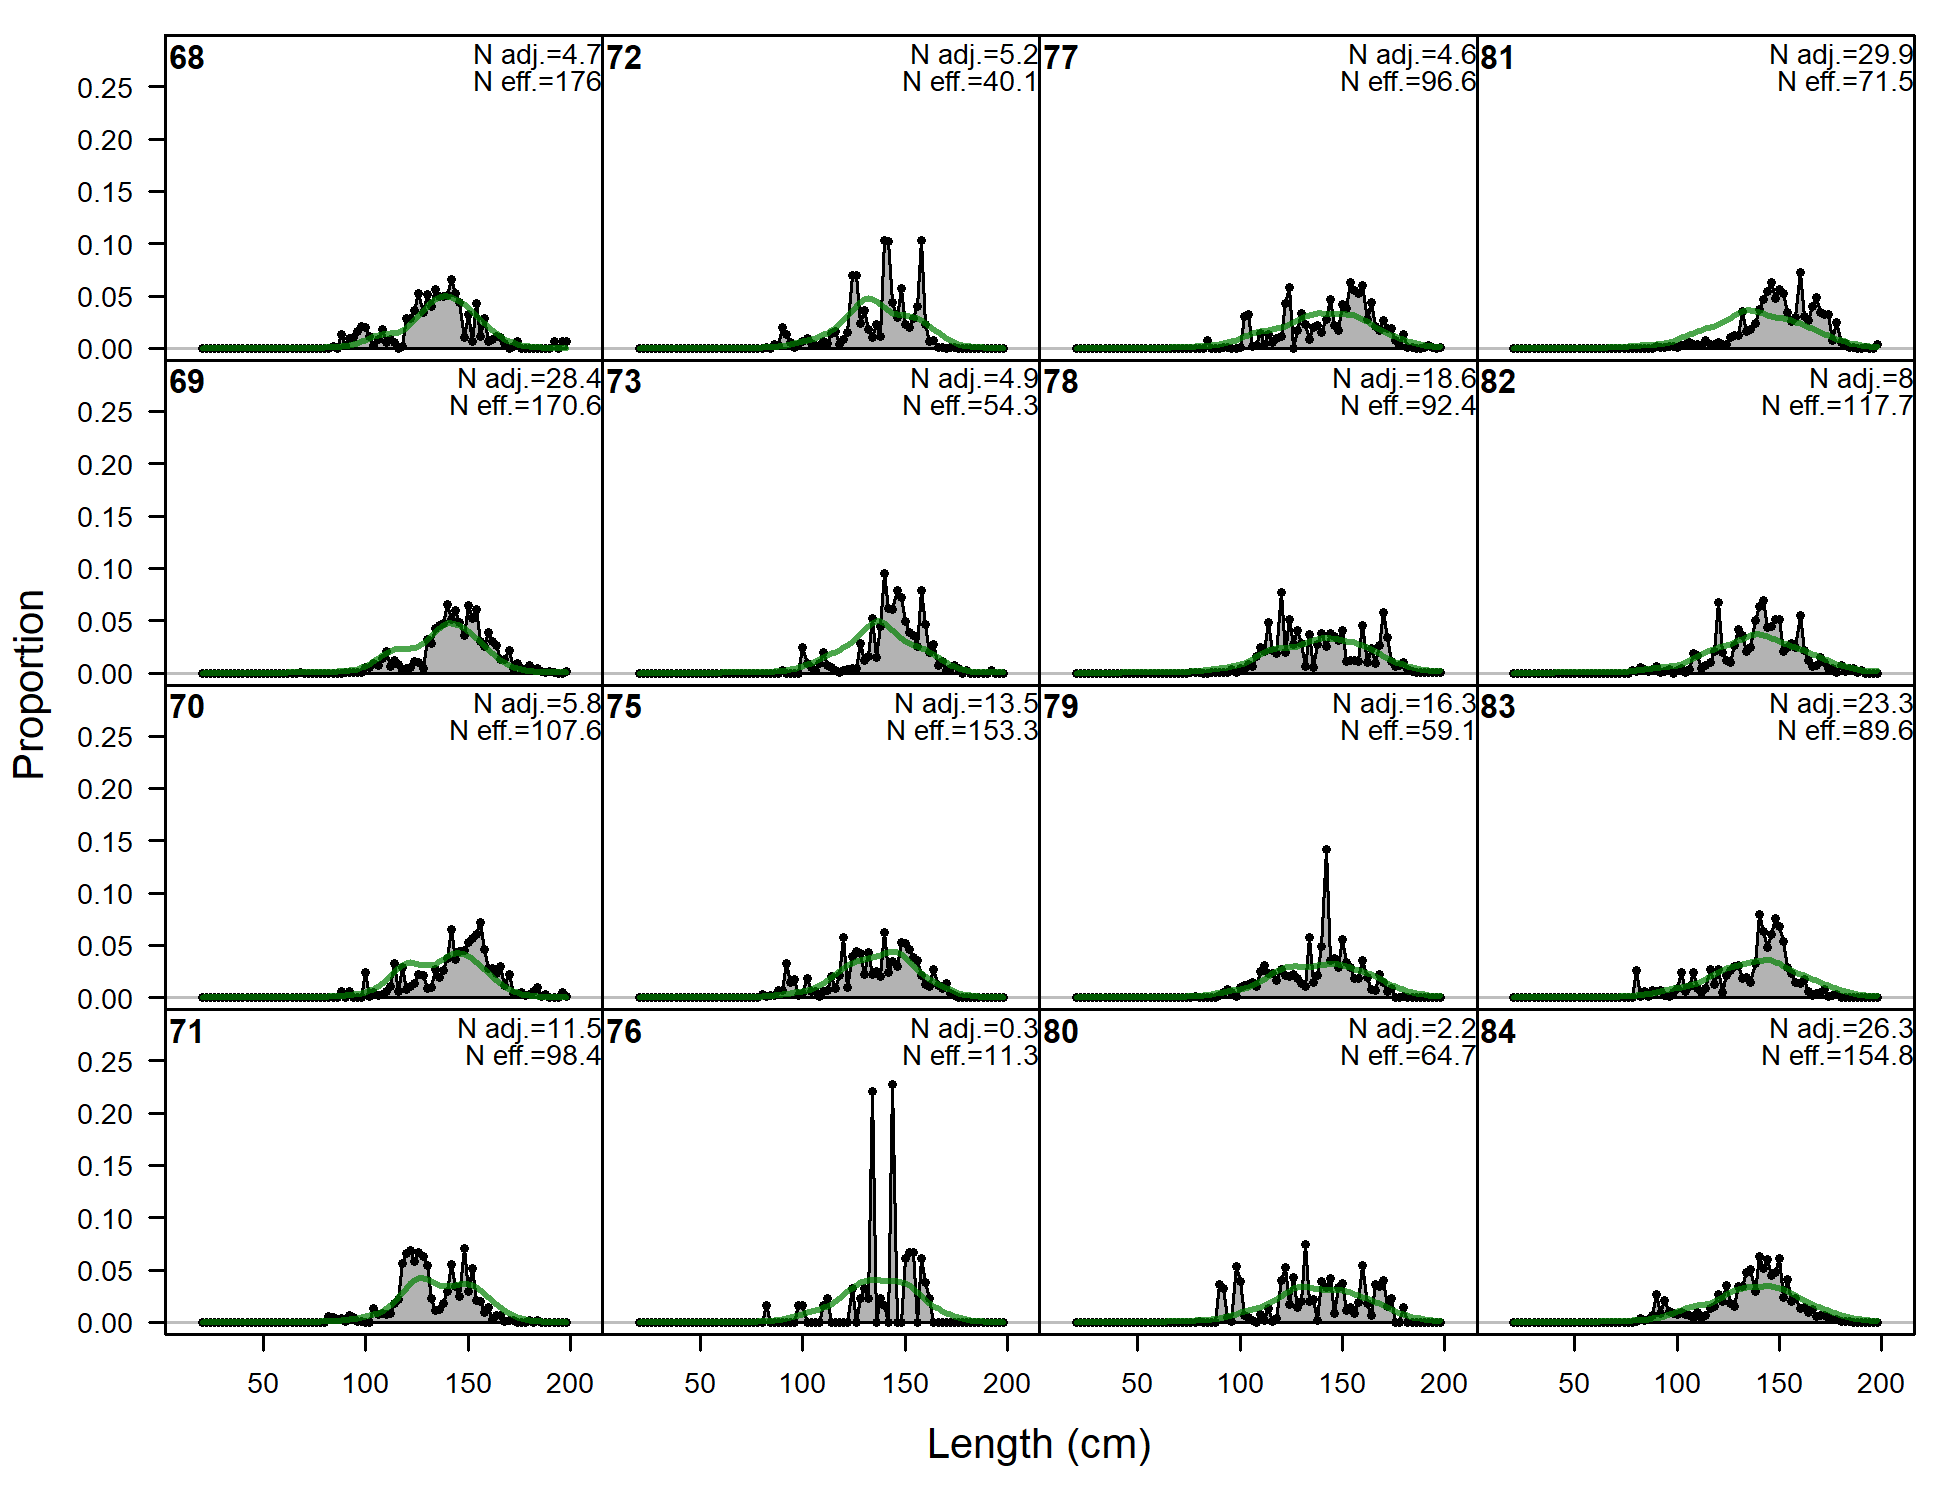
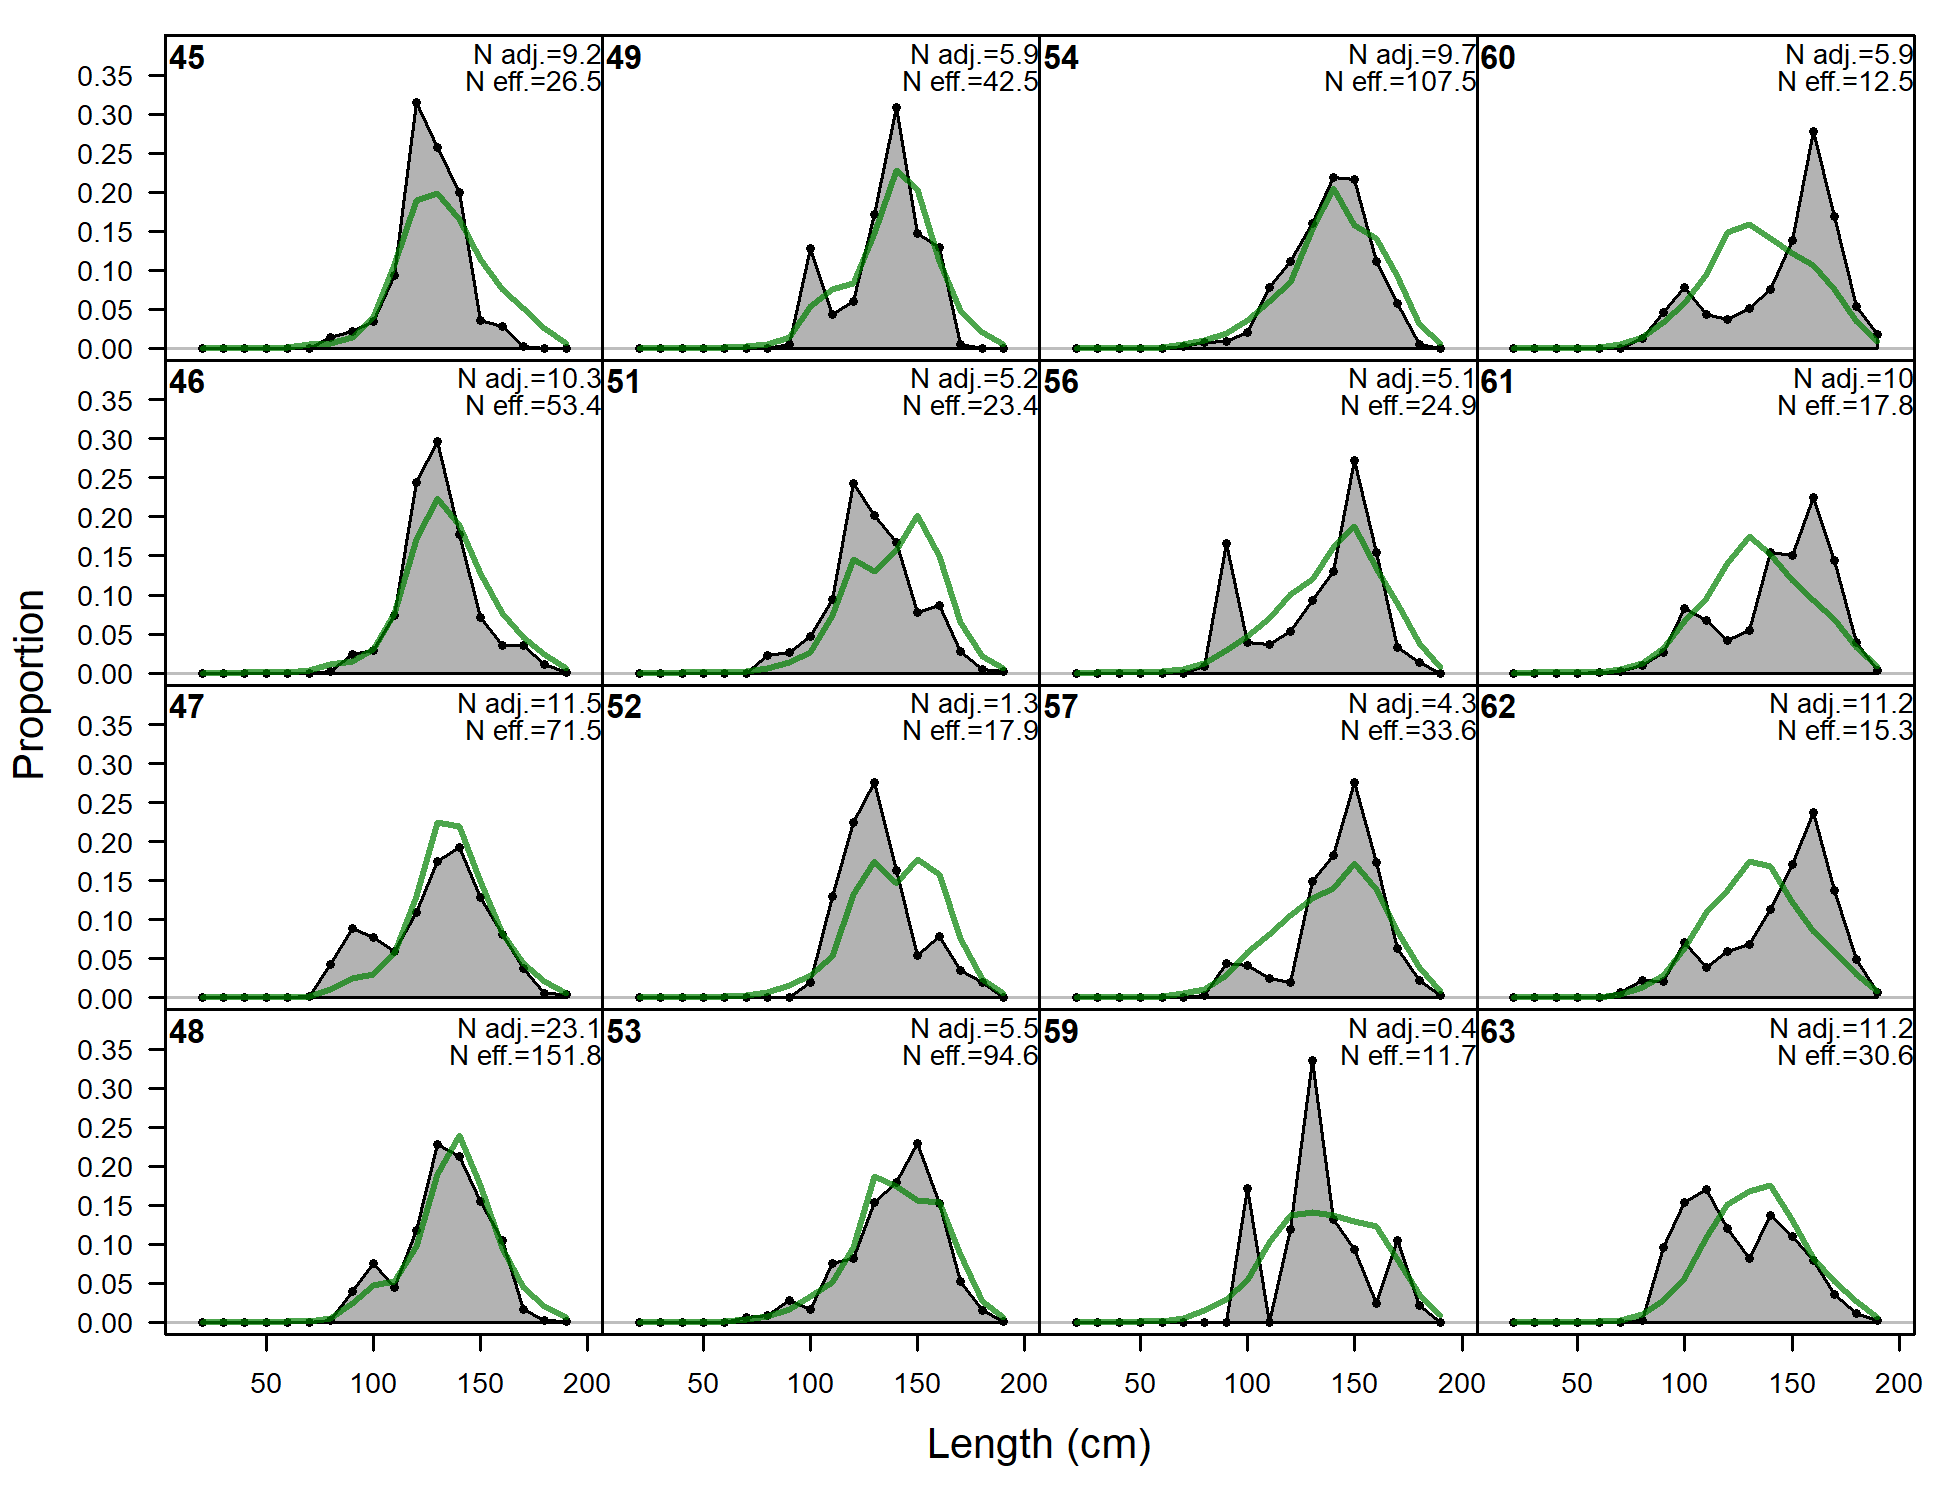
Length comps, whole catch, A3-LL-n (plot 1 of 6).
'N adj.' is the input sample size after data-weighting adjustment. N eff. is the calculated effective sample size used in the McAllister-Iannelli tuning method.
file: comp_lenfit_flt3mkt0_page1.png
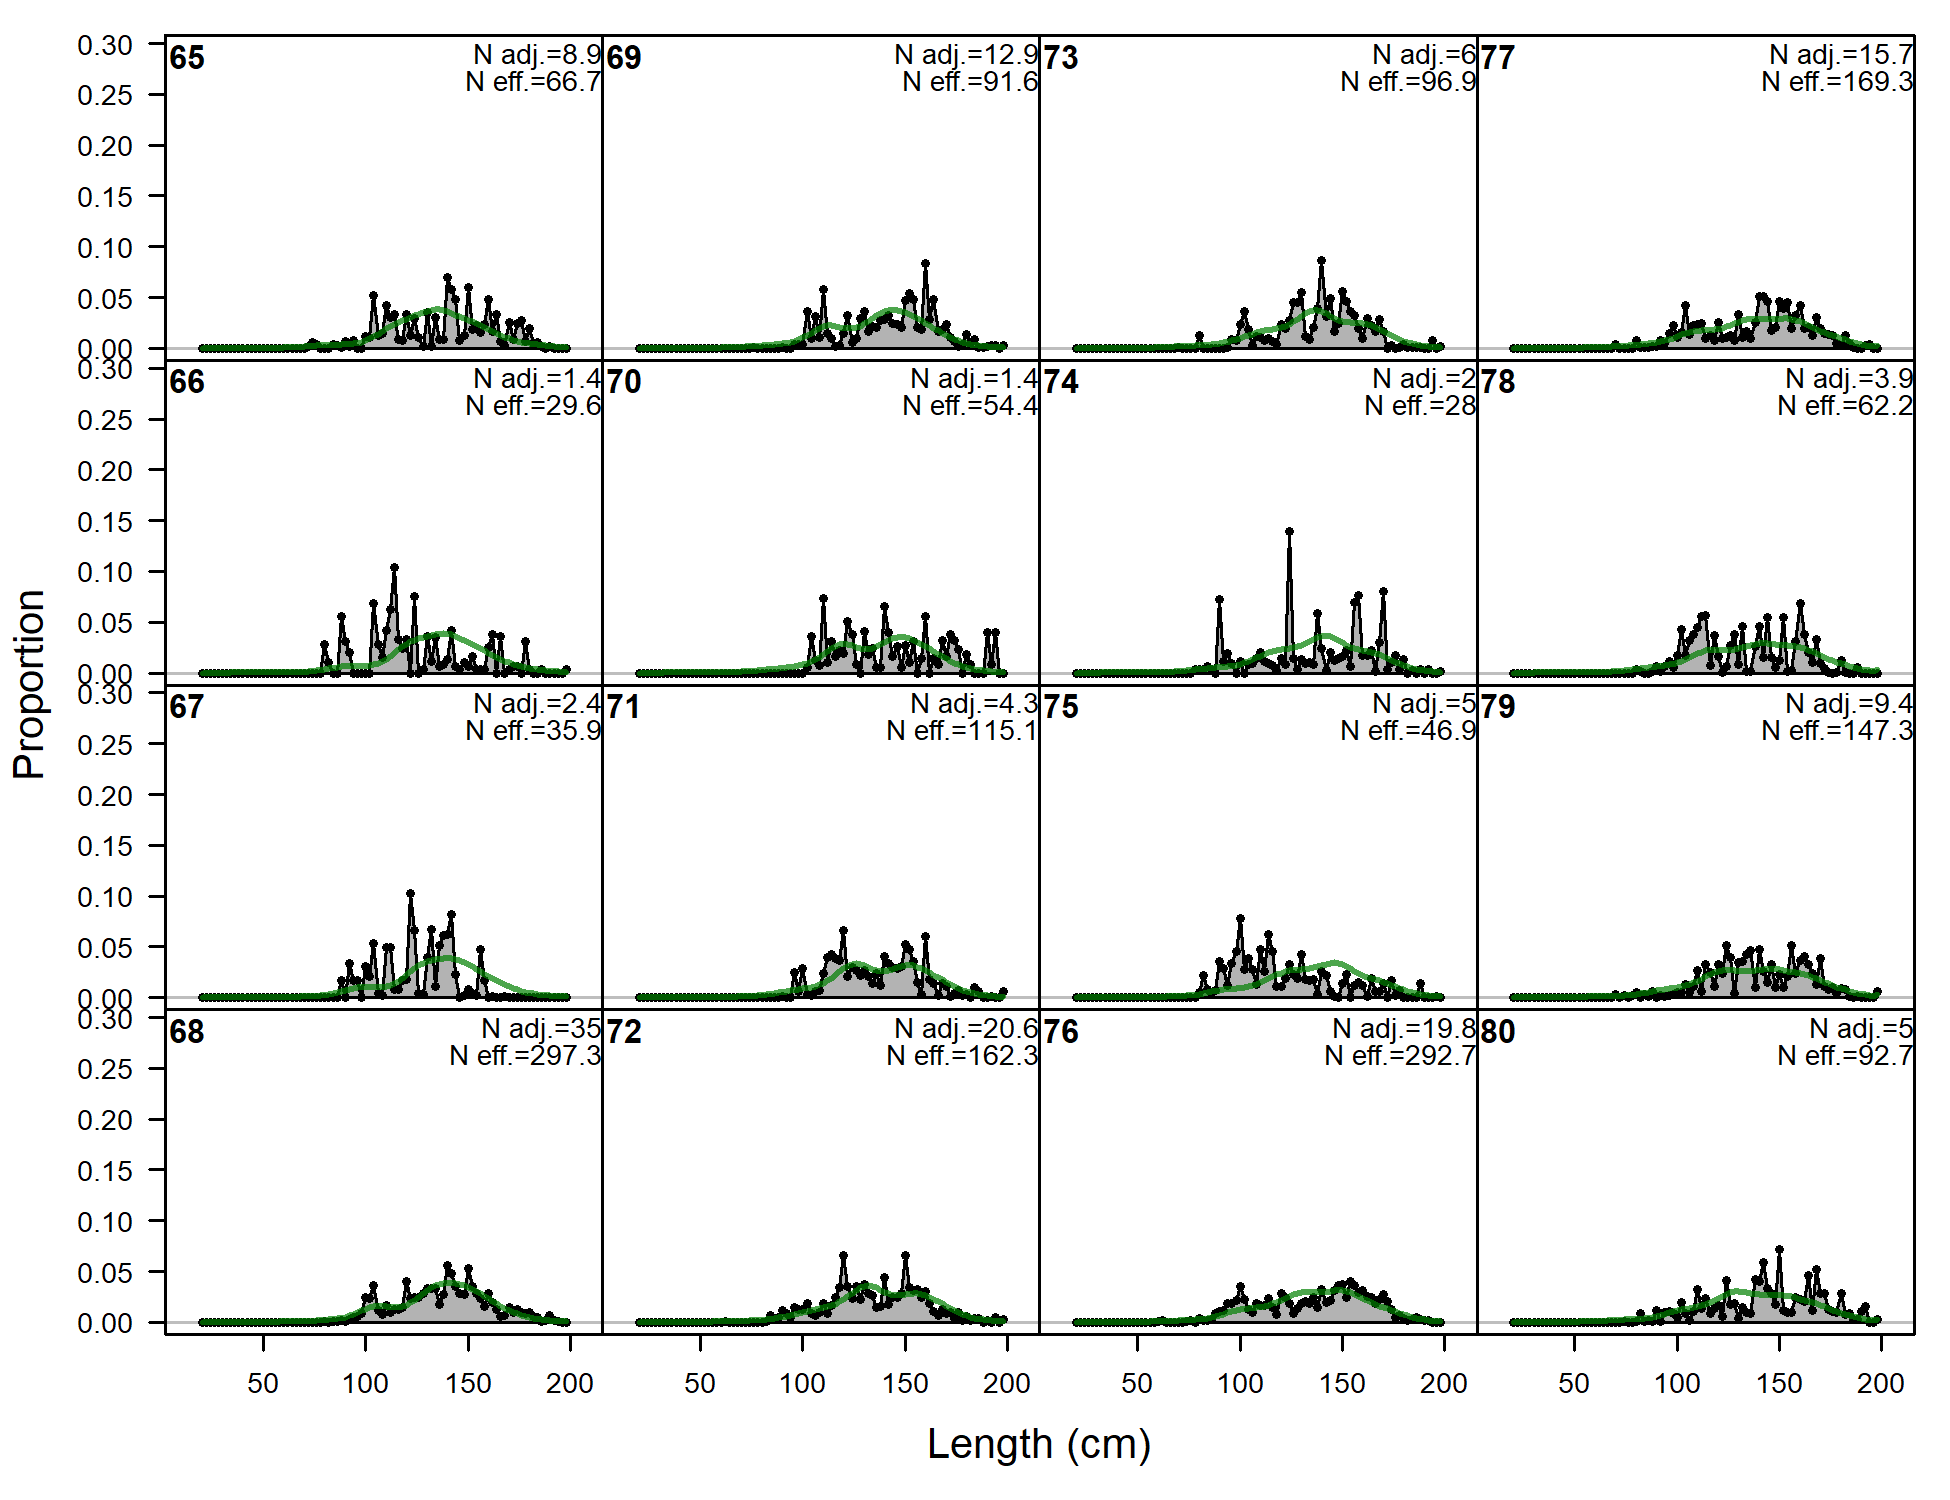
Length comps, whole catch, A3-LL-n (plot 2 of 6)
file: comp_lenfit_flt3mkt0_page2.png
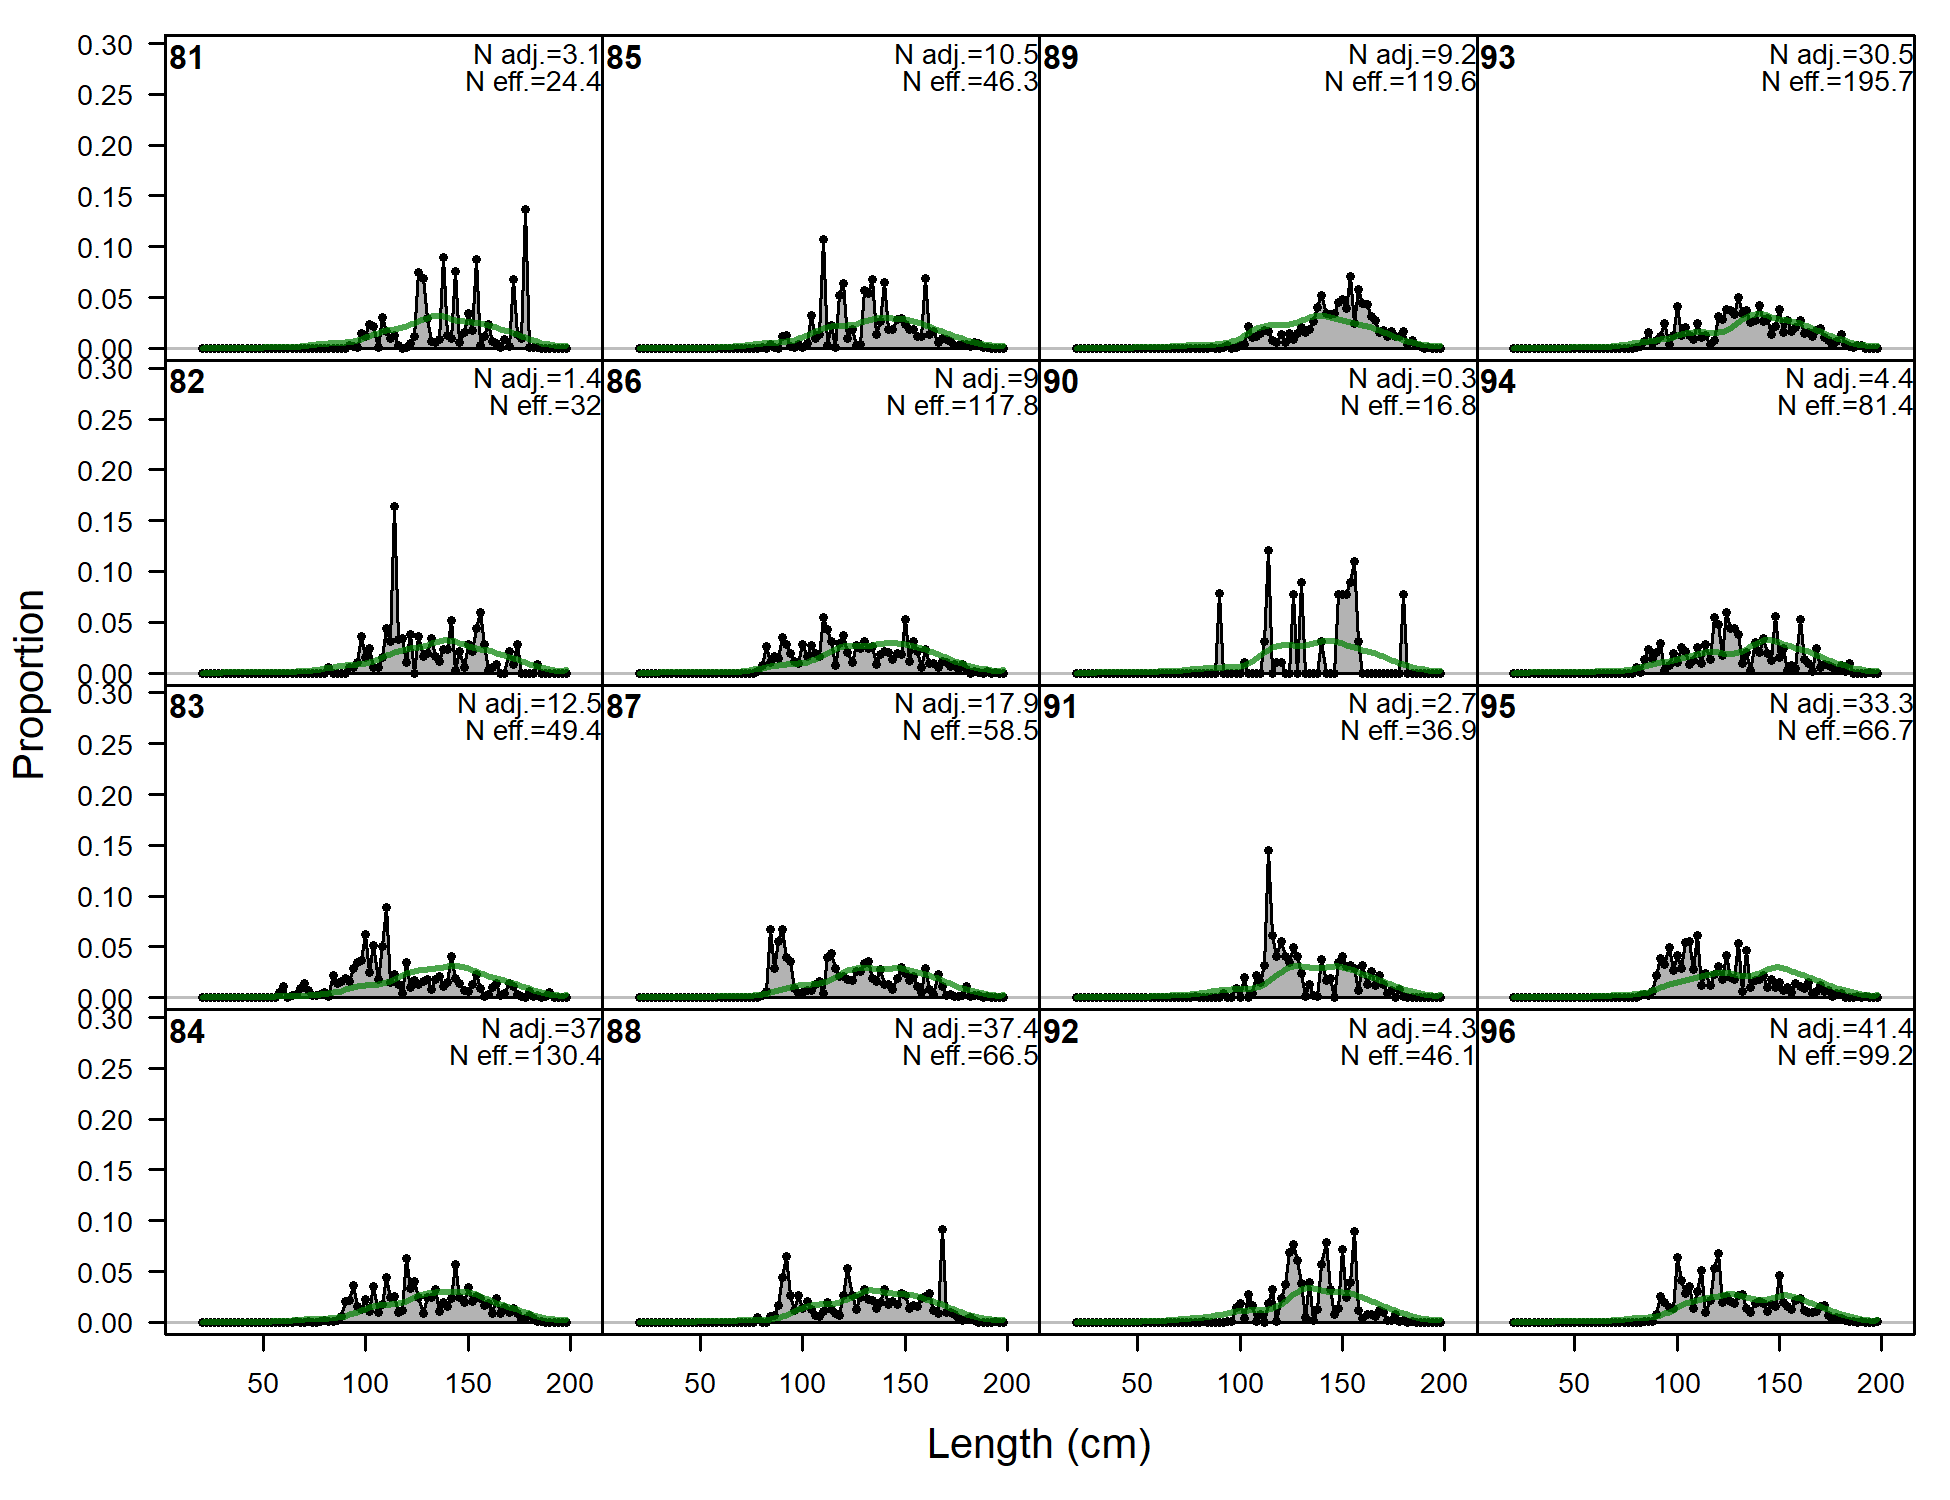
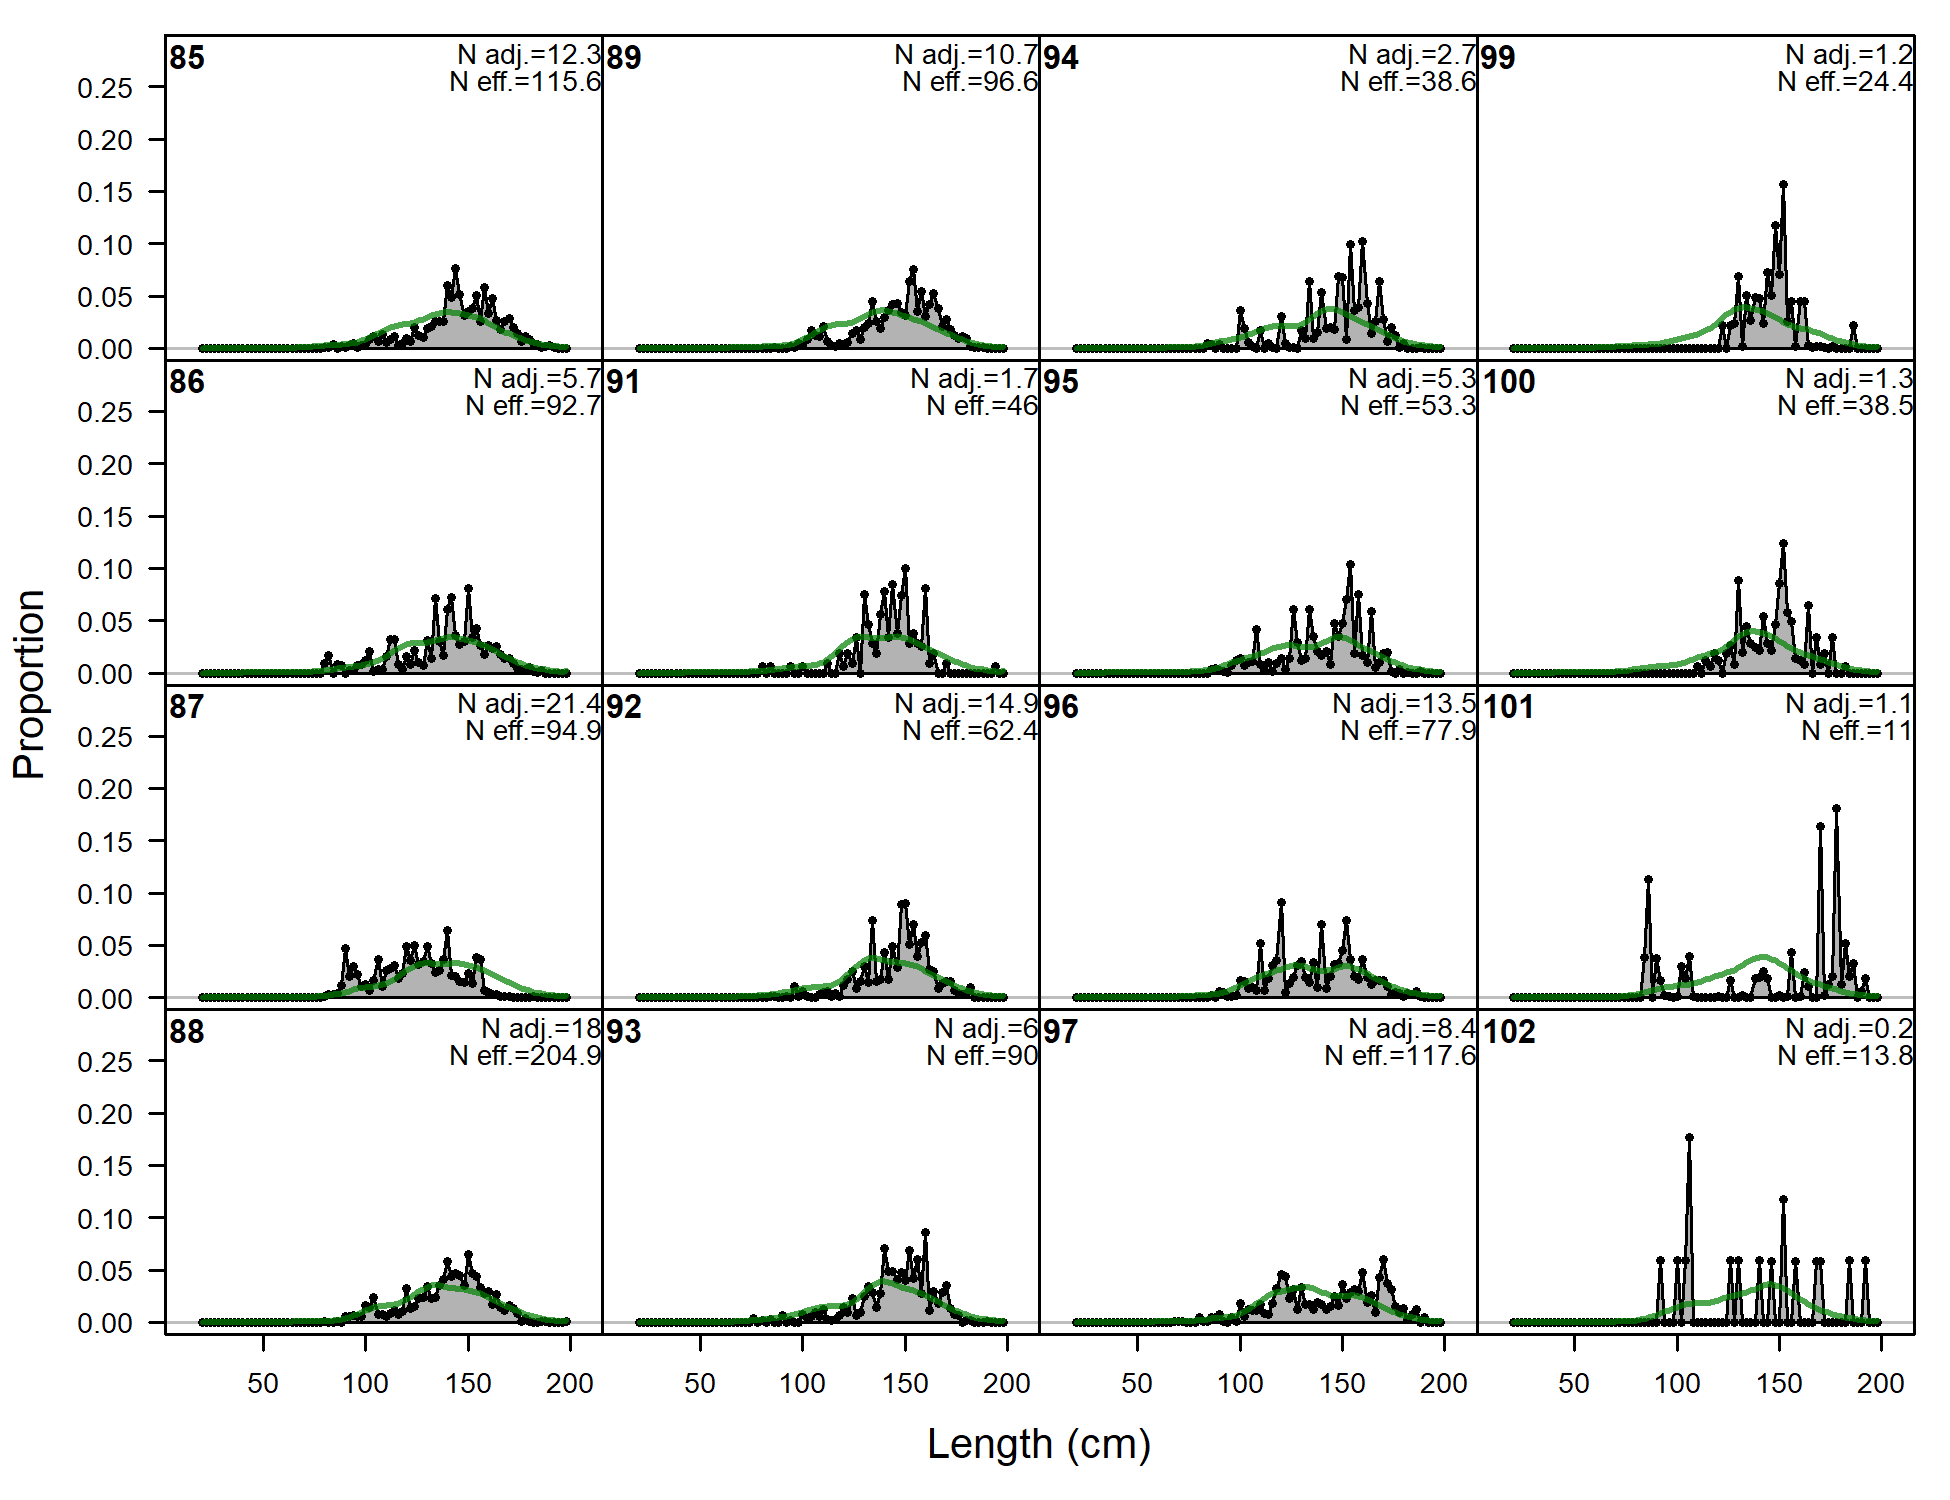
Length comps, whole catch, A3-LL-n (plot 3 of 6)
file: comp_lenfit_flt3mkt0_page3.png
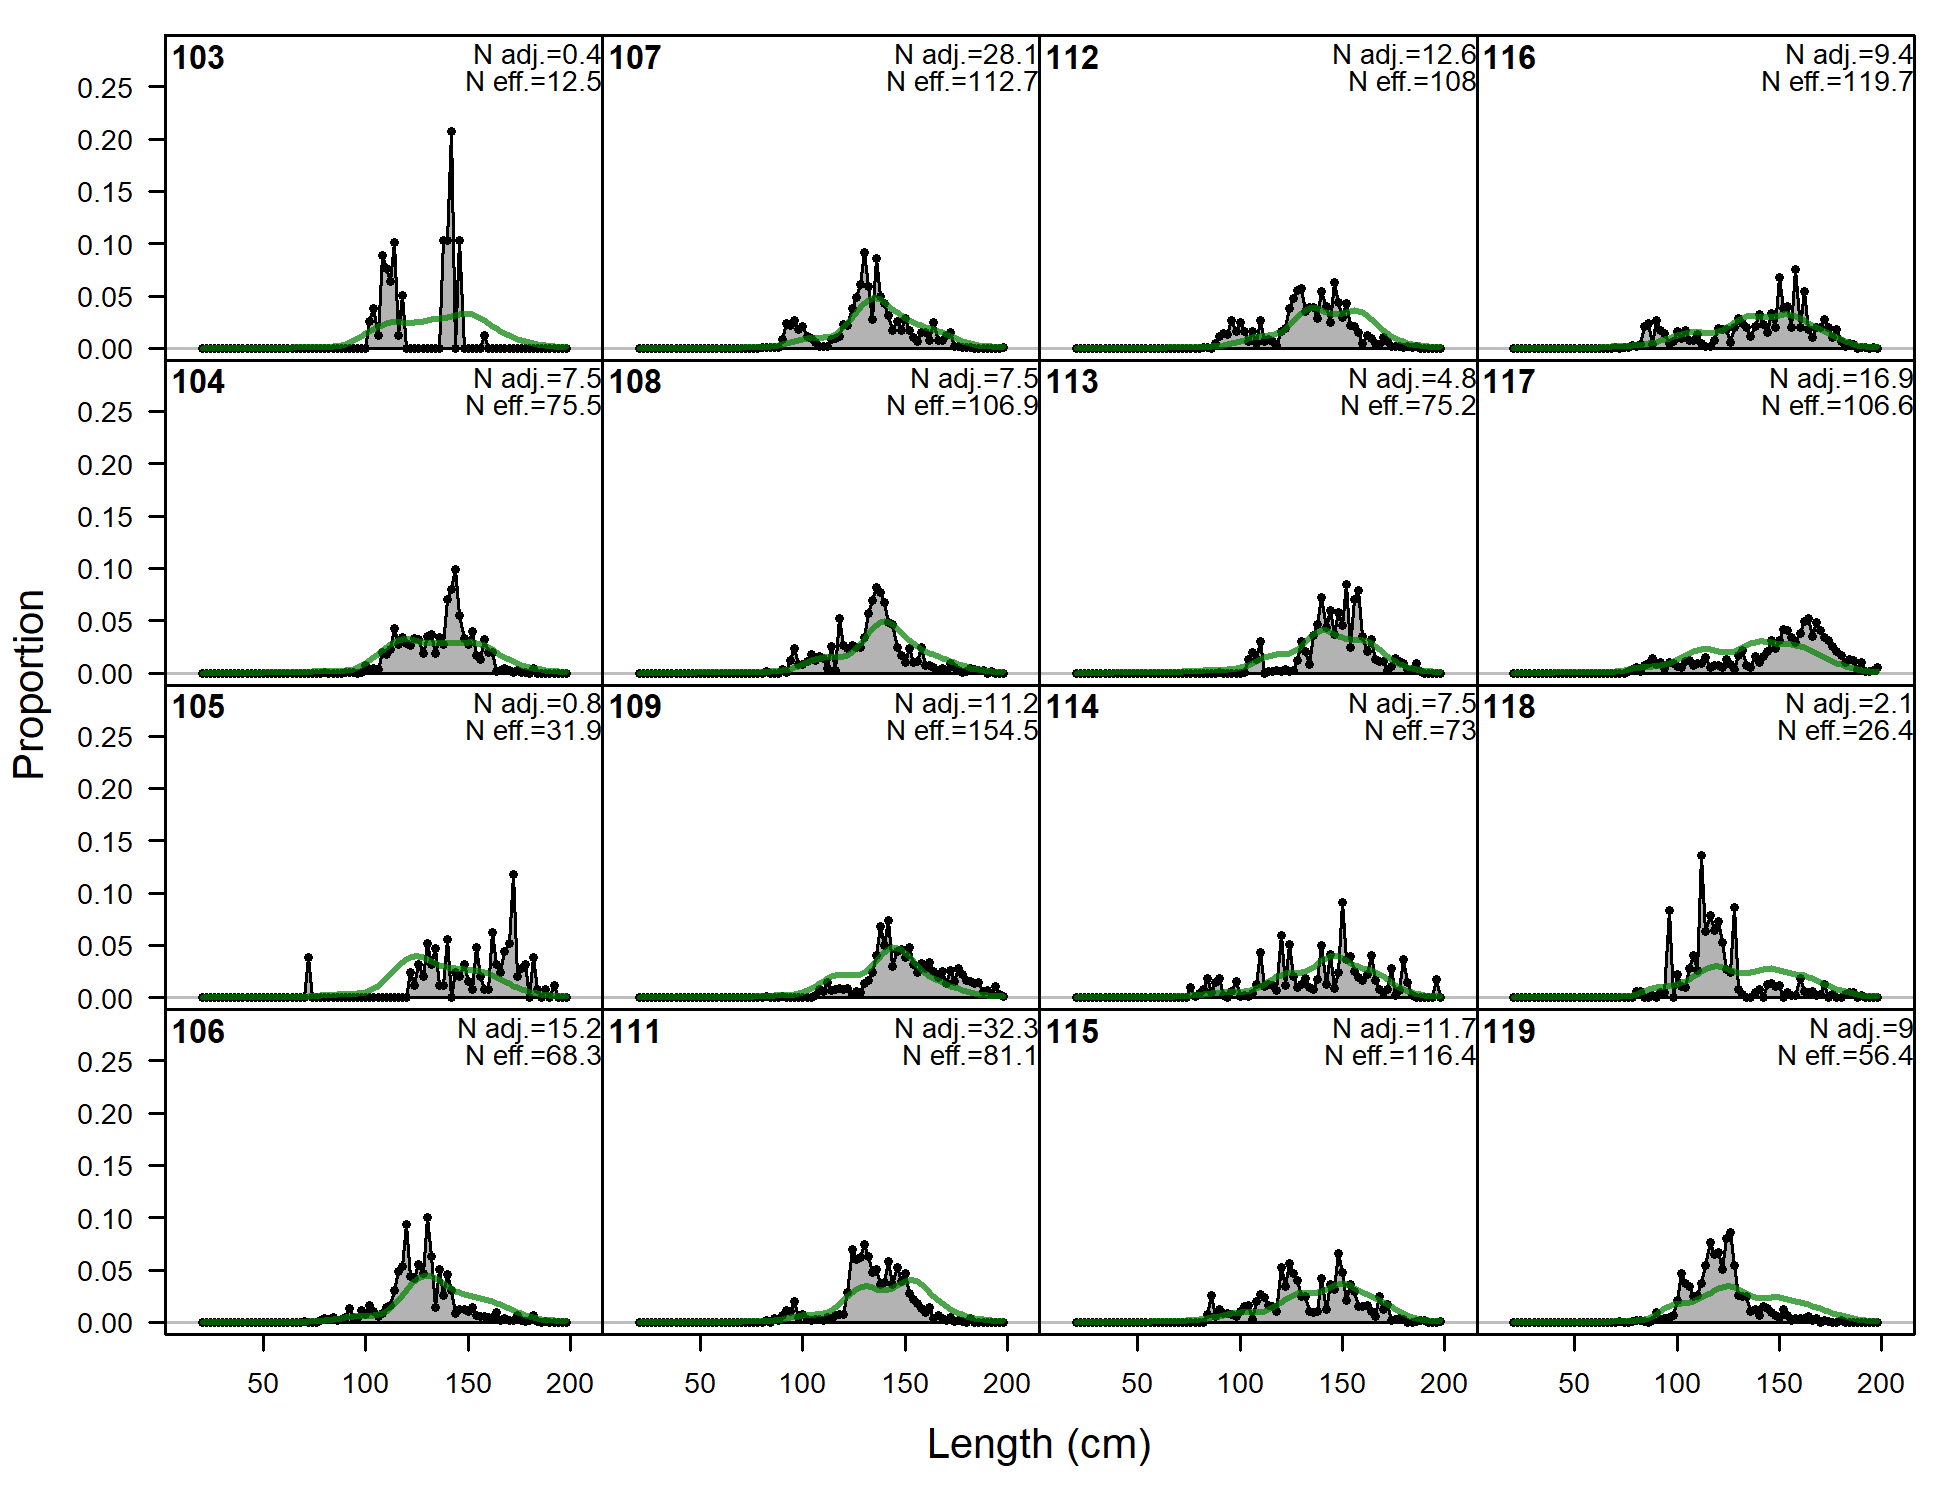
Length comps, whole catch, A3-LL-n (plot 4 of 6)
file: comp_lenfit_flt3mkt0_page4.png
Length comps, whole catch, A3-LL-n (plot 5 of 6)
file: comp_lenfit_flt3mkt0_page5.png
Length comps, whole catch, A3-LL-n (plot 6 of 6)
file: comp_lenfit_flt3mkt0_page6.png
Pearson residuals, whole catch, A3-LL-n (max=4.66) (plot 6 of 6)
Closed bubbles are positive residuals (observed > expected) and open bubbles are negative residuals (observed < expected).
file: comp_lenfit_residsflt3mkt0_page6.png
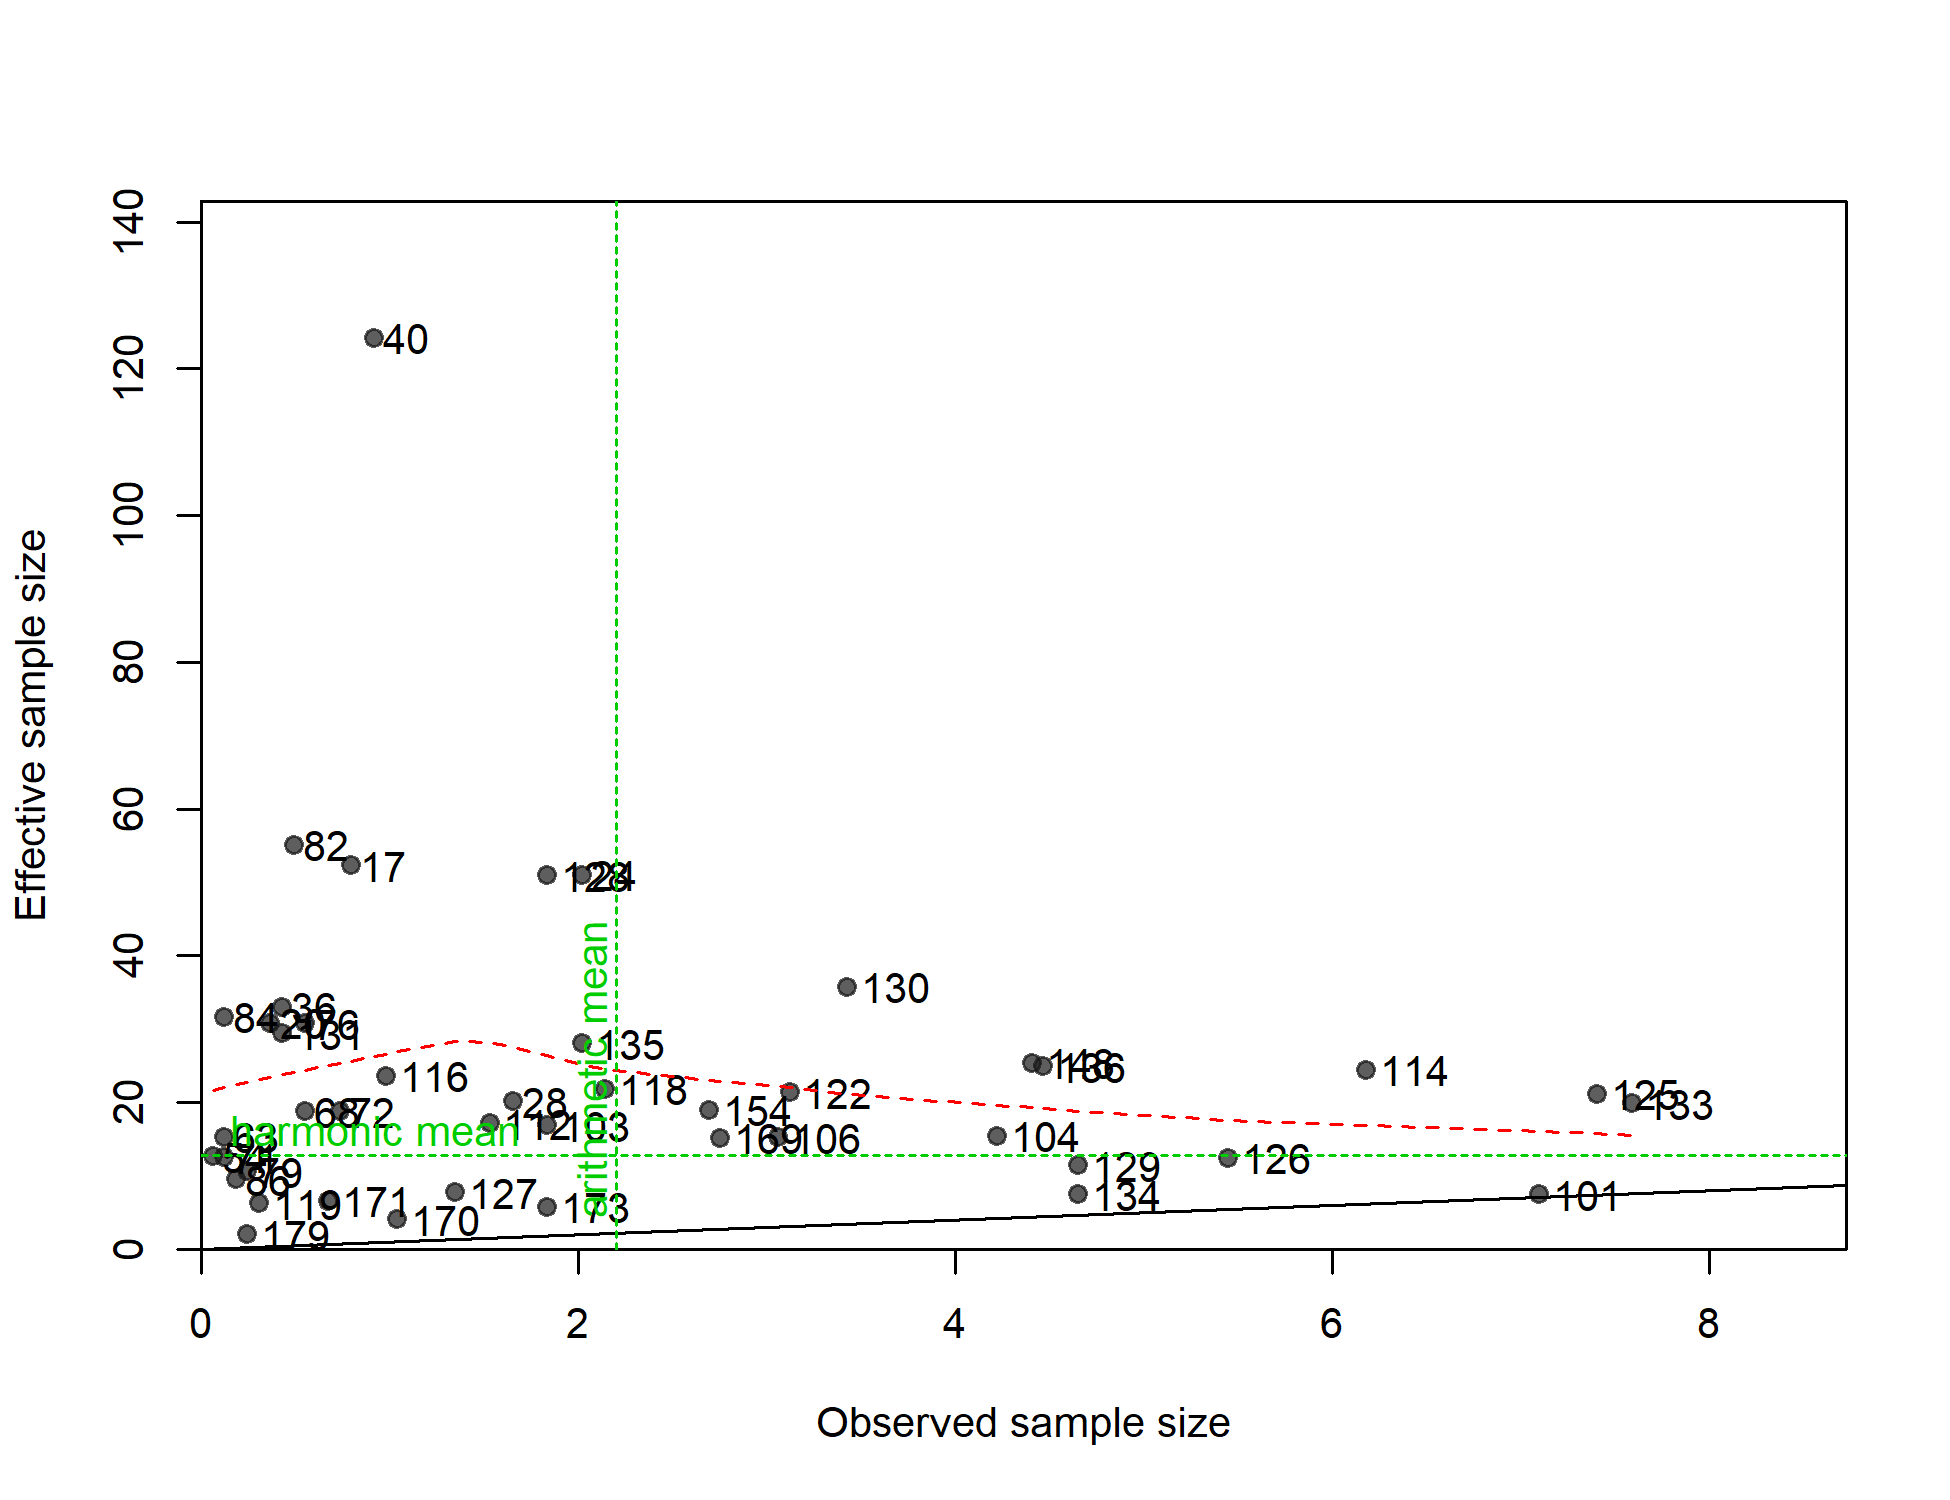
N-EffN comparison, Length comps, whole catch, A3-LL-n
file: comp_lenfit_sampsize_flt3mkt0.png
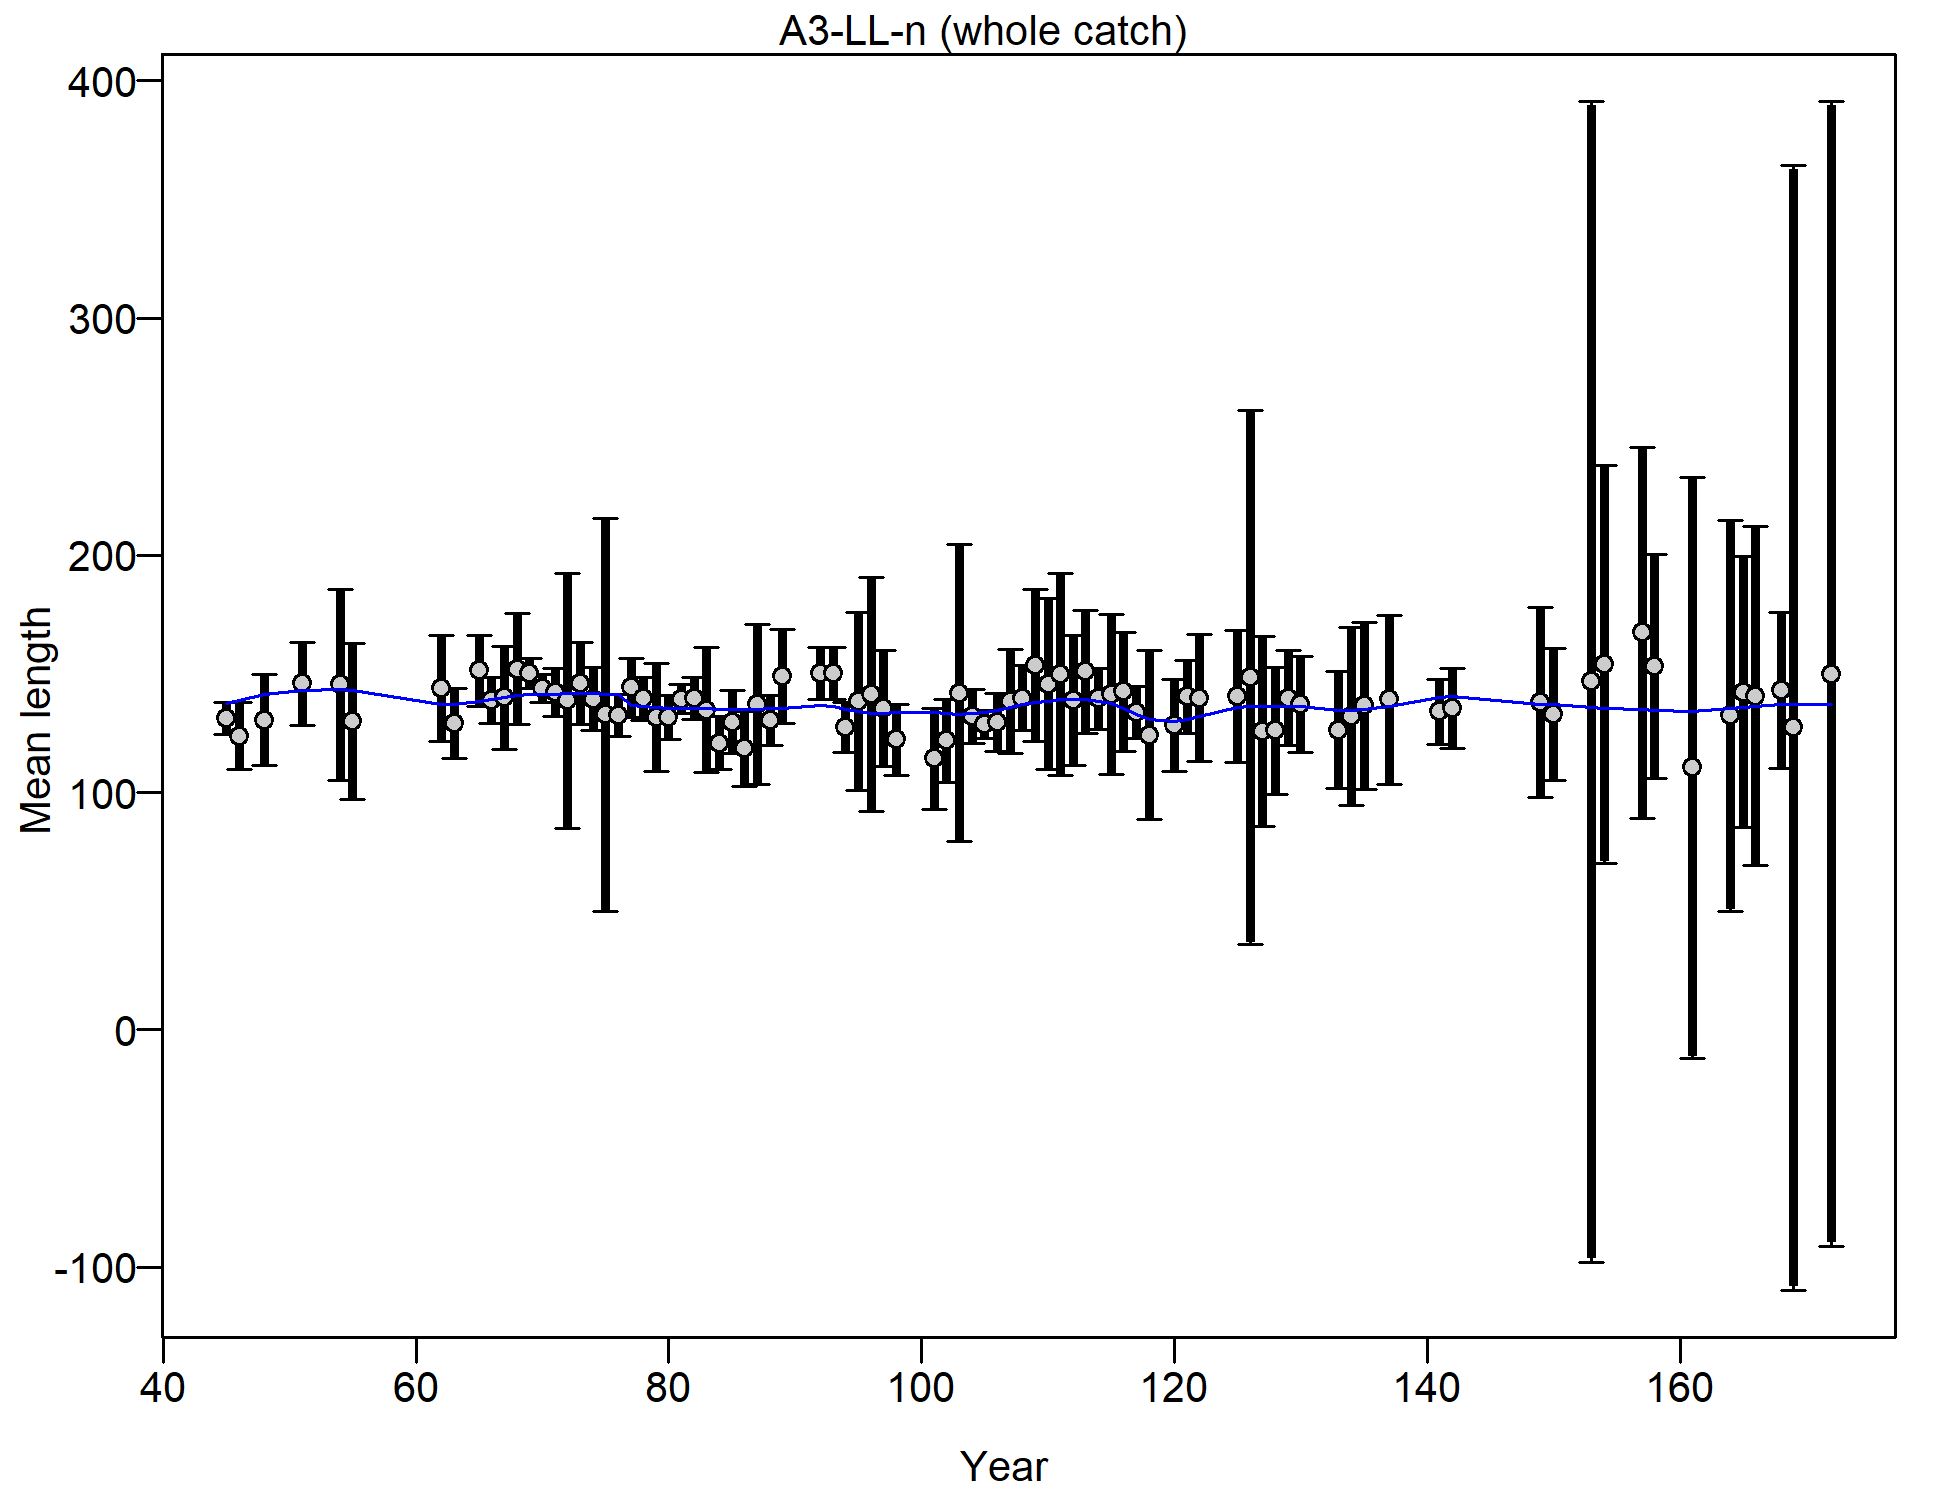
Mean length for A3-LL-n with 95% confidence intervals based on current samples sizes.
Francis data weighting method TA1.8: thinner intervals (with capped ends) show result of further adjusting sample sizes based on suggested multiplier (with 95% interval) for len data from A3-LL-n:
0.987 (0.7181-1.5376)
For more info, see
Francis, R.I.C.C. (2011). Data weighting in statistical fisheries stock assessment models. Can. J. Fish. Aquat. Sci. 68: 1124-1138. https://doi.org/10.1139/f2011-025
Length comps, whole catch, A4-LL-n (plot 1 of 8).
'N adj.' is the input sample size after data-weighting adjustment. N eff. is the calculated effective sample size used in the McAllister-Iannelli tuning method.
file: comp_lenfit_flt4mkt0_page1.png
Length comps, whole catch, A4-LL-n (plot 2 of 8)
file: comp_lenfit_flt4mkt0_page2.png
Length comps, whole catch, A4-LL-n (plot 3 of 8)
file: comp_lenfit_flt4mkt0_page3.png
Length comps, whole catch, A4-LL-n (plot 4 of 8)
file: comp_lenfit_flt4mkt0_page4.png
Length comps, whole catch, A4-LL-n (plot 5 of 8)
file: comp_lenfit_flt4mkt0_page5.png
Length comps, whole catch, A4-LL-n (plot 6 of 8)
file: comp_lenfit_flt4mkt0_page6.png
Length comps, whole catch, A4-LL-n (plot 7 of 8)
file: comp_lenfit_flt4mkt0_page7.png
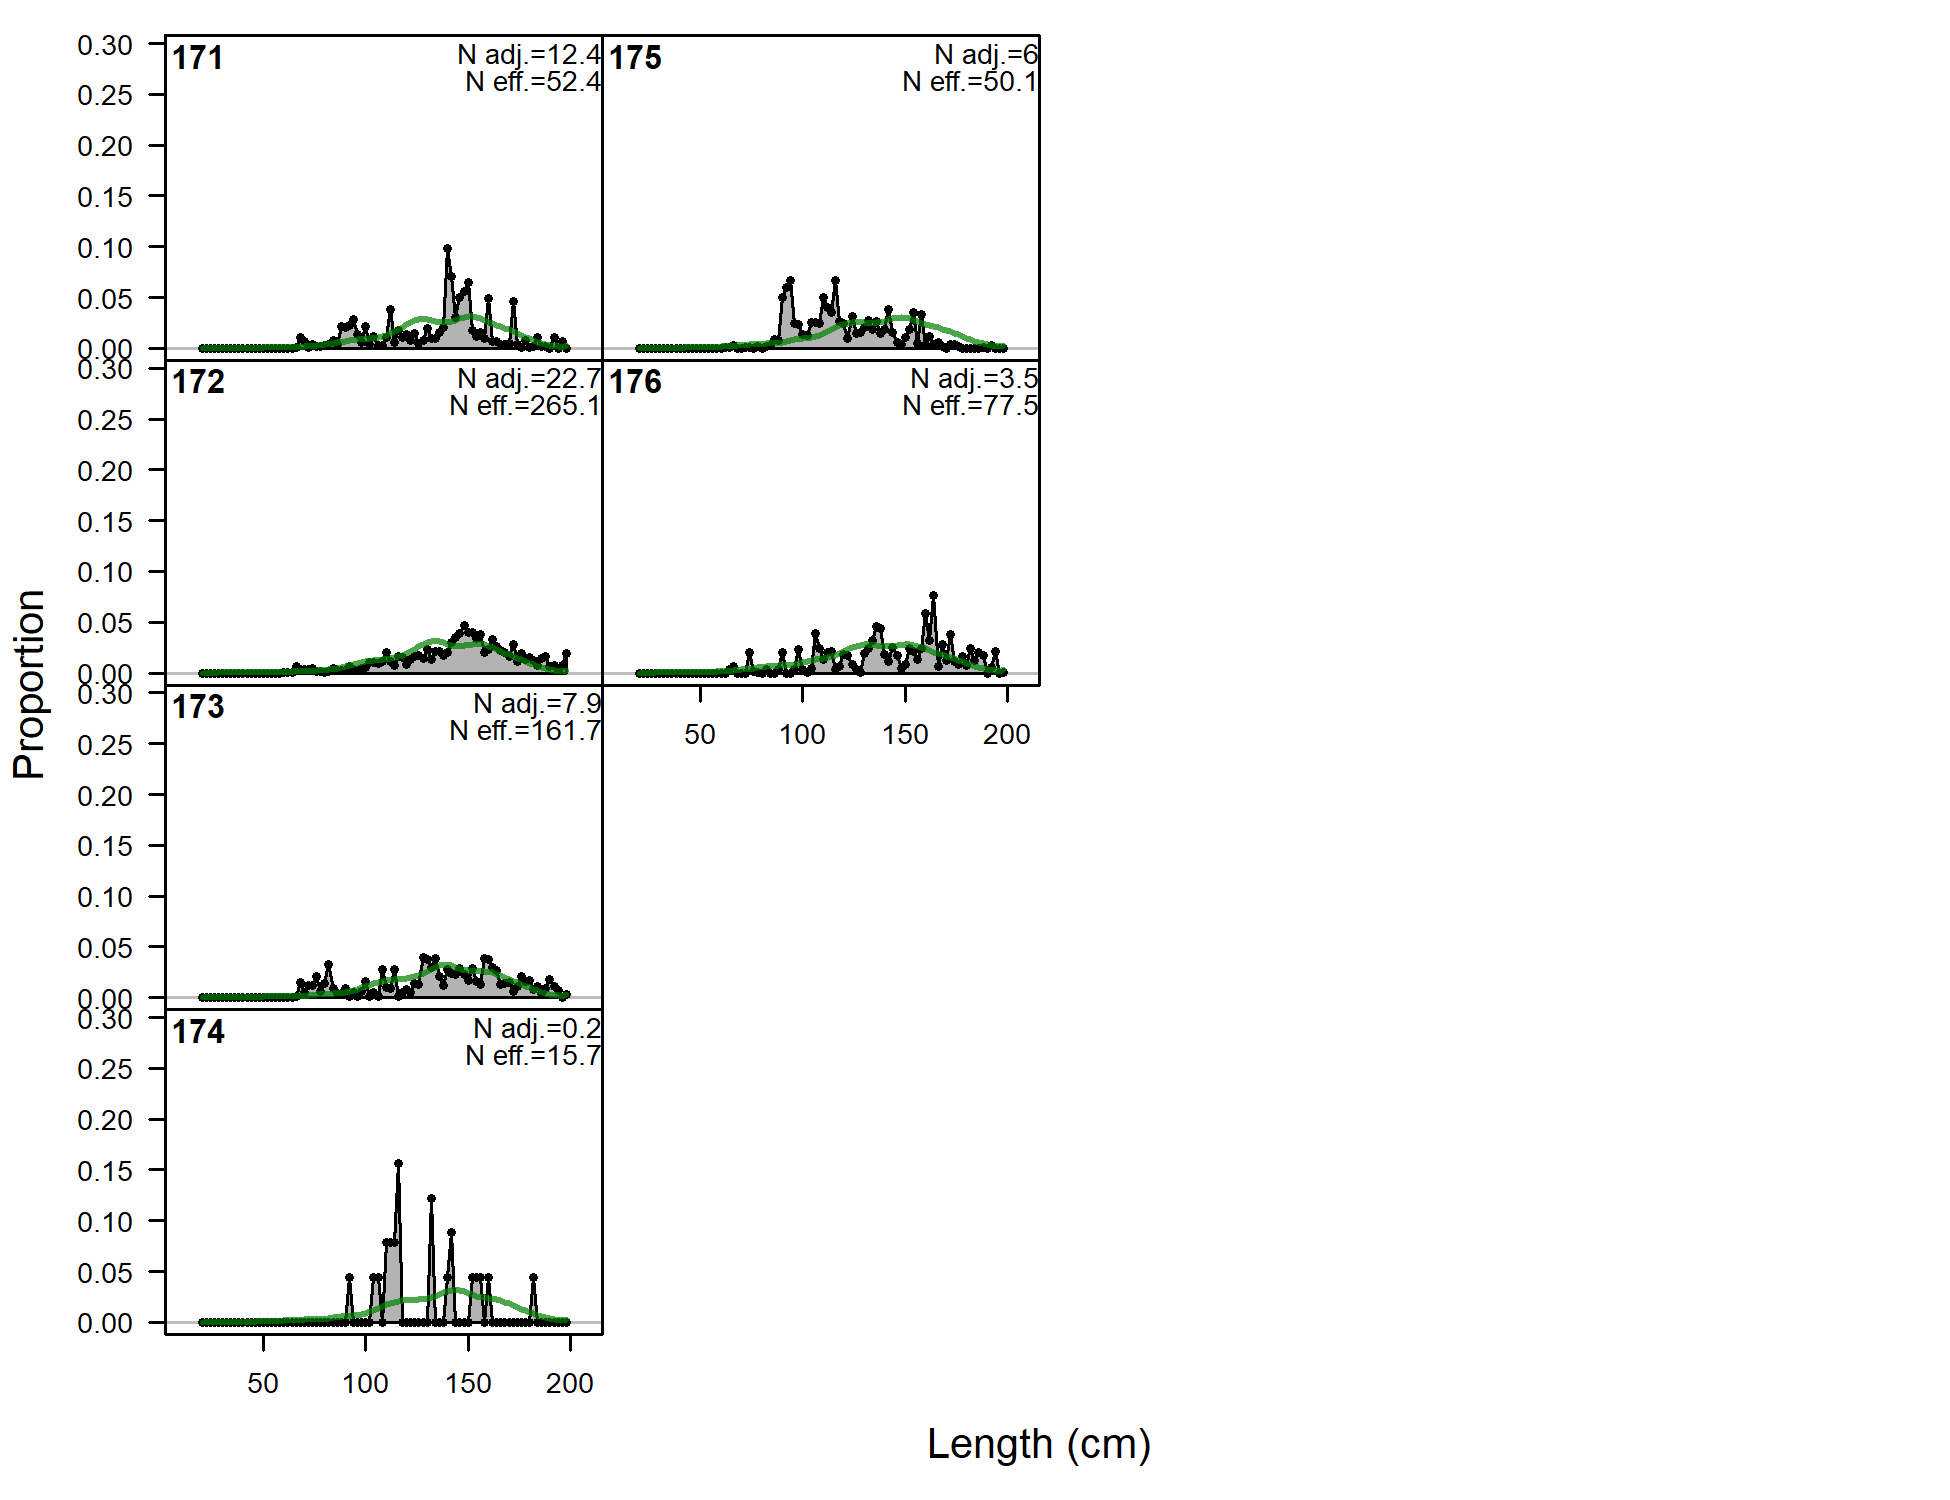
Length comps, whole catch, A4-LL-n (plot 8 of 8)
file: comp_lenfit_flt4mkt0_page8.png
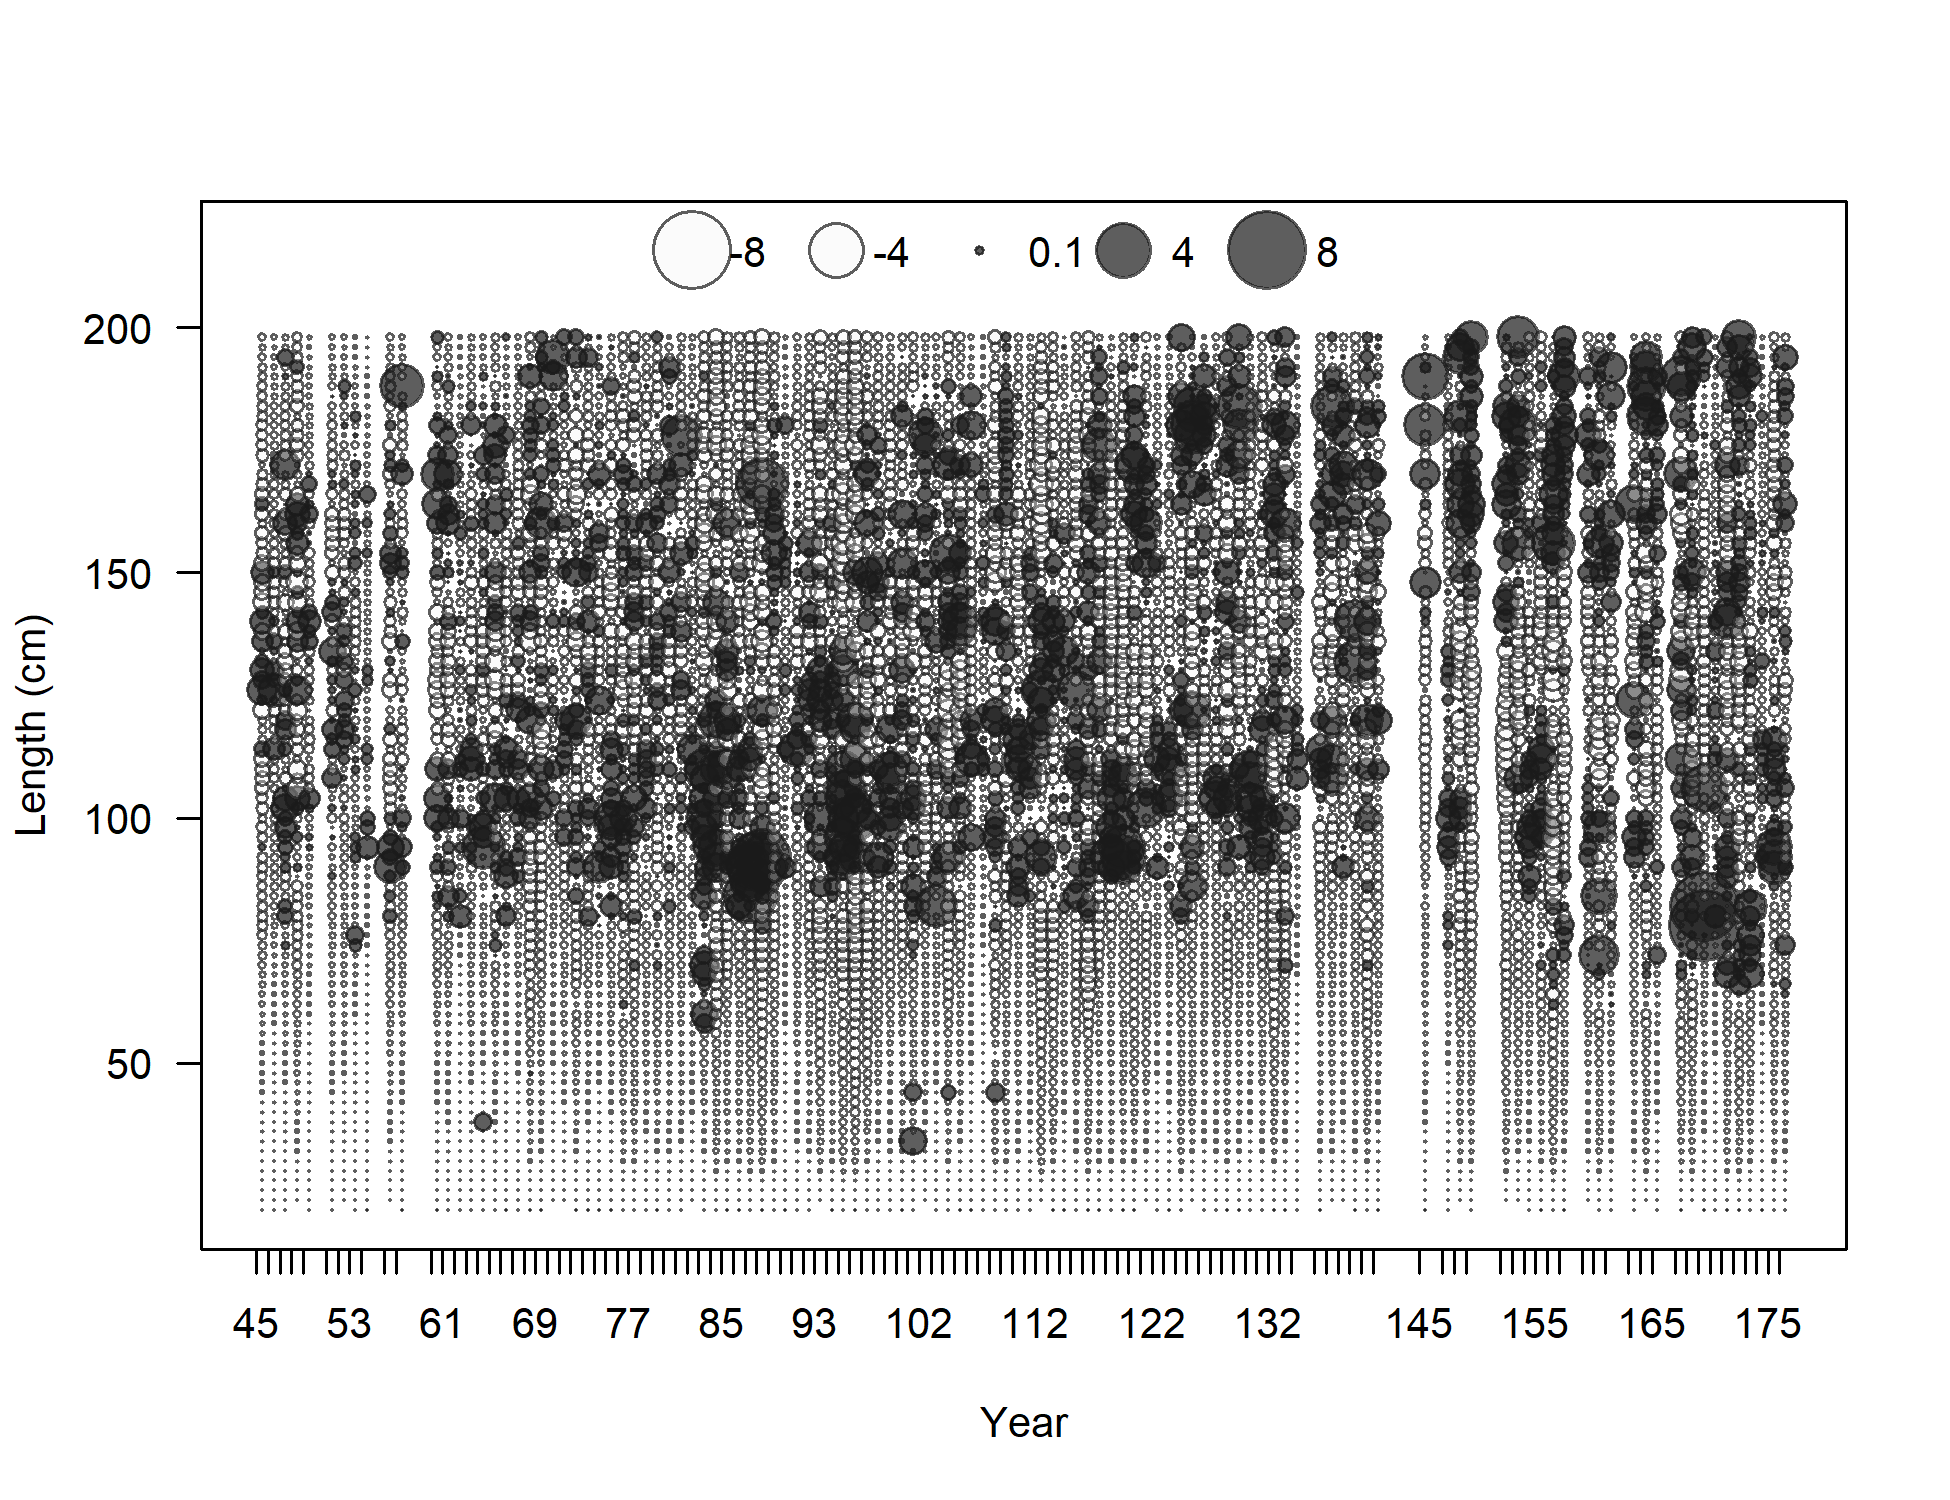
Pearson residuals, whole catch, A4-LL-n (max=6.54) (plot 8 of 8)
Closed bubbles are positive residuals (observed > expected) and open bubbles are negative residuals (observed < expected).
file: comp_lenfit_residsflt4mkt0_page8.png
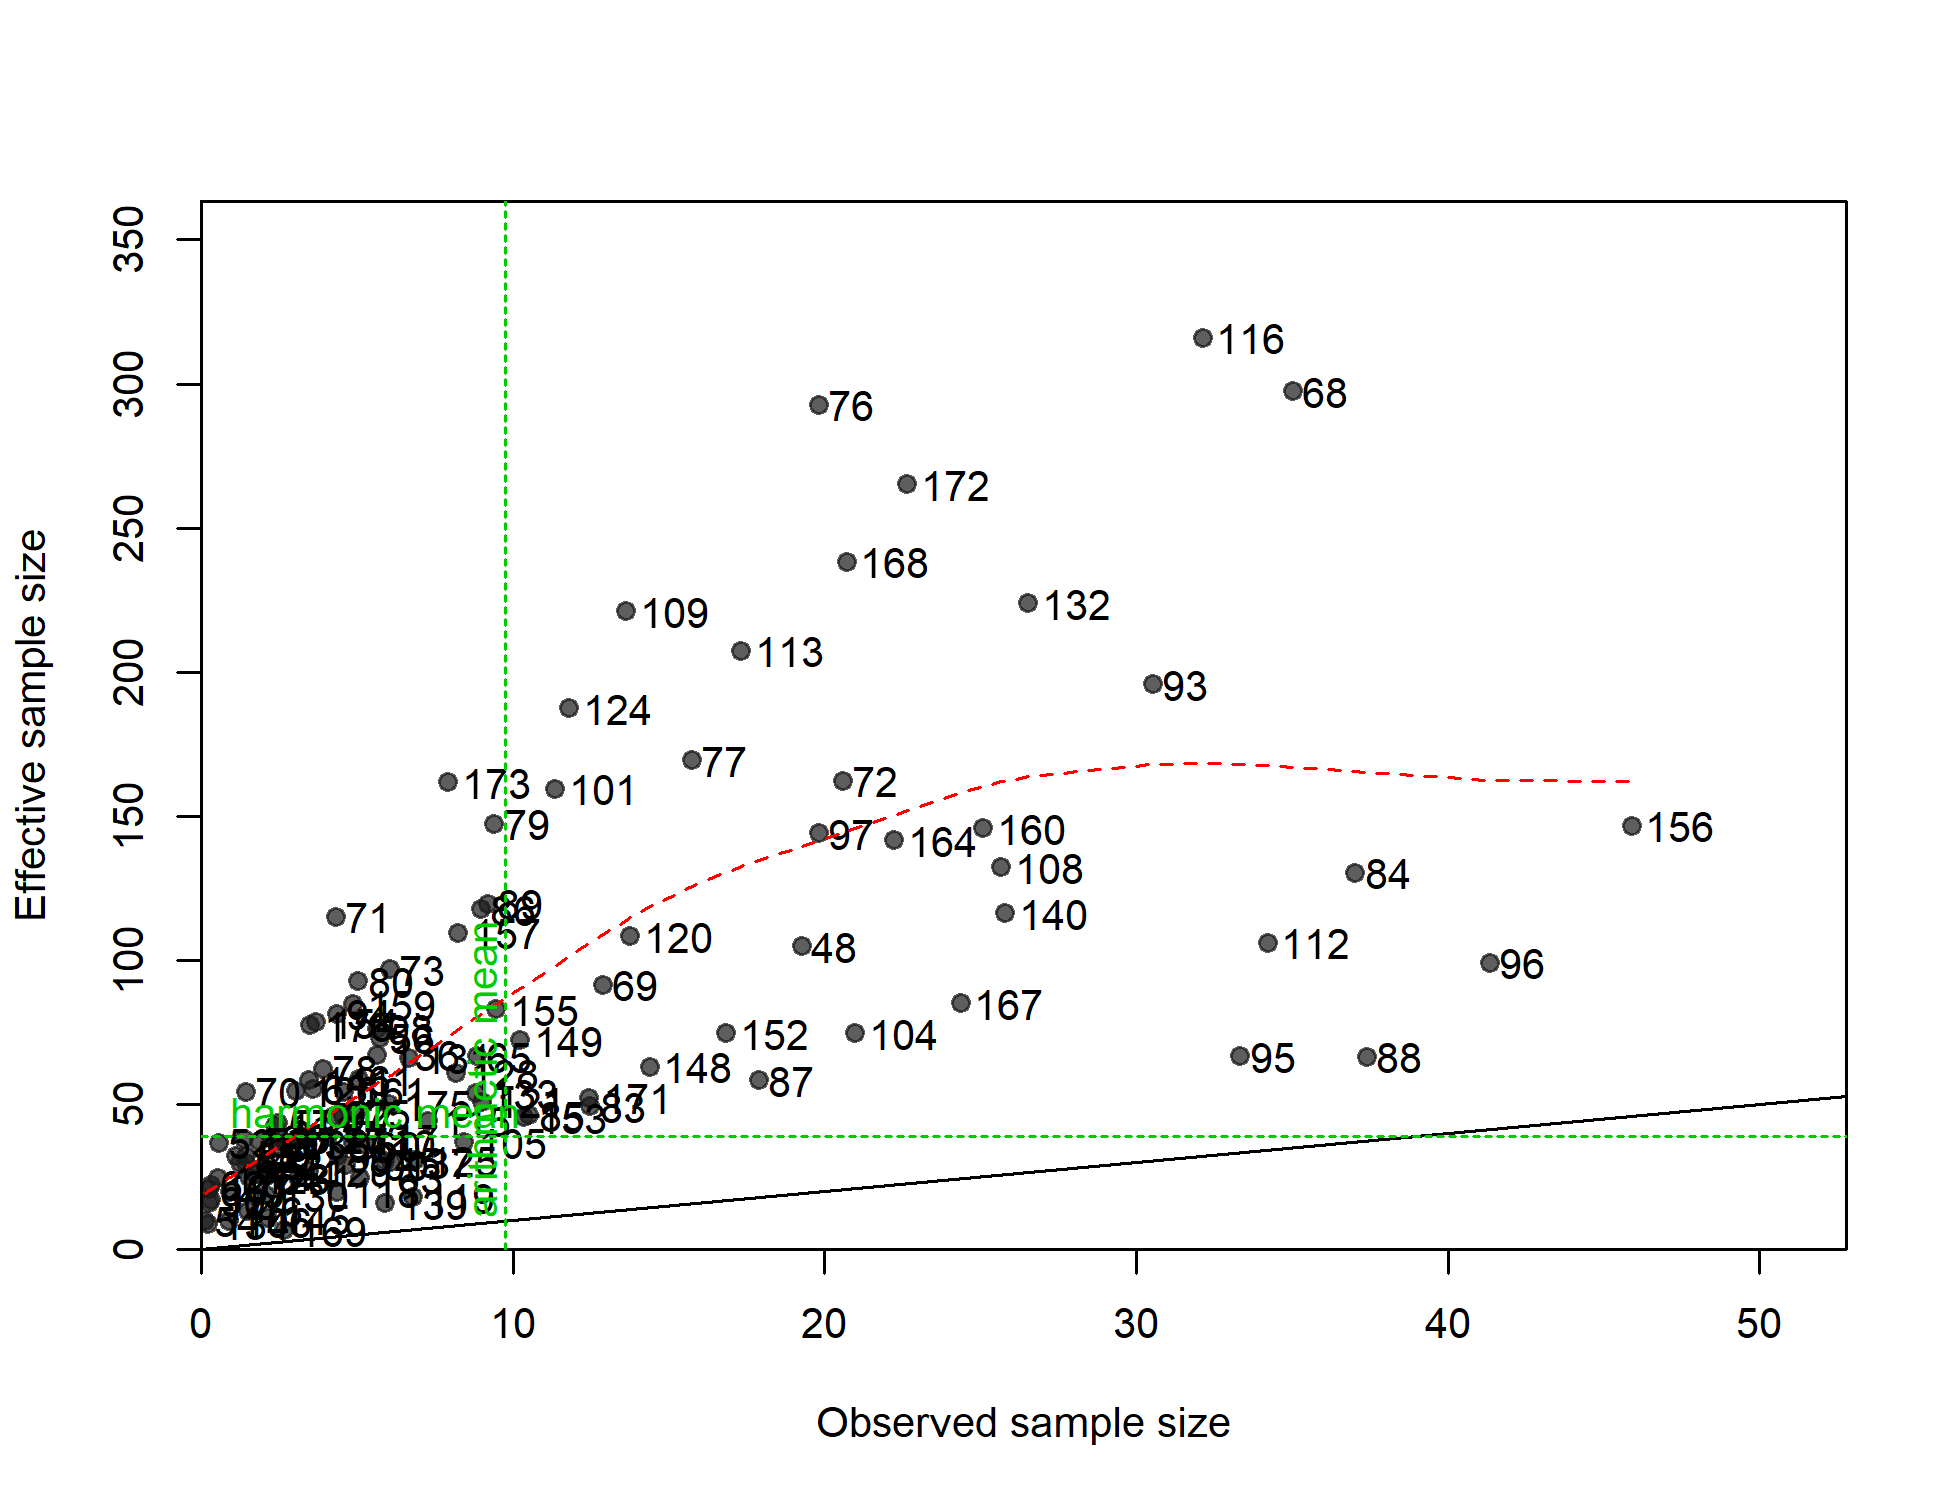
N-EffN comparison, Length comps, whole catch, A4-LL-n
file: comp_lenfit_sampsize_flt4mkt0.png
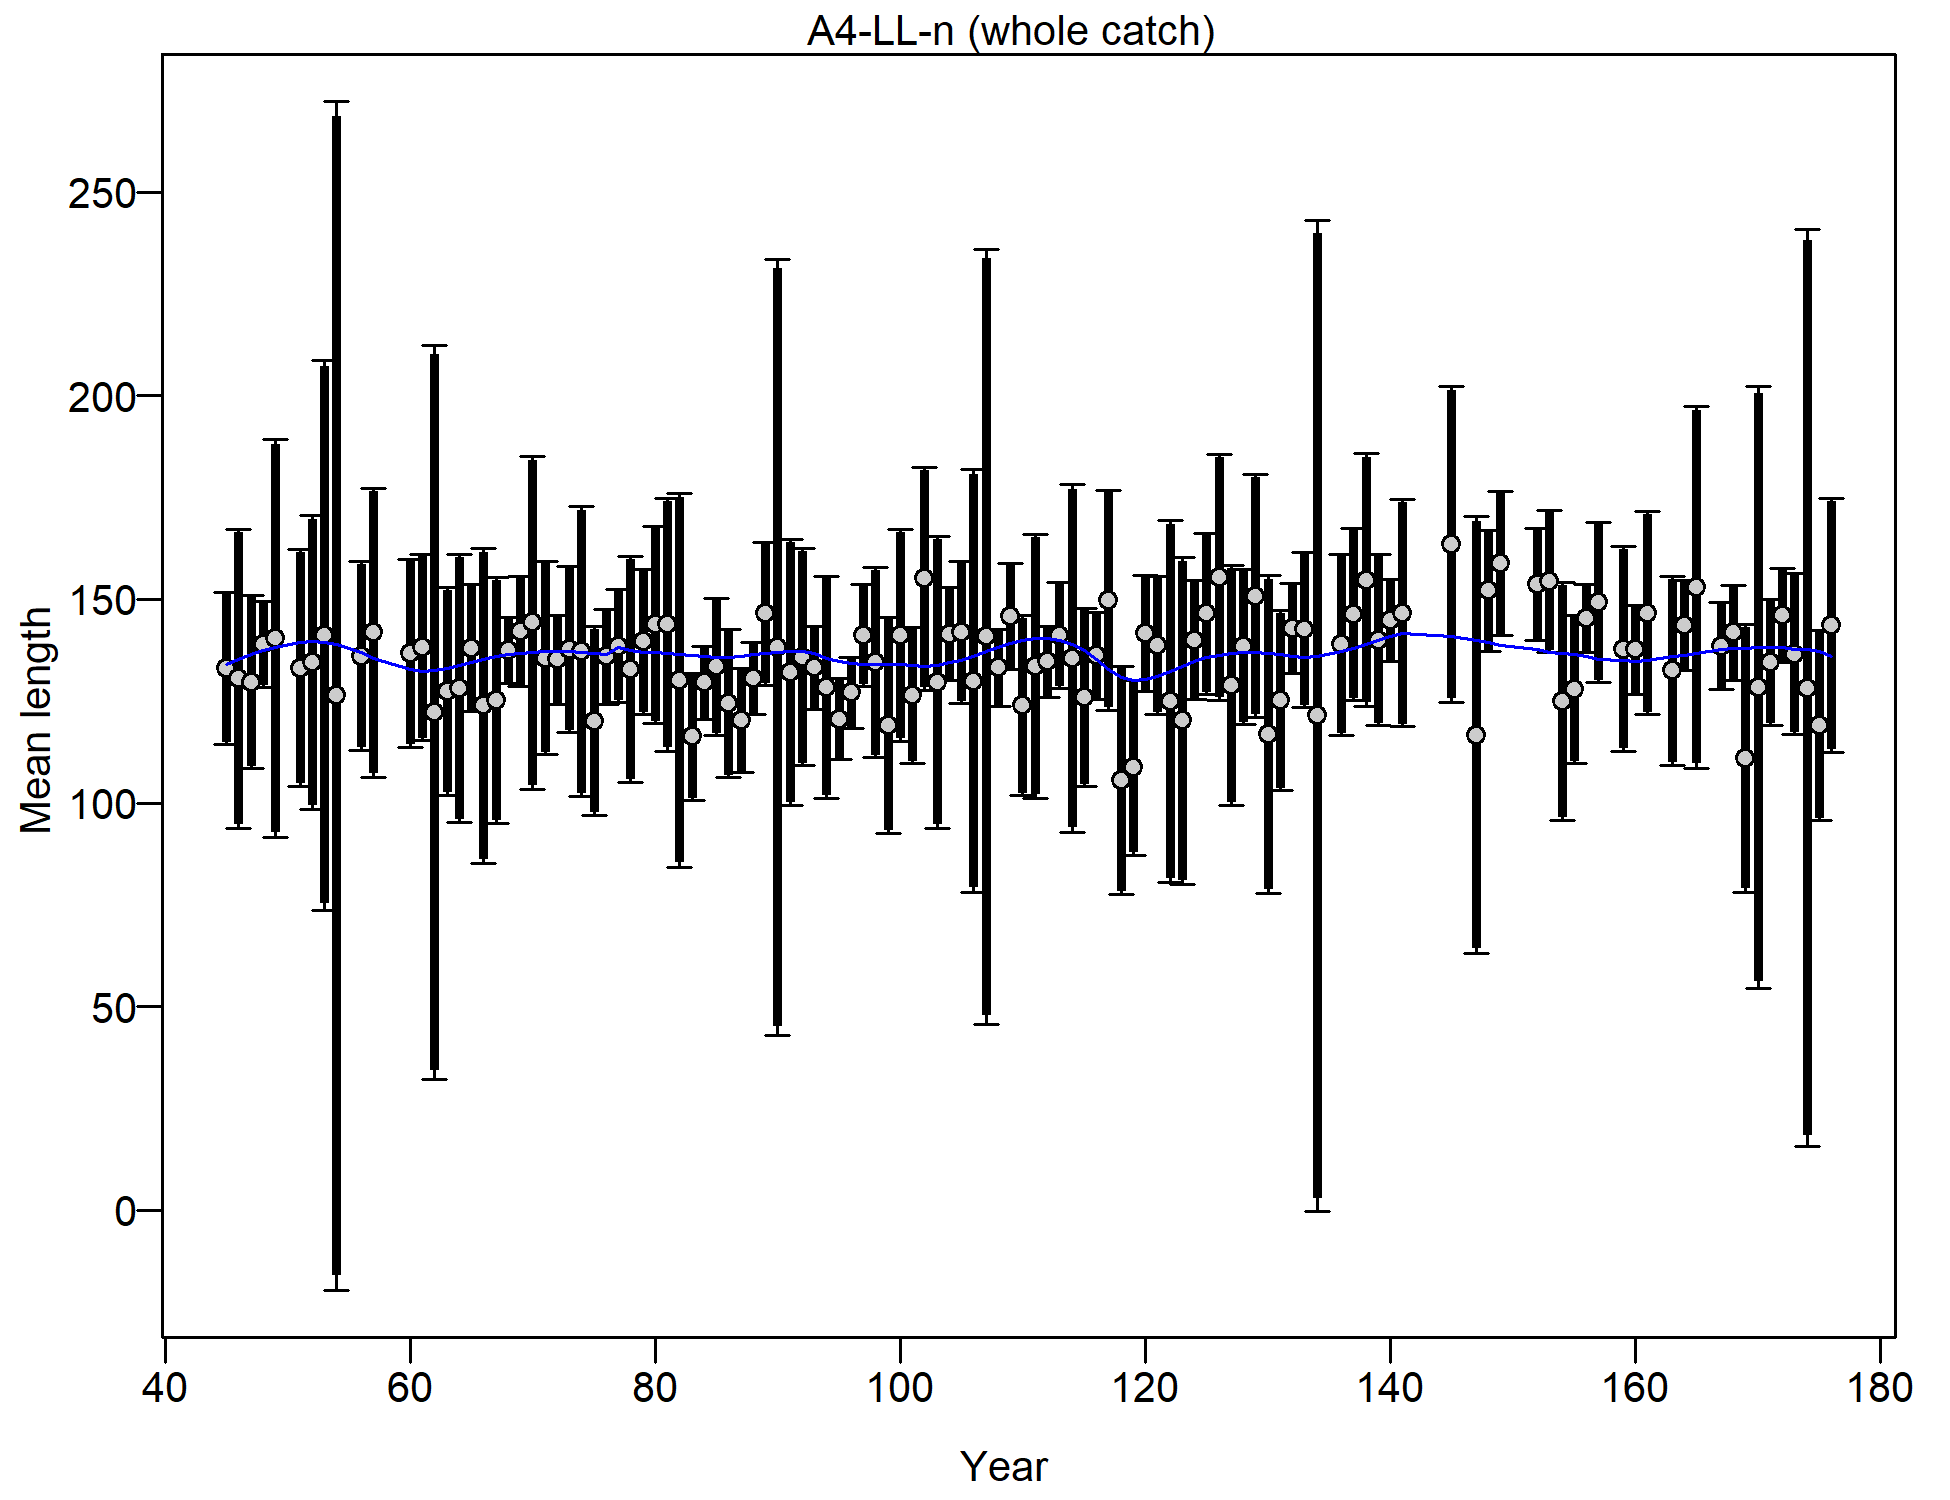
Mean length for A4-LL-n with 95% confidence intervals based on current samples sizes.
Francis data weighting method TA1.8: thinner intervals (with capped ends) show result of further adjusting sample sizes based on suggested multiplier (with 95% interval) for len data from A4-LL-n:
0.9512 (0.7363-1.2836)
For more info, see
Francis, R.I.C.C. (2011). Data weighting in statistical fisheries stock assessment models. Can. J. Fish. Aquat. Sci. 68: 1124-1138. https://doi.org/10.1139/f2011-025
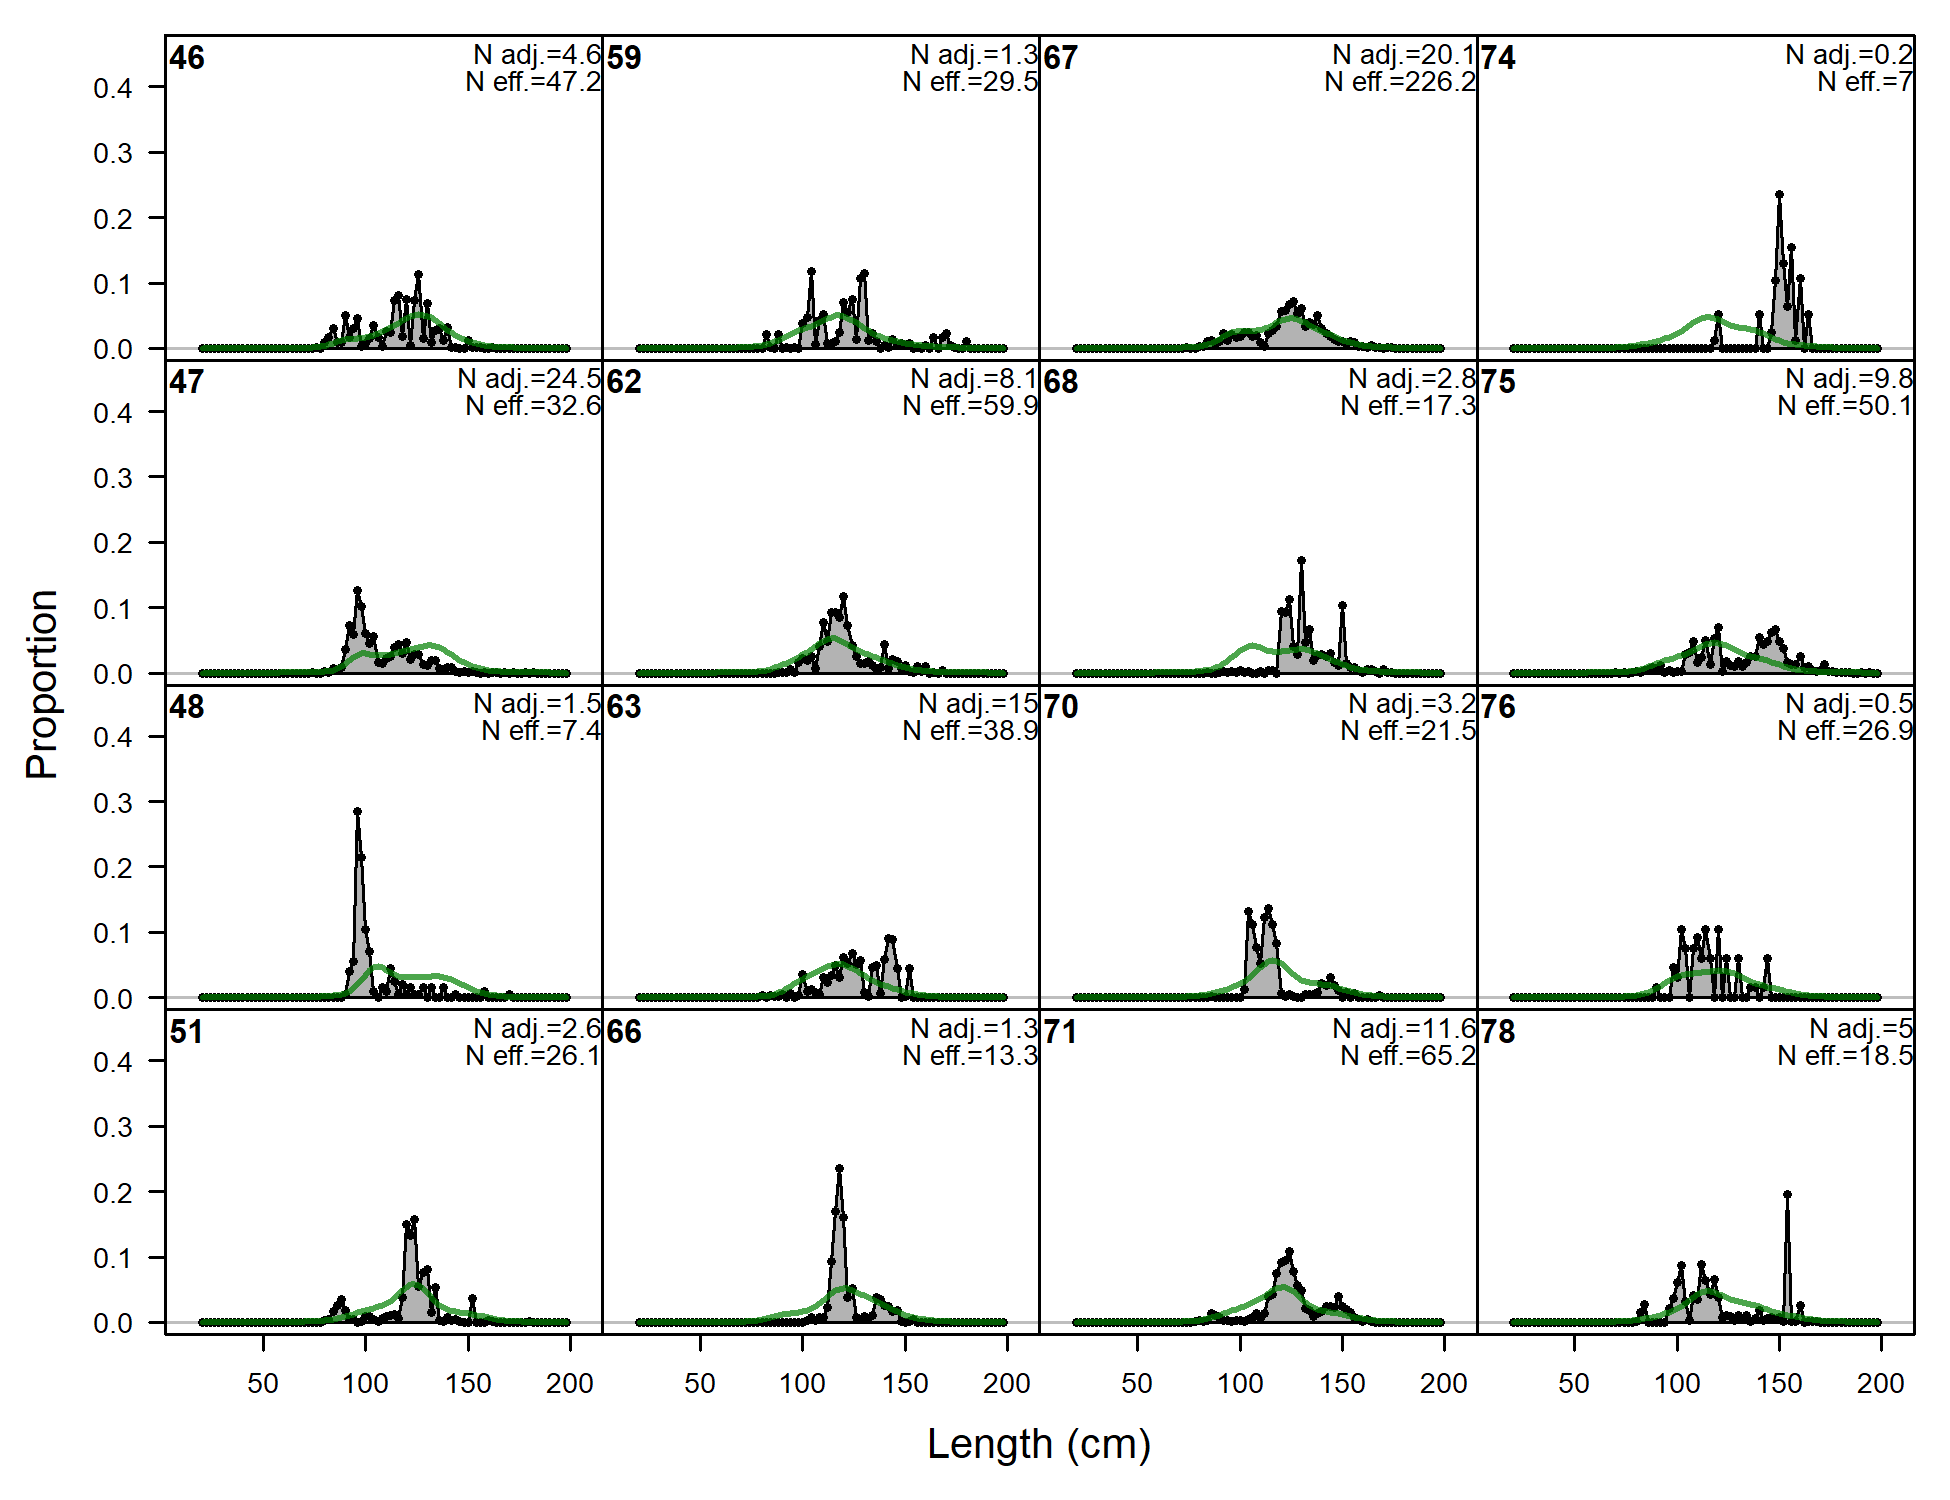
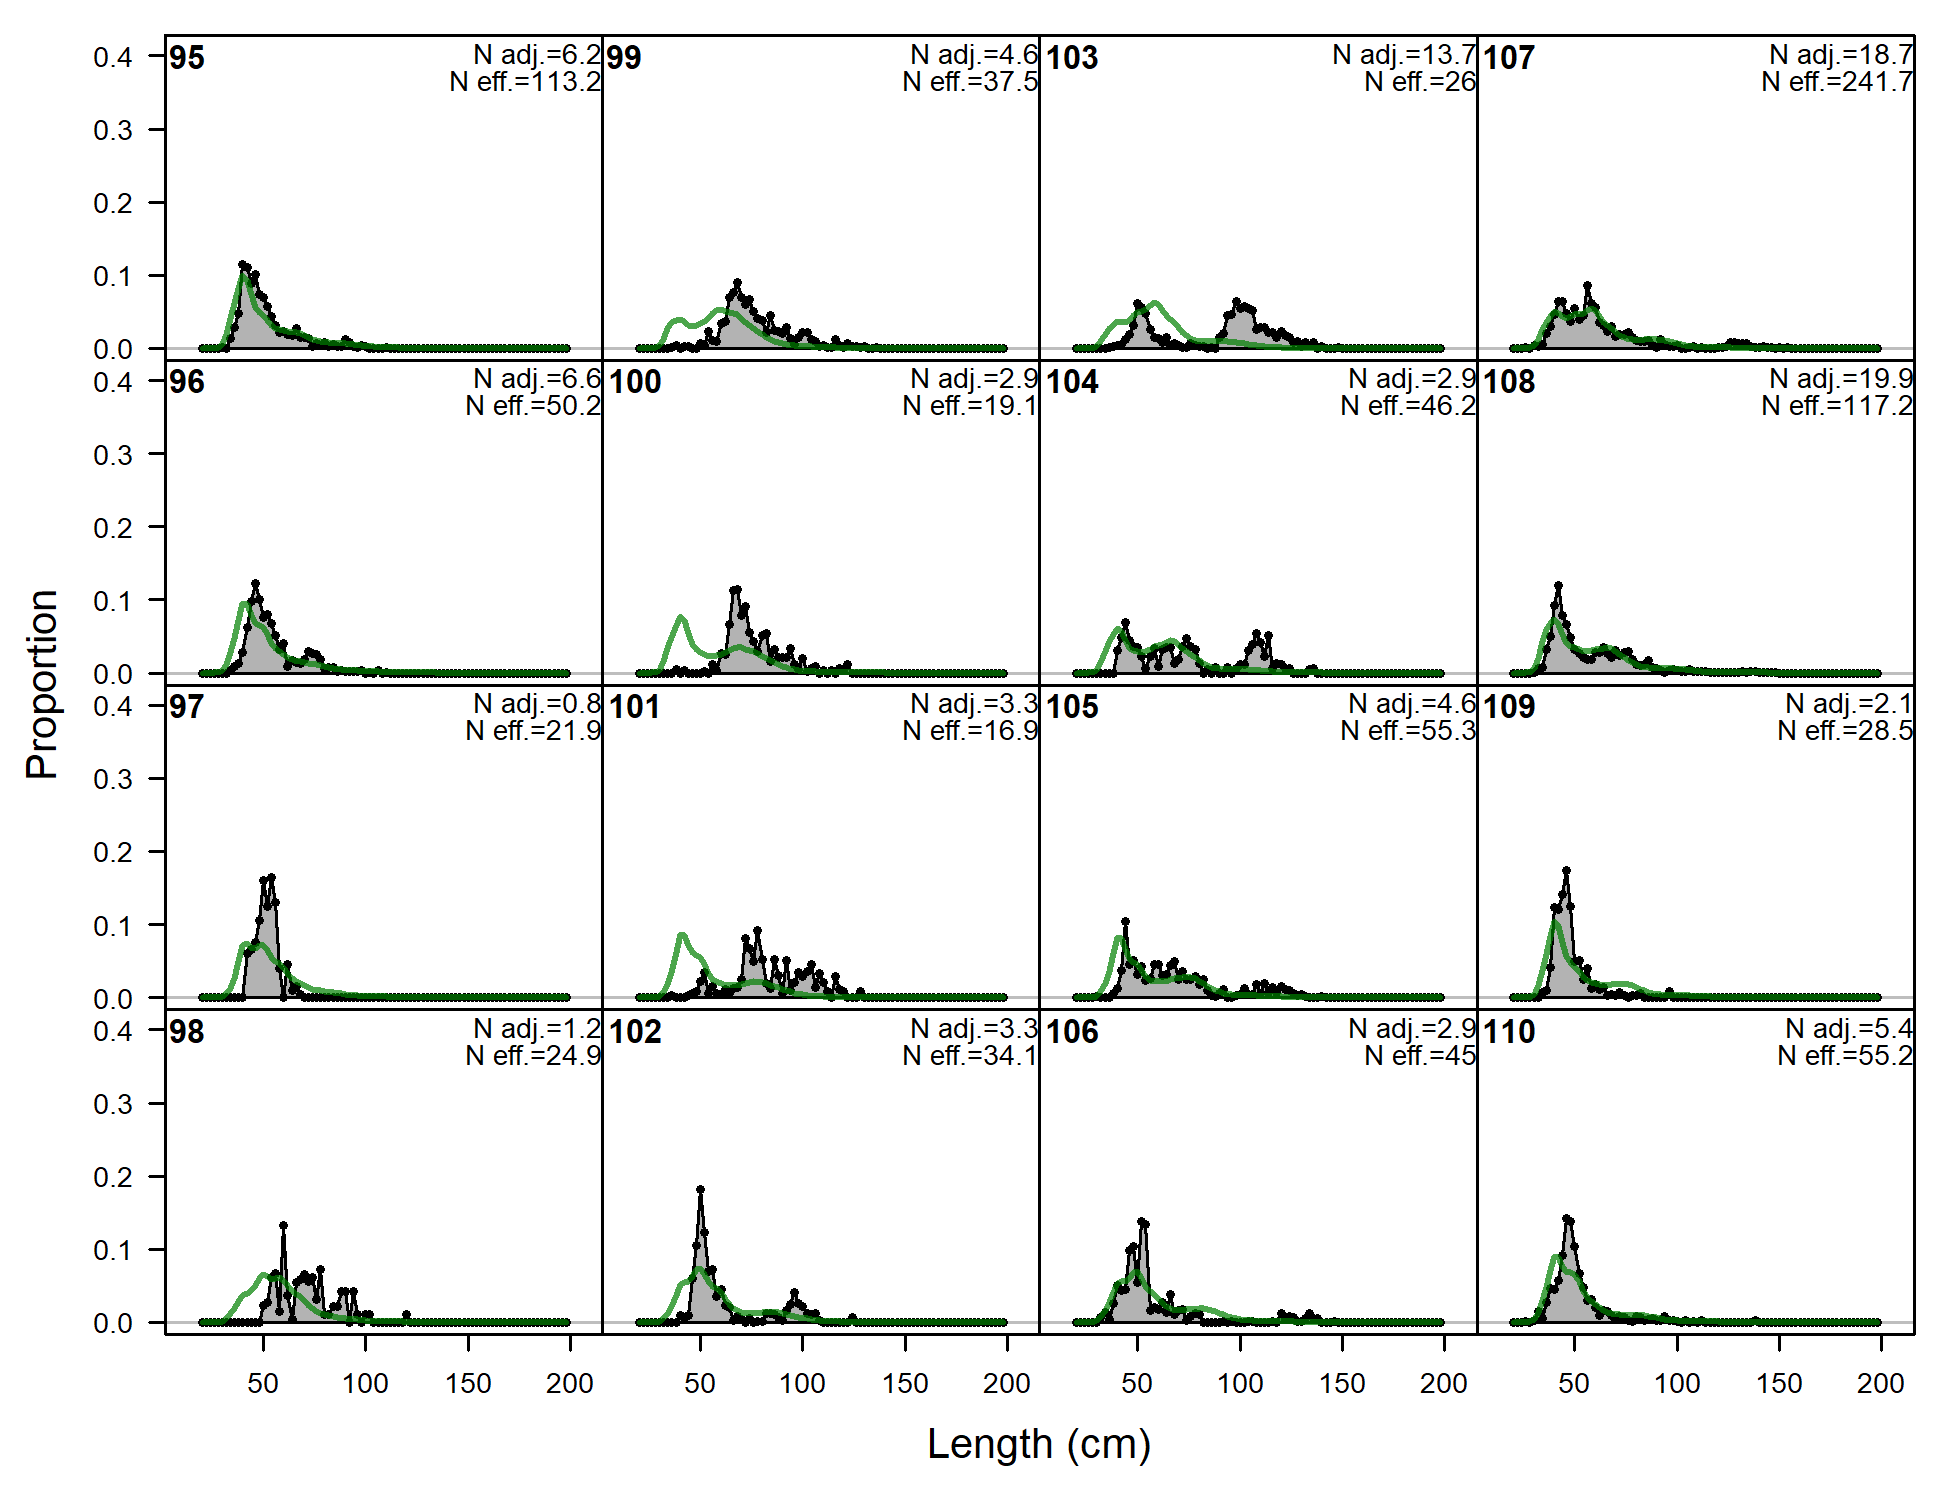
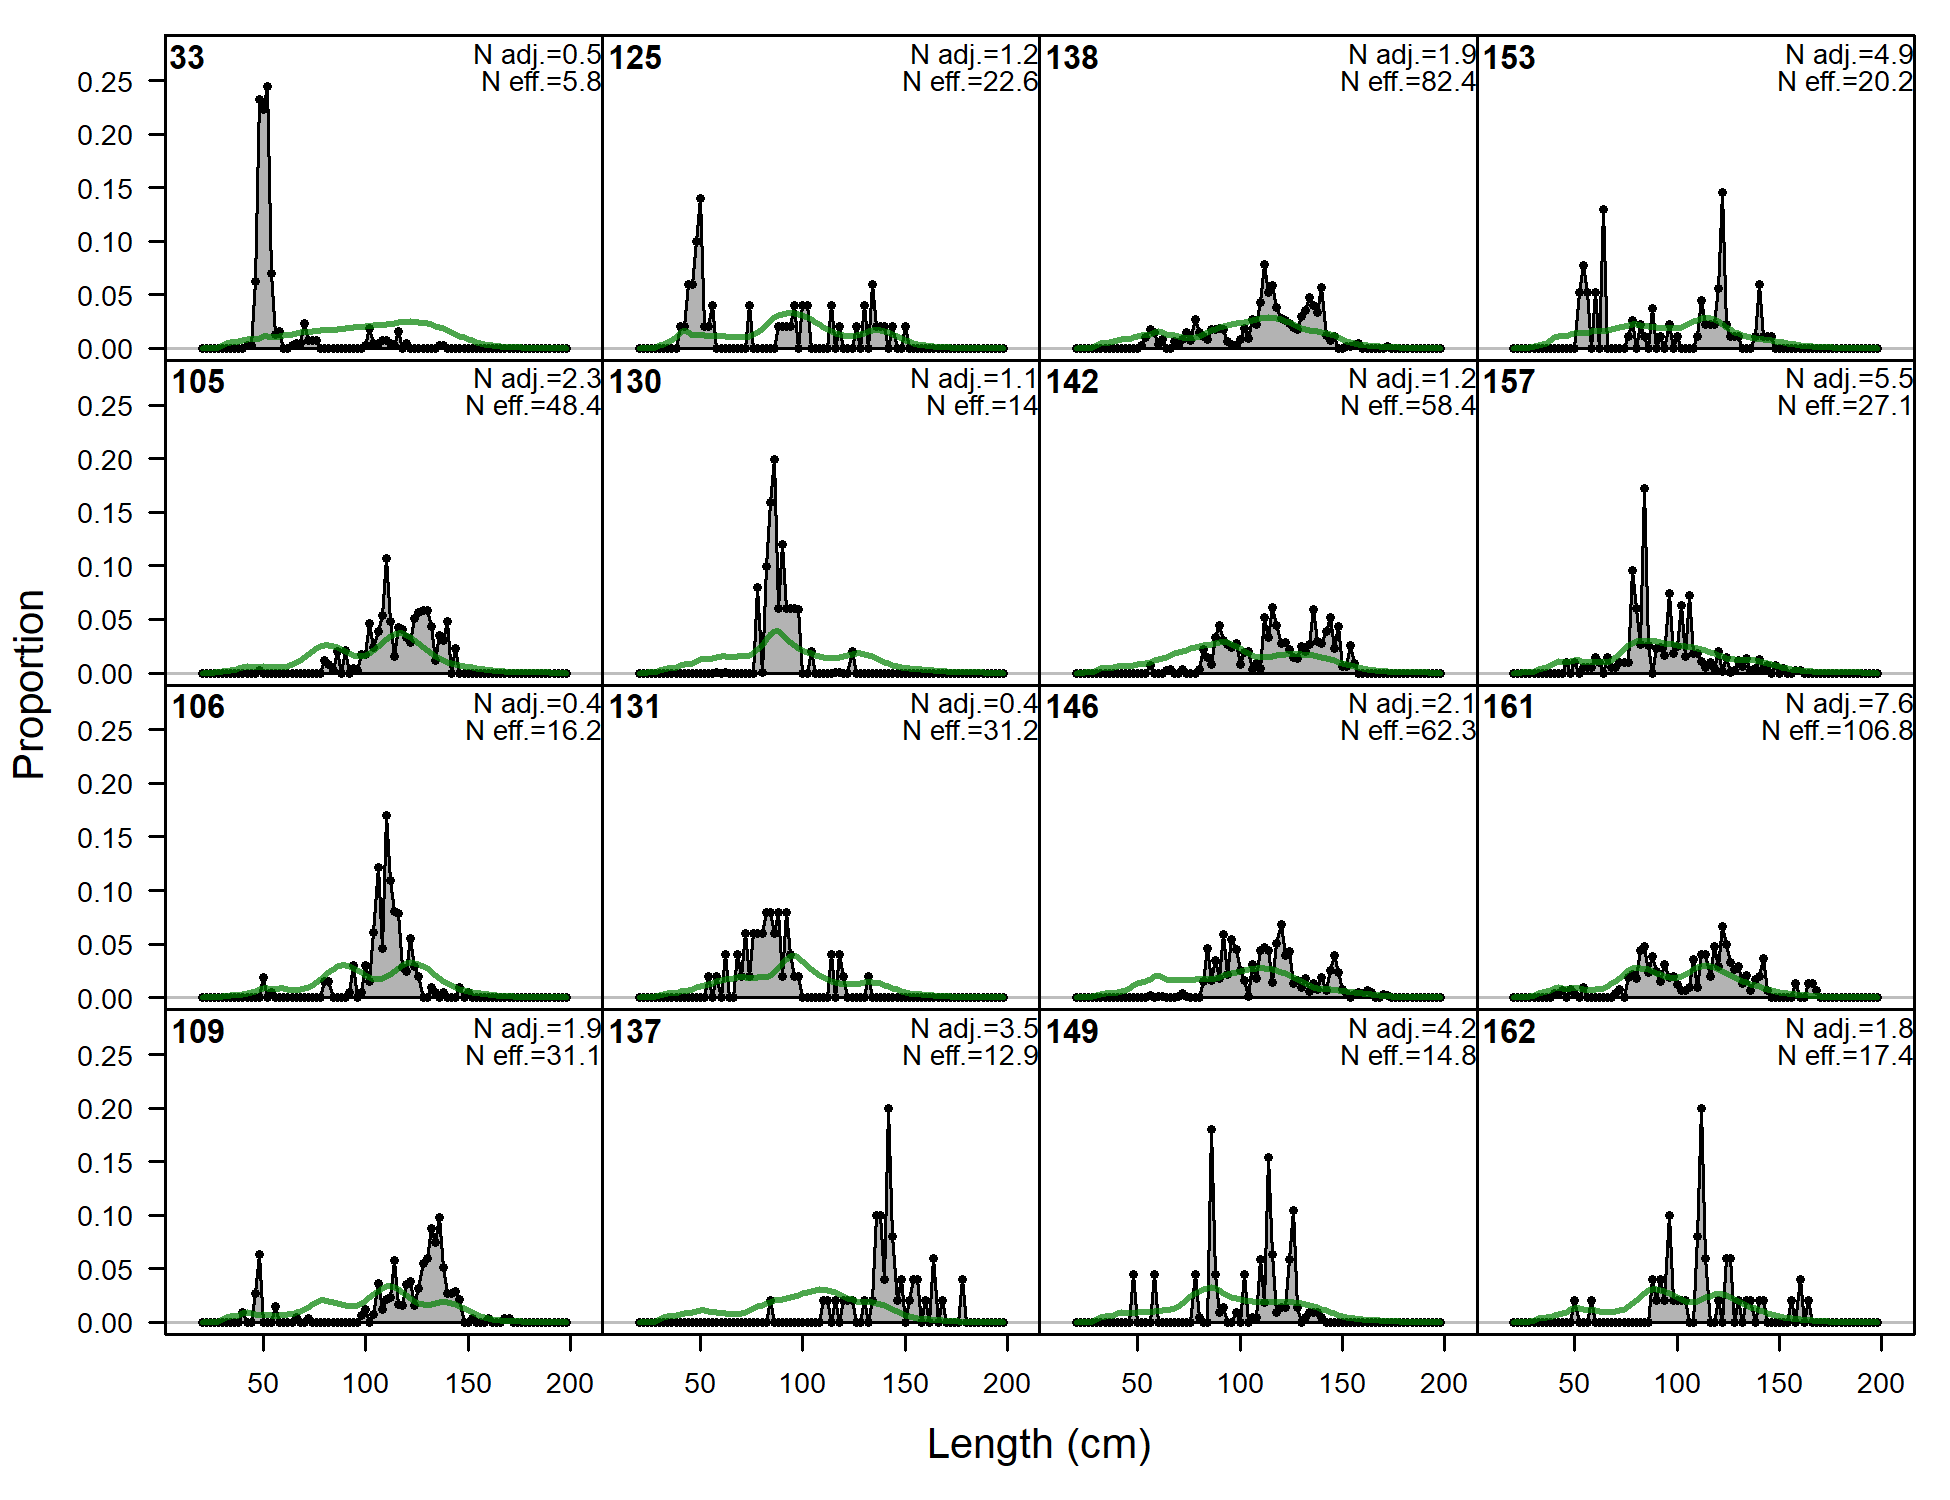
Length comps, whole catch, A5-LL-n (plot 1 of 8).
'N adj.' is the input sample size after data-weighting adjustment. N eff. is the calculated effective sample size used in the McAllister-Iannelli tuning method.
file: comp_lenfit_flt5mkt0_page1.png
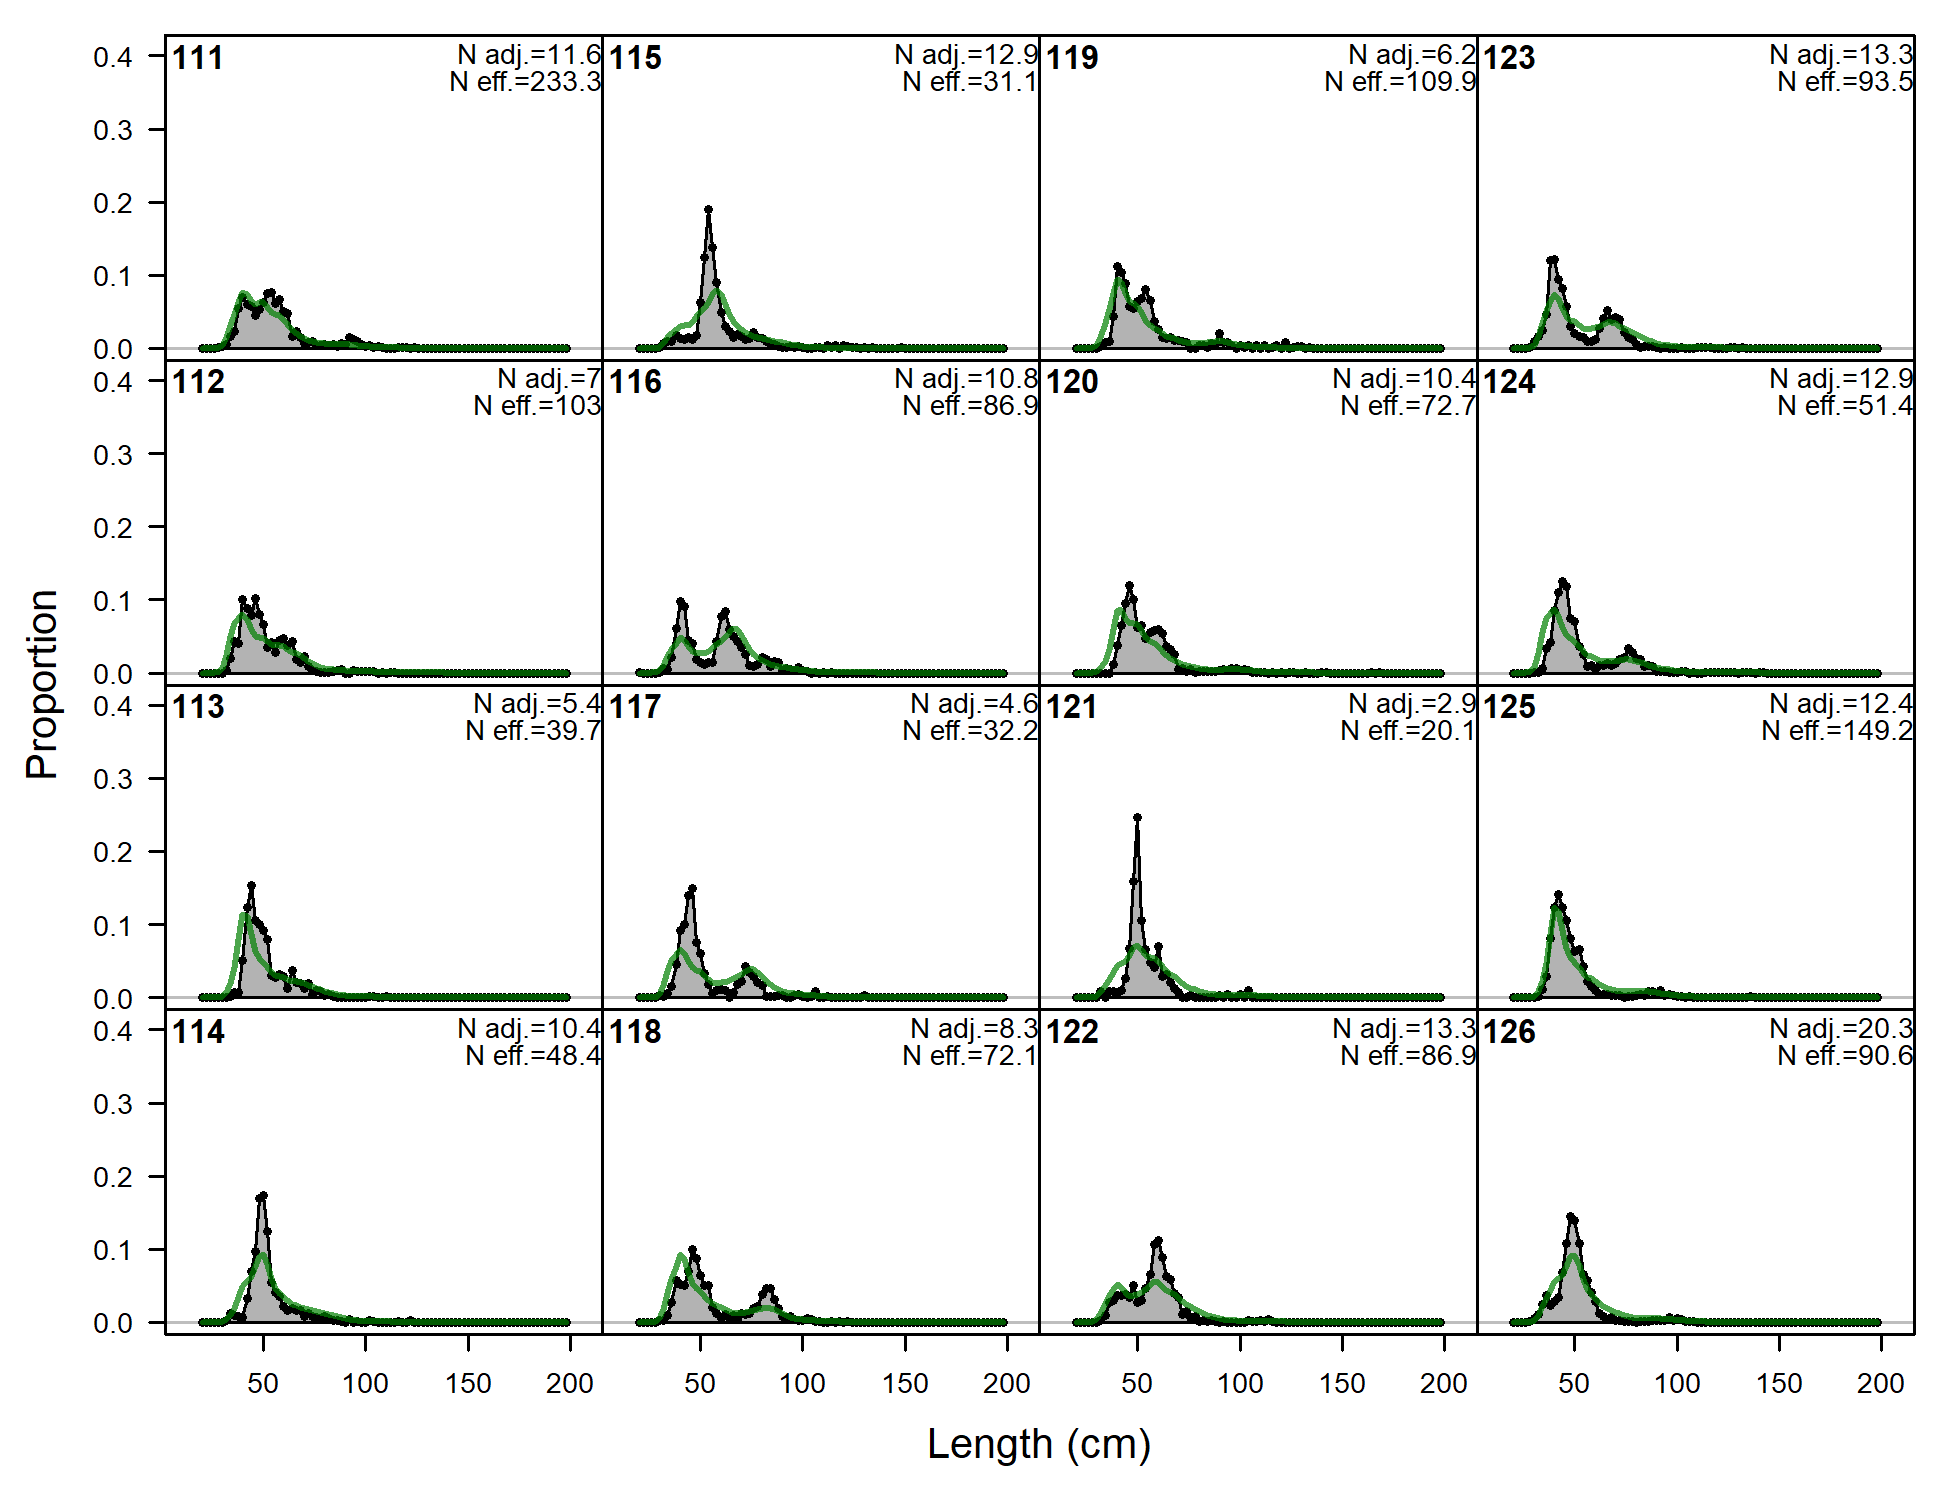
Length comps, whole catch, A5-LL-n (plot 2 of 8)
file: comp_lenfit_flt5mkt0_page2.png
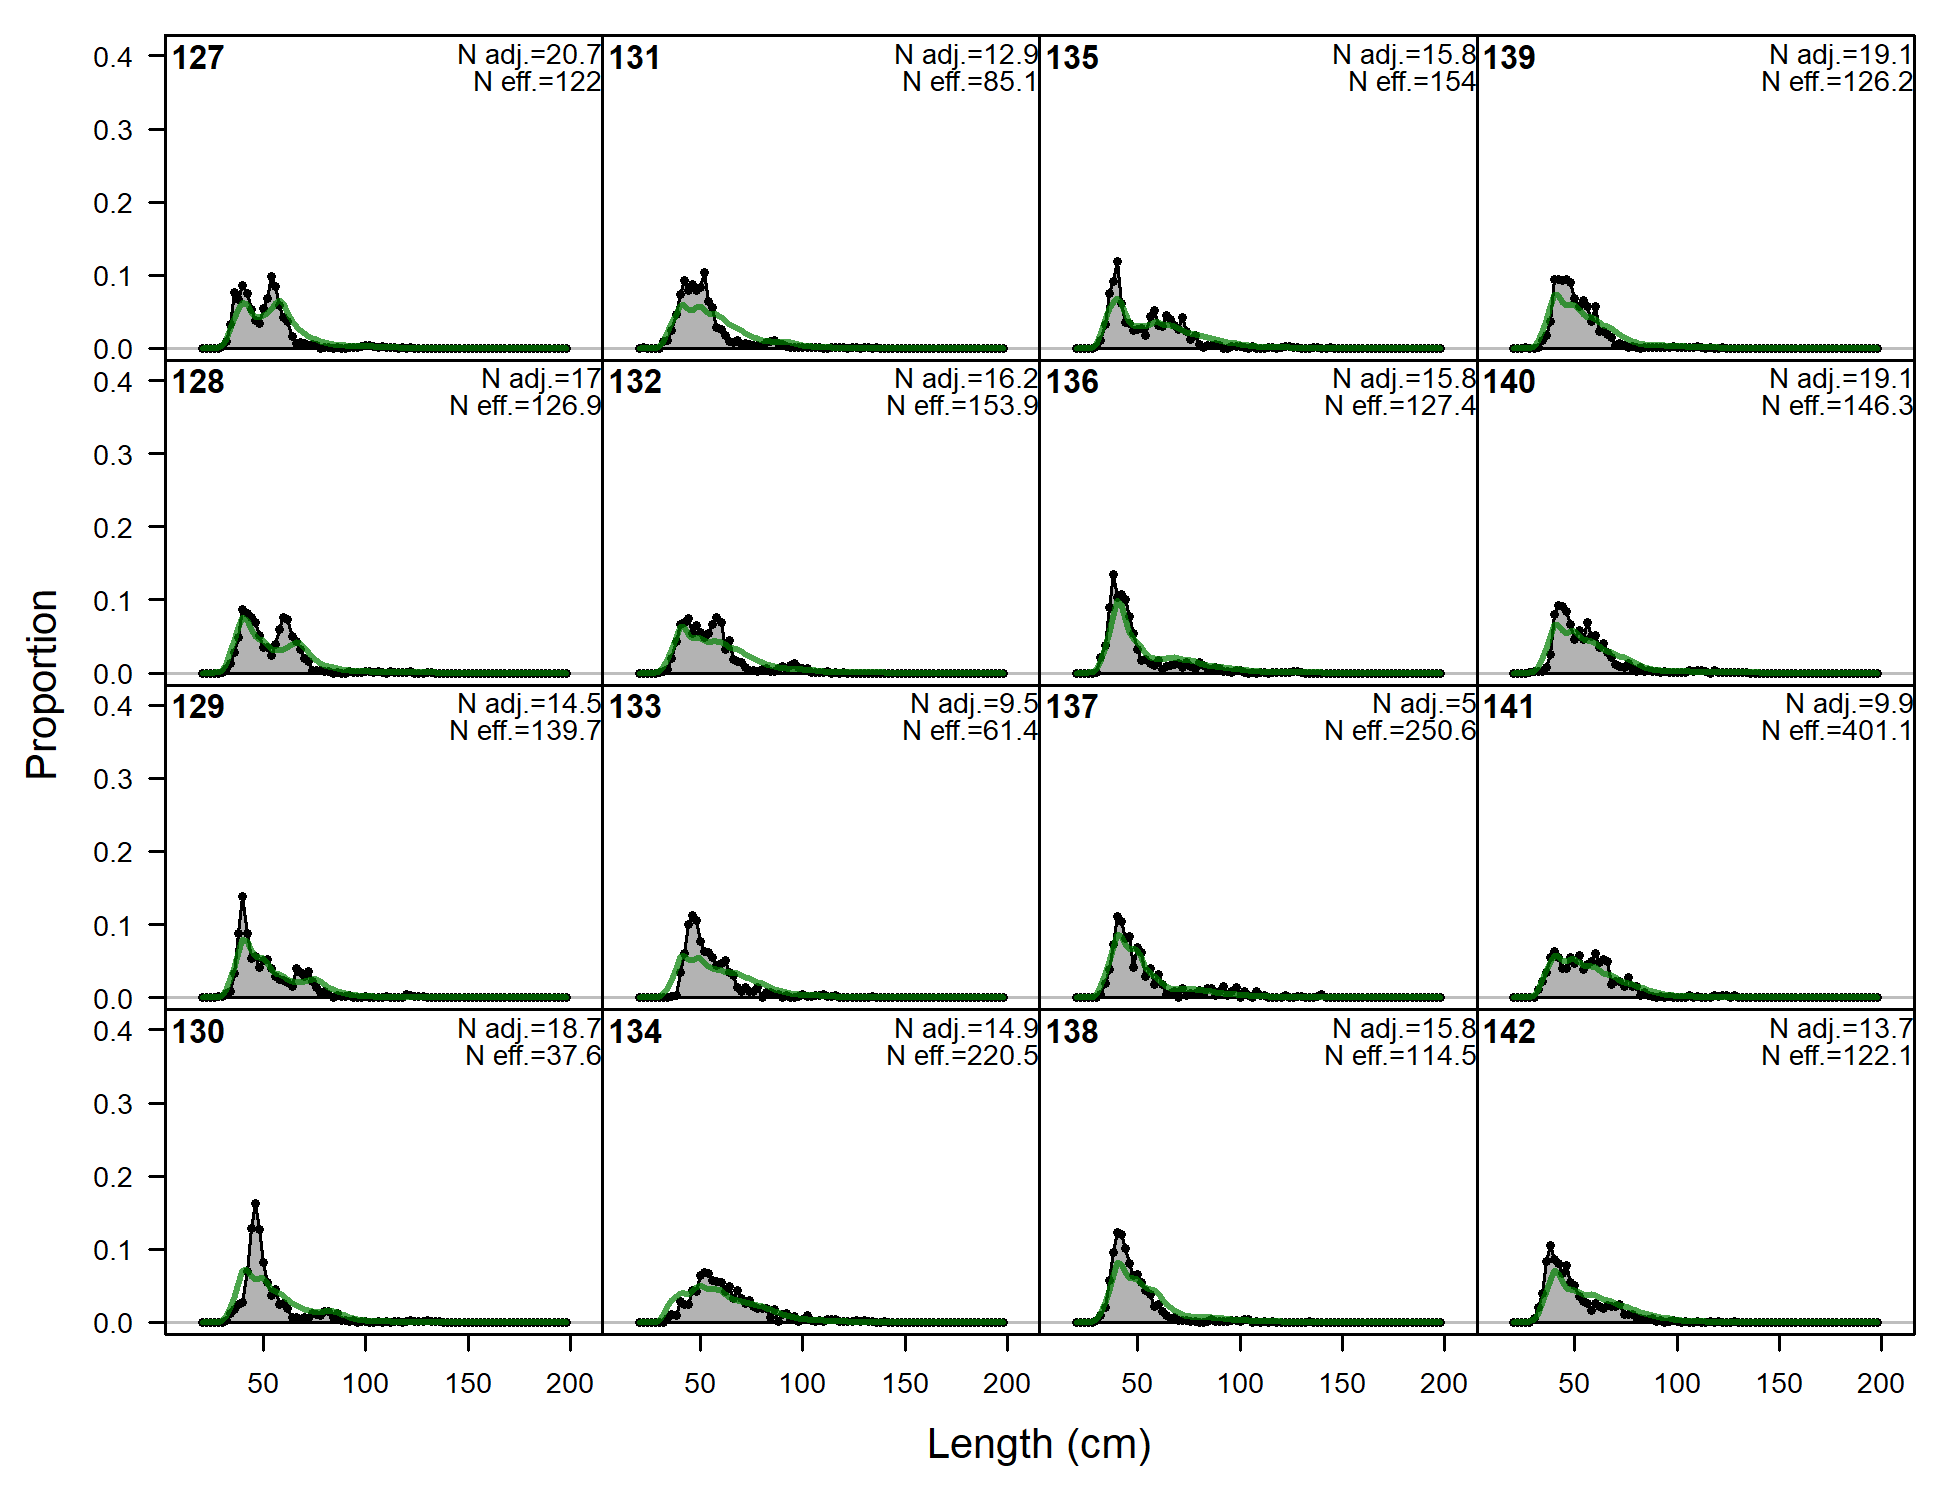
Length comps, whole catch, A5-LL-n (plot 3 of 8)
file: comp_lenfit_flt5mkt0_page3.png
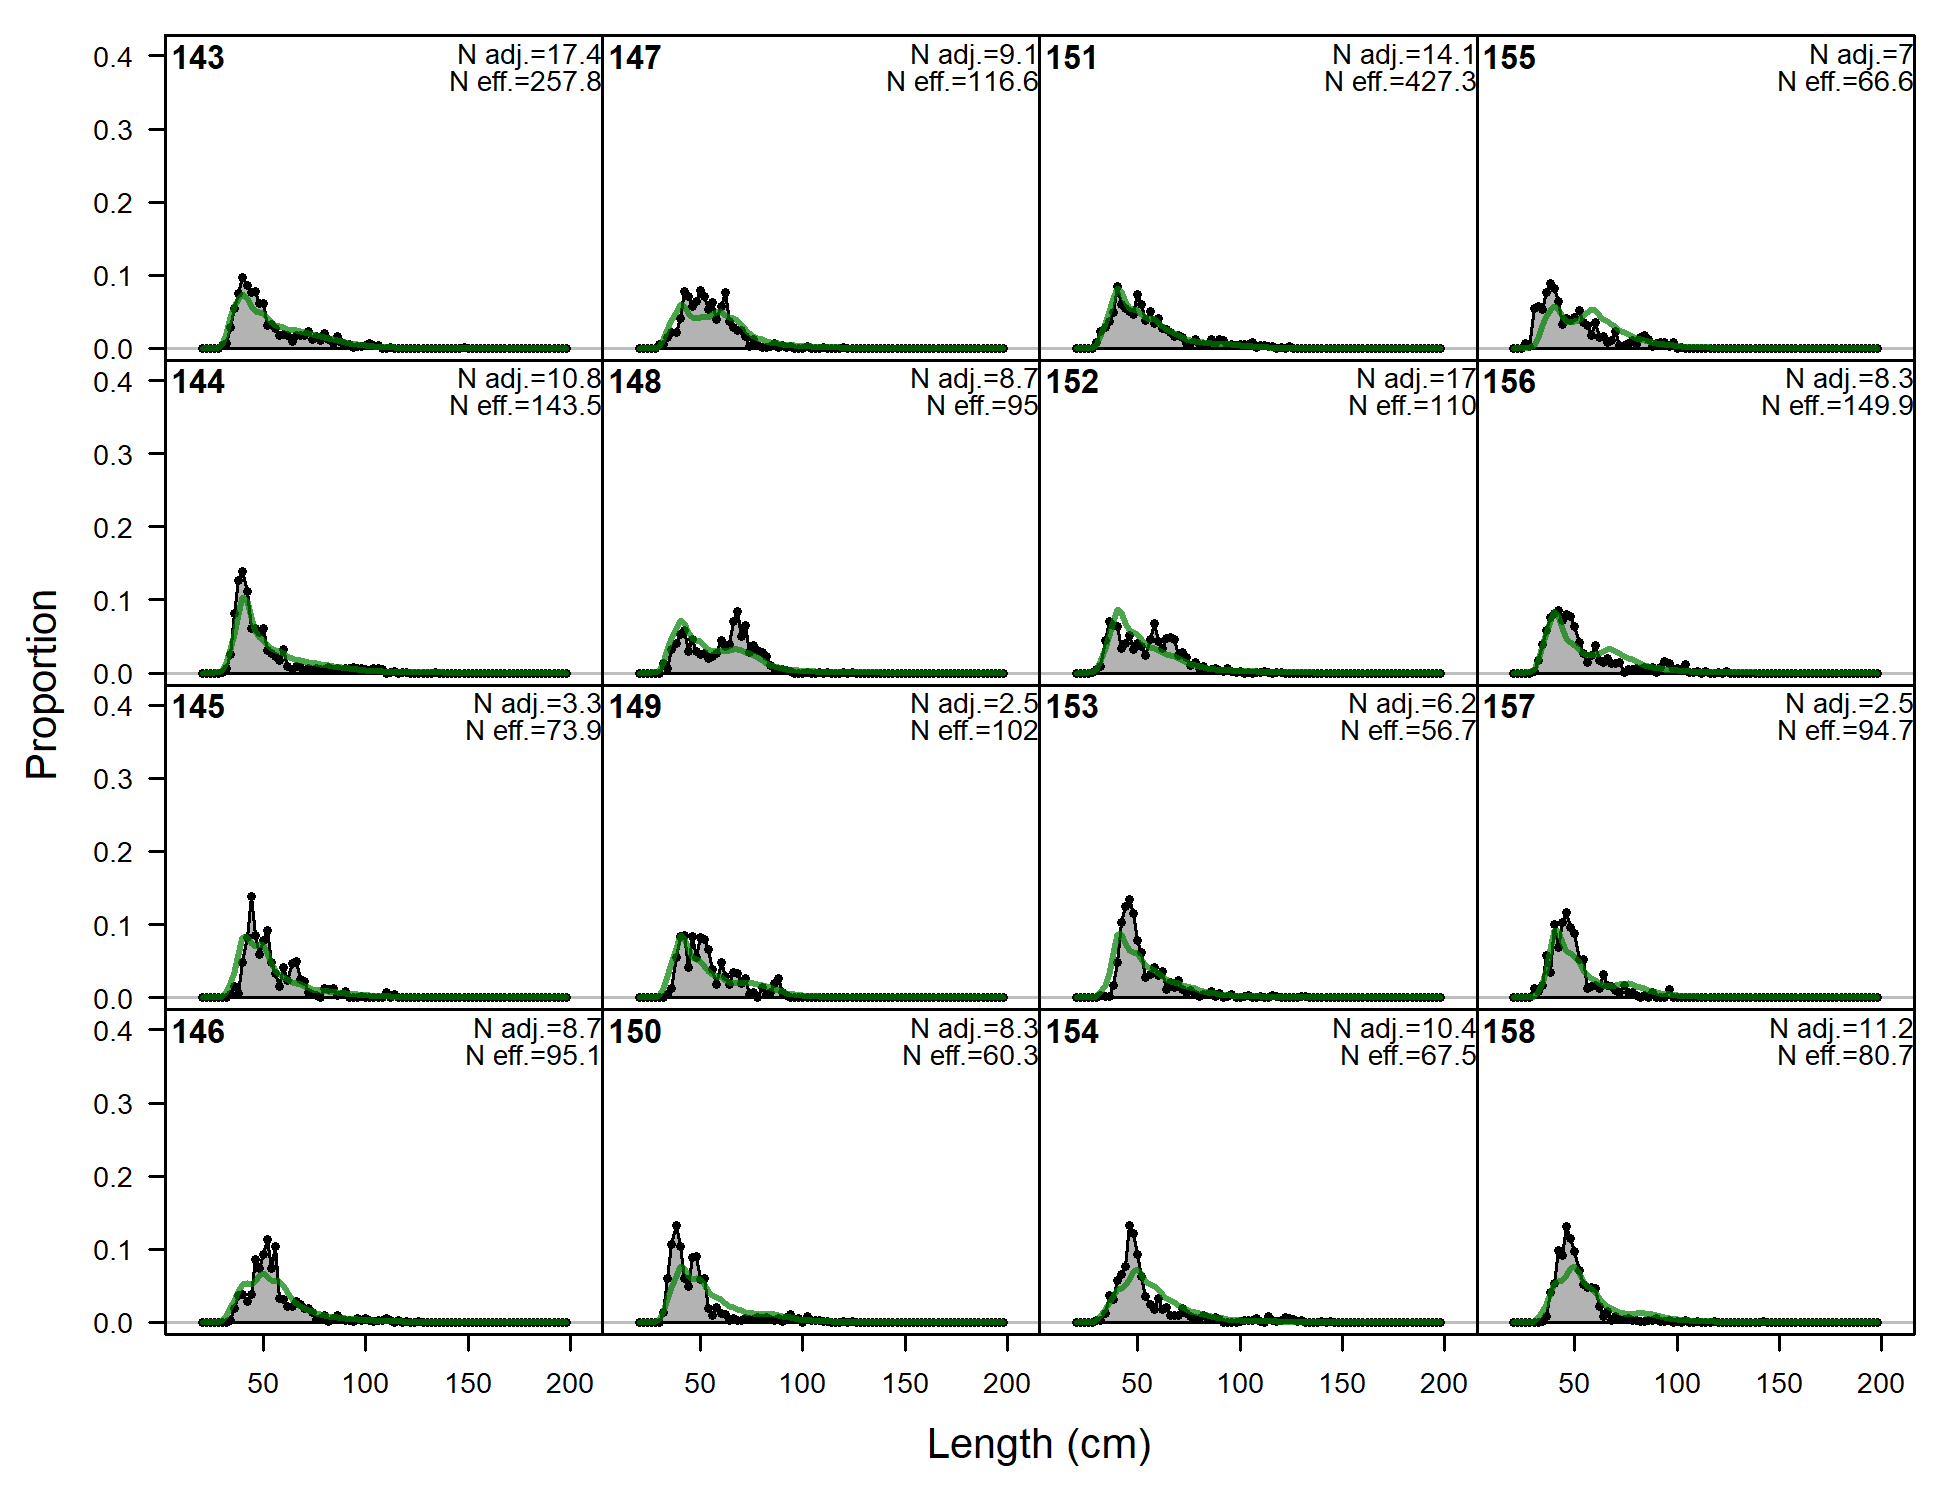
Length comps, whole catch, A5-LL-n (plot 4 of 8)
file: comp_lenfit_flt5mkt0_page4.png
Length comps, whole catch, A5-LL-n (plot 5 of 8)
file: comp_lenfit_flt5mkt0_page5.png
Length comps, whole catch, A5-LL-n (plot 6 of 8)
file: comp_lenfit_flt5mkt0_page6.png
Length comps, whole catch, A5-LL-n (plot 7 of 8)
file: comp_lenfit_flt5mkt0_page7.png
Length comps, whole catch, A5-LL-n (plot 8 of 8)
file: comp_lenfit_flt5mkt0_page8.png
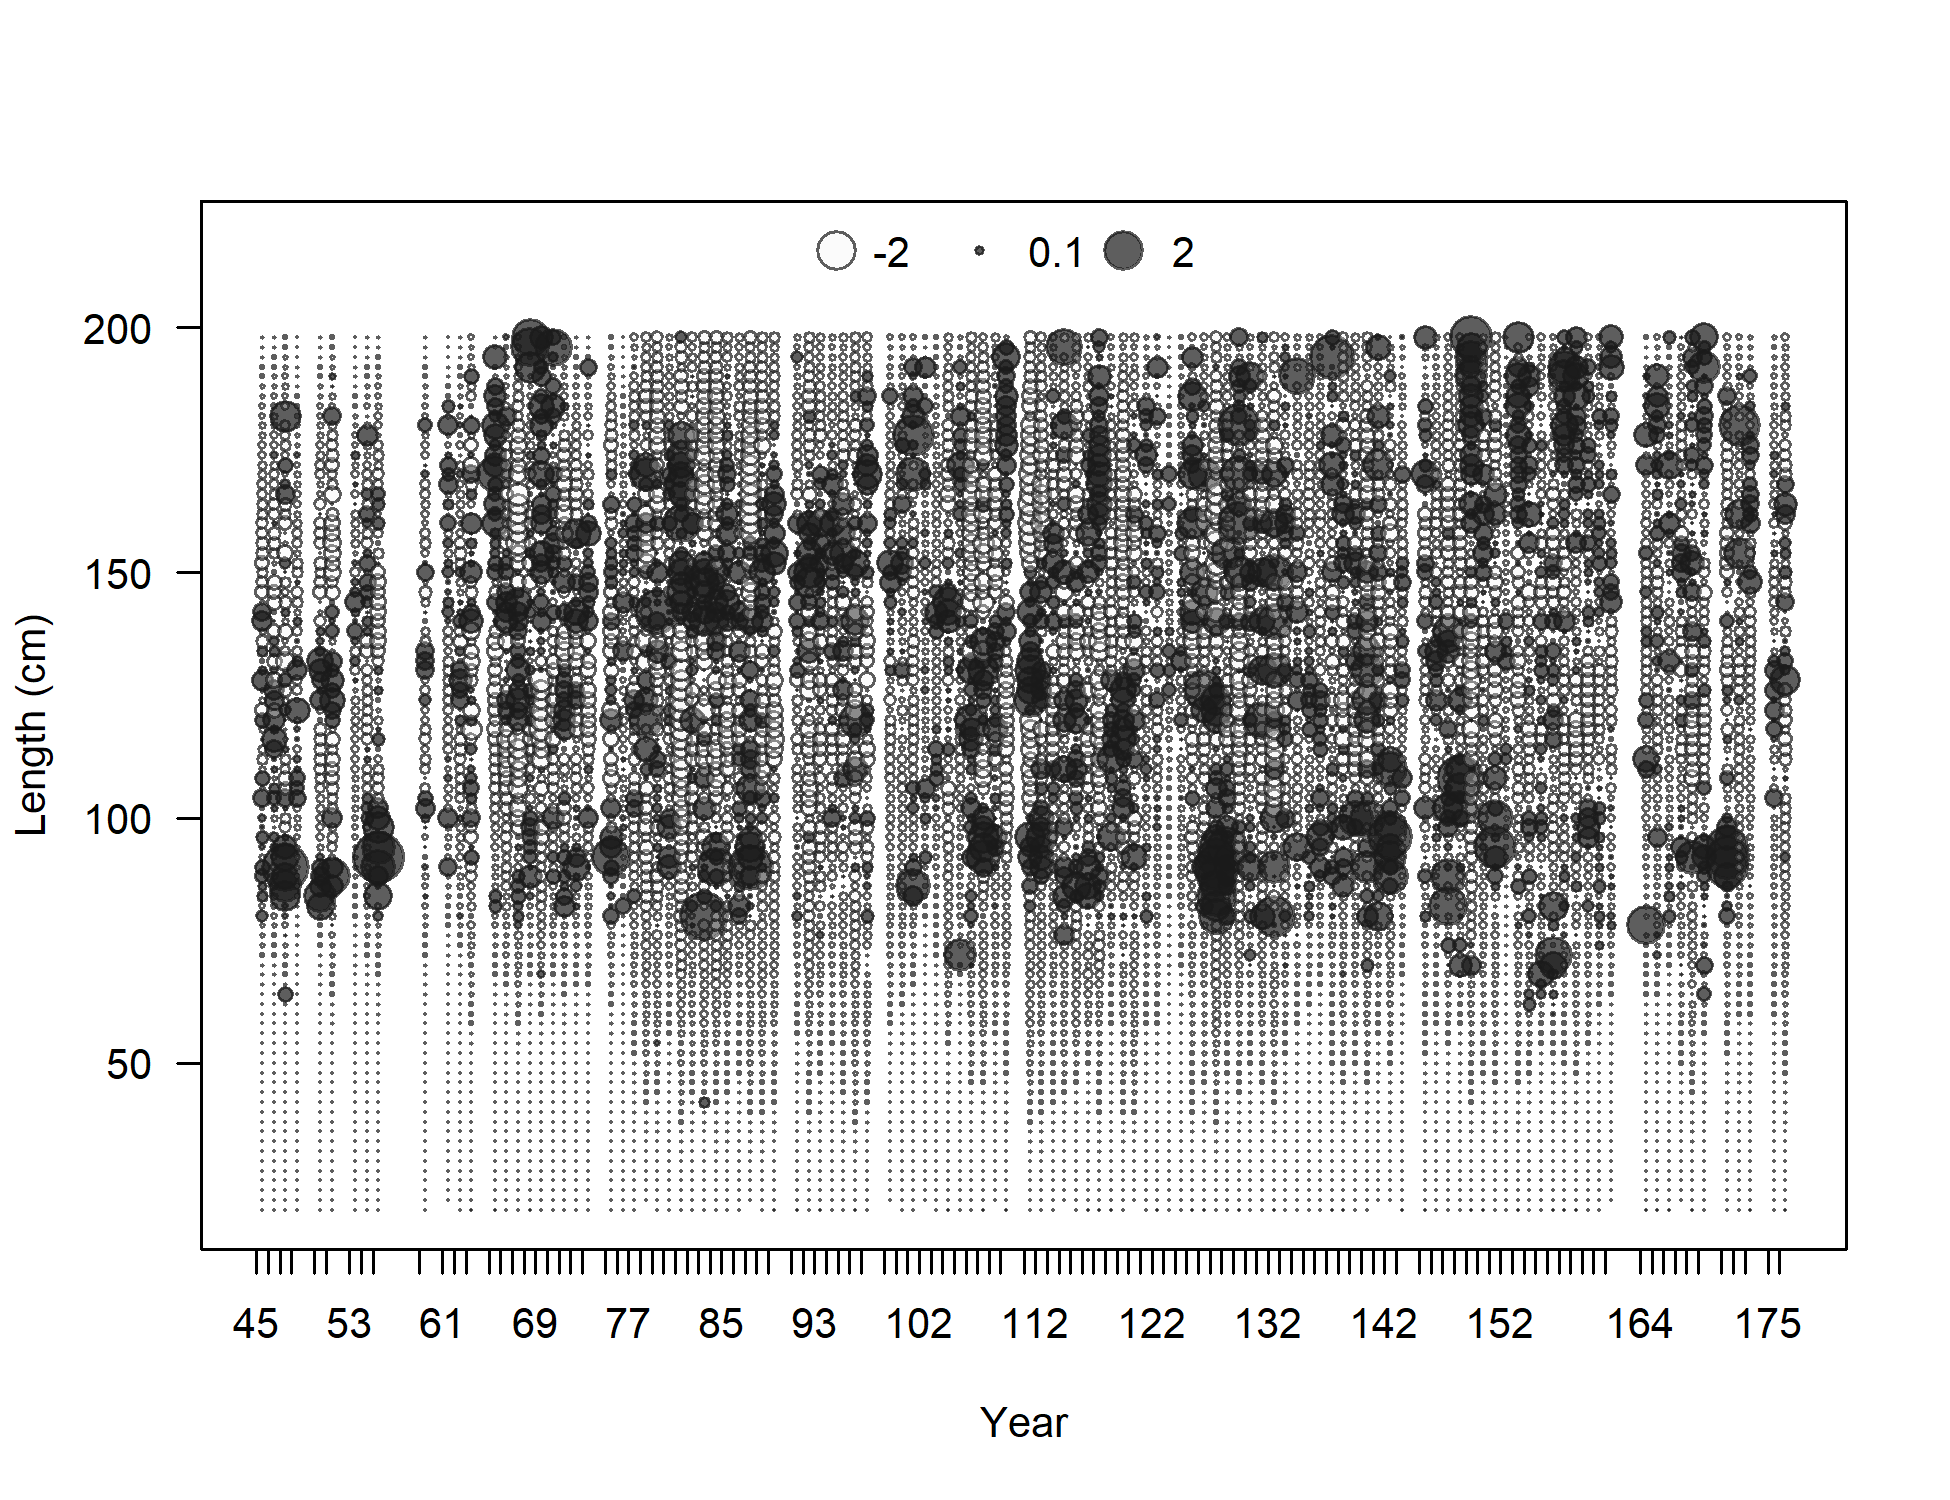
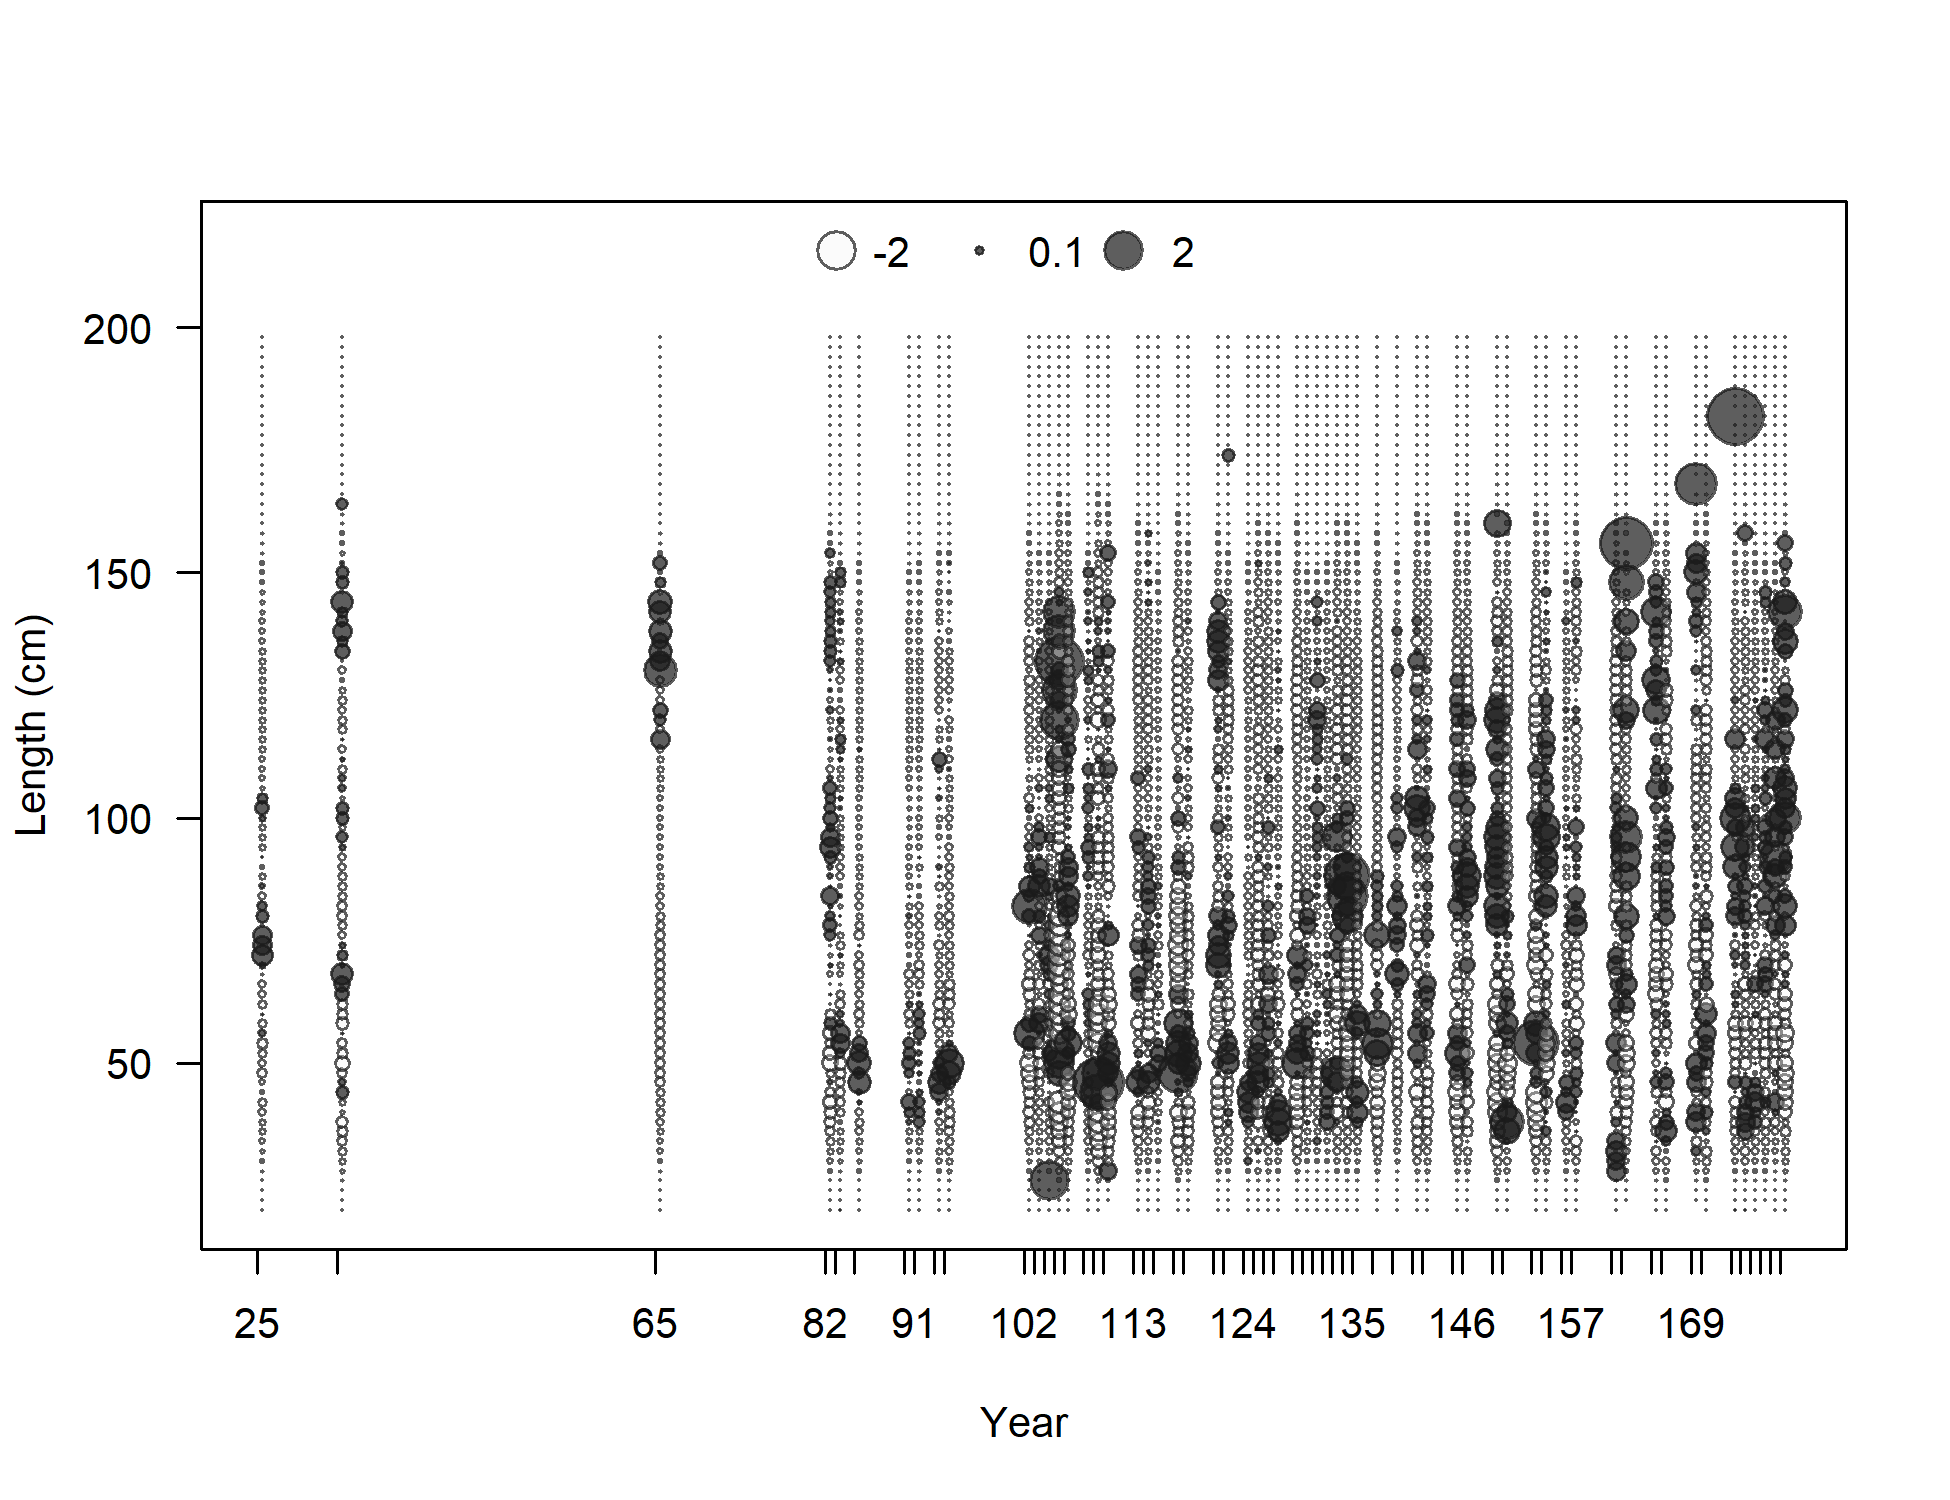
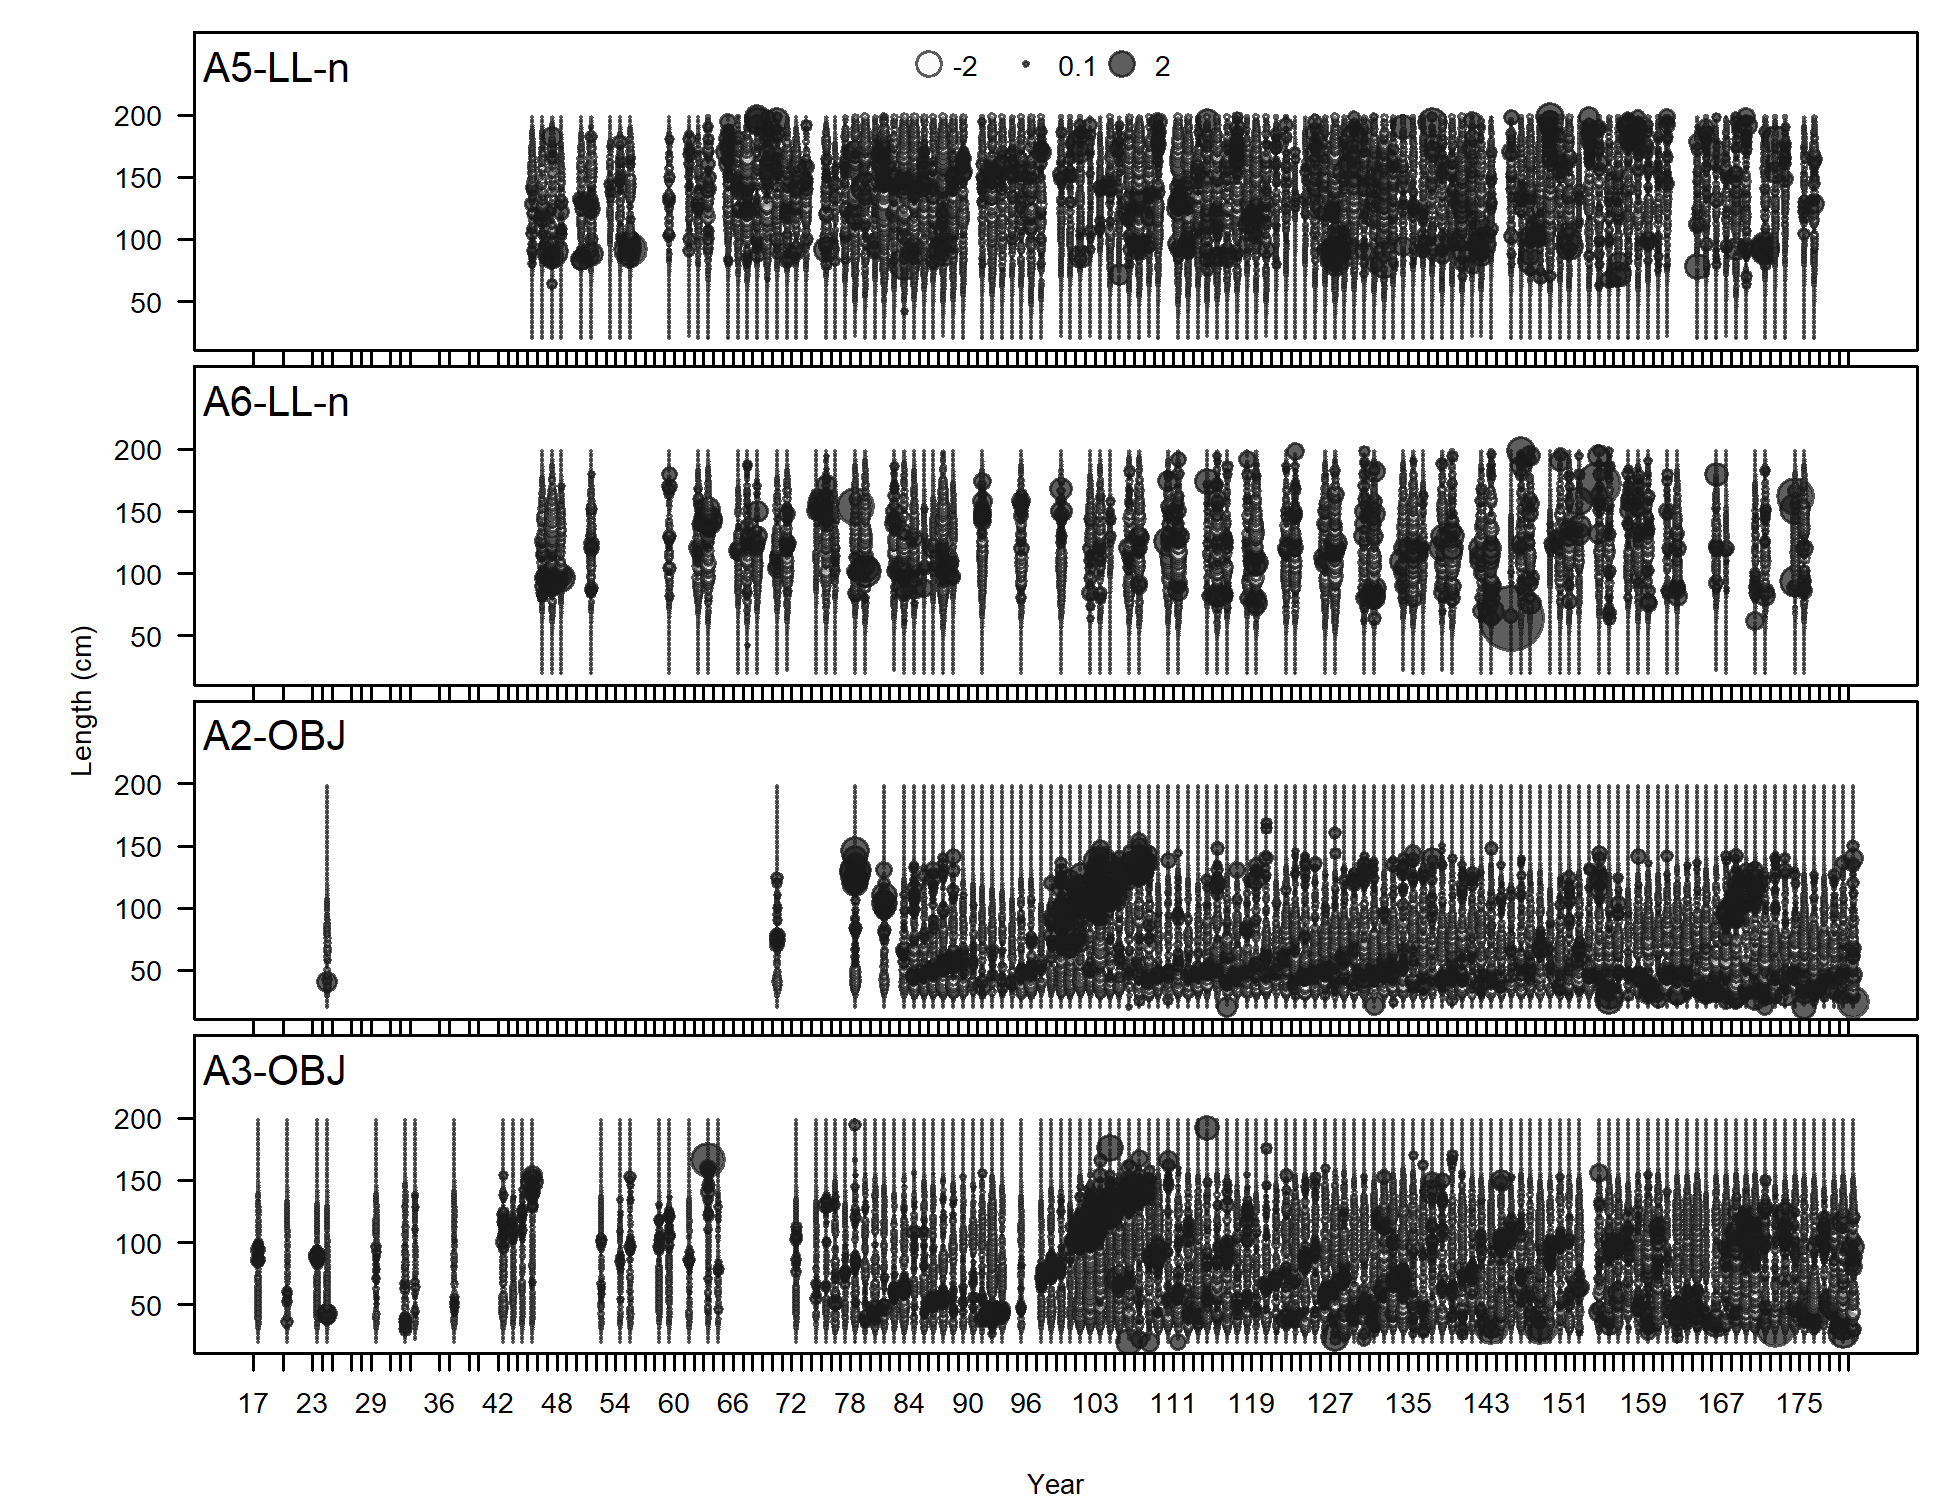
Pearson residuals, whole catch, A5-LL-n (max=3.35) (plot 8 of 8)
Closed bubbles are positive residuals (observed > expected) and open bubbles are negative residuals (observed < expected).
file: comp_lenfit_residsflt5mkt0_page8.png
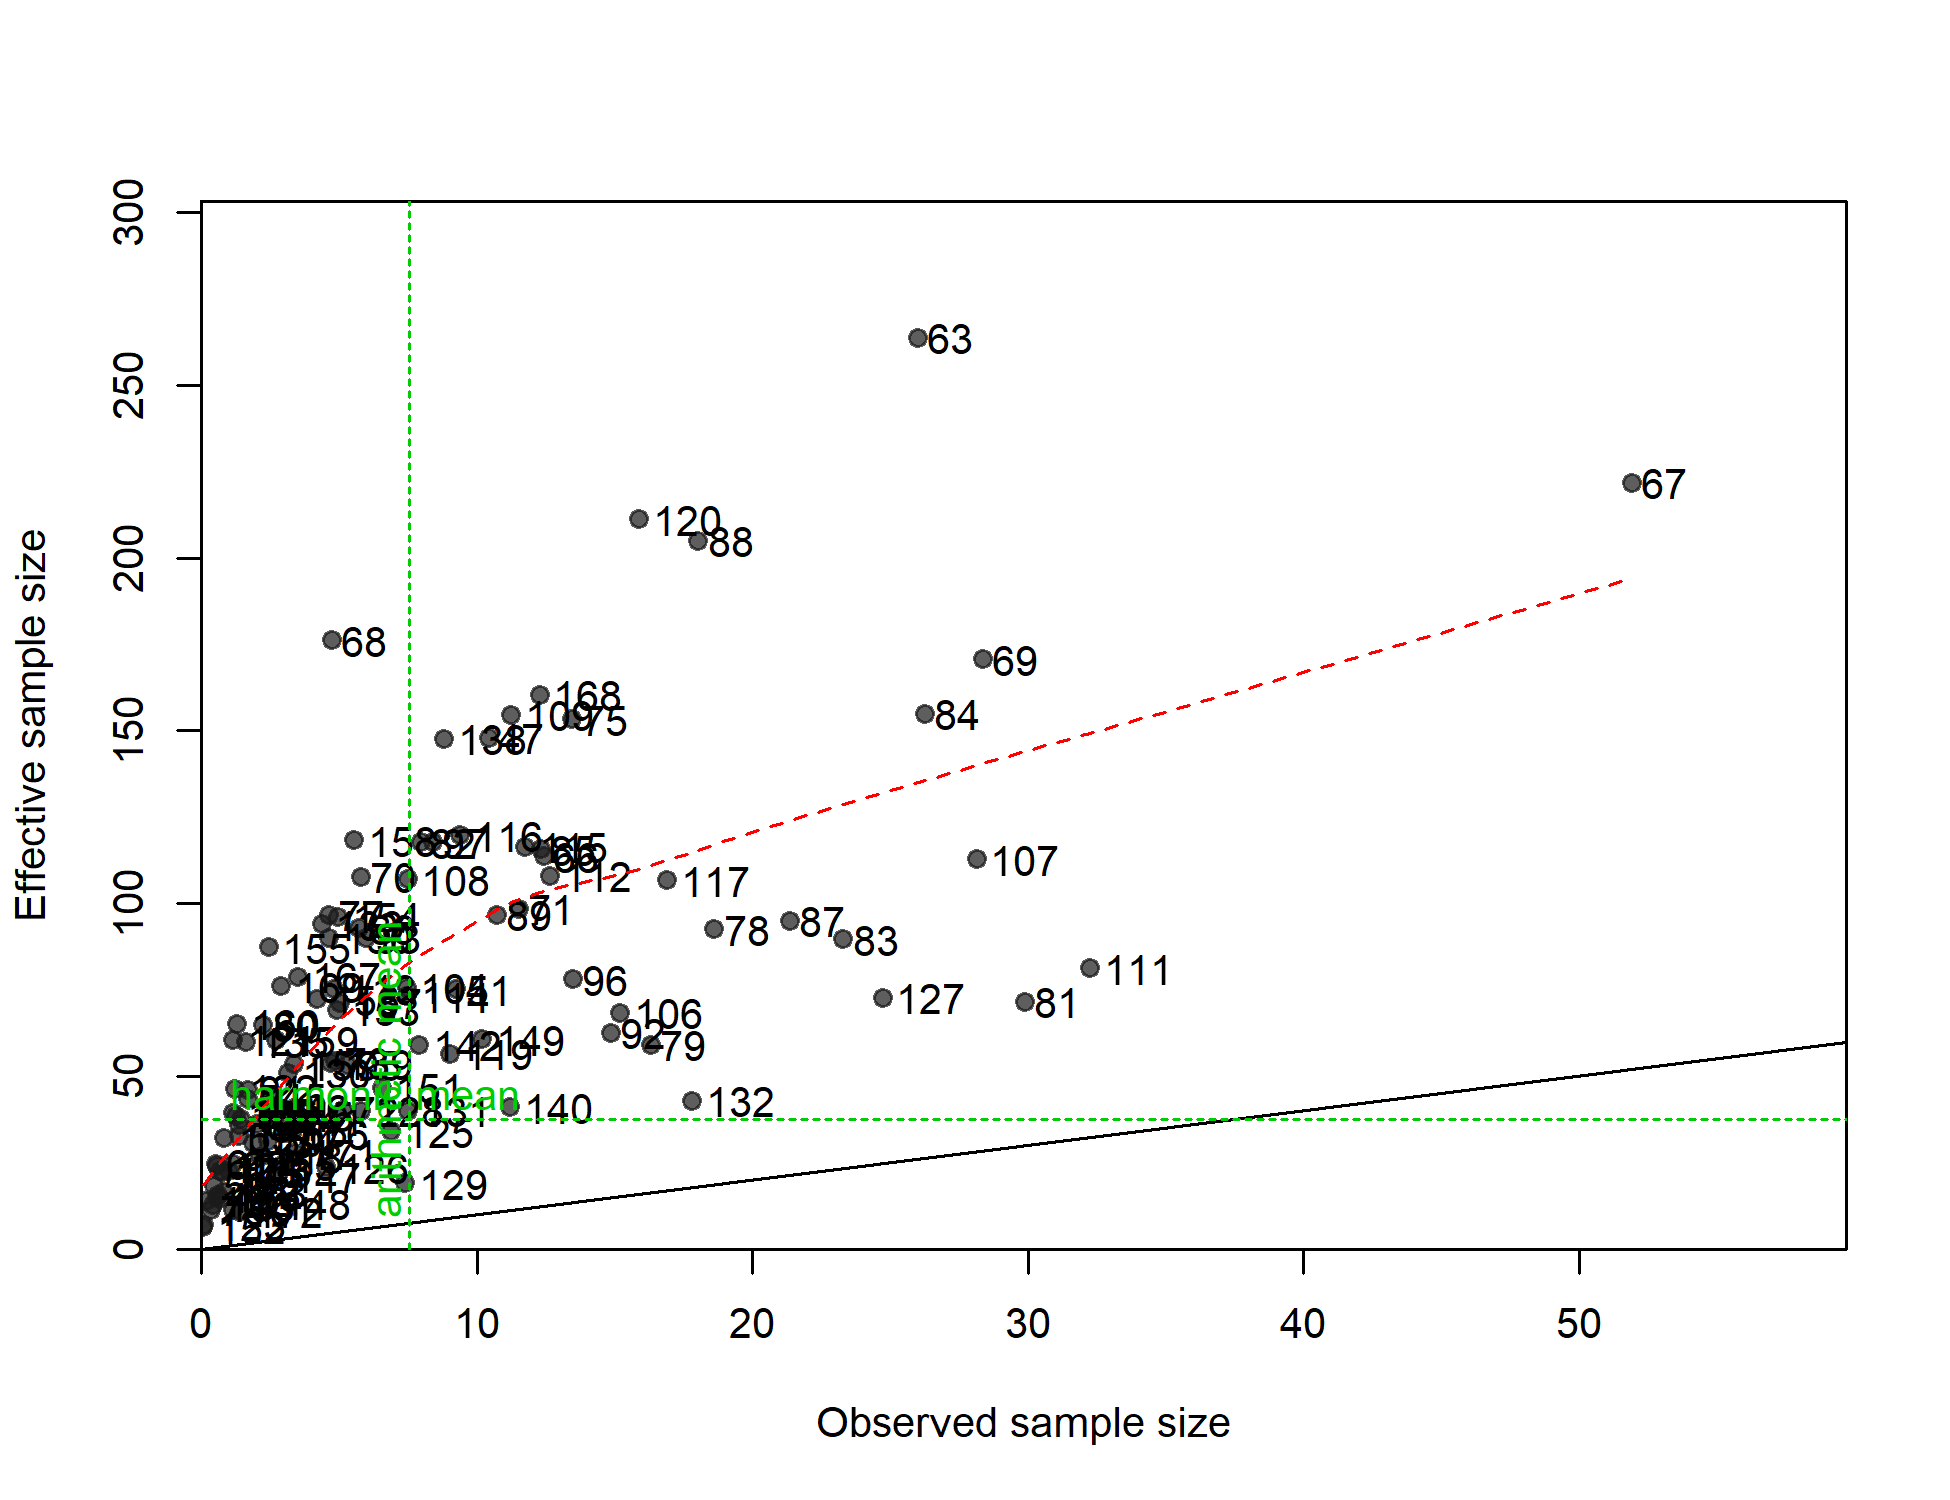
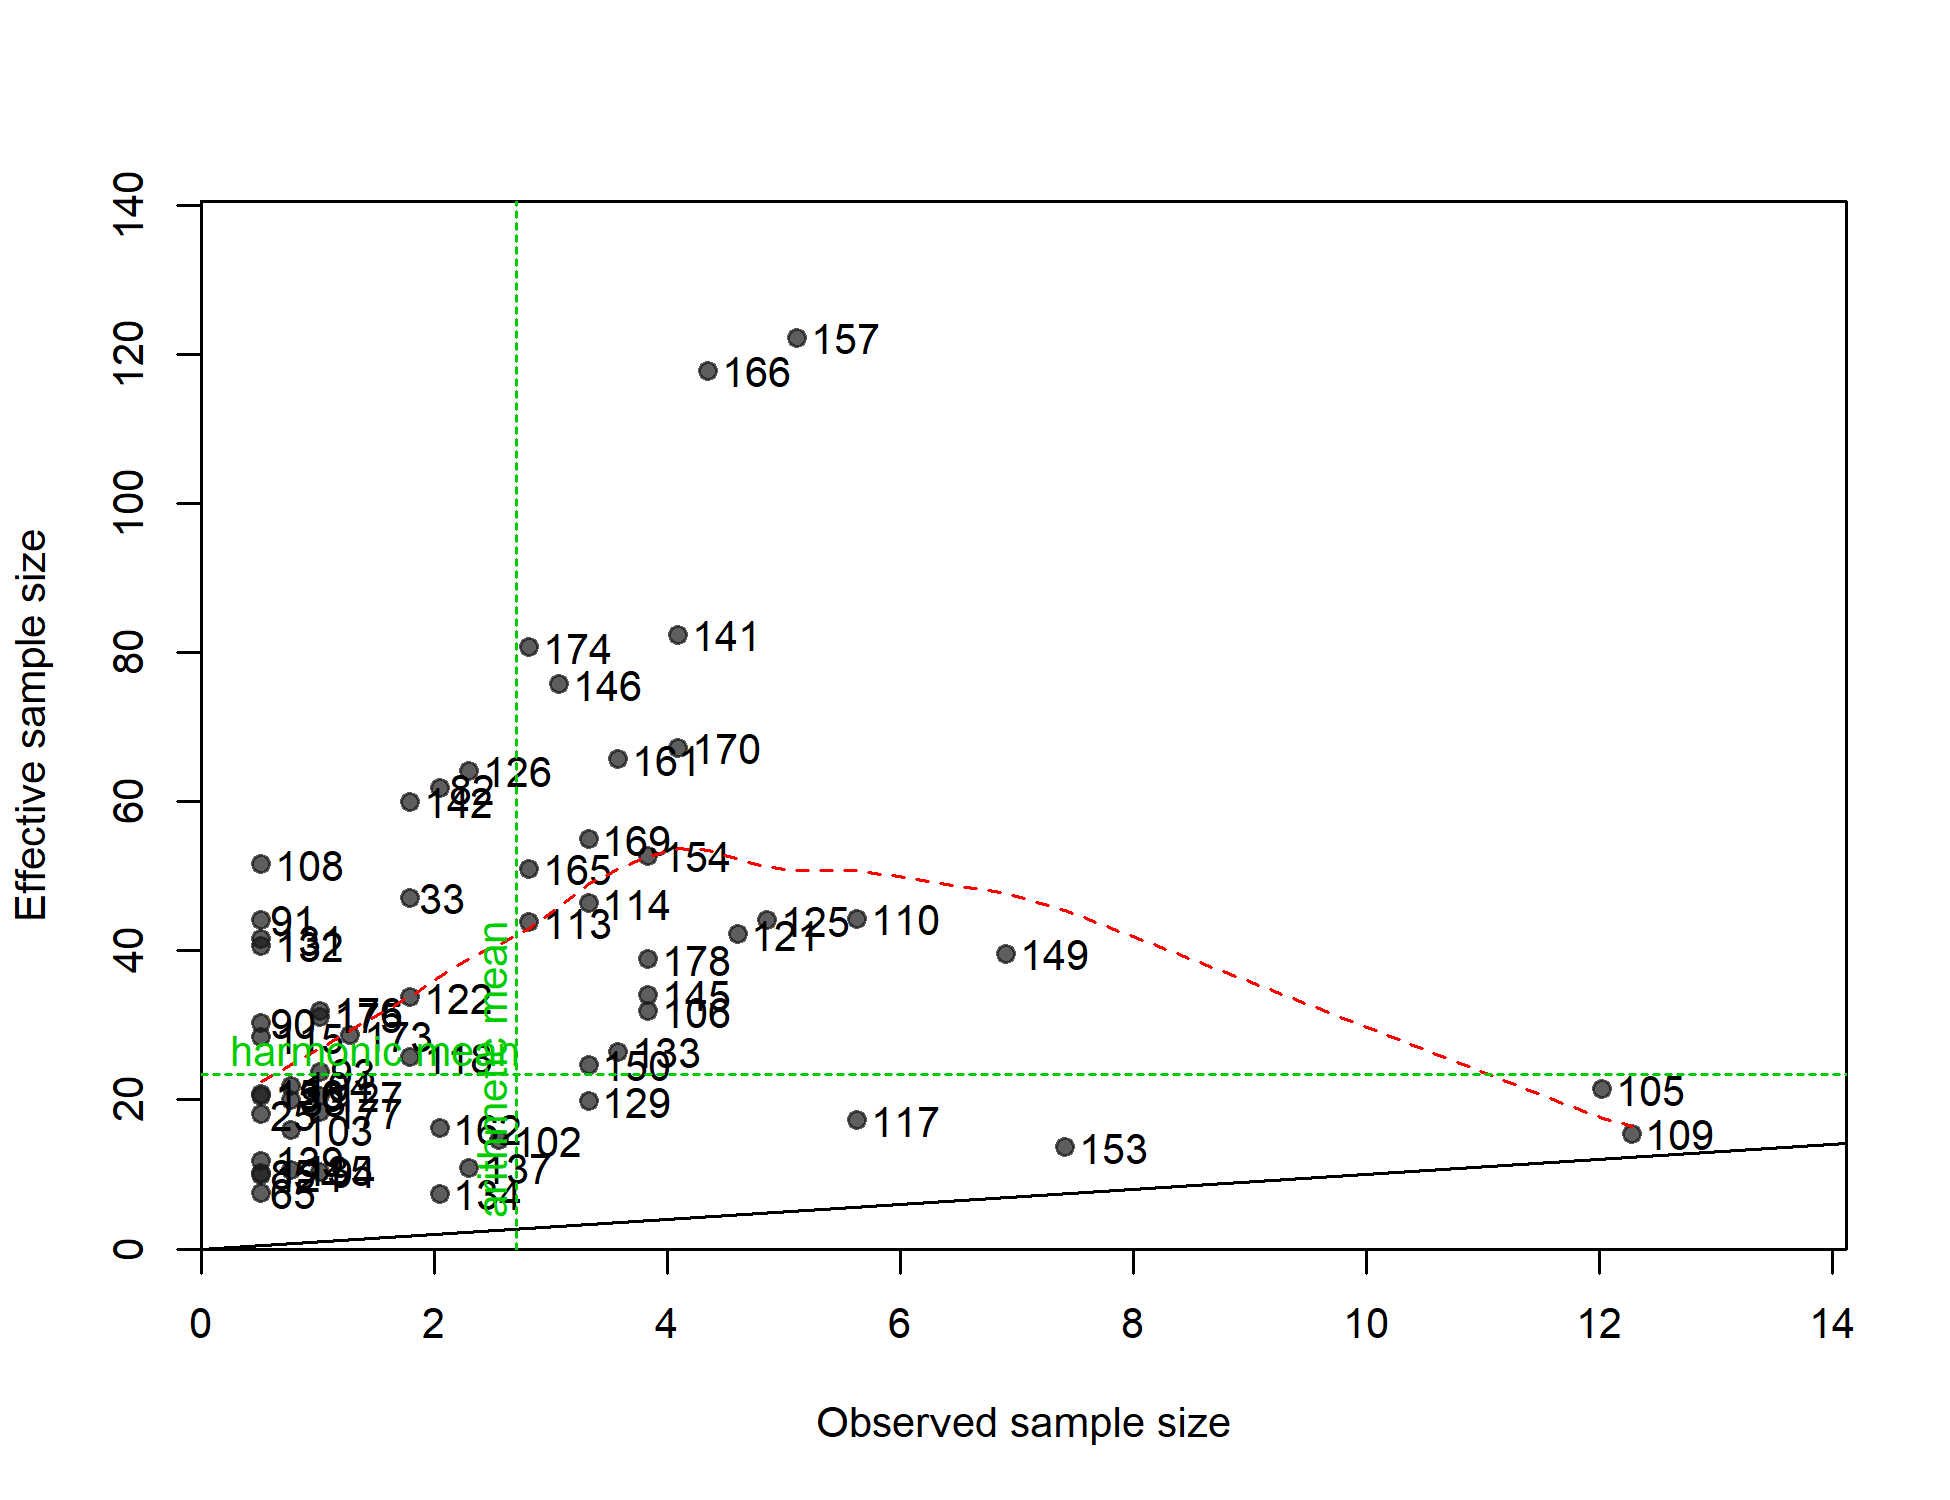
N-EffN comparison, Length comps, whole catch, A5-LL-n
file: comp_lenfit_sampsize_flt5mkt0.png
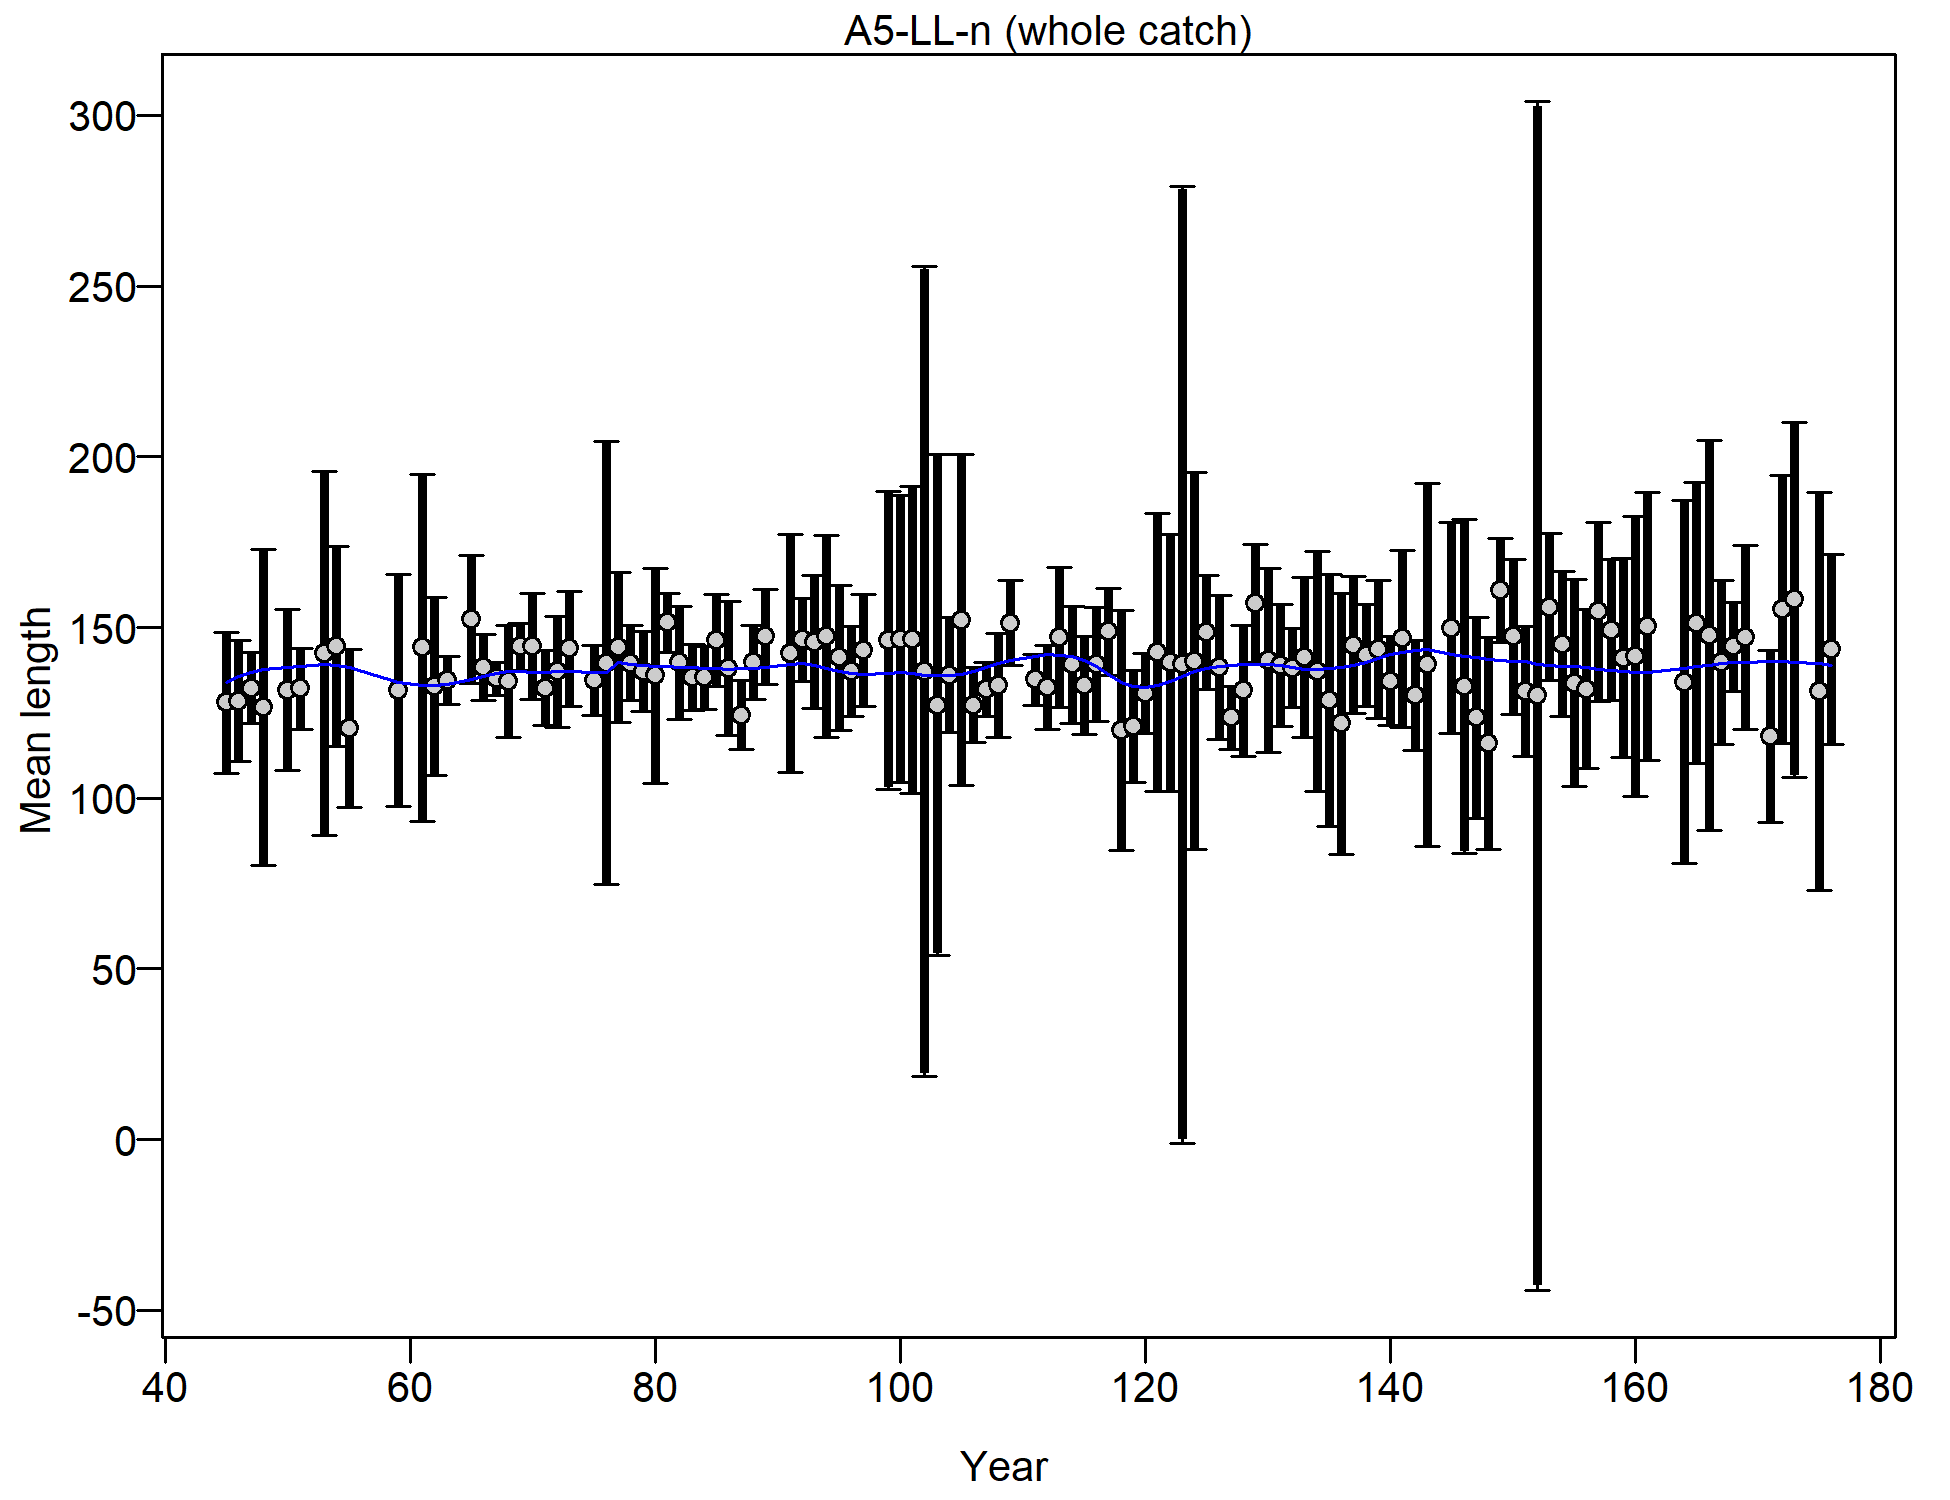
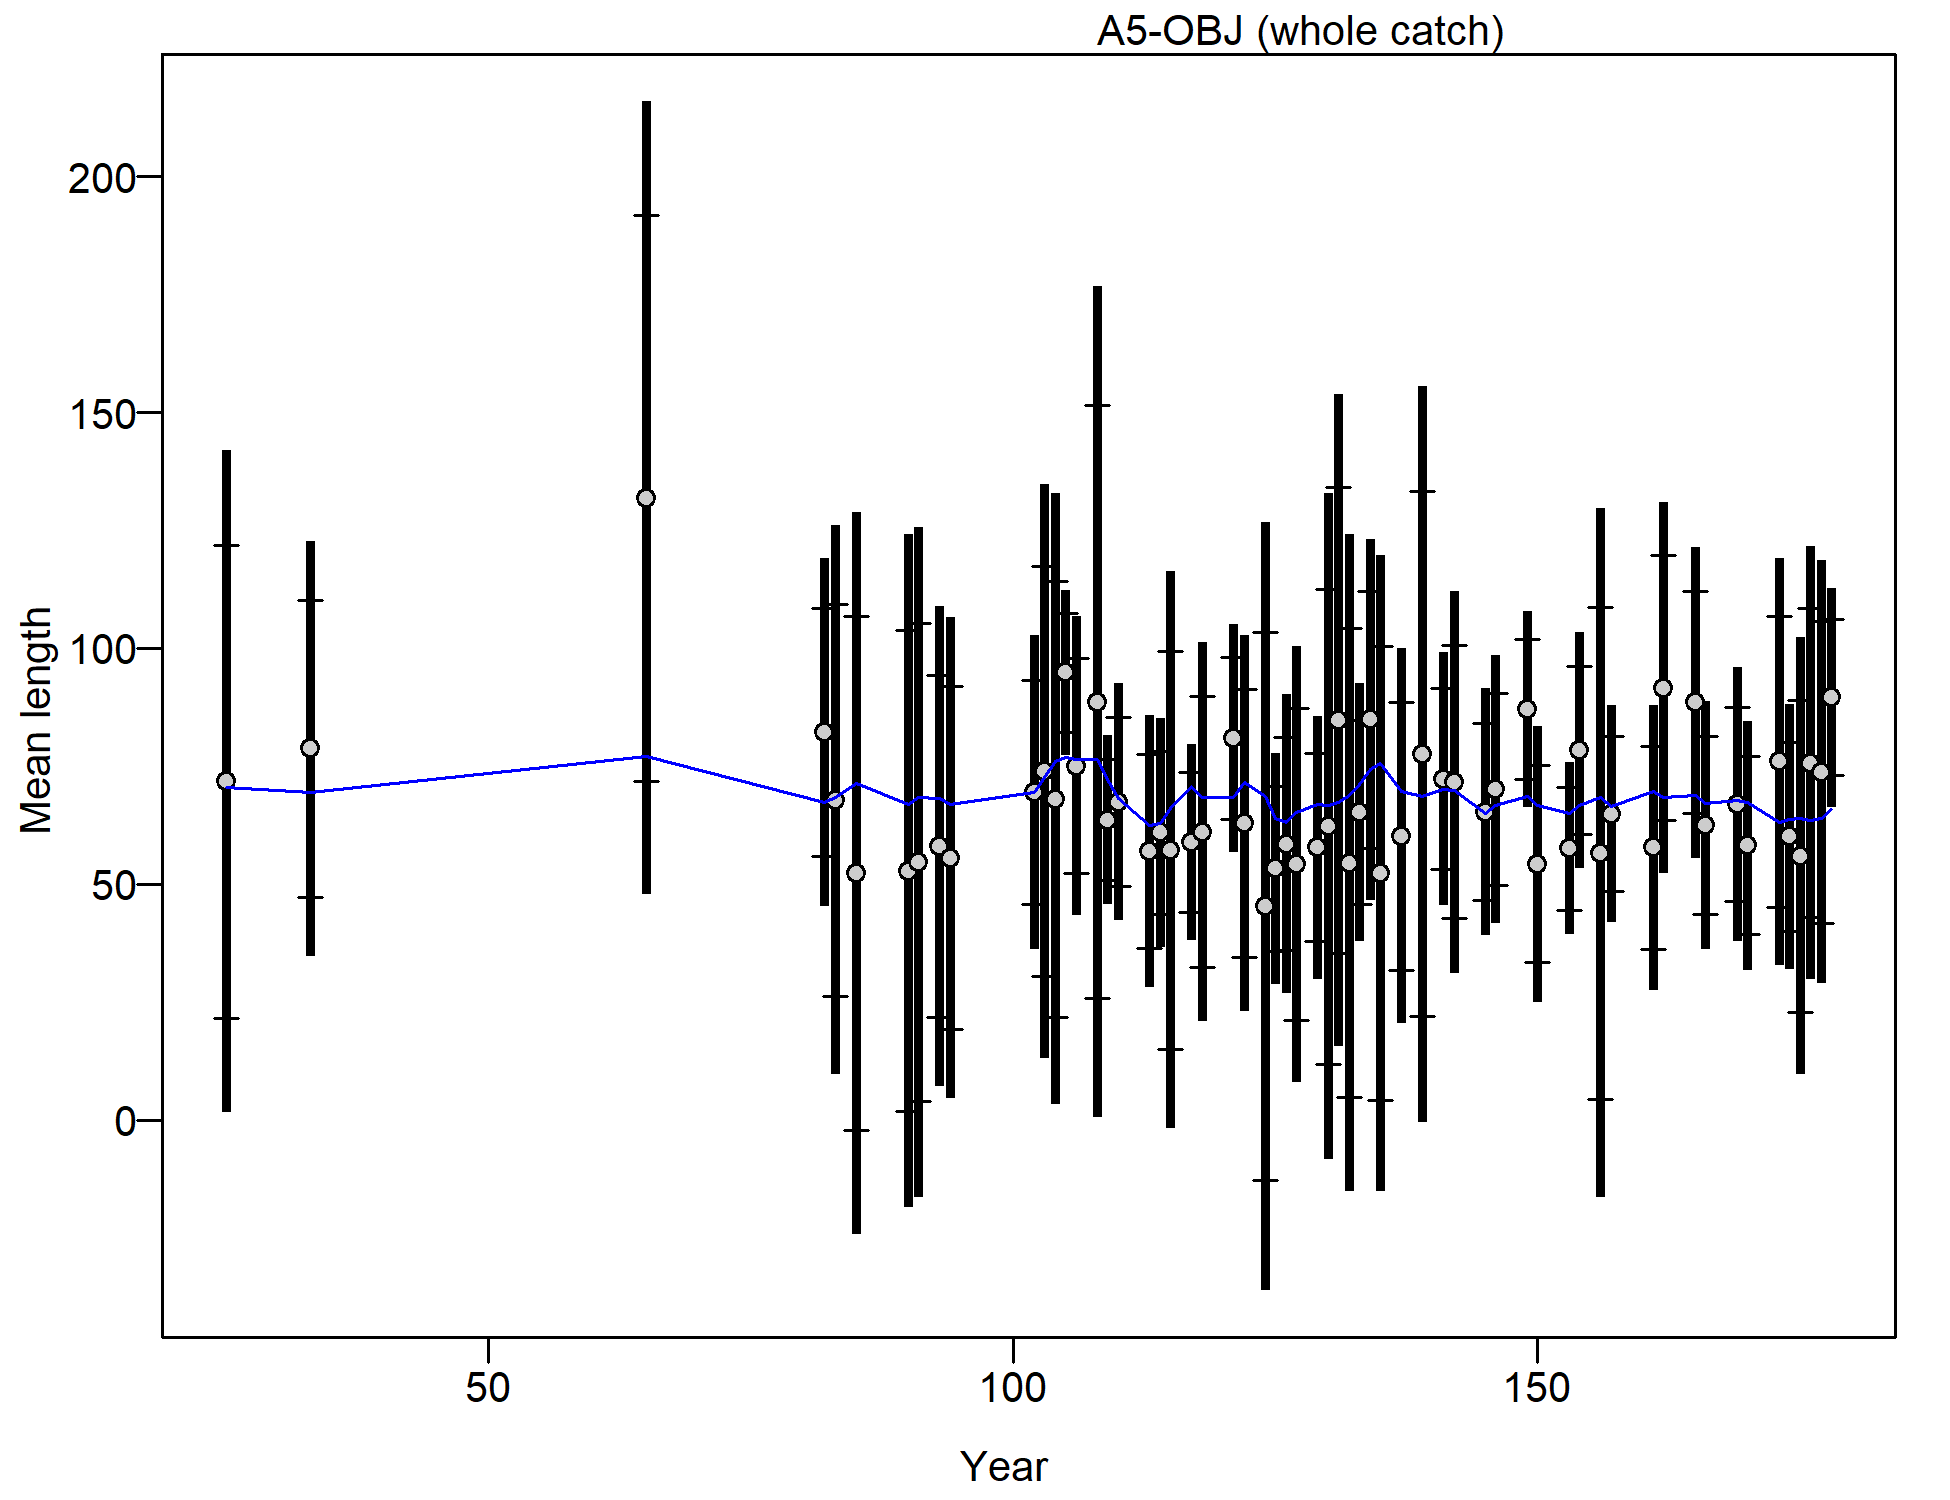
Mean length for A5-LL-n with 95% confidence intervals based on current samples sizes.
Francis data weighting method TA1.8: thinner intervals (with capped ends) show result of further adjusting sample sizes based on suggested multiplier (with 95% interval) for len data from A5-LL-n:
0.9854 (0.7336-1.4441)
For more info, see
Francis, R.I.C.C. (2011). Data weighting in statistical fisheries stock assessment models. Can. J. Fish. Aquat. Sci. 68: 1124-1138. https://doi.org/10.1139/f2011-025
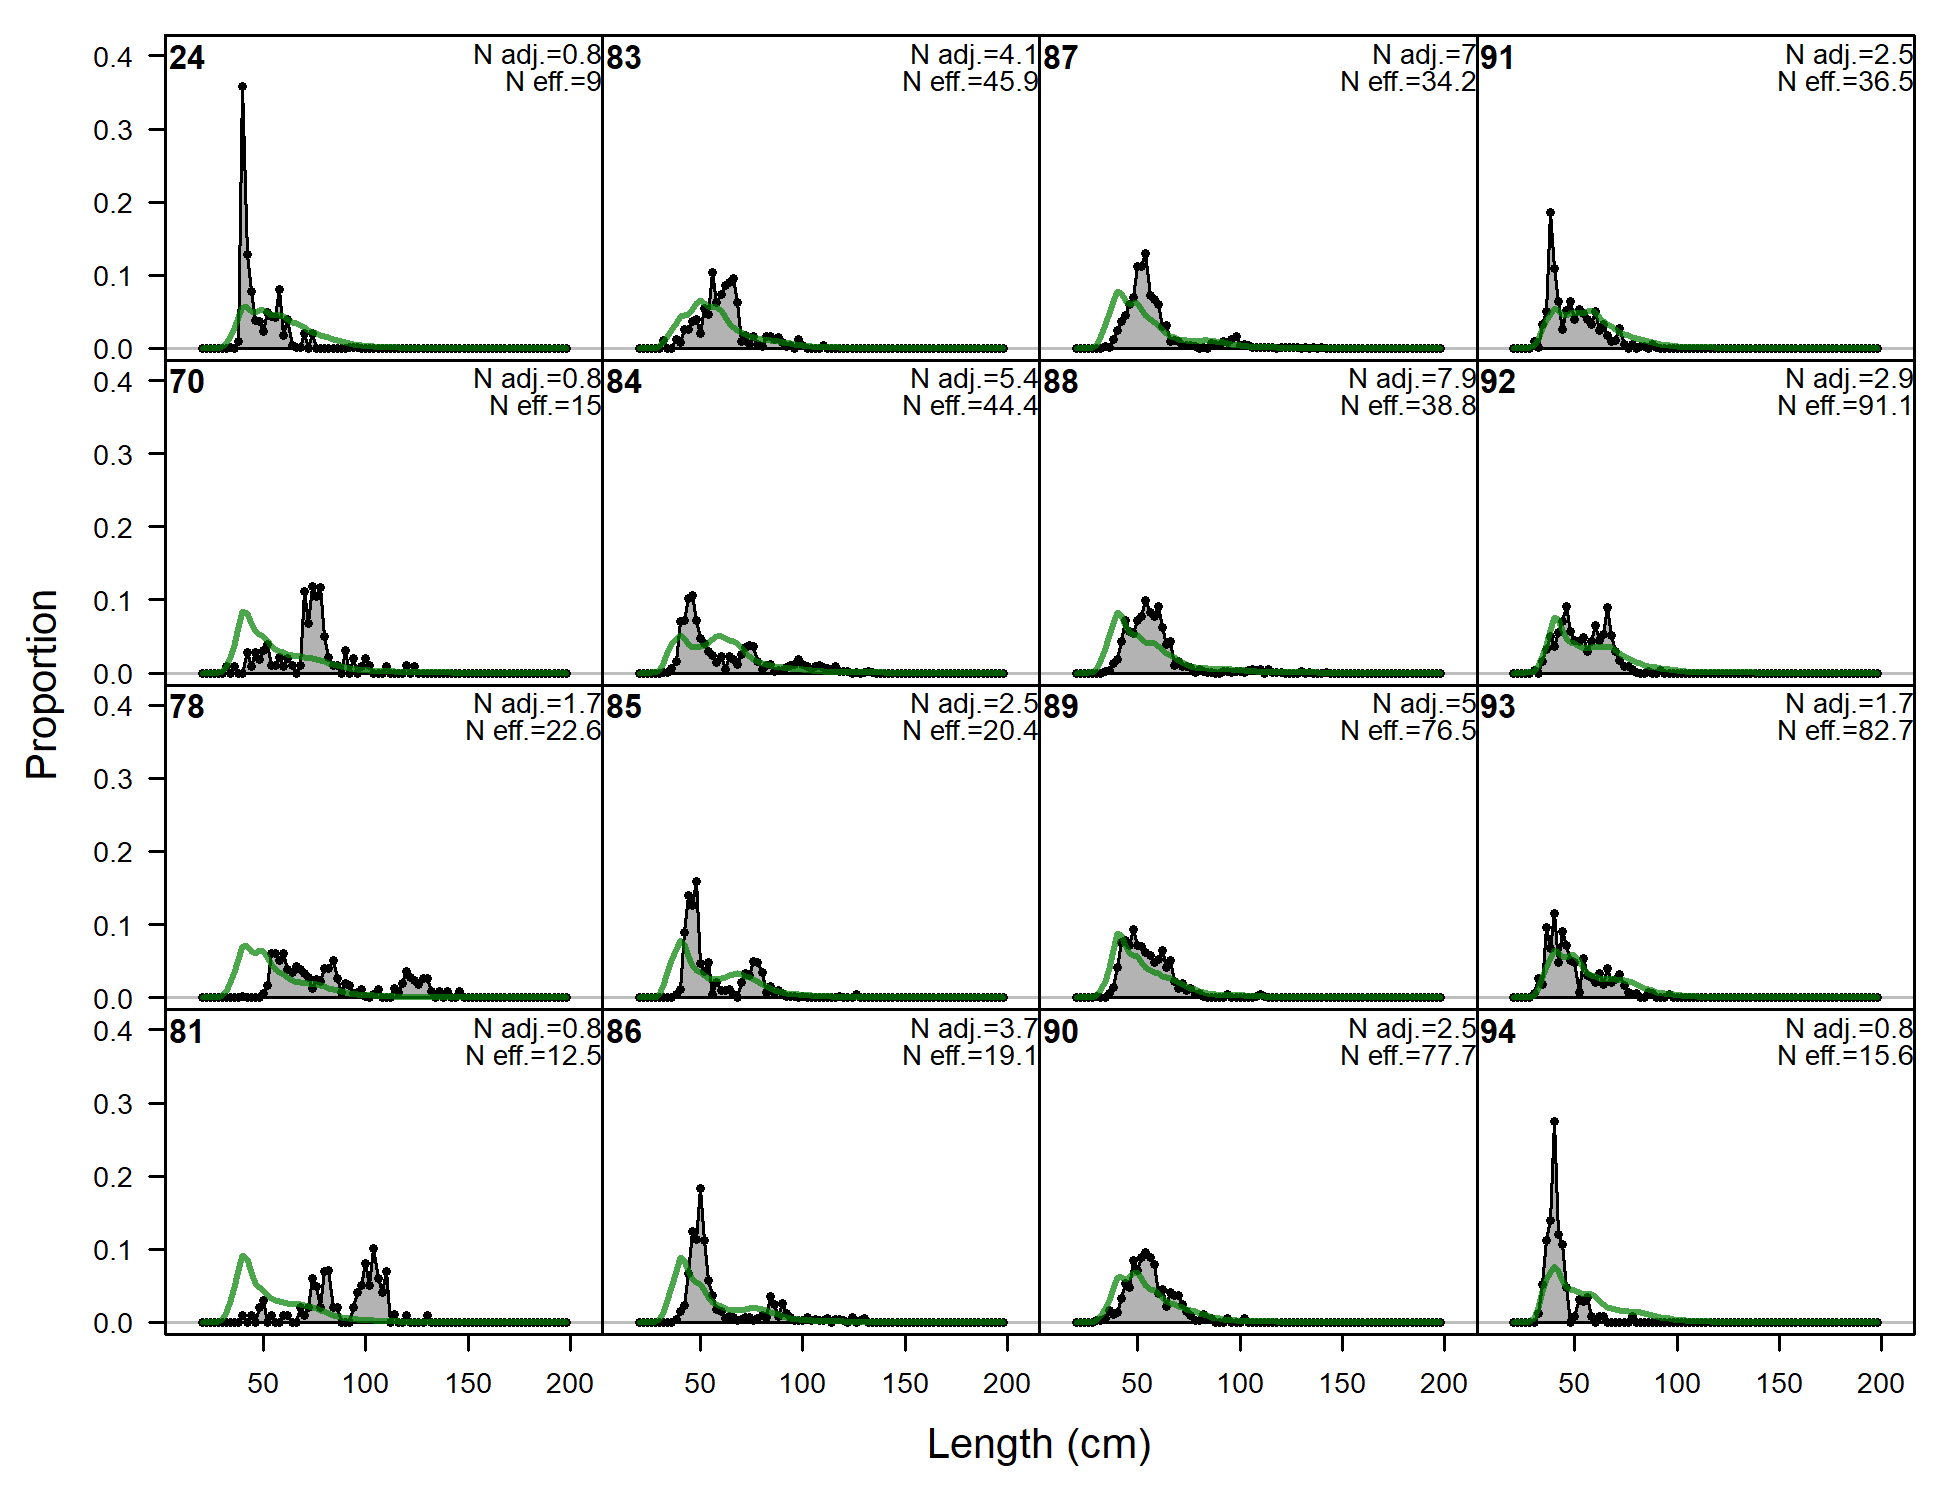
Length comps, whole catch, A6-LL-n (plot 1 of 5).
'N adj.' is the input sample size after data-weighting adjustment. N eff. is the calculated effective sample size used in the McAllister-Iannelli tuning method.
file: comp_lenfit_flt6mkt0_page1.png
Length comps, whole catch, A6-LL-n (plot 2 of 5)
file: comp_lenfit_flt6mkt0_page2.png
Length comps, whole catch, A6-LL-n (plot 3 of 5)
file: comp_lenfit_flt6mkt0_page3.png
Length comps, whole catch, A6-LL-n (plot 4 of 5)
file: comp_lenfit_flt6mkt0_page4.png
Length comps, whole catch, A6-LL-n (plot 5 of 5)
file: comp_lenfit_flt6mkt0_page5.png
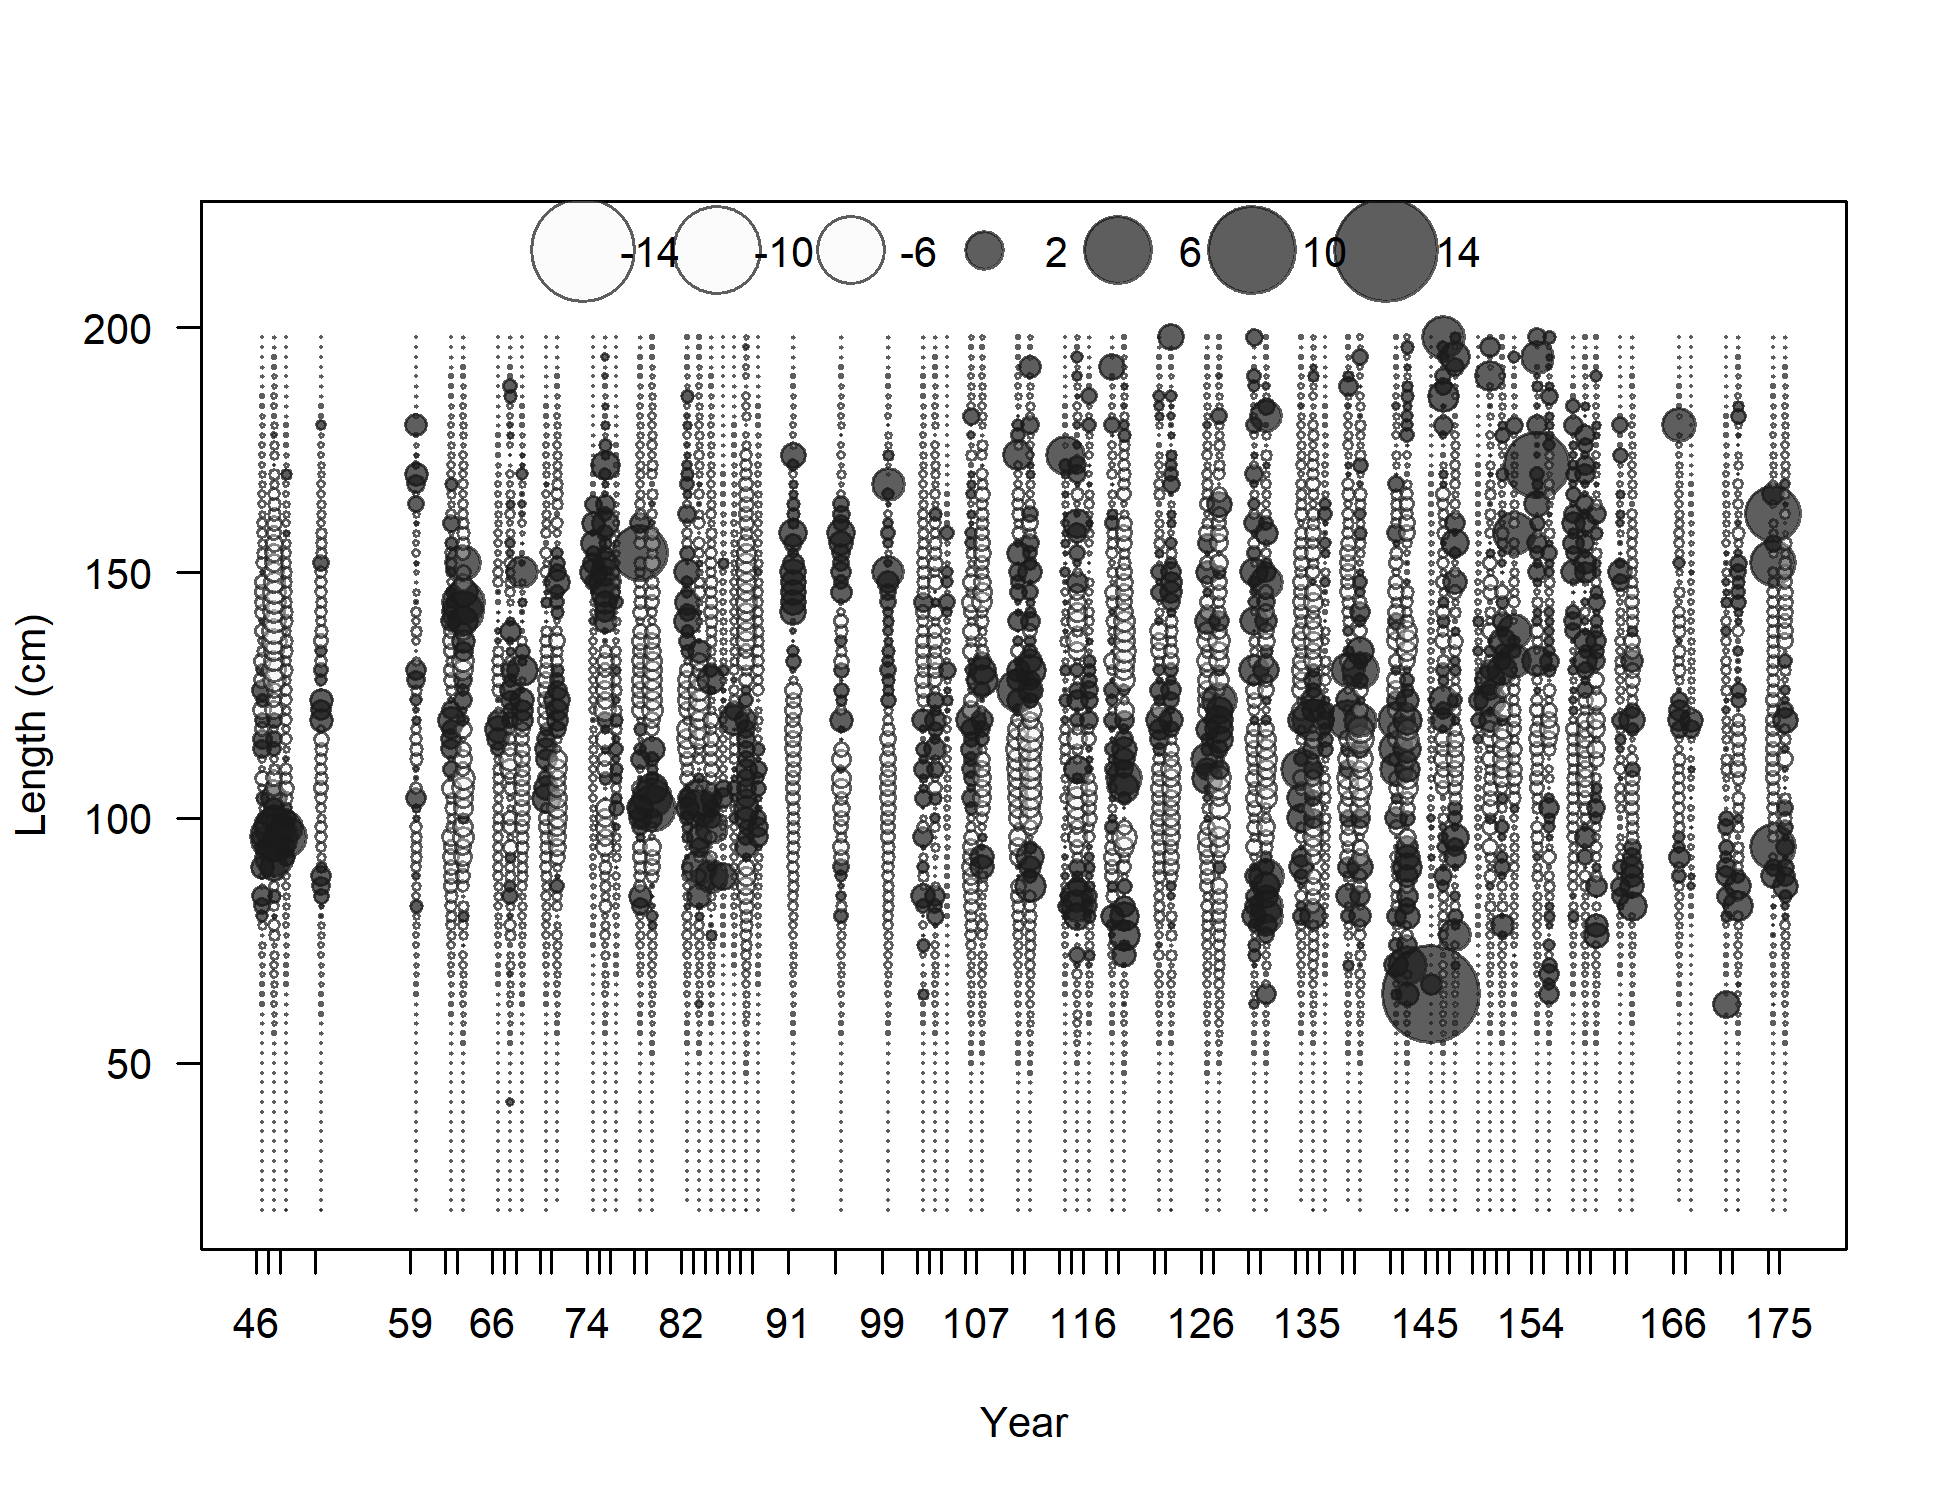
Pearson residuals, whole catch, A6-LL-n (max=12.58) (plot 5 of 5)
Closed bubbles are positive residuals (observed > expected) and open bubbles are negative residuals (observed < expected).
file: comp_lenfit_residsflt6mkt0_page5.png
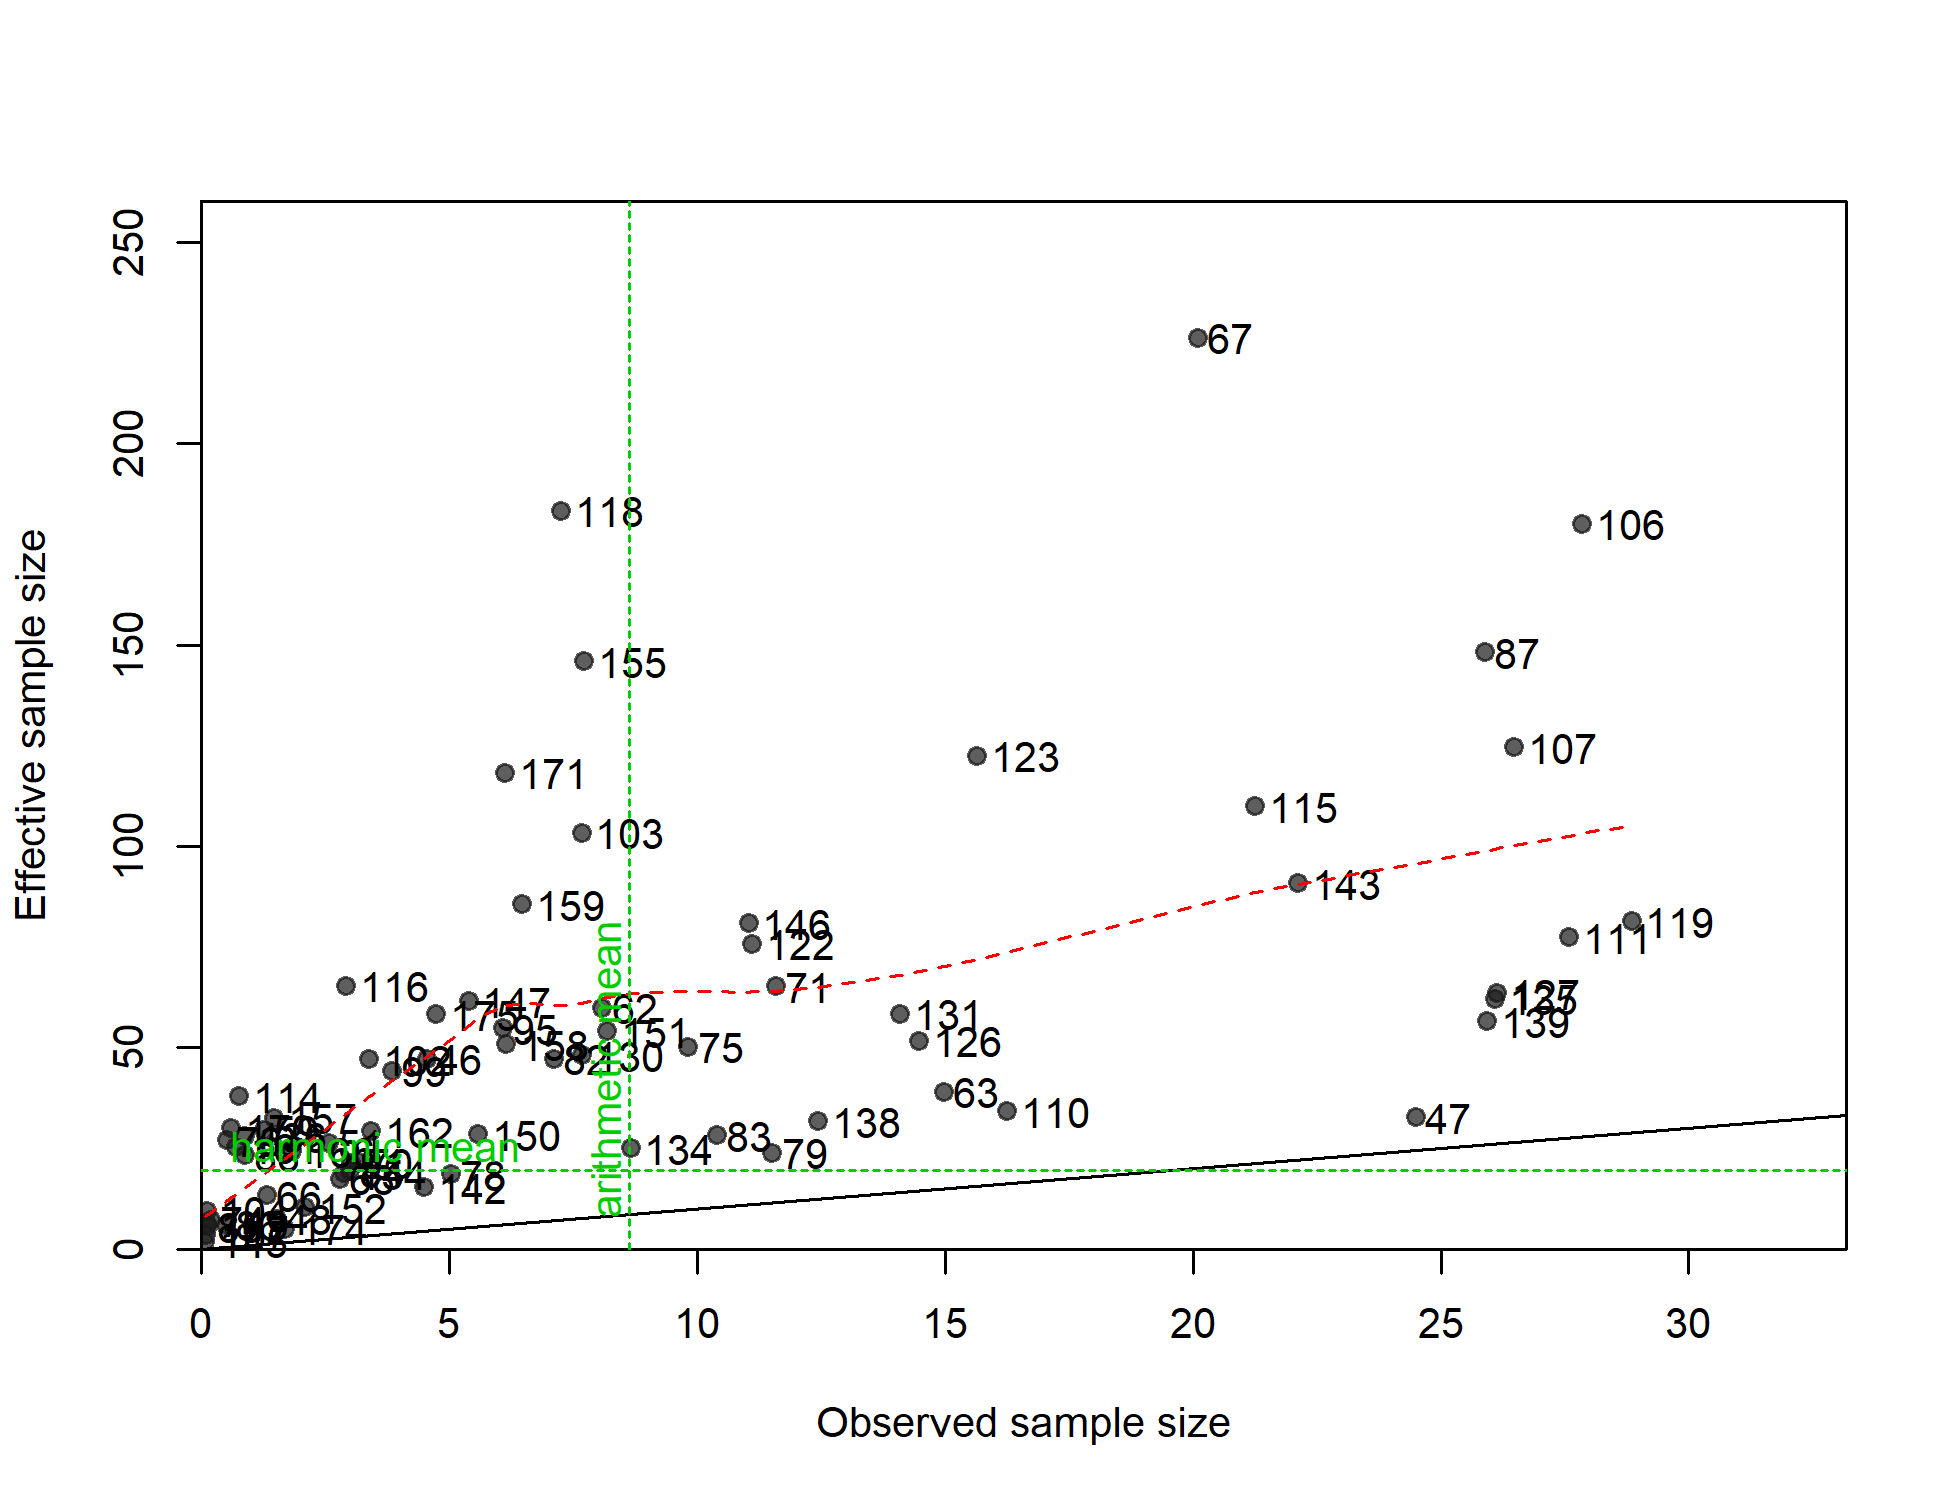
N-EffN comparison, Length comps, whole catch, A6-LL-n
file: comp_lenfit_sampsize_flt6mkt0.png
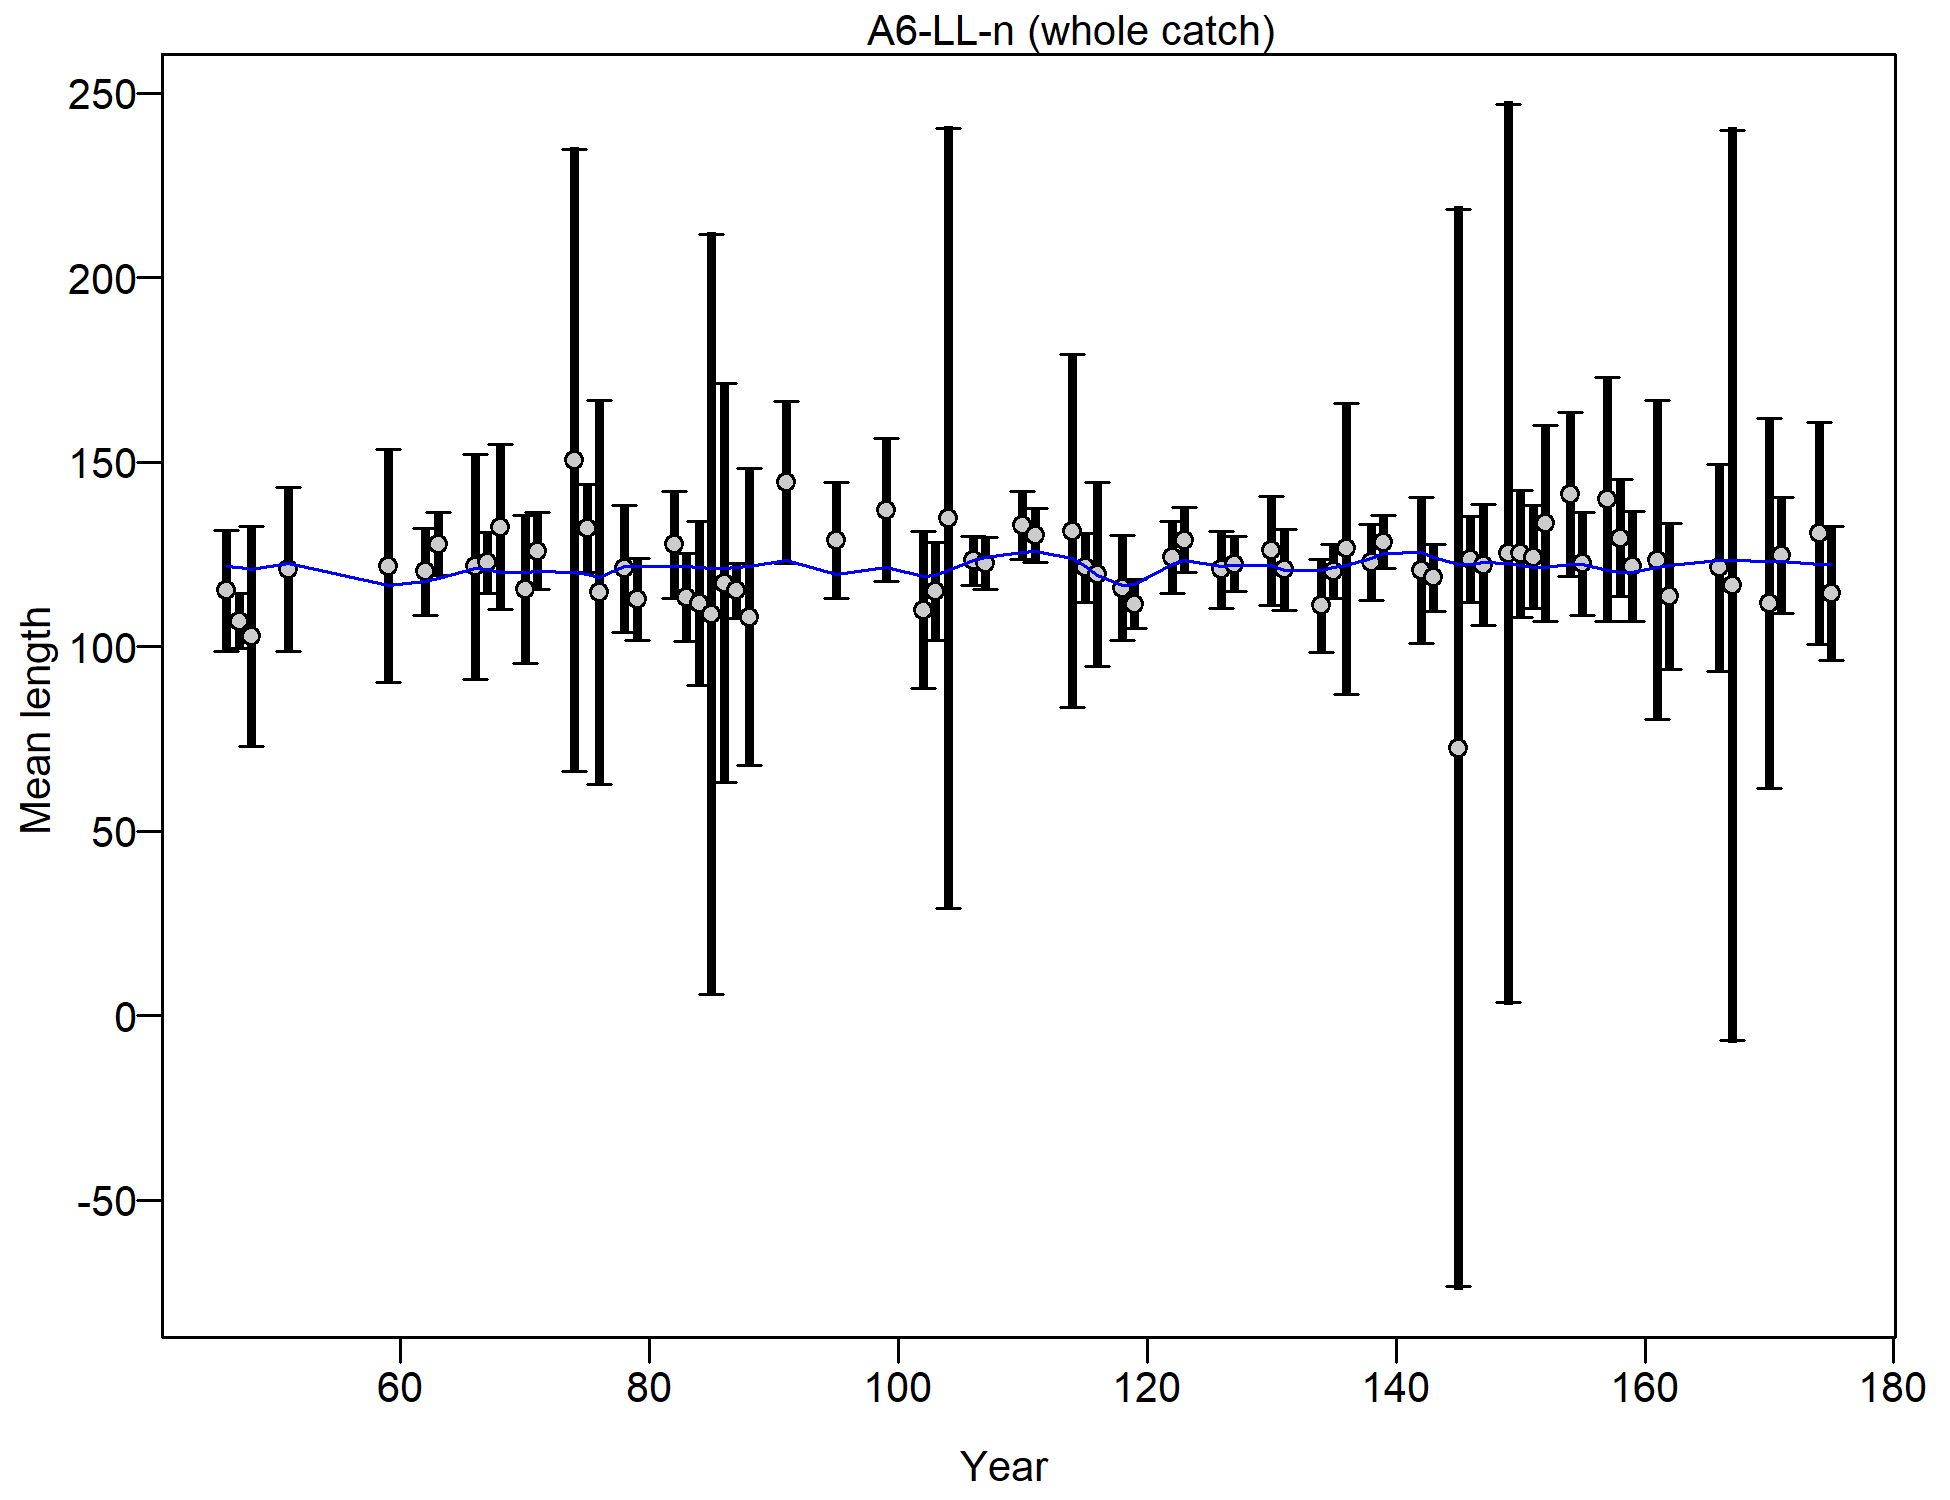
Mean length for A6-LL-n with 95% confidence intervals based on current samples sizes.
Francis data weighting method TA1.8: thinner intervals (with capped ends) show result of further adjusting sample sizes based on suggested multiplier (with 95% interval) for len data from A6-LL-n:
1.0119 (0.6817-1.7199)
For more info, see
Francis, R.I.C.C. (2011). Data weighting in statistical fisheries stock assessment models. Can. J. Fish. Aquat. Sci. 68: 1124-1138. https://doi.org/10.1139/f2011-025
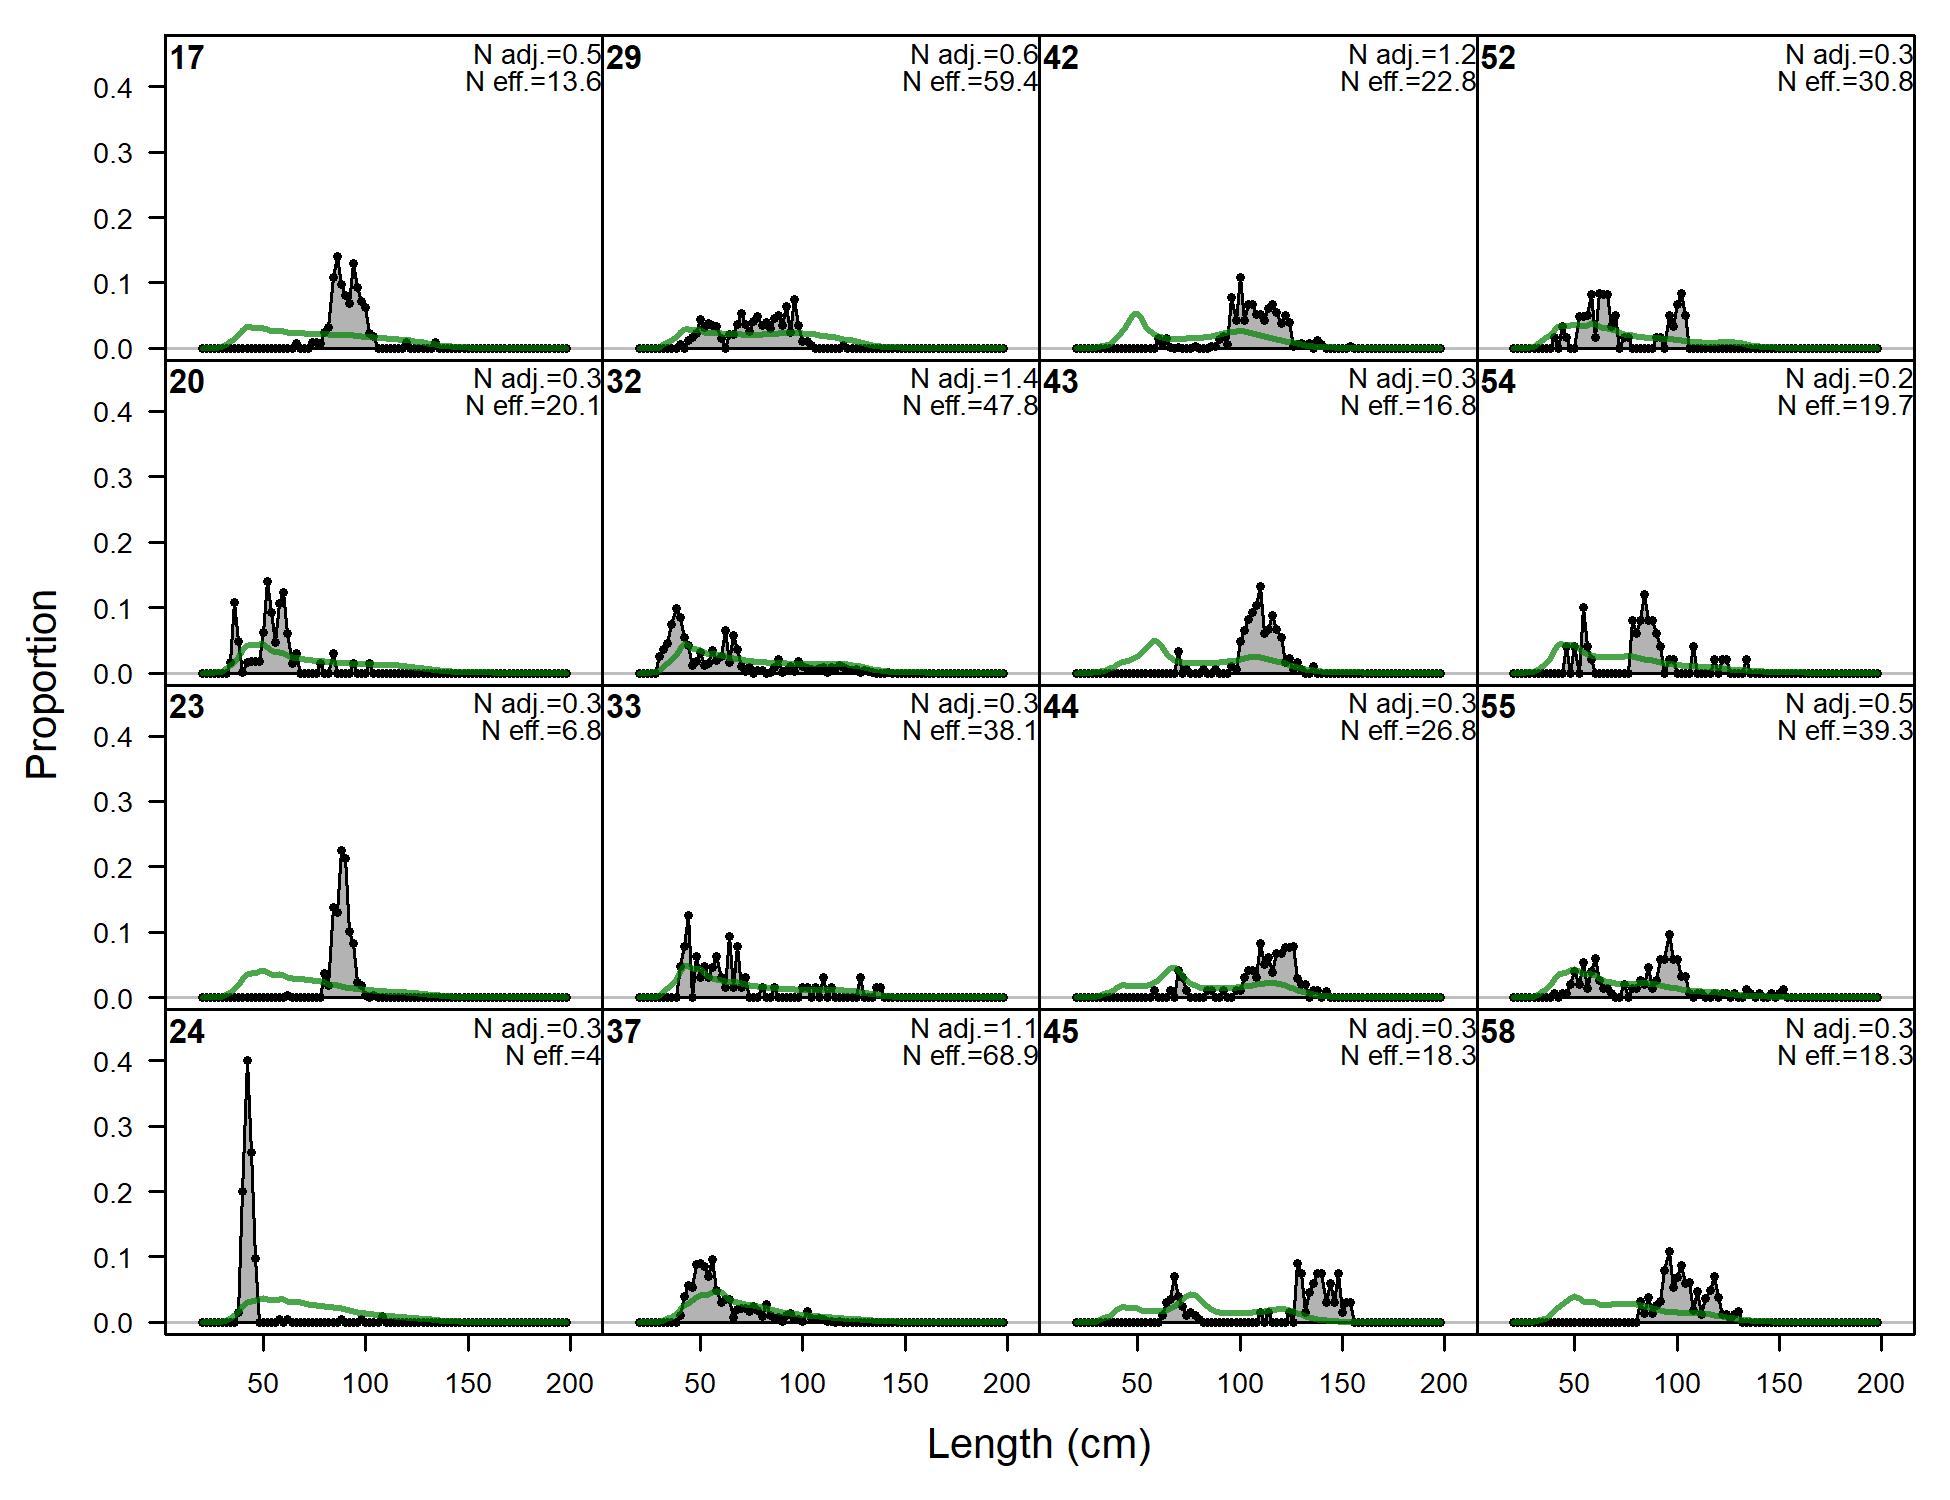
Length comps, whole catch, A2-OBJ (plot 1 of 7).
'N adj.' is the input sample size after data-weighting adjustment. N eff. is the calculated effective sample size used in the McAllister-Iannelli tuning method.
file: comp_lenfit_flt13mkt0_page1.png
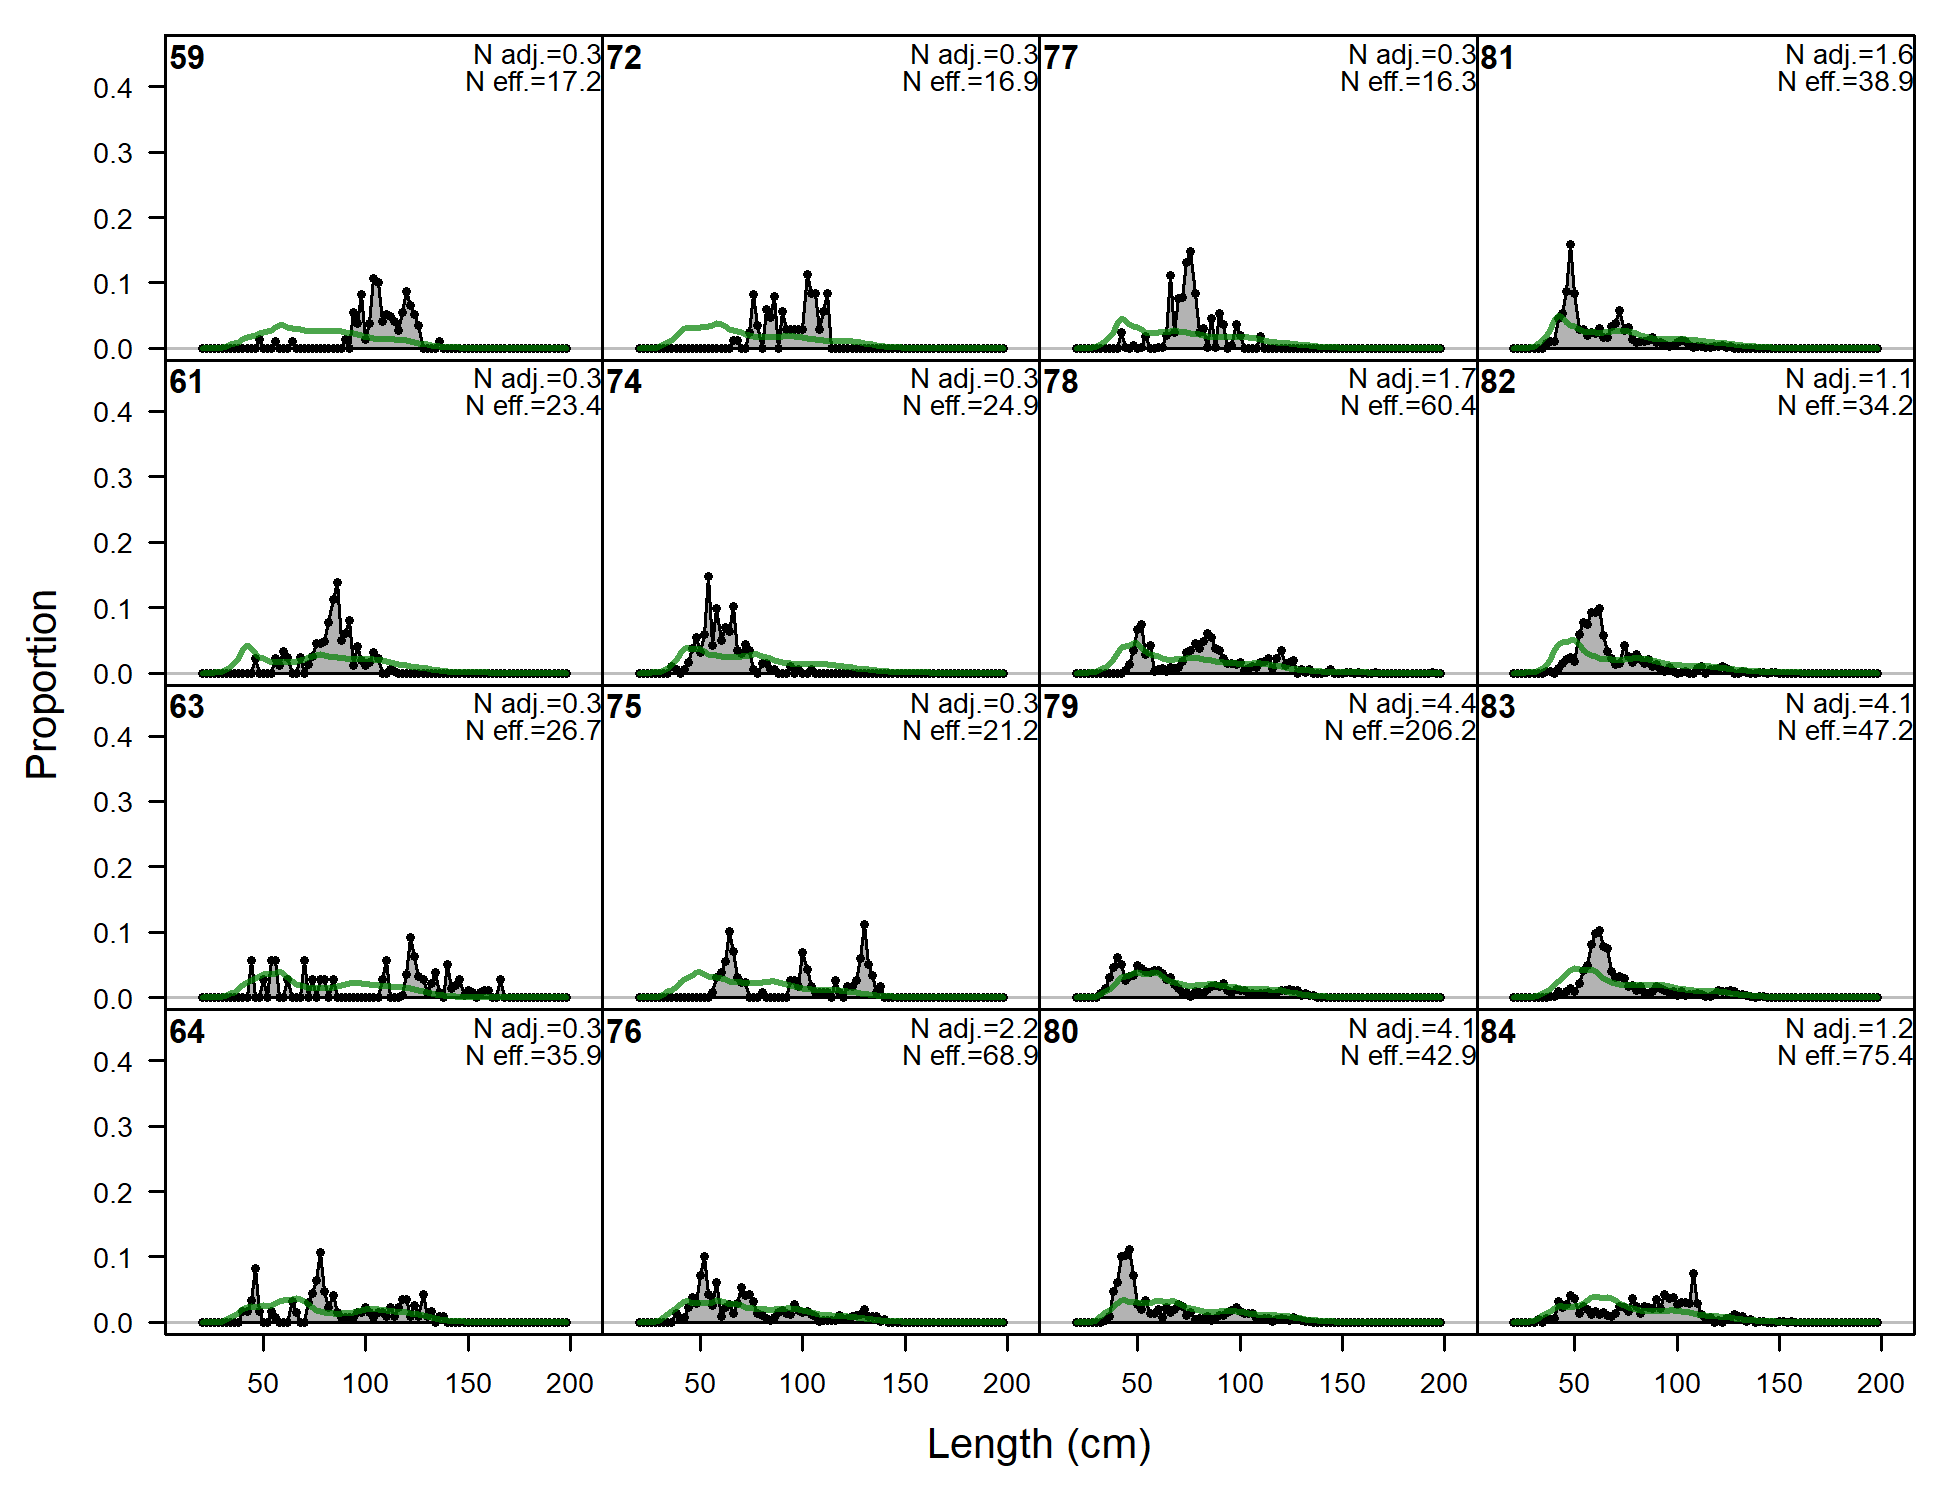
Length comps, whole catch, A2-OBJ (plot 2 of 7)
file: comp_lenfit_flt13mkt0_page2.png
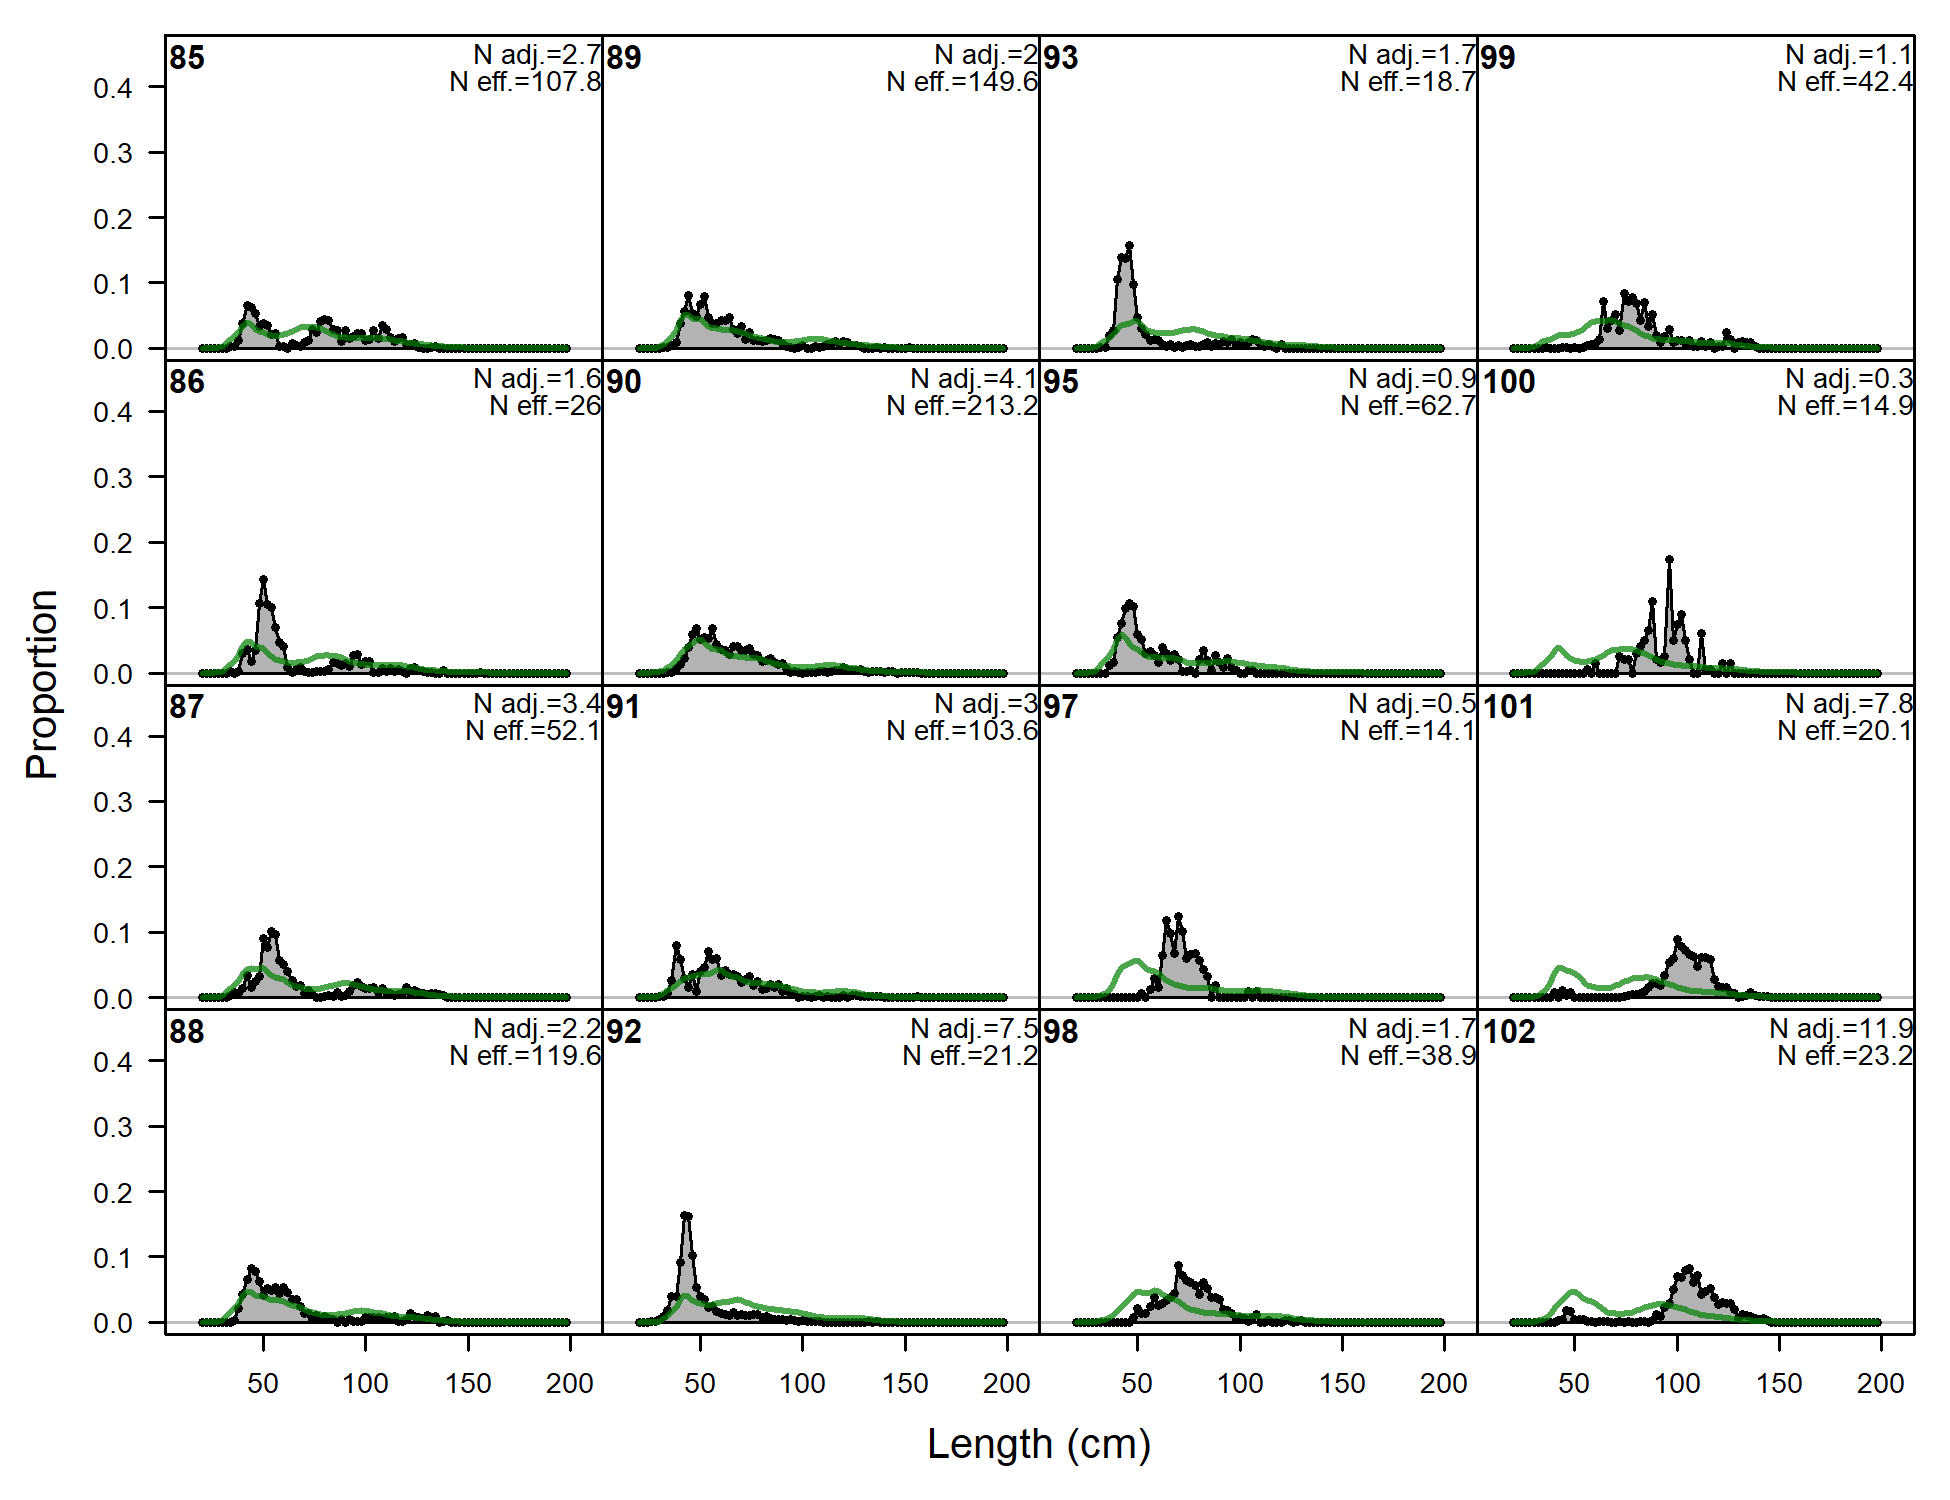
Length comps, whole catch, A2-OBJ (plot 3 of 7)
file: comp_lenfit_flt13mkt0_page3.png
Length comps, whole catch, A2-OBJ (plot 4 of 7)
file: comp_lenfit_flt13mkt0_page4.png
Length comps, whole catch, A2-OBJ (plot 5 of 7)
file: comp_lenfit_flt13mkt0_page5.png
Length comps, whole catch, A2-OBJ (plot 6 of 7)
file: comp_lenfit_flt13mkt0_page6.png
Length comps, whole catch, A2-OBJ (plot 7 of 7)
file: comp_lenfit_flt13mkt0_page7.png
Pearson residuals, whole catch, A2-OBJ (max=3.5) (plot 7 of 7)
Closed bubbles are positive residuals (observed > expected) and open bubbles are negative residuals (observed < expected).
file: comp_lenfit_residsflt13mkt0_page7.png
N-EffN comparison, Length comps, whole catch, A2-OBJ
file: comp_lenfit_sampsize_flt13mkt0.png
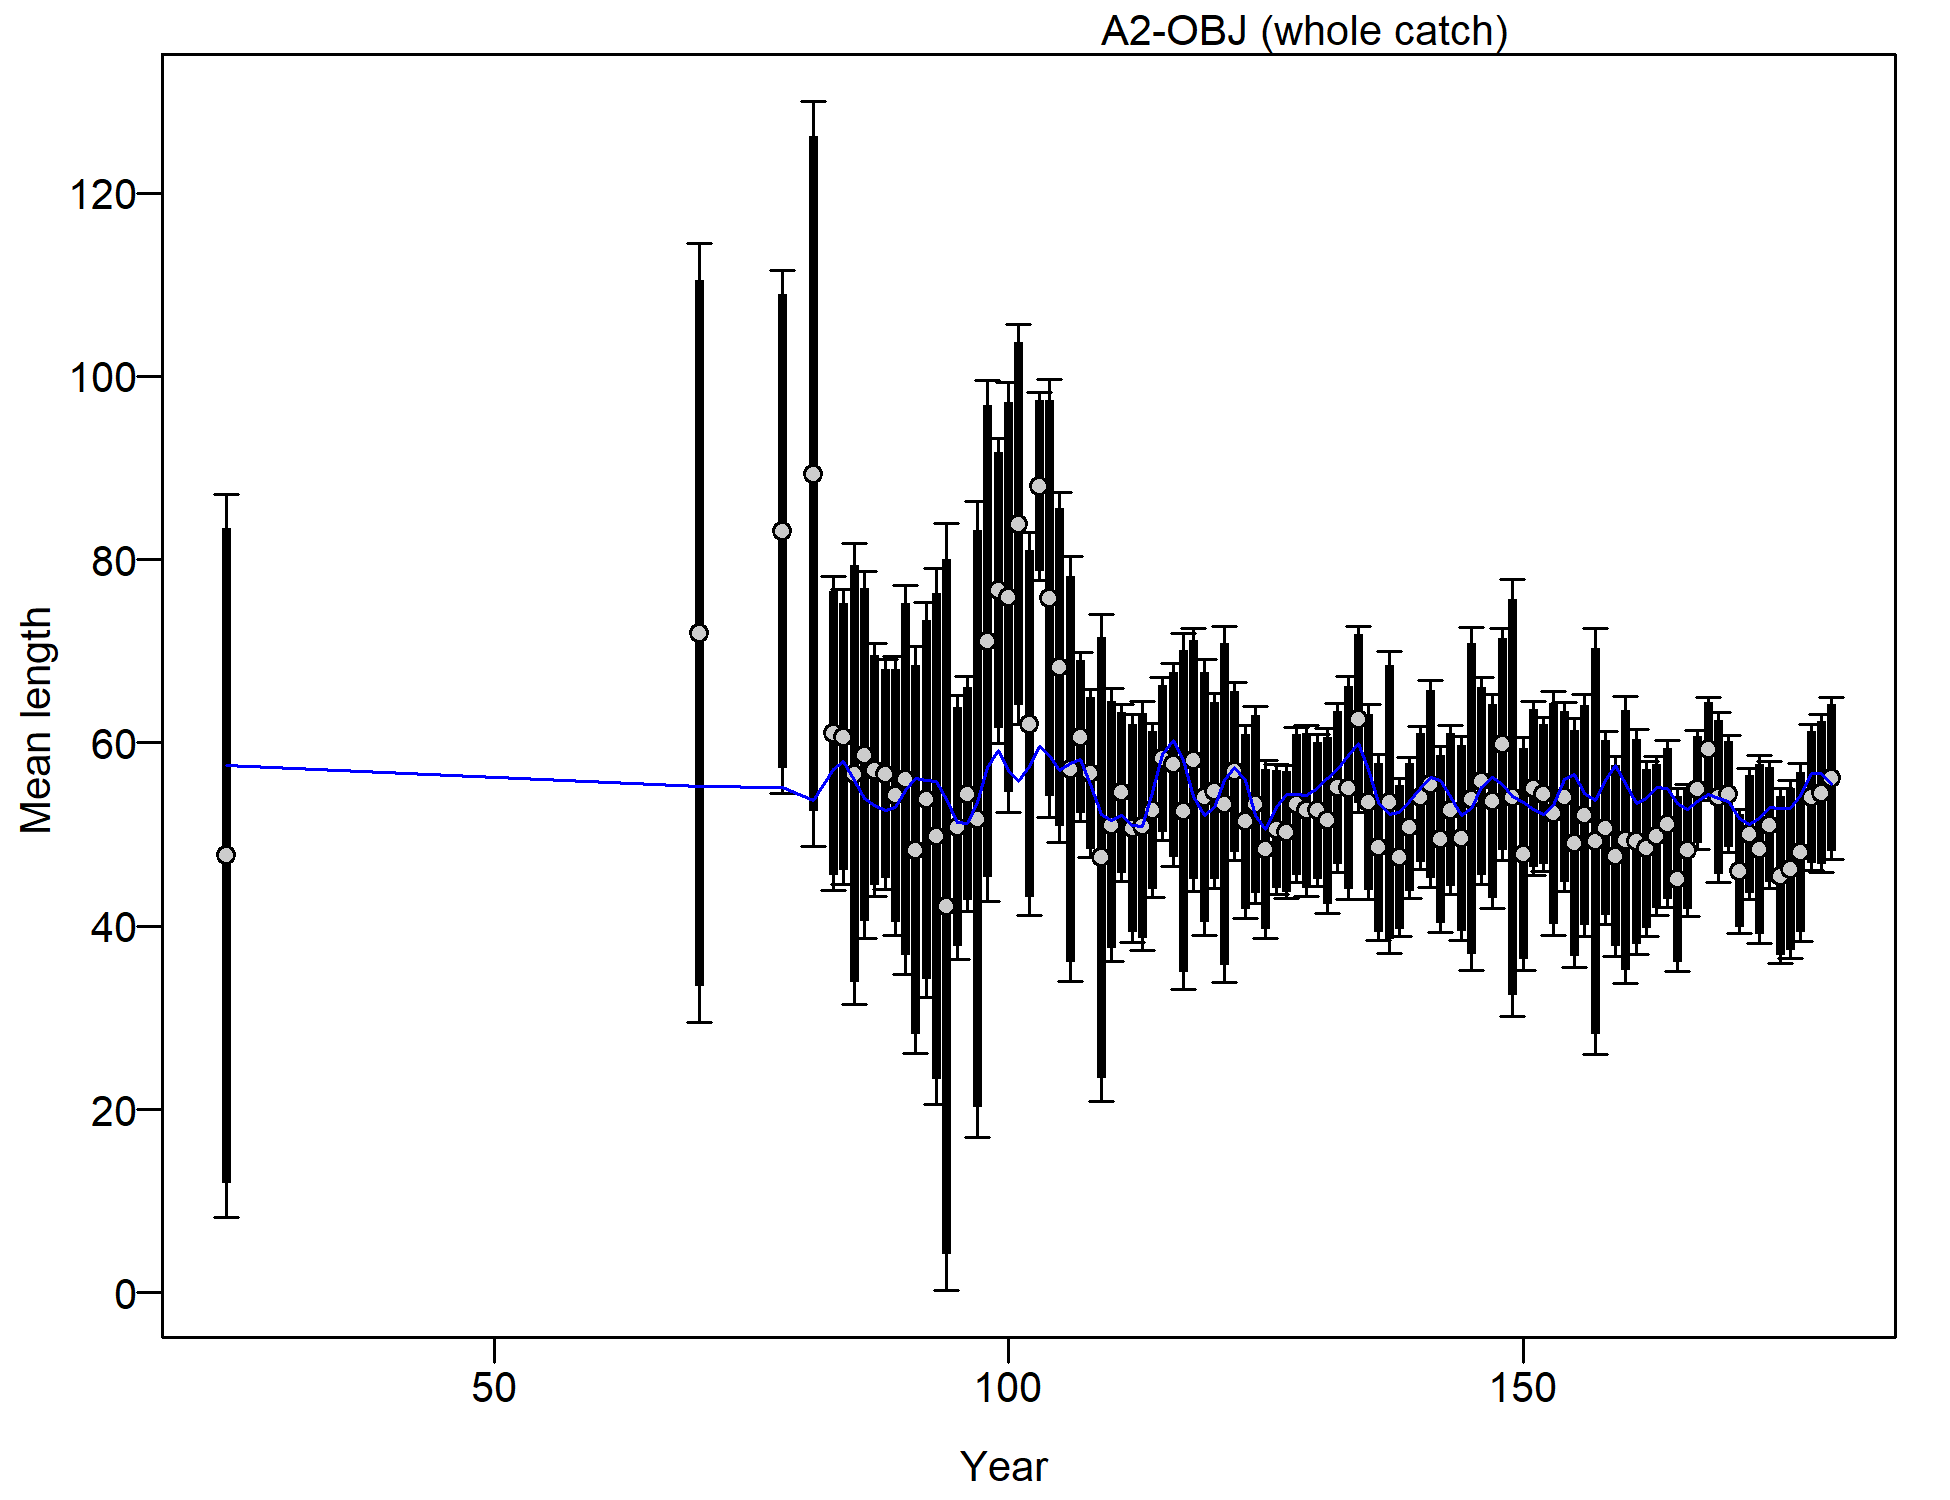
Mean length for A2-OBJ with 95% confidence intervals based on current samples sizes.
Francis data weighting method TA1.8: thinner intervals (with capped ends) show result of further adjusting sample sizes based on suggested multiplier (with 95% interval) for len data from A2-OBJ:
0.8215 (0.4868-1.6092)
For more info, see
Francis, R.I.C.C. (2011). Data weighting in statistical fisheries stock assessment models. Can. J. Fish. Aquat. Sci. 68: 1124-1138. https://doi.org/10.1139/f2011-025
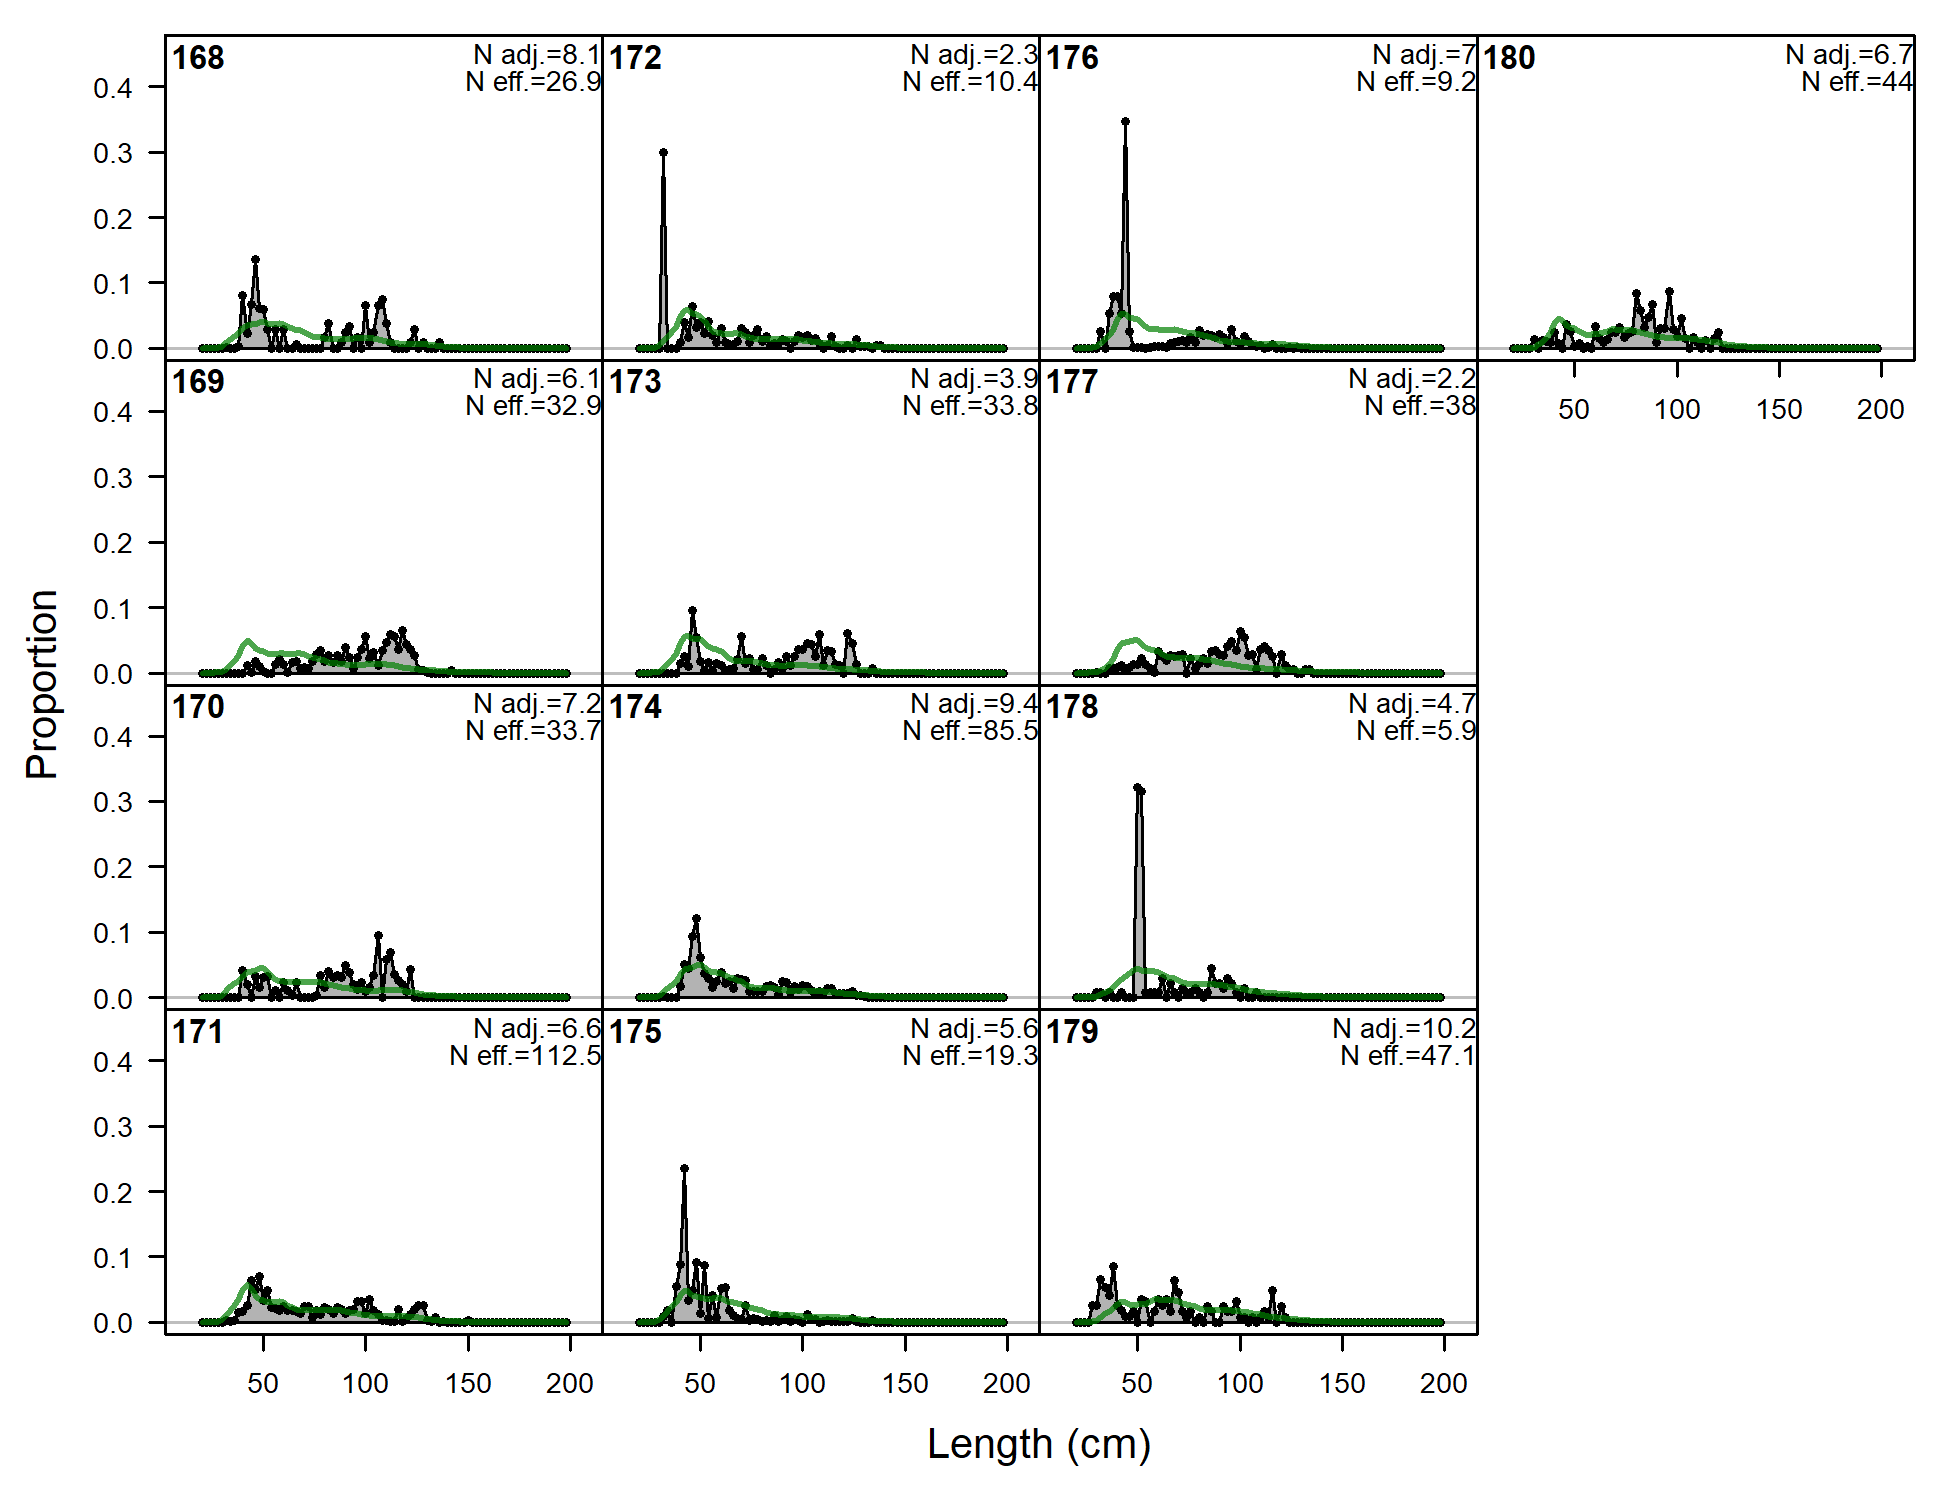
Length comps, whole catch, A3-OBJ (plot 1 of 8).
'N adj.' is the input sample size after data-weighting adjustment. N eff. is the calculated effective sample size used in the McAllister-Iannelli tuning method.
file: comp_lenfit_flt14mkt0_page1.png
Length comps, whole catch, A3-OBJ (plot 2 of 8)
file: comp_lenfit_flt14mkt0_page2.png
Length comps, whole catch, A3-OBJ (plot 3 of 8)
file: comp_lenfit_flt14mkt0_page3.png
Length comps, whole catch, A3-OBJ (plot 4 of 8)
file: comp_lenfit_flt14mkt0_page4.png
Length comps, whole catch, A3-OBJ (plot 5 of 8)
file: comp_lenfit_flt14mkt0_page5.png
Length comps, whole catch, A3-OBJ (plot 6 of 8)
file: comp_lenfit_flt14mkt0_page6.png
Length comps, whole catch, A3-OBJ (plot 7 of 8)
file: comp_lenfit_flt14mkt0_page7.png
Length comps, whole catch, A3-OBJ (plot 8 of 8)
file: comp_lenfit_flt14mkt0_page8.png
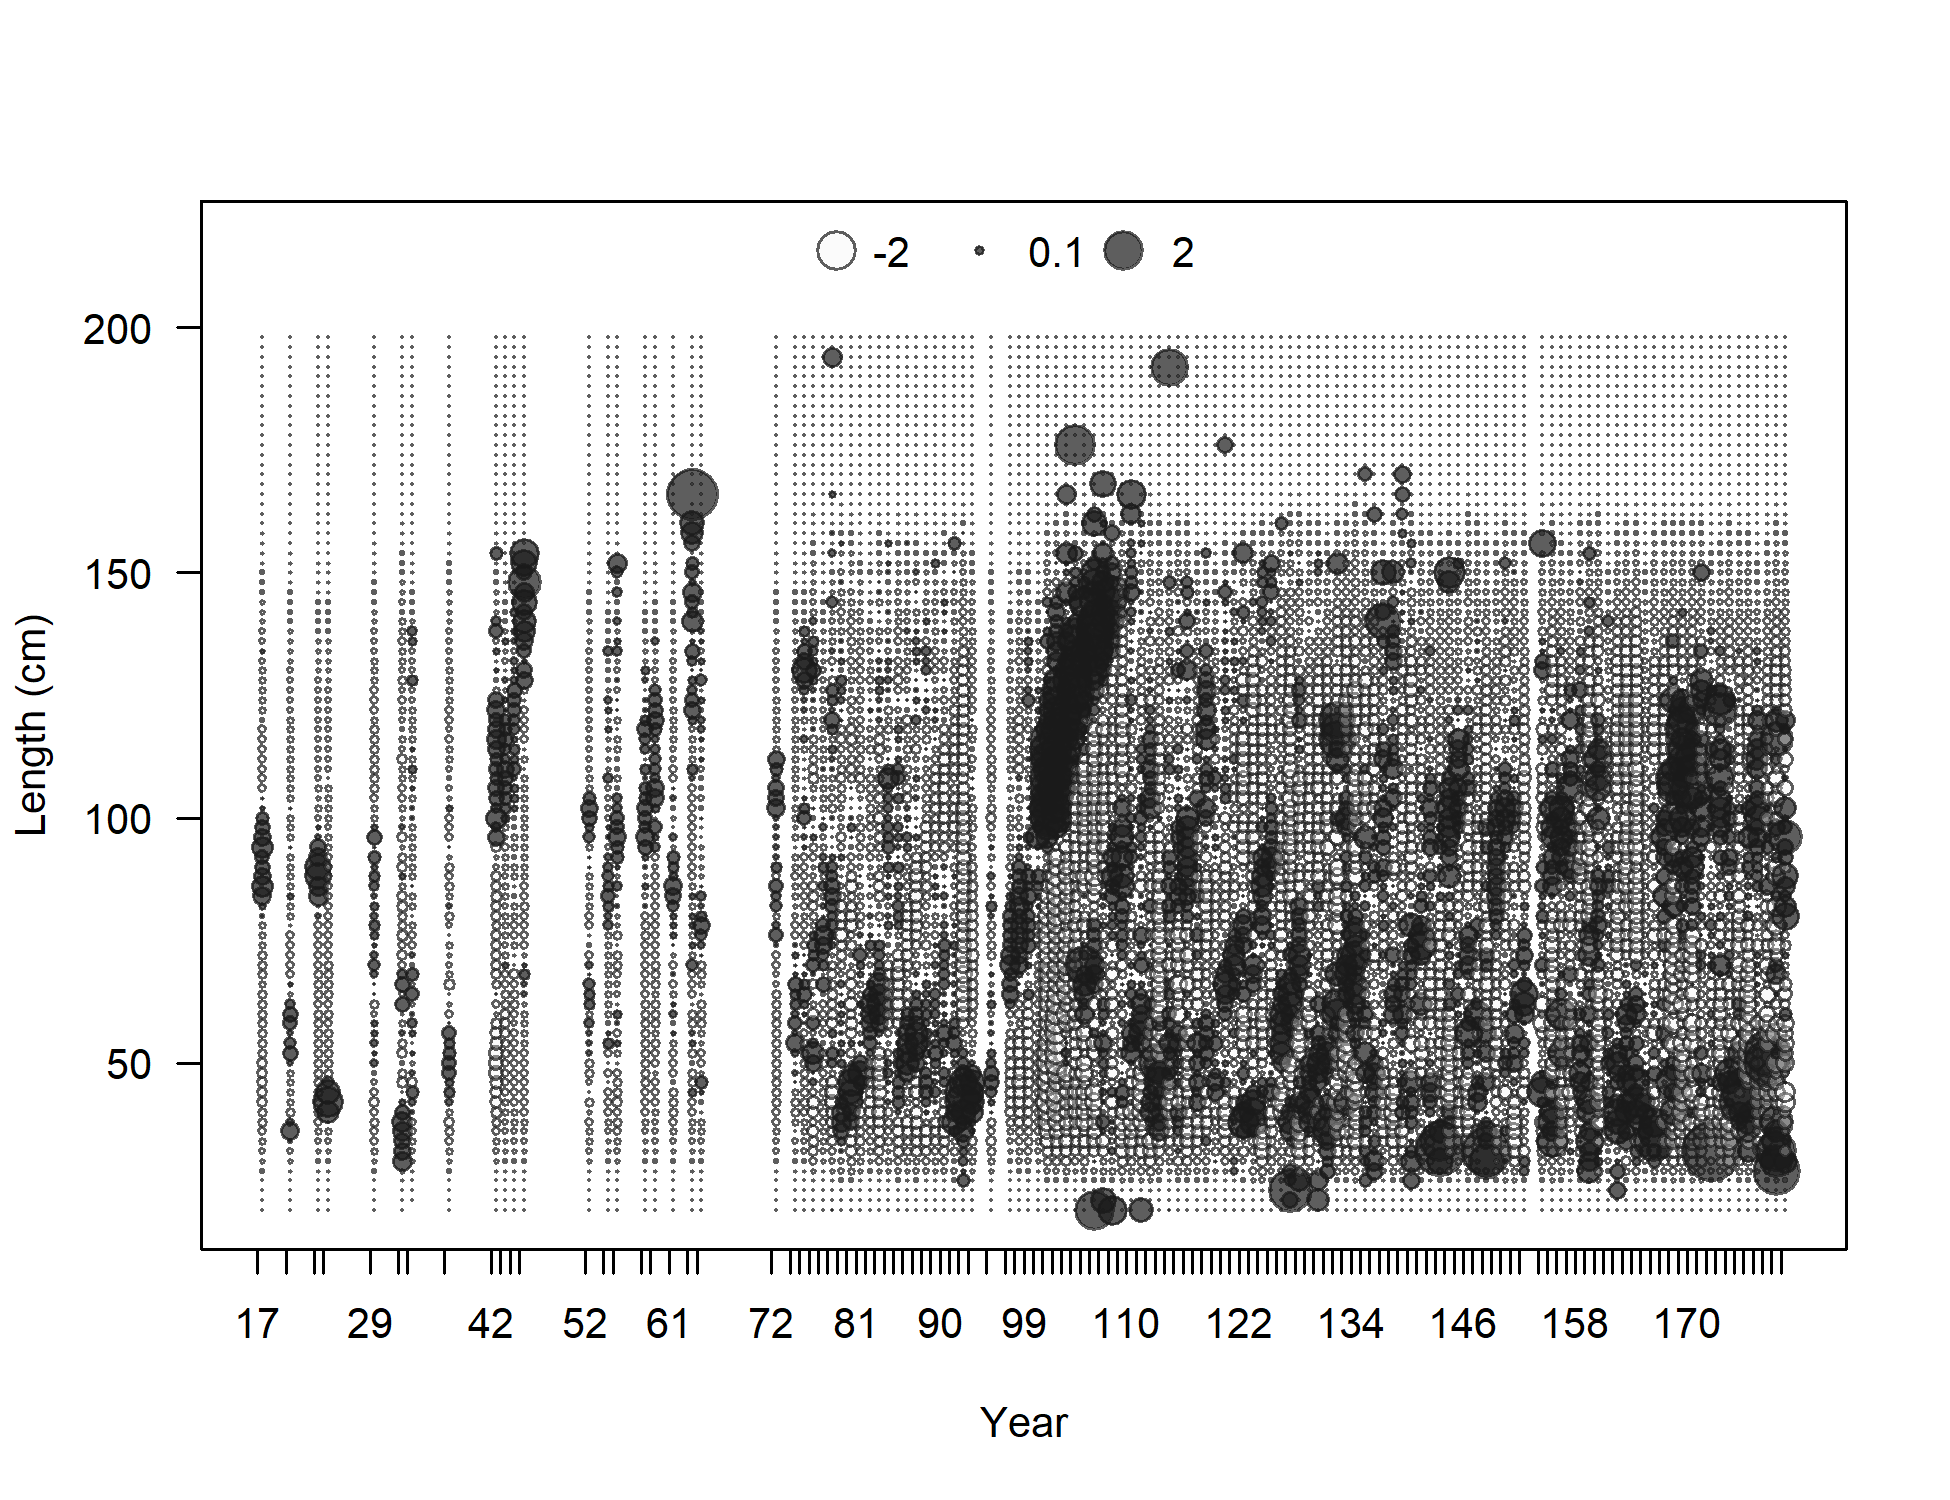
Pearson residuals, whole catch, A3-OBJ (max=4.52) (plot 8 of 8)
Closed bubbles are positive residuals (observed > expected) and open bubbles are negative residuals (observed < expected).
file: comp_lenfit_residsflt14mkt0_page8.png
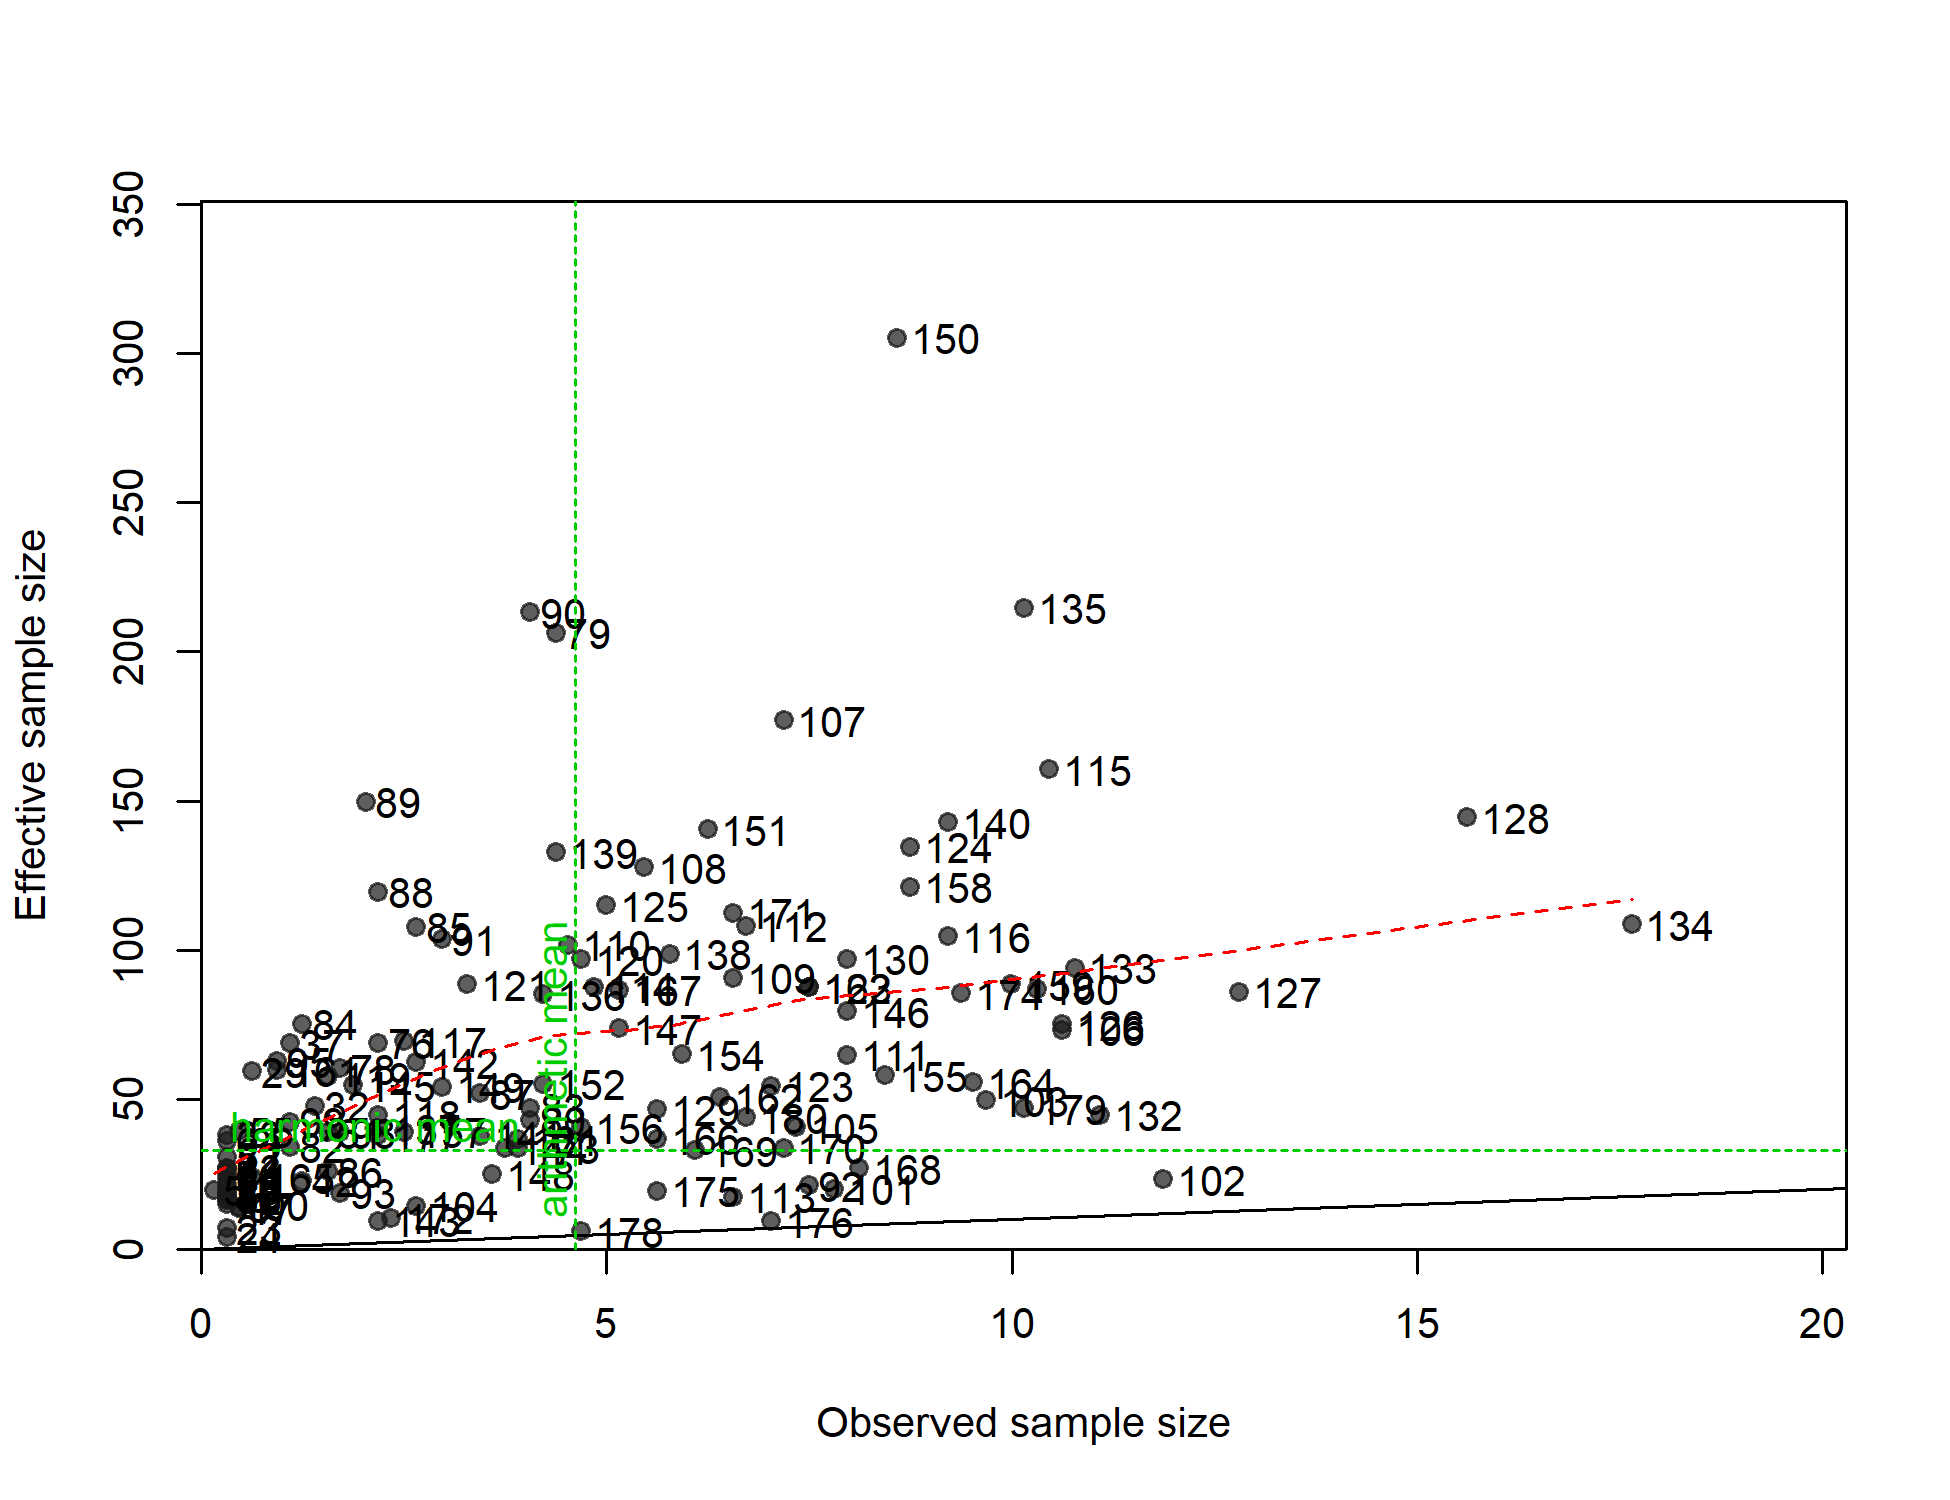
N-EffN comparison, Length comps, whole catch, A3-OBJ
file: comp_lenfit_sampsize_flt14mkt0.png
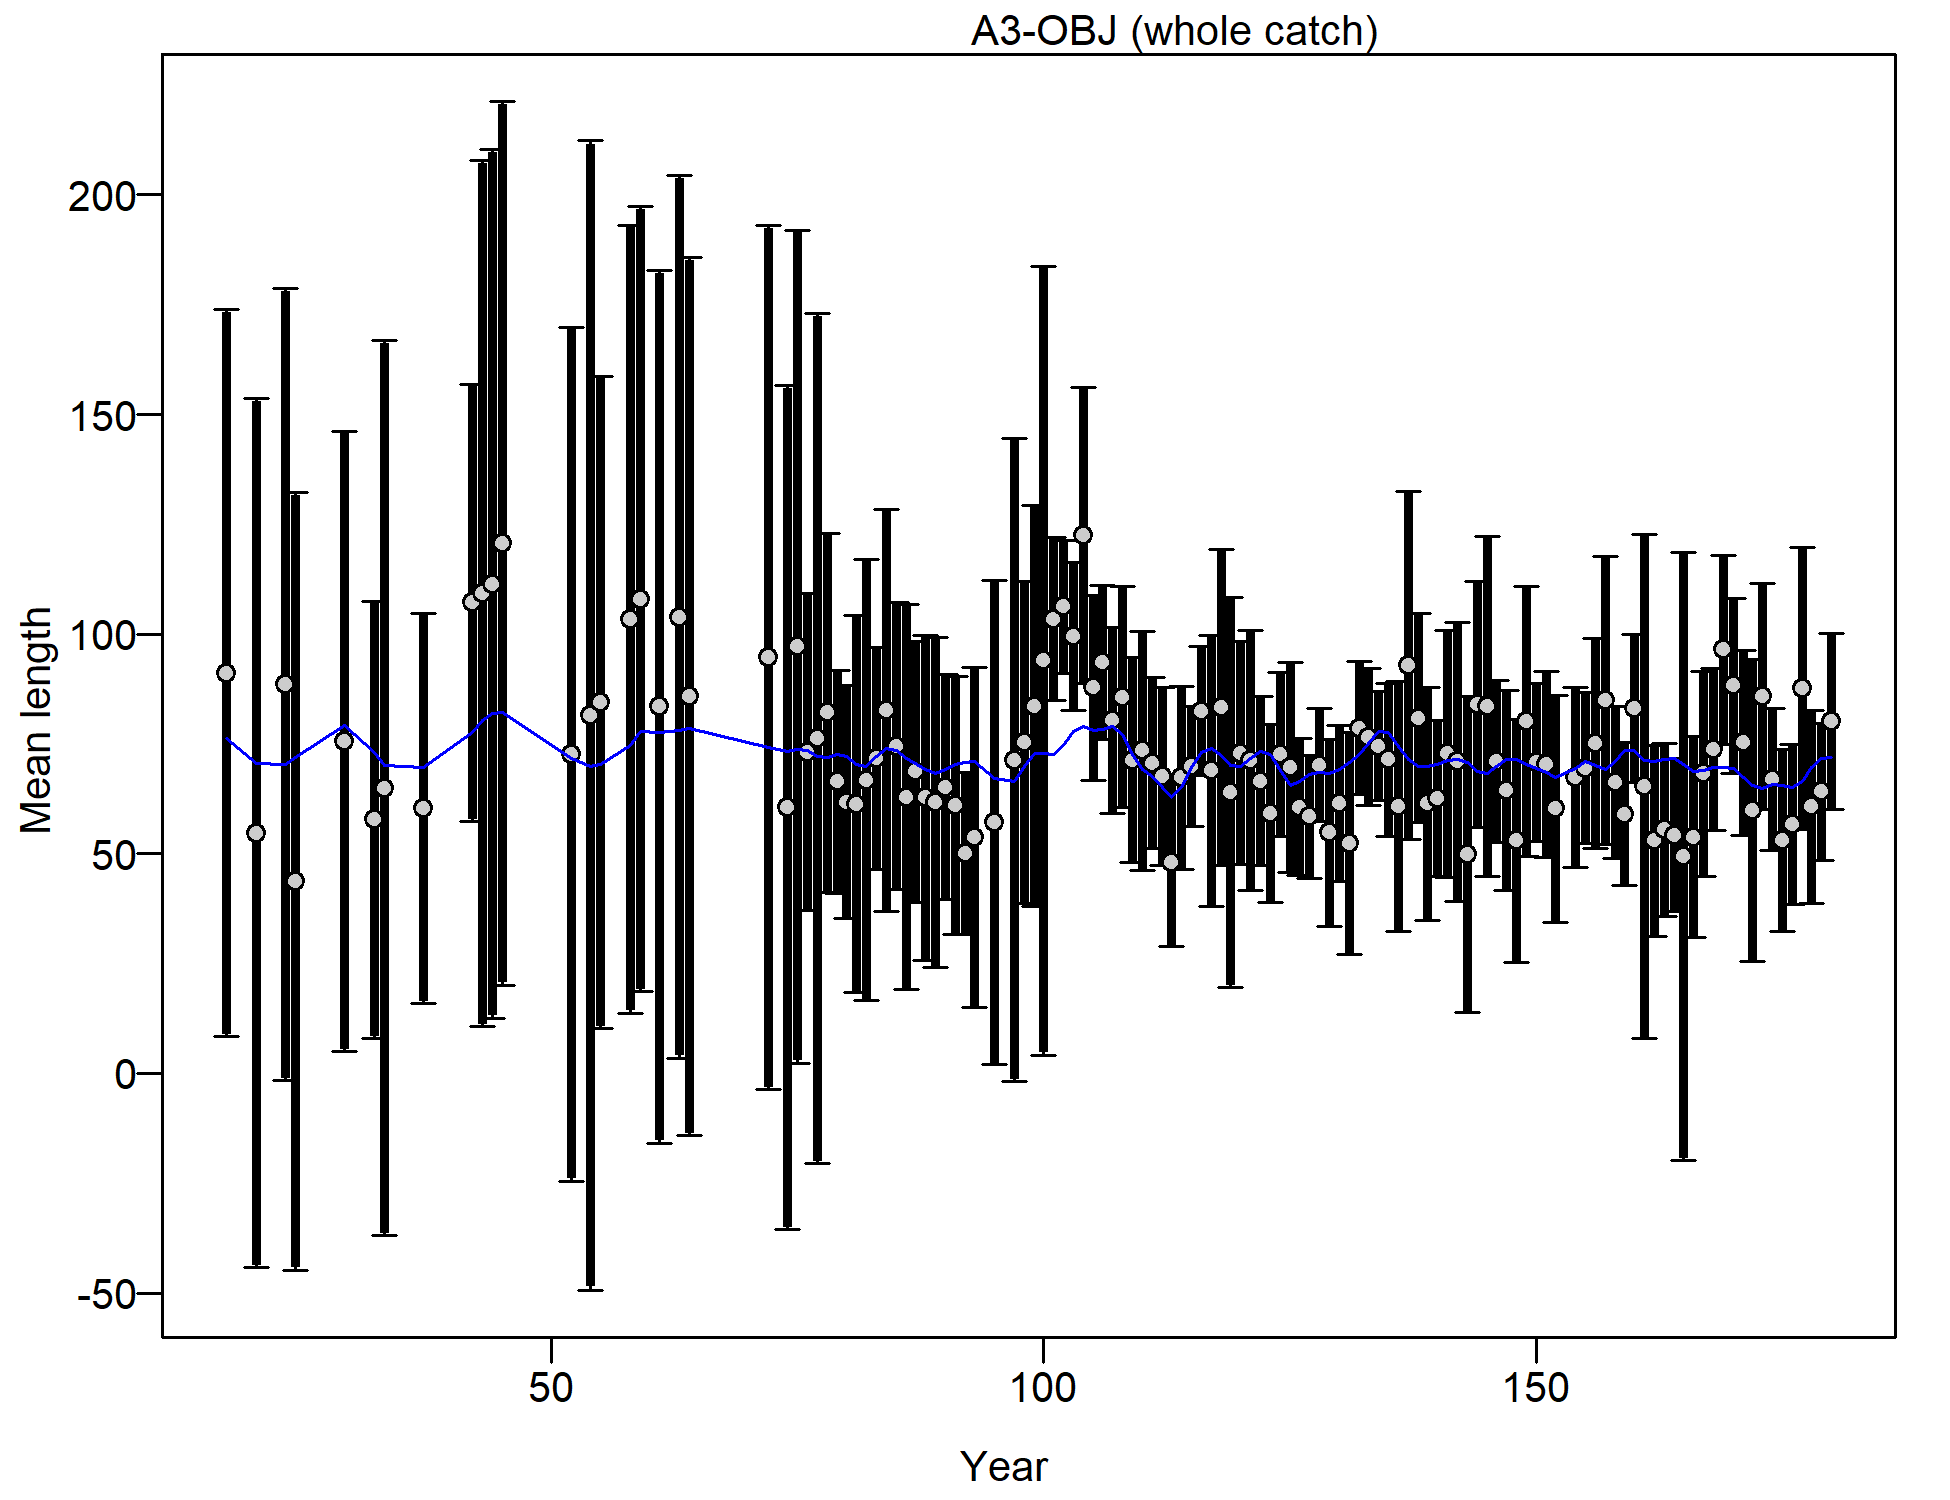
Mean length for A3-OBJ with 95% confidence intervals based on current samples sizes.
Francis data weighting method TA1.8: thinner intervals (with capped ends) show result of further adjusting sample sizes based on suggested multiplier (with 95% interval) for len data from A3-OBJ:
0.9877 (0.7015-1.4719)
For more info, see
Francis, R.I.C.C. (2011). Data weighting in statistical fisheries stock assessment models. Can. J. Fish. Aquat. Sci. 68: 1124-1138. https://doi.org/10.1139/f2011-025
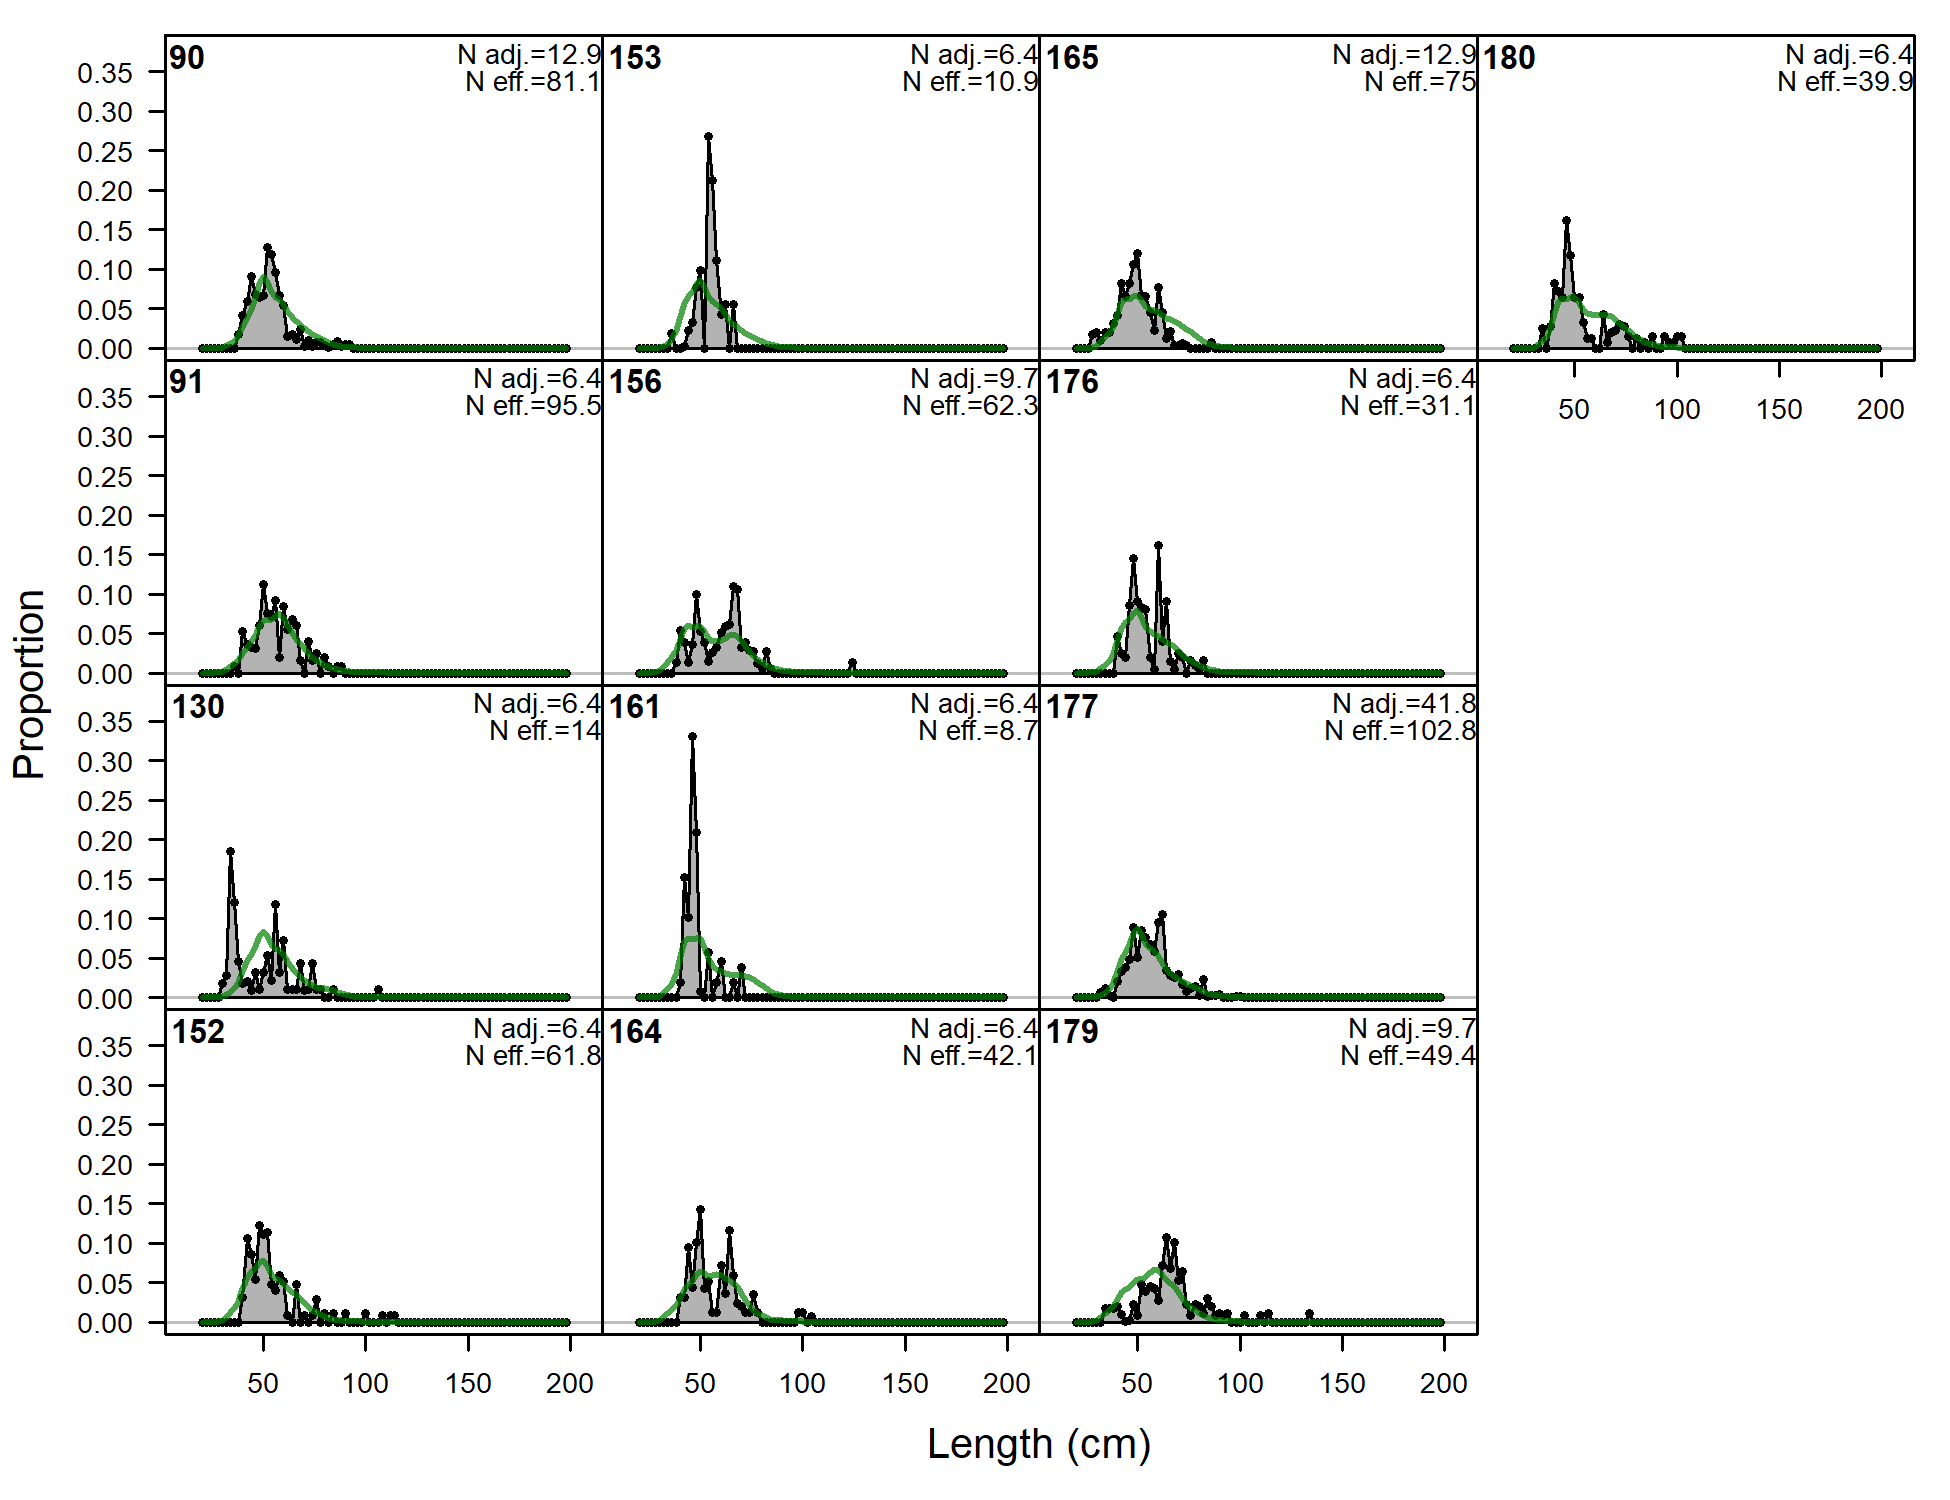
Length comps, whole catch, A4-OBJ.
'N adj.' is the input sample size after data-weighting adjustment. N eff. is the calculated effective sample size used in the McAllister-Iannelli tuning method.
file: comp_lenfit_flt15mkt0.png
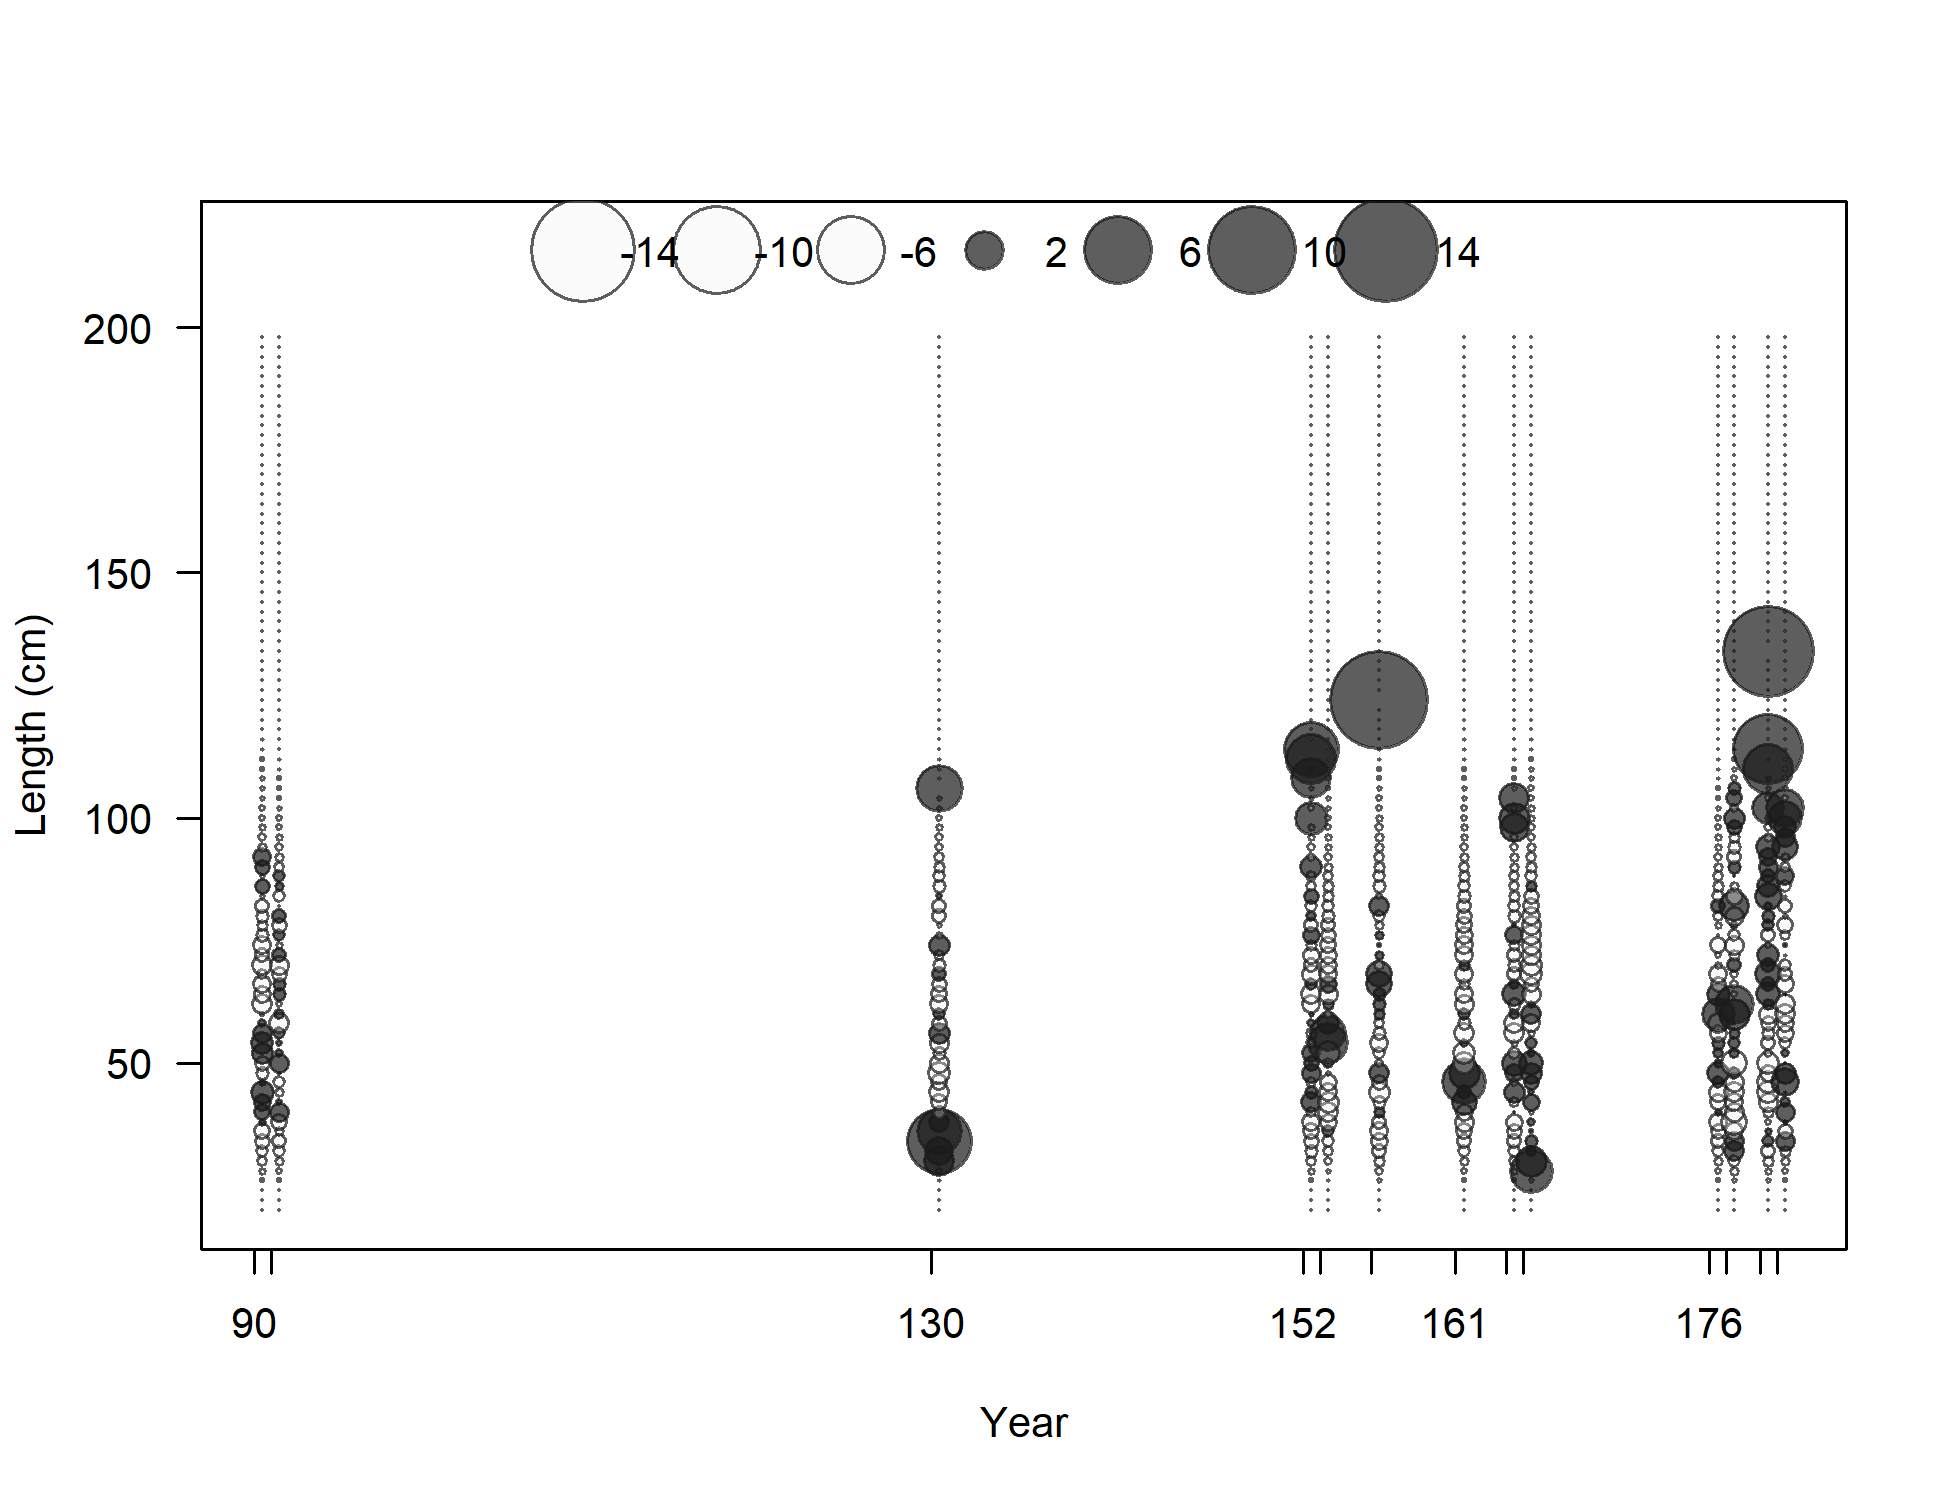
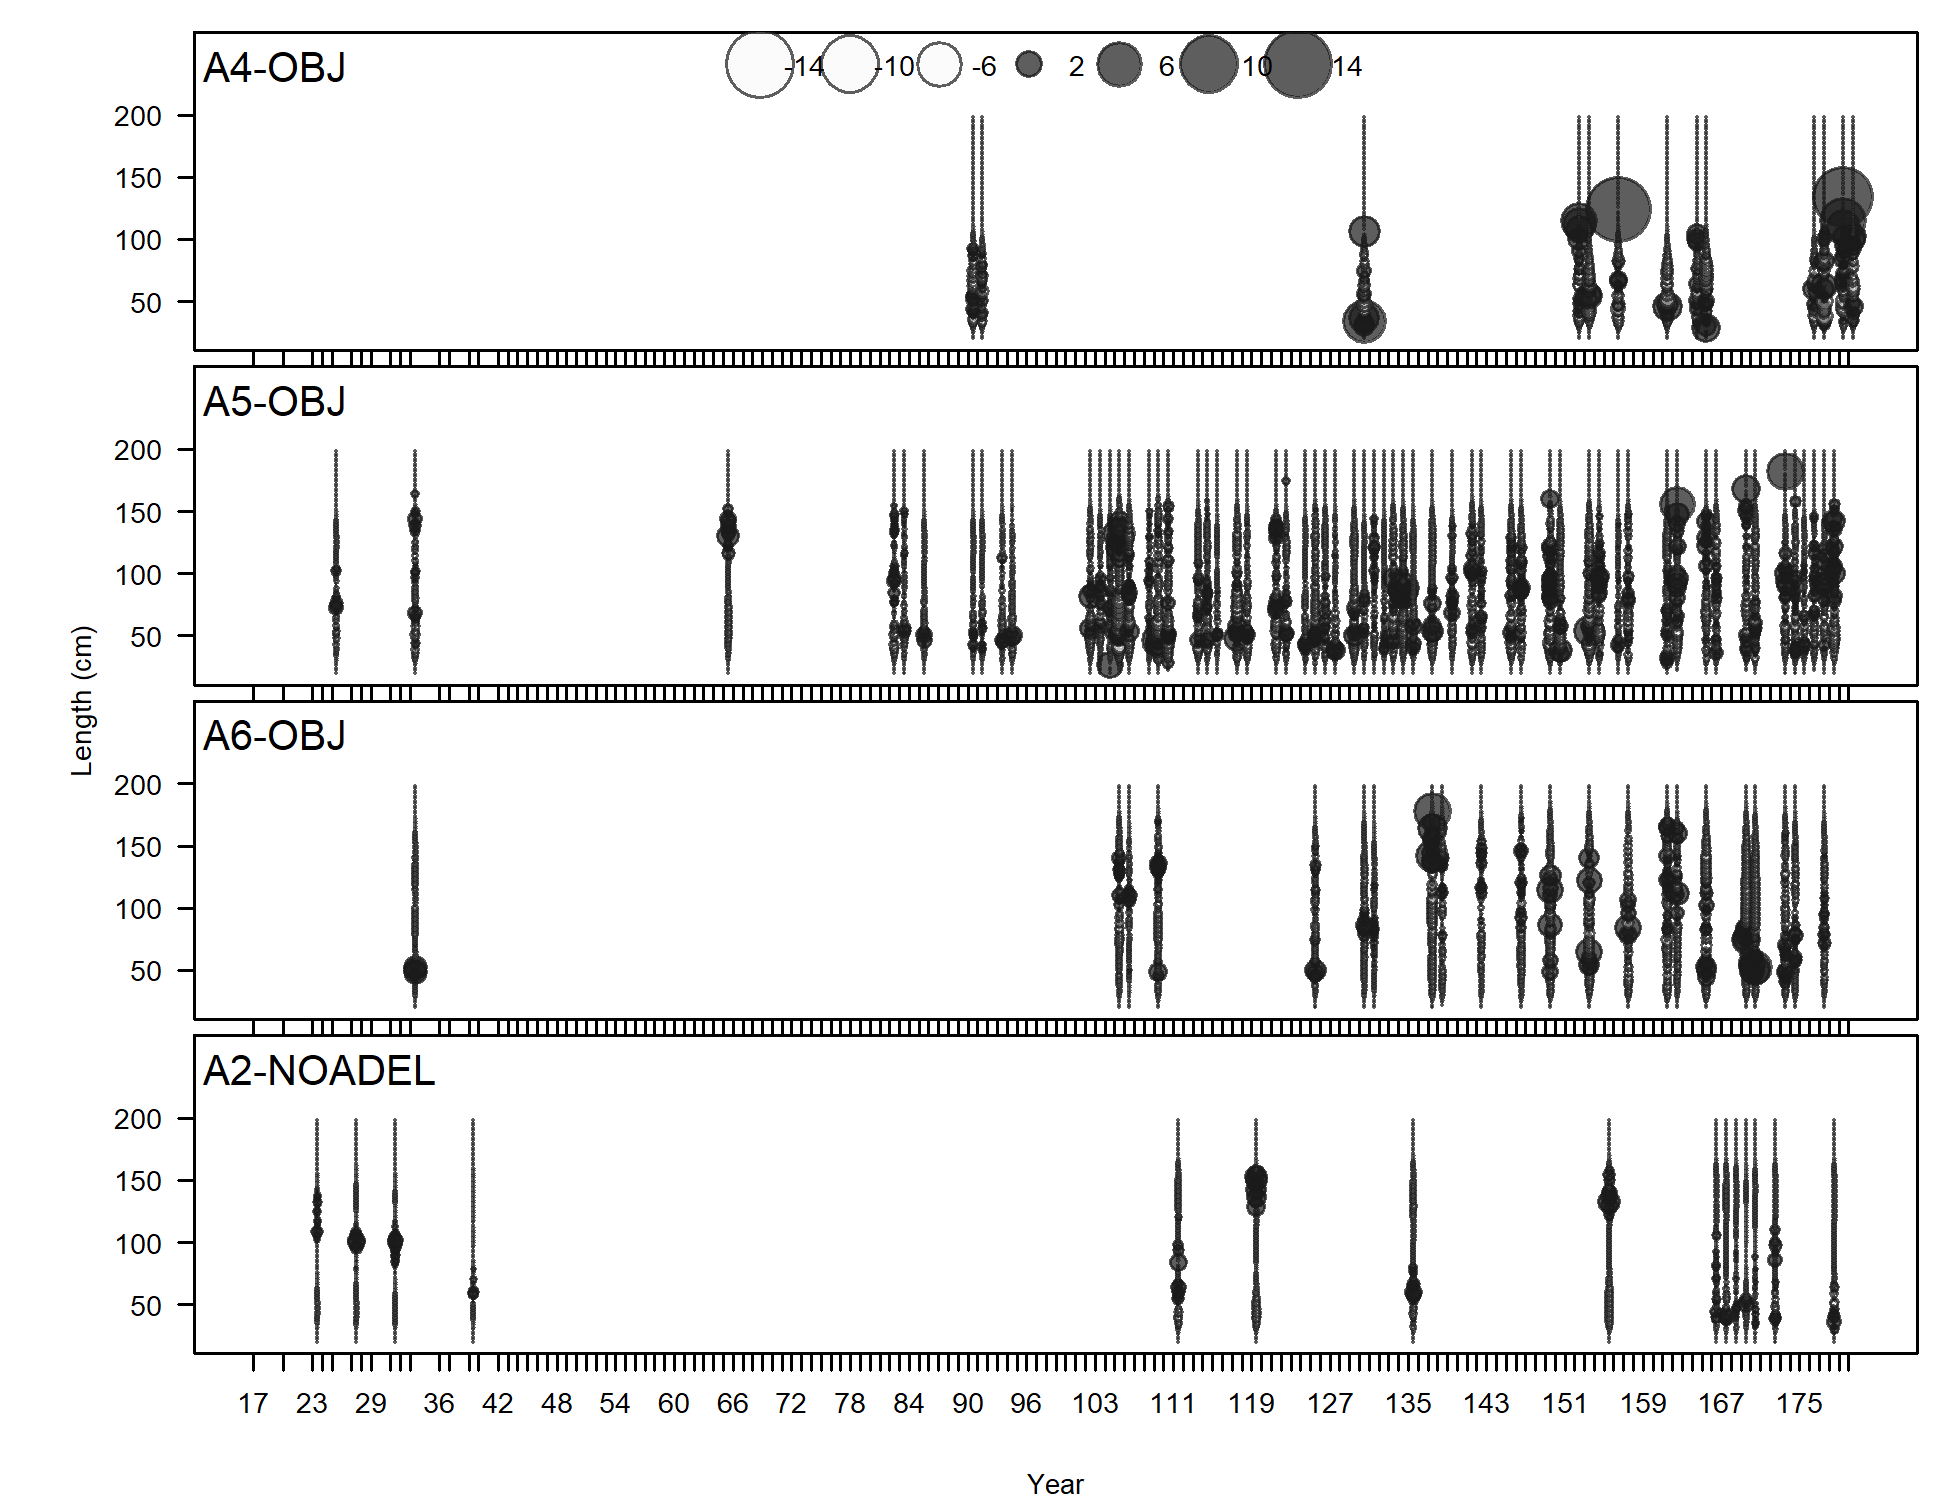
Pearson residuals, whole catch, A4-OBJ (max=12.49)
Closed bubbles are positive residuals (observed > expected) and open bubbles are negative residuals (observed < expected).
file: comp_lenfit_residsflt15mkt0.png
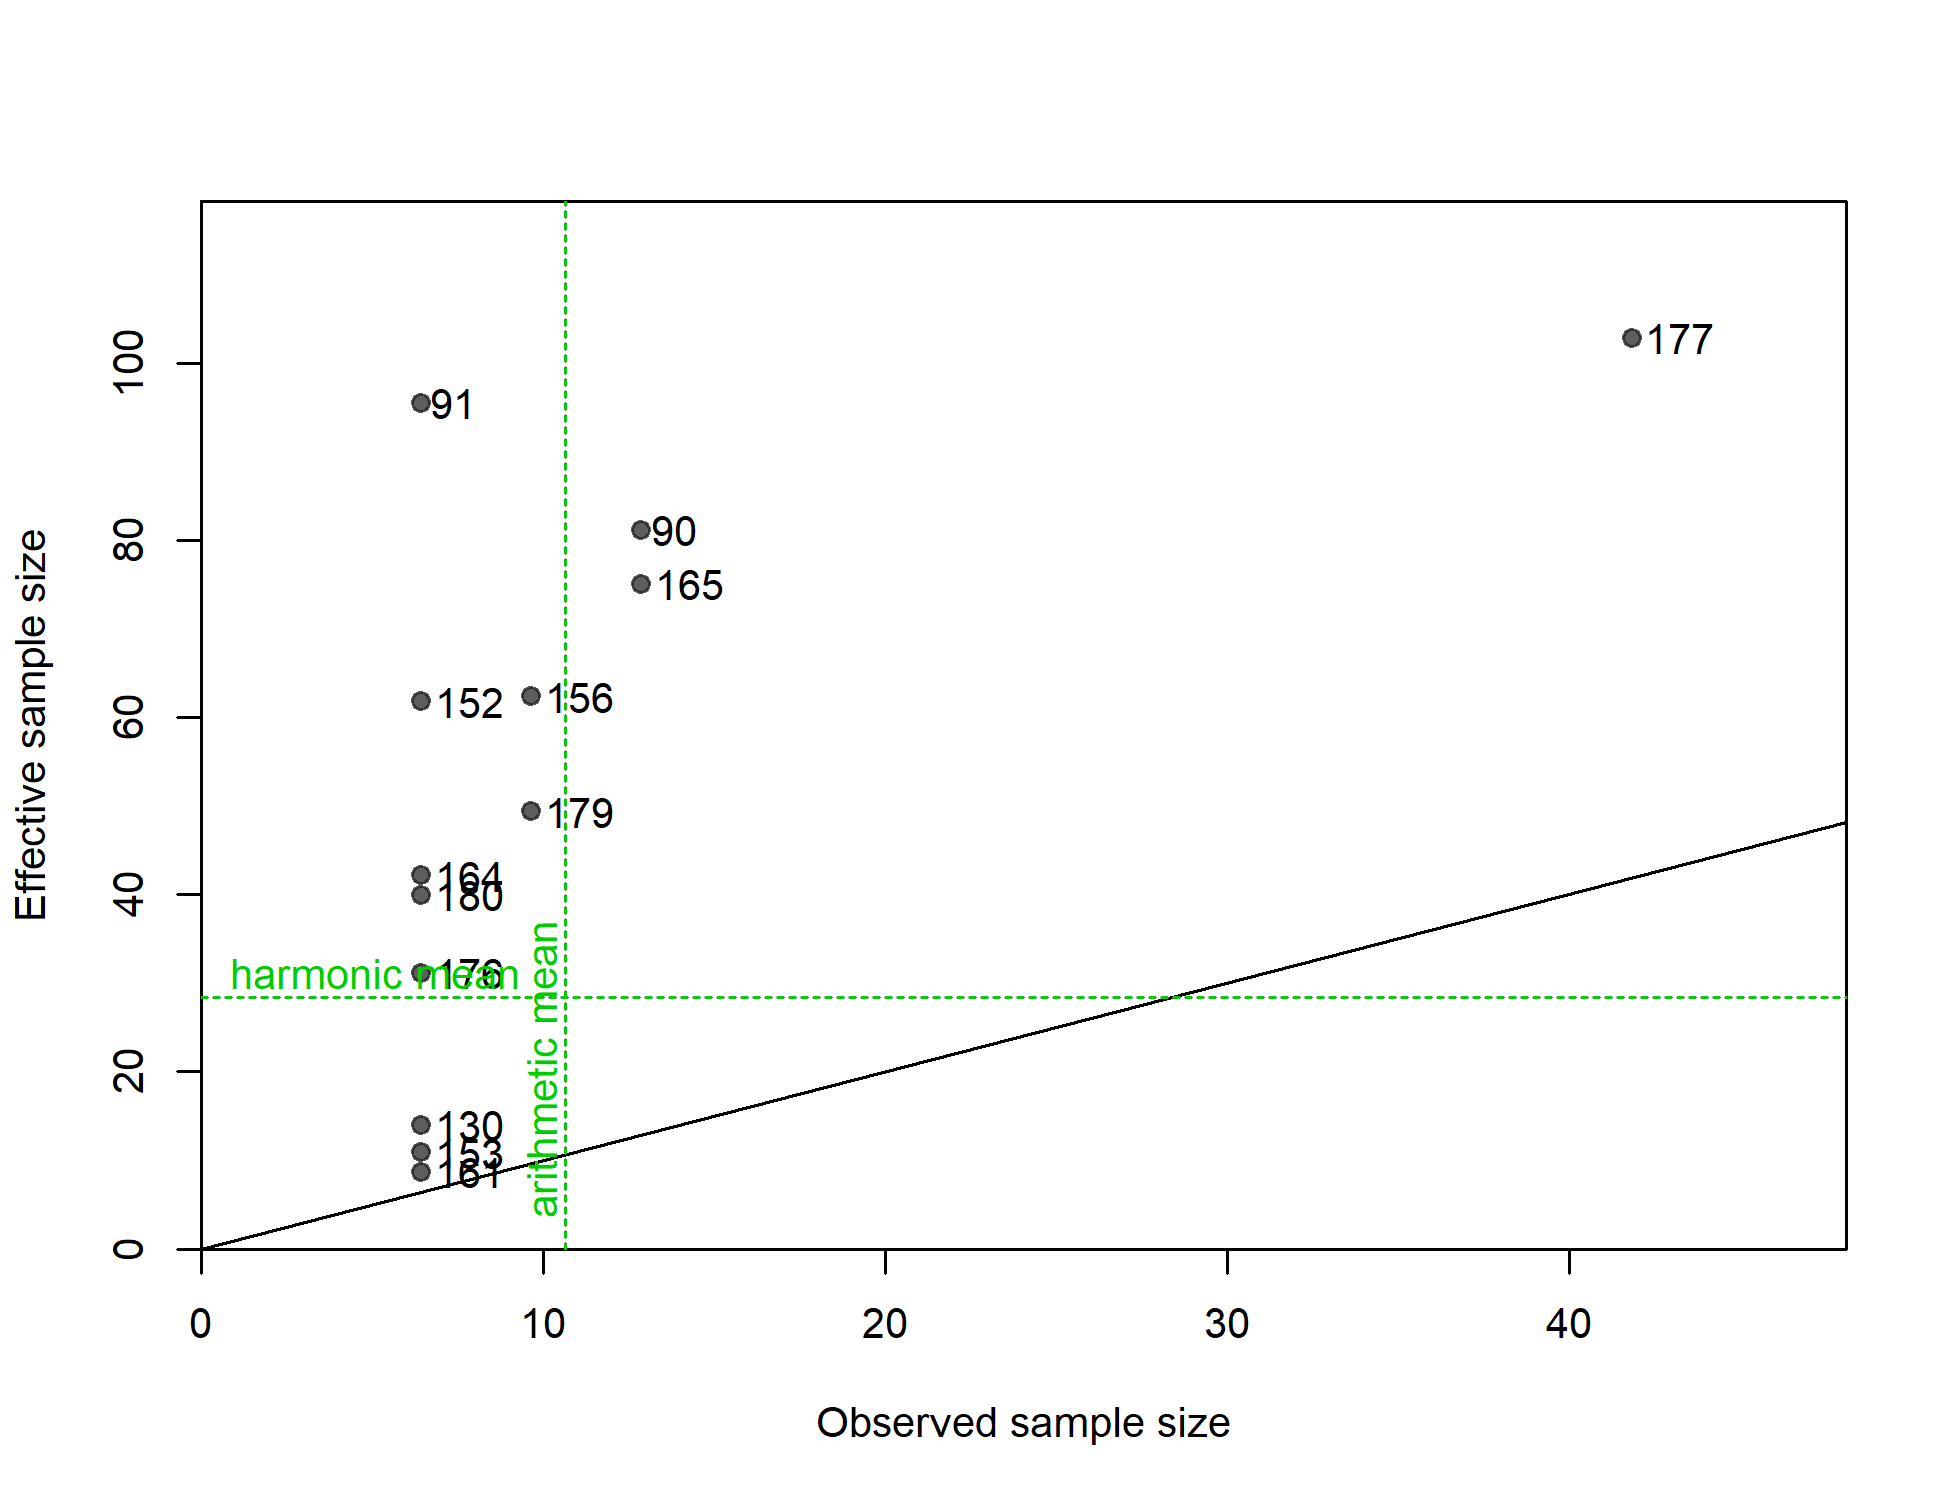
N-EffN comparison, Length comps, whole catch, A4-OBJ
file: comp_lenfit_sampsize_flt15mkt0.png
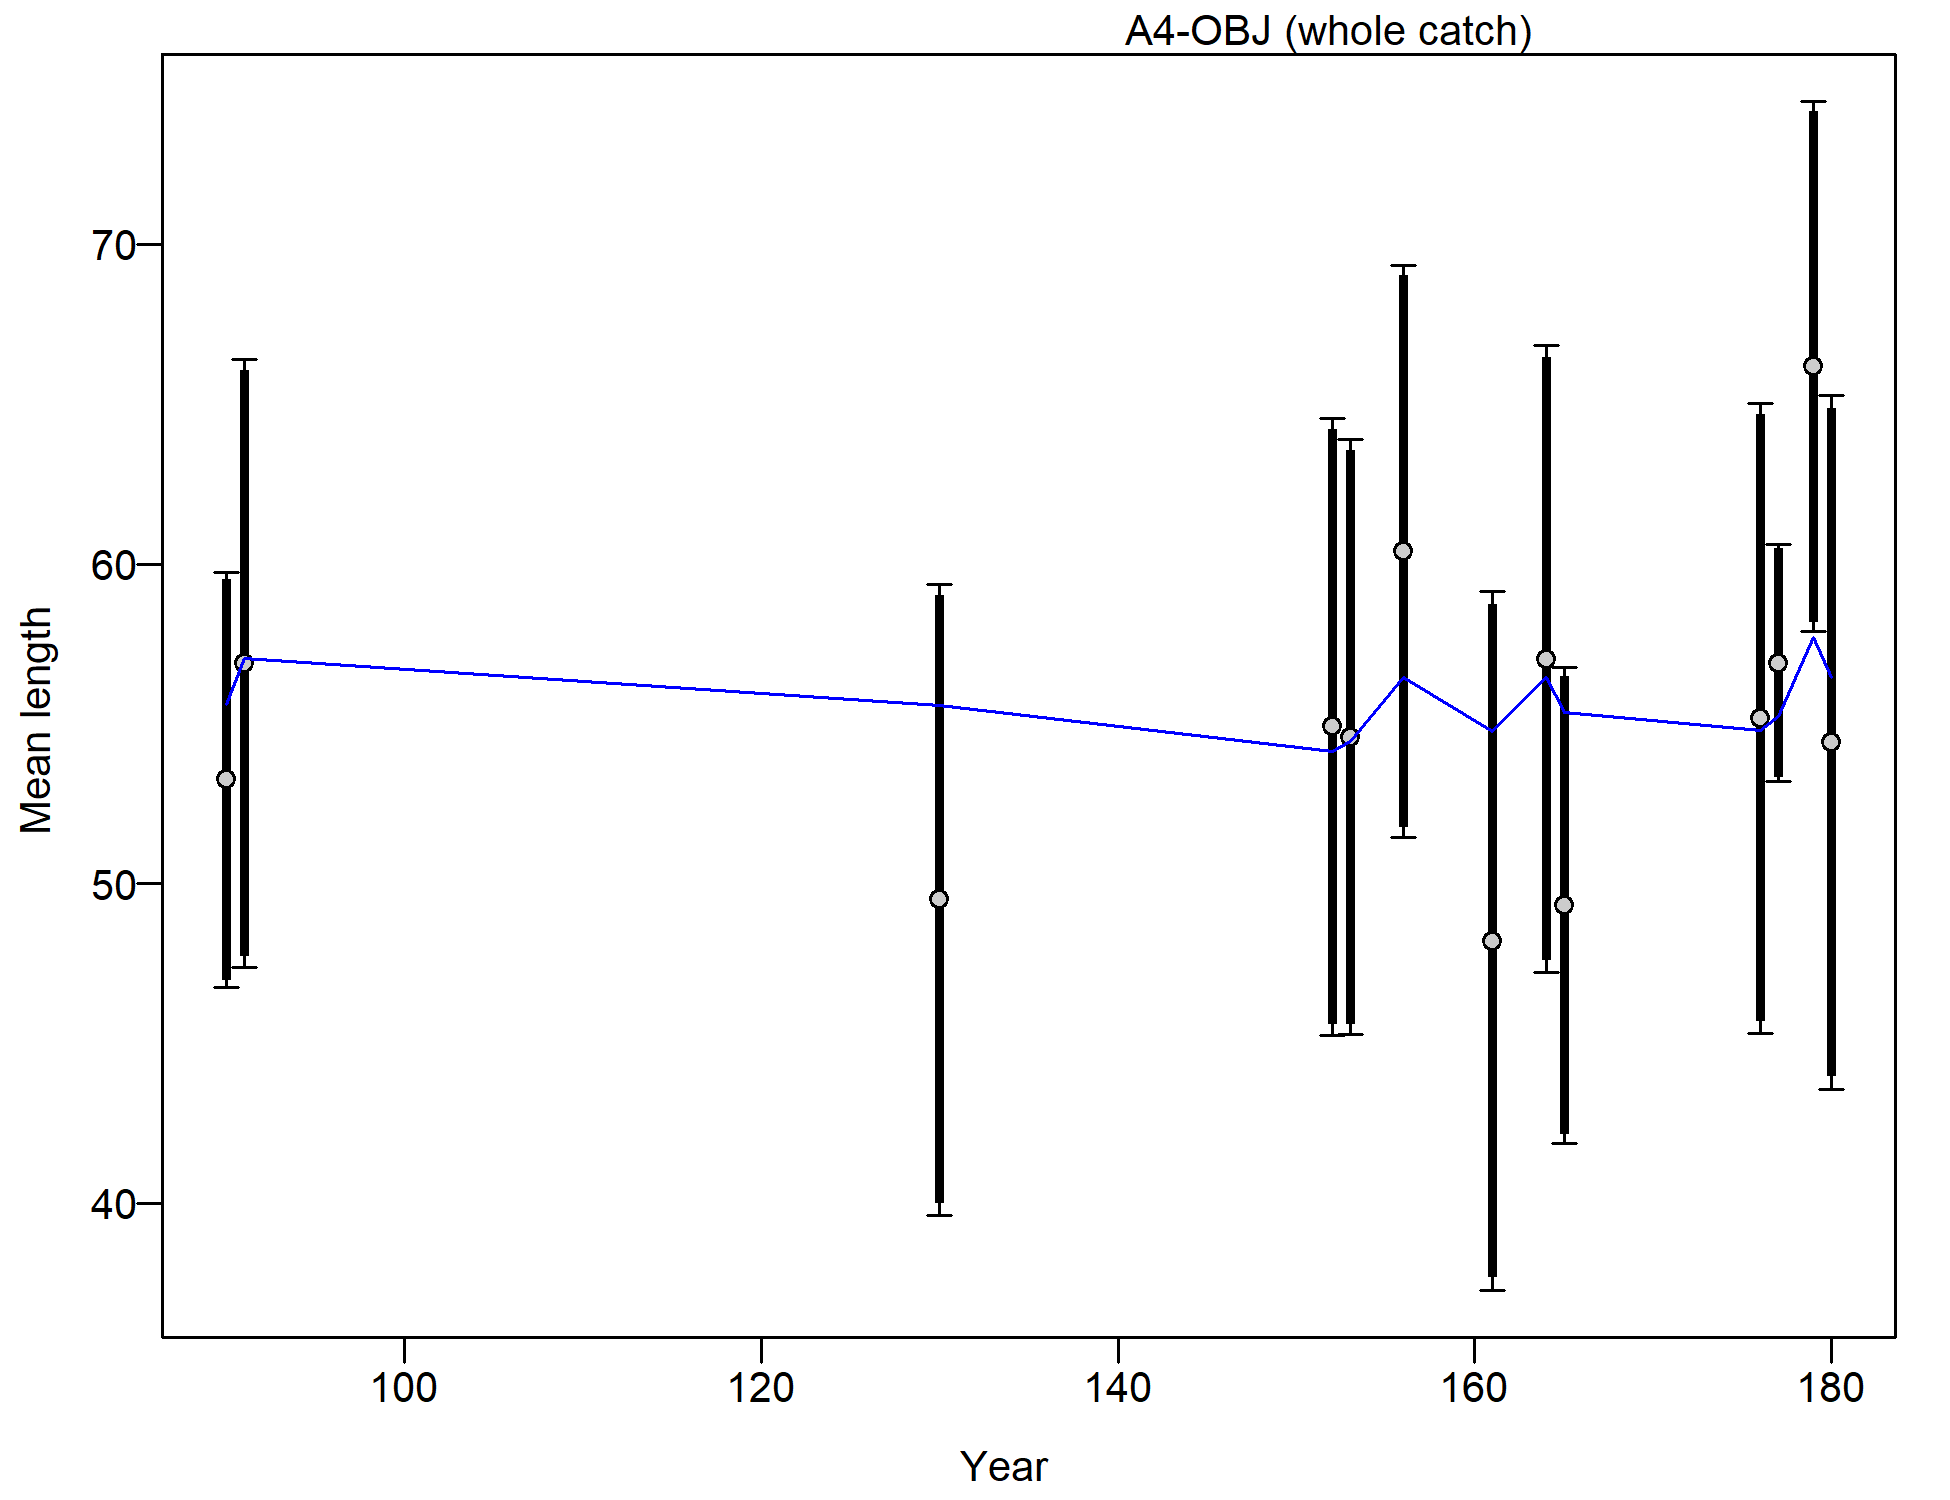
Mean length for A4-OBJ with 95% confidence intervals based on current samples sizes.
Francis data weighting method TA1.8: thinner intervals (with capped ends) show result of further adjusting sample sizes based on suggested multiplier (with 95% interval) for len data from A4-OBJ:
0.9289 (0.5395-2.8829)
For more info, see
Francis, R.I.C.C. (2011). Data weighting in statistical fisheries stock assessment models. Can. J. Fish. Aquat. Sci. 68: 1124-1138. https://doi.org/10.1139/f2011-025
Length comps, whole catch, A5-OBJ (plot 1 of 4).
'N adj.' is the input sample size after data-weighting adjustment. N eff. is the calculated effective sample size used in the McAllister-Iannelli tuning method.
file: comp_lenfit_flt16mkt0_page1.png
Length comps, whole catch, A5-OBJ (plot 2 of 4)
file: comp_lenfit_flt16mkt0_page2.png
Length comps, whole catch, A5-OBJ (plot 3 of 4)
file: comp_lenfit_flt16mkt0_page3.png
Length comps, whole catch, A5-OBJ (plot 4 of 4)
file: comp_lenfit_flt16mkt0_page4.png
Pearson residuals, whole catch, A5-OBJ (max=4.21) (plot 4 of 4)
Closed bubbles are positive residuals (observed > expected) and open bubbles are negative residuals (observed < expected).
file: comp_lenfit_residsflt16mkt0_page4.png
N-EffN comparison, Length comps, whole catch, A5-OBJ
file: comp_lenfit_sampsize_flt16mkt0.png
Mean length for A5-OBJ with 95% confidence intervals based on current samples sizes.
Francis data weighting method TA1.8: thinner intervals (with capped ends) show result of further adjusting sample sizes based on suggested multiplier (with 95% interval) for len data from A5-OBJ:
1.9621 (1.3684-3.3927)
For more info, see
Francis, R.I.C.C. (2011). Data weighting in statistical fisheries stock assessment models. Can. J. Fish. Aquat. Sci. 68: 1124-1138. https://doi.org/10.1139/f2011-025
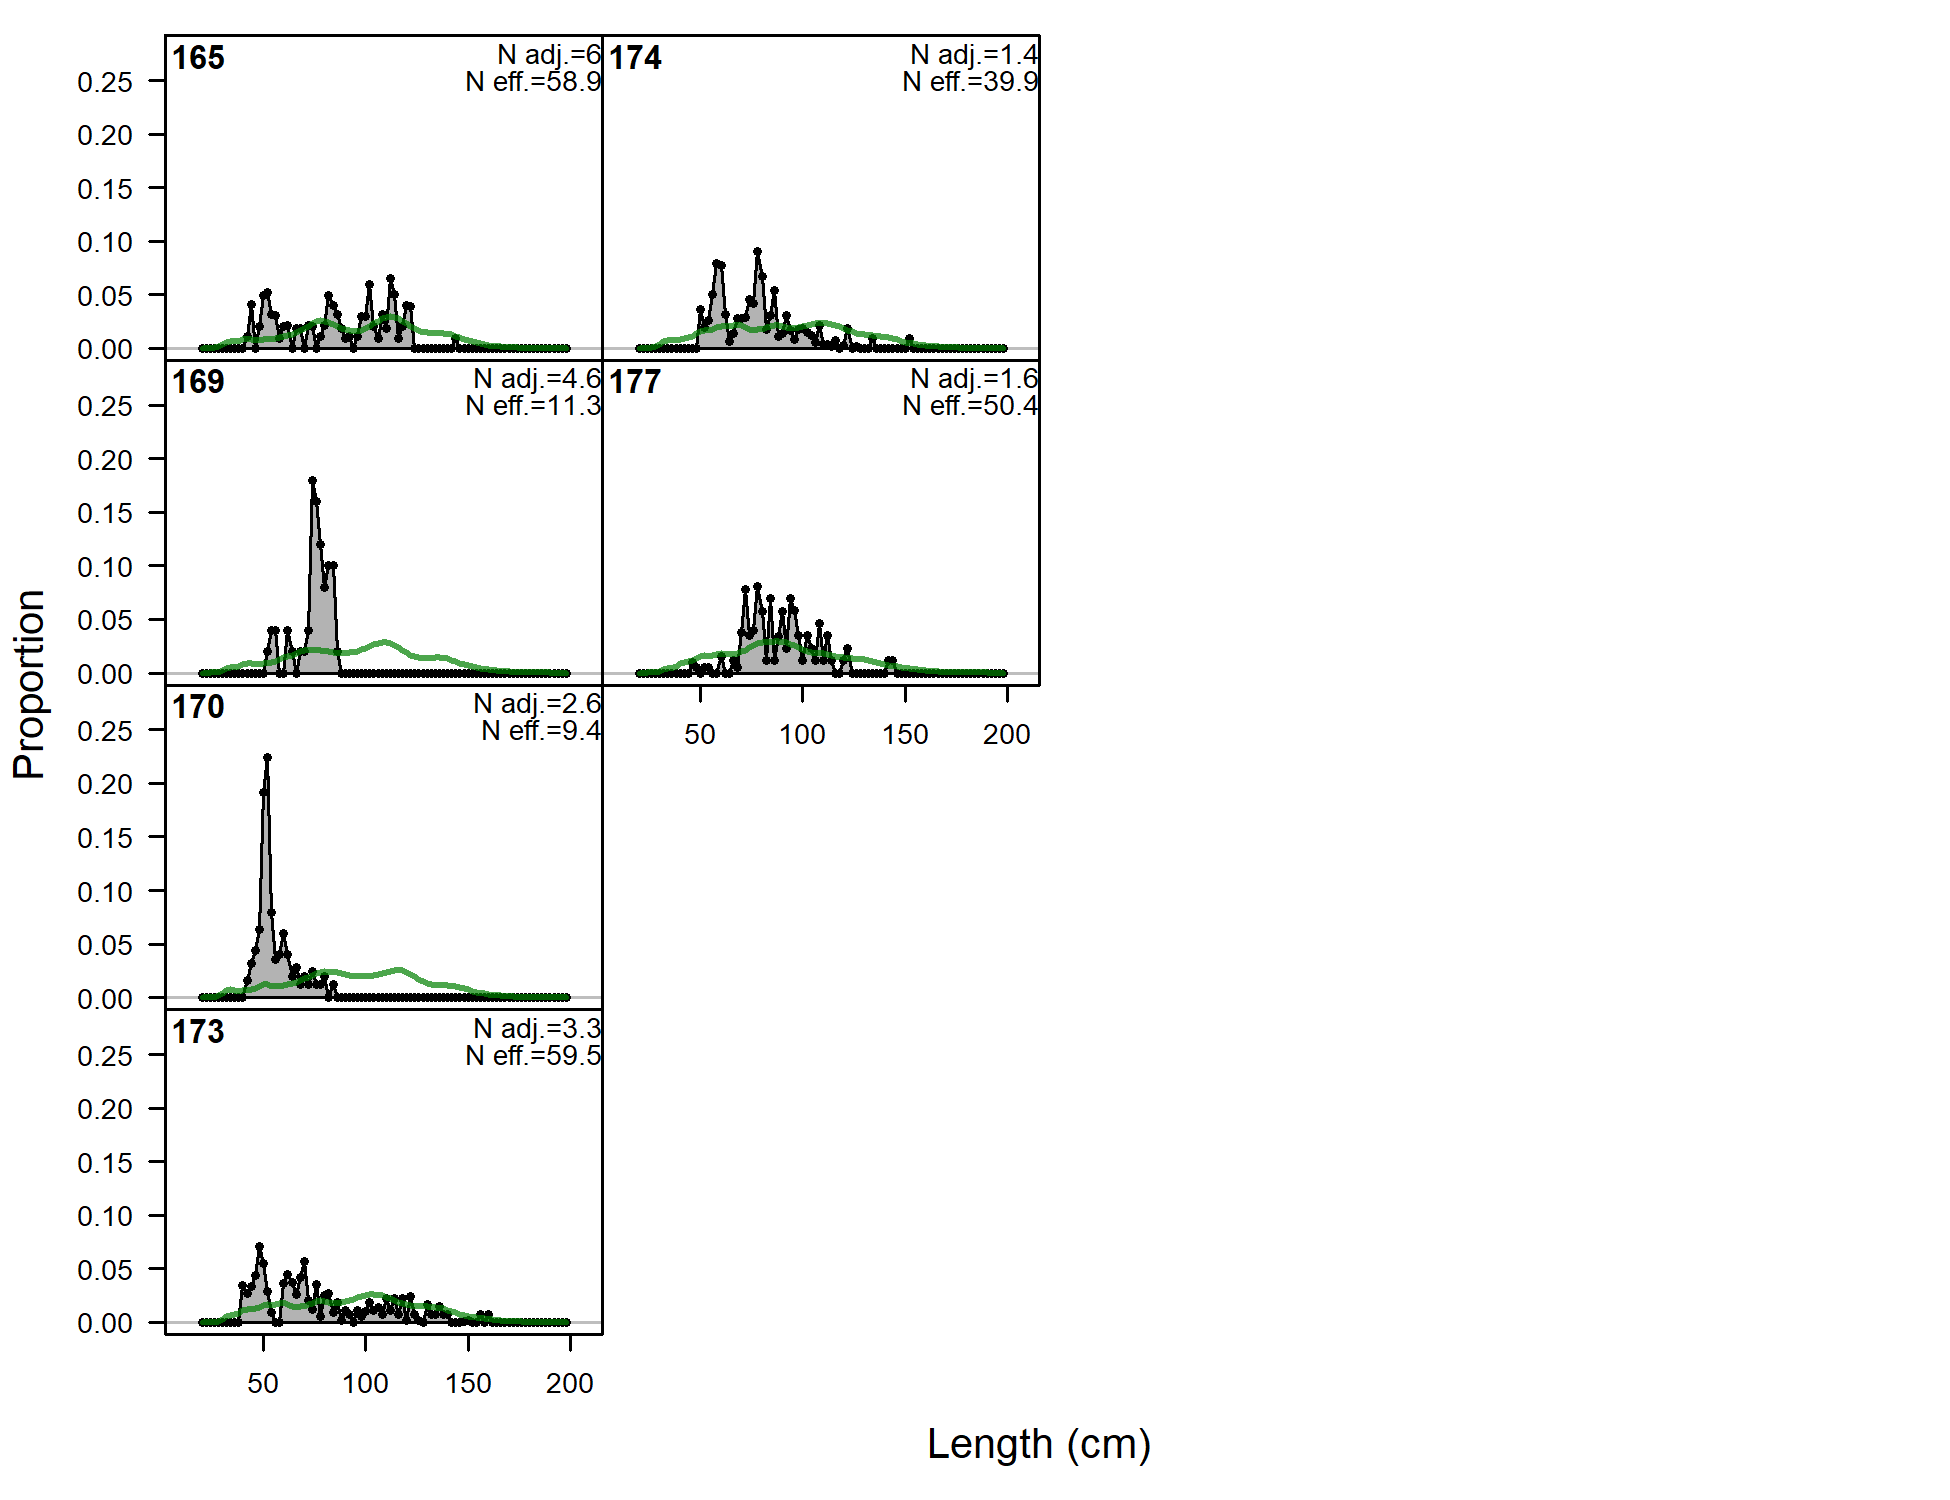
Length comps, whole catch, A6-OBJ (plot 1 of 2).
'N adj.' is the input sample size after data-weighting adjustment. N eff. is the calculated effective sample size used in the McAllister-Iannelli tuning method.
file: comp_lenfit_flt17mkt0_page1.png
Length comps, whole catch, A6-OBJ (plot 2 of 2)
file: comp_lenfit_flt17mkt0_page2.png
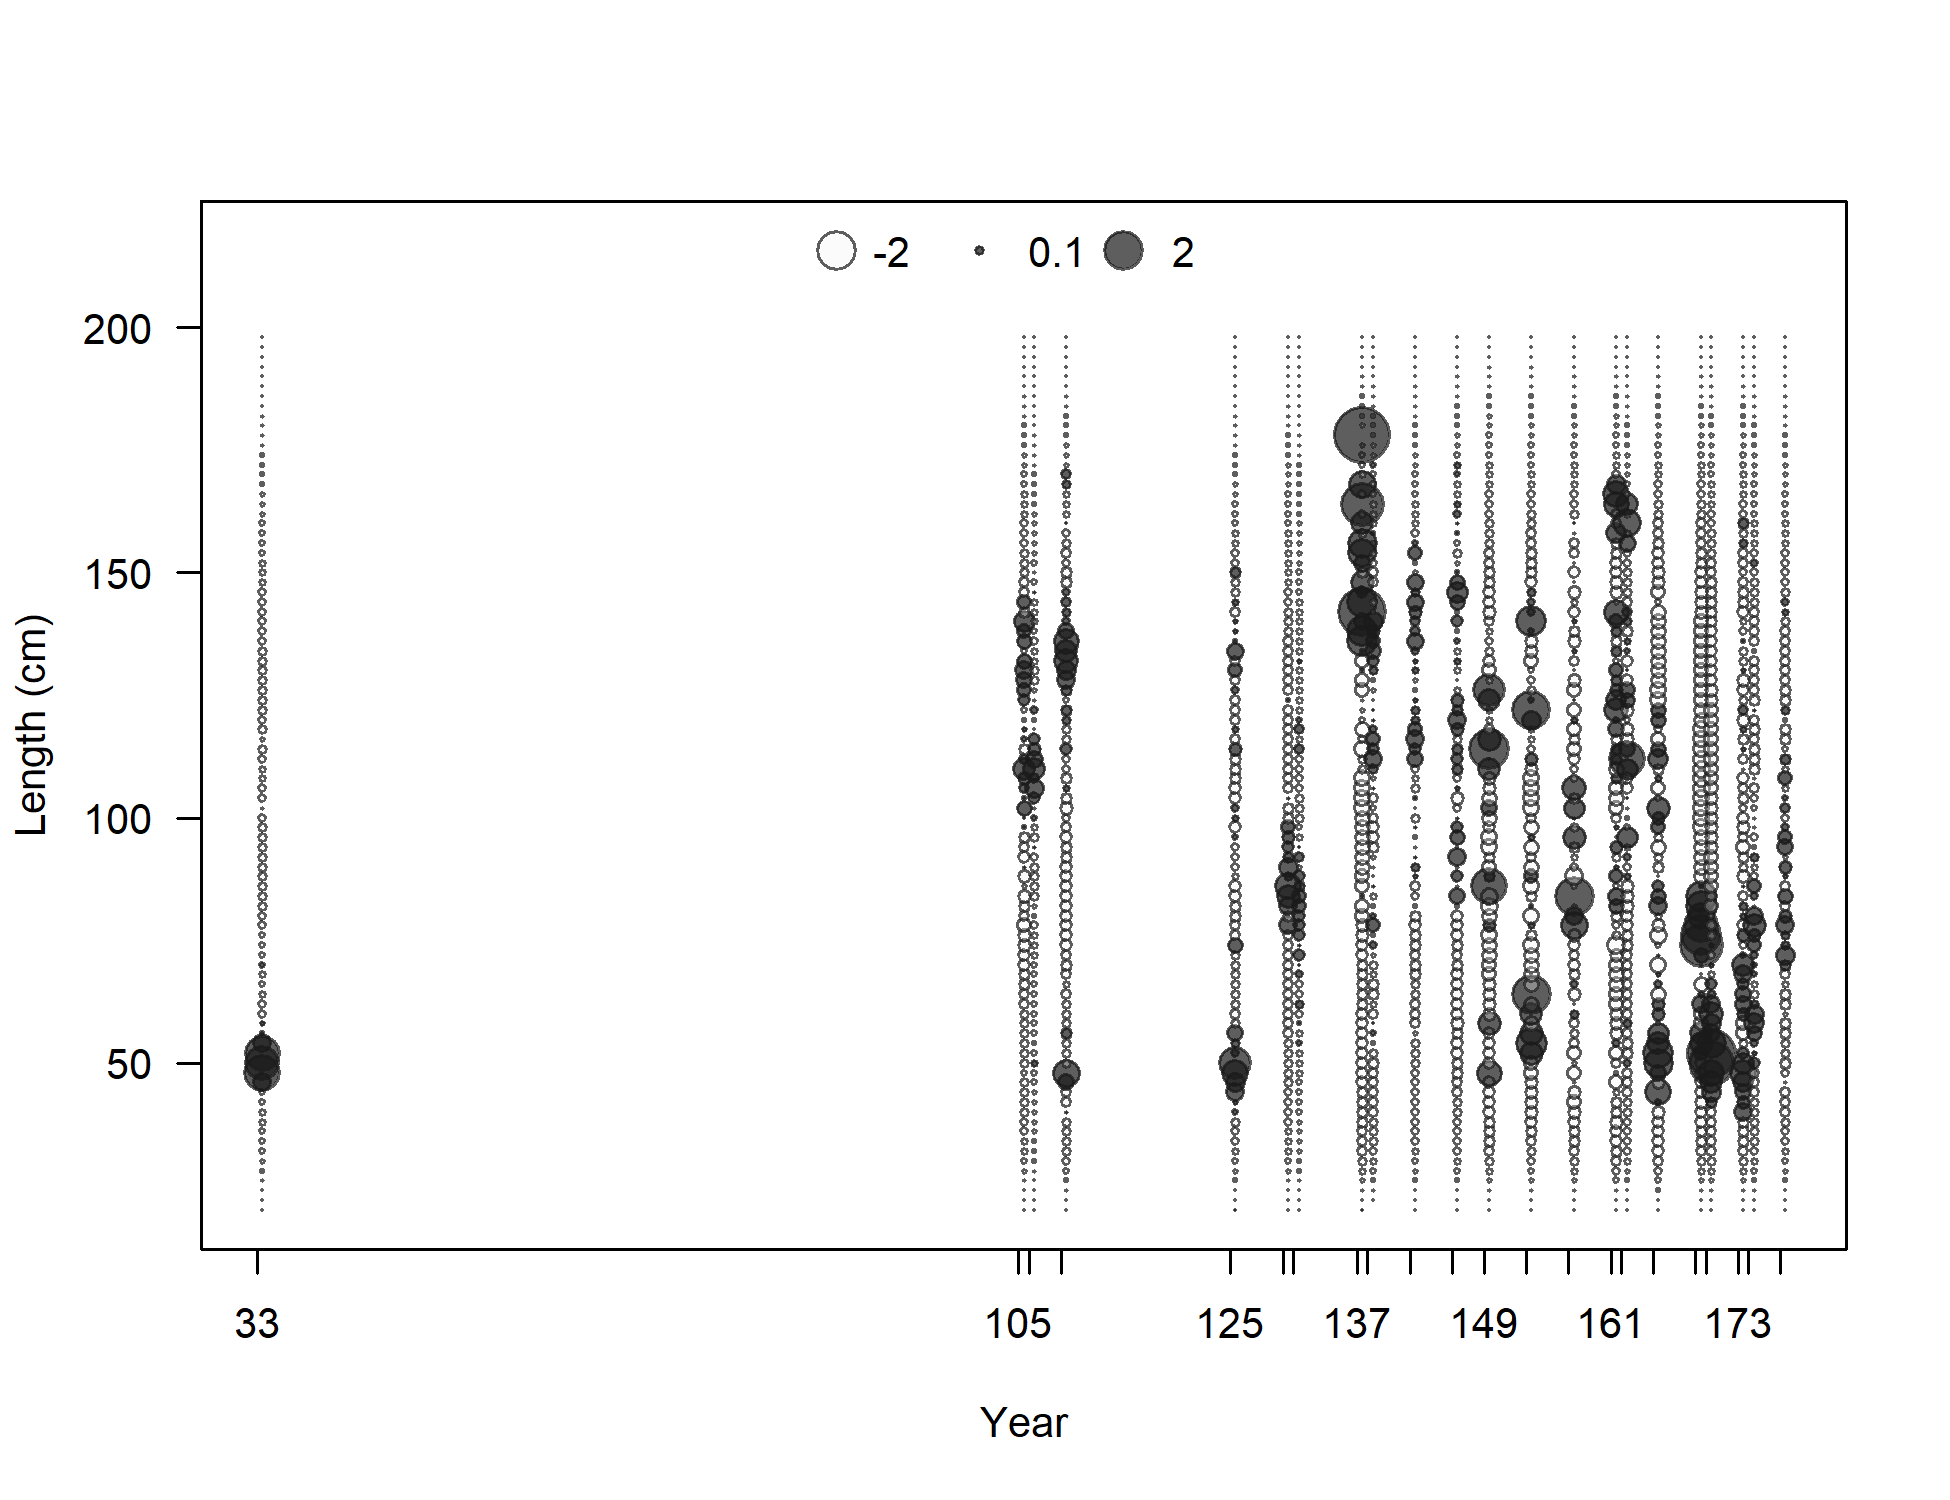
Pearson residuals, whole catch, A6-OBJ (max=4.06) (plot 2 of 2)
Closed bubbles are positive residuals (observed > expected) and open bubbles are negative residuals (observed < expected).
file: comp_lenfit_residsflt17mkt0_page2.png
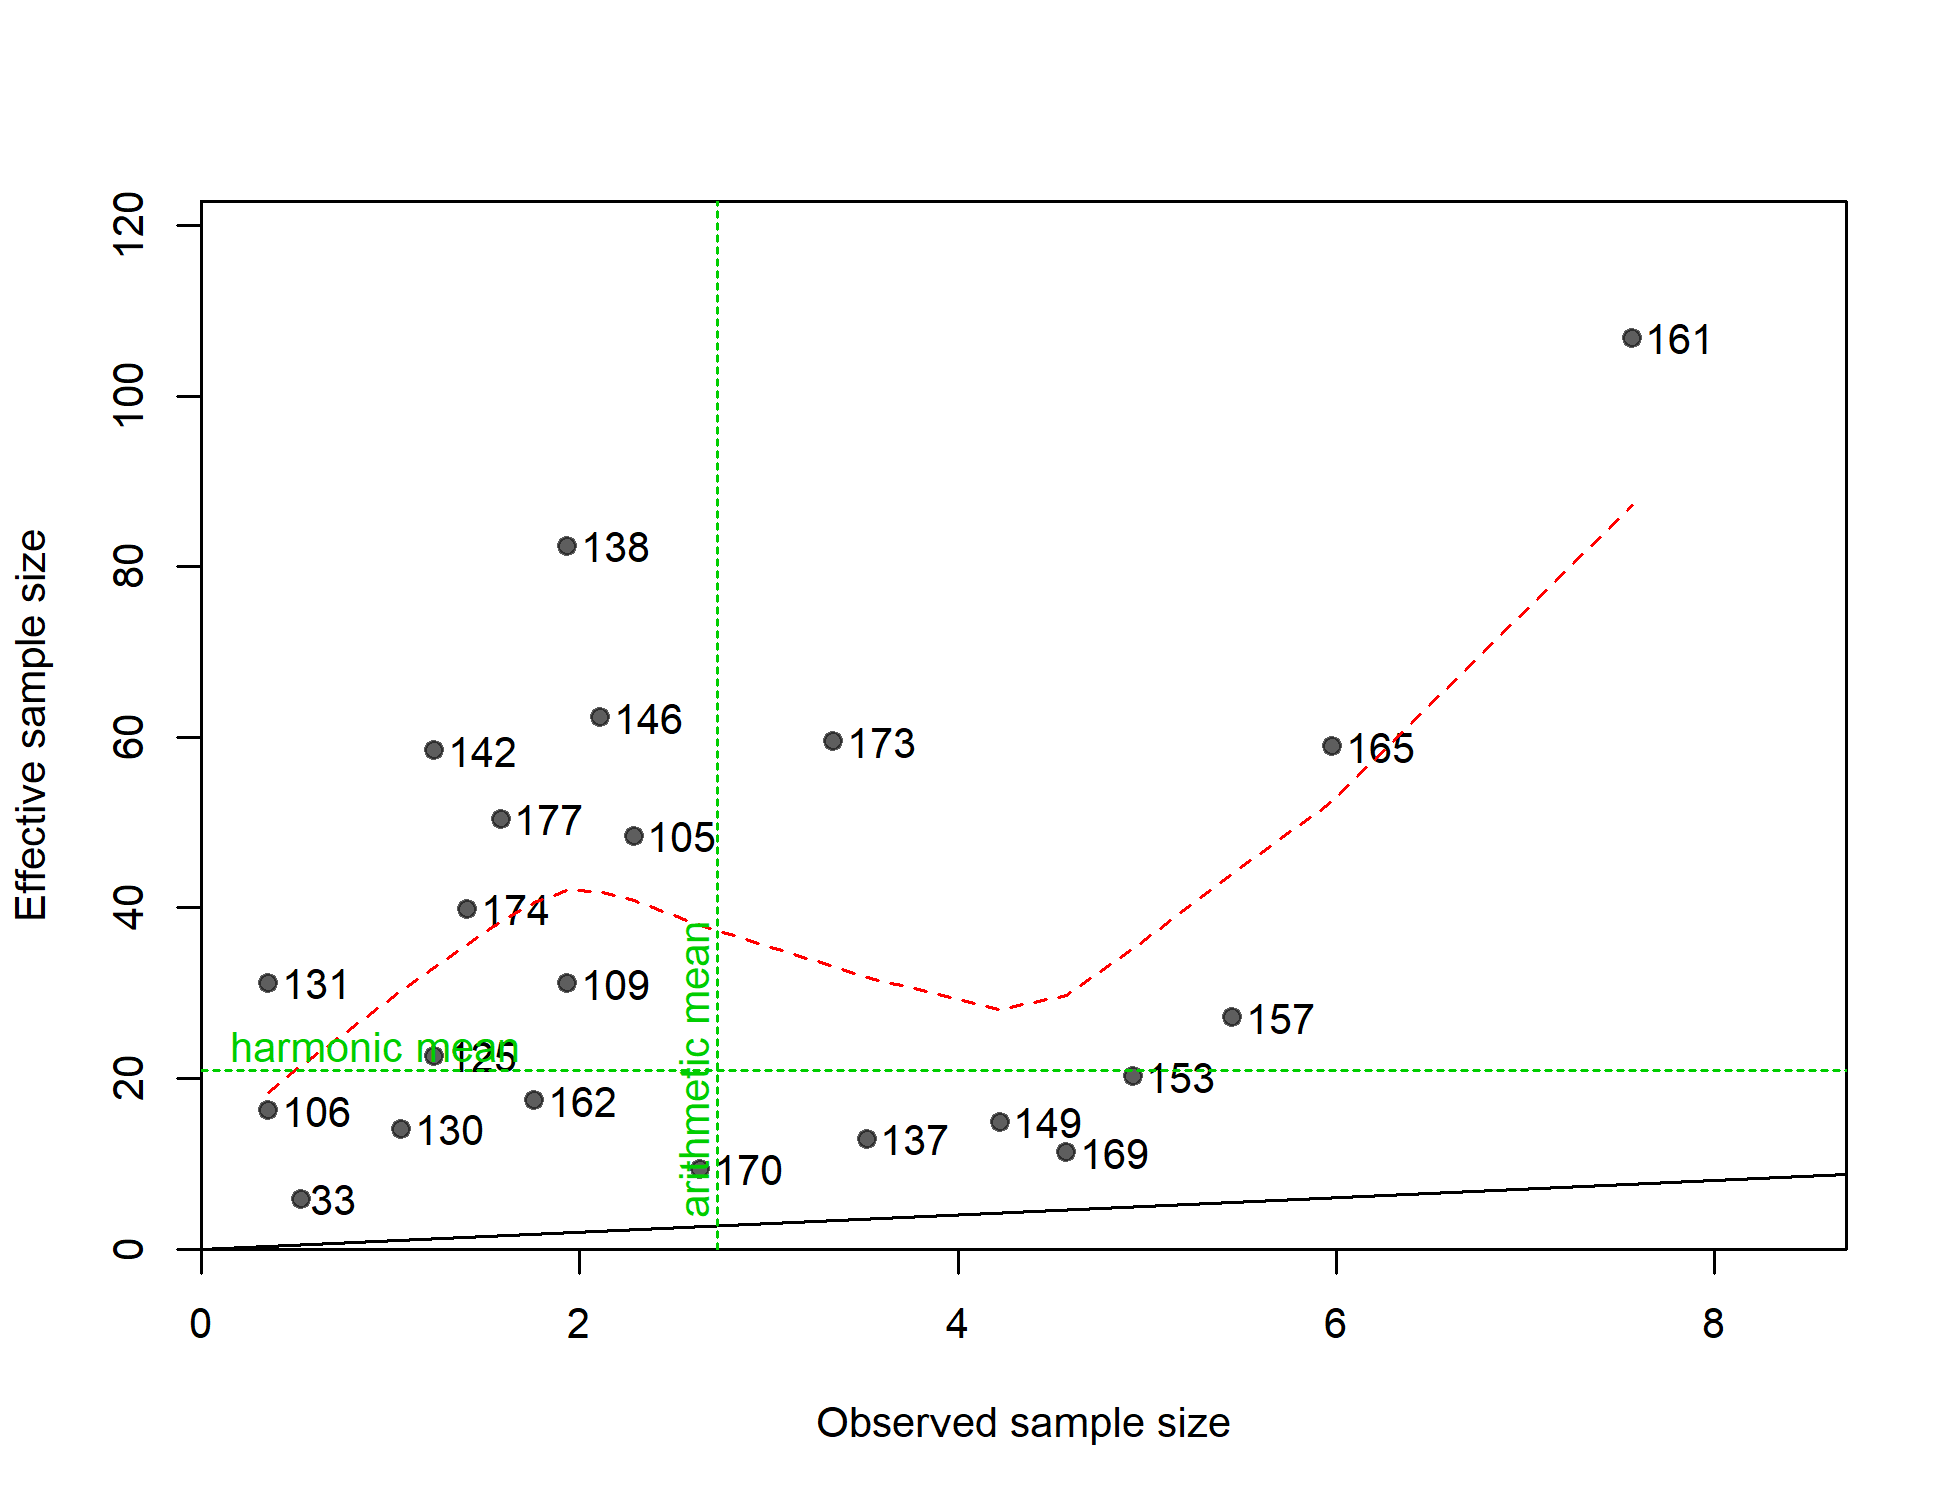
N-EffN comparison, Length comps, whole catch, A6-OBJ
file: comp_lenfit_sampsize_flt17mkt0.png
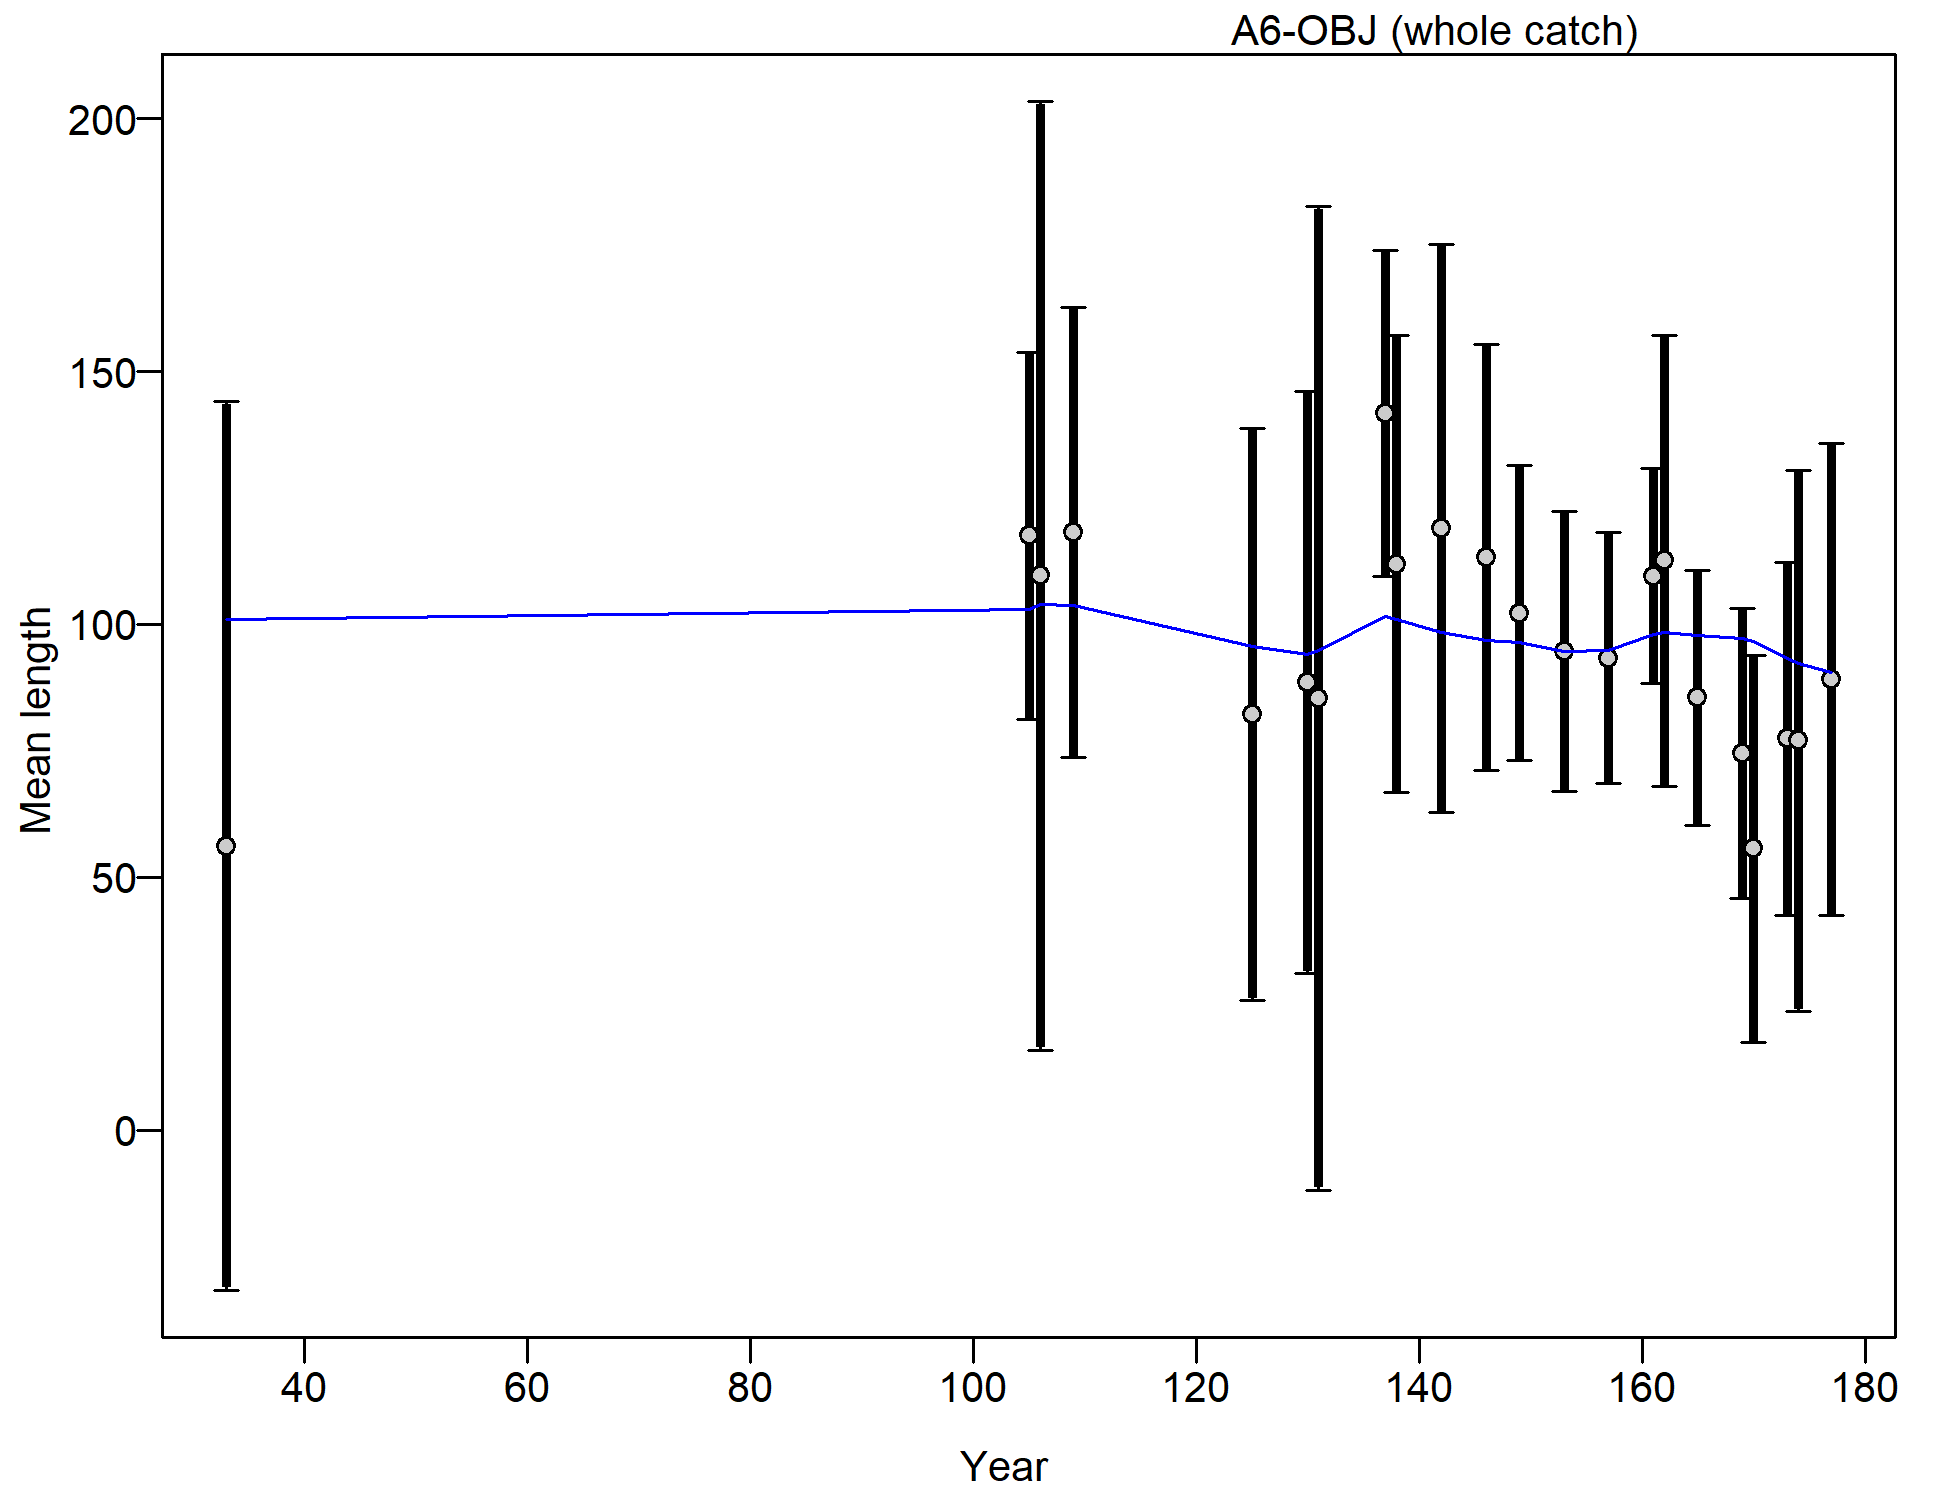
Mean length for A6-OBJ with 95% confidence intervals based on current samples sizes.
Francis data weighting method TA1.8: thinner intervals (with capped ends) show result of further adjusting sample sizes based on suggested multiplier (with 95% interval) for len data from A6-OBJ:
0.9889 (0.5949-2.5861)
For more info, see
Francis, R.I.C.C. (2011). Data weighting in statistical fisheries stock assessment models. Can. J. Fish. Aquat. Sci. 68: 1124-1138. https://doi.org/10.1139/f2011-025
Length comps, whole catch, A2-NOADEL.
'N adj.' is the input sample size after data-weighting adjustment. N eff. is the calculated effective sample size used in the McAllister-Iannelli tuning method.
file: comp_lenfit_flt19mkt0.png
Pearson residuals, whole catch, A2-NOADEL (max=1.43)
Closed bubbles are positive residuals (observed > expected) and open bubbles are negative residuals (observed < expected).
file: comp_lenfit_residsflt19mkt0.png
N-EffN comparison, Length comps, whole catch, A2-NOADEL
file: comp_lenfit_sampsize_flt19mkt0.png
Mean length for A2-NOADEL with 95% confidence intervals based on current samples sizes.
Francis data weighting method TA1.8: thinner intervals (with capped ends) show result of further adjusting sample sizes based on suggested multiplier (with 95% interval) for len data from A2-NOADEL:
1.9418 (1.0509-16.0008)
For more info, see
Francis, R.I.C.C. (2011). Data weighting in statistical fisheries stock assessment models. Can. J. Fish. Aquat. Sci. 68: 1124-1138. https://doi.org/10.1139/f2011-025
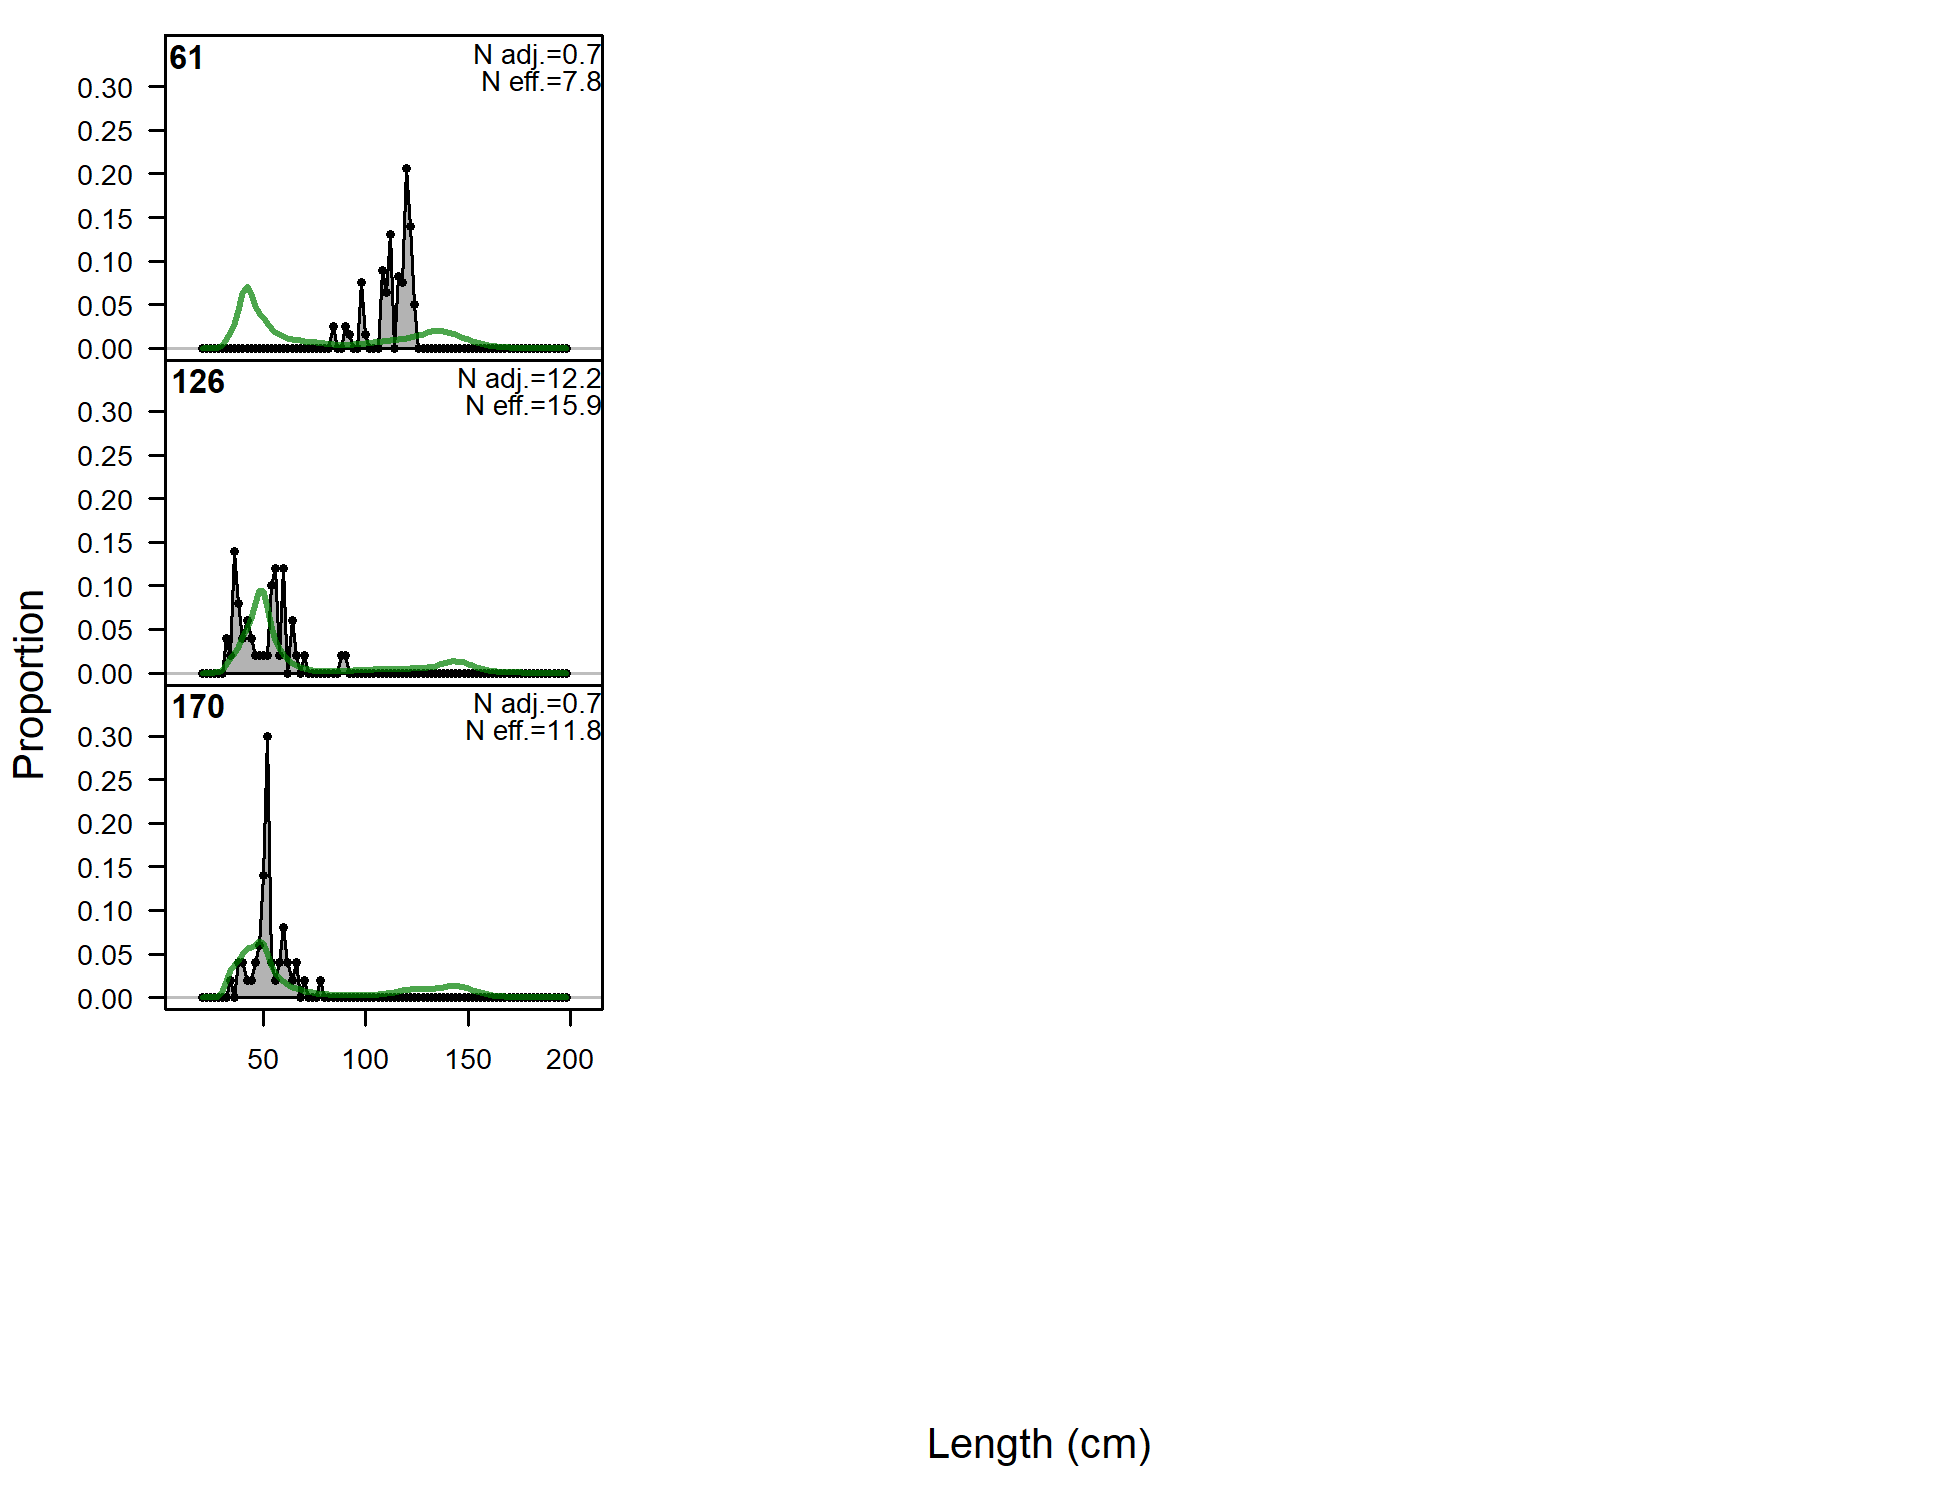
Length comps, whole catch, A3-NOADEL (plot 1 of 3).
'N adj.' is the input sample size after data-weighting adjustment. N eff. is the calculated effective sample size used in the McAllister-Iannelli tuning method.
file: comp_lenfit_flt20mkt0_page1.png
Length comps, whole catch, A3-NOADEL (plot 2 of 3)
file: comp_lenfit_flt20mkt0_page2.png
Length comps, whole catch, A3-NOADEL (plot 3 of 3)
file: comp_lenfit_flt20mkt0_page3.png
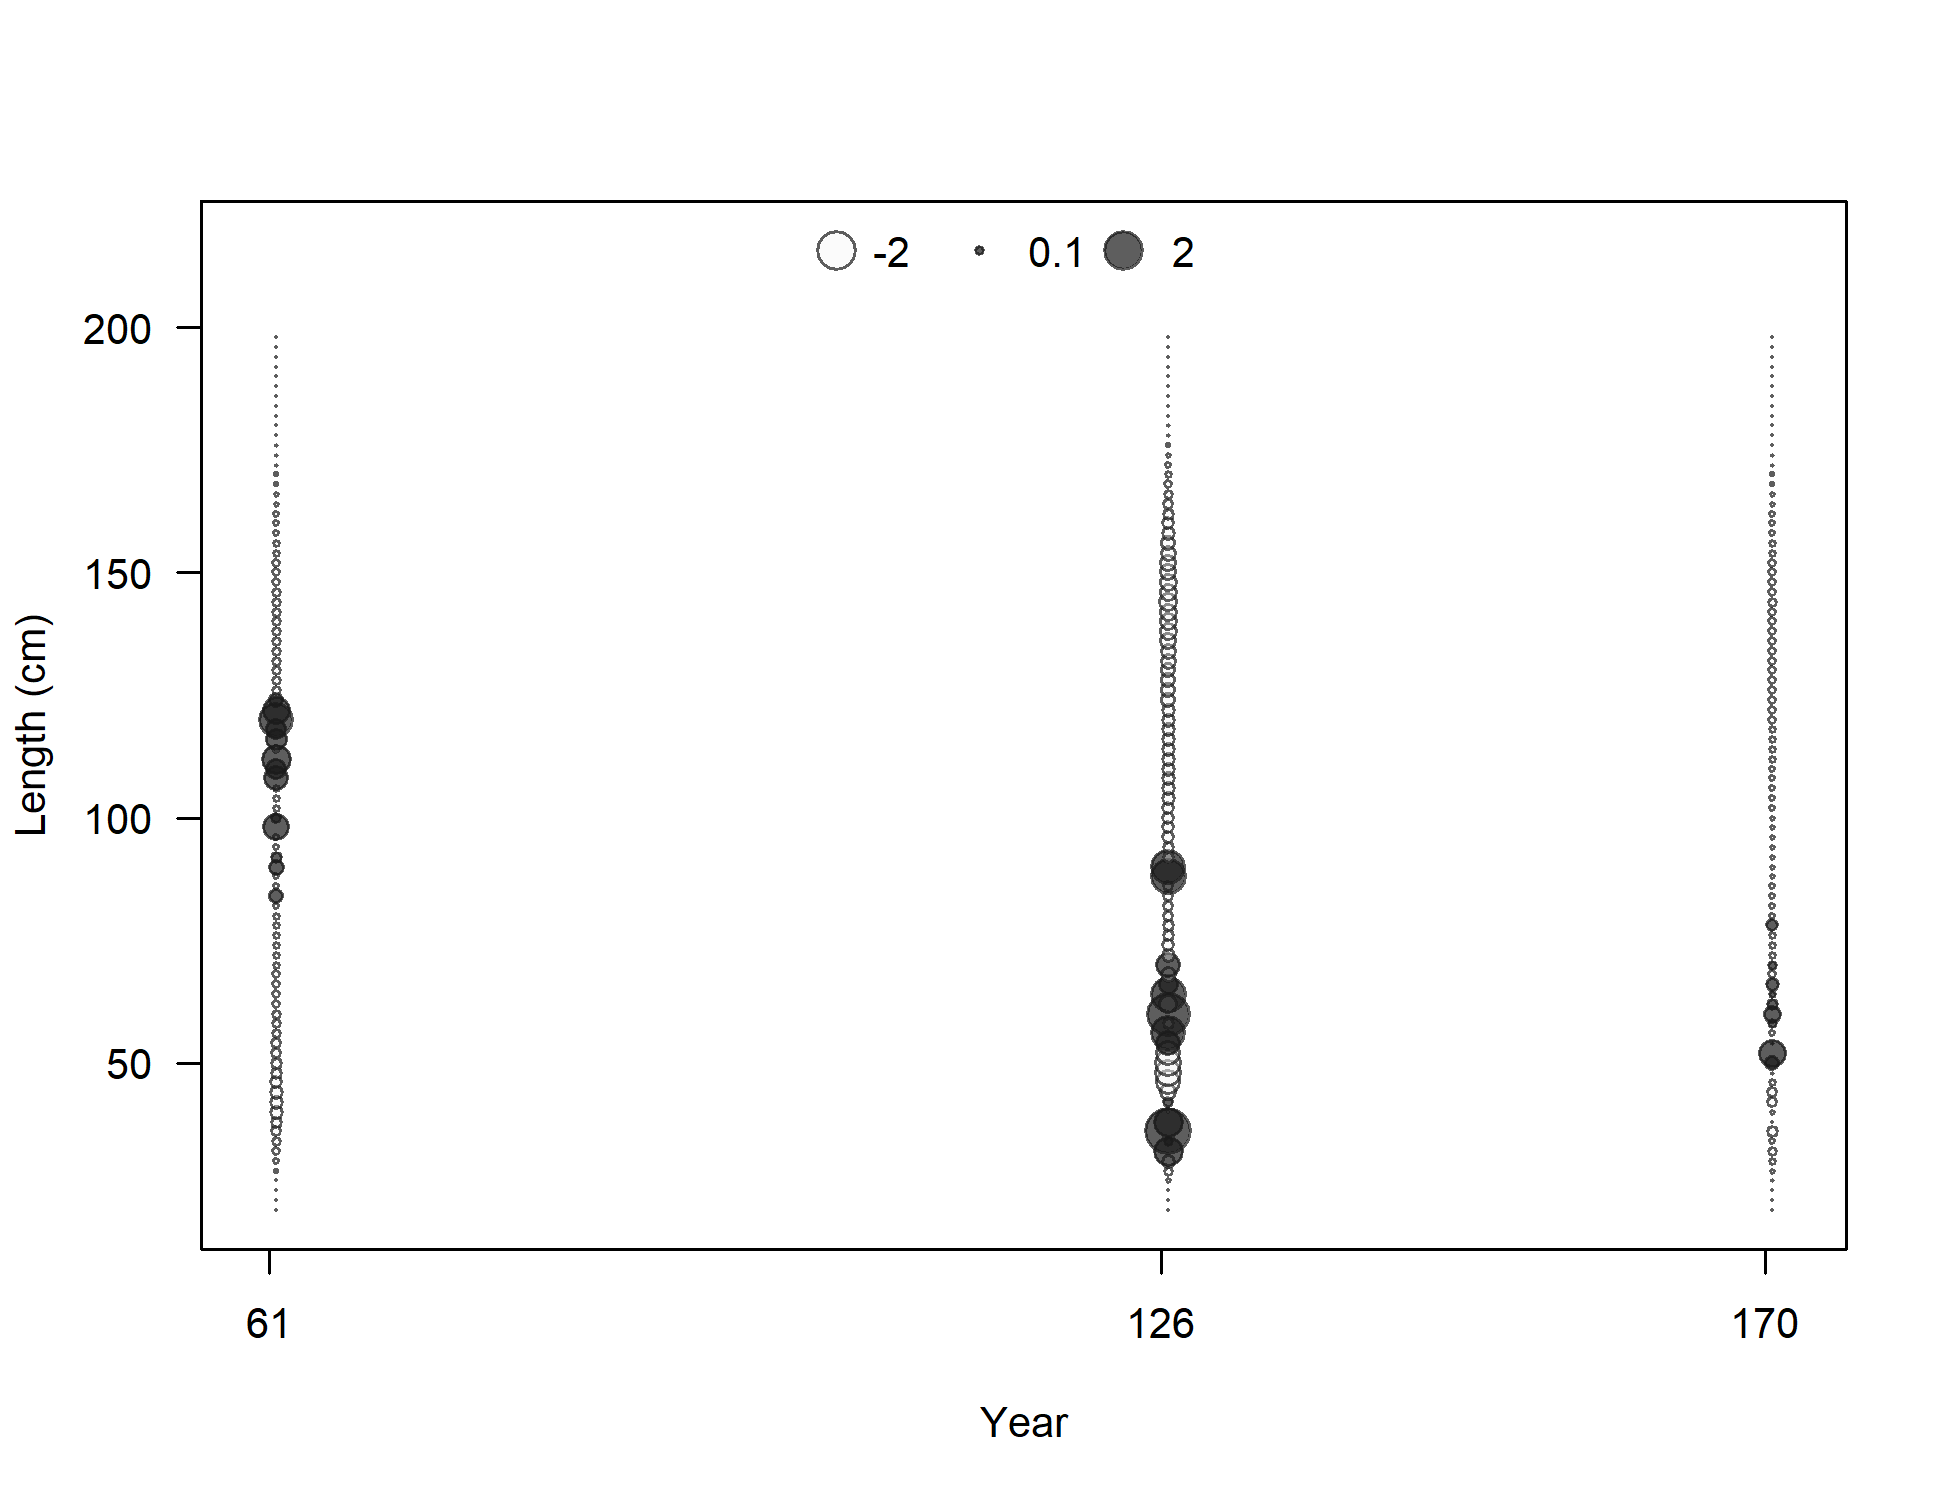
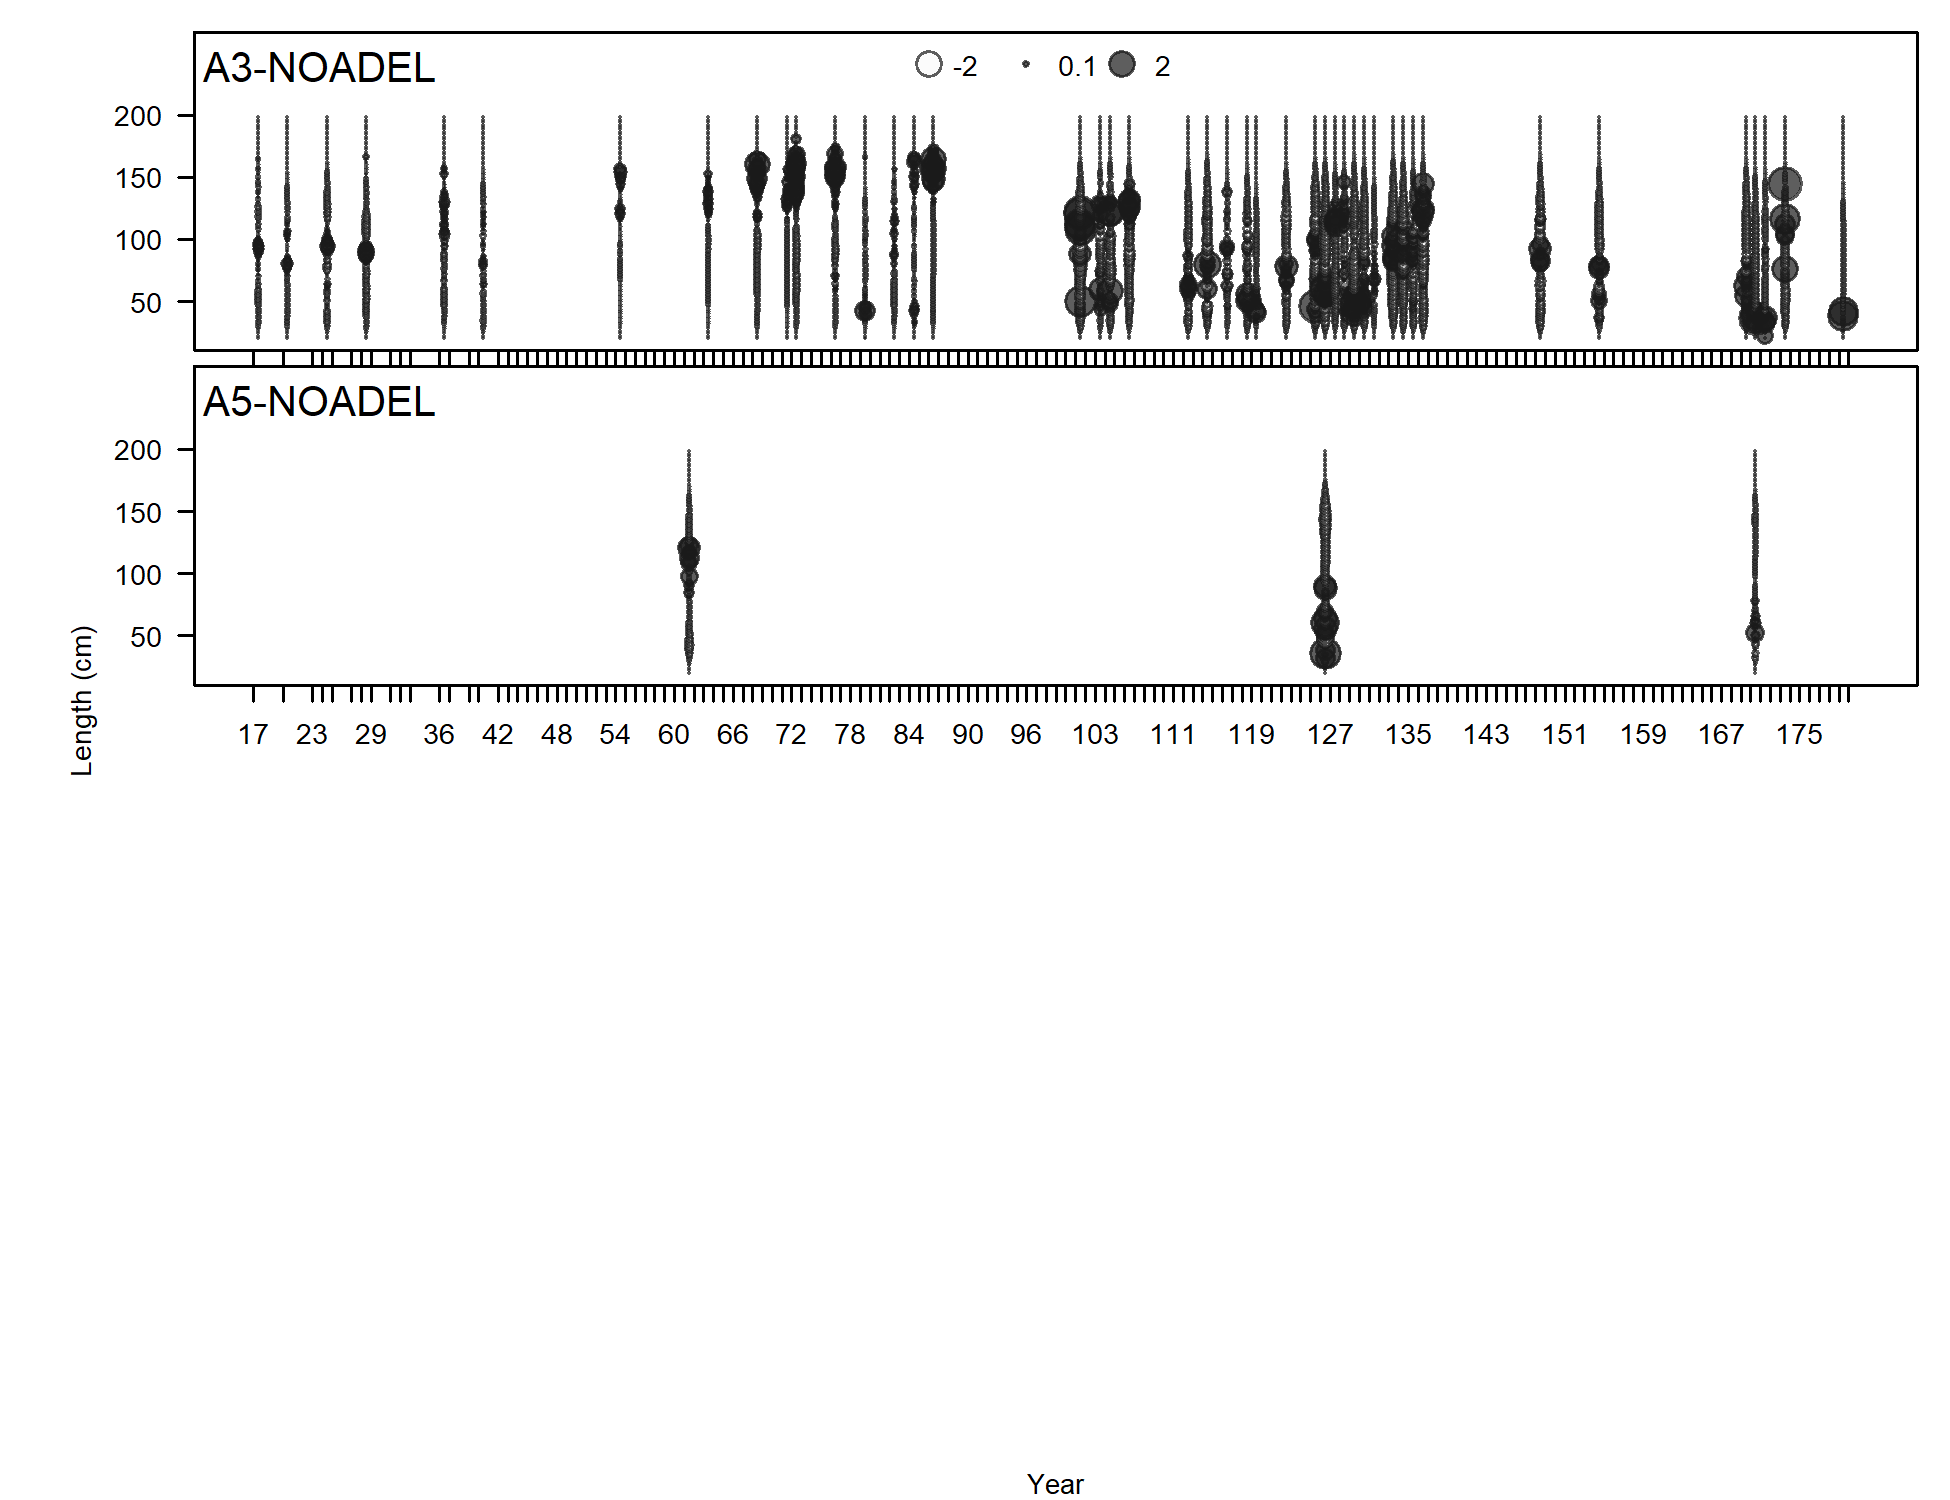
Pearson residuals, whole catch, A3-NOADEL (max=4.1) (plot 3 of 3)
Closed bubbles are positive residuals (observed > expected) and open bubbles are negative residuals (observed < expected).
file: comp_lenfit_residsflt20mkt0_page3.png
N-EffN comparison, Length comps, whole catch, A3-NOADEL
file: comp_lenfit_sampsize_flt20mkt0.png
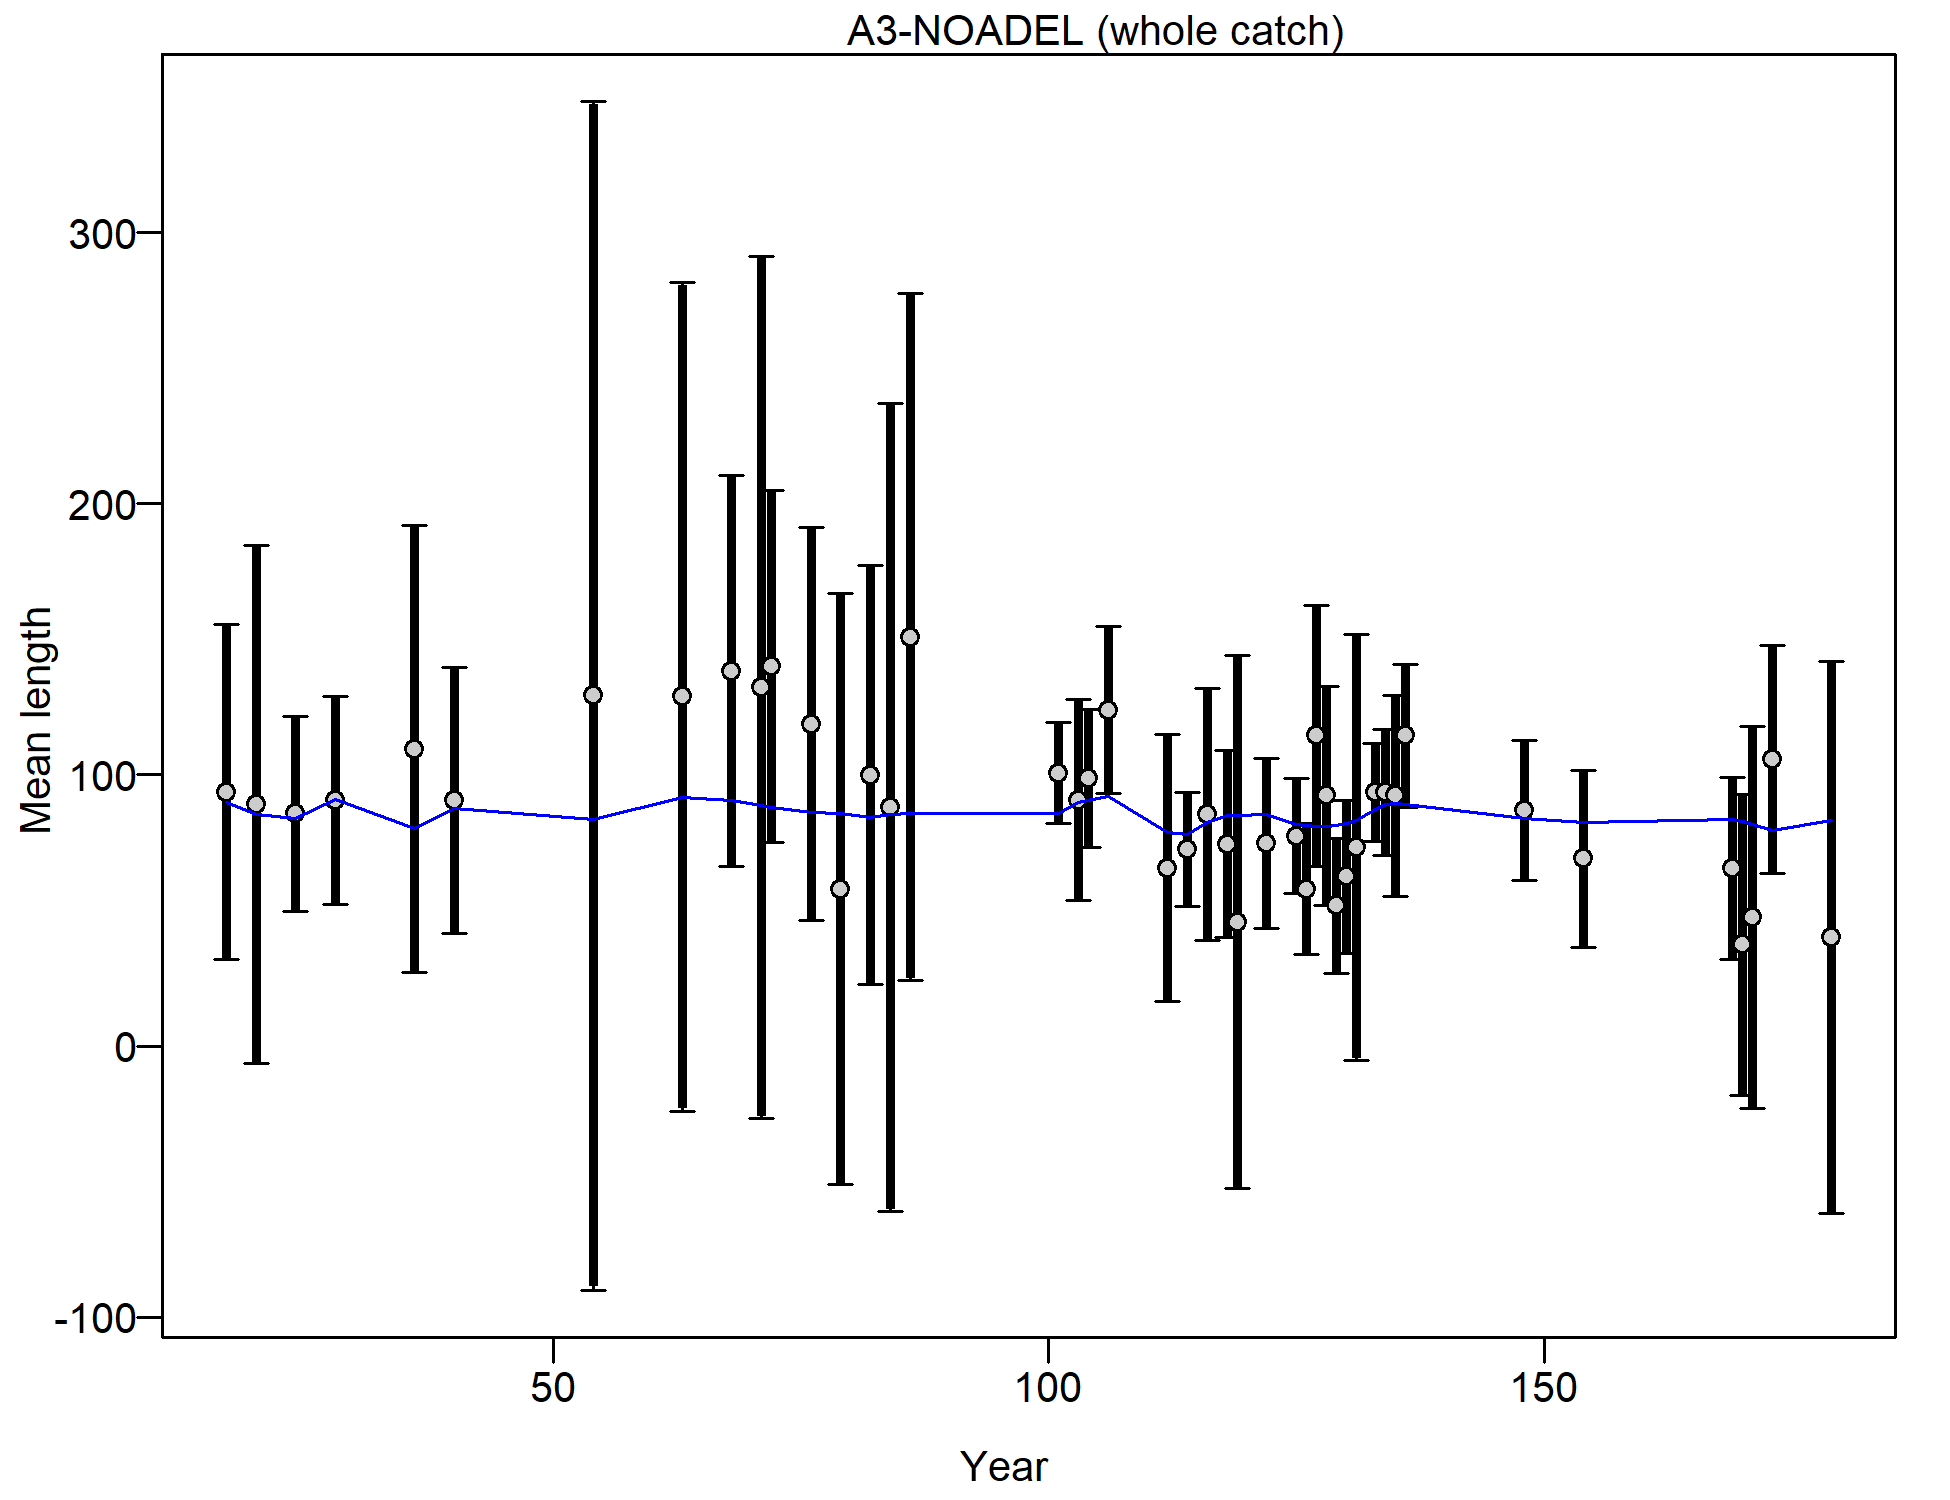
Mean length for A3-NOADEL with 95% confidence intervals based on current samples sizes.
Francis data weighting method TA1.8: thinner intervals (with capped ends) show result of further adjusting sample sizes based on suggested multiplier (with 95% interval) for len data from A3-NOADEL:
0.9891 (0.7094-1.5811)
For more info, see
Francis, R.I.C.C. (2011). Data weighting in statistical fisheries stock assessment models. Can. J. Fish. Aquat. Sci. 68: 1124-1138. https://doi.org/10.1139/f2011-025
Length comps, whole catch, A5-NOADEL.
'N adj.' is the input sample size after data-weighting adjustment. N eff. is the calculated effective sample size used in the McAllister-Iannelli tuning method.
file: comp_lenfit_flt22mkt0.png
Pearson residuals, whole catch, A5-NOADEL (max=2.82)
Closed bubbles are positive residuals (observed > expected) and open bubbles are negative residuals (observed < expected).
file: comp_lenfit_residsflt22mkt0.png
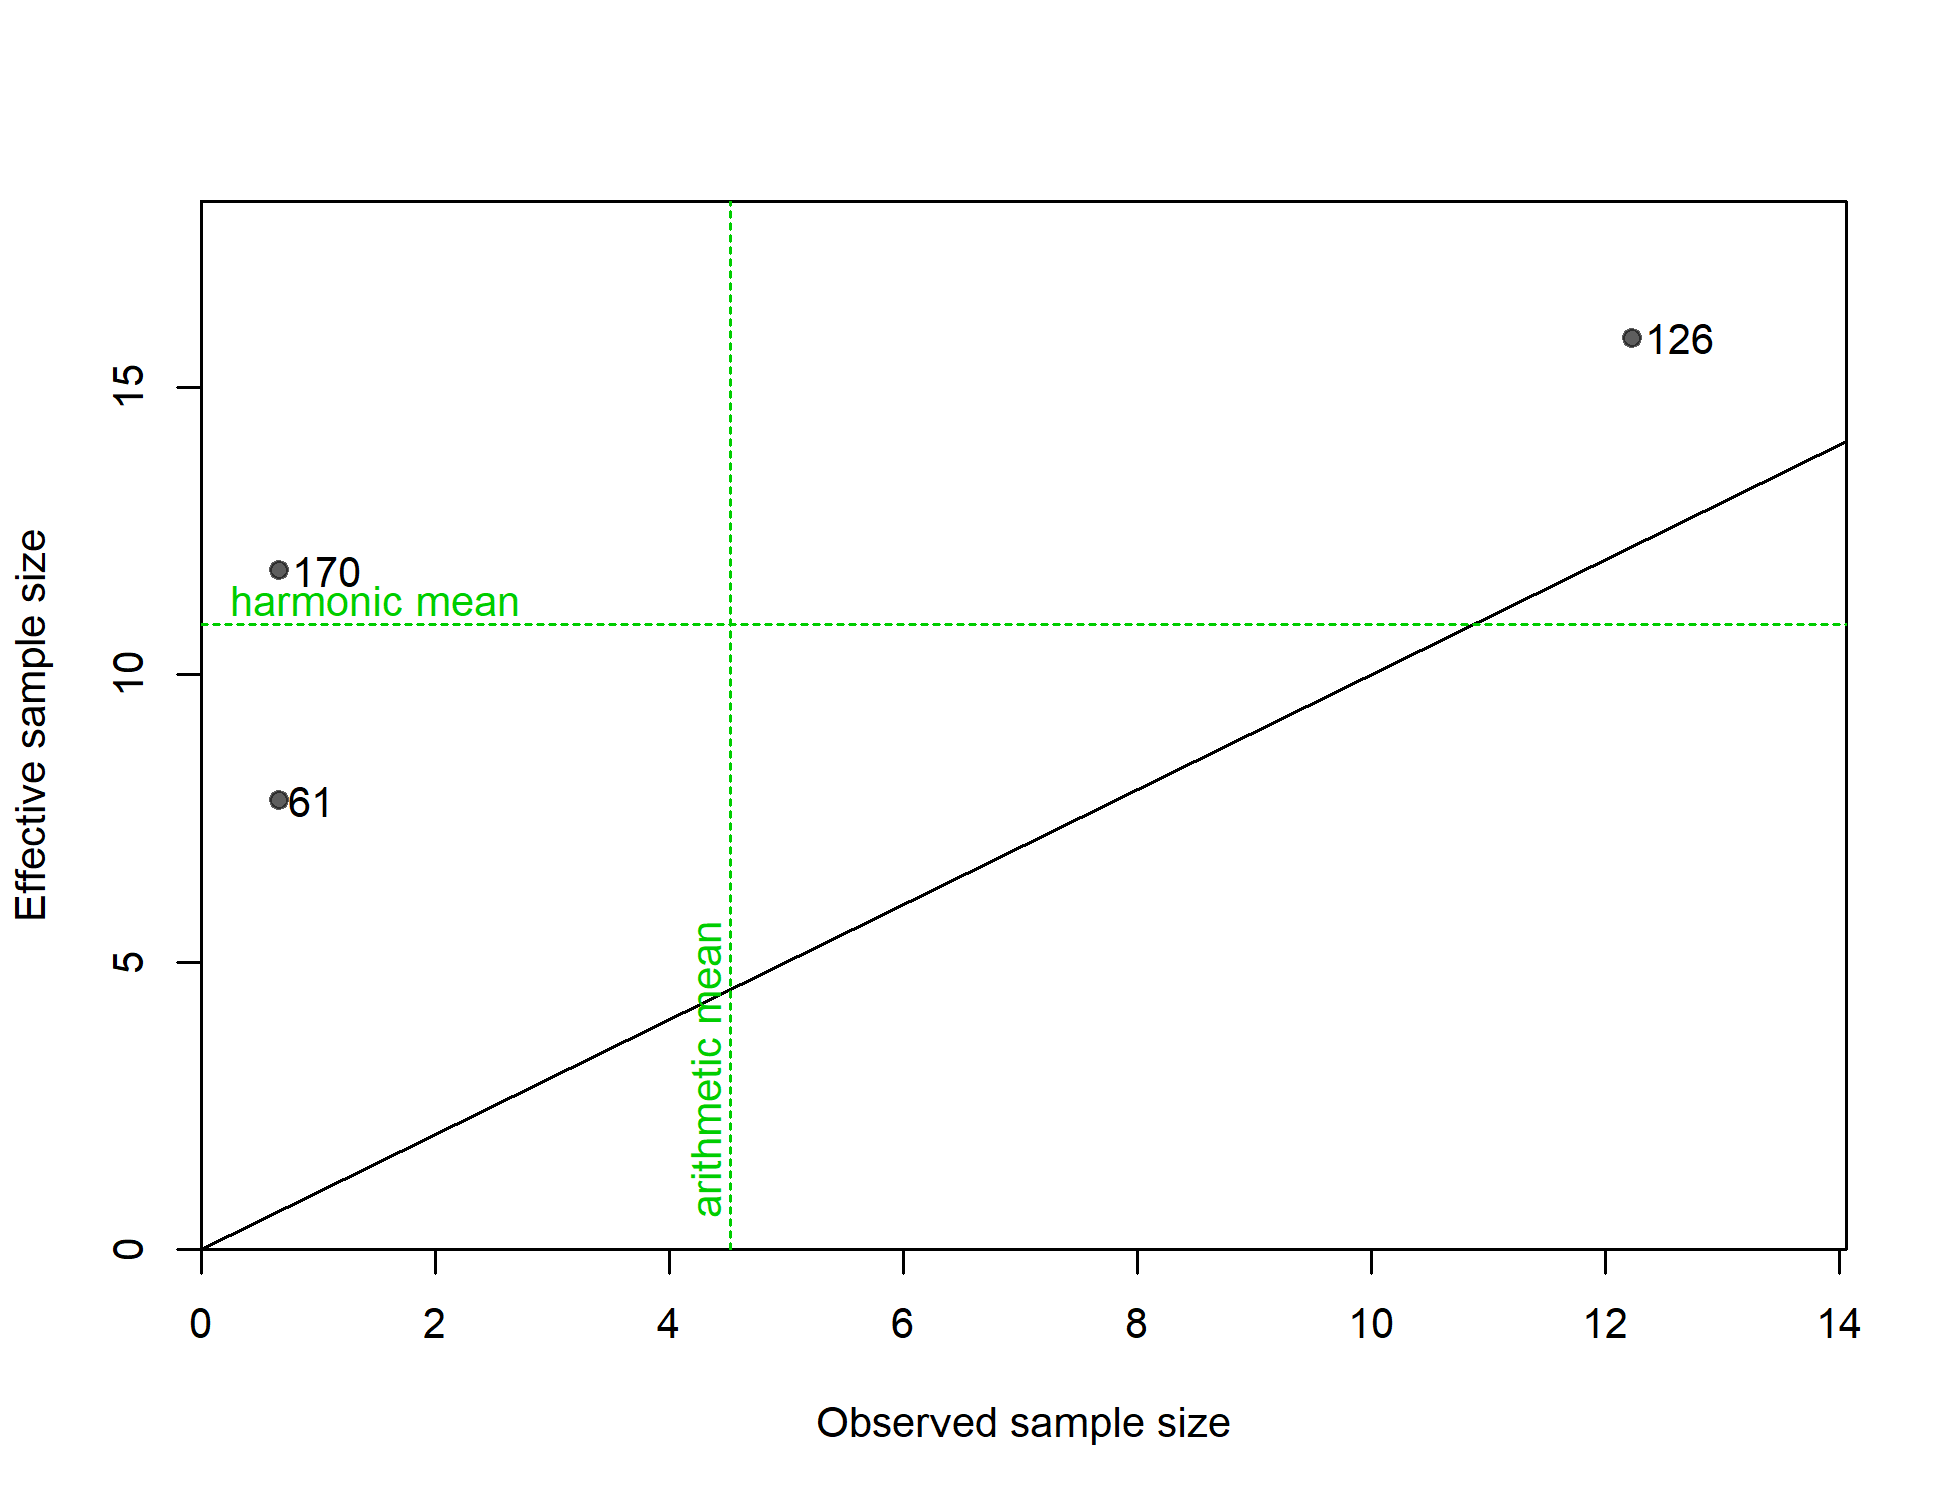
N-EffN comparison, Length comps, whole catch, A5-NOADEL
file: comp_lenfit_sampsize_flt22mkt0.png
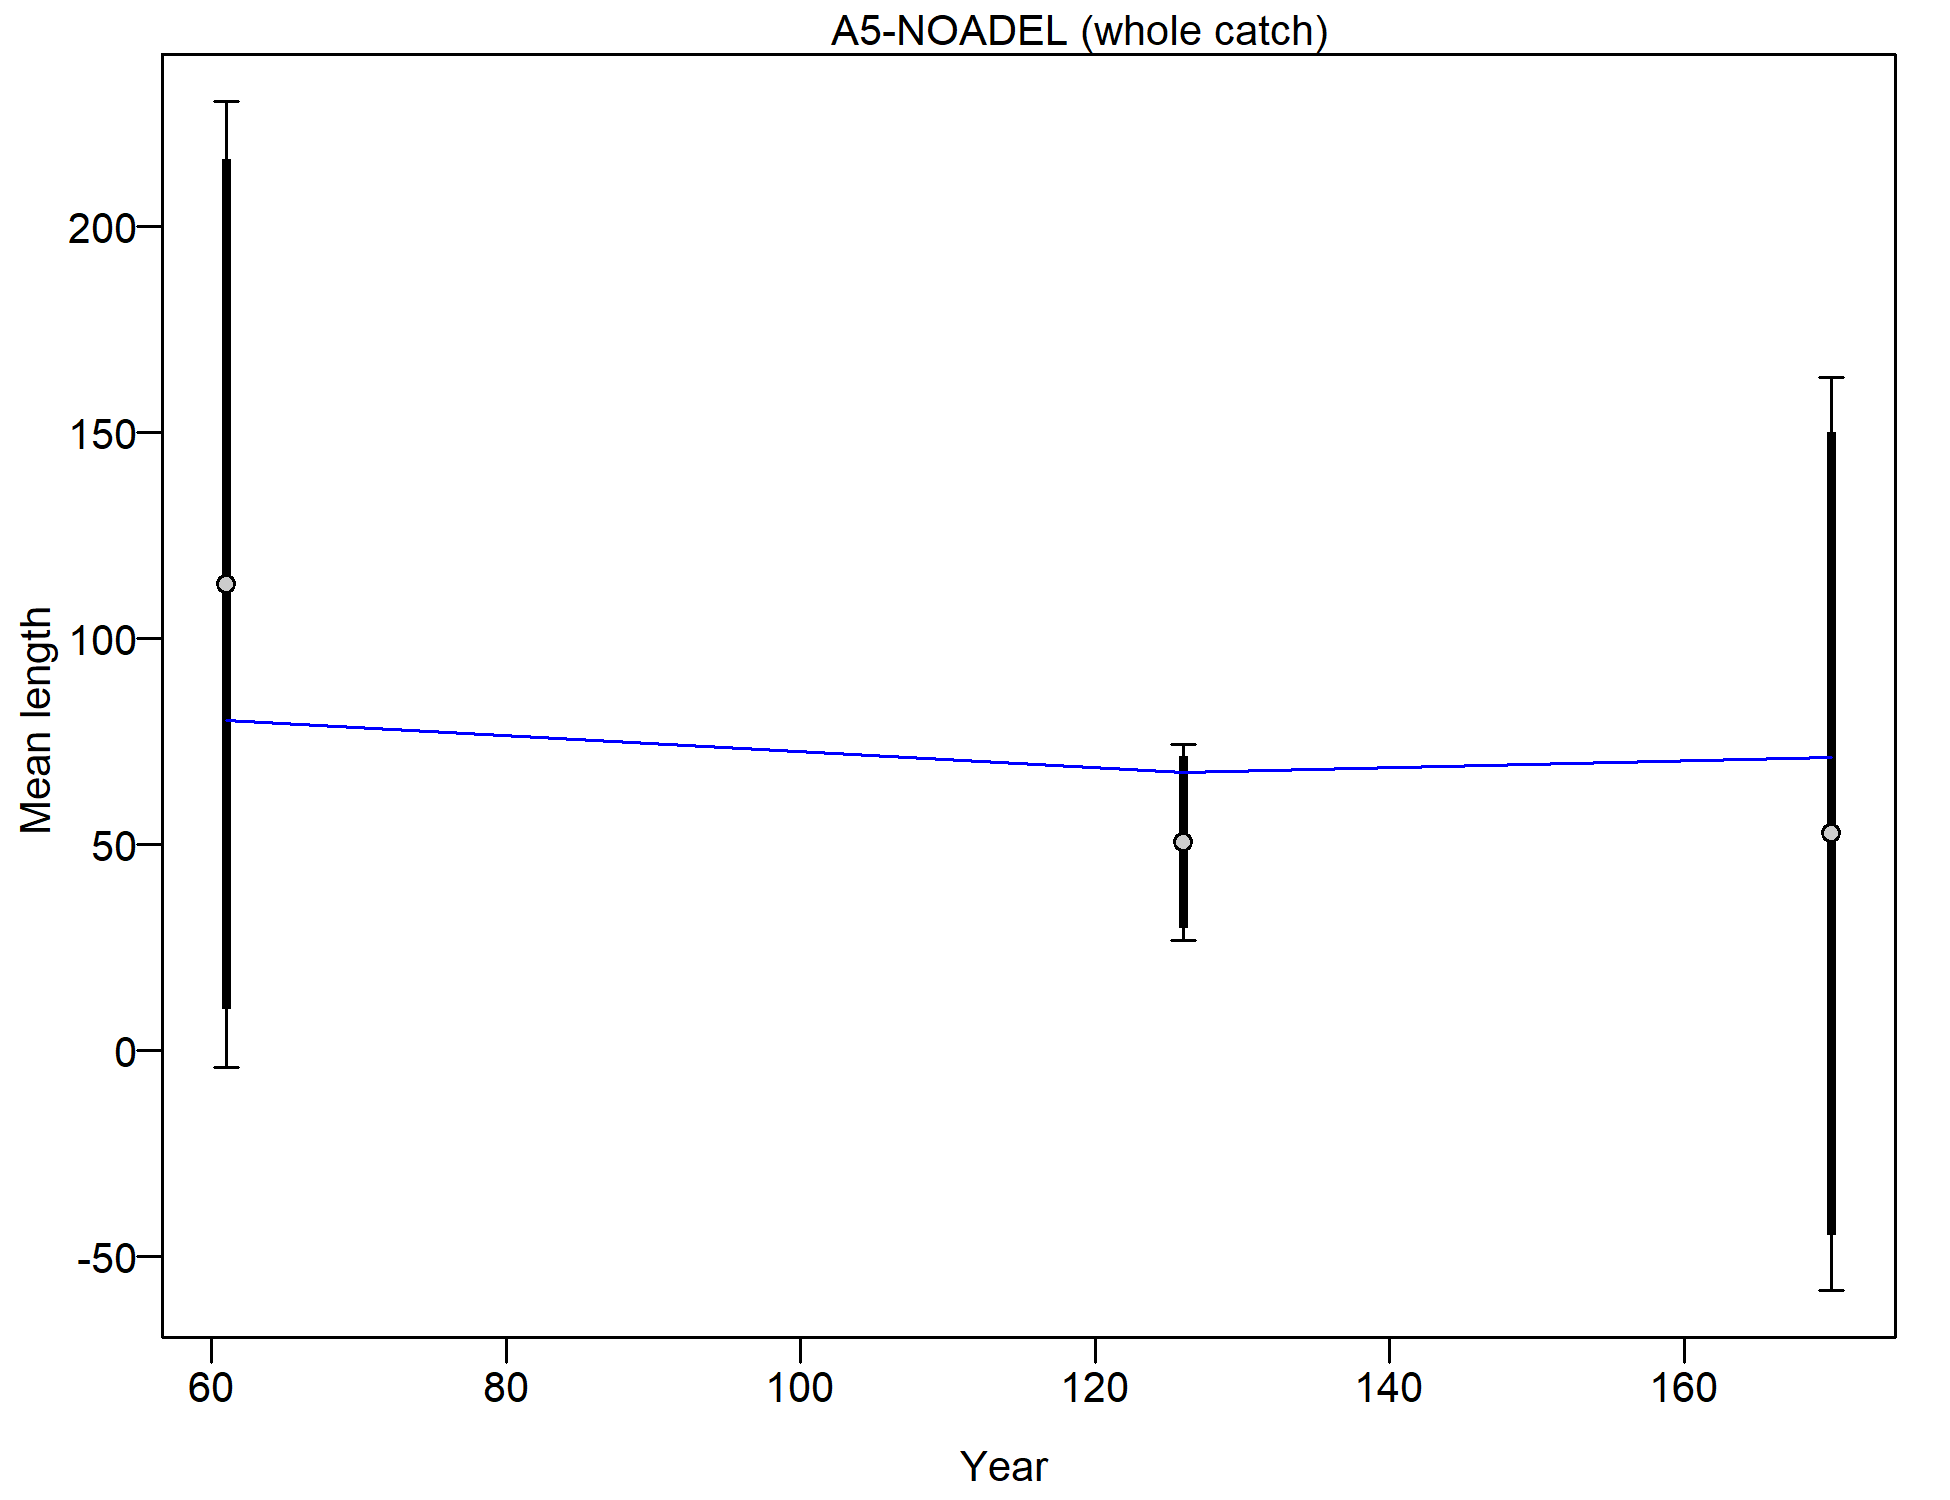
Mean length for A5-NOADEL with 95% confidence intervals based on current samples sizes.
Francis data weighting method TA1.8: thinner intervals (with capped ends) show result of further adjusting sample sizes based on suggested multiplier (with 95% interval) for len data from A5-NOADEL:
0.7735 (0.582-Inf)
For more info, see
Francis, R.I.C.C. (2011). Data weighting in statistical fisheries stock assessment models. Can. J. Fish. Aquat. Sci. 68: 1124-1138. https://doi.org/10.1139/f2011-025
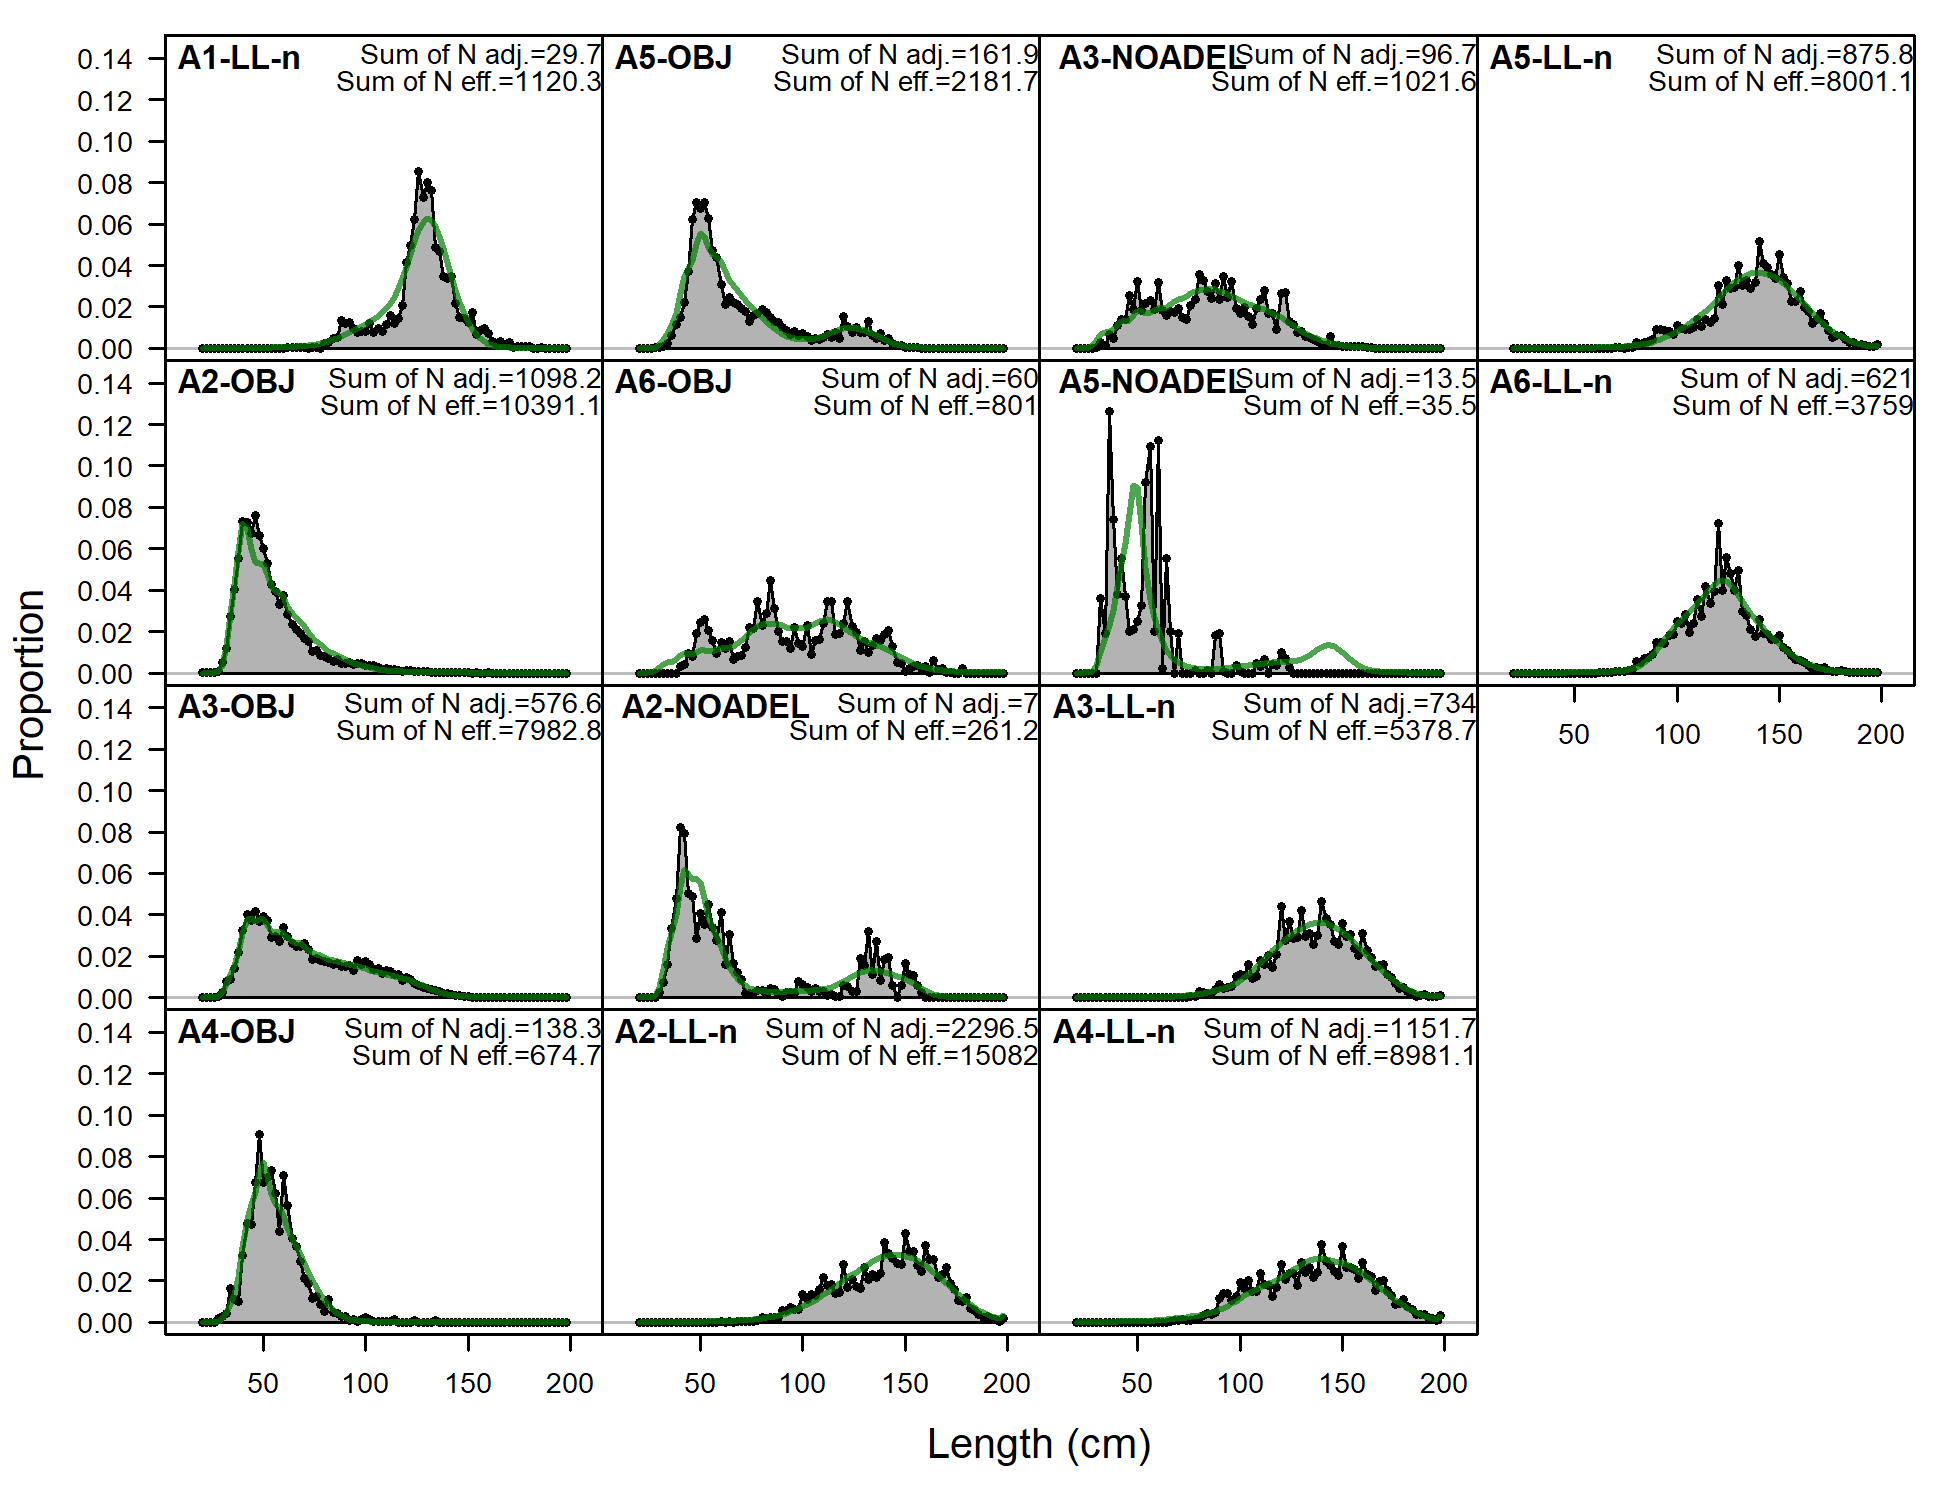
Length comps, aggregated across time by fleet.
Labels 'retained' and 'discard' indicate discarded or retained sampled for each fleet. Panels without this designation represent the whole catch.
file: comp_lenfit__aggregated_across_time.png
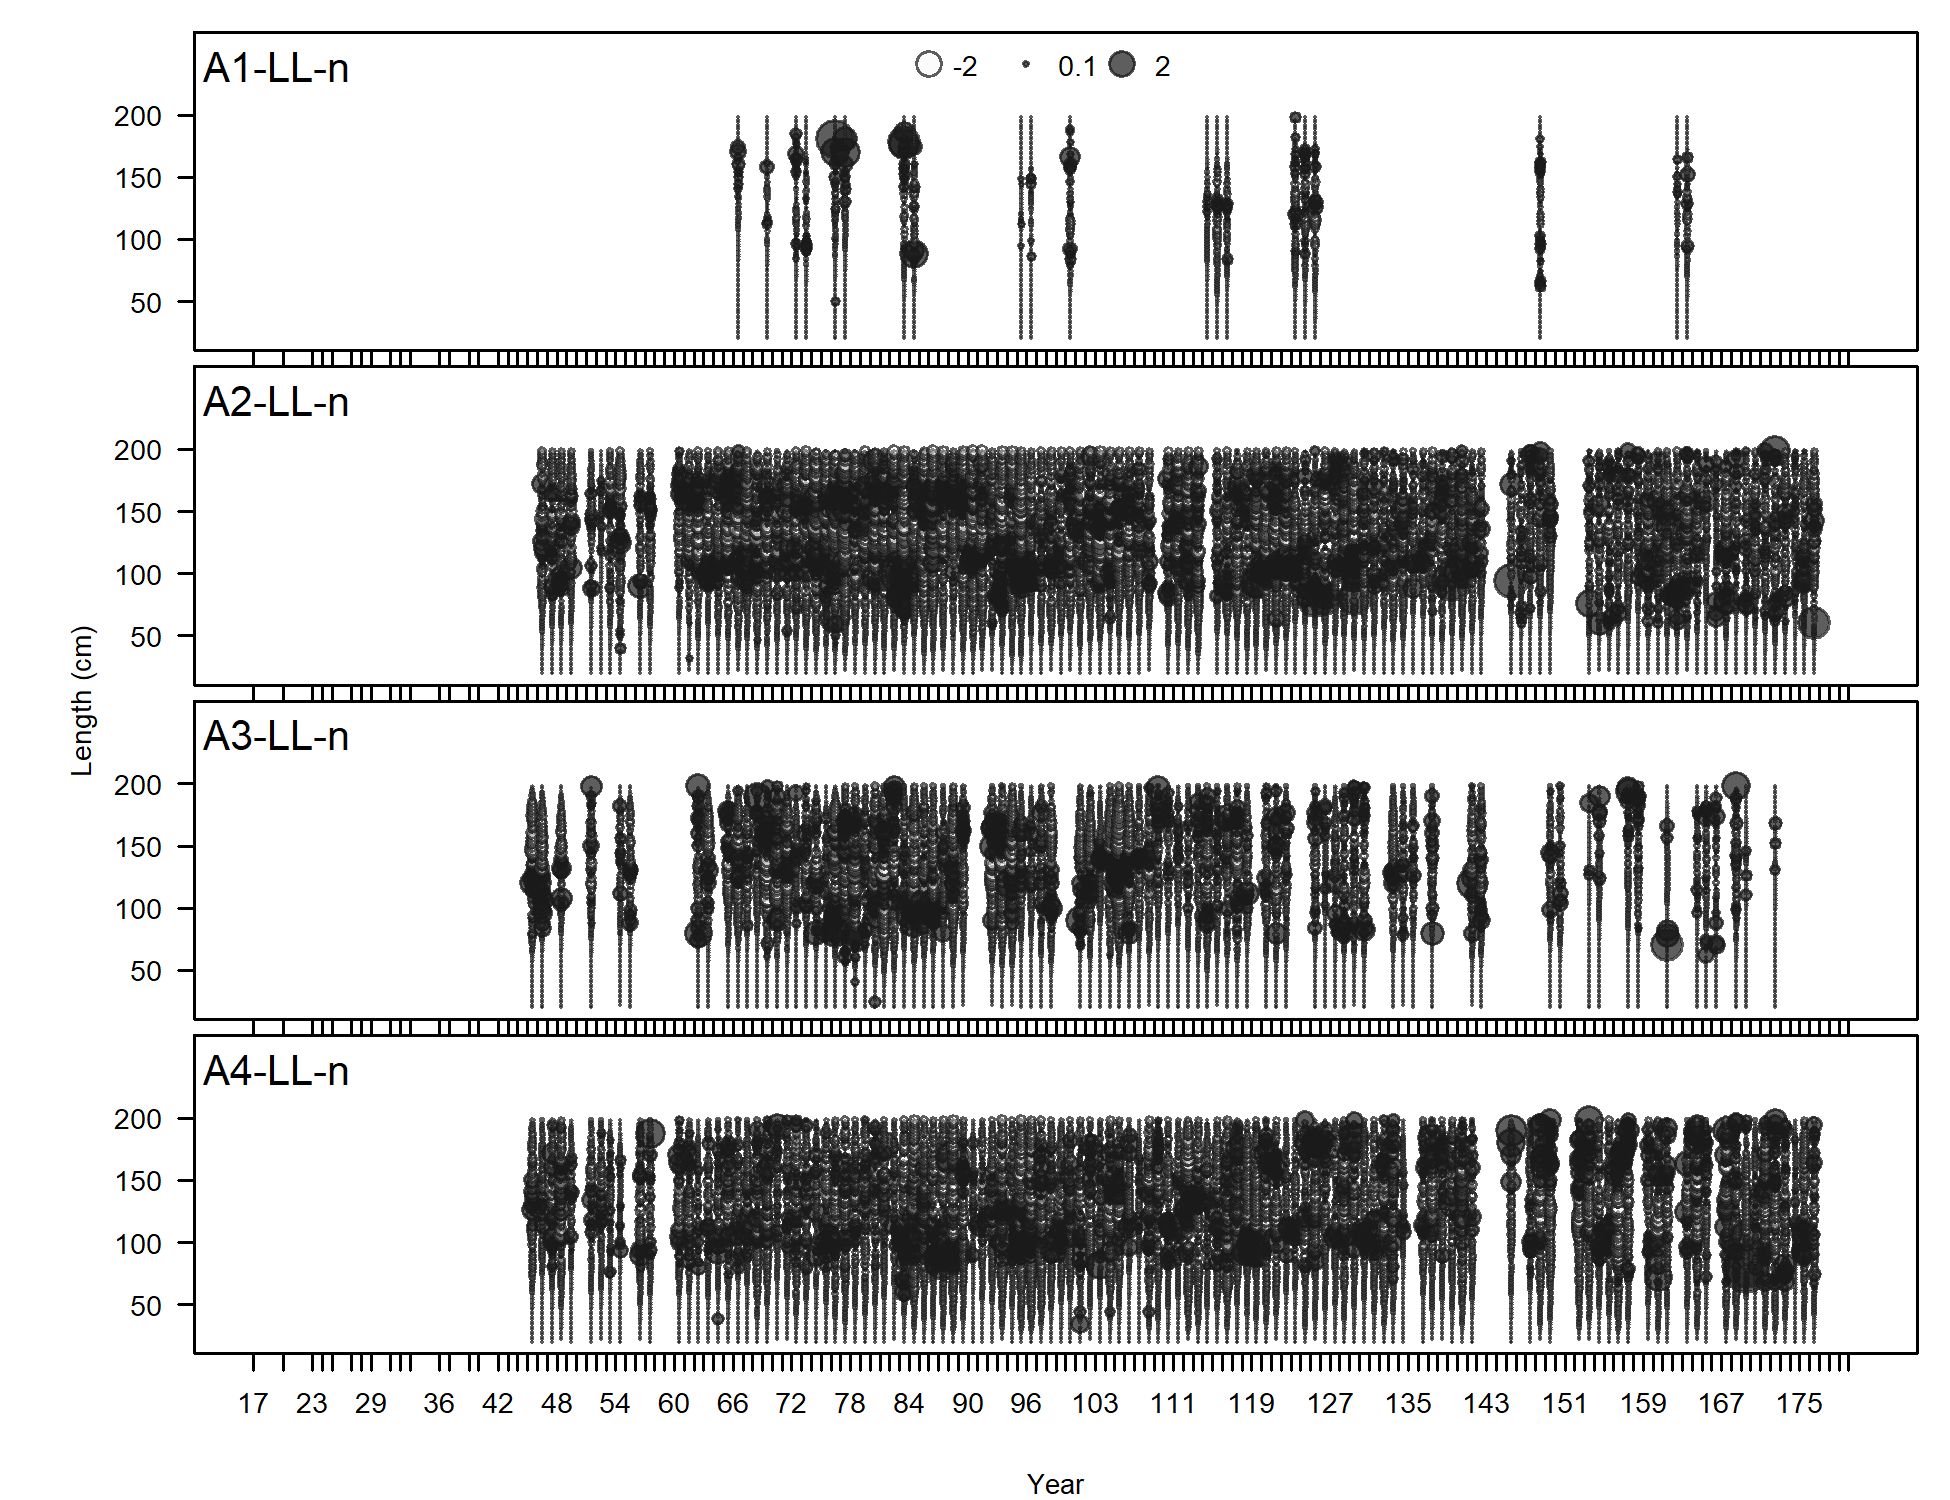
Pearson residuals, comparing across fleets (plot 1 of 4)
Closed bubbles are positive residuals (observed > expected) and open bubbles are negative residuals (observed < expected).
file: comp_lenfit__page1_multi-fleet_comparison.png
Pearson residuals, comparing across fleets (plot 2 of 4)
file: comp_lenfit__page2_multi-fleet_comparison.png
Pearson residuals, comparing across fleets (plot 3 of 4)
file: comp_lenfit__page3_multi-fleet_comparison.png
Pearson residuals, comparing across fleets (plot 4 of 4)
file: comp_lenfit__page4_multi-fleet_comparison.png
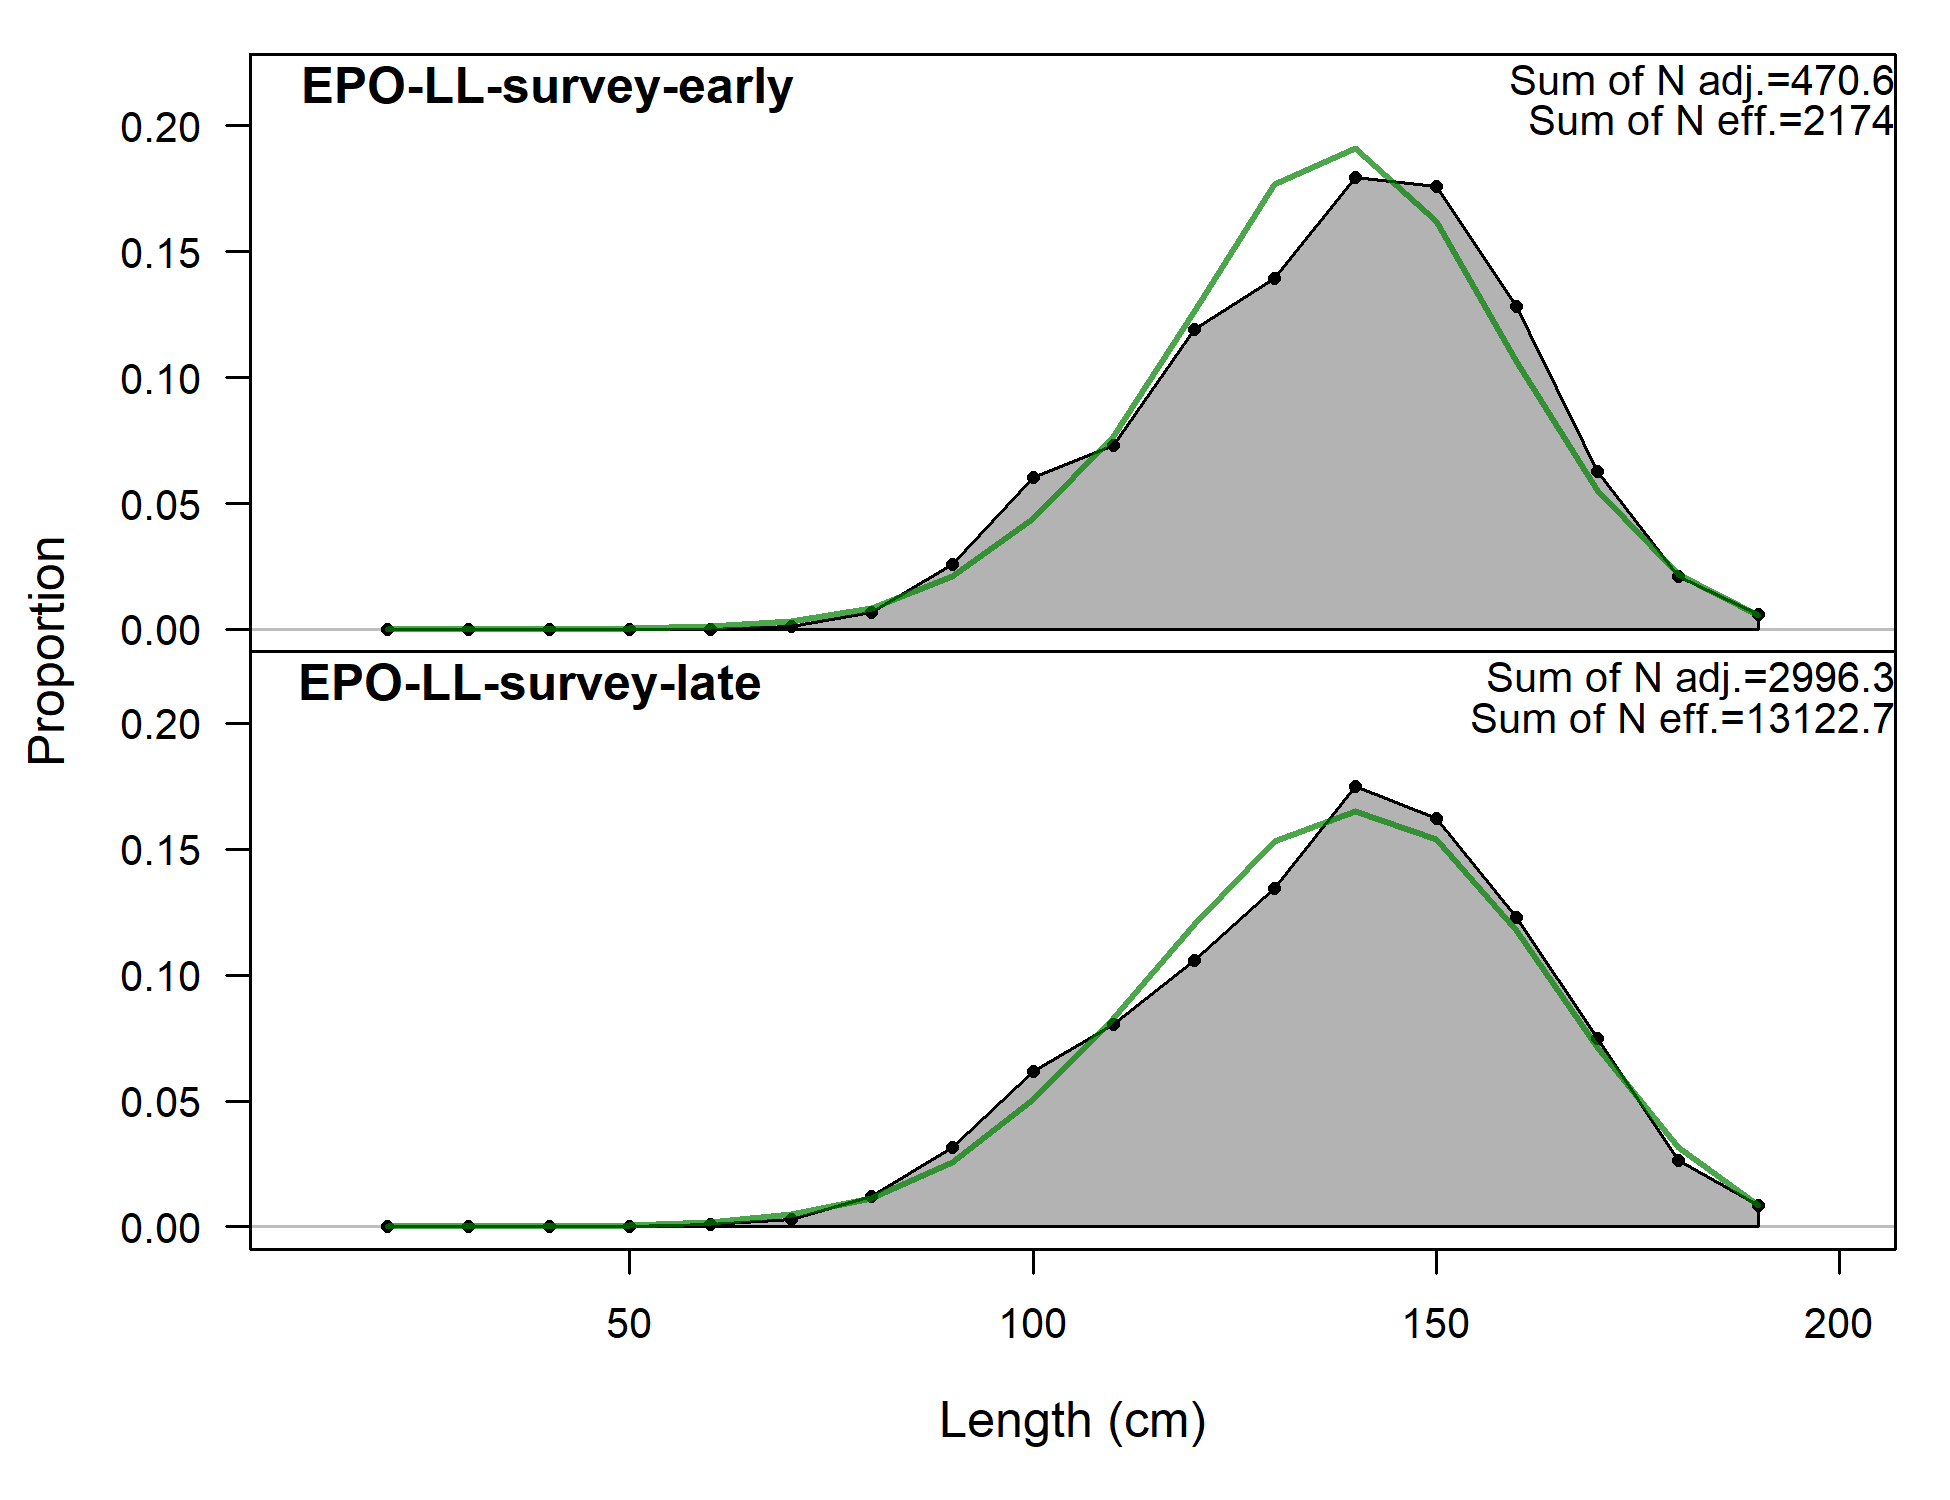
Size comps, whole catch, EPO-LL-survey-early (plot 1 of 2).
'N adj.' is the input sample size after data-weighting adjustment. N eff. is the calculated effective sample size used in the McAllister-Iannelli tuning method.
file: comp_sizefit_flt24mkt0_page1.png
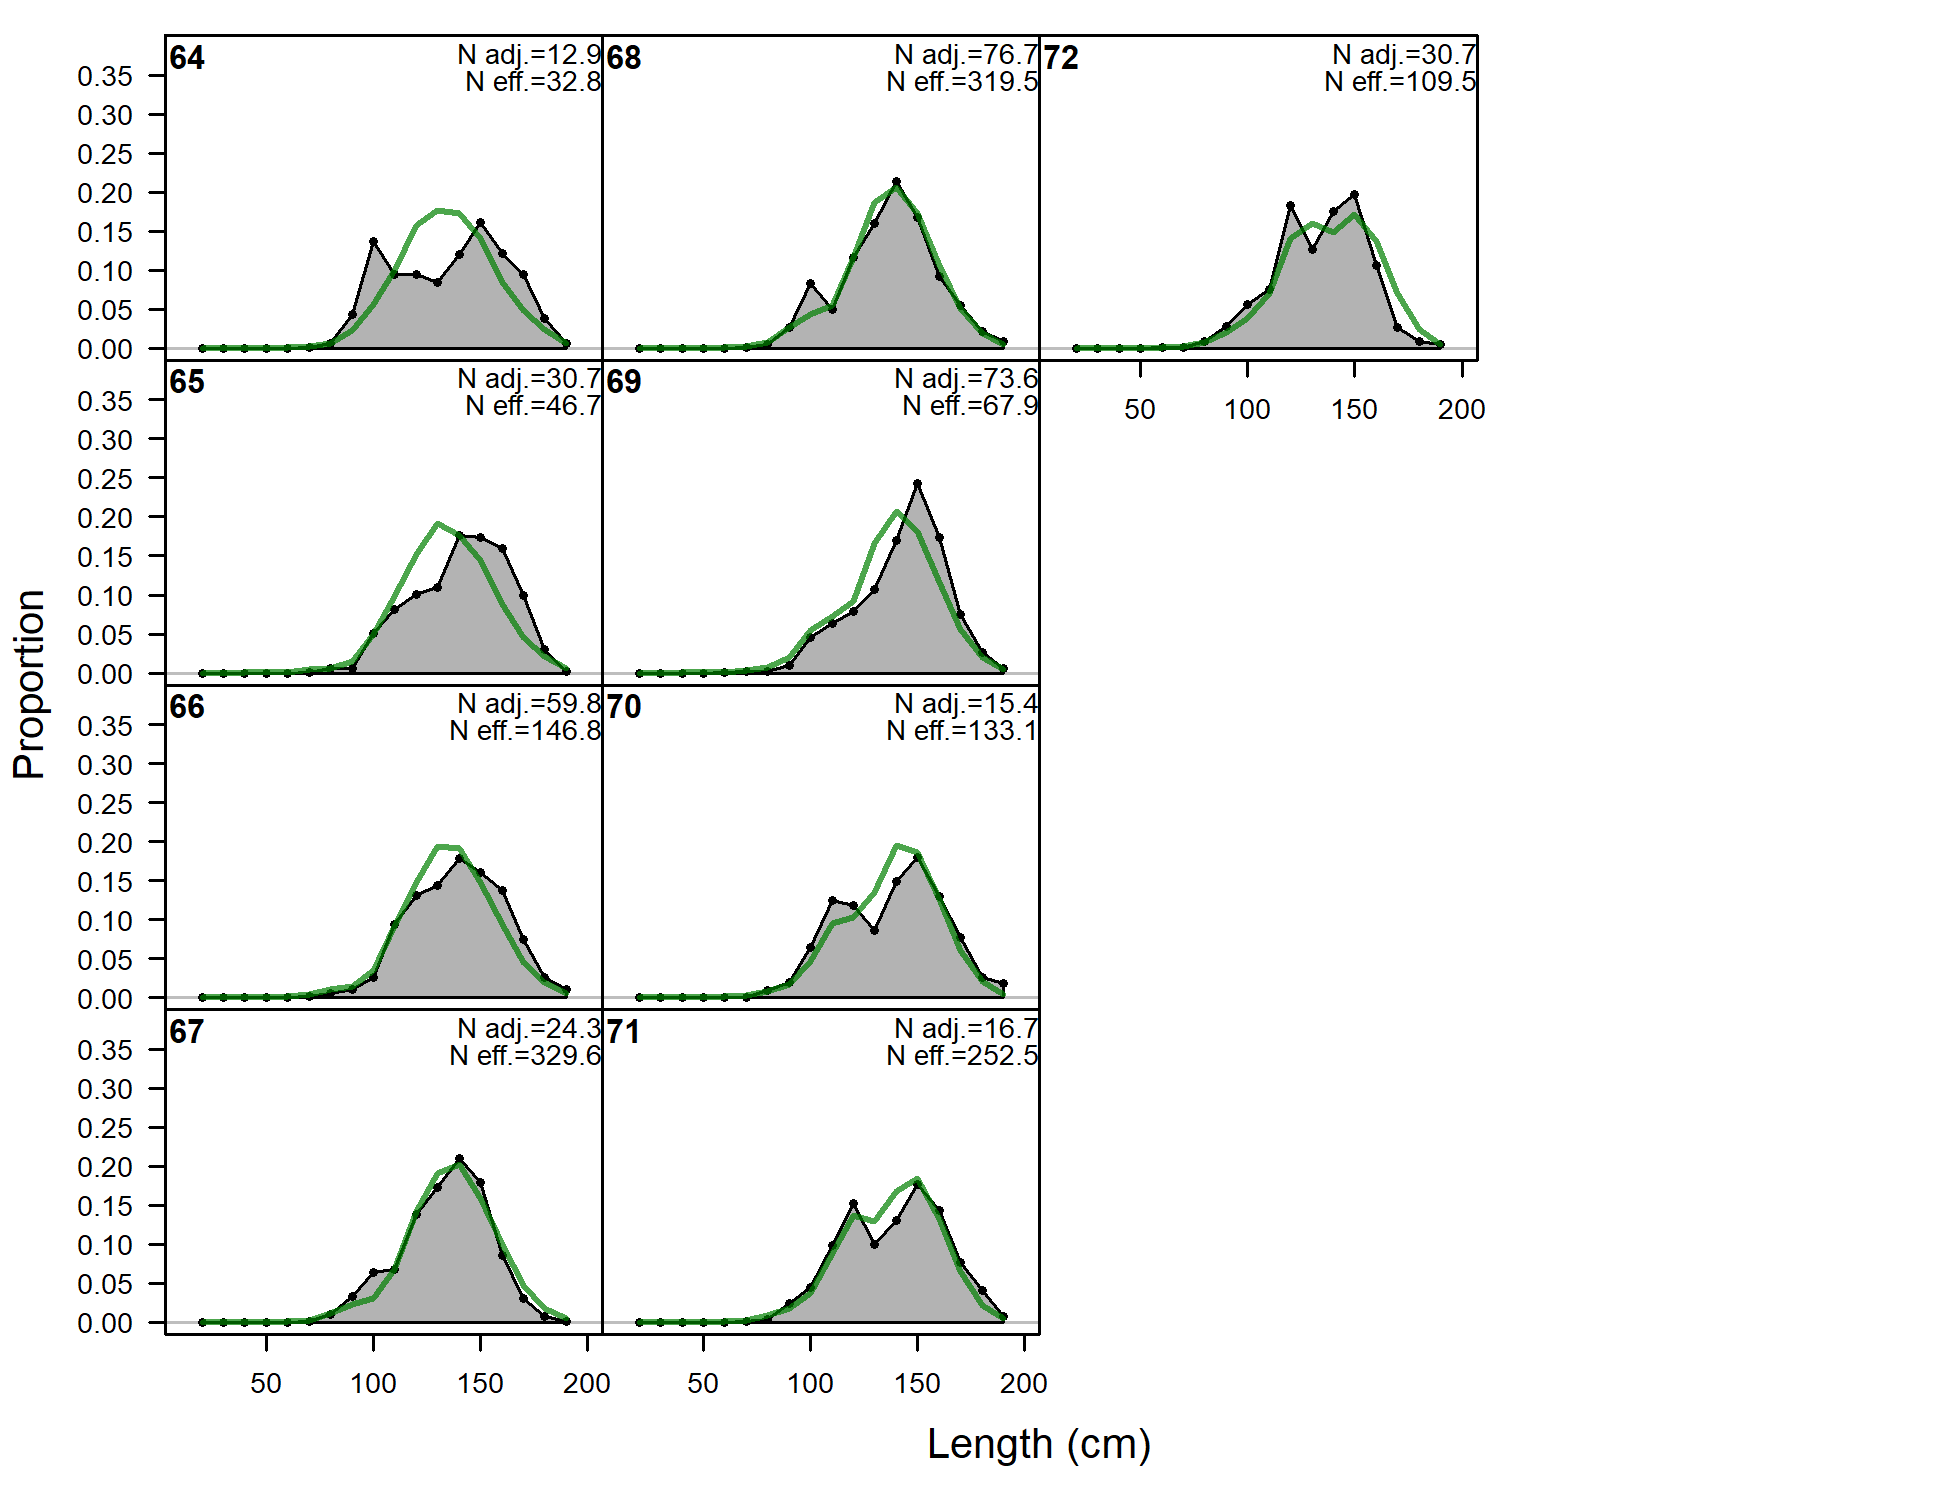
Size comps, whole catch, EPO-LL-survey-early (plot 2 of 2)
file: comp_sizefit_flt24mkt0_page2.png
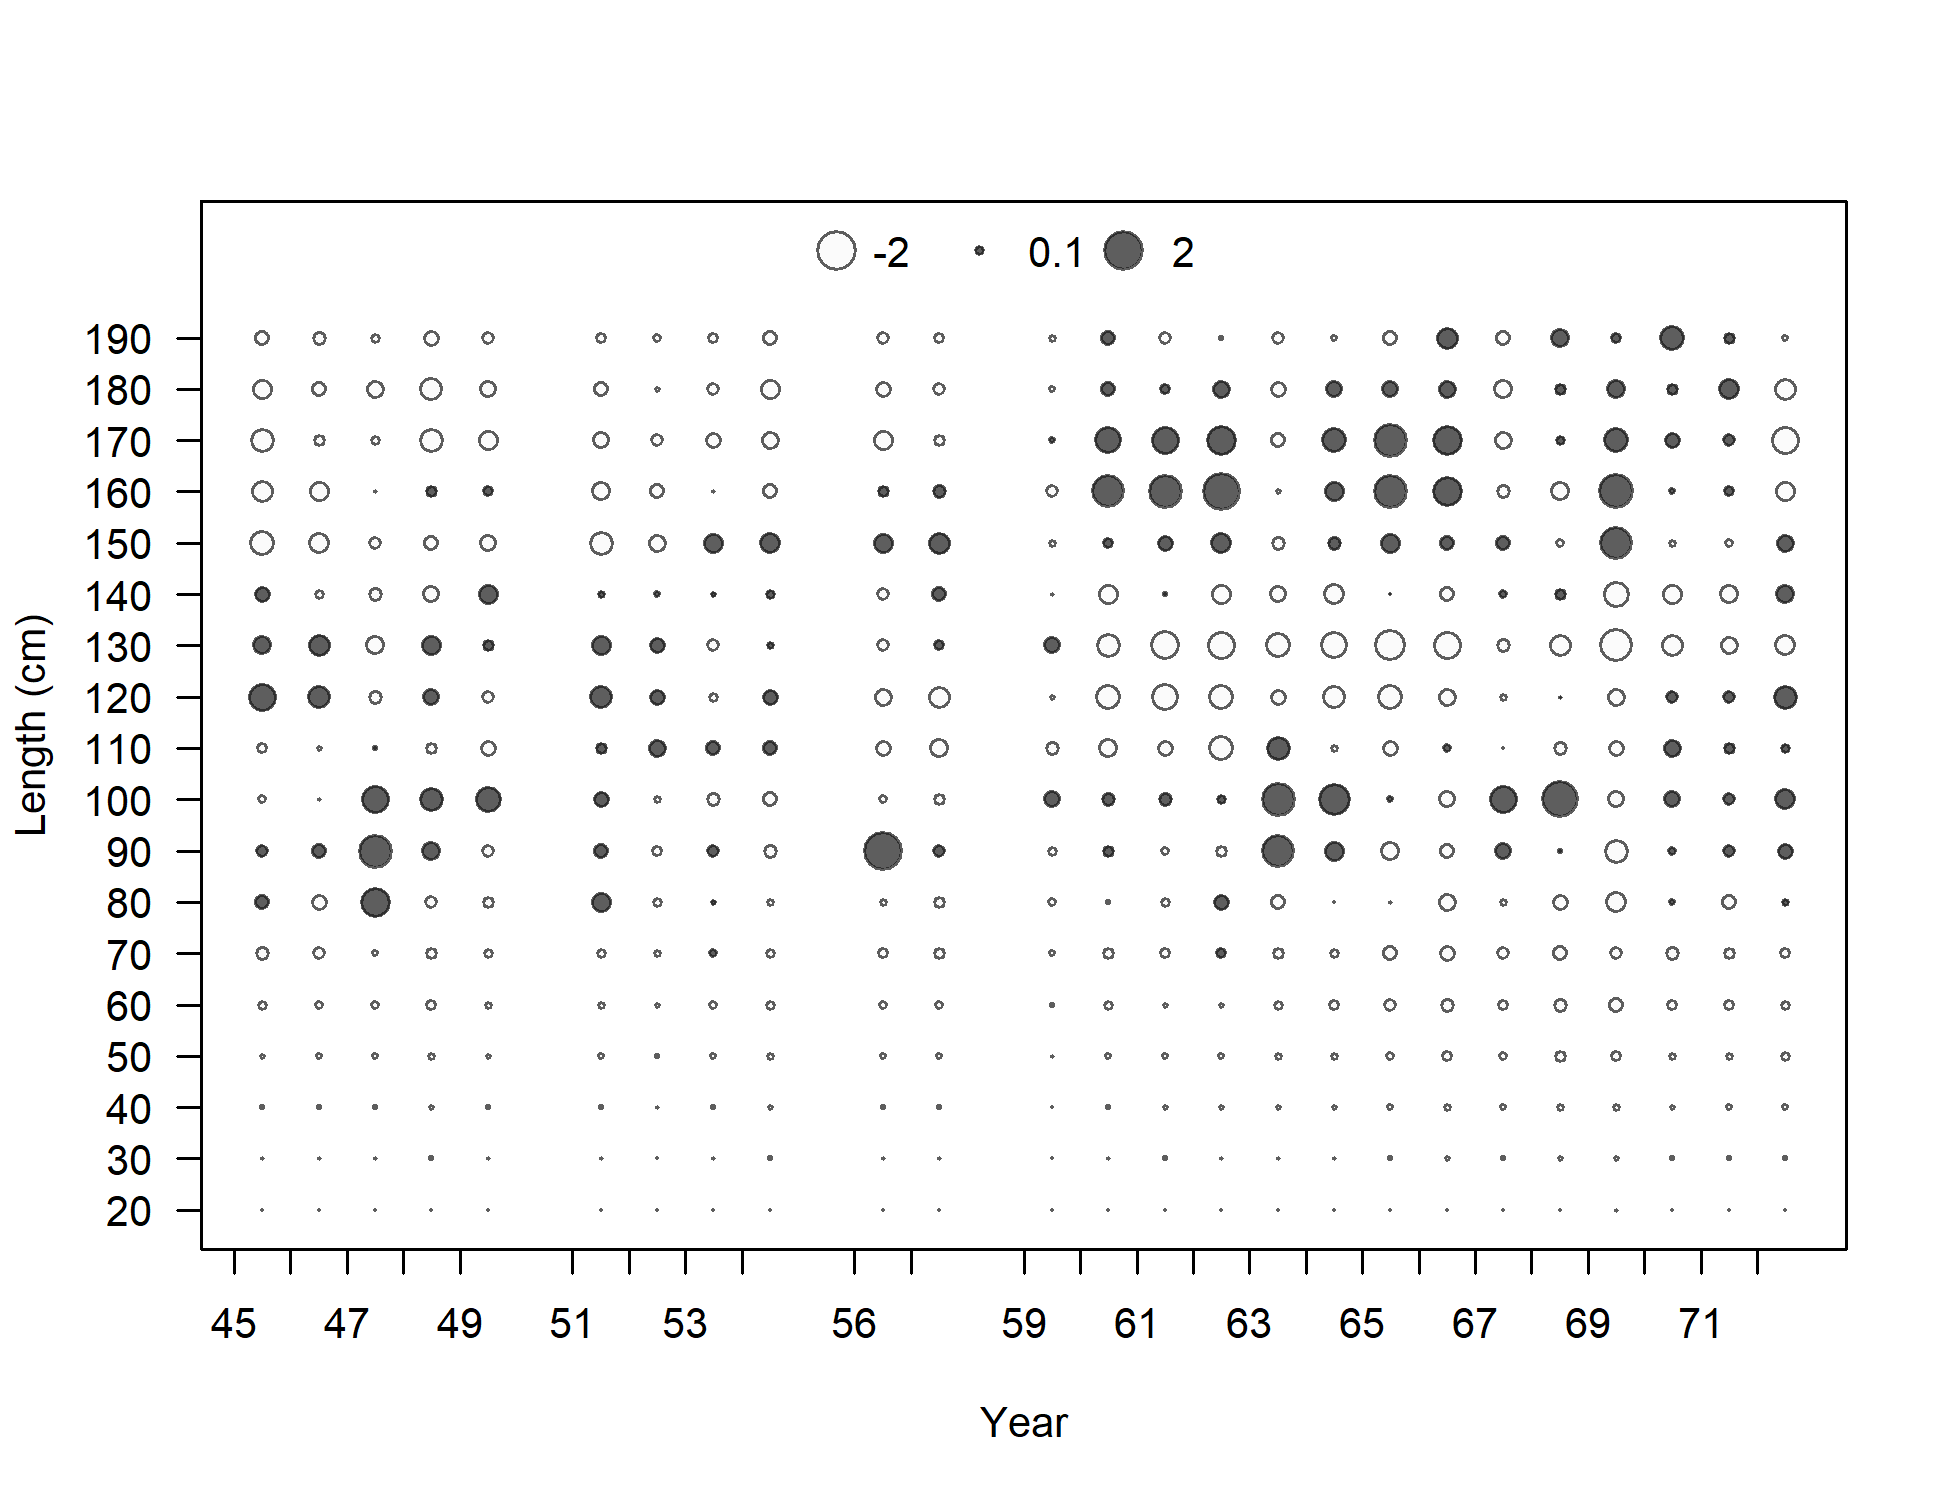
Pearson residuals, whole catch, EPO-LL-survey-early (max=1.87) (plot 2 of 2)
Closed bubbles are positive residuals (observed > expected) and open bubbles are negative residuals (observed < expected).
file: comp_sizefit_residsflt24mkt0_page2.png
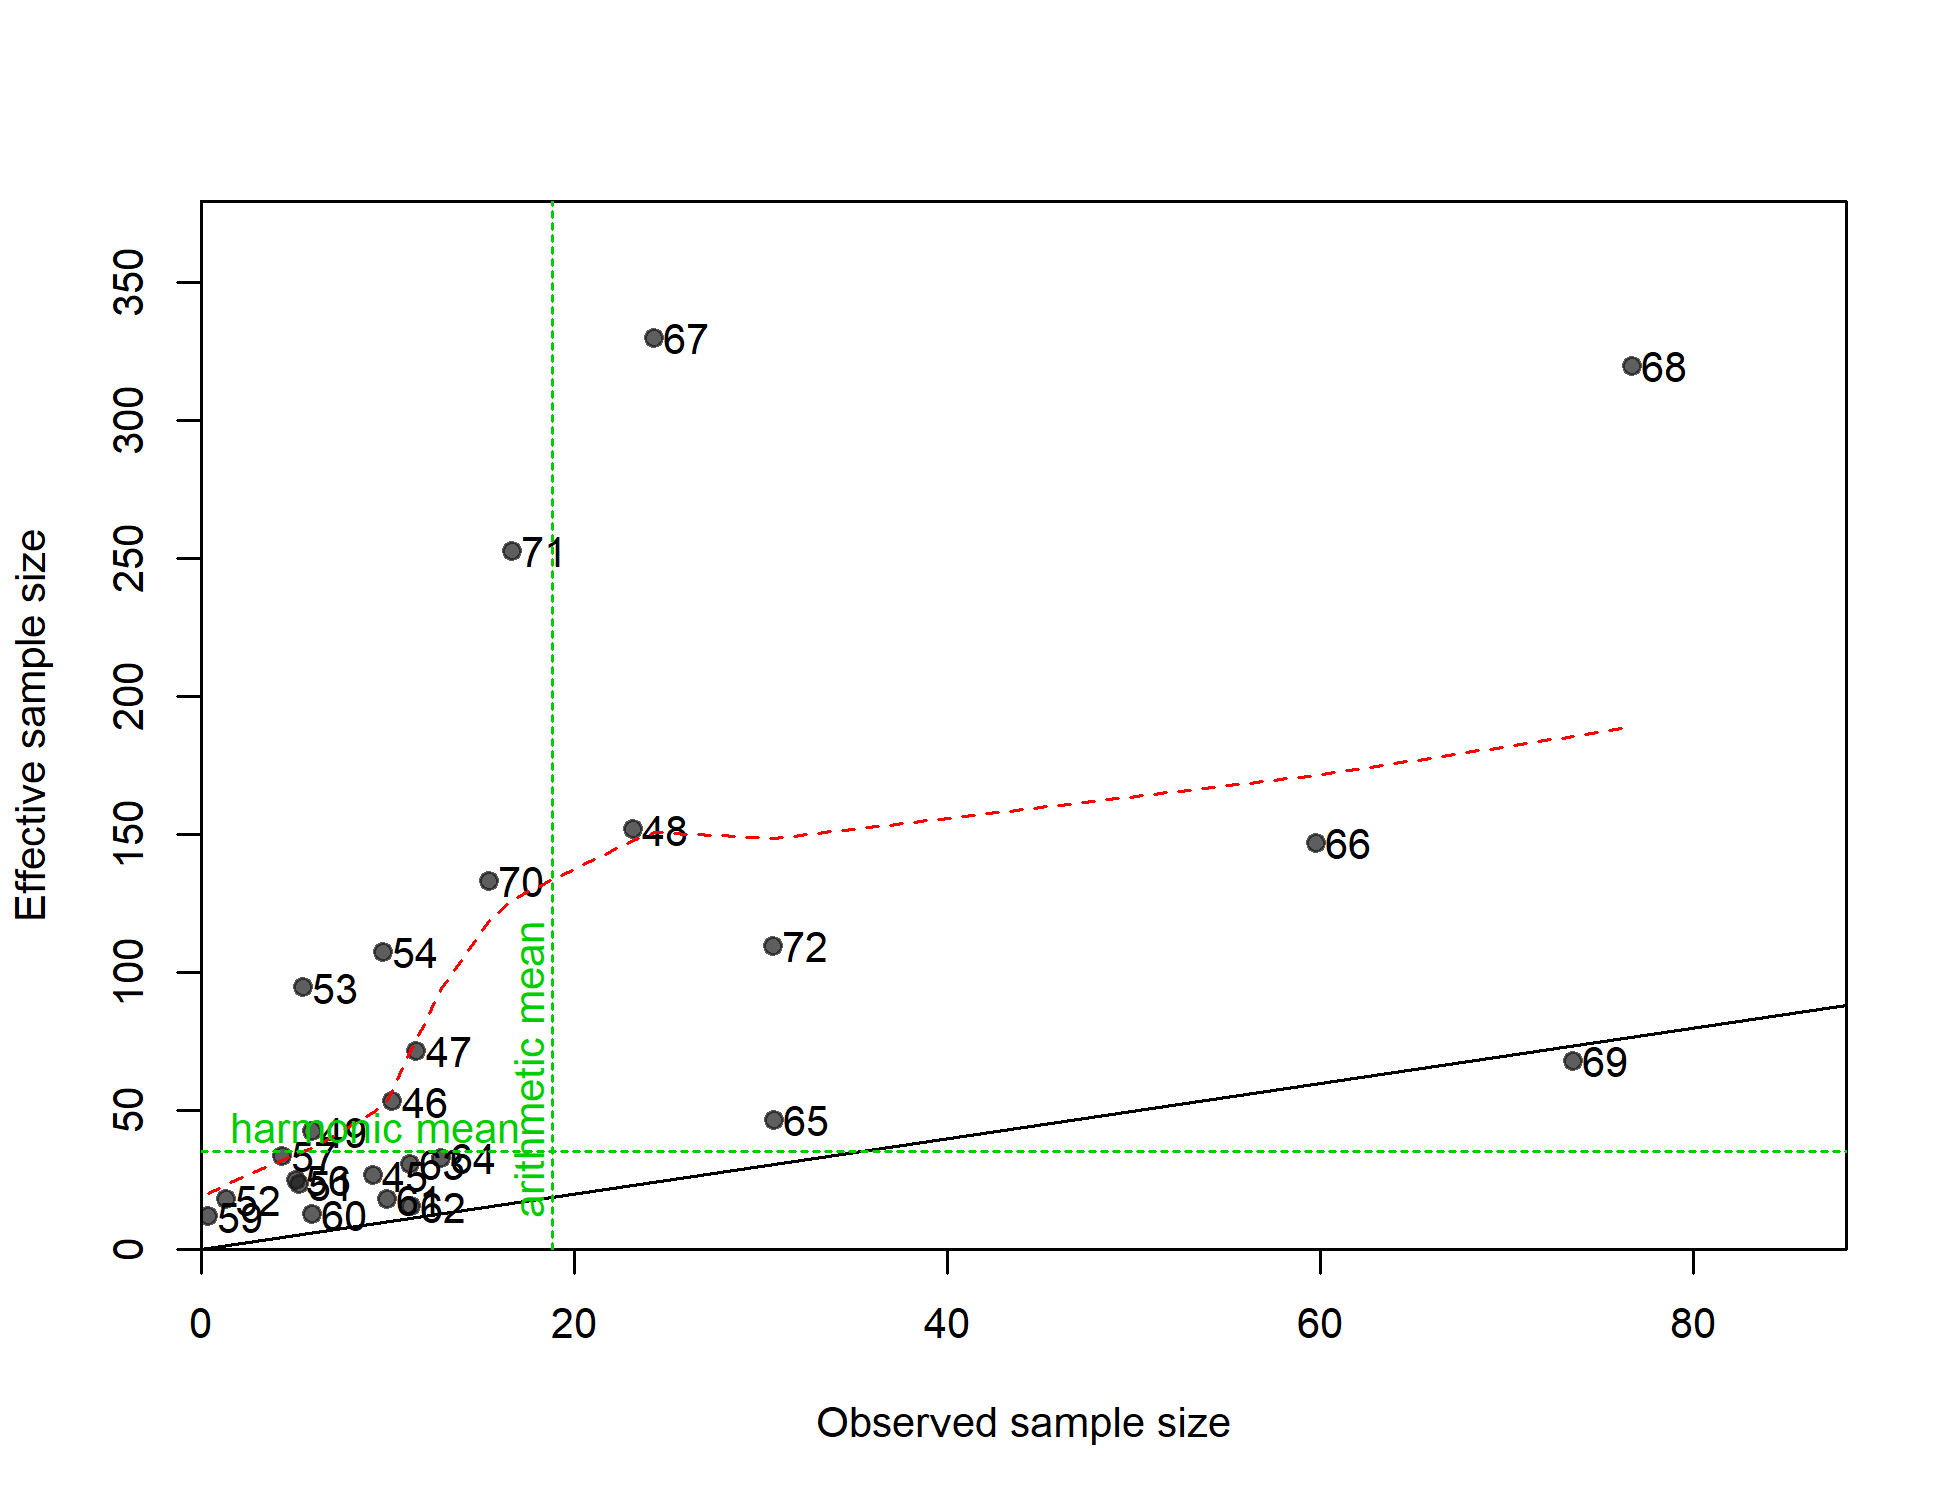
N-EffN comparison, Size comps, whole catch, EPO-LL-survey-early
file: comp_sizefit_sampsize_flt24mkt0.png
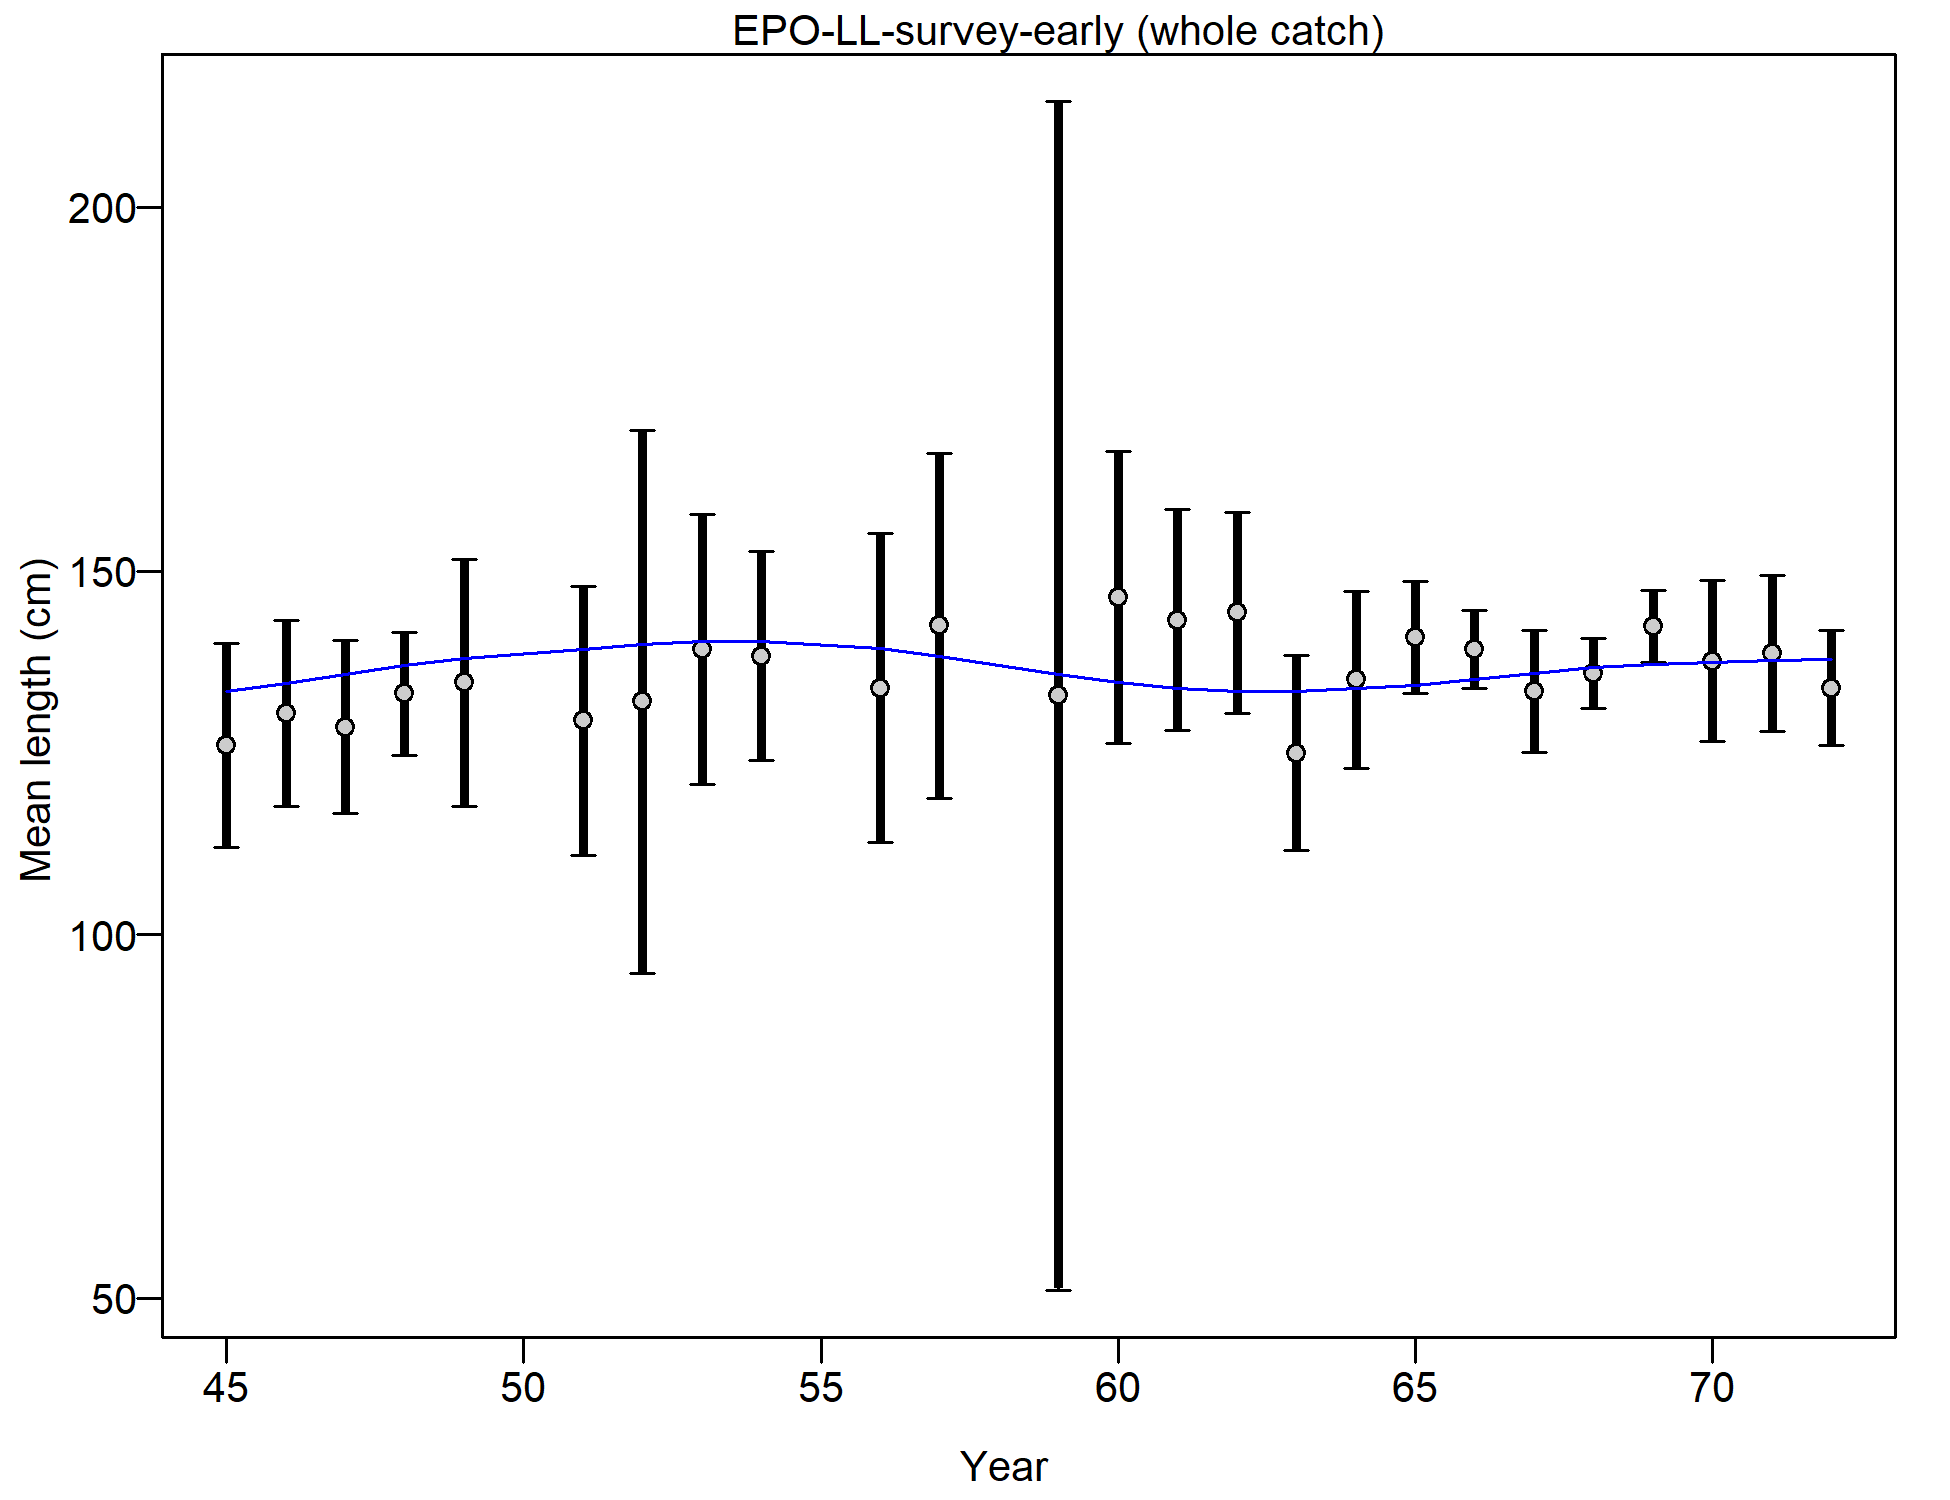
Mean size for EPO-LL-survey-early with 95% confidence intervals based on current samples sizes.
Francis data weighting method TA1.8: thinner intervals (with capped ends) show result of further adjusting sample sizes based on suggested multiplier (with 95% interval) for size data from EPO-LL-survey-early:
0.9958 (0.7225-1.8792)
For more info, see
Francis, R.I.C.C. (2011). Data weighting in statistical fisheries stock assessment models. Can. J. Fish. Aquat. Sci. 68: 1124-1138. https://doi.org/10.1139/f2011-025
Size comps, whole catch, EPO-LL-survey-late (plot 1 of 6).
'N adj.' is the input sample size after data-weighting adjustment. N eff. is the calculated effective sample size used in the McAllister-Iannelli tuning method.
file: comp_sizefit_flt25mkt0_page1.png
Size comps, whole catch, EPO-LL-survey-late (plot 2 of 6)
file: comp_sizefit_flt25mkt0_page2.png
Size comps, whole catch, EPO-LL-survey-late (plot 3 of 6)
file: comp_sizefit_flt25mkt0_page3.png
Size comps, whole catch, EPO-LL-survey-late (plot 4 of 6)
file: comp_sizefit_flt25mkt0_page4.png
Size comps, whole catch, EPO-LL-survey-late (plot 5 of 6)
file: comp_sizefit_flt25mkt0_page5.png
Size comps, whole catch, EPO-LL-survey-late (plot 6 of 6)
file: comp_sizefit_flt25mkt0_page6.png
Pearson residuals, whole catch, EPO-LL-survey-late (max=2.95) (plot 6 of 6)
Closed bubbles are positive residuals (observed > expected) and open bubbles are negative residuals (observed < expected).
file: comp_sizefit_residsflt25mkt0_page6.png
N-EffN comparison, Size comps, whole catch, EPO-LL-survey-late
file: comp_sizefit_sampsize_flt25mkt0.png
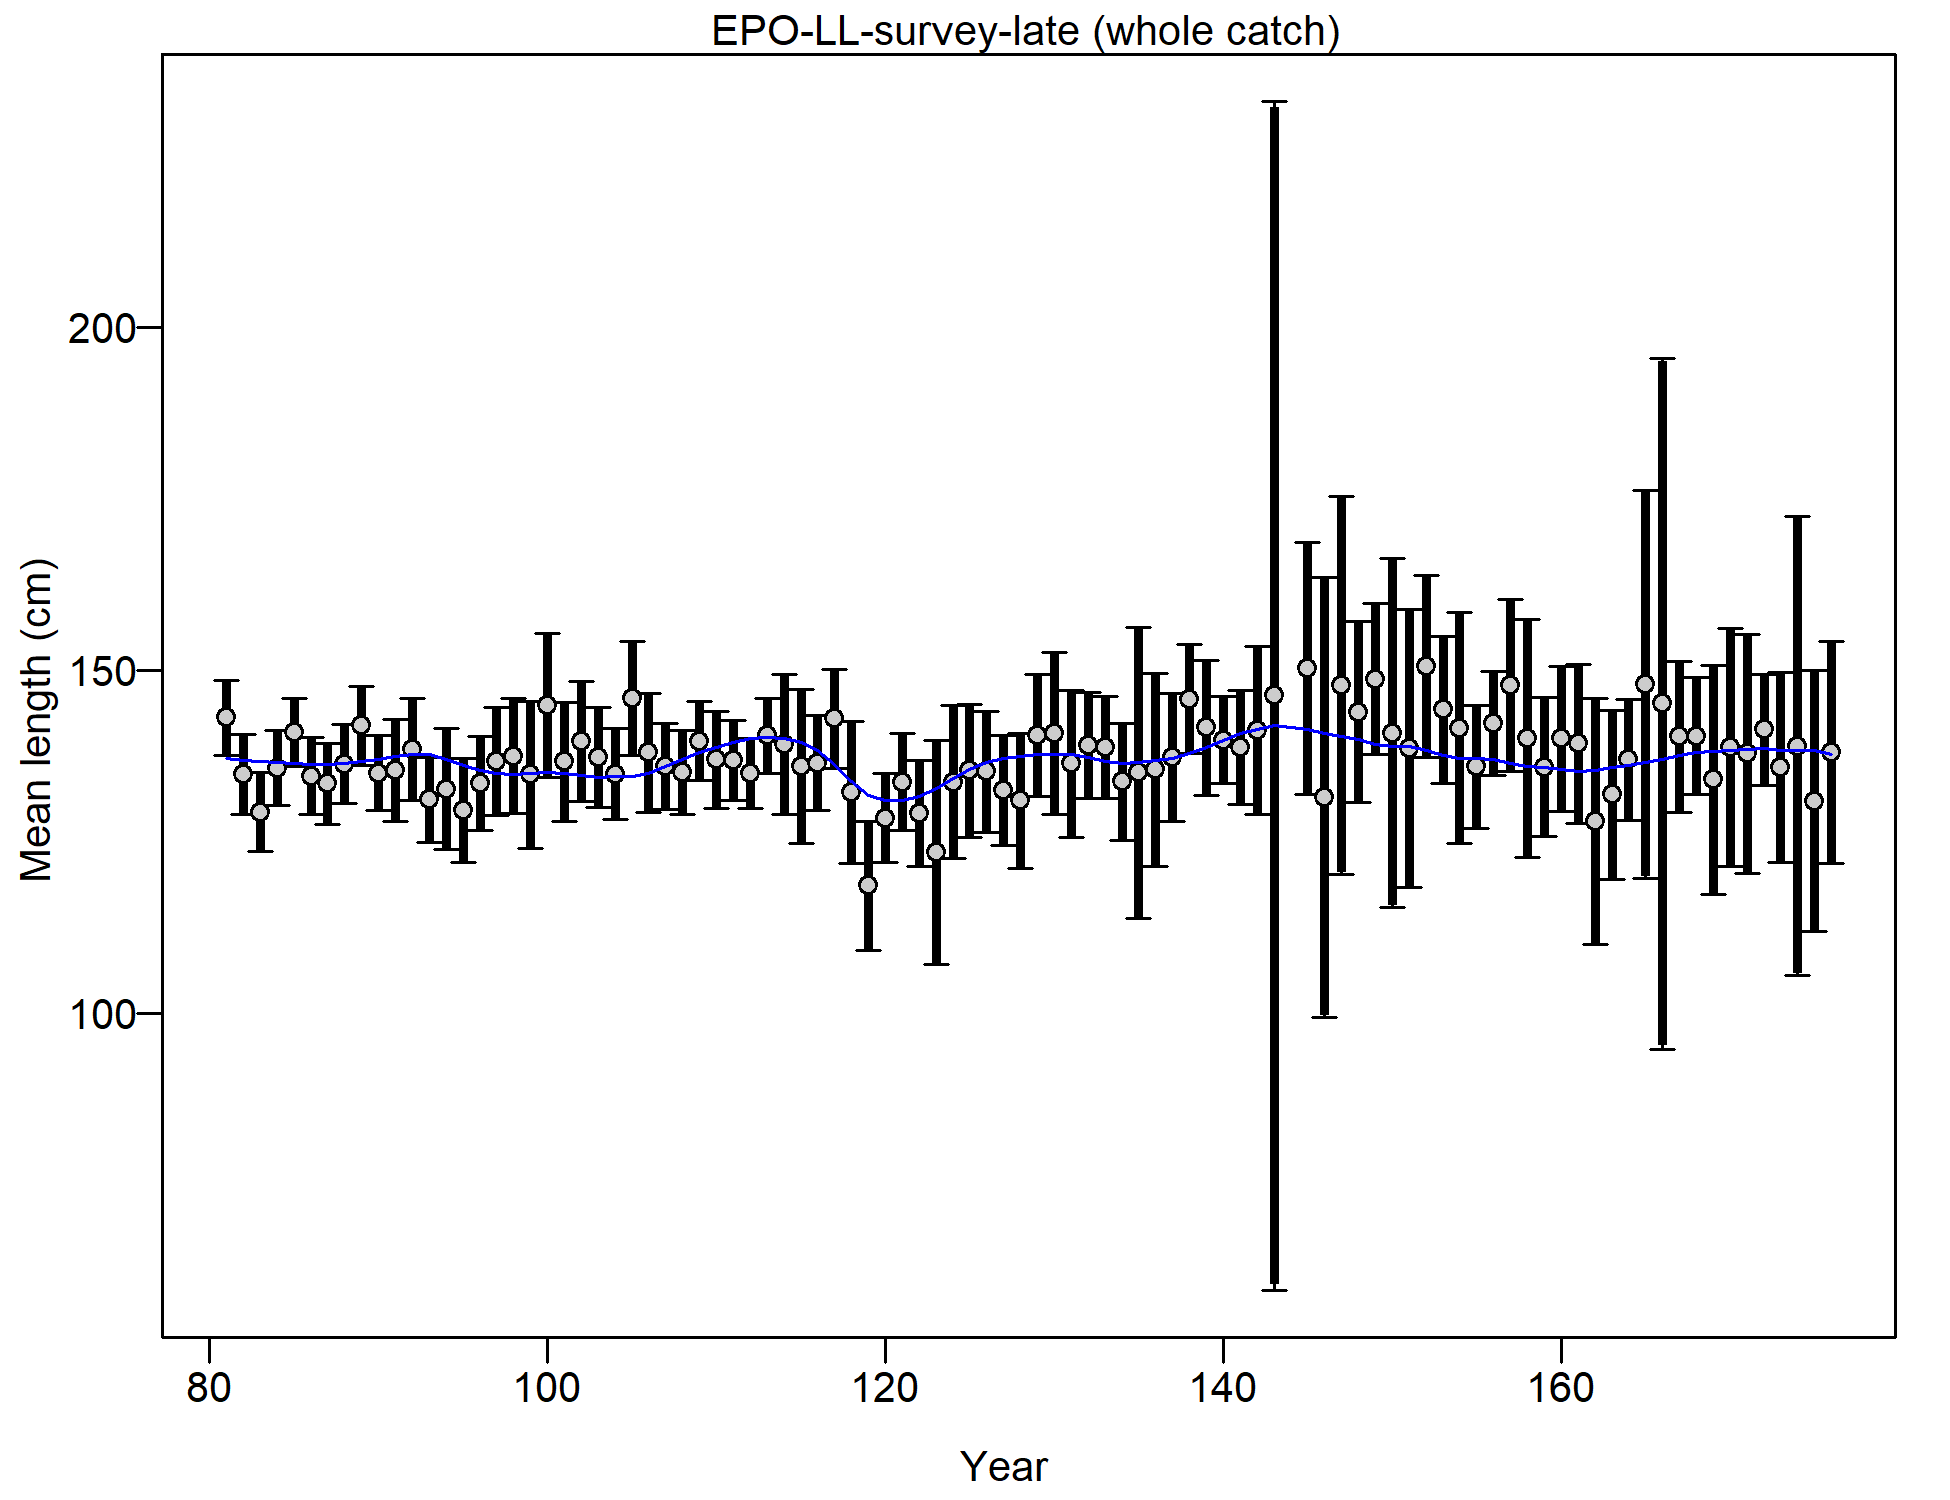
Mean size for EPO-LL-survey-late with 95% confidence intervals based on current samples sizes.
Francis data weighting method TA1.8: thinner intervals (with capped ends) show result of further adjusting sample sizes based on suggested multiplier (with 95% interval) for size data from EPO-LL-survey-late:
0.9814 (0.7553-1.4164)
For more info, see
Francis, R.I.C.C. (2011). Data weighting in statistical fisheries stock assessment models. Can. J. Fish. Aquat. Sci. 68: 1124-1138. https://doi.org/10.1139/f2011-025
Size comps, aggregated across time by fleet.
Labels 'retained' and 'discard' indicate discarded or retained sampled for each fleet. Panels without this designation represent the whole catch.
file: comp_sizefit__aggregated_across_time.png