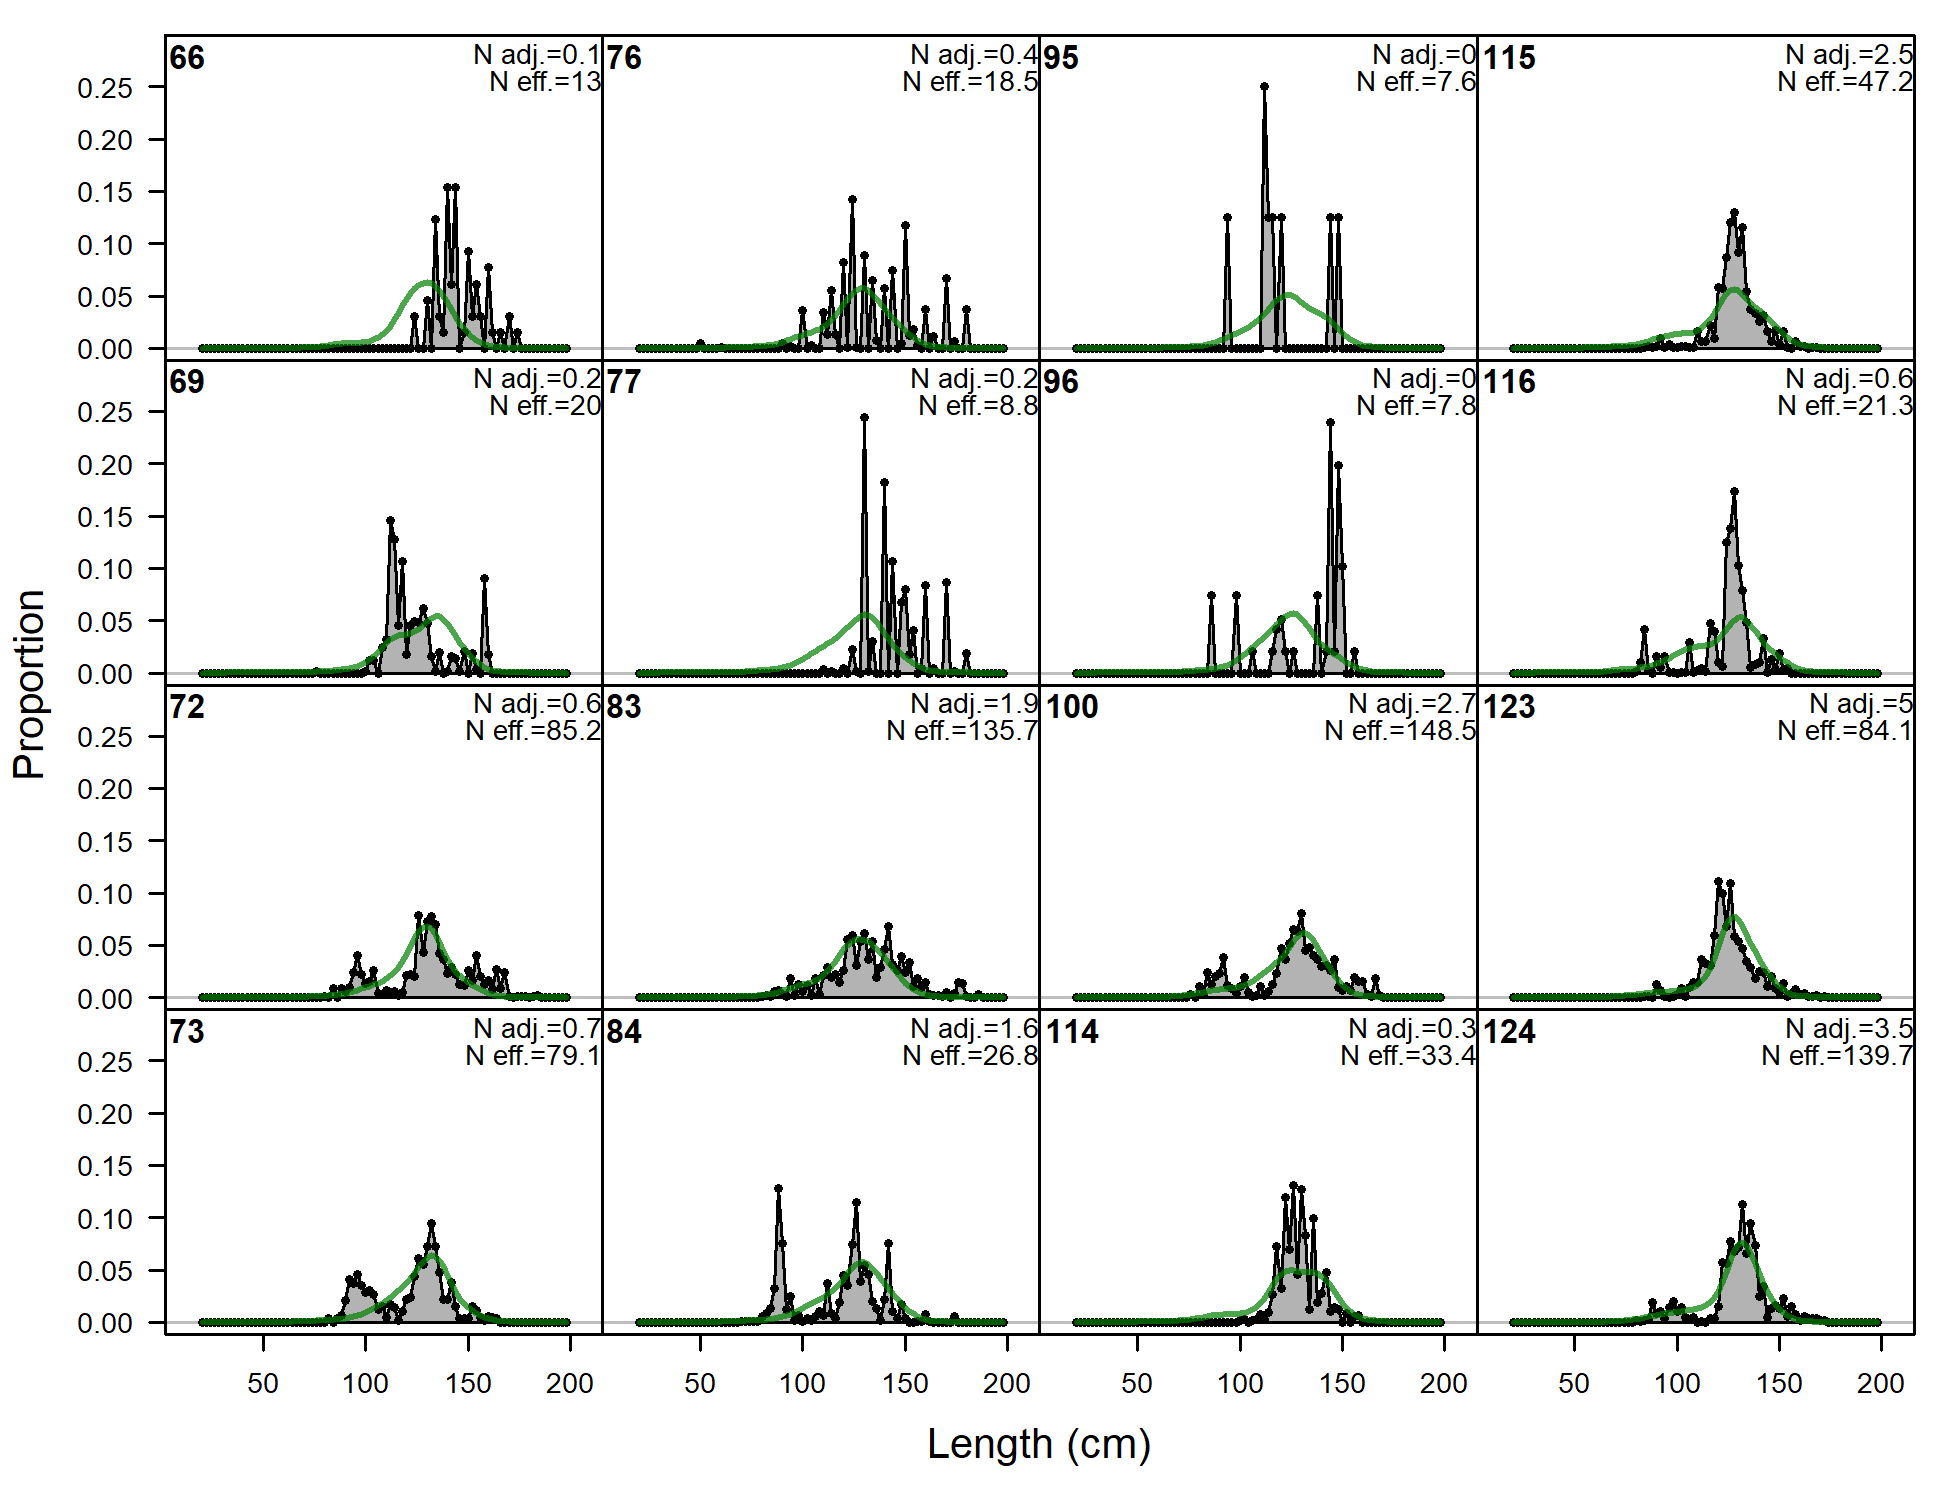
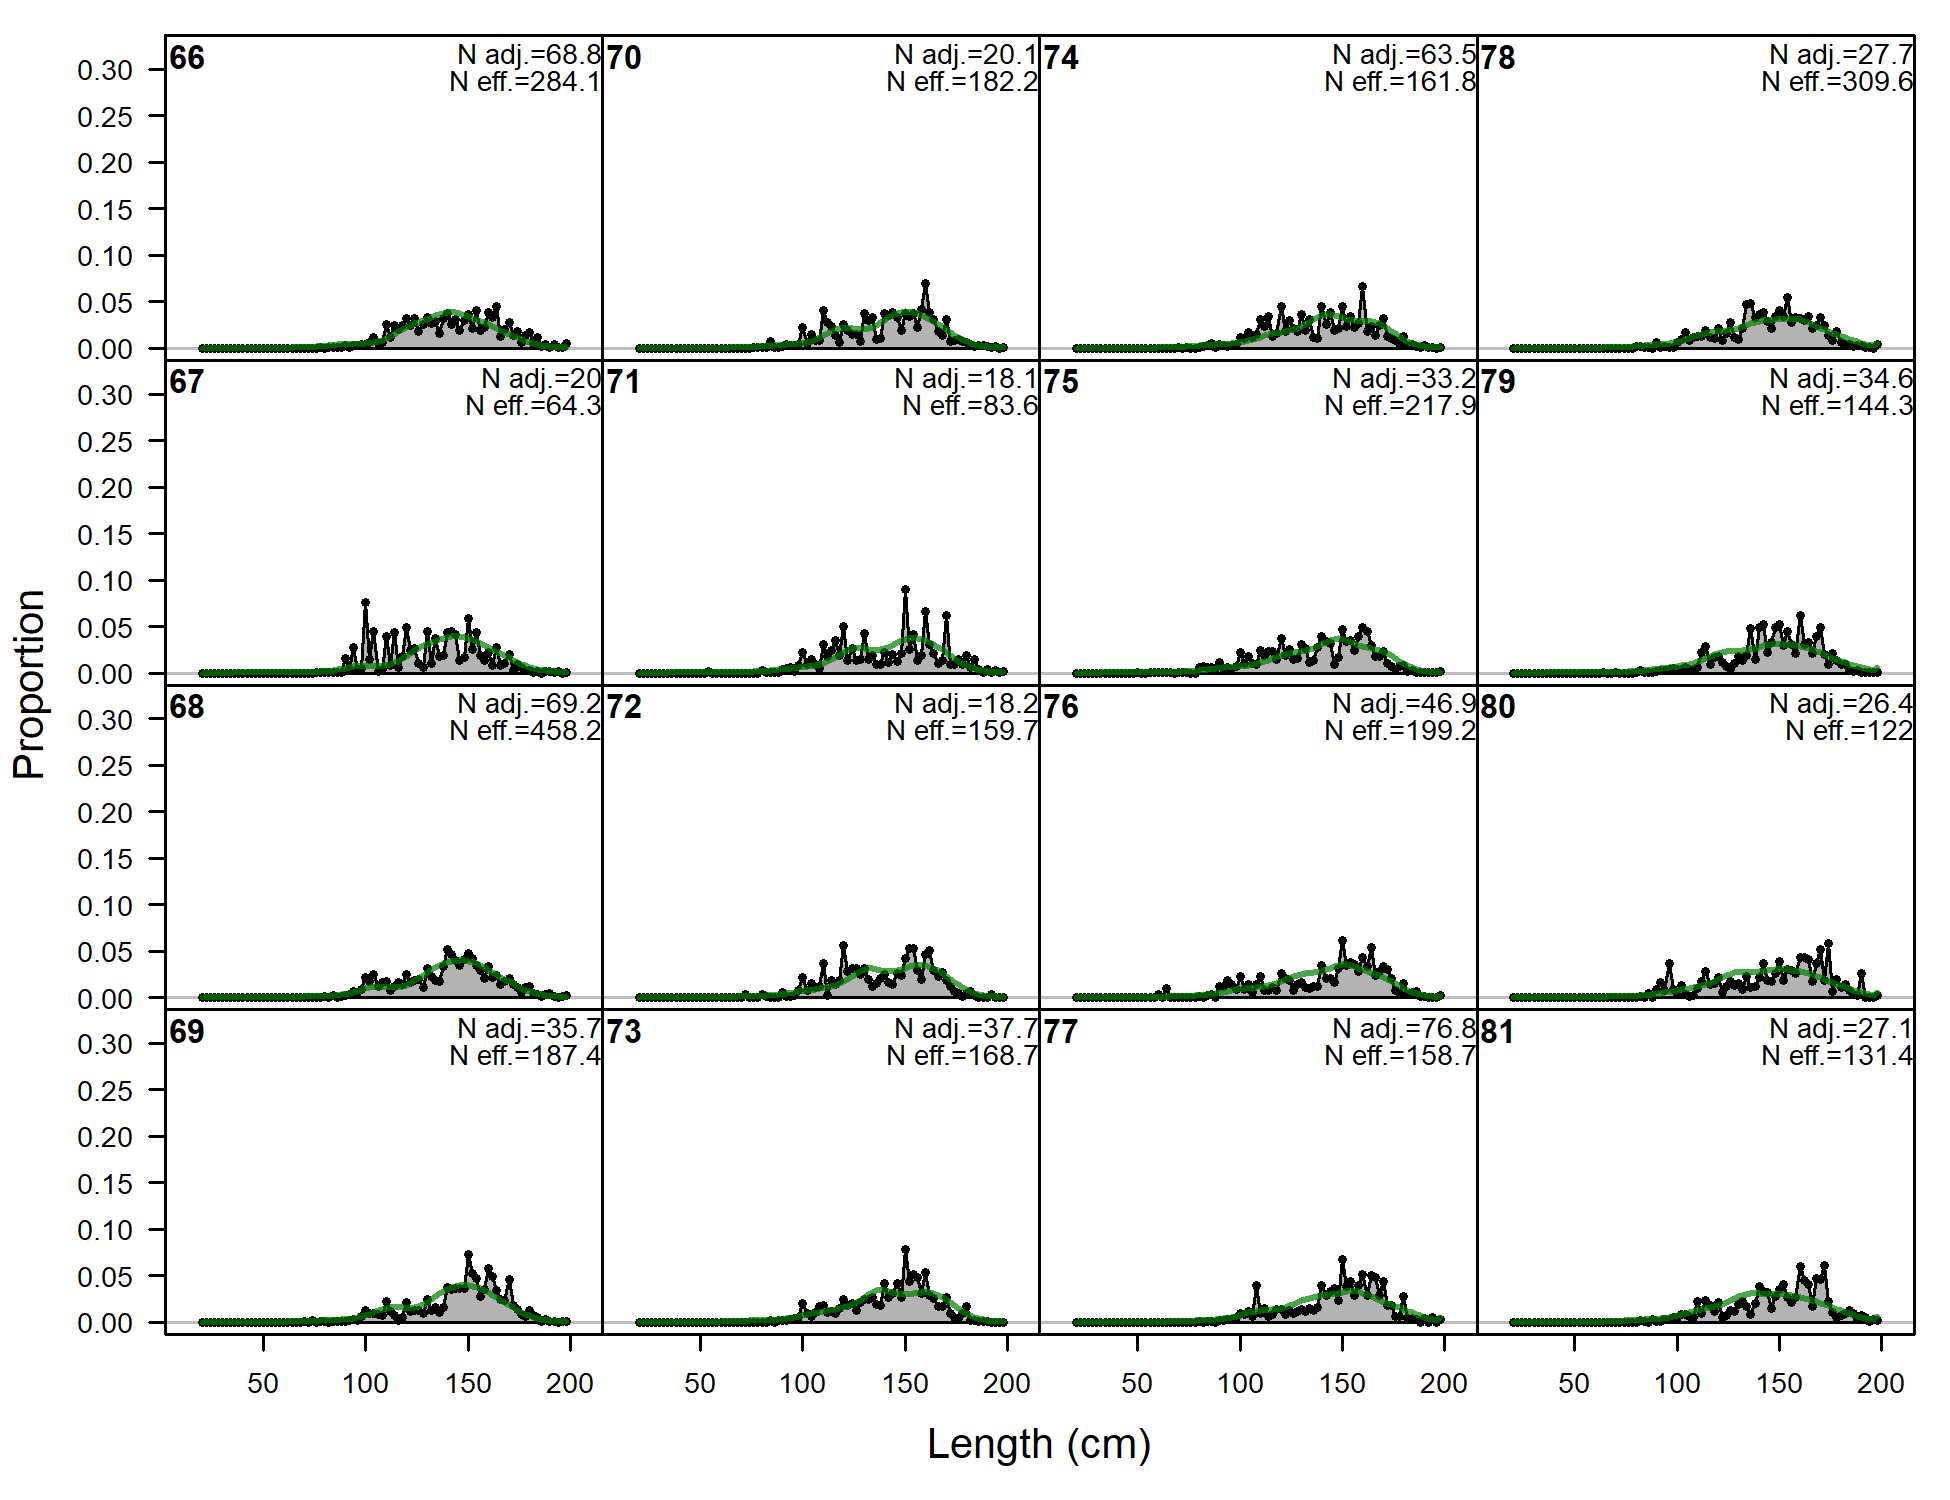
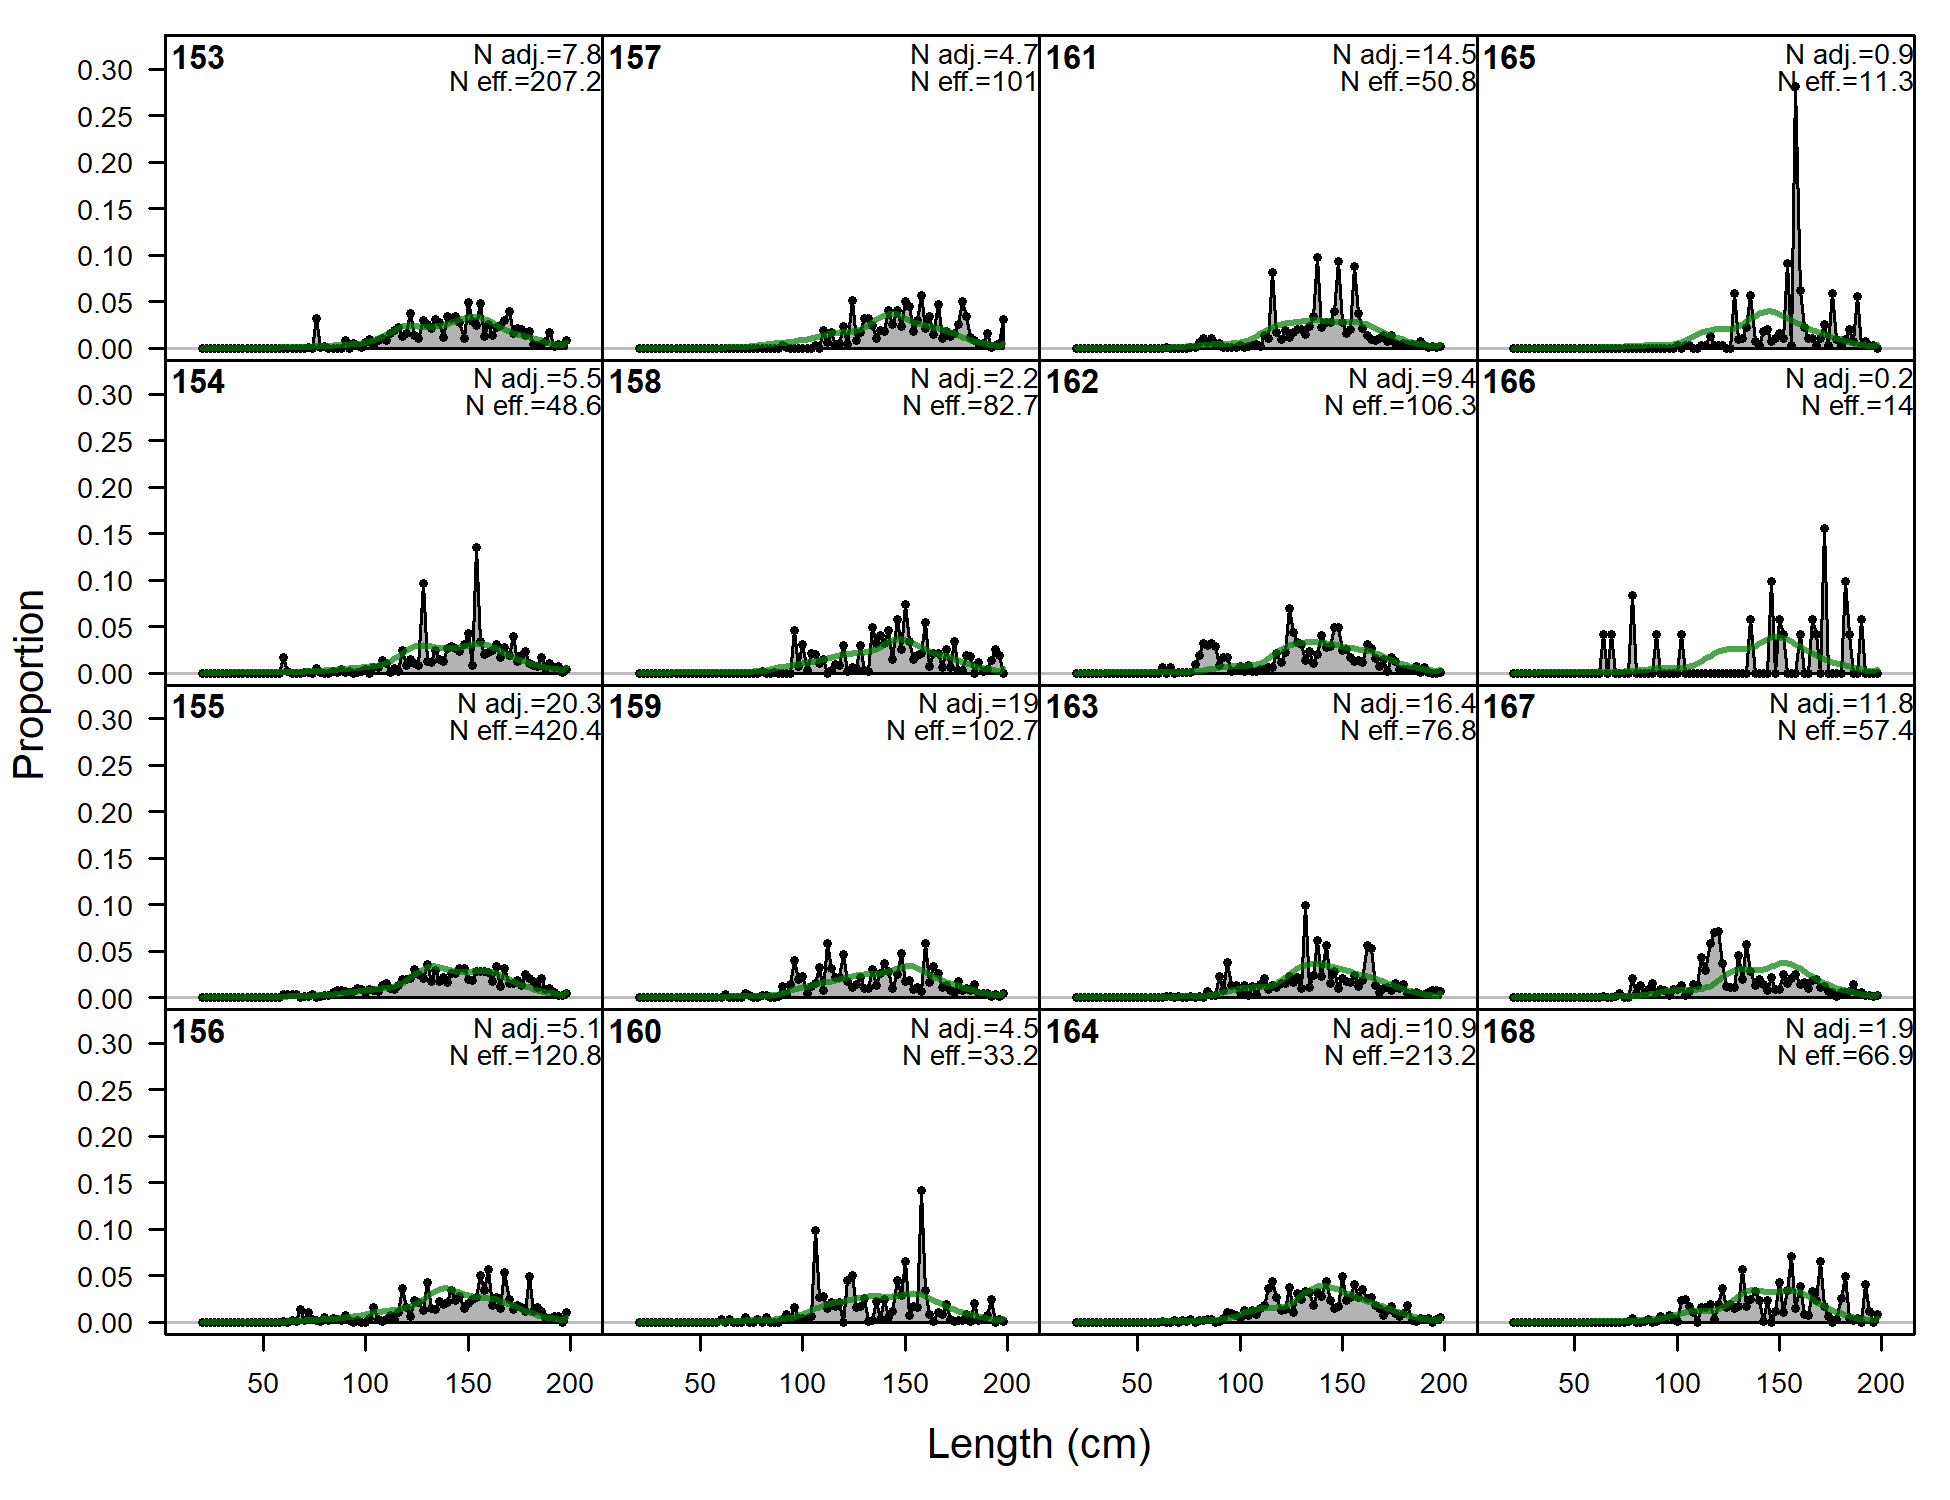
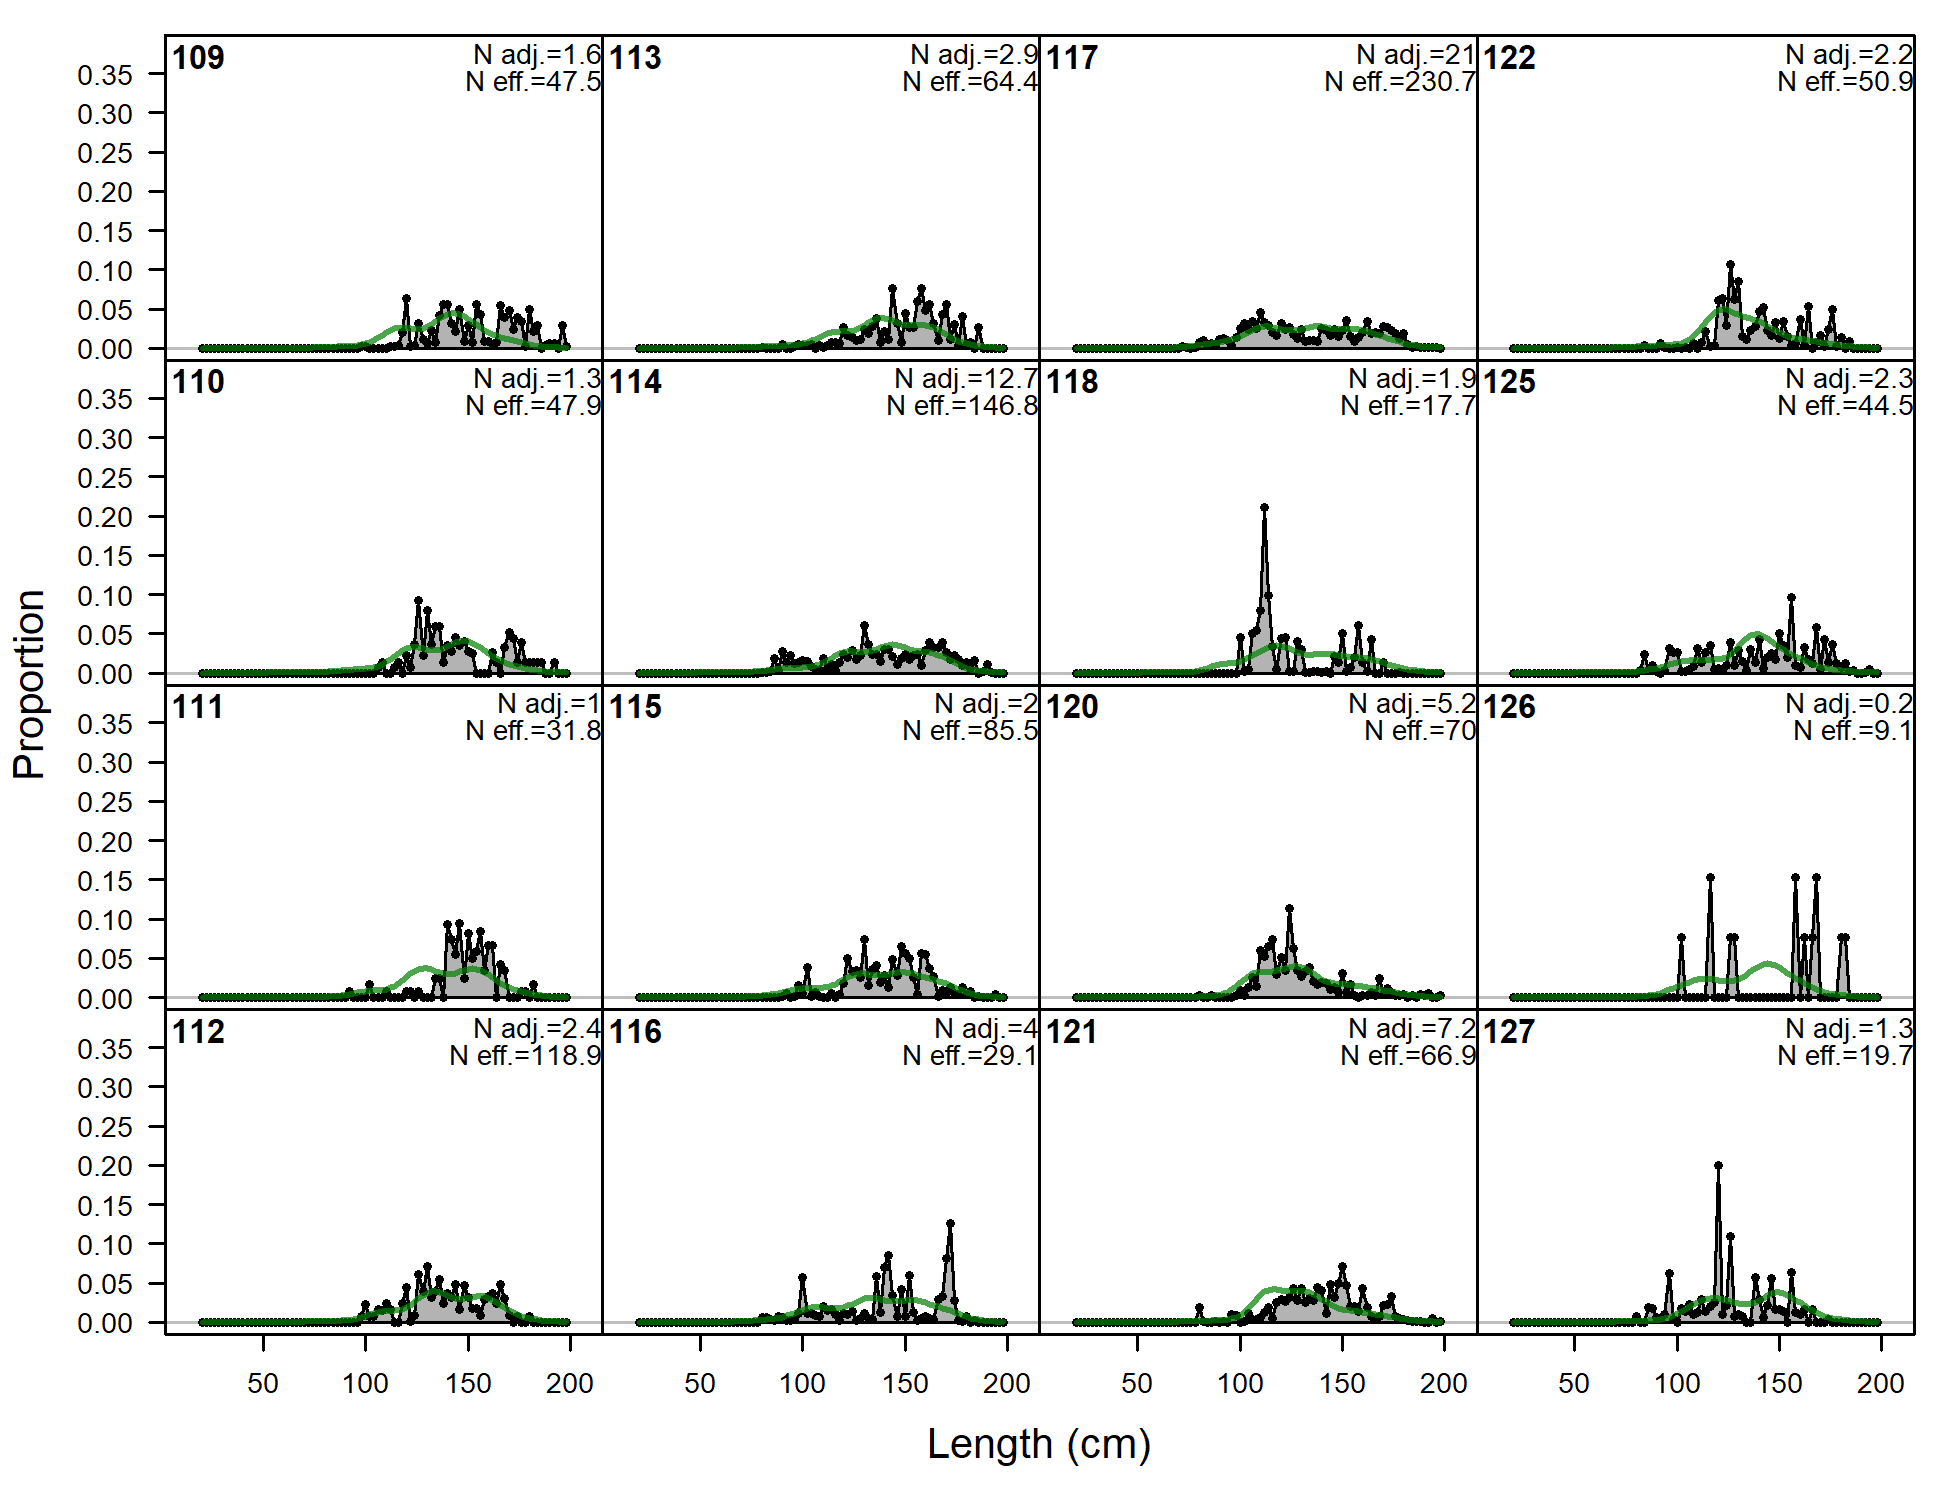
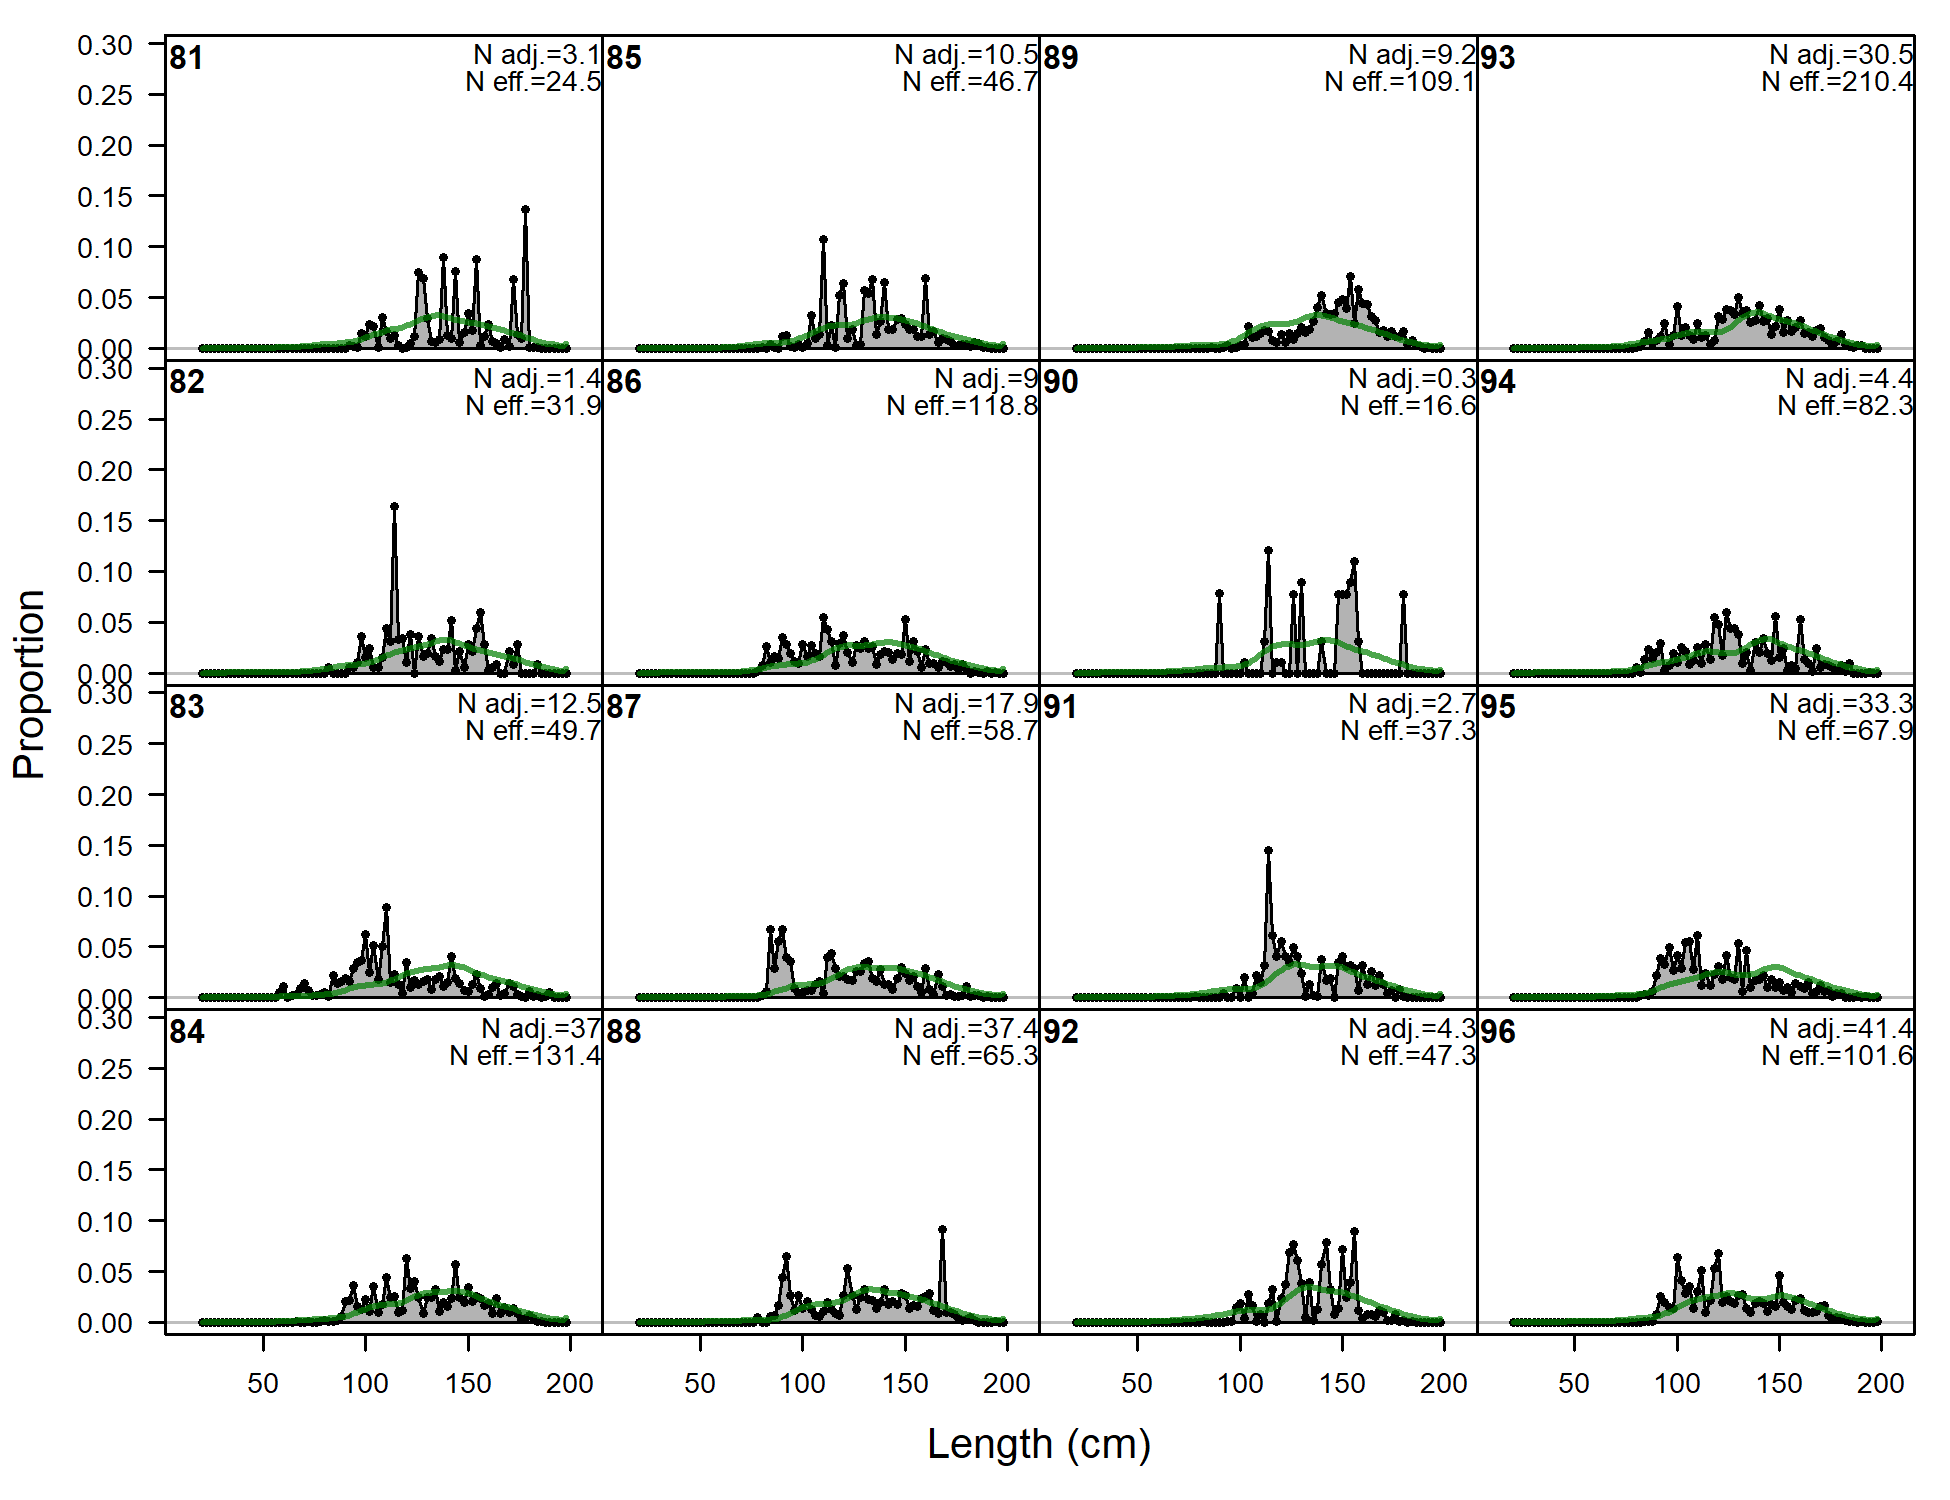
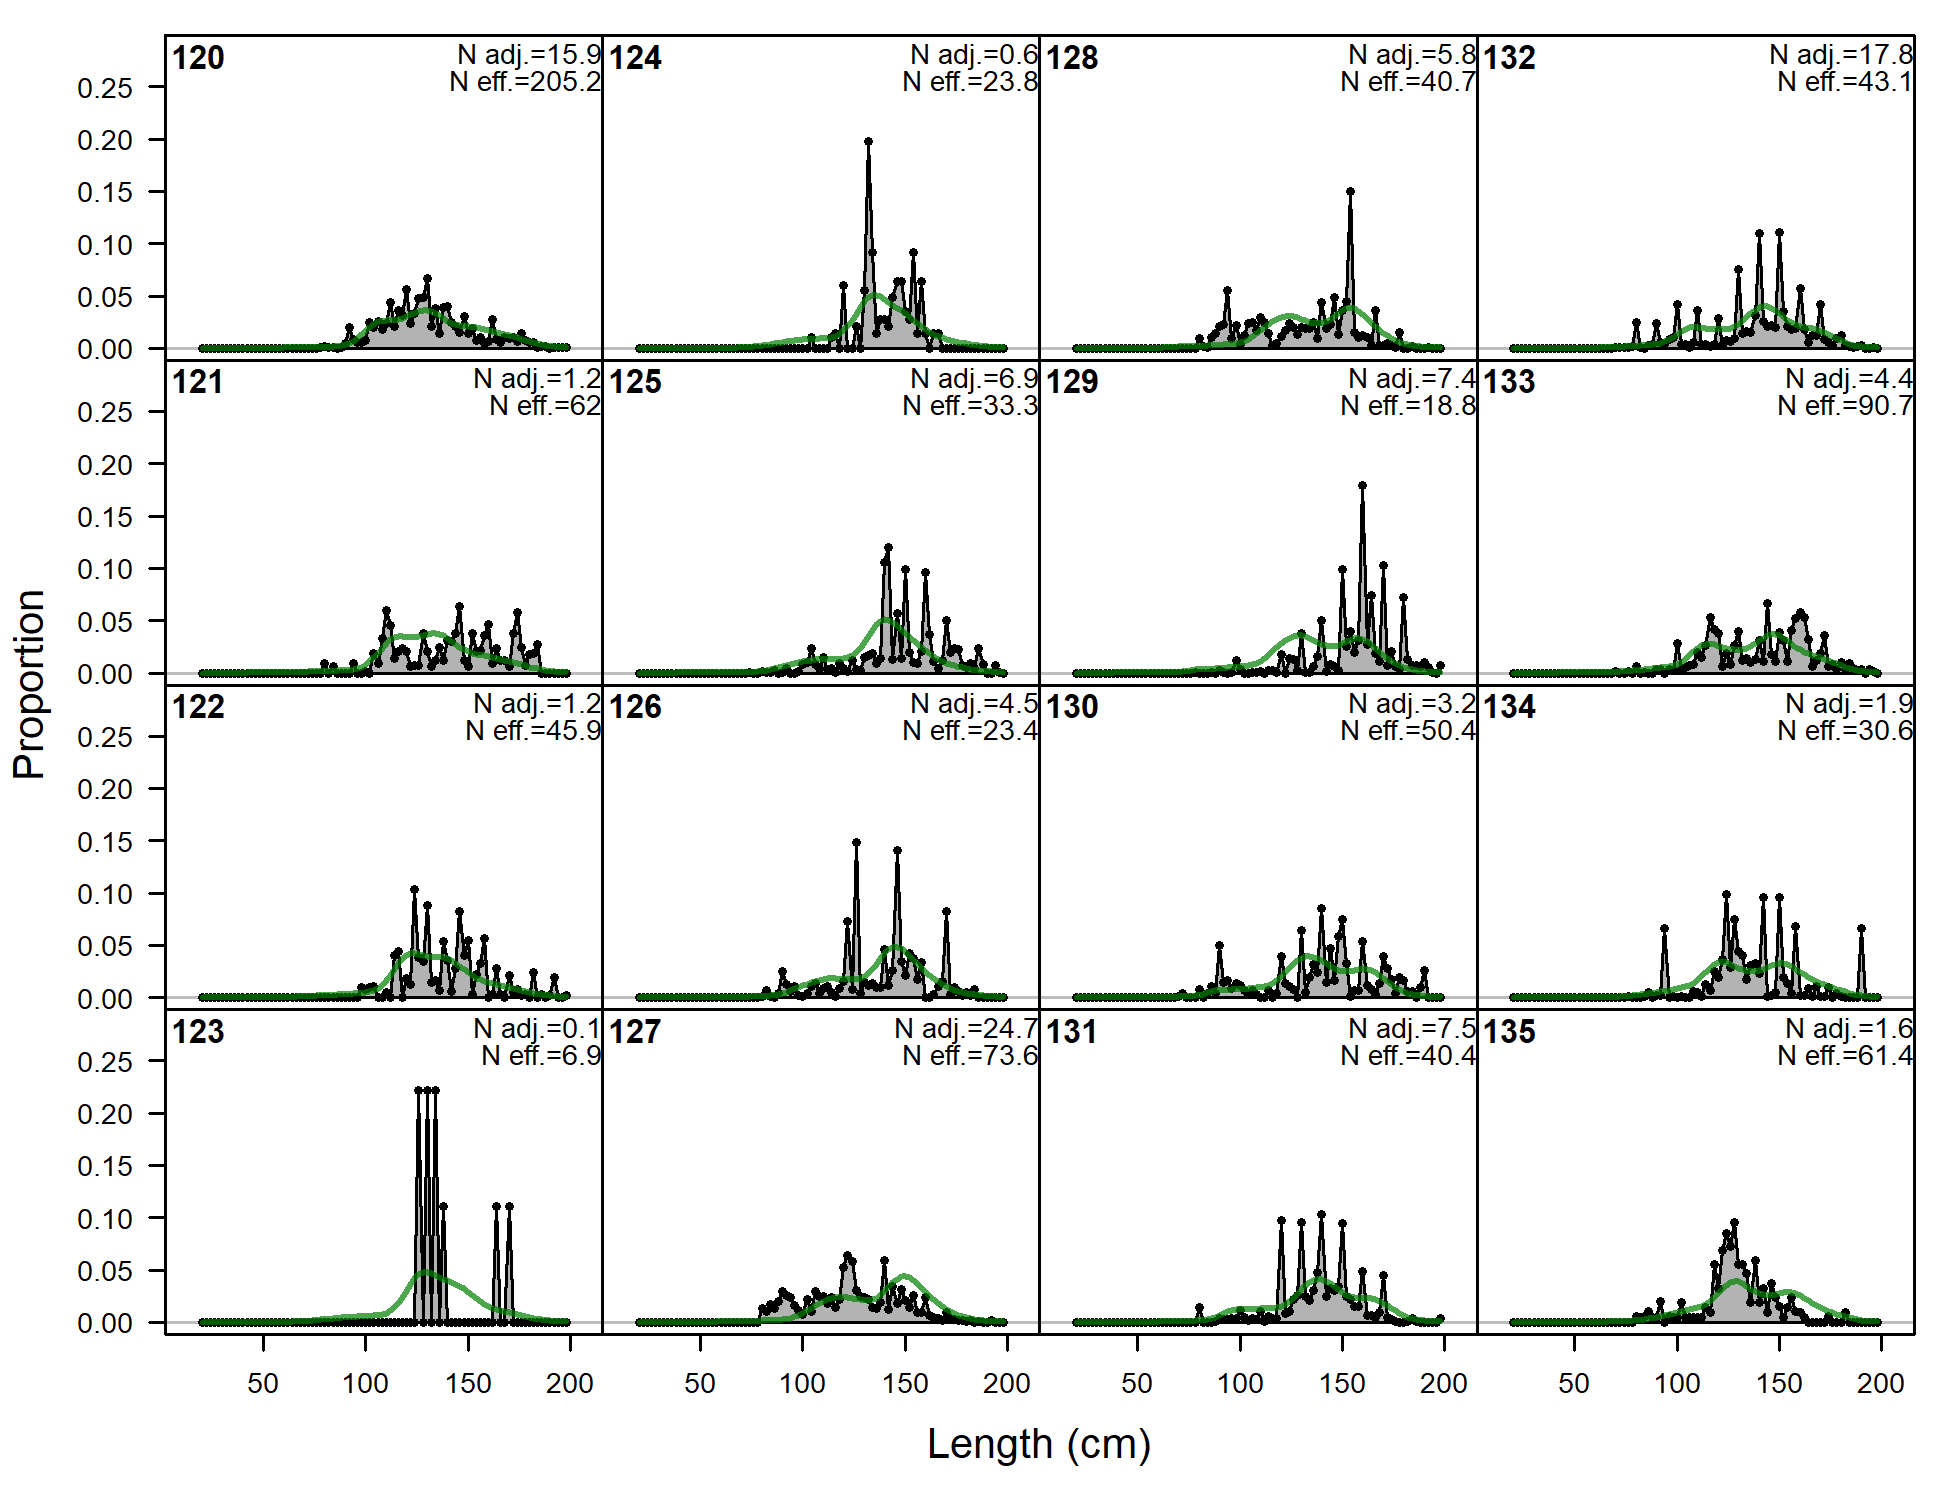
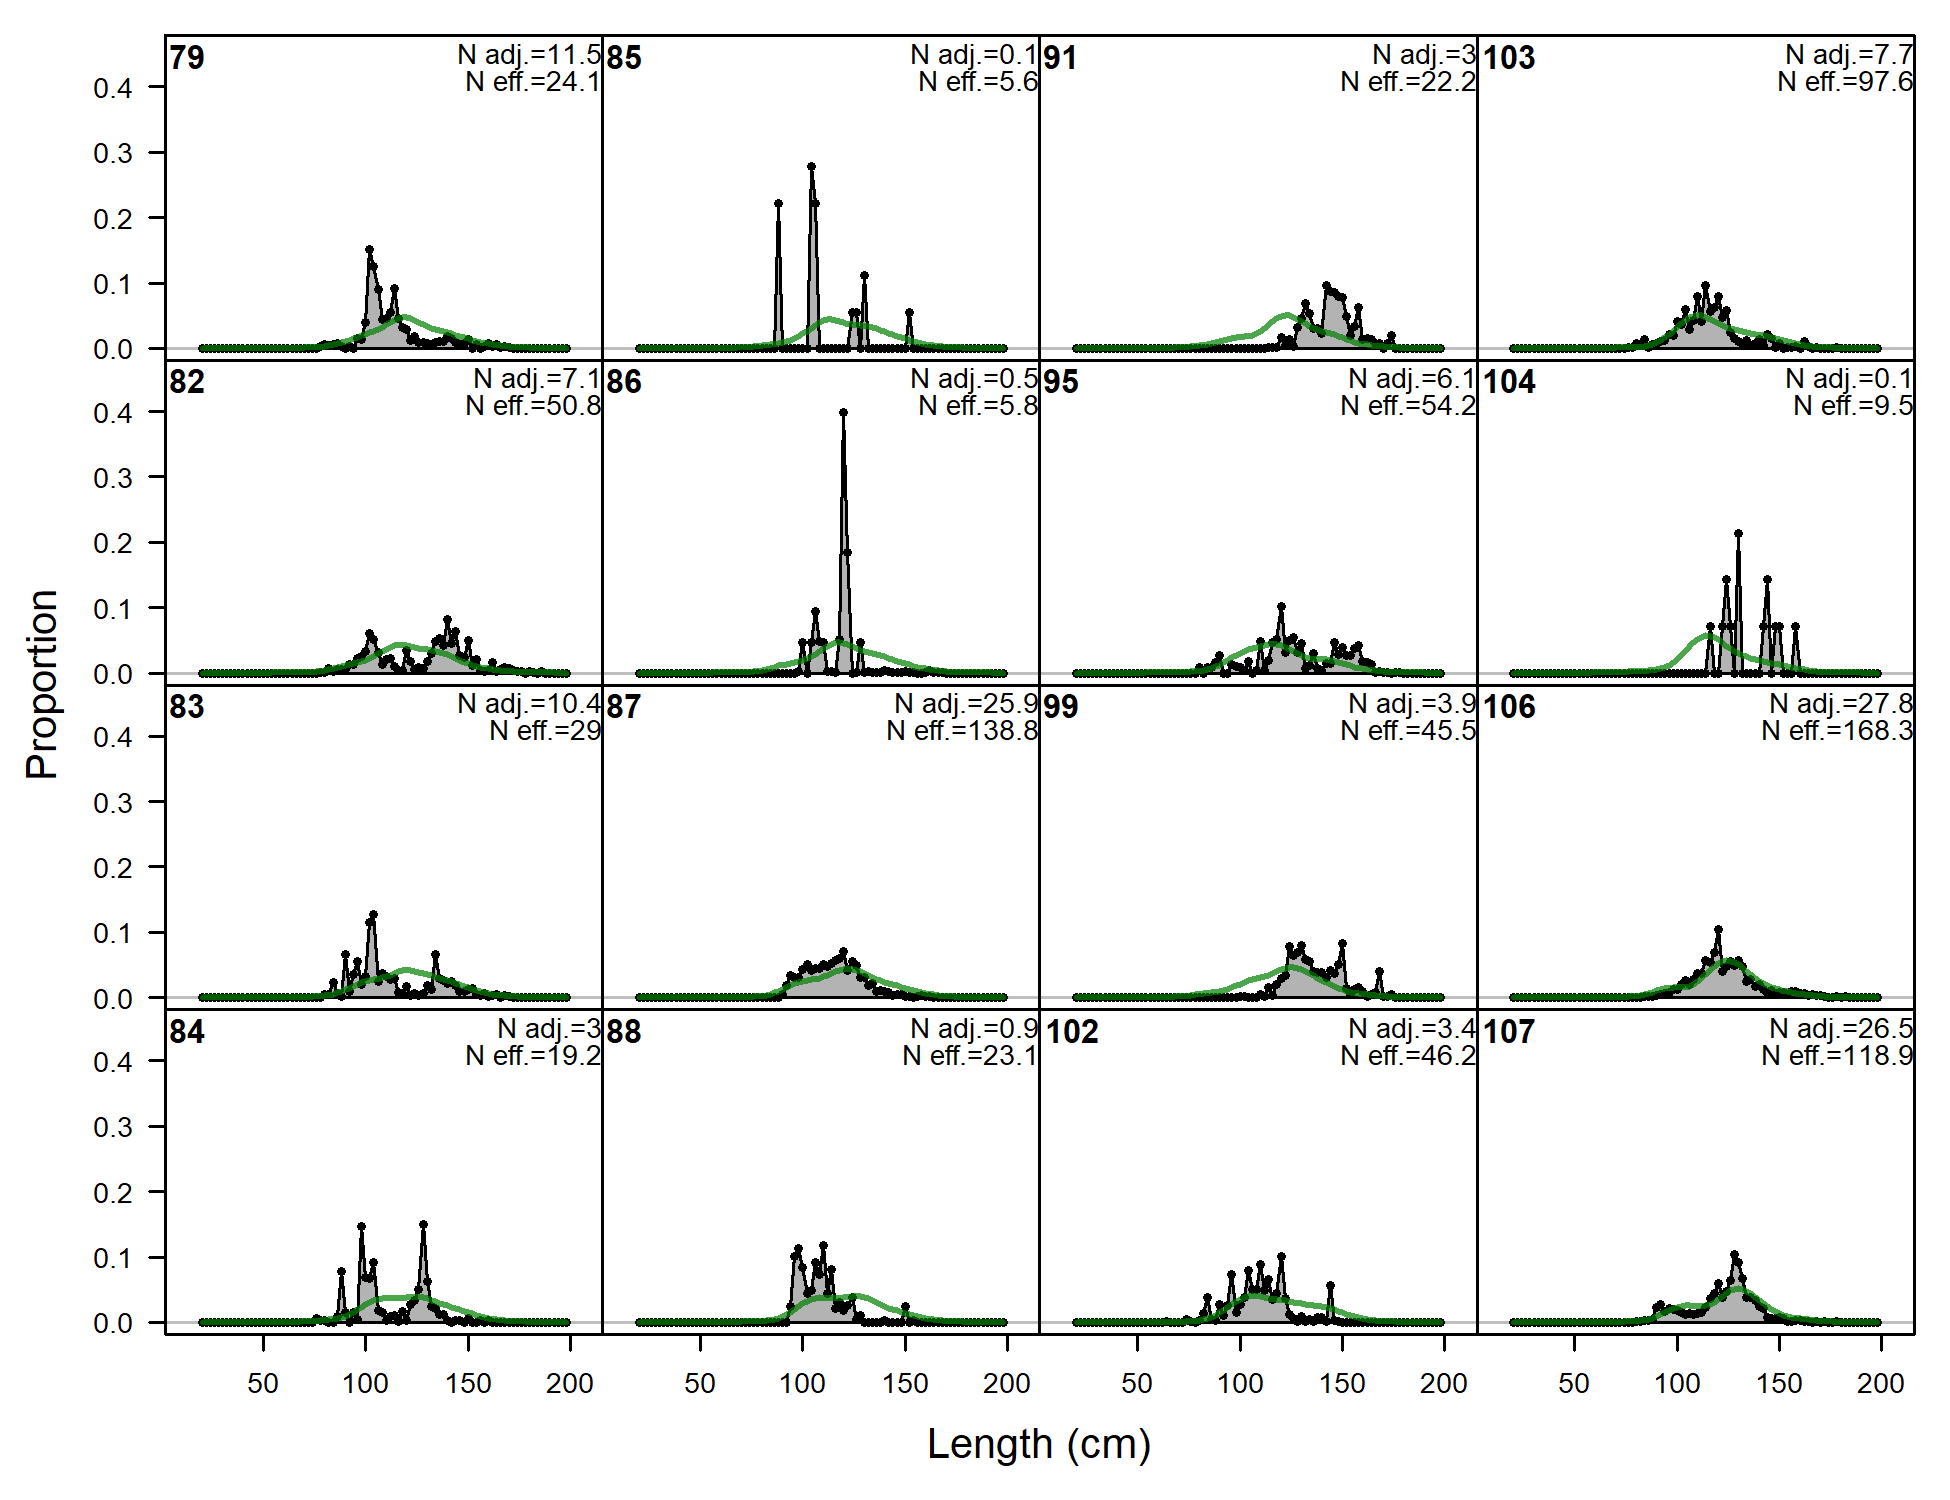
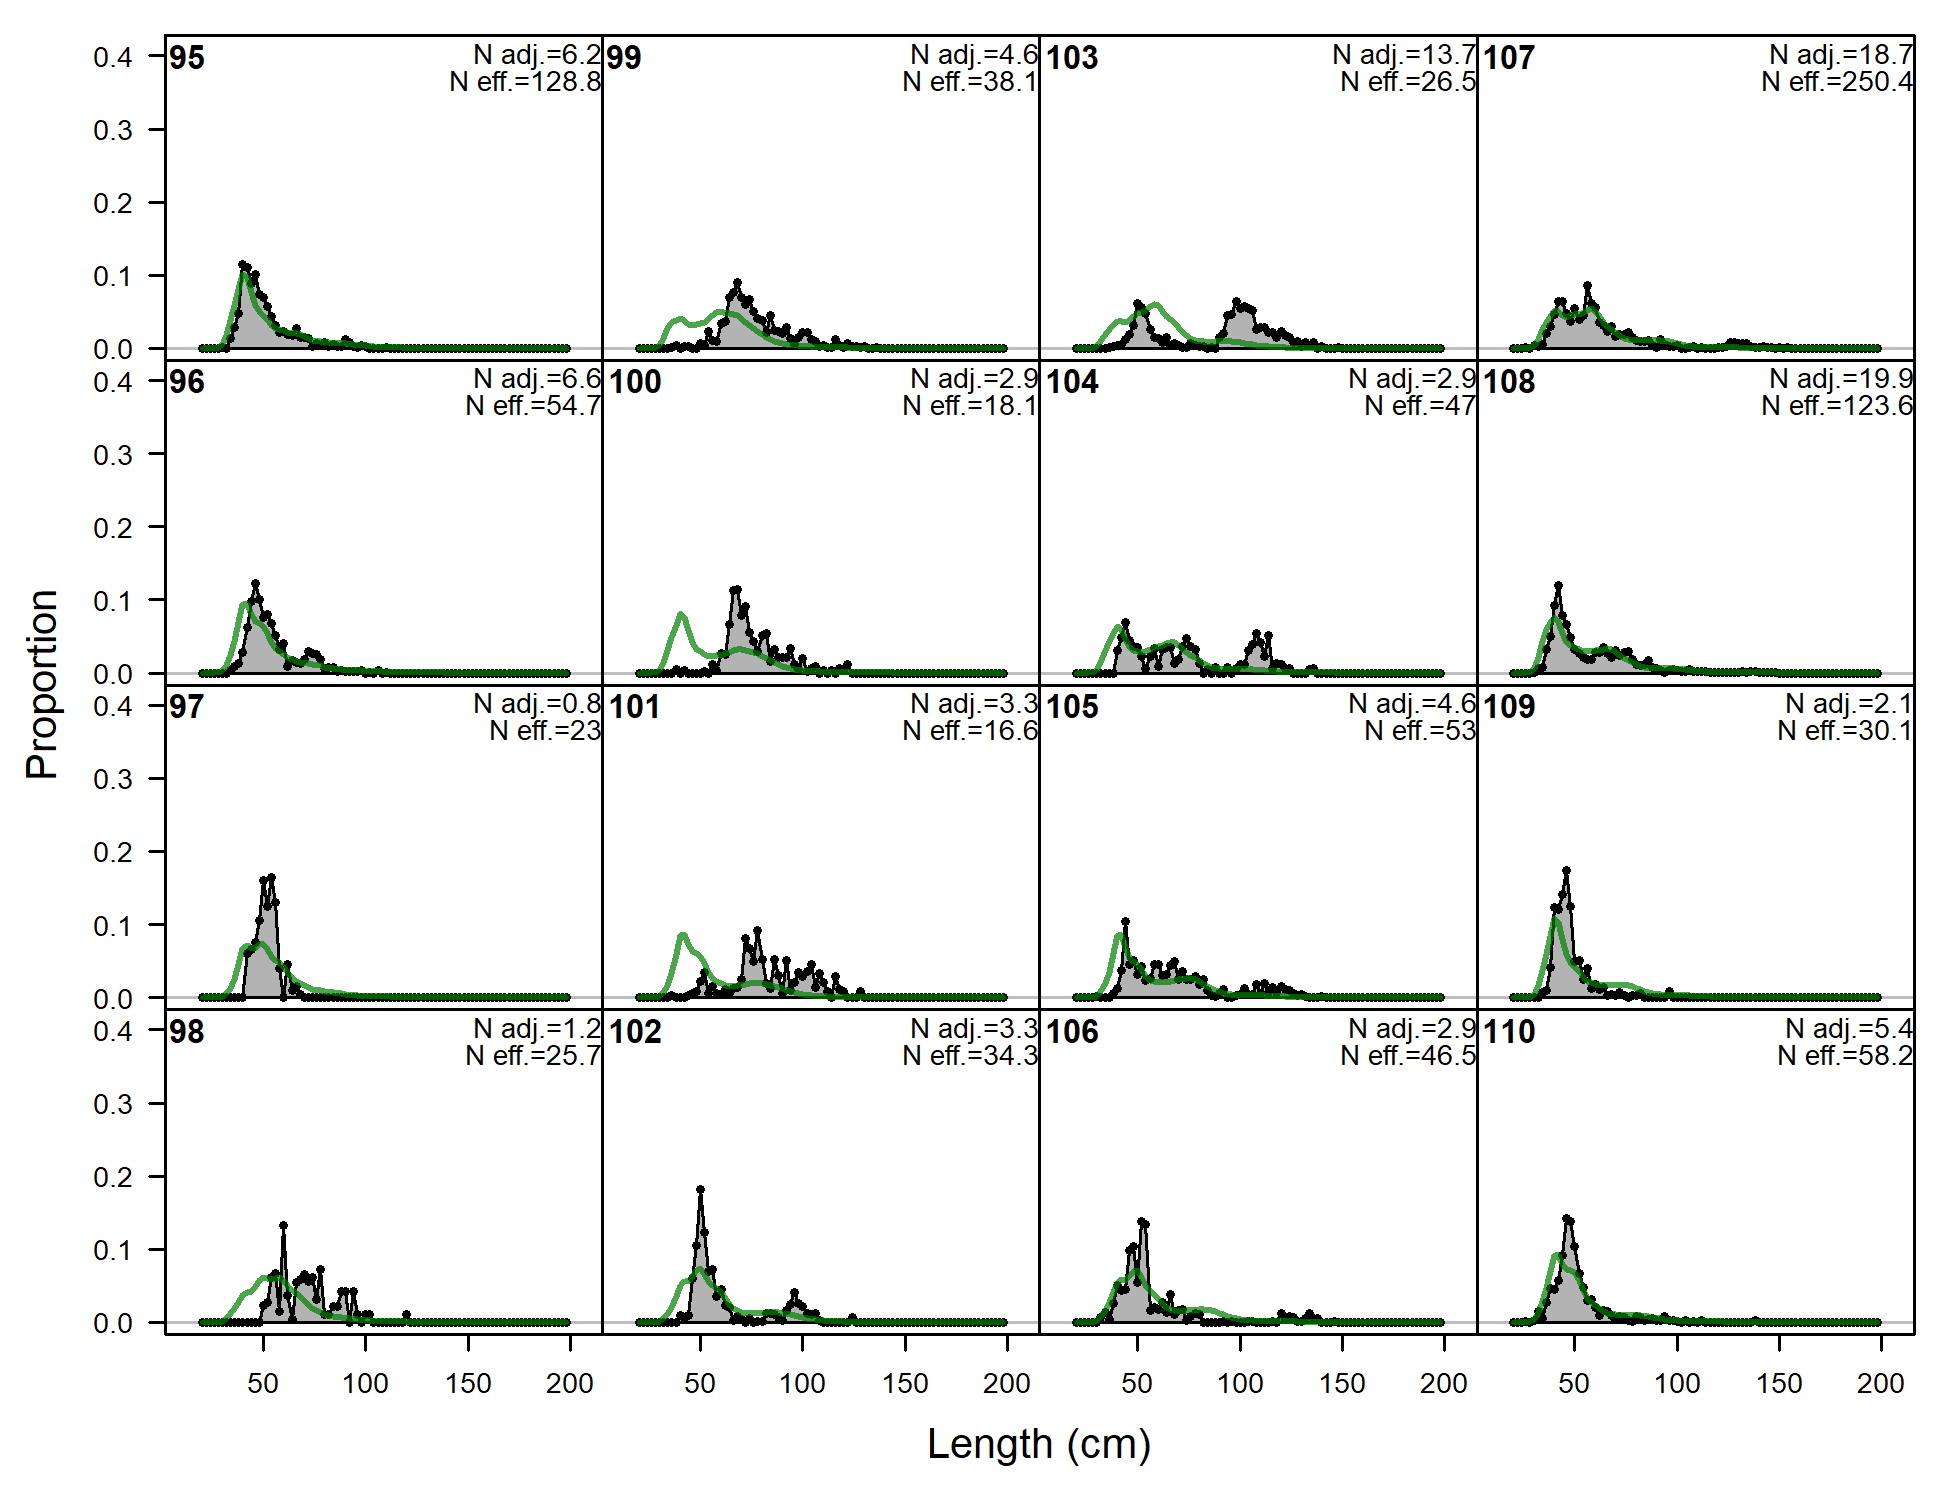
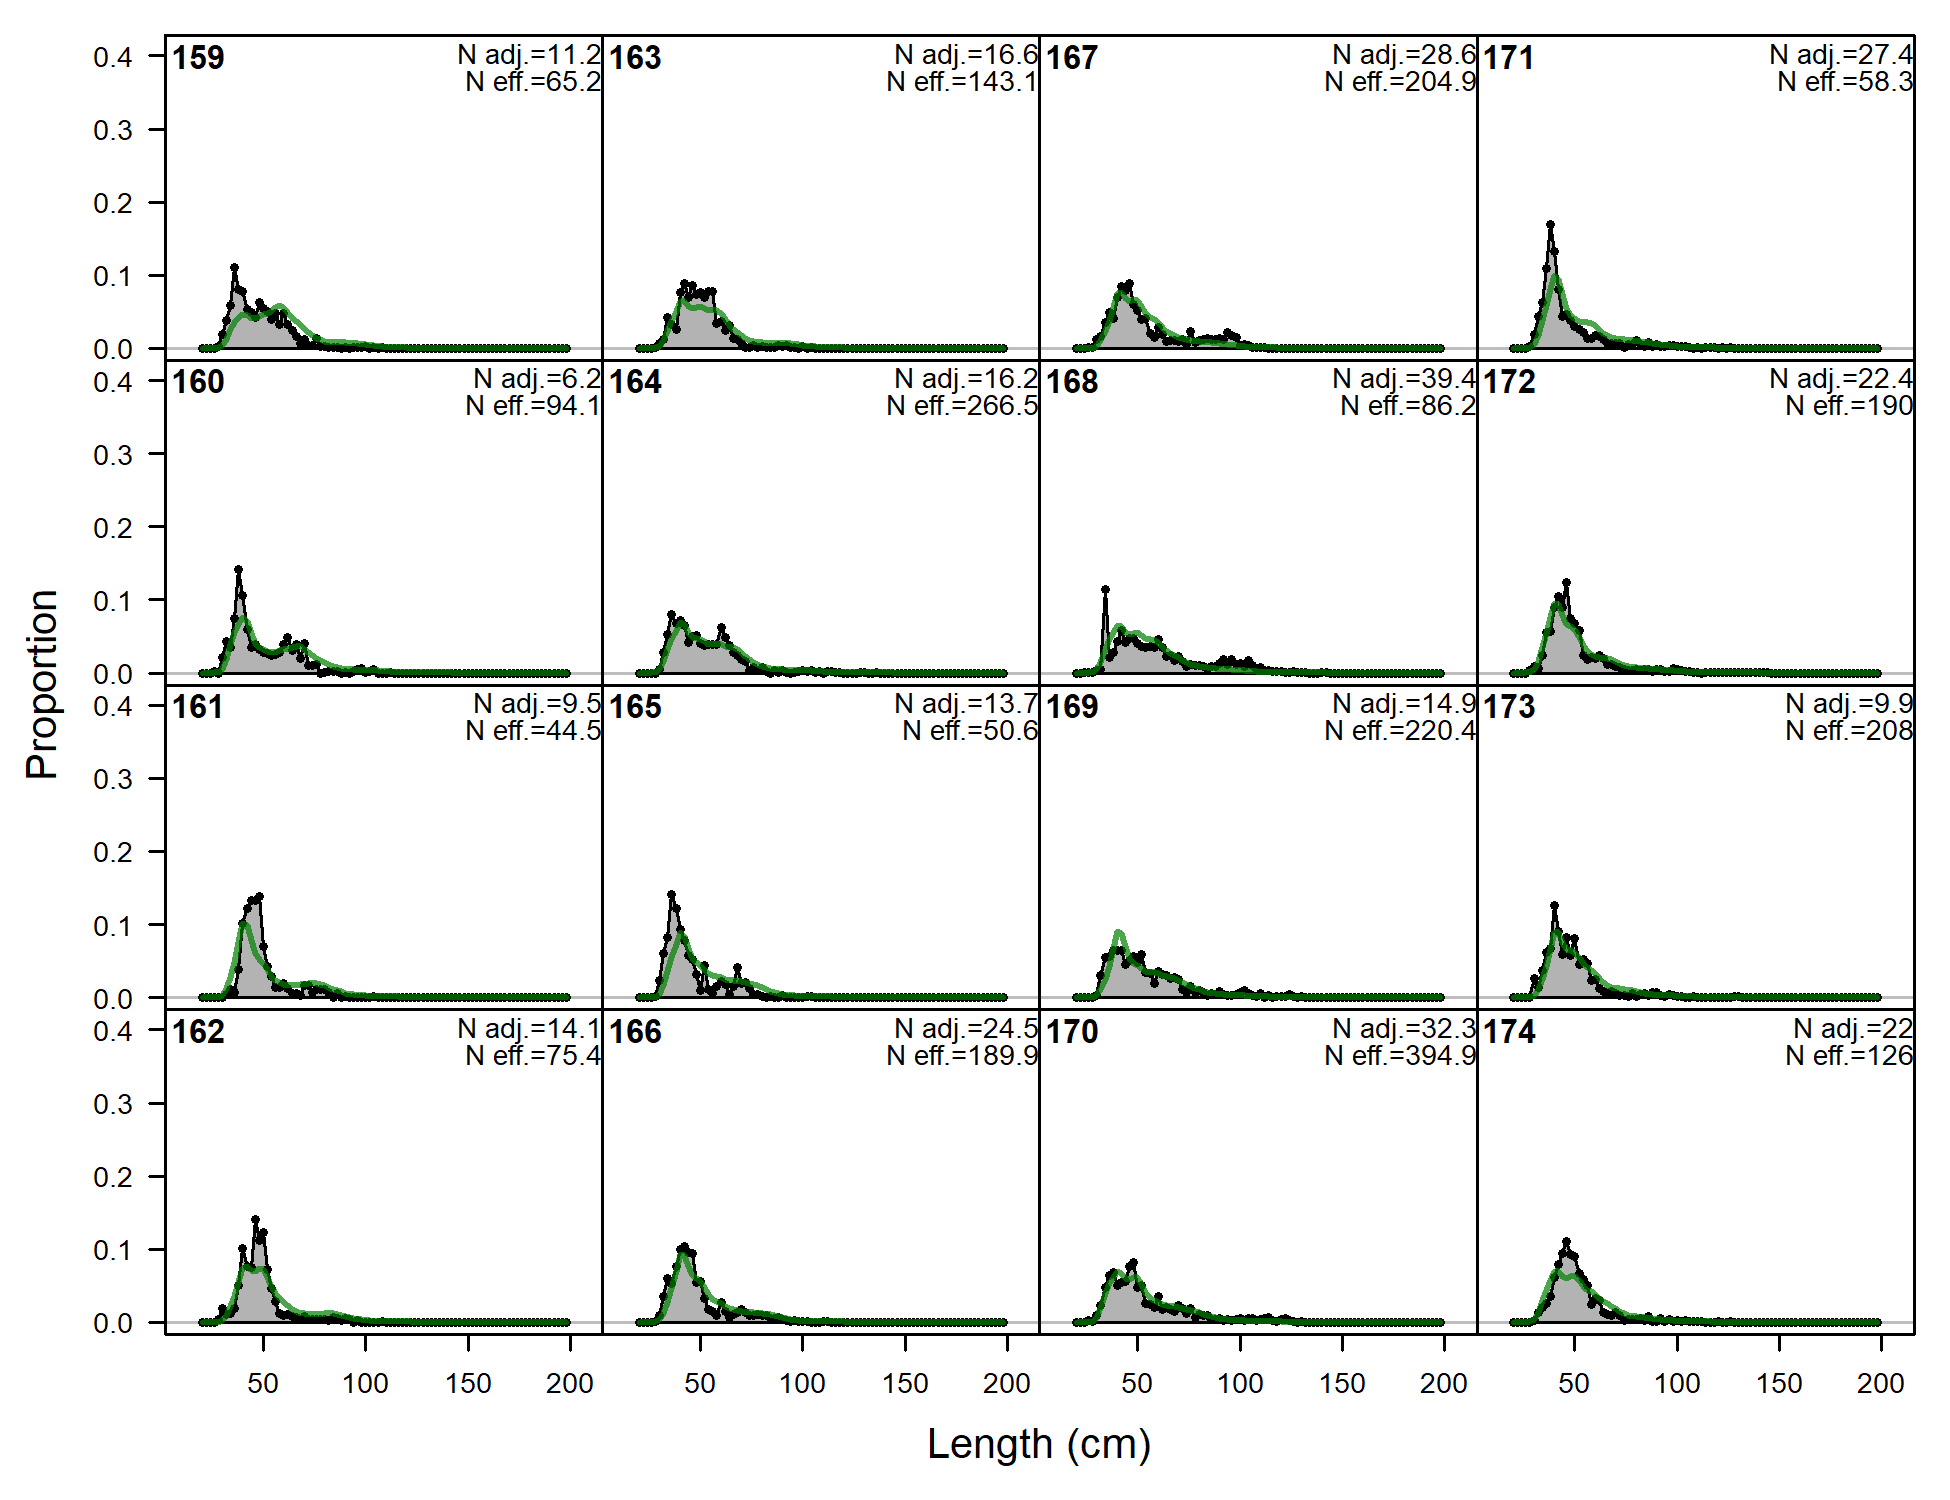
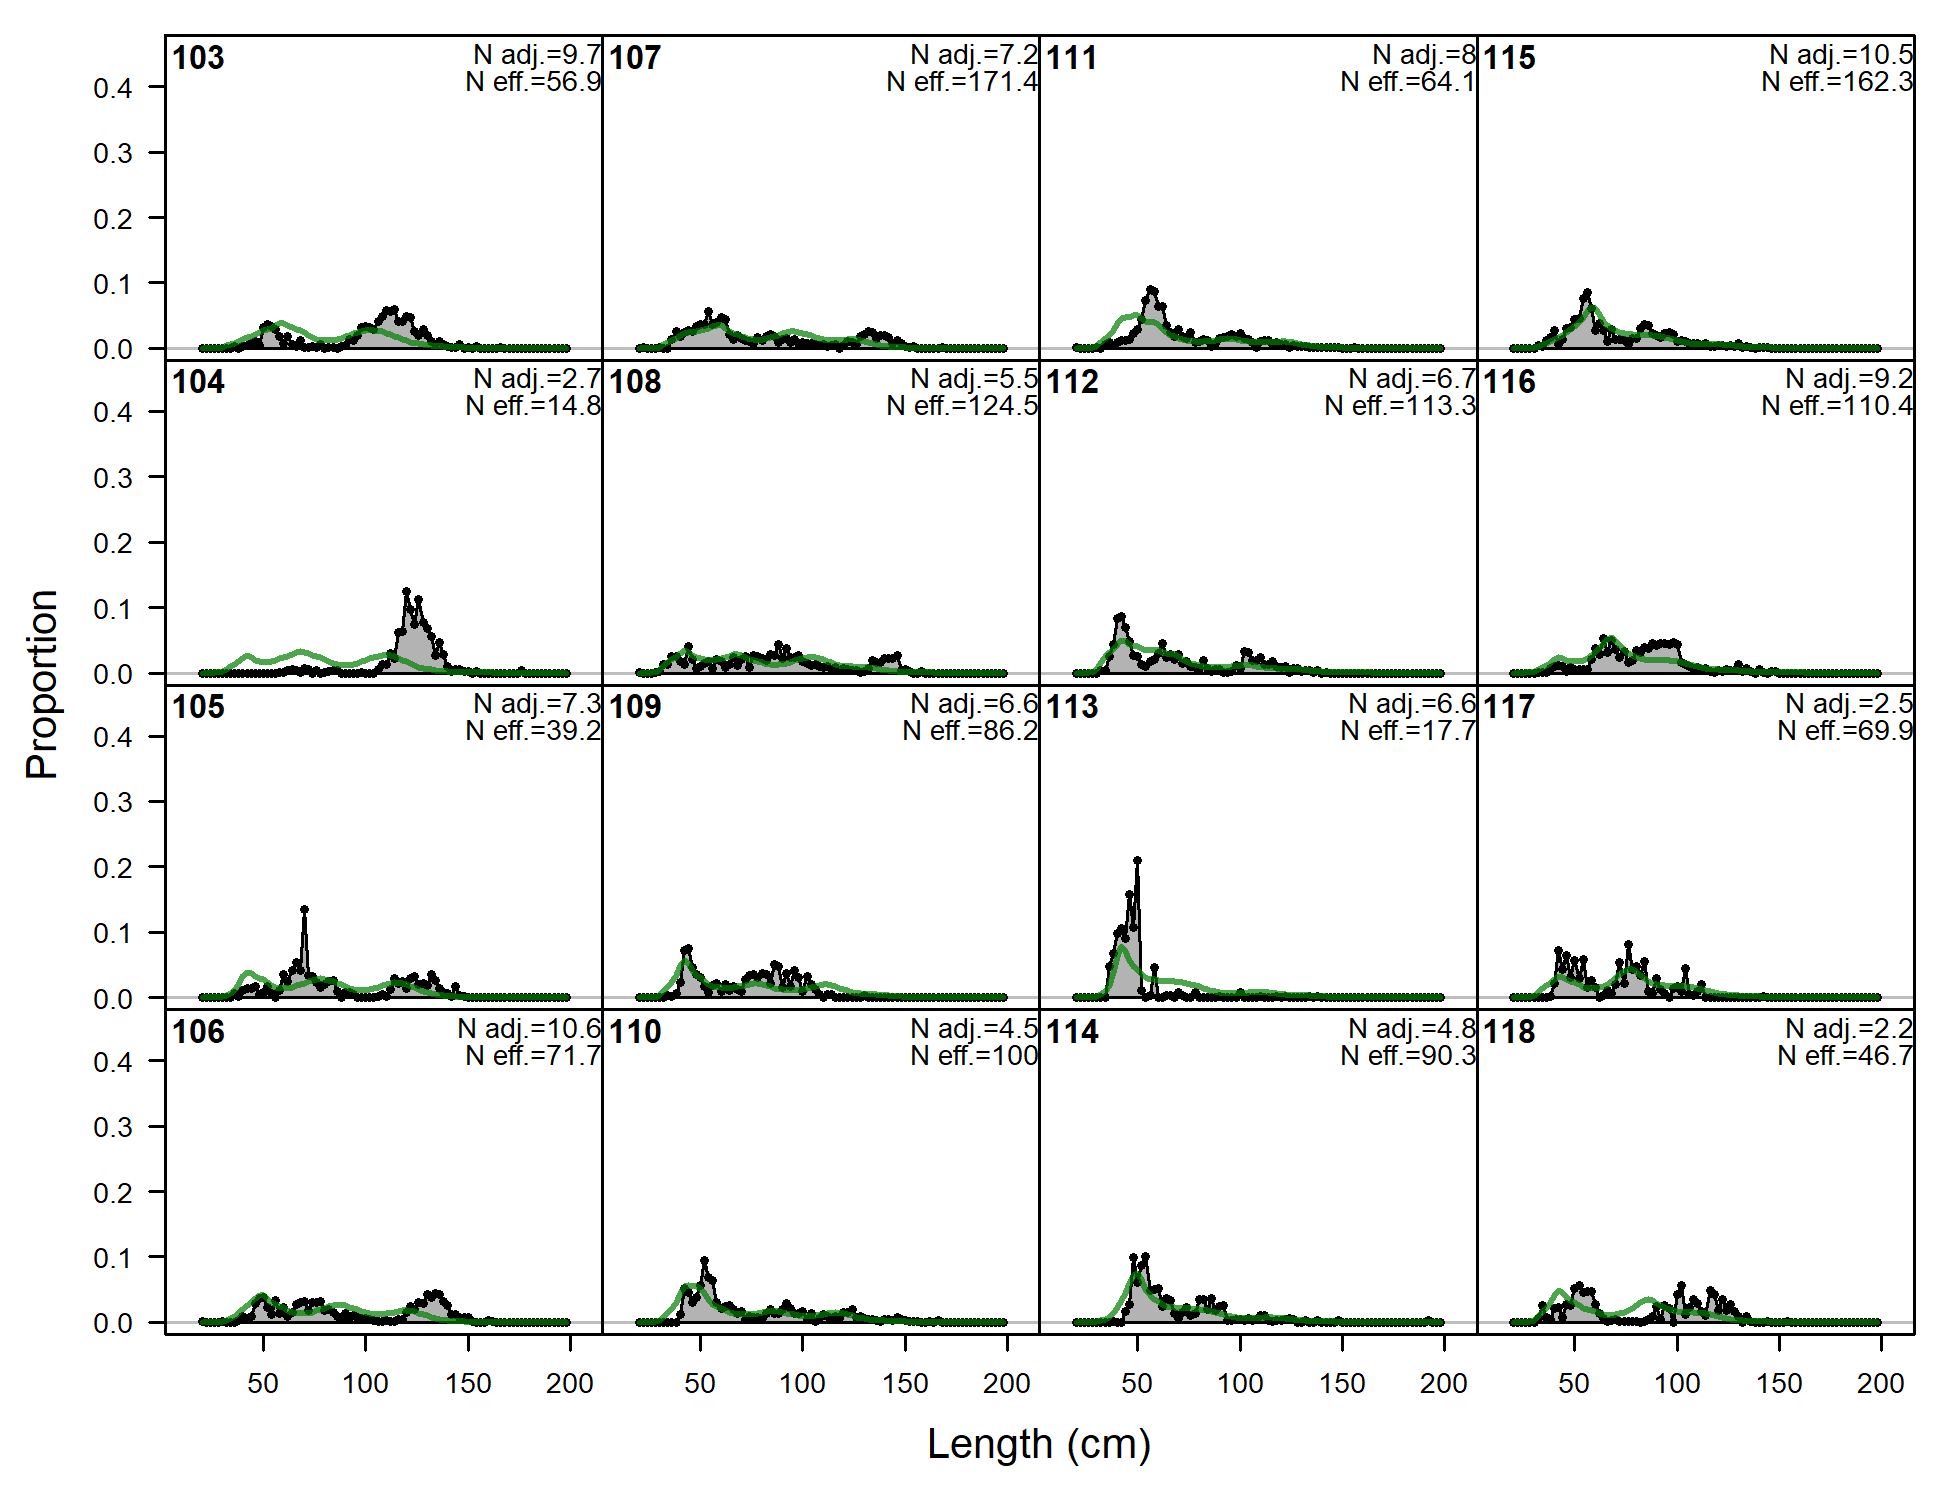
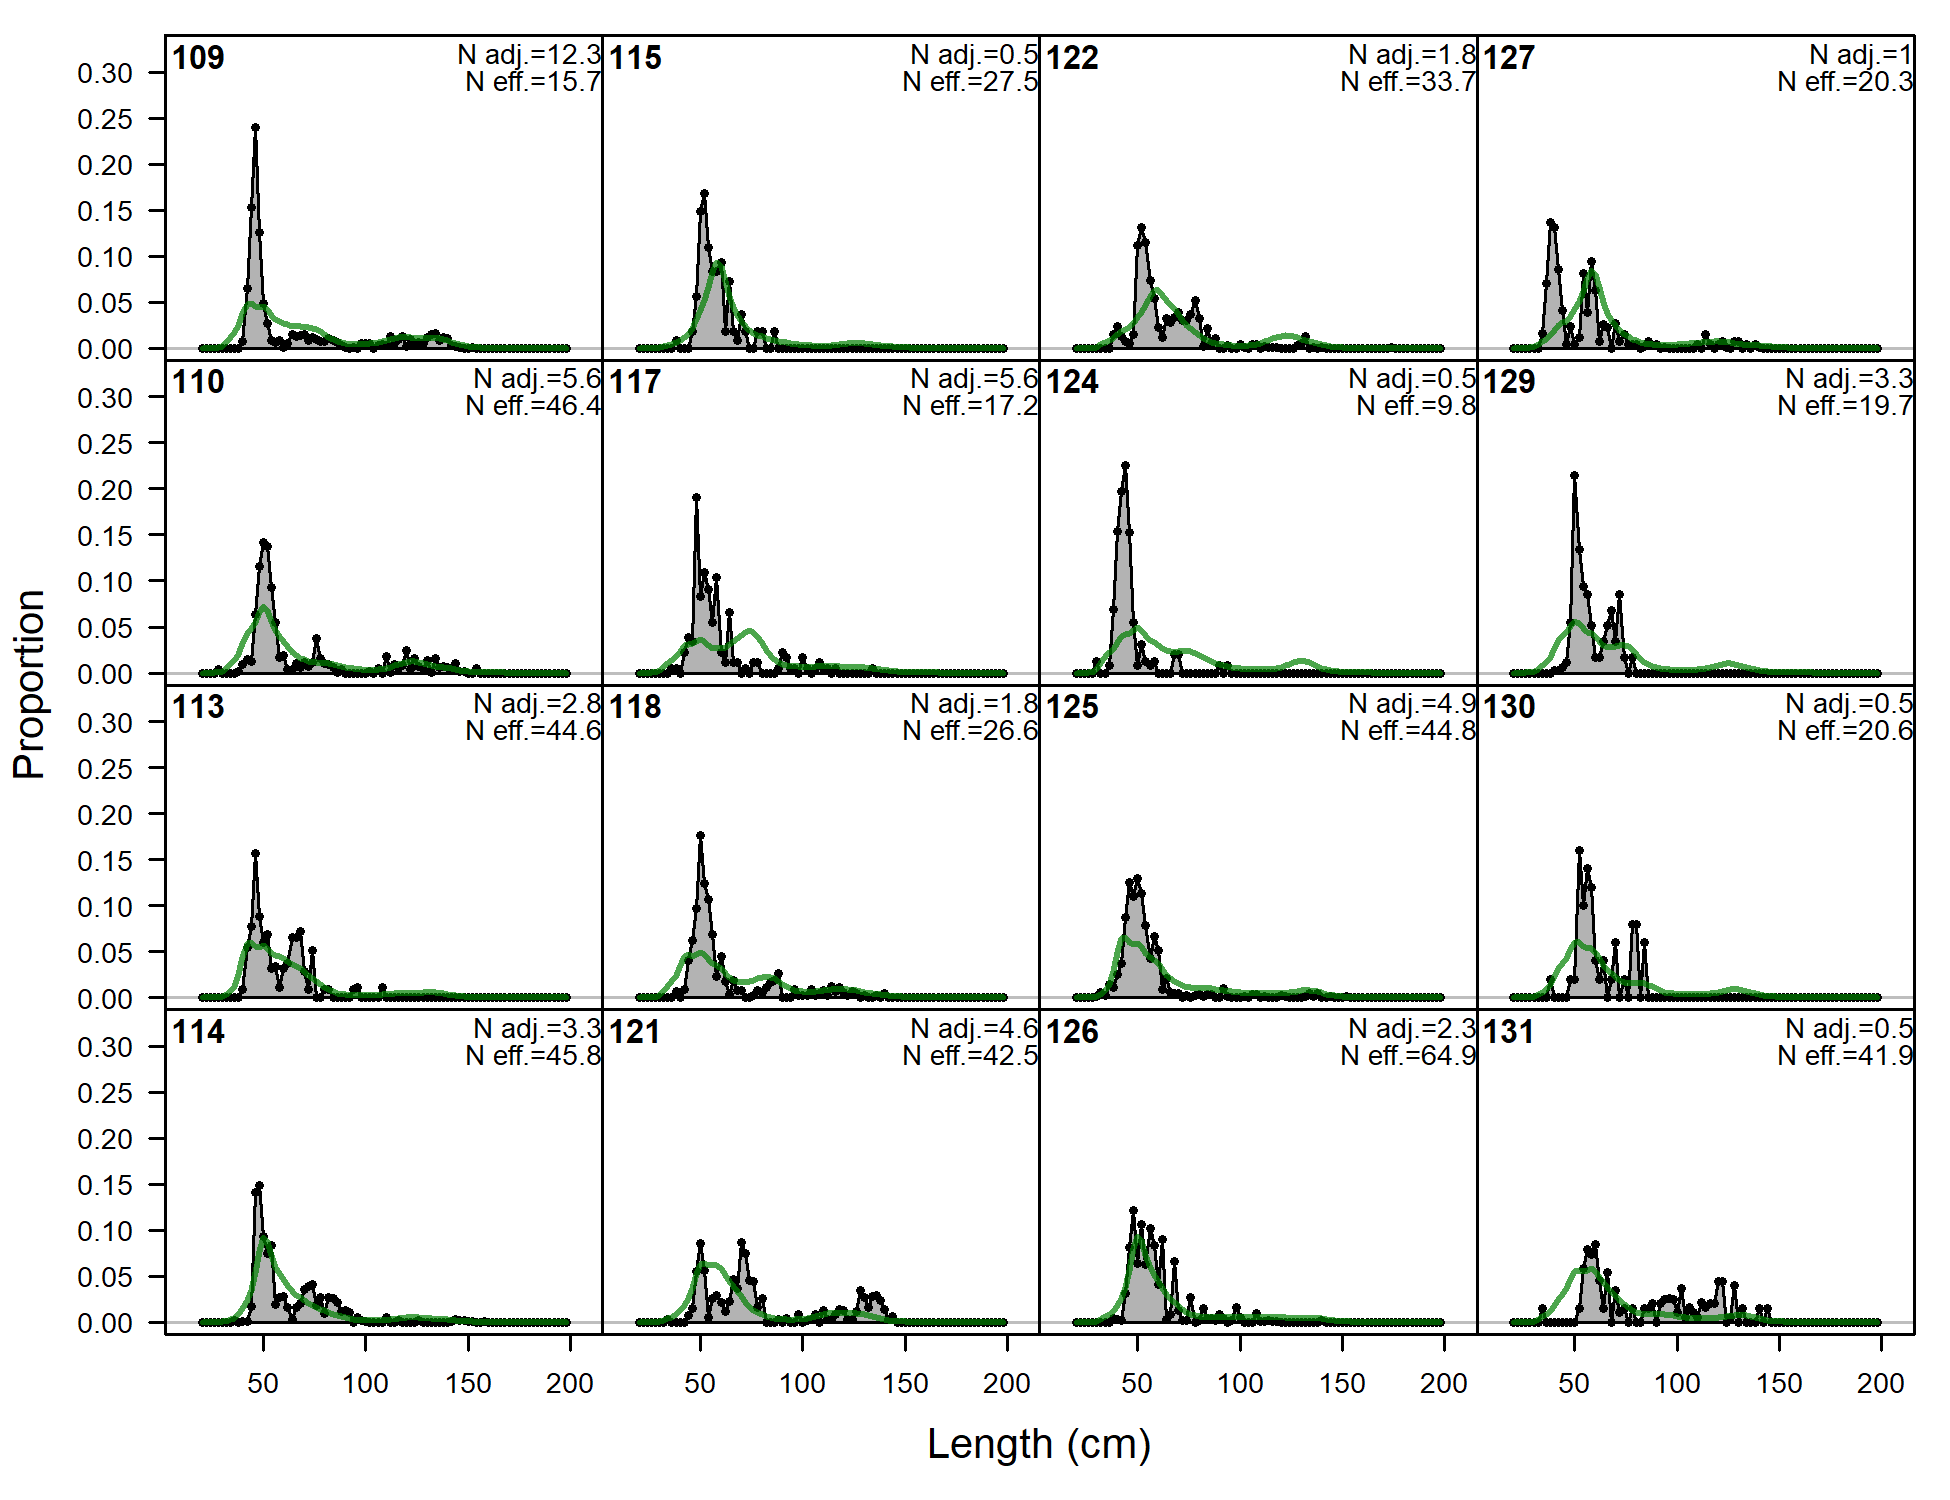
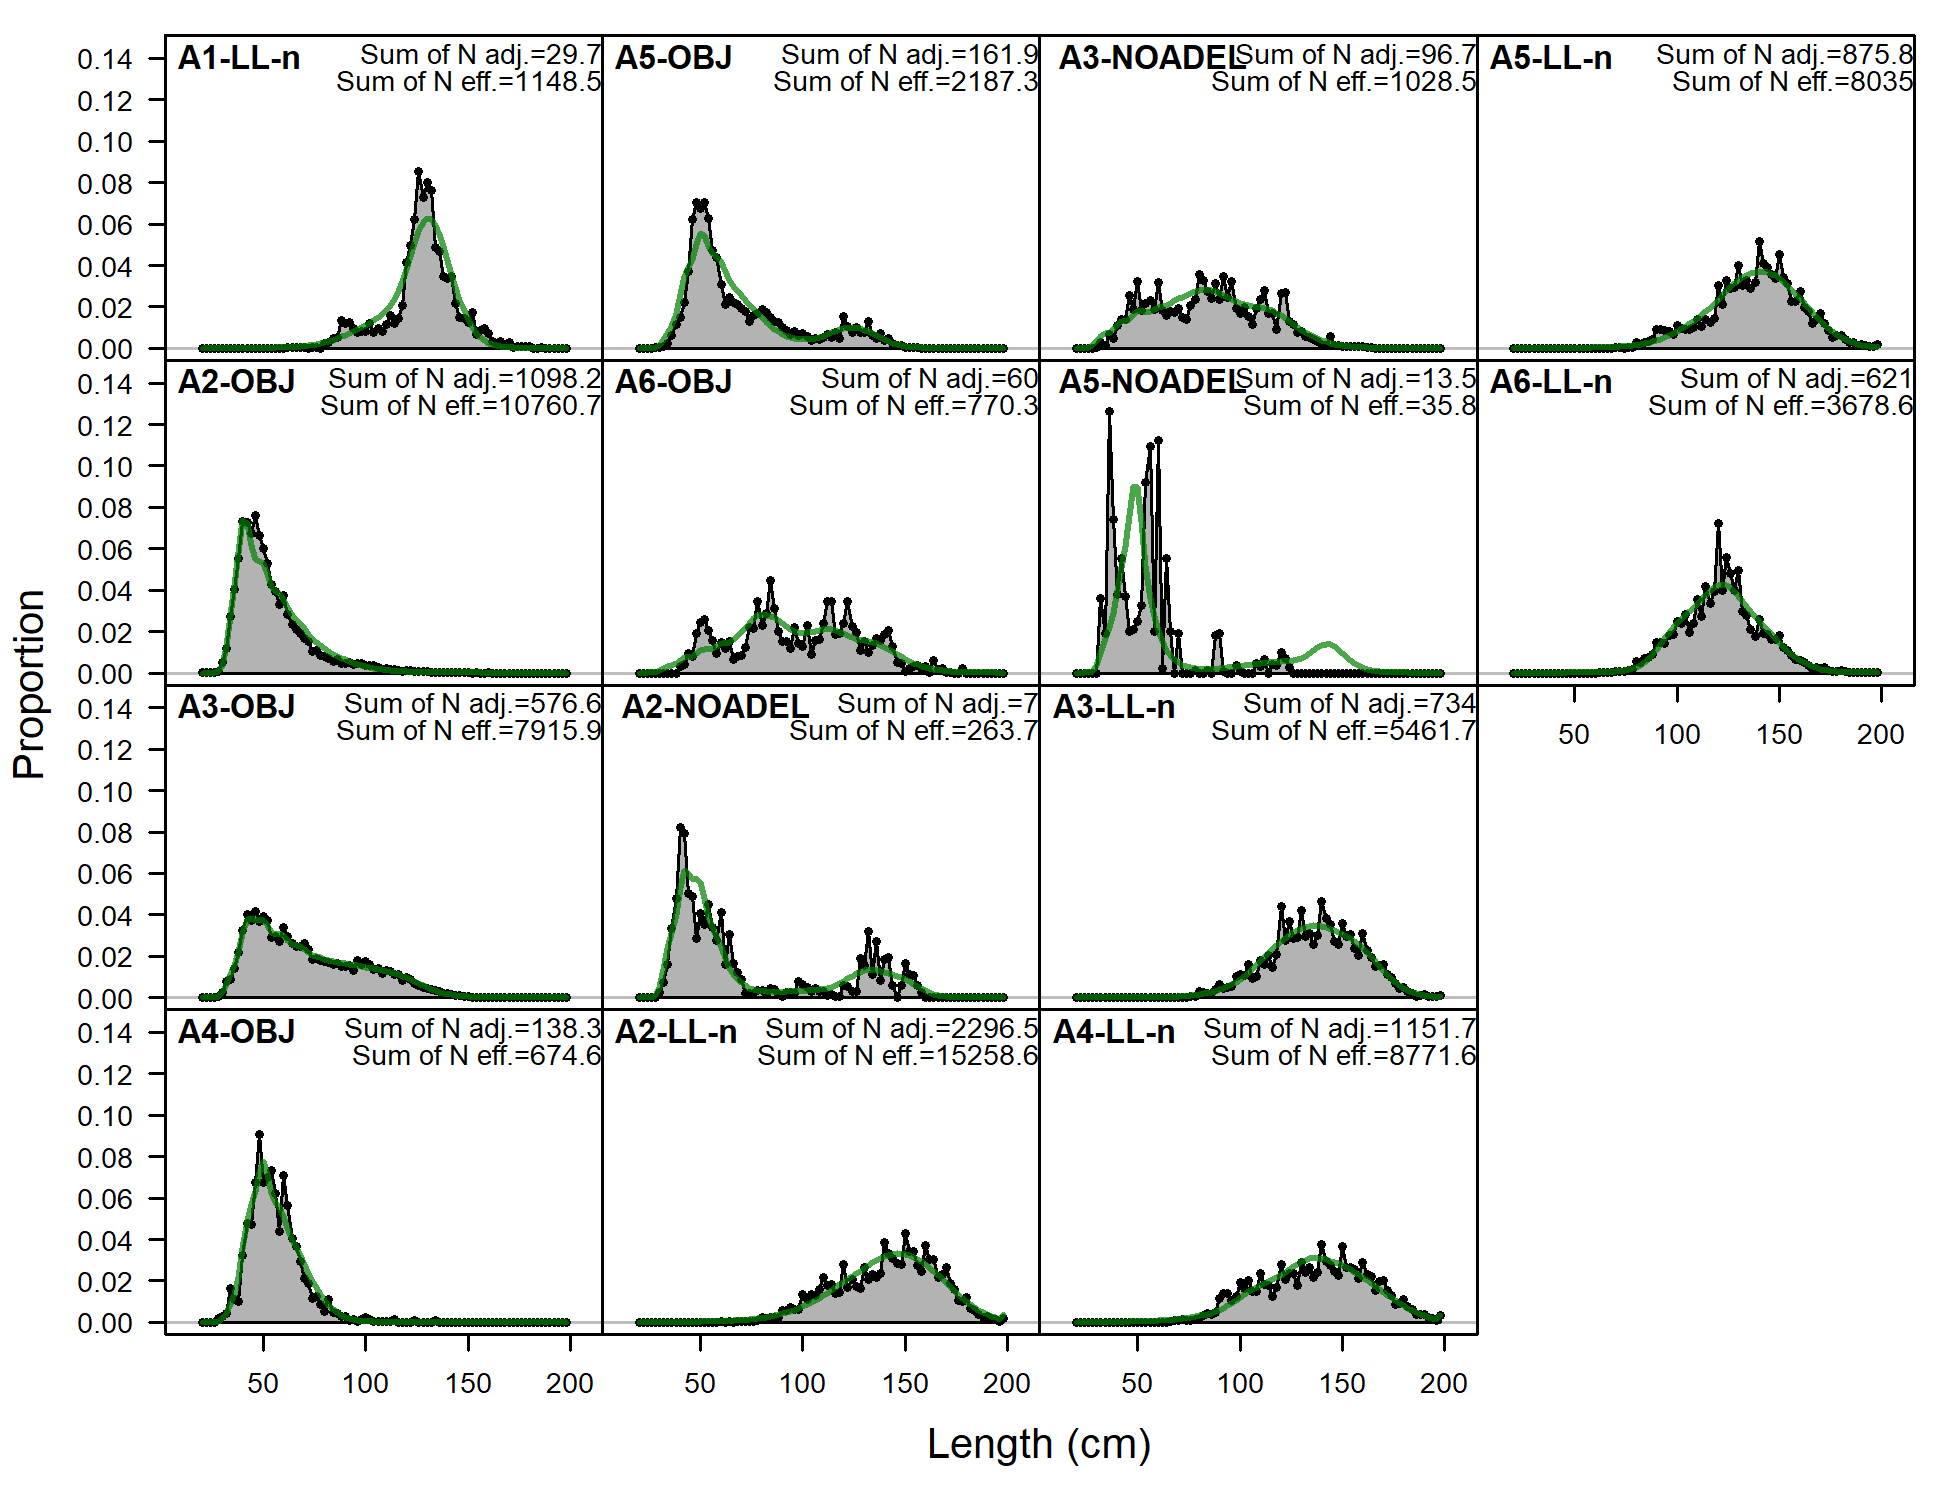
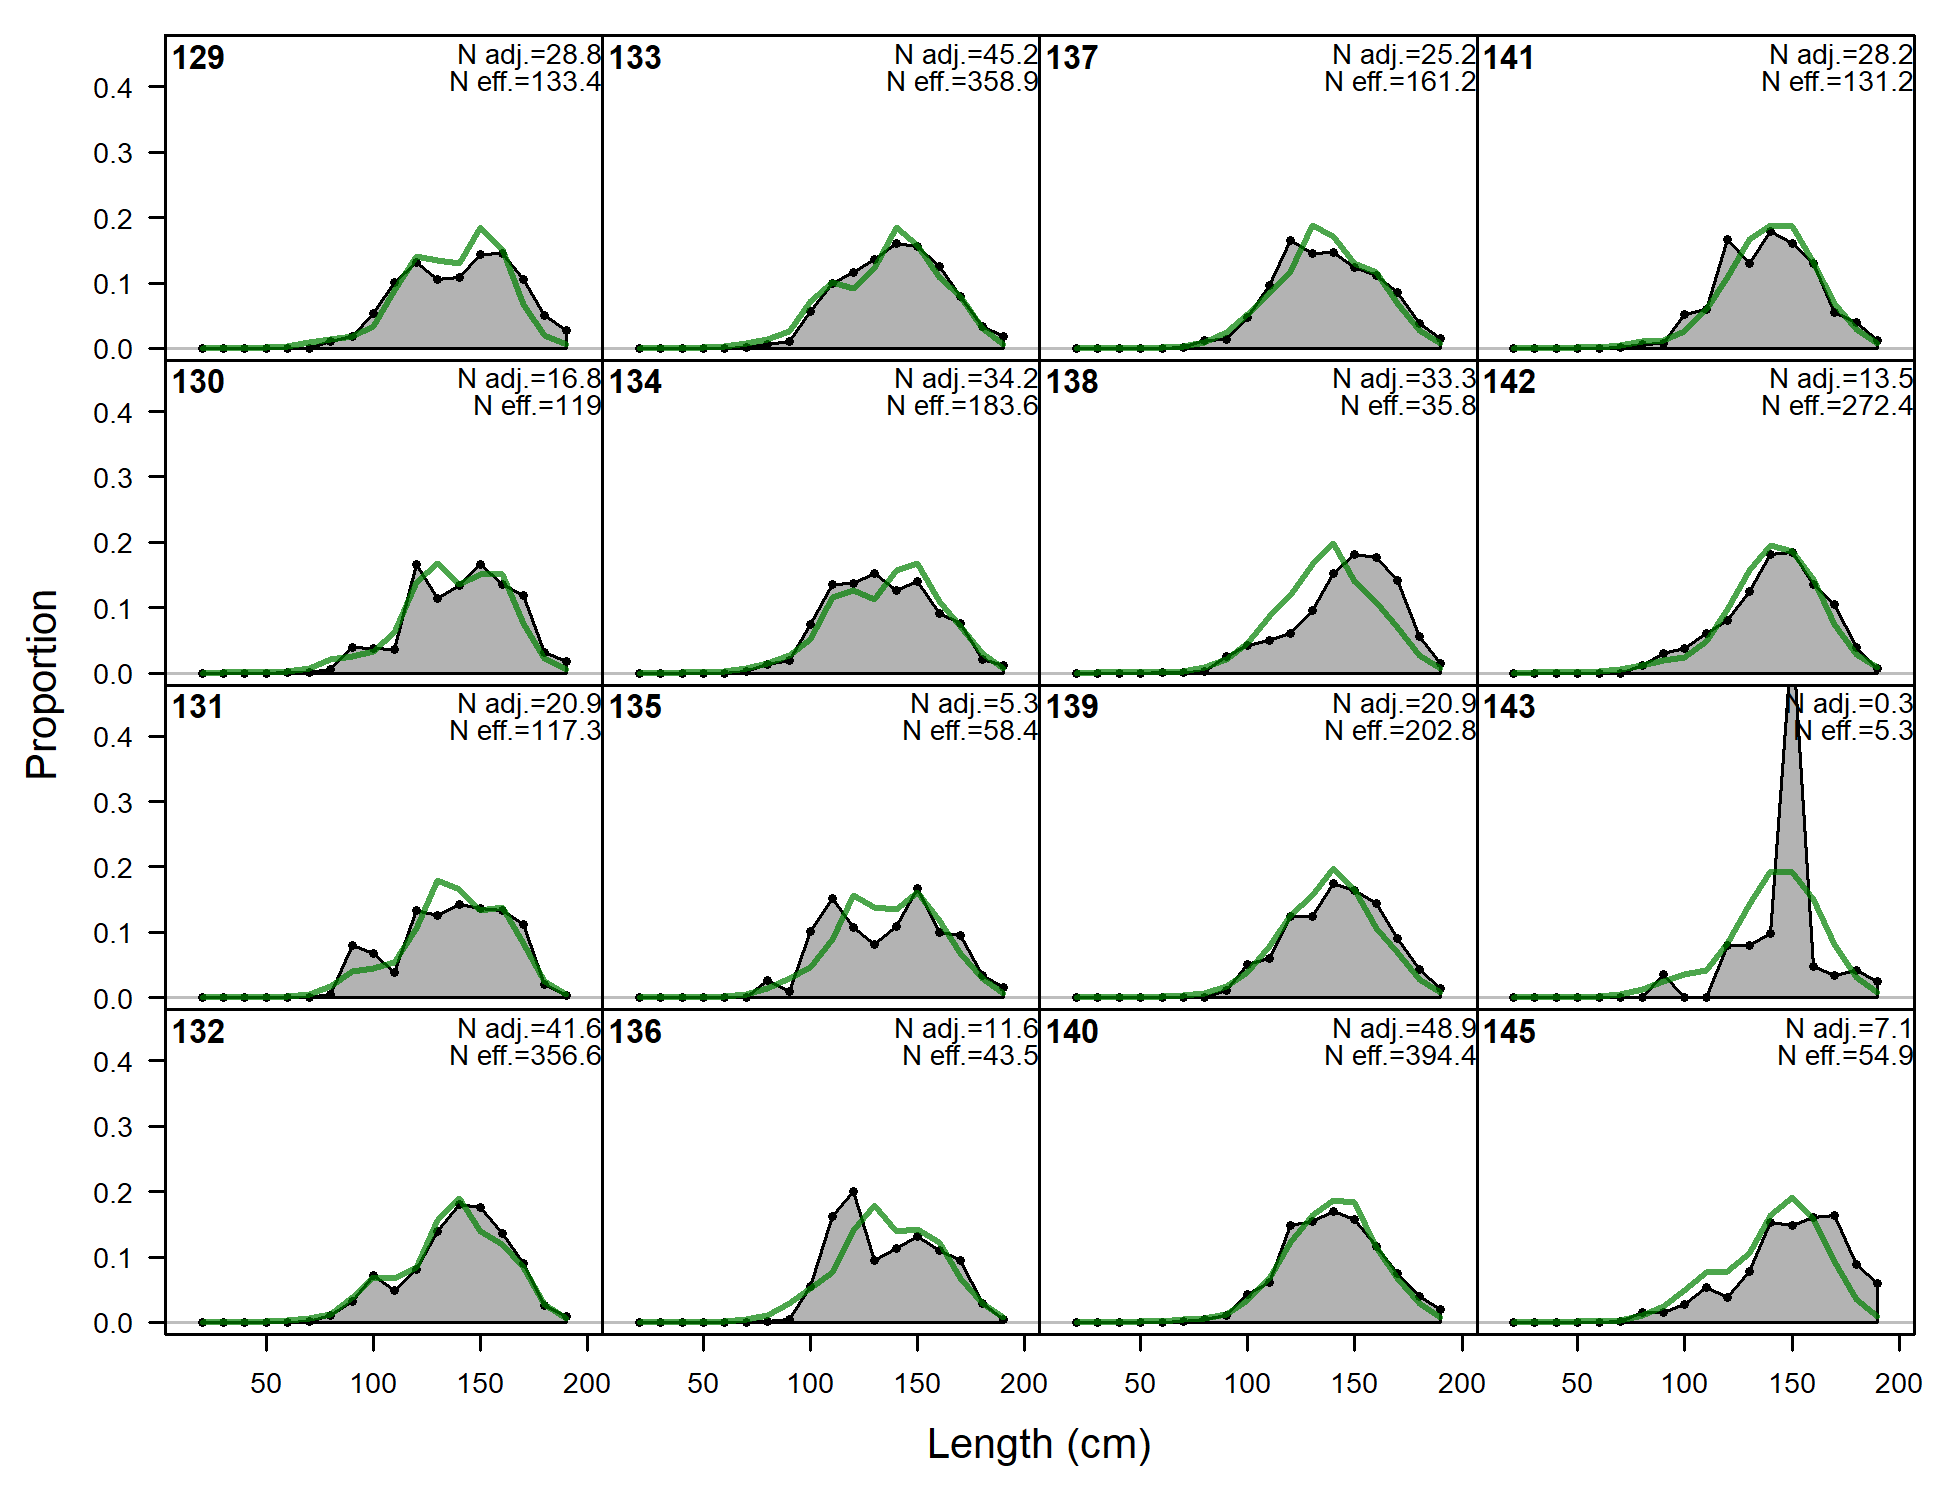
Length comps, whole catch, A1-LL-n (plot 1 of 2).
'N adj.' is the input sample size after data-weighting adjustment. N eff. is the calculated effective sample size used in the McAllister-Iannelli tuning method.
file: comp_lenfit_flt1mkt0_page1.png
Length comps, whole catch, A1-LL-n (plot 1 of 2).
'N adj.' is the input sample size after data-weighting adjustment. N eff. is the calculated effective sample size used in the McAllister-Iannelli tuning method.
file: comp_lenfit_flt1mkt0_page1.png

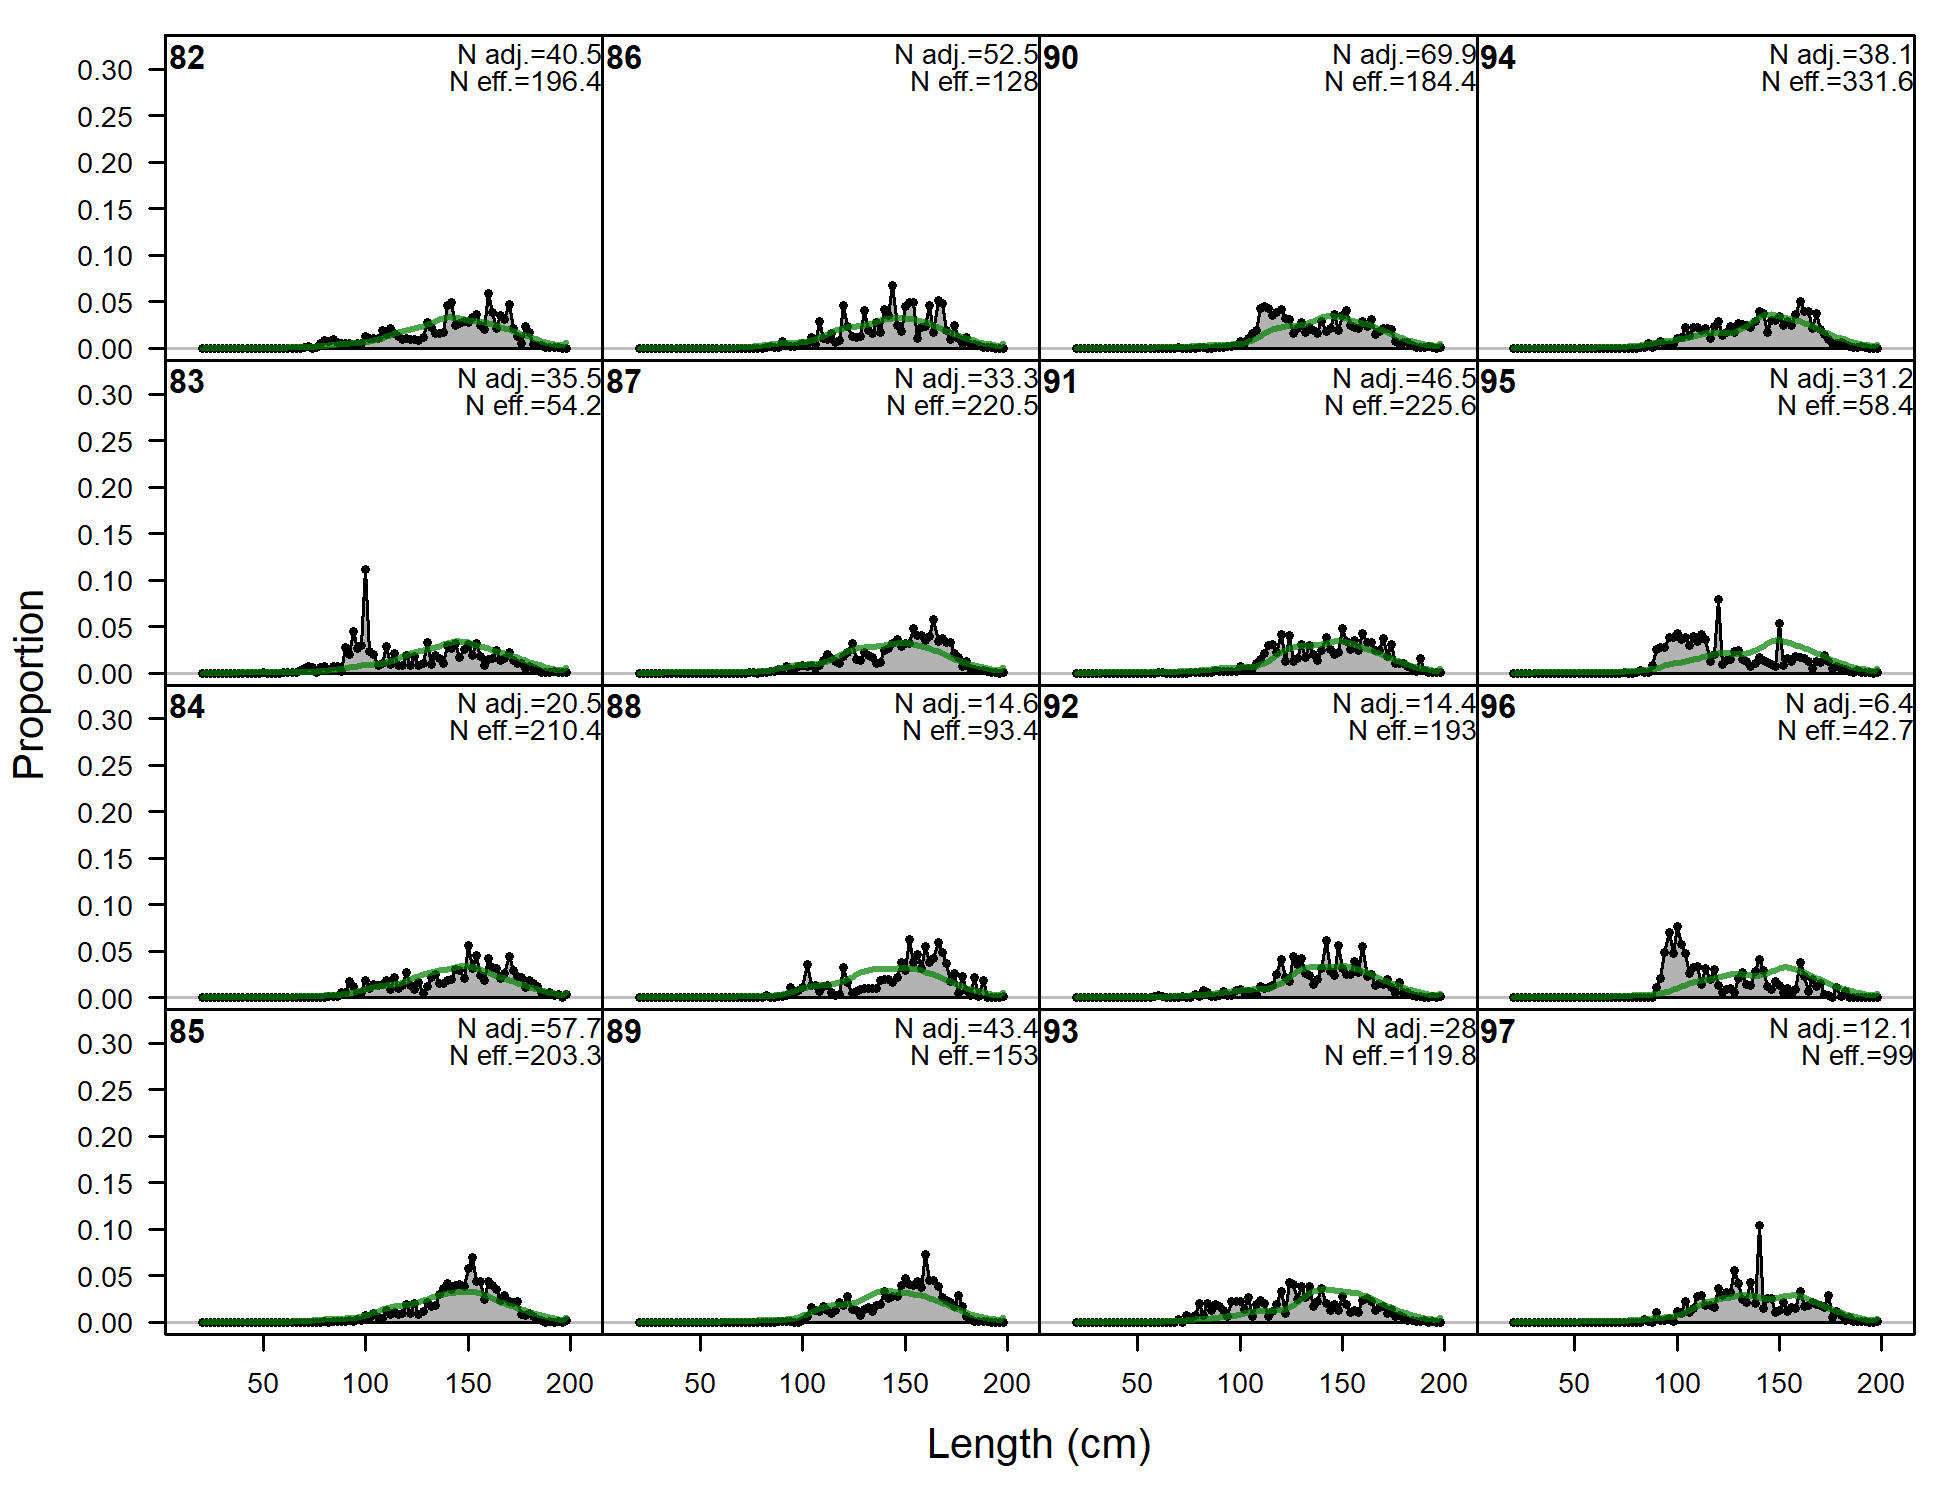
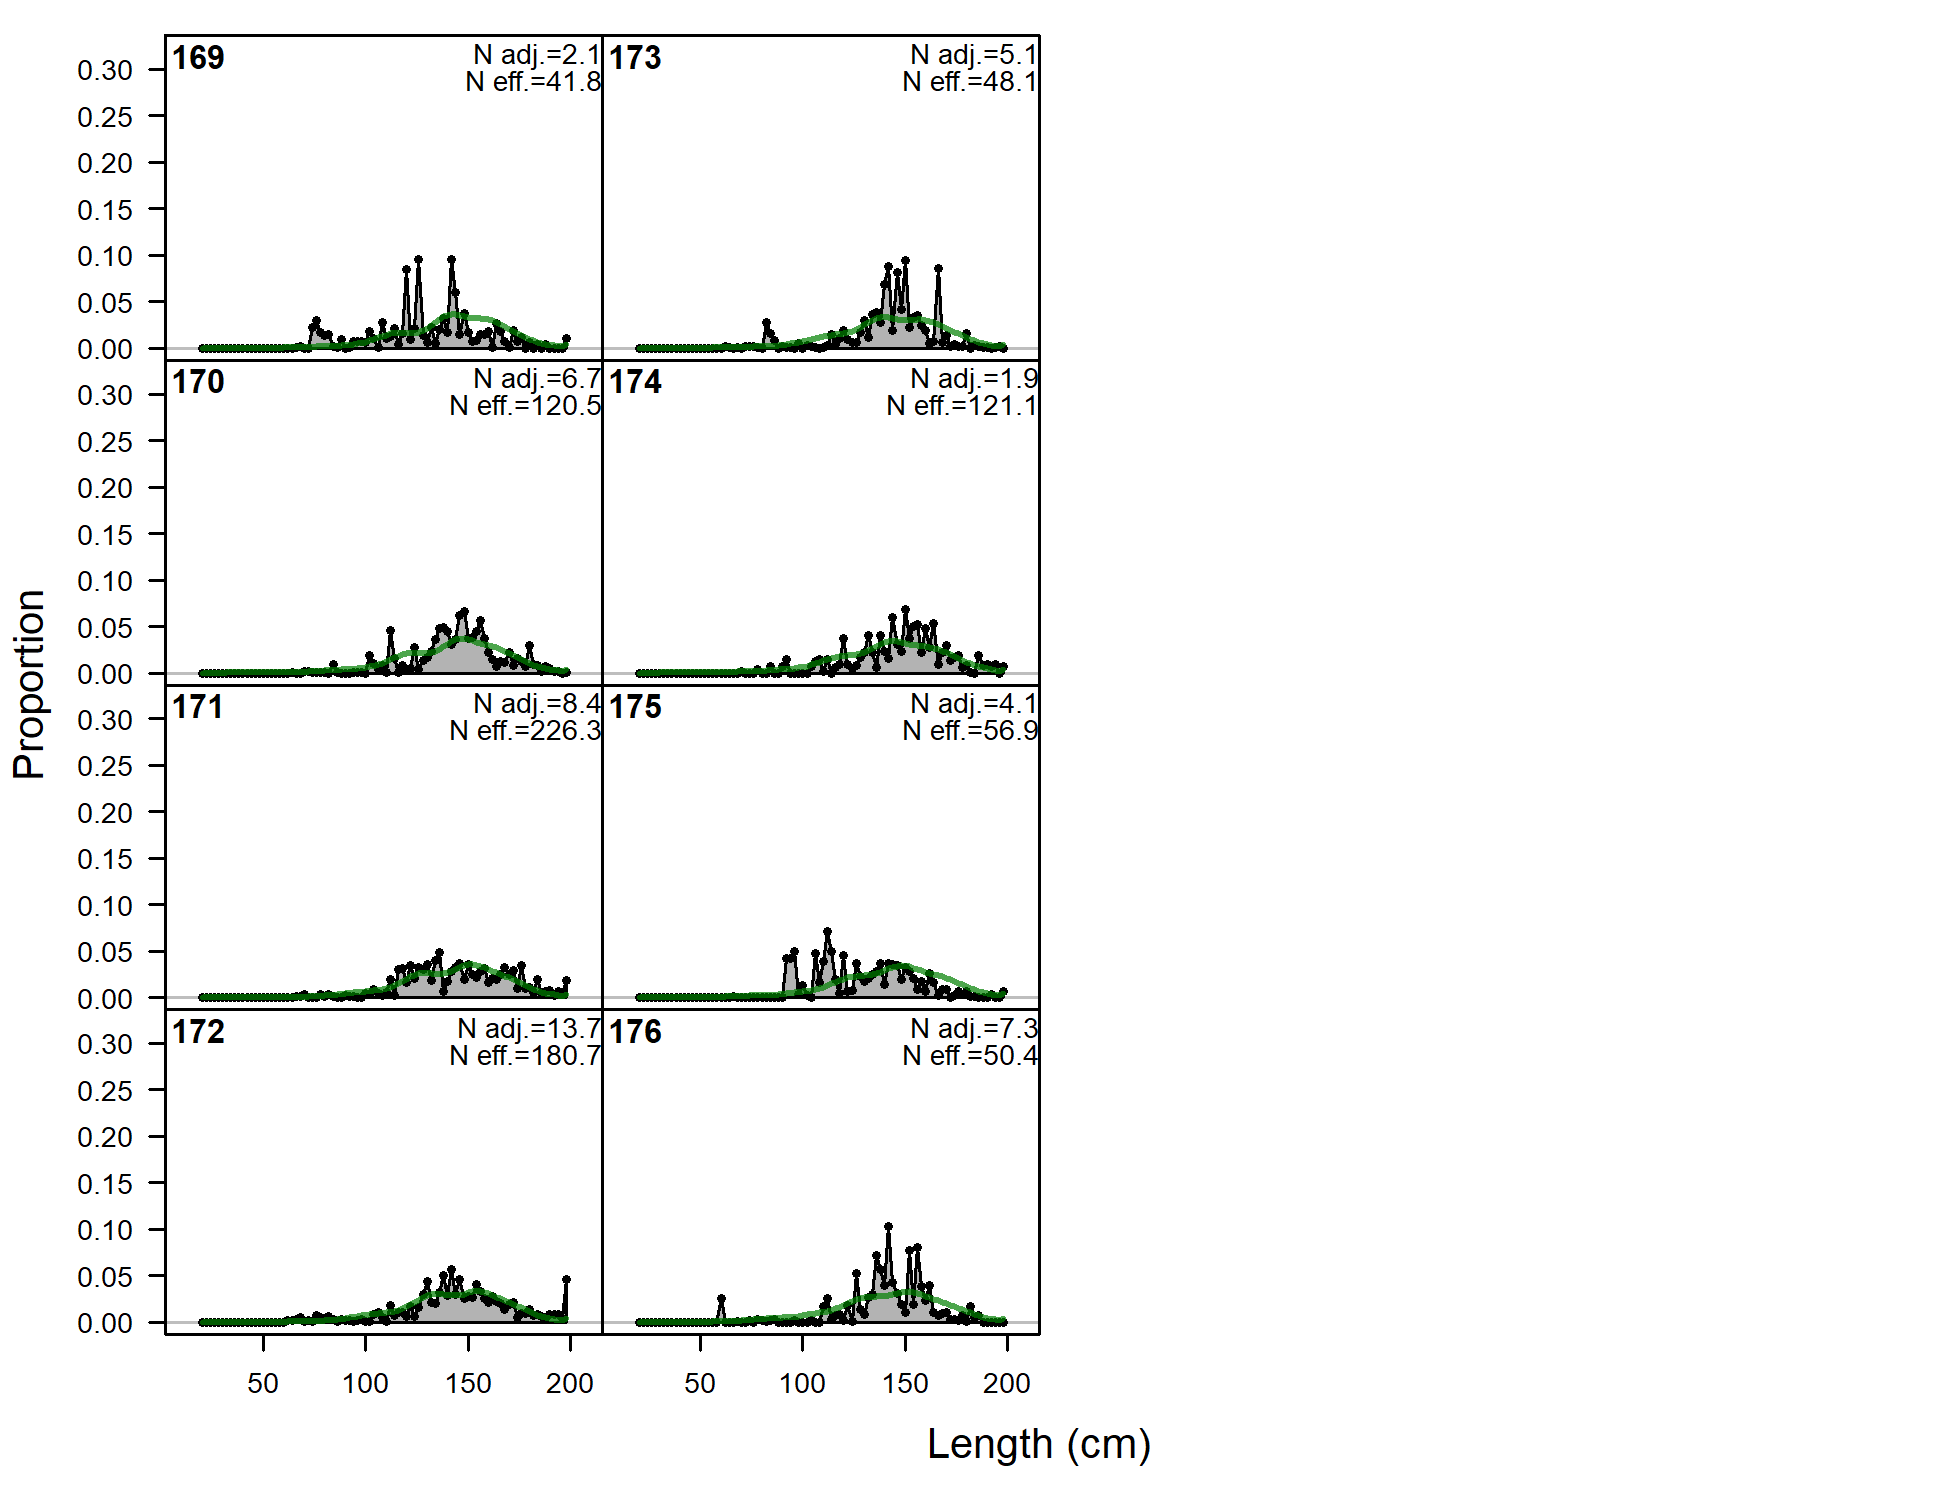
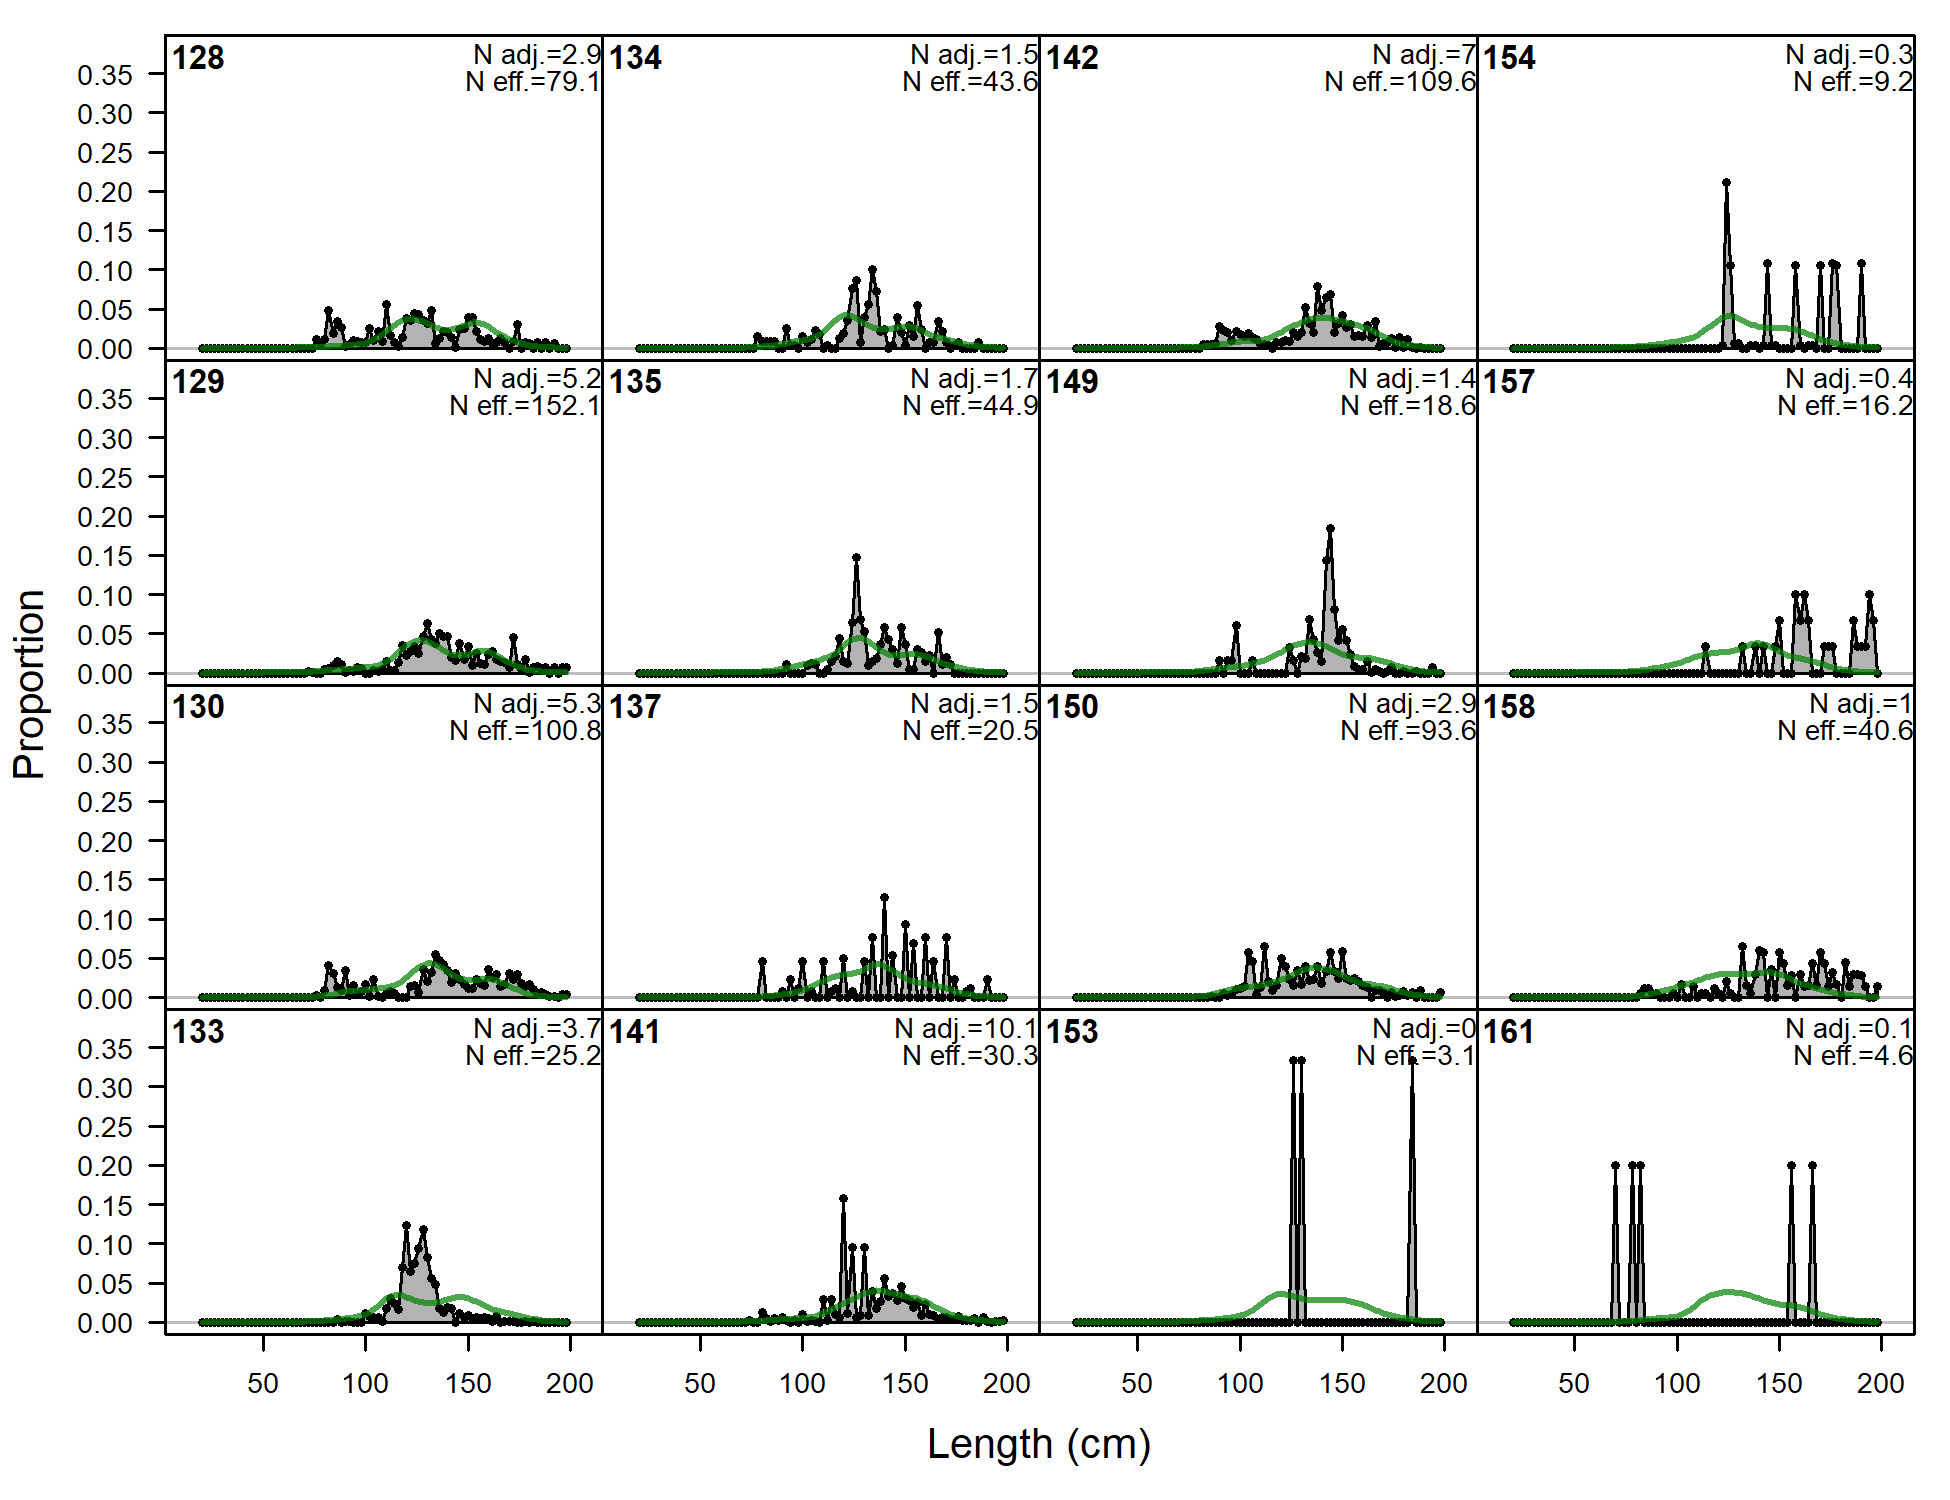
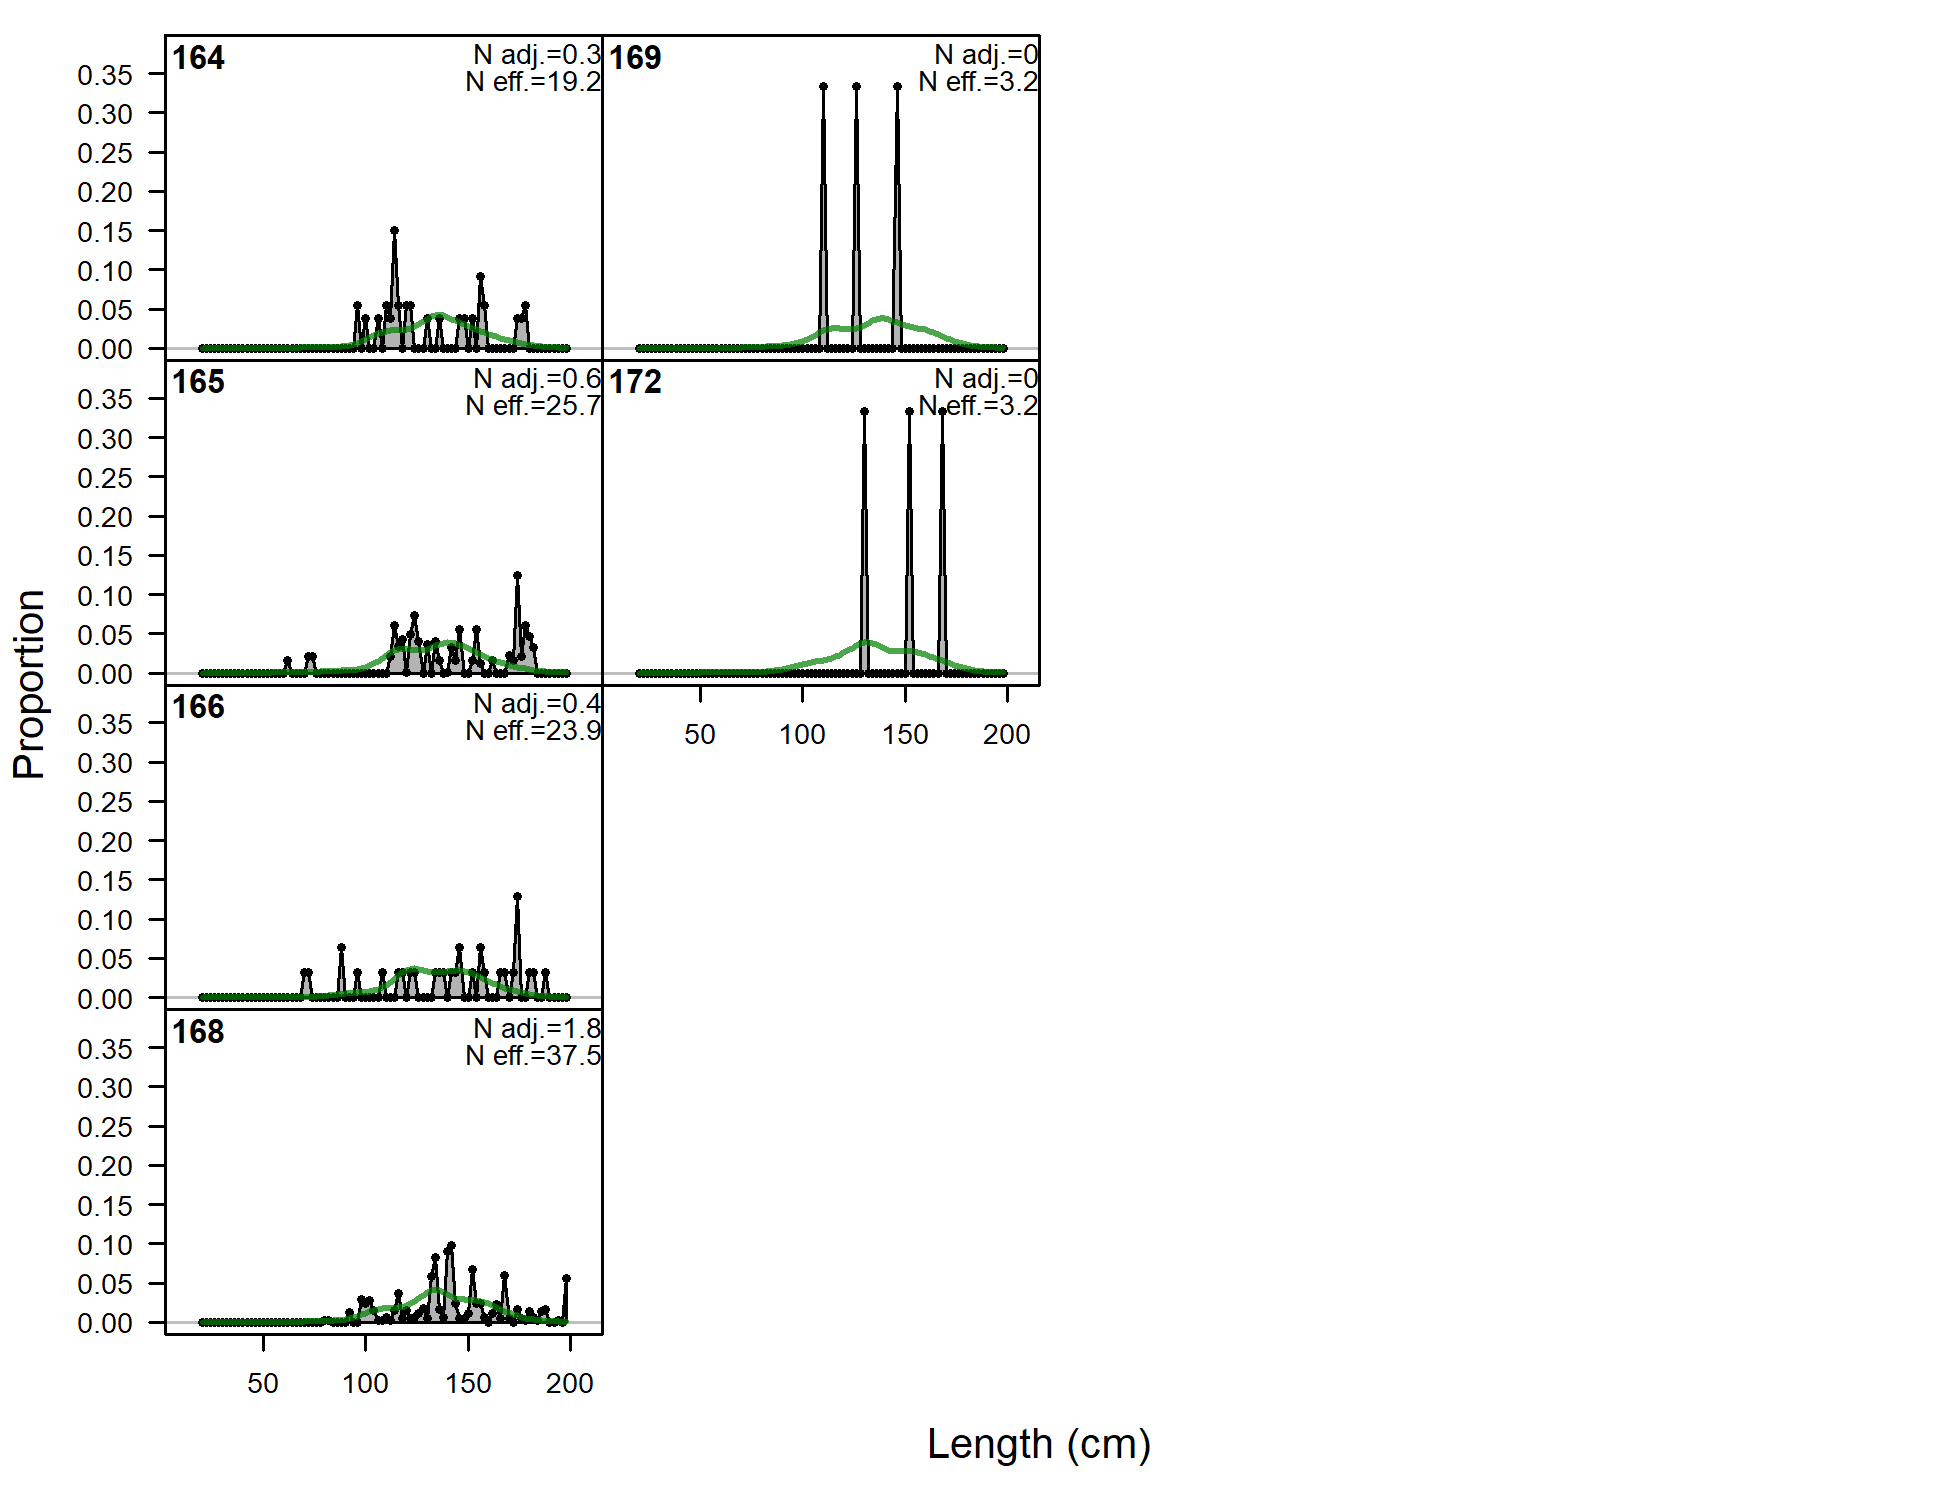
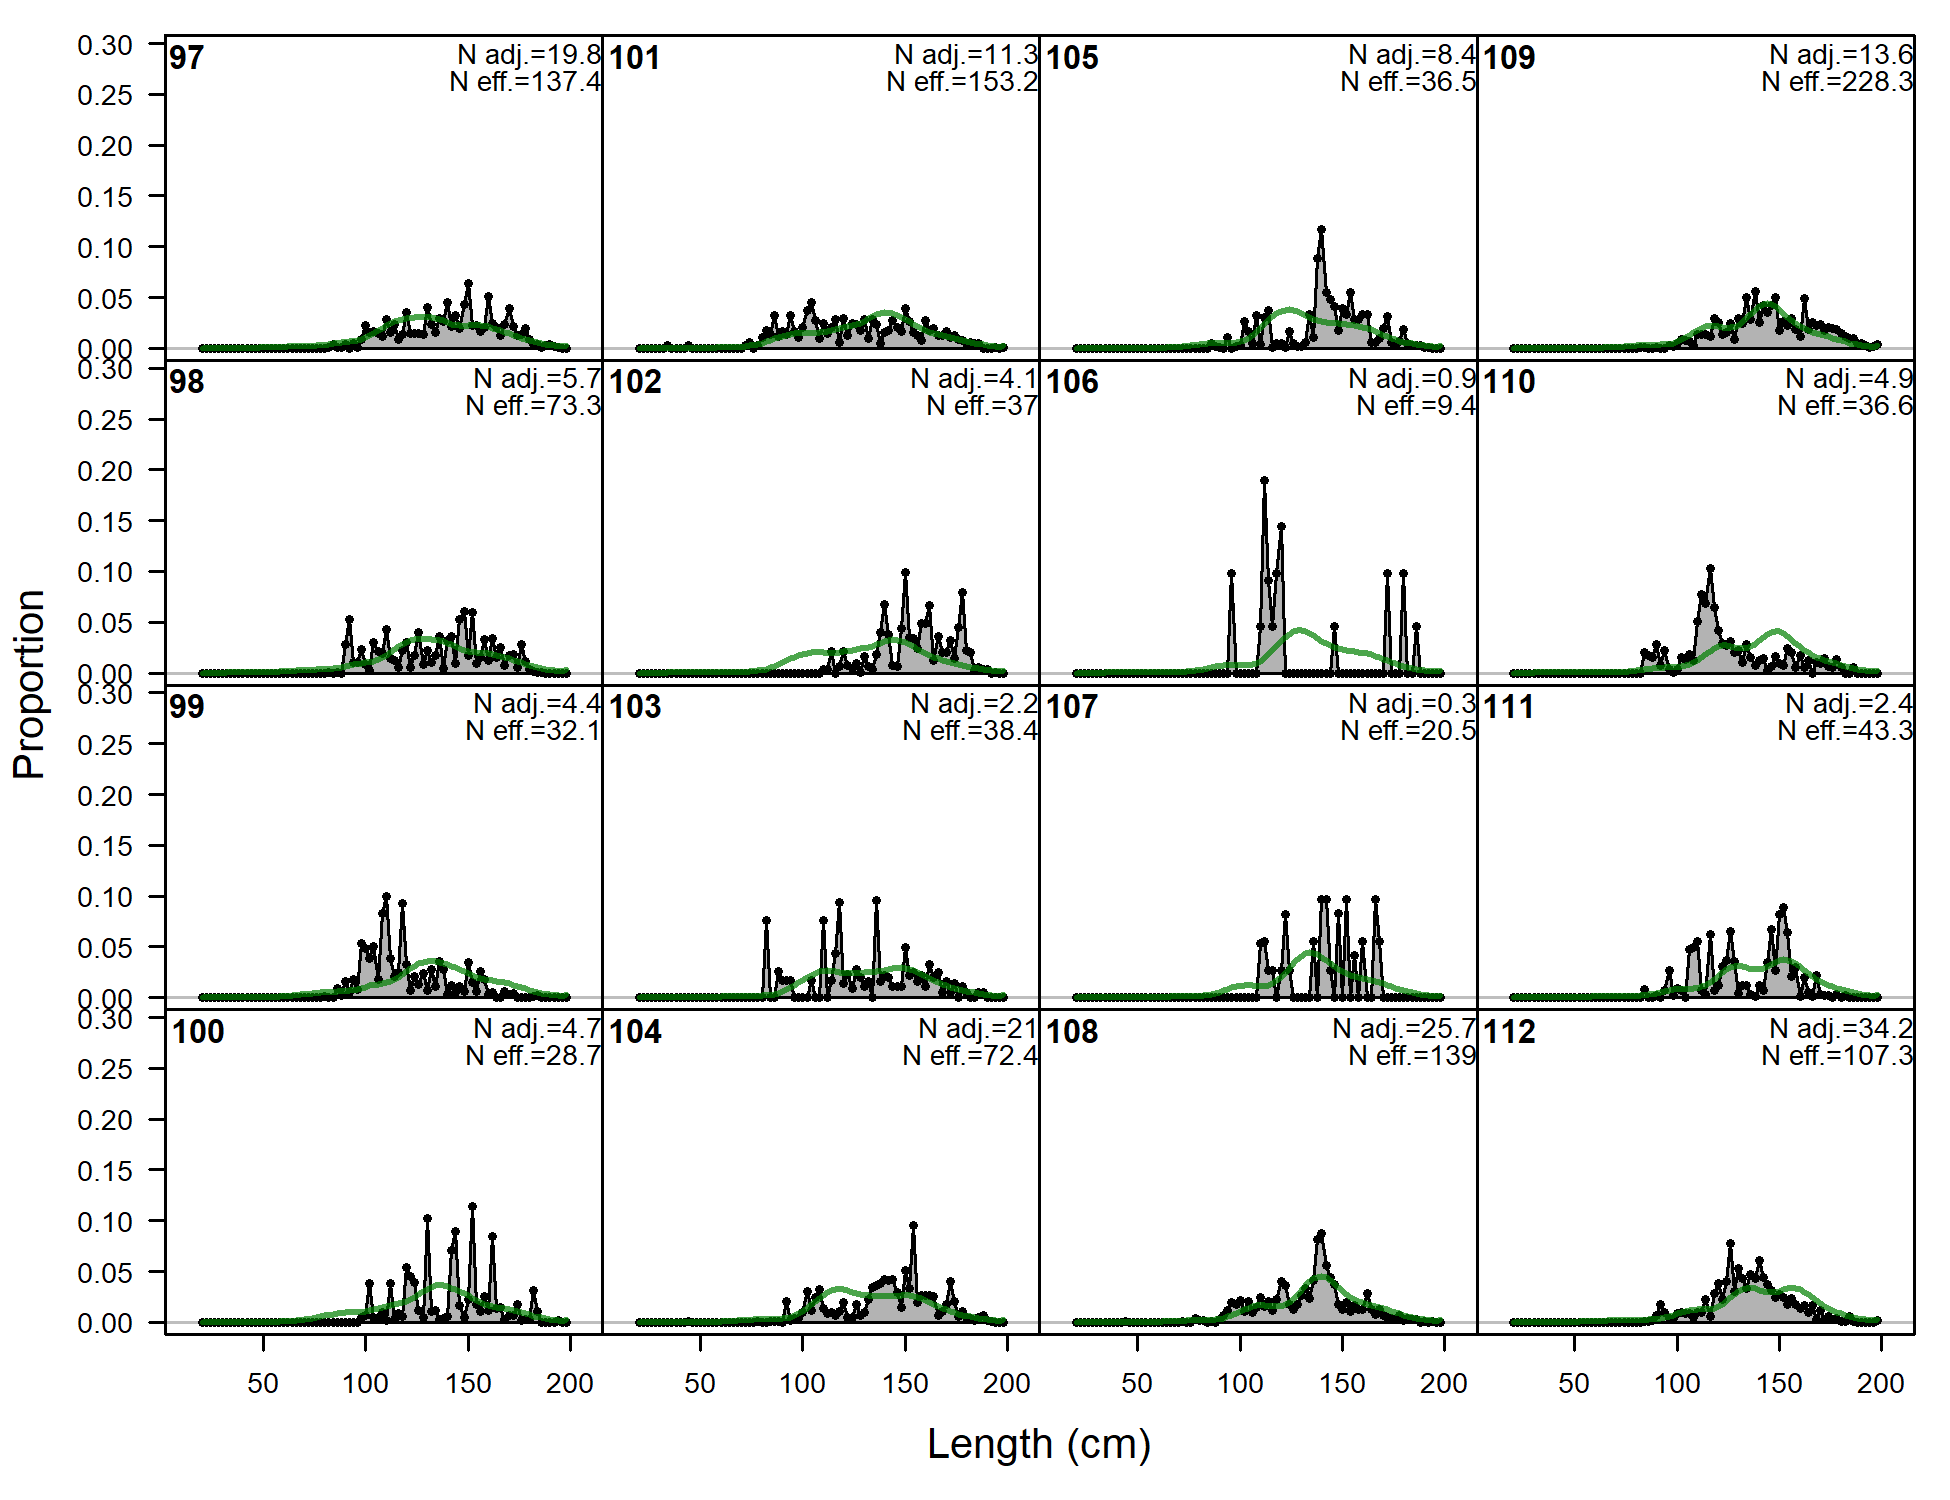
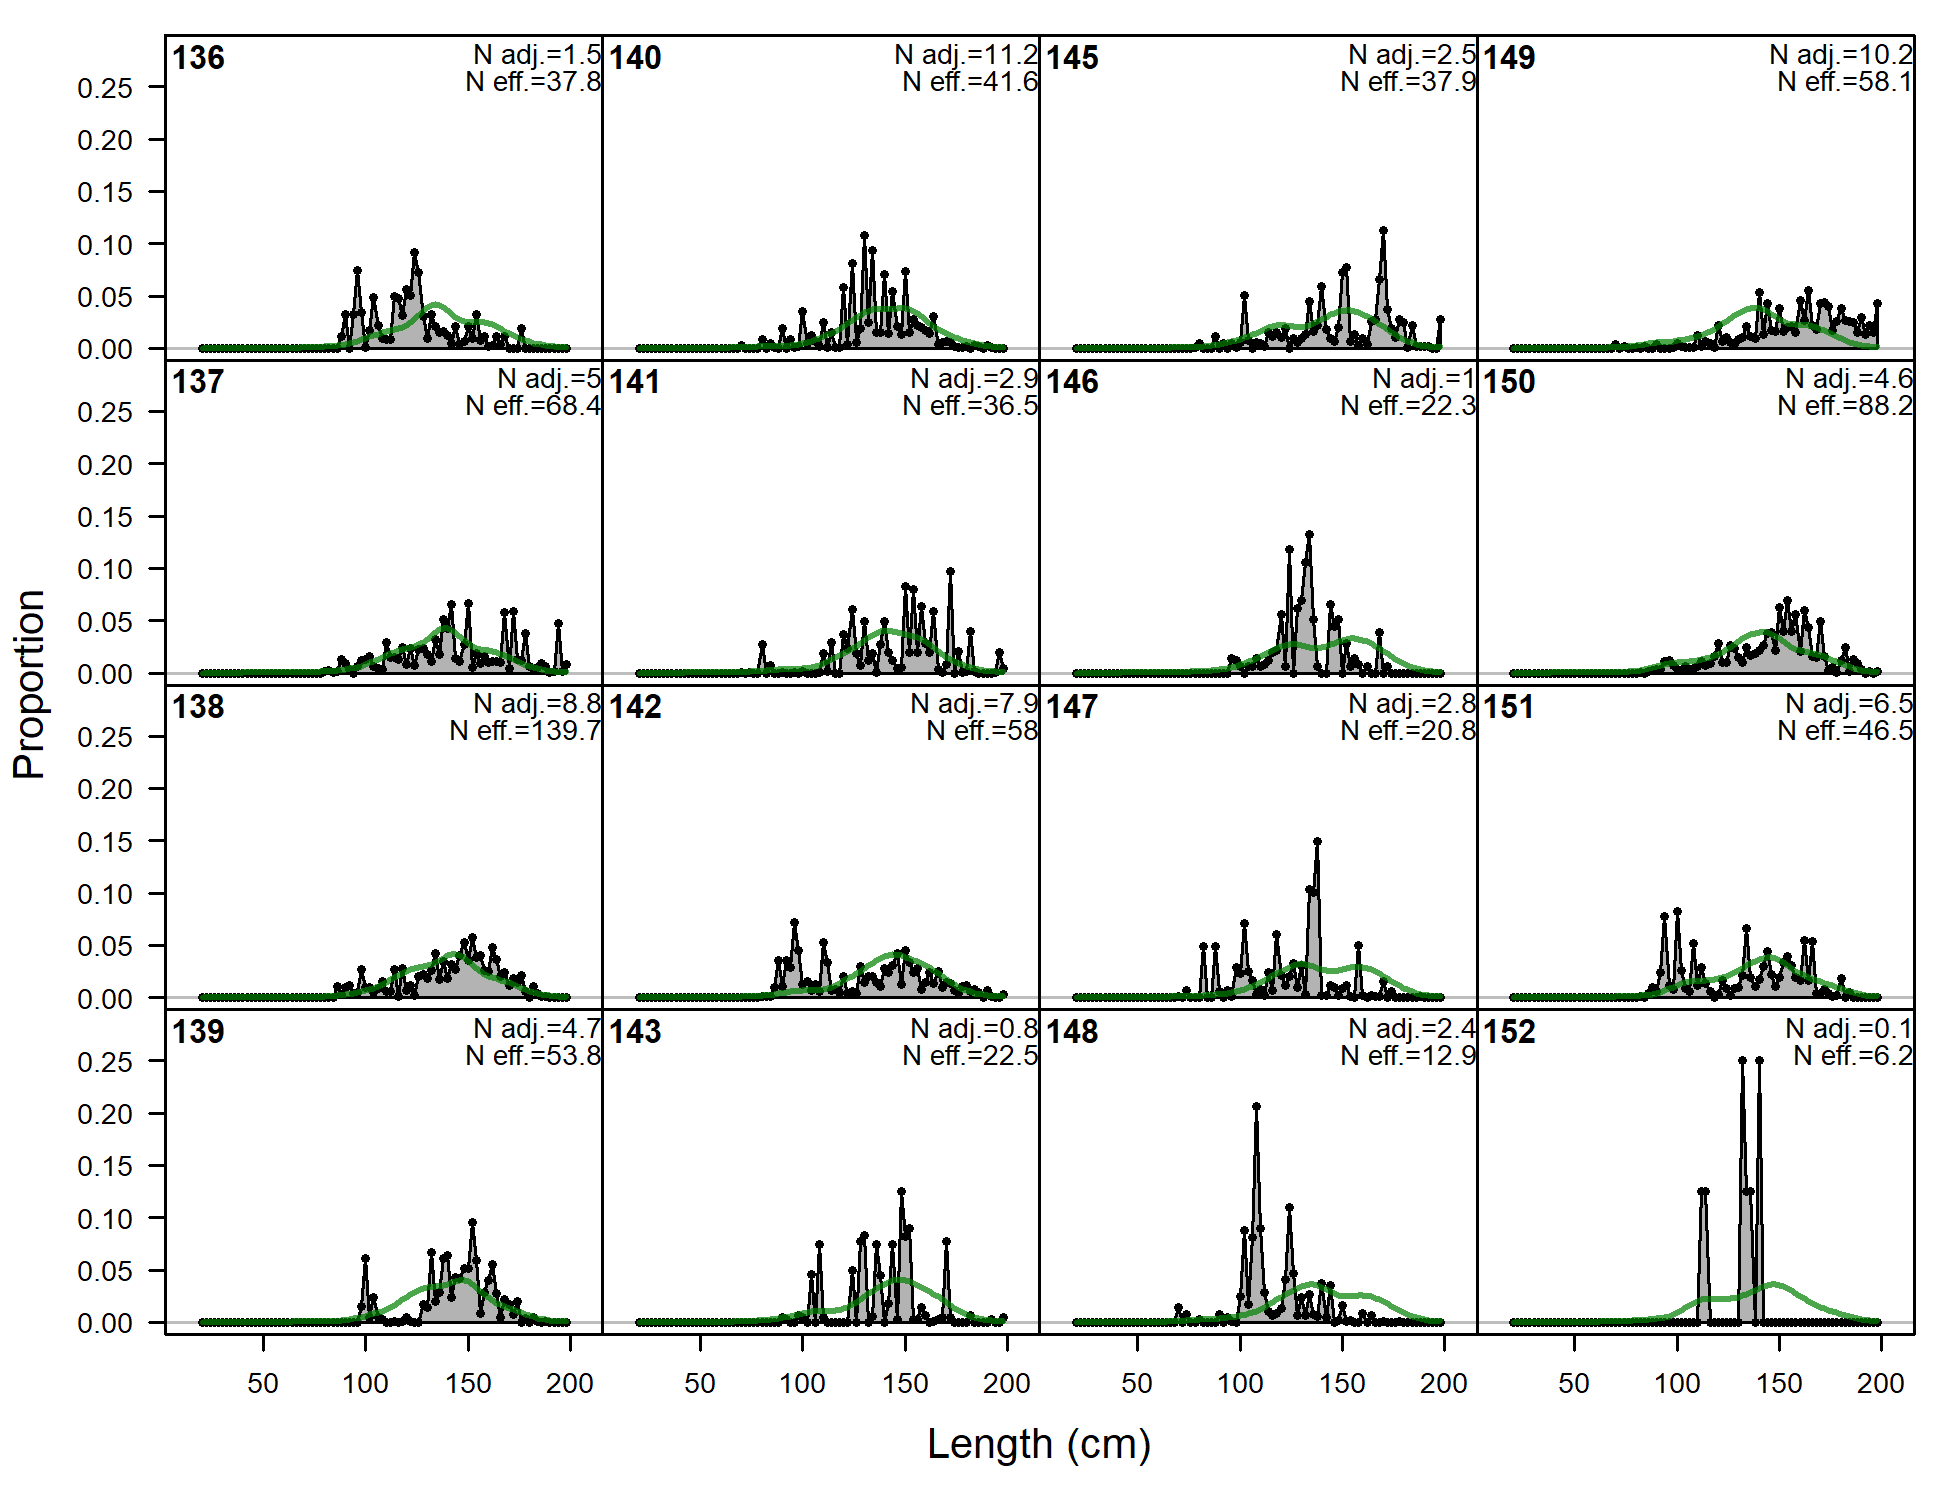
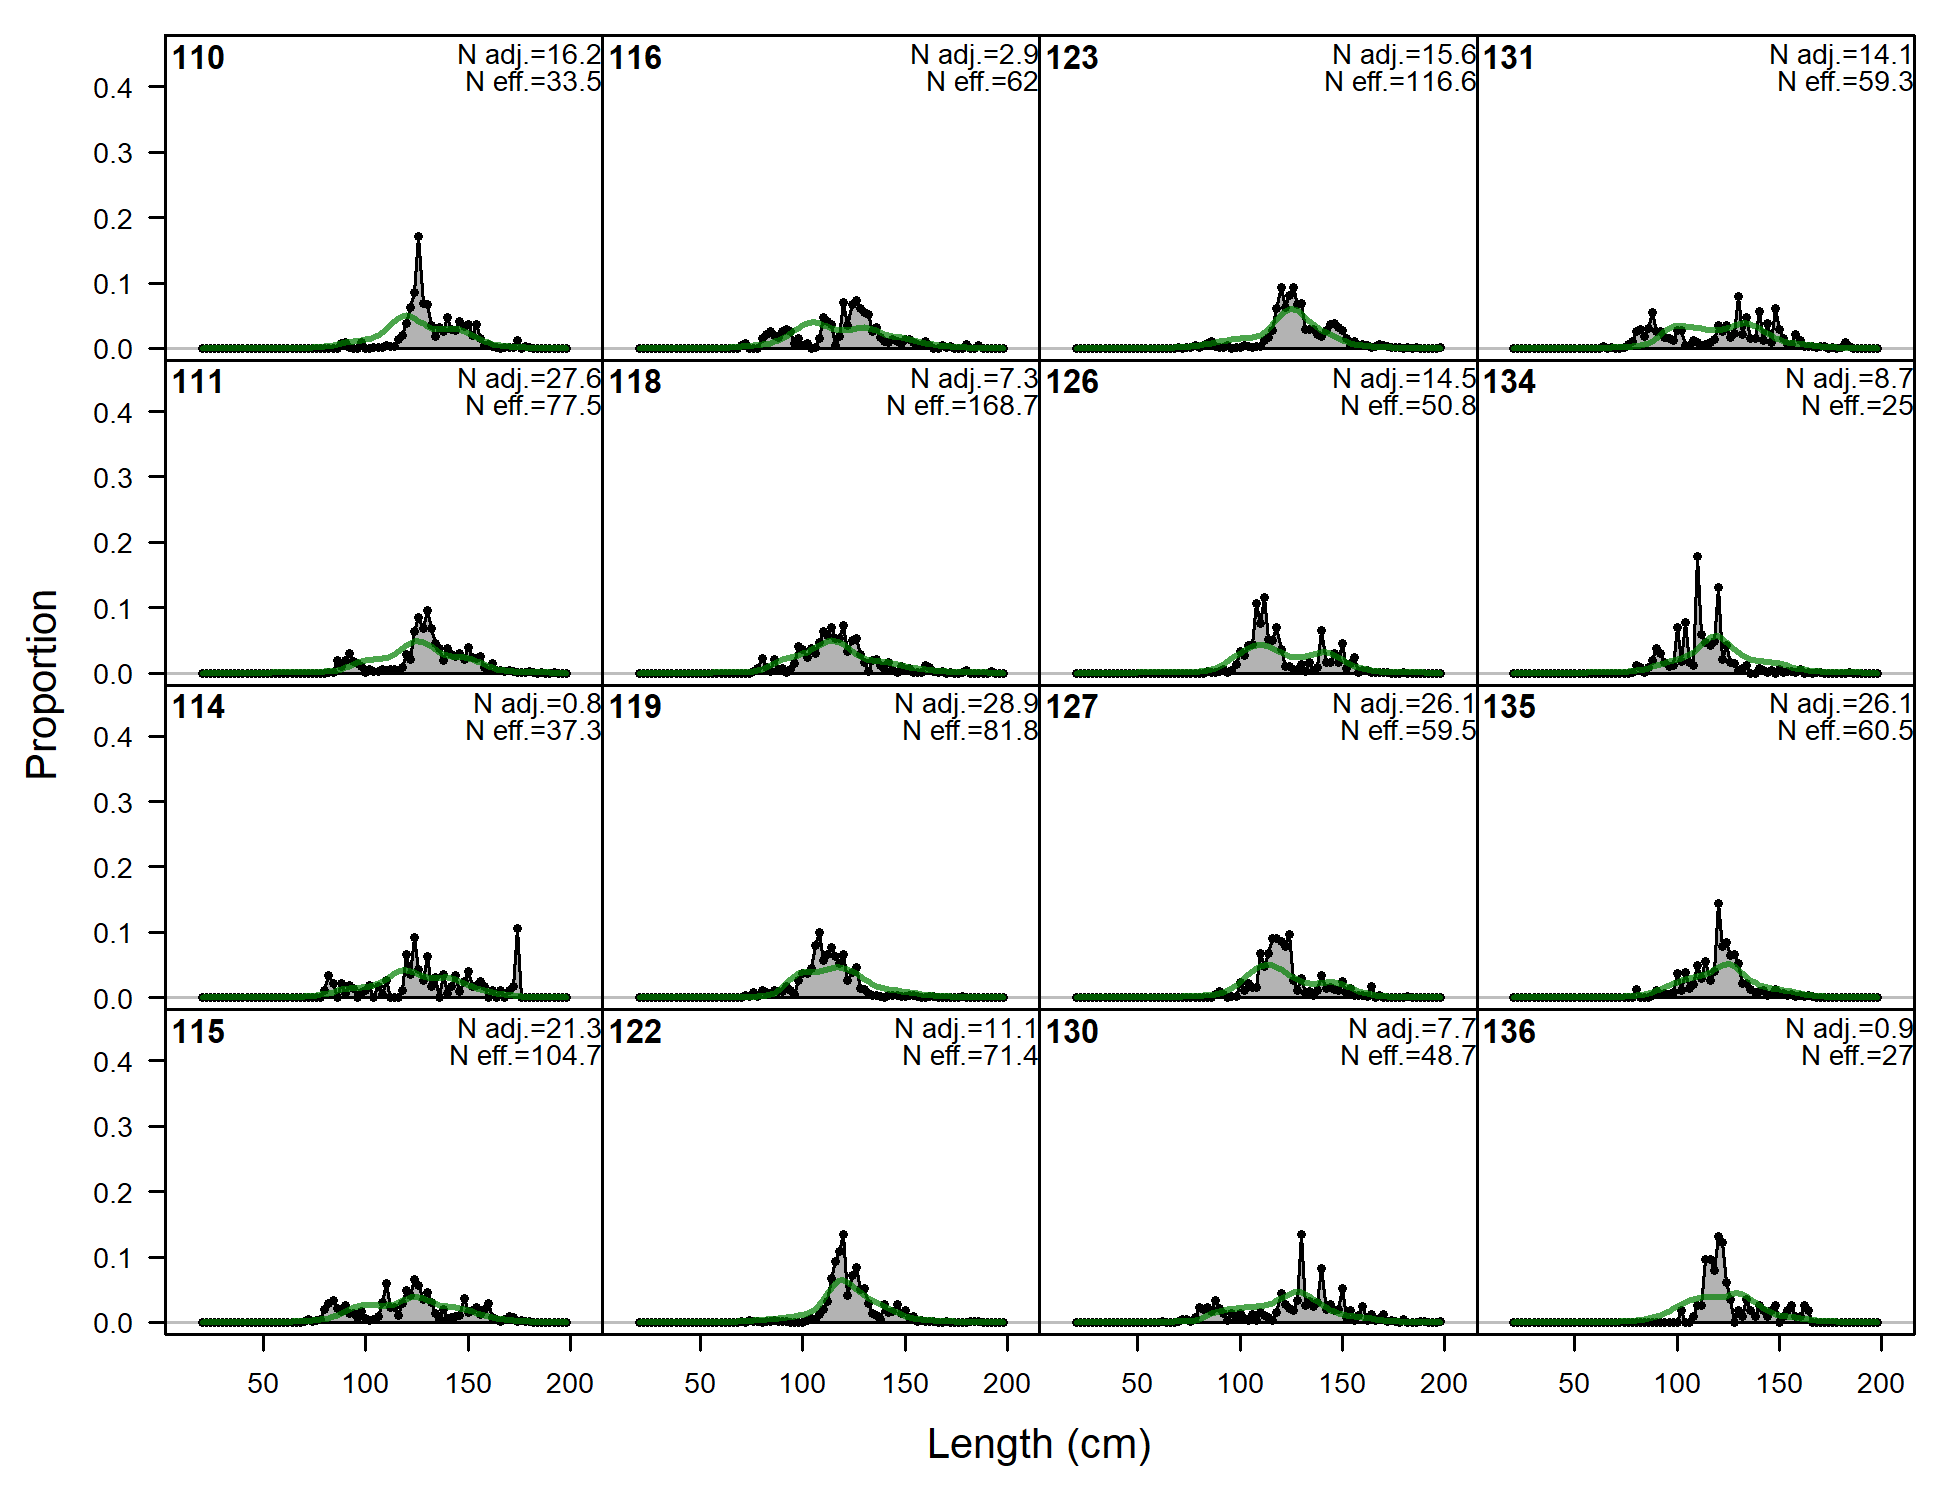
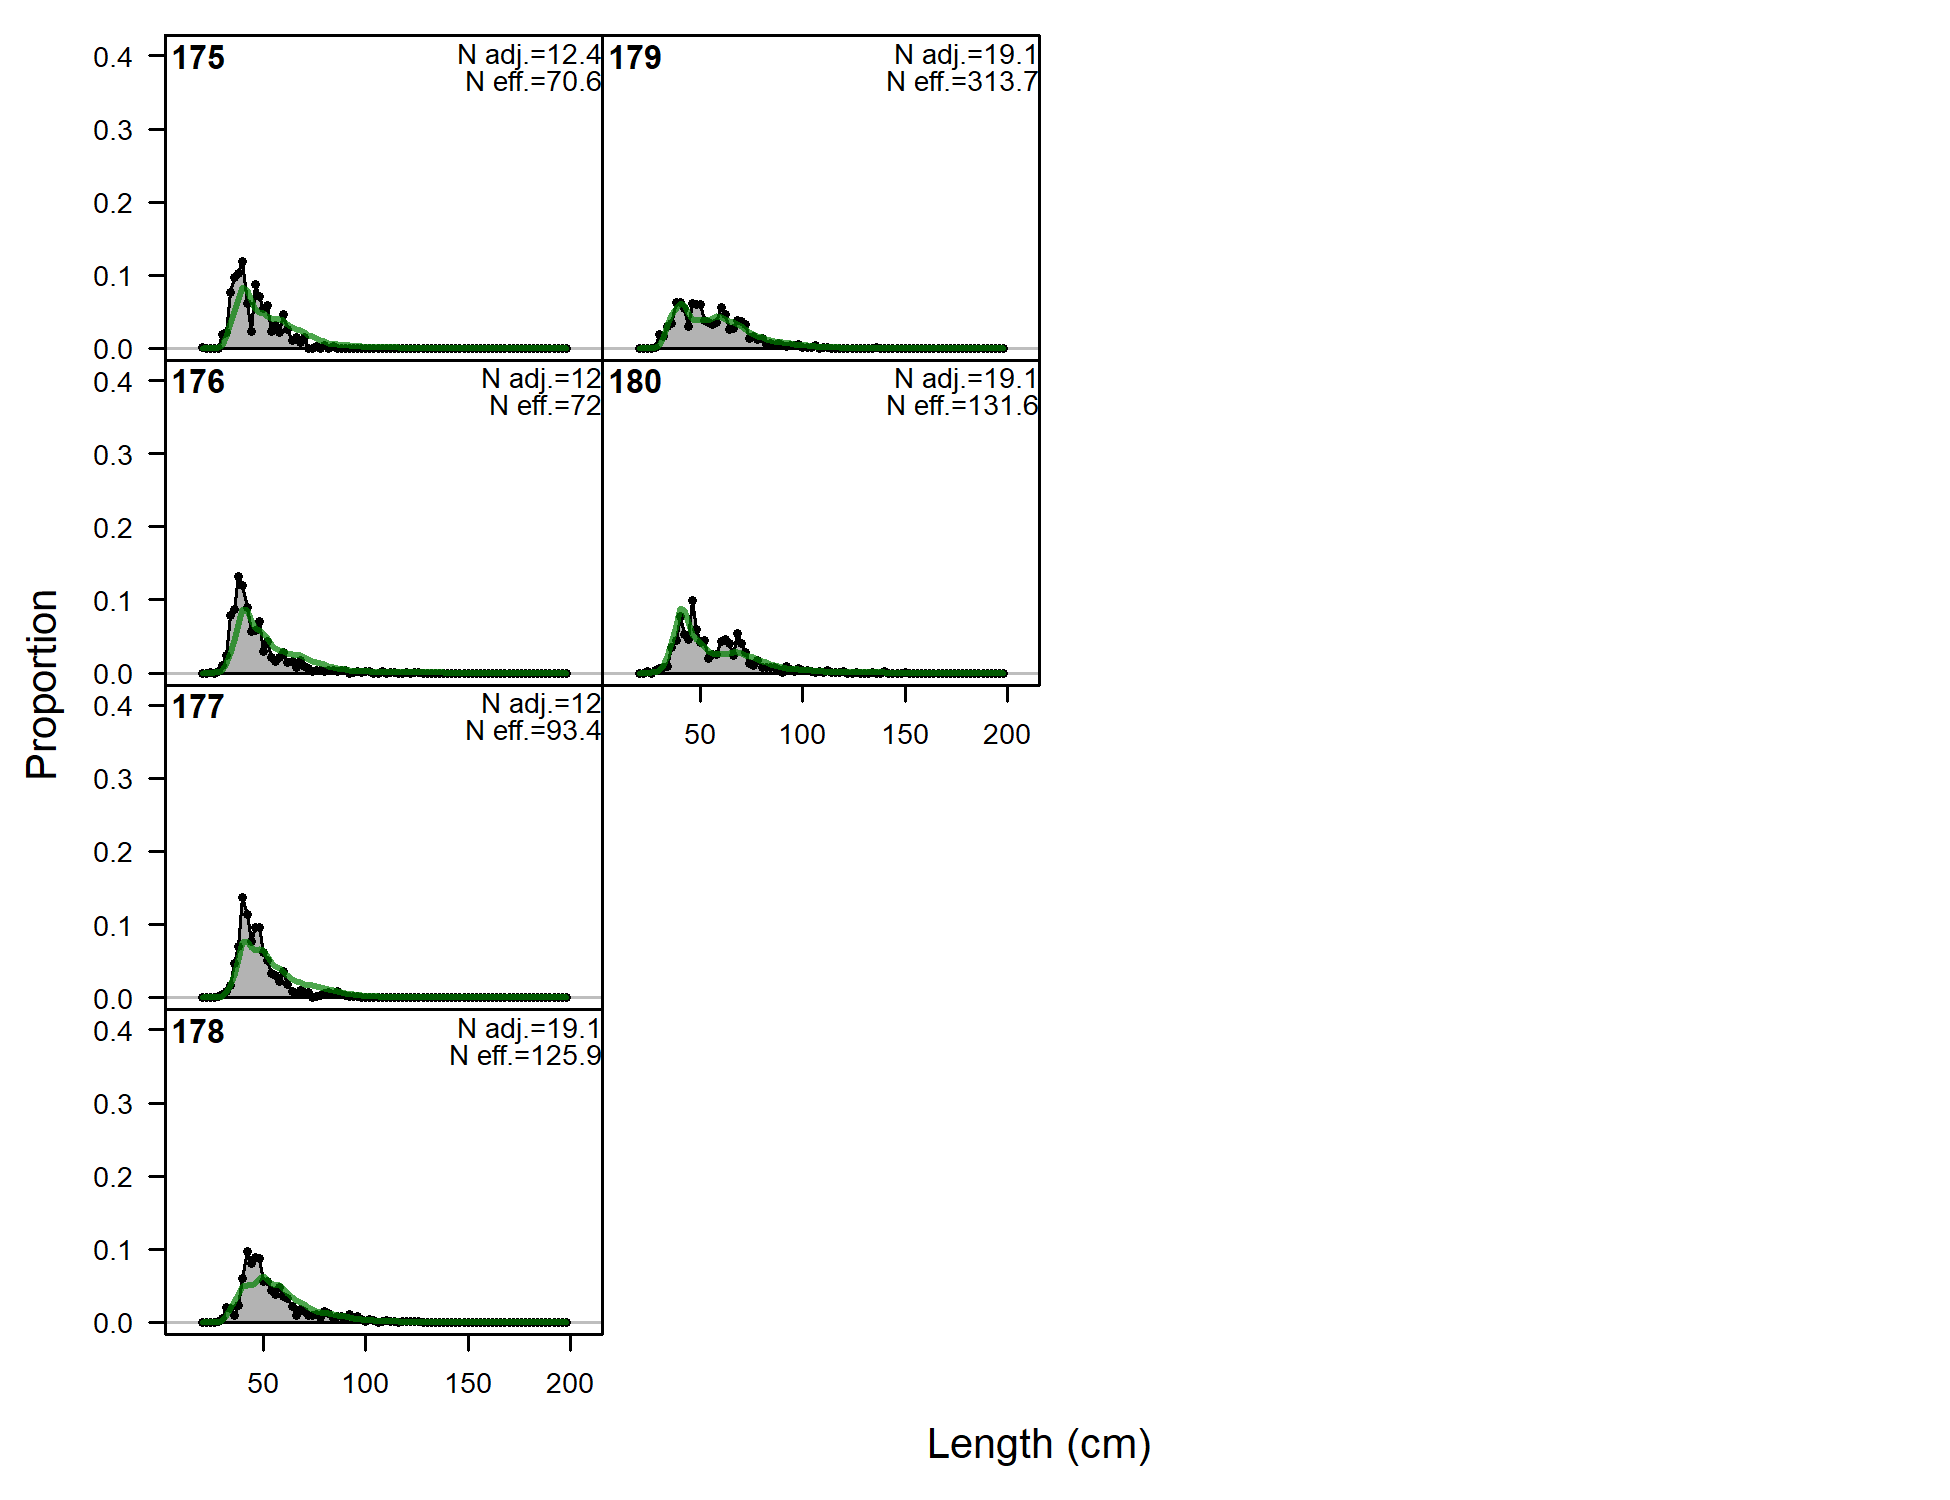
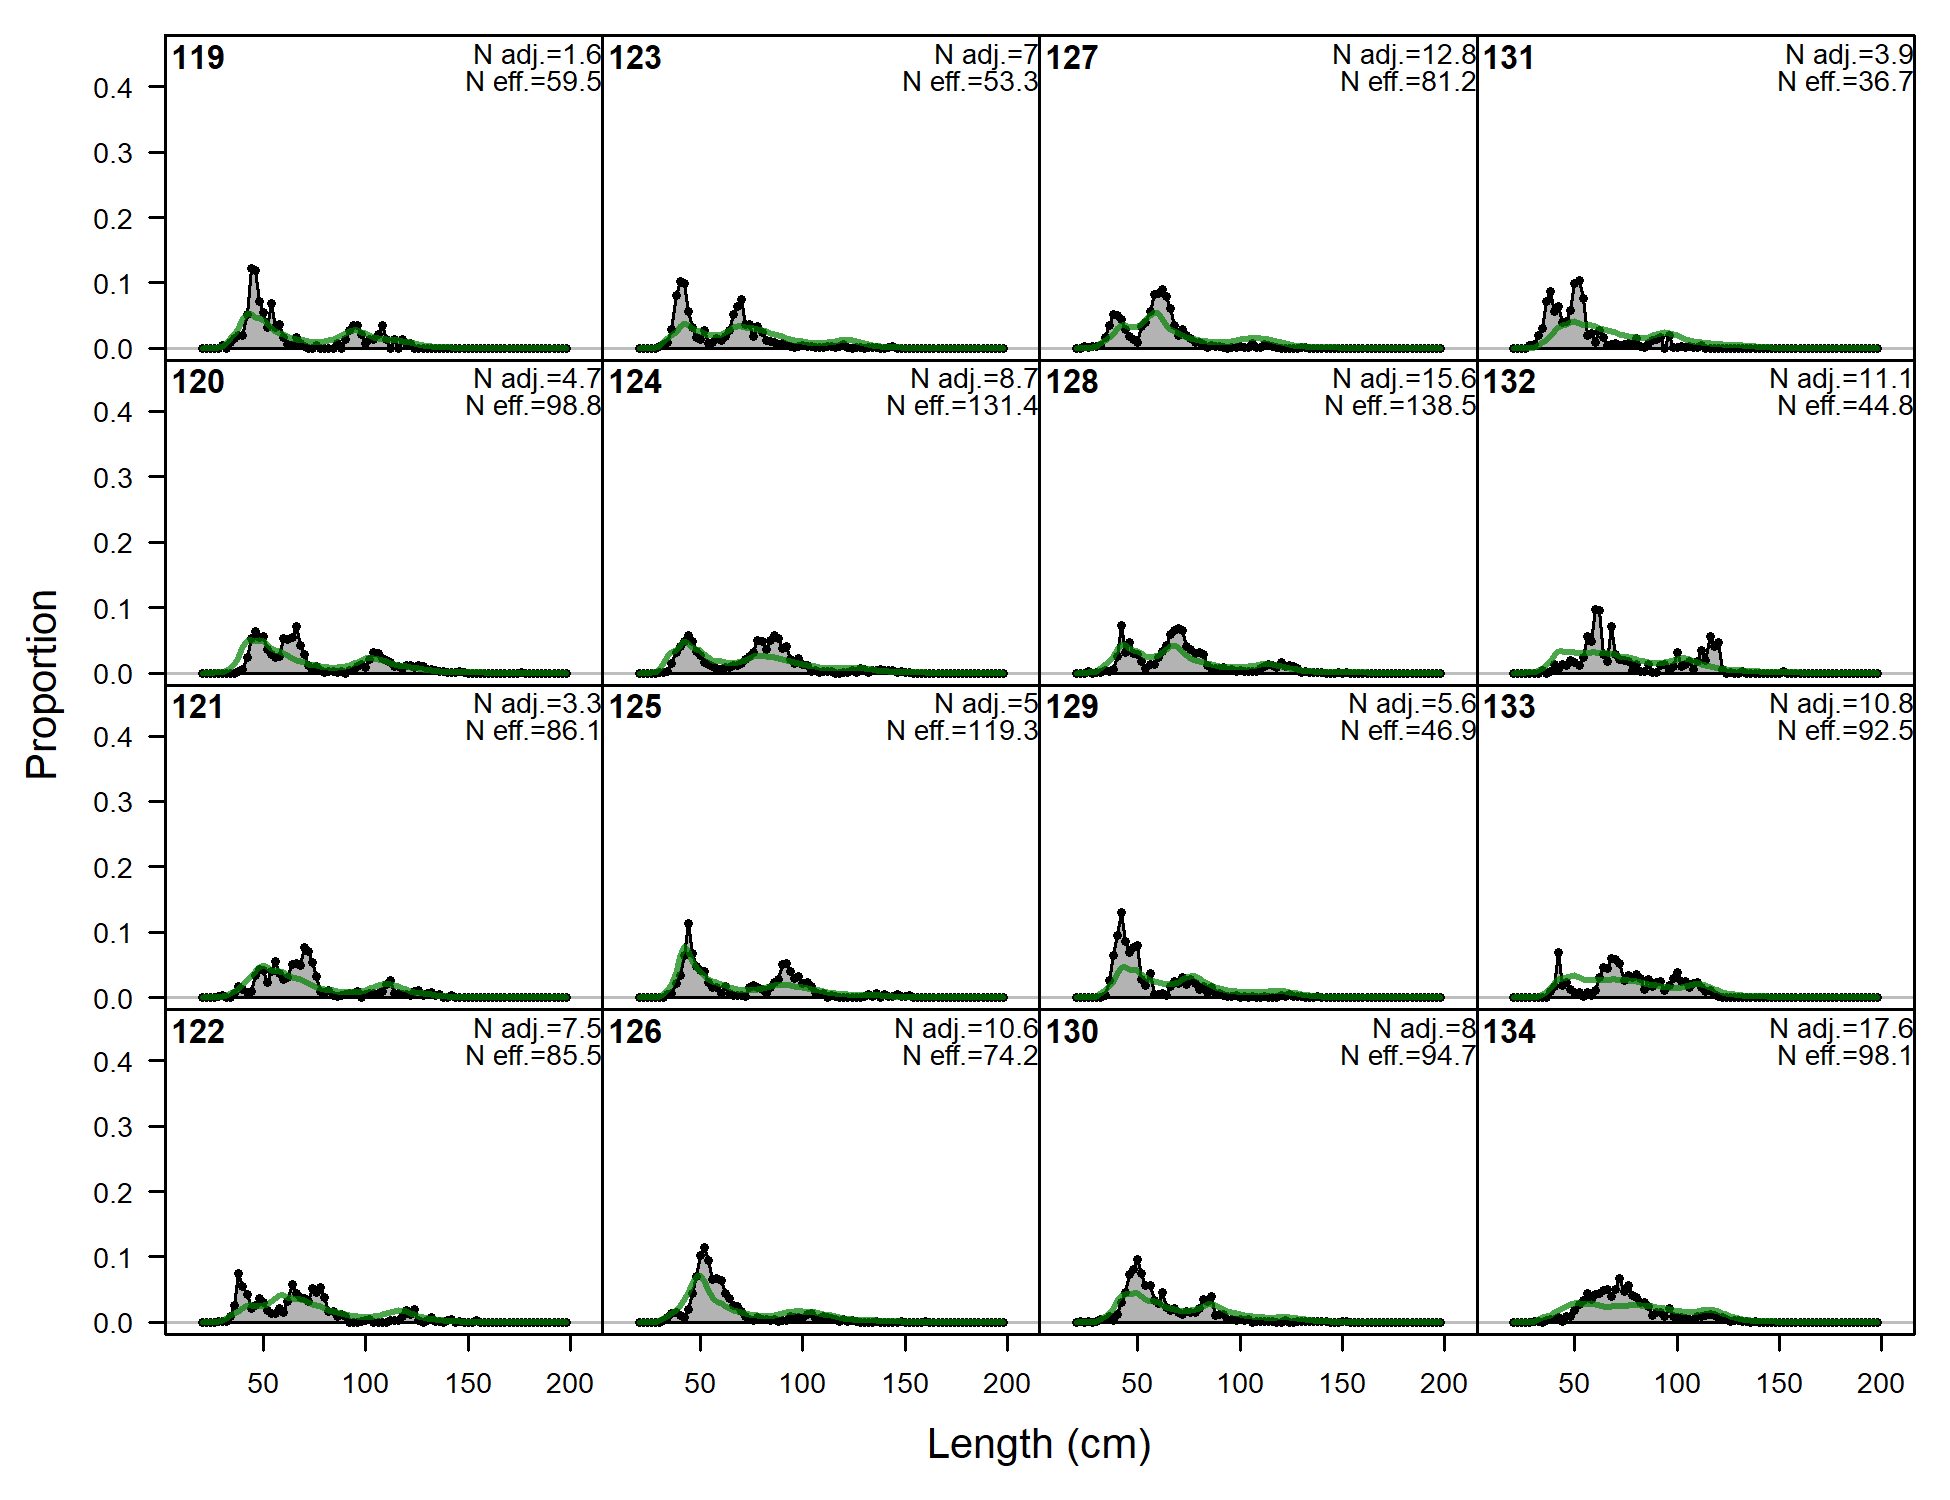
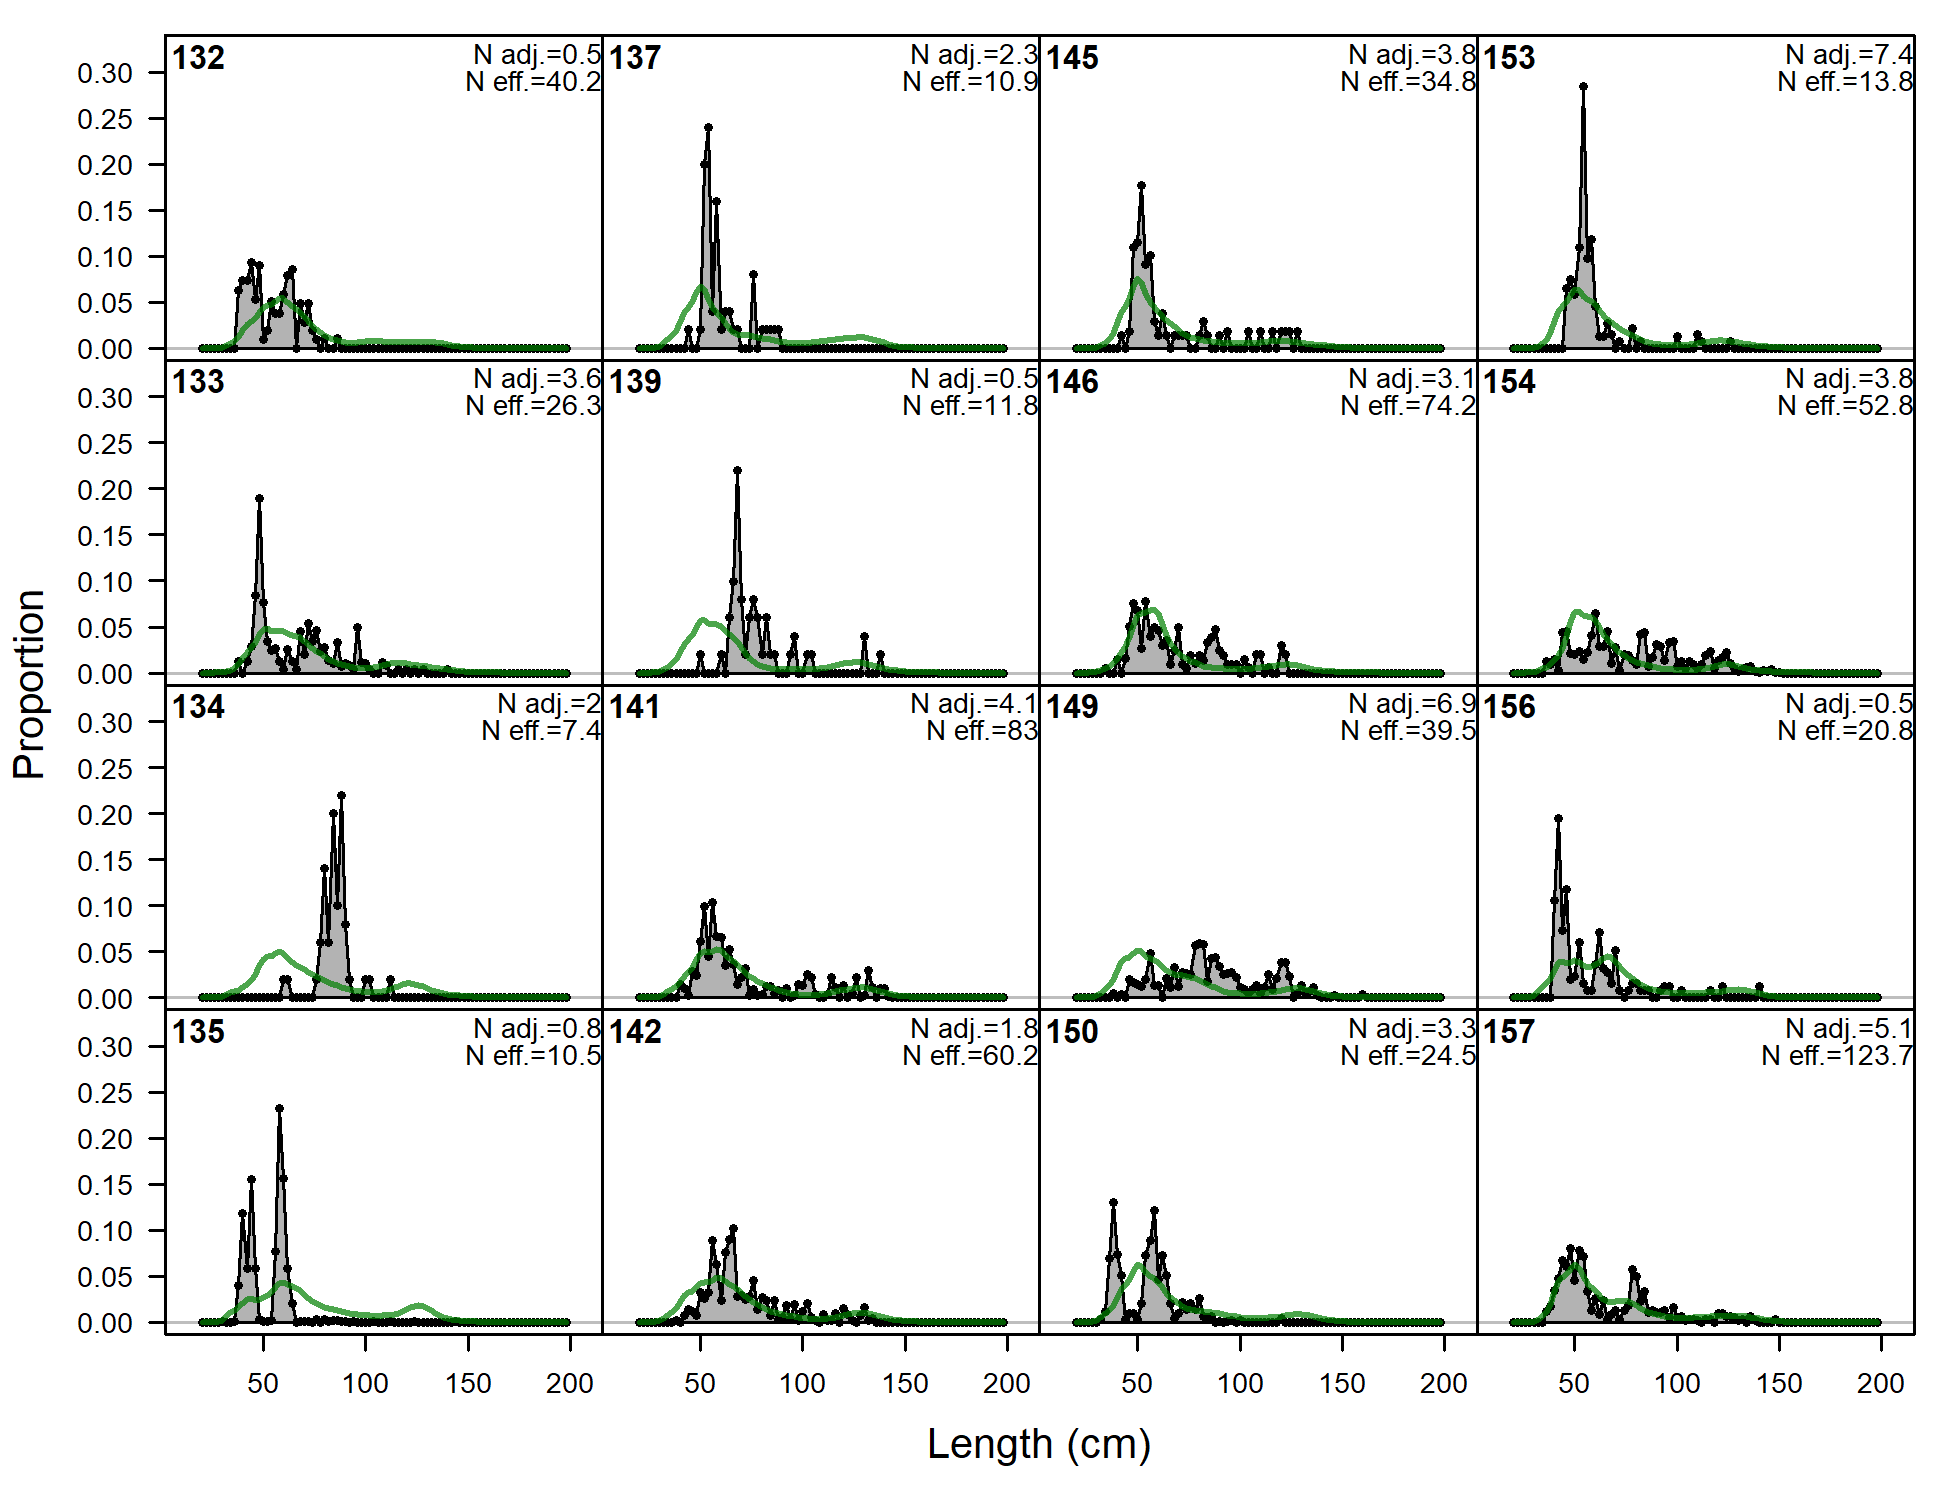
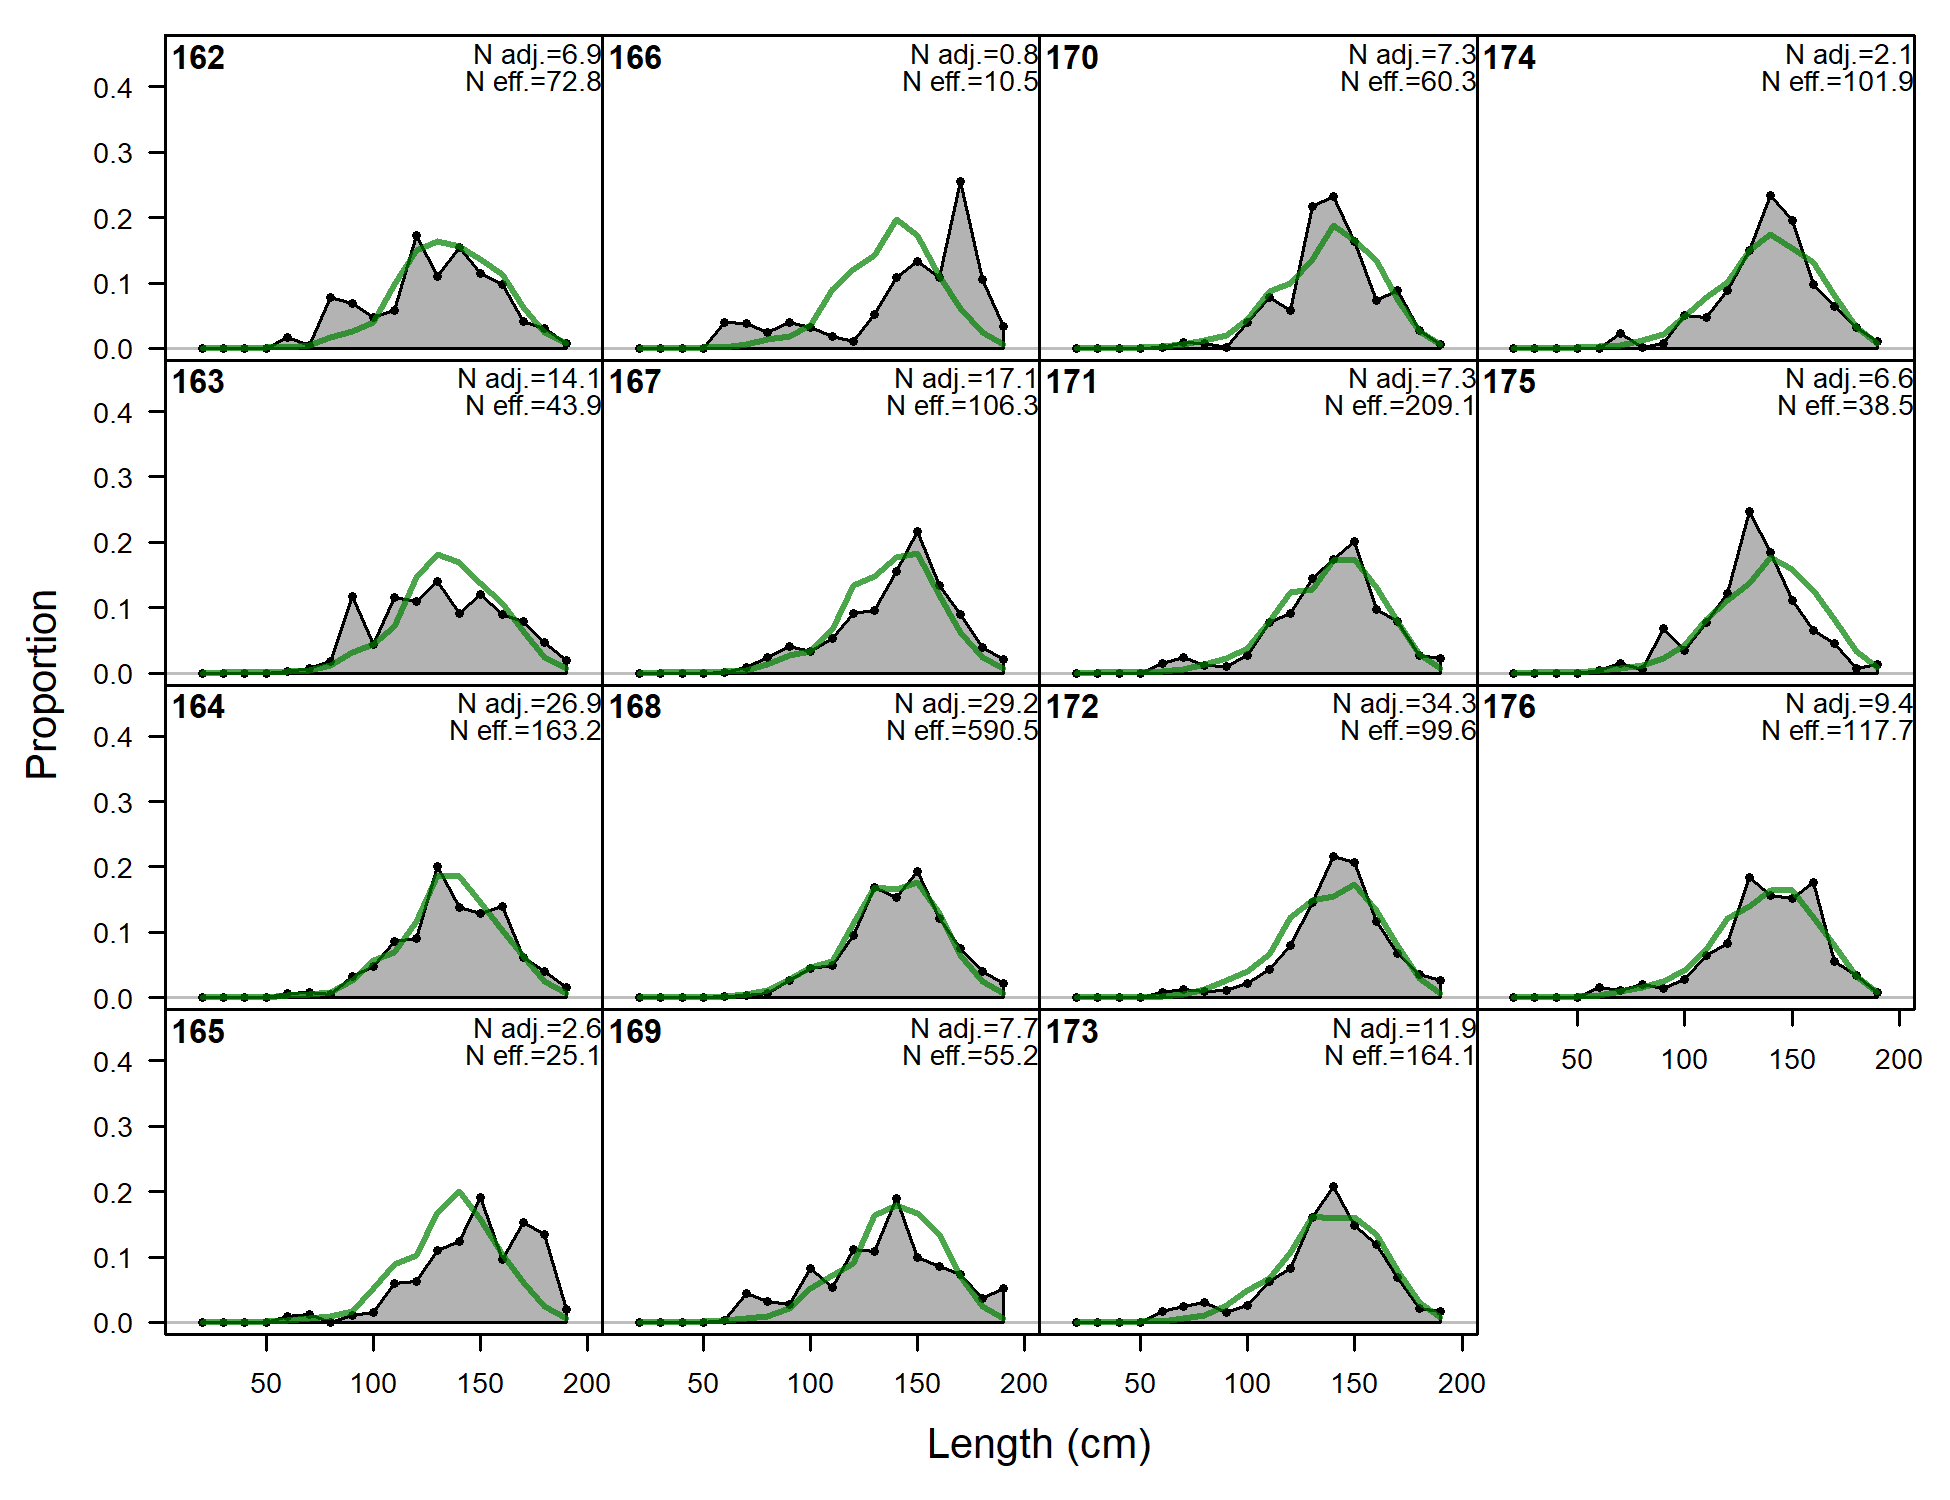
Length comps, whole catch, A1-LL-n (plot 2 of 2)
file: comp_lenfit_flt1mkt0_page2.png

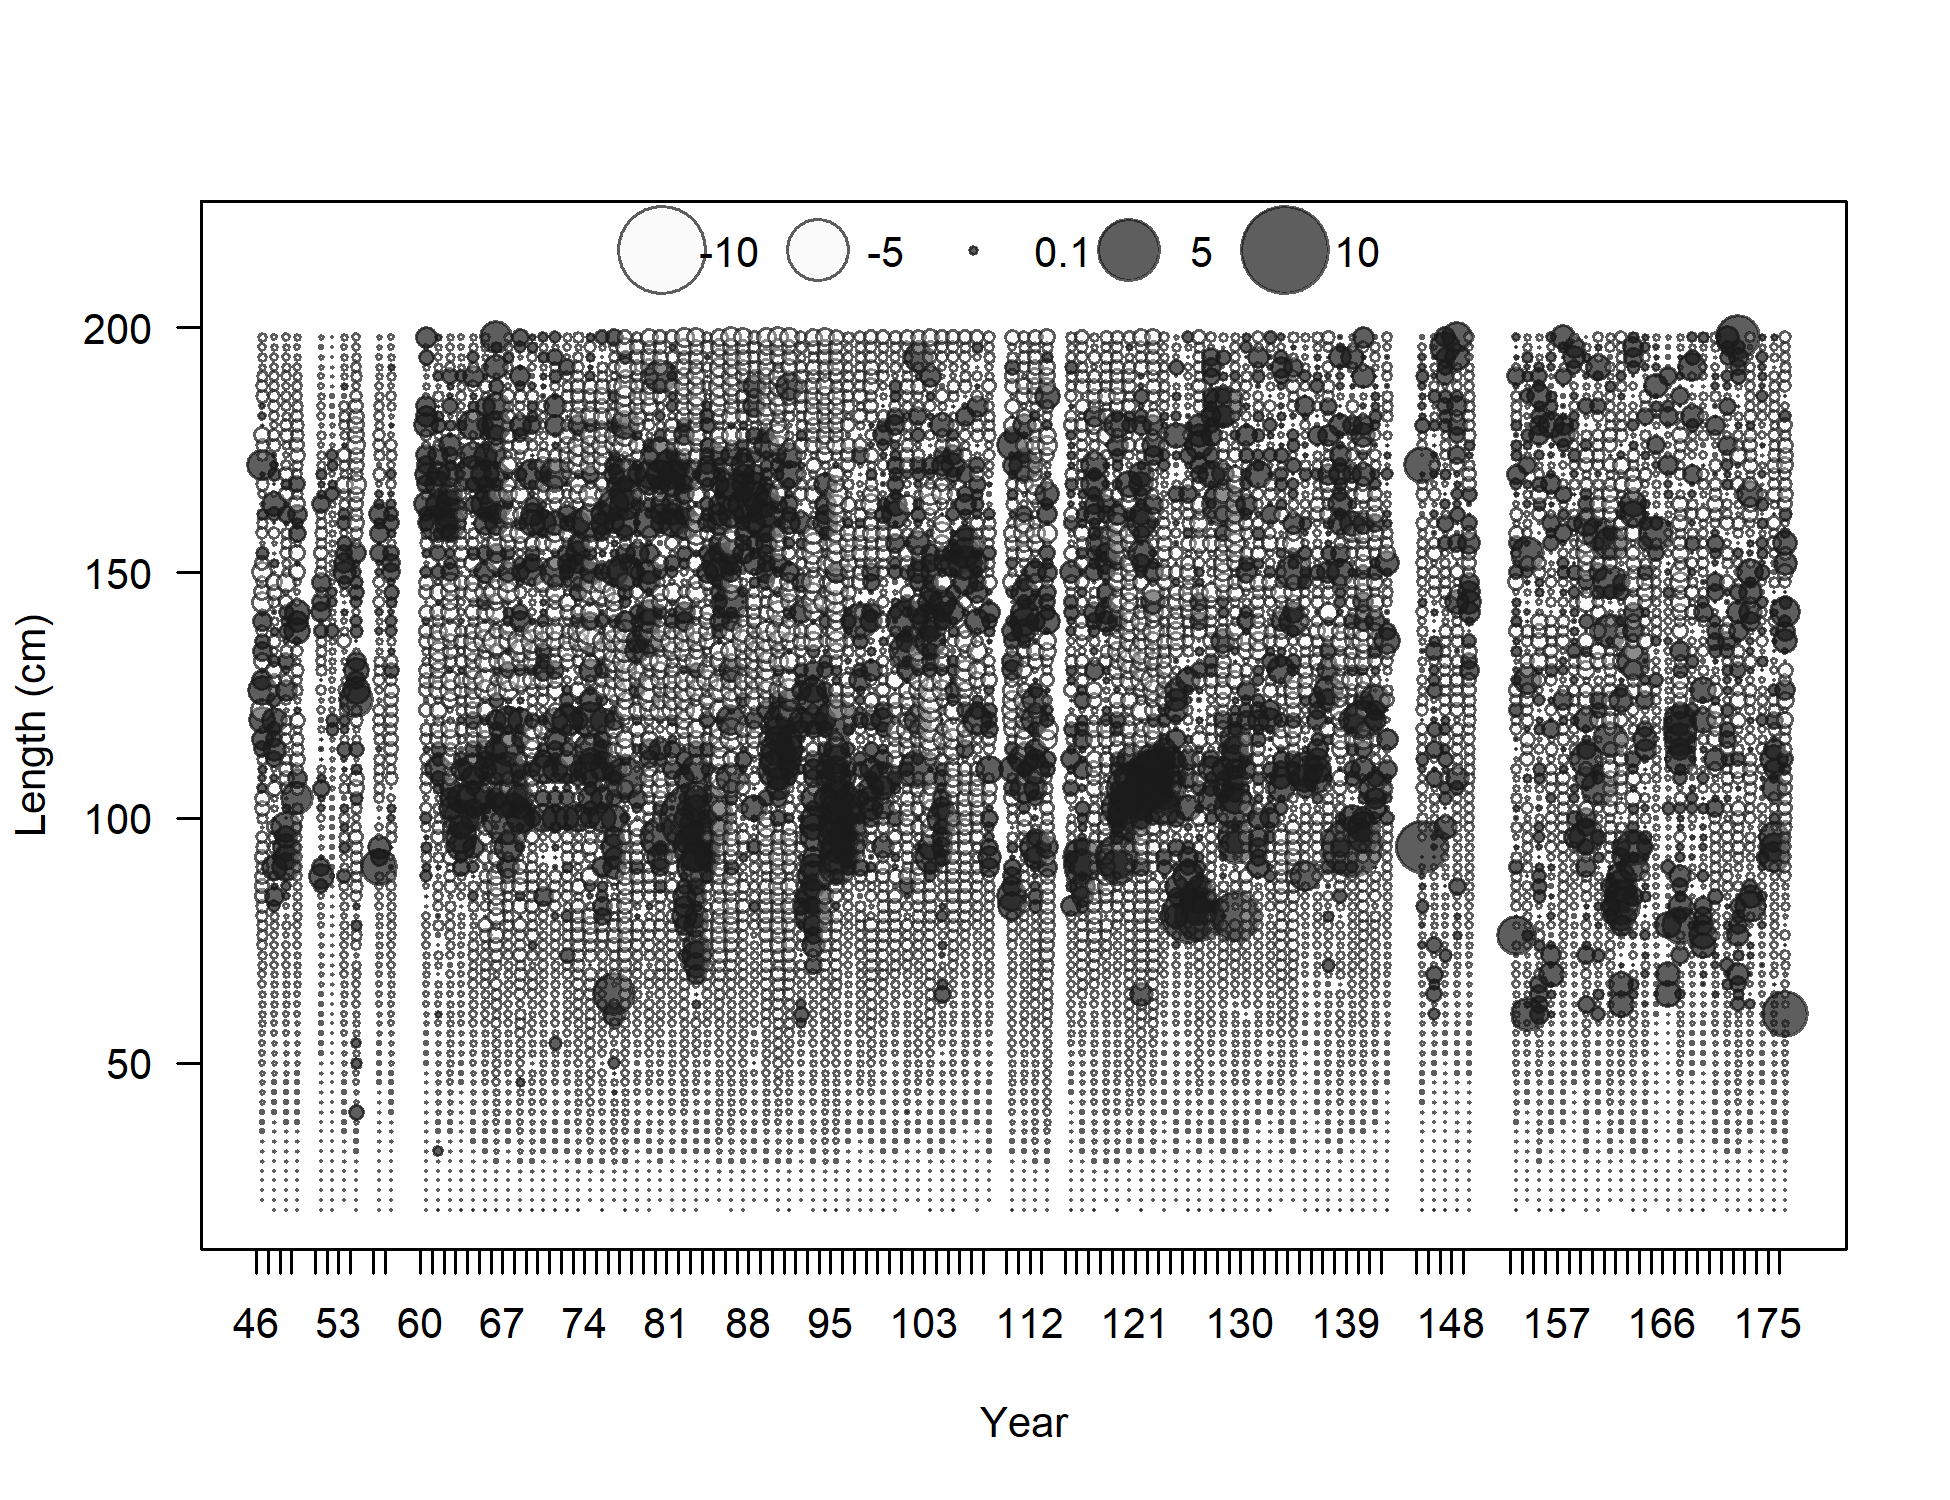
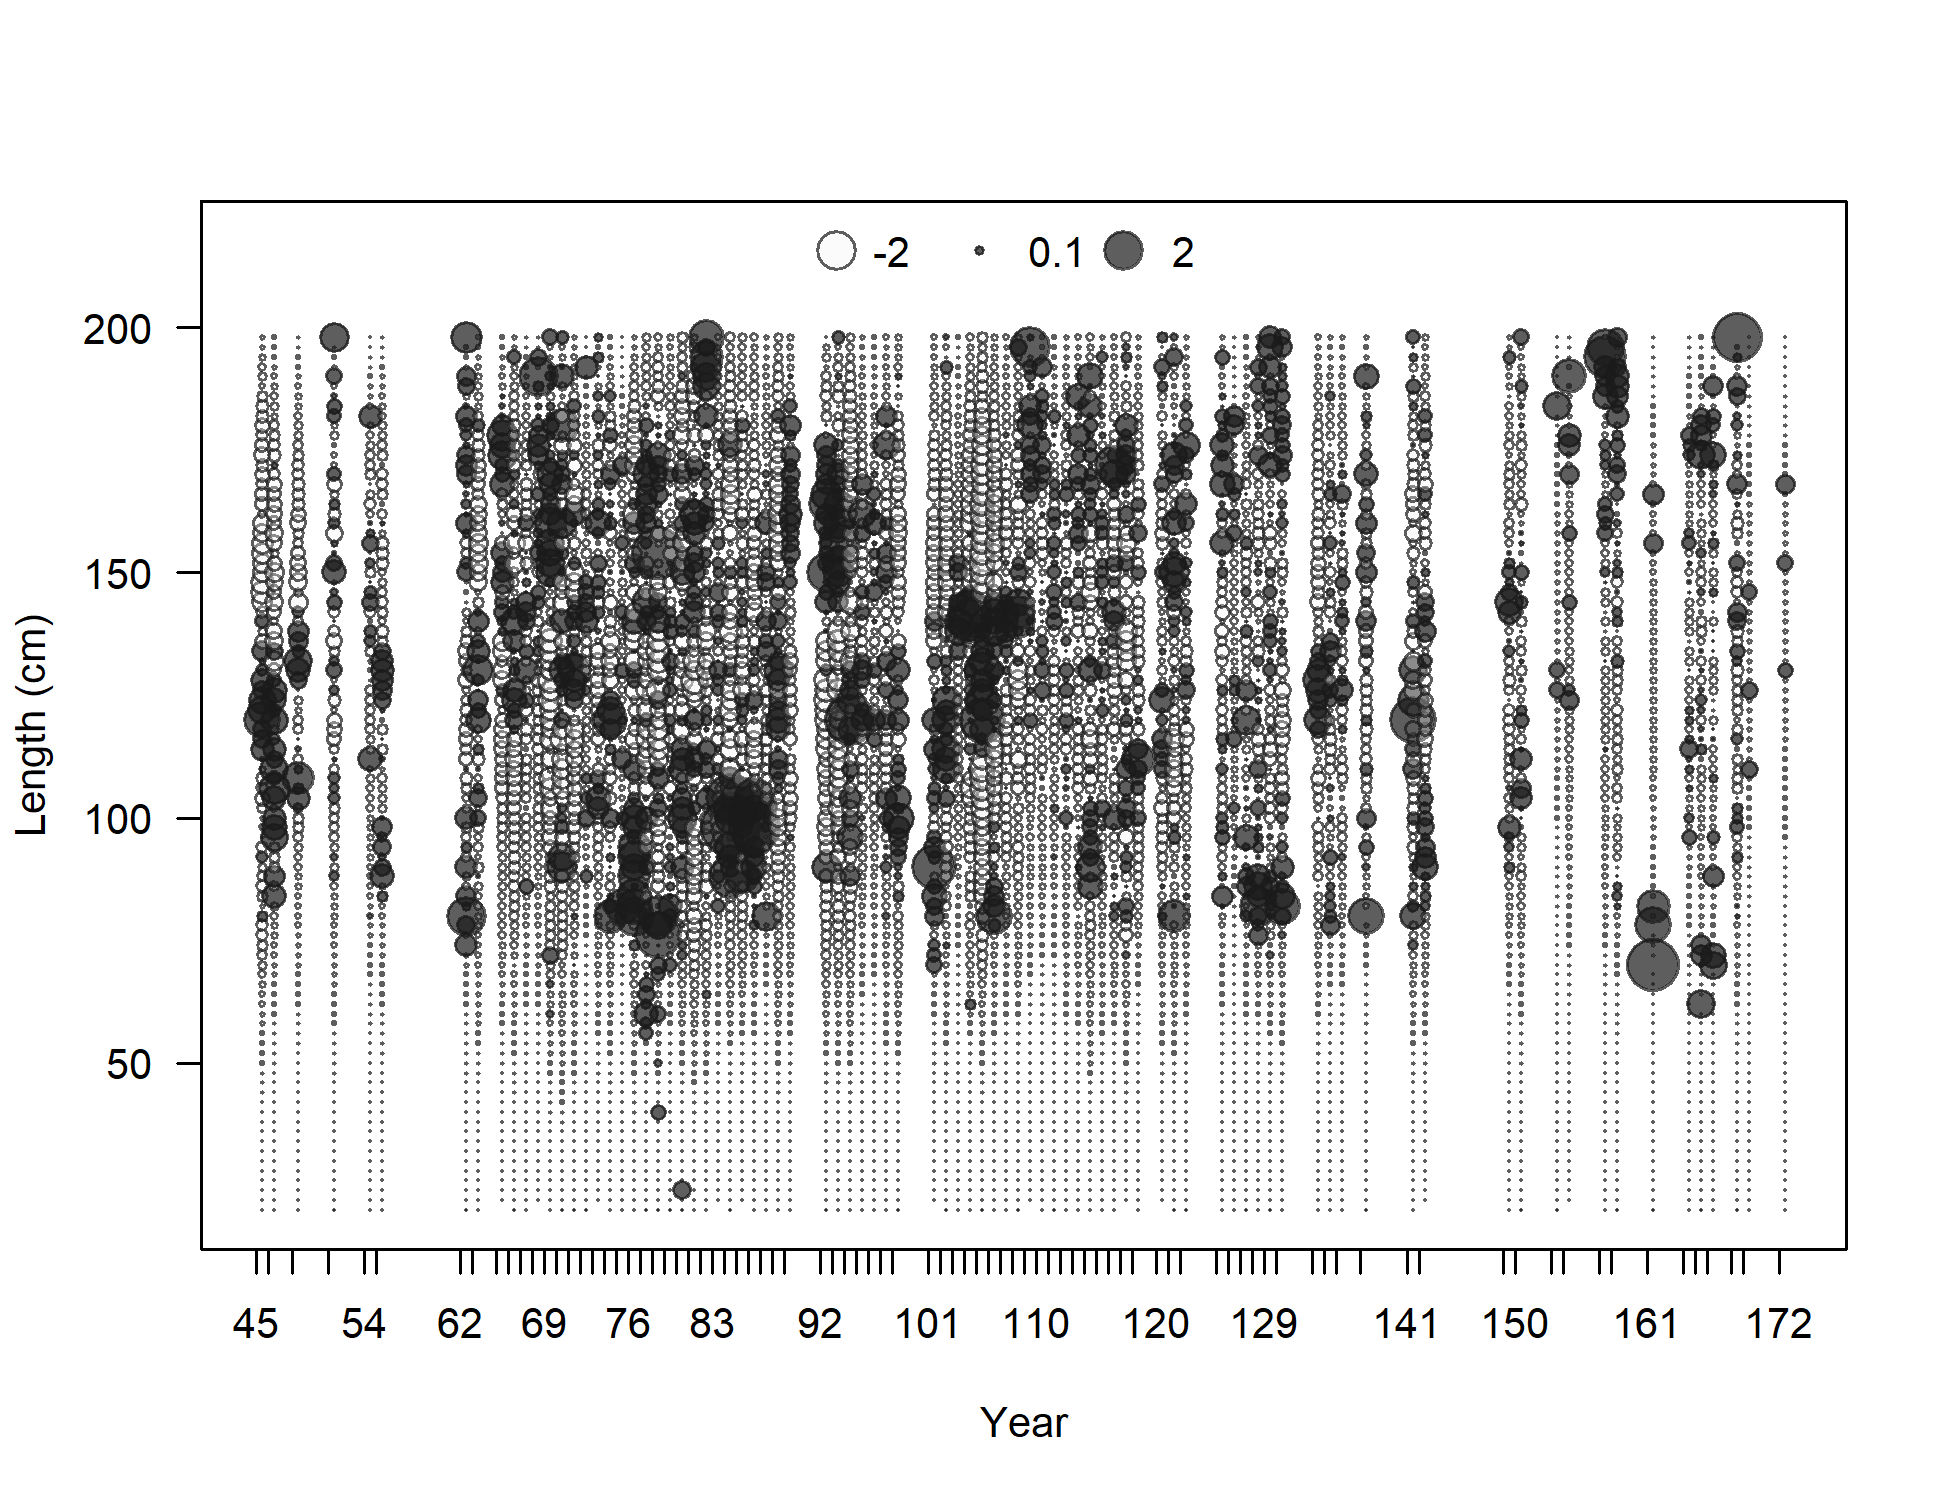
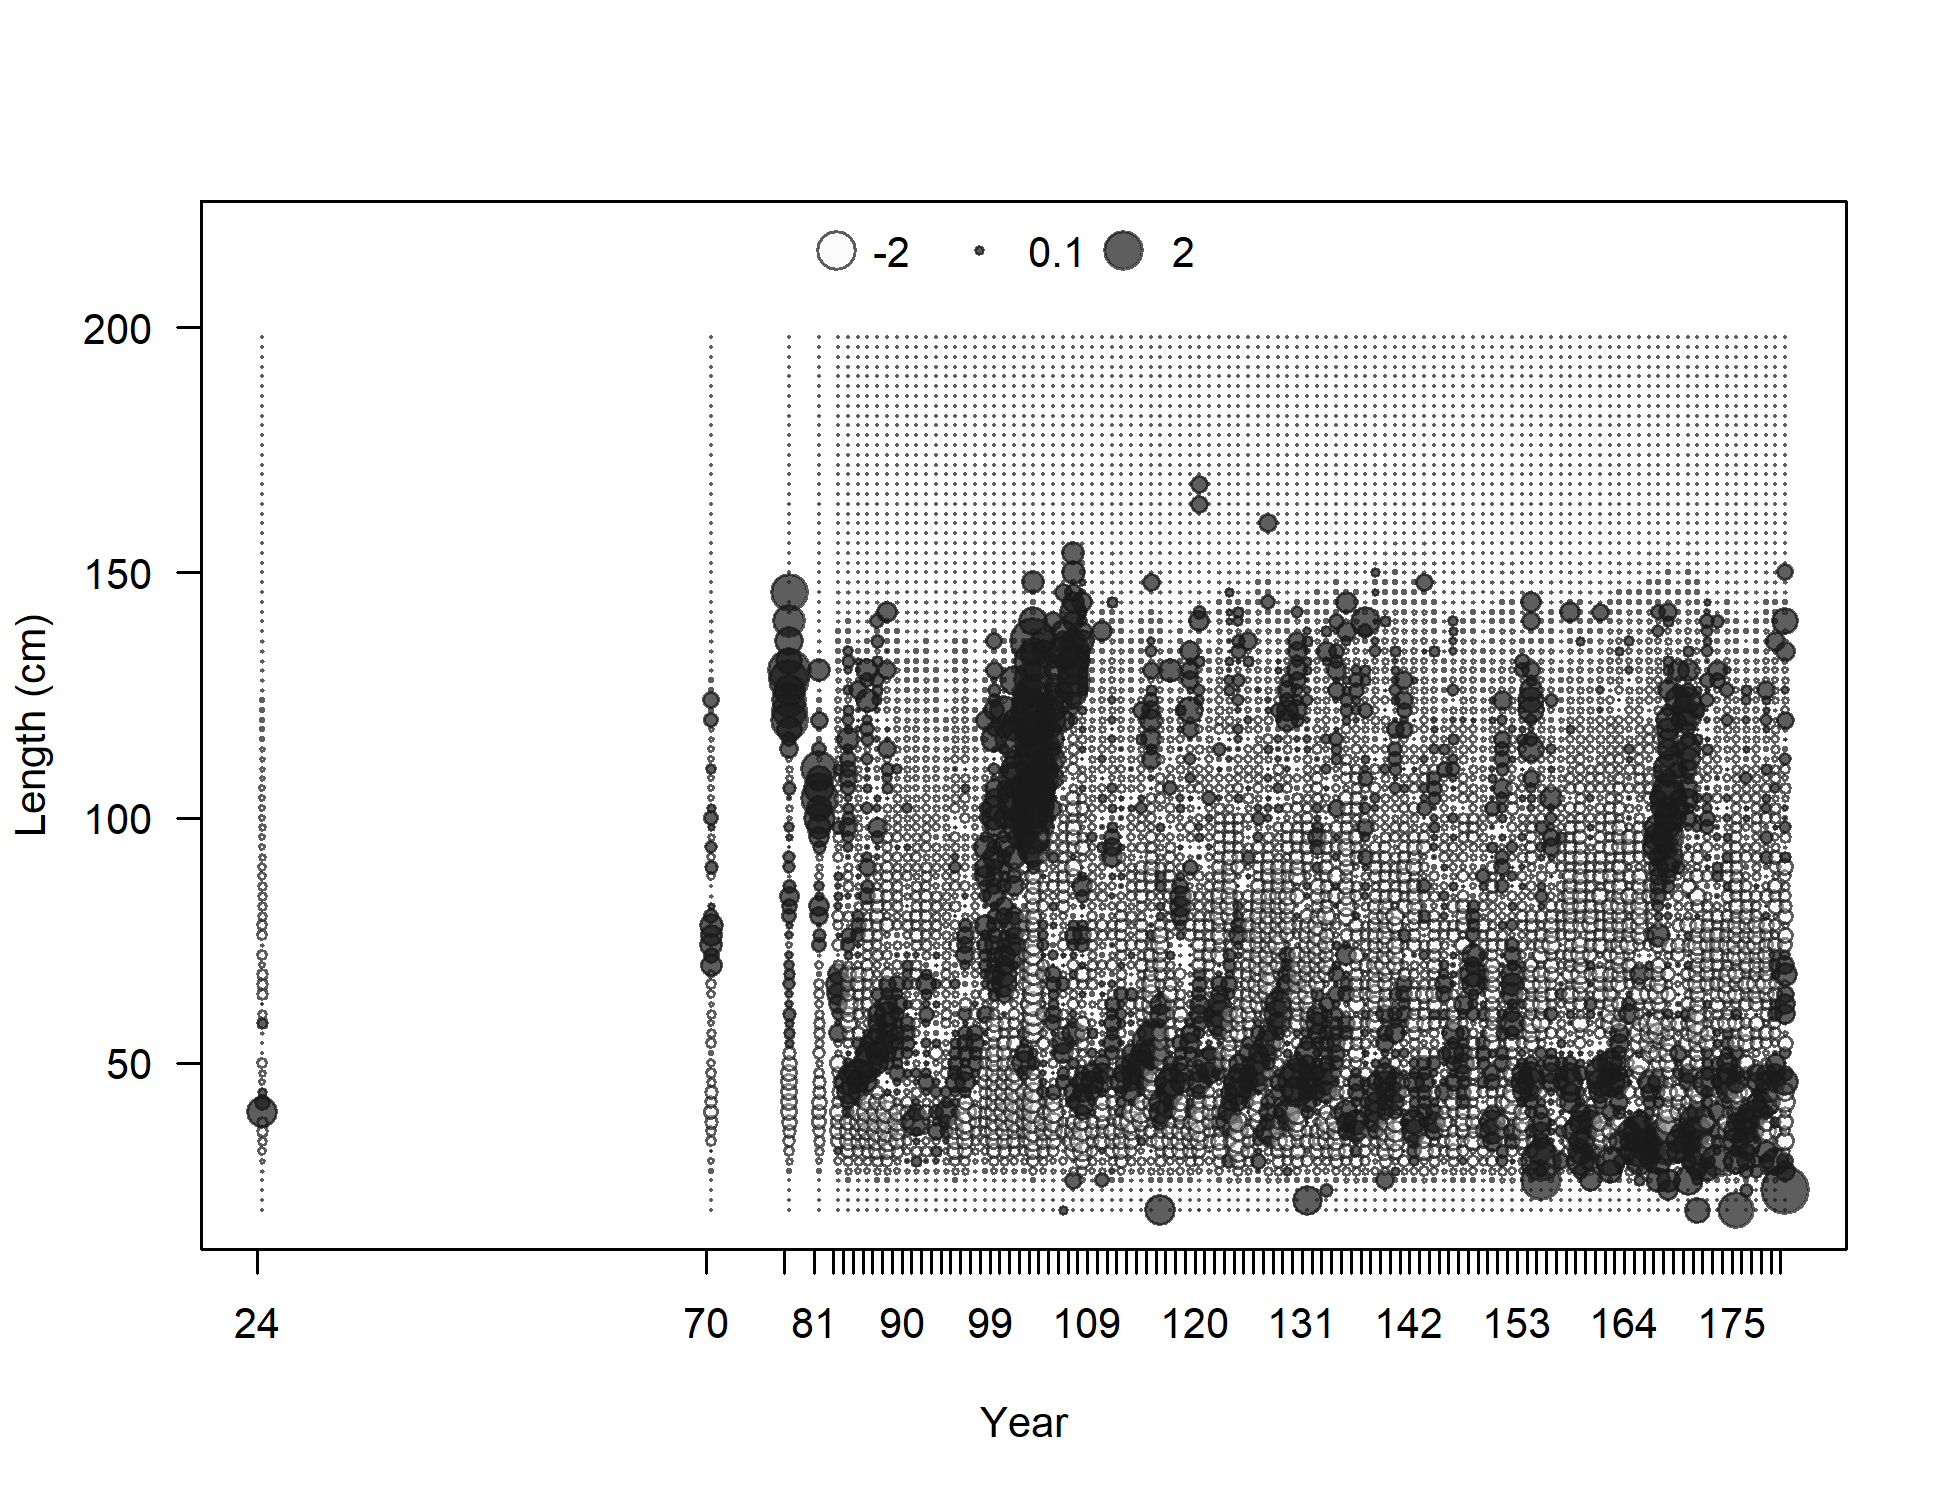
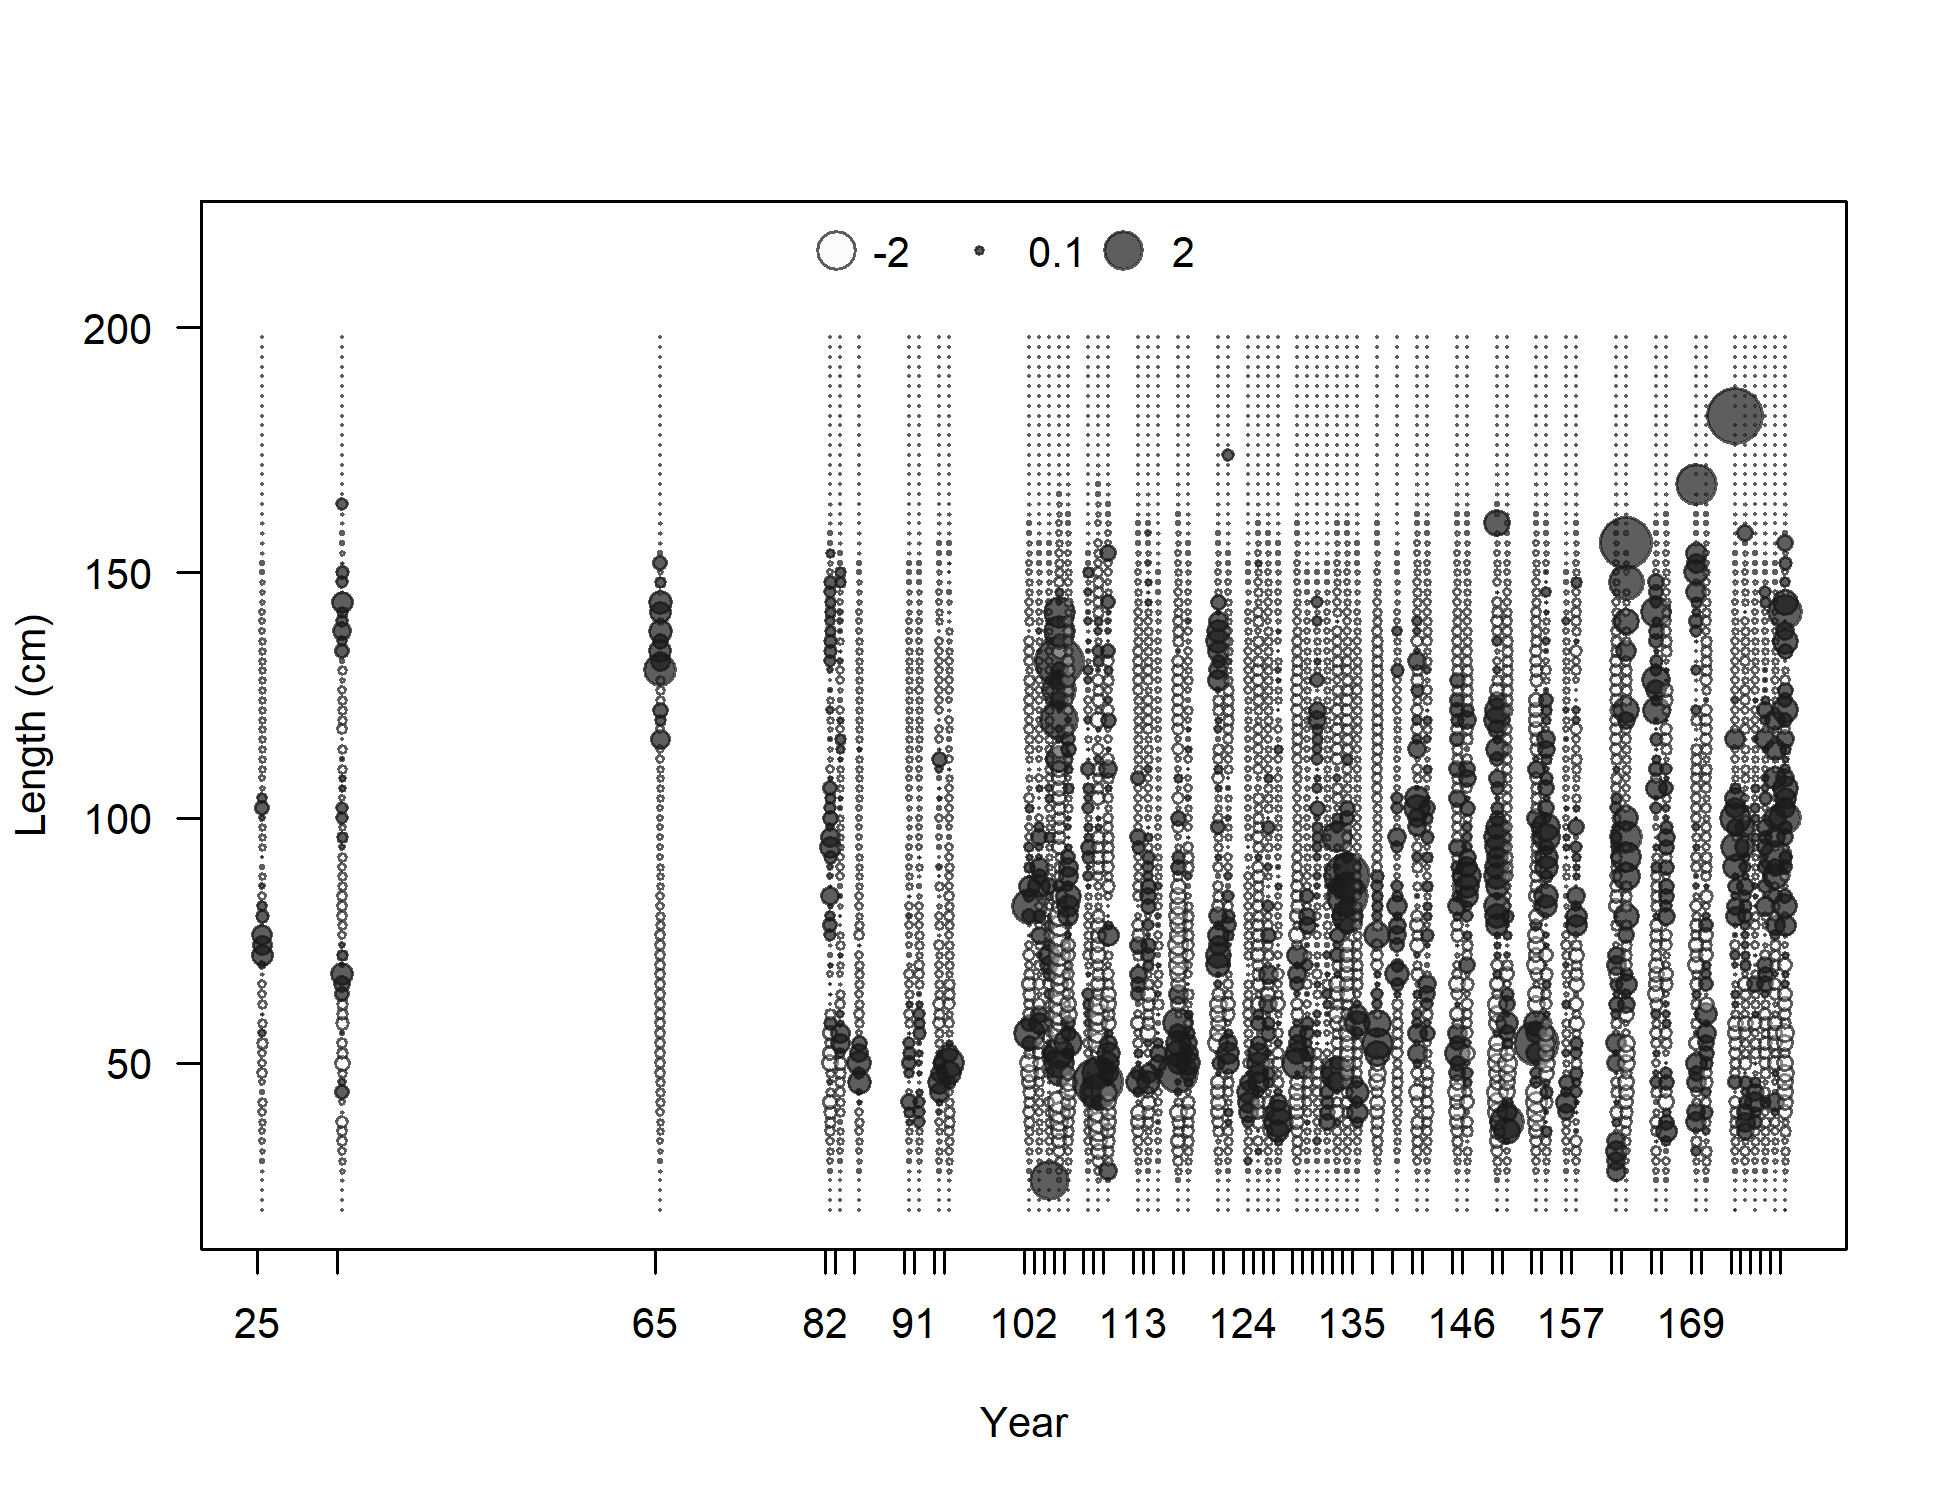
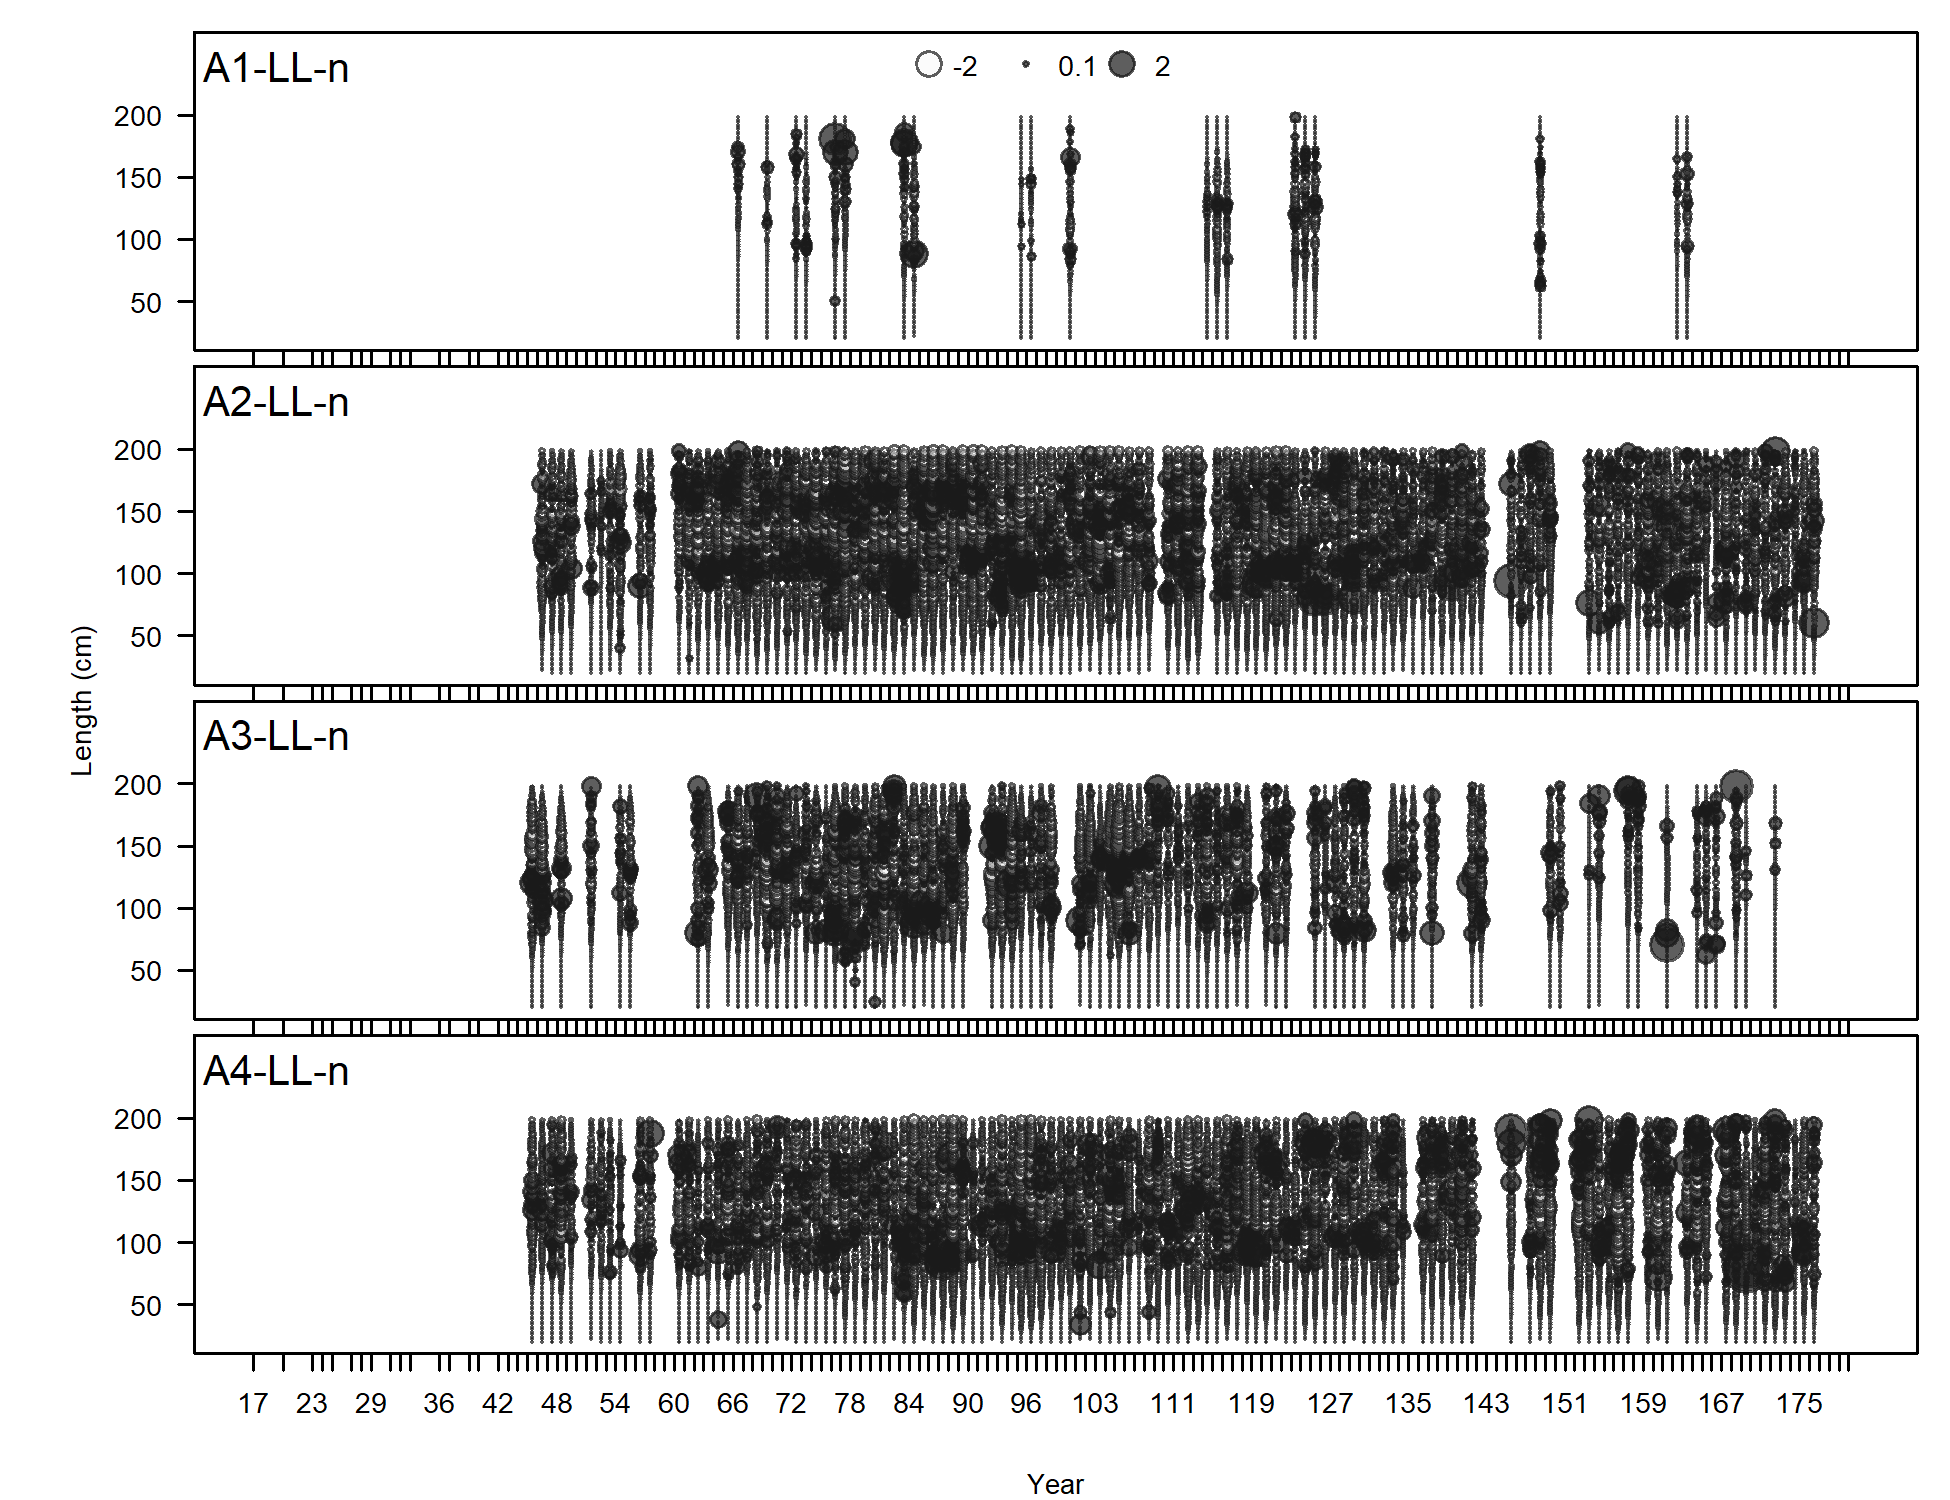
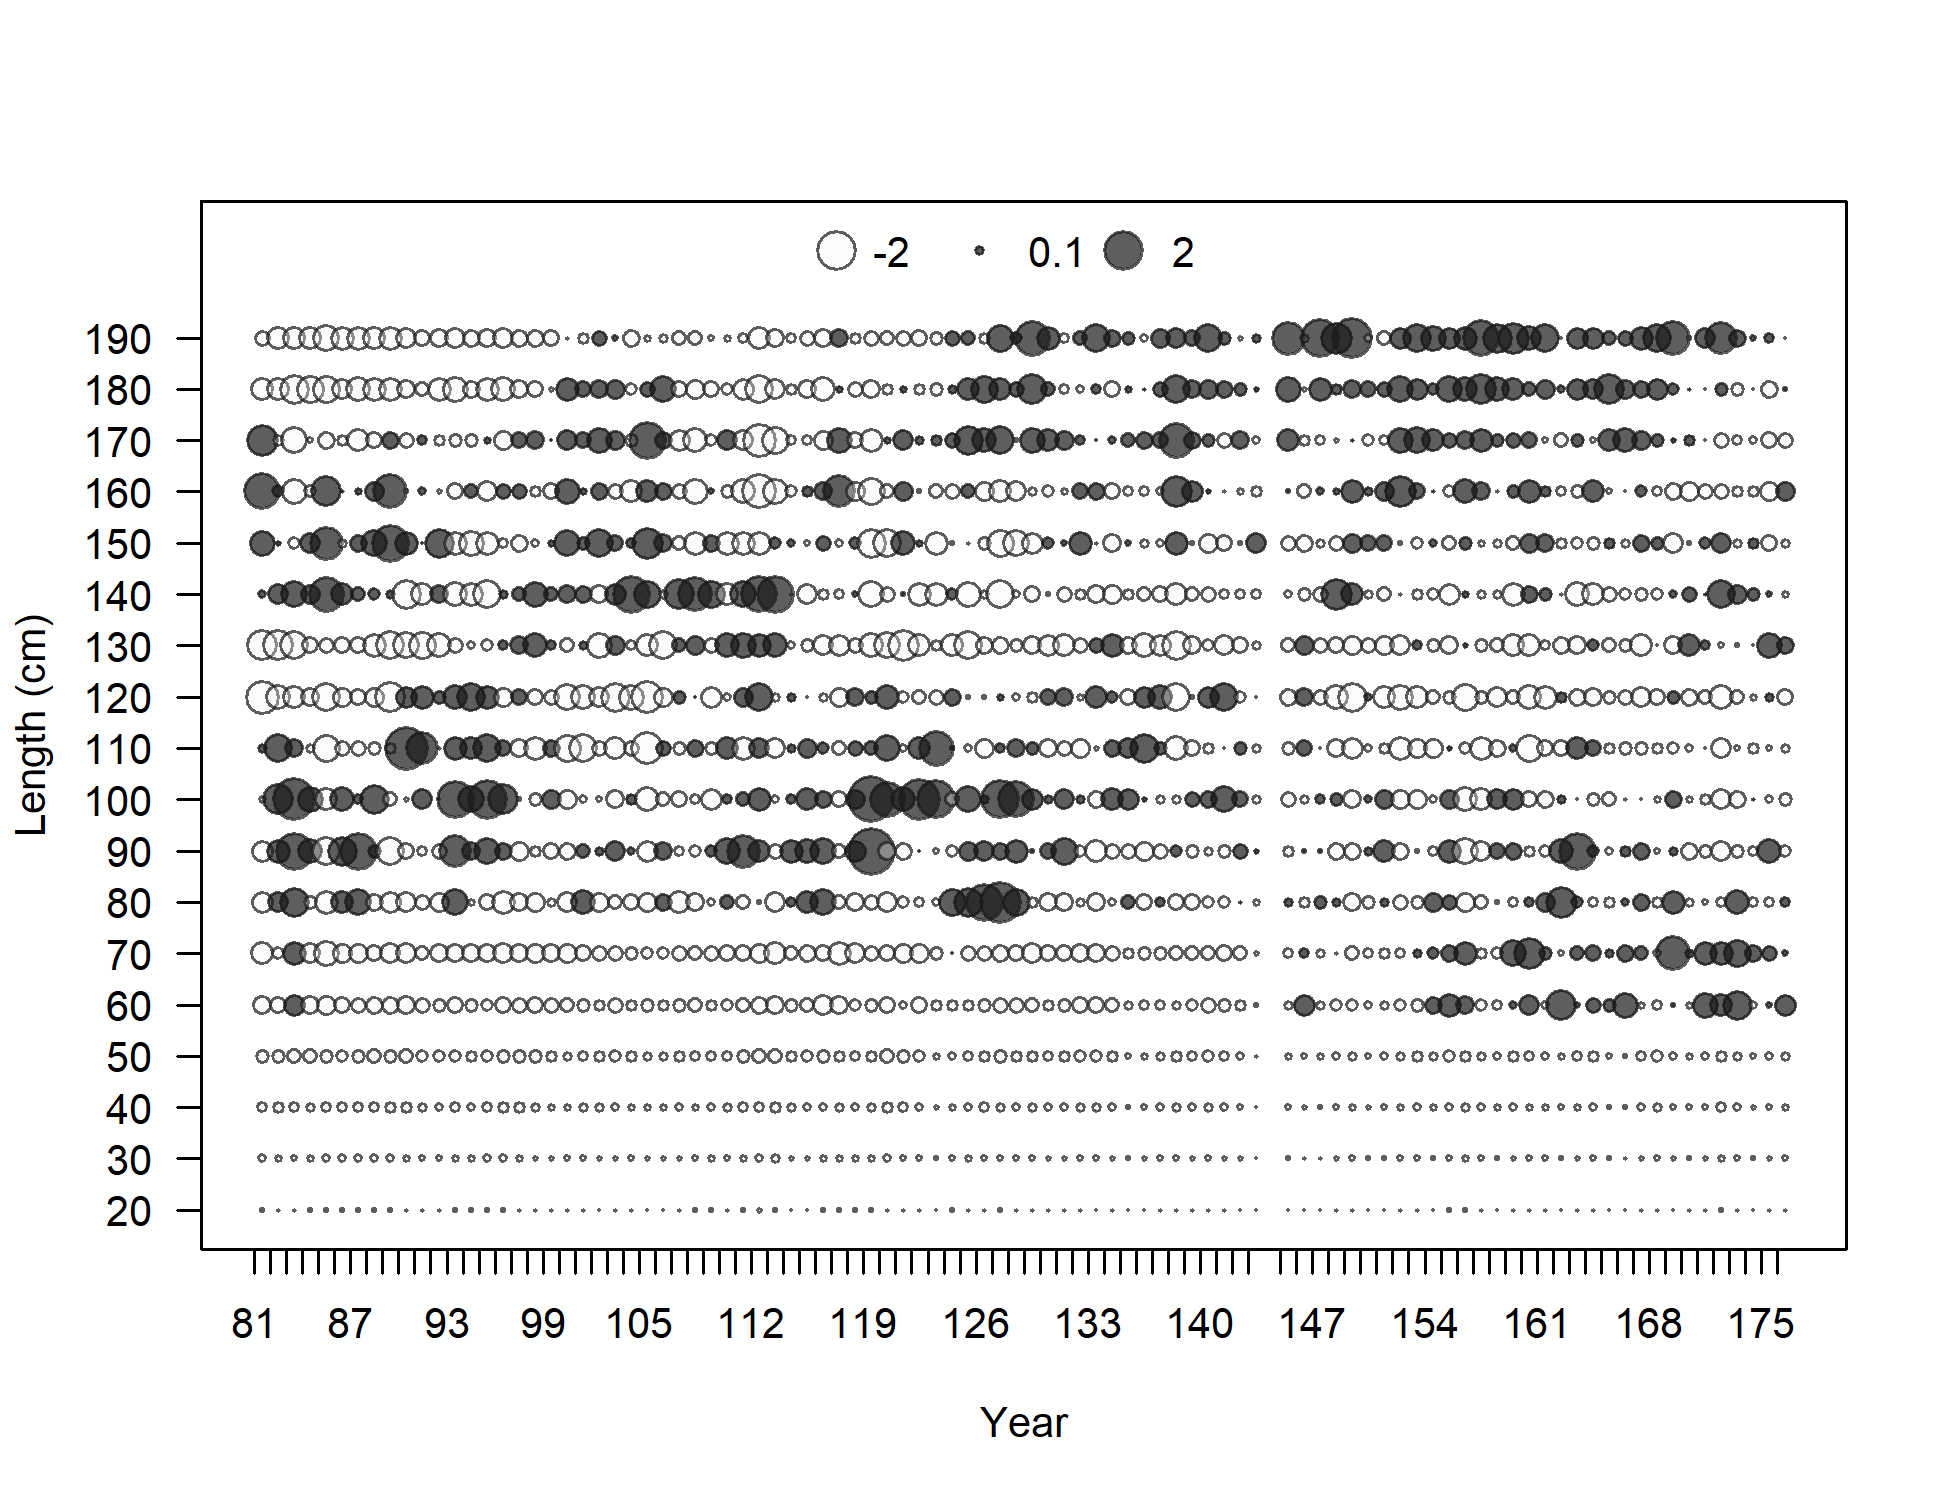
Pearson residuals, whole catch, A1-LL-n (max=3.16) (plot 2 of 2)
Closed bubbles are positive residuals (observed > expected) and open bubbles are negative residuals (observed < expected).
file: comp_lenfit_residsflt1mkt0_page2.png
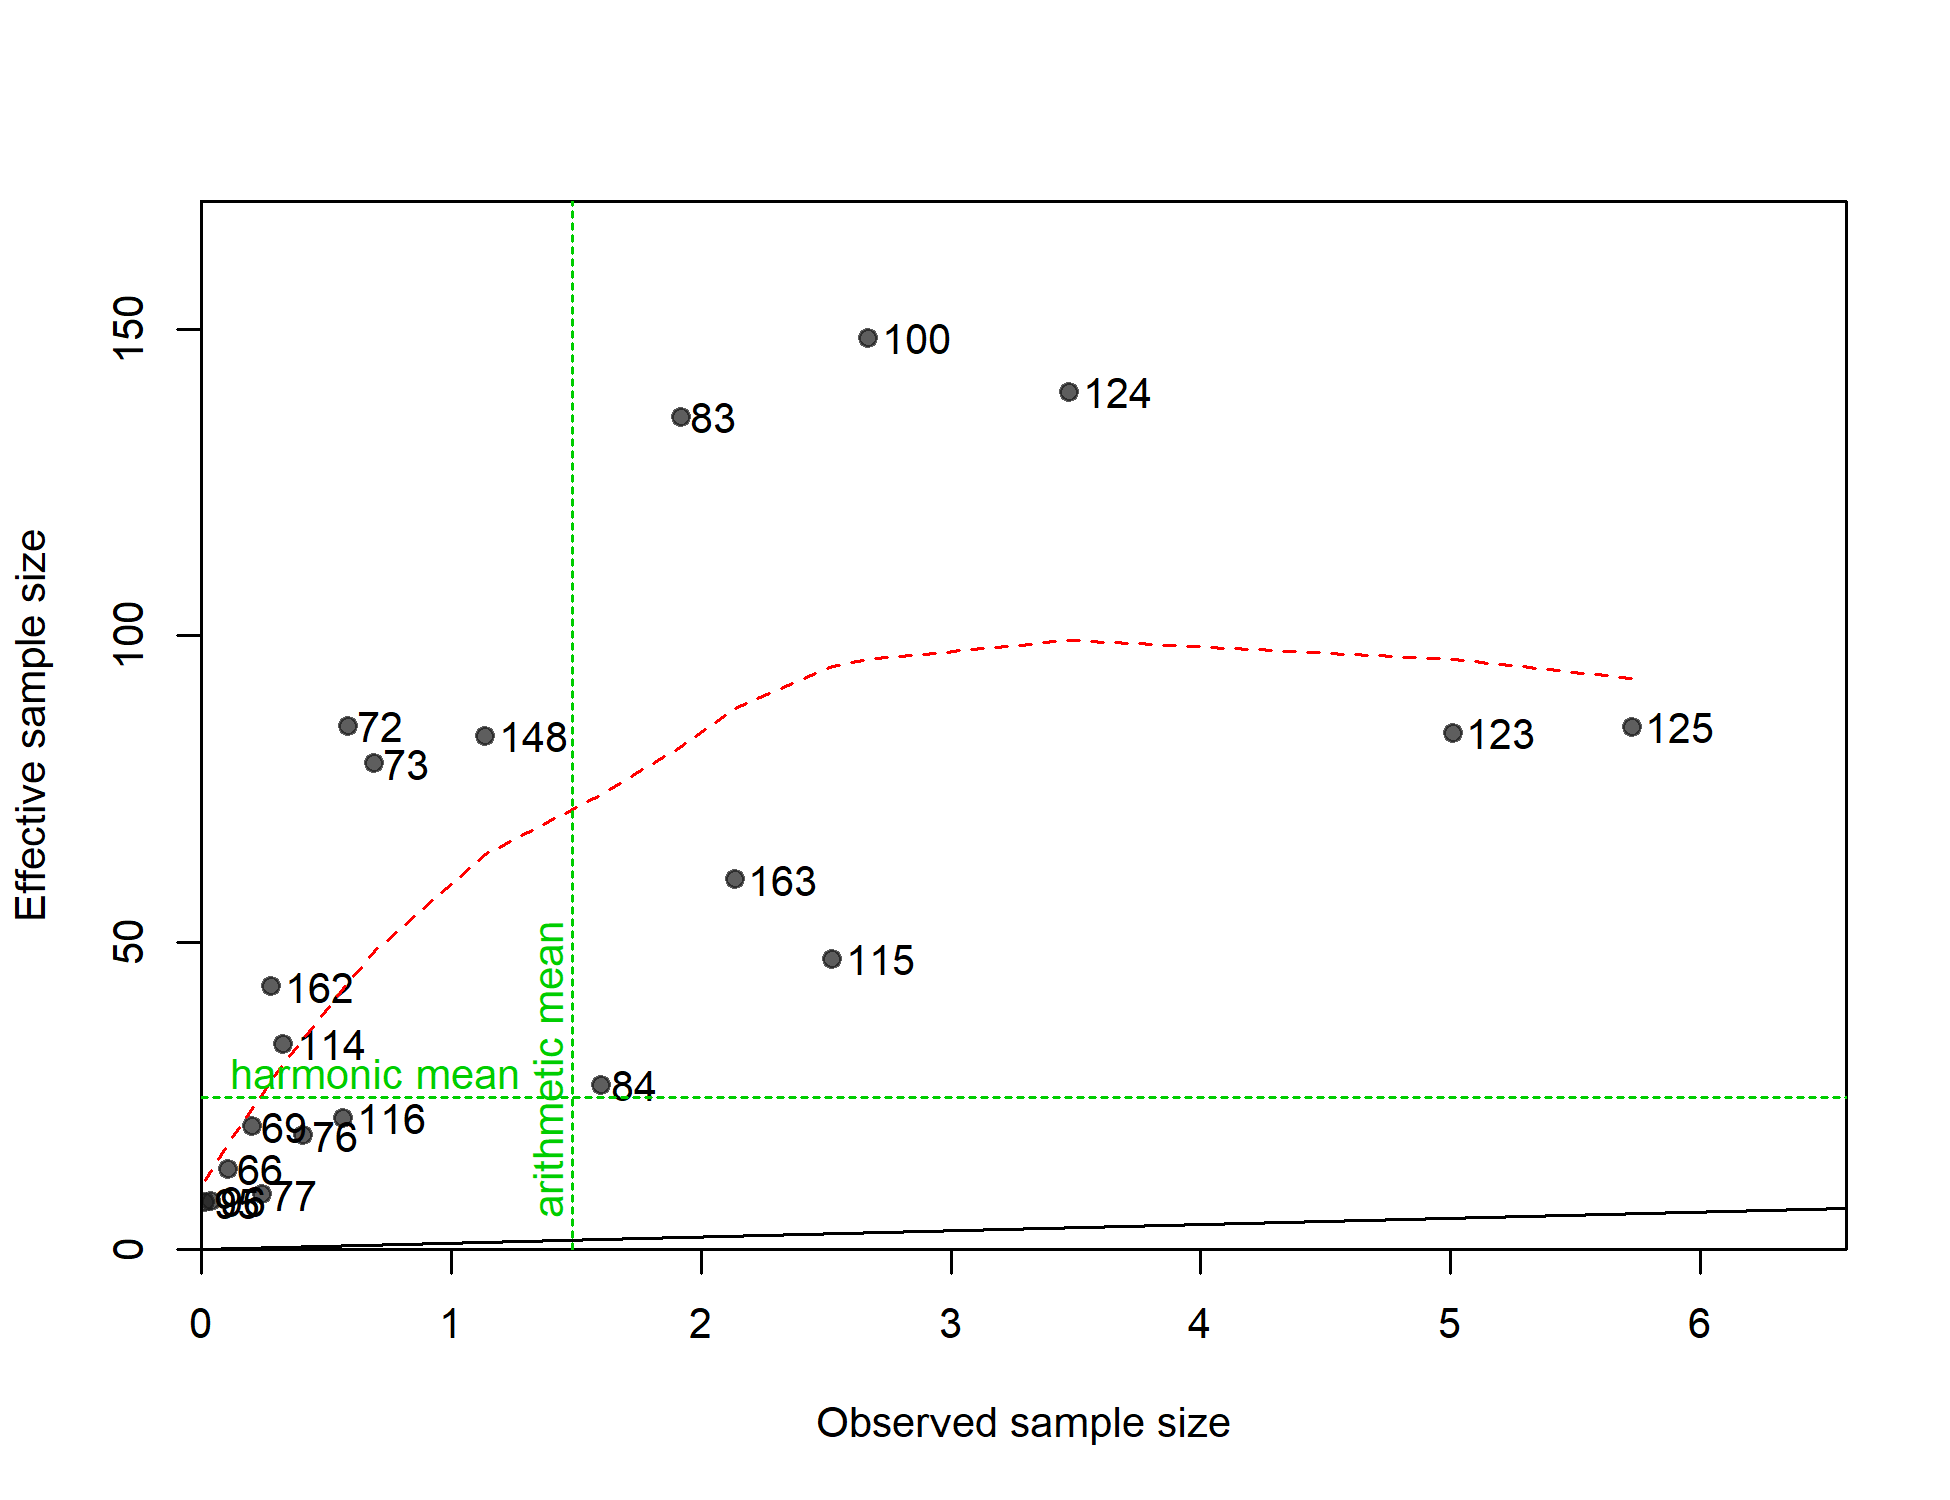
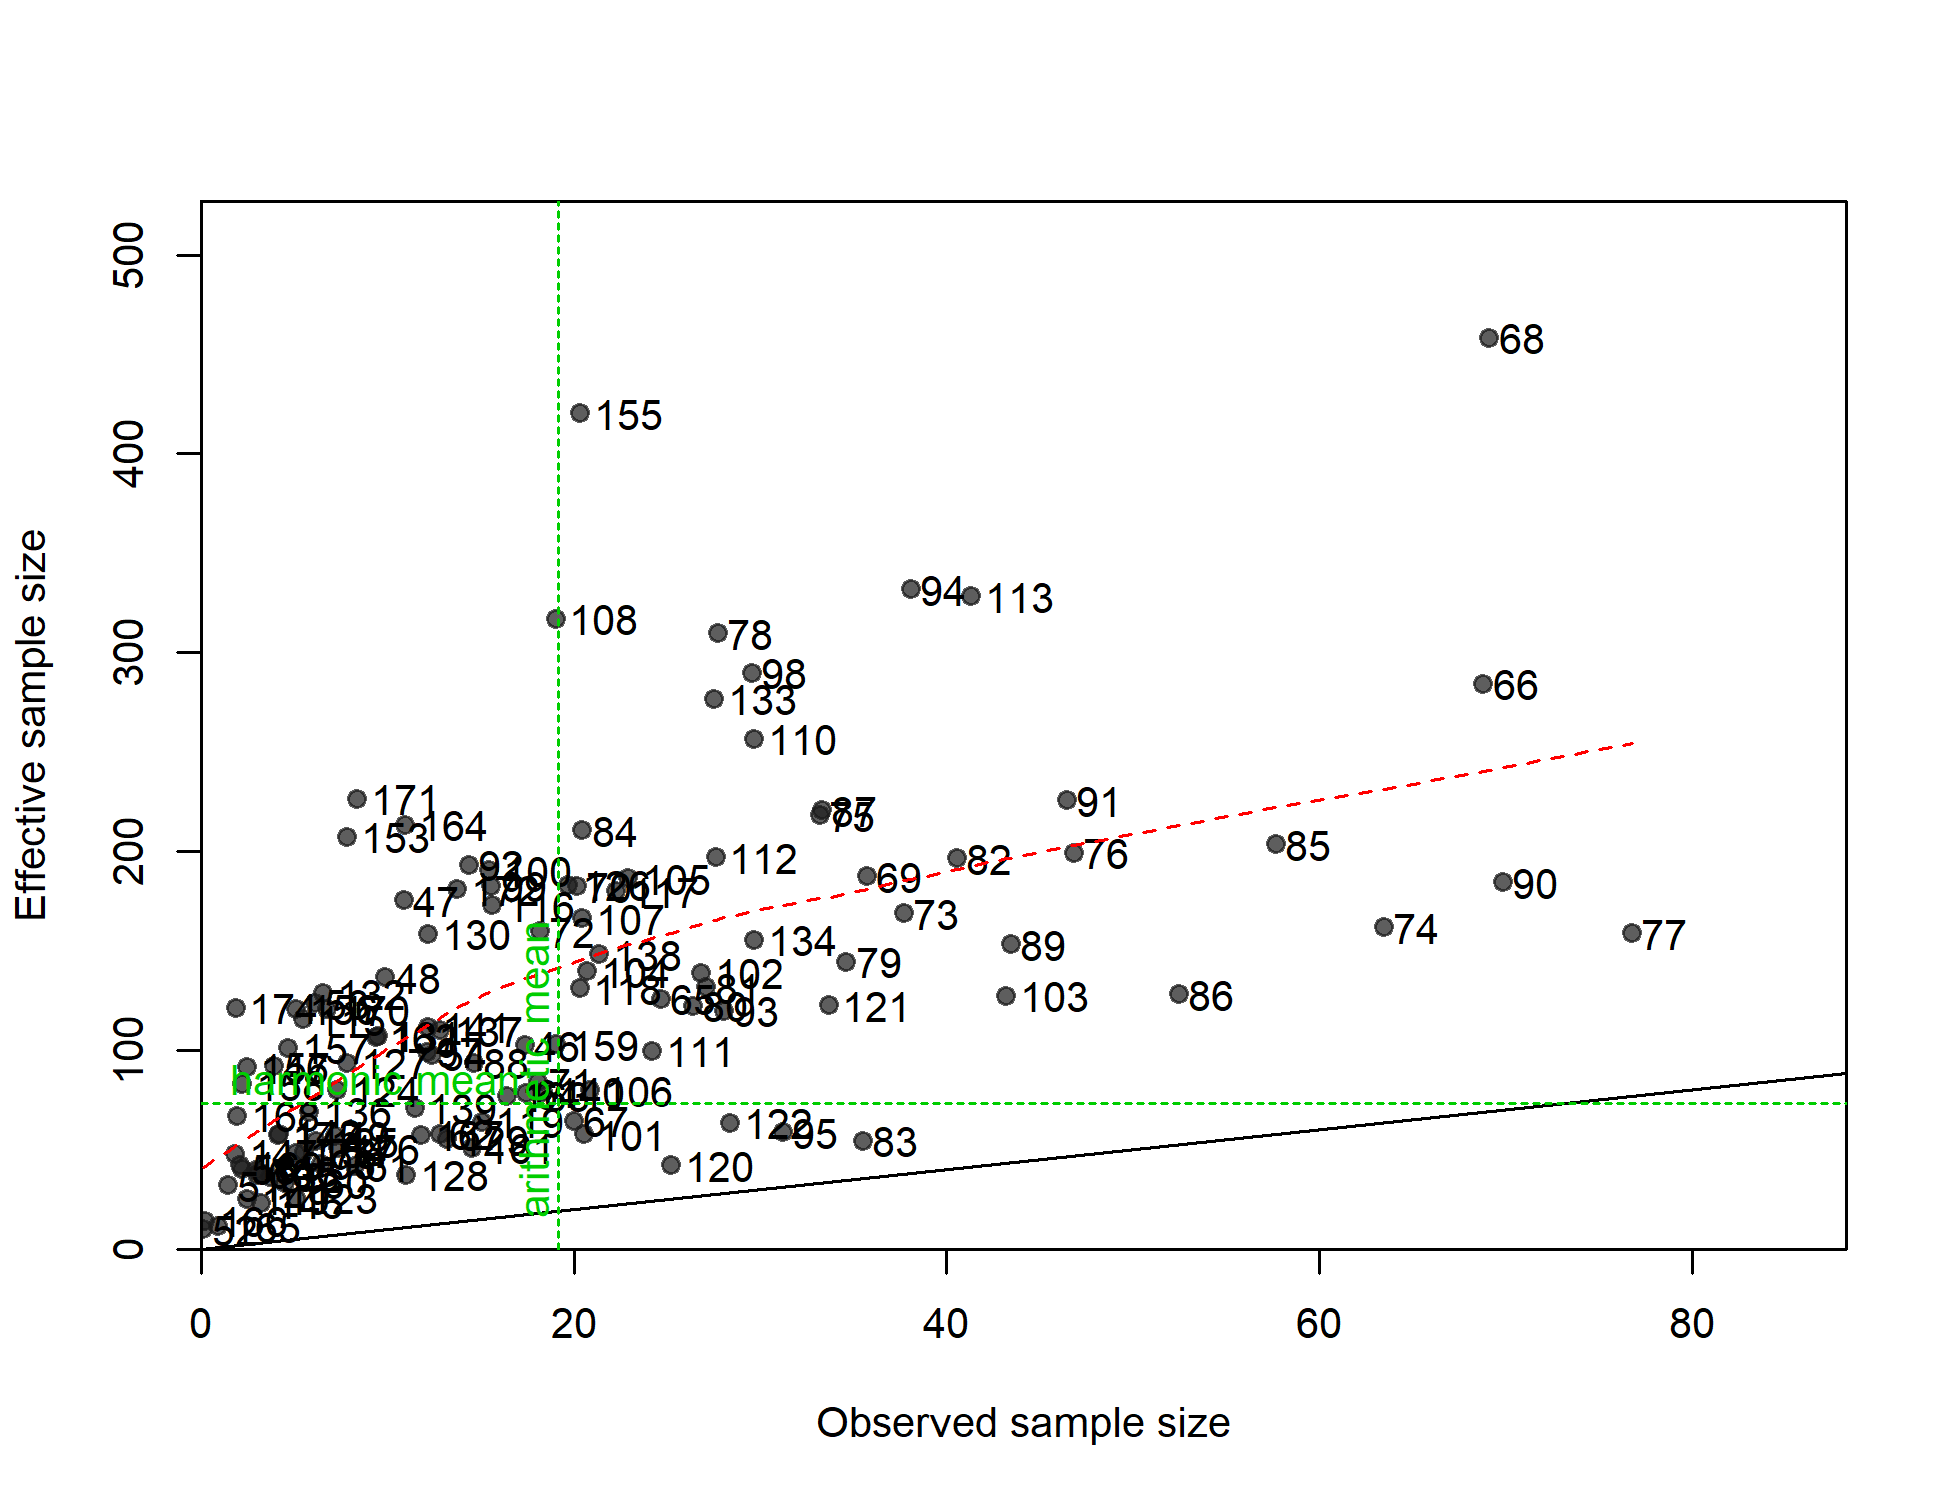
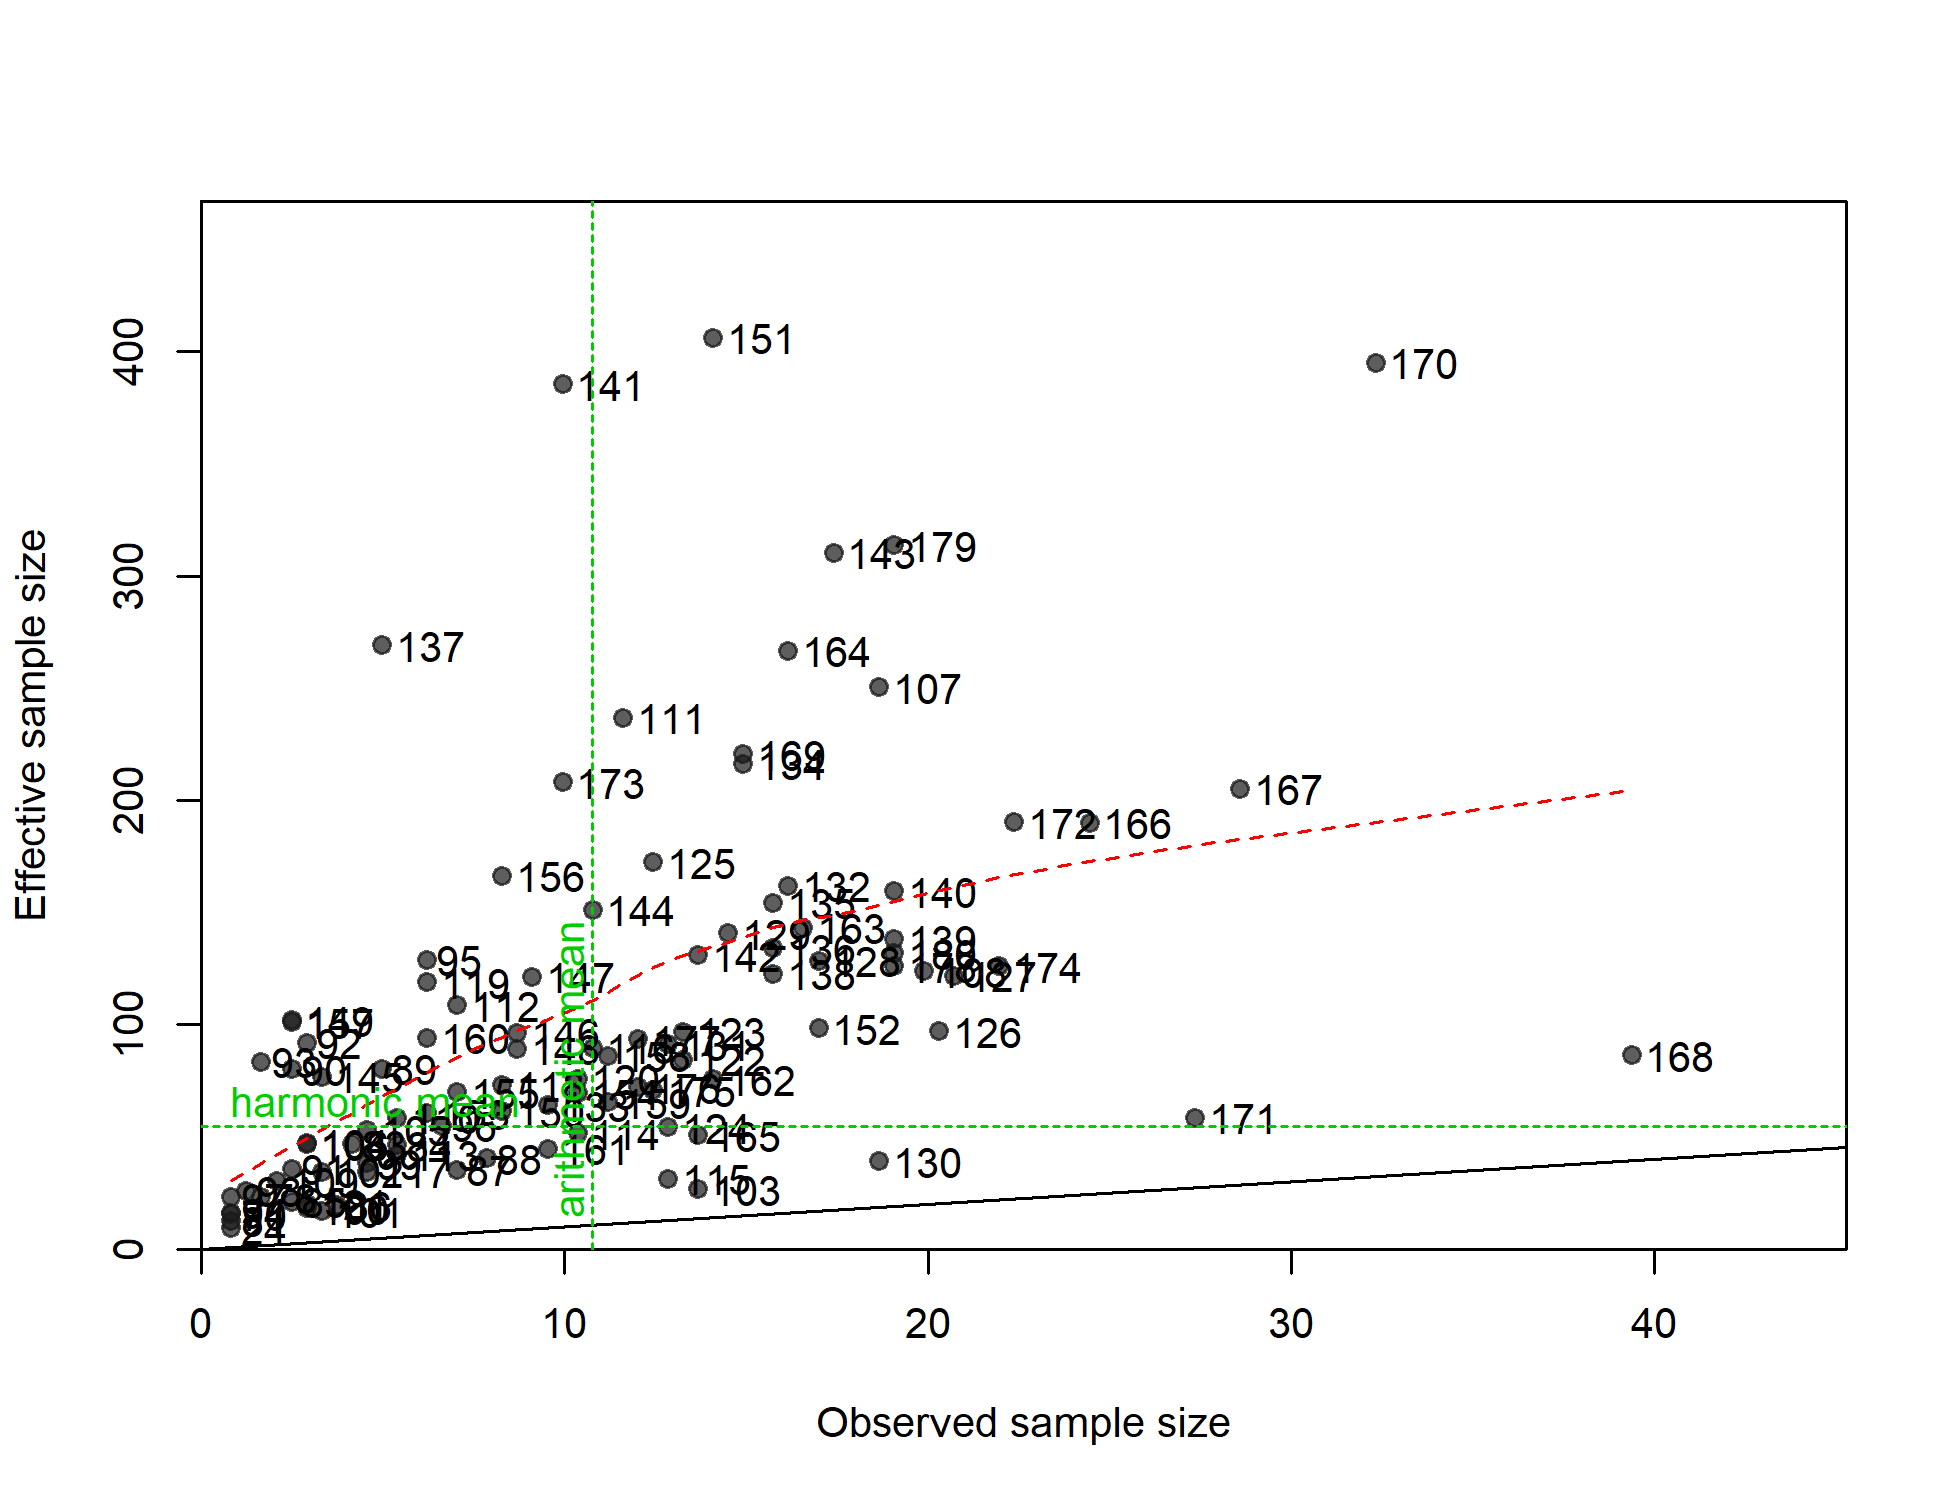
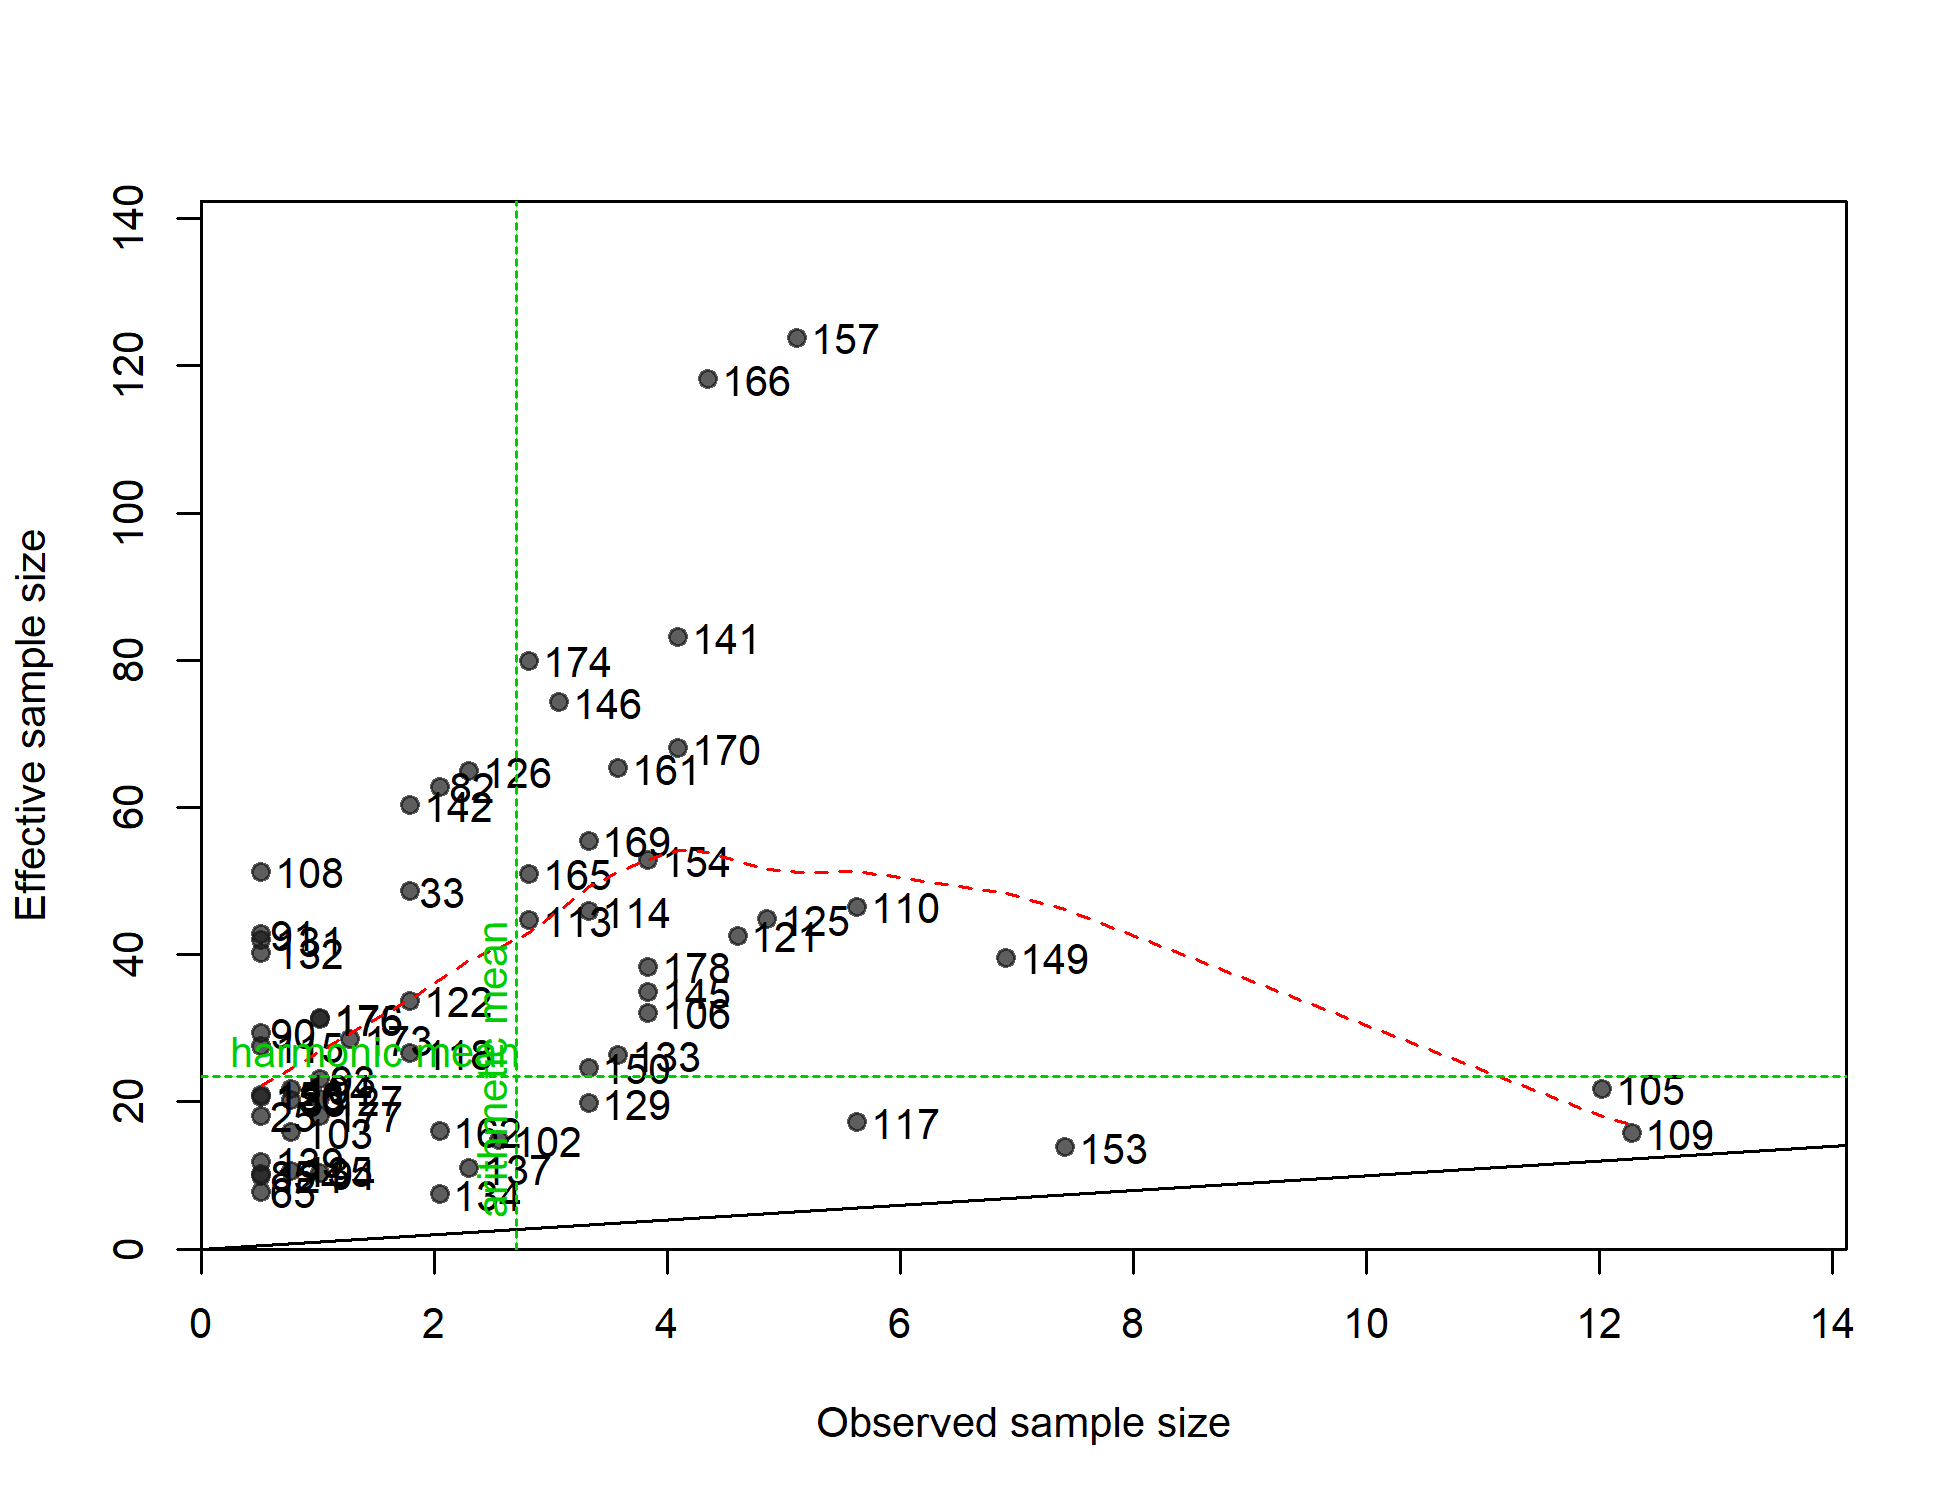
N-EffN comparison, Length comps, whole catch, A1-LL-n
file: comp_lenfit_sampsize_flt1mkt0.png
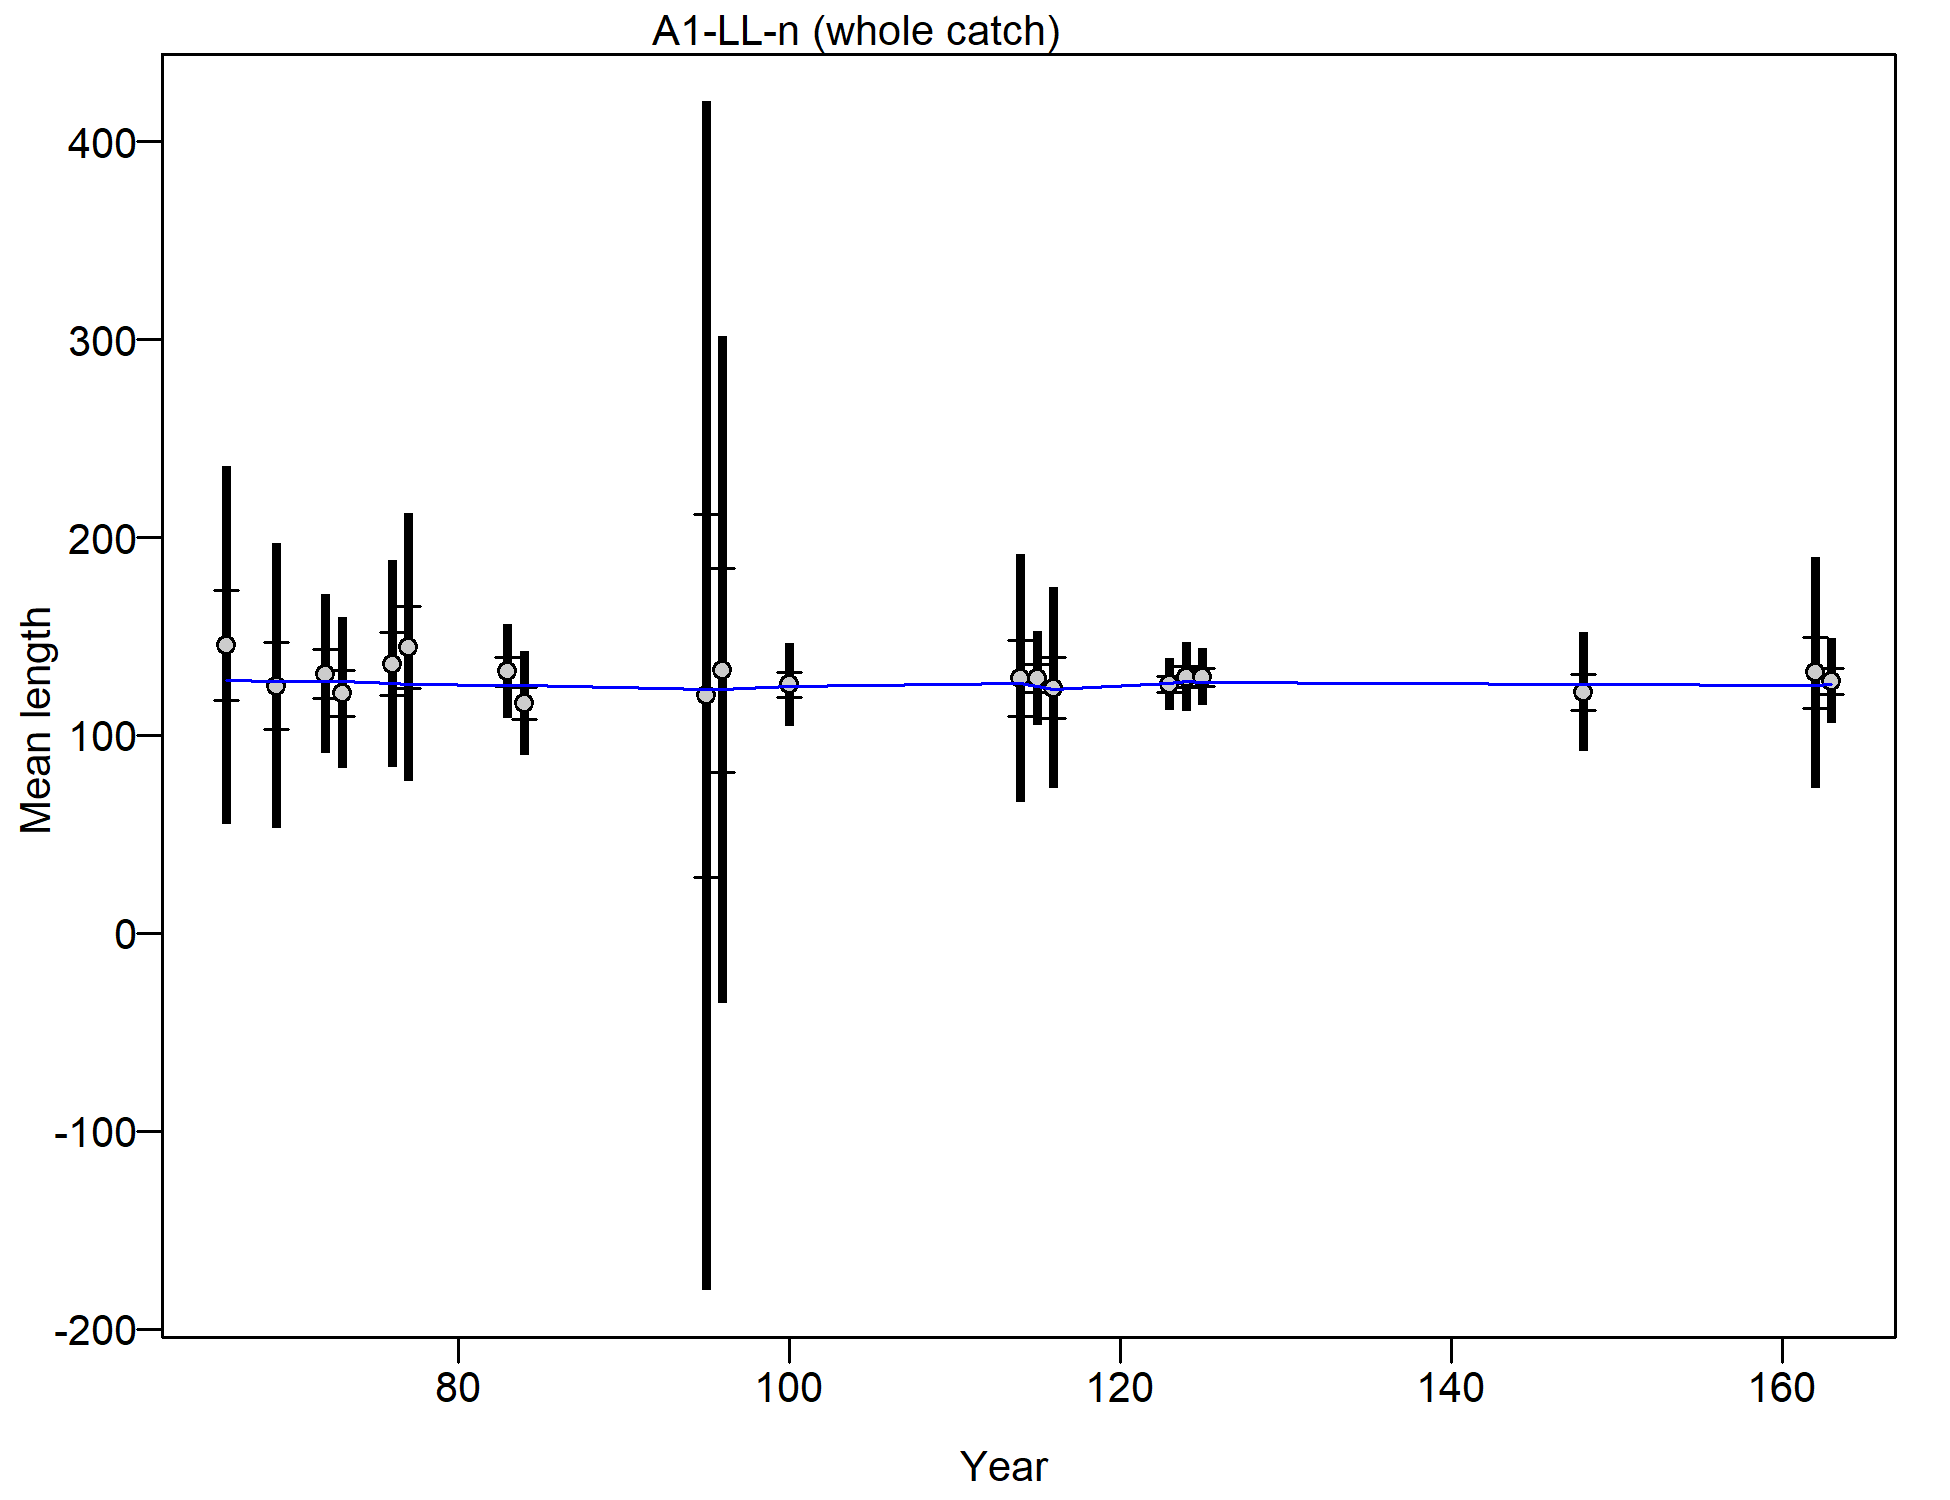
Mean length for A1-LL-n with 95% confidence intervals based on current samples sizes.
Francis data weighting method TA1.8: thinner intervals (with capped ends) show result of further adjusting sample sizes based on suggested multiplier (with 95% interval) for len data from A1-LL-n:
10.6988 (6.3381-27.2122)
For more info, see
Francis, R.I.C.C. (2011). Data weighting in statistical fisheries stock assessment models. Can. J. Fish. Aquat. Sci. 68: 1124-1138. https://doi.org/10.1139/f2011-025
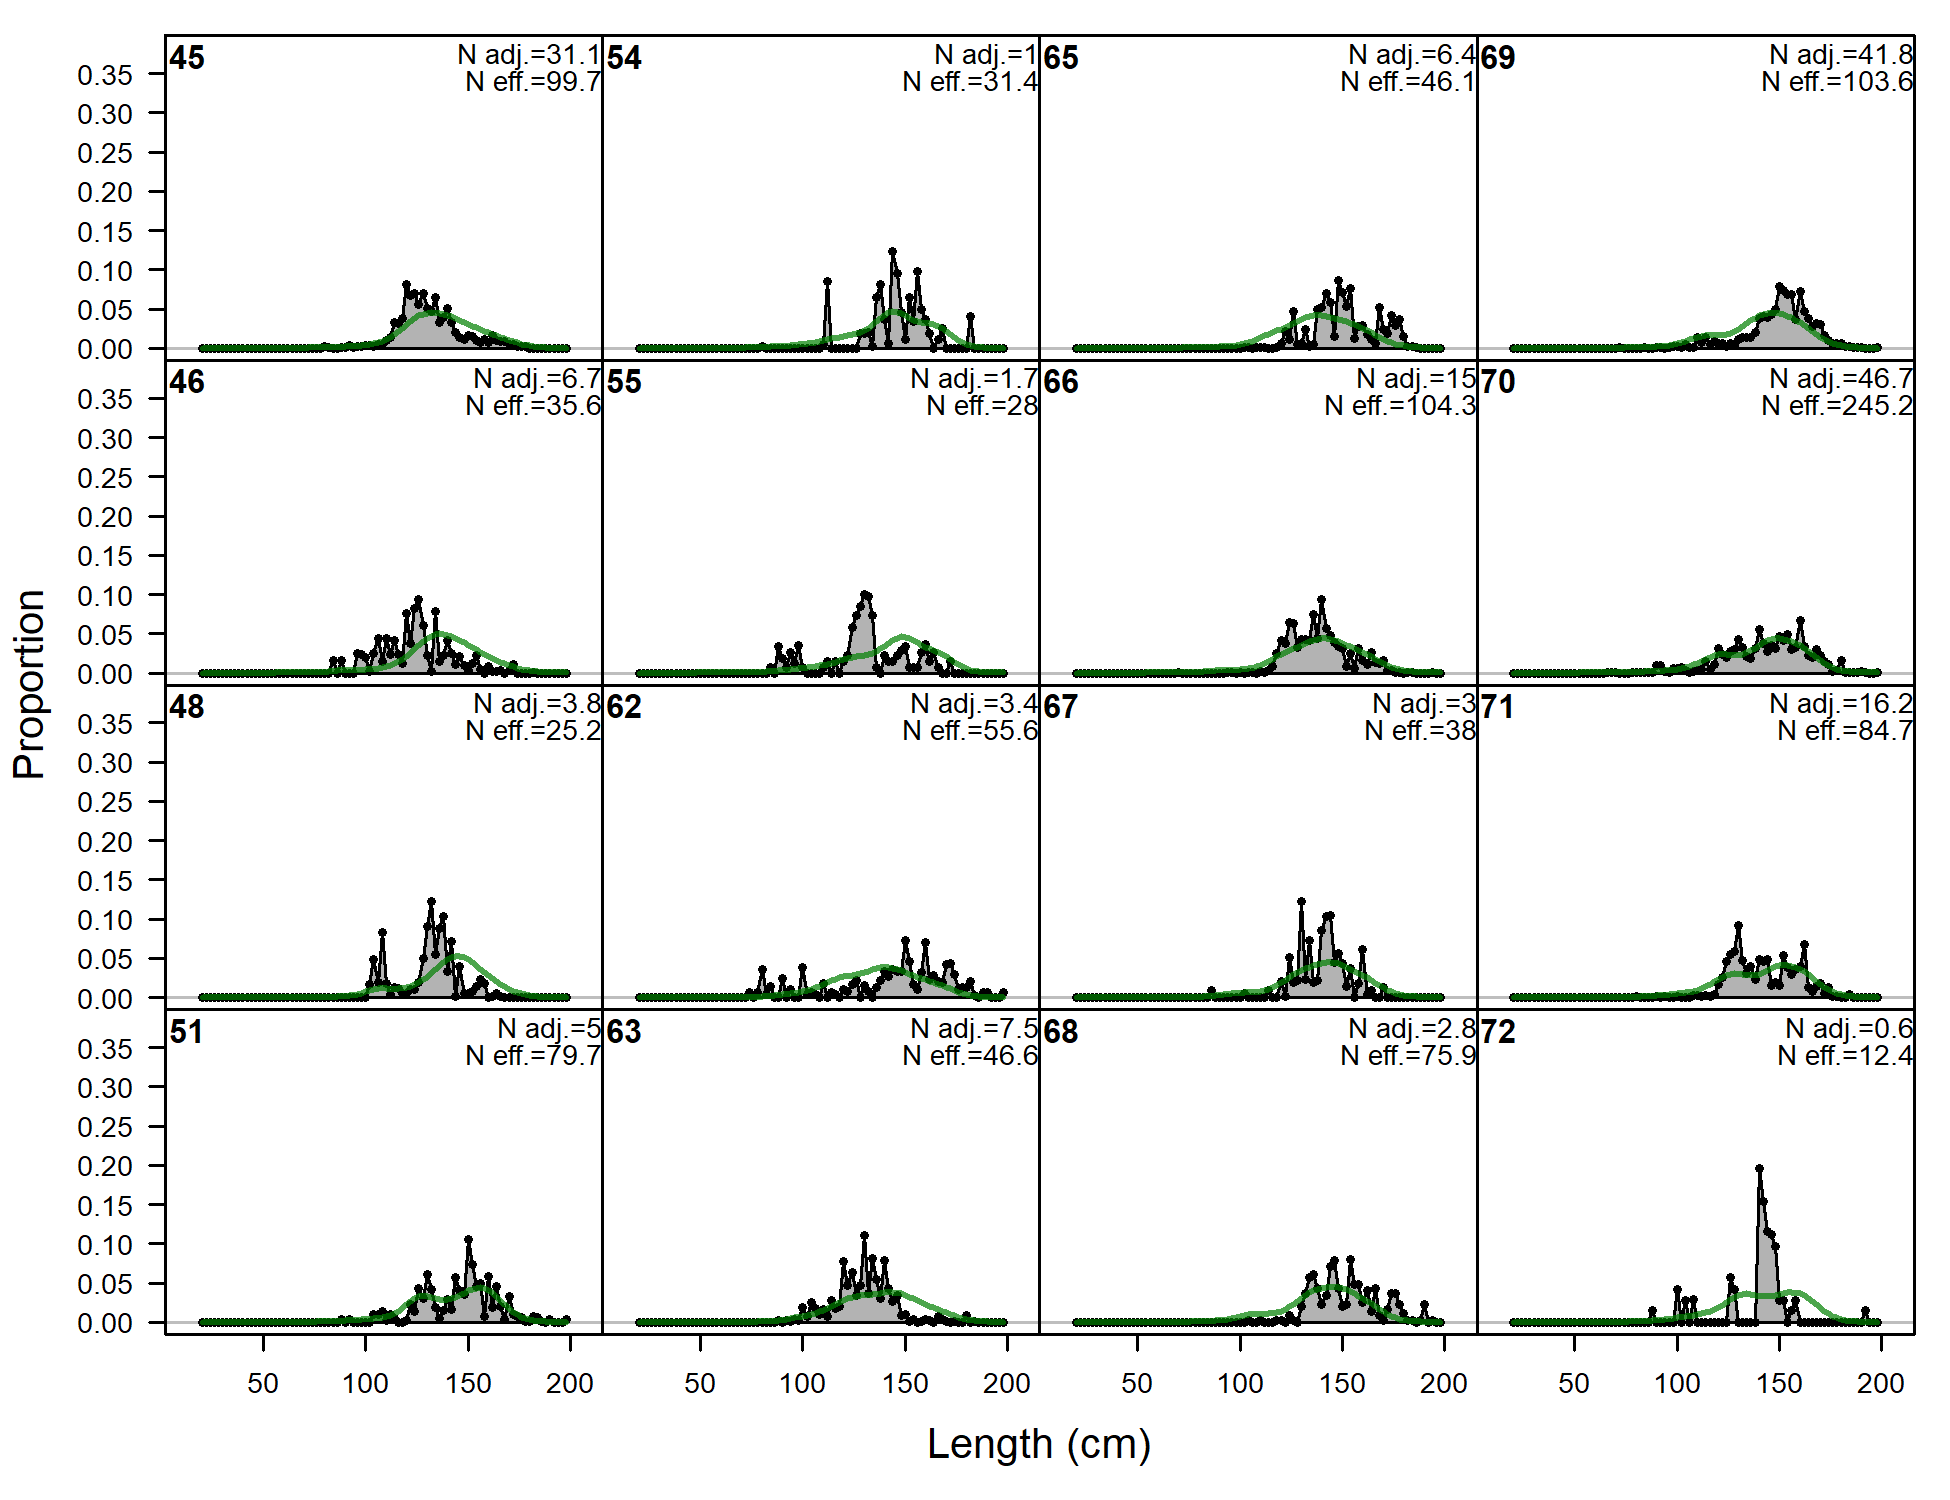
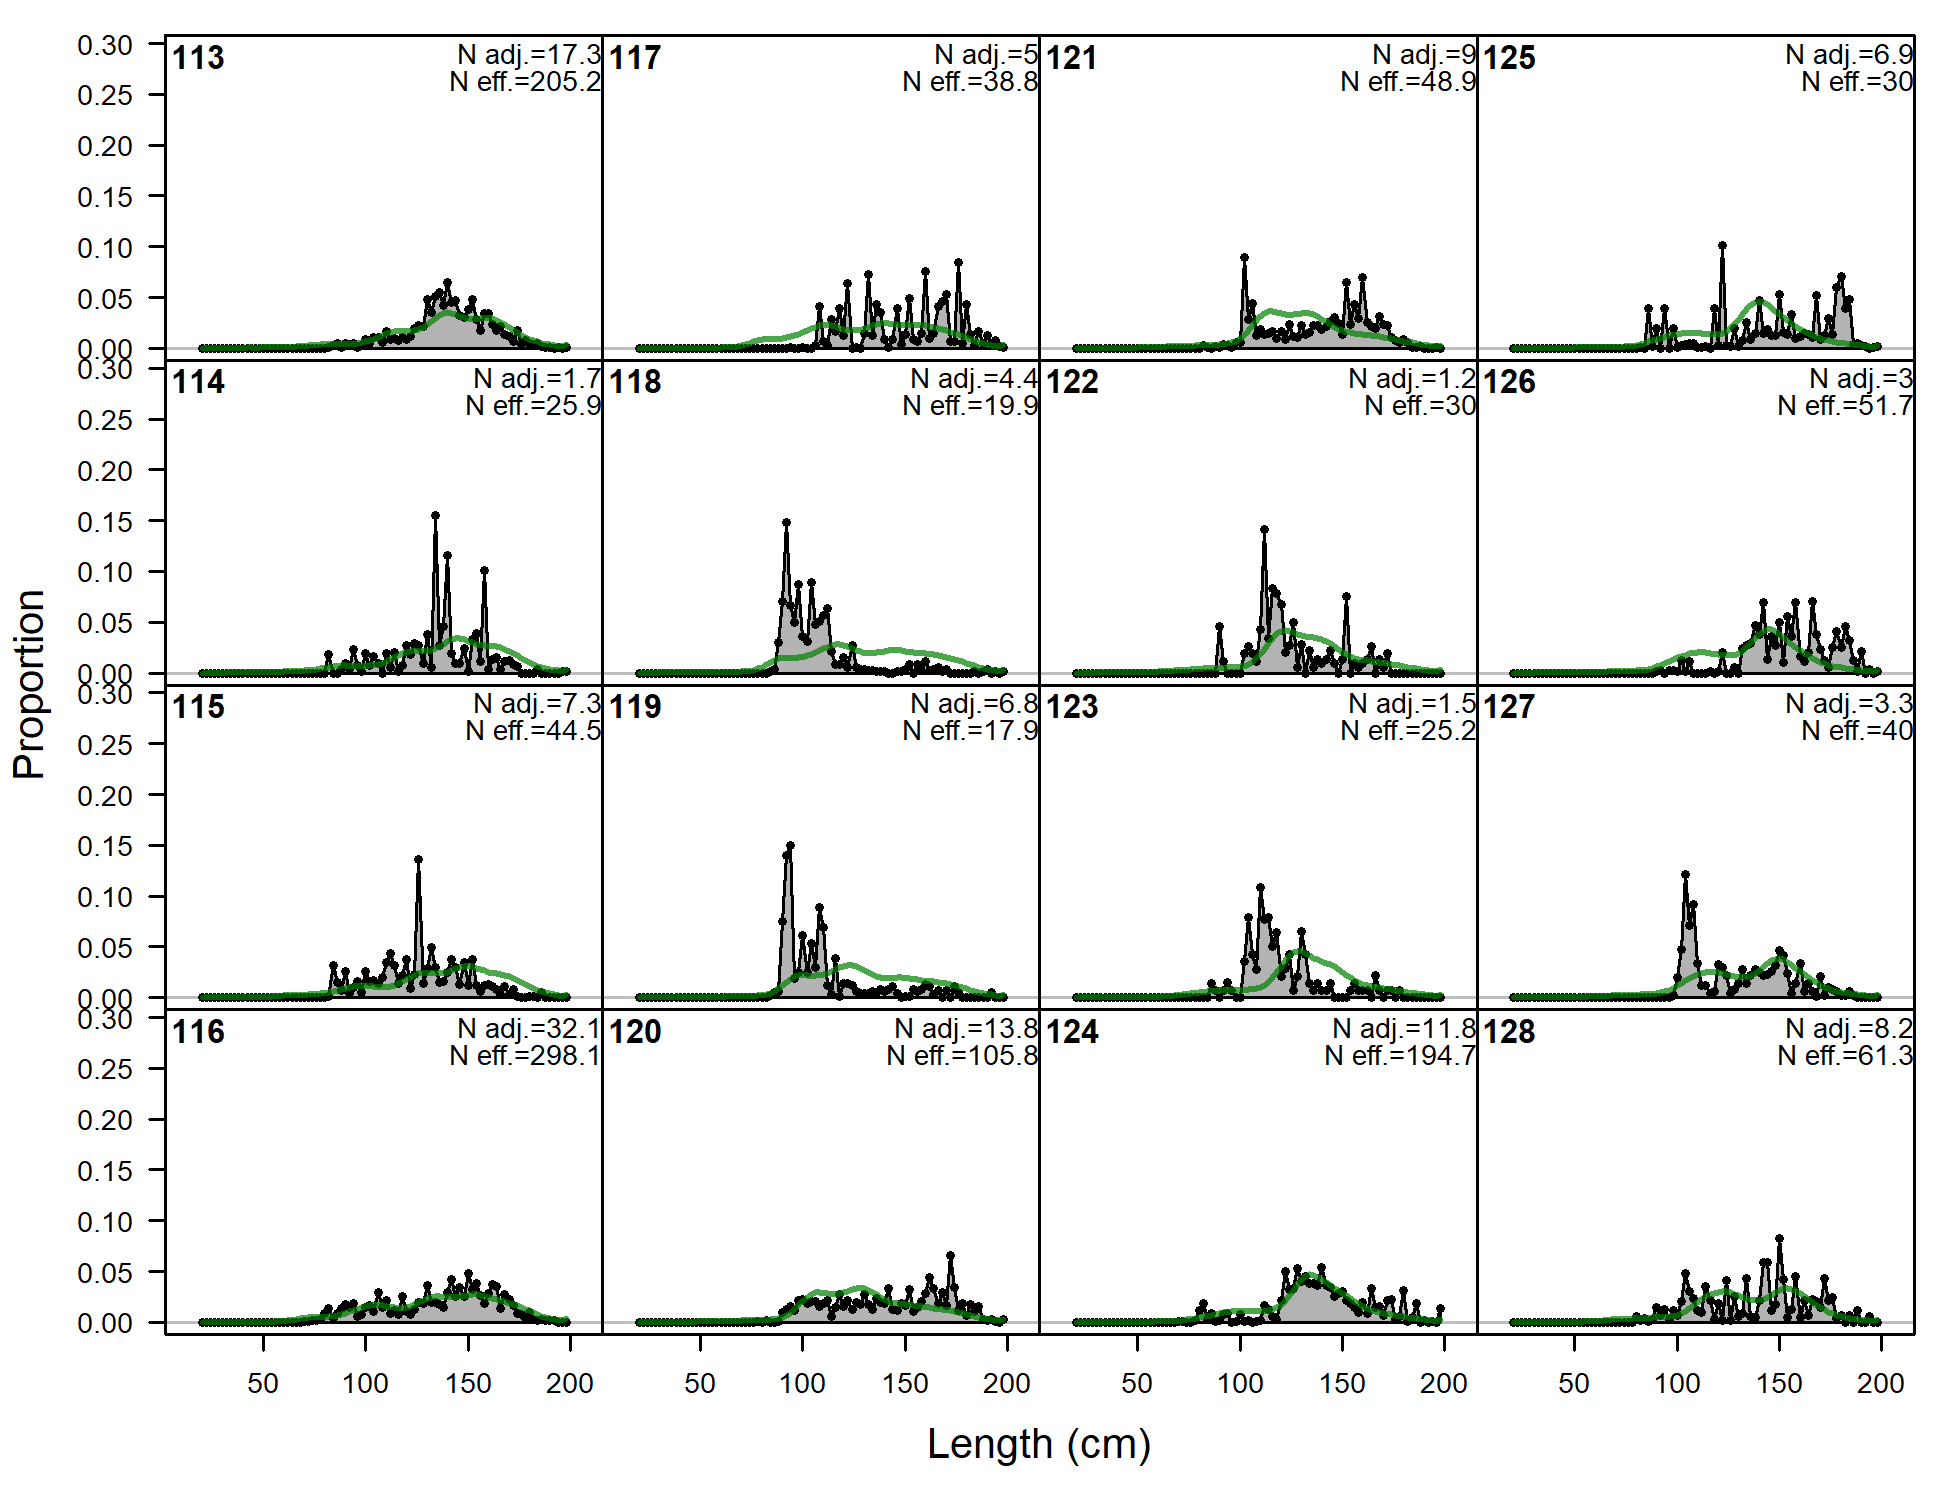
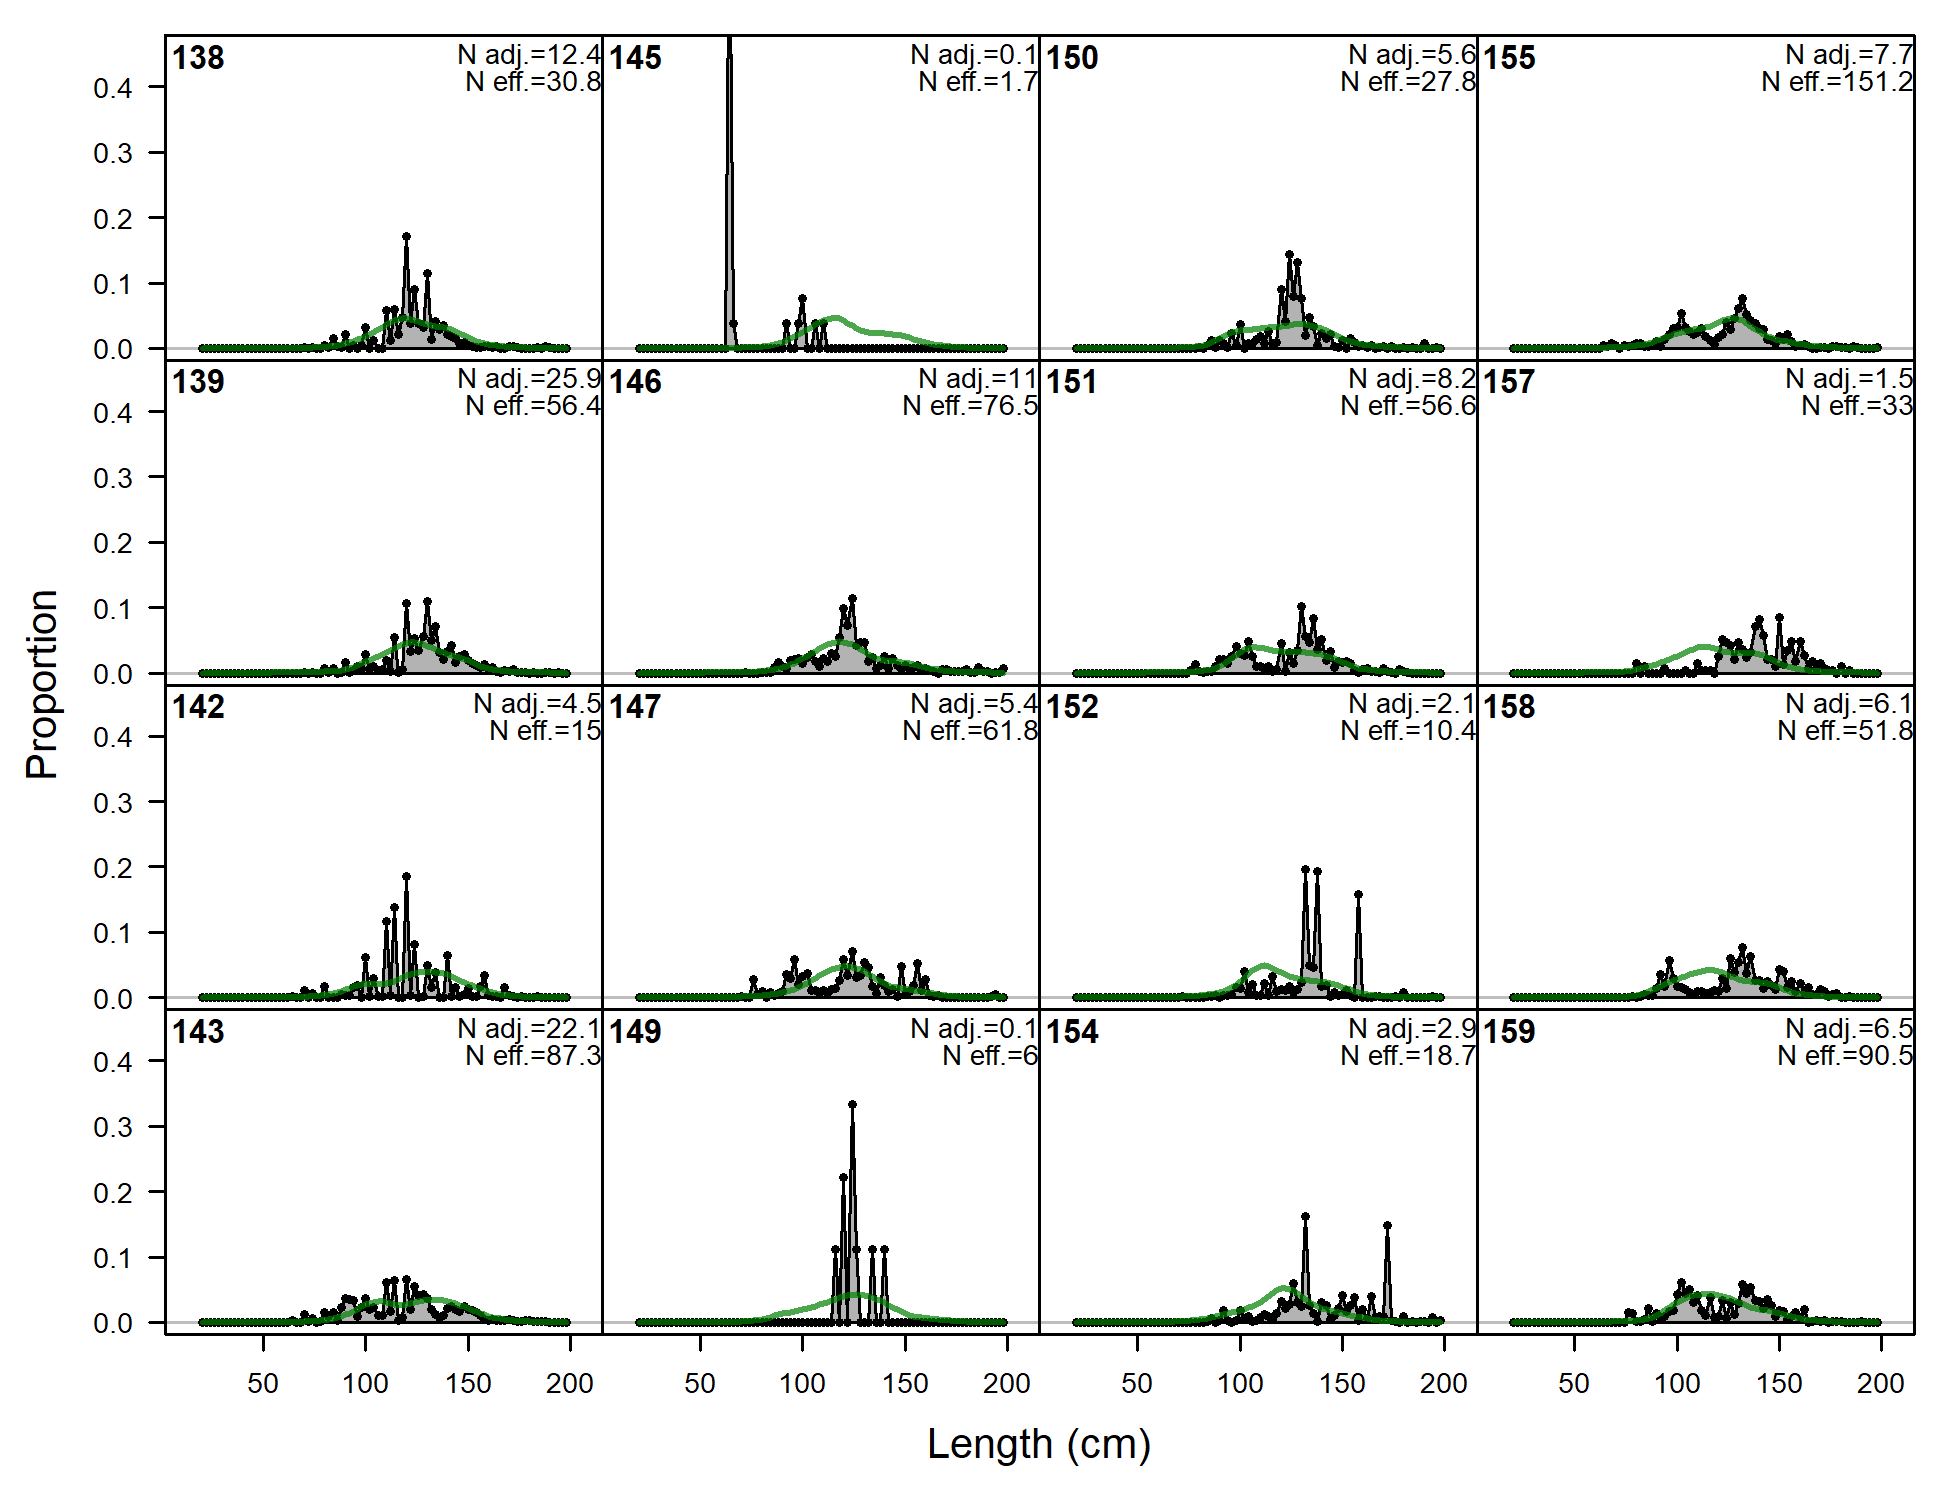
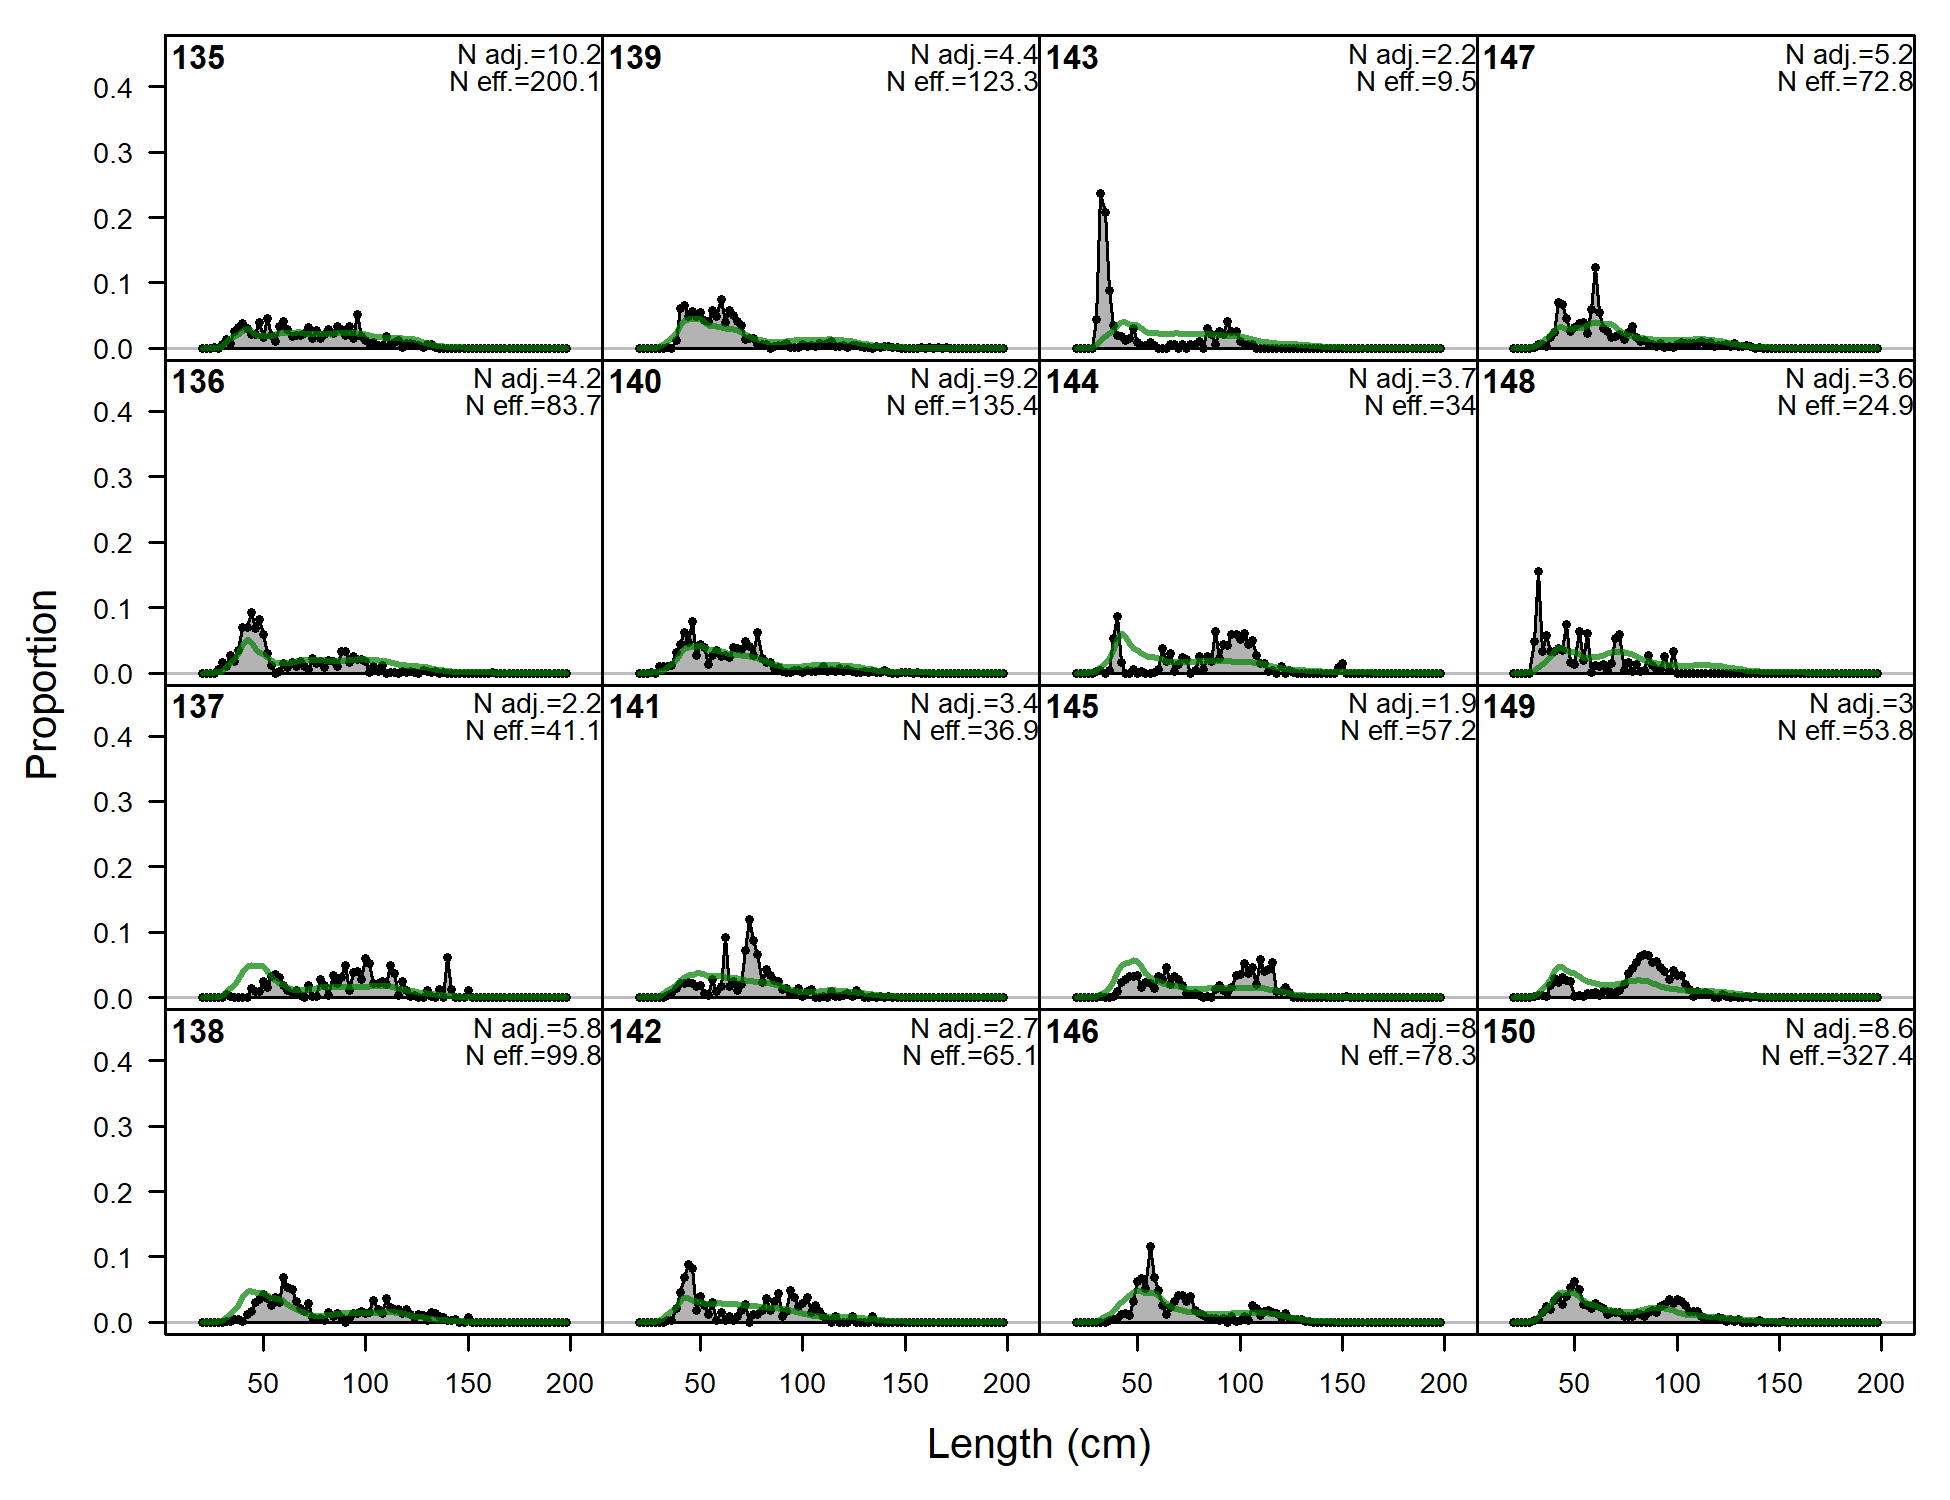
Length comps, whole catch, A2-LL-n (plot 1 of 8).
'N adj.' is the input sample size after data-weighting adjustment. N eff. is the calculated effective sample size used in the McAllister-Iannelli tuning method.
file: comp_lenfit_flt2mkt0_page1.png
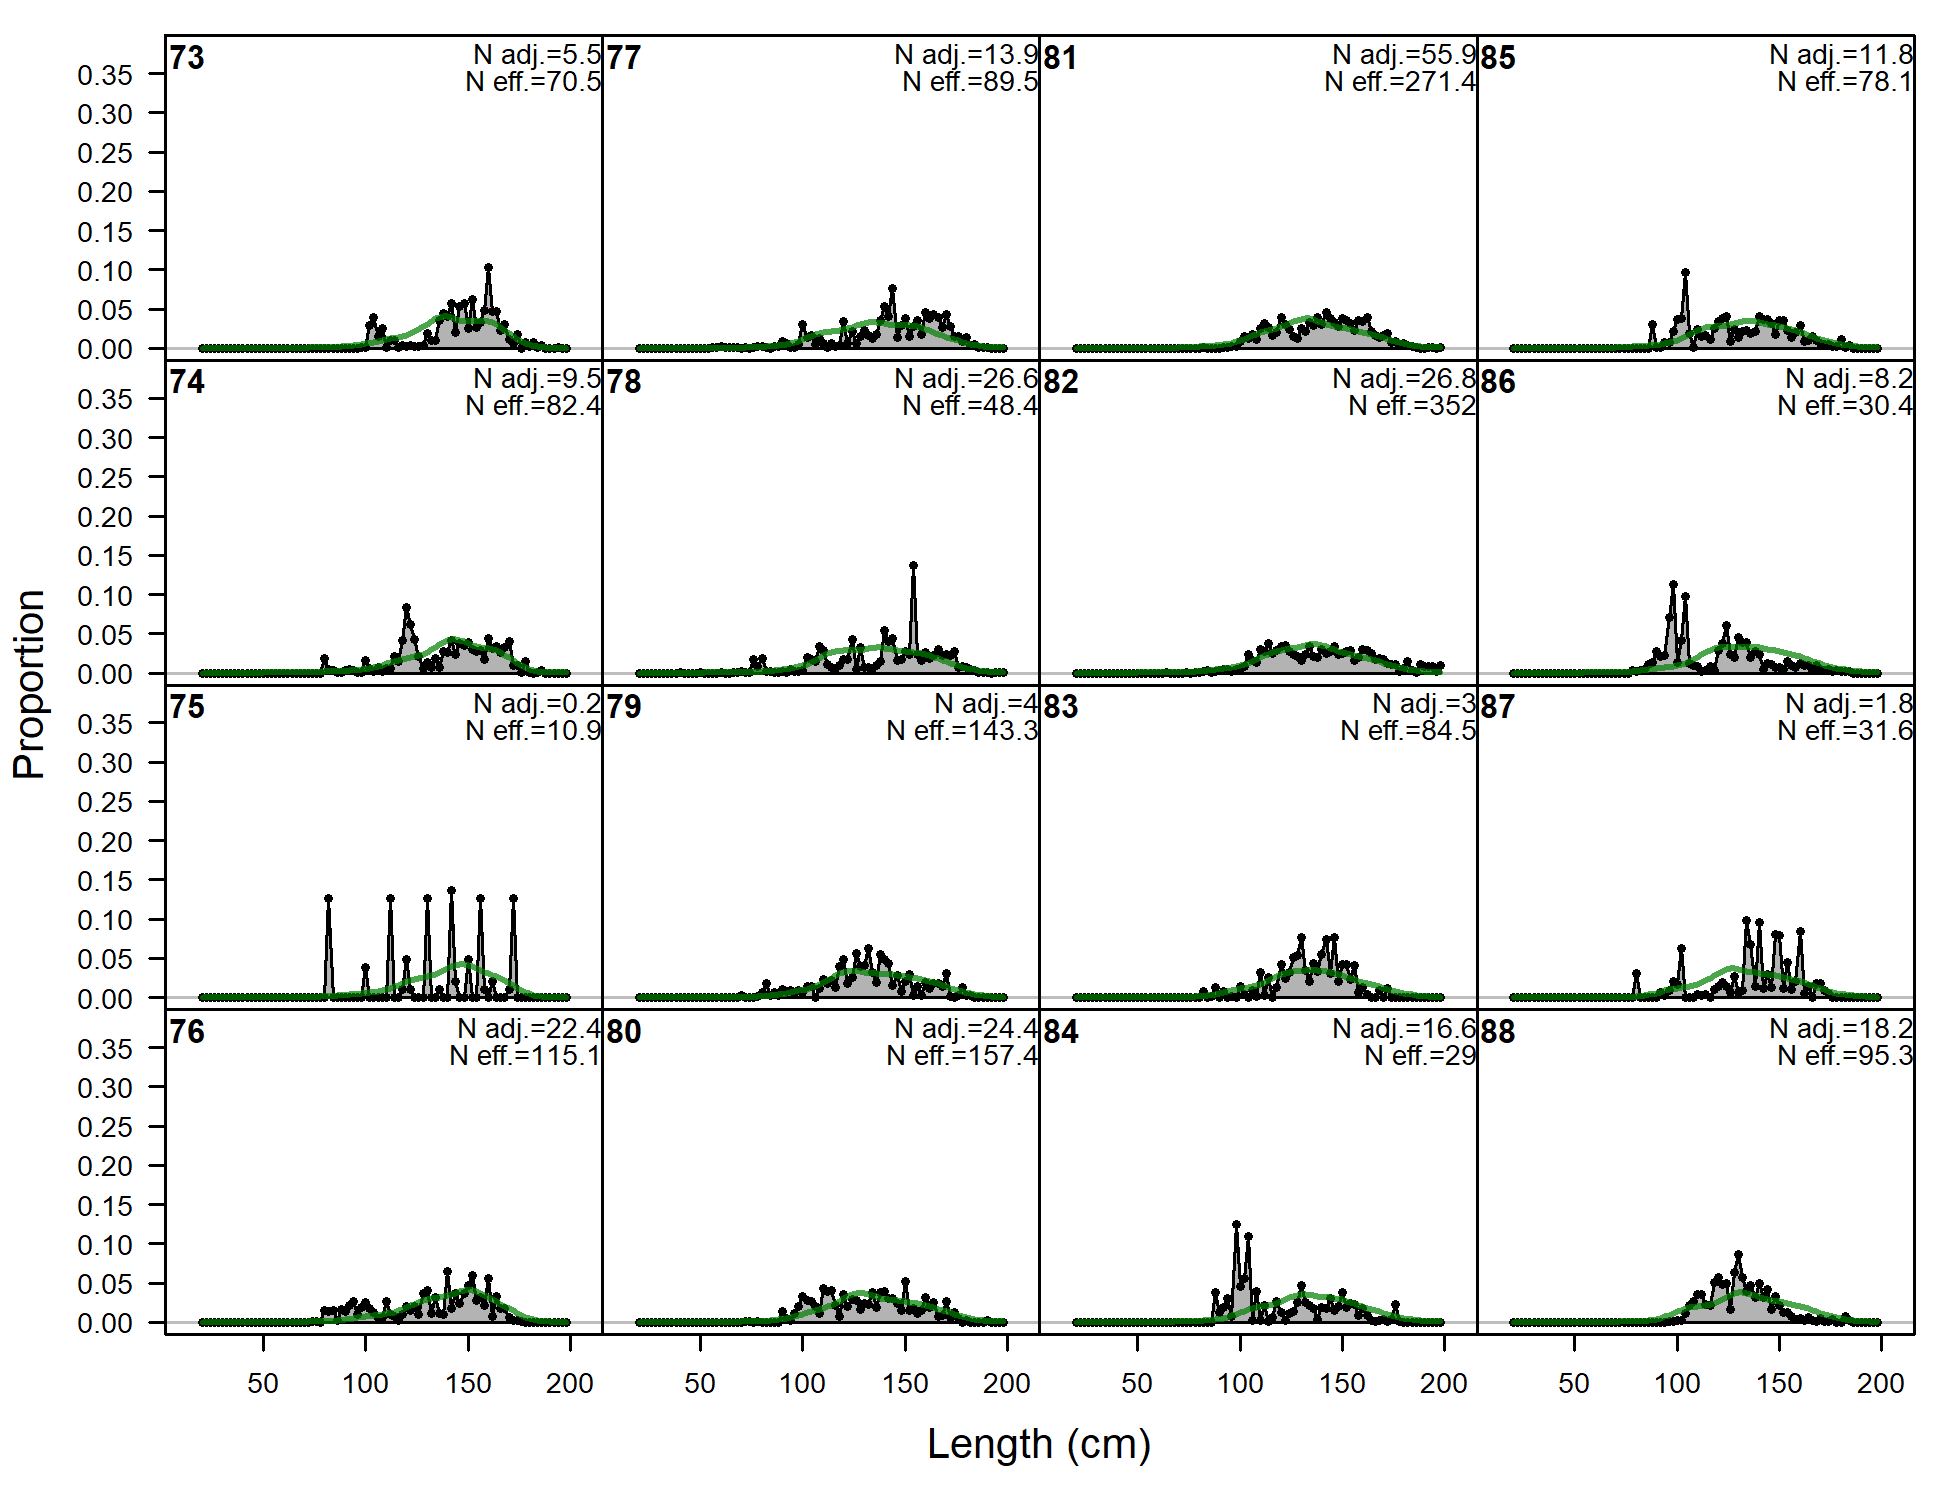
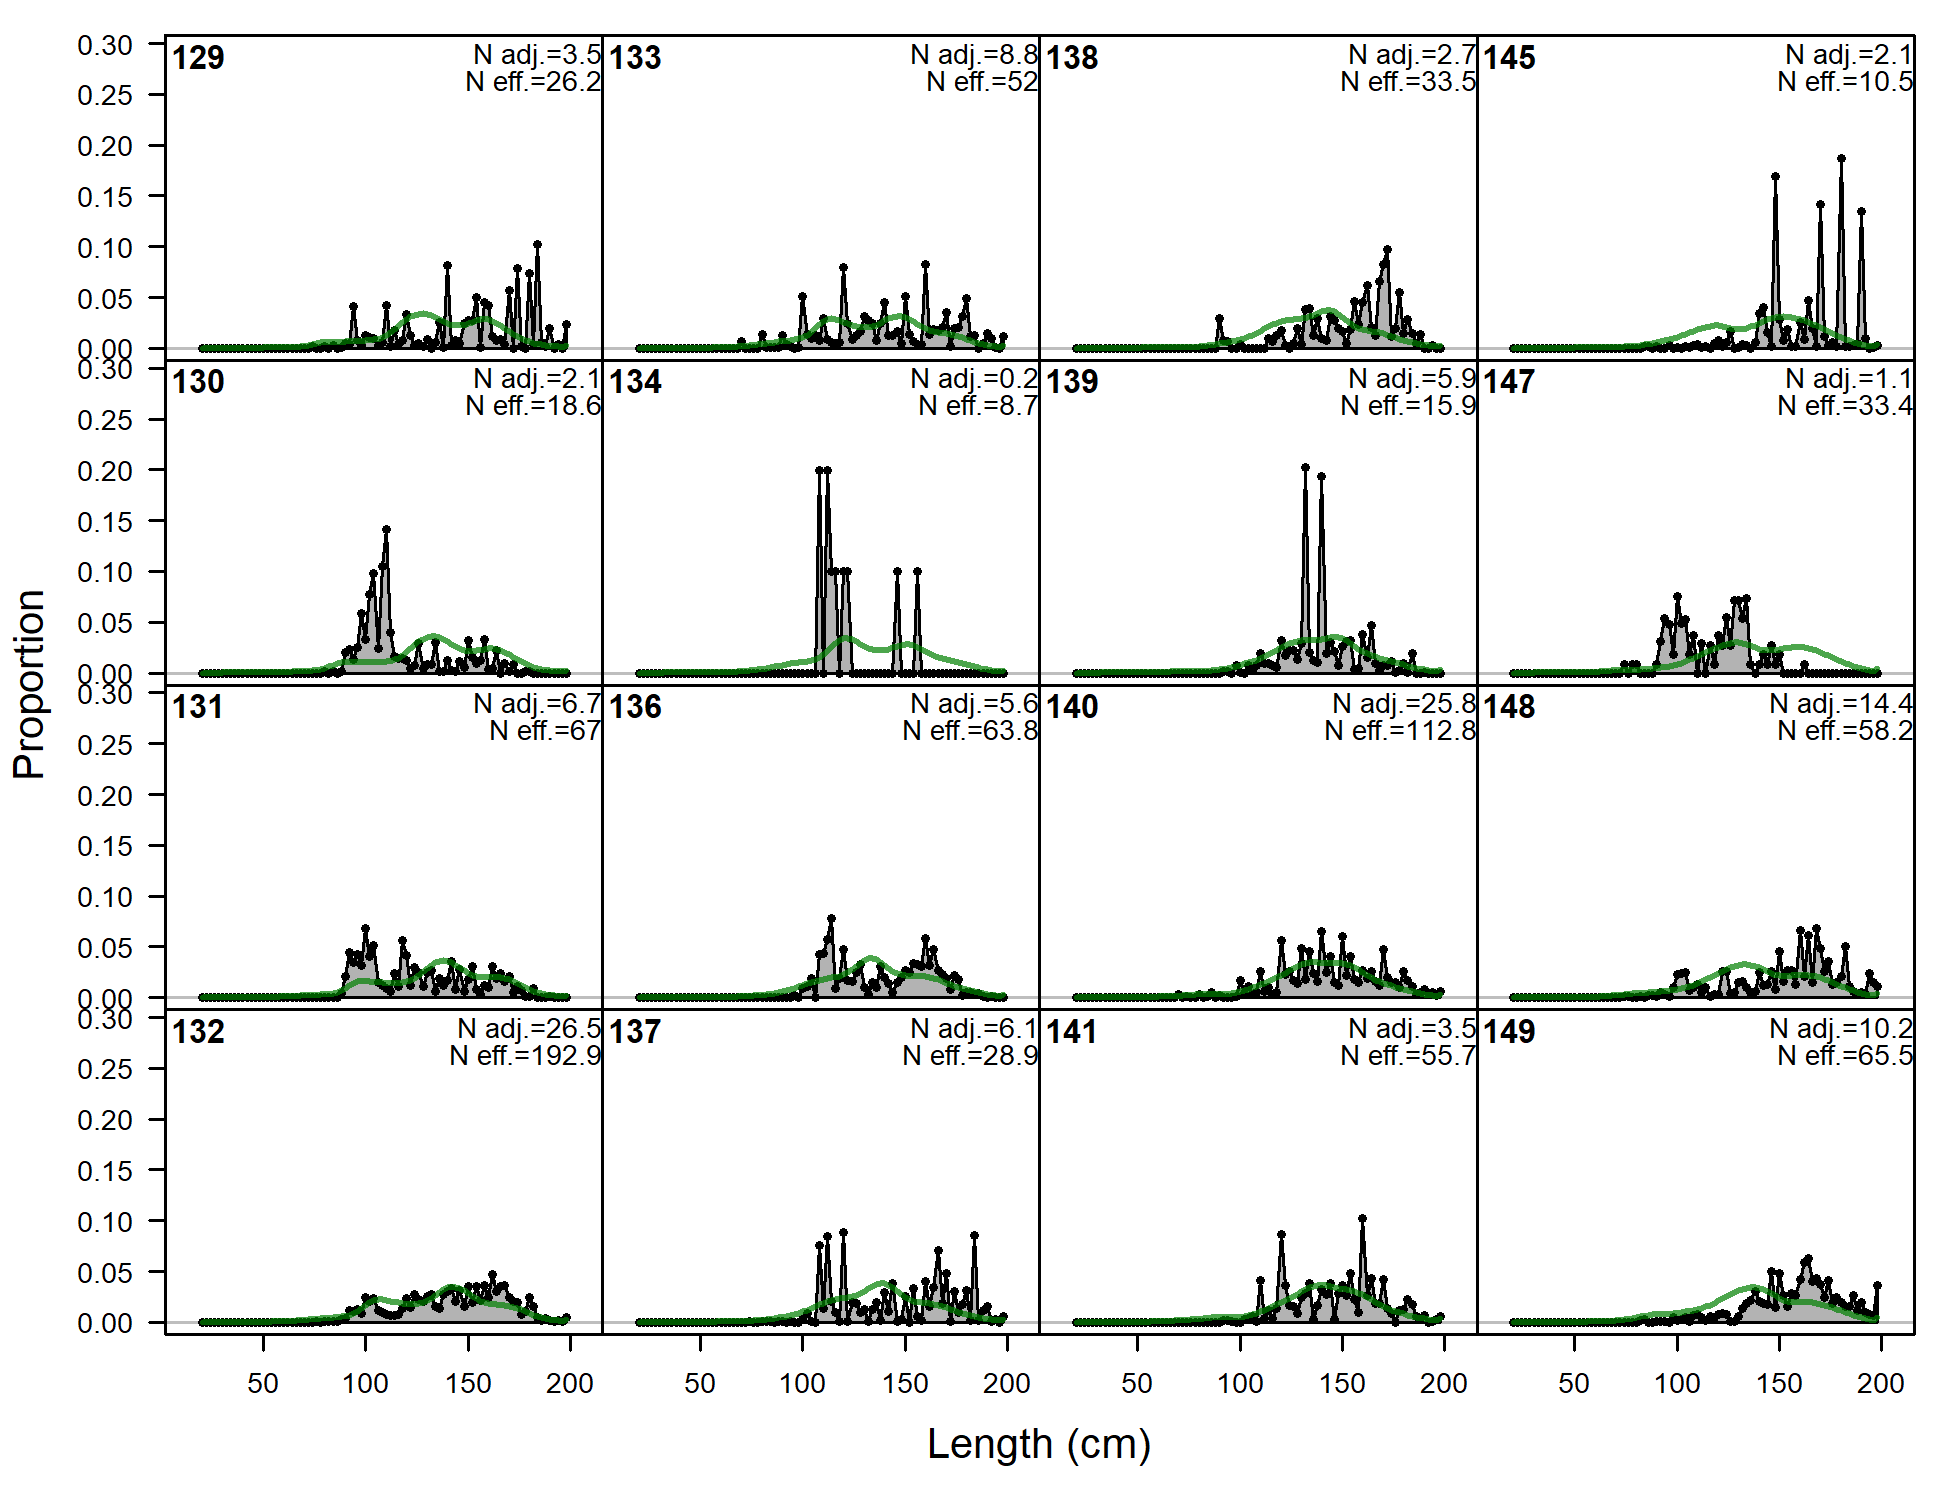
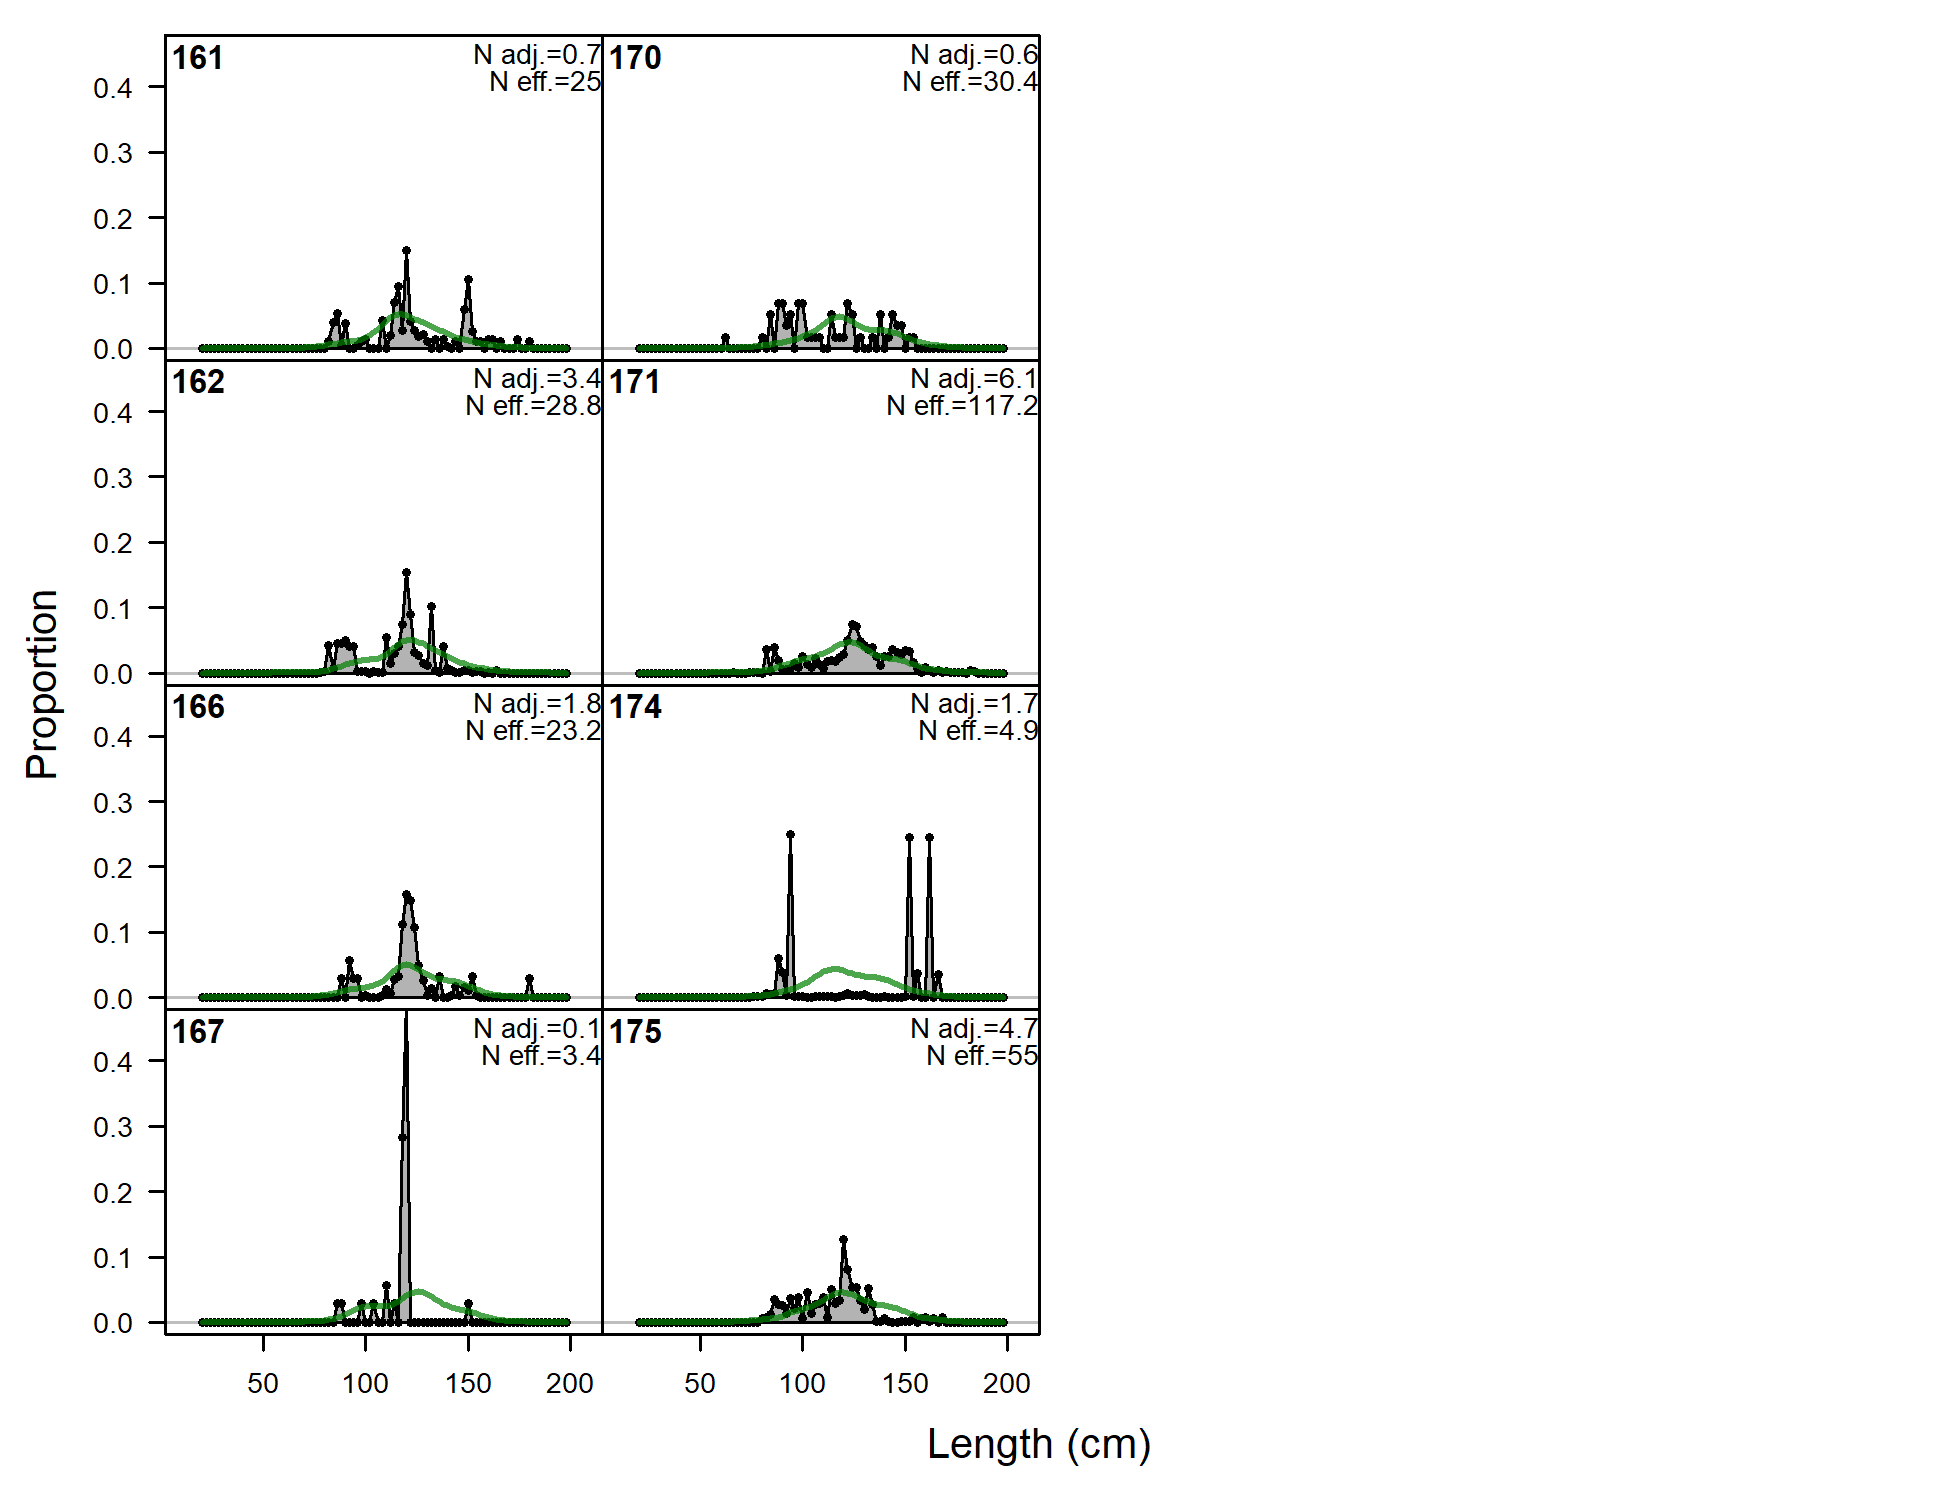
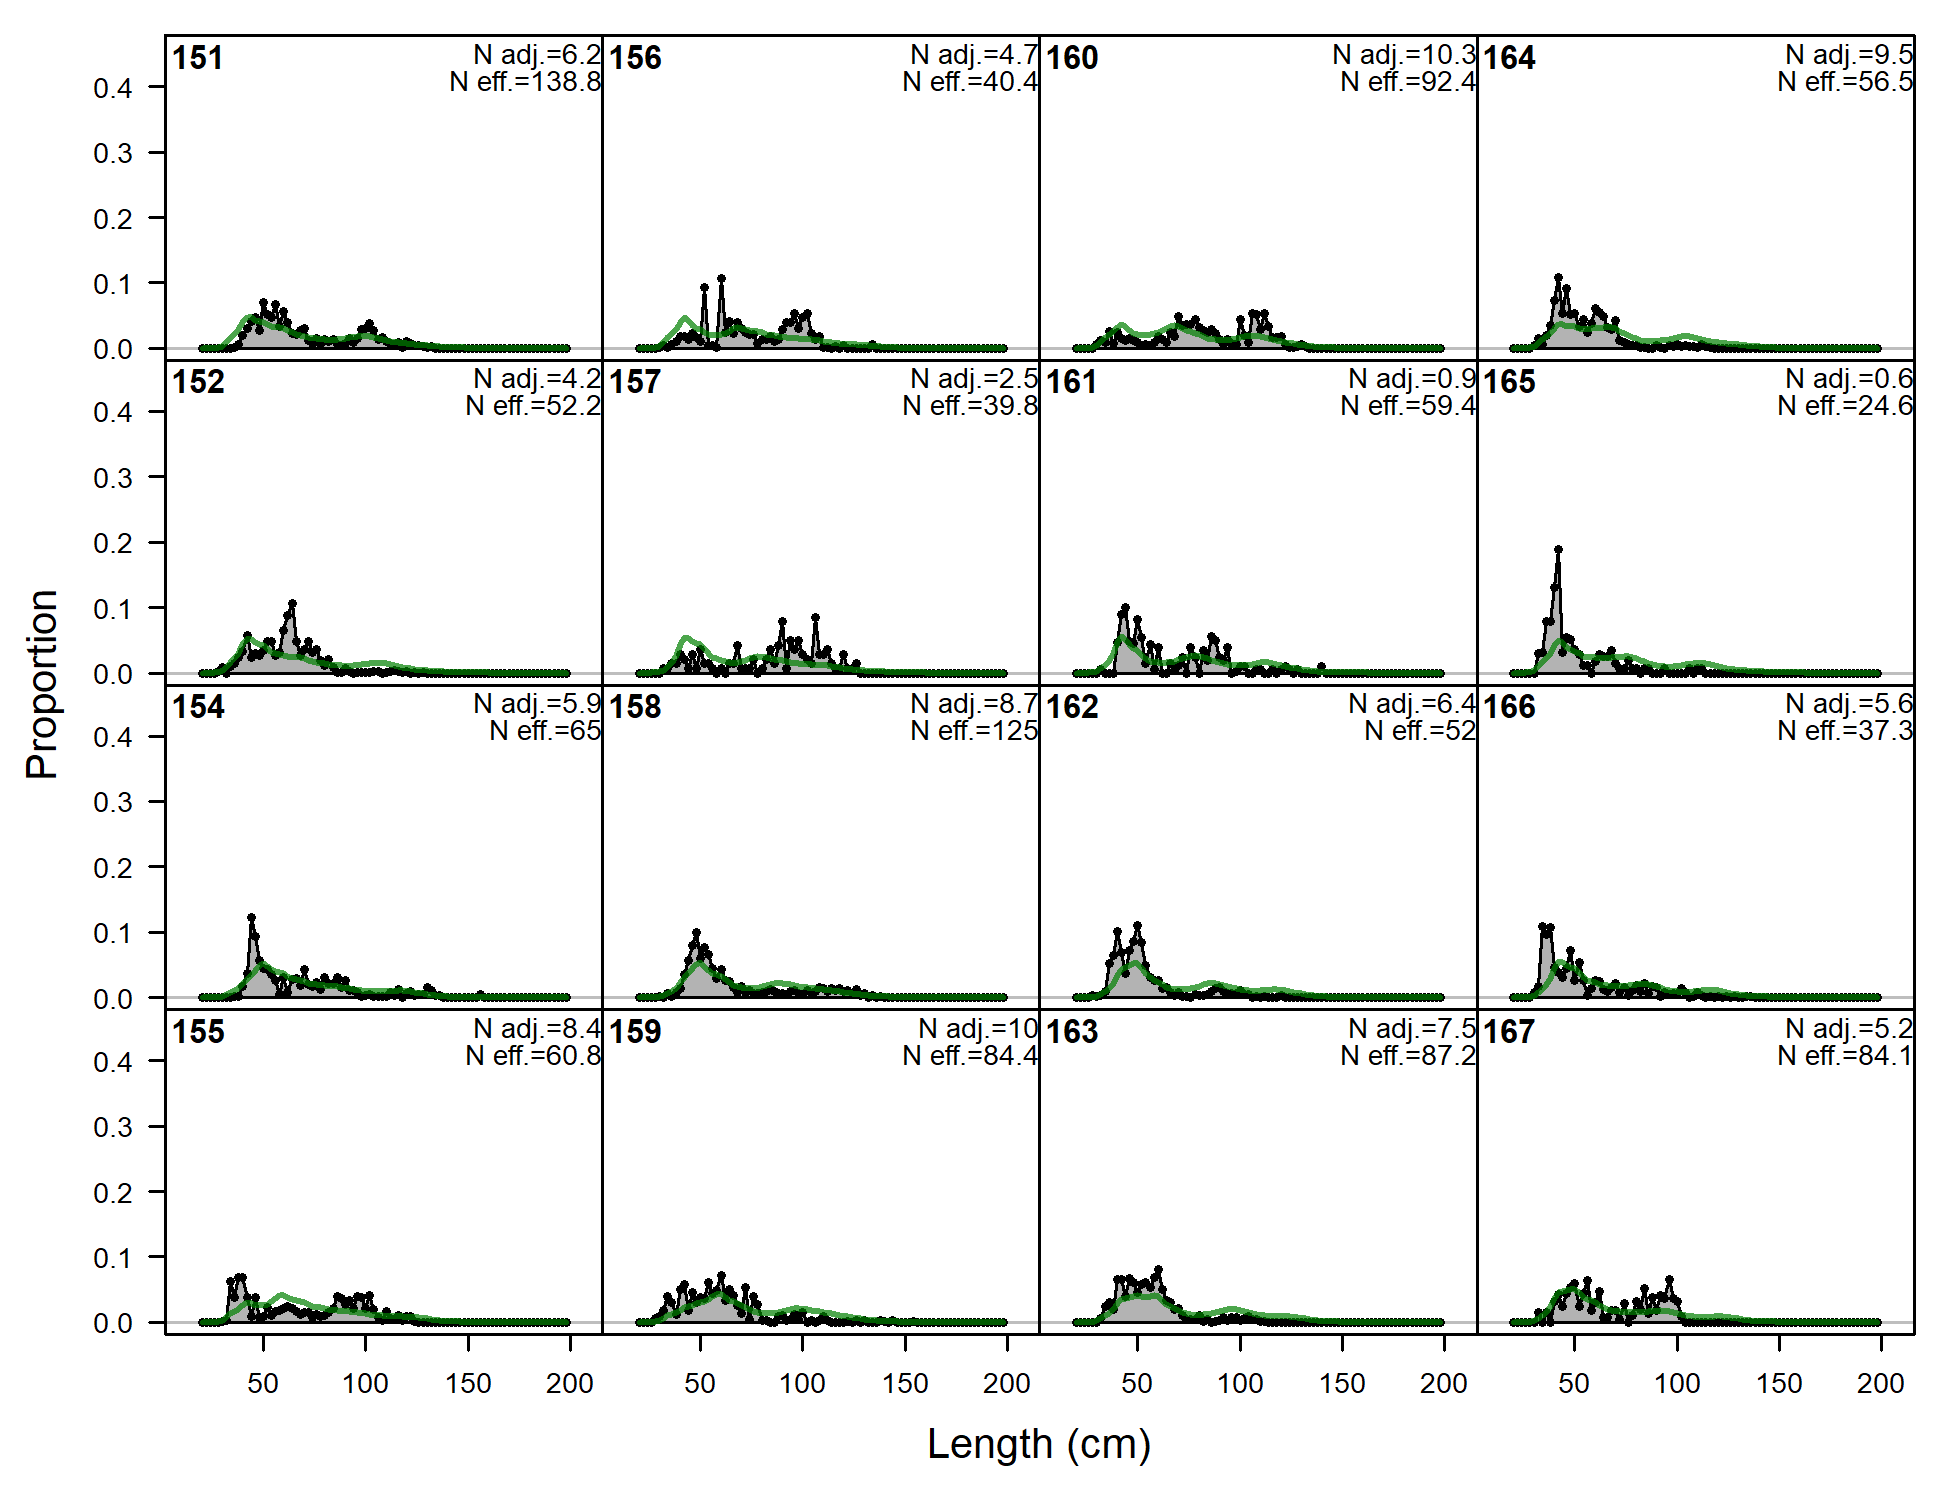
Length comps, whole catch, A2-LL-n (plot 2 of 8)
file: comp_lenfit_flt2mkt0_page2.png
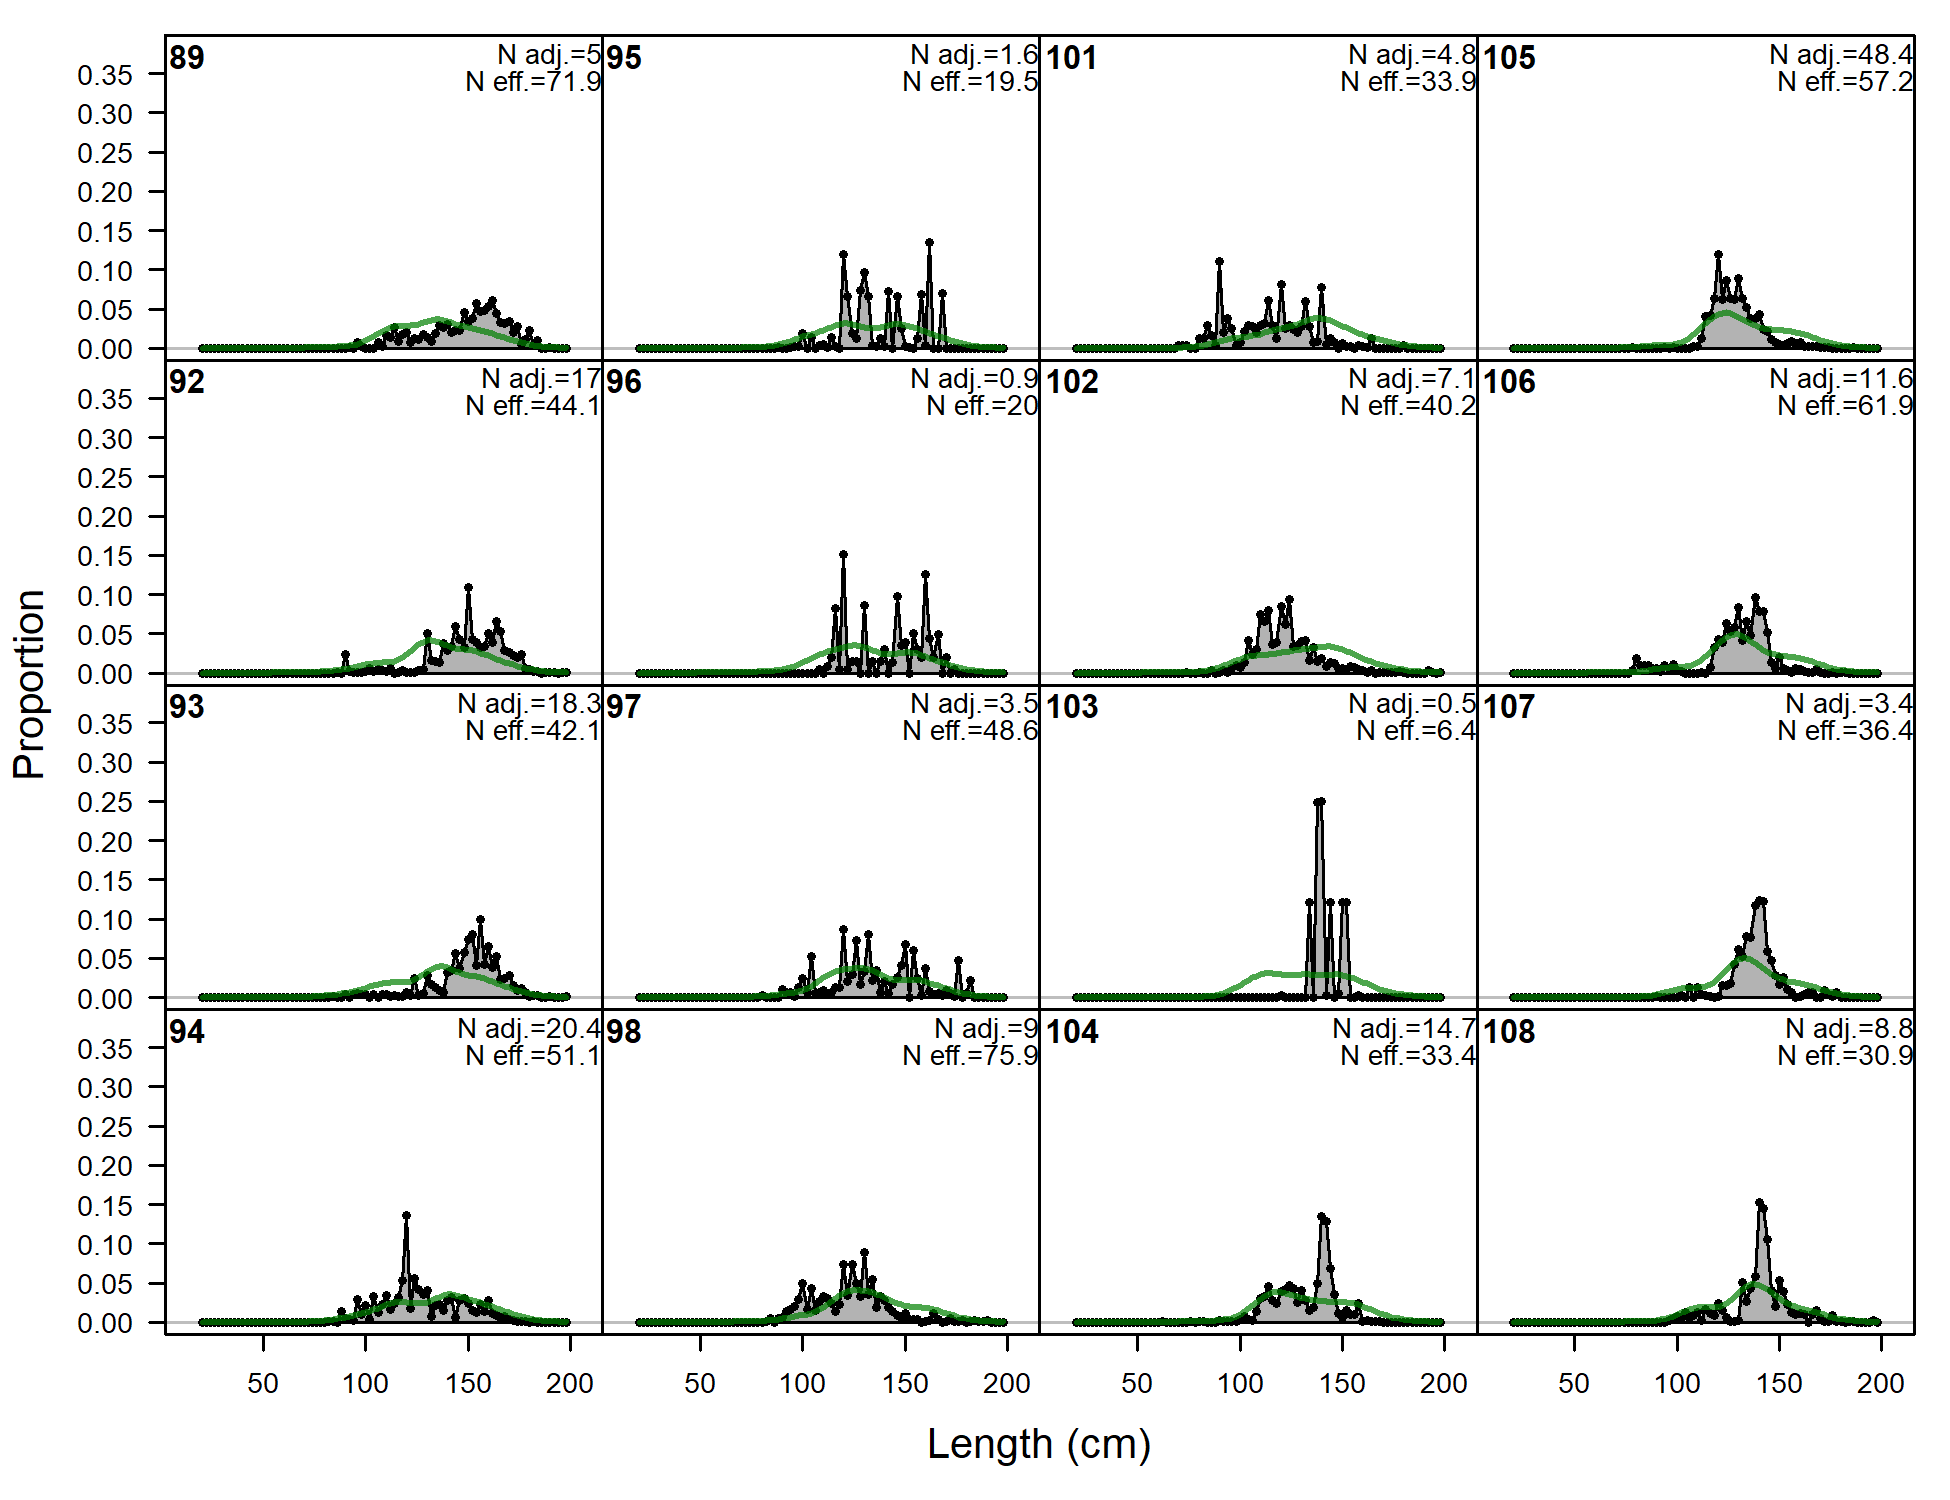
Length comps, whole catch, A2-LL-n (plot 3 of 8)
file: comp_lenfit_flt2mkt0_page3.png

Length comps, whole catch, A2-LL-n (plot 4 of 8)
file: comp_lenfit_flt2mkt0_page4.png
Length comps, whole catch, A2-LL-n (plot 5 of 8)
file: comp_lenfit_flt2mkt0_page5.png
Length comps, whole catch, A2-LL-n (plot 6 of 8)
file: comp_lenfit_flt2mkt0_page6.png
Length comps, whole catch, A2-LL-n (plot 7 of 8)
file: comp_lenfit_flt2mkt0_page7.png
Length comps, whole catch, A2-LL-n (plot 8 of 8)
file: comp_lenfit_flt2mkt0_page8.png
Pearson residuals, whole catch, A2-LL-n (max=6.89) (plot 8 of 8)
Closed bubbles are positive residuals (observed > expected) and open bubbles are negative residuals (observed < expected).
file: comp_lenfit_residsflt2mkt0_page8.png
N-EffN comparison, Length comps, whole catch, A2-LL-n
file: comp_lenfit_sampsize_flt2mkt0.png
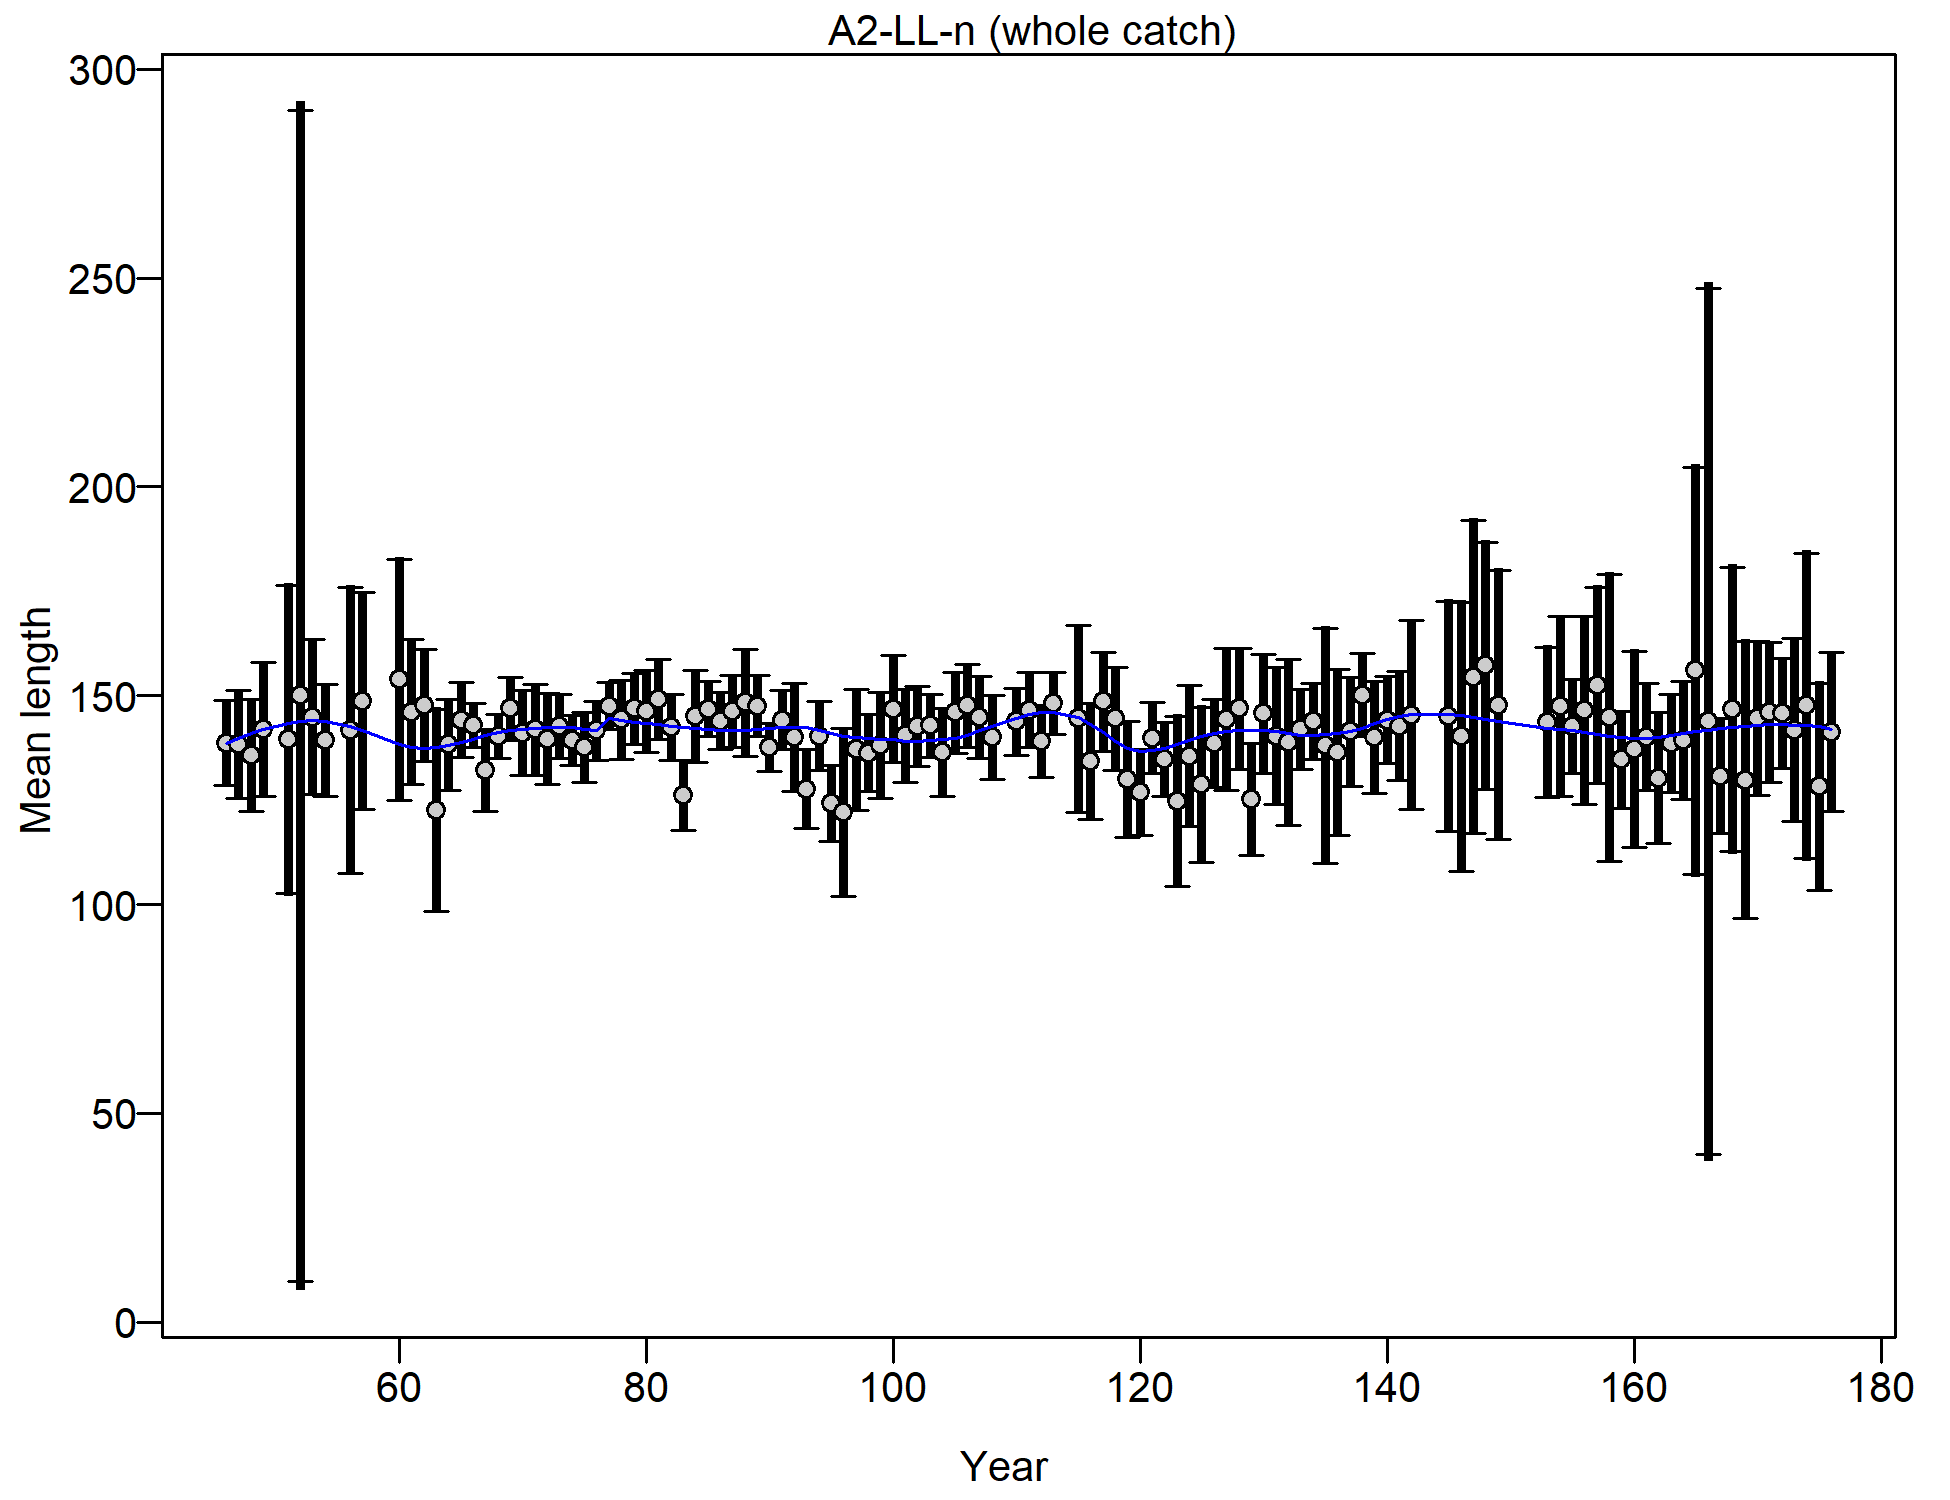
Mean length for A2-LL-n with 95% confidence intervals based on current samples sizes.
Francis data weighting method TA1.8: thinner intervals (with capped ends) show result of further adjusting sample sizes based on suggested multiplier (with 95% interval) for len data from A2-LL-n:
1.03 (0.7489-1.5589)
For more info, see
Francis, R.I.C.C. (2011). Data weighting in statistical fisheries stock assessment models. Can. J. Fish. Aquat. Sci. 68: 1124-1138. https://doi.org/10.1139/f2011-025
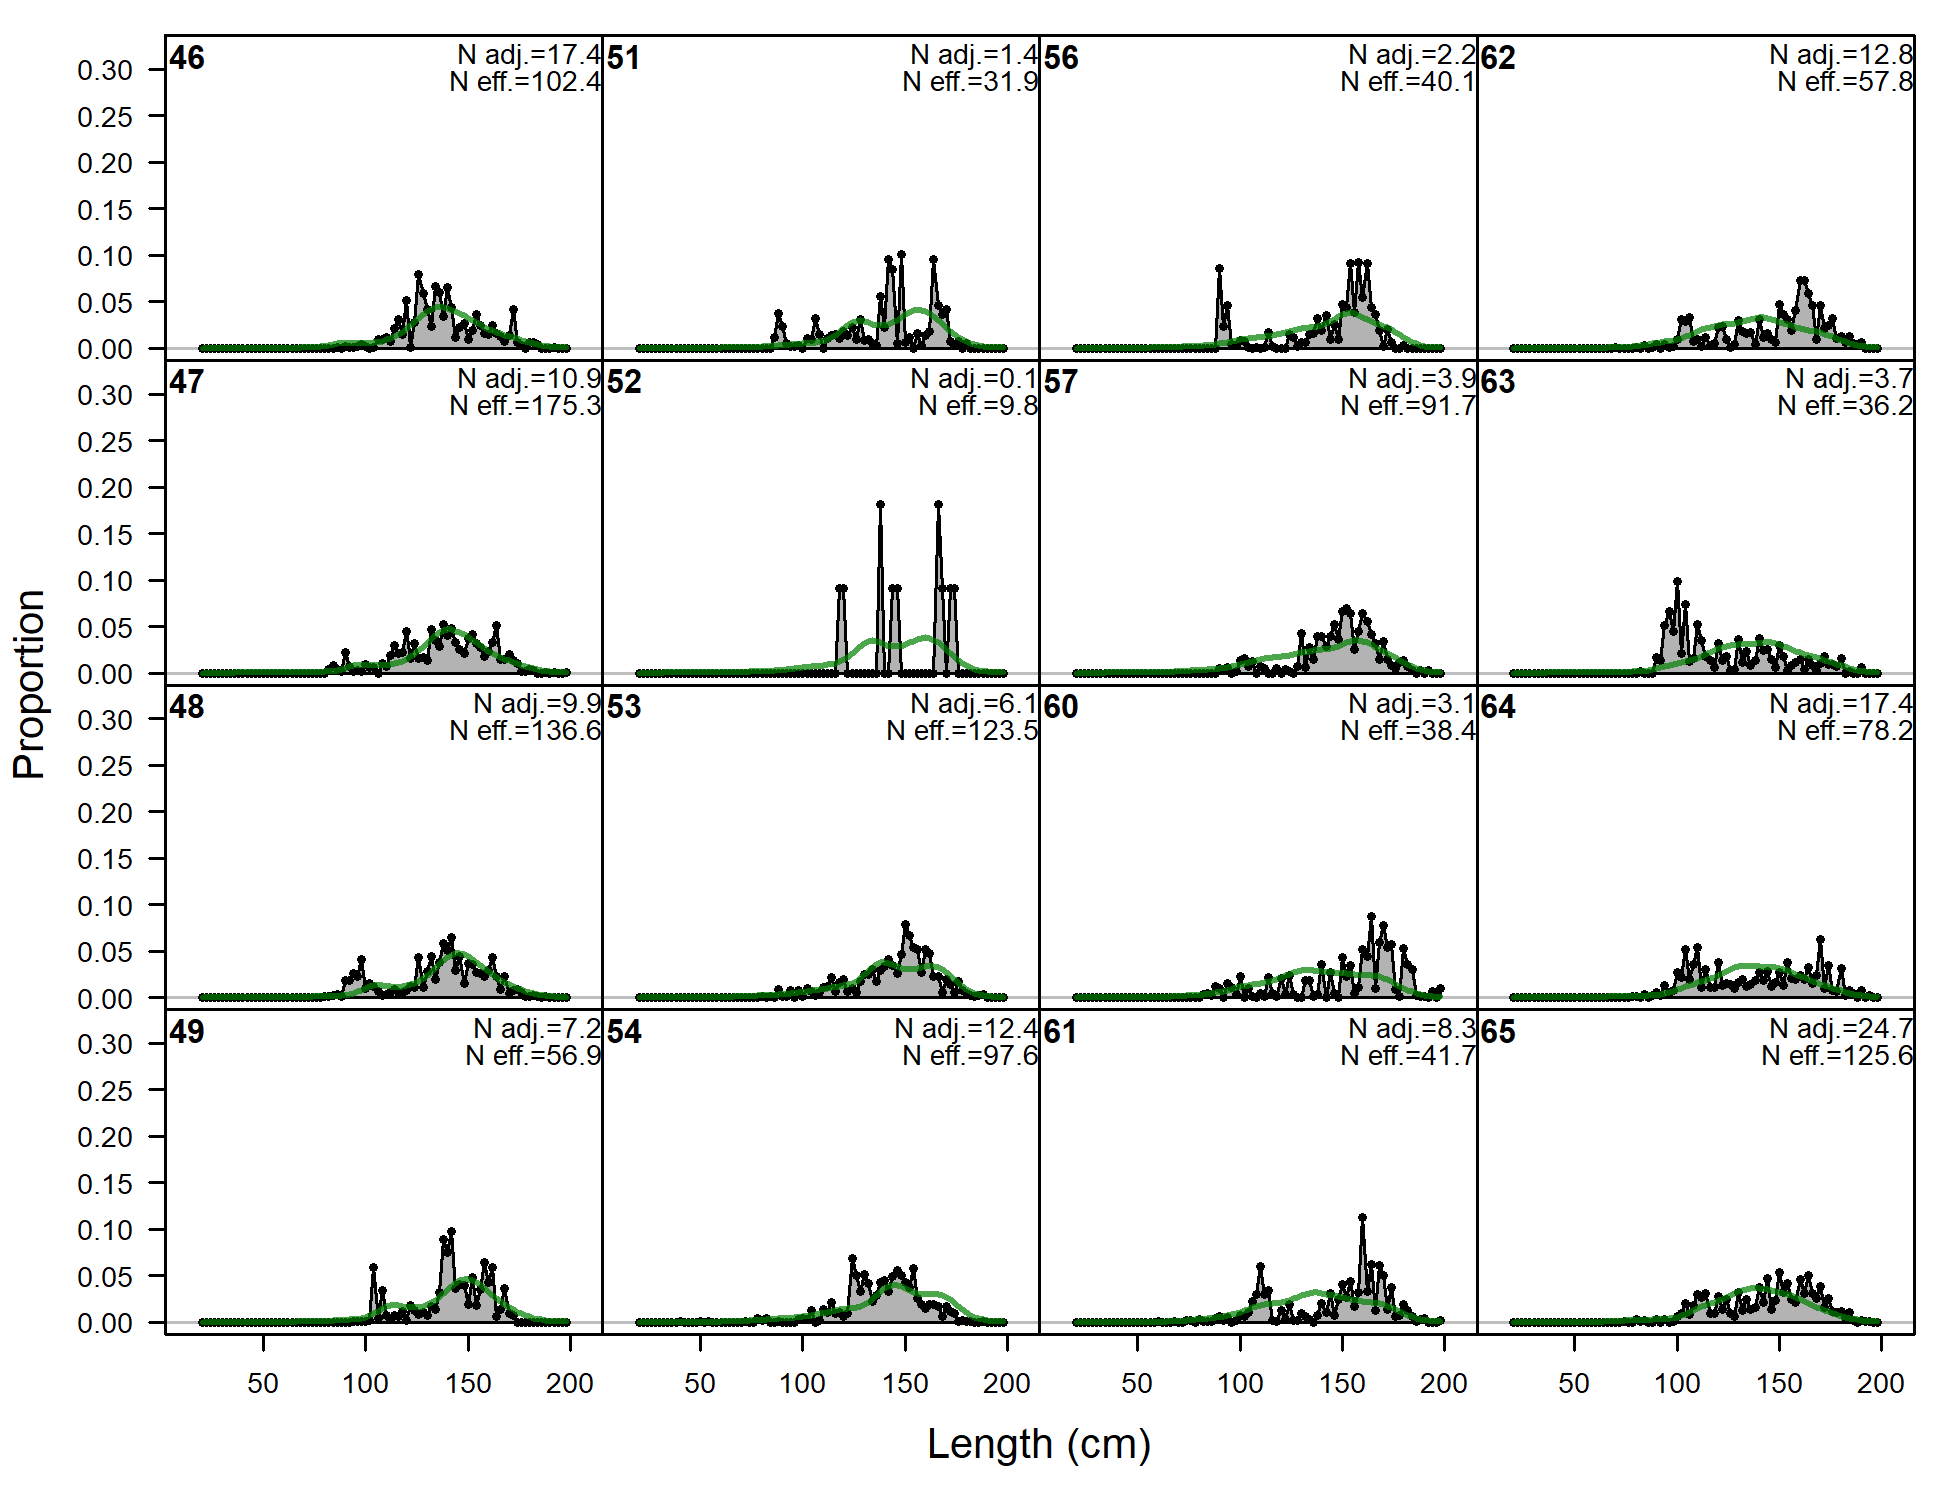
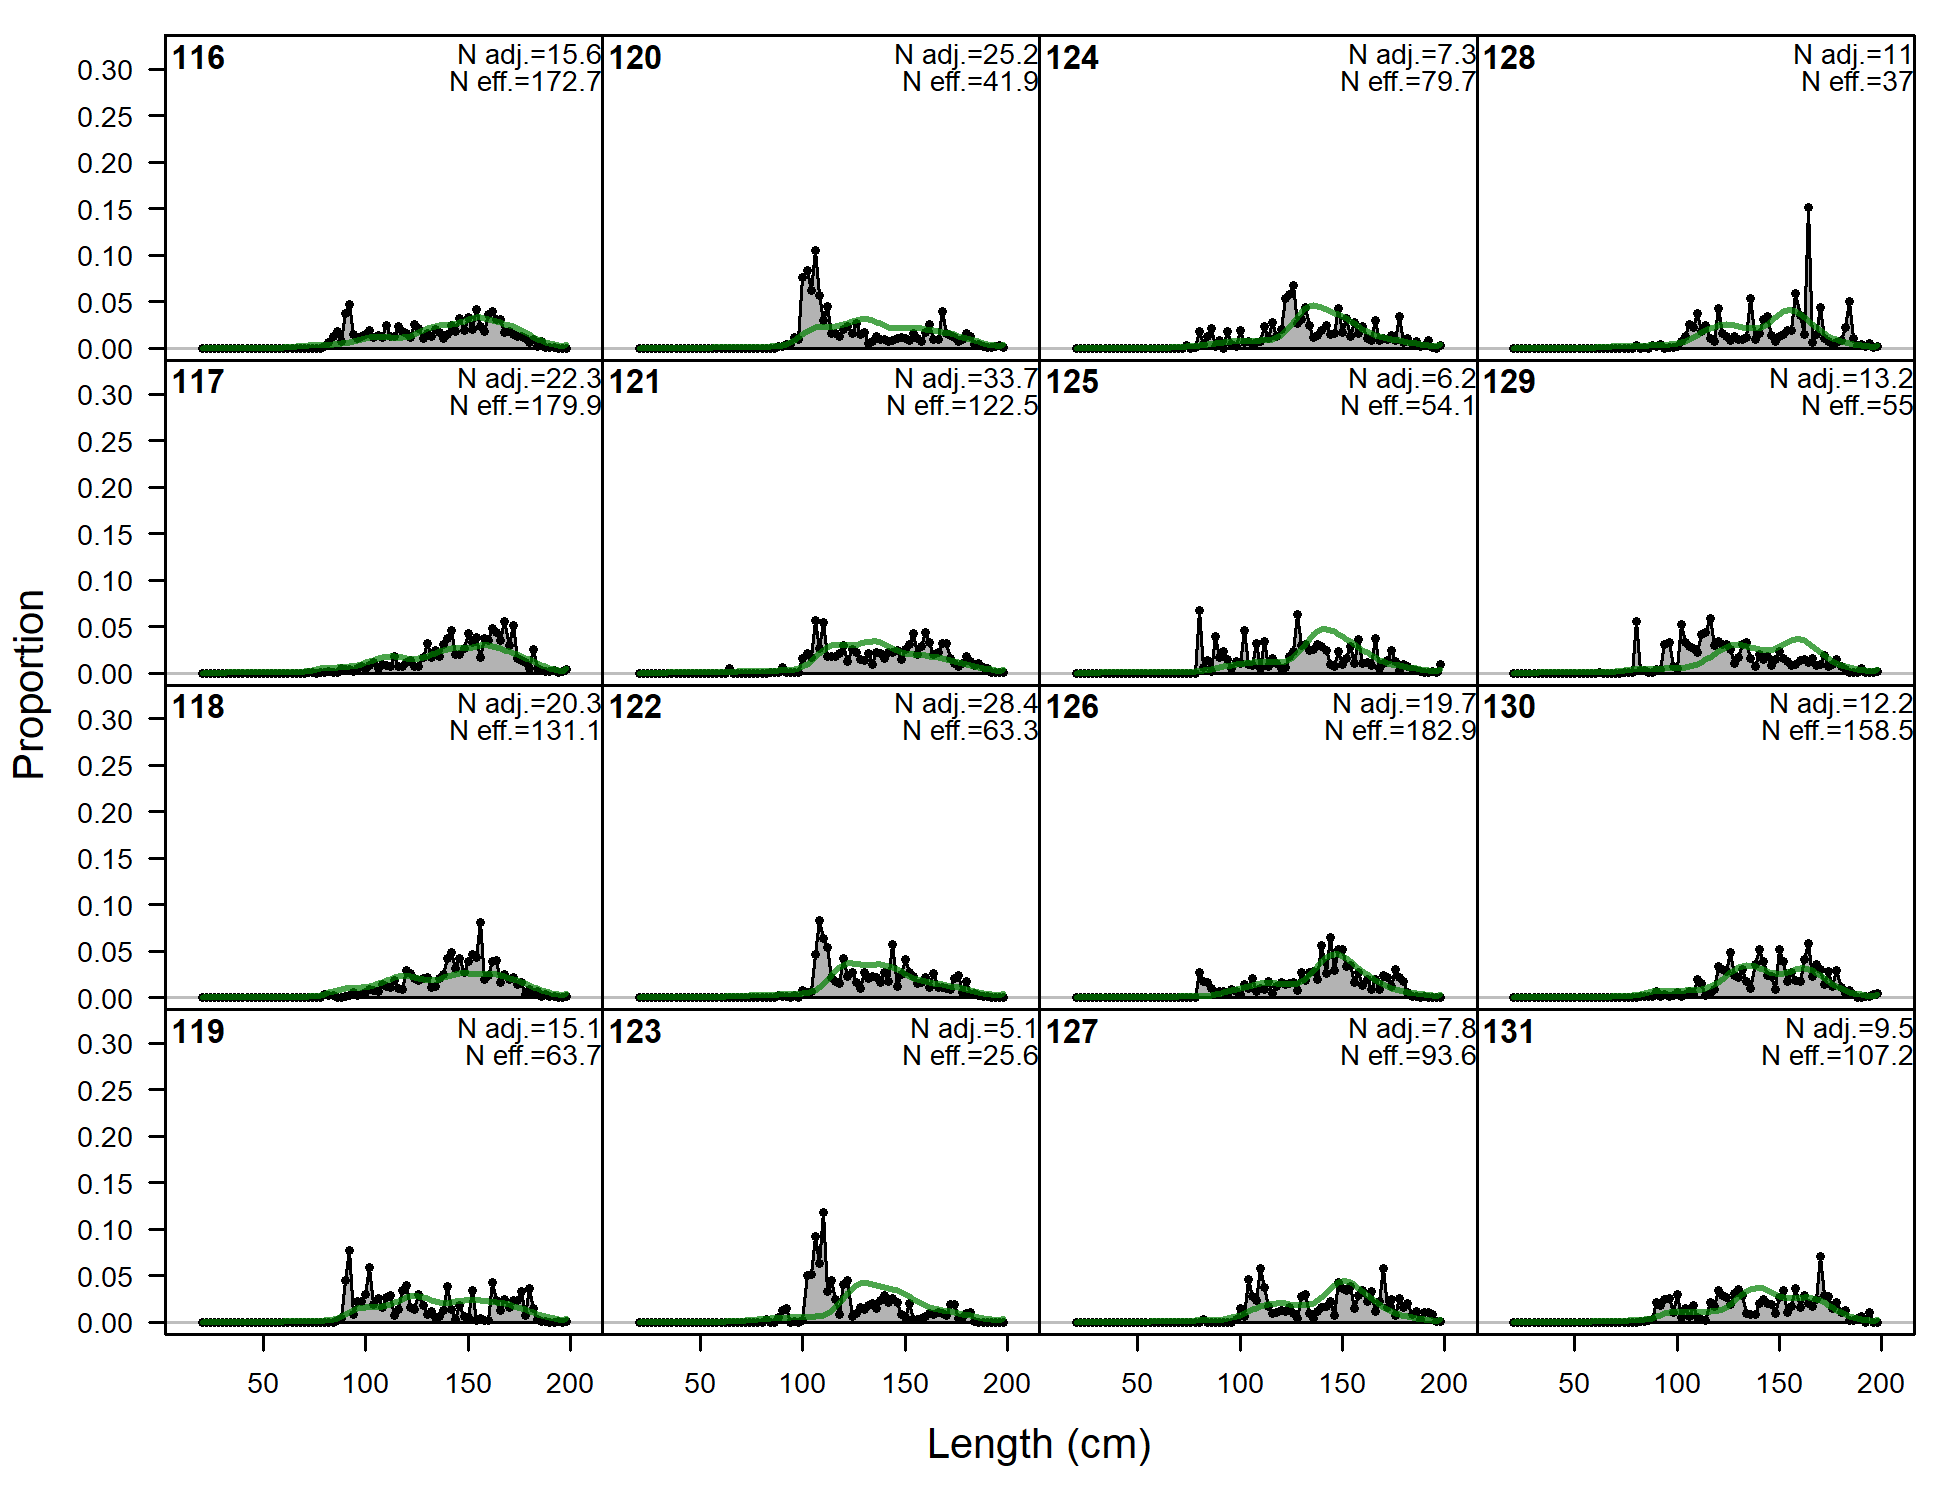
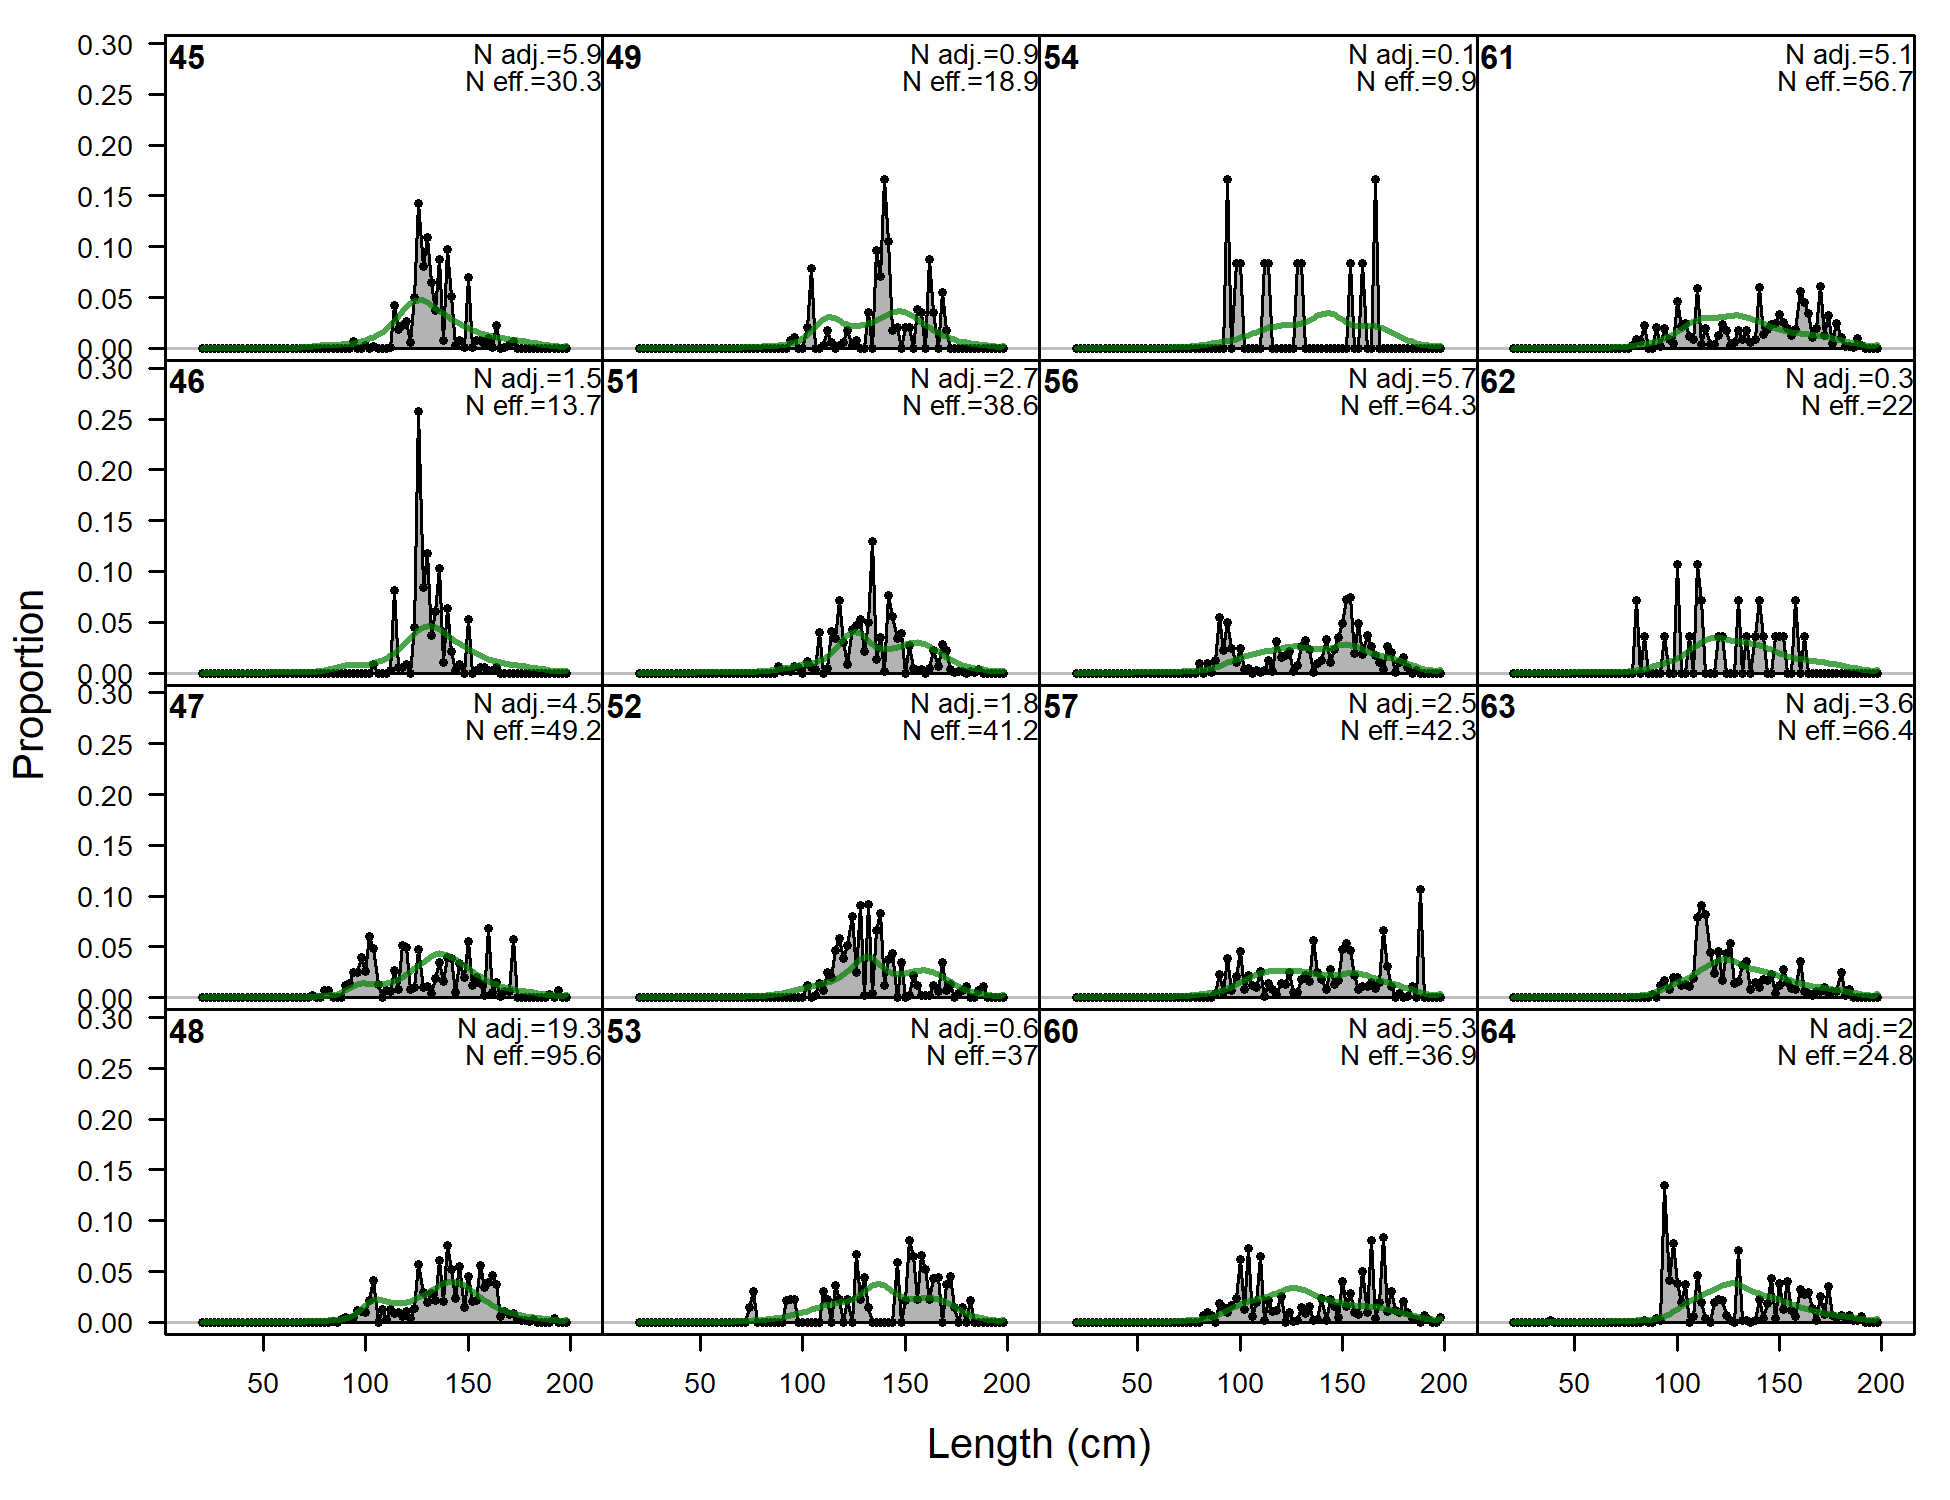
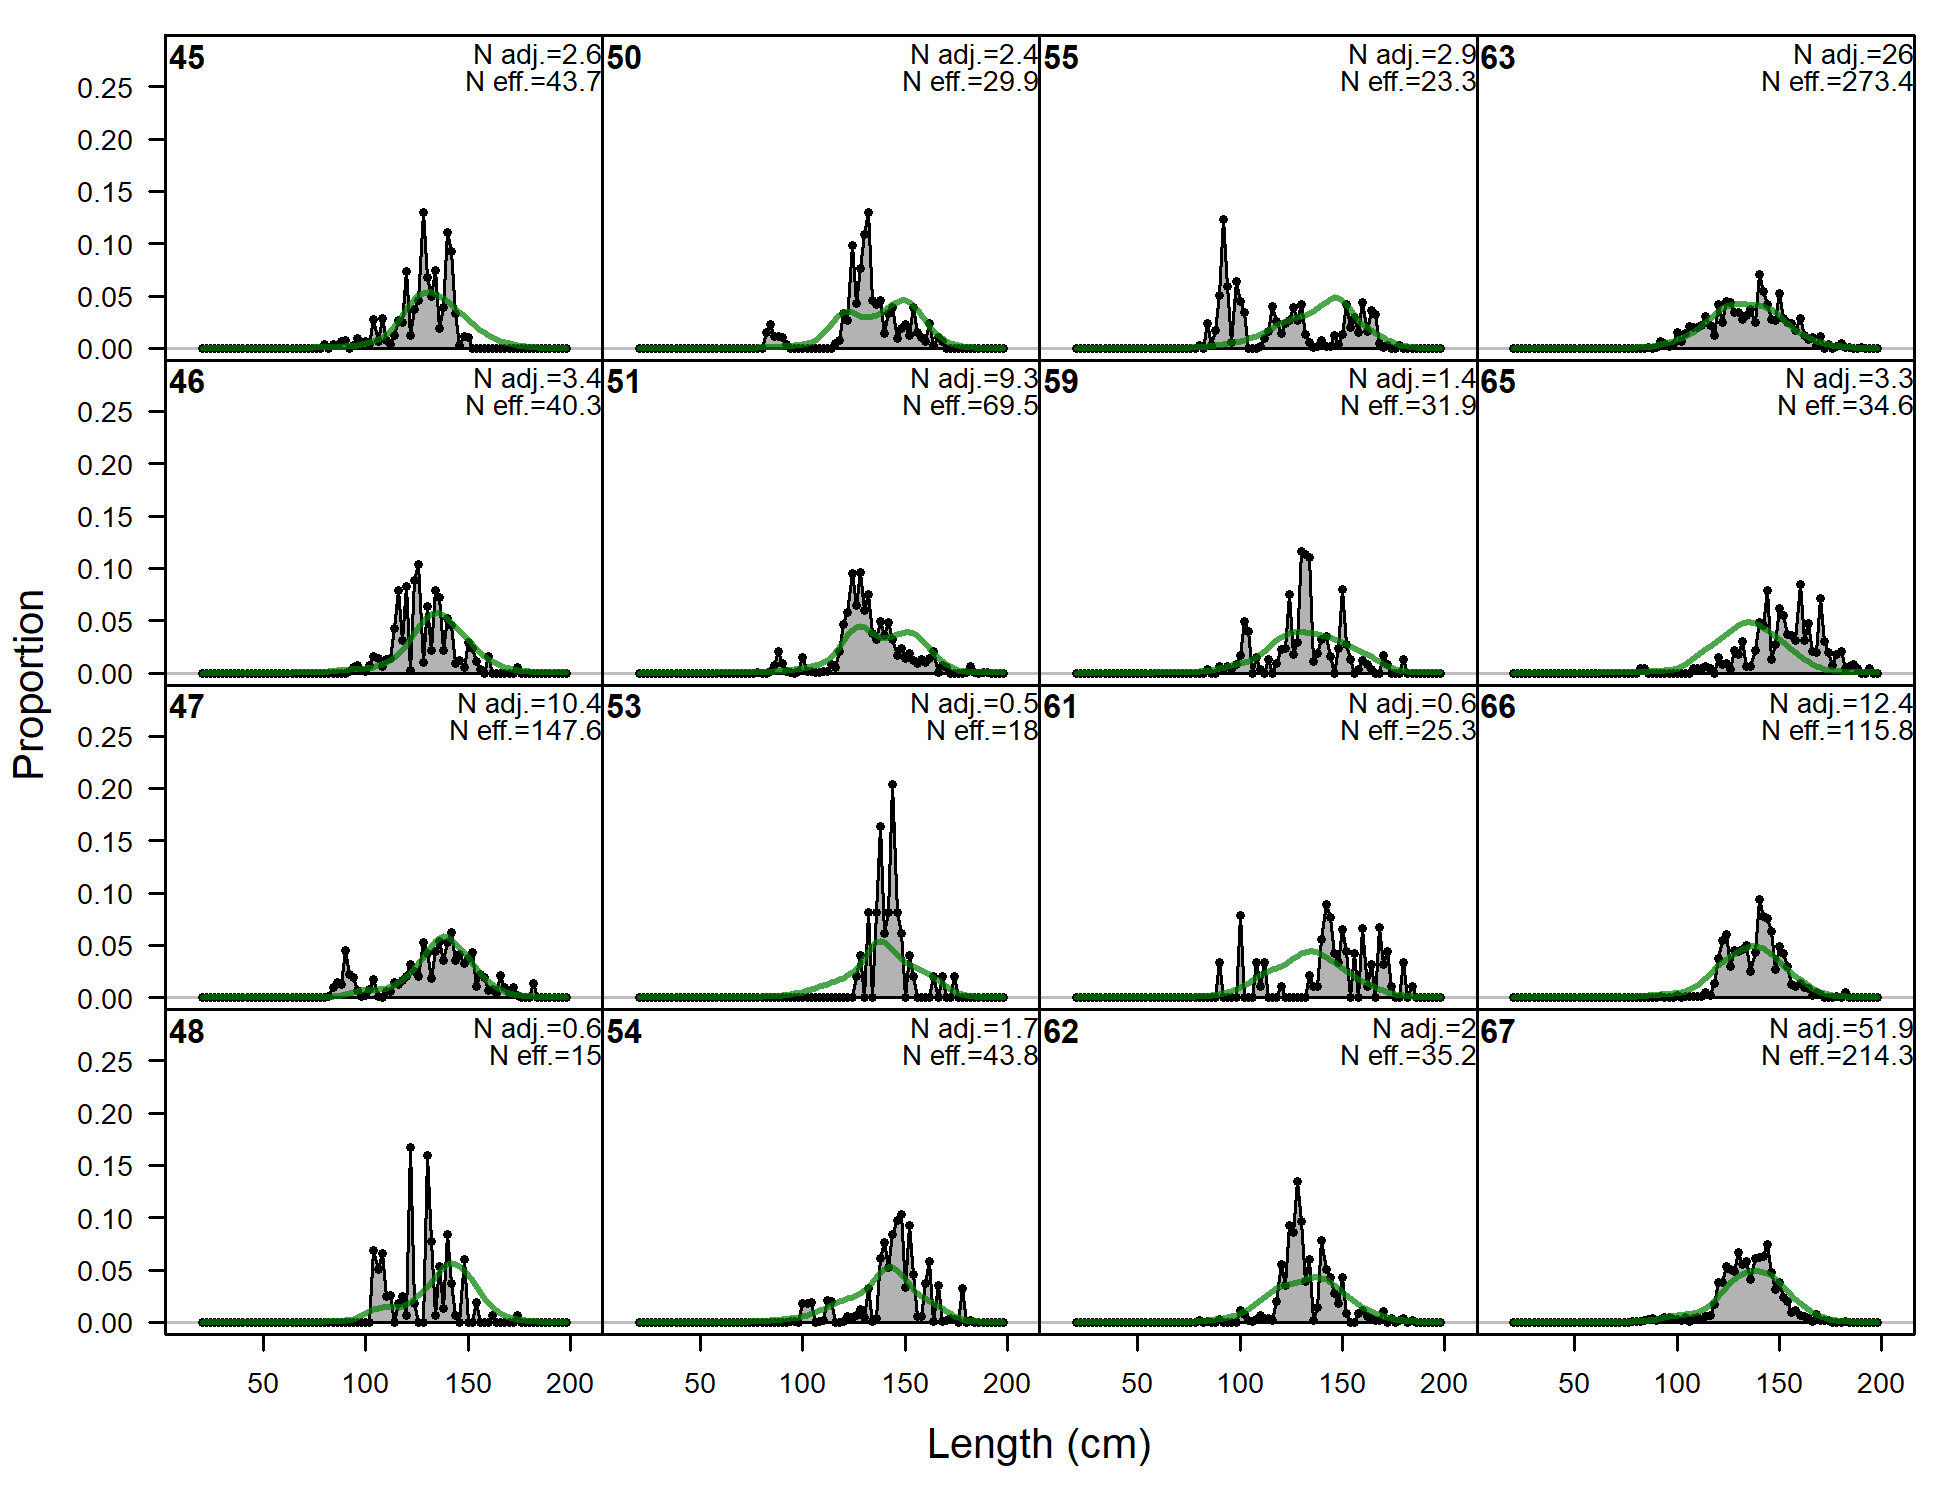
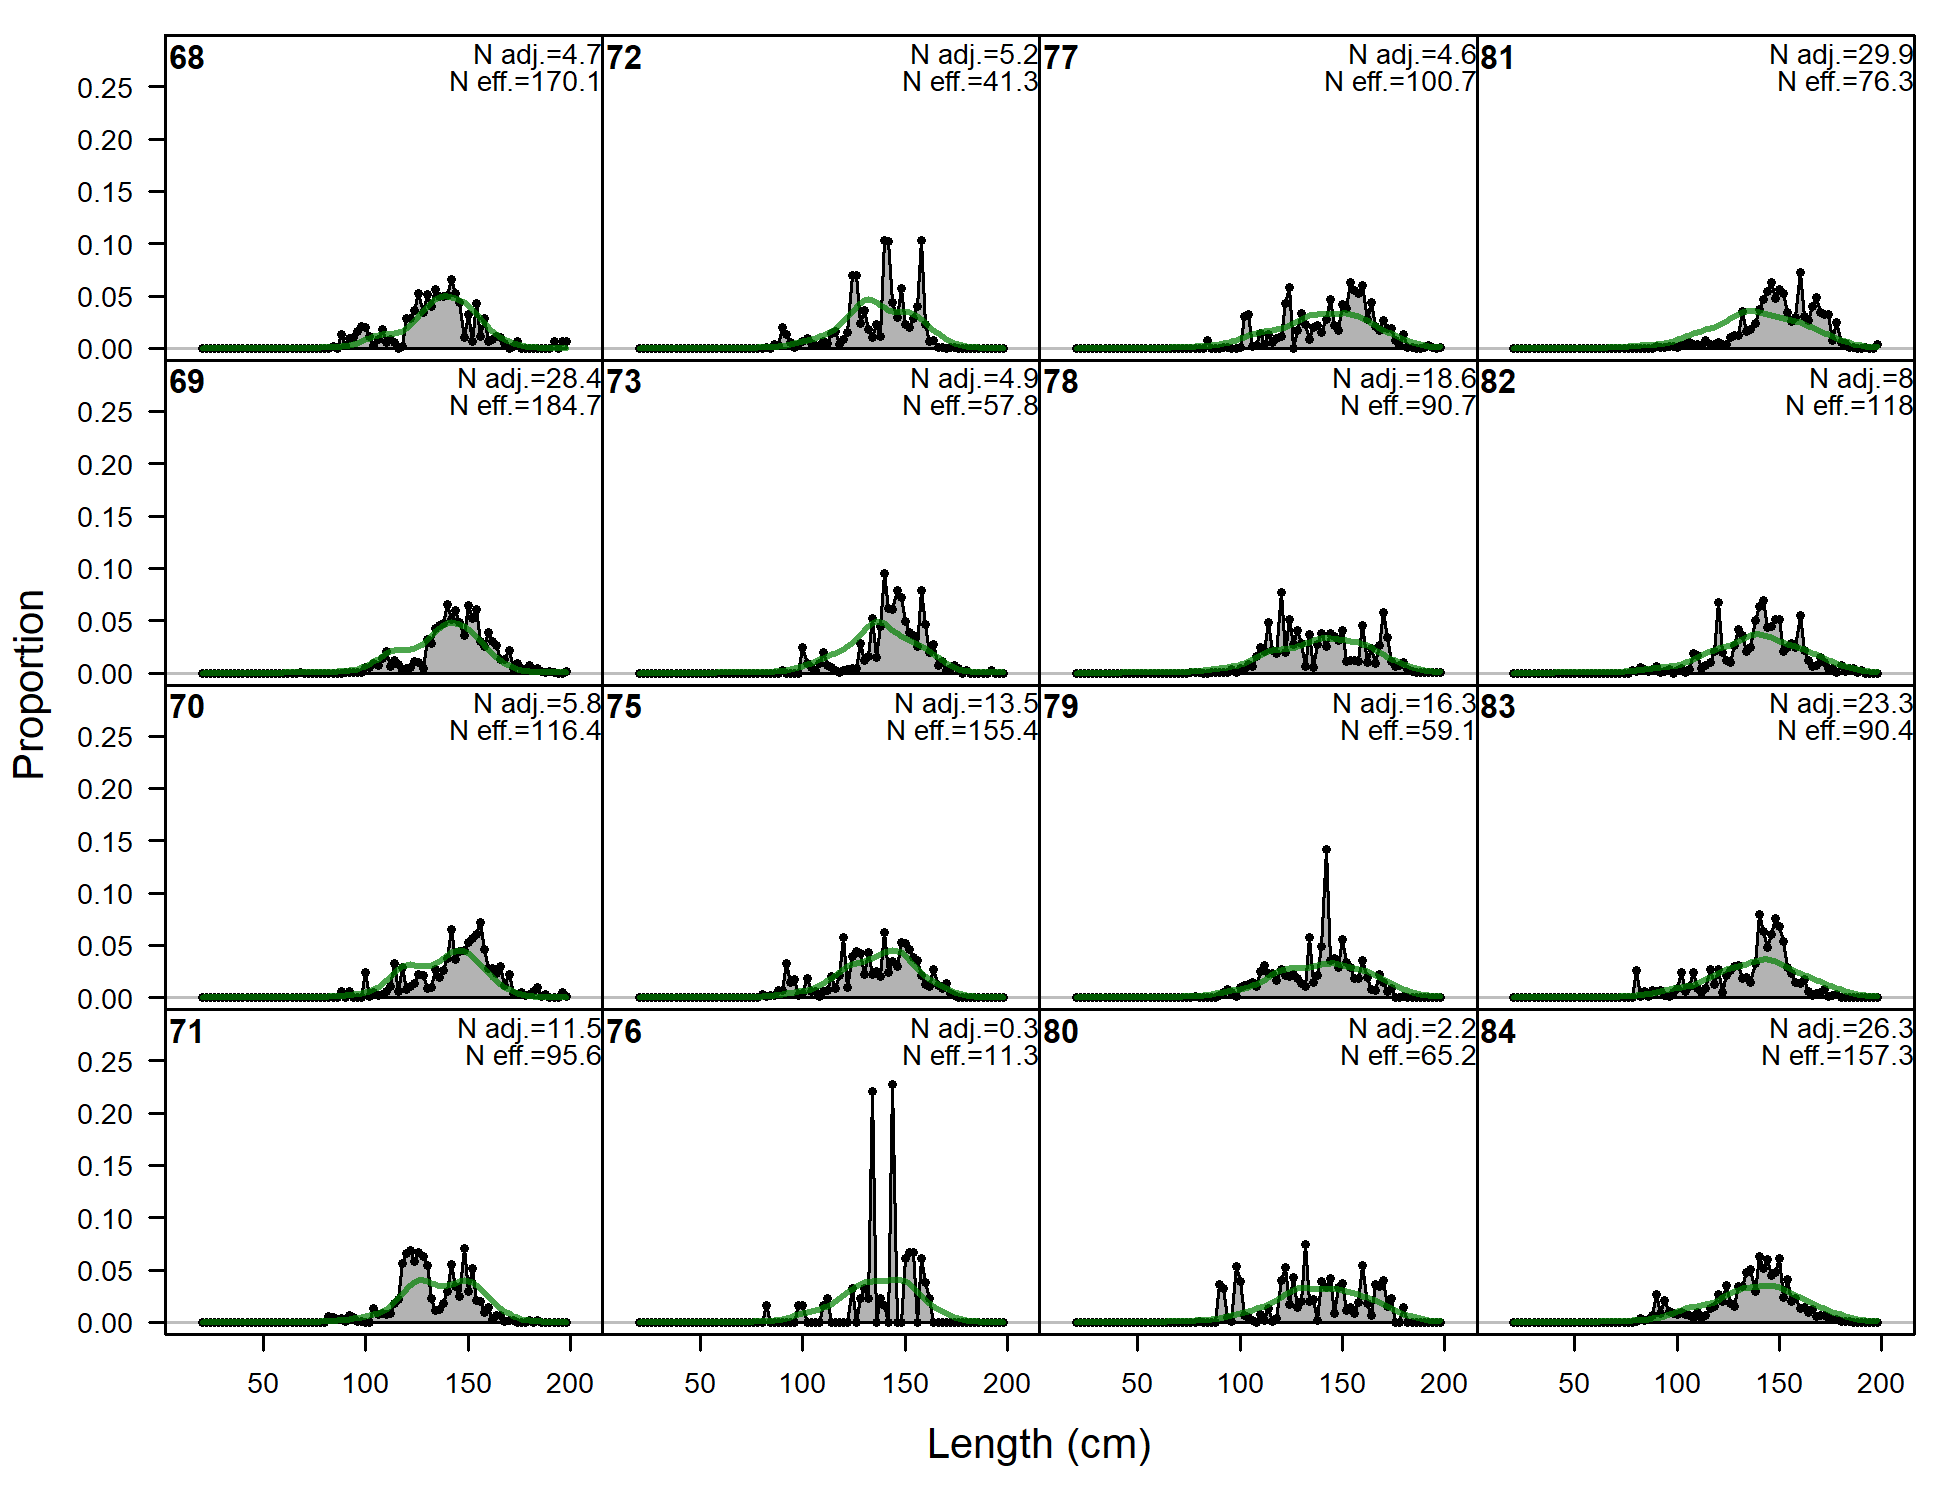
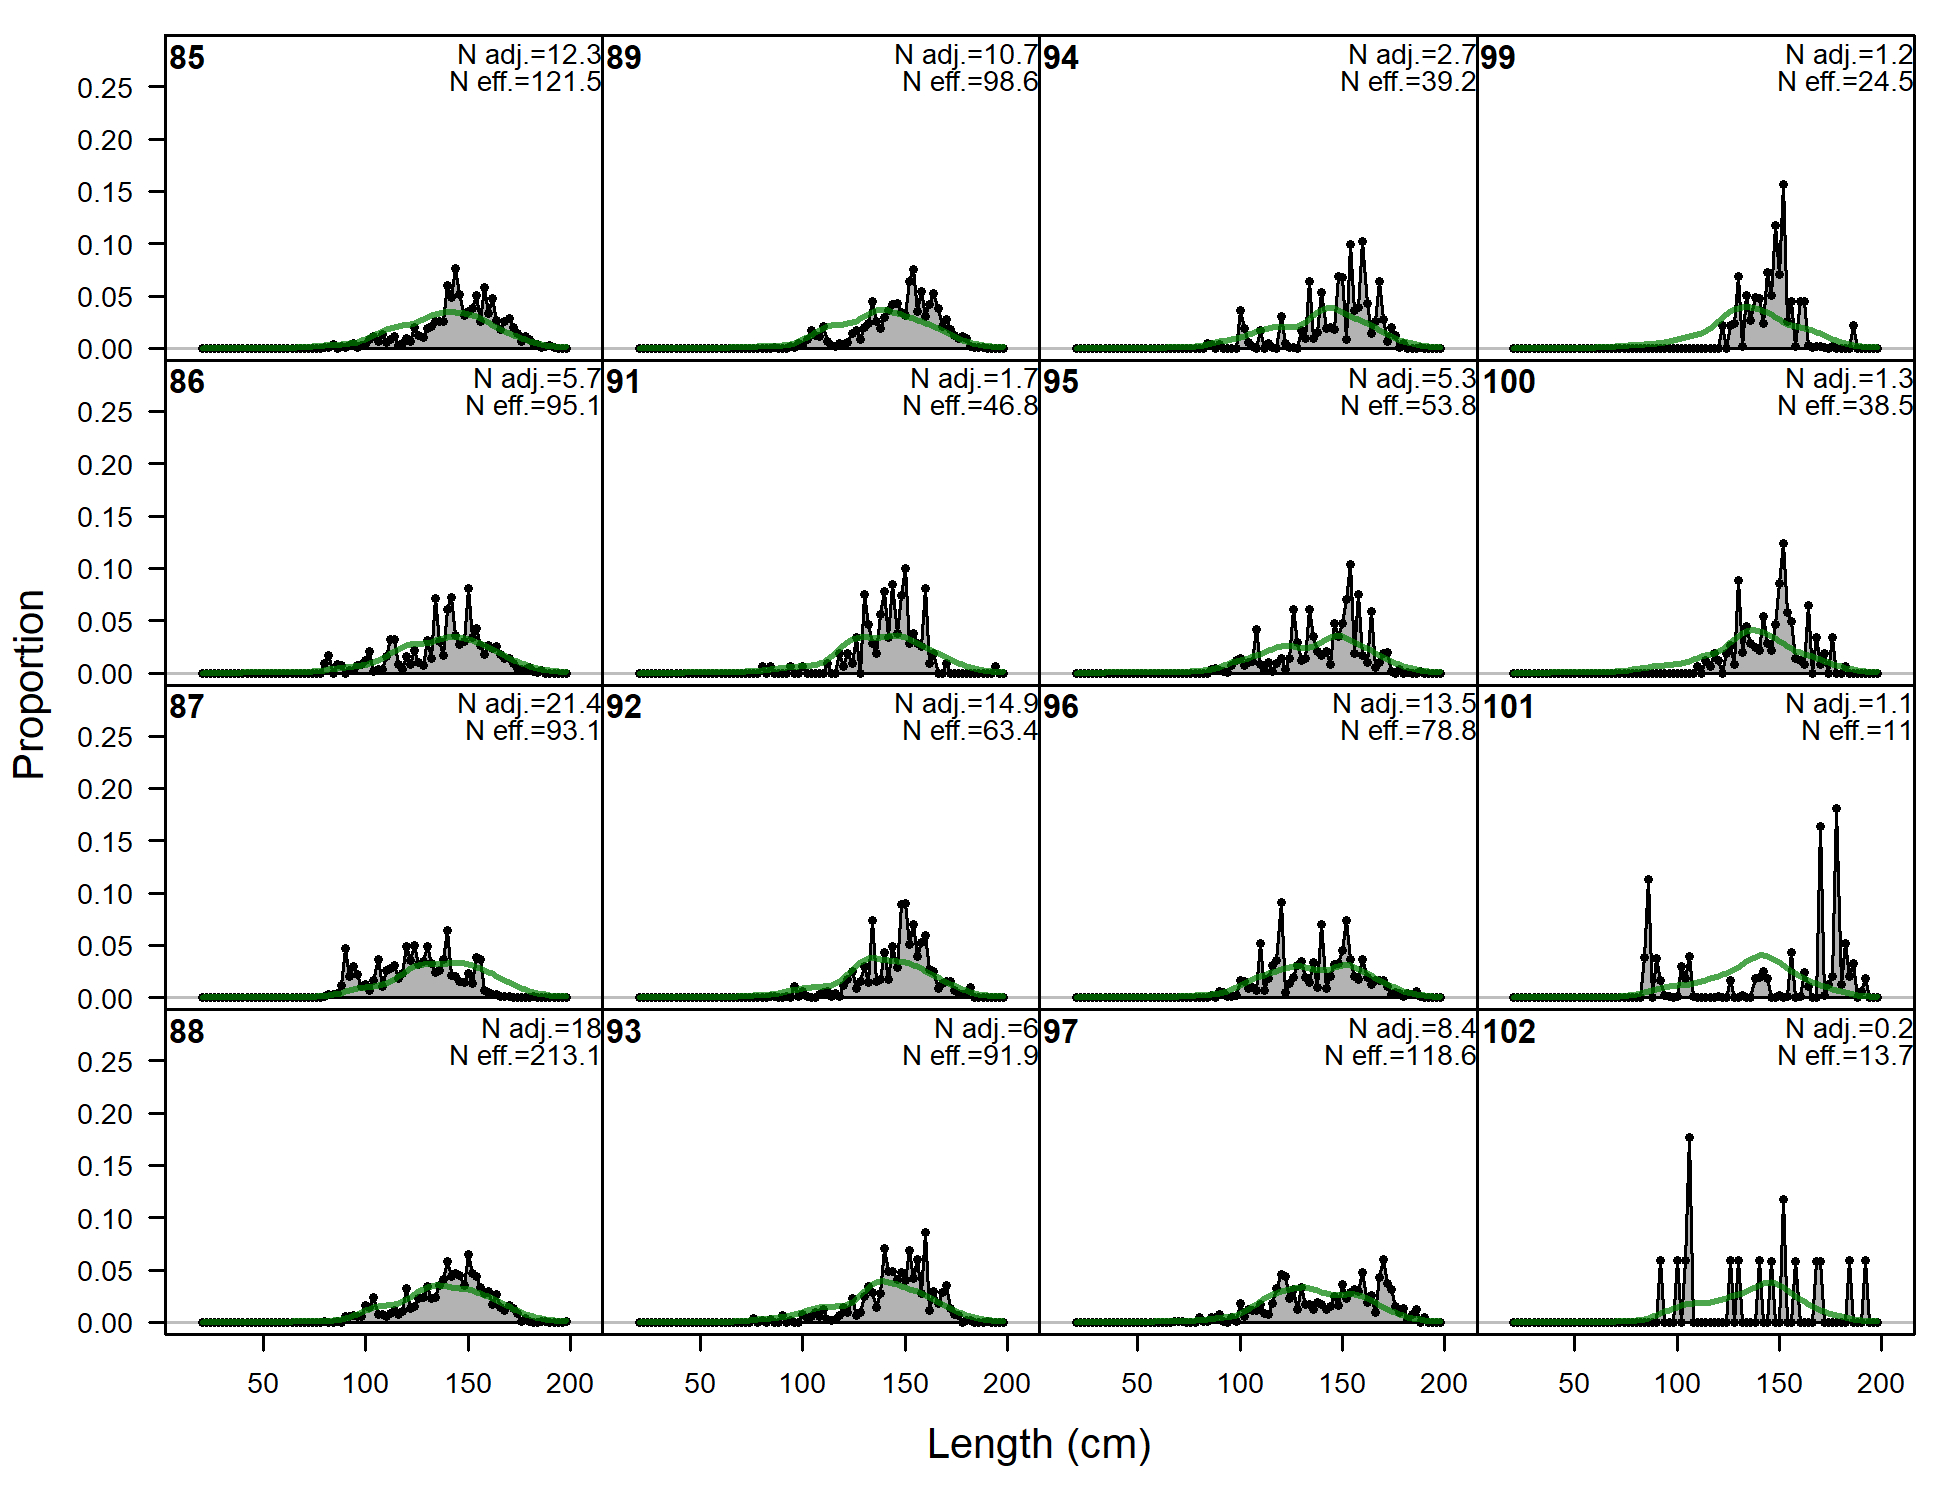
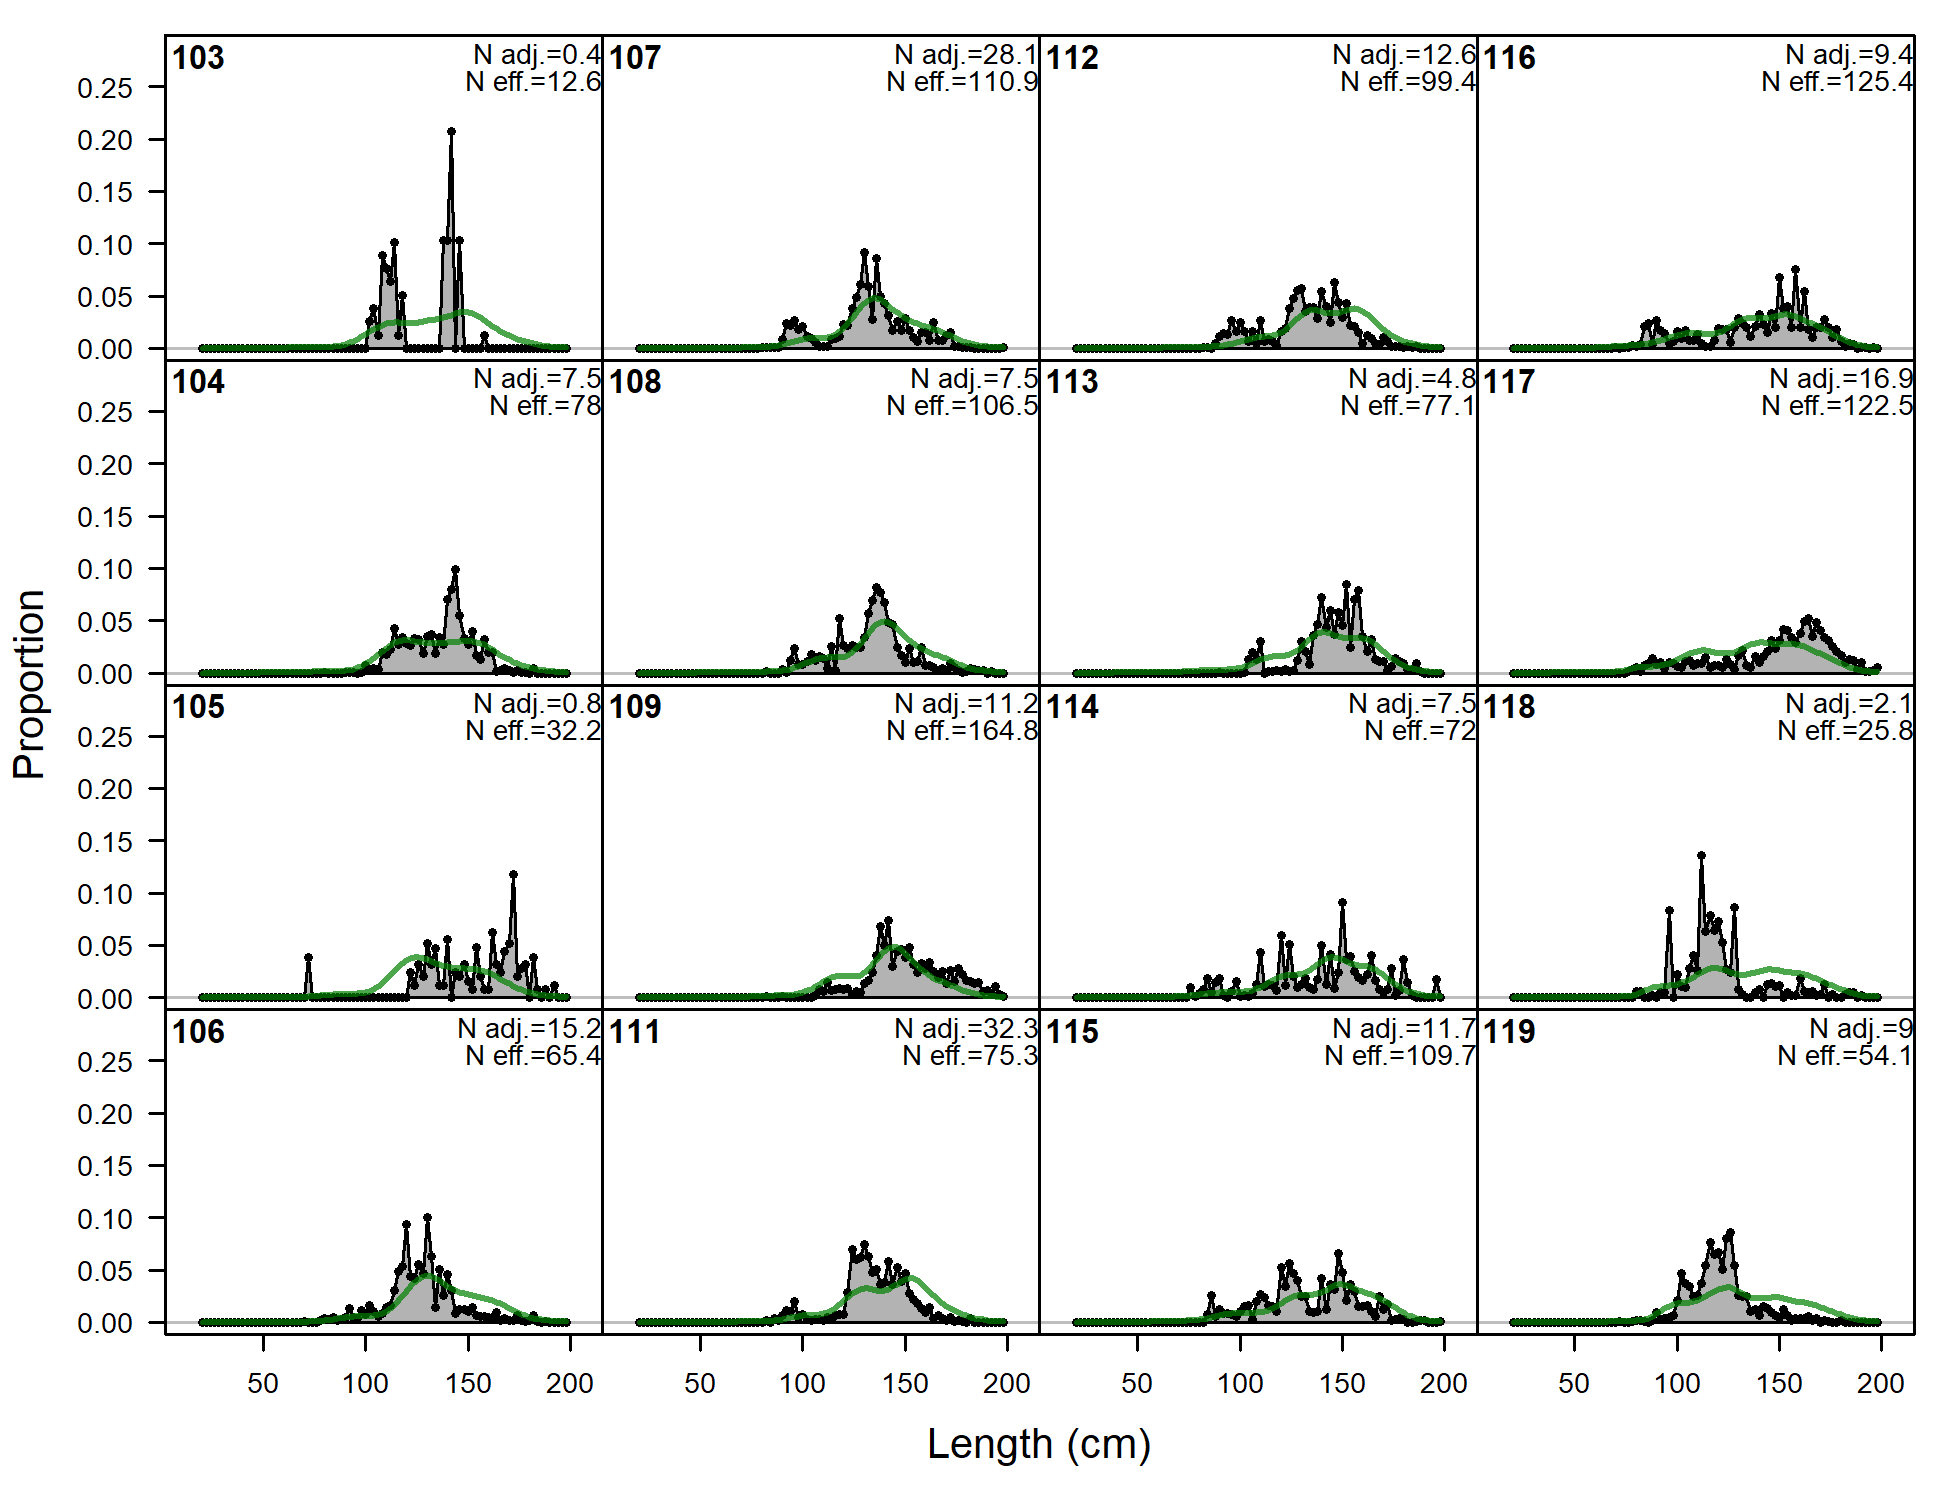
Length comps, whole catch, A3-LL-n (plot 1 of 6).
'N adj.' is the input sample size after data-weighting adjustment. N eff. is the calculated effective sample size used in the McAllister-Iannelli tuning method.
file: comp_lenfit_flt3mkt0_page1.png
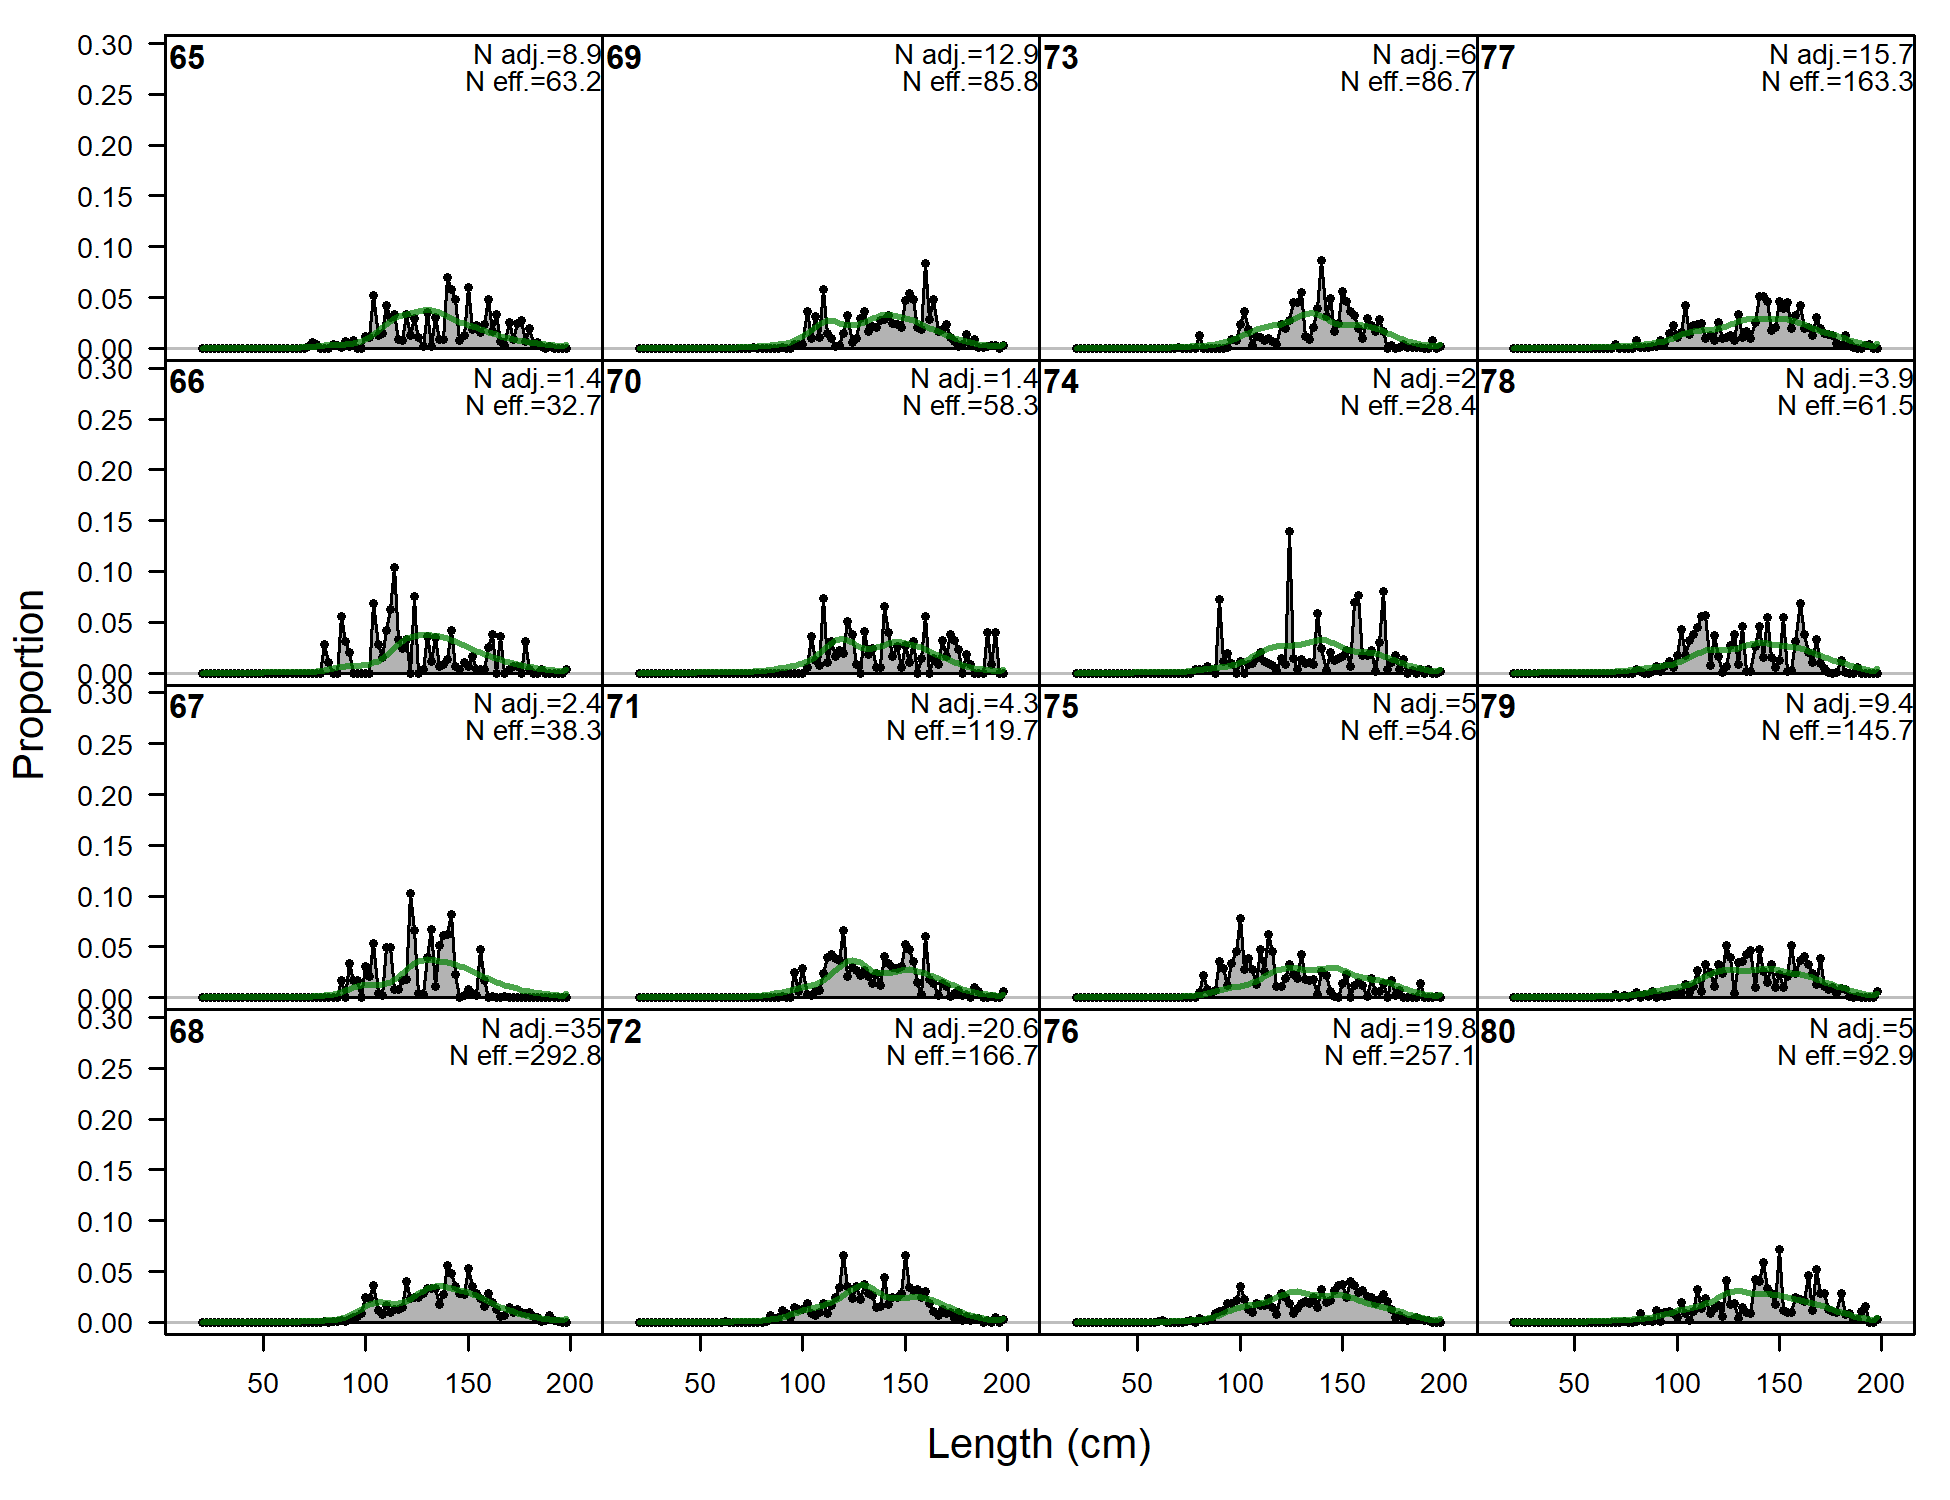
Length comps, whole catch, A3-LL-n (plot 2 of 6)
file: comp_lenfit_flt3mkt0_page2.png
Length comps, whole catch, A3-LL-n (plot 3 of 6)
file: comp_lenfit_flt3mkt0_page3.png
Length comps, whole catch, A3-LL-n (plot 4 of 6)
file: comp_lenfit_flt3mkt0_page4.png
Length comps, whole catch, A3-LL-n (plot 5 of 6)
file: comp_lenfit_flt3mkt0_page5.png
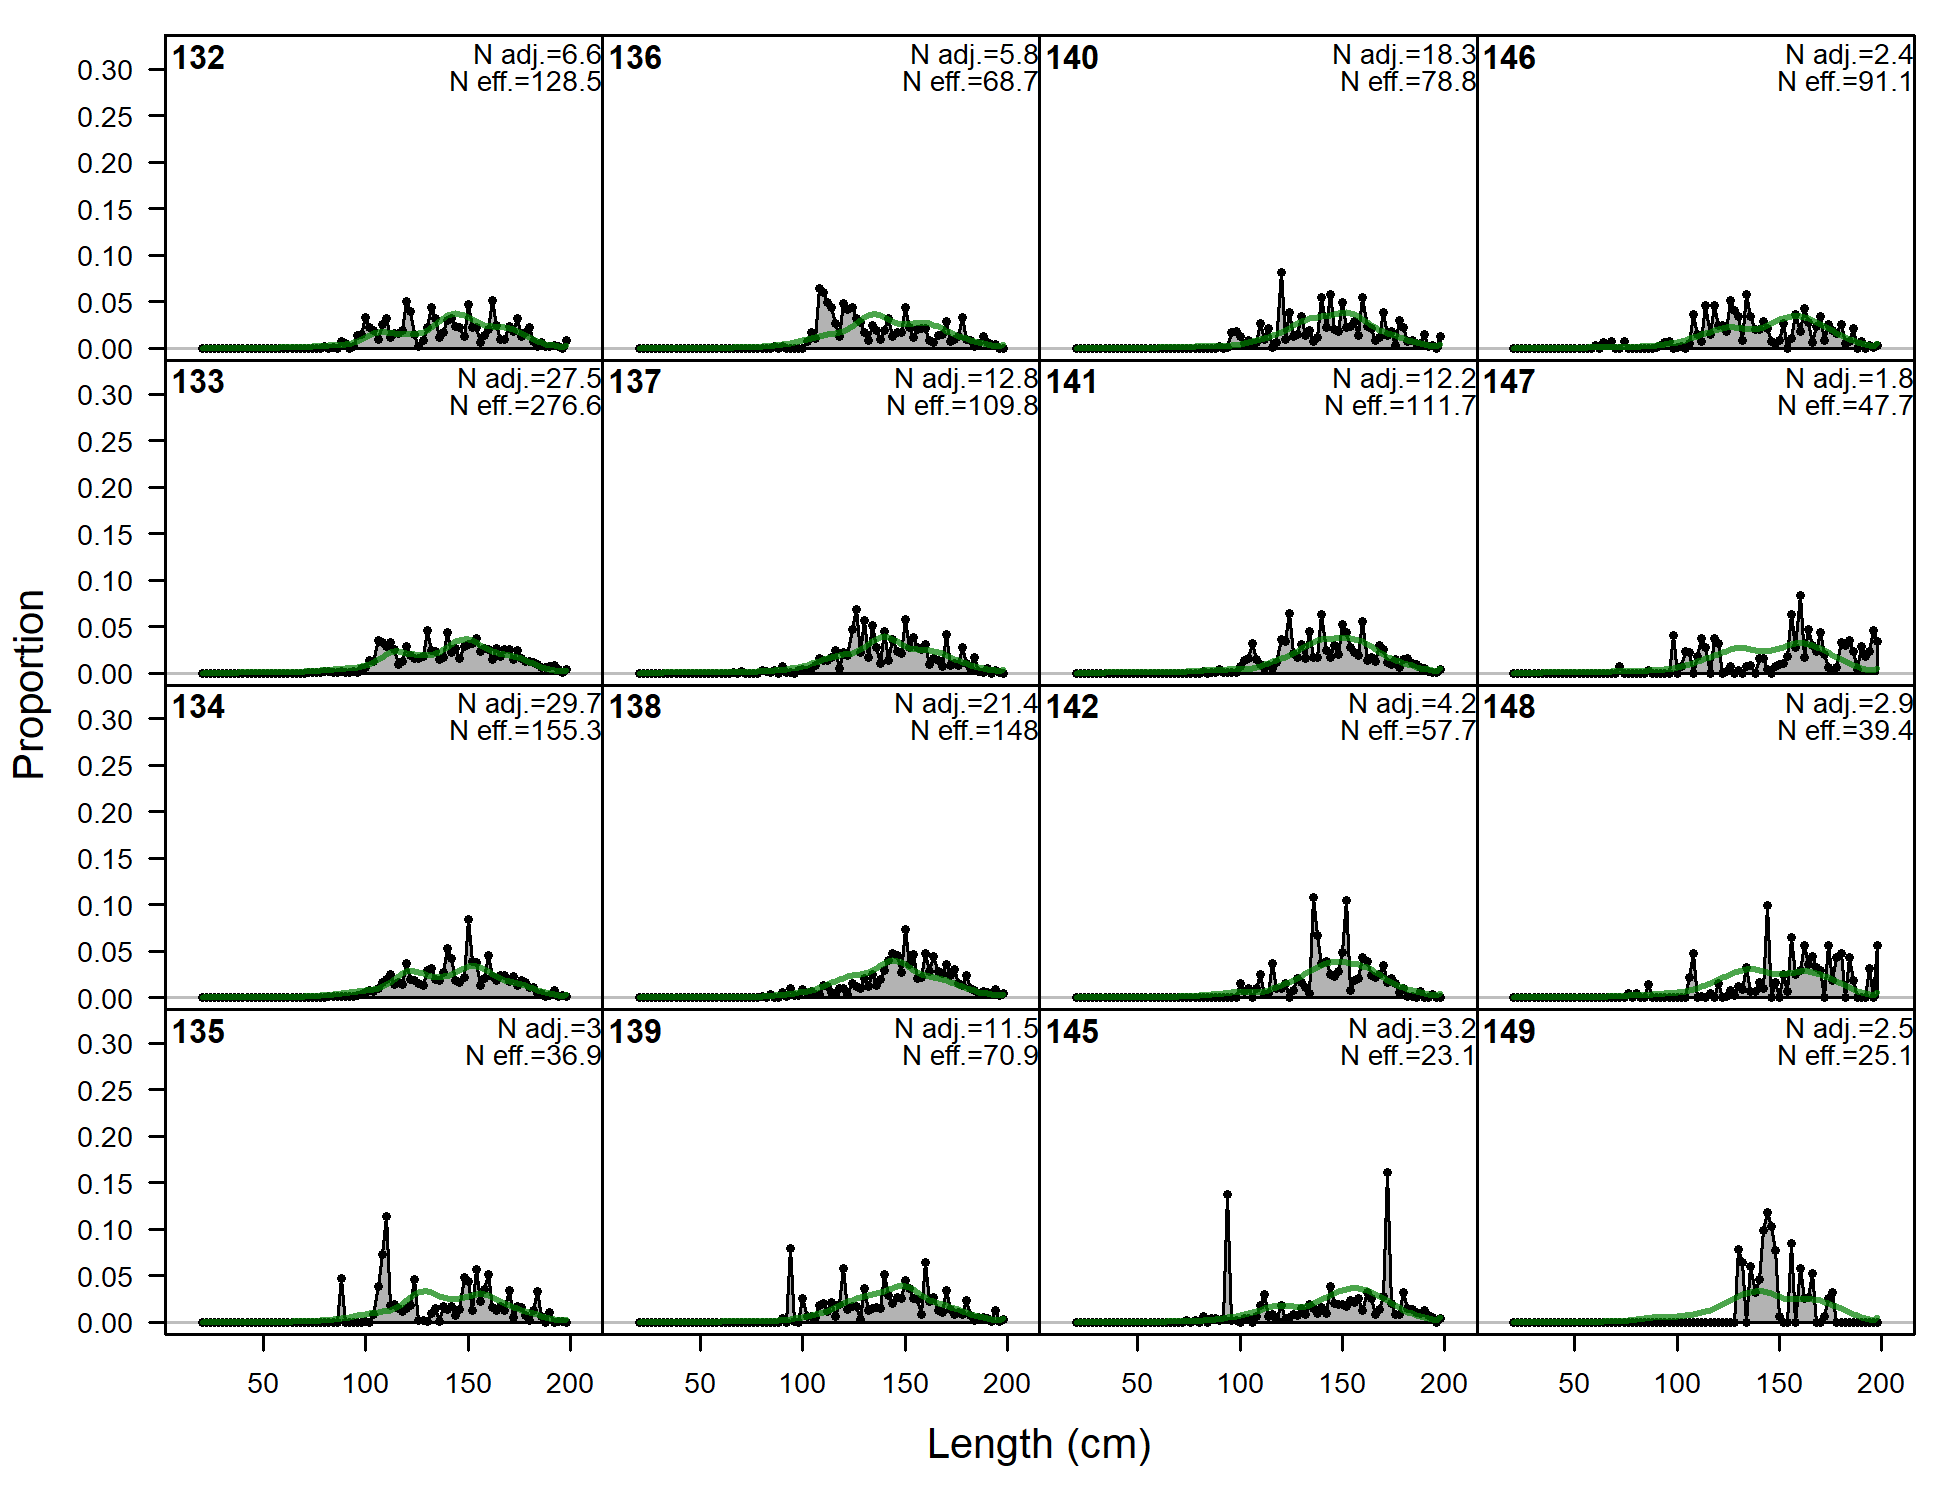
Length comps, whole catch, A3-LL-n (plot 6 of 6)
file: comp_lenfit_flt3mkt0_page6.png
Pearson residuals, whole catch, A3-LL-n (max=4.57) (plot 6 of 6)
Closed bubbles are positive residuals (observed > expected) and open bubbles are negative residuals (observed < expected).
file: comp_lenfit_residsflt3mkt0_page6.png
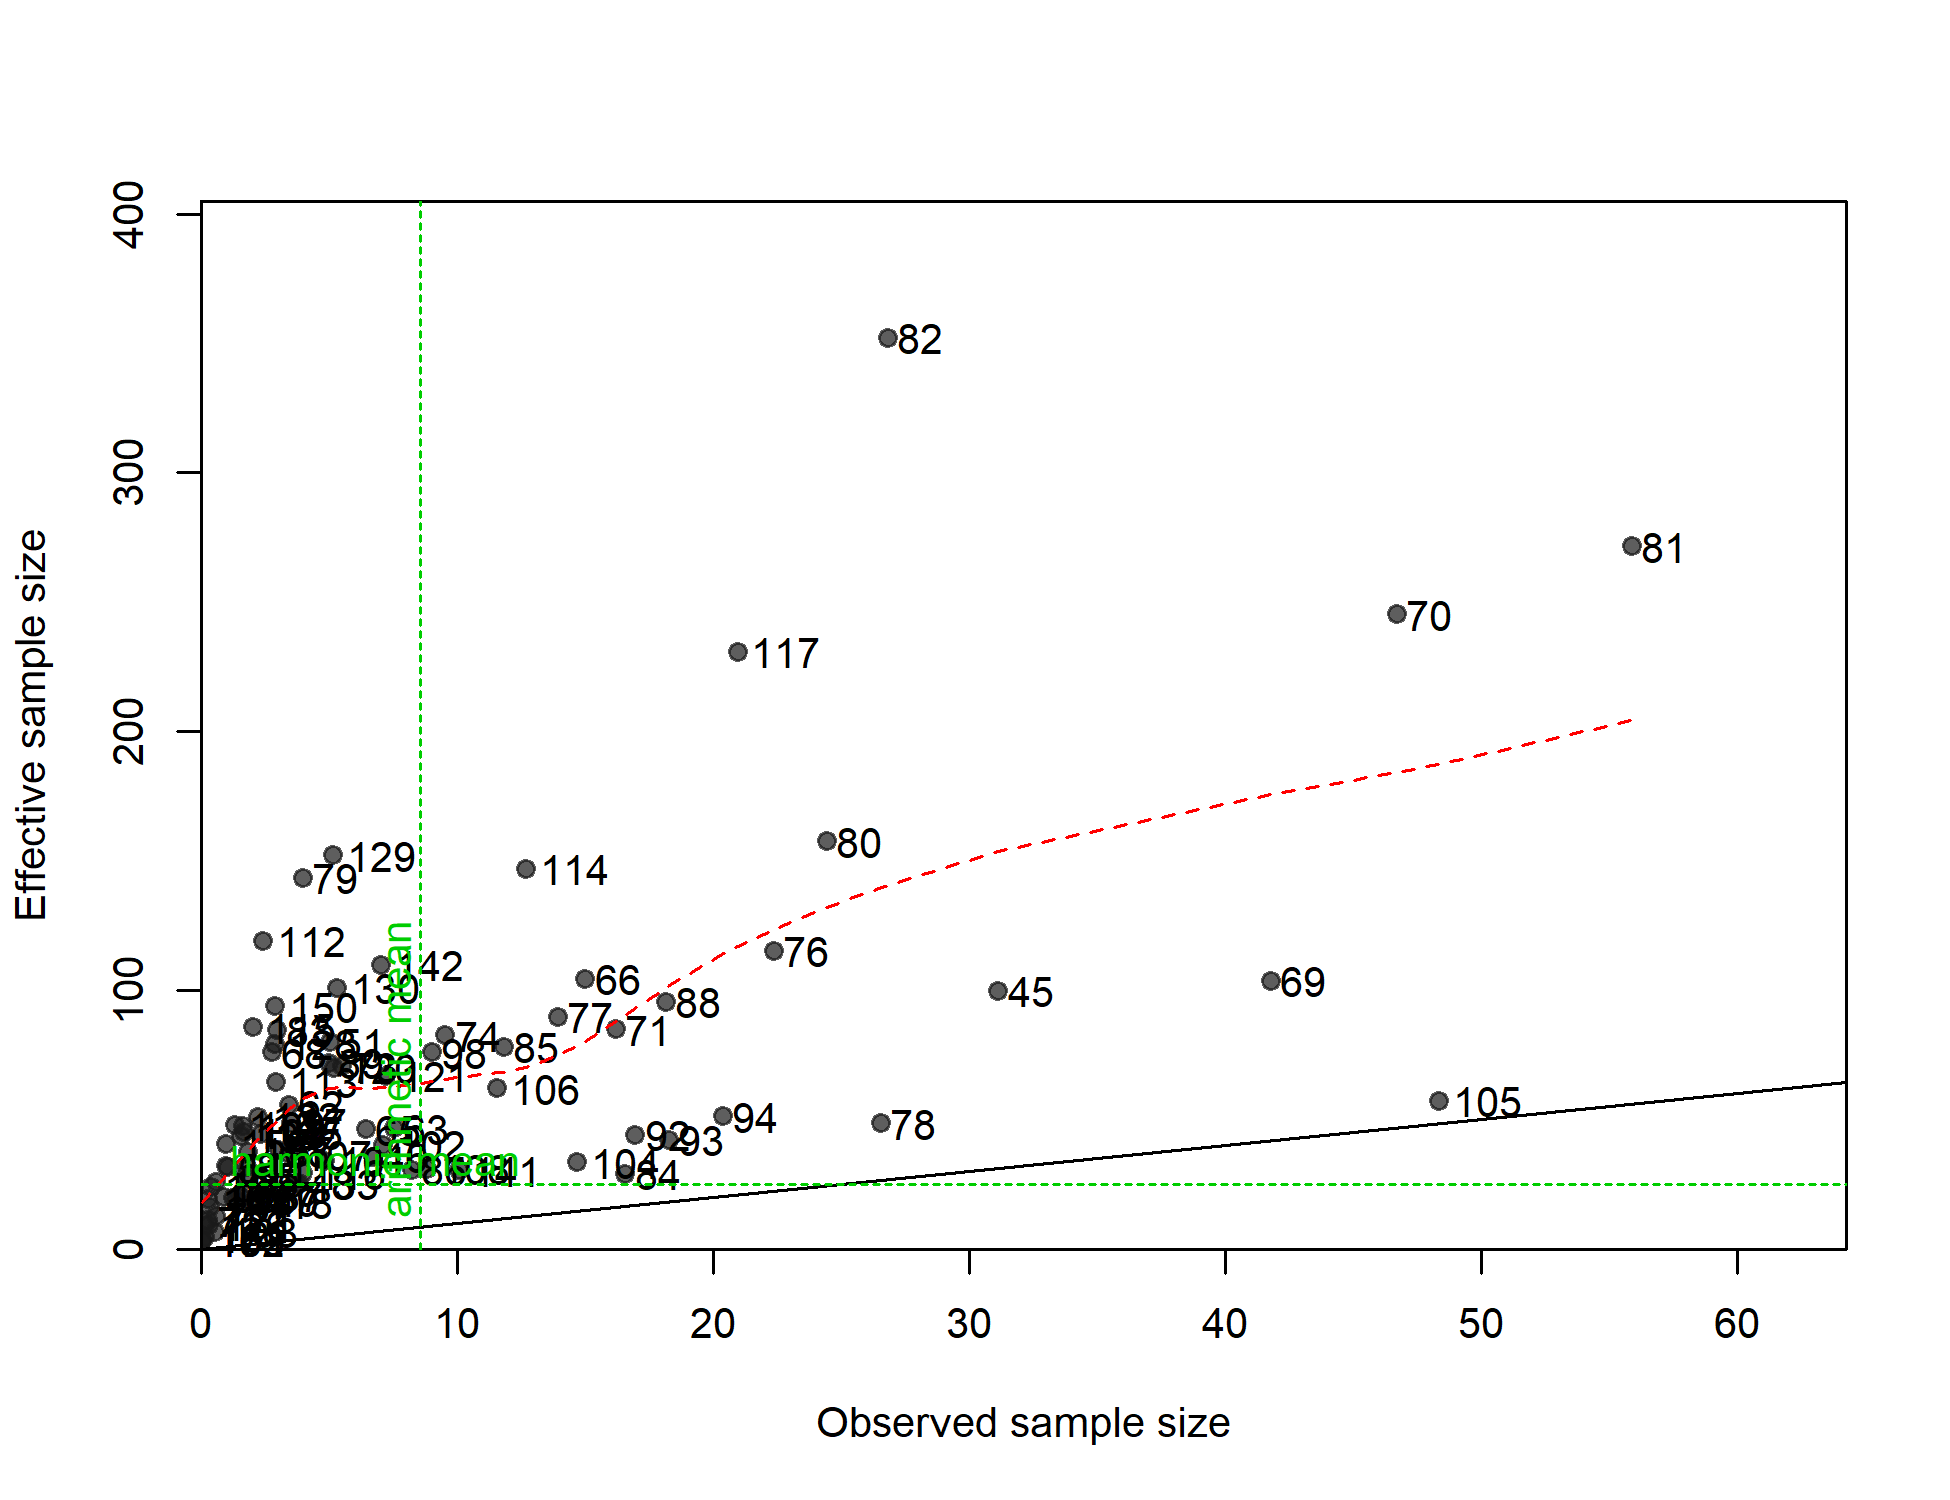
N-EffN comparison, Length comps, whole catch, A3-LL-n
file: comp_lenfit_sampsize_flt3mkt0.png
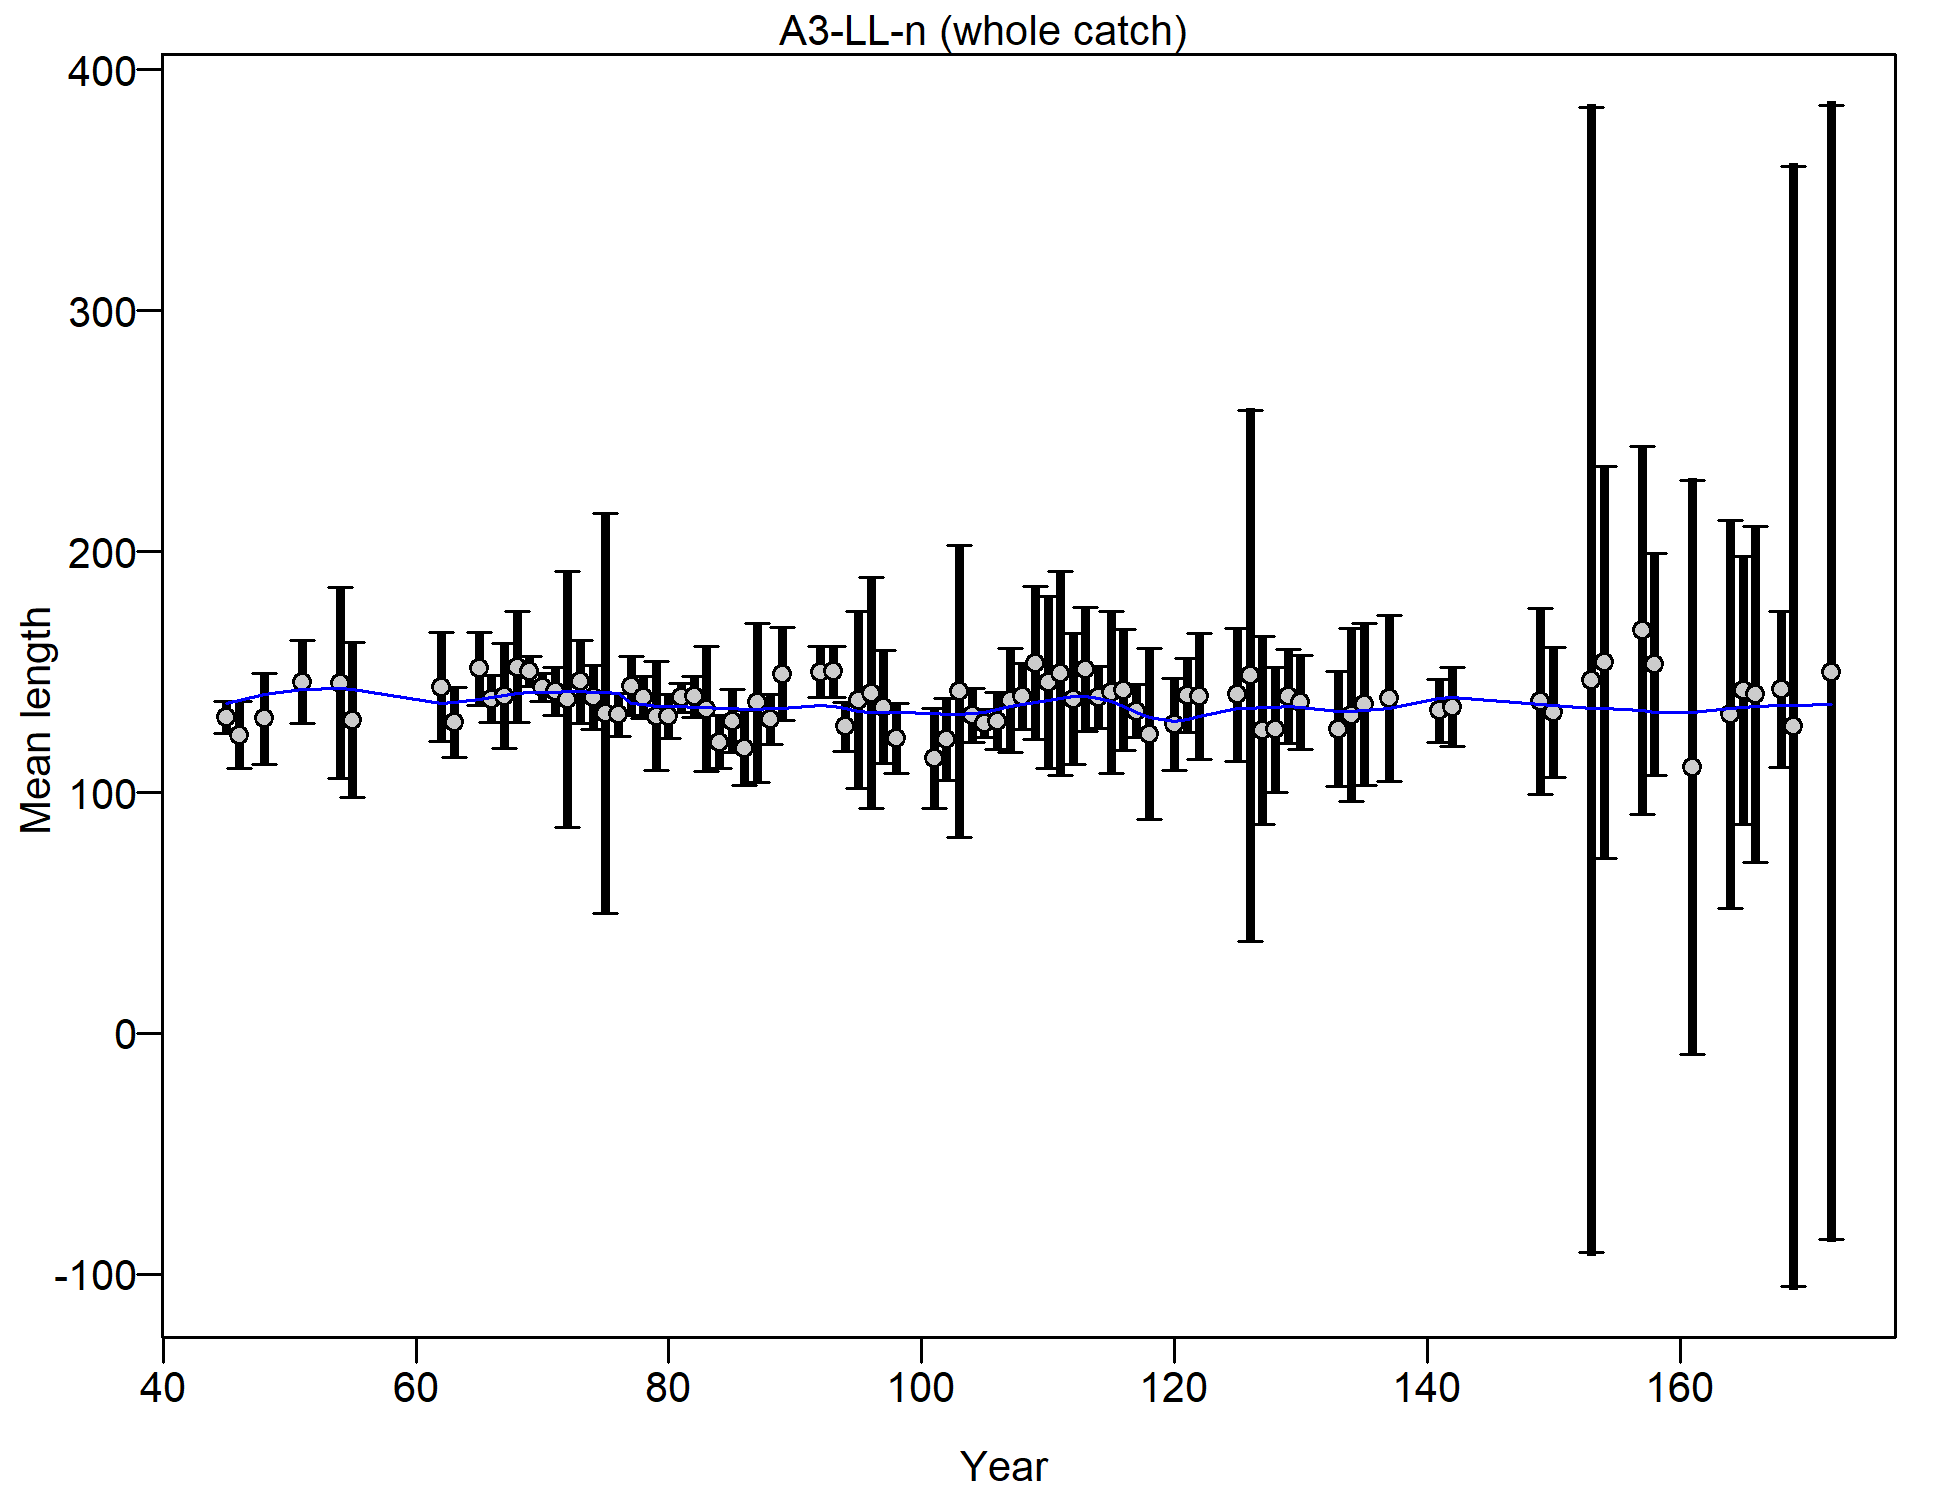
Mean length for A3-LL-n with 95% confidence intervals based on current samples sizes.
Francis data weighting method TA1.8: thinner intervals (with capped ends) show result of further adjusting sample sizes based on suggested multiplier (with 95% interval) for len data from A3-LL-n:
1.0124 (0.7325-1.5506)
For more info, see
Francis, R.I.C.C. (2011). Data weighting in statistical fisheries stock assessment models. Can. J. Fish. Aquat. Sci. 68: 1124-1138. https://doi.org/10.1139/f2011-025
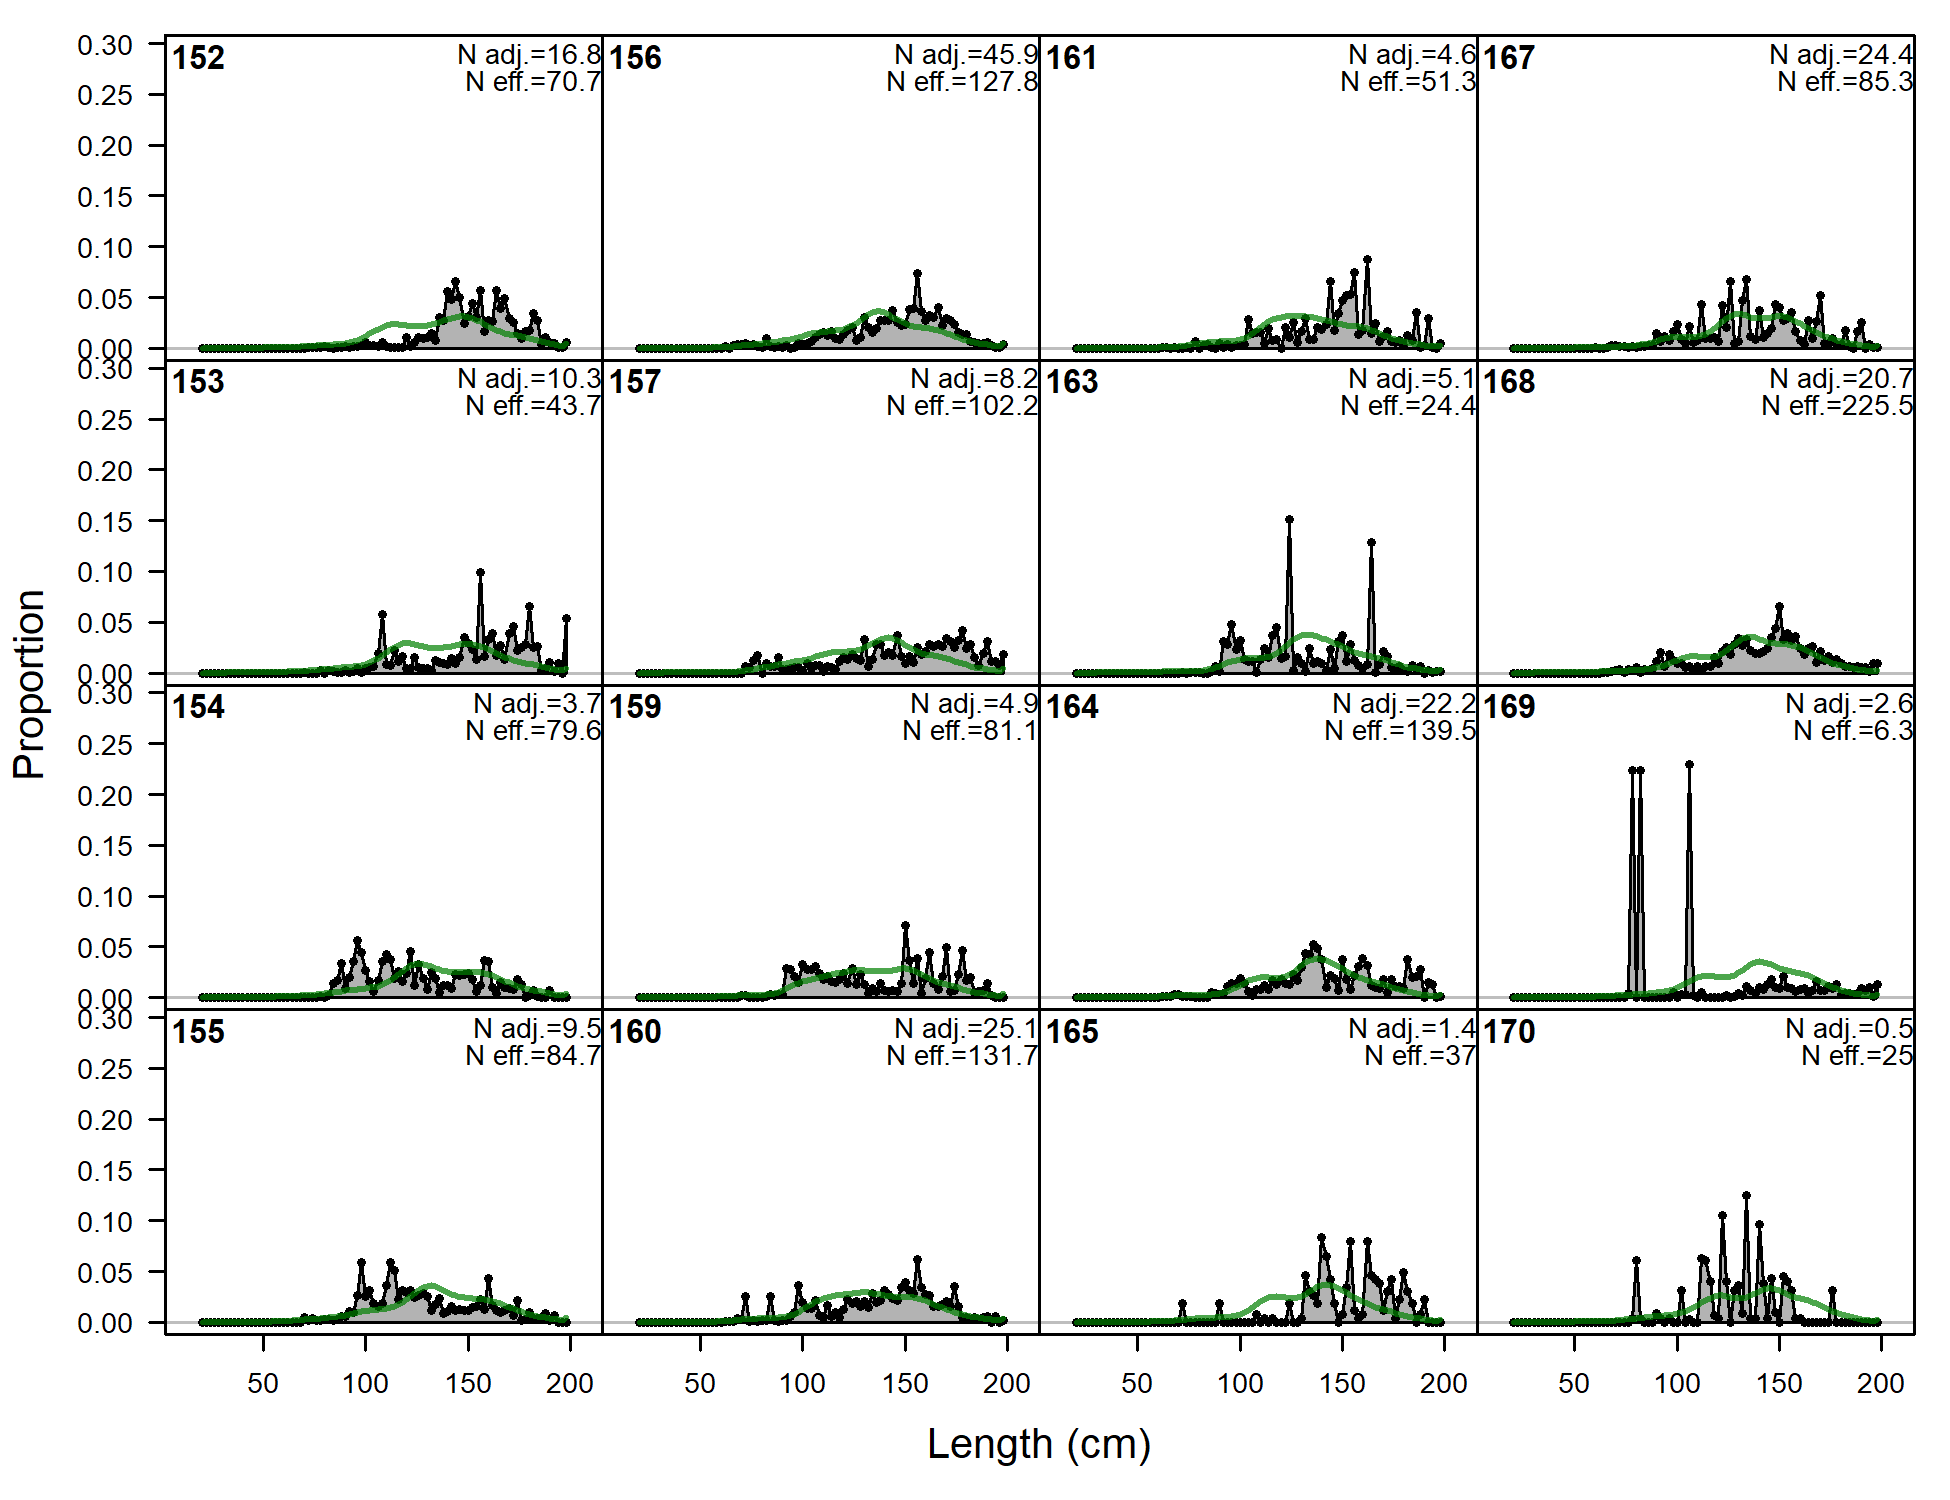
Length comps, whole catch, A4-LL-n (plot 1 of 8).
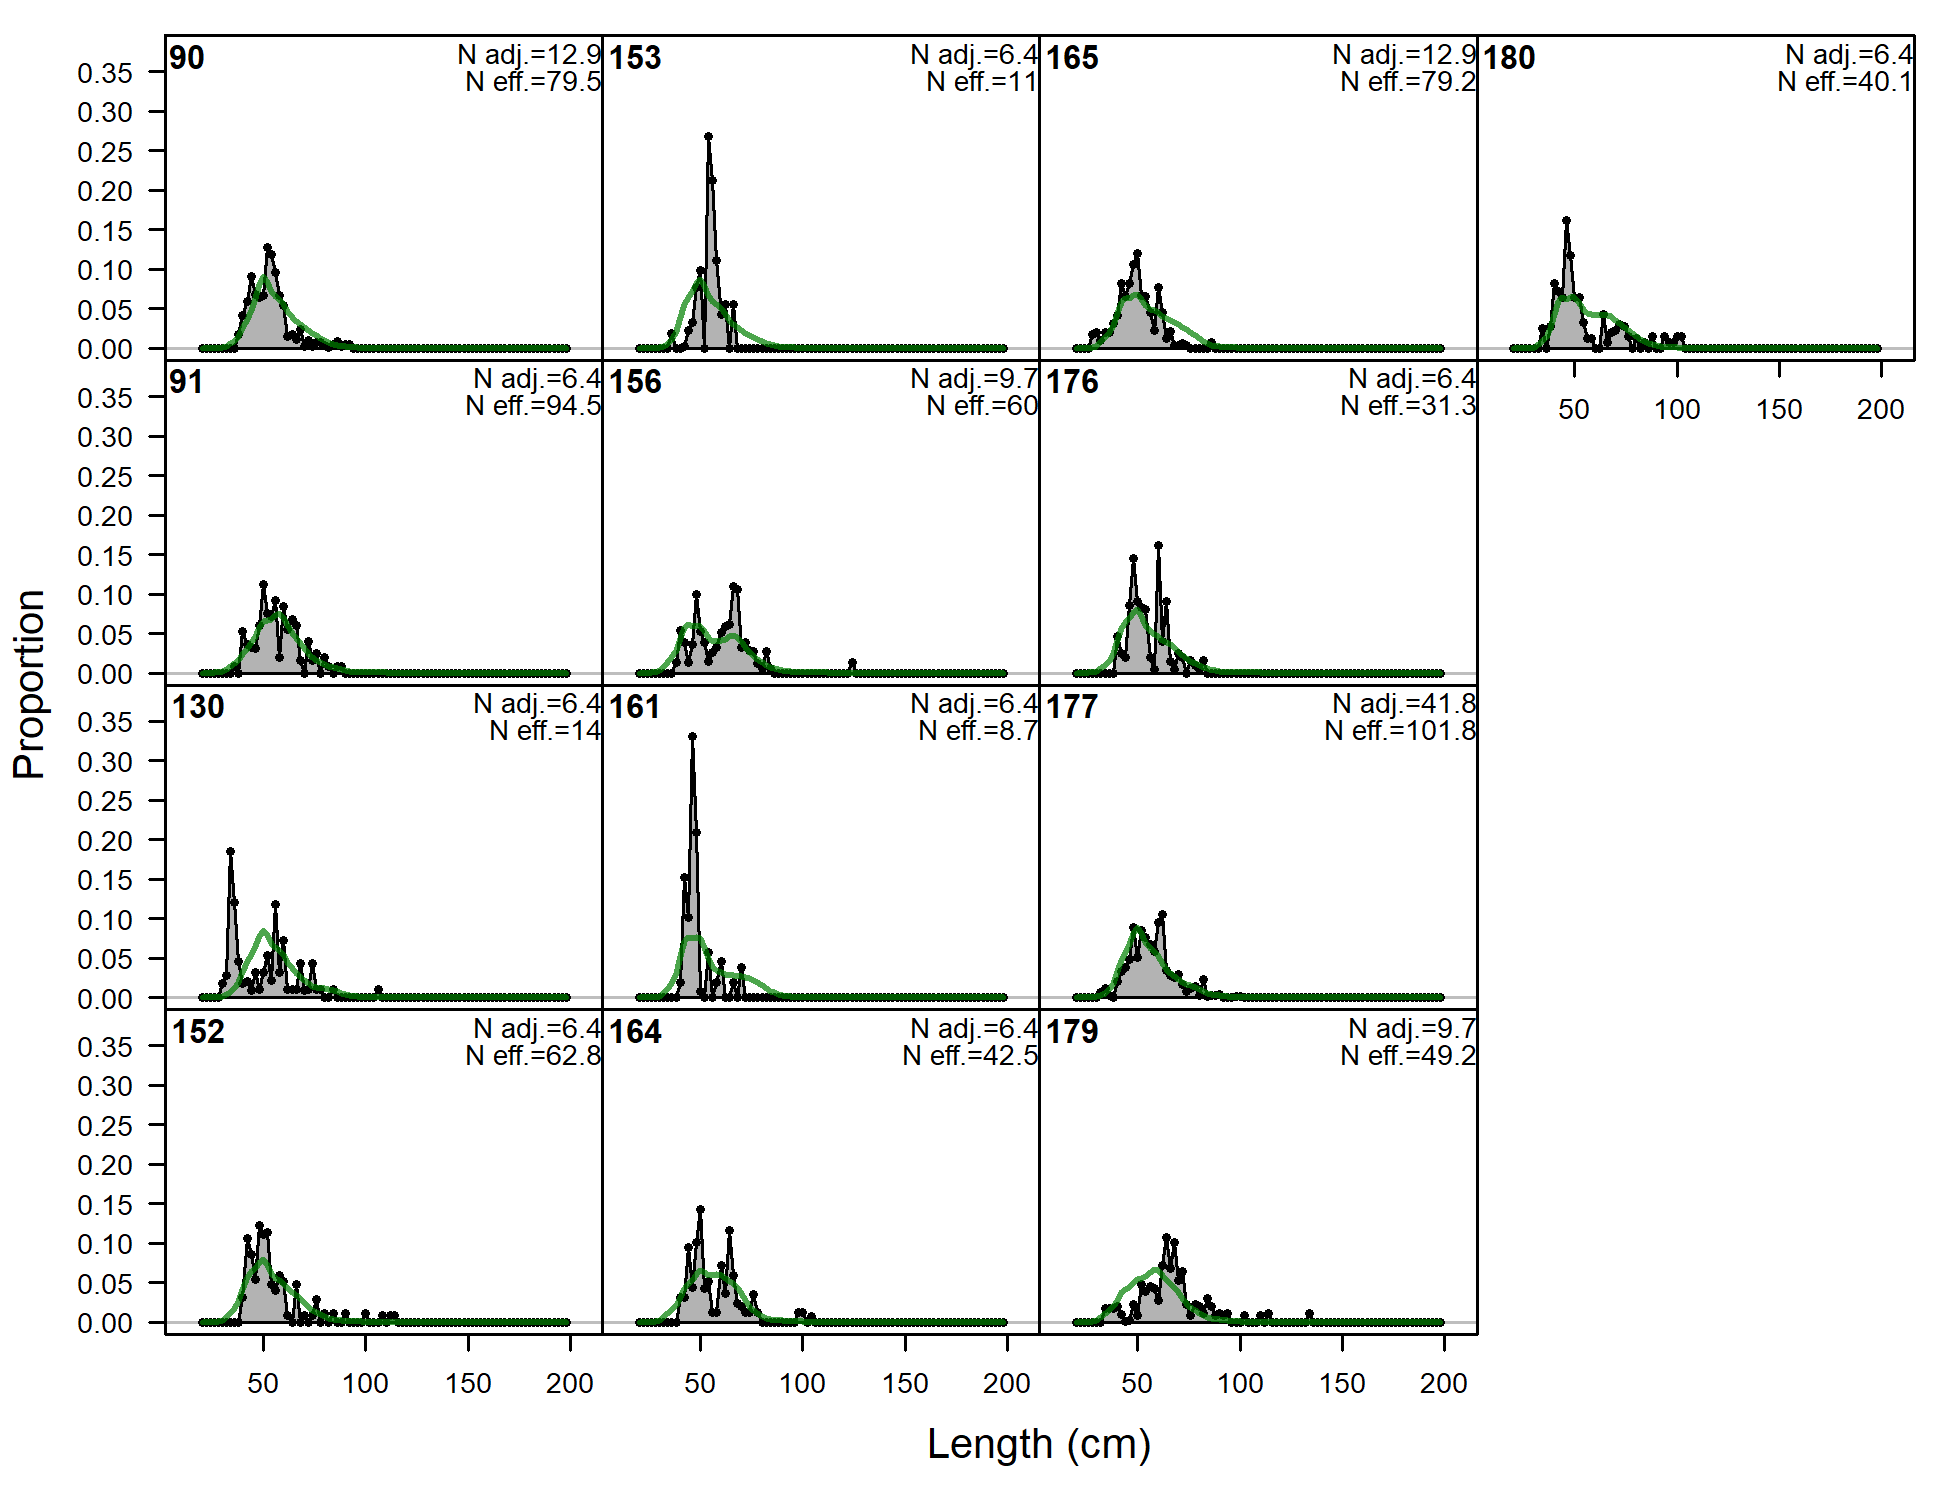
'N adj.' is the input sample size after data-weighting adjustment. N eff. is the calculated effective sample size used in the McAllister-Iannelli tuning method.
file: comp_lenfit_flt4mkt0_page1.png
Length comps, whole catch, A4-LL-n (plot 2 of 8)
file: comp_lenfit_flt4mkt0_page2.png
Length comps, whole catch, A4-LL-n (plot 3 of 8)
file: comp_lenfit_flt4mkt0_page3.png
Length comps, whole catch, A4-LL-n (plot 4 of 8)
file: comp_lenfit_flt4mkt0_page4.png
Length comps, whole catch, A4-LL-n (plot 5 of 8)
file: comp_lenfit_flt4mkt0_page5.png
Length comps, whole catch, A4-LL-n (plot 6 of 8)
file: comp_lenfit_flt4mkt0_page6.png
Length comps, whole catch, A4-LL-n (plot 7 of 8)
file: comp_lenfit_flt4mkt0_page7.png
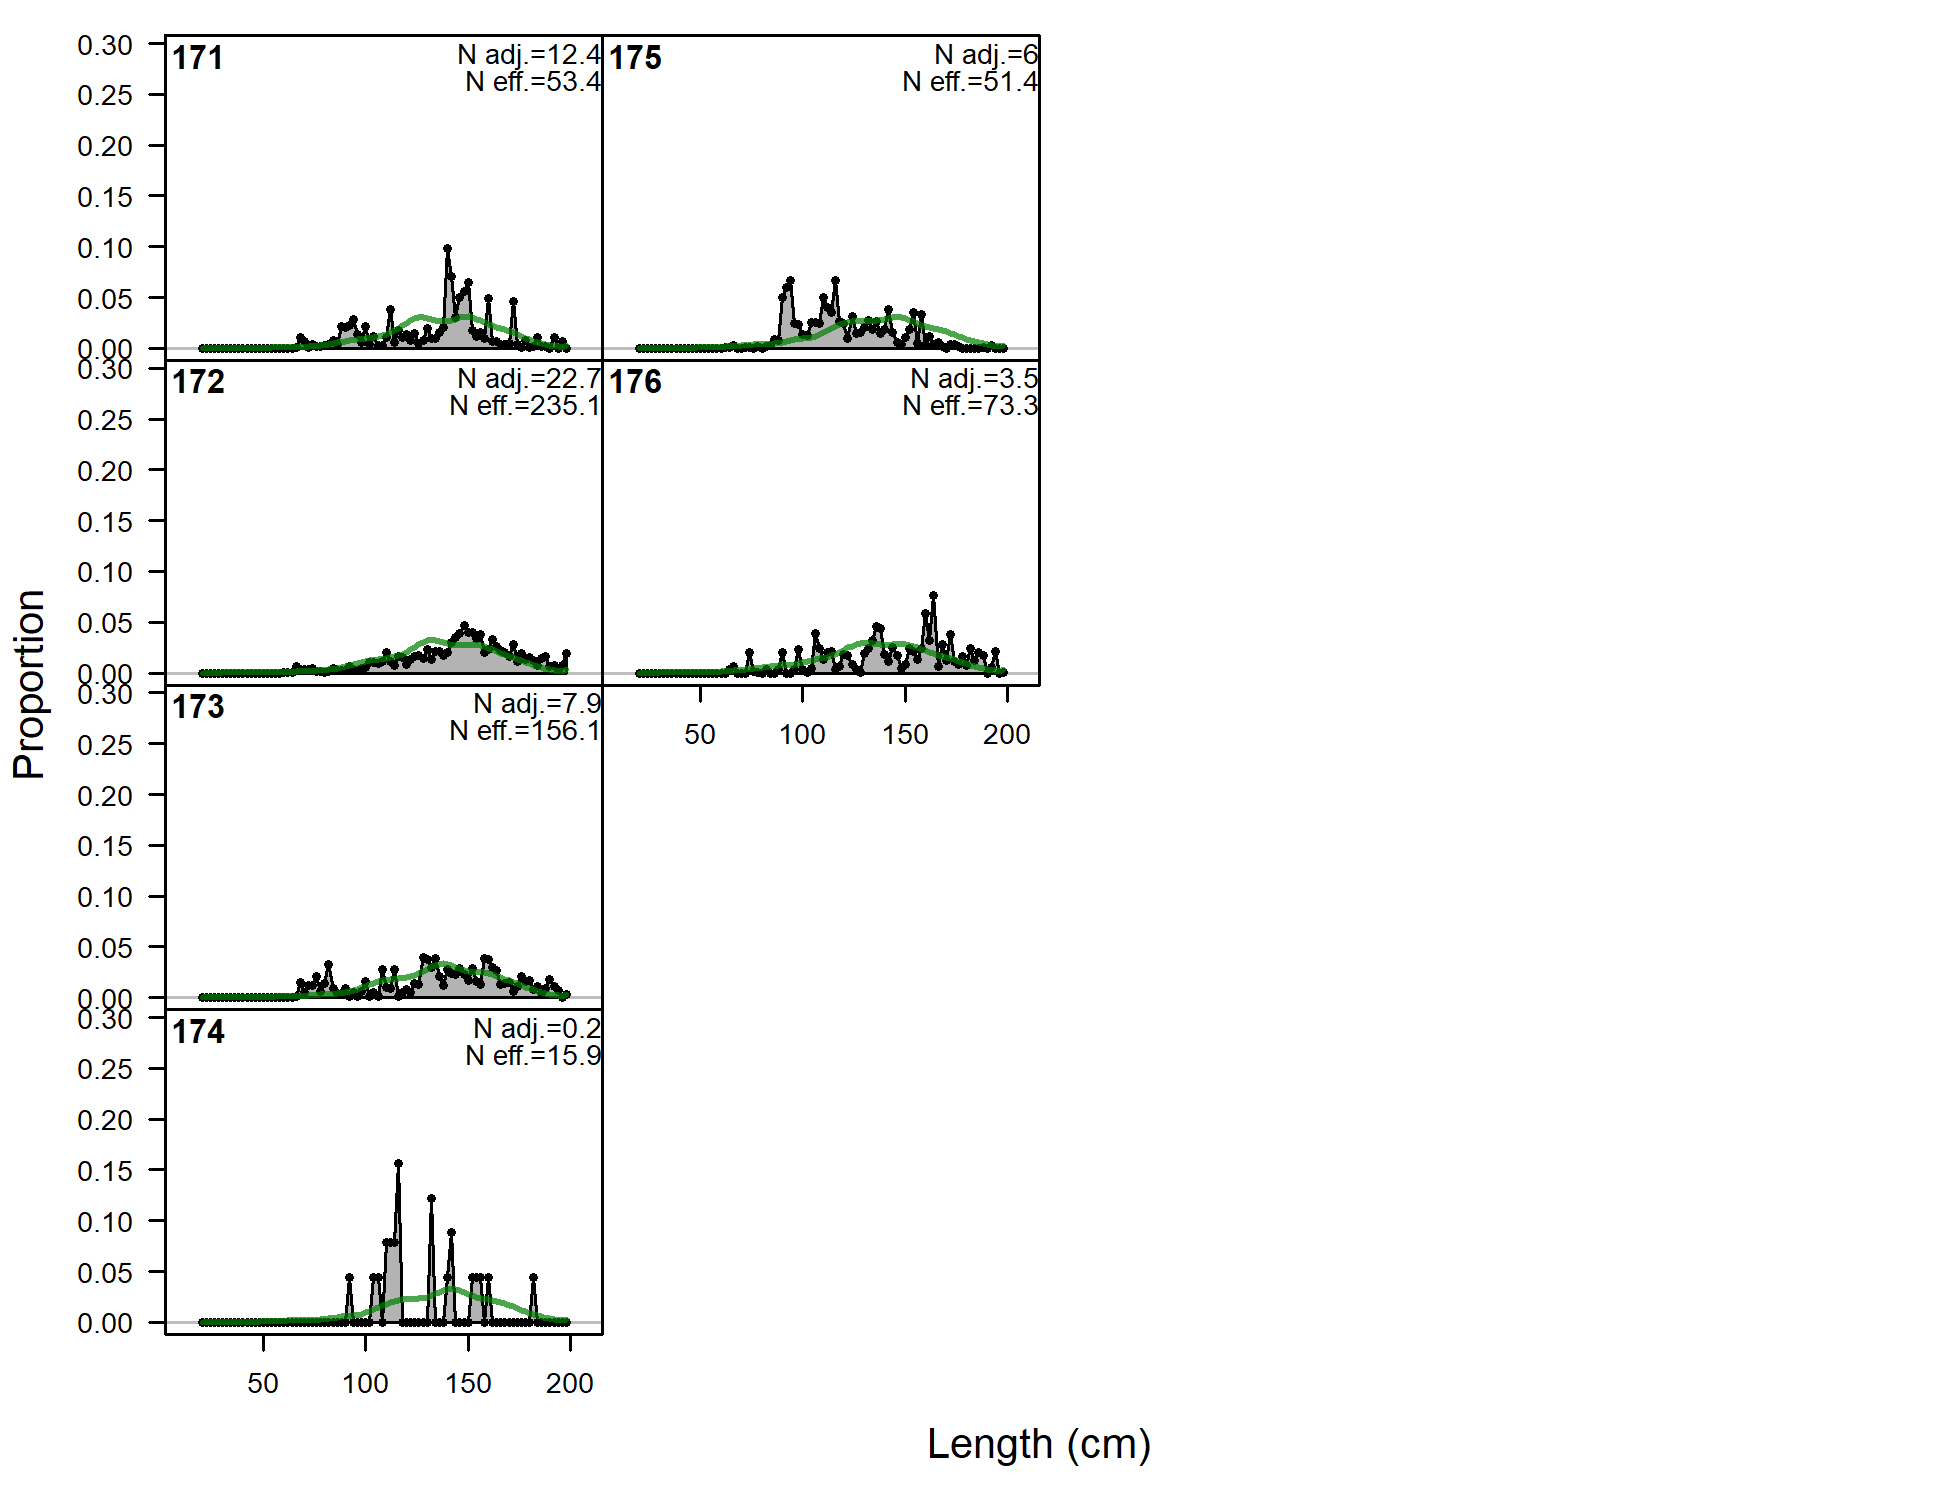
Length comps, whole catch, A4-LL-n (plot 8 of 8)
file: comp_lenfit_flt4mkt0_page8.png
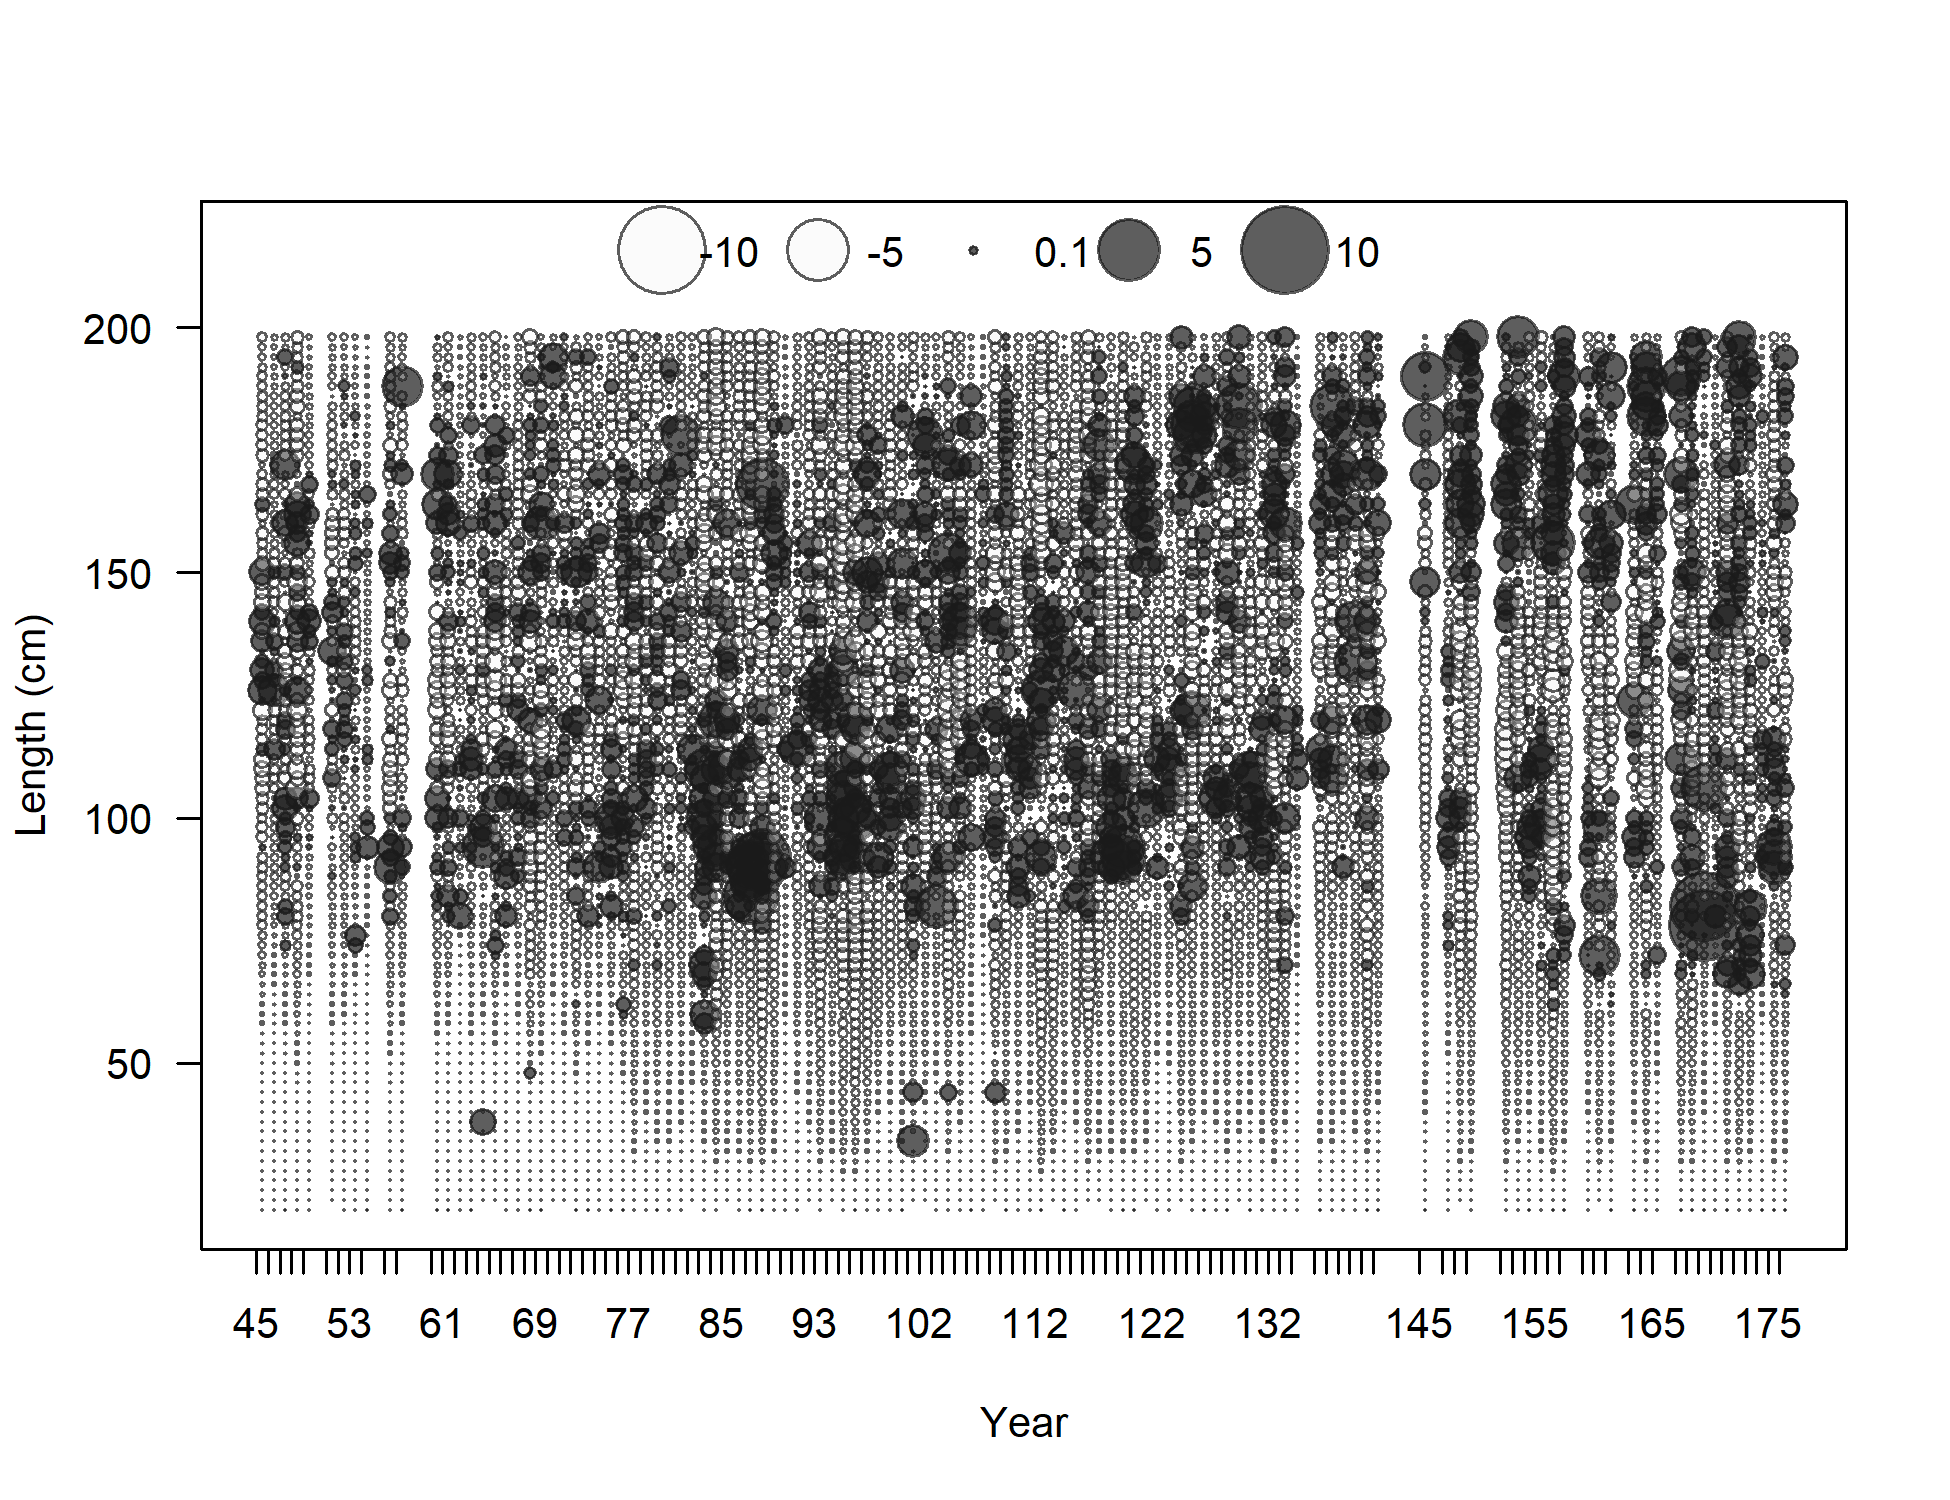
Pearson residuals, whole catch, A4-LL-n (max=6.63) (plot 8 of 8)
Closed bubbles are positive residuals (observed > expected) and open bubbles are negative residuals (observed < expected).
file: comp_lenfit_residsflt4mkt0_page8.png

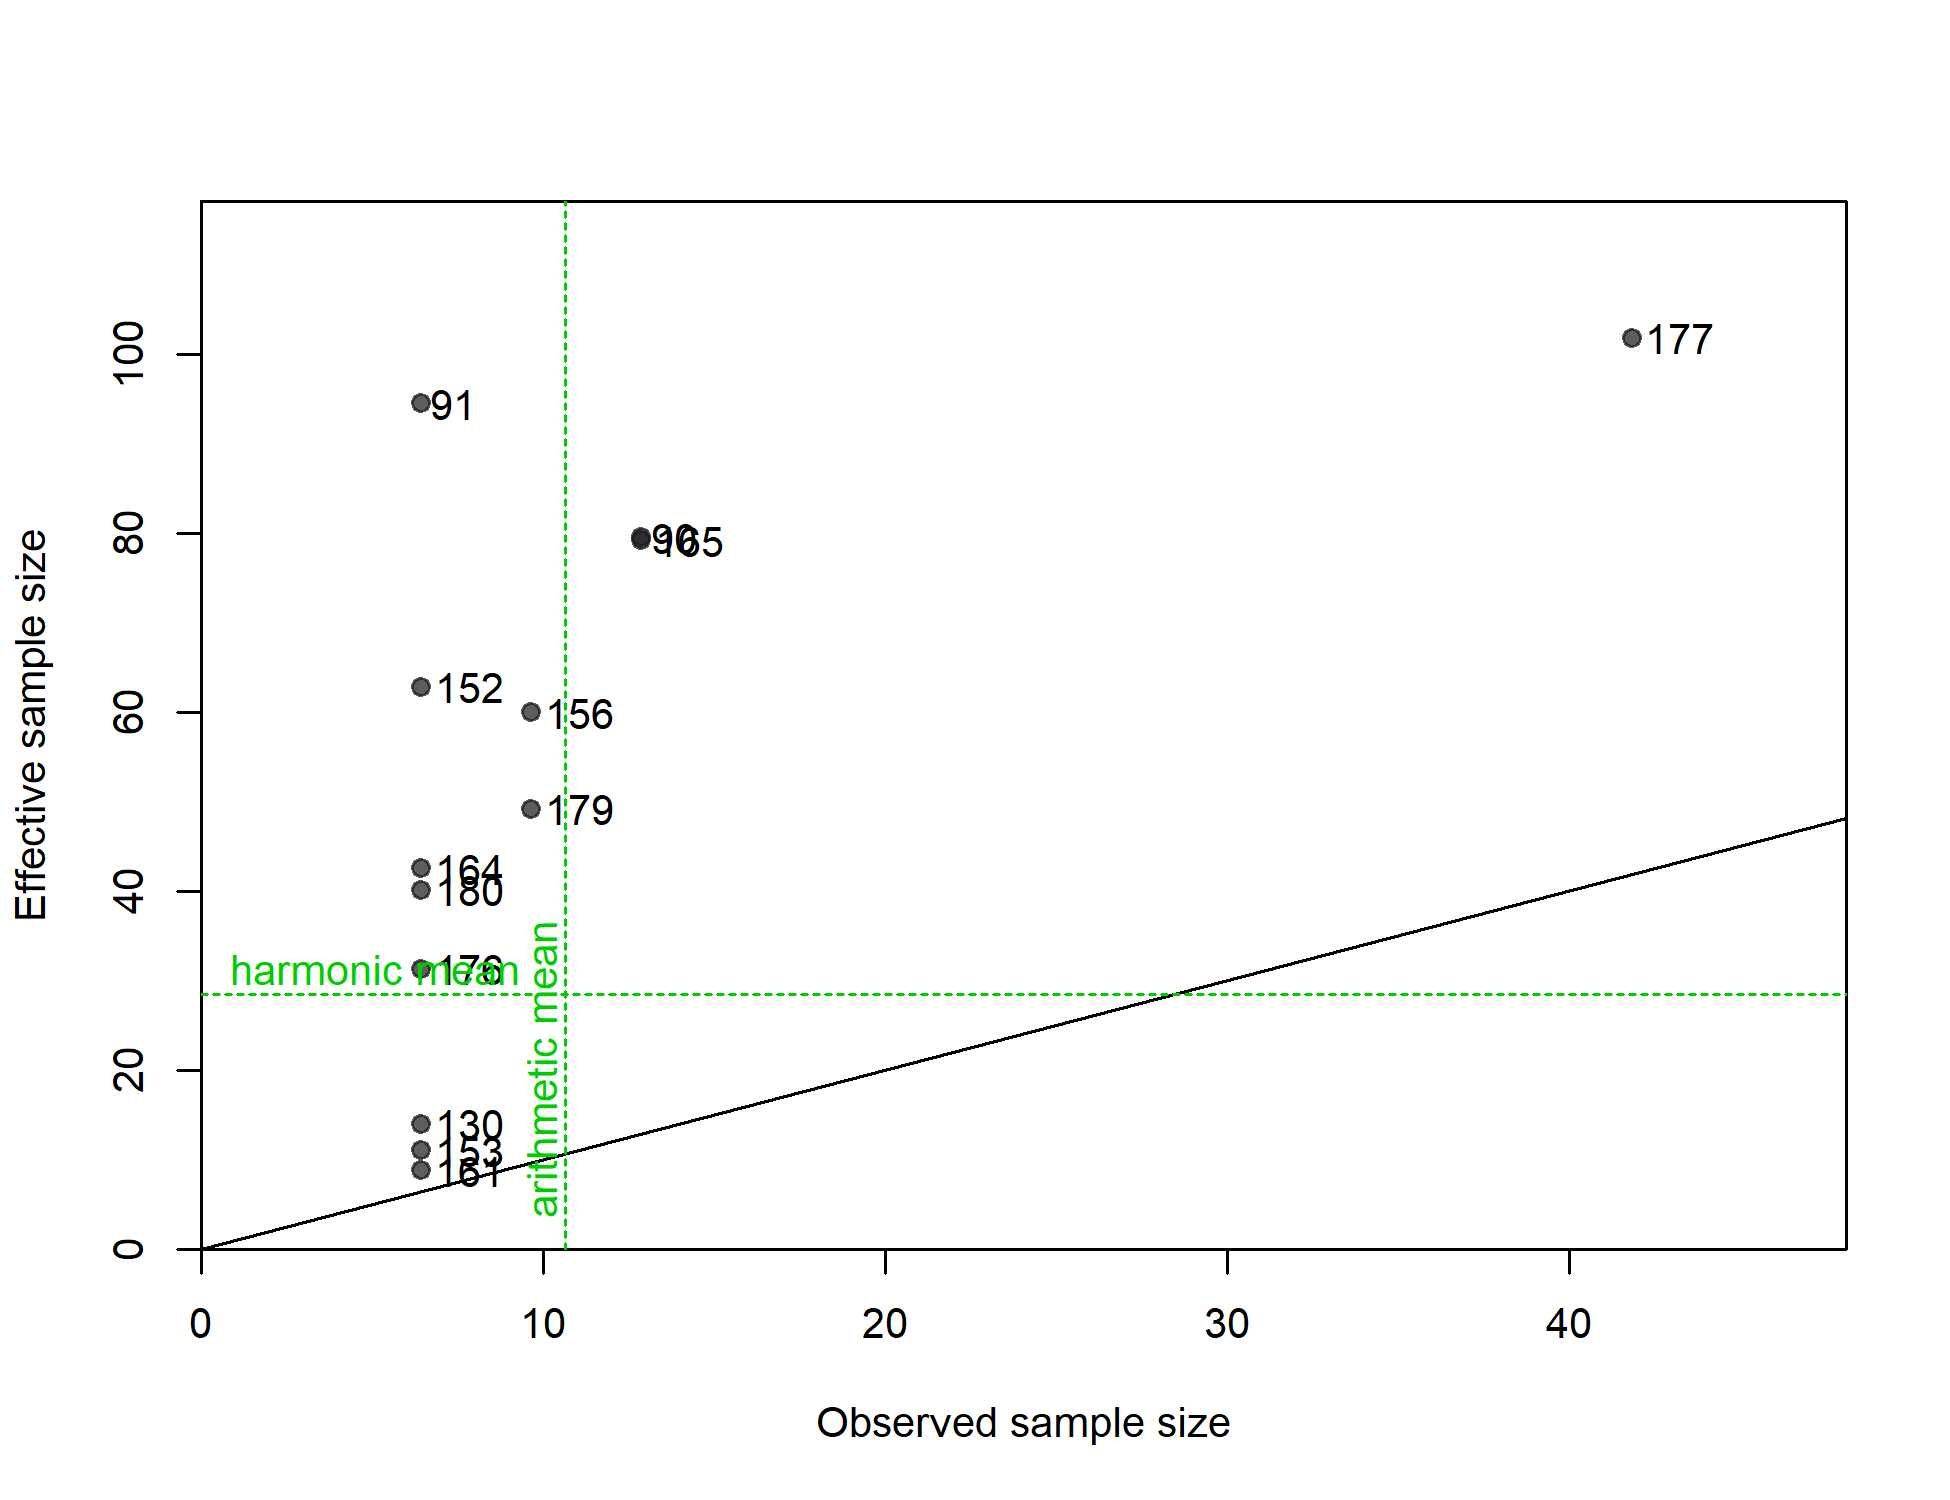
N-EffN comparison, Length comps, whole catch, A4-LL-n
file: comp_lenfit_sampsize_flt4mkt0.png
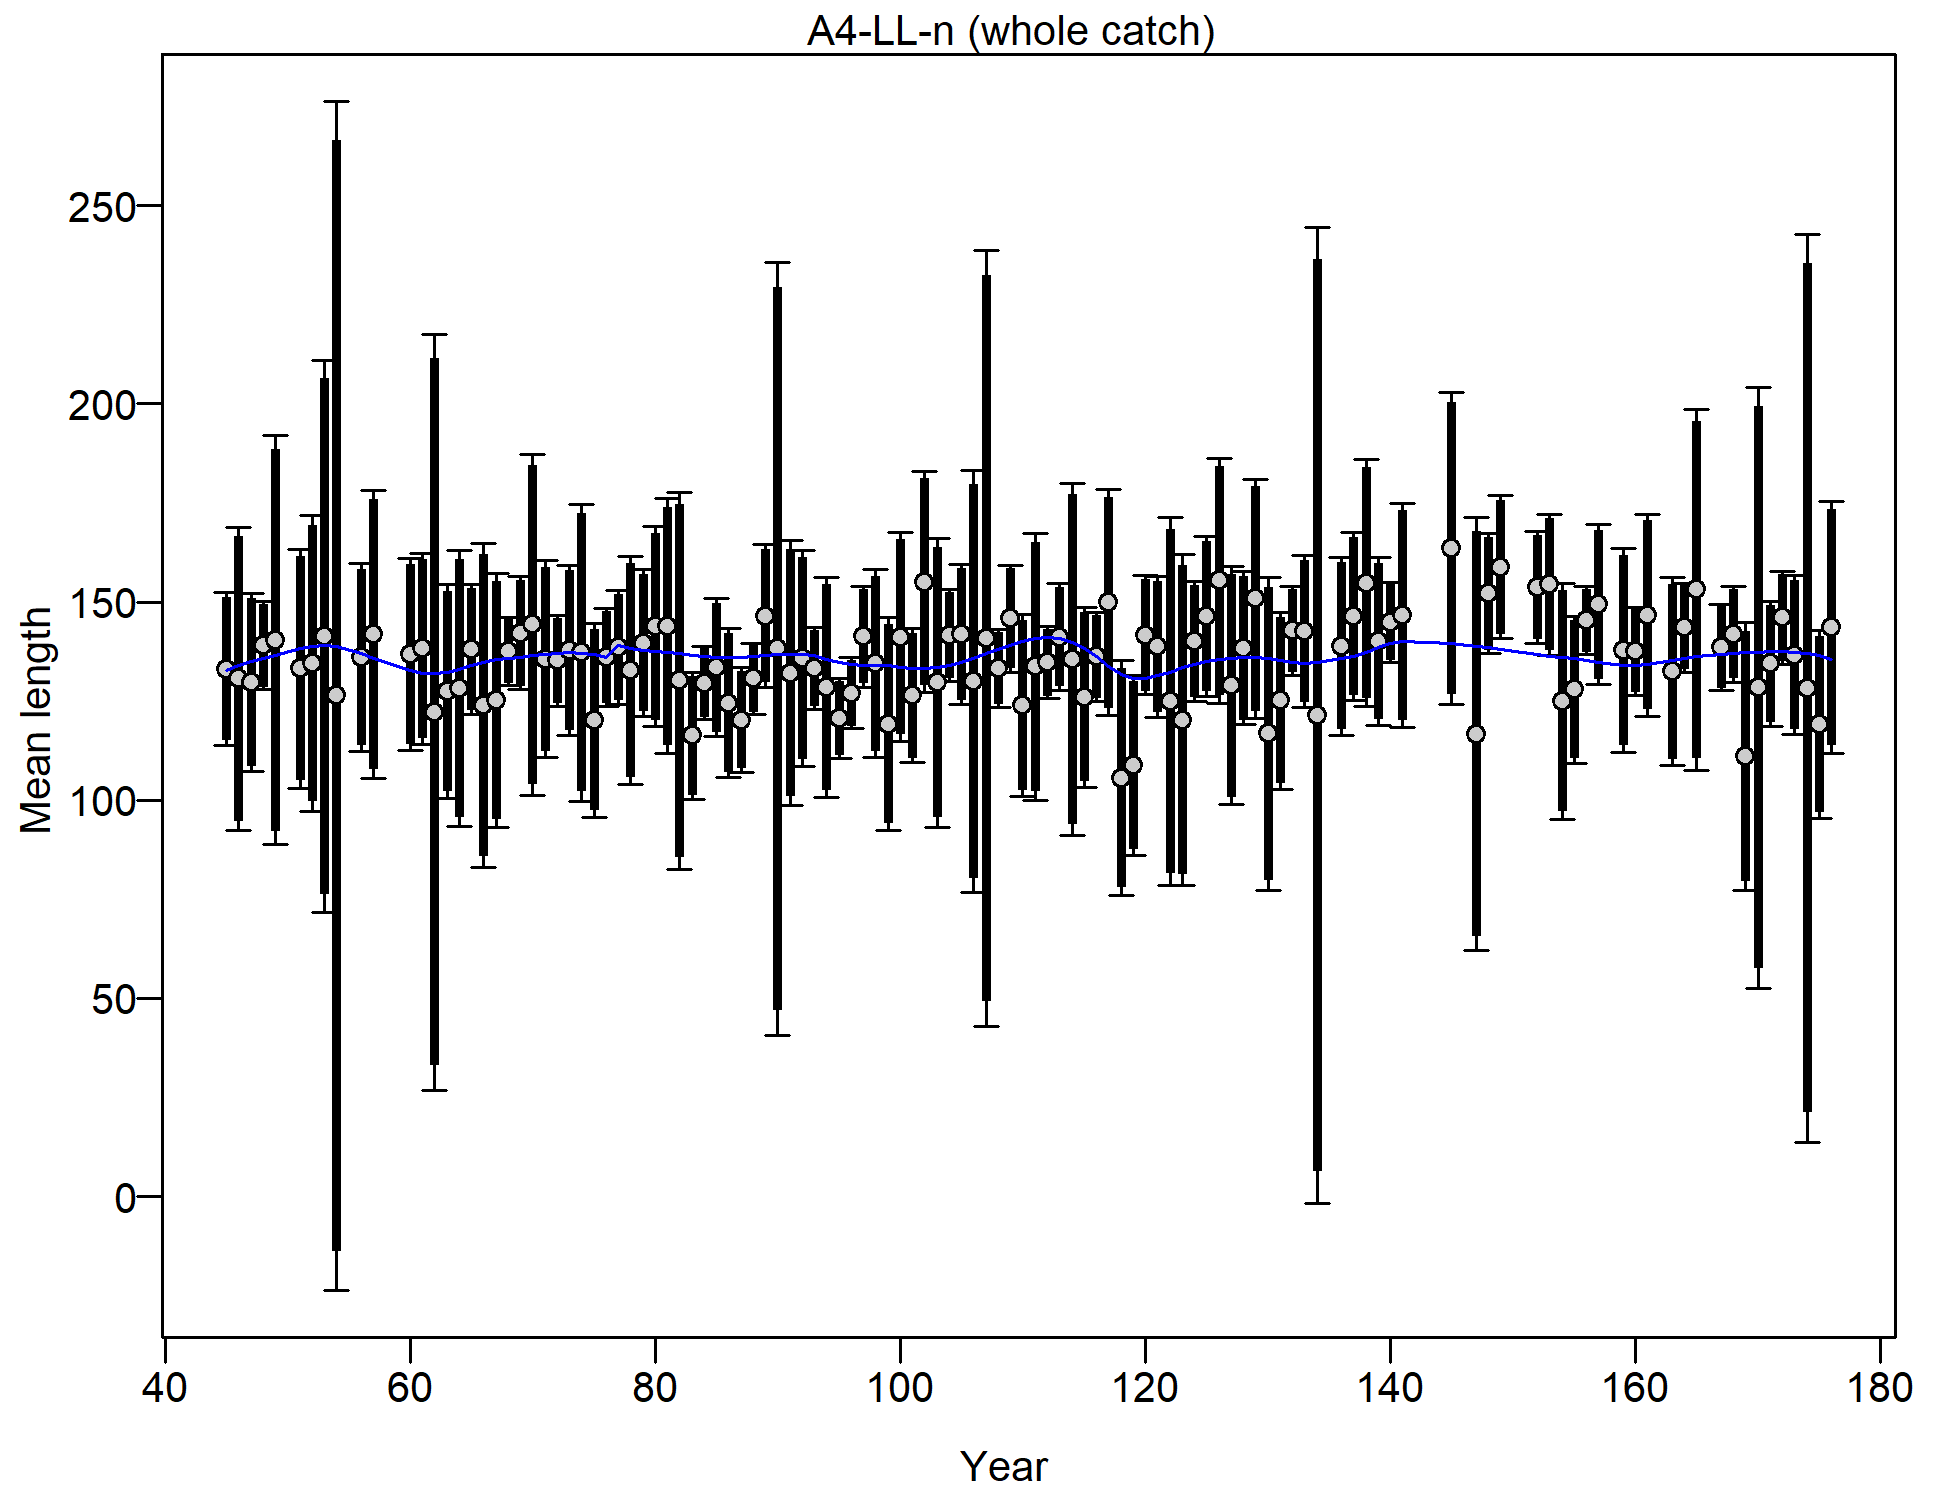
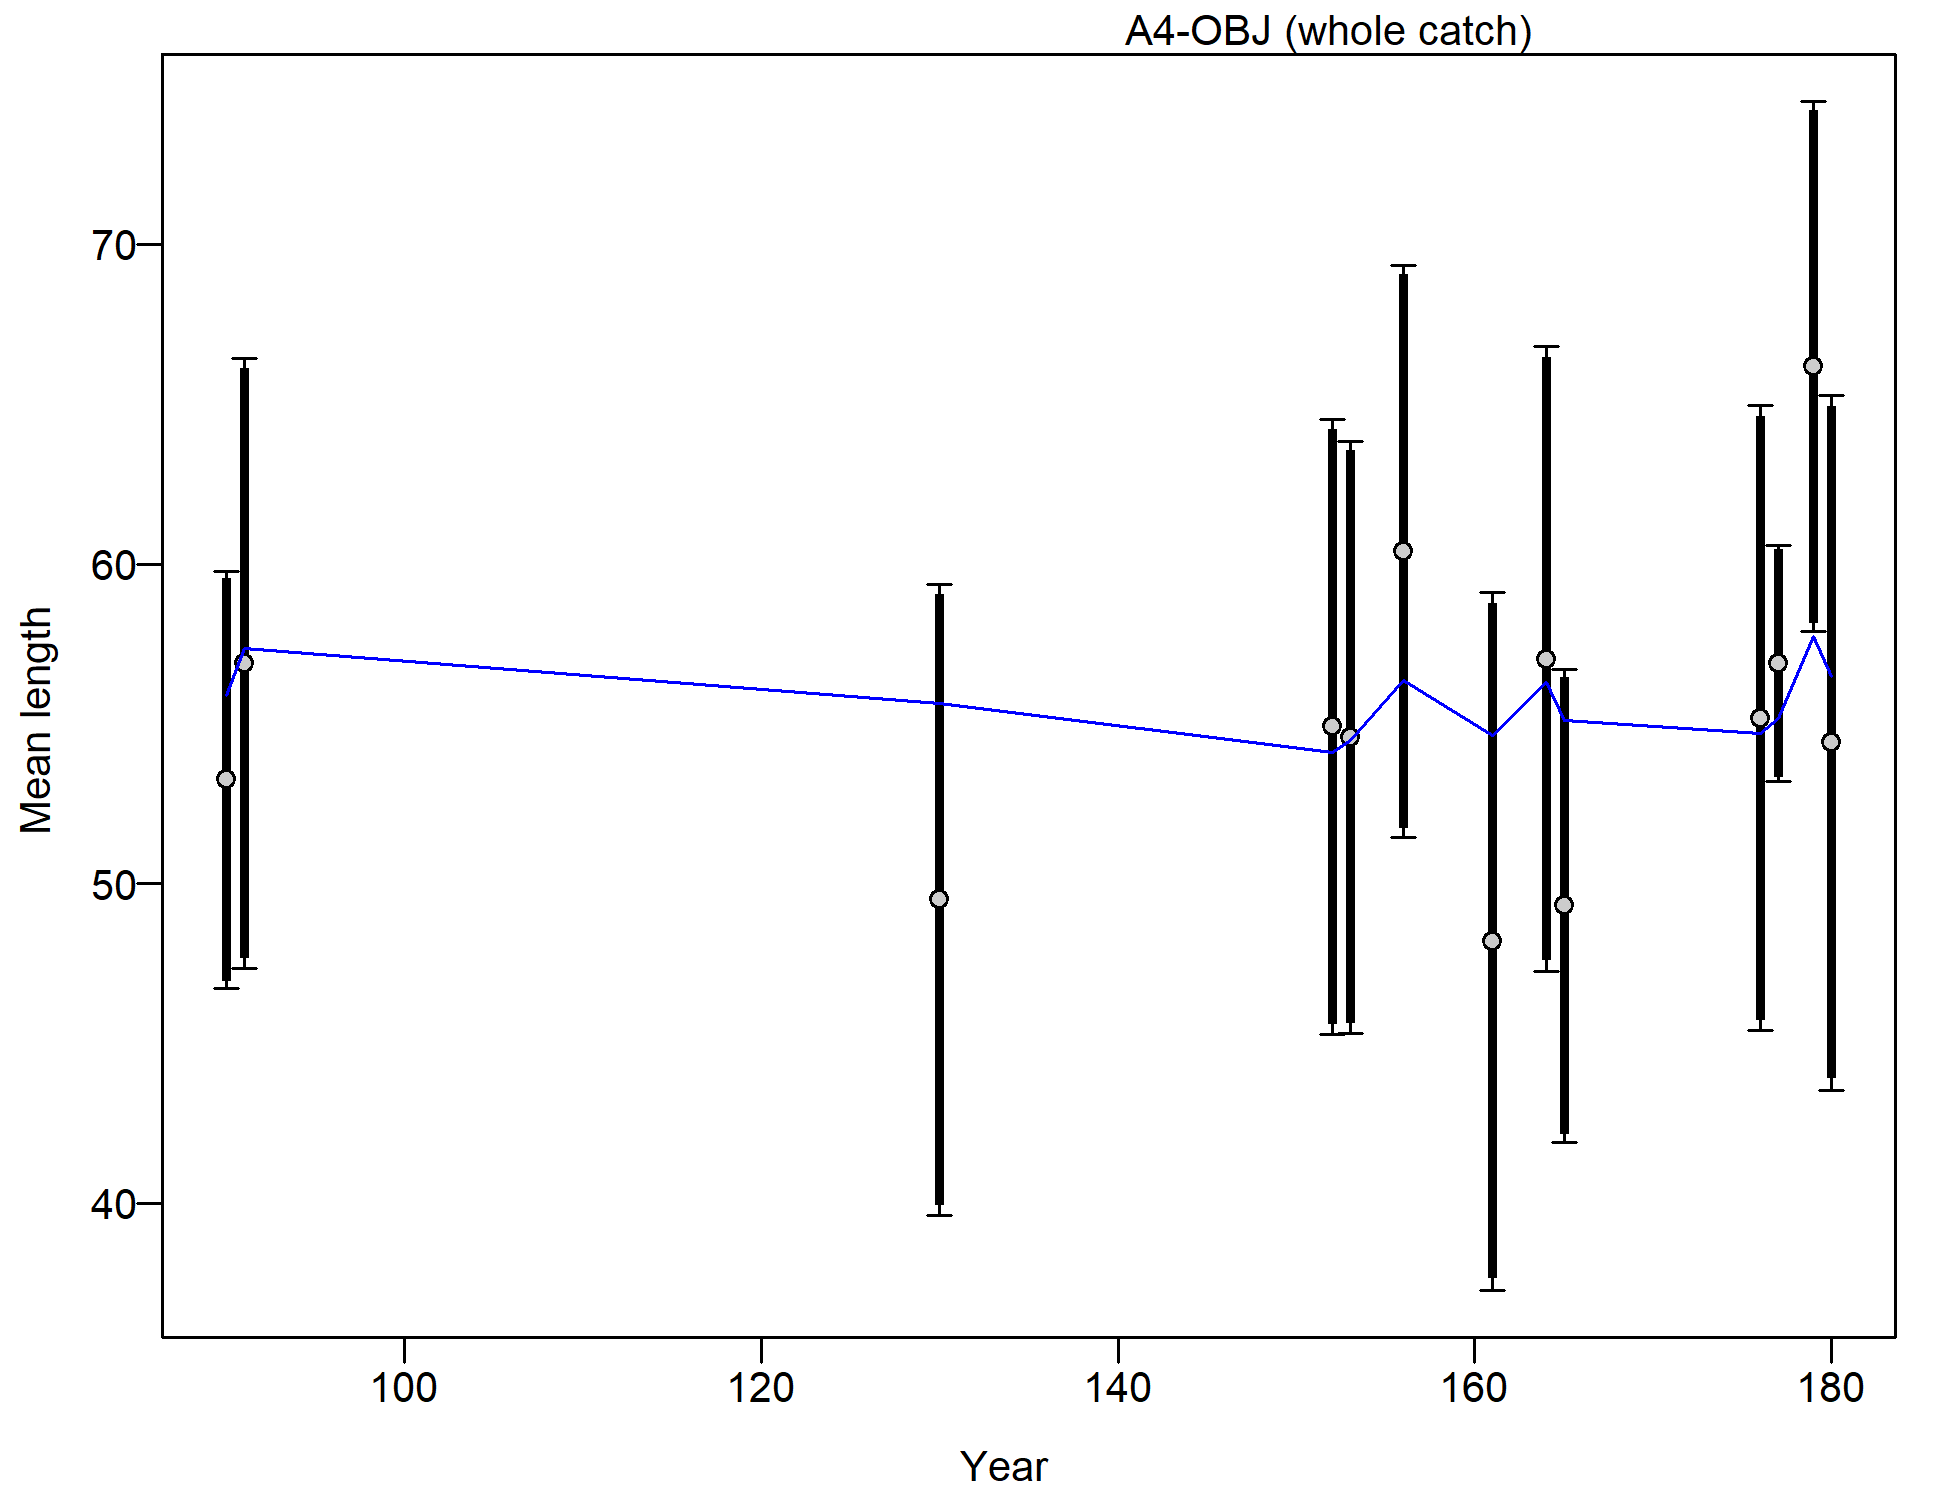
Mean length for A4-LL-n with 95% confidence intervals based on current samples sizes.
Francis data weighting method TA1.8: thinner intervals (with capped ends) show result of further adjusting sample sizes based on suggested multiplier (with 95% interval) for len data from A4-LL-n:
0.8751 (0.6906-1.1907)
For more info, see
Francis, R.I.C.C. (2011). Data weighting in statistical fisheries stock assessment models. Can. J. Fish. Aquat. Sci. 68: 1124-1138. https://doi.org/10.1139/f2011-025
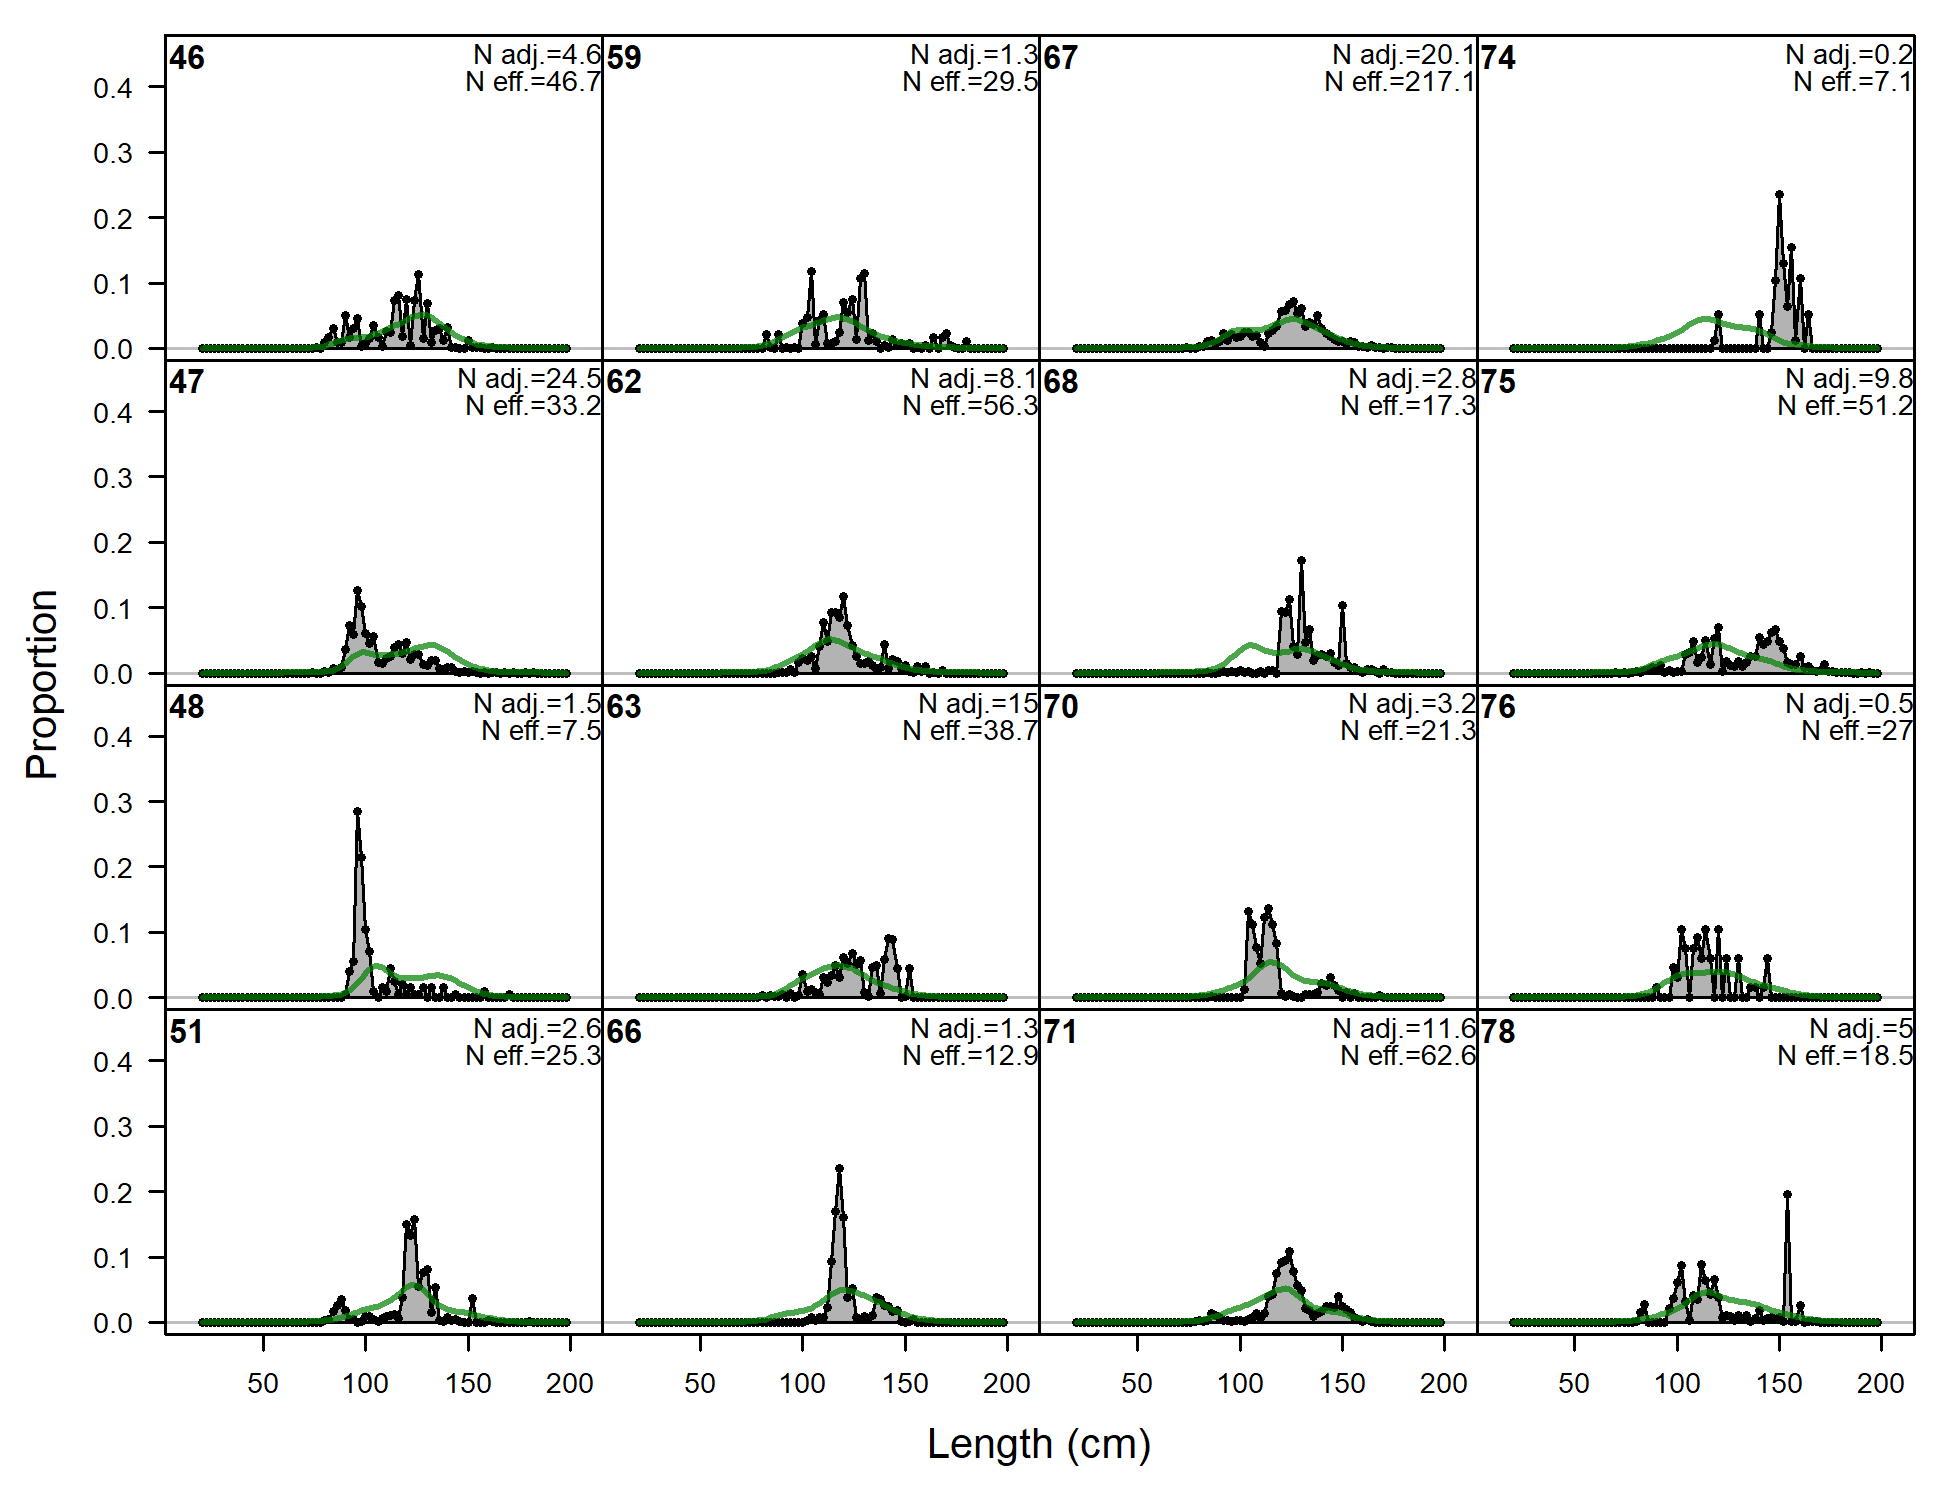
Length comps, whole catch, A5-LL-n (plot 1 of 8).
'N adj.' is the input sample size after data-weighting adjustment. N eff. is the calculated effective sample size used in the McAllister-Iannelli tuning method.
file: comp_lenfit_flt5mkt0_page1.png
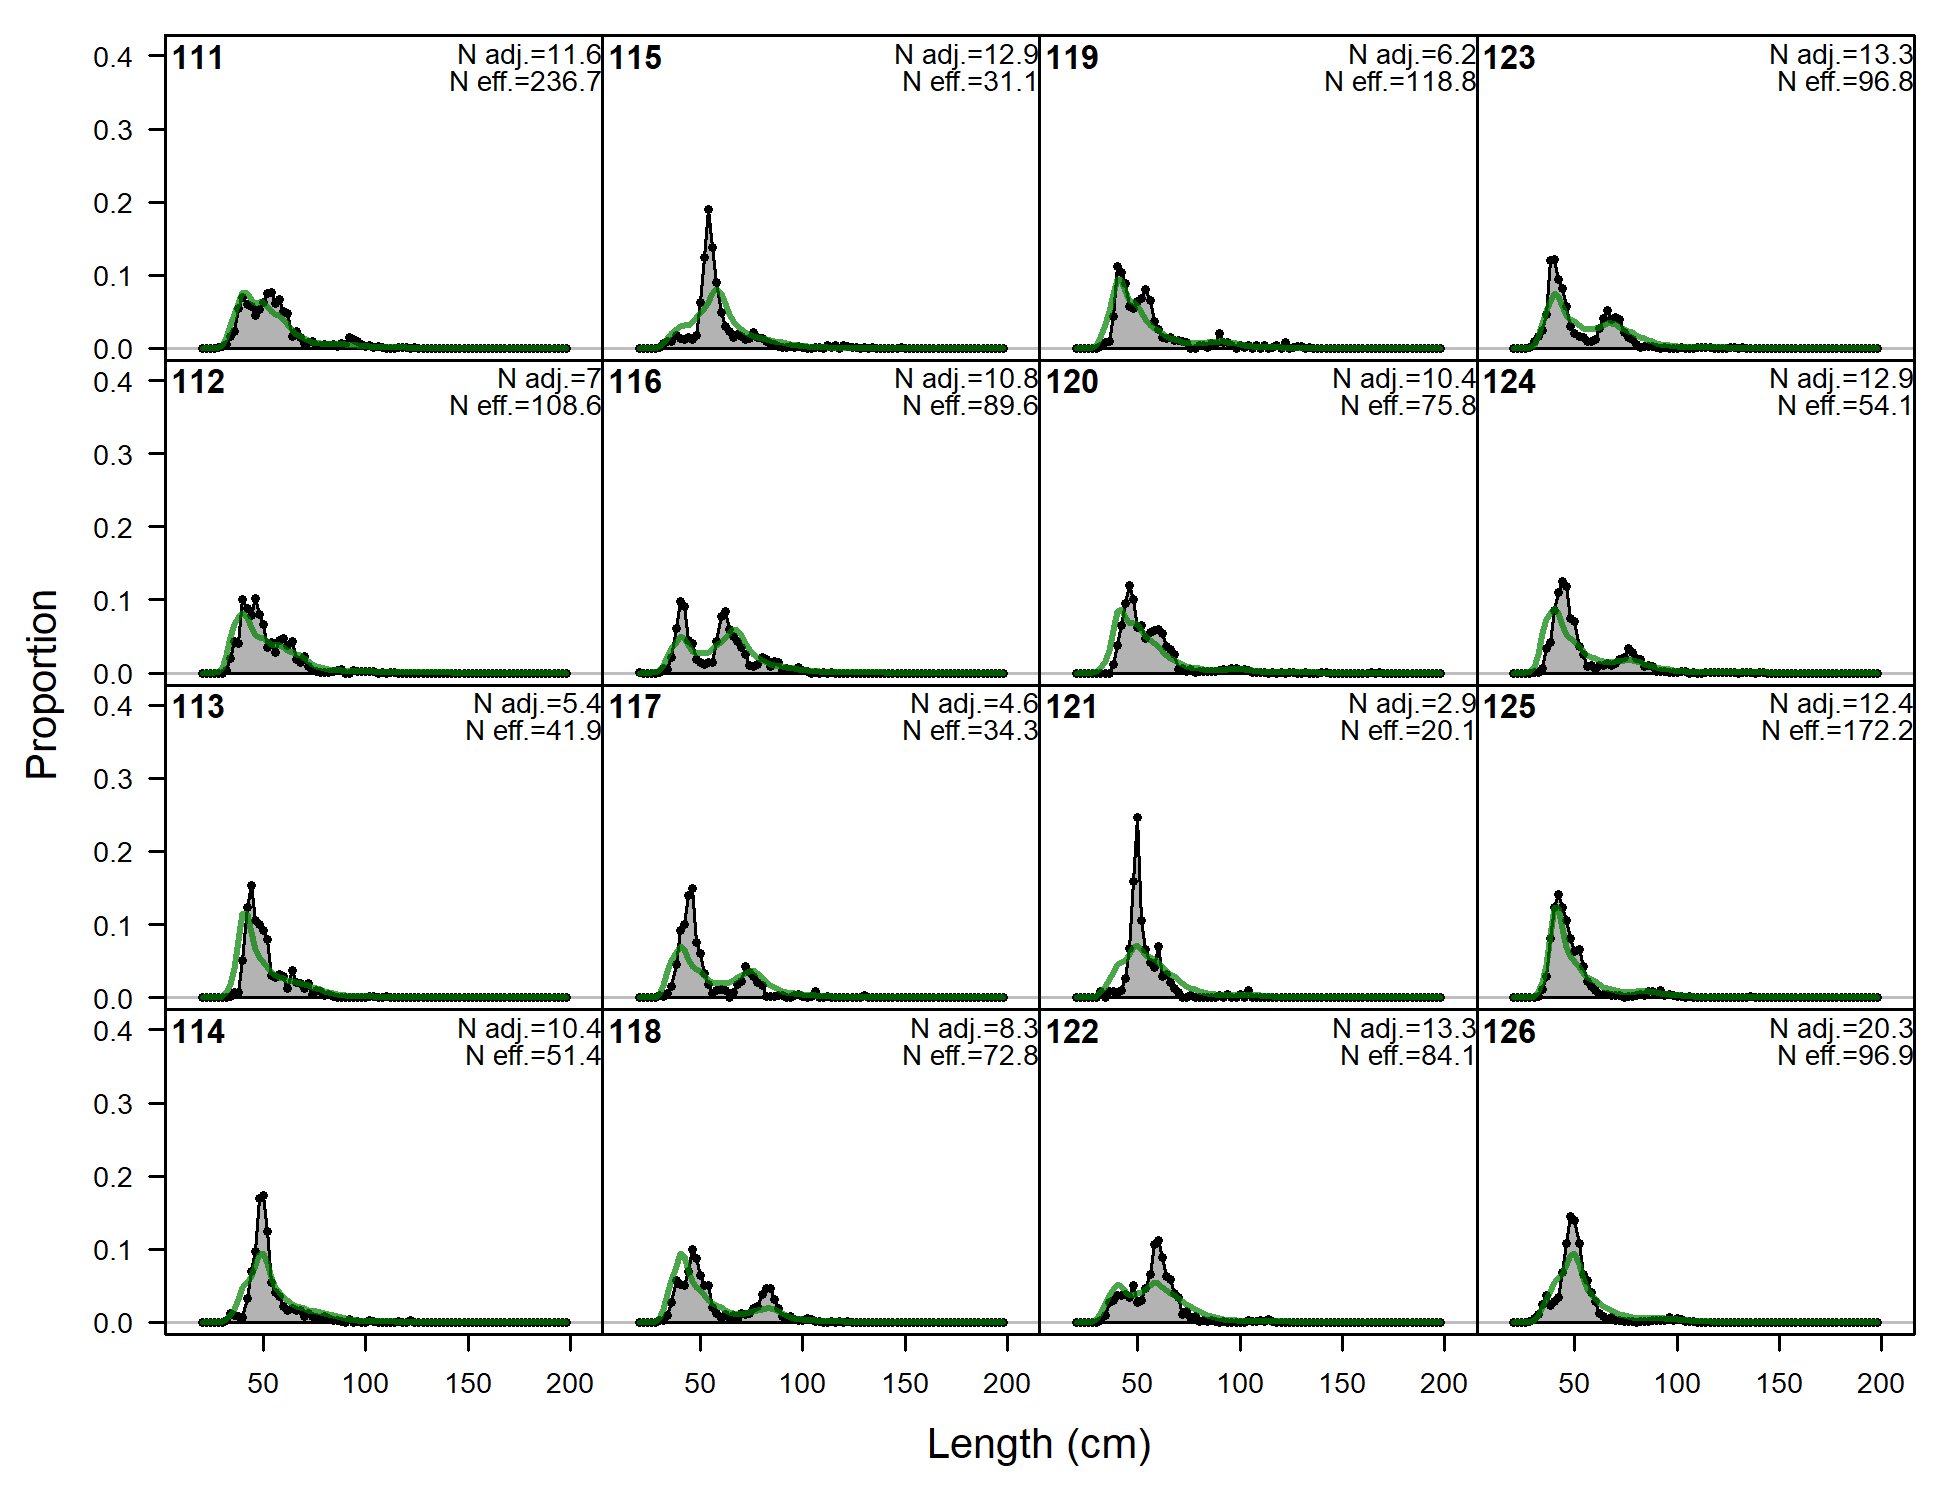
Length comps, whole catch, A5-LL-n (plot 2 of 8)
file: comp_lenfit_flt5mkt0_page2.png
Length comps, whole catch, A5-LL-n (plot 3 of 8)
file: comp_lenfit_flt5mkt0_page3.png
Length comps, whole catch, A5-LL-n (plot 4 of 8)
file: comp_lenfit_flt5mkt0_page4.png
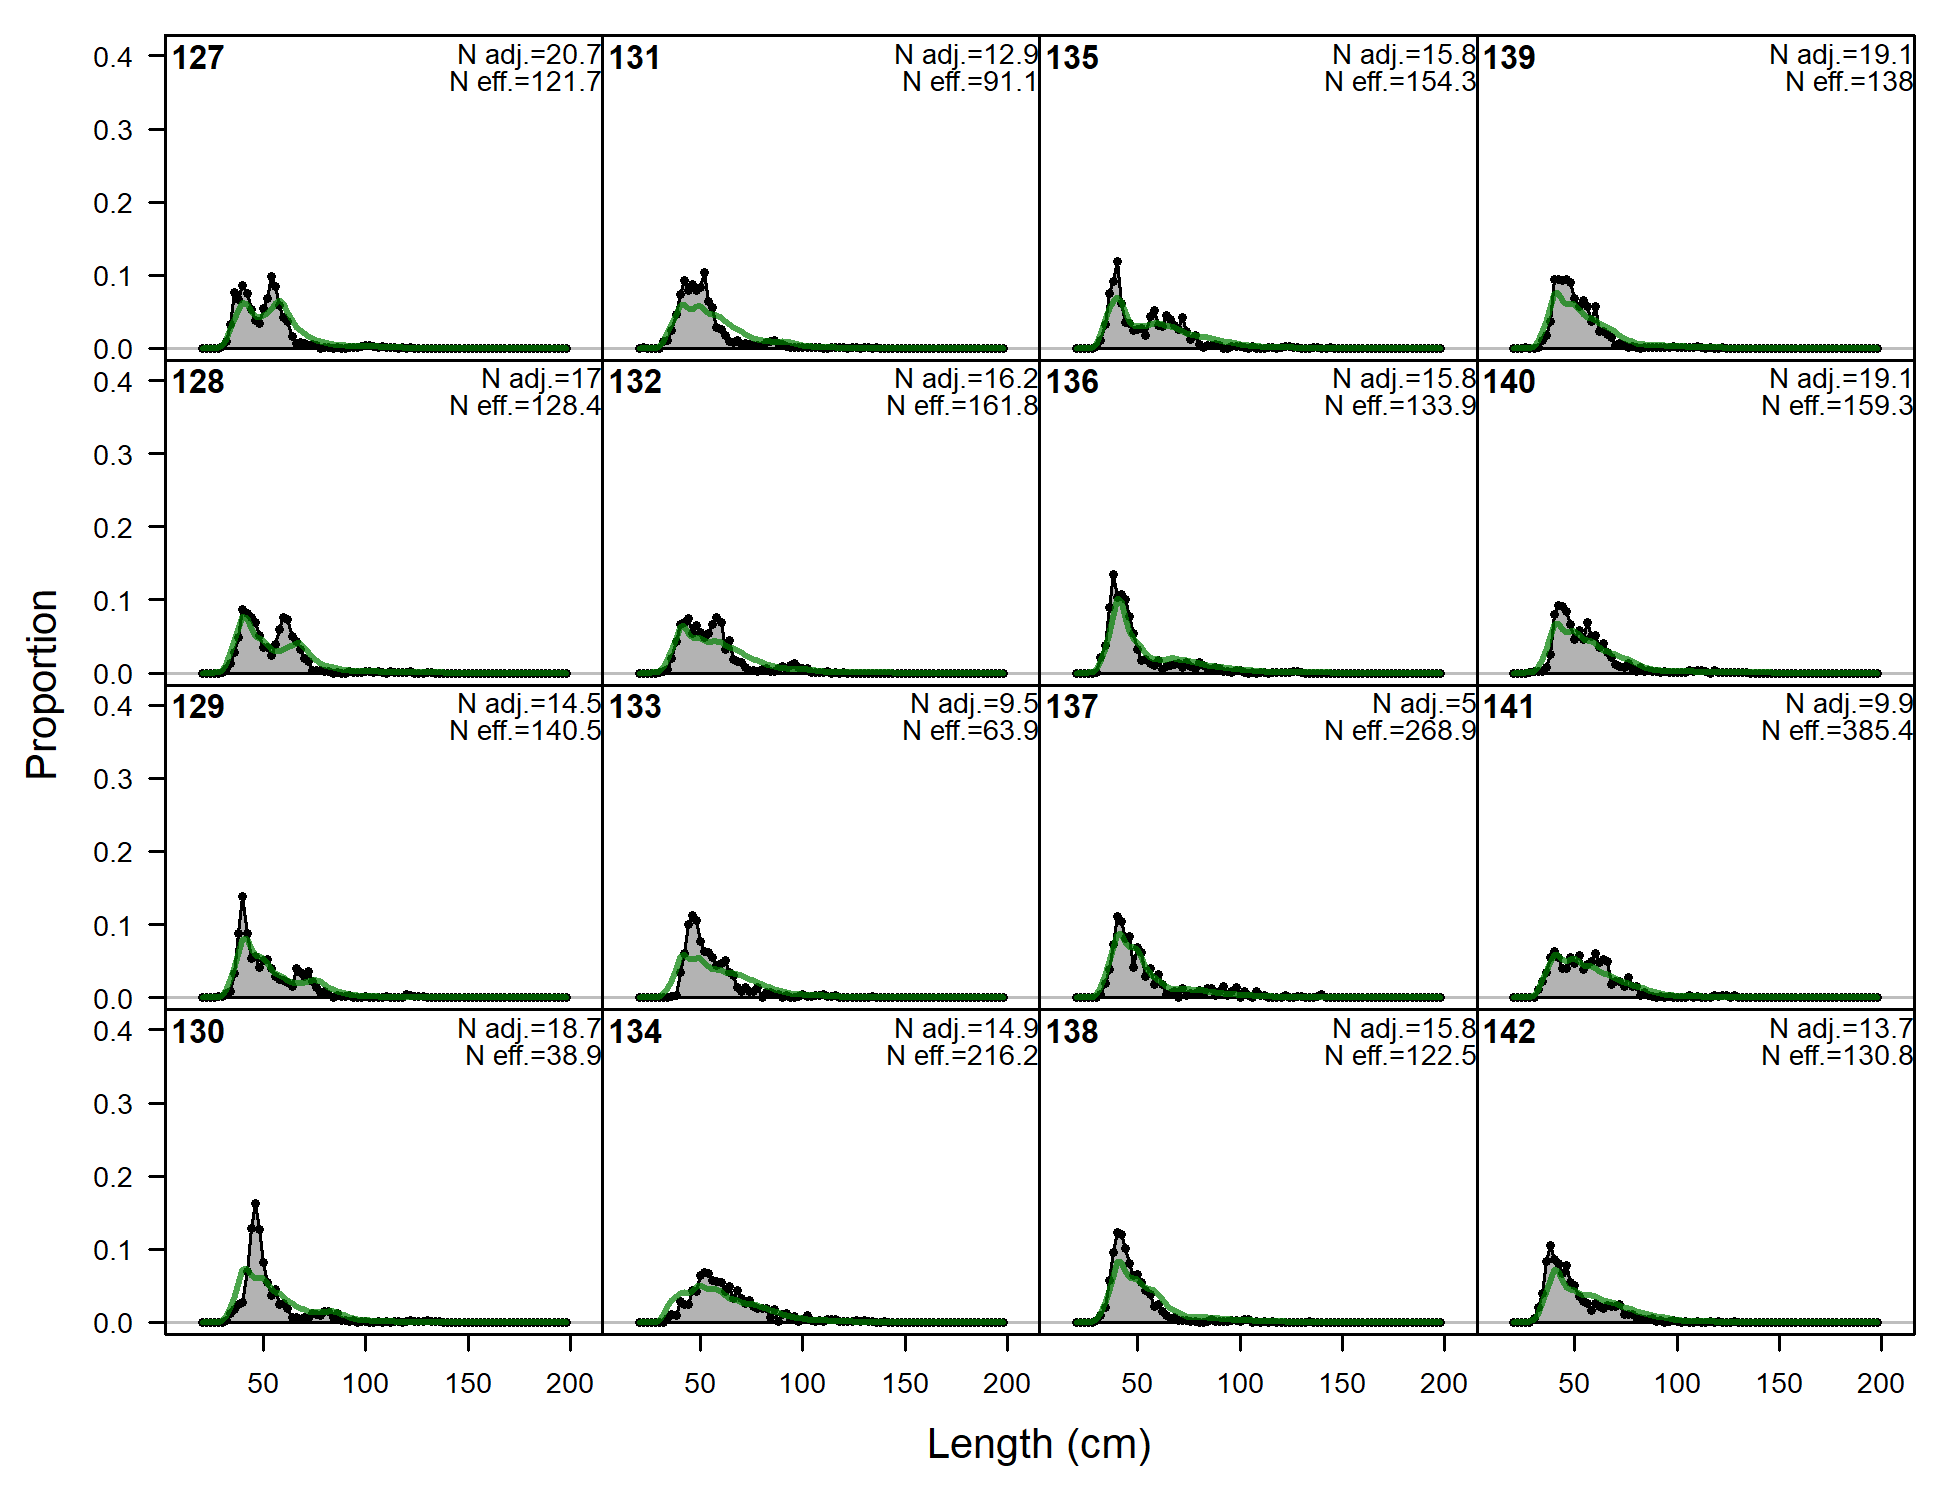
Length comps, whole catch, A5-LL-n (plot 5 of 8)
file: comp_lenfit_flt5mkt0_page5.png
Length comps, whole catch, A5-LL-n (plot 6 of 8)
file: comp_lenfit_flt5mkt0_page6.png
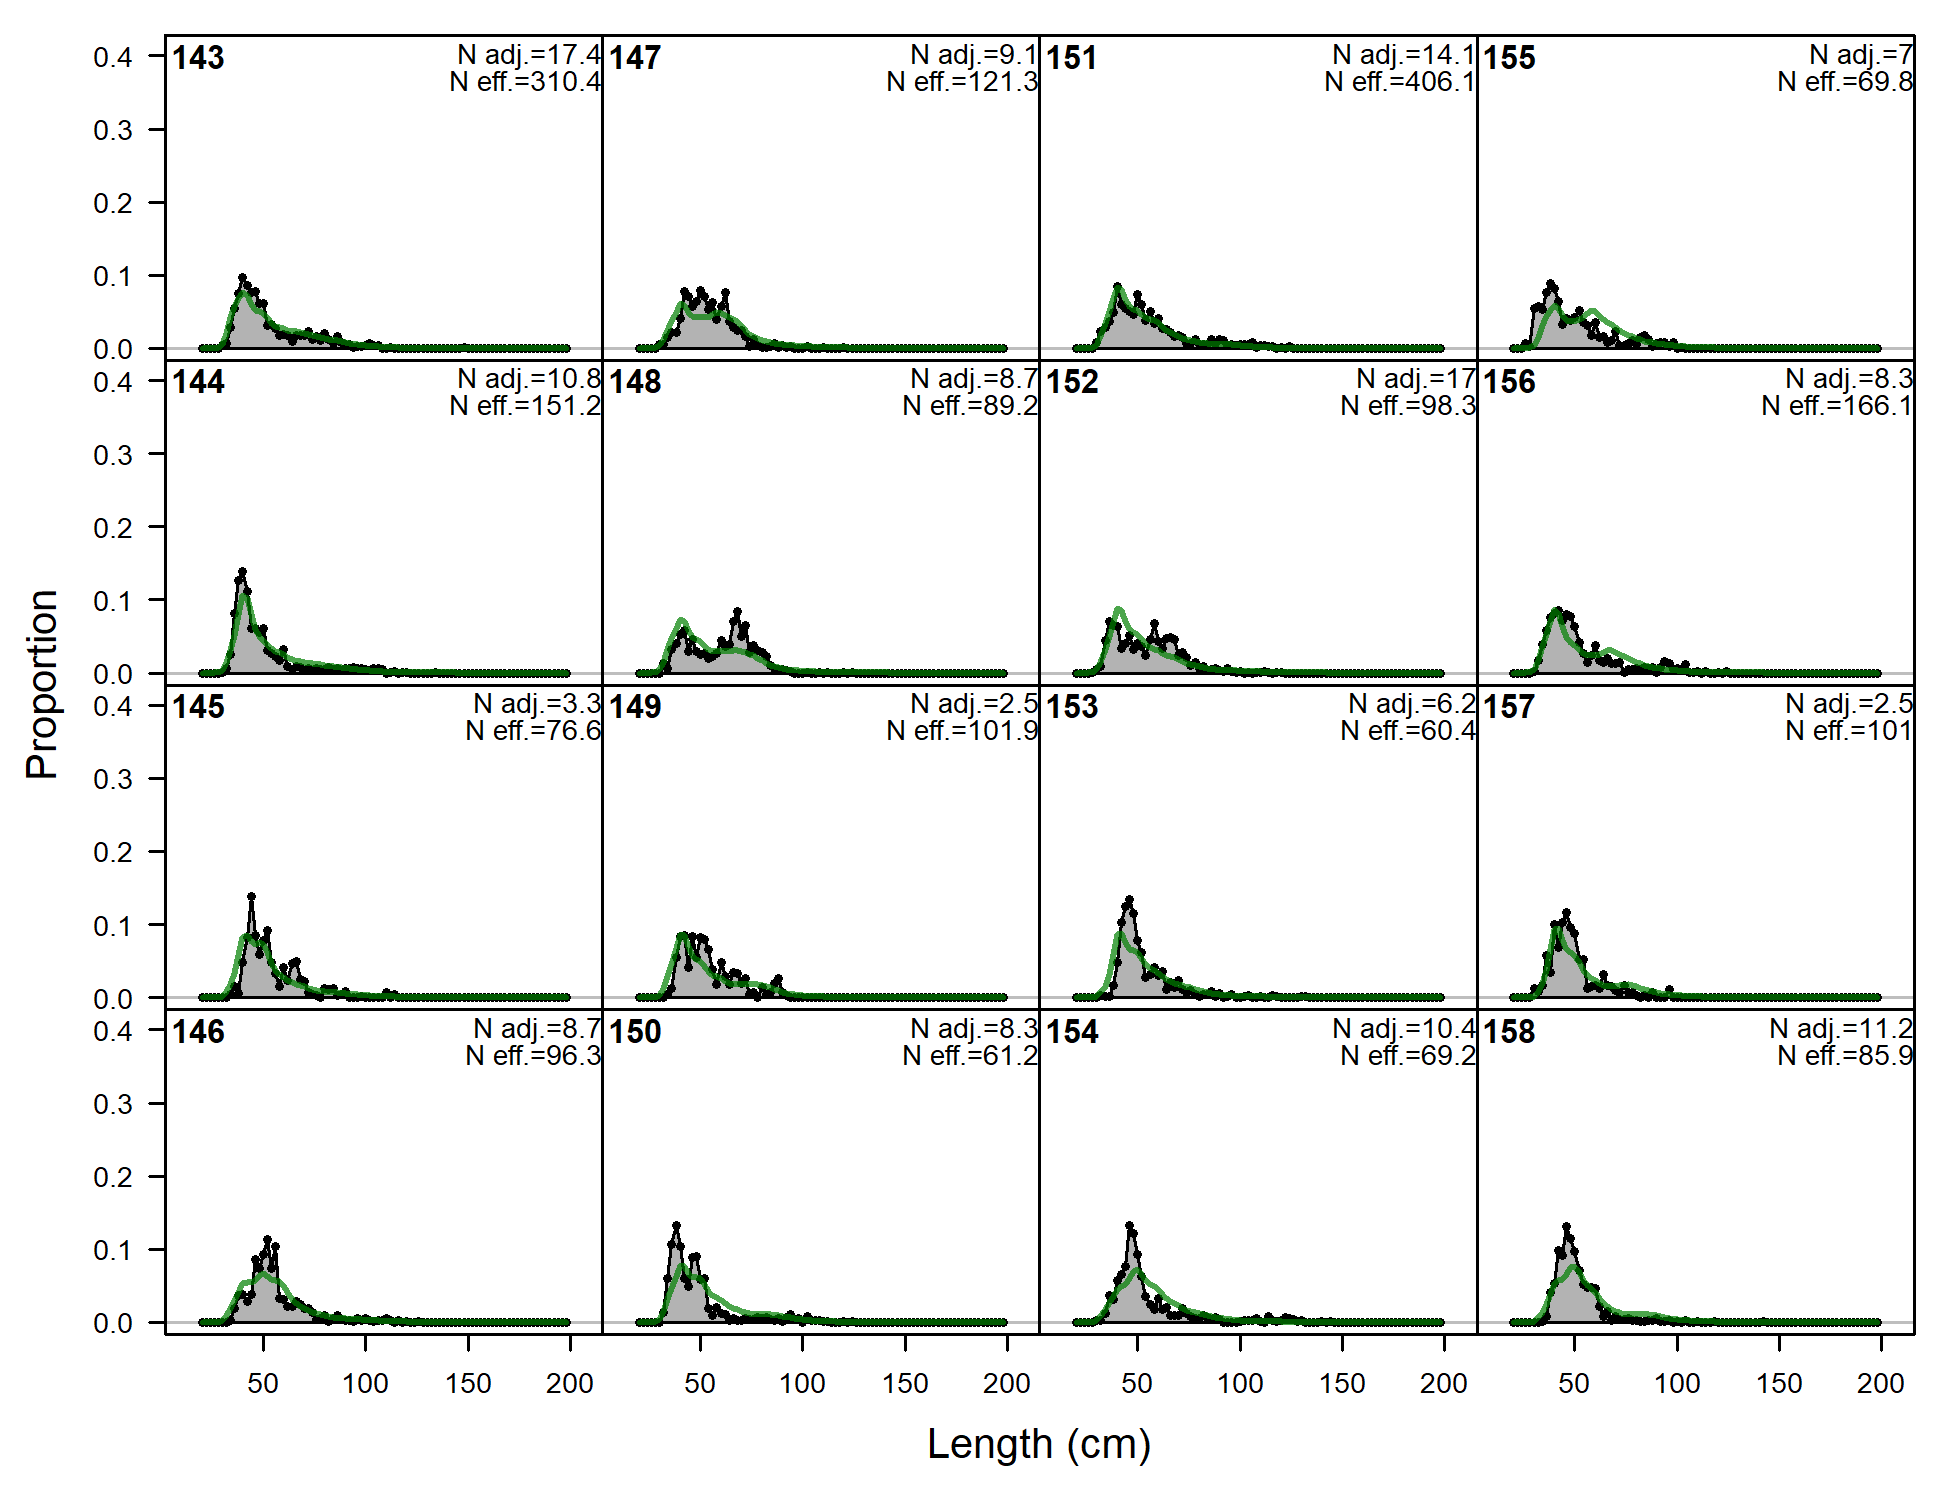
Length comps, whole catch, A5-LL-n (plot 7 of 8)
file: comp_lenfit_flt5mkt0_page7.png
Length comps, whole catch, A5-LL-n (plot 8 of 8)
file: comp_lenfit_flt5mkt0_page8.png
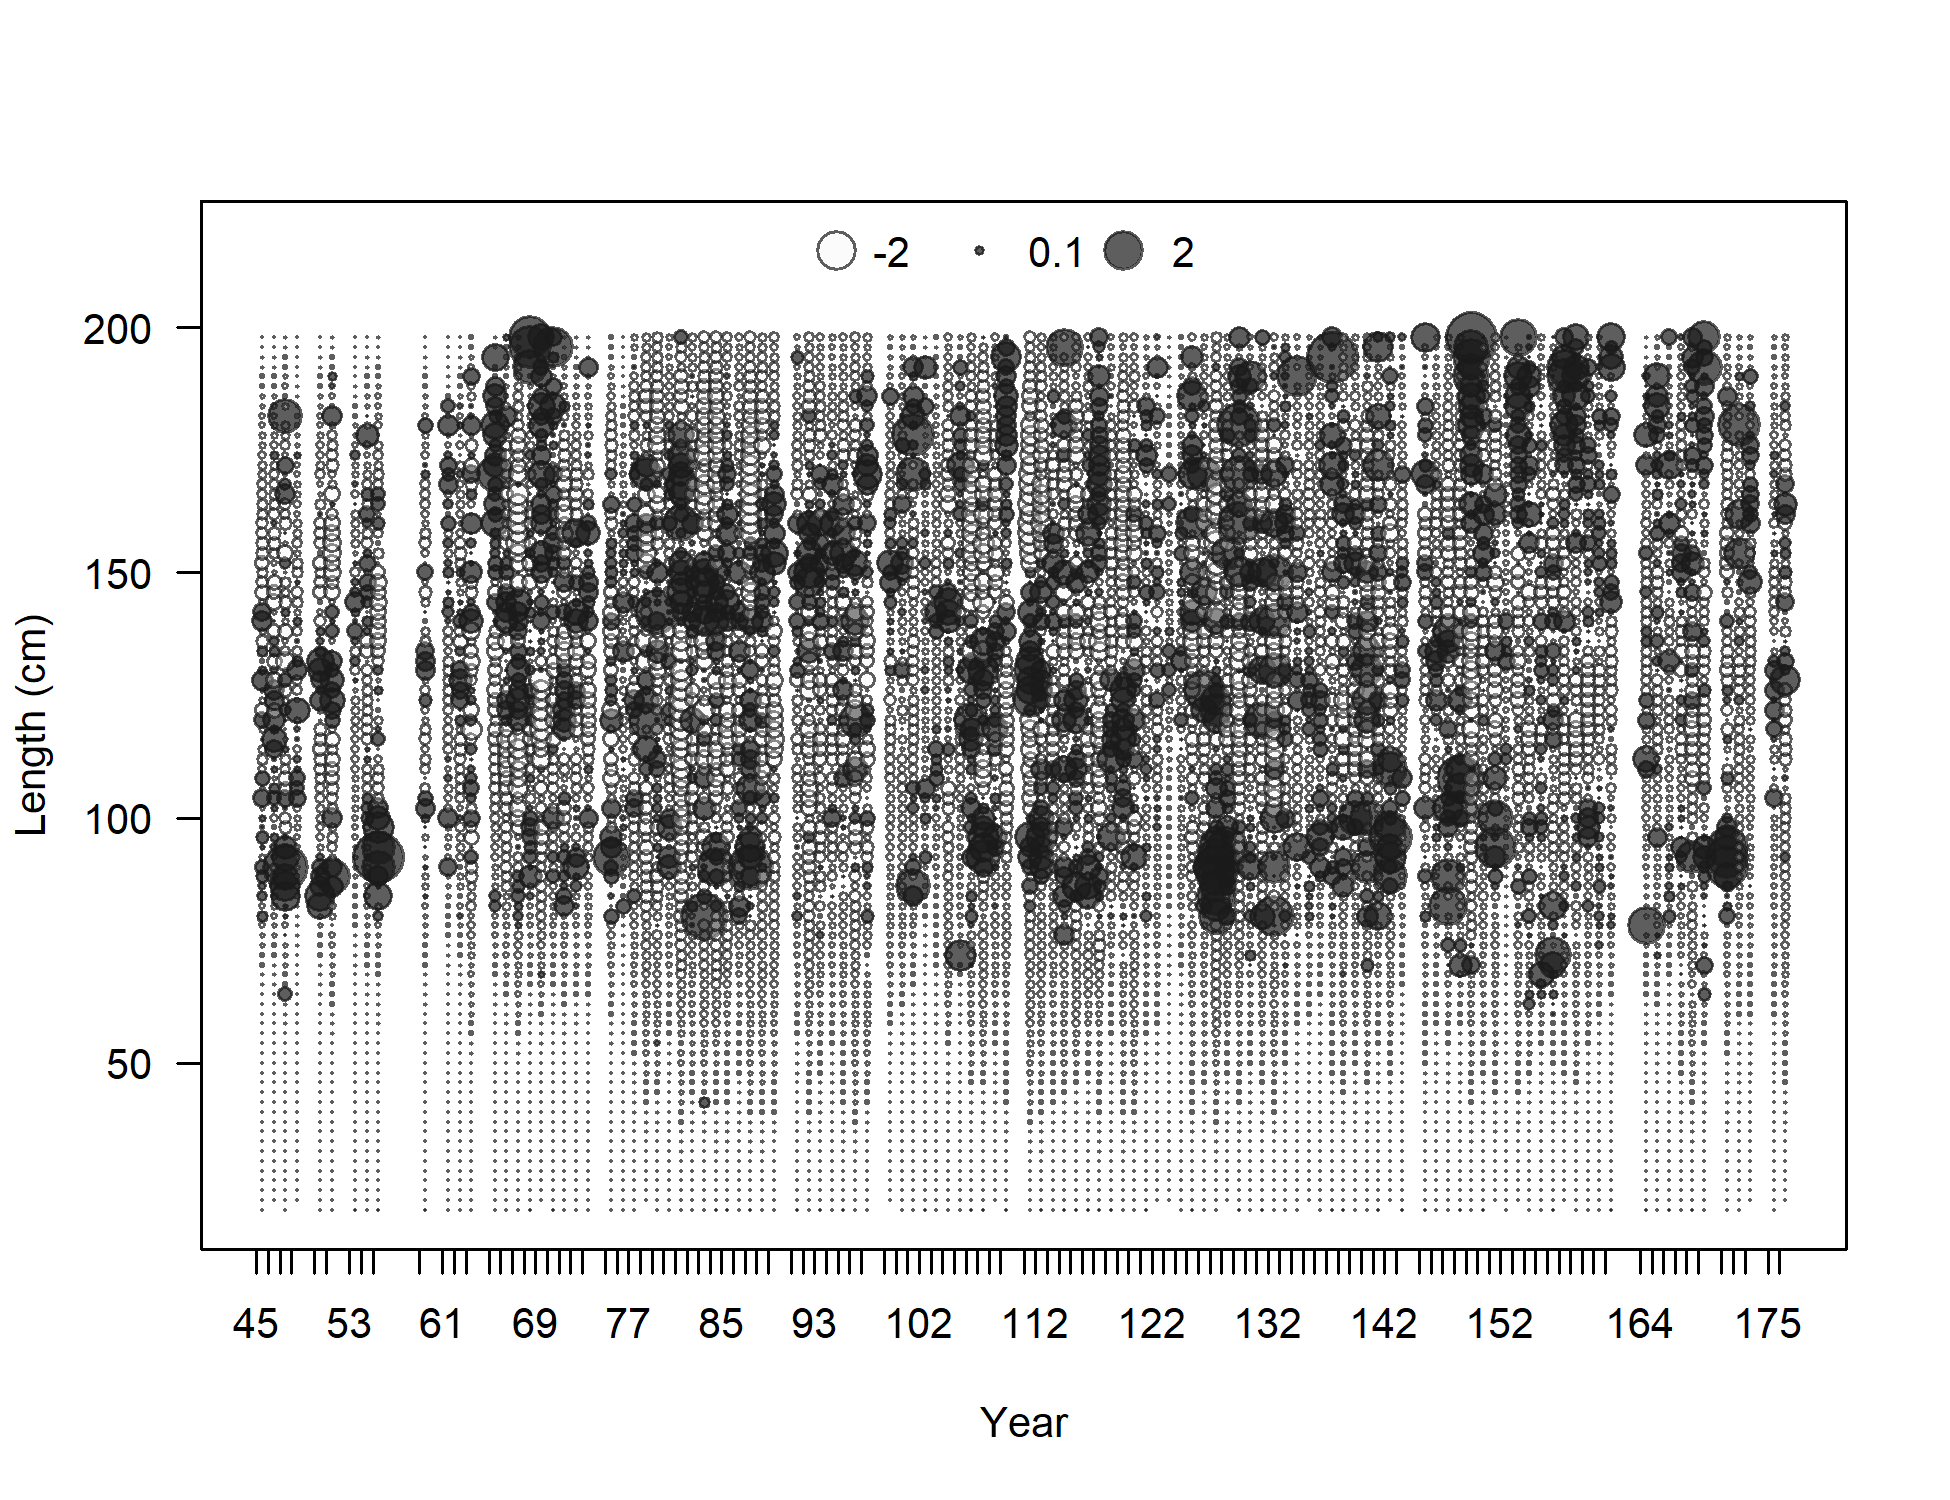
Pearson residuals, whole catch, A5-LL-n (max=3.46) (plot 8 of 8)
Closed bubbles are positive residuals (observed > expected) and open bubbles are negative residuals (observed < expected).
file: comp_lenfit_residsflt5mkt0_page8.png
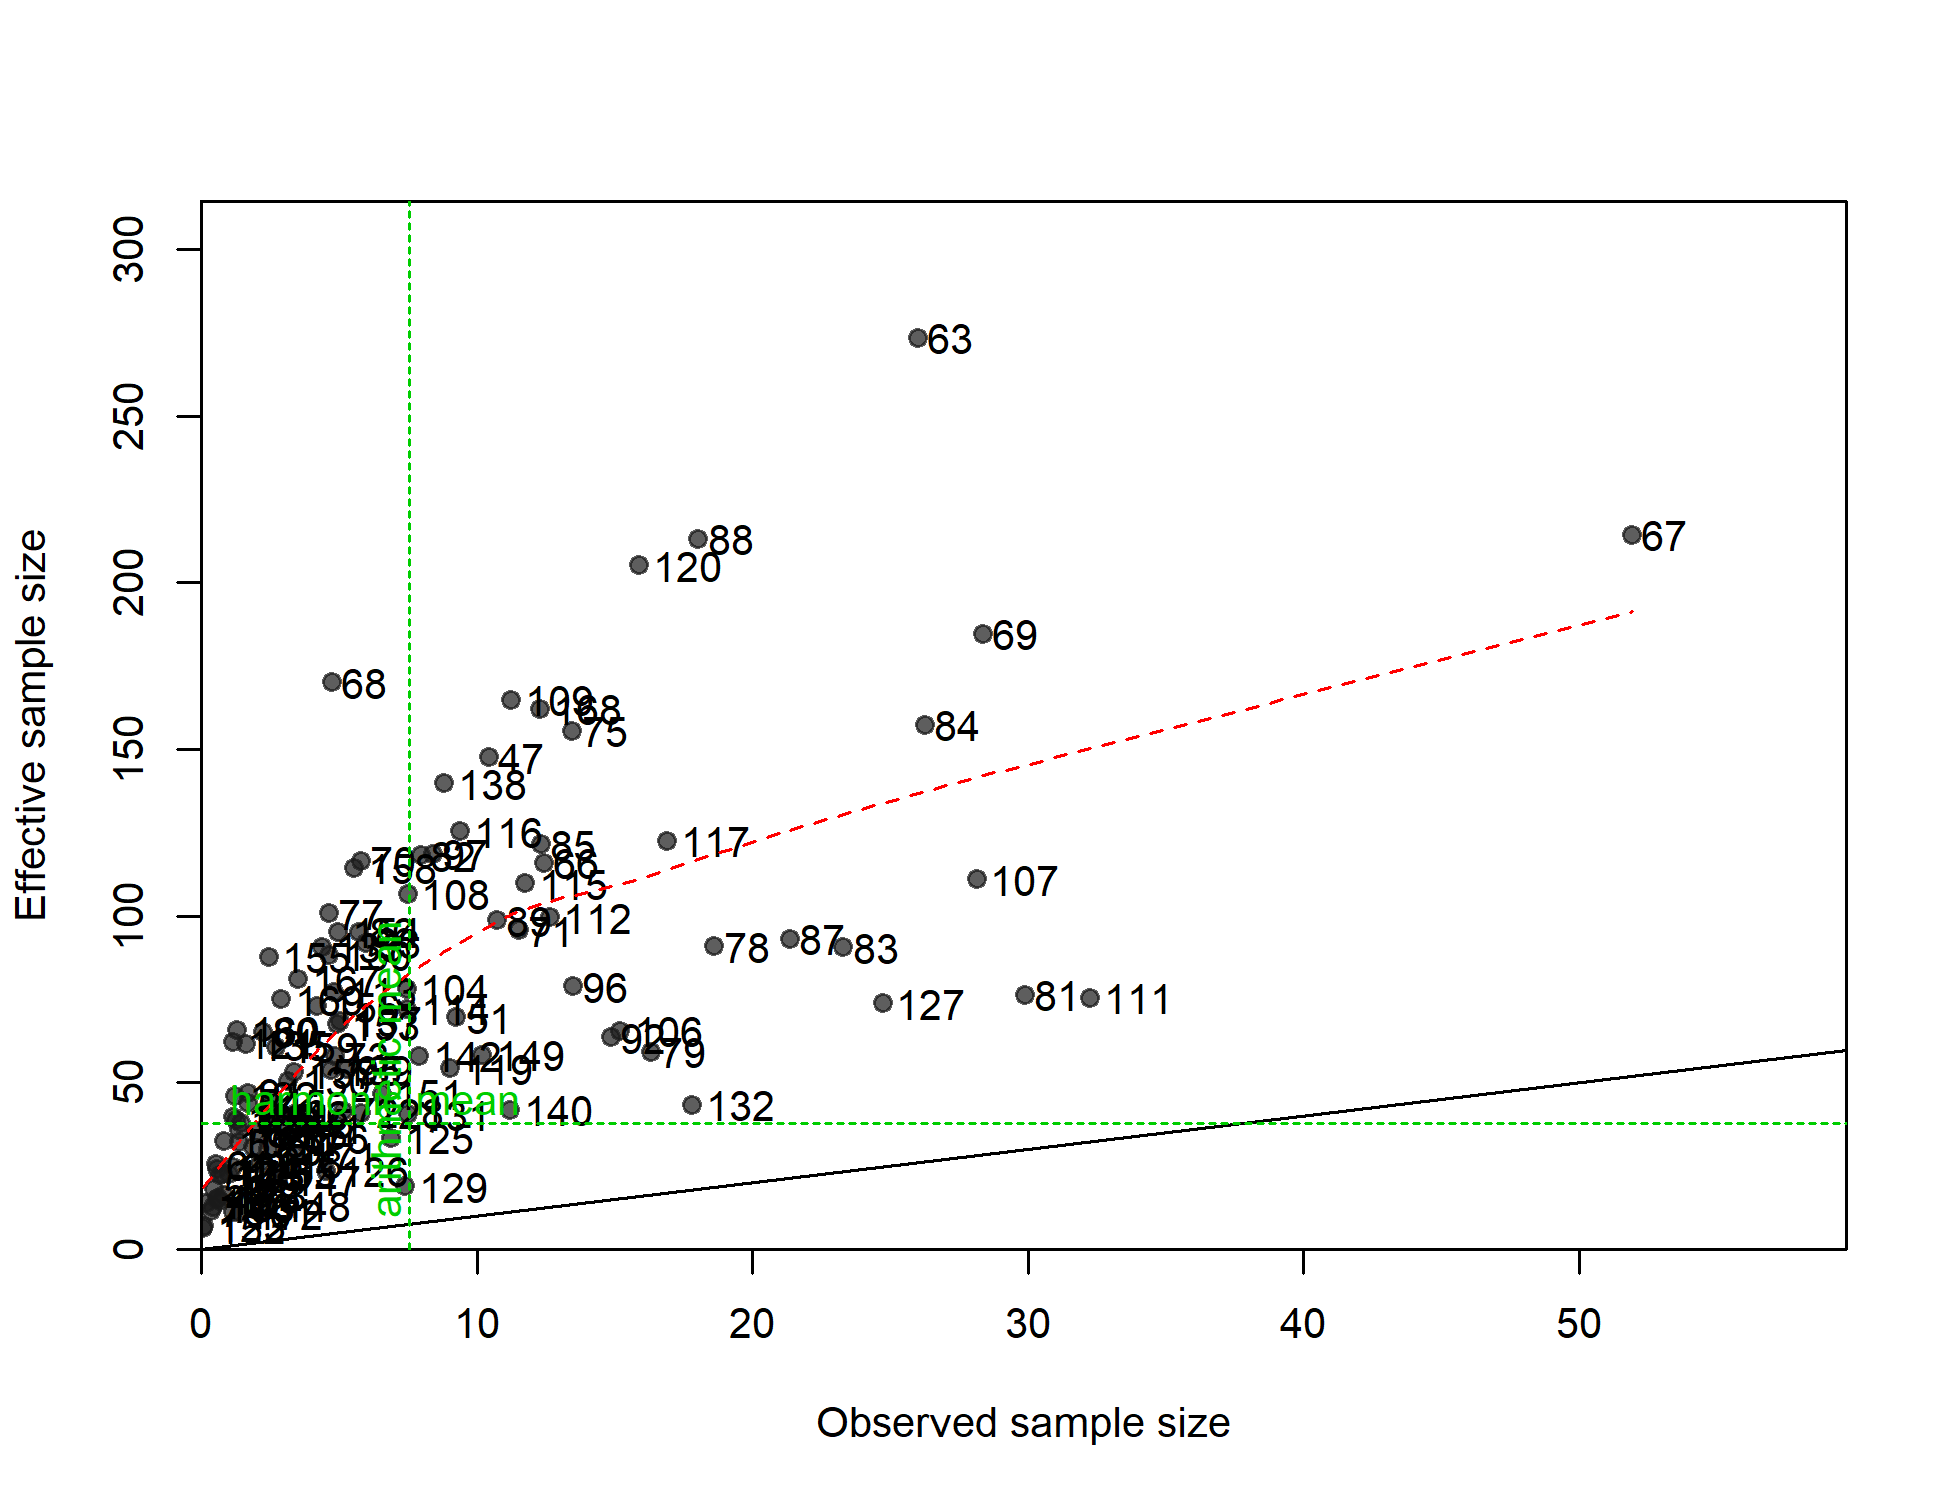
N-EffN comparison, Length comps, whole catch, A5-LL-n
file: comp_lenfit_sampsize_flt5mkt0.png
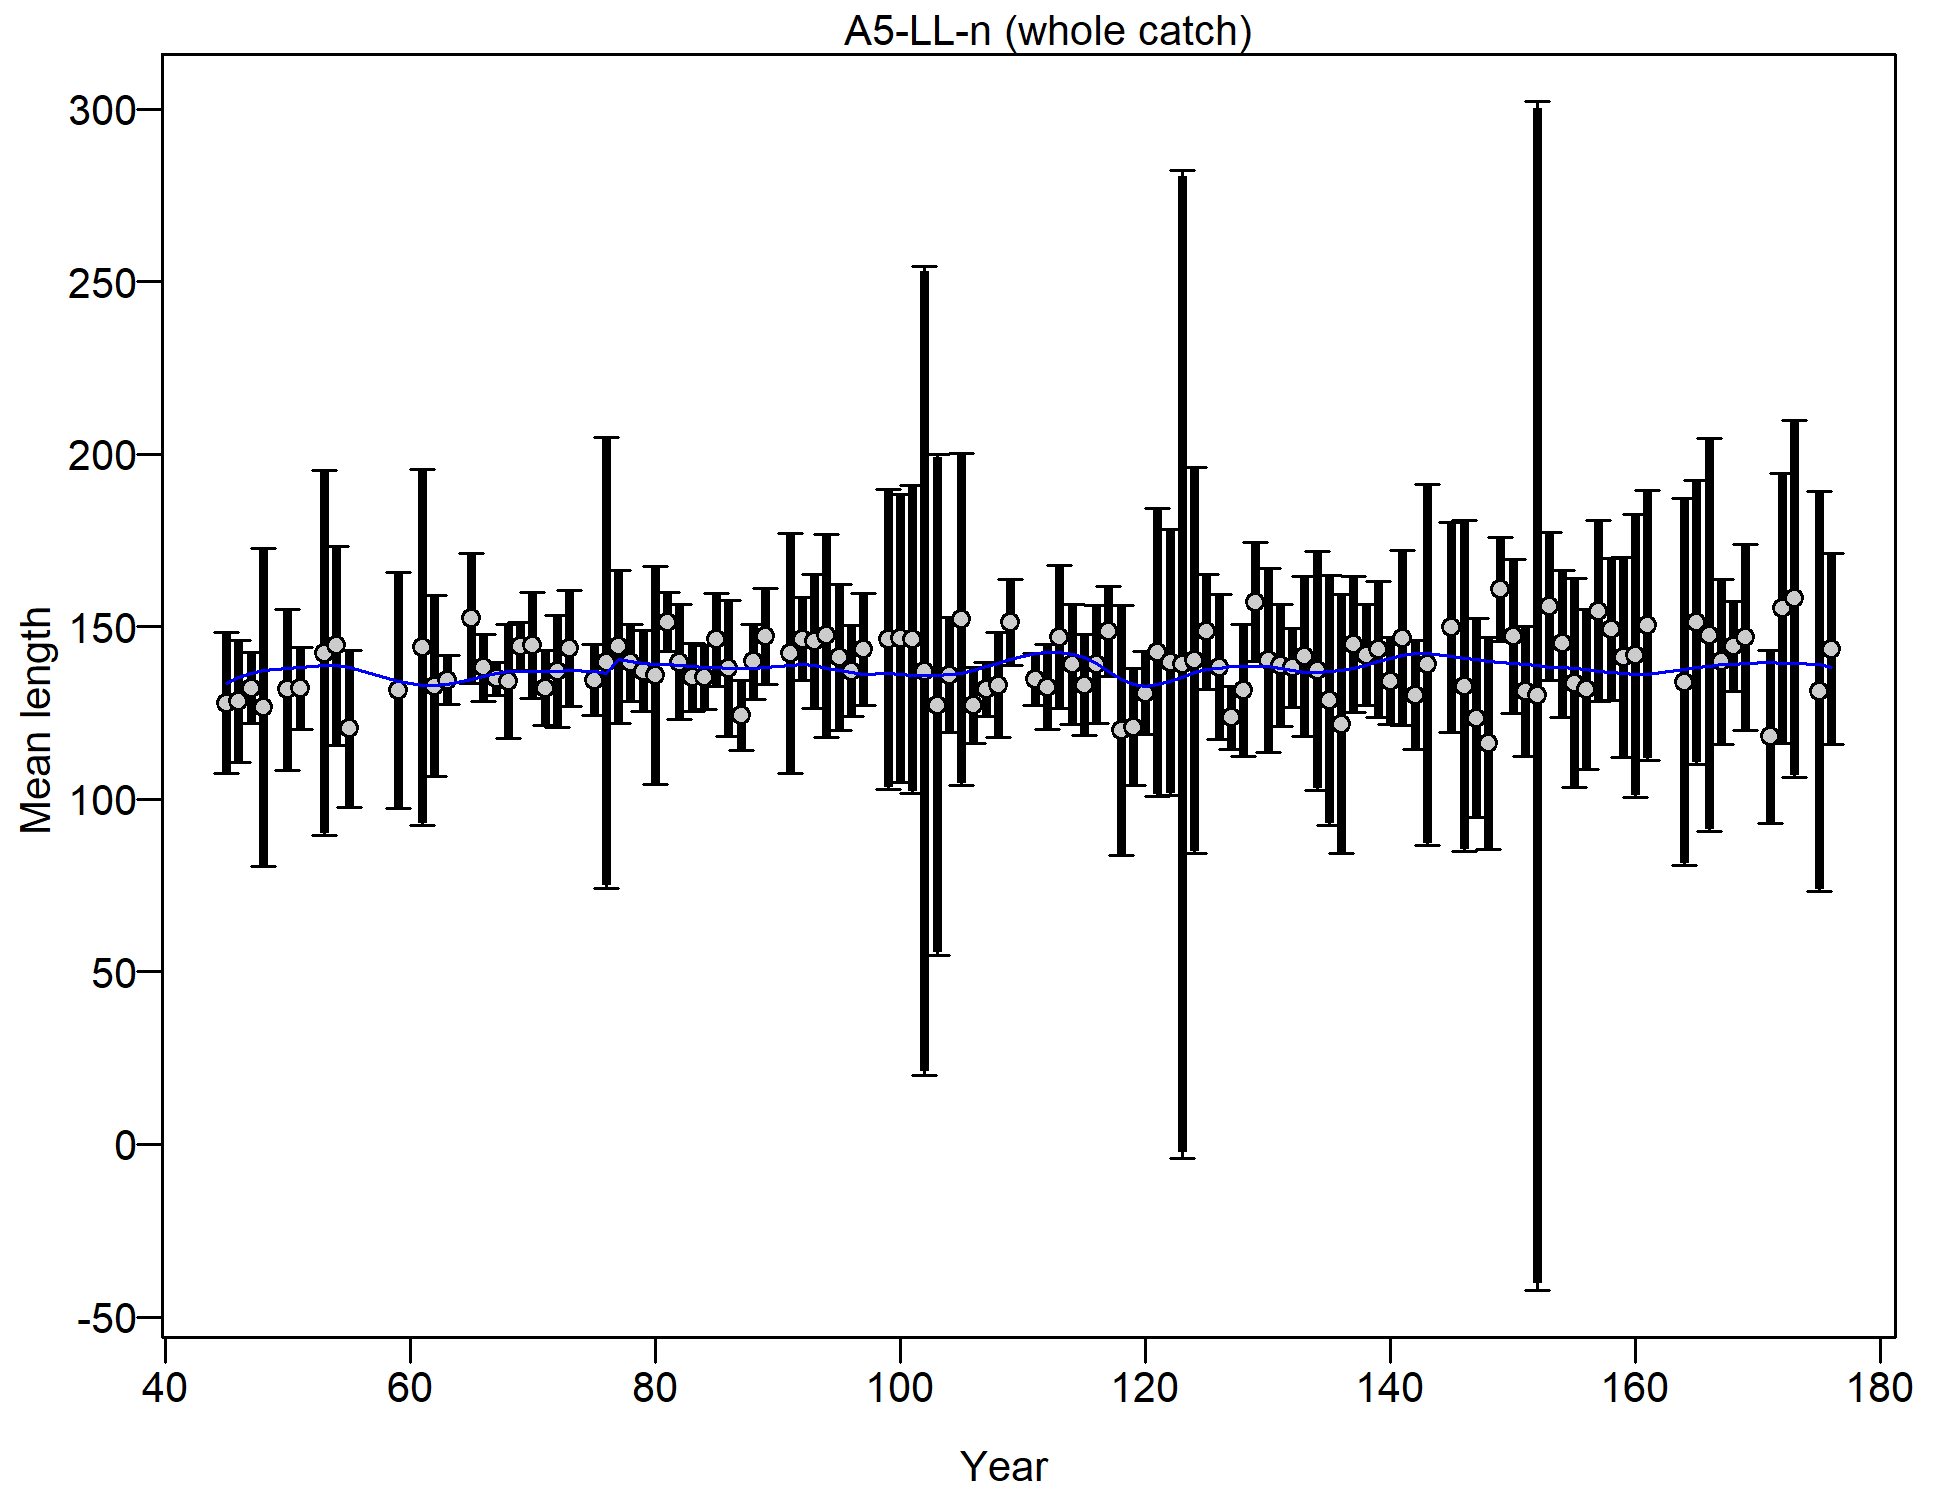
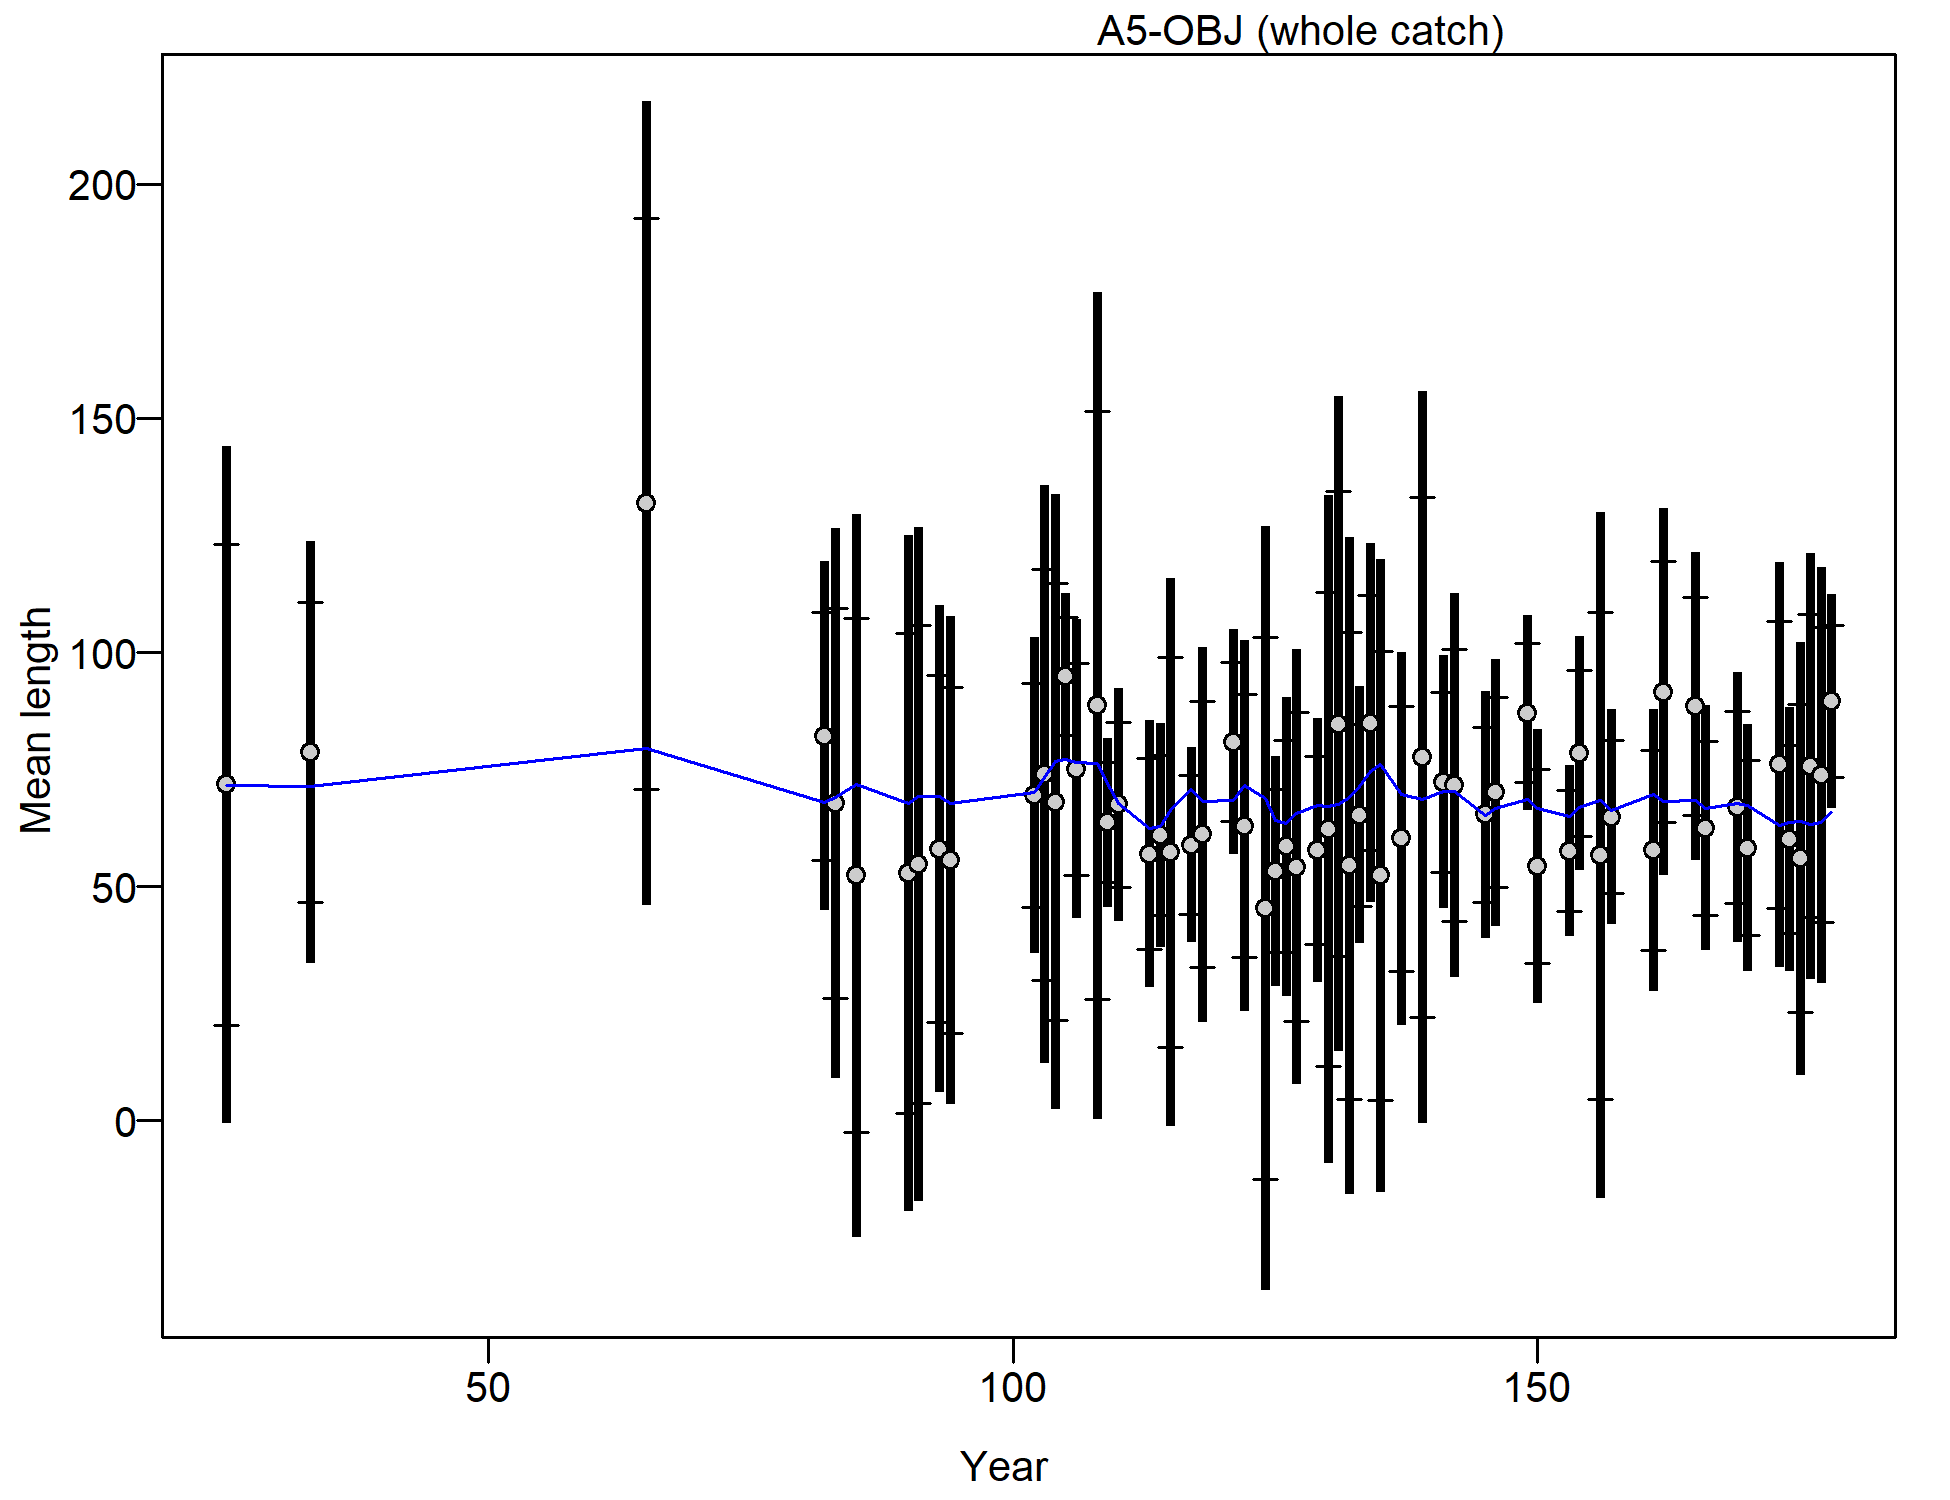
Mean length for A5-LL-n with 95% confidence intervals based on current samples sizes.
Francis data weighting method TA1.8: thinner intervals (with capped ends) show result of further adjusting sample sizes based on suggested multiplier (with 95% interval) for len data from A5-LL-n:
0.9775 (0.7261-1.3834)
For more info, see
Francis, R.I.C.C. (2011). Data weighting in statistical fisheries stock assessment models. Can. J. Fish. Aquat. Sci. 68: 1124-1138. https://doi.org/10.1139/f2011-025
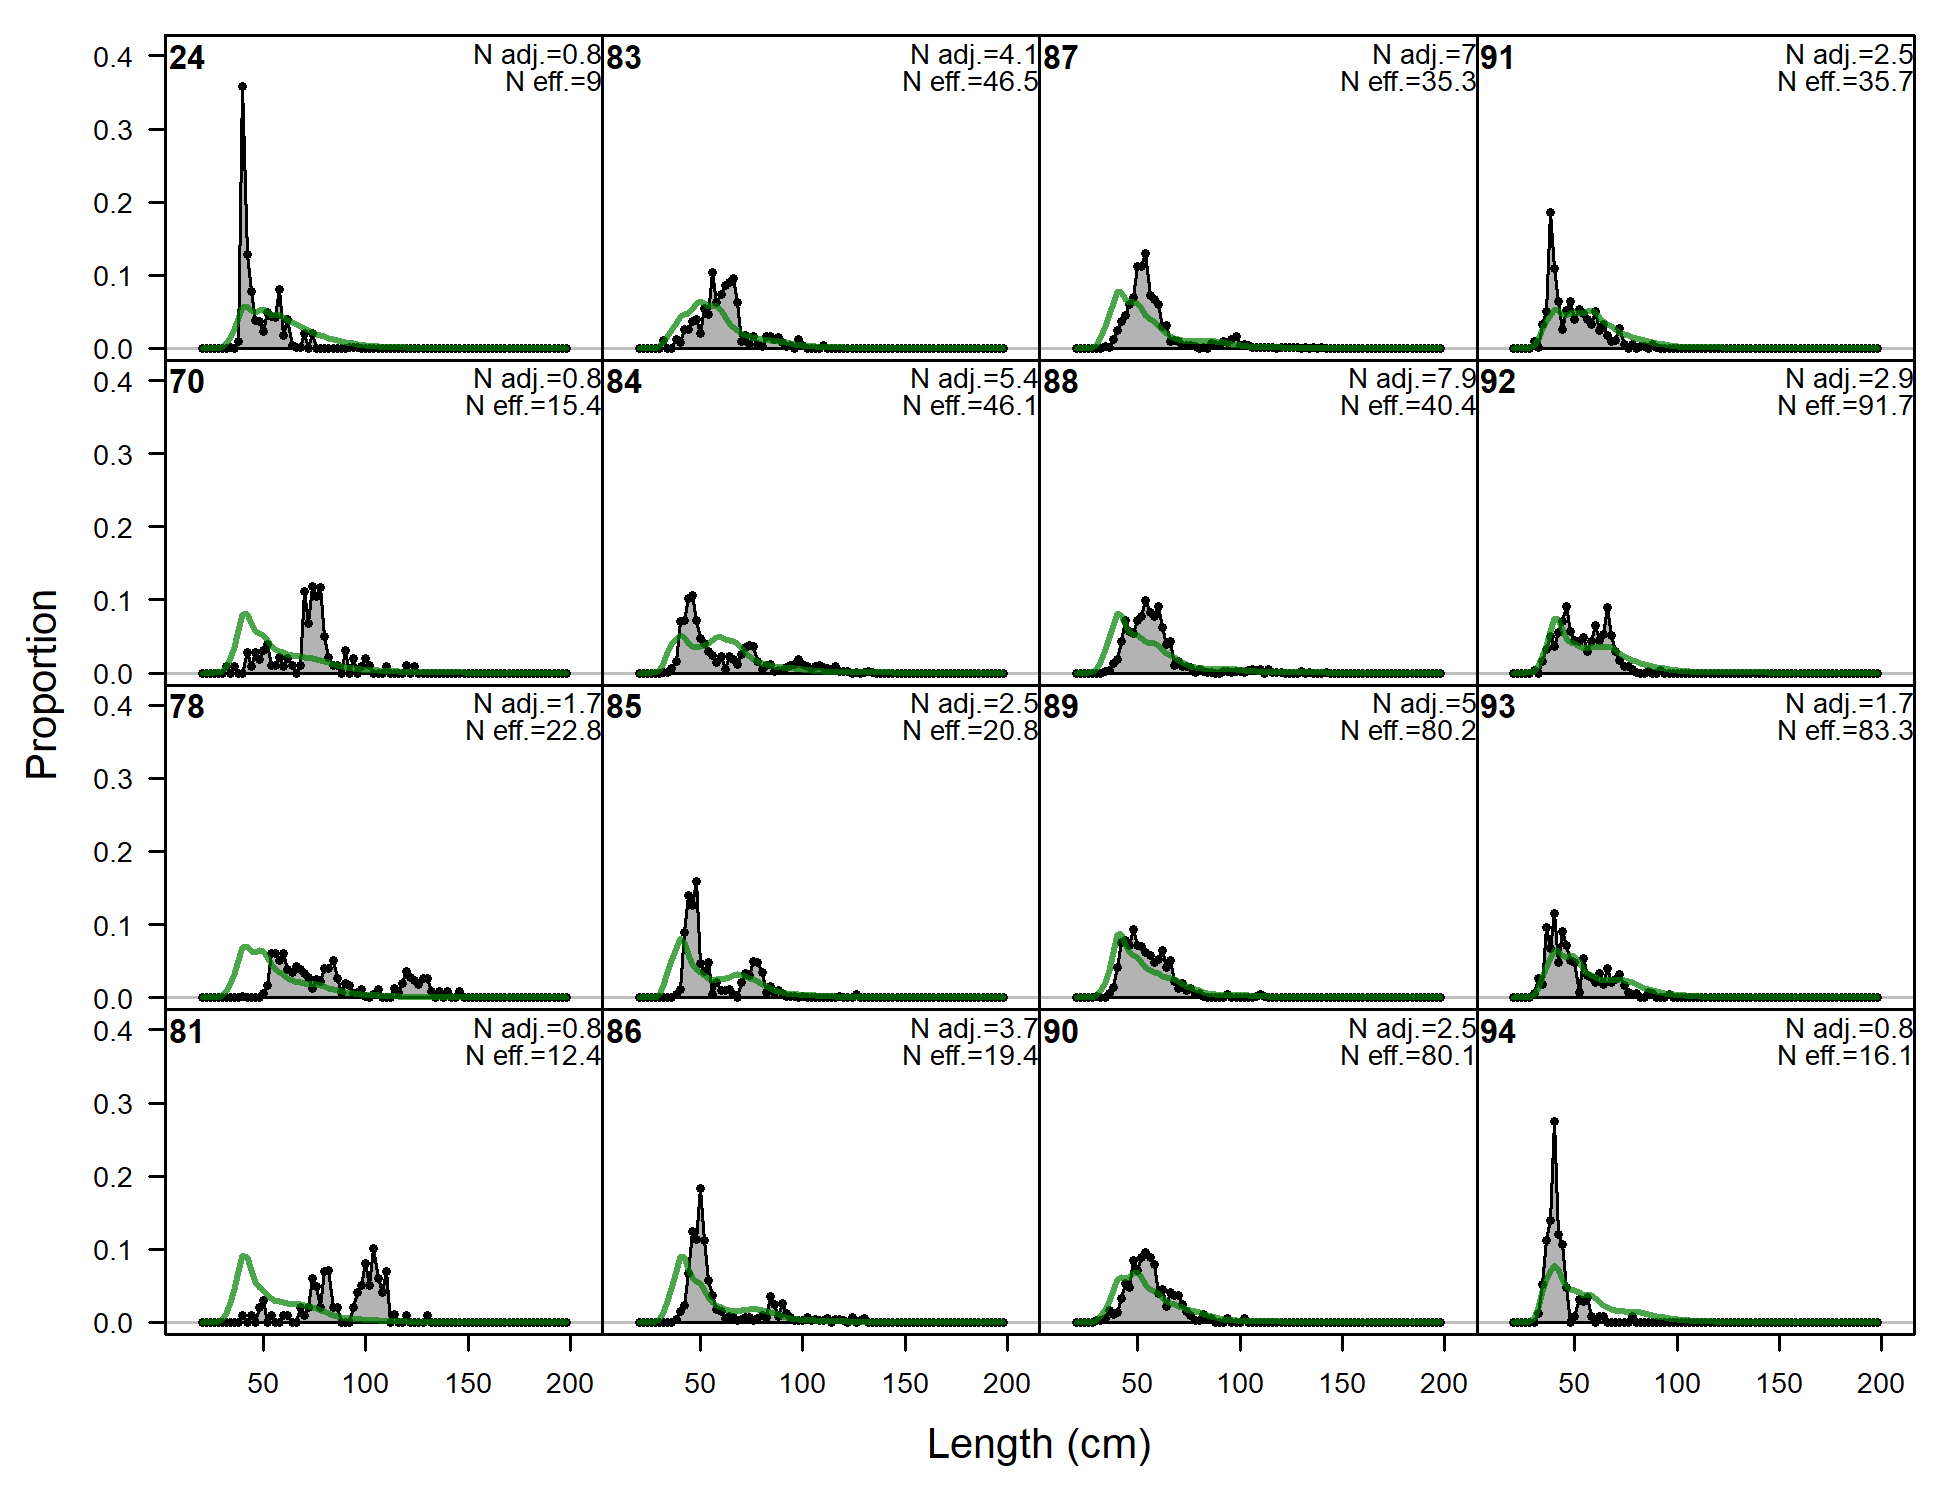
Length comps, whole catch, A6-LL-n (plot 1 of 5).
'N adj.' is the input sample size after data-weighting adjustment. N eff. is the calculated effective sample size used in the McAllister-Iannelli tuning method.
file: comp_lenfit_flt6mkt0_page1.png
Length comps, whole catch, A6-LL-n (plot 2 of 5)
file: comp_lenfit_flt6mkt0_page2.png
Length comps, whole catch, A6-LL-n (plot 3 of 5)
file: comp_lenfit_flt6mkt0_page3.png
Length comps, whole catch, A6-LL-n (plot 4 of 5)
file: comp_lenfit_flt6mkt0_page4.png
Length comps, whole catch, A6-LL-n (plot 5 of 5)
file: comp_lenfit_flt6mkt0_page5.png
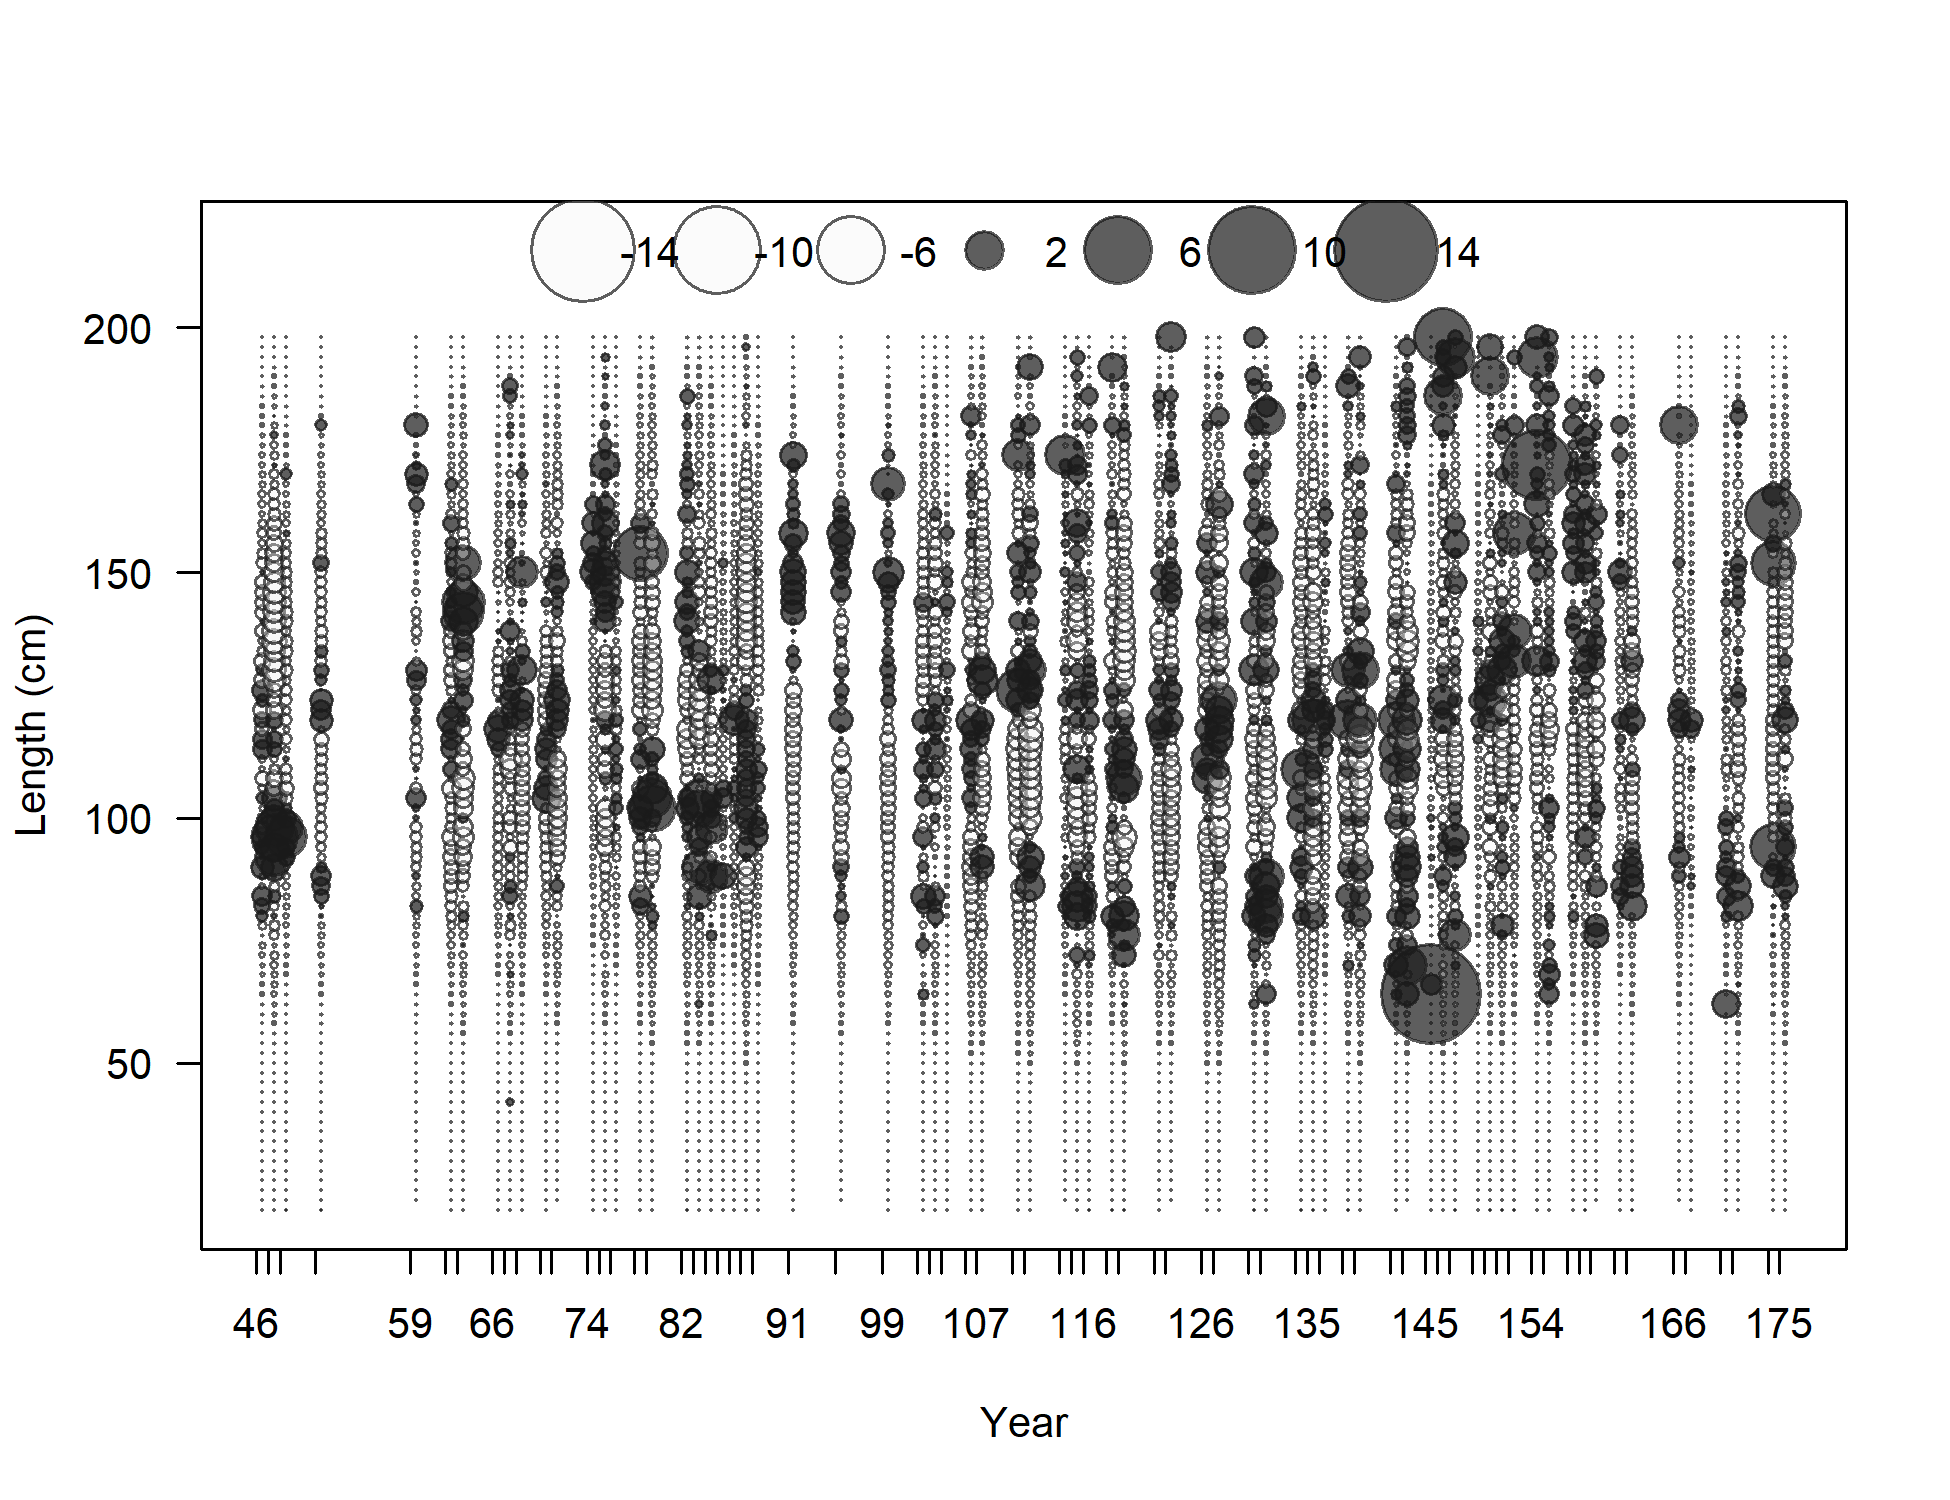
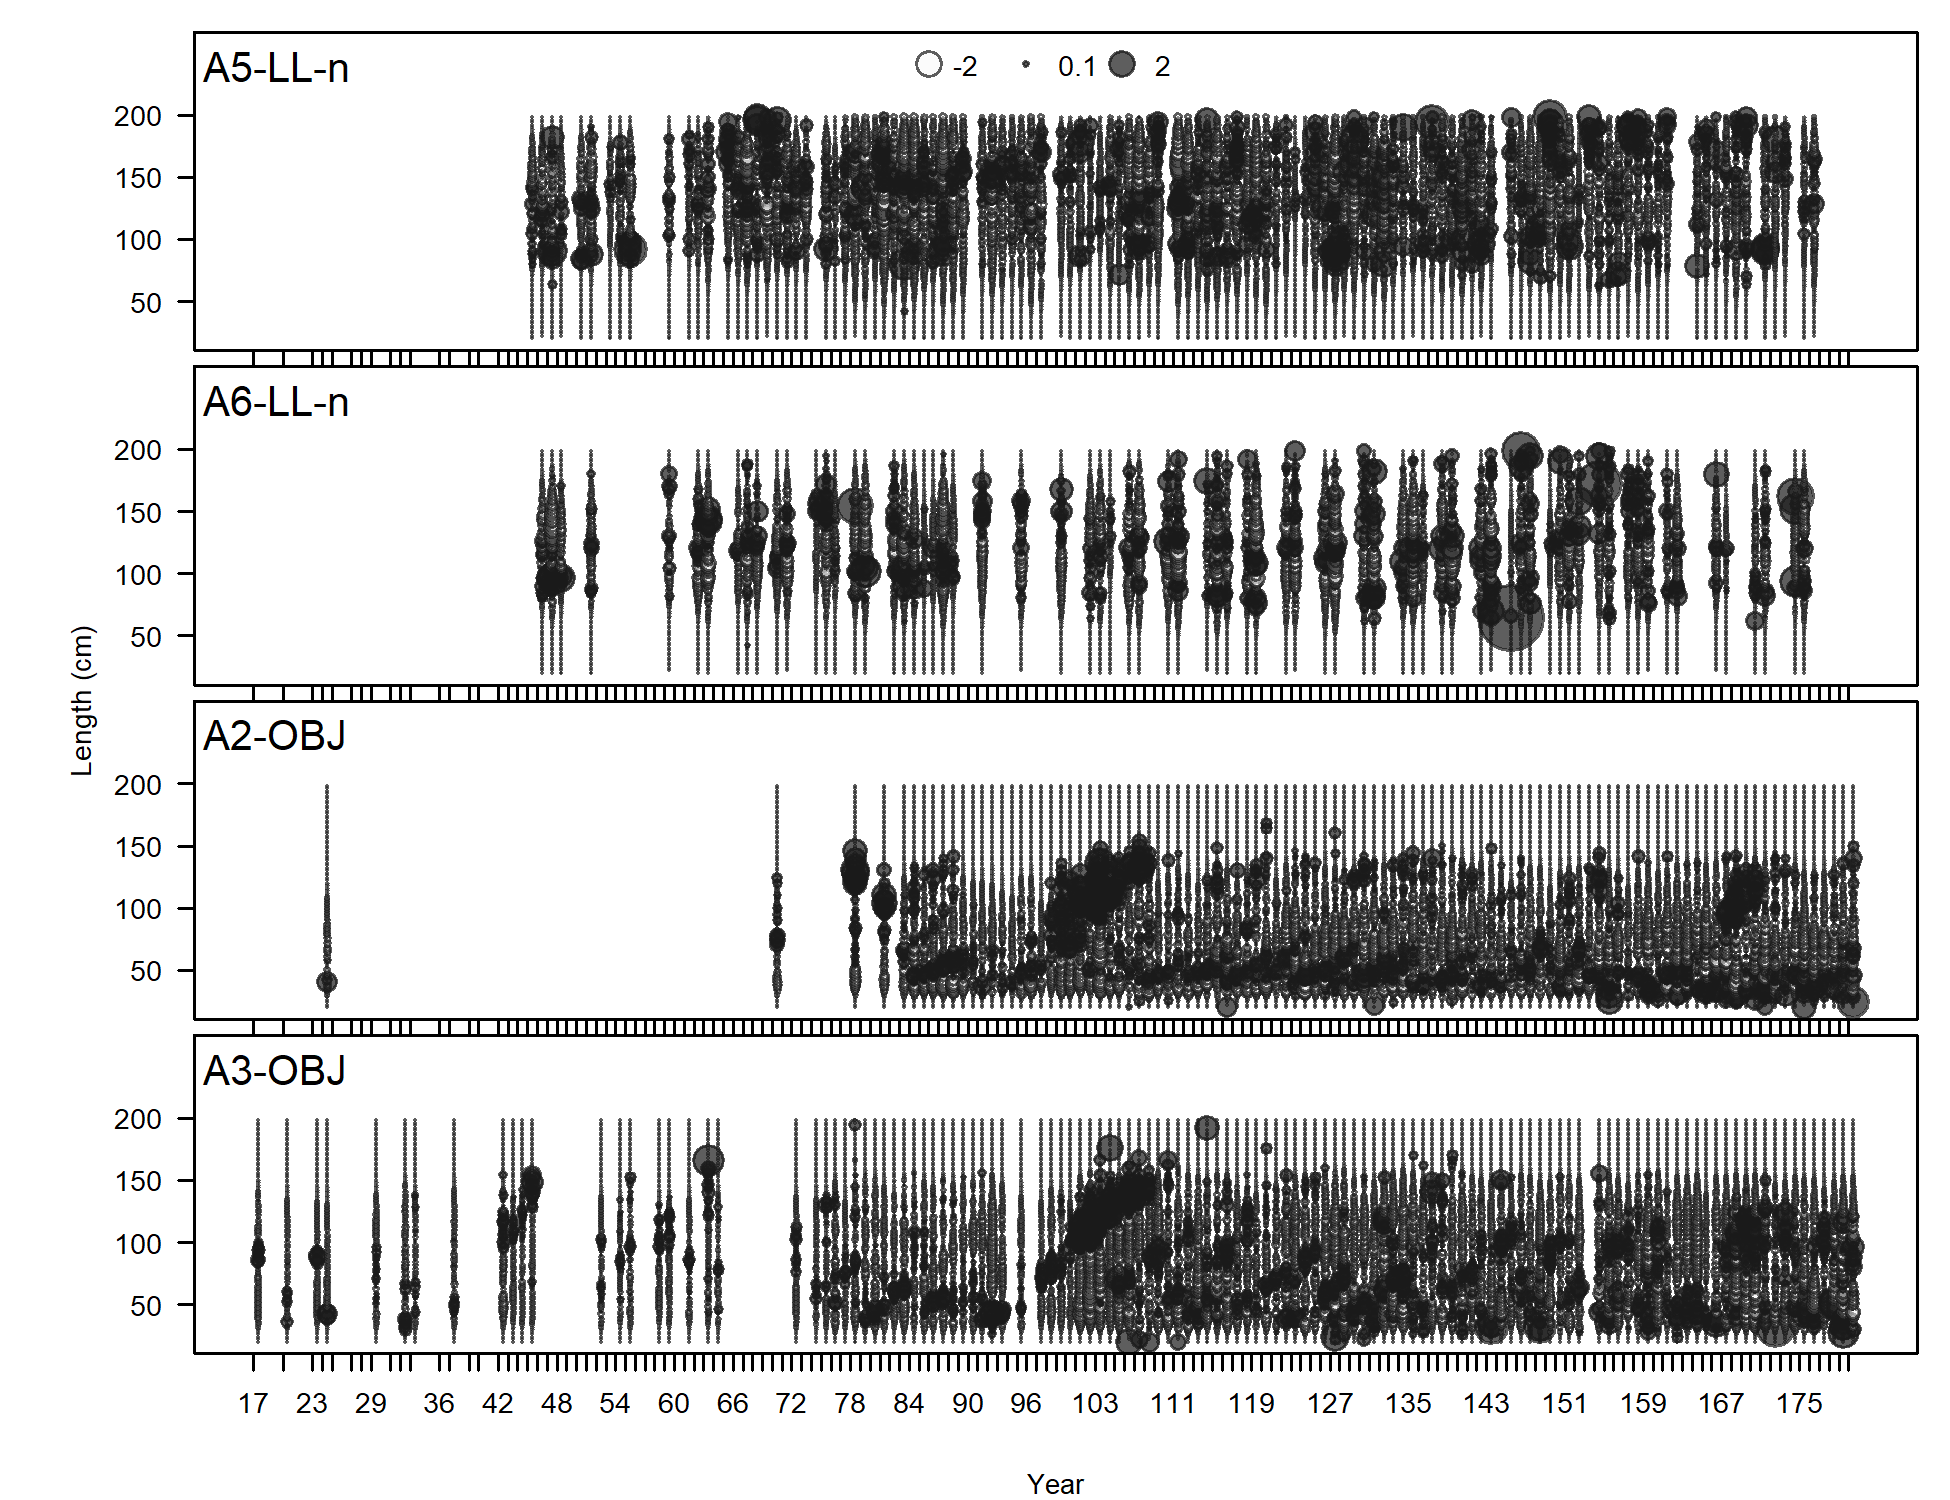
Pearson residuals, whole catch, A6-LL-n (max=13.06) (plot 5 of 5)
Closed bubbles are positive residuals (observed > expected) and open bubbles are negative residuals (observed < expected).
file: comp_lenfit_residsflt6mkt0_page5.png
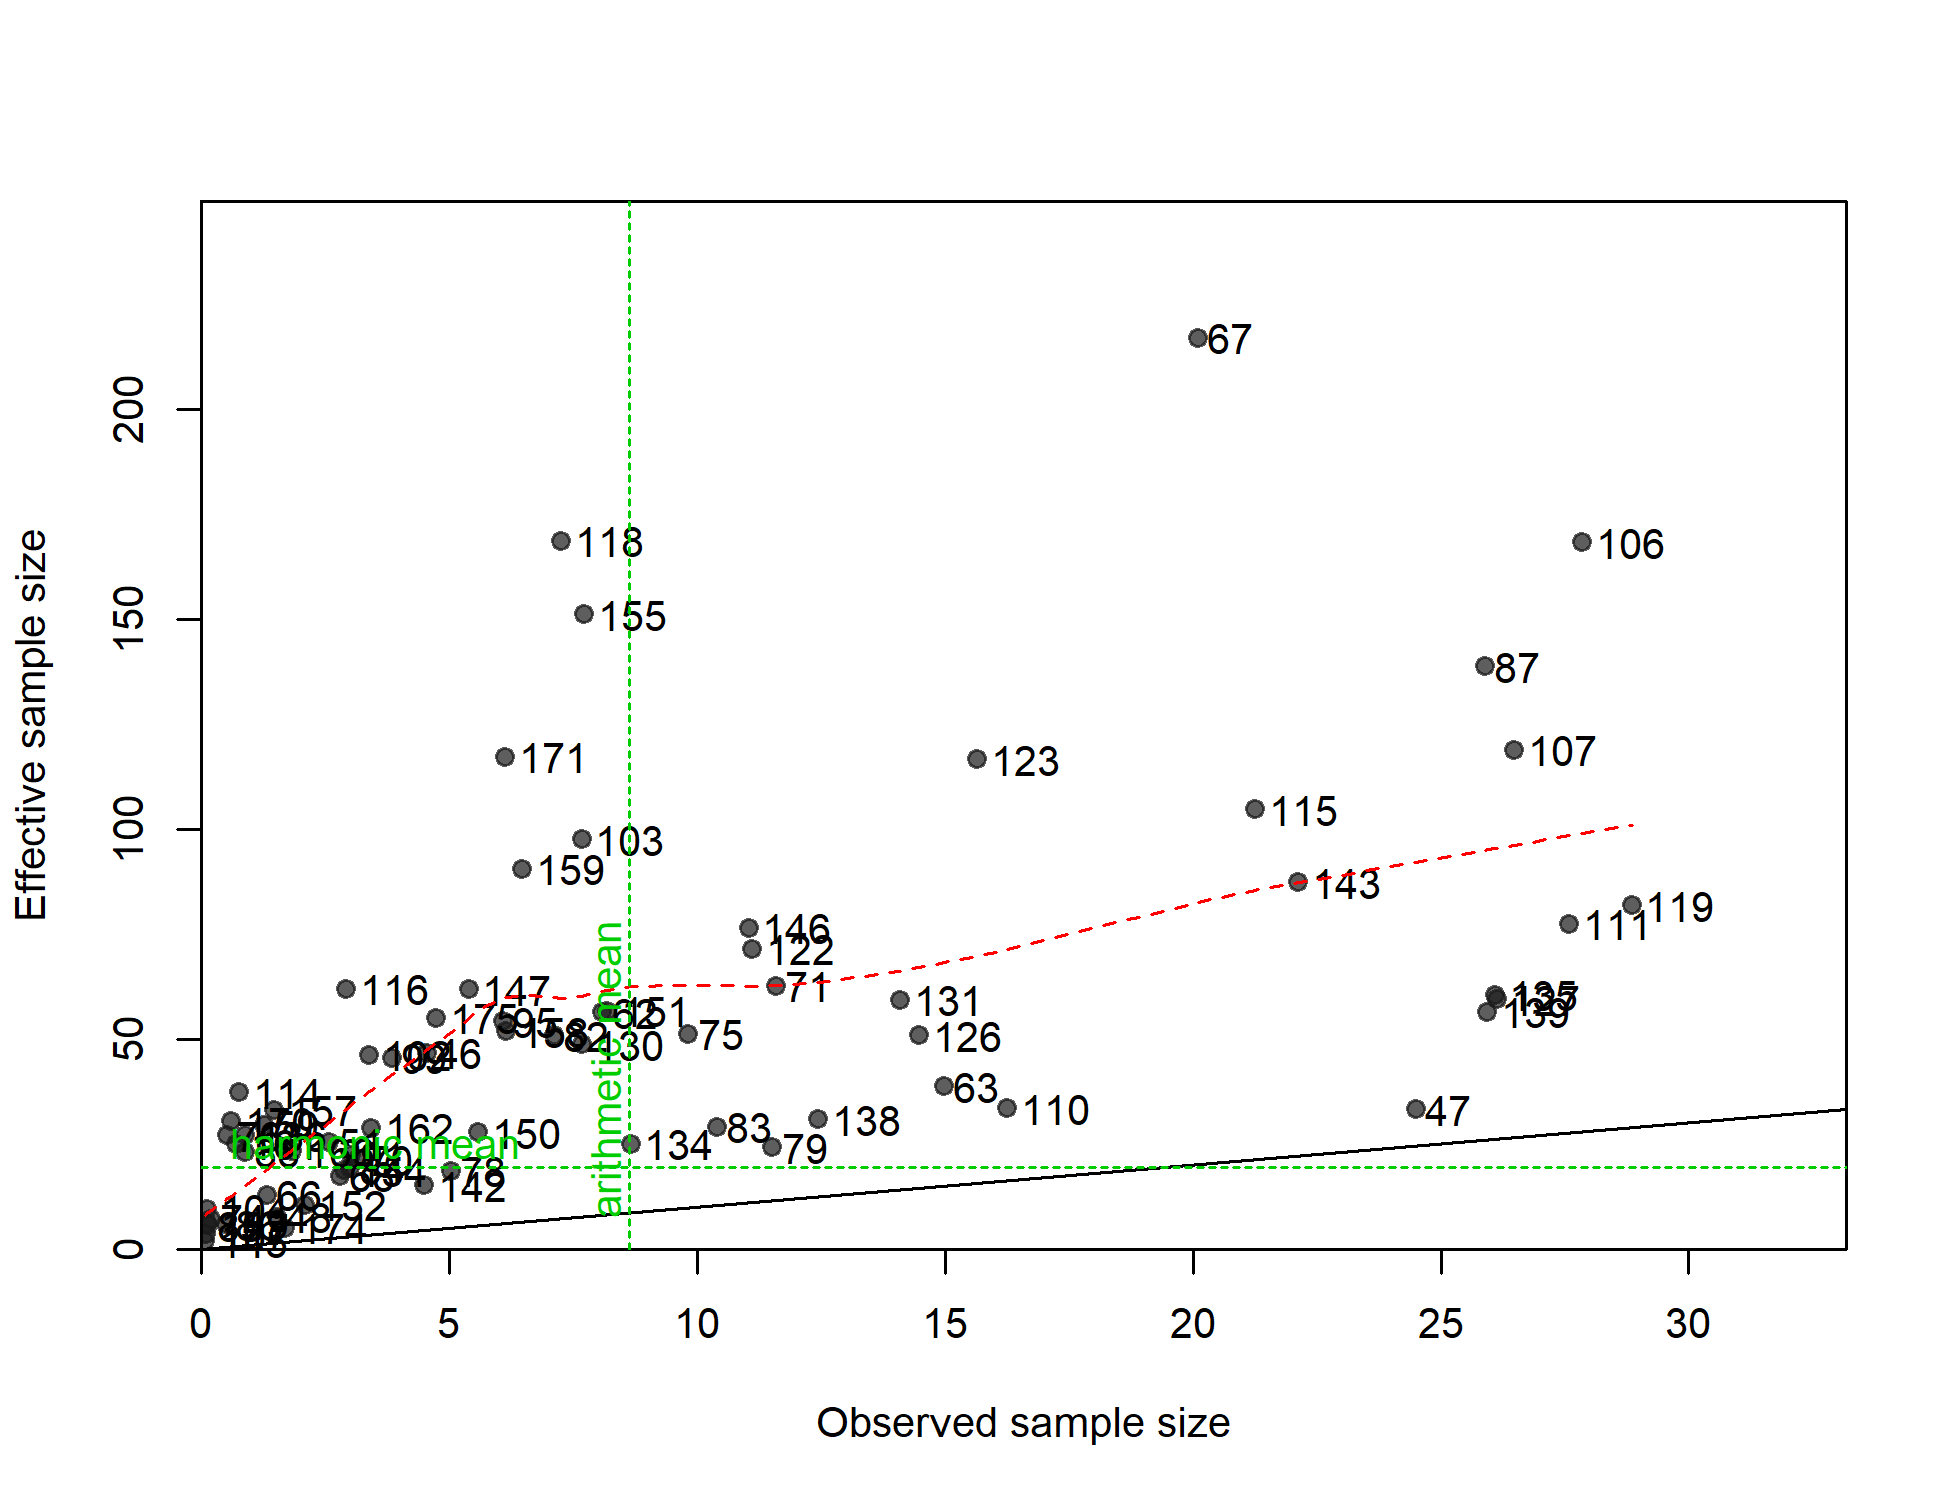
N-EffN comparison, Length comps, whole catch, A6-LL-n
file: comp_lenfit_sampsize_flt6mkt0.png
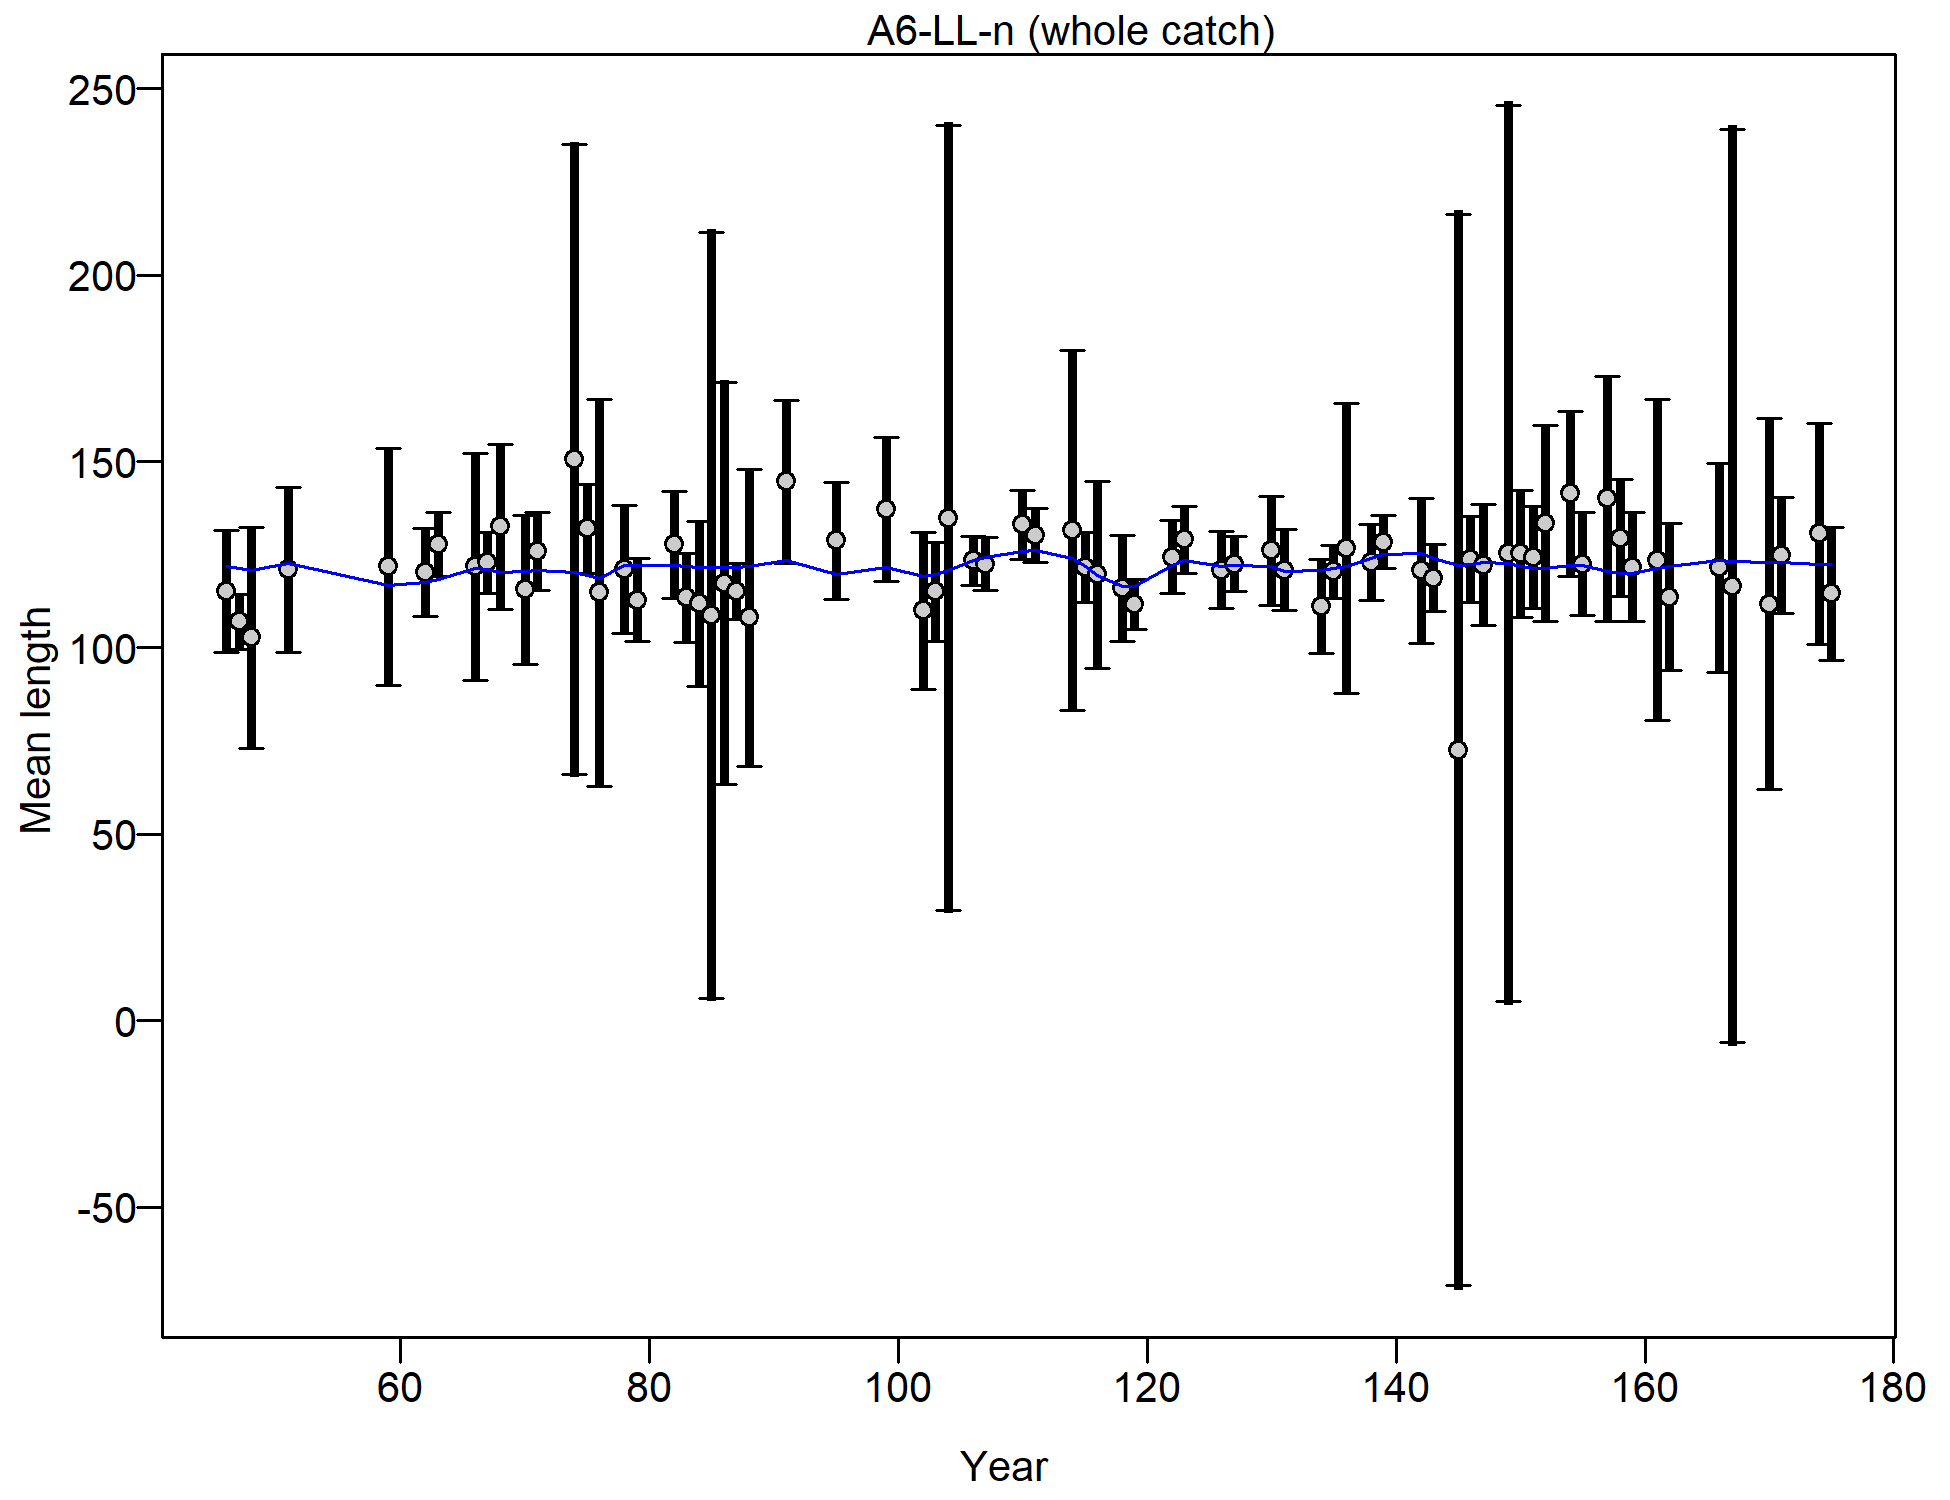
Mean length for A6-LL-n with 95% confidence intervals based on current samples sizes.
Francis data weighting method TA1.8: thinner intervals (with capped ends) show result of further adjusting sample sizes based on suggested multiplier (with 95% interval) for len data from A6-LL-n:
1.0157 (0.6649-1.6343)
For more info, see
Francis, R.I.C.C. (2011). Data weighting in statistical fisheries stock assessment models. Can. J. Fish. Aquat. Sci. 68: 1124-1138. https://doi.org/10.1139/f2011-025
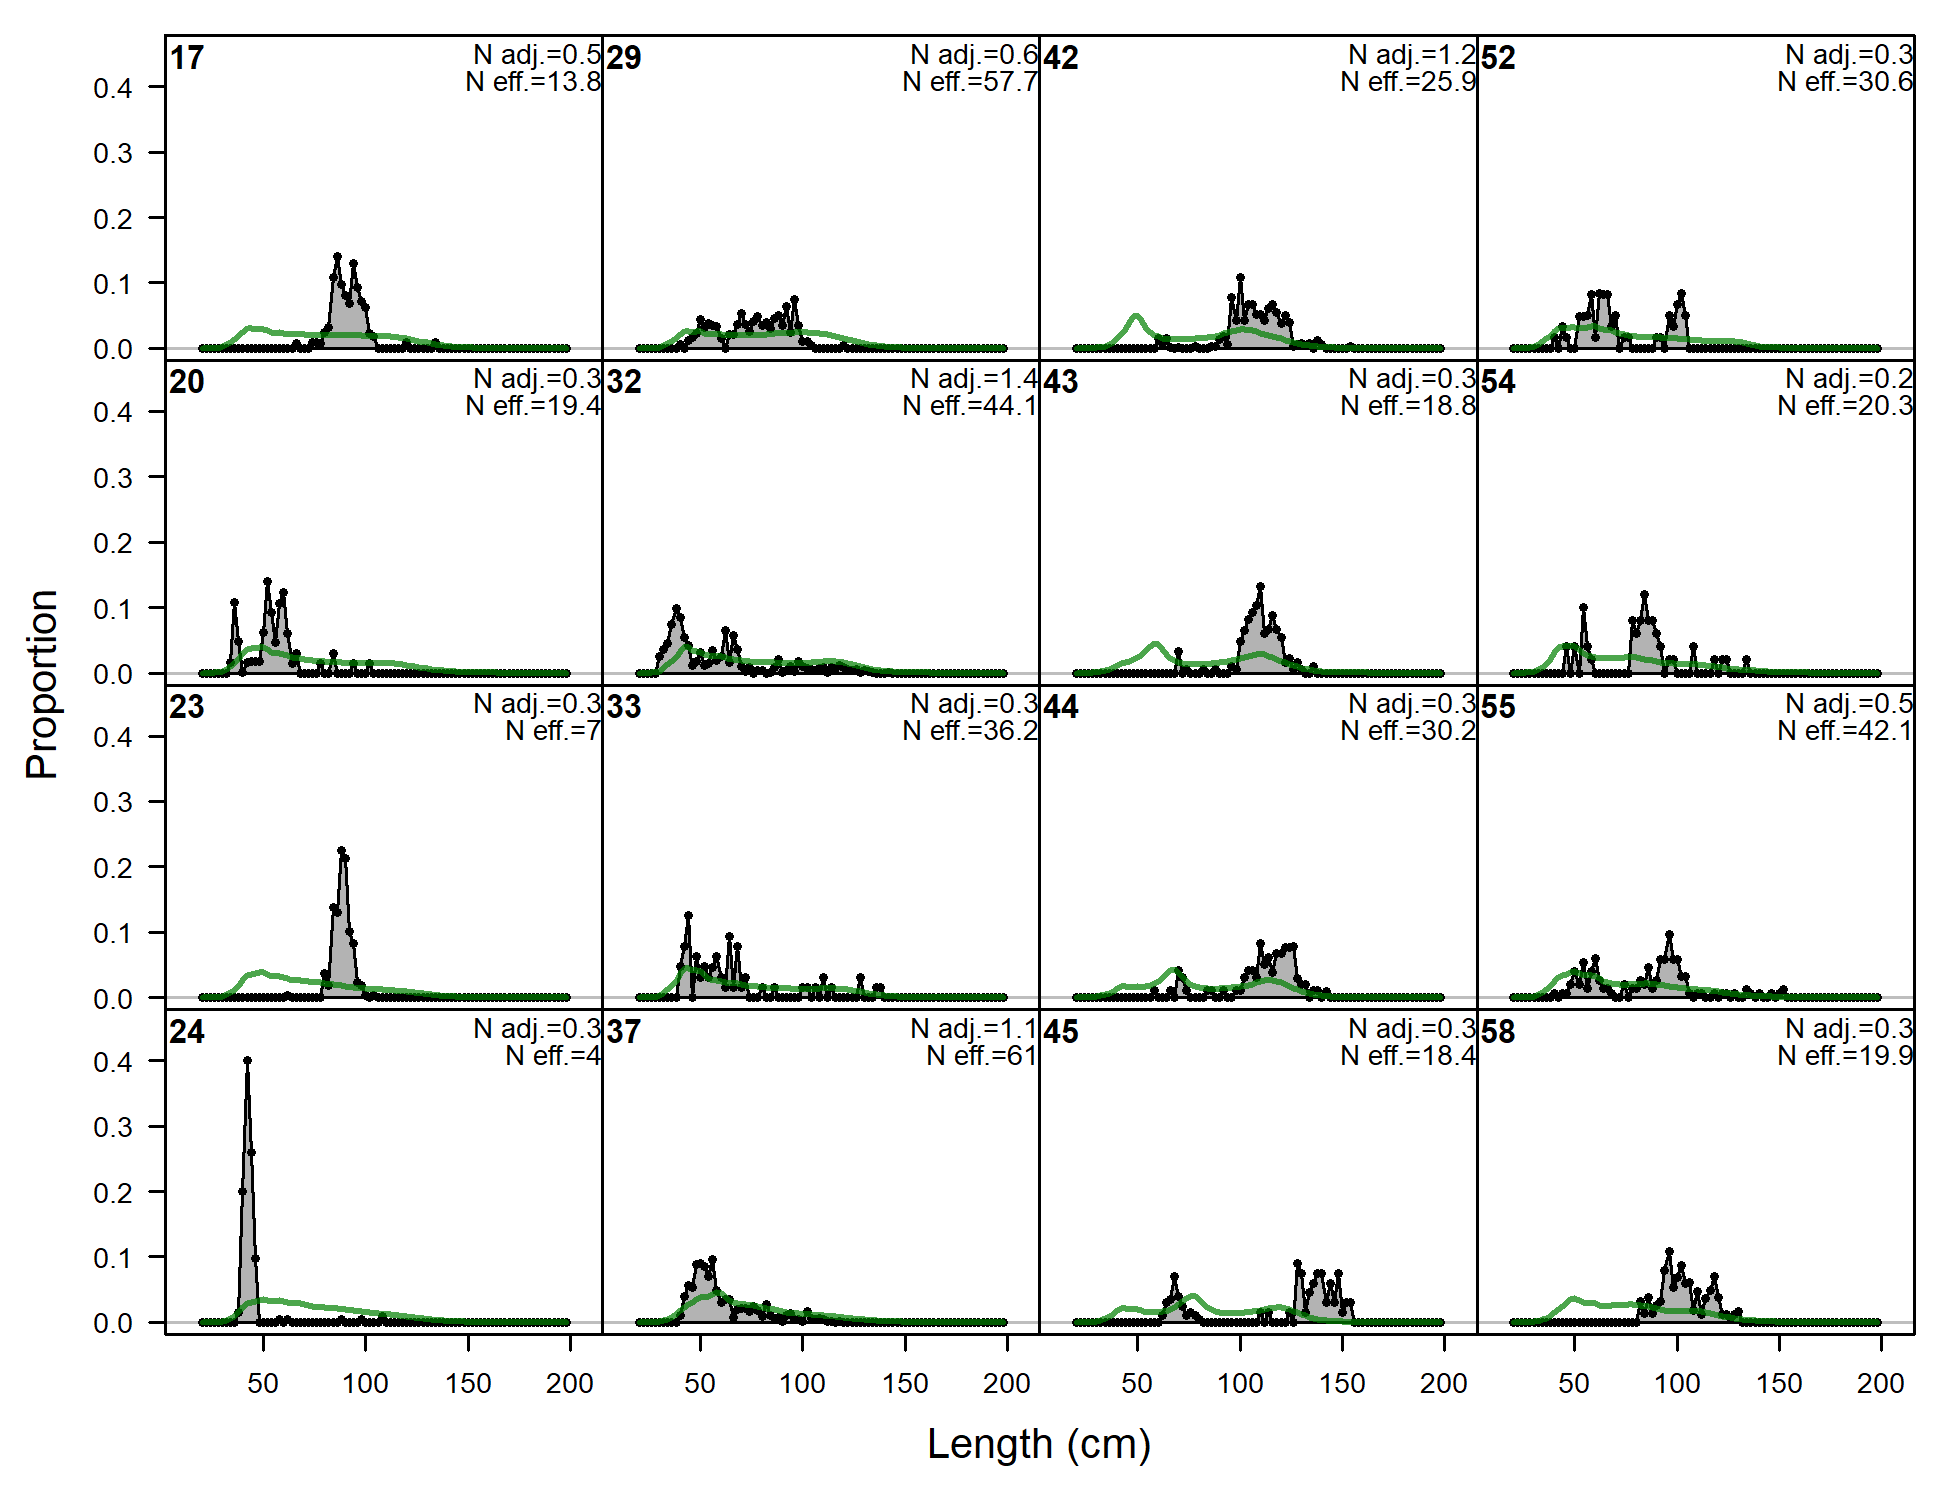
Length comps, whole catch, A2-OBJ (plot 1 of 7).
'N adj.' is the input sample size after data-weighting adjustment. N eff. is the calculated effective sample size used in the McAllister-Iannelli tuning method.
file: comp_lenfit_flt13mkt0_page1.png
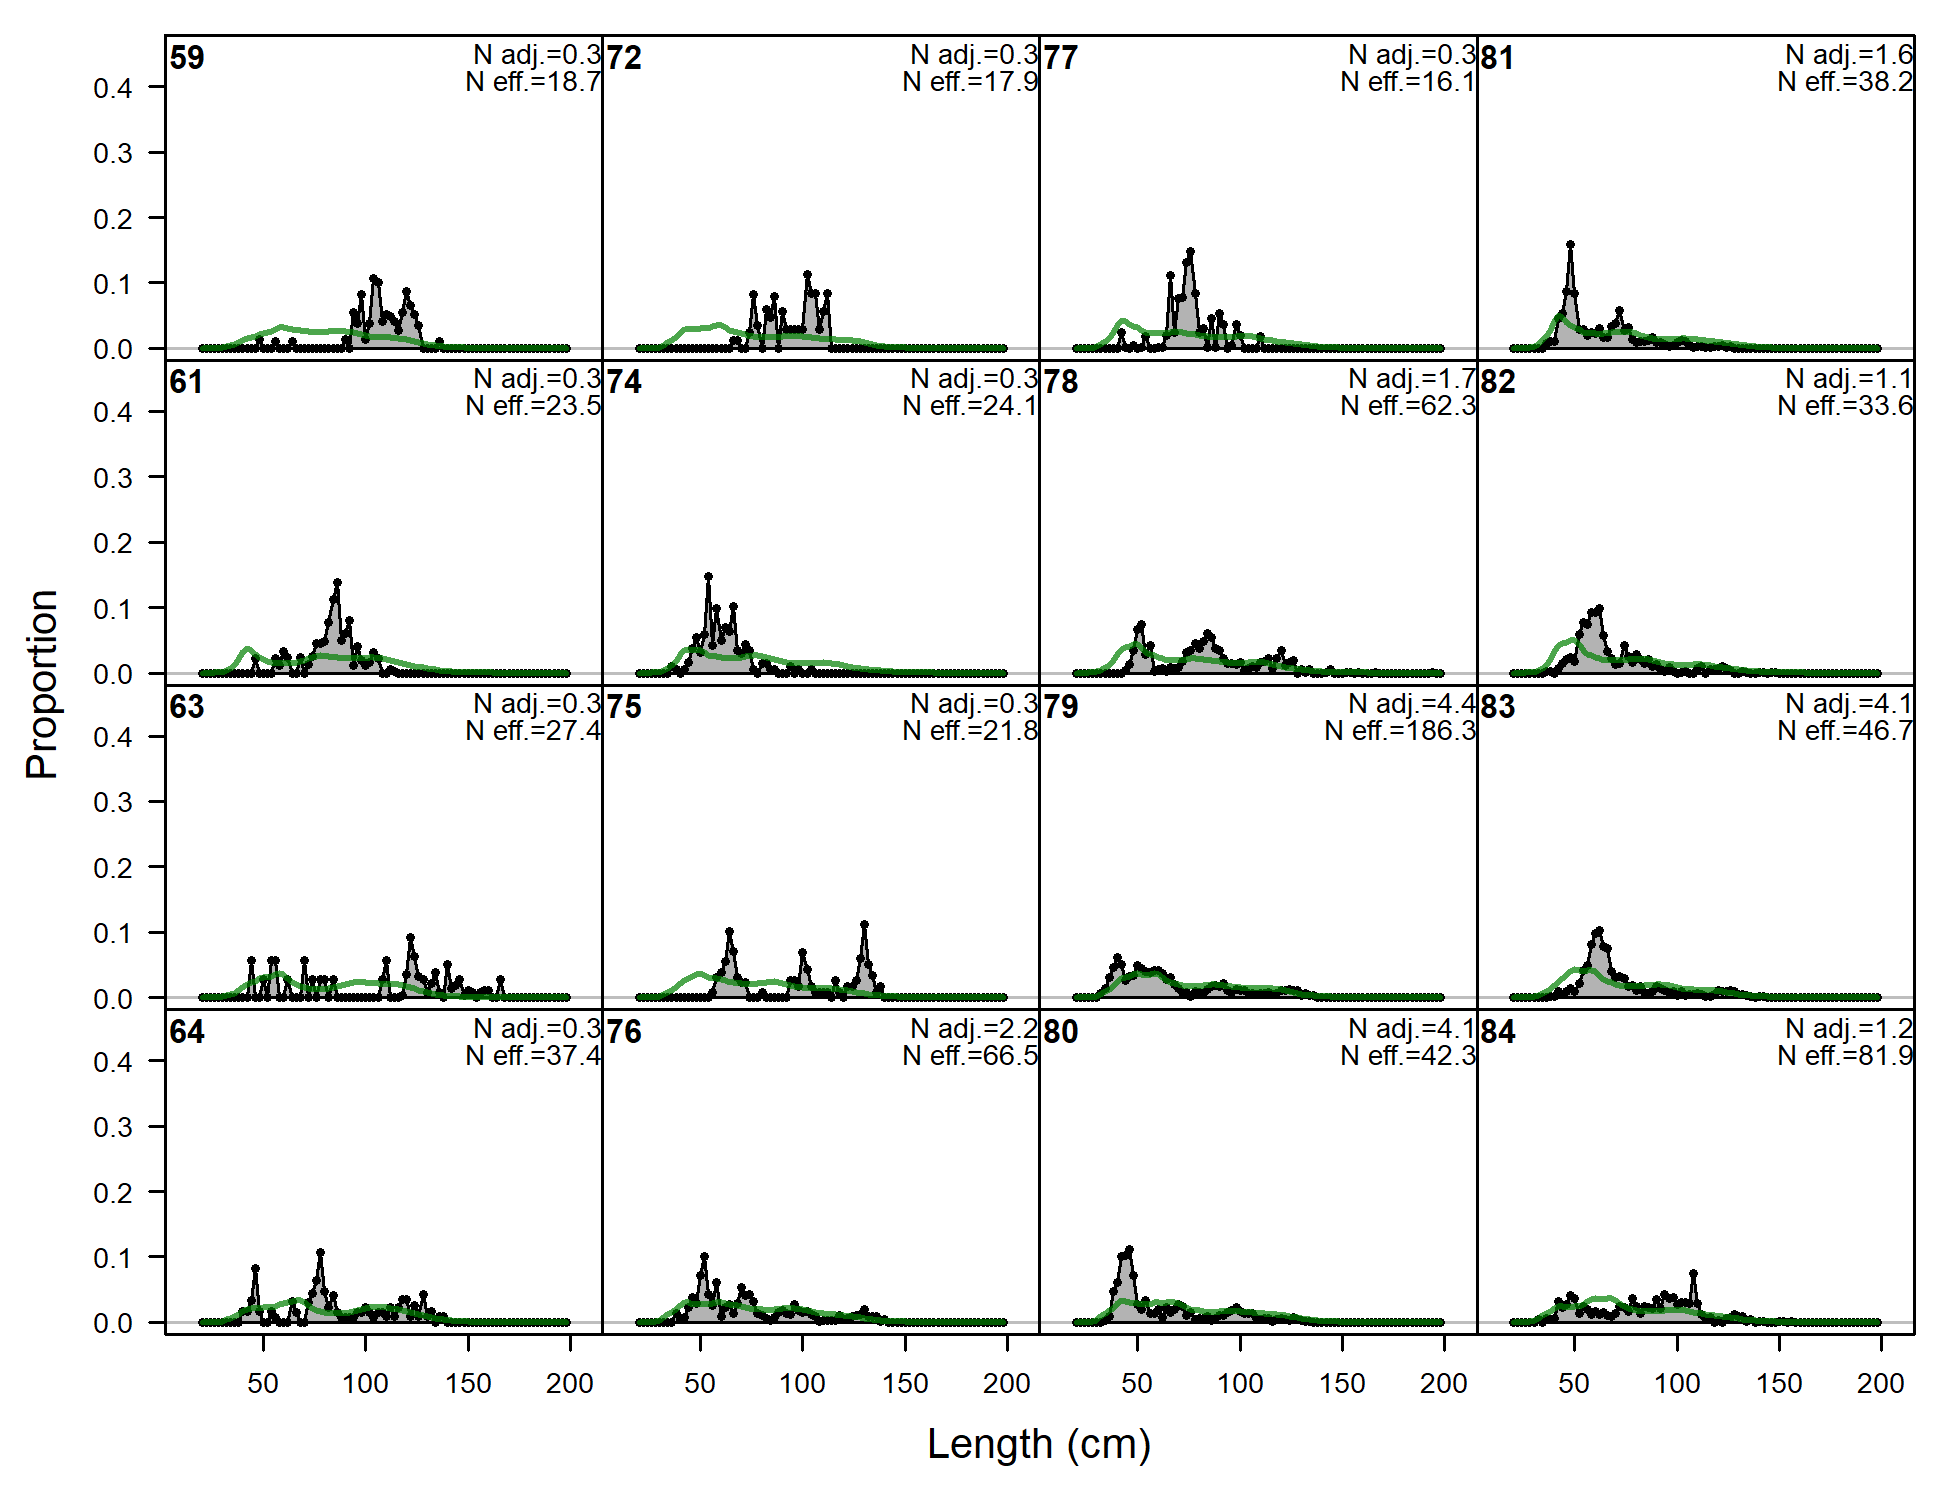
Length comps, whole catch, A2-OBJ (plot 2 of 7)
file: comp_lenfit_flt13mkt0_page2.png
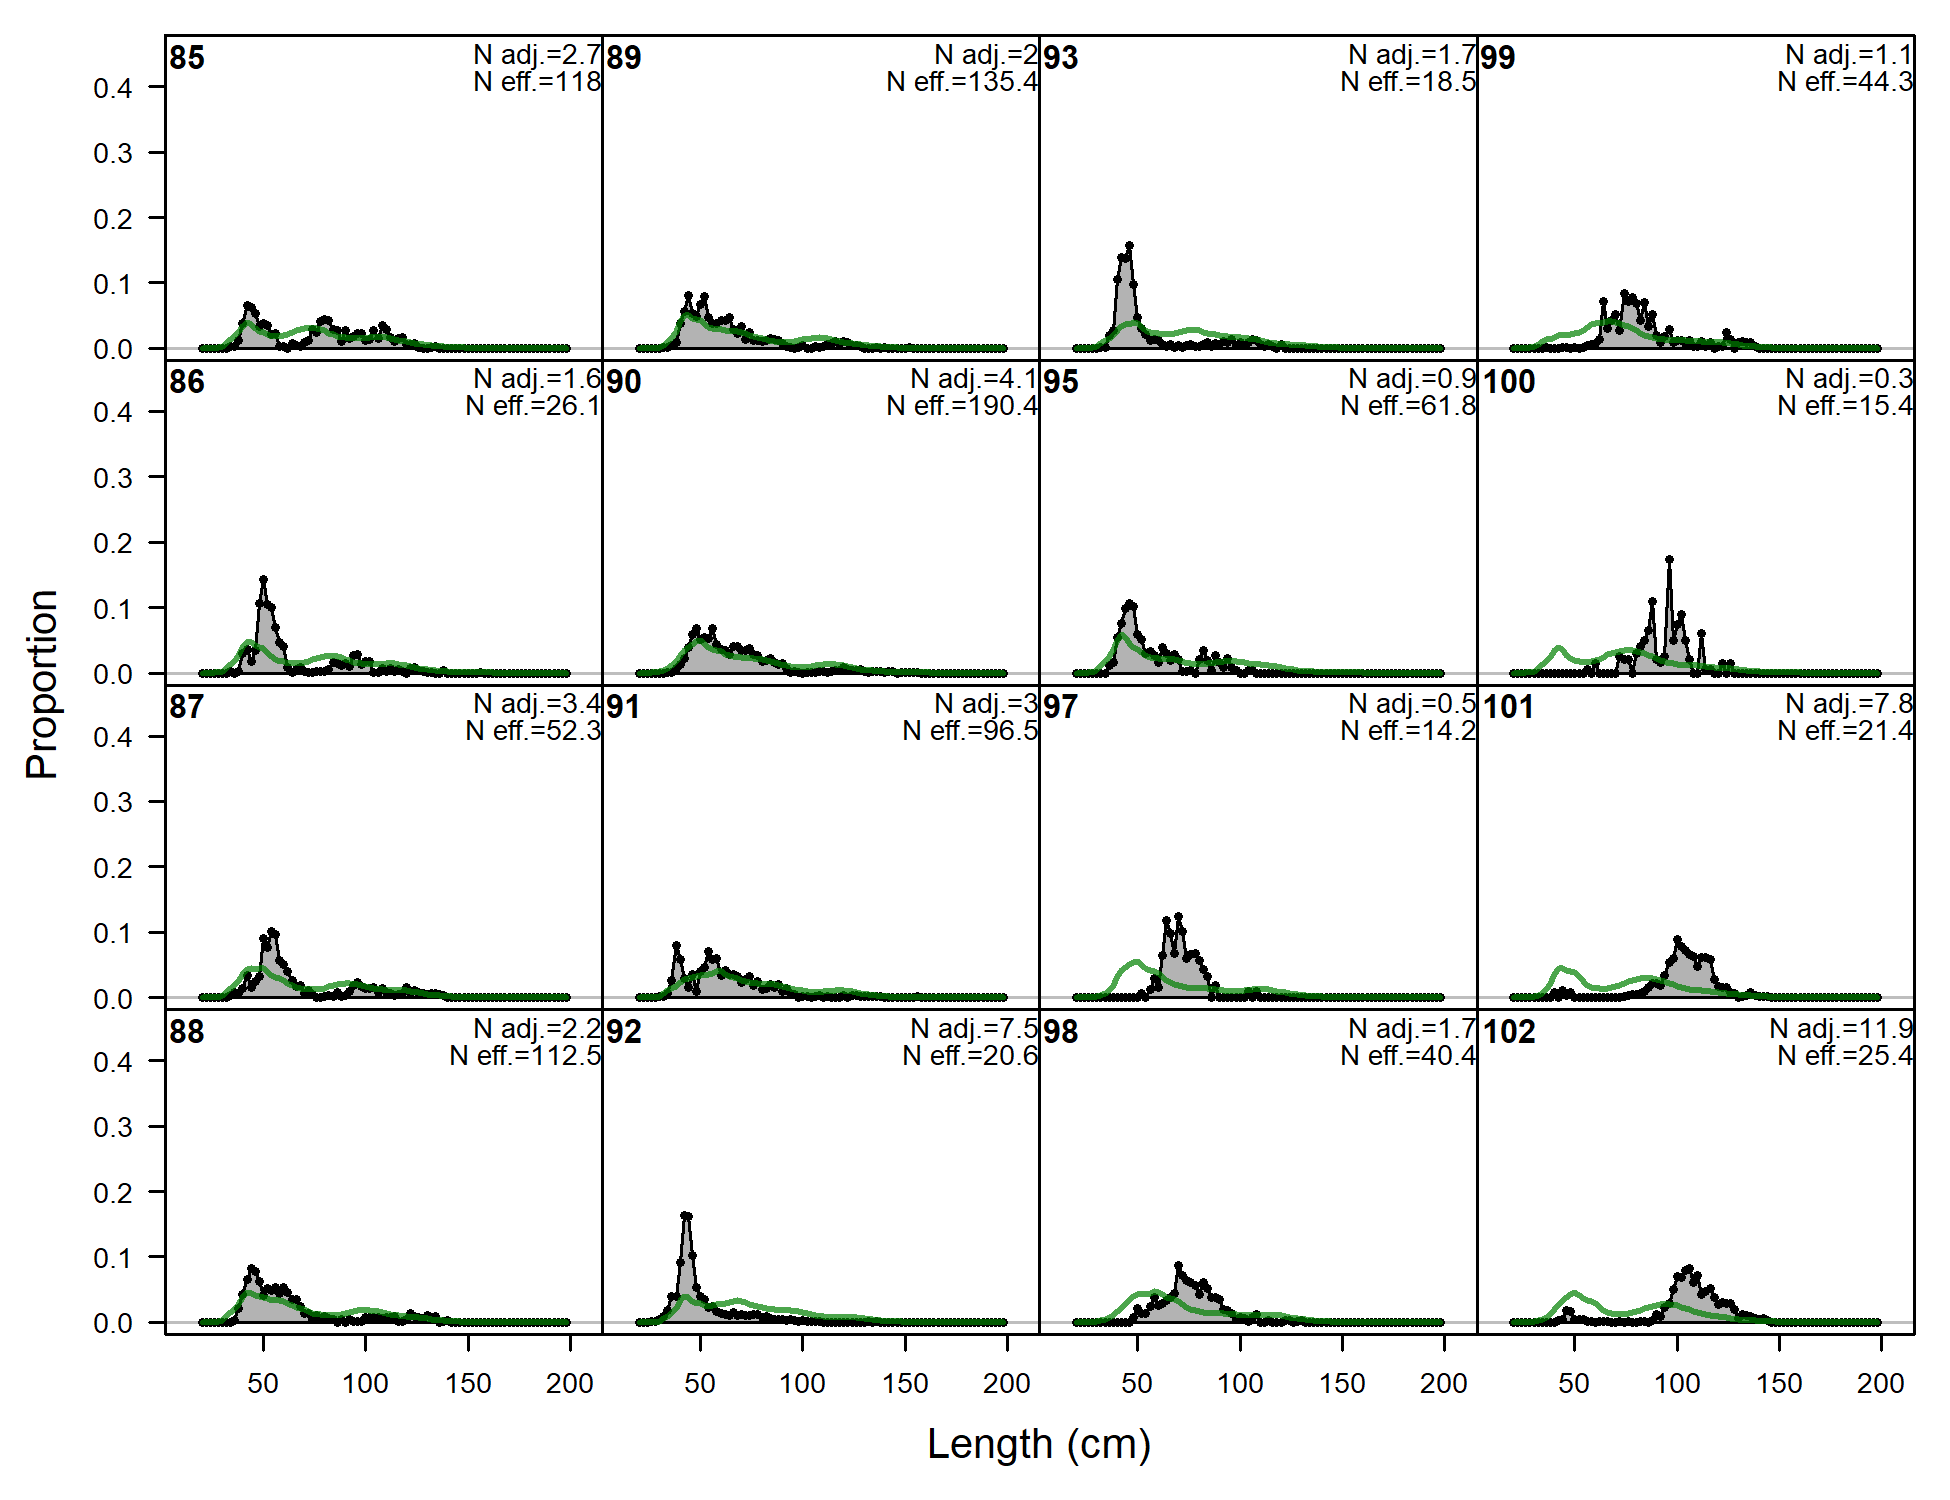
Length comps, whole catch, A2-OBJ (plot 3 of 7)
file: comp_lenfit_flt13mkt0_page3.png
Length comps, whole catch, A2-OBJ (plot 4 of 7)
file: comp_lenfit_flt13mkt0_page4.png
Length comps, whole catch, A2-OBJ (plot 5 of 7)
file: comp_lenfit_flt13mkt0_page5.png
Length comps, whole catch, A2-OBJ (plot 6 of 7)
file: comp_lenfit_flt13mkt0_page6.png
Length comps, whole catch, A2-OBJ (plot 7 of 7)
file: comp_lenfit_flt13mkt0_page7.png
Pearson residuals, whole catch, A2-OBJ (max=3.05) (plot 7 of 7)
Closed bubbles are positive residuals (observed > expected) and open bubbles are negative residuals (observed < expected).
file: comp_lenfit_residsflt13mkt0_page7.png
N-EffN comparison, Length comps, whole catch, A2-OBJ
file: comp_lenfit_sampsize_flt13mkt0.png
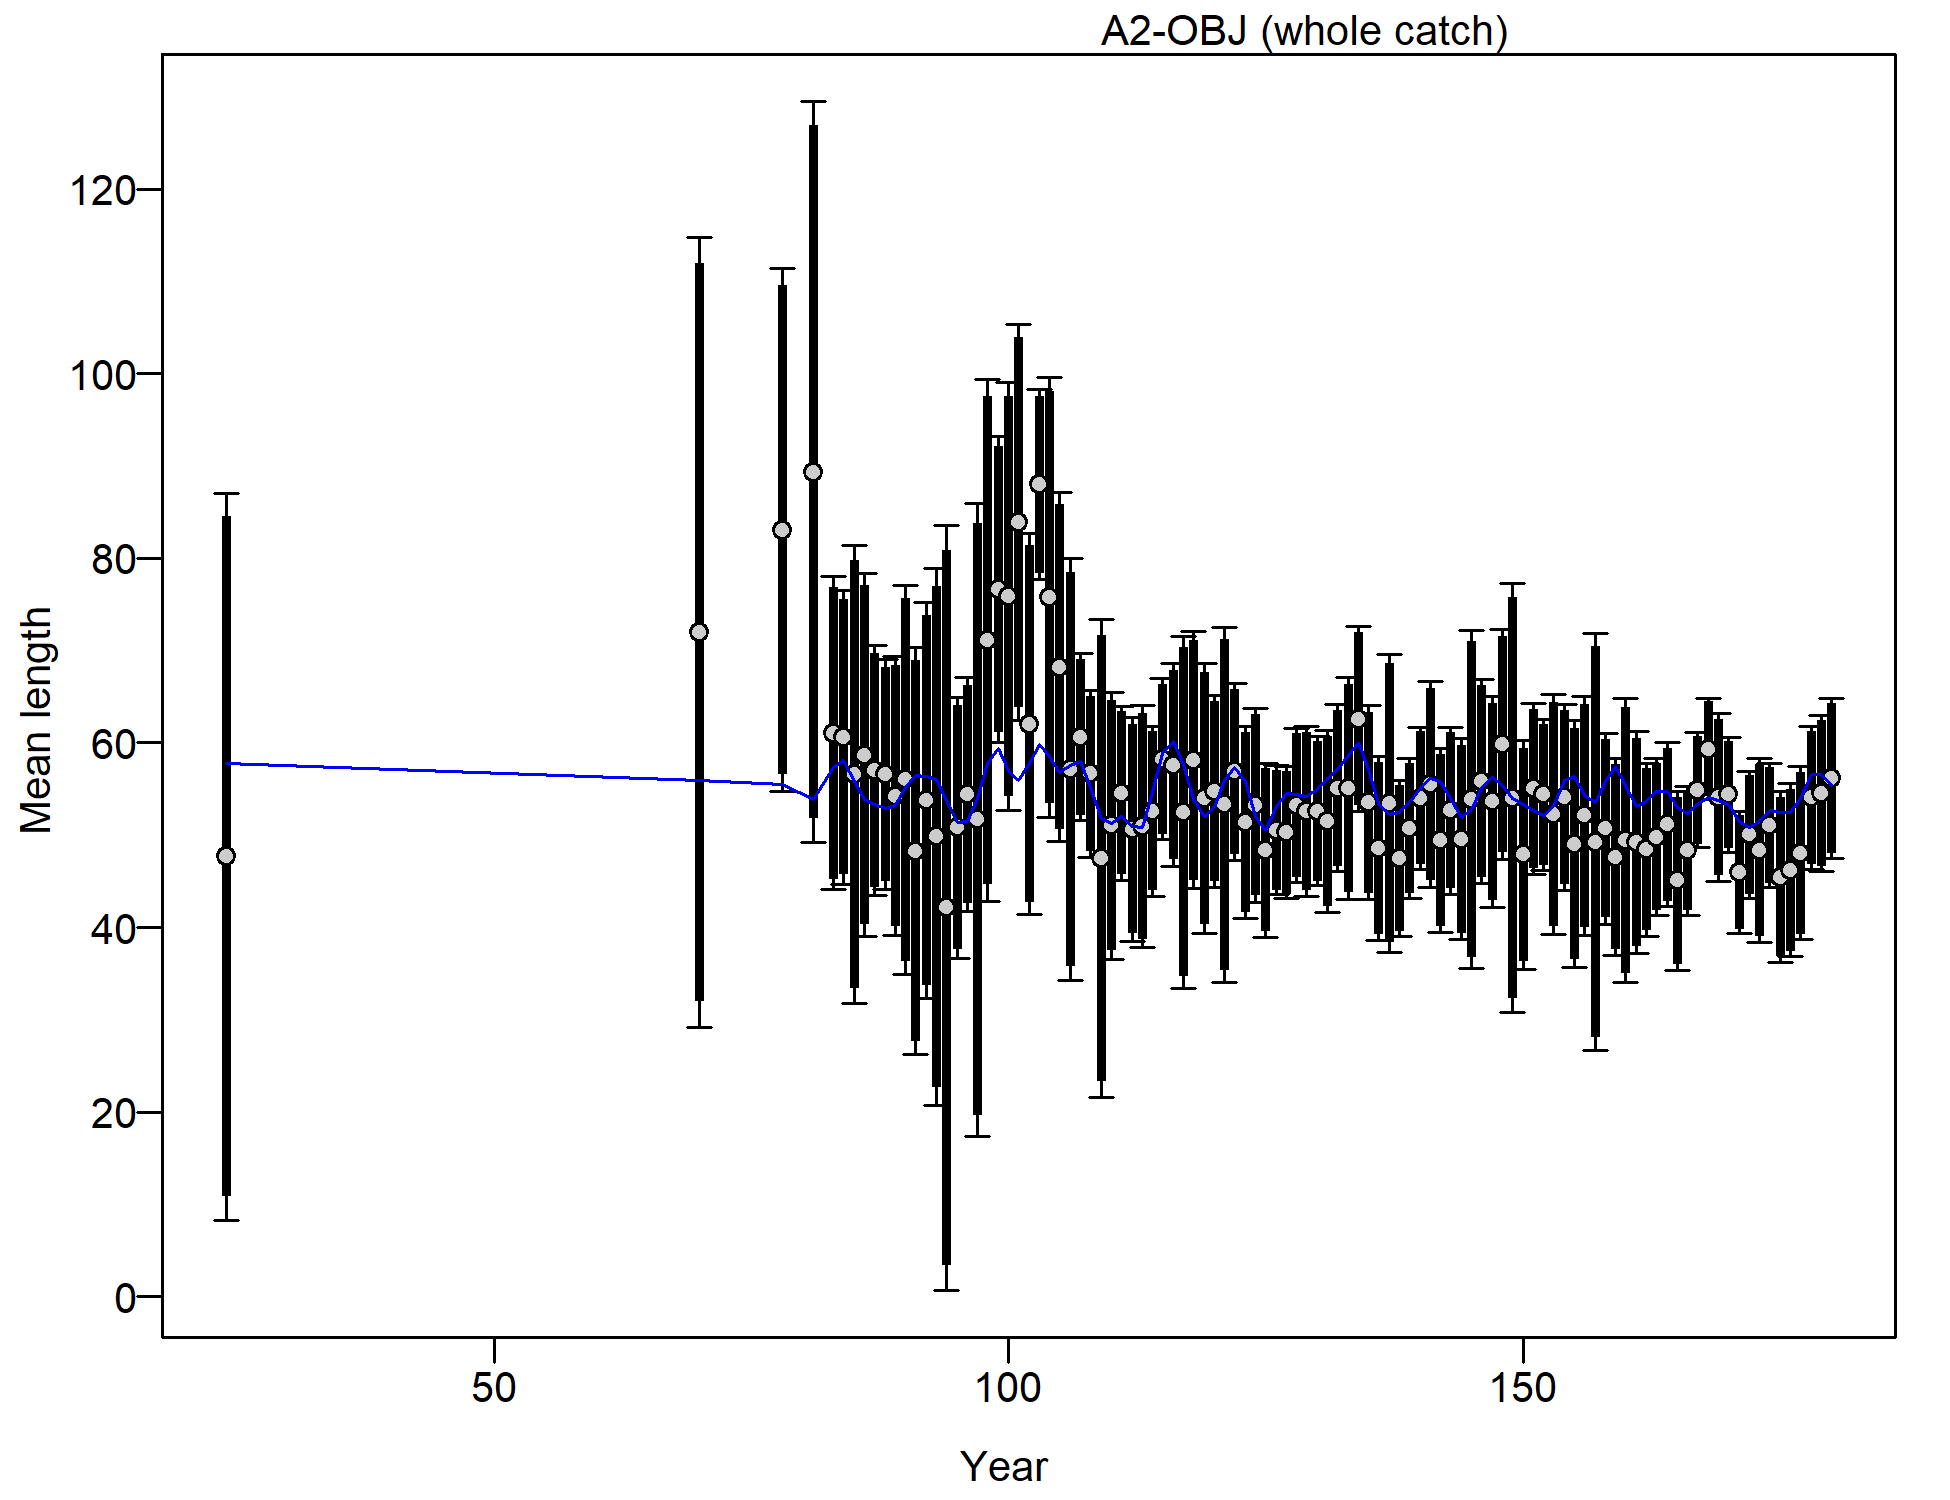
Mean length for A2-OBJ with 95% confidence intervals based on current samples sizes.
Francis data weighting method TA1.8: thinner intervals (with capped ends) show result of further adjusting sample sizes based on suggested multiplier (with 95% interval) for len data from A2-OBJ:
0.8737 (0.5078-1.6927)
For more info, see
Francis, R.I.C.C. (2011). Data weighting in statistical fisheries stock assessment models. Can. J. Fish. Aquat. Sci. 68: 1124-1138. https://doi.org/10.1139/f2011-025
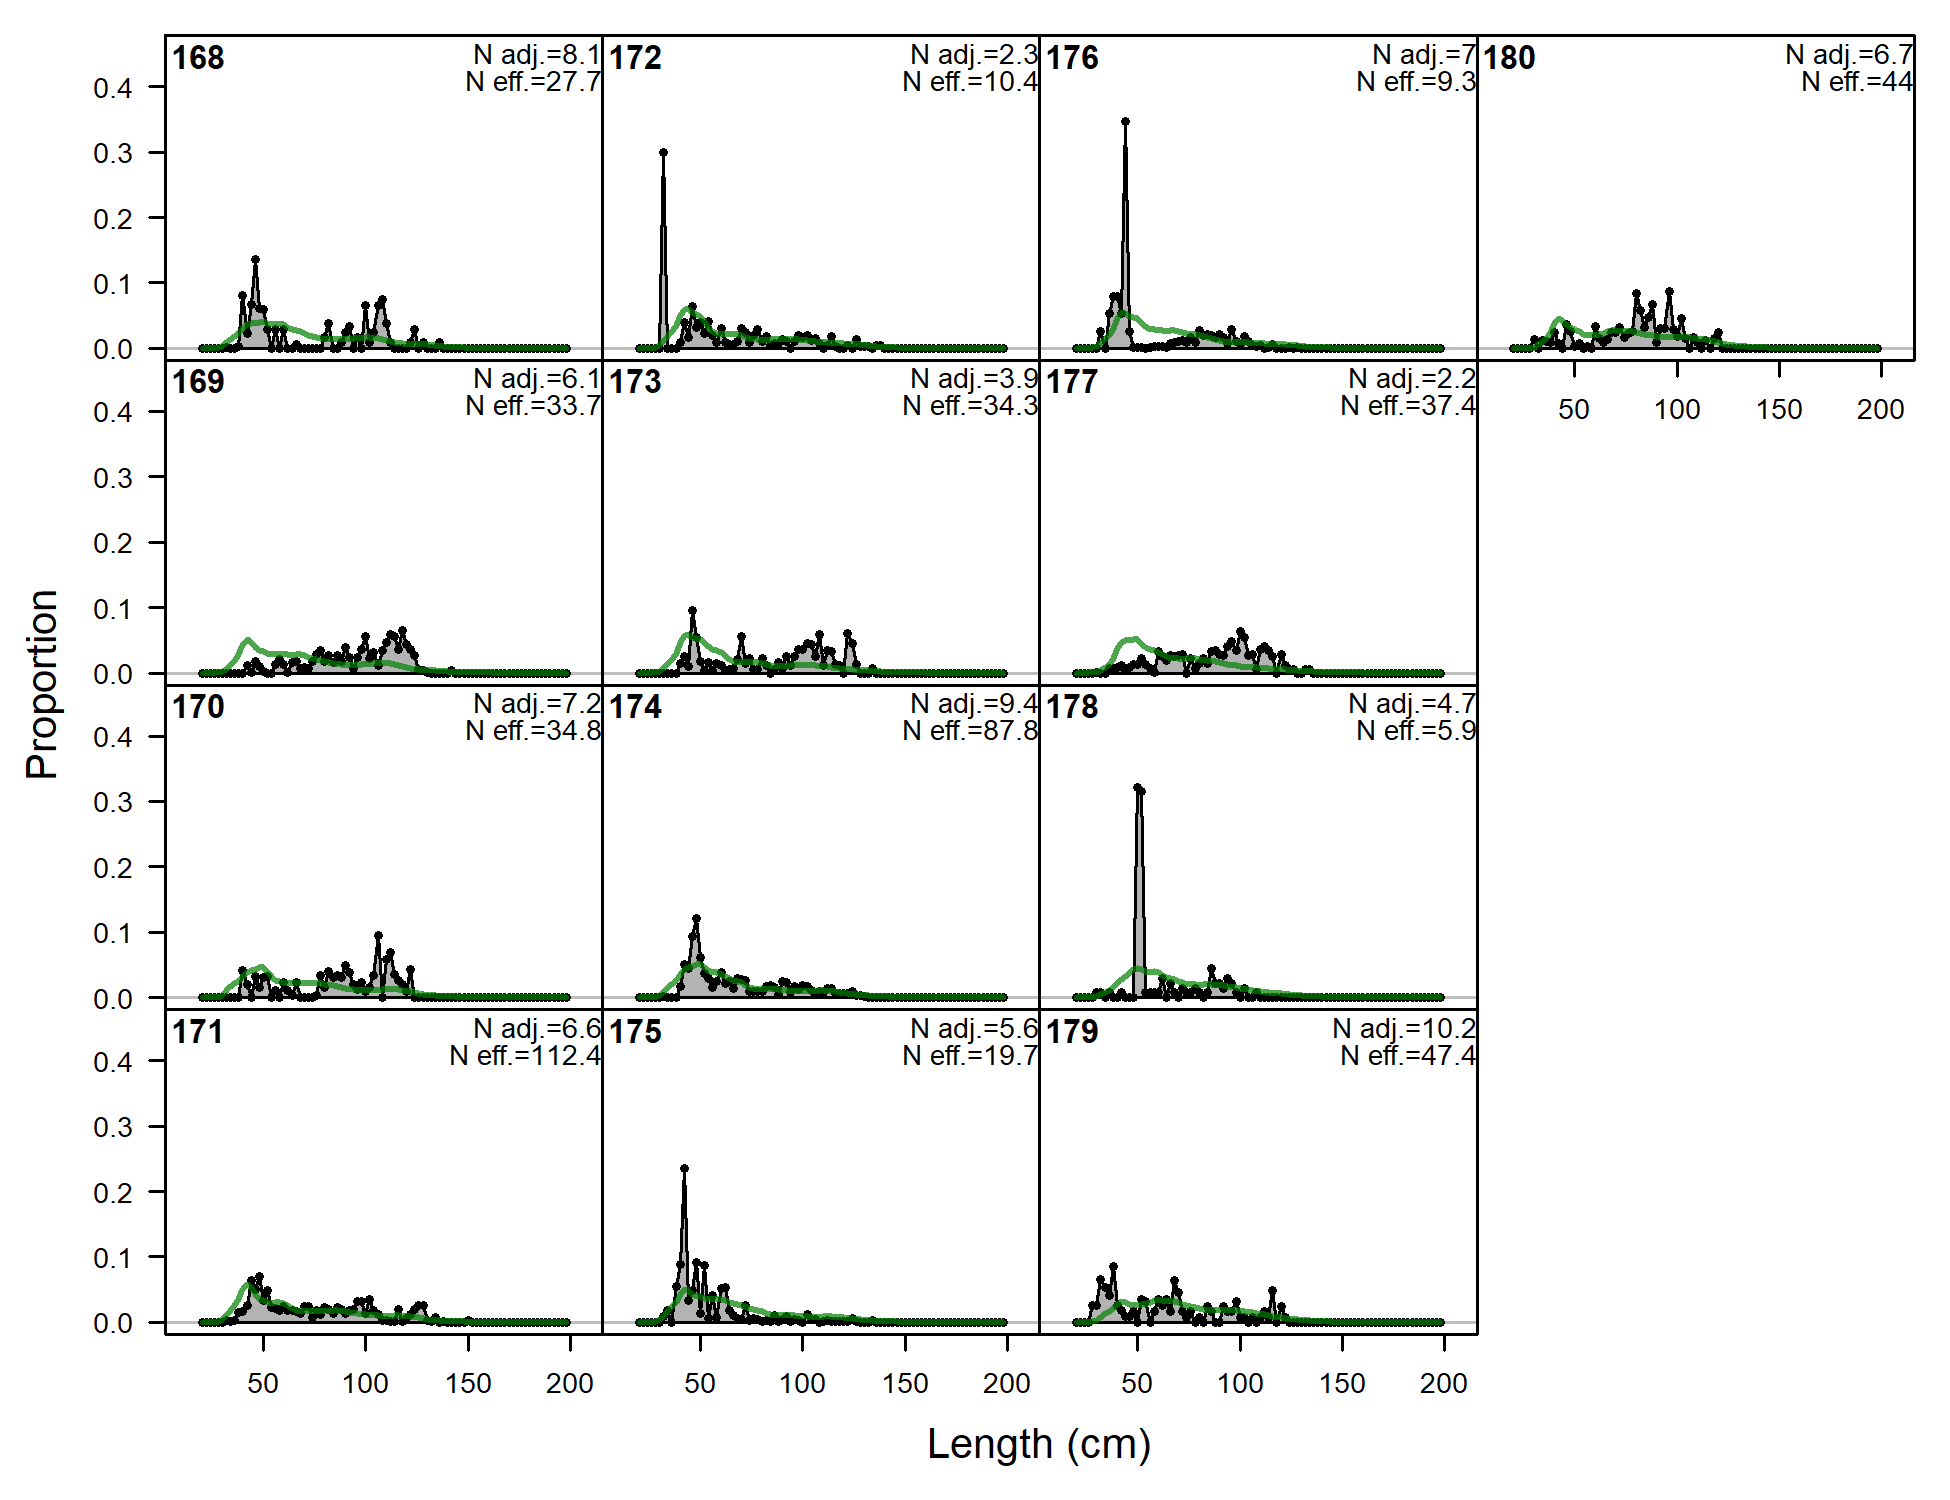
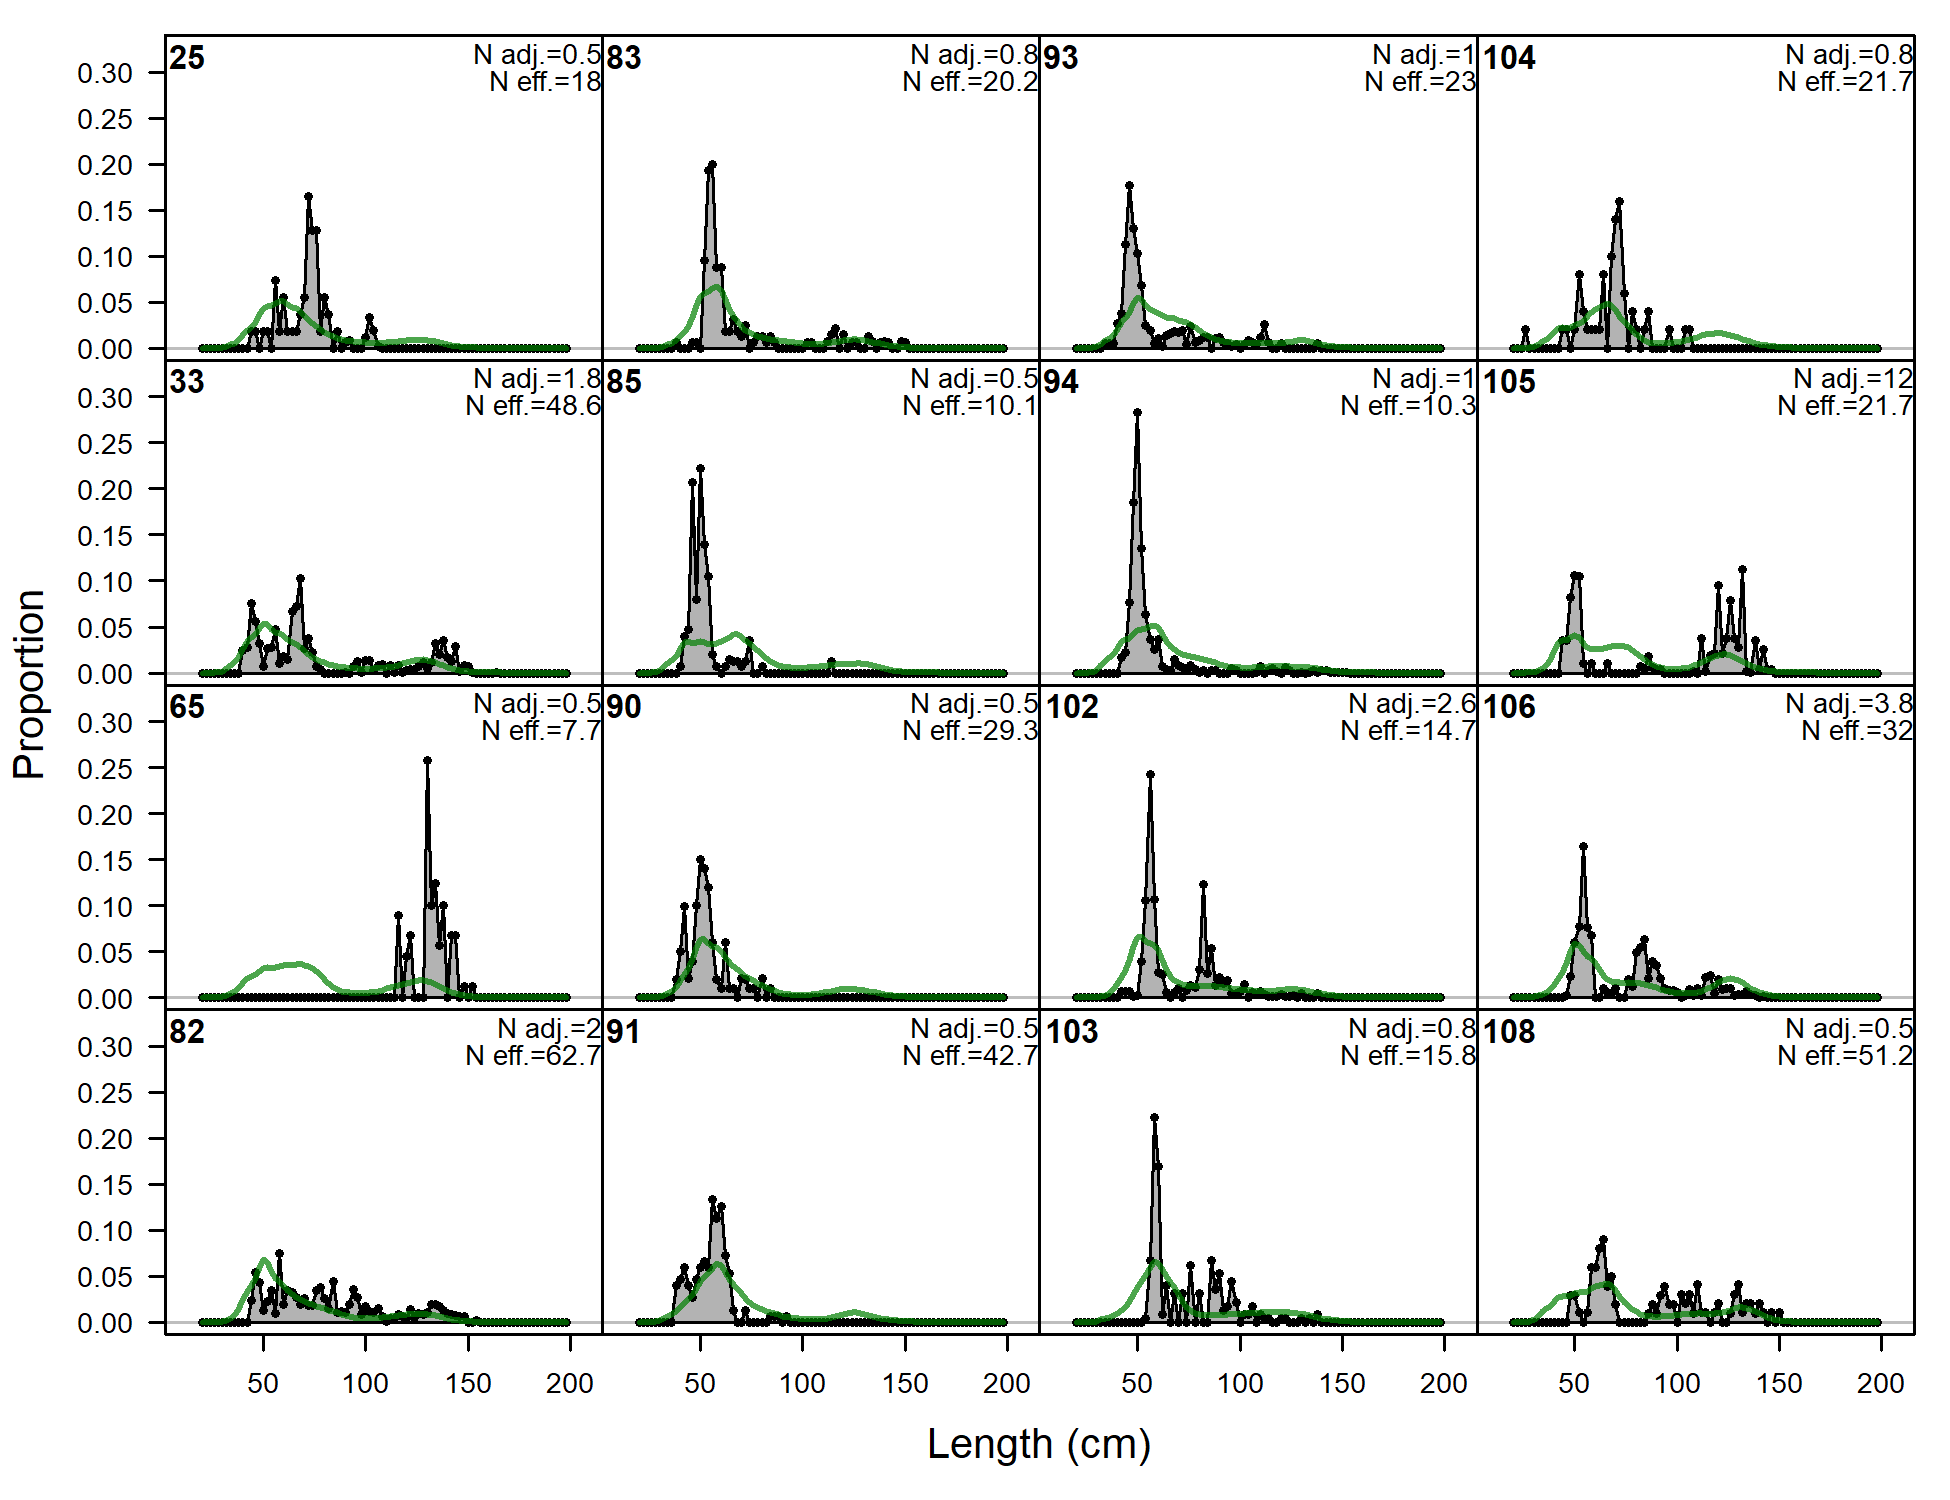
Length comps, whole catch, A3-OBJ (plot 1 of 8).
'N adj.' is the input sample size after data-weighting adjustment. N eff. is the calculated effective sample size used in the McAllister-Iannelli tuning method.
file: comp_lenfit_flt14mkt0_page1.png
Length comps, whole catch, A3-OBJ (plot 2 of 8)
file: comp_lenfit_flt14mkt0_page2.png
Length comps, whole catch, A3-OBJ (plot 3 of 8)
file: comp_lenfit_flt14mkt0_page3.png
Length comps, whole catch, A3-OBJ (plot 4 of 8)
file: comp_lenfit_flt14mkt0_page4.png
Length comps, whole catch, A3-OBJ (plot 5 of 8)
file: comp_lenfit_flt14mkt0_page5.png
Length comps, whole catch, A3-OBJ (plot 6 of 8)
file: comp_lenfit_flt14mkt0_page6.png
Length comps, whole catch, A3-OBJ (plot 7 of 8)
file: comp_lenfit_flt14mkt0_page7.png
Length comps, whole catch, A3-OBJ (plot 8 of 8)
file: comp_lenfit_flt14mkt0_page8.png
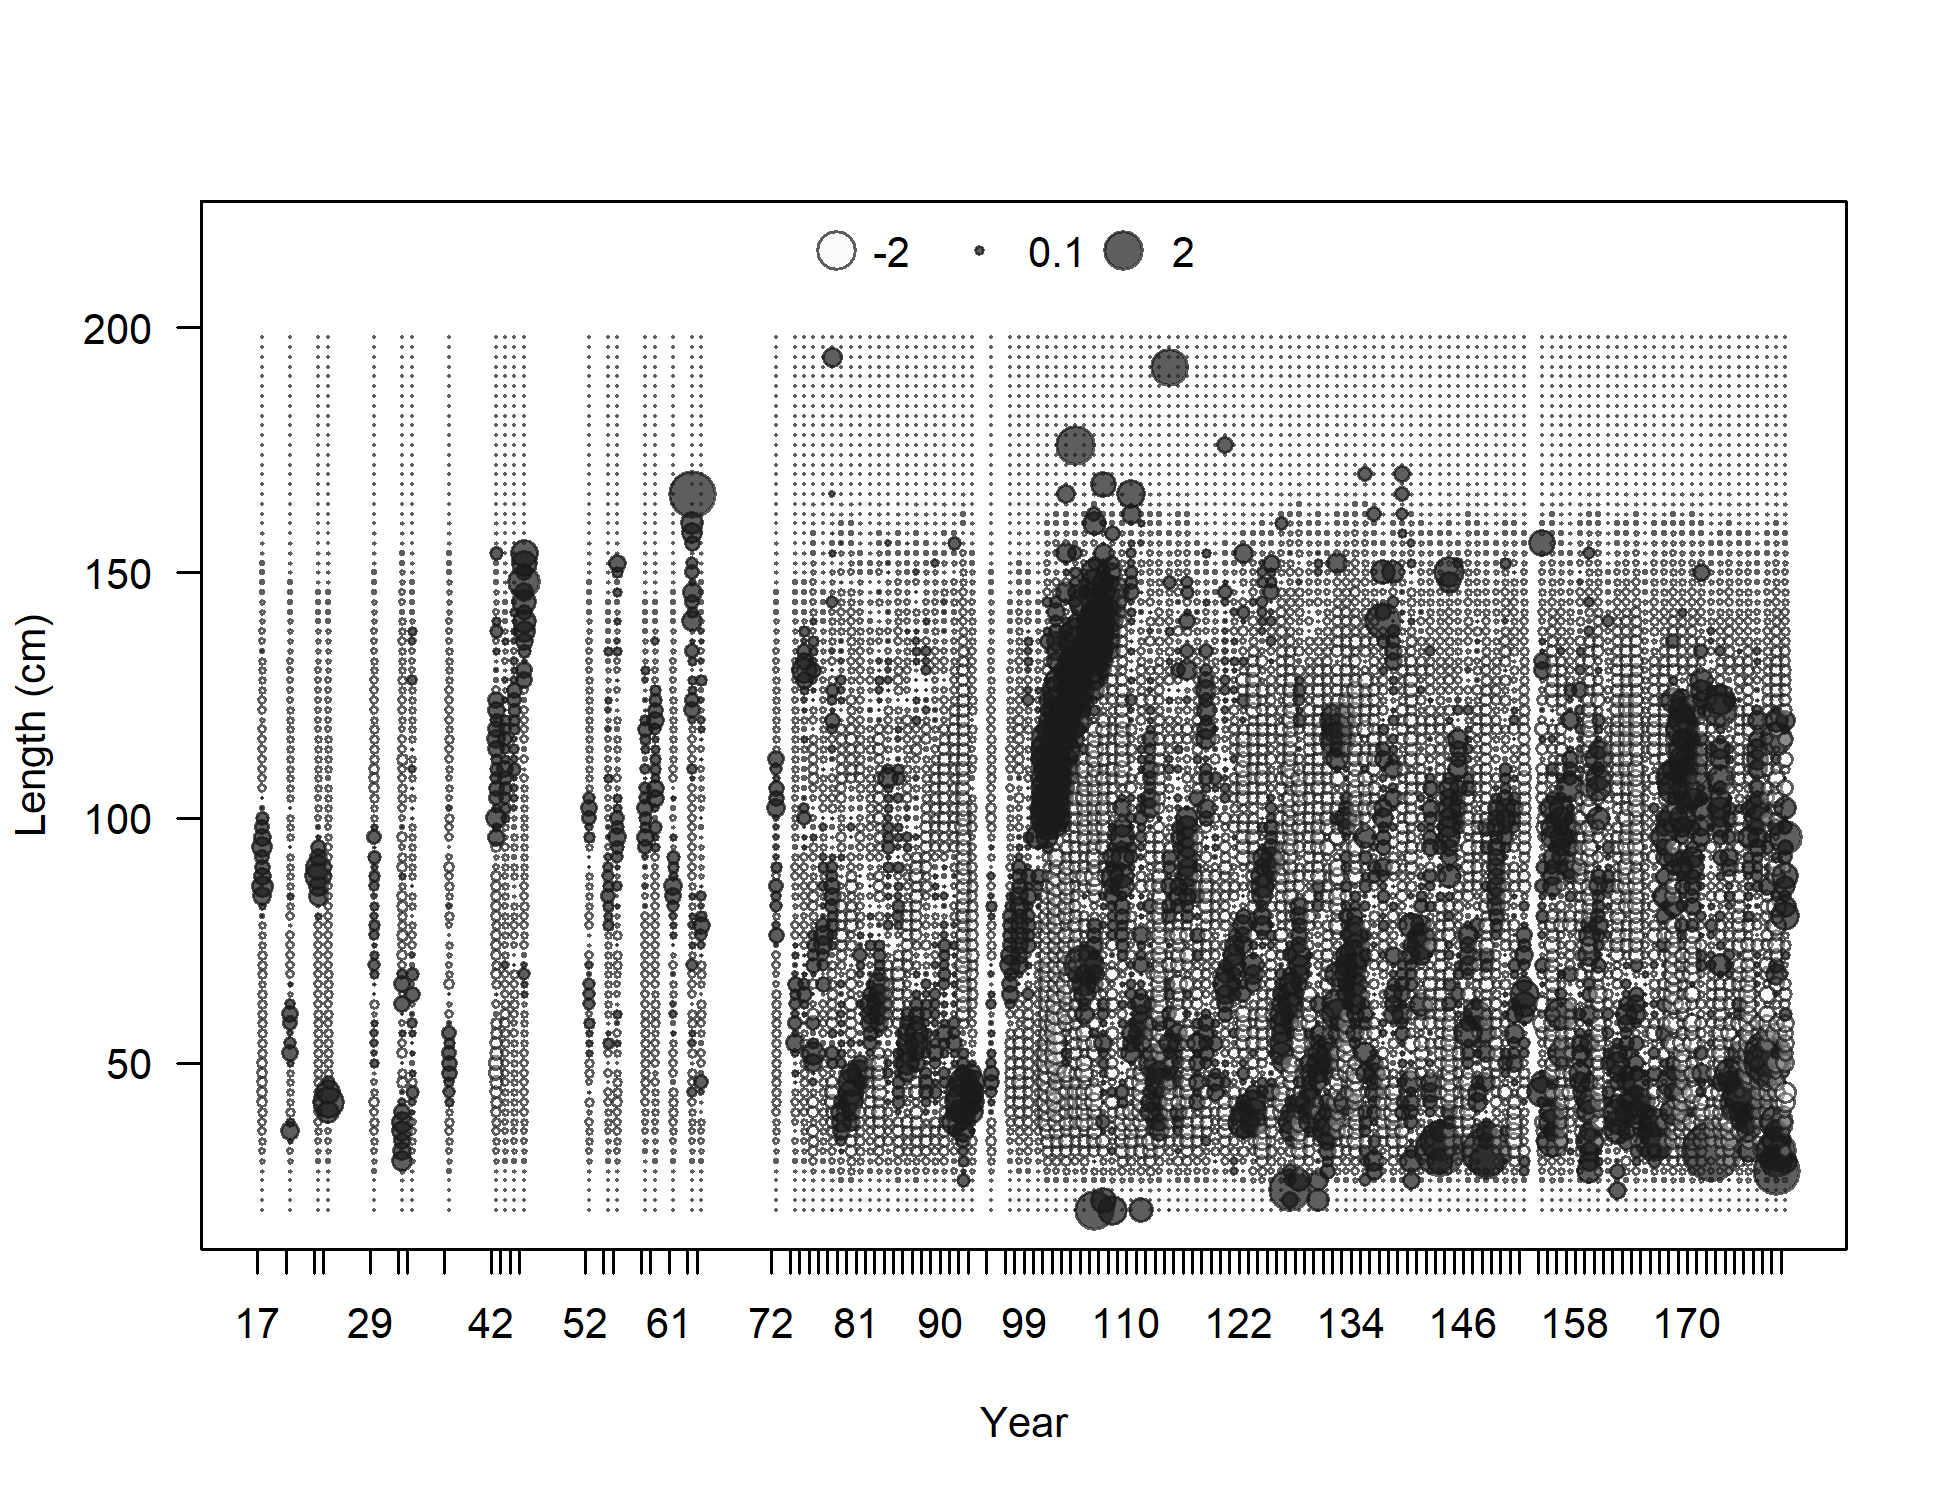
Pearson residuals, whole catch, A3-OBJ (max=4.49) (plot 8 of 8)
Closed bubbles are positive residuals (observed > expected) and open bubbles are negative residuals (observed < expected).
file: comp_lenfit_residsflt14mkt0_page8.png
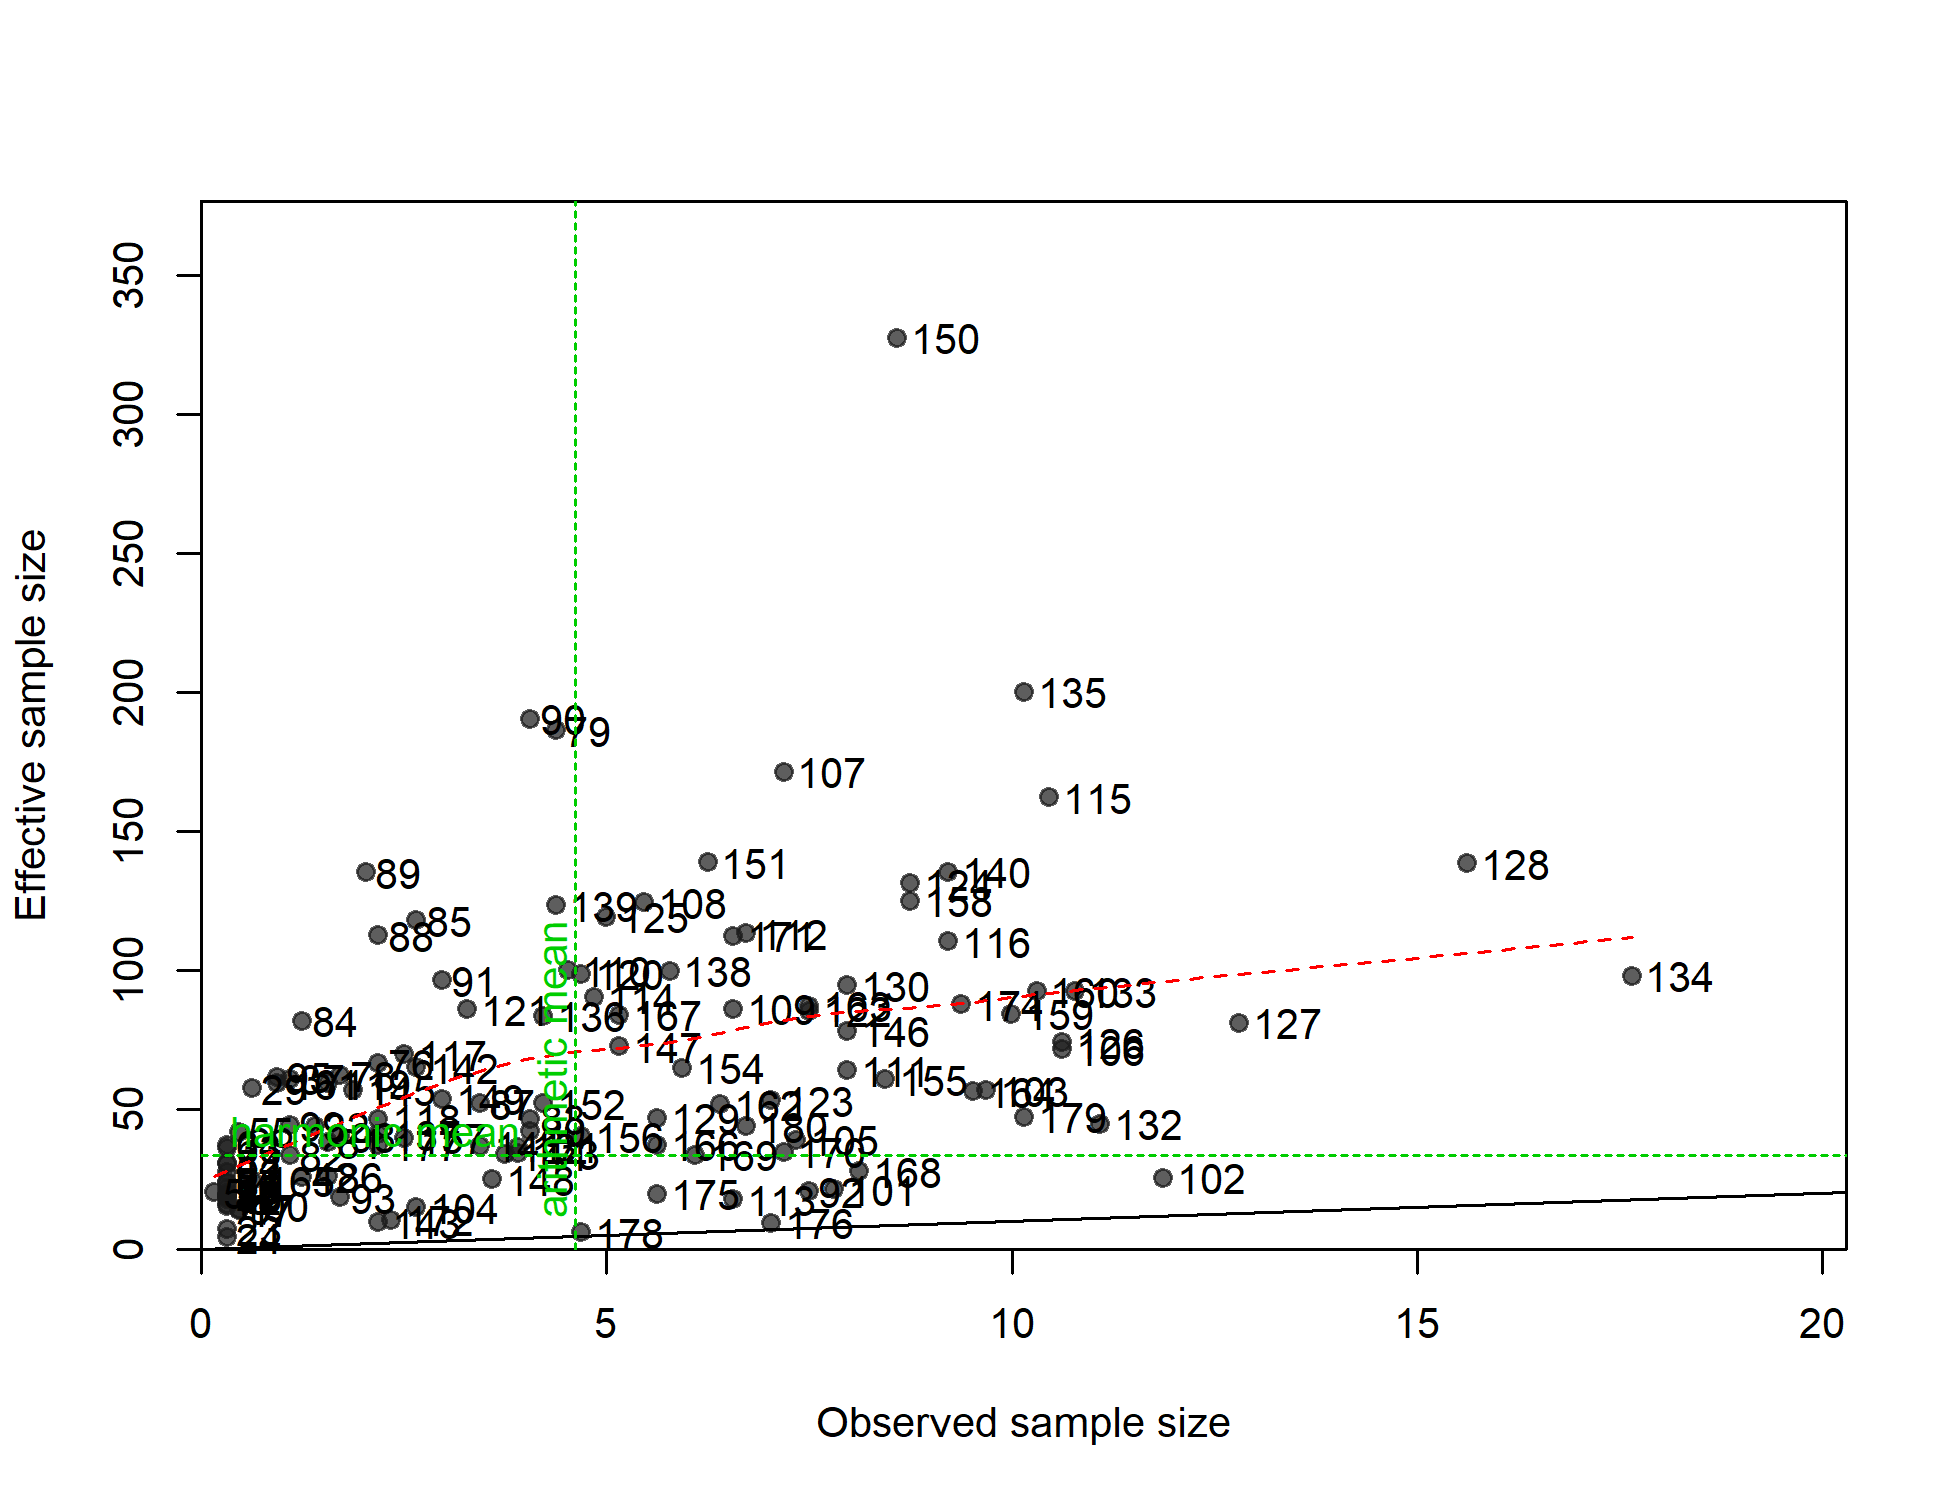
N-EffN comparison, Length comps, whole catch, A3-OBJ
file: comp_lenfit_sampsize_flt14mkt0.png
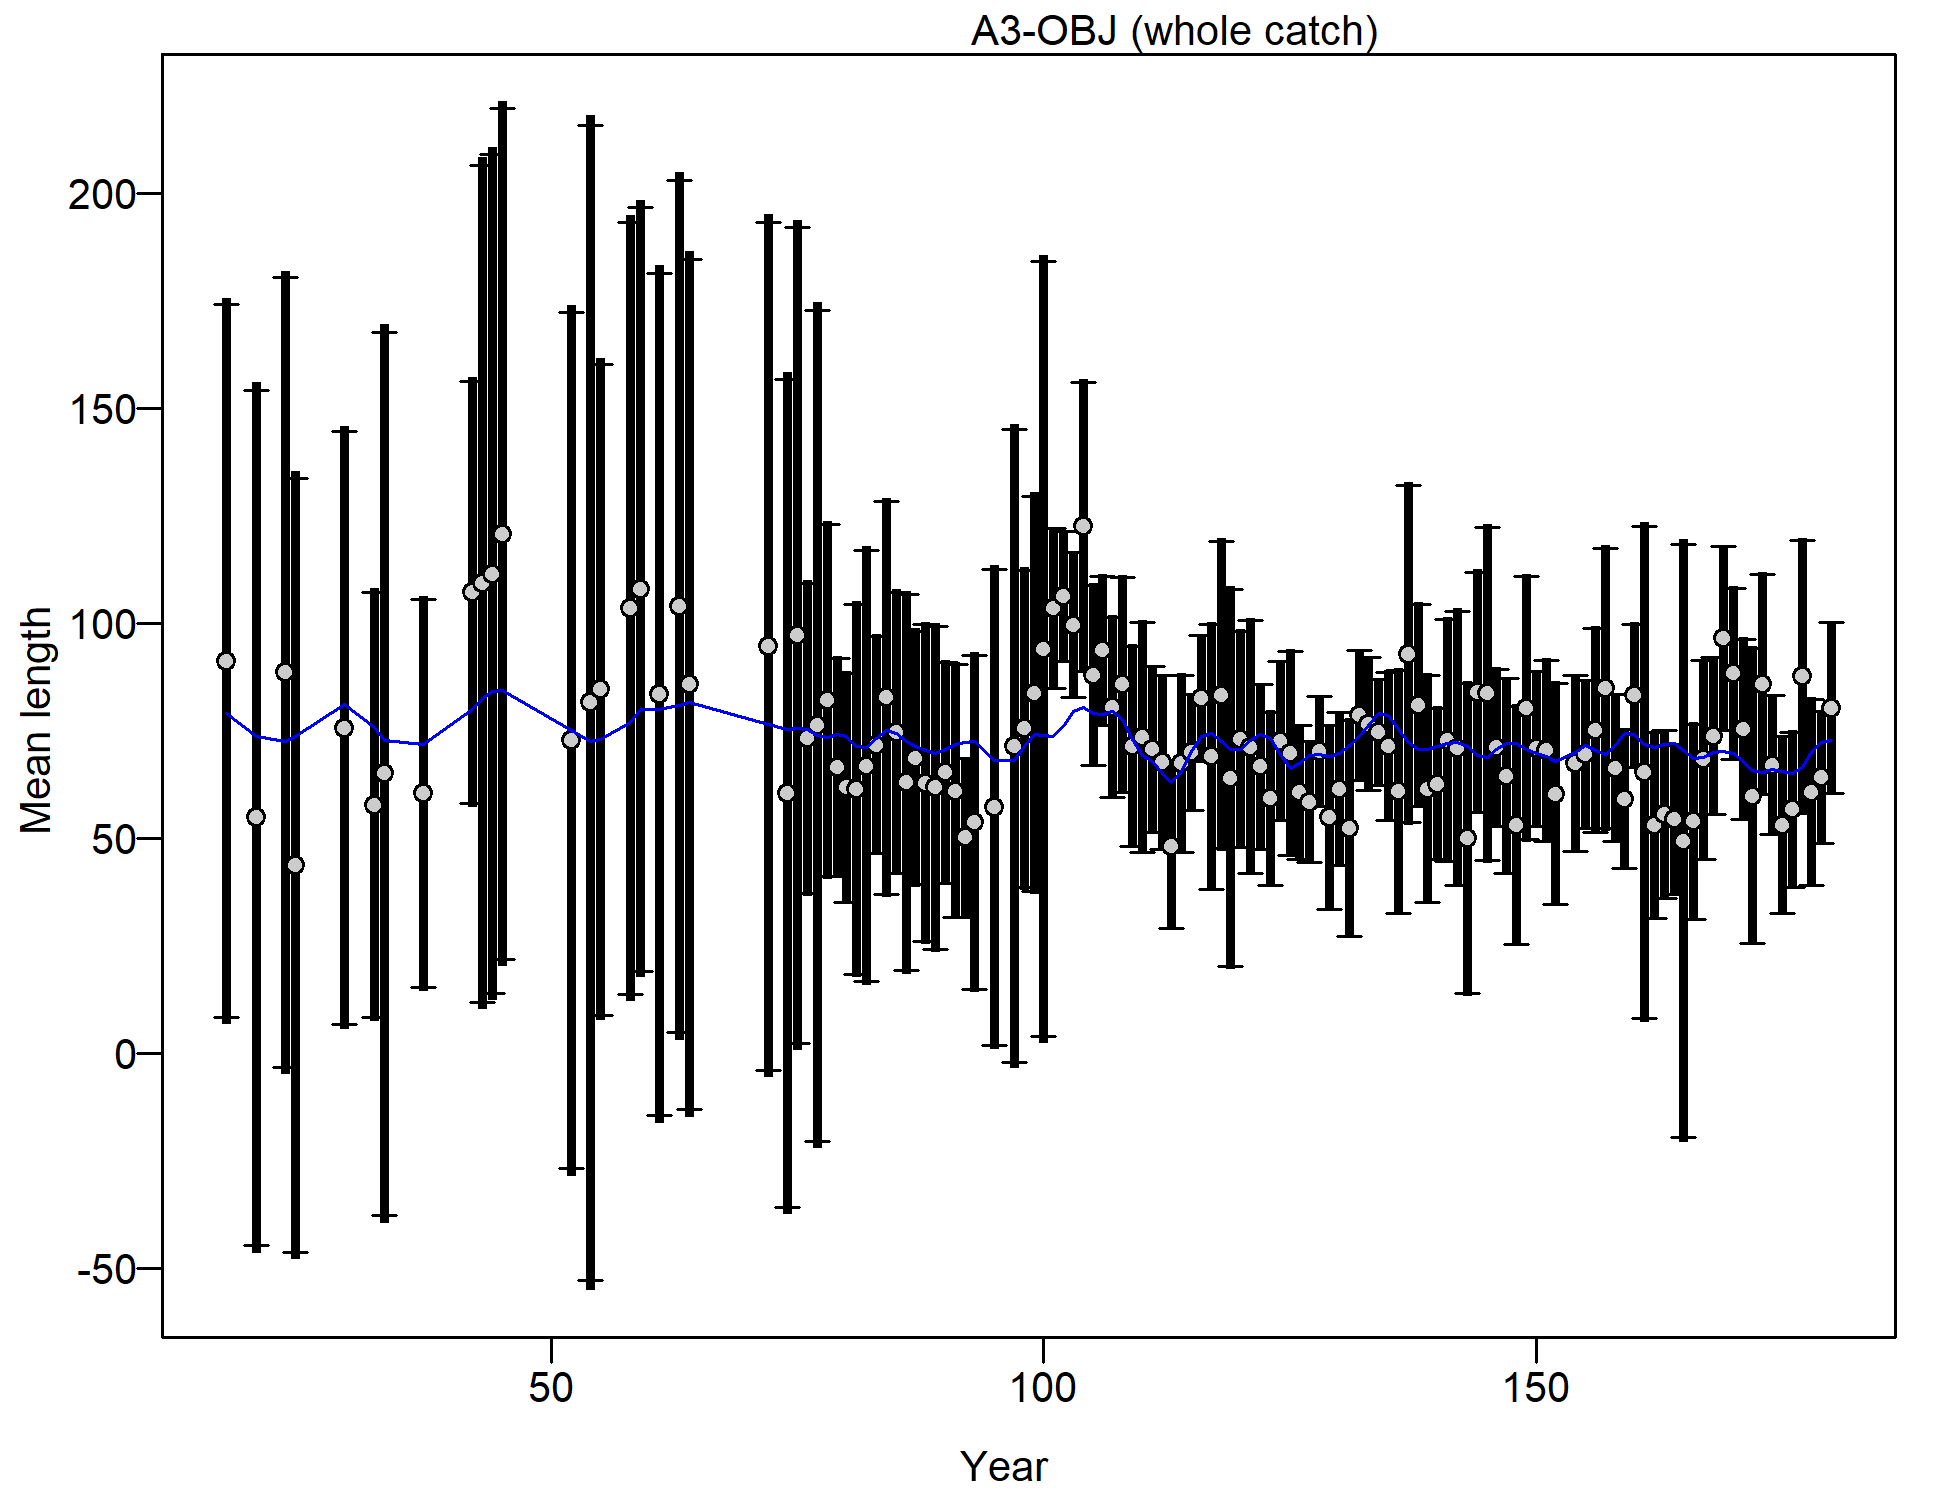
Mean length for A3-OBJ with 95% confidence intervals based on current samples sizes.
Francis data weighting method TA1.8: thinner intervals (with capped ends) show result of further adjusting sample sizes based on suggested multiplier (with 95% interval) for len data from A3-OBJ:
1.0348 (0.737-1.5273)
For more info, see
Francis, R.I.C.C. (2011). Data weighting in statistical fisheries stock assessment models. Can. J. Fish. Aquat. Sci. 68: 1124-1138. https://doi.org/10.1139/f2011-025
Length comps, whole catch, A4-OBJ.
'N adj.' is the input sample size after data-weighting adjustment. N eff. is the calculated effective sample size used in the McAllister-Iannelli tuning method.
file: comp_lenfit_flt15mkt0.png

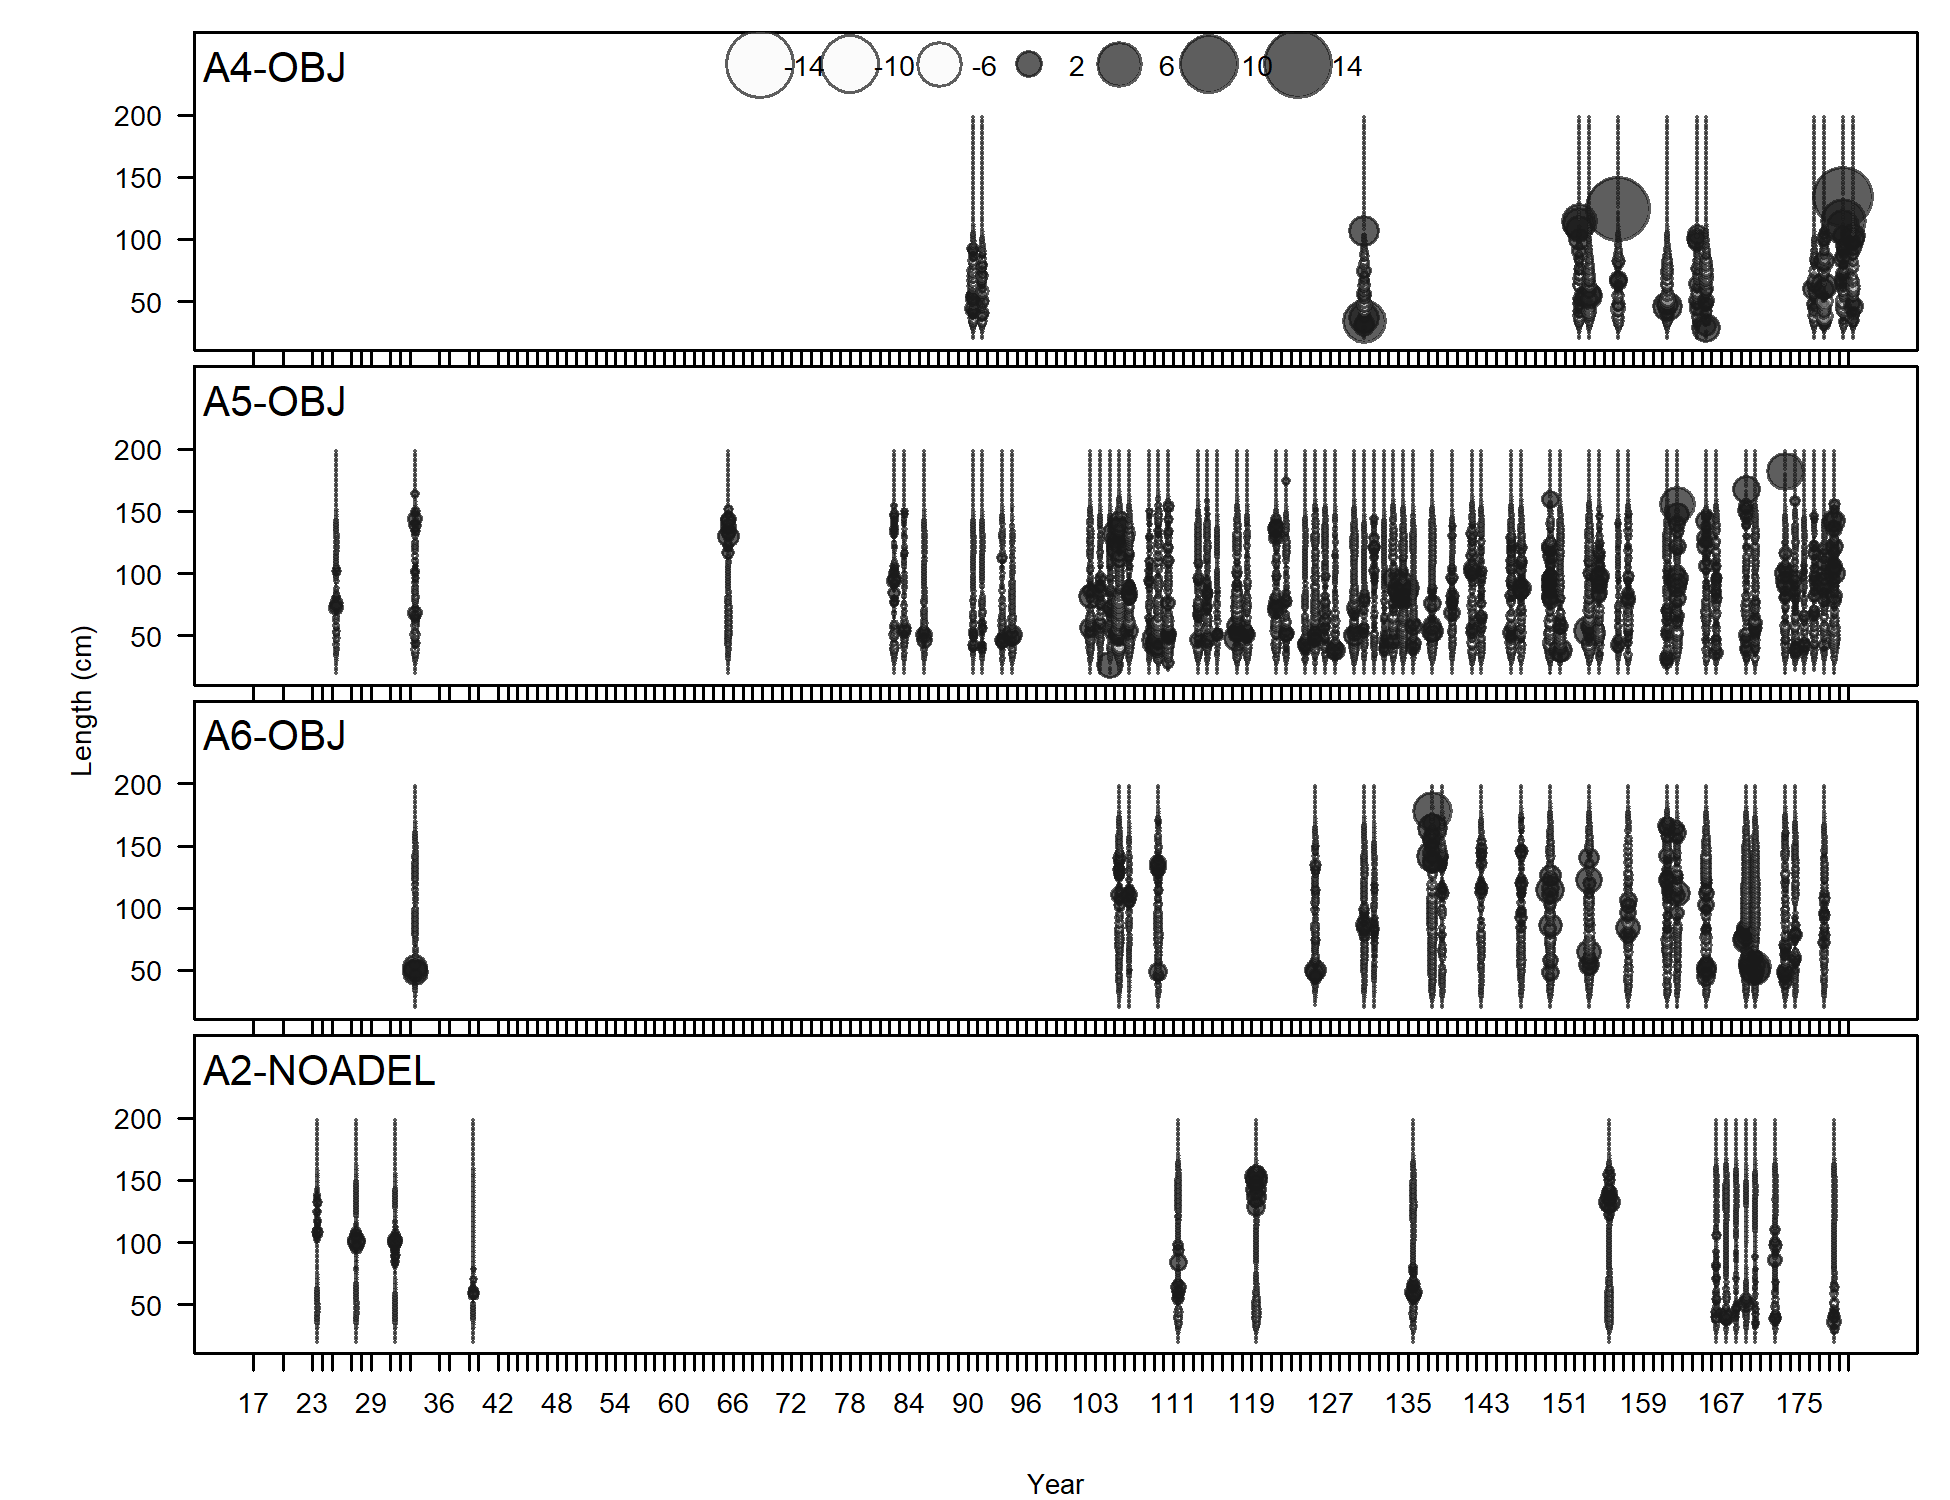
Pearson residuals, whole catch, A4-OBJ (max=12.23)
Closed bubbles are positive residuals (observed > expected) and open bubbles are negative residuals (observed < expected).
file: comp_lenfit_residsflt15mkt0.png
N-EffN comparison, Length comps, whole catch, A4-OBJ
file: comp_lenfit_sampsize_flt15mkt0.png
Mean length for A4-OBJ with 95% confidence intervals based on current samples sizes.
Francis data weighting method TA1.8: thinner intervals (with capped ends) show result of further adjusting sample sizes based on suggested multiplier (with 95% interval) for len data from A4-OBJ:
0.9349 (0.5626-2.538)
For more info, see
Francis, R.I.C.C. (2011). Data weighting in statistical fisheries stock assessment models. Can. J. Fish. Aquat. Sci. 68: 1124-1138. https://doi.org/10.1139/f2011-025
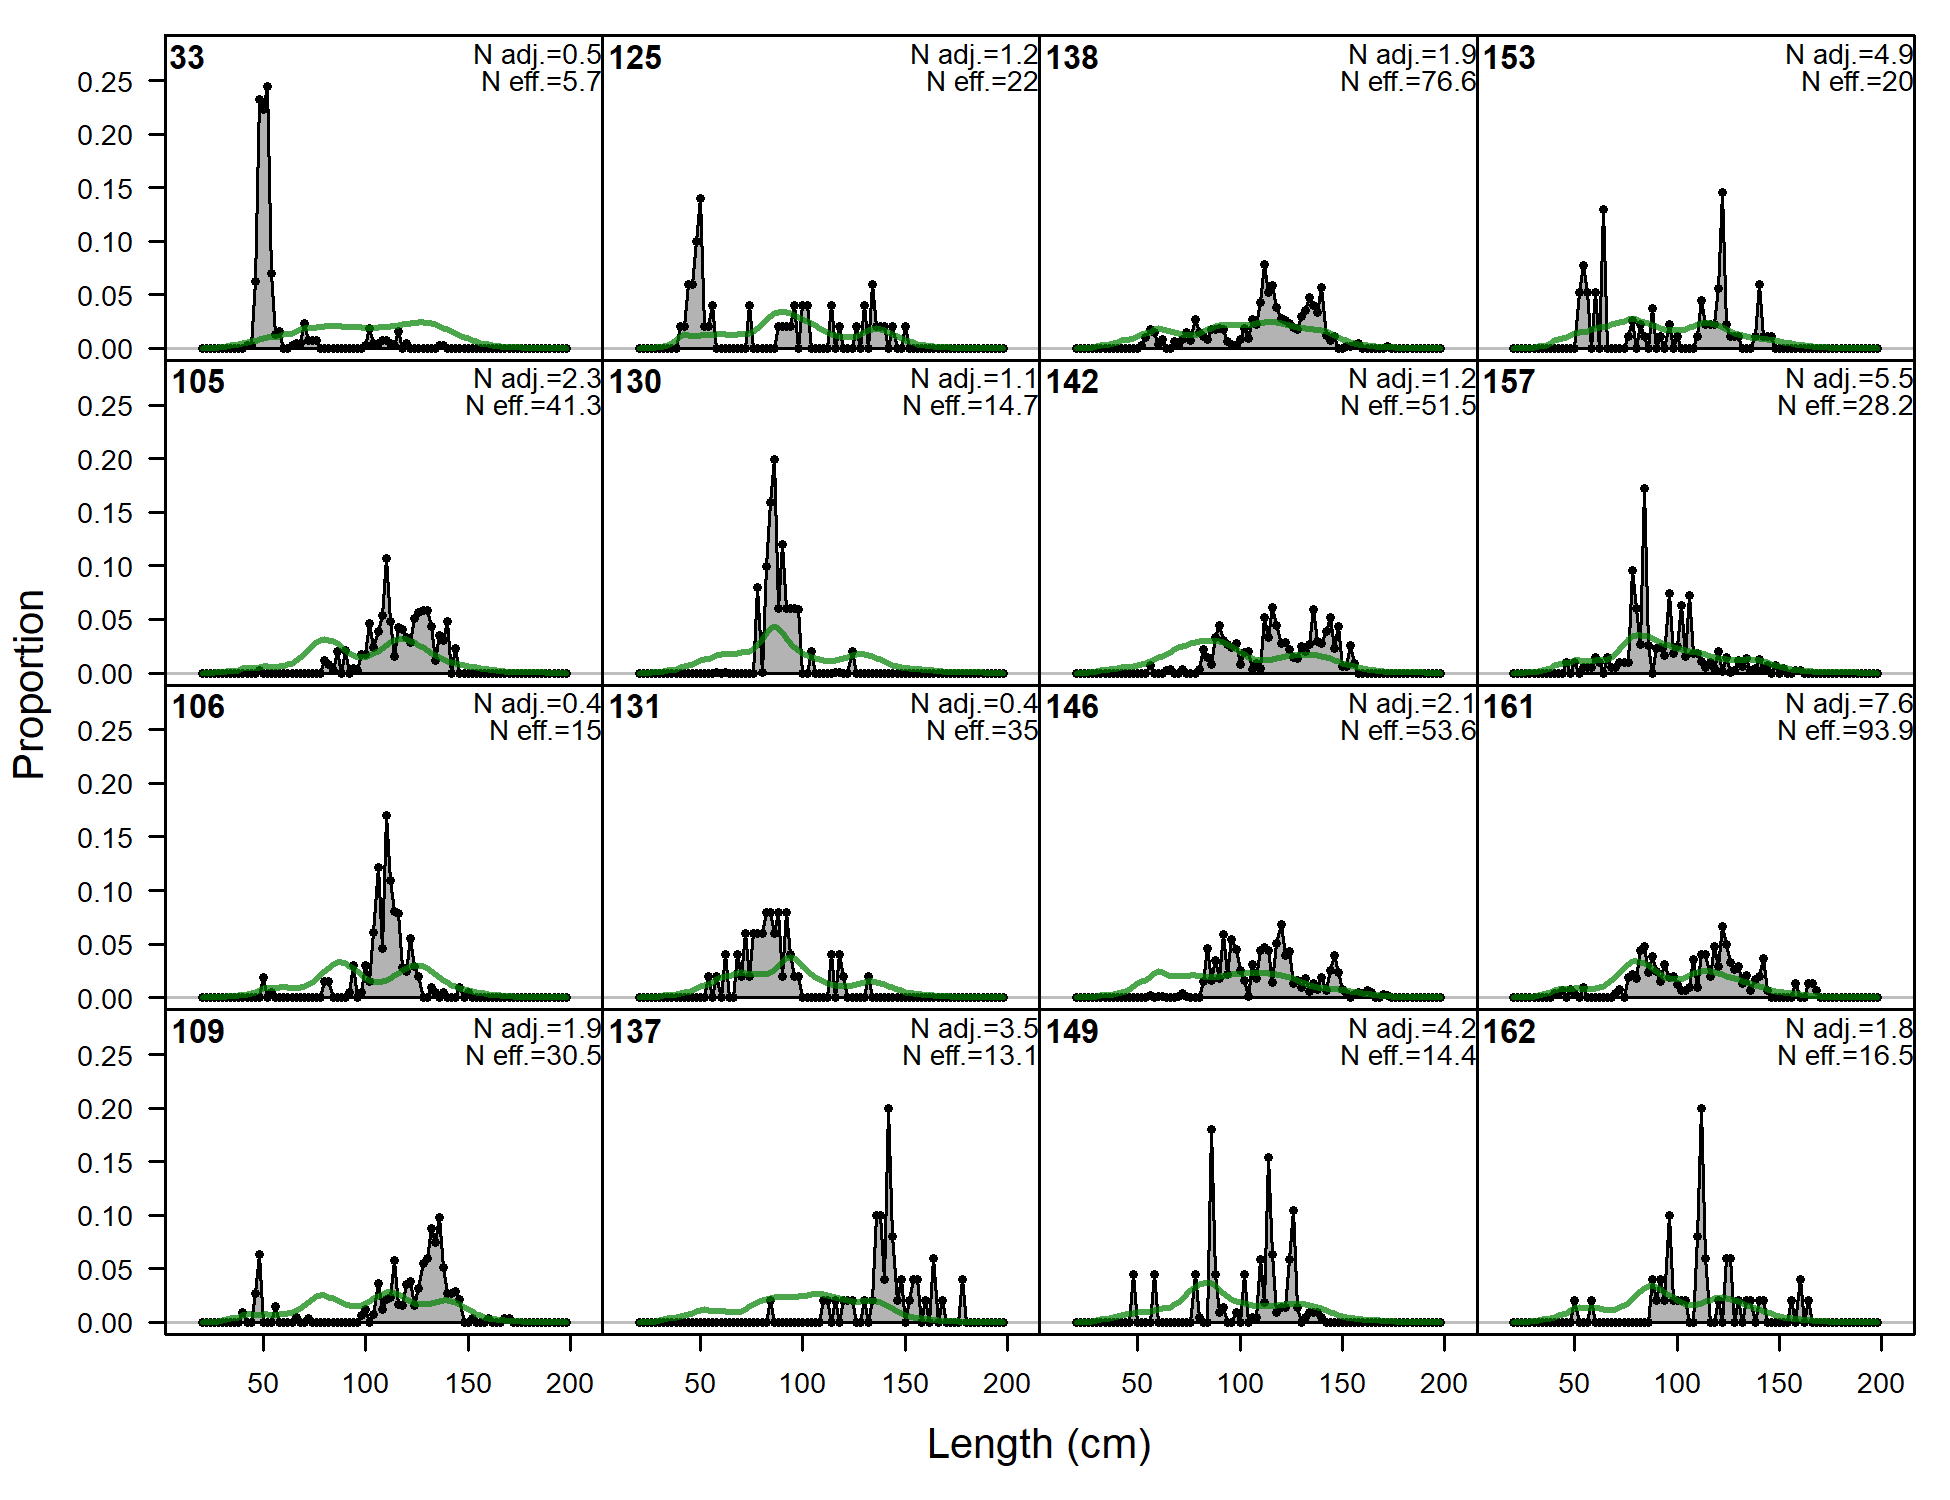
Length comps, whole catch, A5-OBJ (plot 1 of 4).
'N adj.' is the input sample size after data-weighting adjustment. N eff. is the calculated effective sample size used in the McAllister-Iannelli tuning method.
file: comp_lenfit_flt16mkt0_page1.png
Length comps, whole catch, A5-OBJ (plot 2 of 4)
file: comp_lenfit_flt16mkt0_page2.png
Length comps, whole catch, A5-OBJ (plot 3 of 4)
file: comp_lenfit_flt16mkt0_page3.png

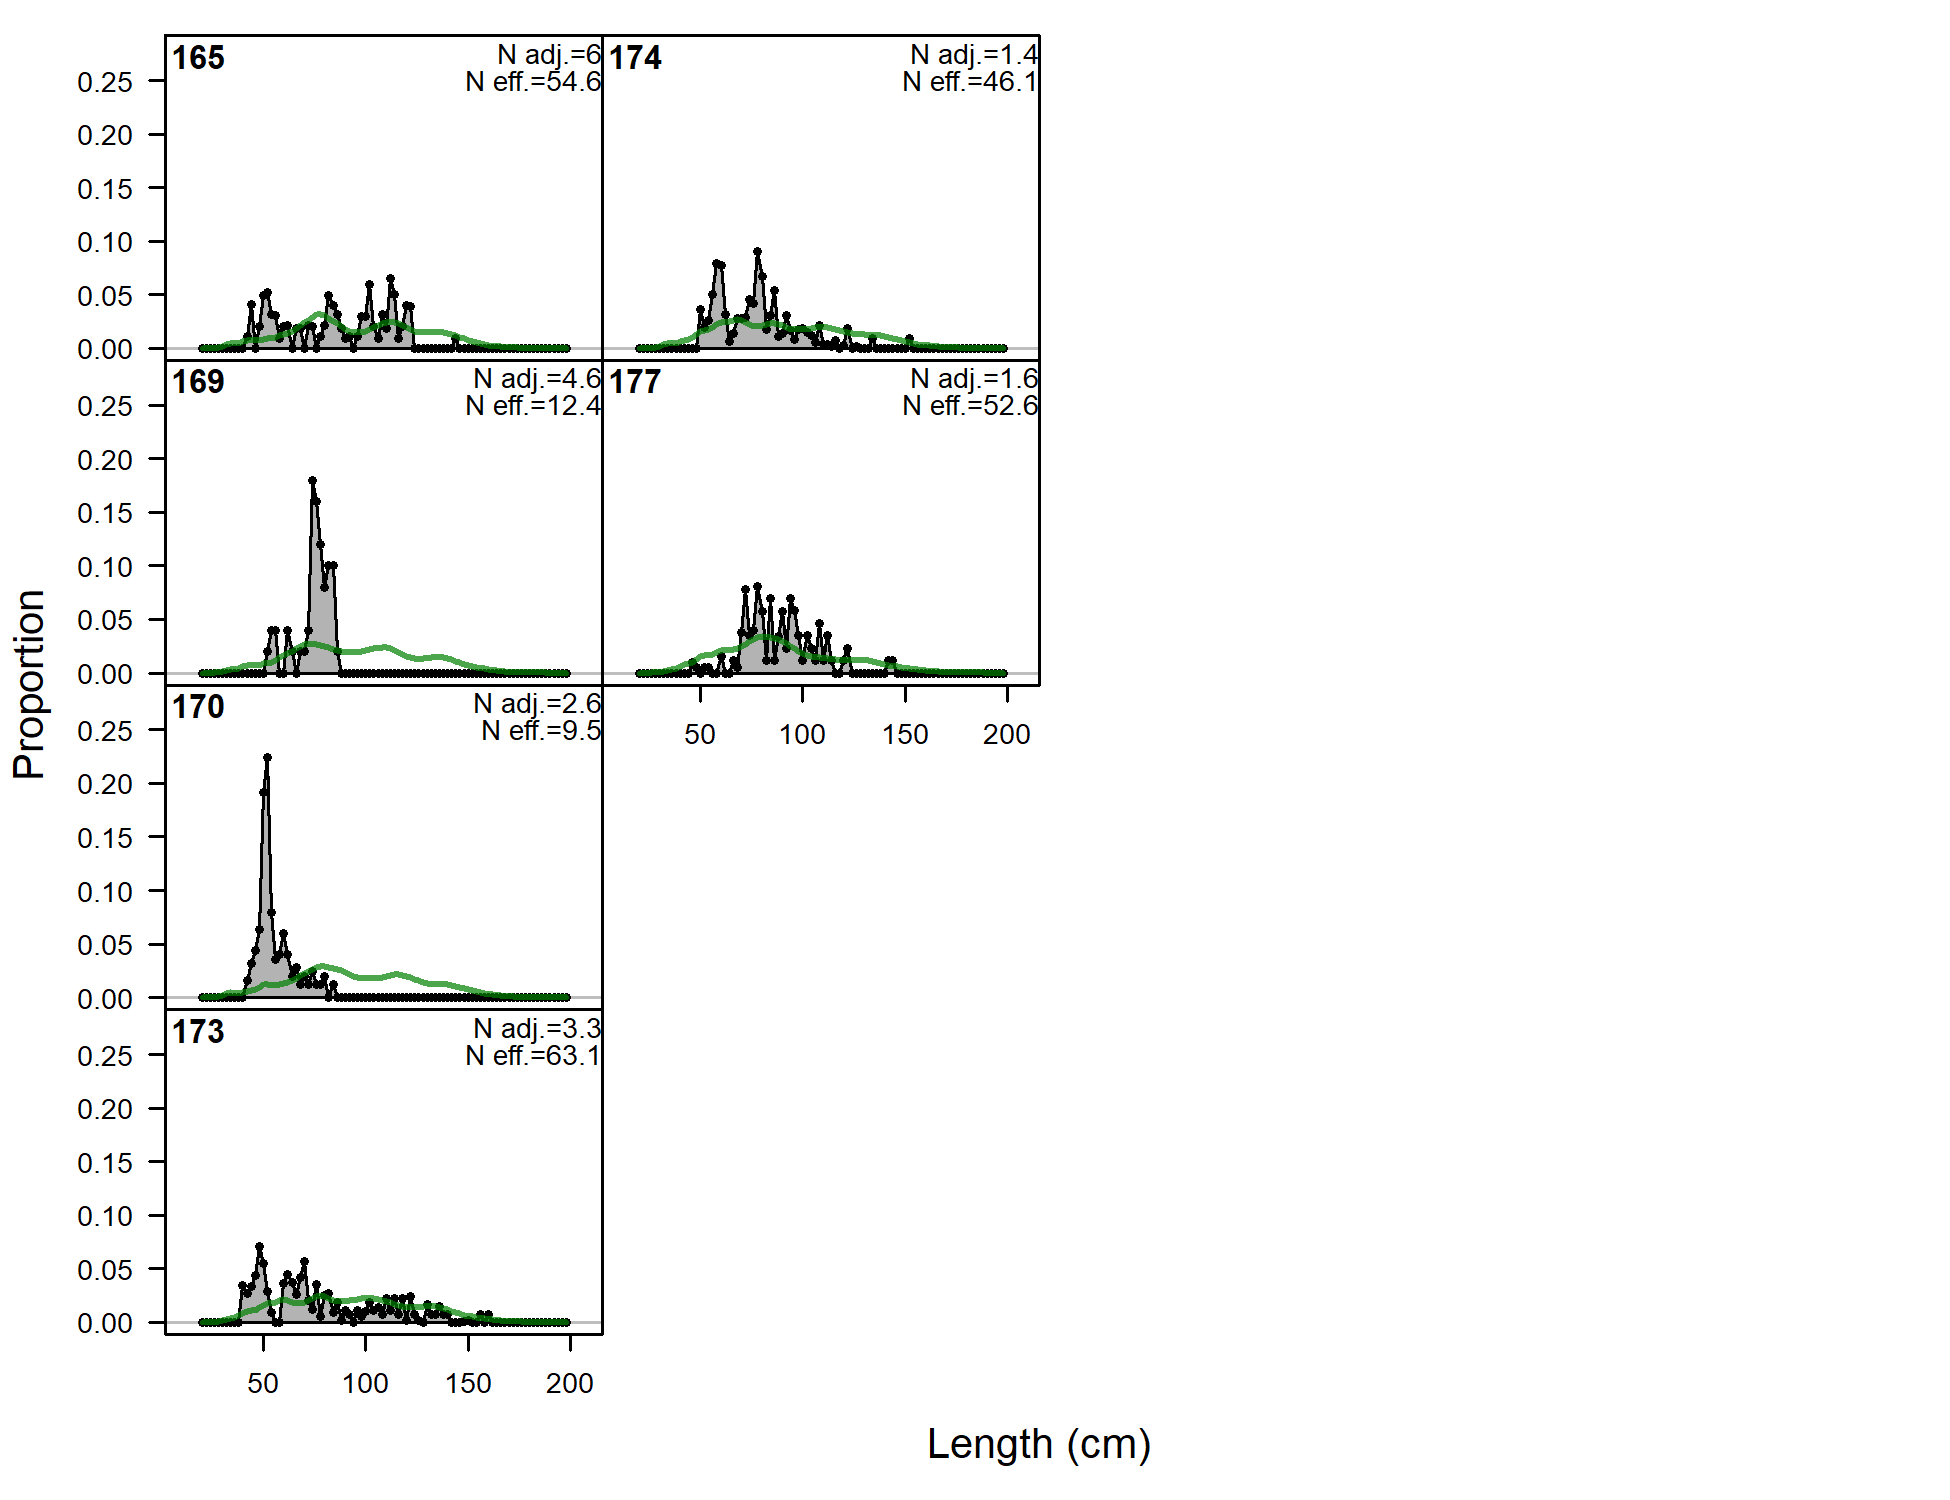
Length comps, whole catch, A5-OBJ (plot 4 of 4)
file: comp_lenfit_flt16mkt0_page4.png
Pearson residuals, whole catch, A5-OBJ (max=4.14) (plot 4 of 4)
Closed bubbles are positive residuals (observed > expected) and open bubbles are negative residuals (observed < expected).
file: comp_lenfit_residsflt16mkt0_page4.png
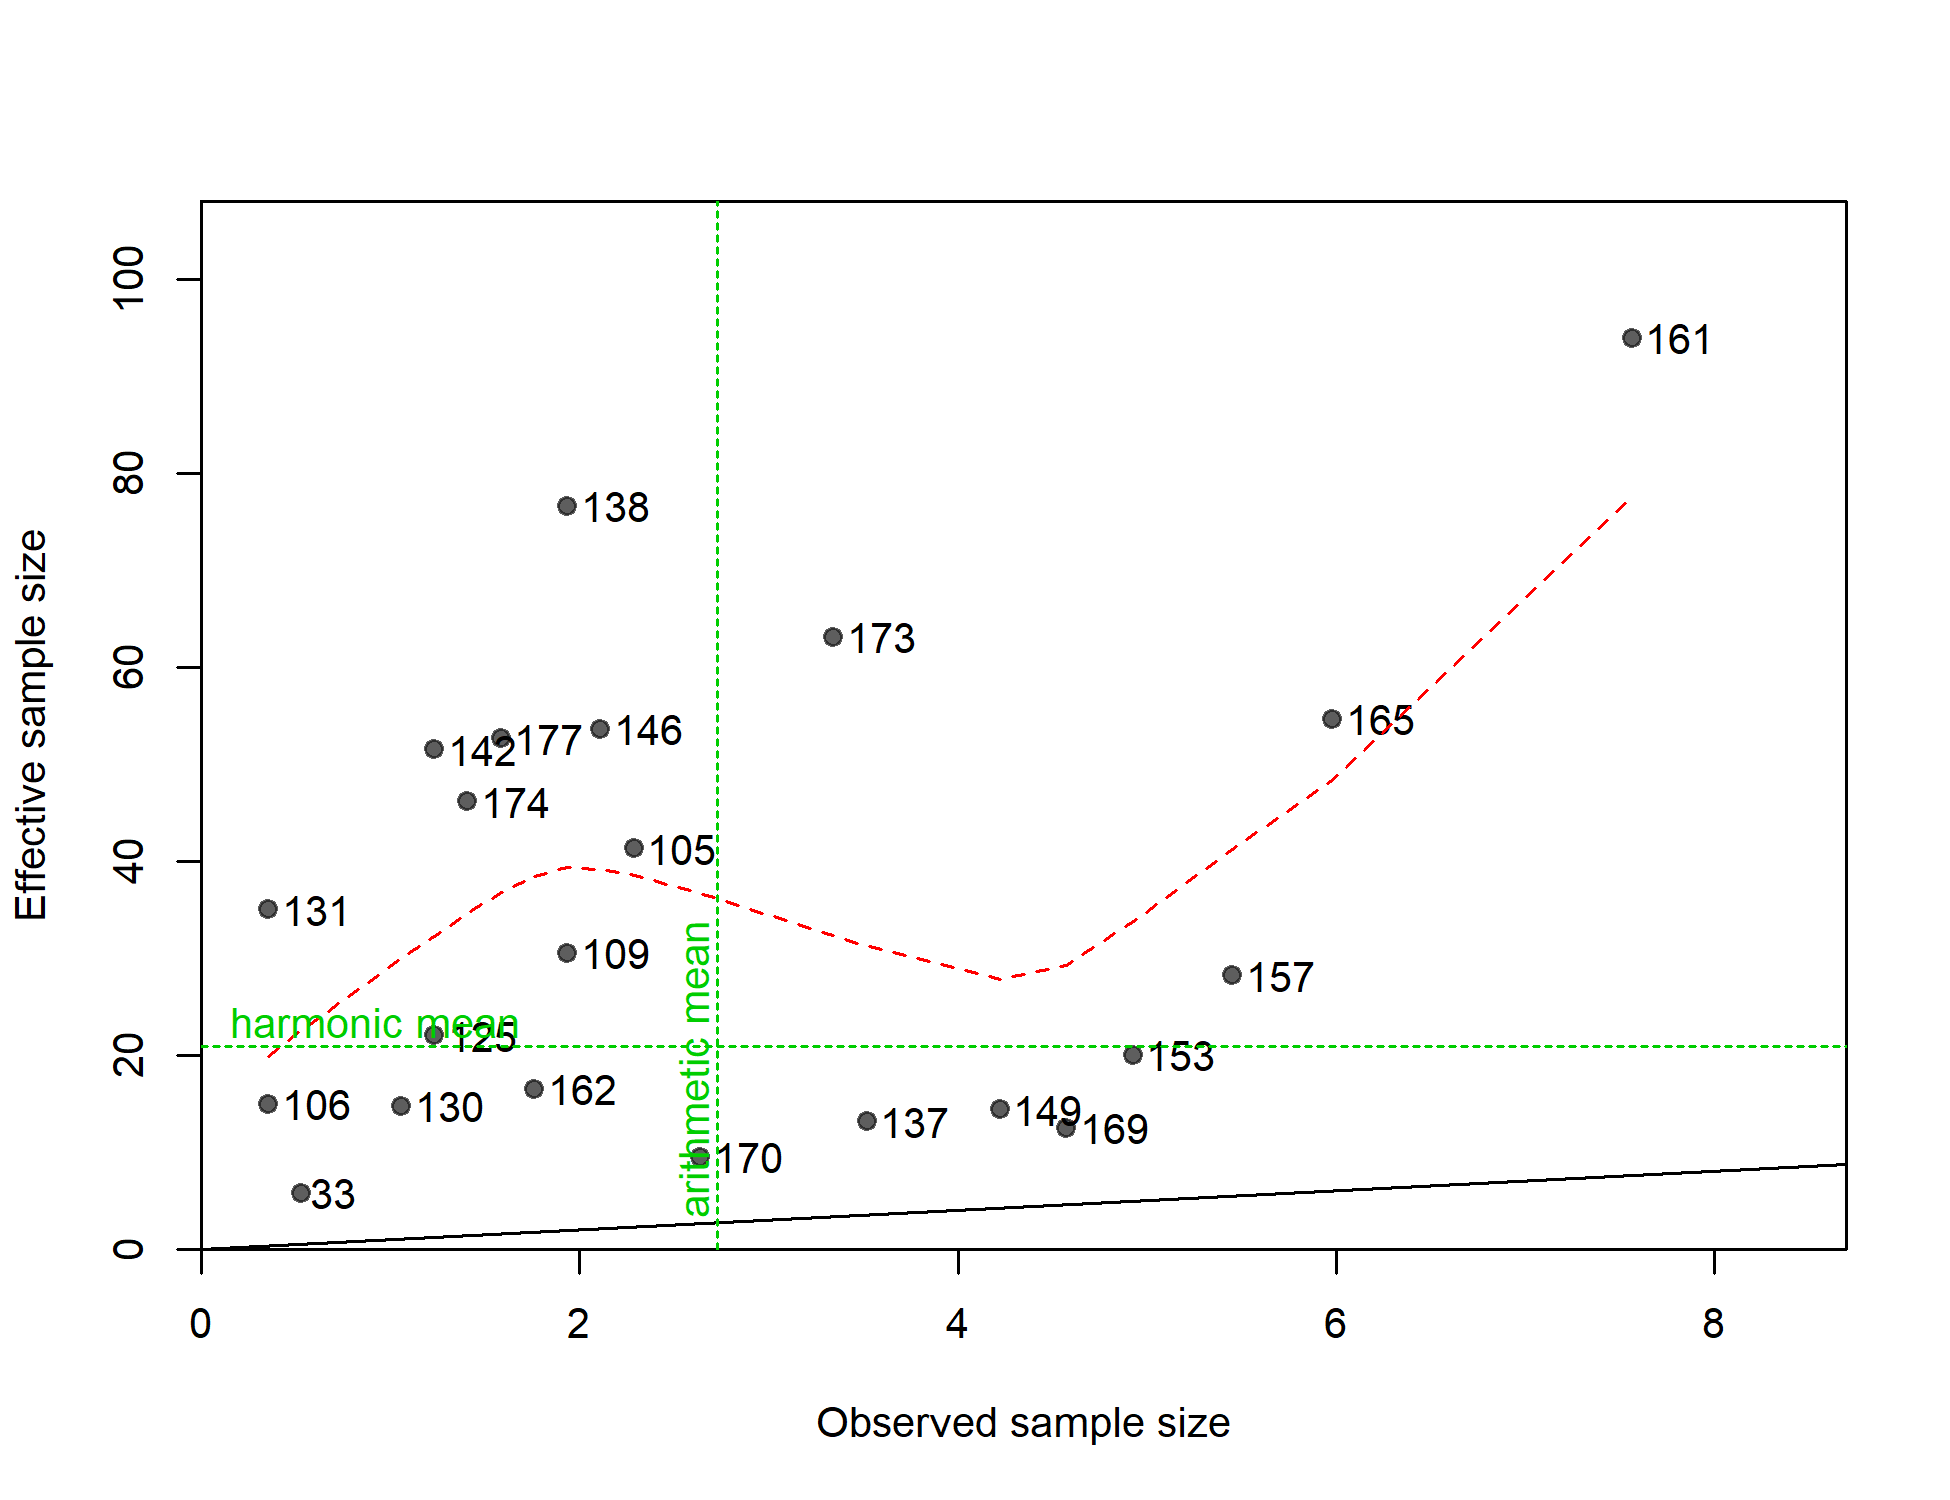
N-EffN comparison, Length comps, whole catch, A5-OBJ
file: comp_lenfit_sampsize_flt16mkt0.png
Mean length for A5-OBJ with 95% confidence intervals based on current samples sizes.
Francis data weighting method TA1.8: thinner intervals (with capped ends) show result of further adjusting sample sizes based on suggested multiplier (with 95% interval) for len data from A5-OBJ:
1.9818 (1.3951-3.3131)
For more info, see
Francis, R.I.C.C. (2011). Data weighting in statistical fisheries stock assessment models. Can. J. Fish. Aquat. Sci. 68: 1124-1138. https://doi.org/10.1139/f2011-025
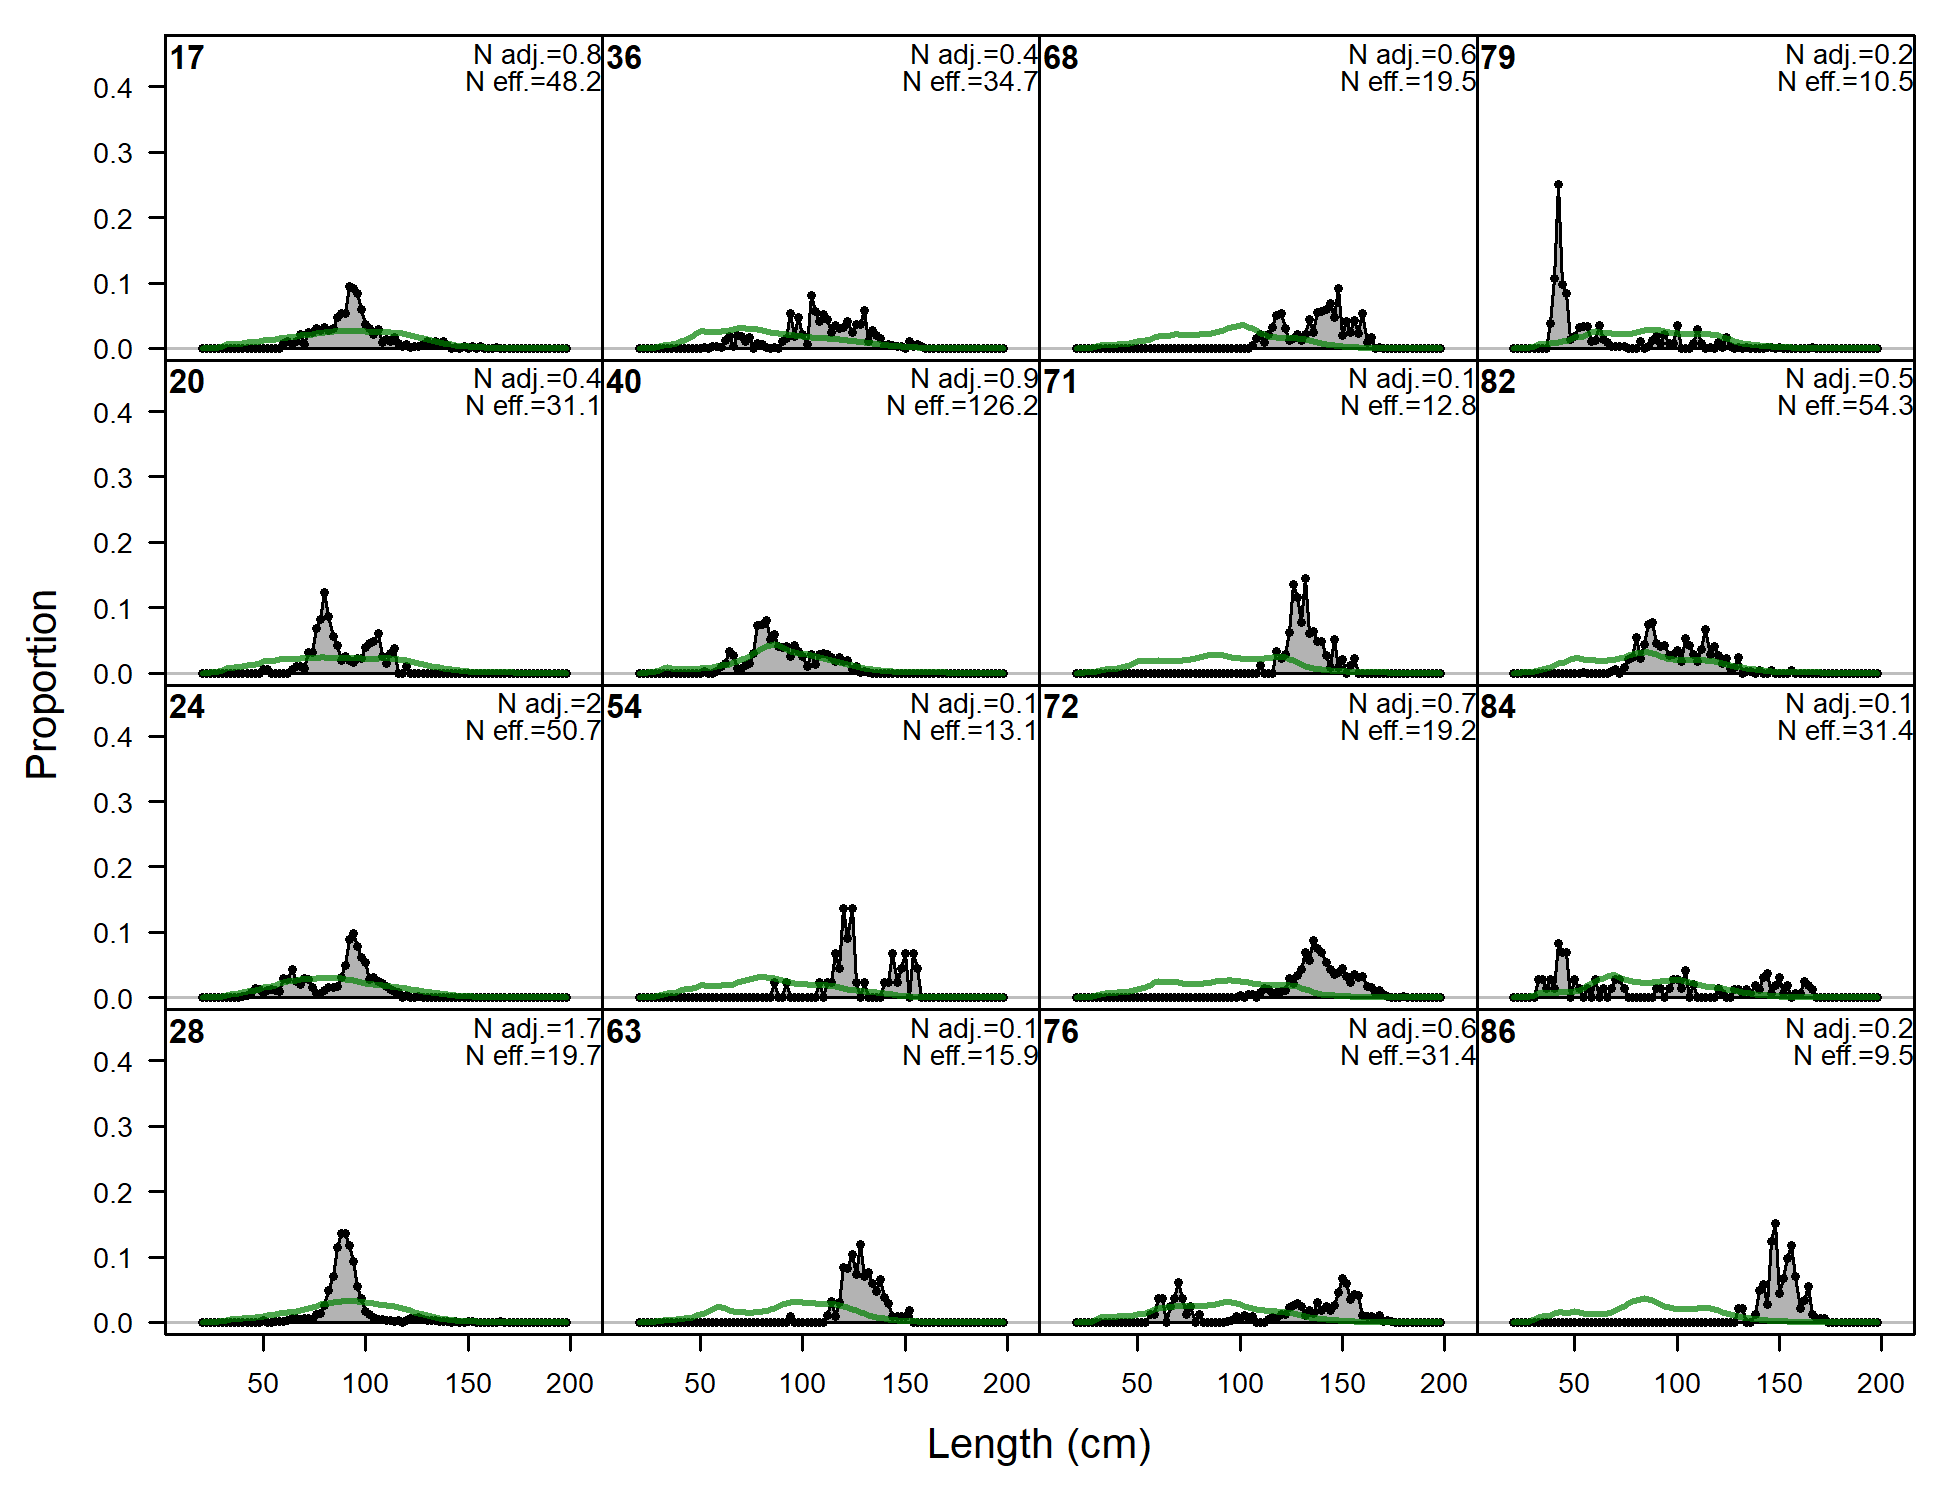
Length comps, whole catch, A6-OBJ (plot 1 of 2).
'N adj.' is the input sample size after data-weighting adjustment. N eff. is the calculated effective sample size used in the McAllister-Iannelli tuning method.
file: comp_lenfit_flt17mkt0_page1.png
Length comps, whole catch, A6-OBJ (plot 2 of 2)
file: comp_lenfit_flt17mkt0_page2.png

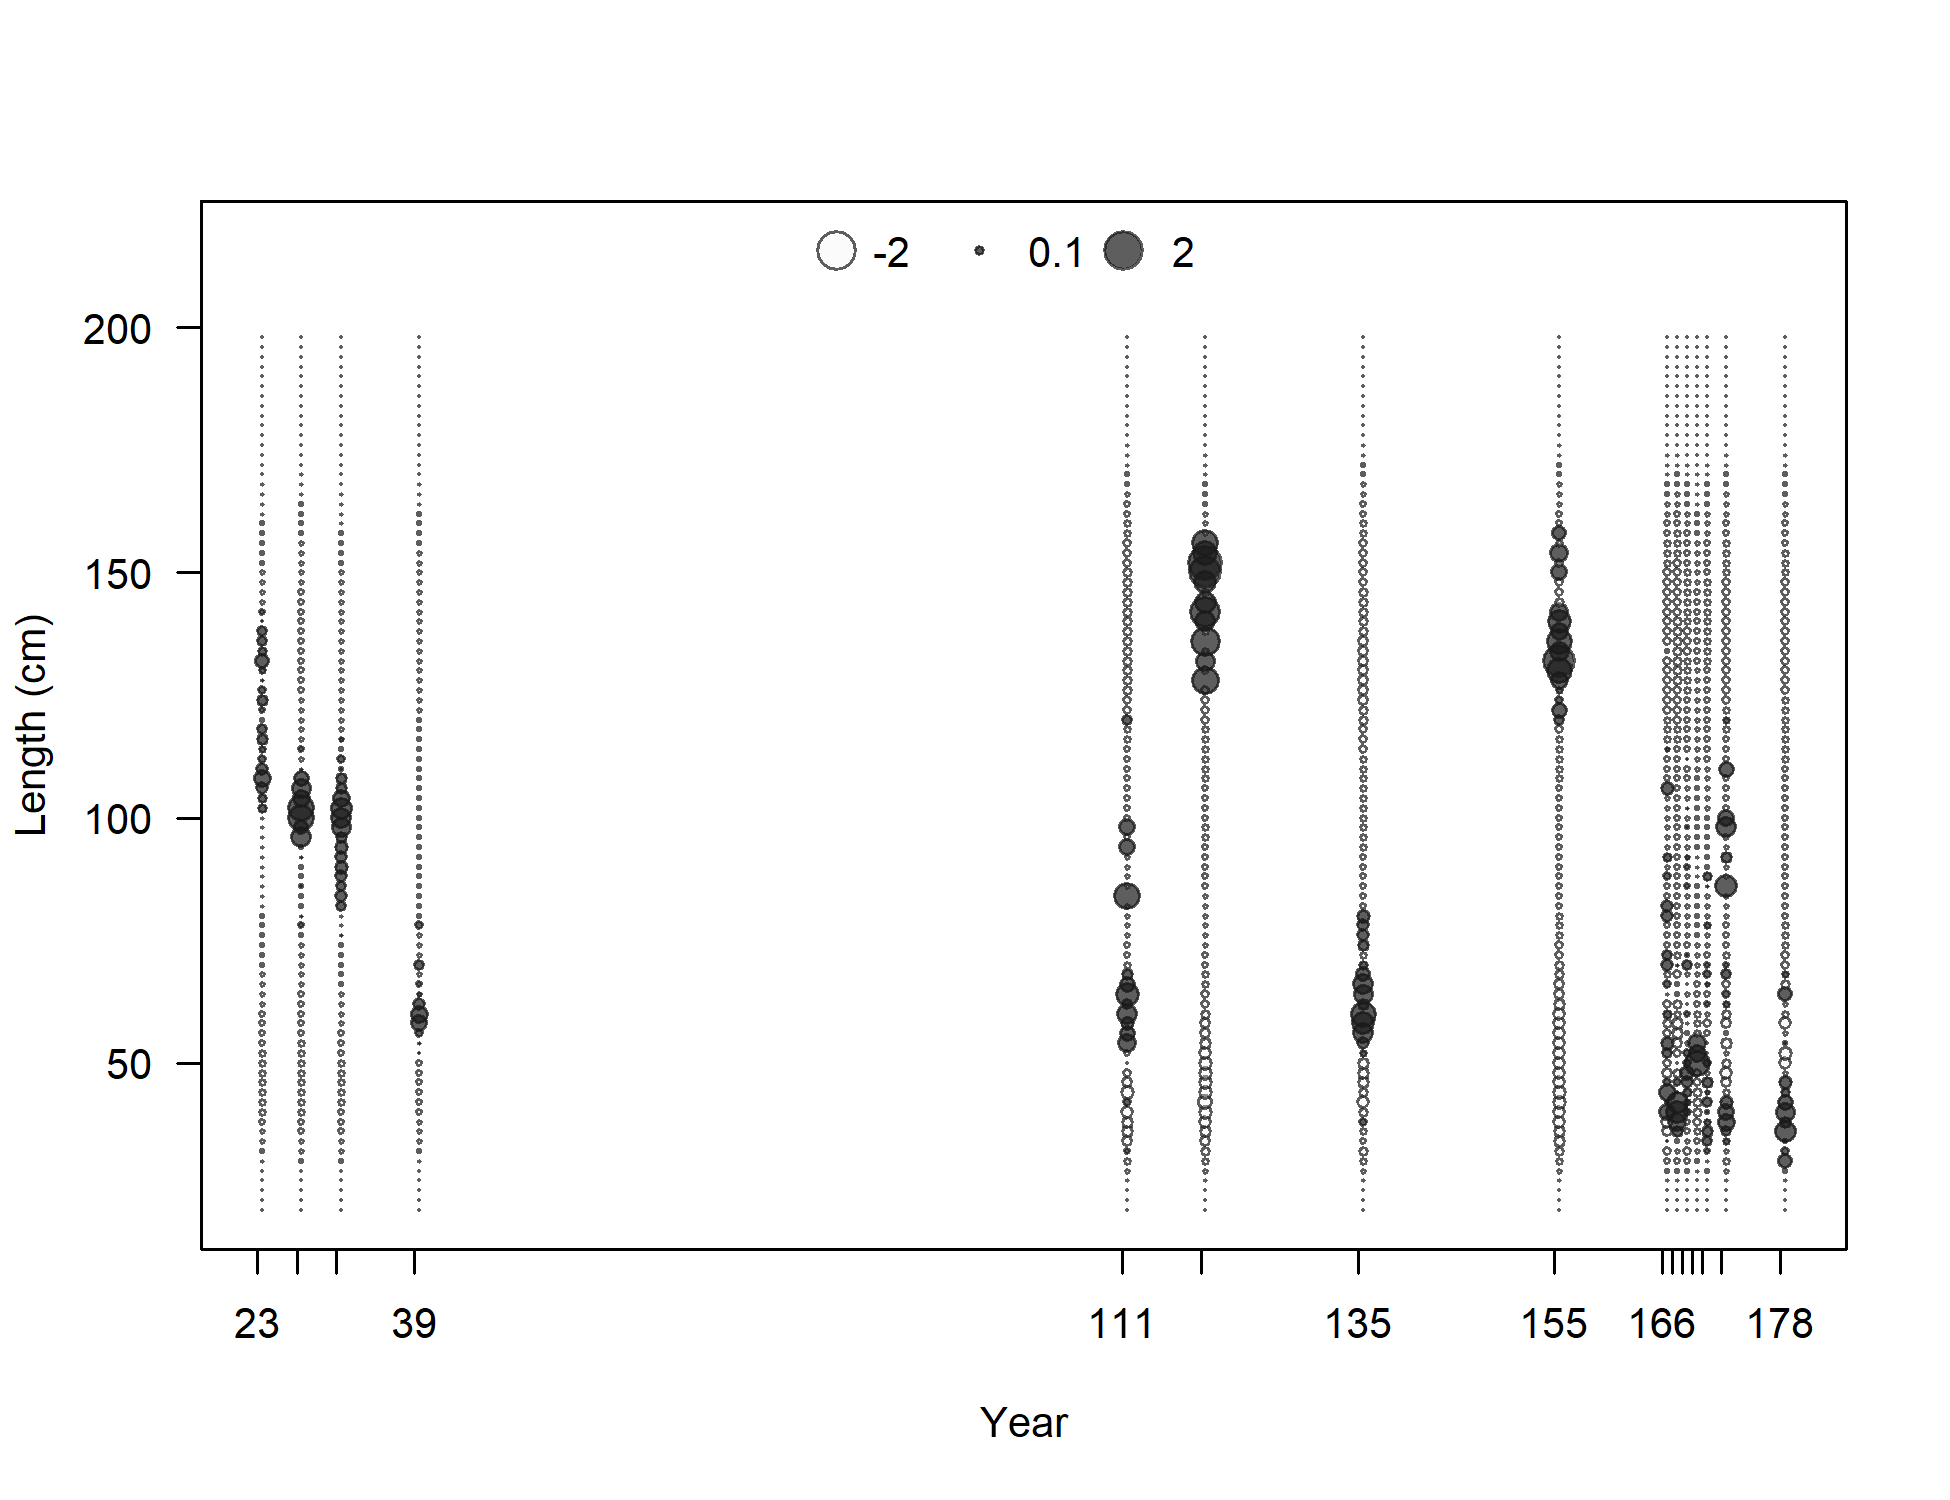
Pearson residuals, whole catch, A6-OBJ (max=4.55) (plot 2 of 2)
Closed bubbles are positive residuals (observed > expected) and open bubbles are negative residuals (observed < expected).
file: comp_lenfit_residsflt17mkt0_page2.png
N-EffN comparison, Length comps, whole catch, A6-OBJ
file: comp_lenfit_sampsize_flt17mkt0.png
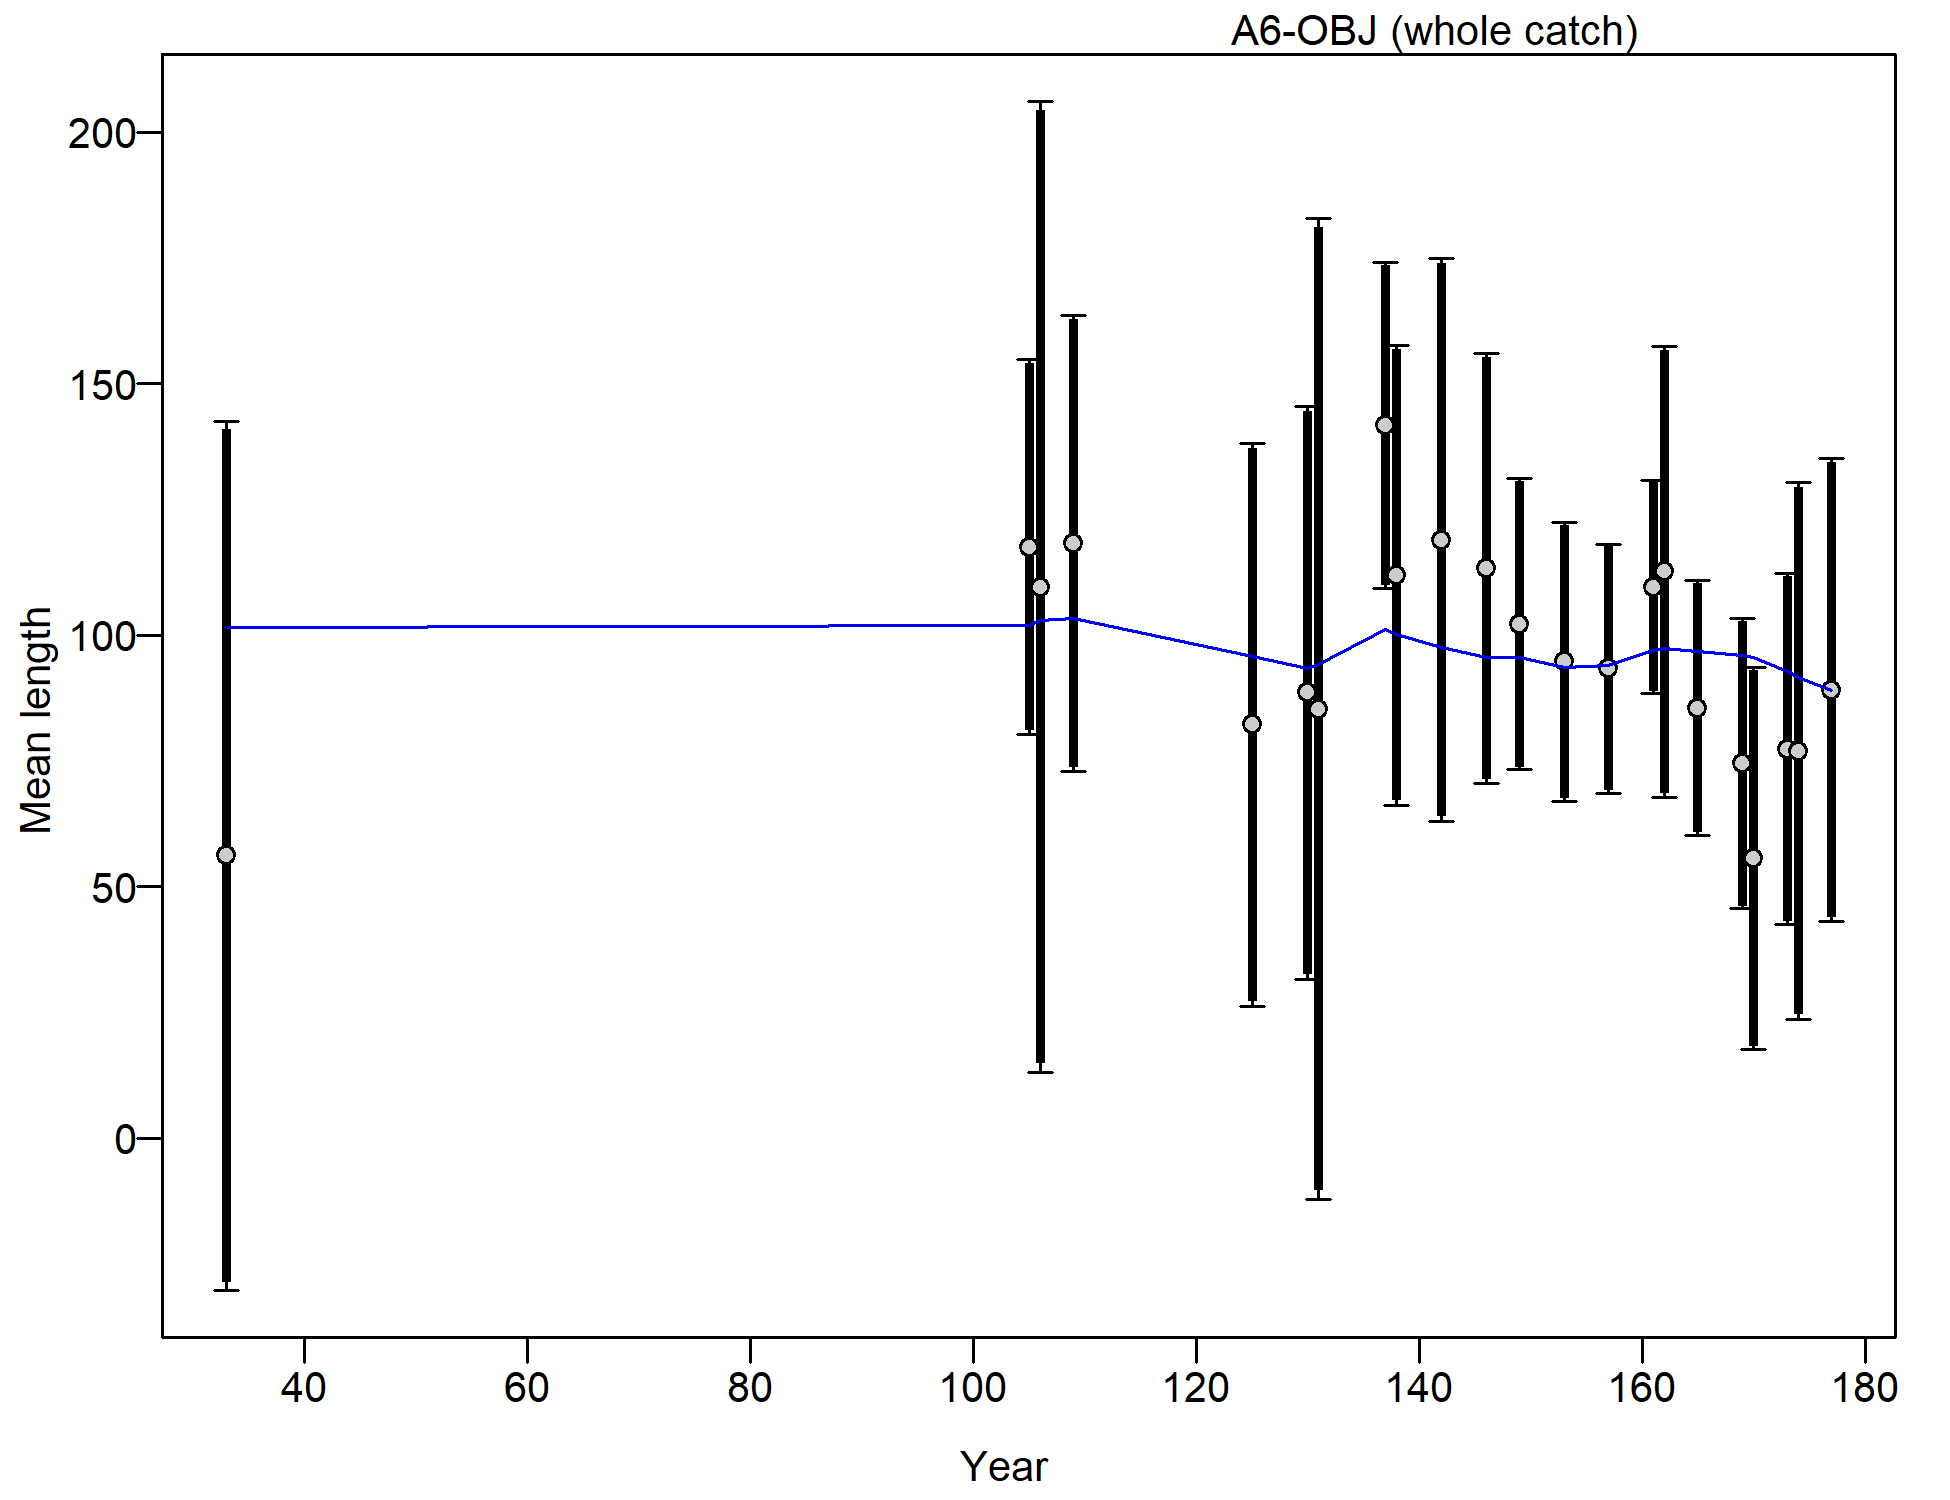
Mean length for A6-OBJ with 95% confidence intervals based on current samples sizes.
Francis data weighting method TA1.8: thinner intervals (with capped ends) show result of further adjusting sample sizes based on suggested multiplier (with 95% interval) for len data from A6-OBJ:
0.9632 (0.5842-2.1353)
For more info, see
Francis, R.I.C.C. (2011). Data weighting in statistical fisheries stock assessment models. Can. J. Fish. Aquat. Sci. 68: 1124-1138. https://doi.org/10.1139/f2011-025

Length comps, whole catch, A2-NOADEL.
'N adj.' is the input sample size after data-weighting adjustment. N eff. is the calculated effective sample size used in the McAllister-Iannelli tuning method.
file: comp_lenfit_flt19mkt0.png
Pearson residuals, whole catch, A2-NOADEL (max=1.47)
Closed bubbles are positive residuals (observed > expected) and open bubbles are negative residuals (observed < expected).
file: comp_lenfit_residsflt19mkt0.png

N-EffN comparison, Length comps, whole catch, A2-NOADEL
file: comp_lenfit_sampsize_flt19mkt0.png
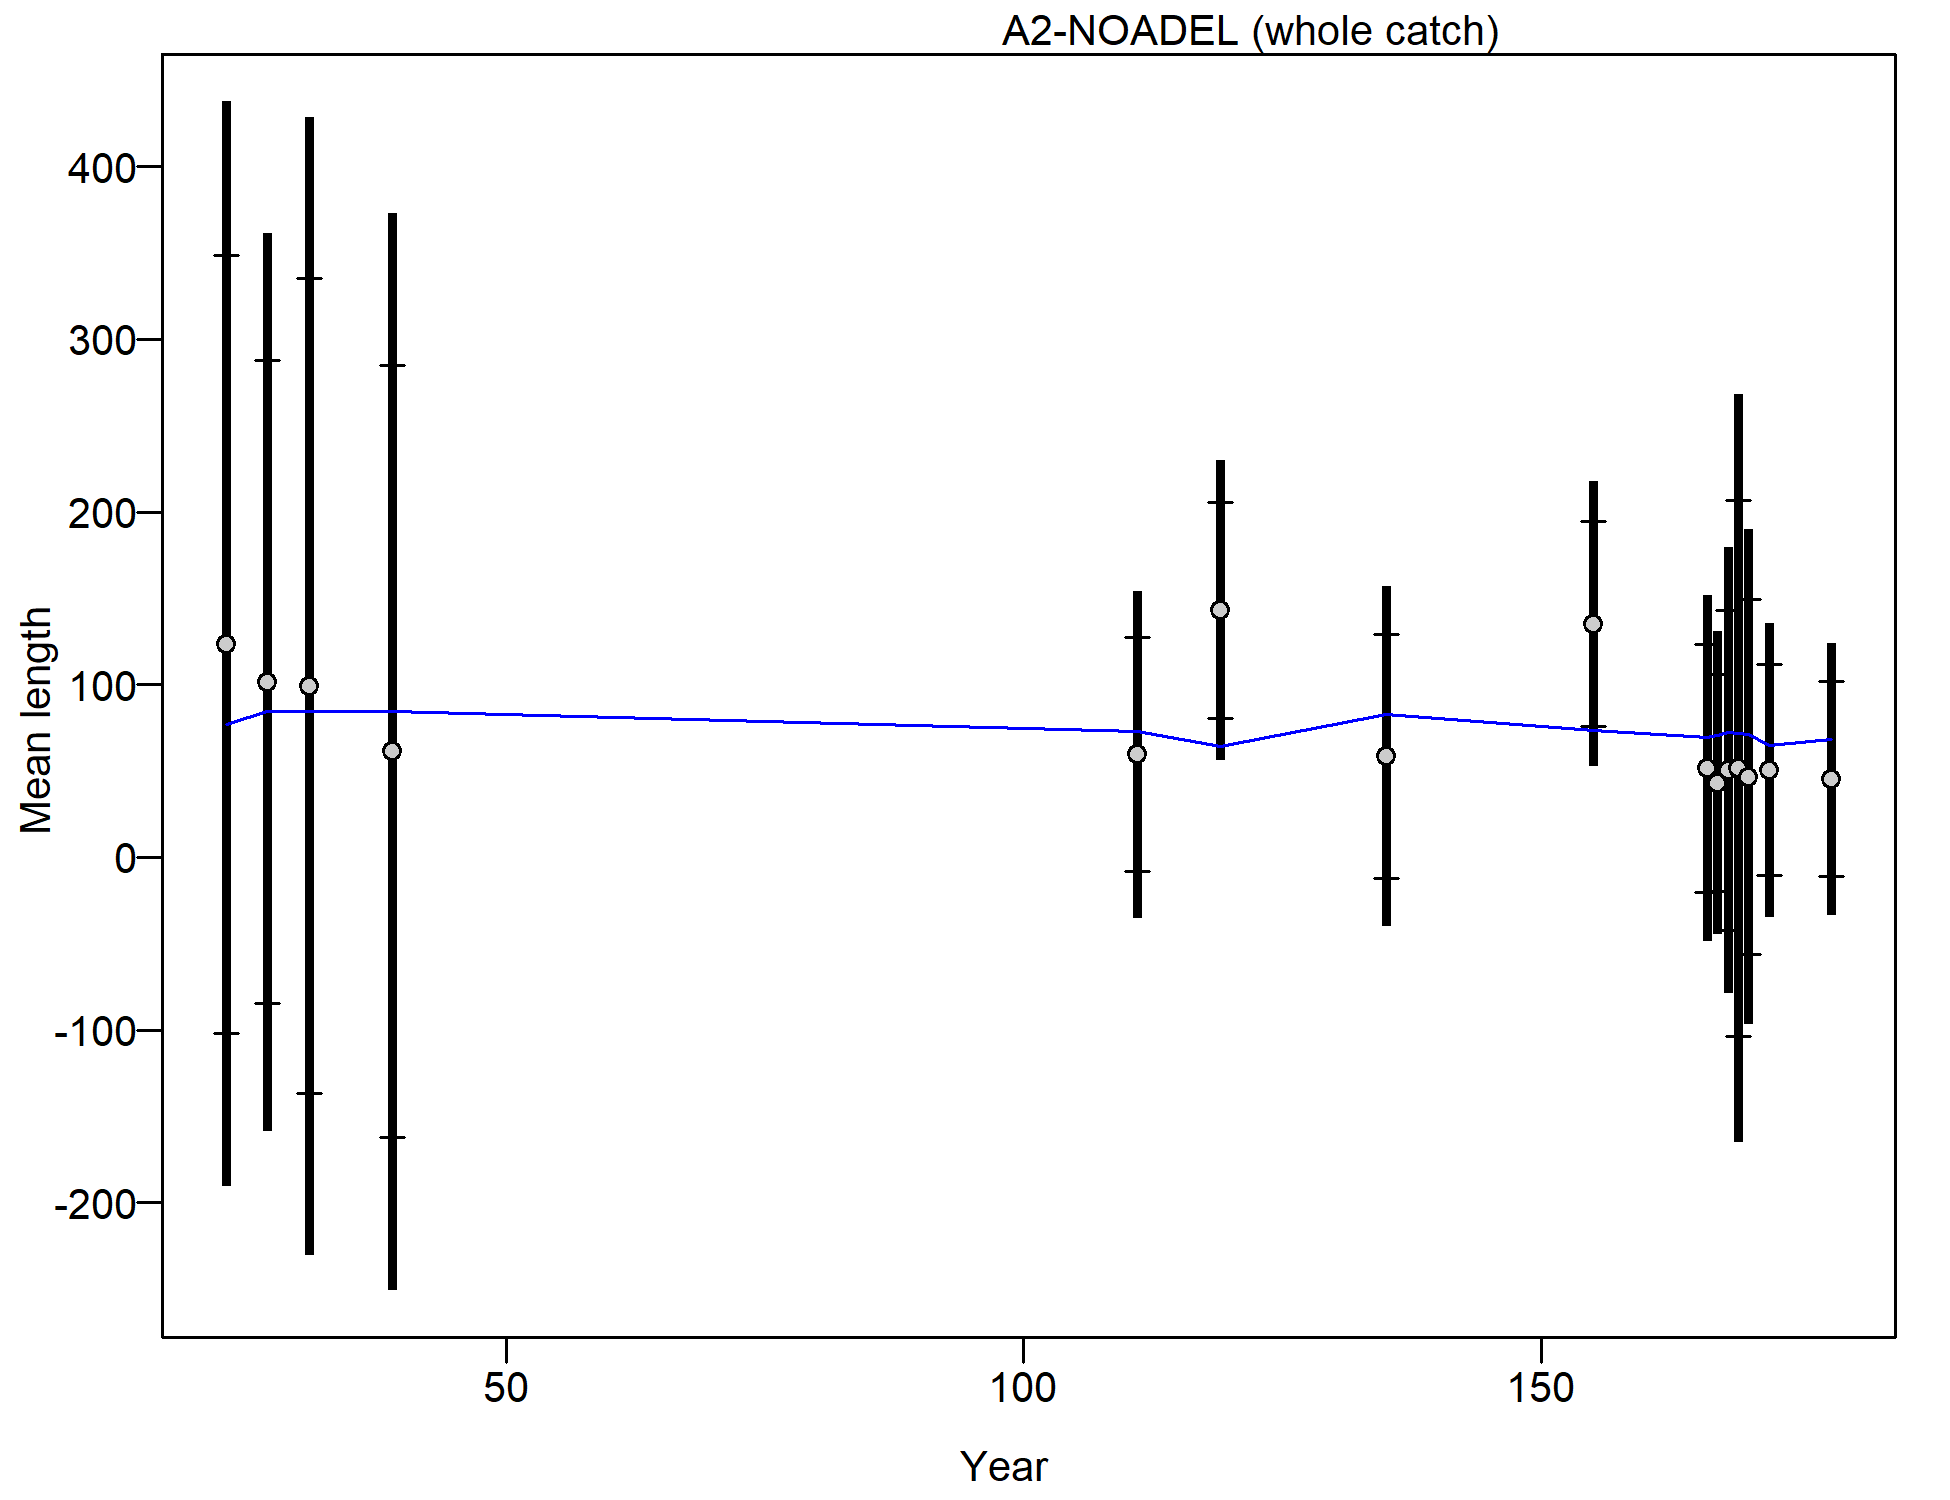
Mean length for A2-NOADEL with 95% confidence intervals based on current samples sizes.
Francis data weighting method TA1.8: thinner intervals (with capped ends) show result of further adjusting sample sizes based on suggested multiplier (with 95% interval) for len data from A2-NOADEL:
1.9468 (1.0567-19.825)
For more info, see
Francis, R.I.C.C. (2011). Data weighting in statistical fisheries stock assessment models. Can. J. Fish. Aquat. Sci. 68: 1124-1138. https://doi.org/10.1139/f2011-025
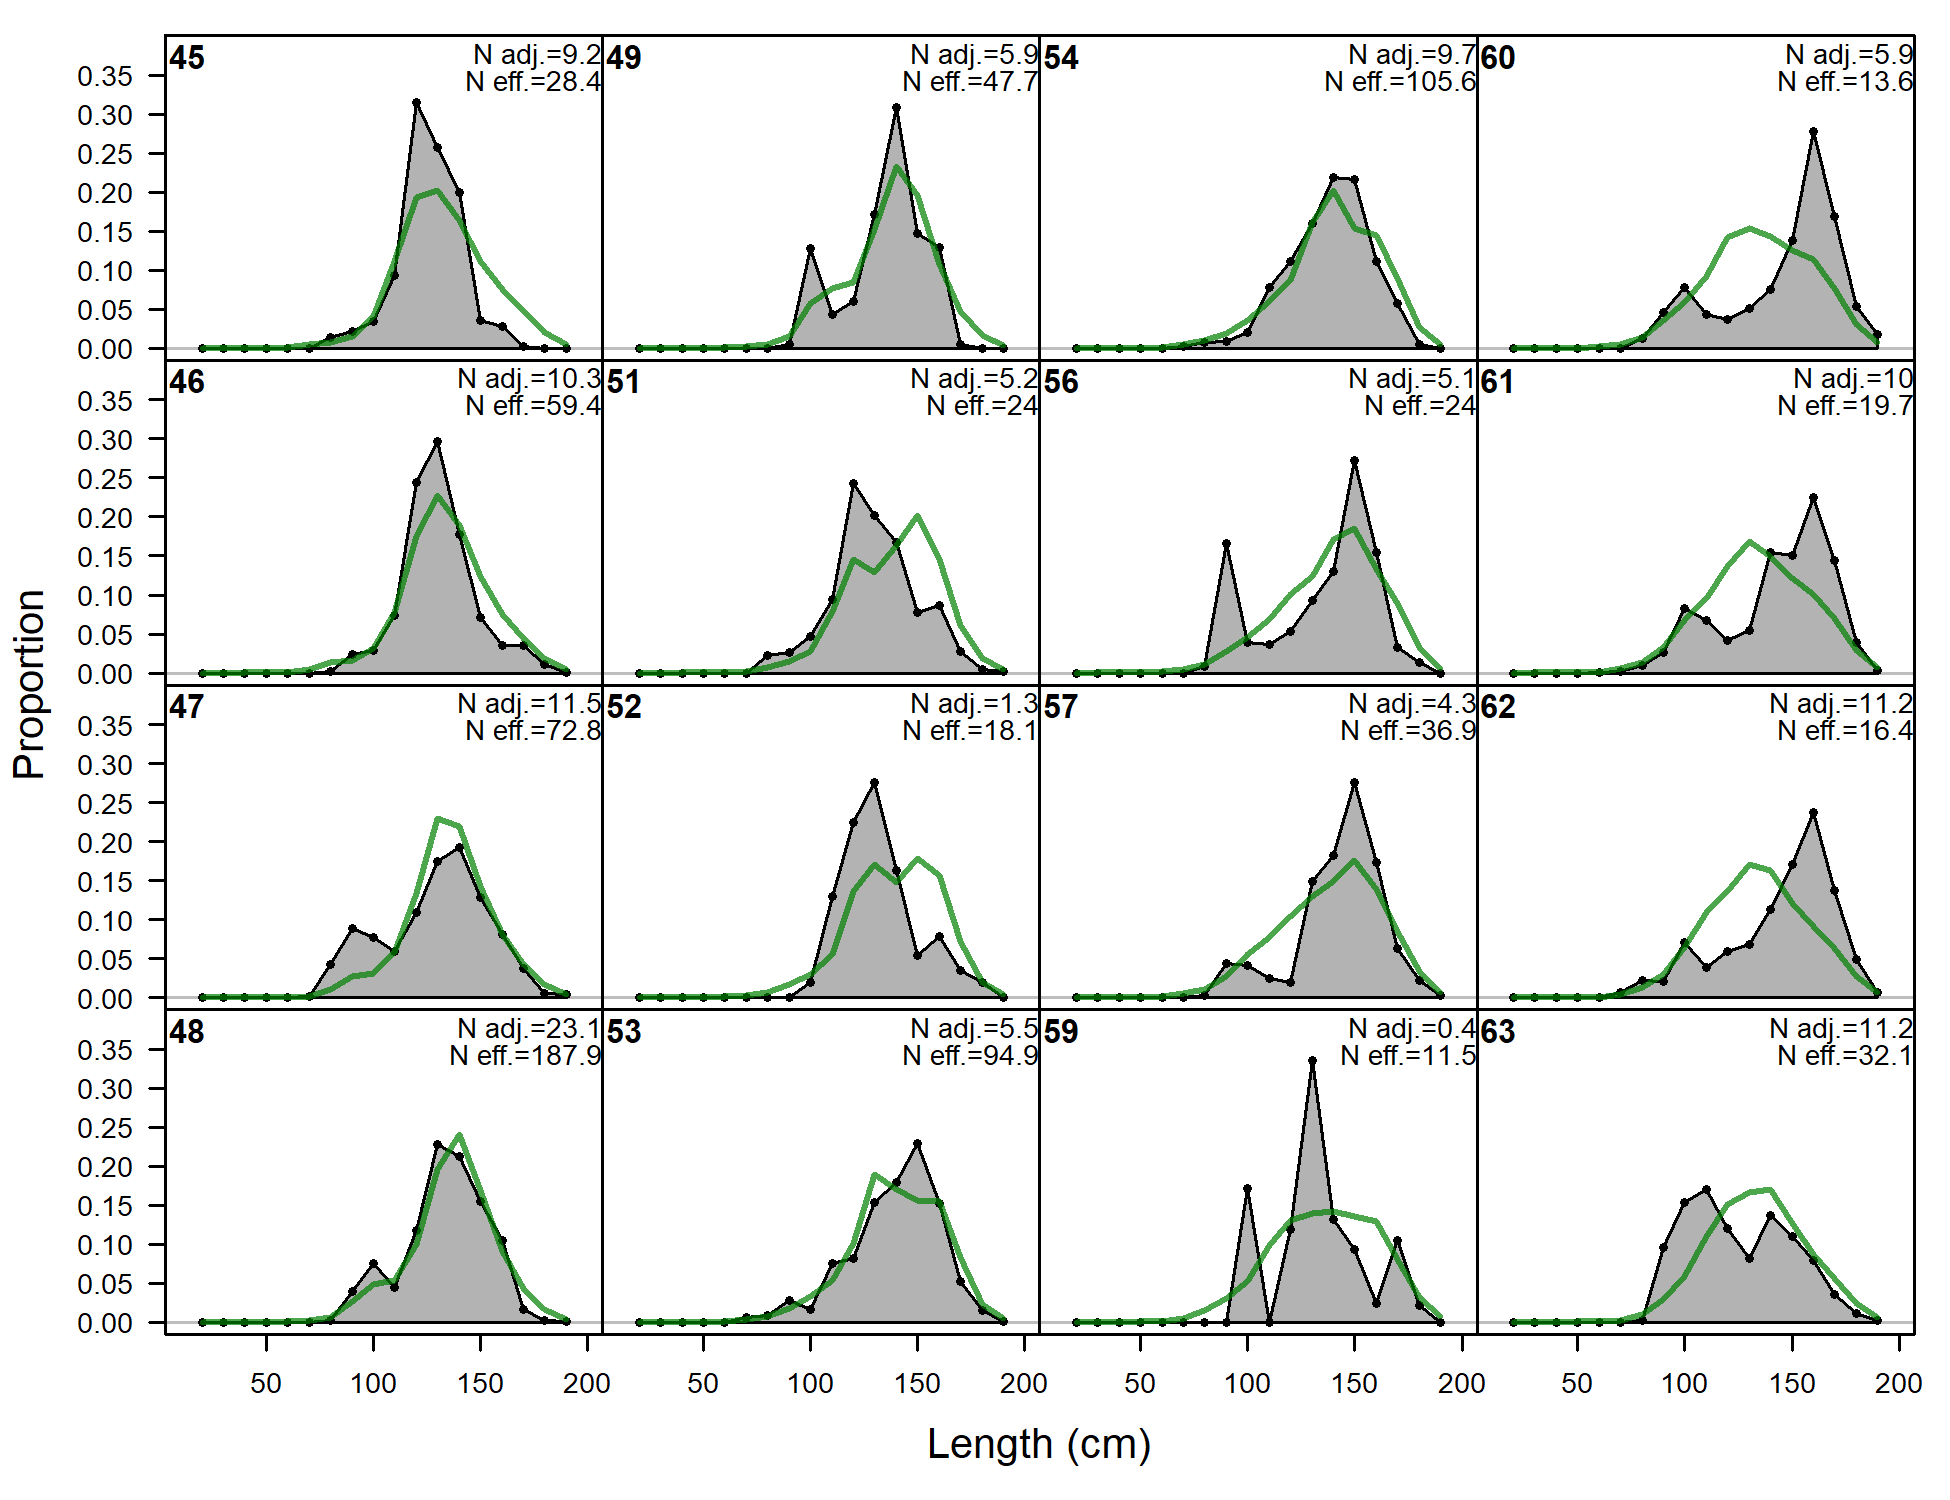
Length comps, whole catch, A3-NOADEL (plot 1 of 3).
'N adj.' is the input sample size after data-weighting adjustment. N eff. is the calculated effective sample size used in the McAllister-Iannelli tuning method.
file: comp_lenfit_flt20mkt0_page1.png
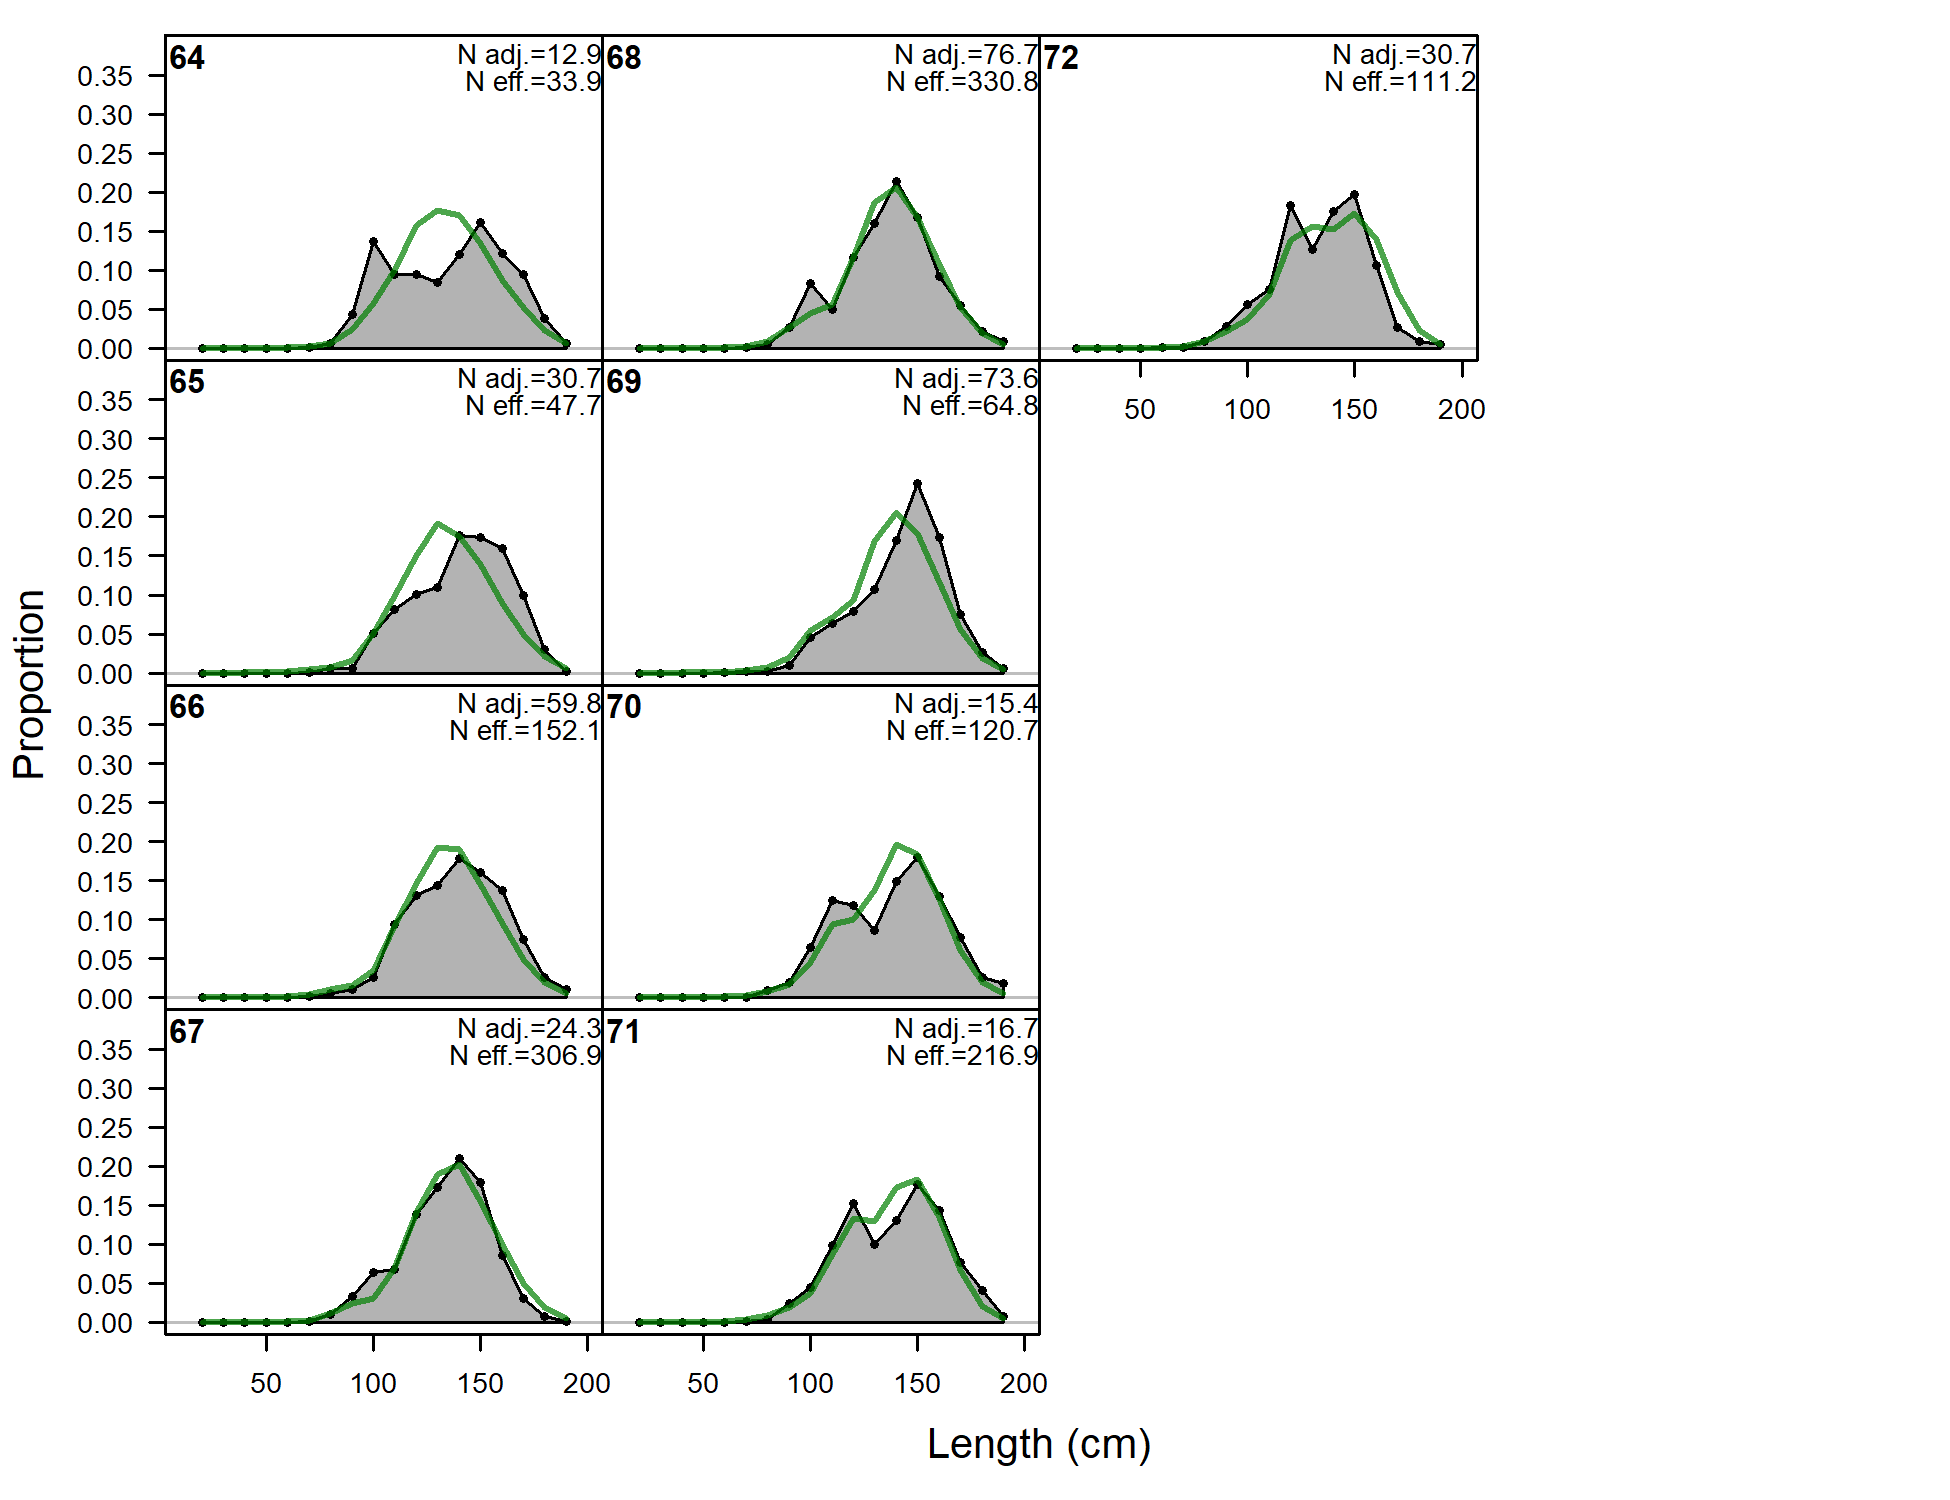
Length comps, whole catch, A3-NOADEL (plot 2 of 3)
file: comp_lenfit_flt20mkt0_page2.png

Length comps, whole catch, A3-NOADEL (plot 3 of 3)
file: comp_lenfit_flt20mkt0_page3.png

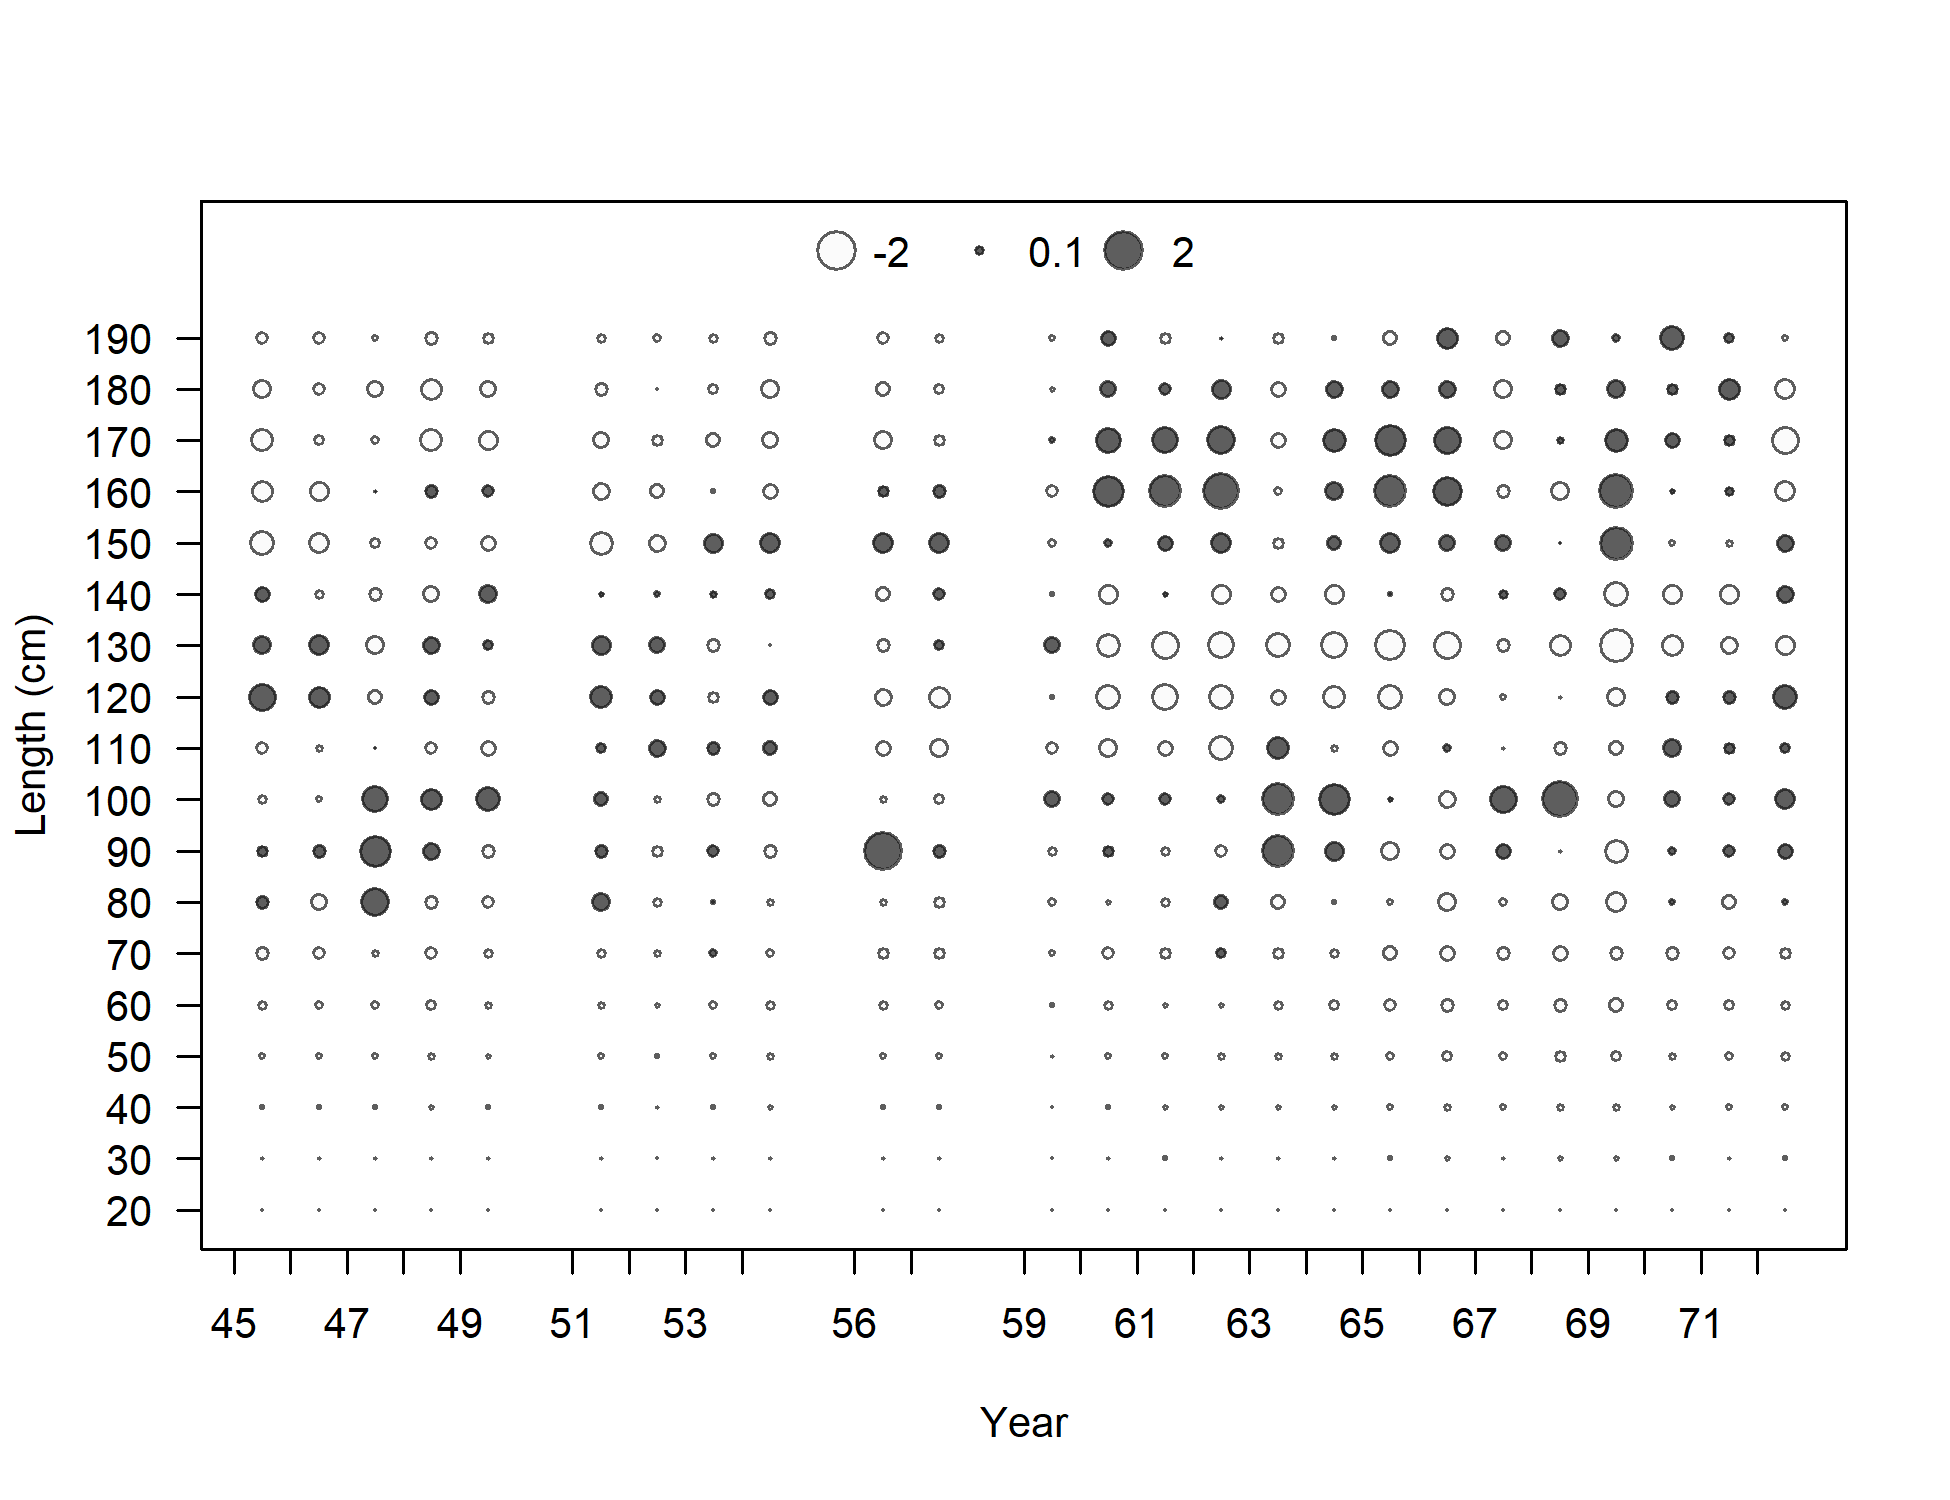
Pearson residuals, whole catch, A3-NOADEL (max=4.28) (plot 3 of 3)
Closed bubbles are positive residuals (observed > expected) and open bubbles are negative residuals (observed < expected).
file: comp_lenfit_residsflt20mkt0_page3.png

N-EffN comparison, Length comps, whole catch, A3-NOADEL
file: comp_lenfit_sampsize_flt20mkt0.png

Mean length for A3-NOADEL with 95% confidence intervals based on current samples sizes.
Francis data weighting method TA1.8: thinner intervals (with capped ends) show result of further adjusting sample sizes based on suggested multiplier (with 95% interval) for len data from A3-NOADEL:
1.0129 (0.7385-1.693)
For more info, see
Francis, R.I.C.C. (2011). Data weighting in statistical fisheries stock assessment models. Can. J. Fish. Aquat. Sci. 68: 1124-1138. https://doi.org/10.1139/f2011-025
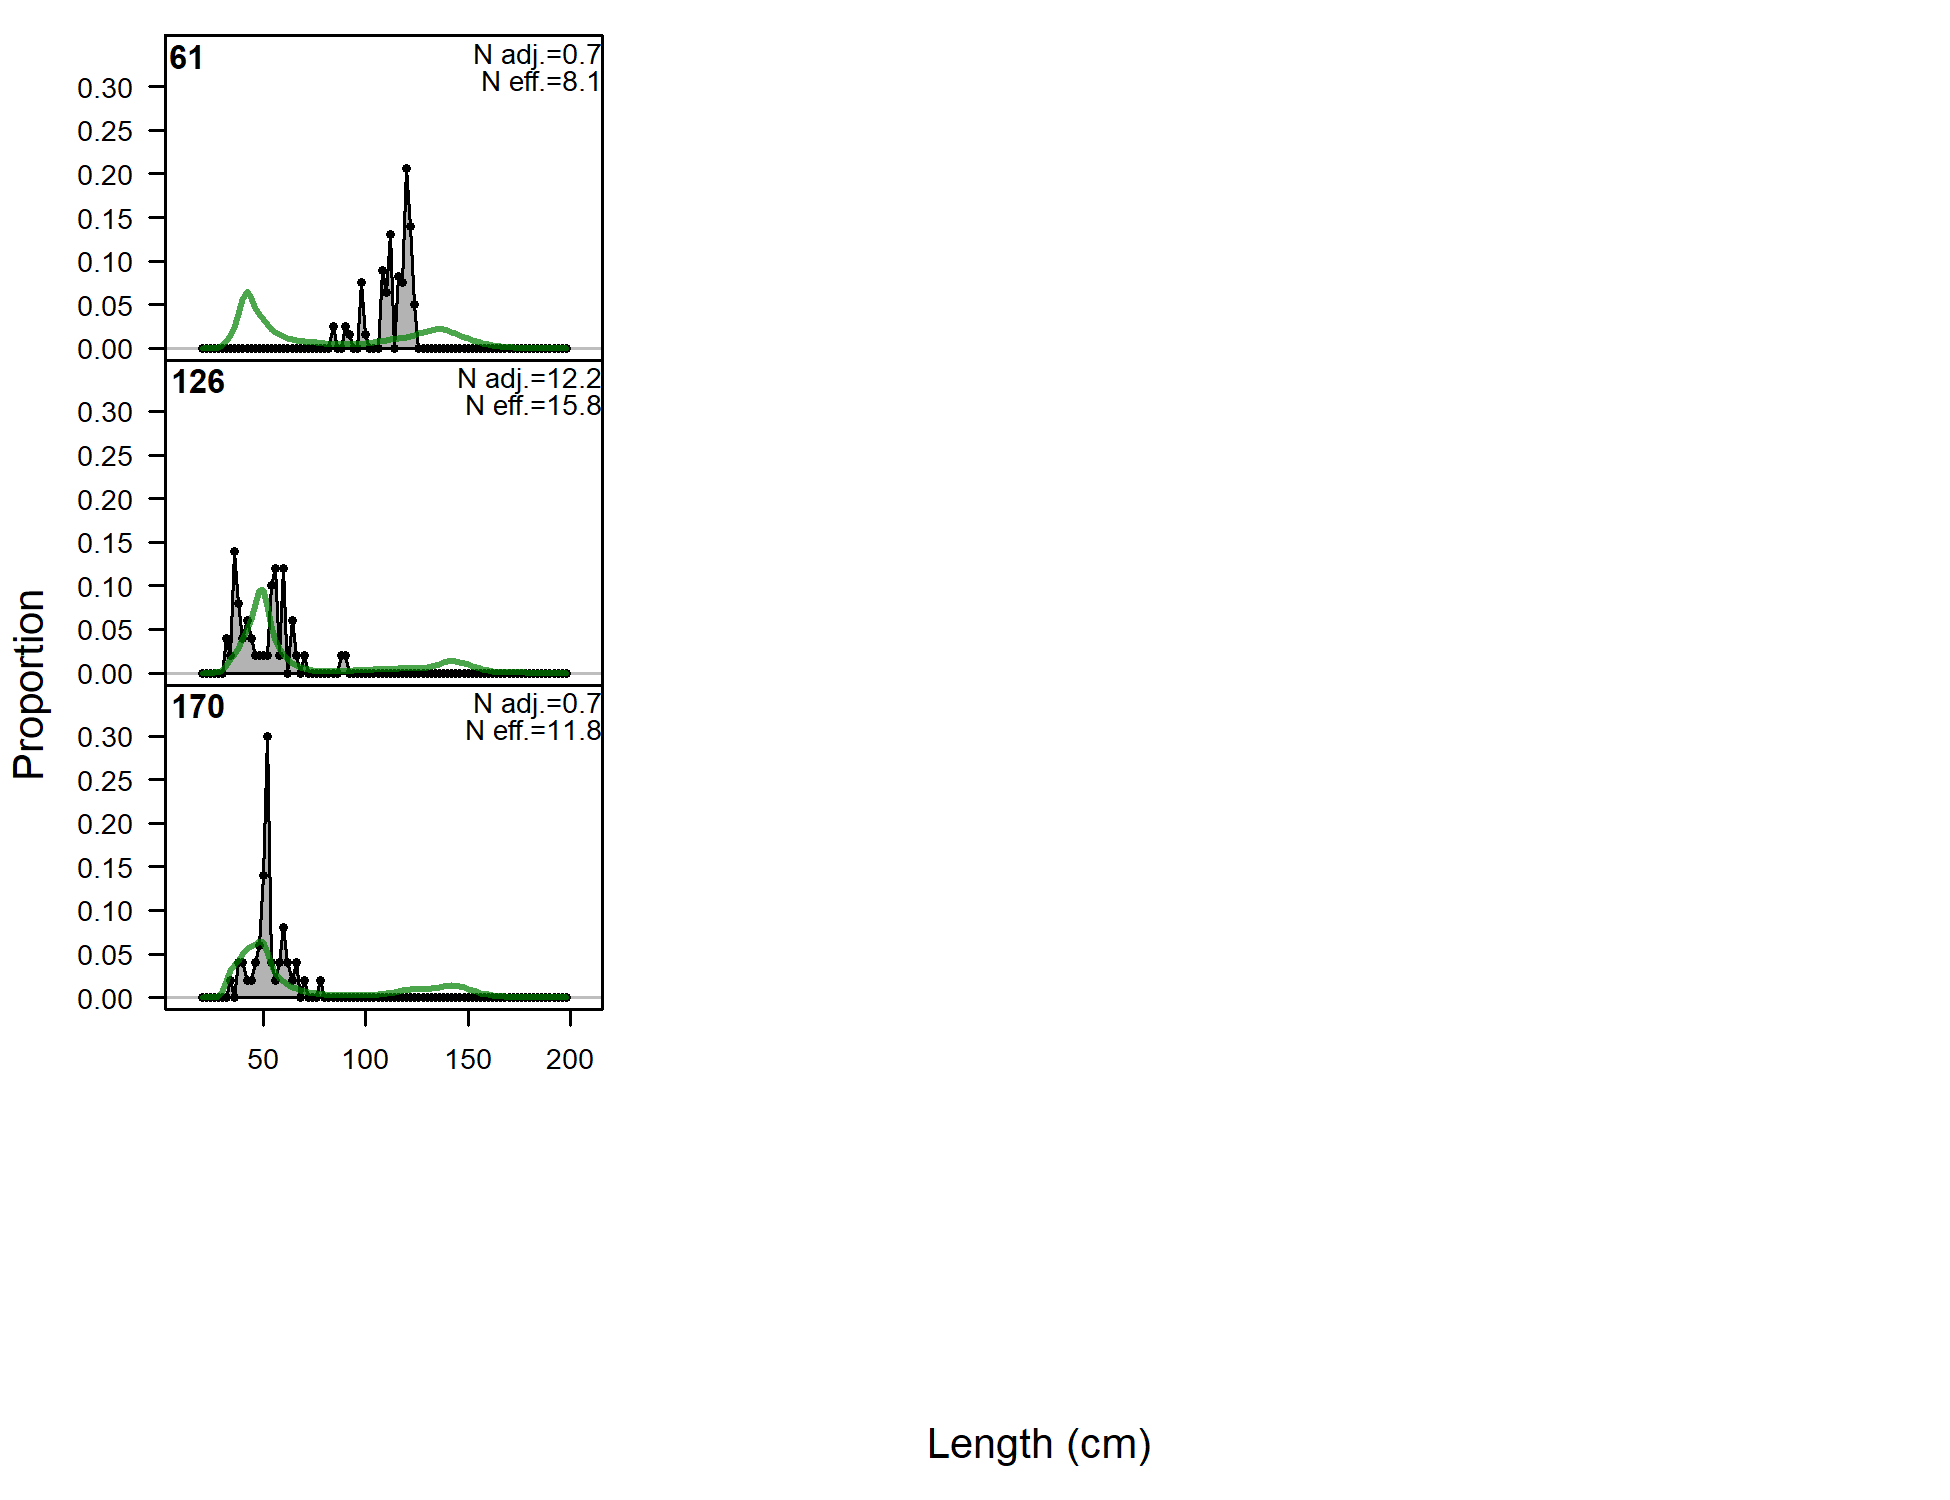
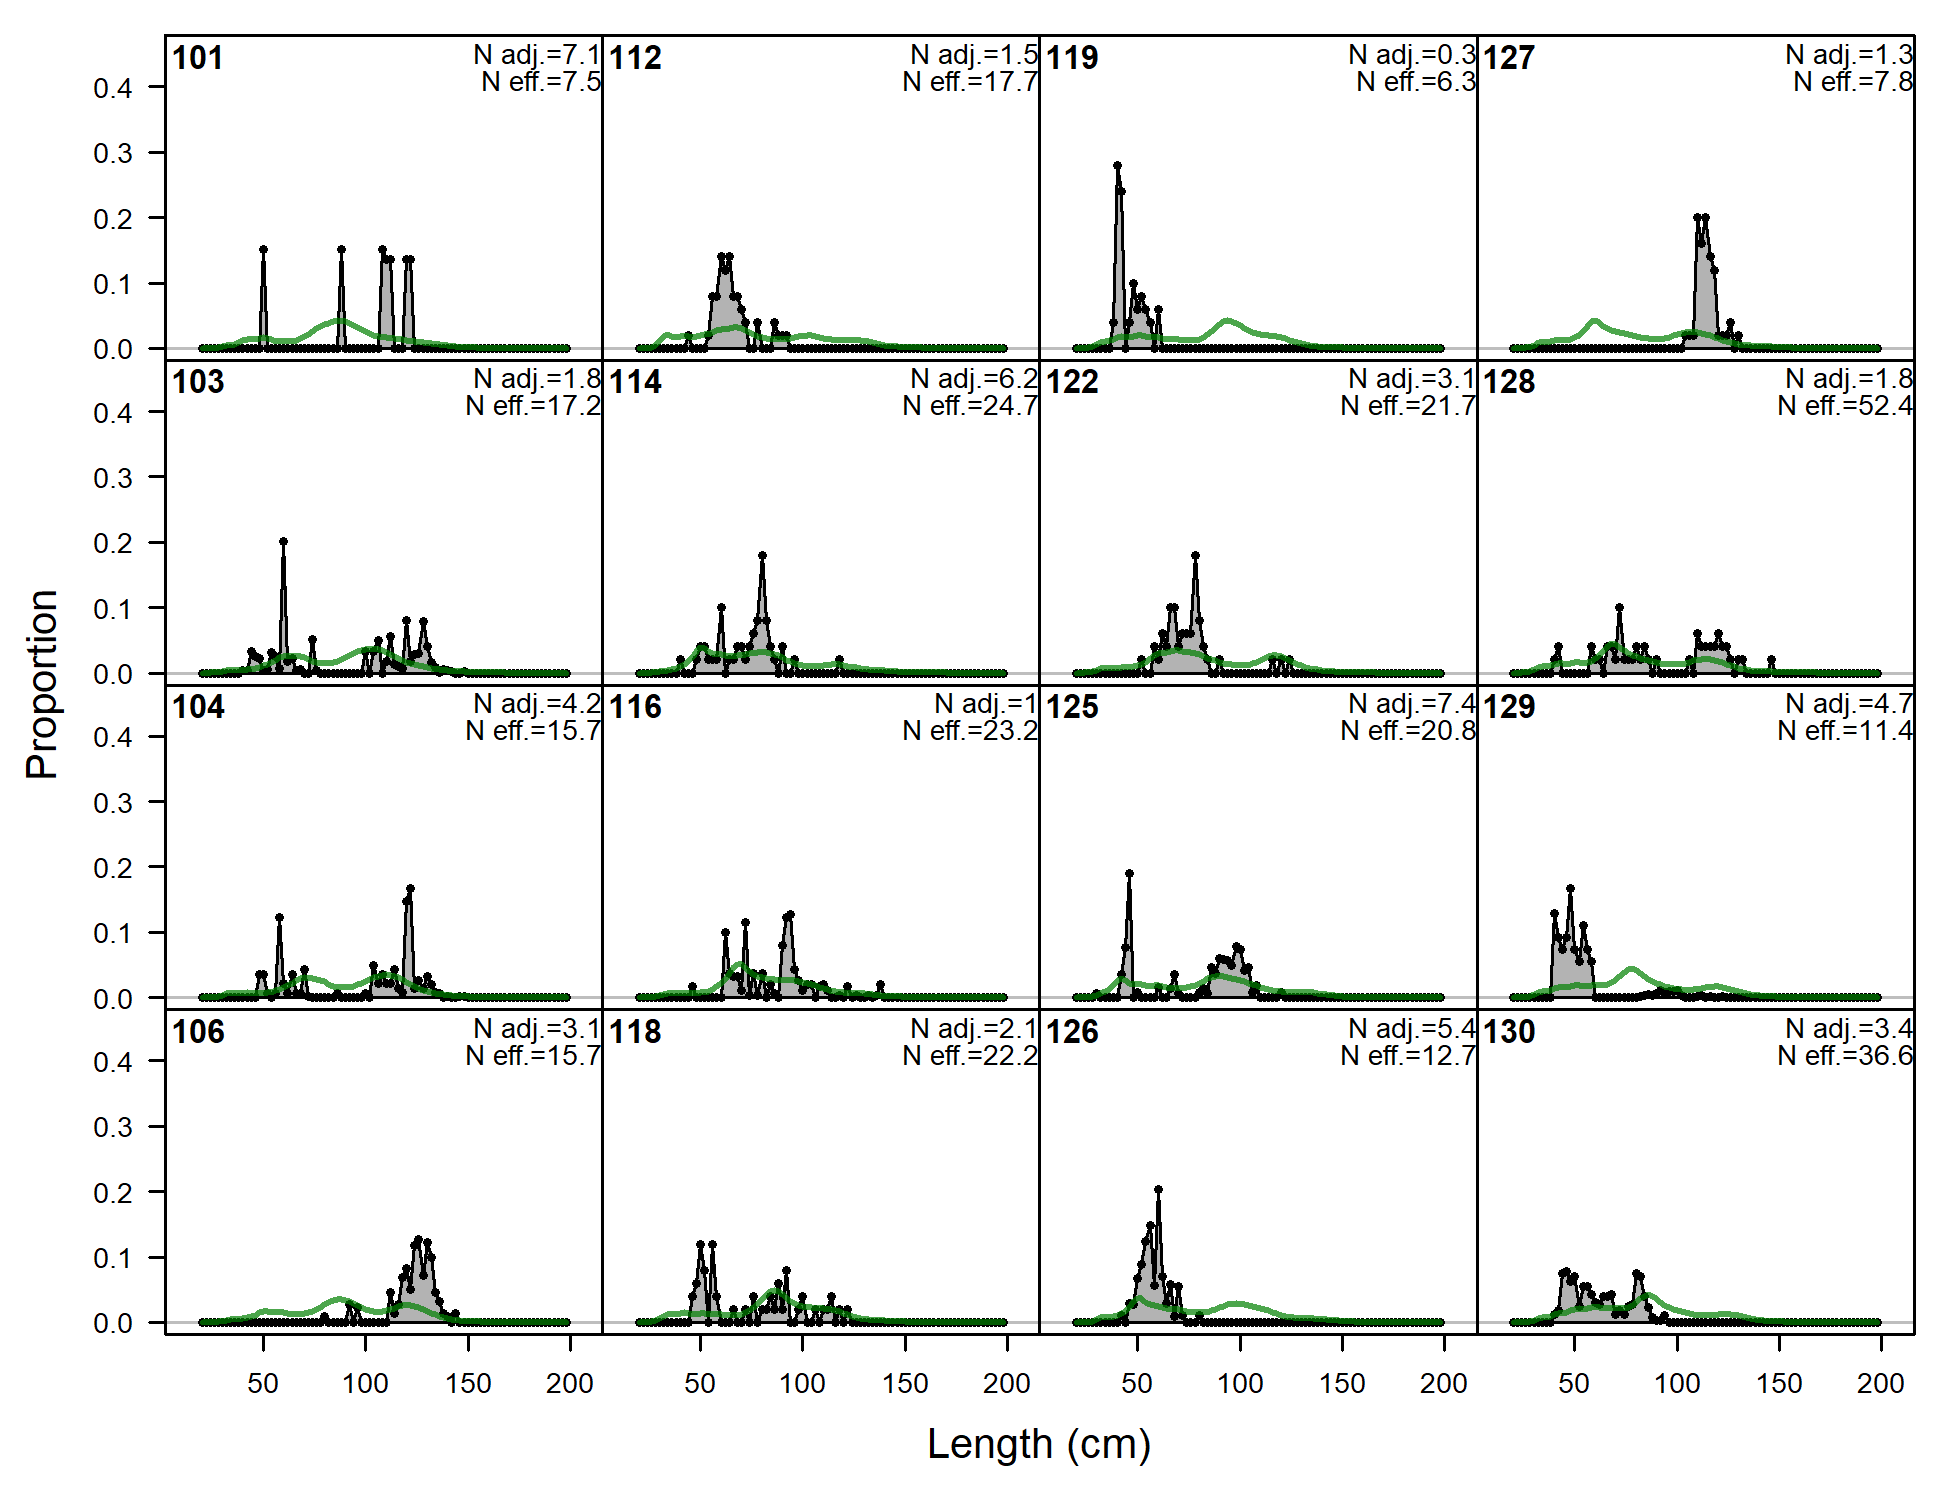
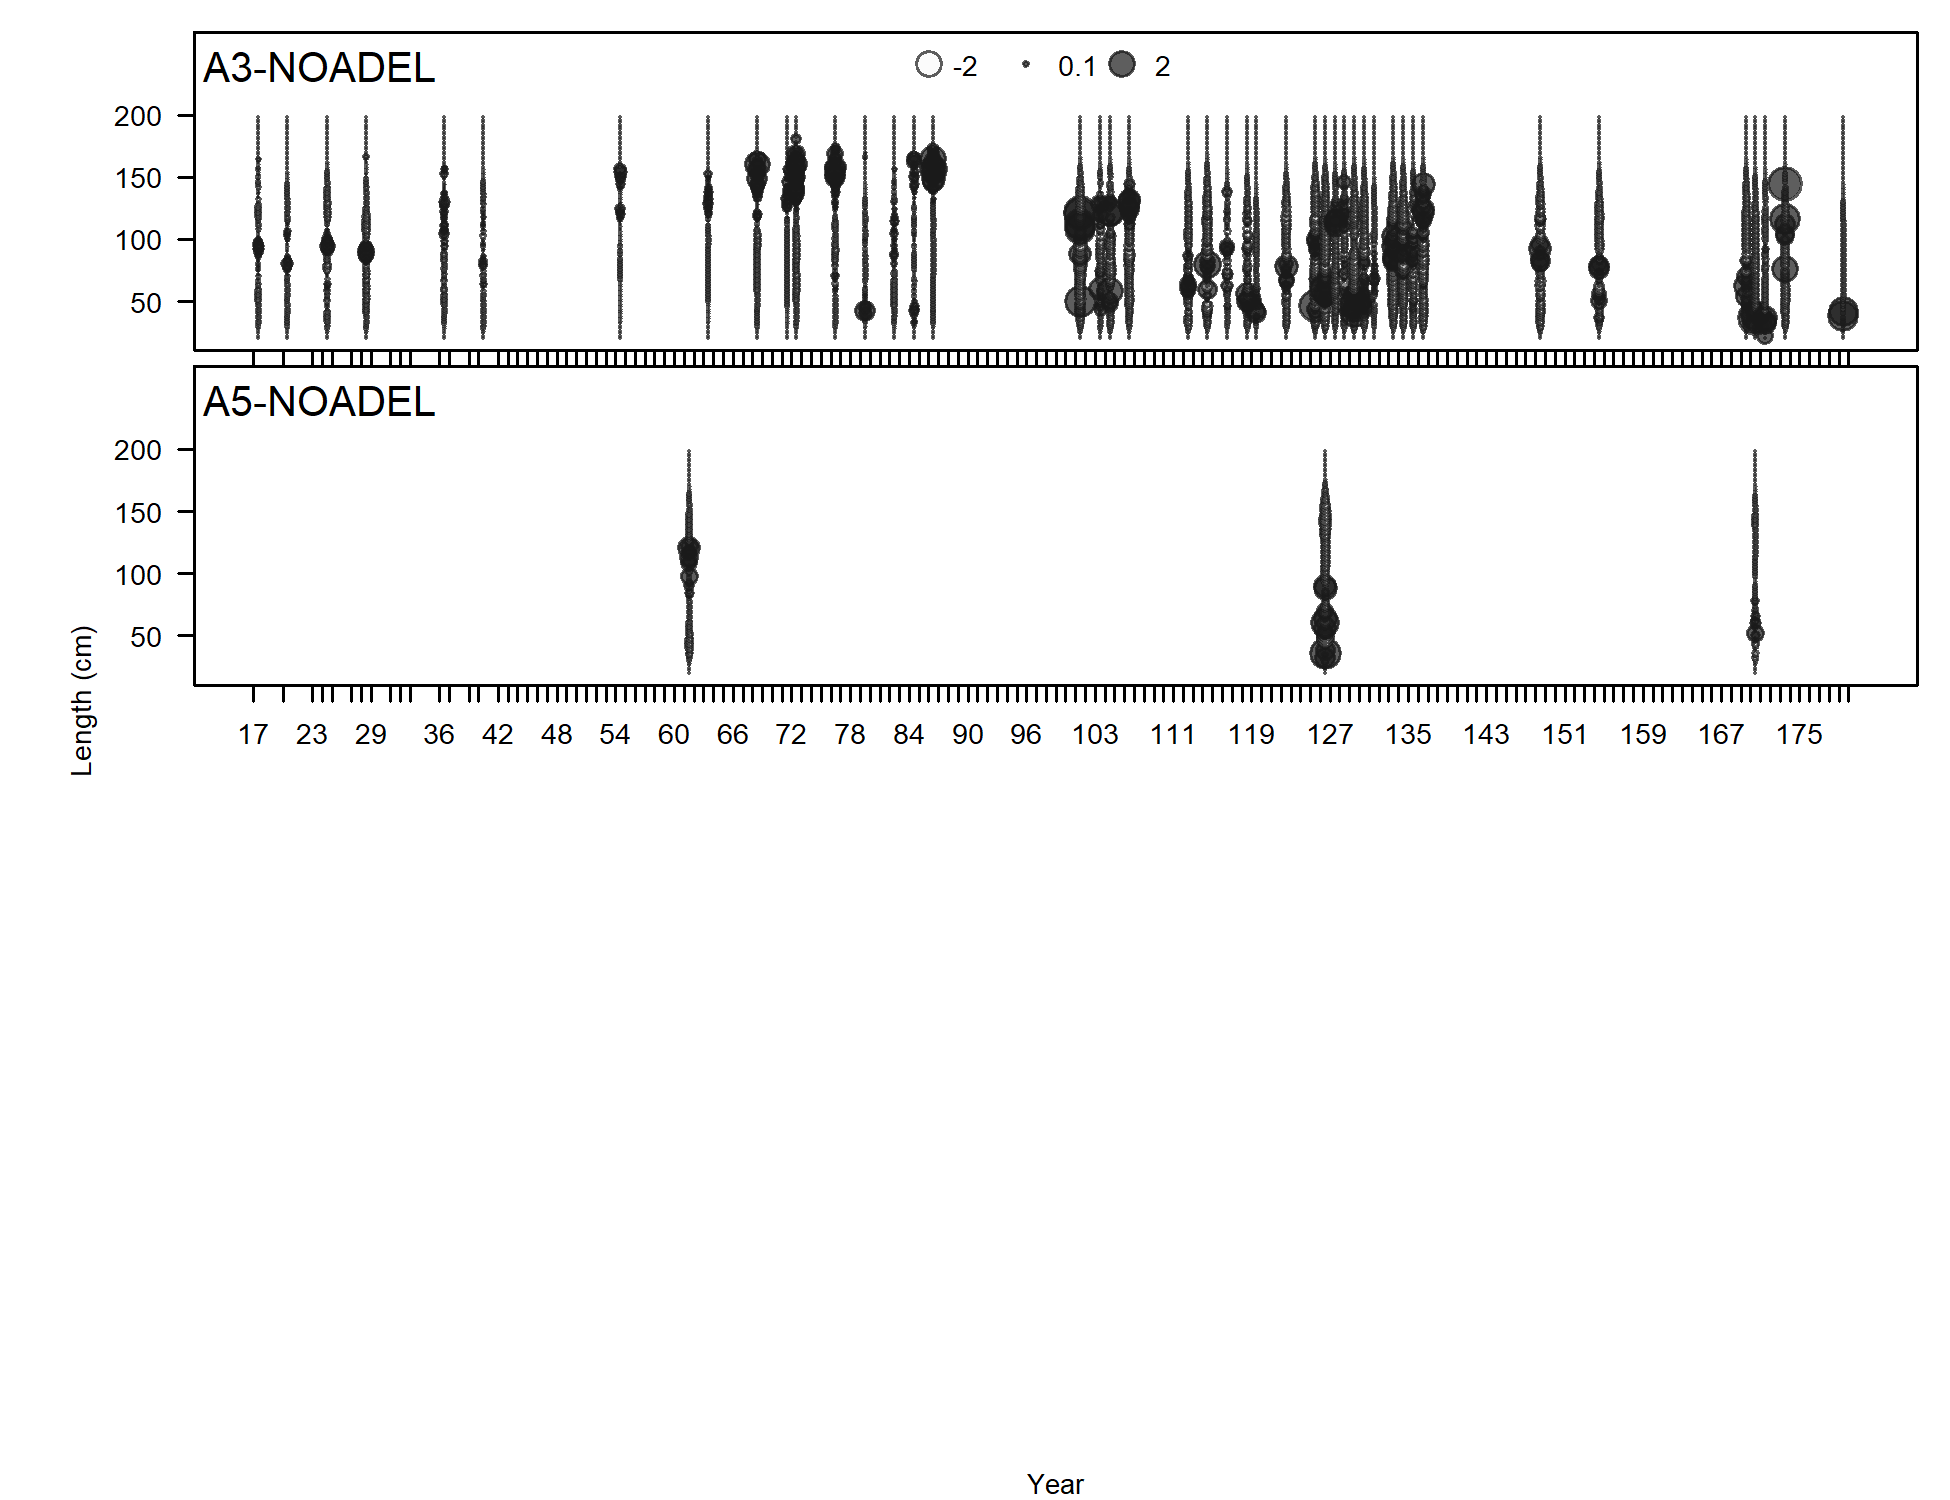
Length comps, whole catch, A5-NOADEL.
'N adj.' is the input sample size after data-weighting adjustment. N eff. is the calculated effective sample size used in the McAllister-Iannelli tuning method.
file: comp_lenfit_flt22mkt0.png

Pearson residuals, whole catch, A5-NOADEL (max=2.89)
Closed bubbles are positive residuals (observed > expected) and open bubbles are negative residuals (observed < expected).
file: comp_lenfit_residsflt22mkt0.png
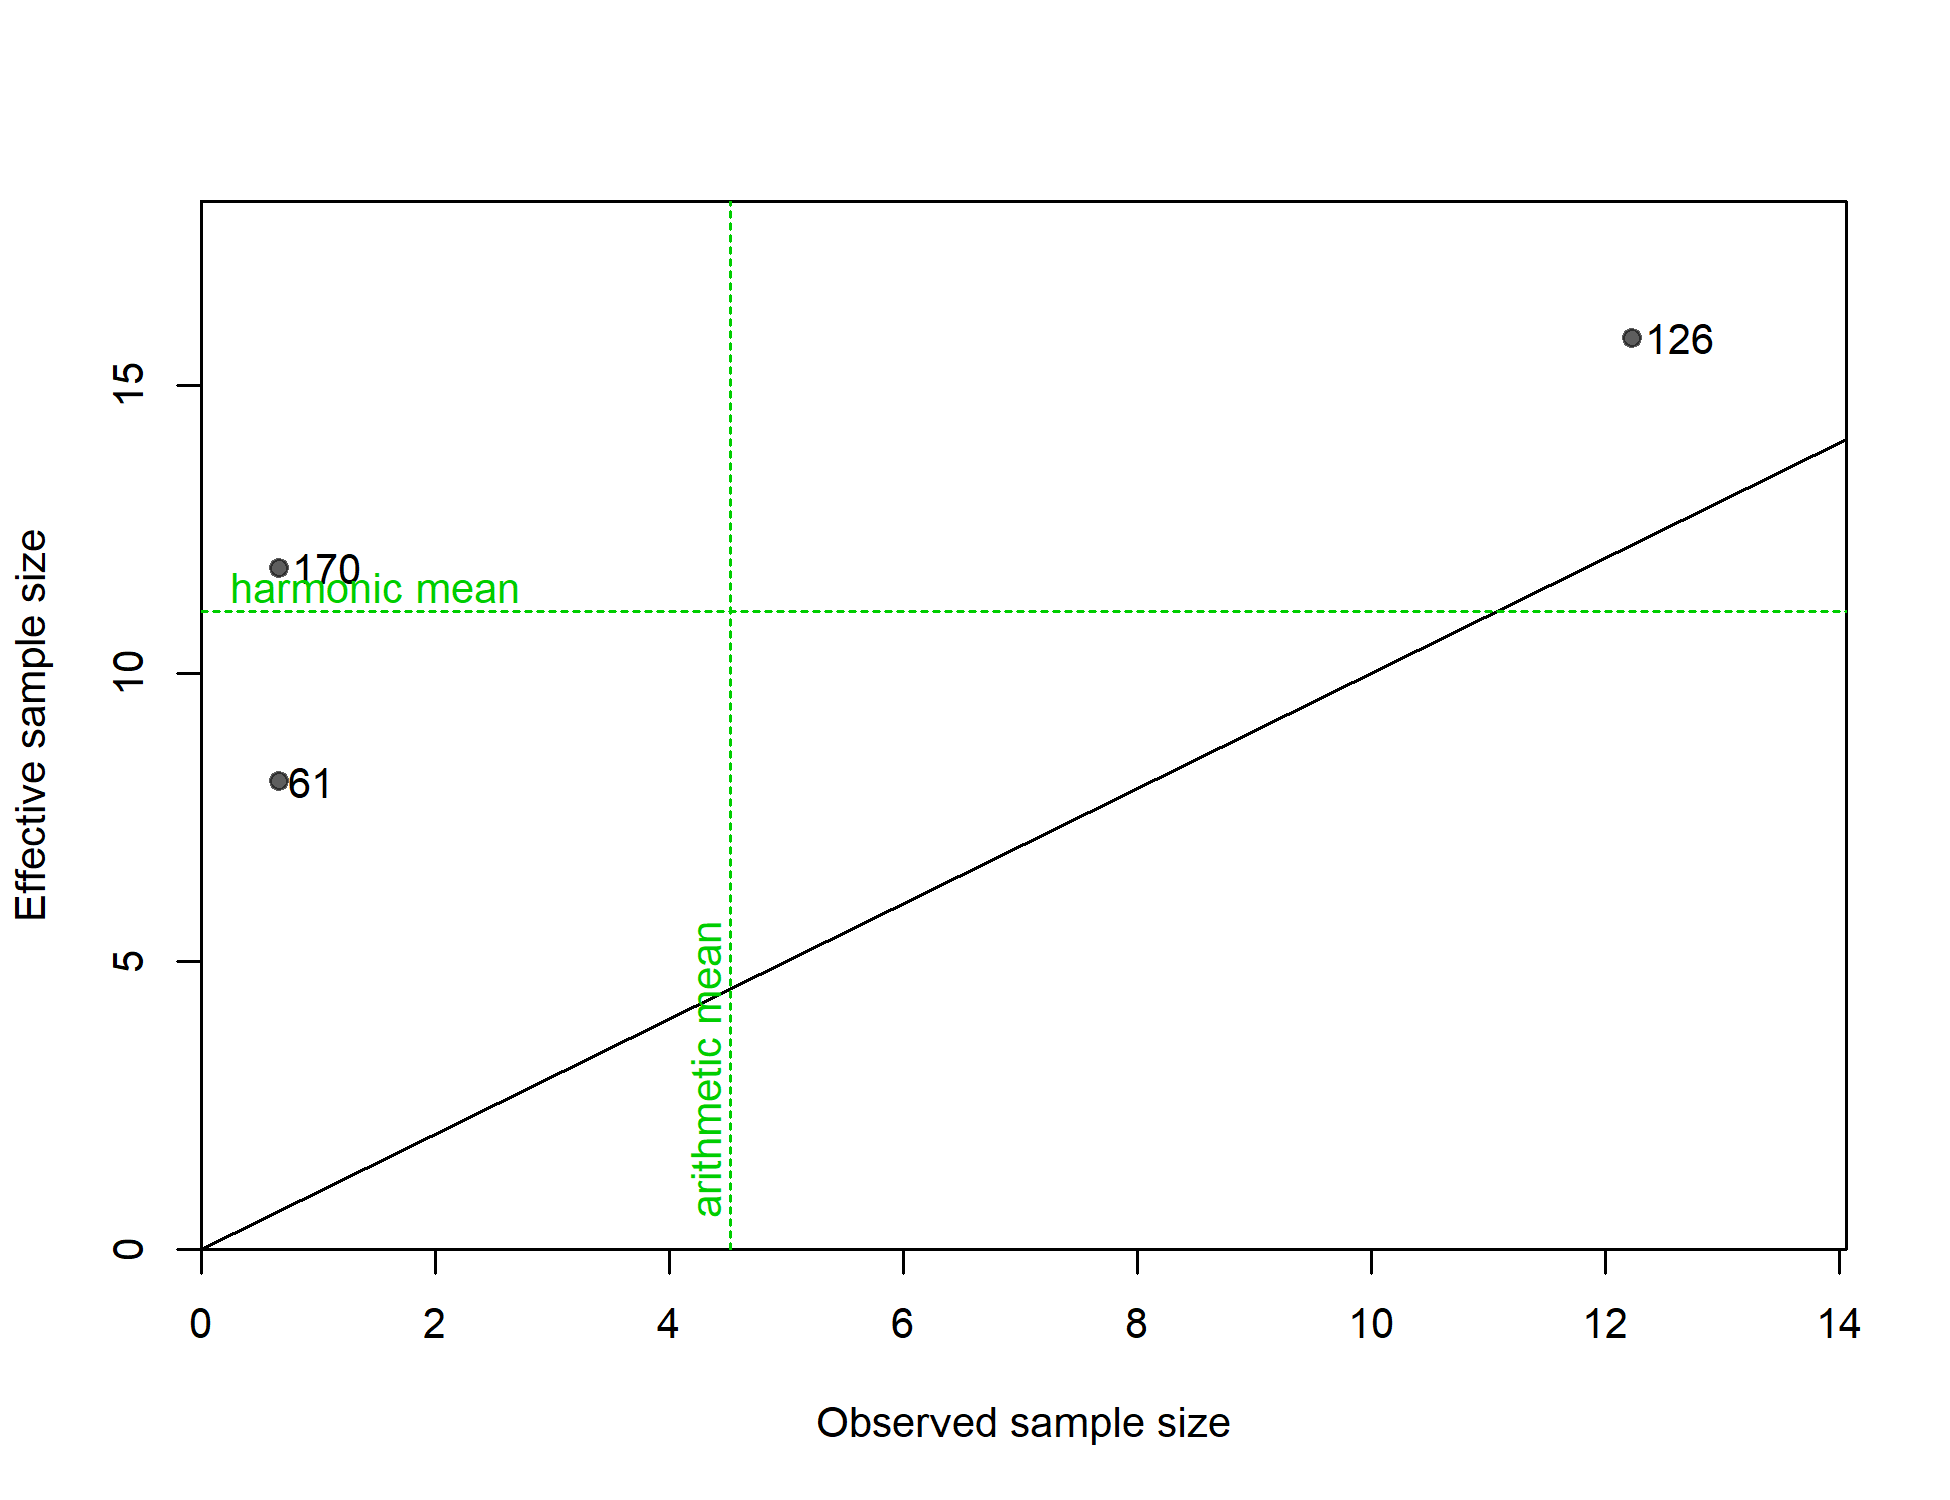
N-EffN comparison, Length comps, whole catch, A5-NOADEL
file: comp_lenfit_sampsize_flt22mkt0.png
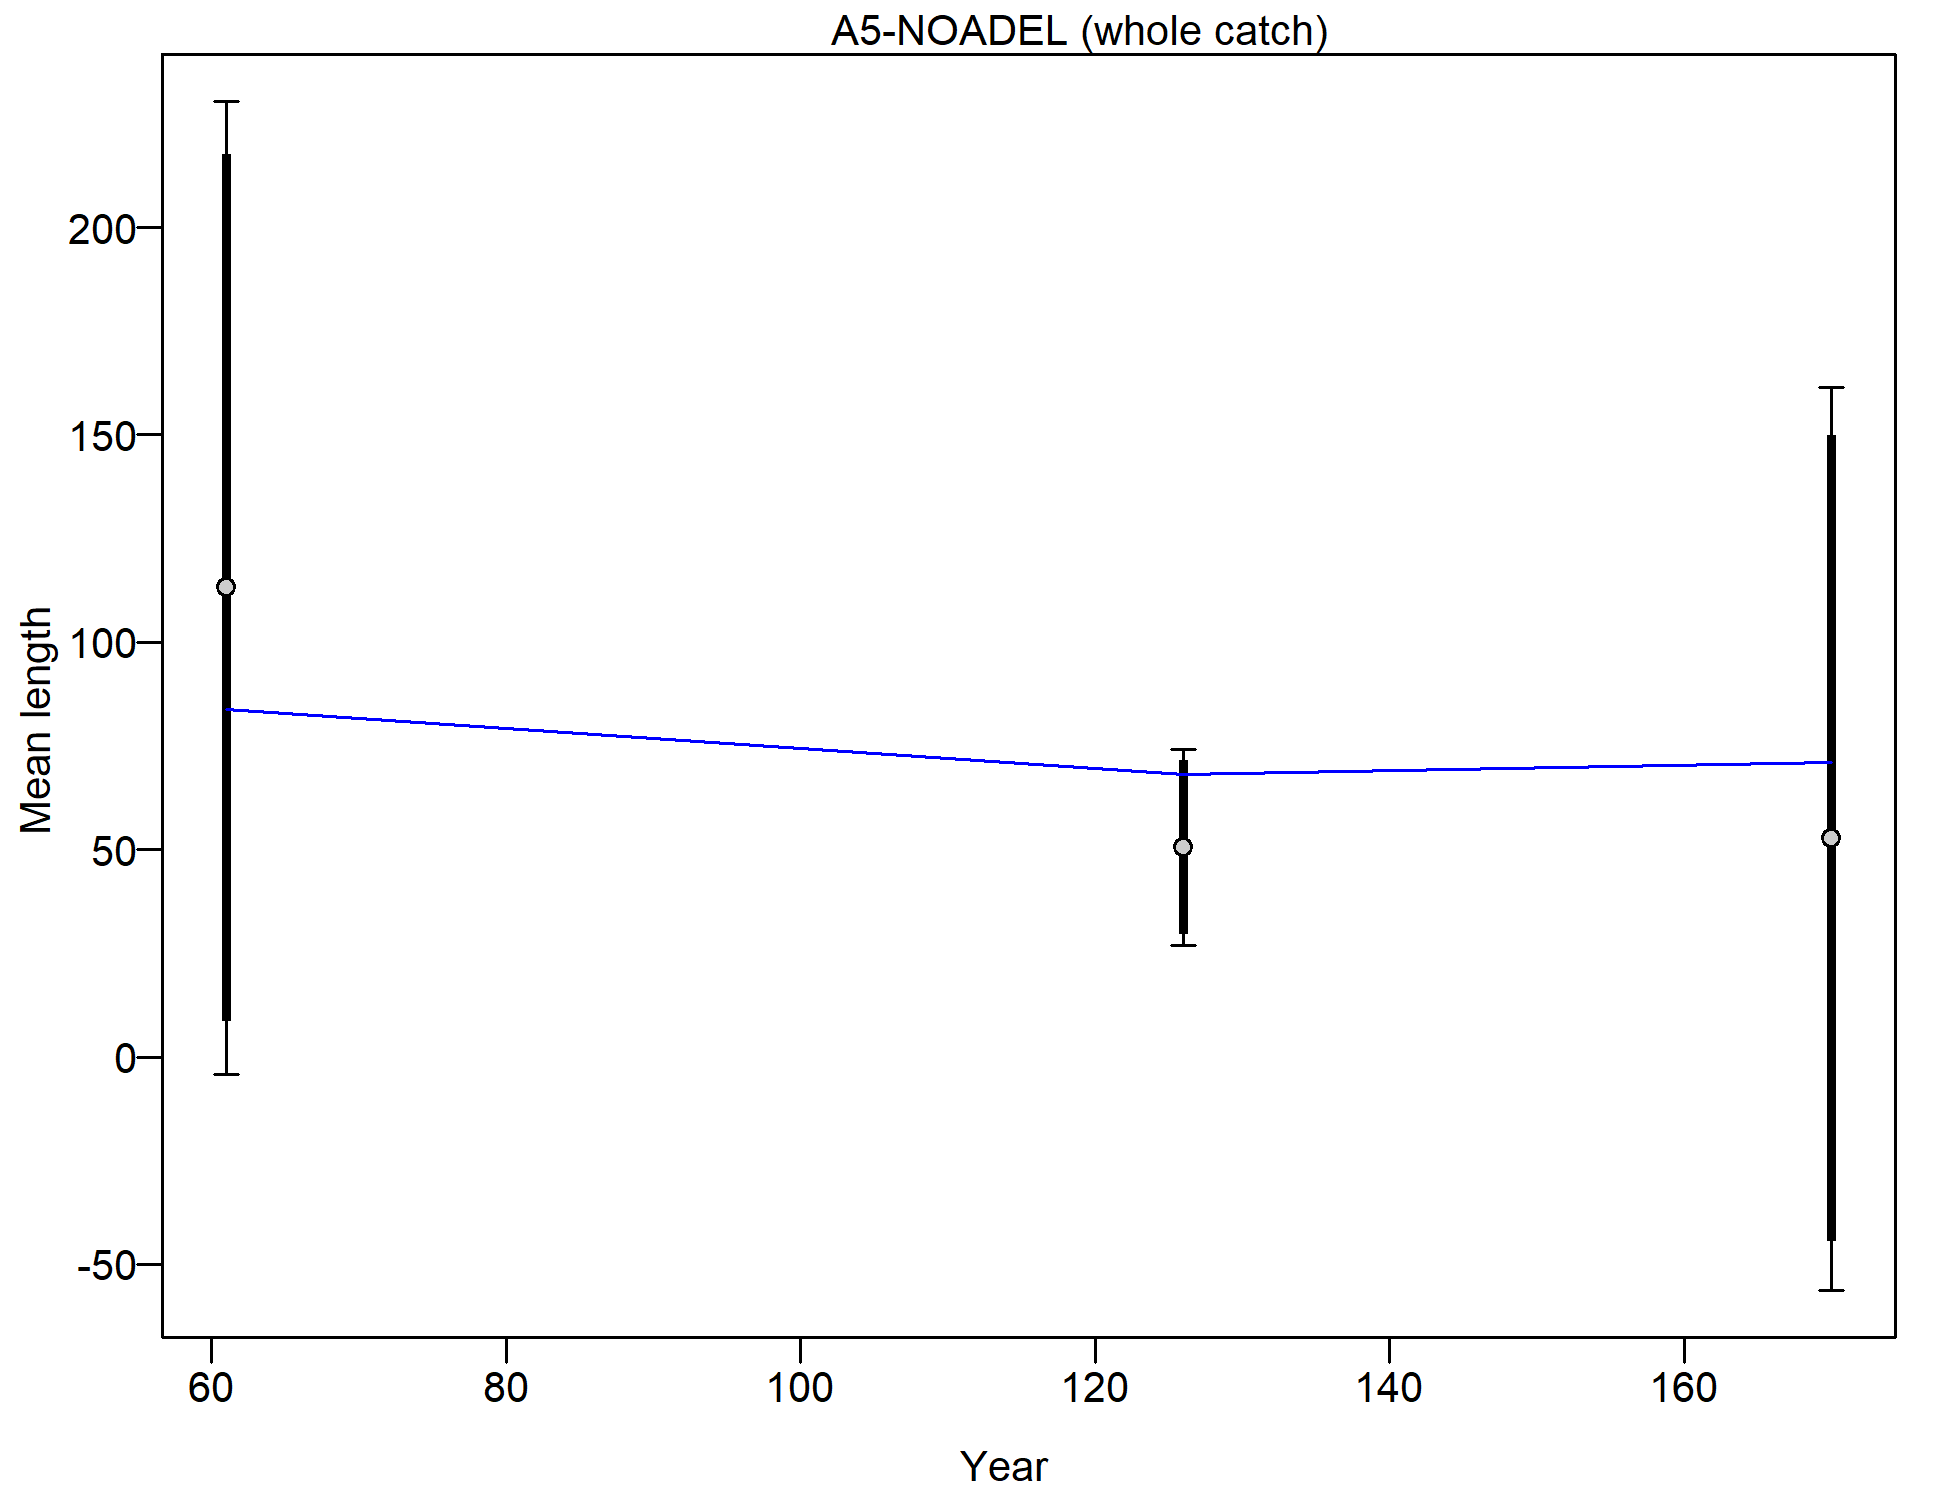
Mean length for A5-NOADEL with 95% confidence intervals based on current samples sizes.
Francis data weighting method TA1.8: thinner intervals (with capped ends) show result of further adjusting sample sizes based on suggested multiplier (with 95% interval) for len data from A5-NOADEL:
0.796 (0.6021-Inf)
For more info, see
Francis, R.I.C.C. (2011). Data weighting in statistical fisheries stock assessment models. Can. J. Fish. Aquat. Sci. 68: 1124-1138. https://doi.org/10.1139/f2011-025
Length comps, aggregated across time by fleet.
Labels 'retained' and 'discard' indicate discarded or retained sampled for each fleet. Panels without this designation represent the whole catch.
file: comp_lenfit__aggregated_across_time.png
Pearson residuals, comparing across fleets (plot 1 of 4)
Closed bubbles are positive residuals (observed > expected) and open bubbles are negative residuals (observed < expected).
file: comp_lenfit__page1_multi-fleet_comparison.png
Pearson residuals, comparing across fleets (plot 2 of 4)
file: comp_lenfit__page2_multi-fleet_comparison.png
Pearson residuals, comparing across fleets (plot 3 of 4)
file: comp_lenfit__page3_multi-fleet_comparison.png
Pearson residuals, comparing across fleets (plot 4 of 4)
file: comp_lenfit__page4_multi-fleet_comparison.png
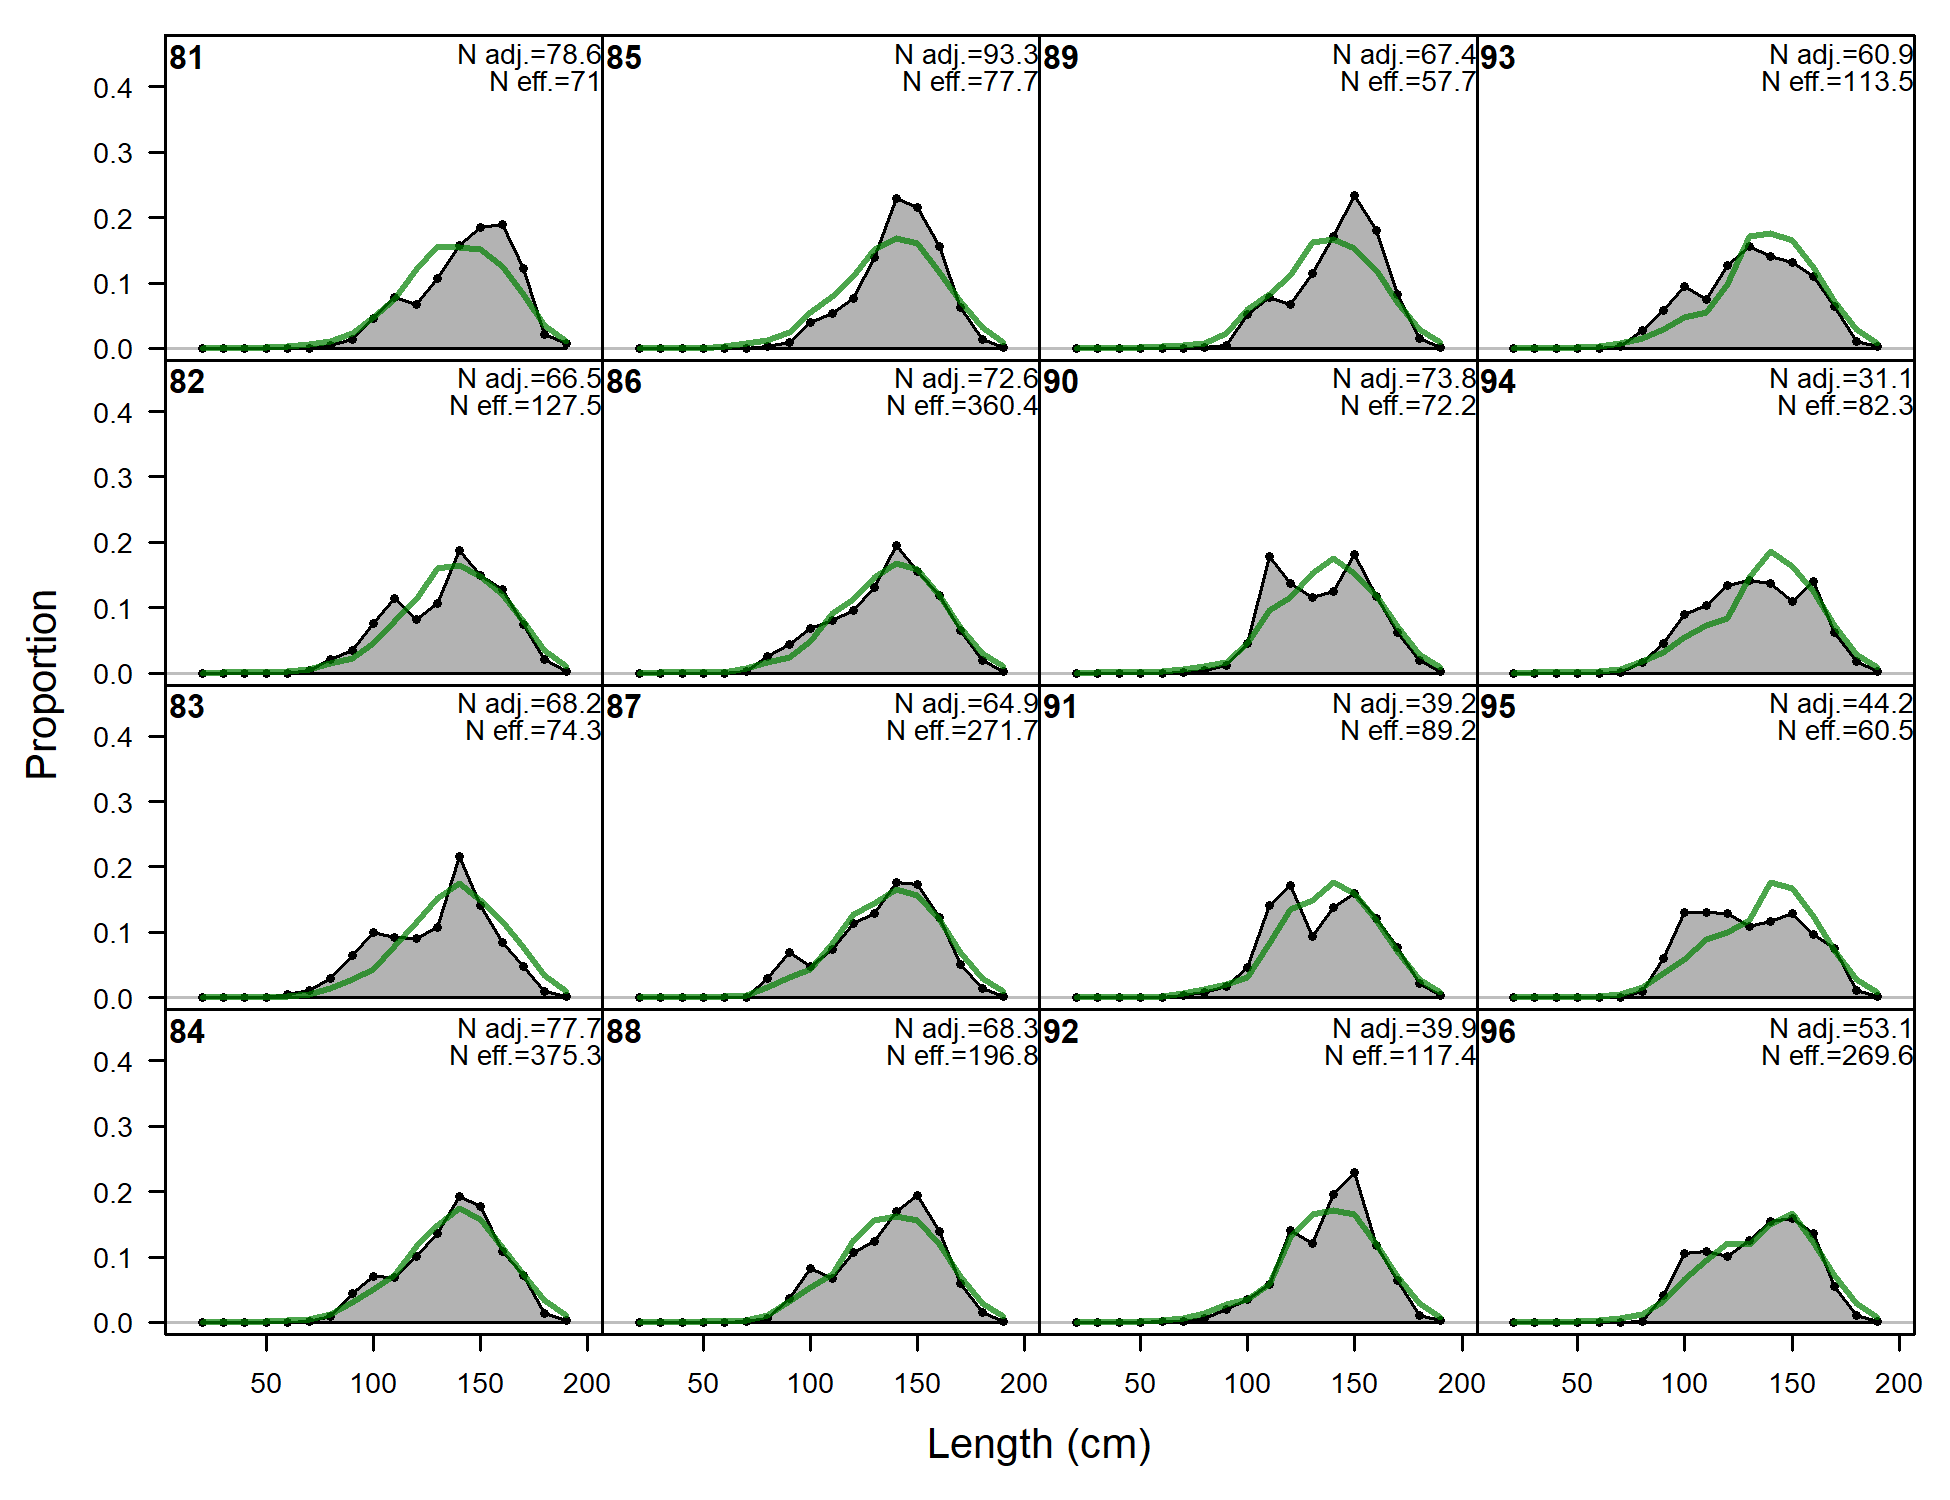
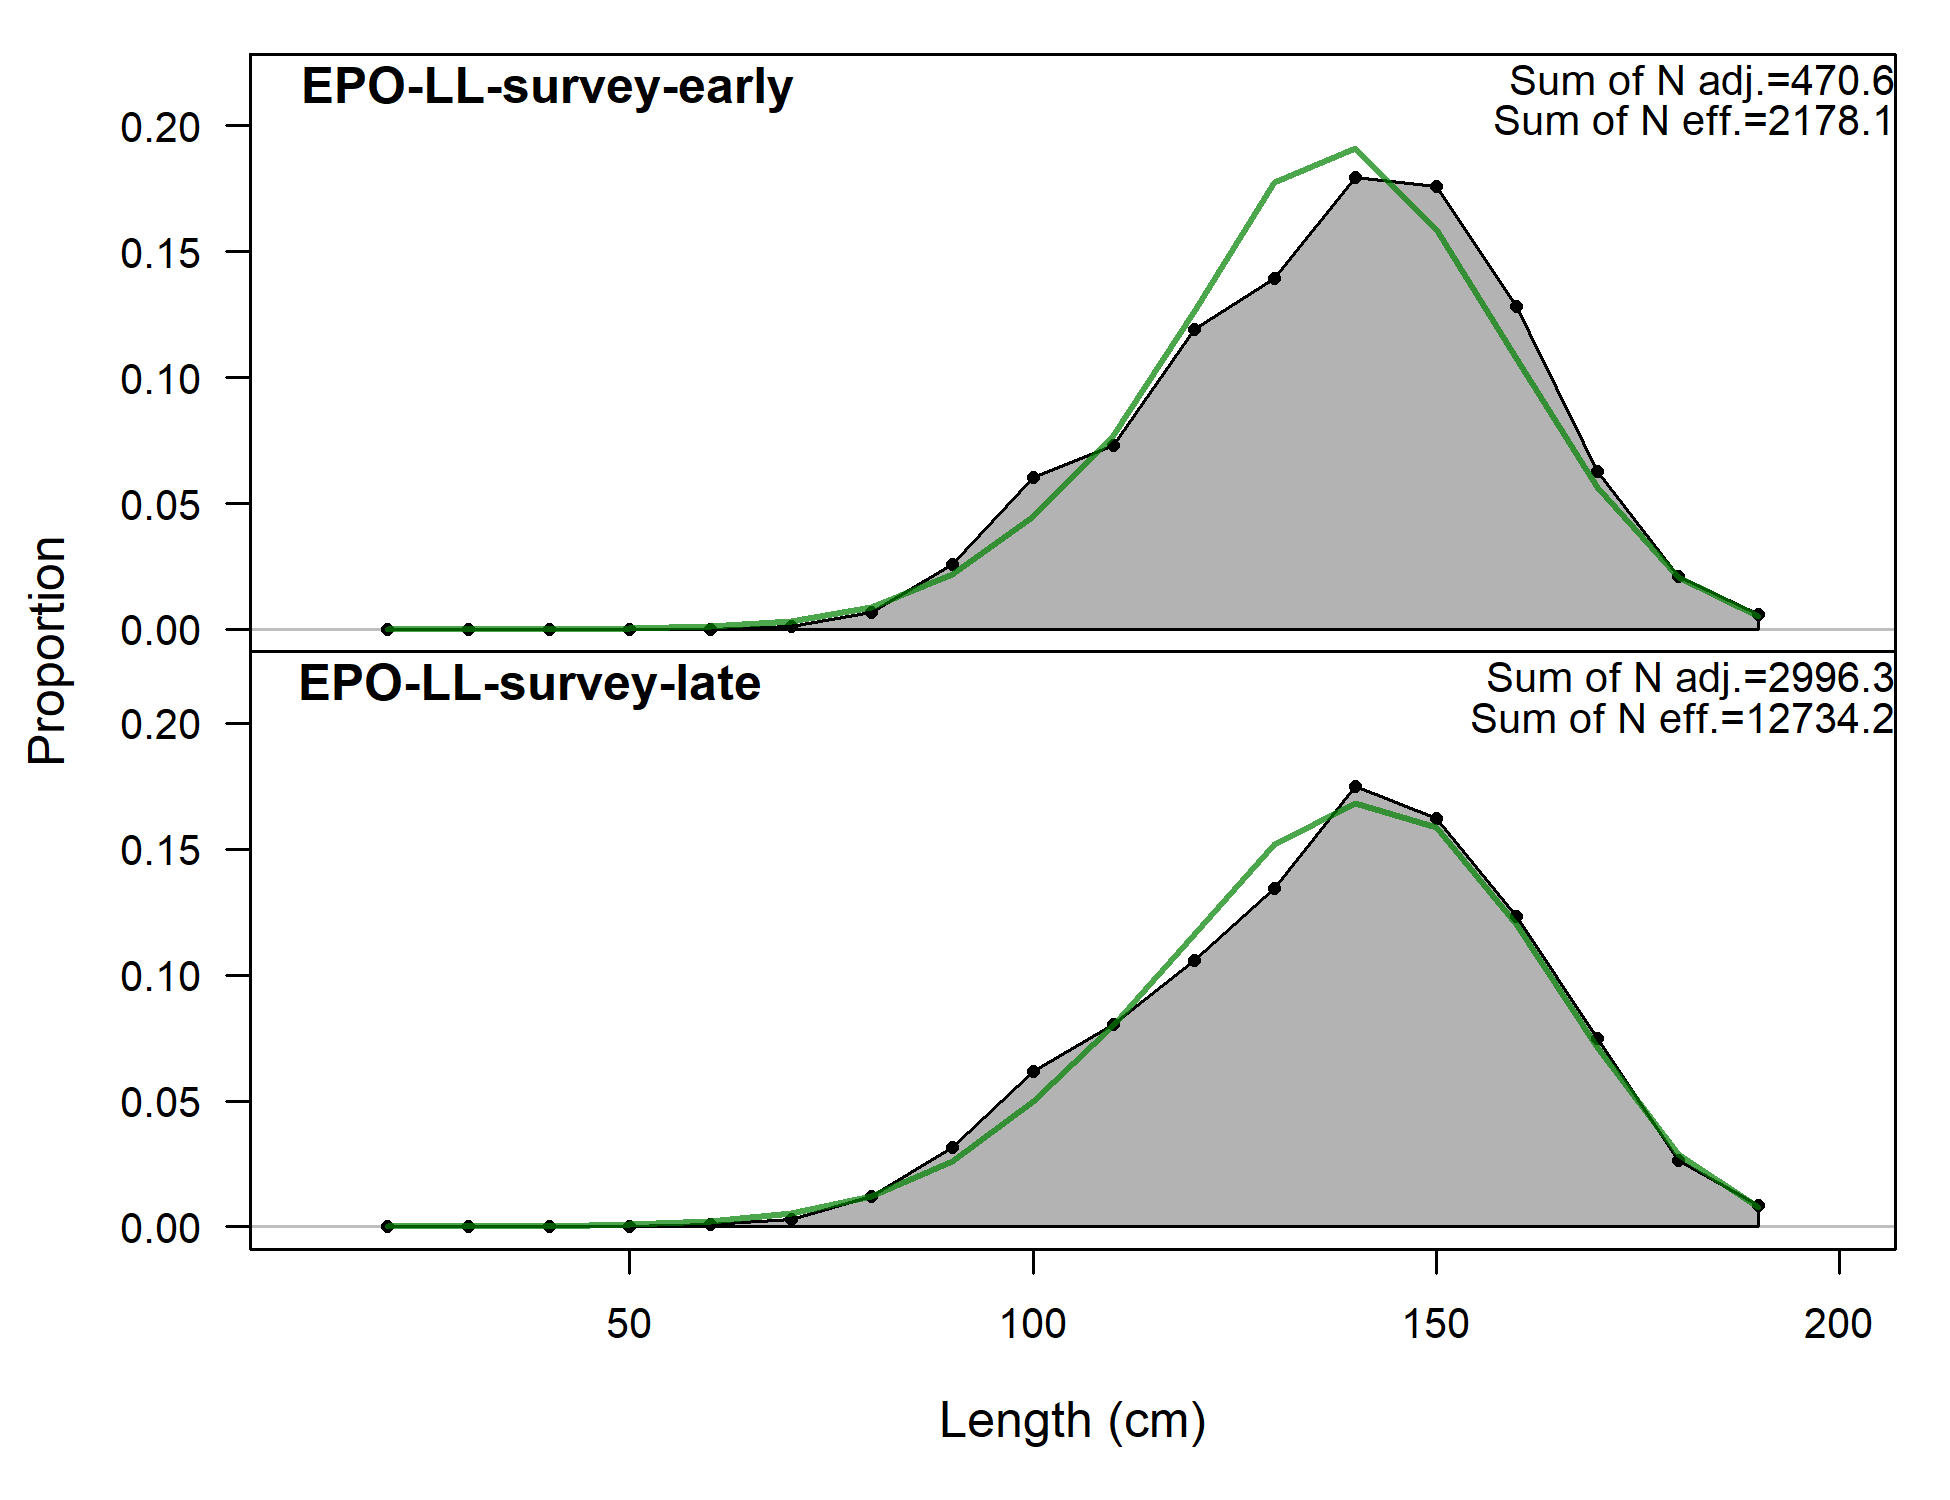
Size comps, whole catch, EPO-LL-survey-early (plot 1 of 2).
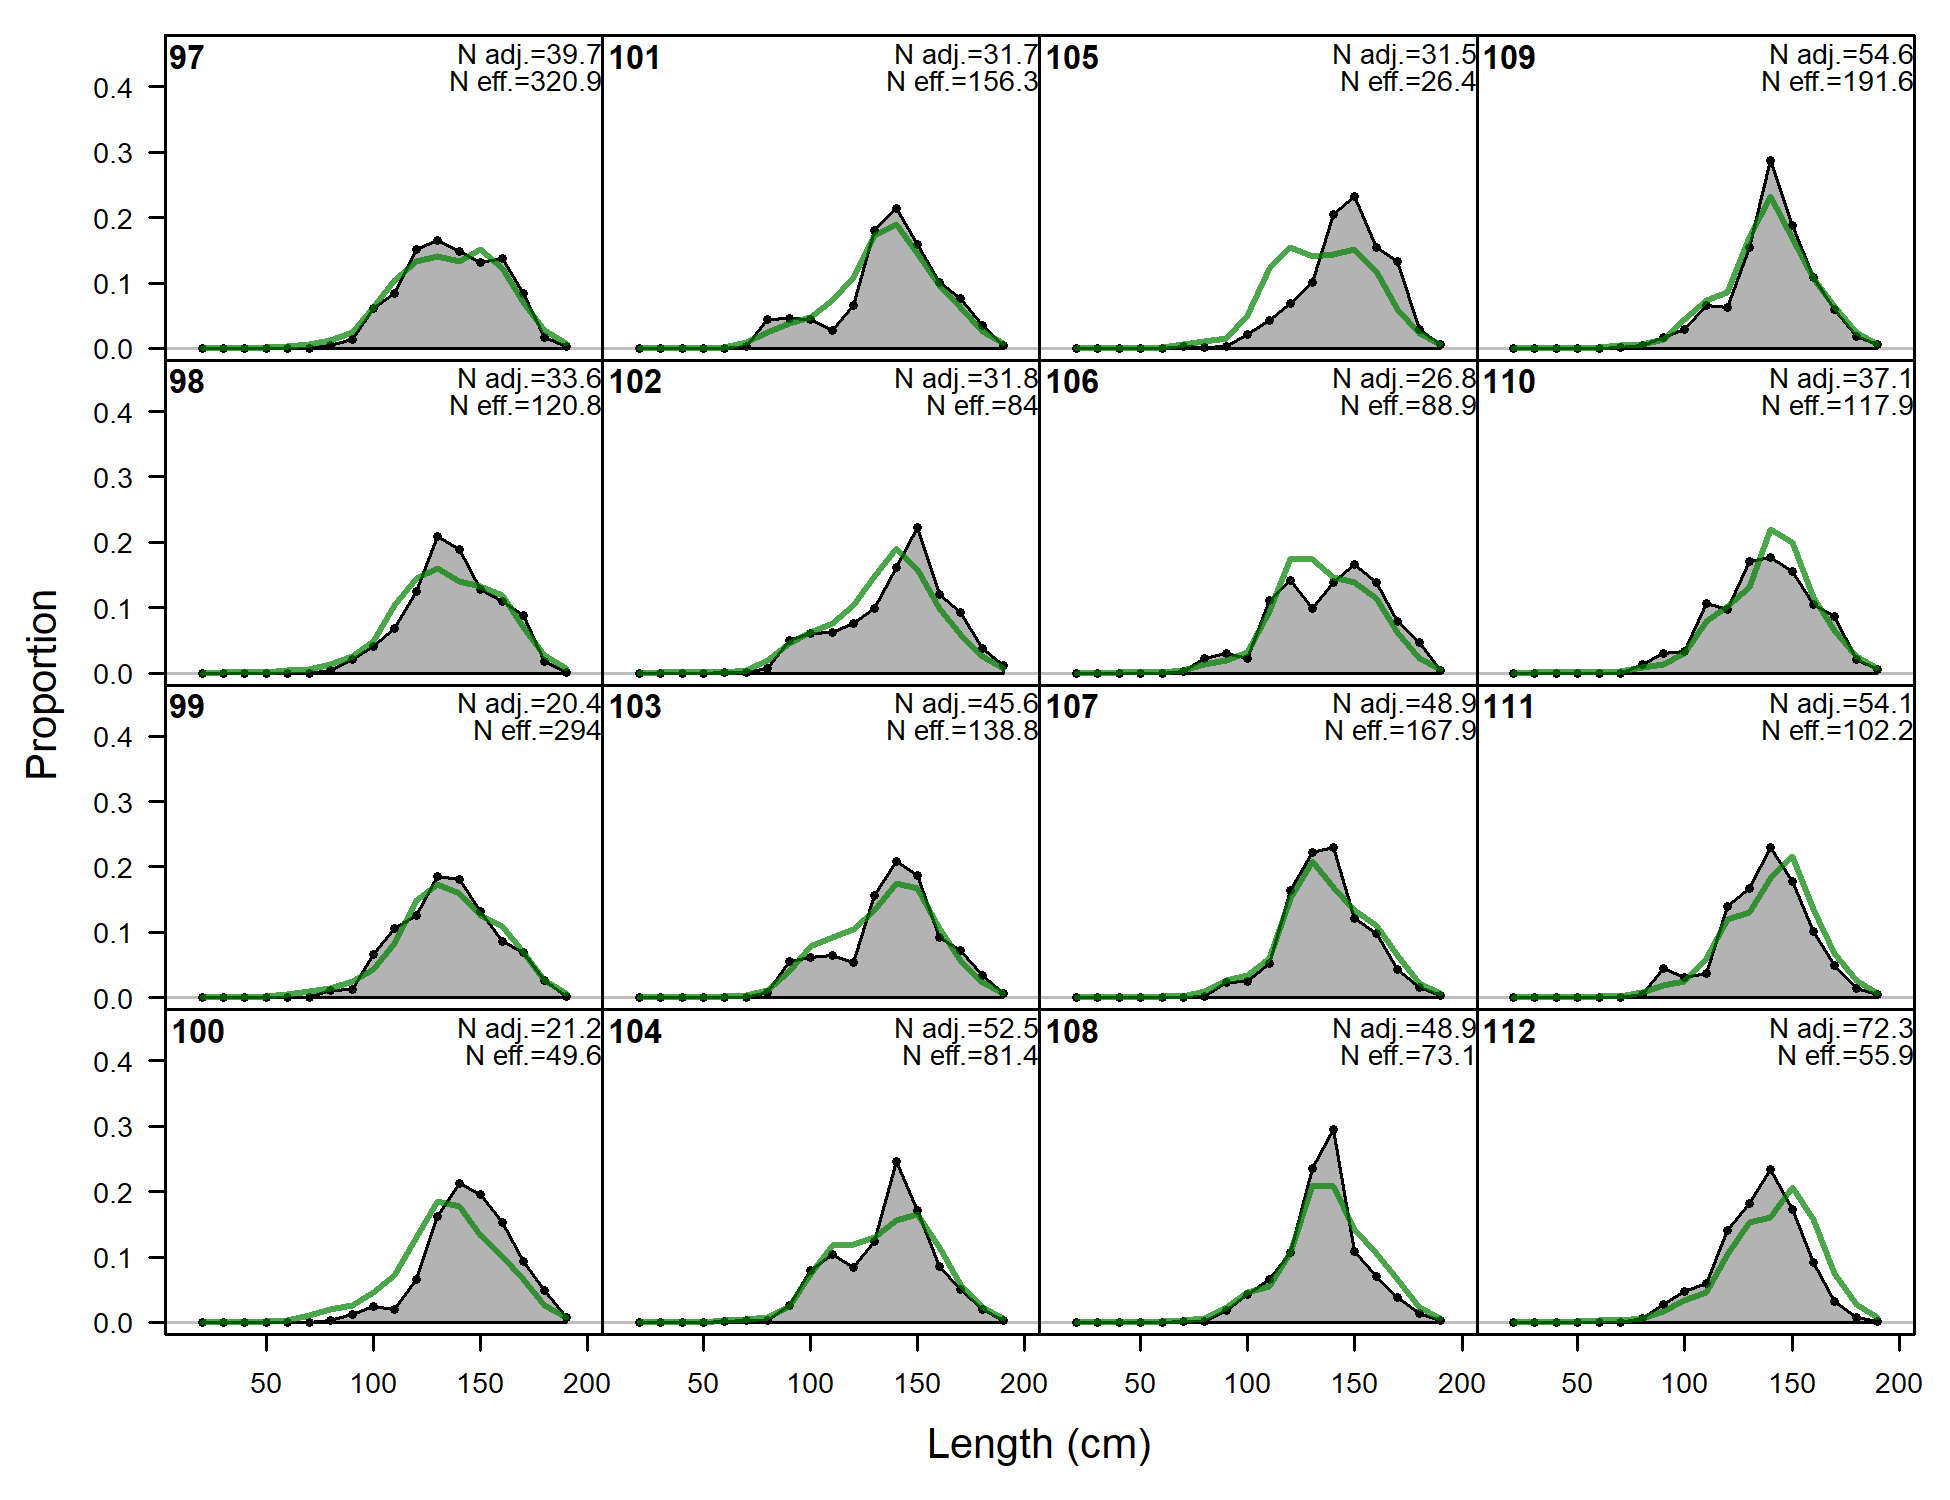
'N adj.' is the input sample size after data-weighting adjustment. N eff. is the calculated effective sample size used in the McAllister-Iannelli tuning method.
file: comp_sizefit_flt24mkt0_page1.png
Size comps, whole catch, EPO-LL-survey-early (plot 2 of 2)
file: comp_sizefit_flt24mkt0_page2.png
Pearson residuals, whole catch, EPO-LL-survey-early (max=1.9) (plot 2 of 2)
Closed bubbles are positive residuals (observed > expected) and open bubbles are negative residuals (observed < expected).
file: comp_sizefit_residsflt24mkt0_page2.png
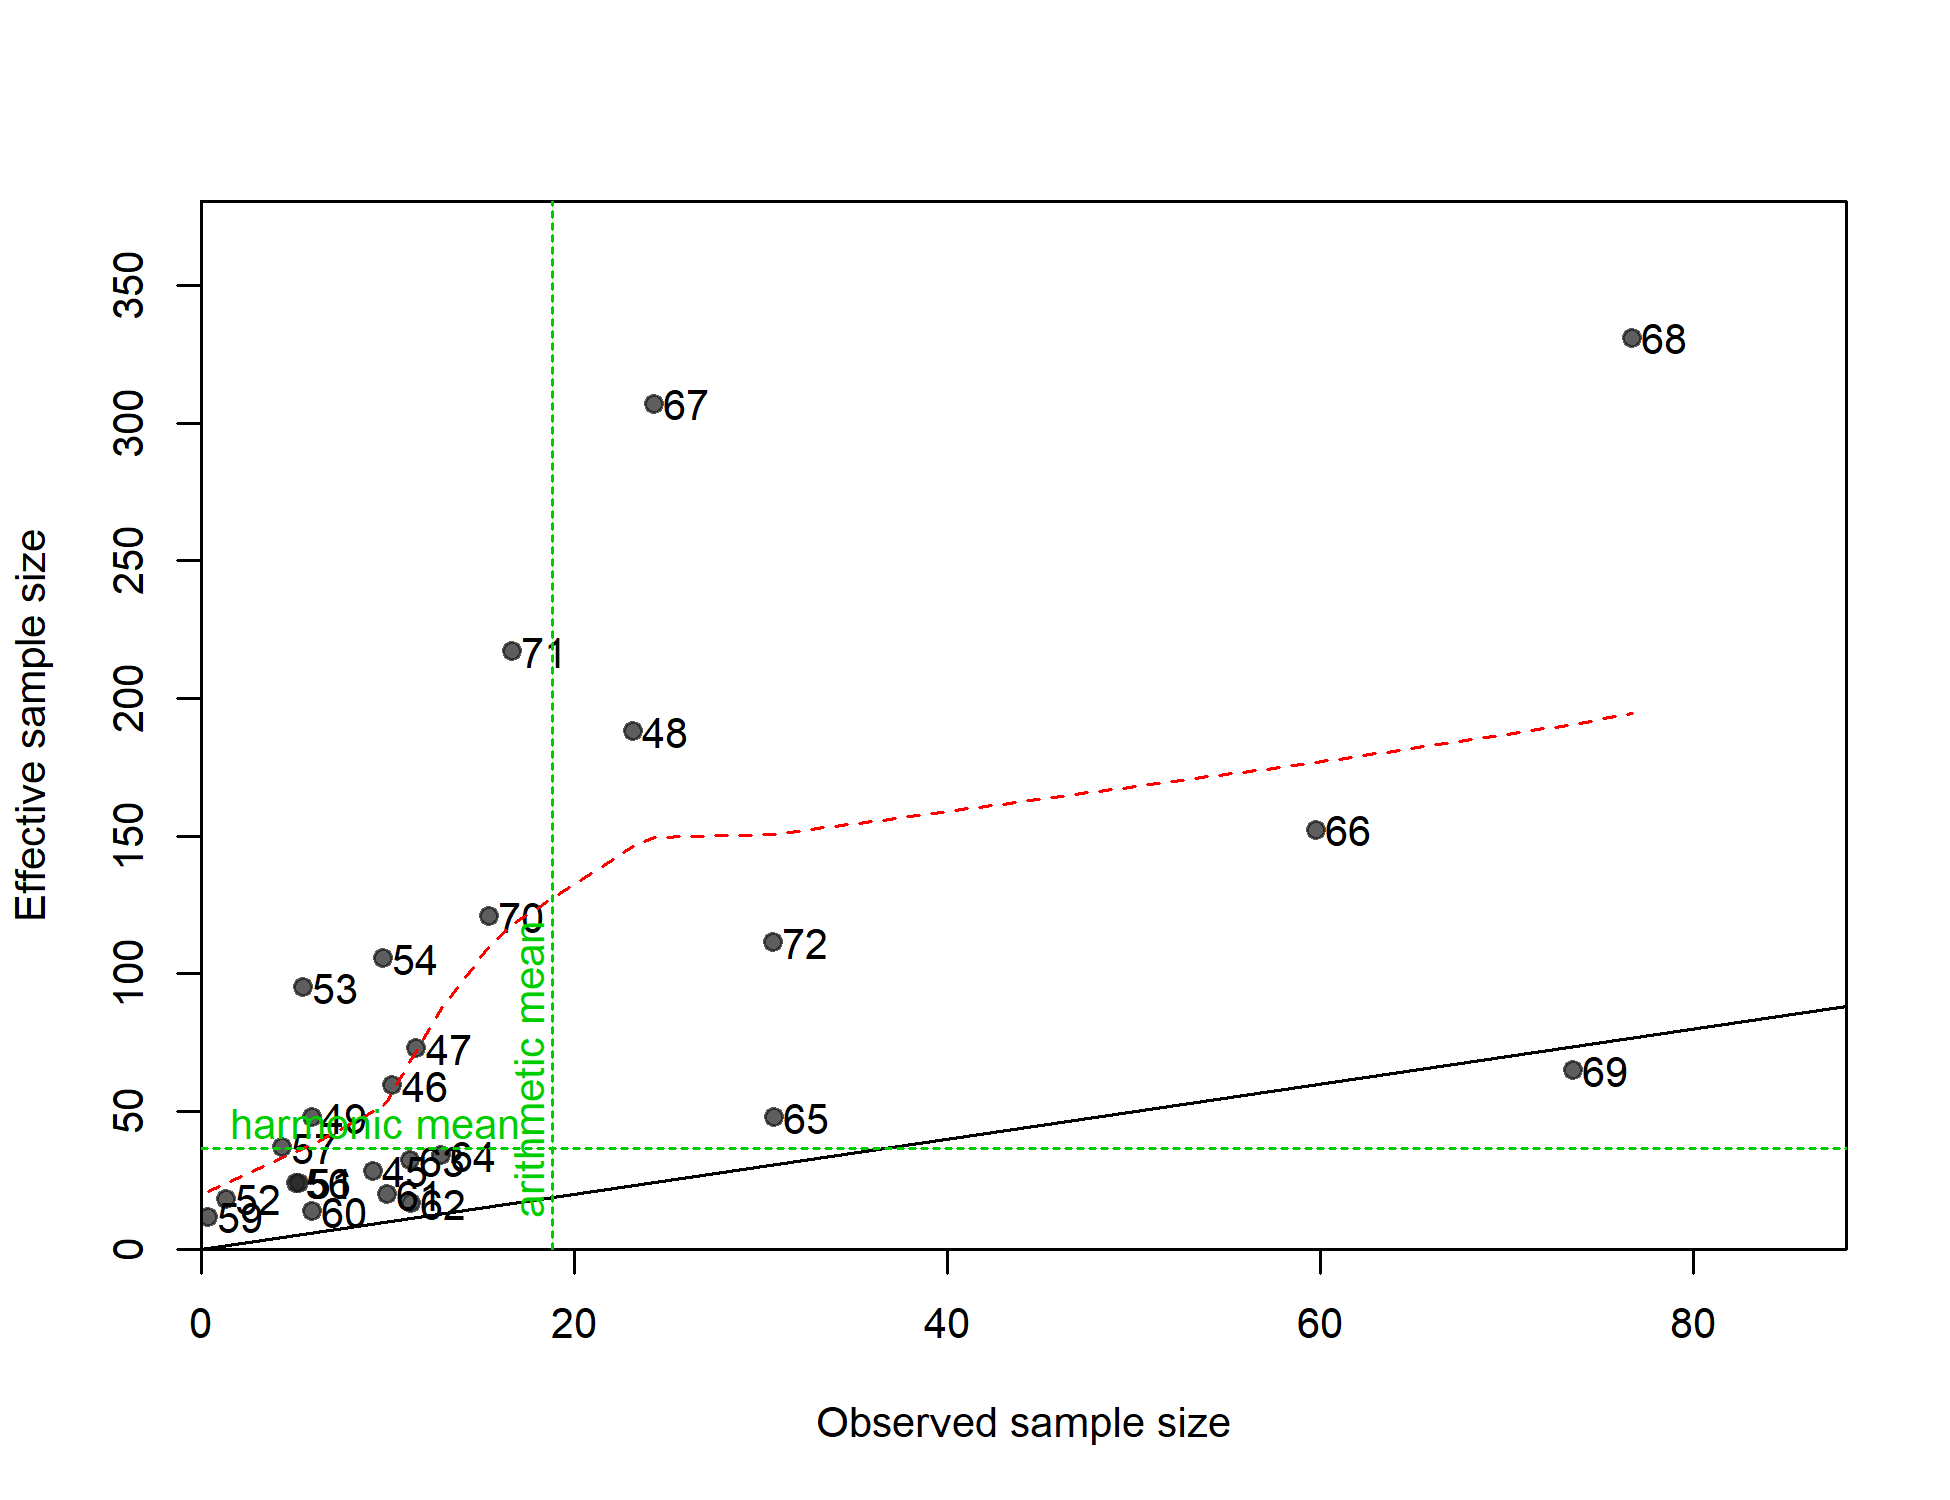
N-EffN comparison, Size comps, whole catch, EPO-LL-survey-early
file: comp_sizefit_sampsize_flt24mkt0.png
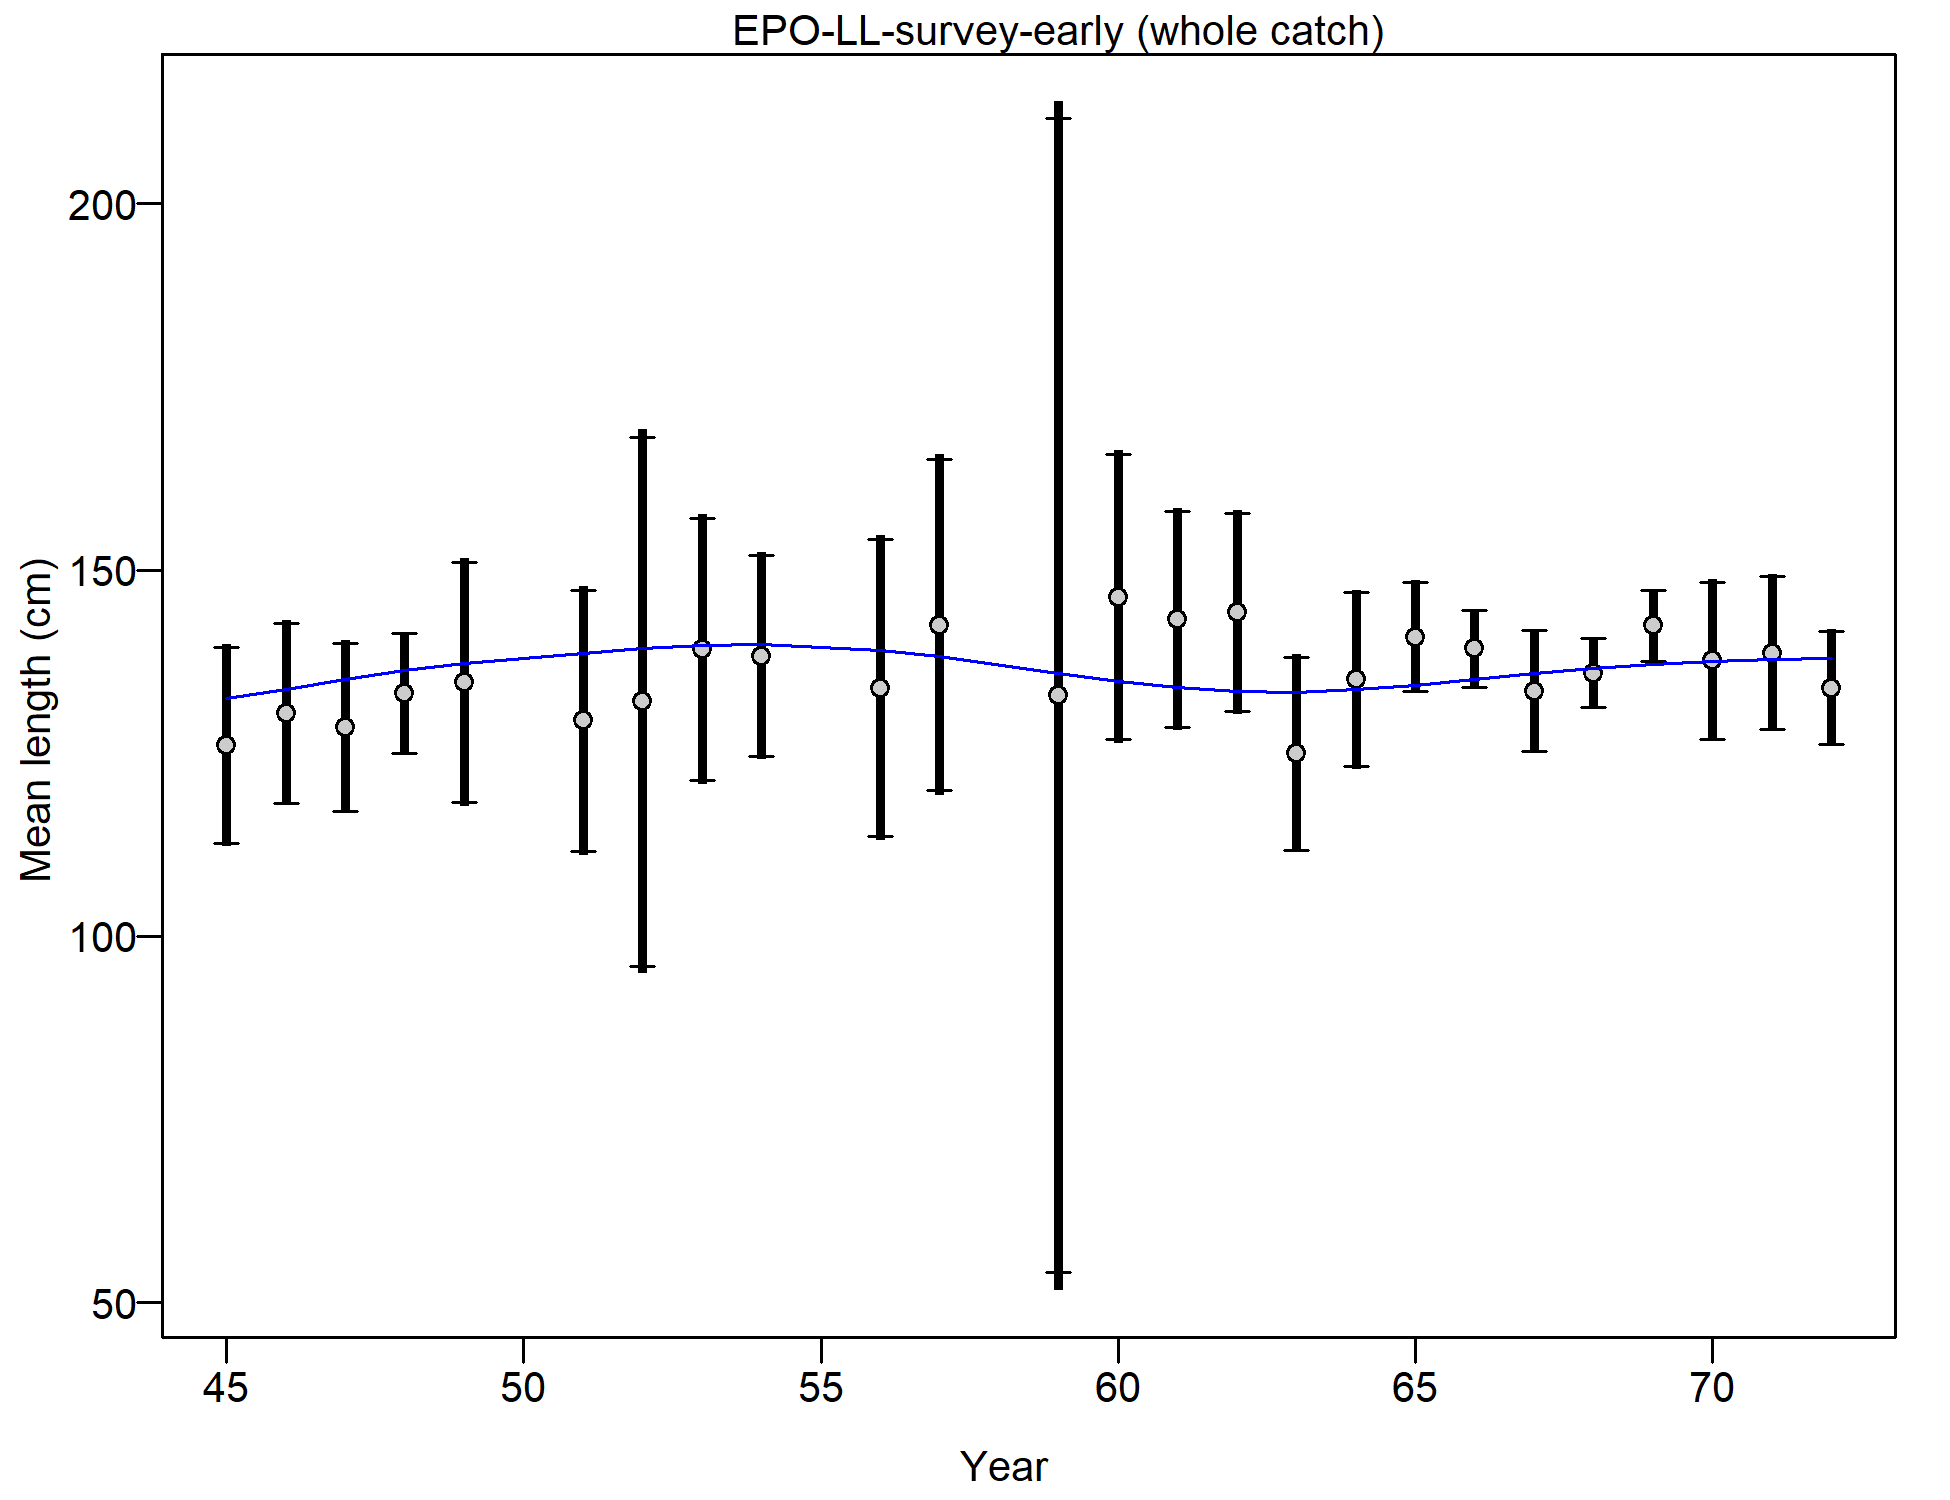
Mean size for EPO-LL-survey-early with 95% confidence intervals based on current samples sizes.
Francis data weighting method TA1.8: thinner intervals (with capped ends) show result of further adjusting sample sizes based on suggested multiplier (with 95% interval) for size data from EPO-LL-survey-early:
1.0602 (0.7515-2.0181)
For more info, see
Francis, R.I.C.C. (2011). Data weighting in statistical fisheries stock assessment models. Can. J. Fish. Aquat. Sci. 68: 1124-1138. https://doi.org/10.1139/f2011-025
Size comps, whole catch, EPO-LL-survey-late (plot 1 of 6).
'N adj.' is the input sample size after data-weighting adjustment. N eff. is the calculated effective sample size used in the McAllister-Iannelli tuning method.
file: comp_sizefit_flt25mkt0_page1.png
Size comps, whole catch, EPO-LL-survey-late (plot 2 of 6)
file: comp_sizefit_flt25mkt0_page2.png

Size comps, whole catch, EPO-LL-survey-late (plot 3 of 6)
file: comp_sizefit_flt25mkt0_page3.png
Size comps, whole catch, EPO-LL-survey-late (plot 4 of 6)
file: comp_sizefit_flt25mkt0_page4.png
Size comps, whole catch, EPO-LL-survey-late (plot 5 of 6)
file: comp_sizefit_flt25mkt0_page5.png
Size comps, whole catch, EPO-LL-survey-late (plot 6 of 6)
file: comp_sizefit_flt25mkt0_page6.png
Pearson residuals, whole catch, EPO-LL-survey-late (max=2.91) (plot 6 of 6)
Closed bubbles are positive residuals (observed > expected) and open bubbles are negative residuals (observed < expected).
file: comp_sizefit_residsflt25mkt0_page6.png
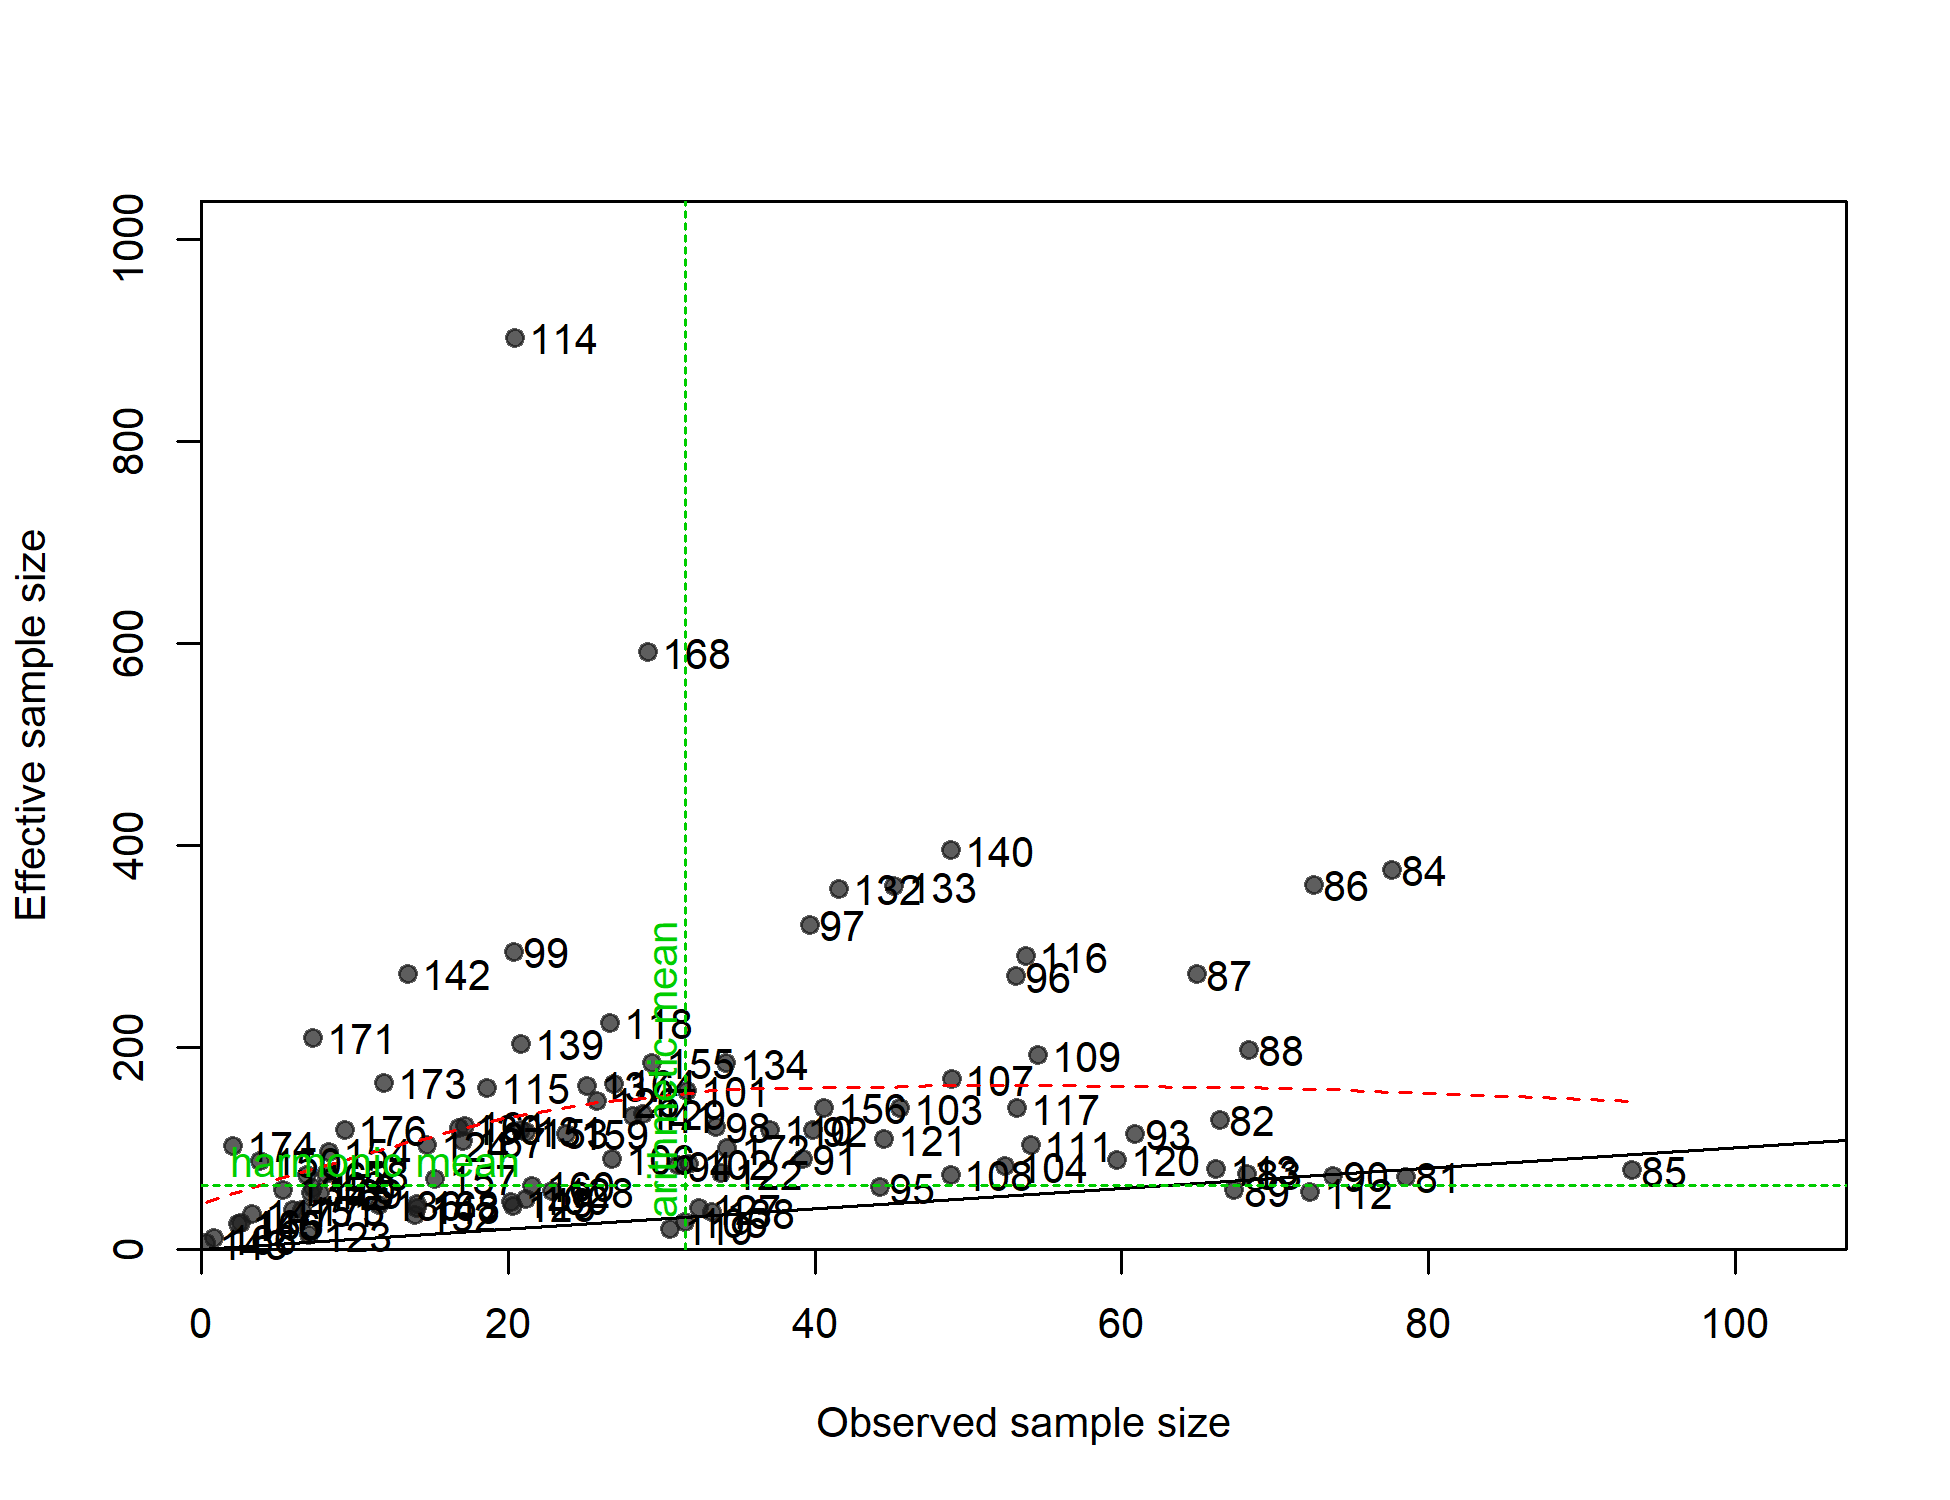
N-EffN comparison, Size comps, whole catch, EPO-LL-survey-late
file: comp_sizefit_sampsize_flt25mkt0.png
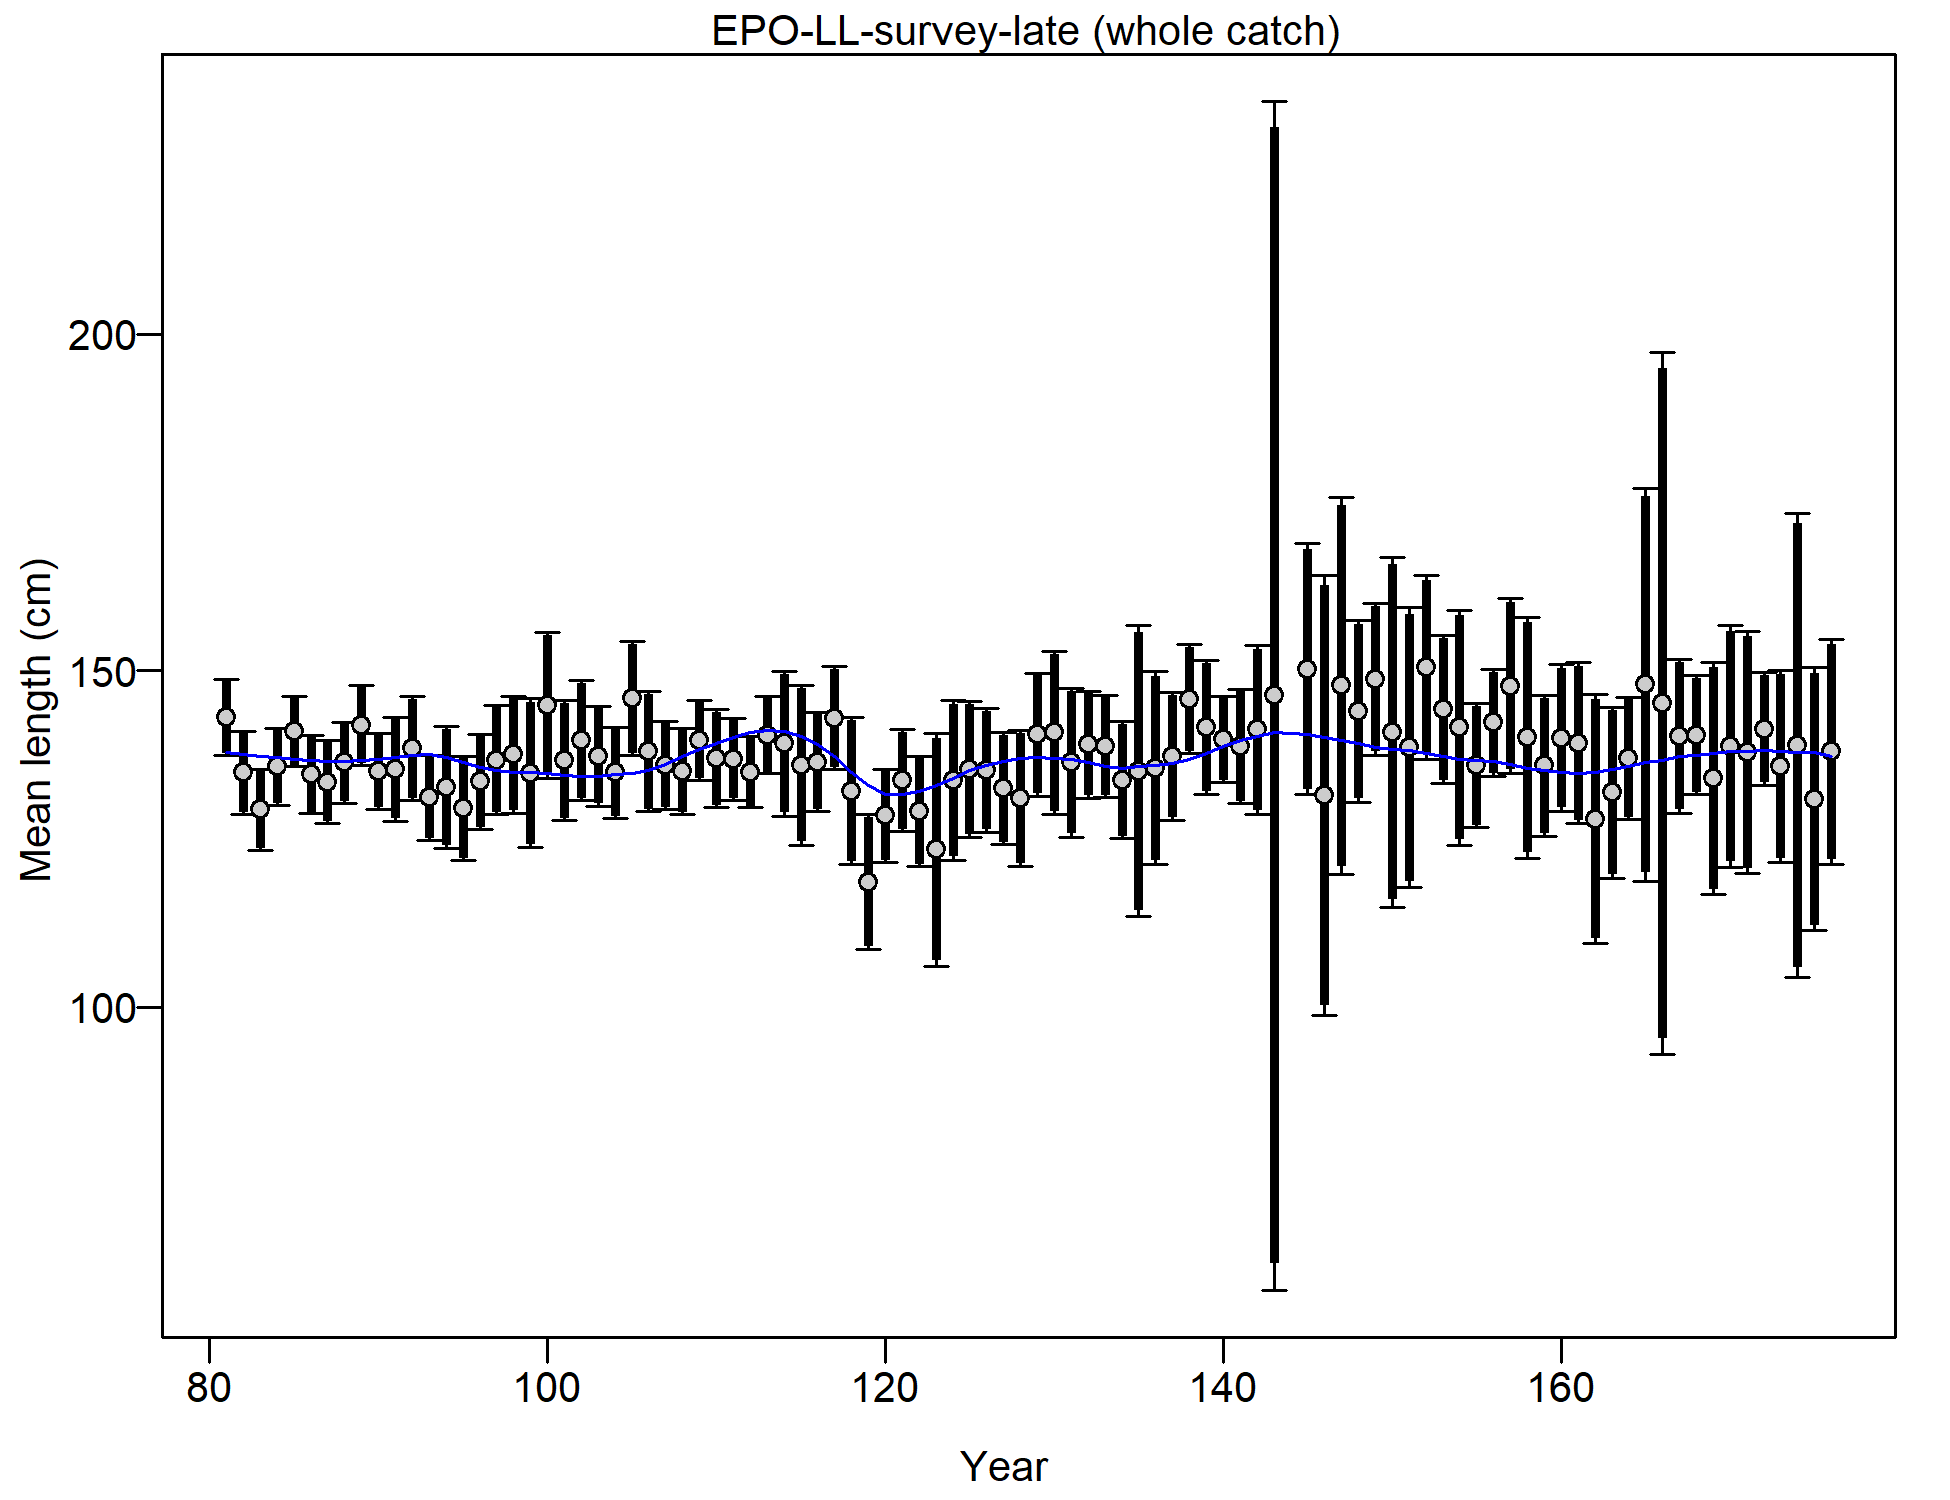
Mean size for EPO-LL-survey-late with 95% confidence intervals based on current samples sizes.
Francis data weighting method TA1.8: thinner intervals (with capped ends) show result of further adjusting sample sizes based on suggested multiplier (with 95% interval) for size data from EPO-LL-survey-late:
0.9138 (0.6892-1.3685)
For more info, see
Francis, R.I.C.C. (2011). Data weighting in statistical fisheries stock assessment models. Can. J. Fish. Aquat. Sci. 68: 1124-1138. https://doi.org/10.1139/f2011-025
Size comps, aggregated across time by fleet.
Labels 'retained' and 'discard' indicate discarded or retained sampled for each fleet. Panels without this designation represent the whole catch.
file: comp_sizefit__aggregated_across_time.png