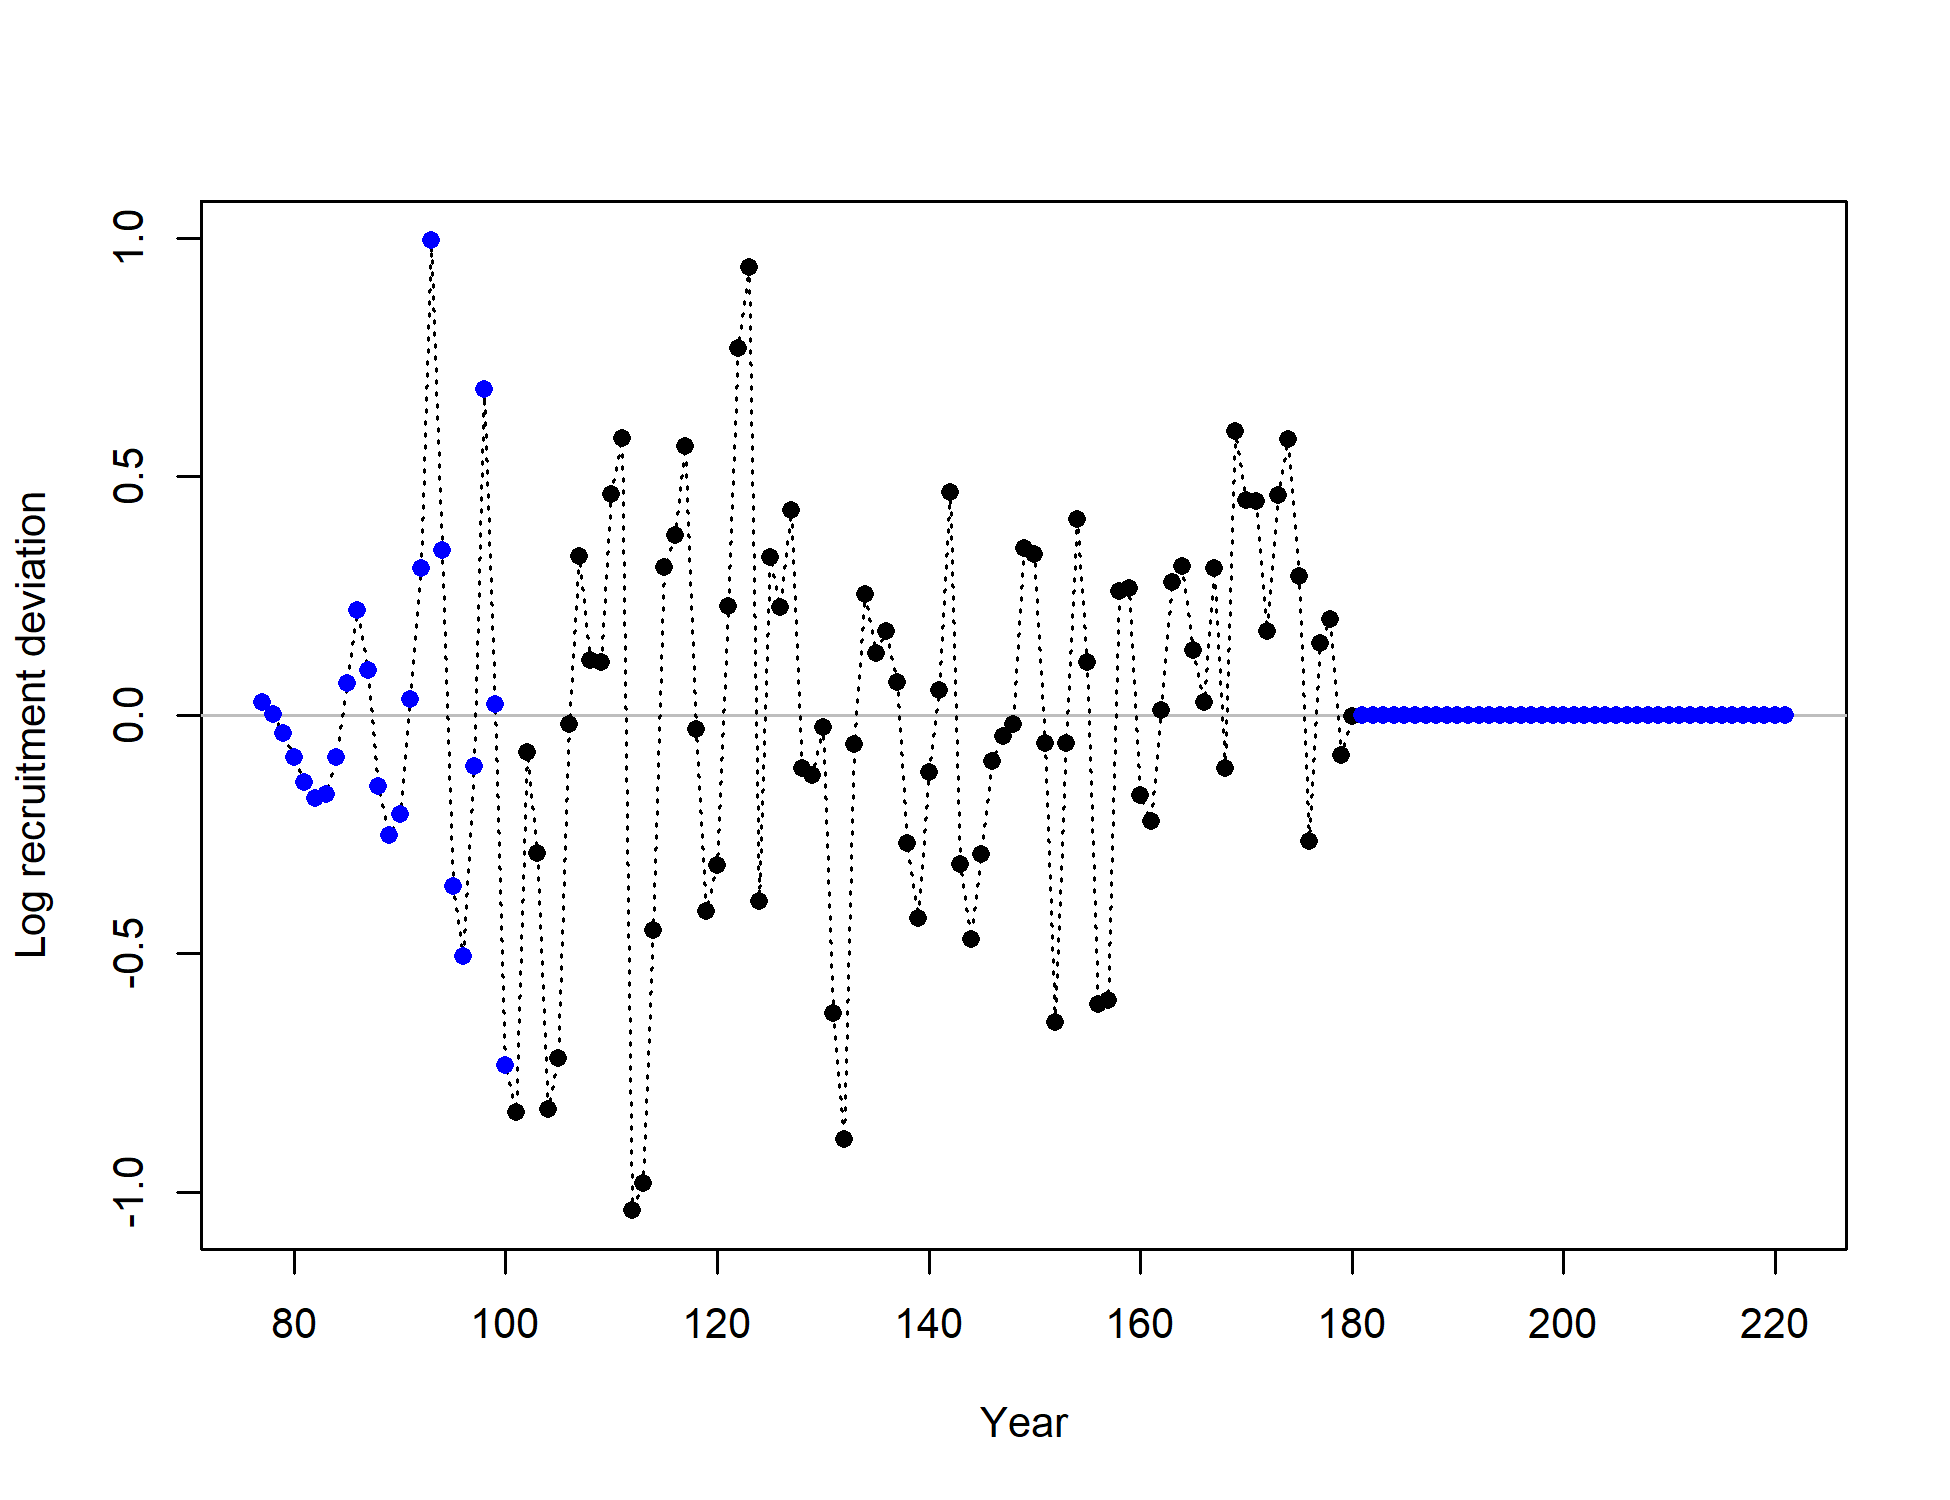
Recruitment deviations
file: recdevs1_points.png
Recruitment deviations
file: recdevs1_points.png
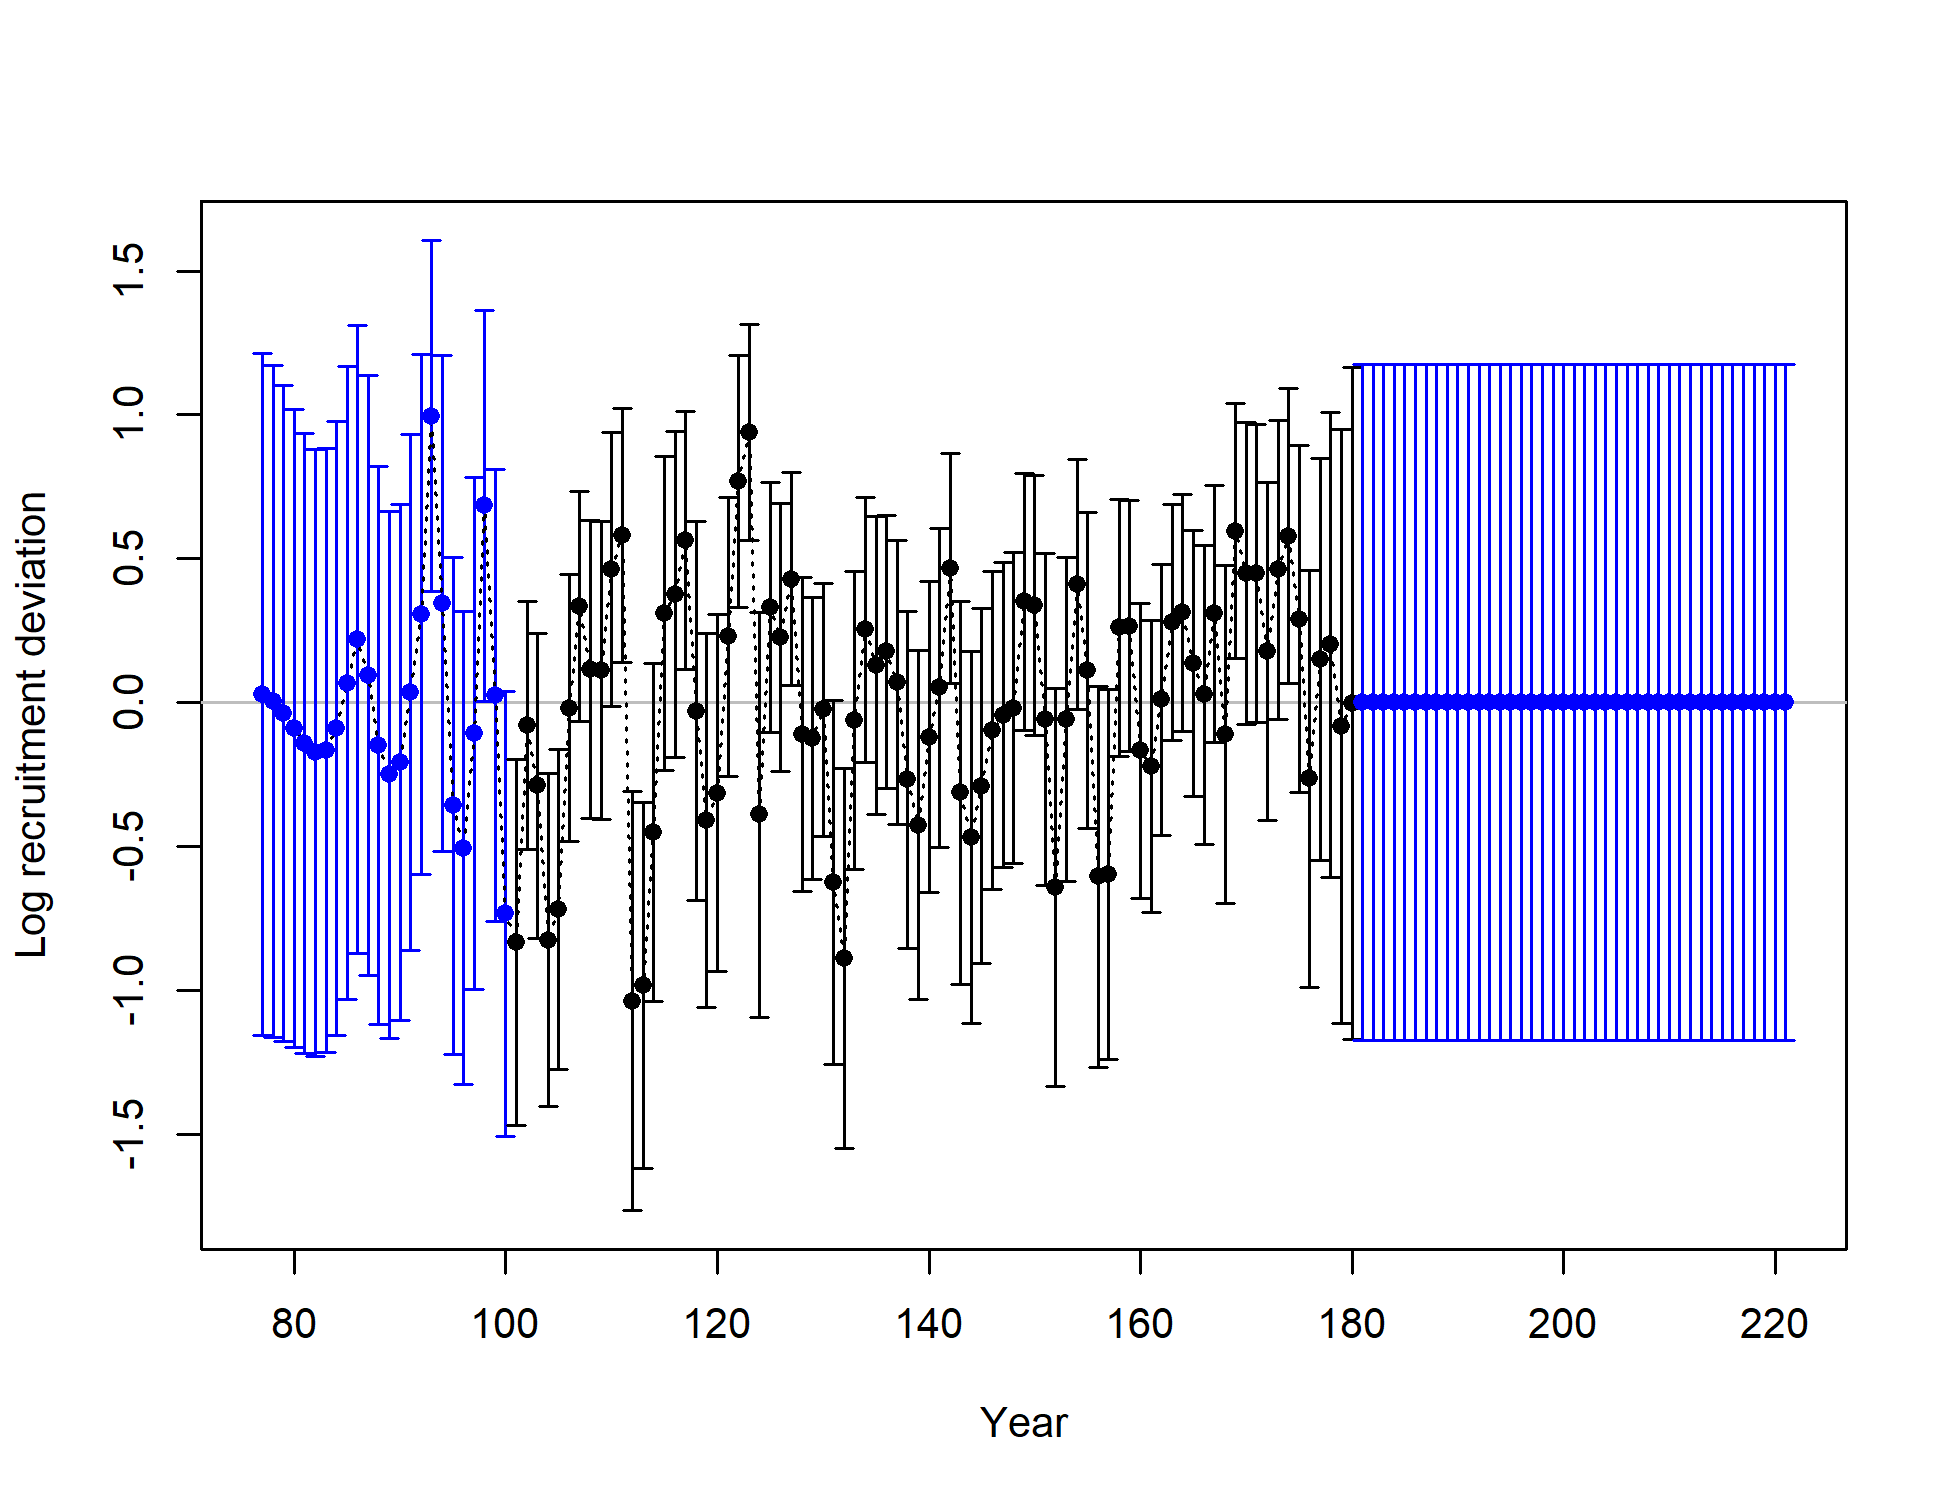
Recruitment deviations with 95% intervals
file: recdevs2_withbars.png
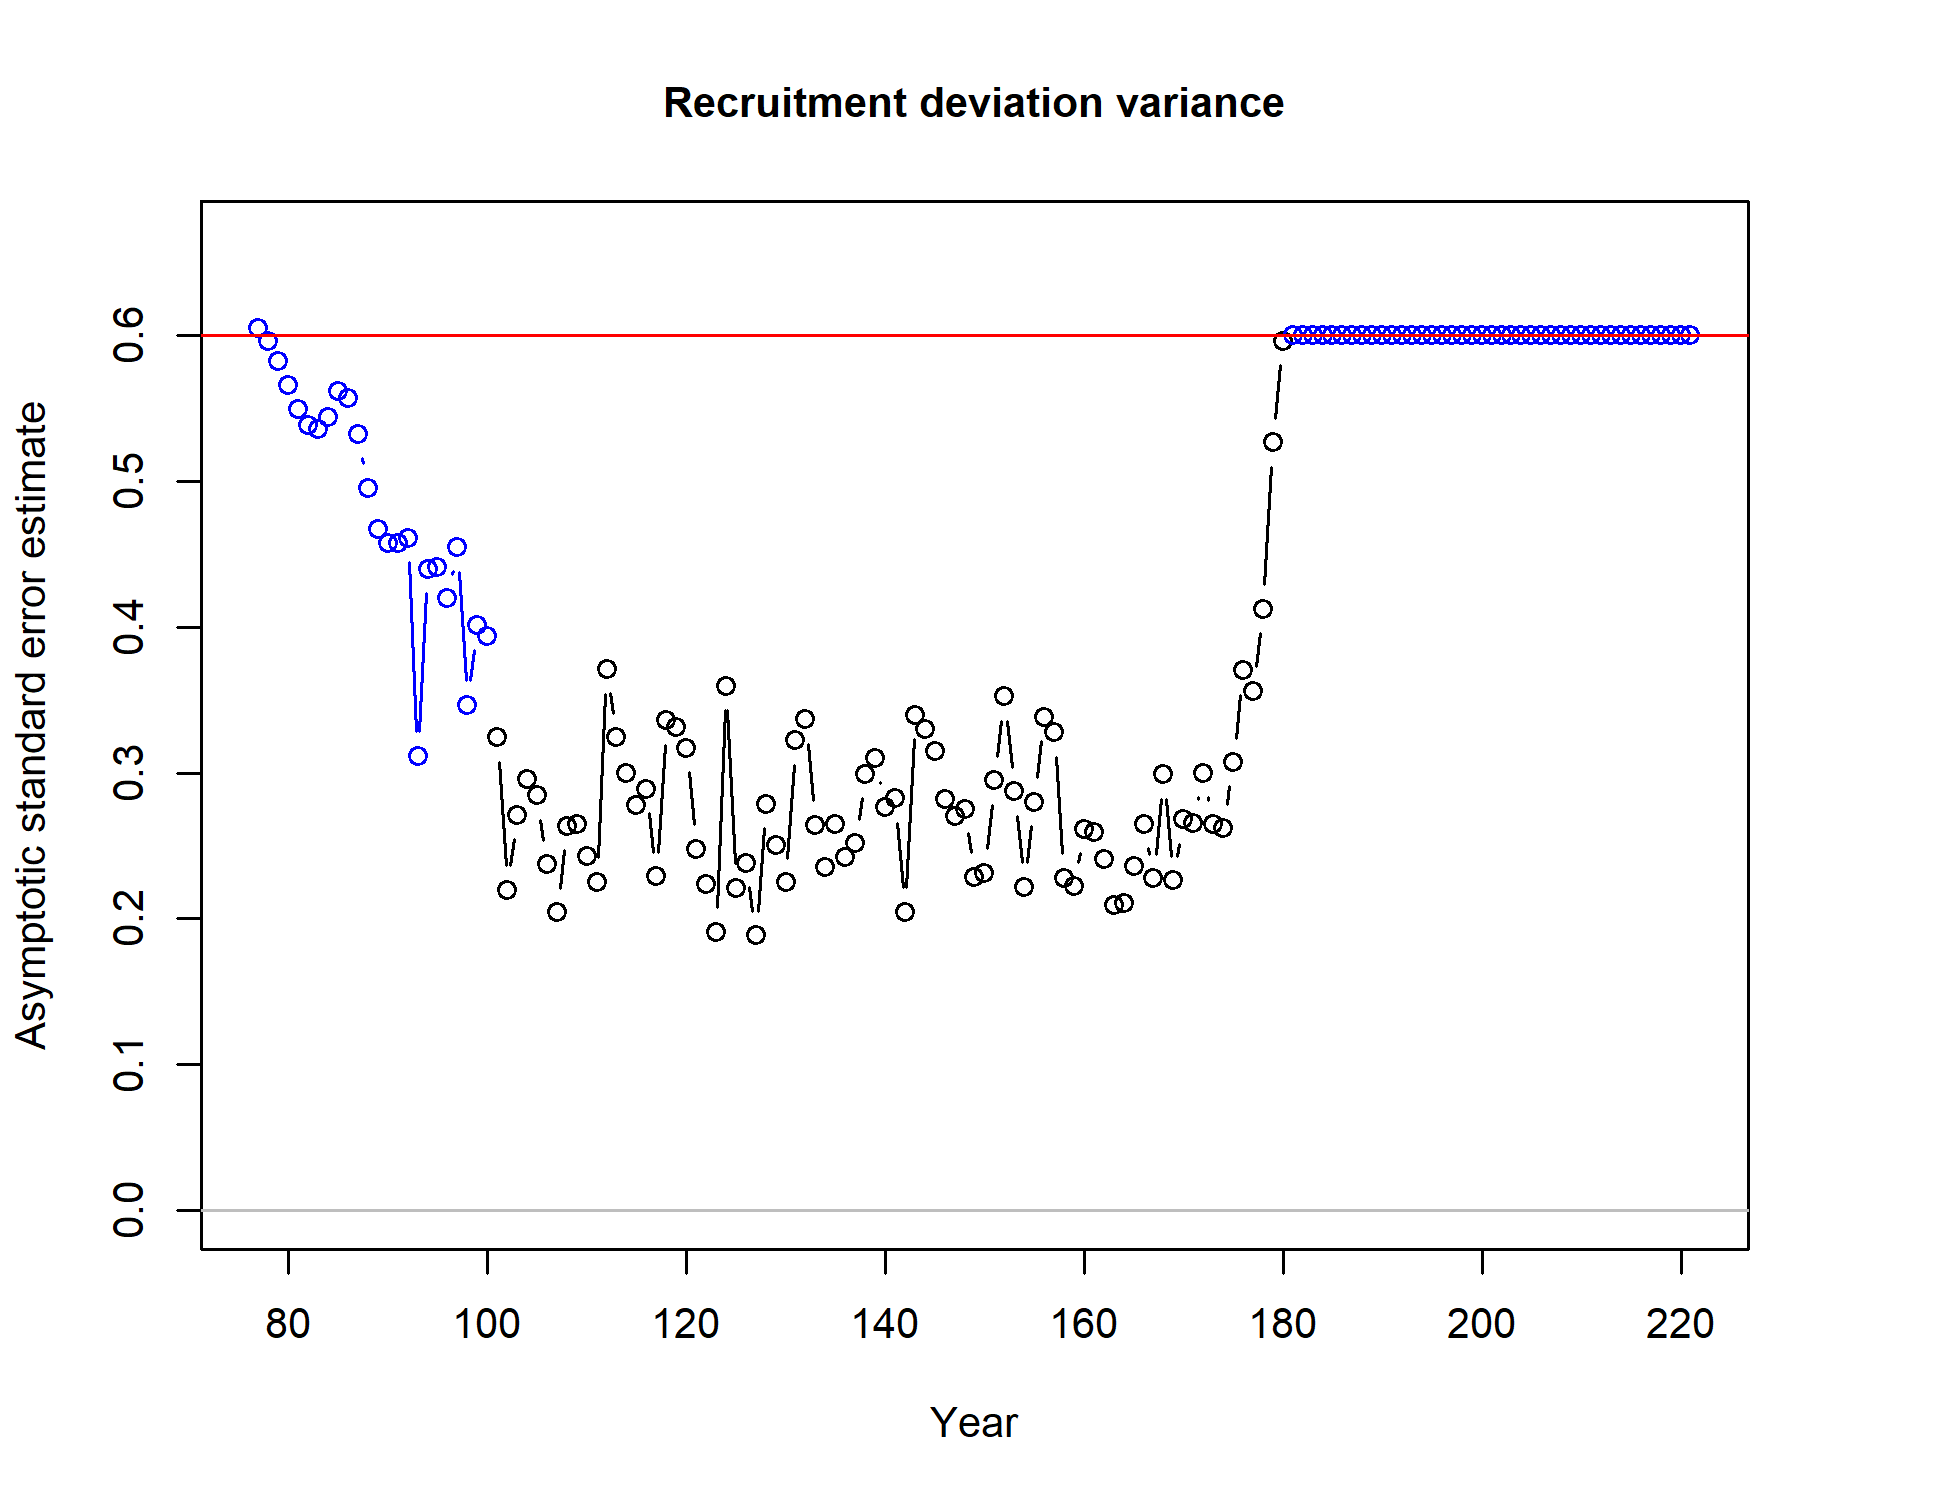
Recruitment deviations variance check.
See later figure of transformed variance values for comparison with bias adjustment settings in the model.
file: recdevs3_varcheck.png
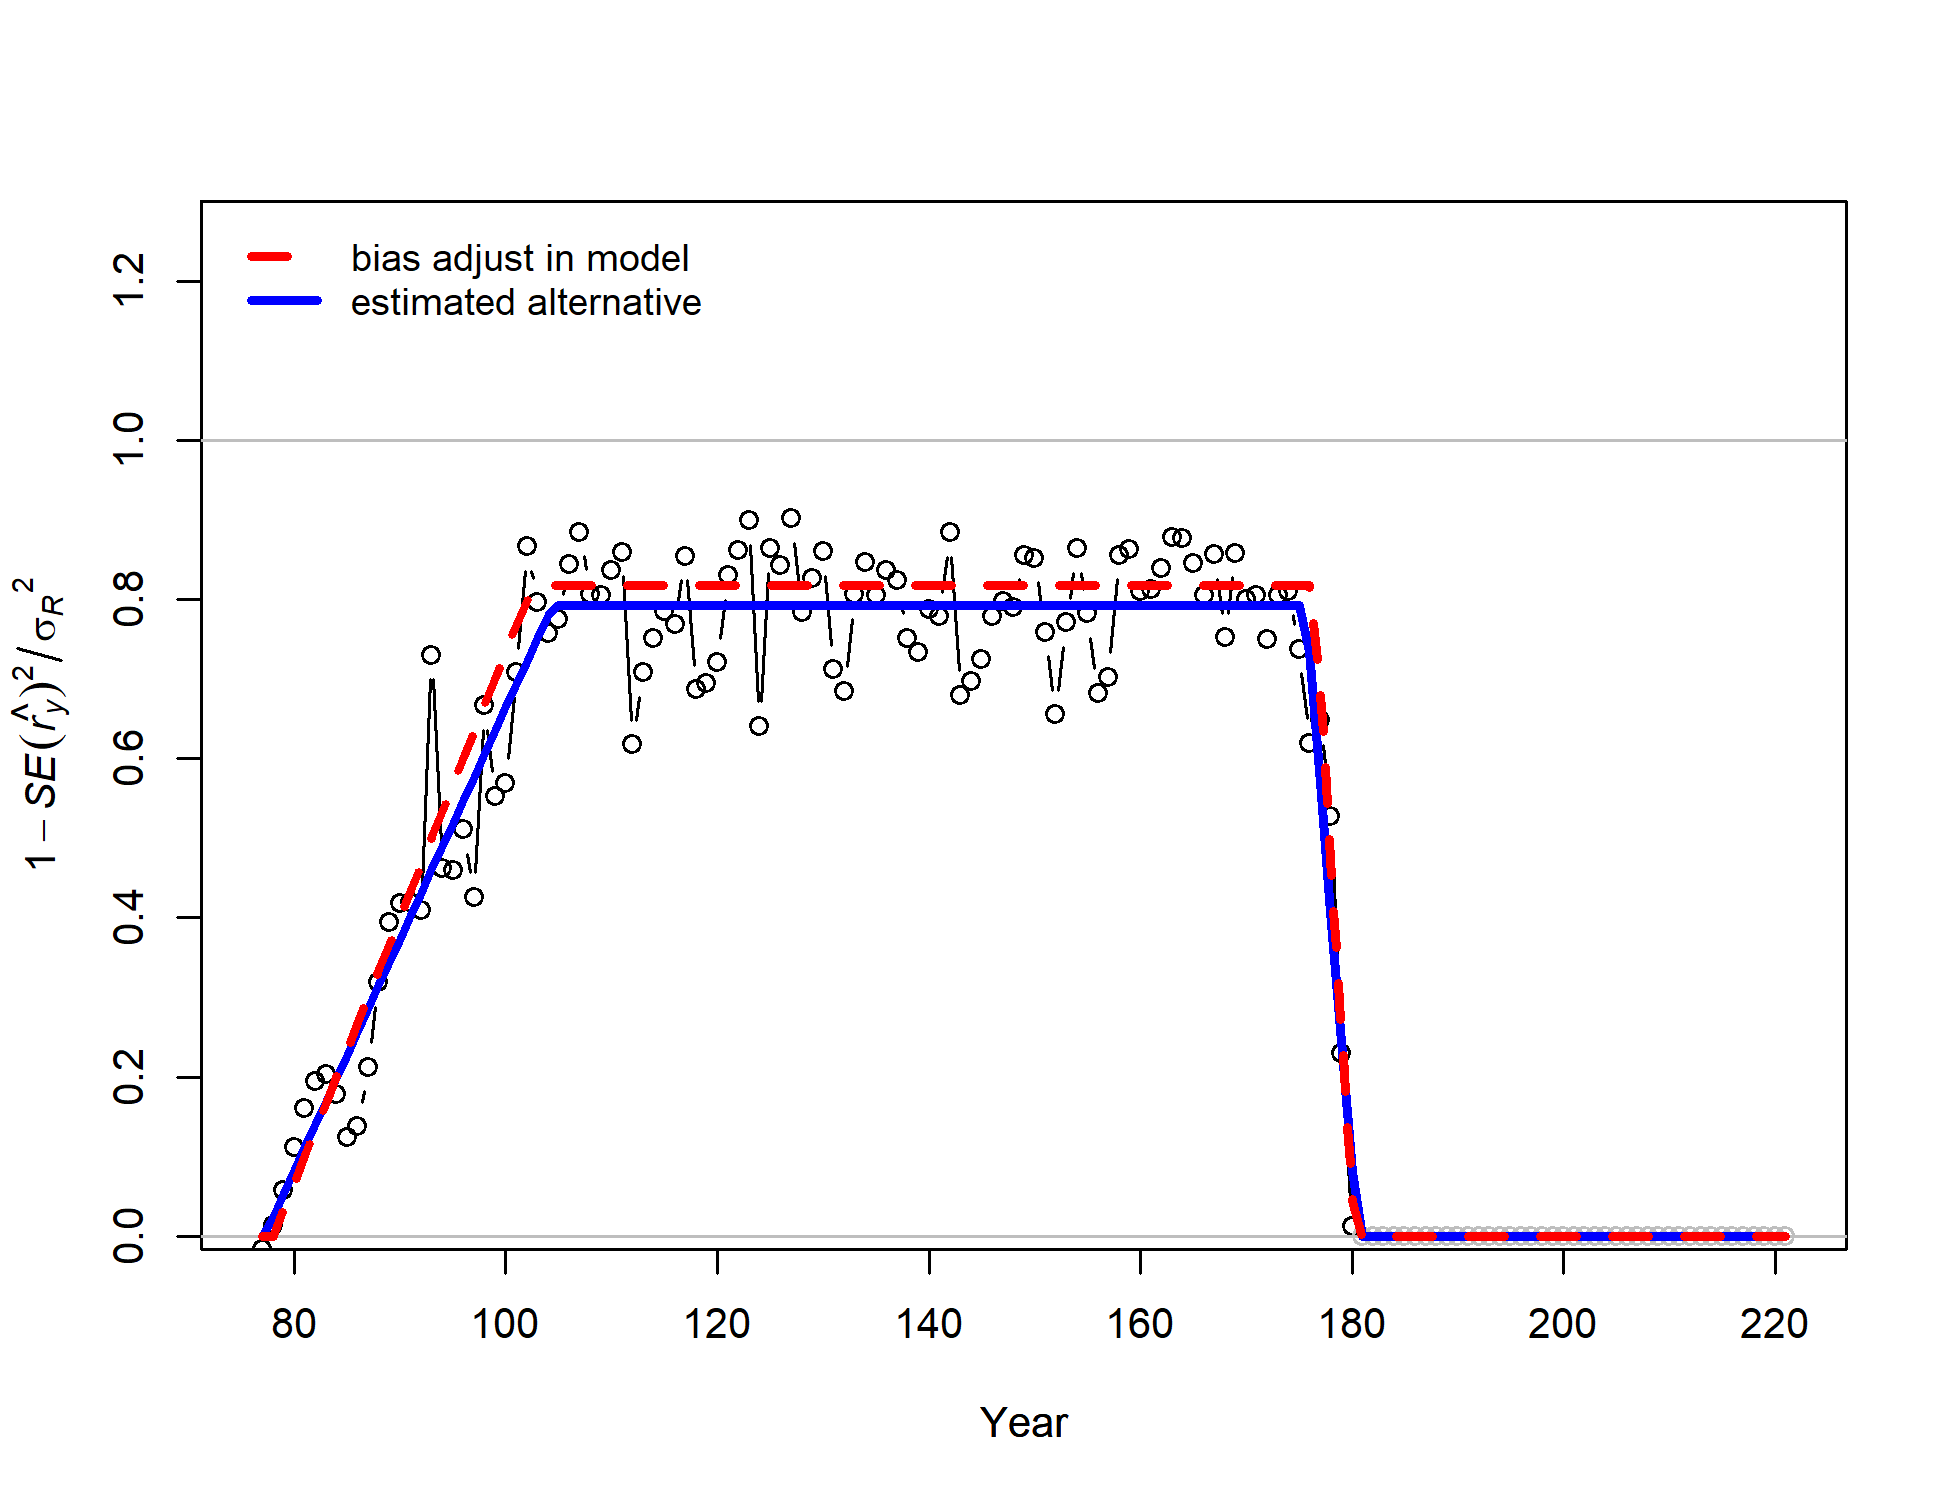
Points are transformed variances. Red line shows current settings forfor bias adjustment specified in control file.Blue line shows least squares estimate of alternative bias adjustmentrelationship for recruitment deviations (which may or may not be animprovement. For more information, see
Methot, R.D. and Taylor, I.G., 2011. Adjusting for bias due to variability of estimated recruitments in fishery assessment models. Can. J. Fish. Aquat. Sci., 68:1744-1760.
77.2   #_last_early_yr_nobias_adj_in_MPD
104.4   #_first_yr_fullbias_adj_in_MPD
175.6   #_last_yr_fullbias_adj_in_MPD
180.5   #_first_recent_yr_nobias_adj_in_MPD
0.7931   #_max_bias_adj_in_MPD (1.0 to mimic pre-2009 models)