
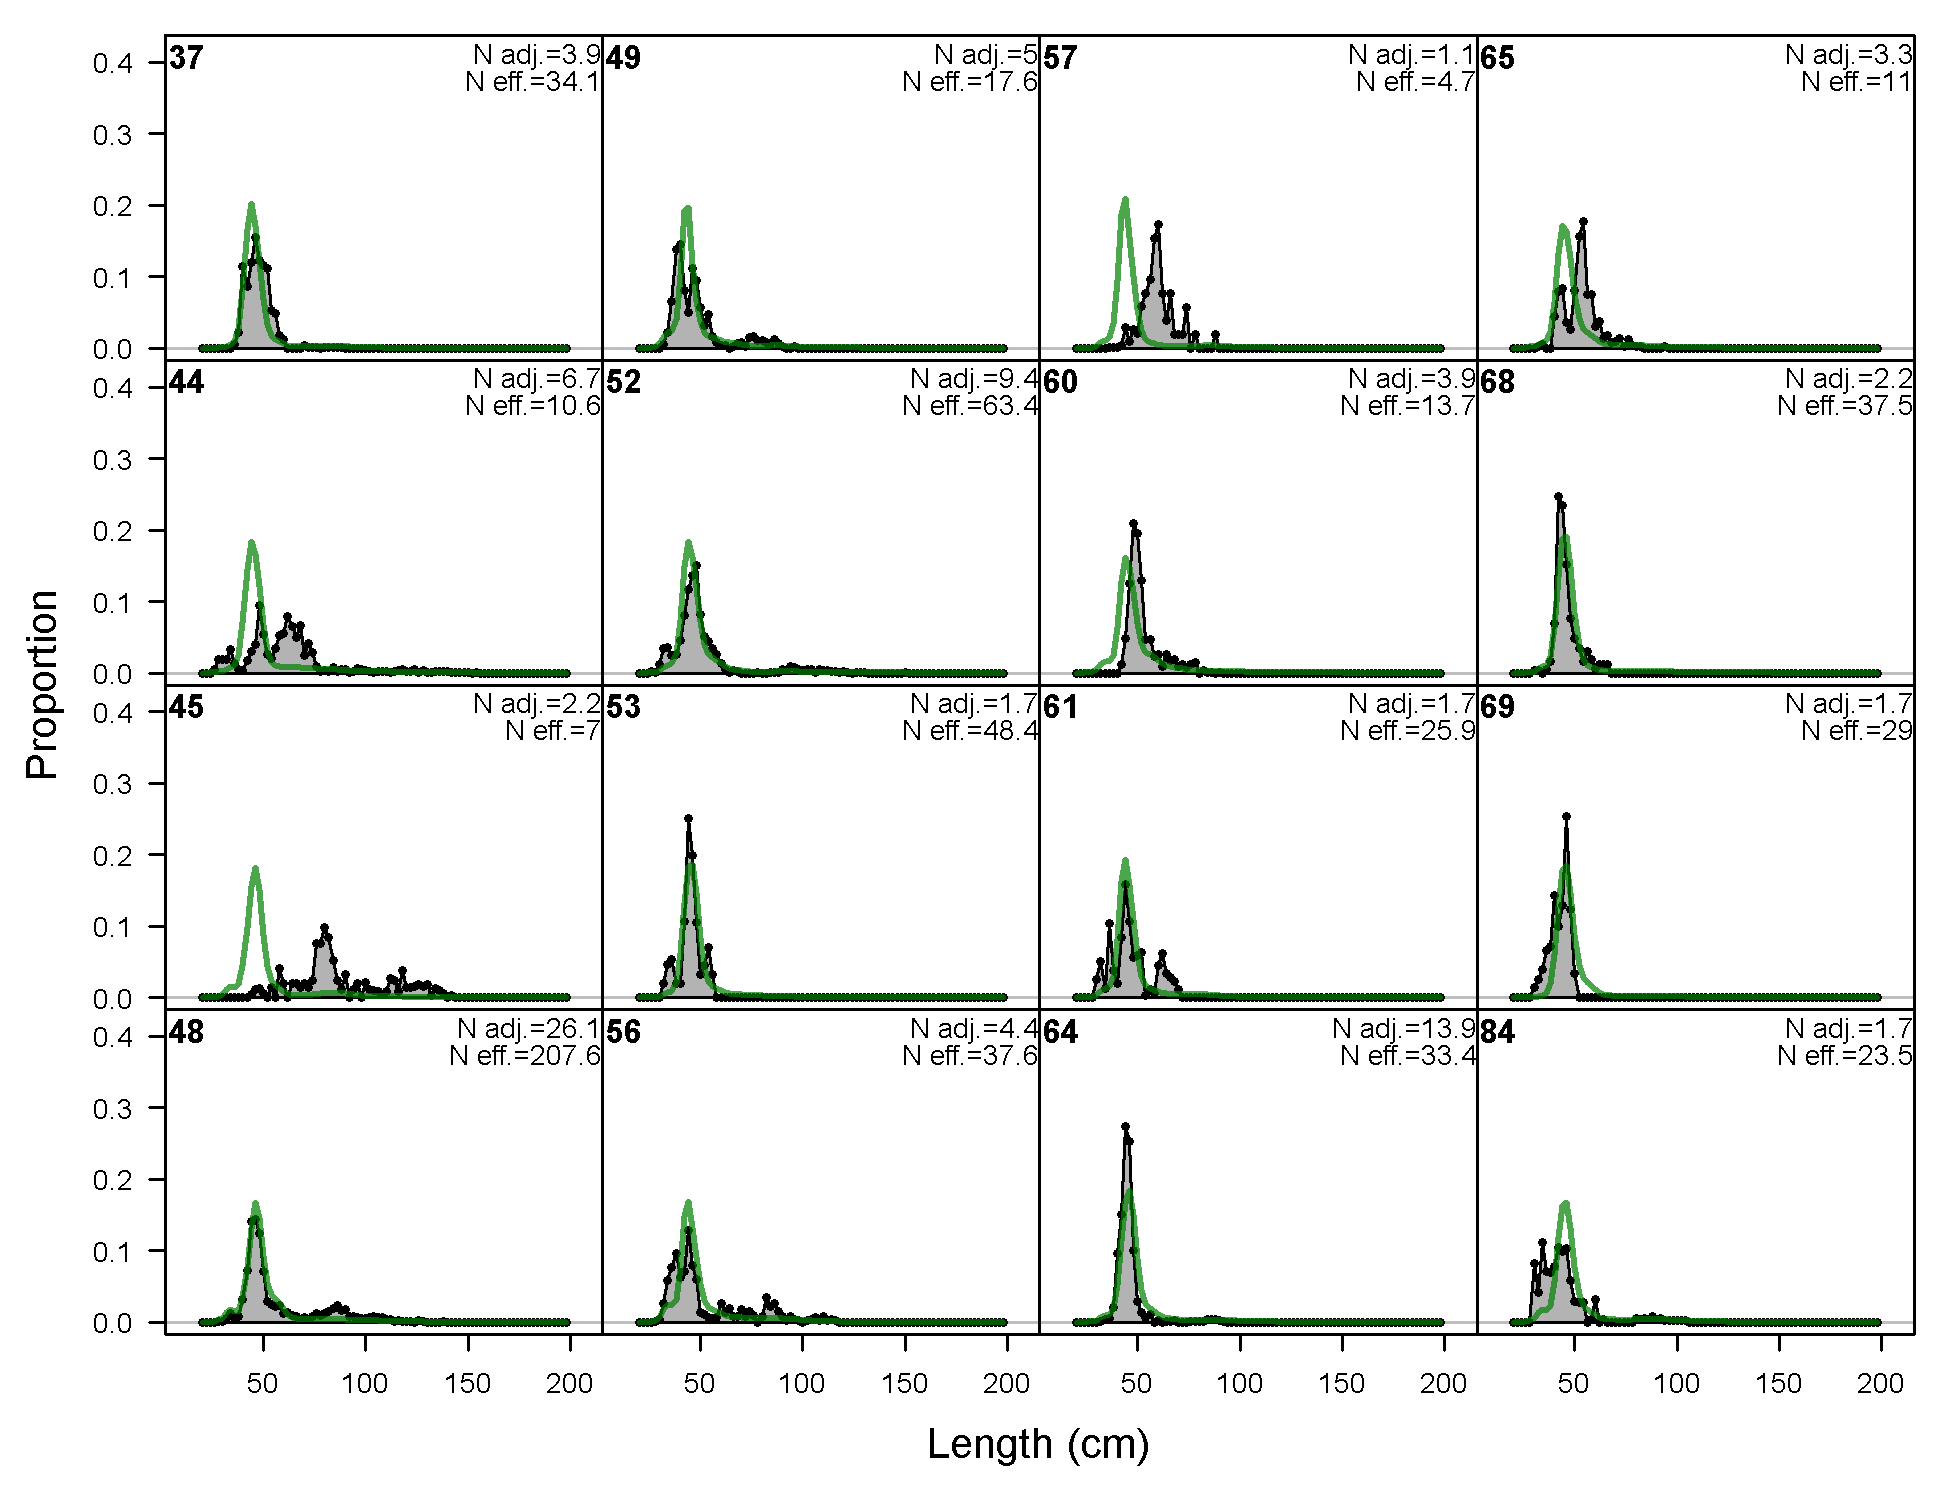
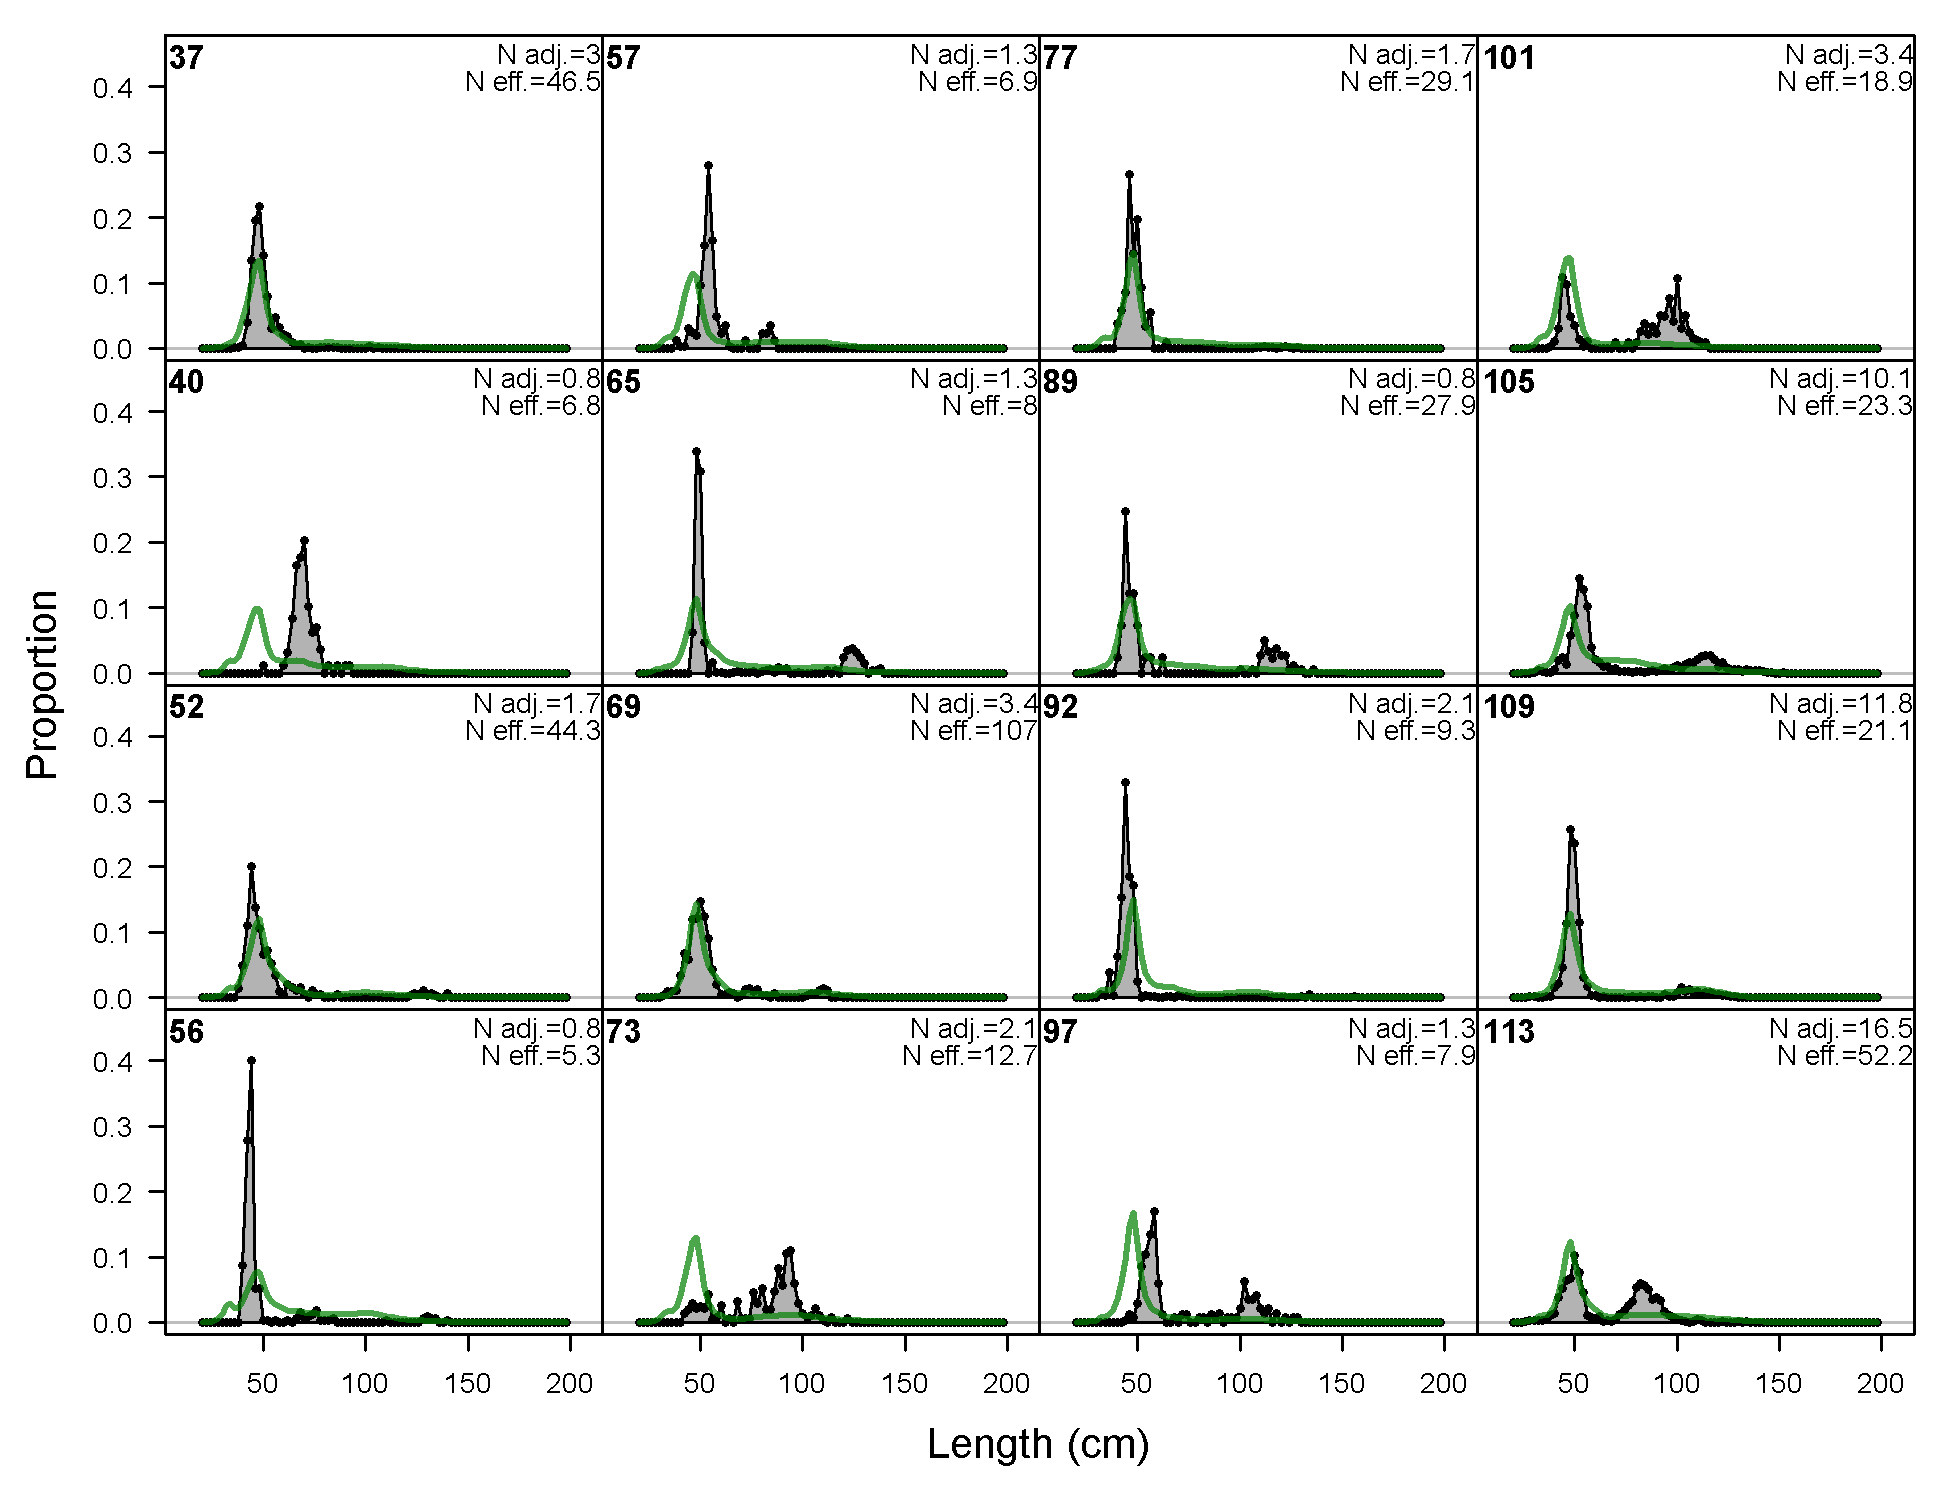
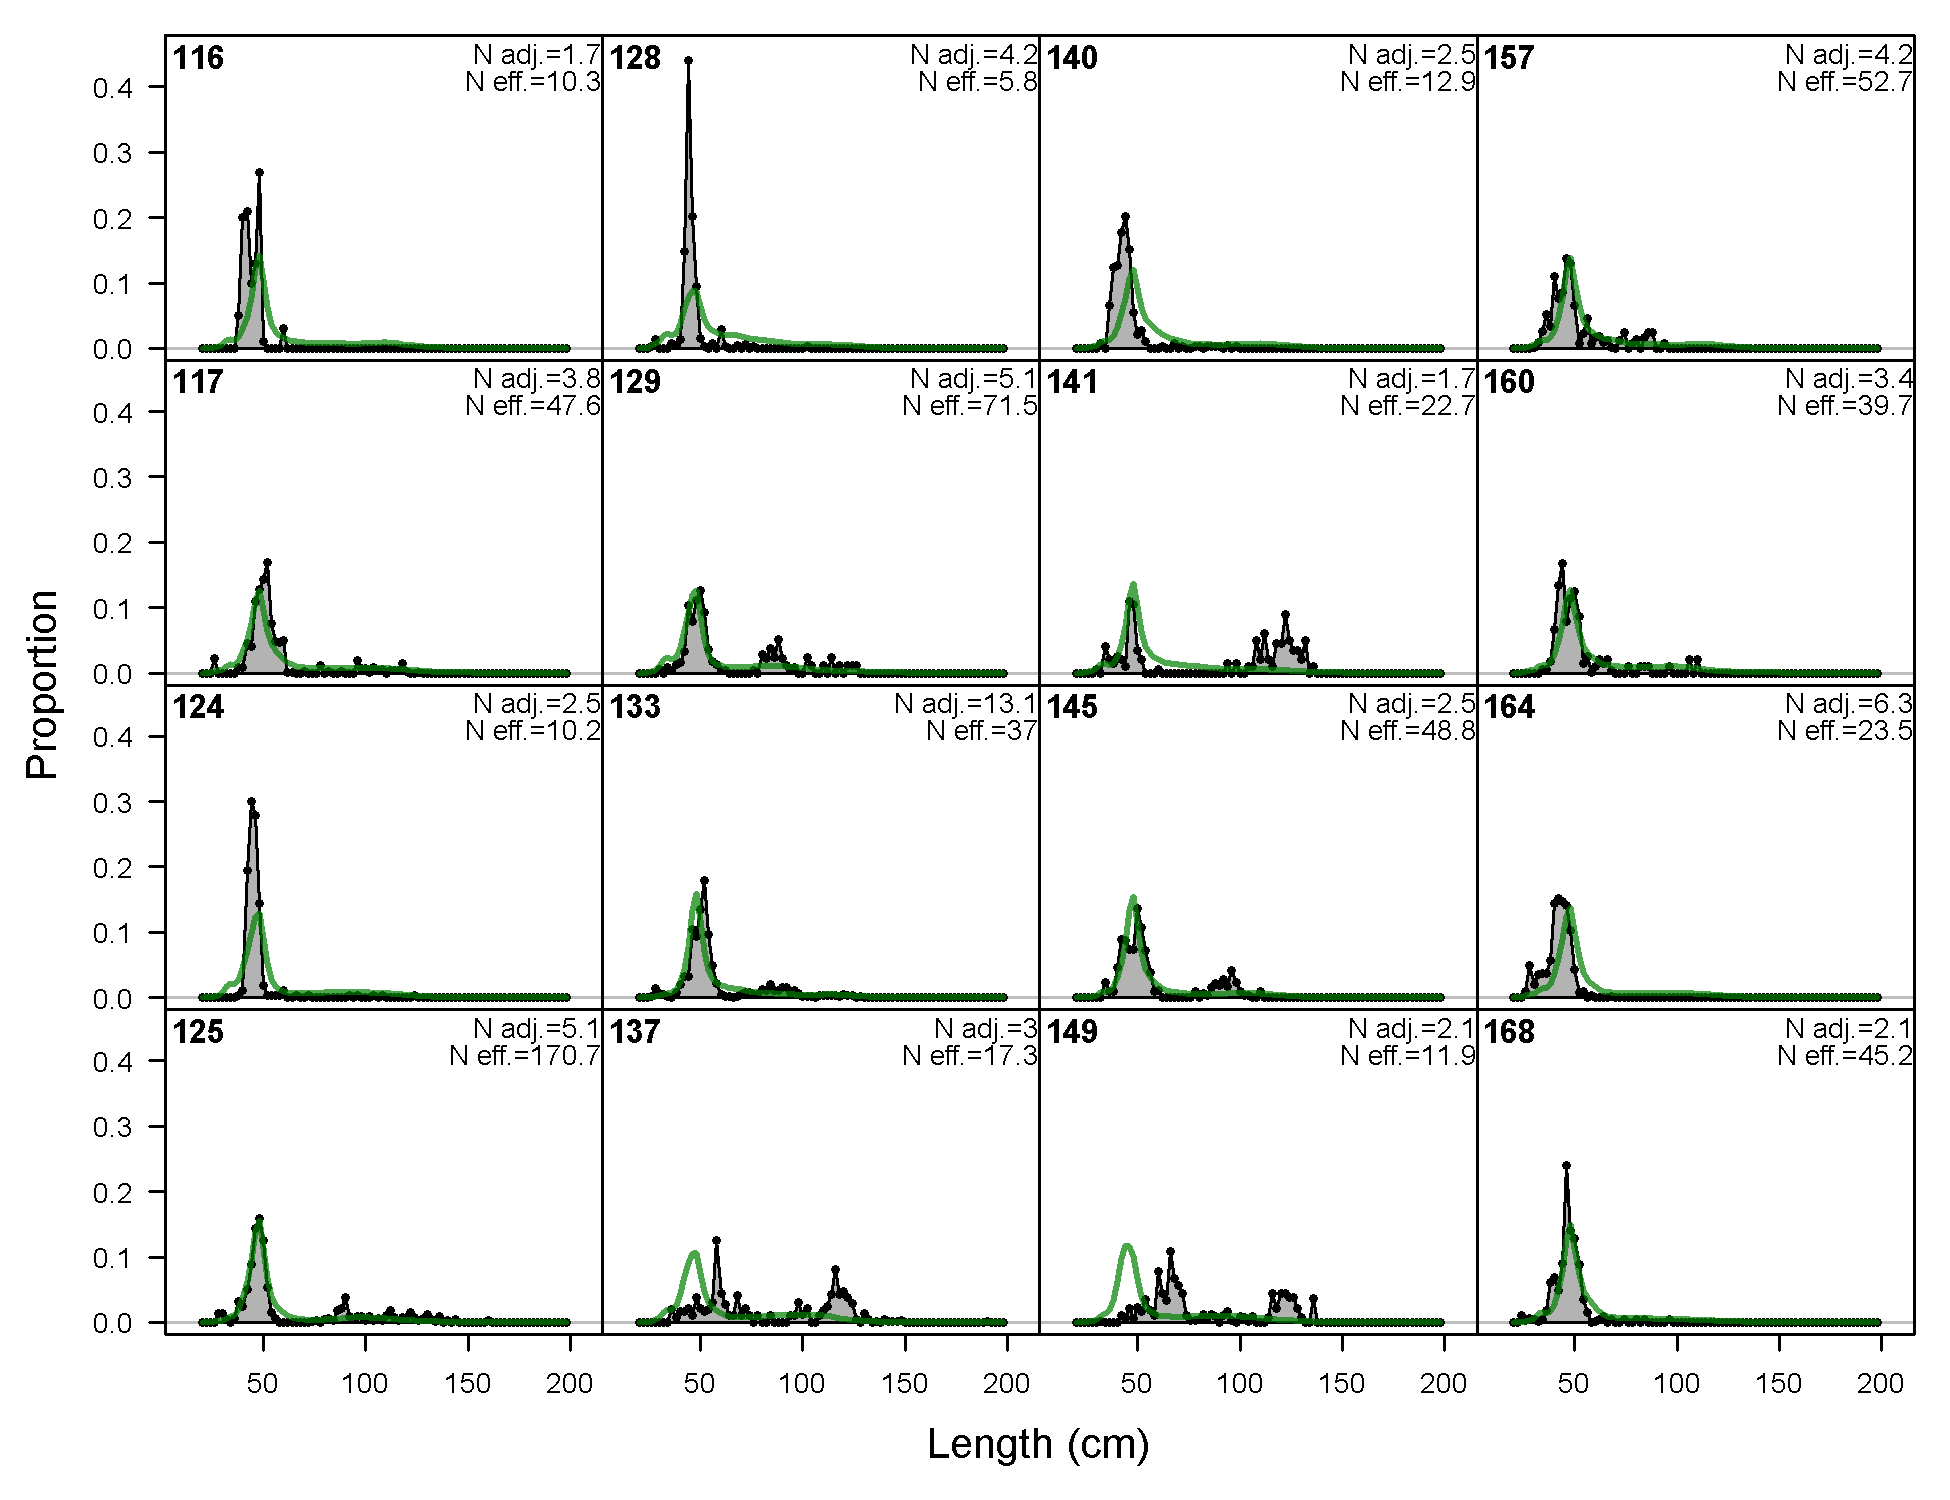
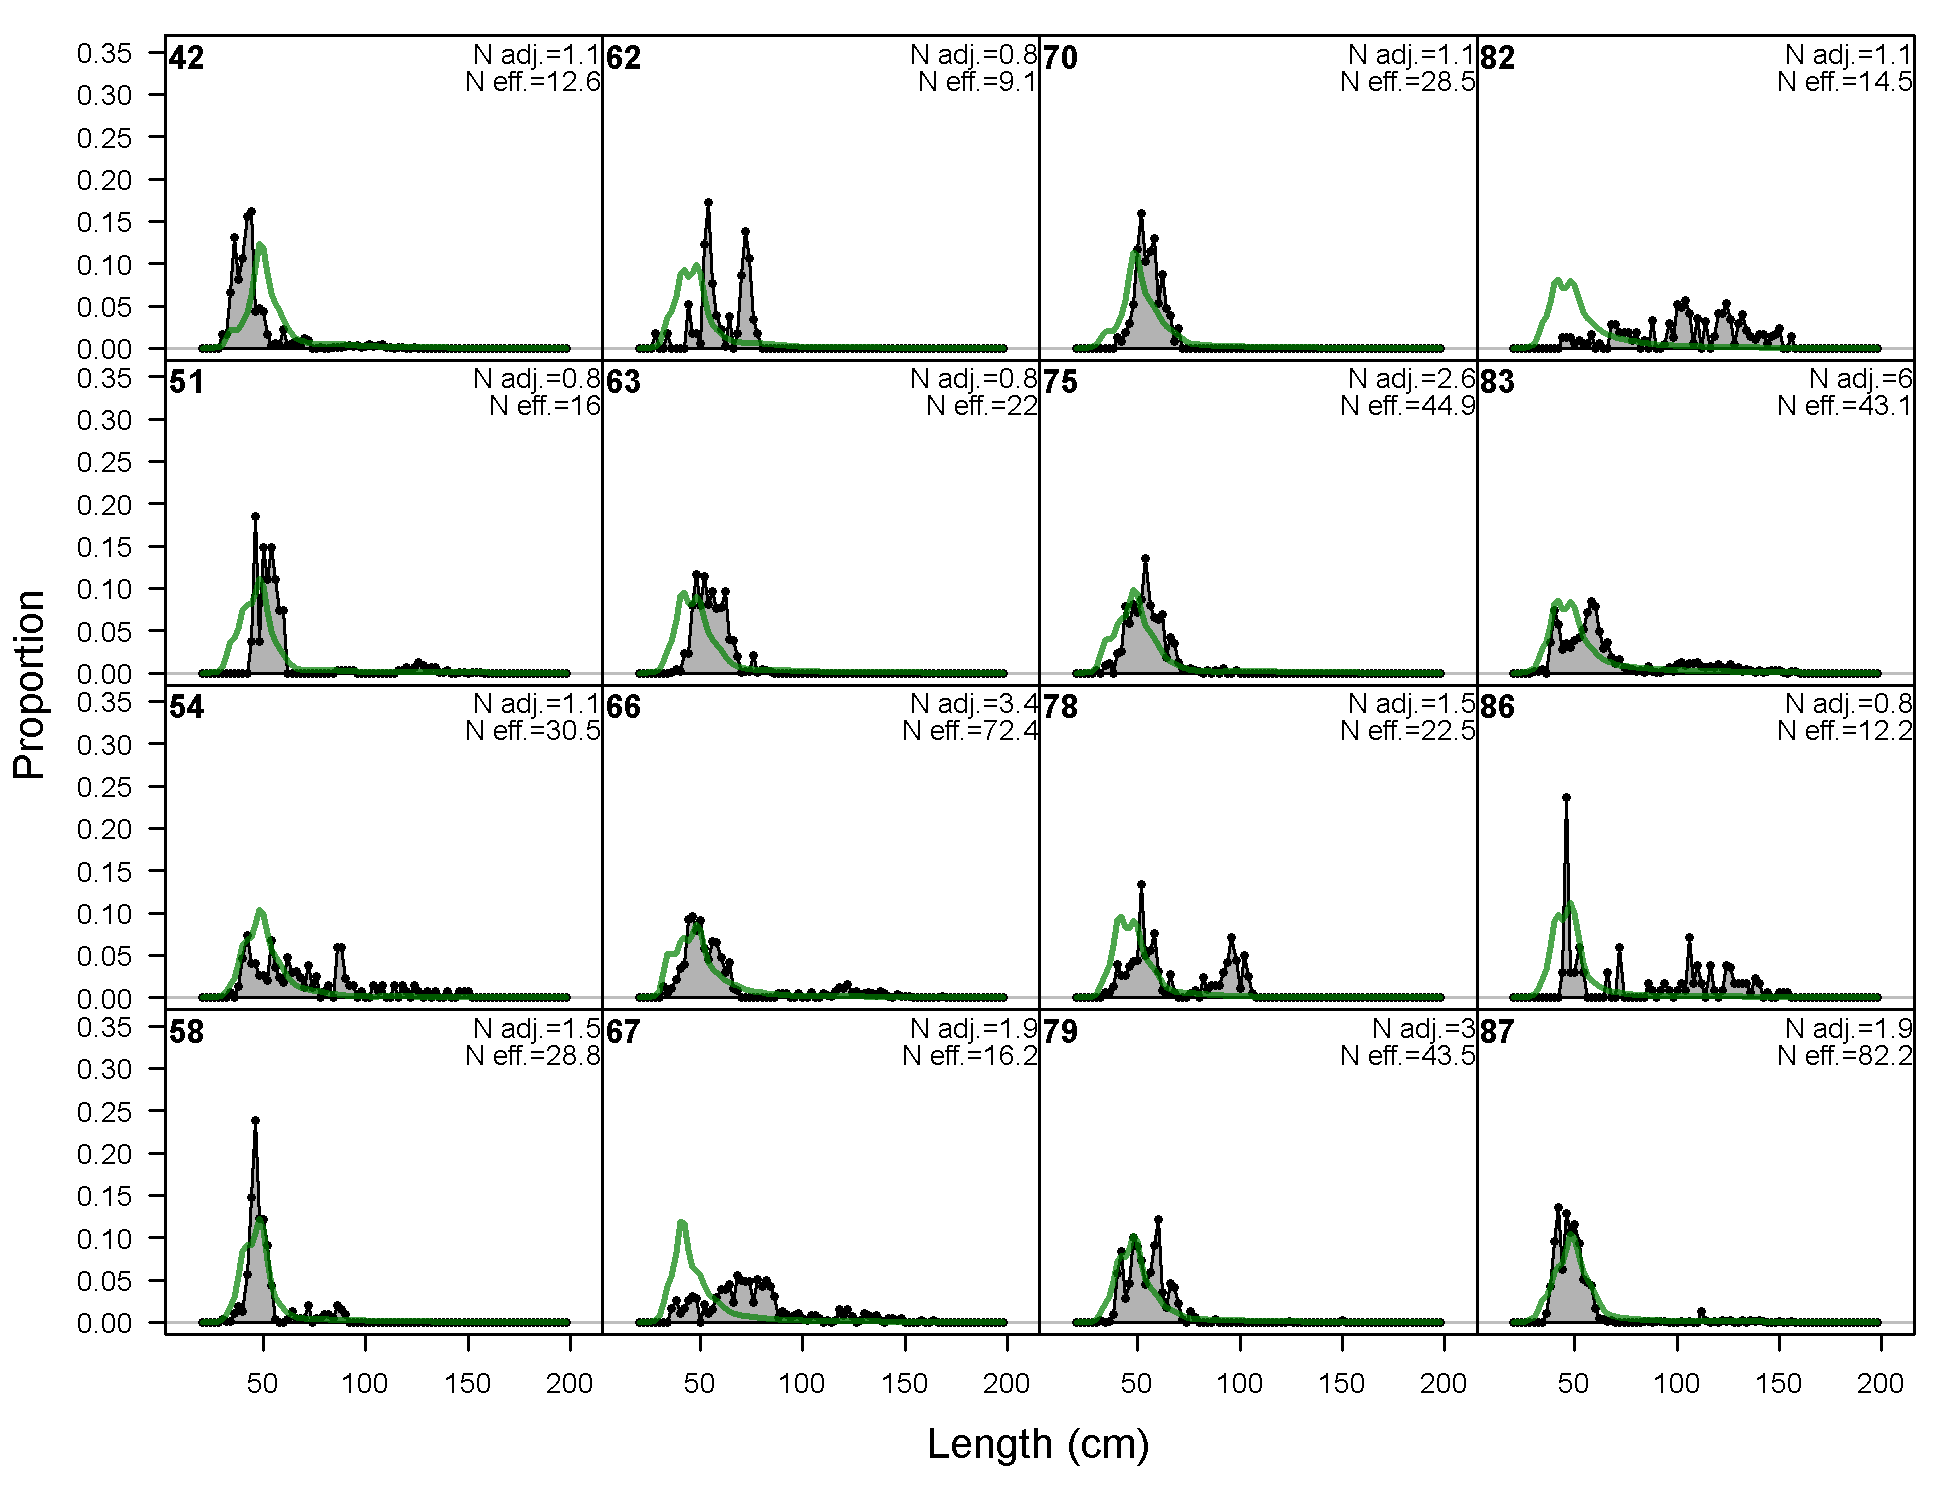
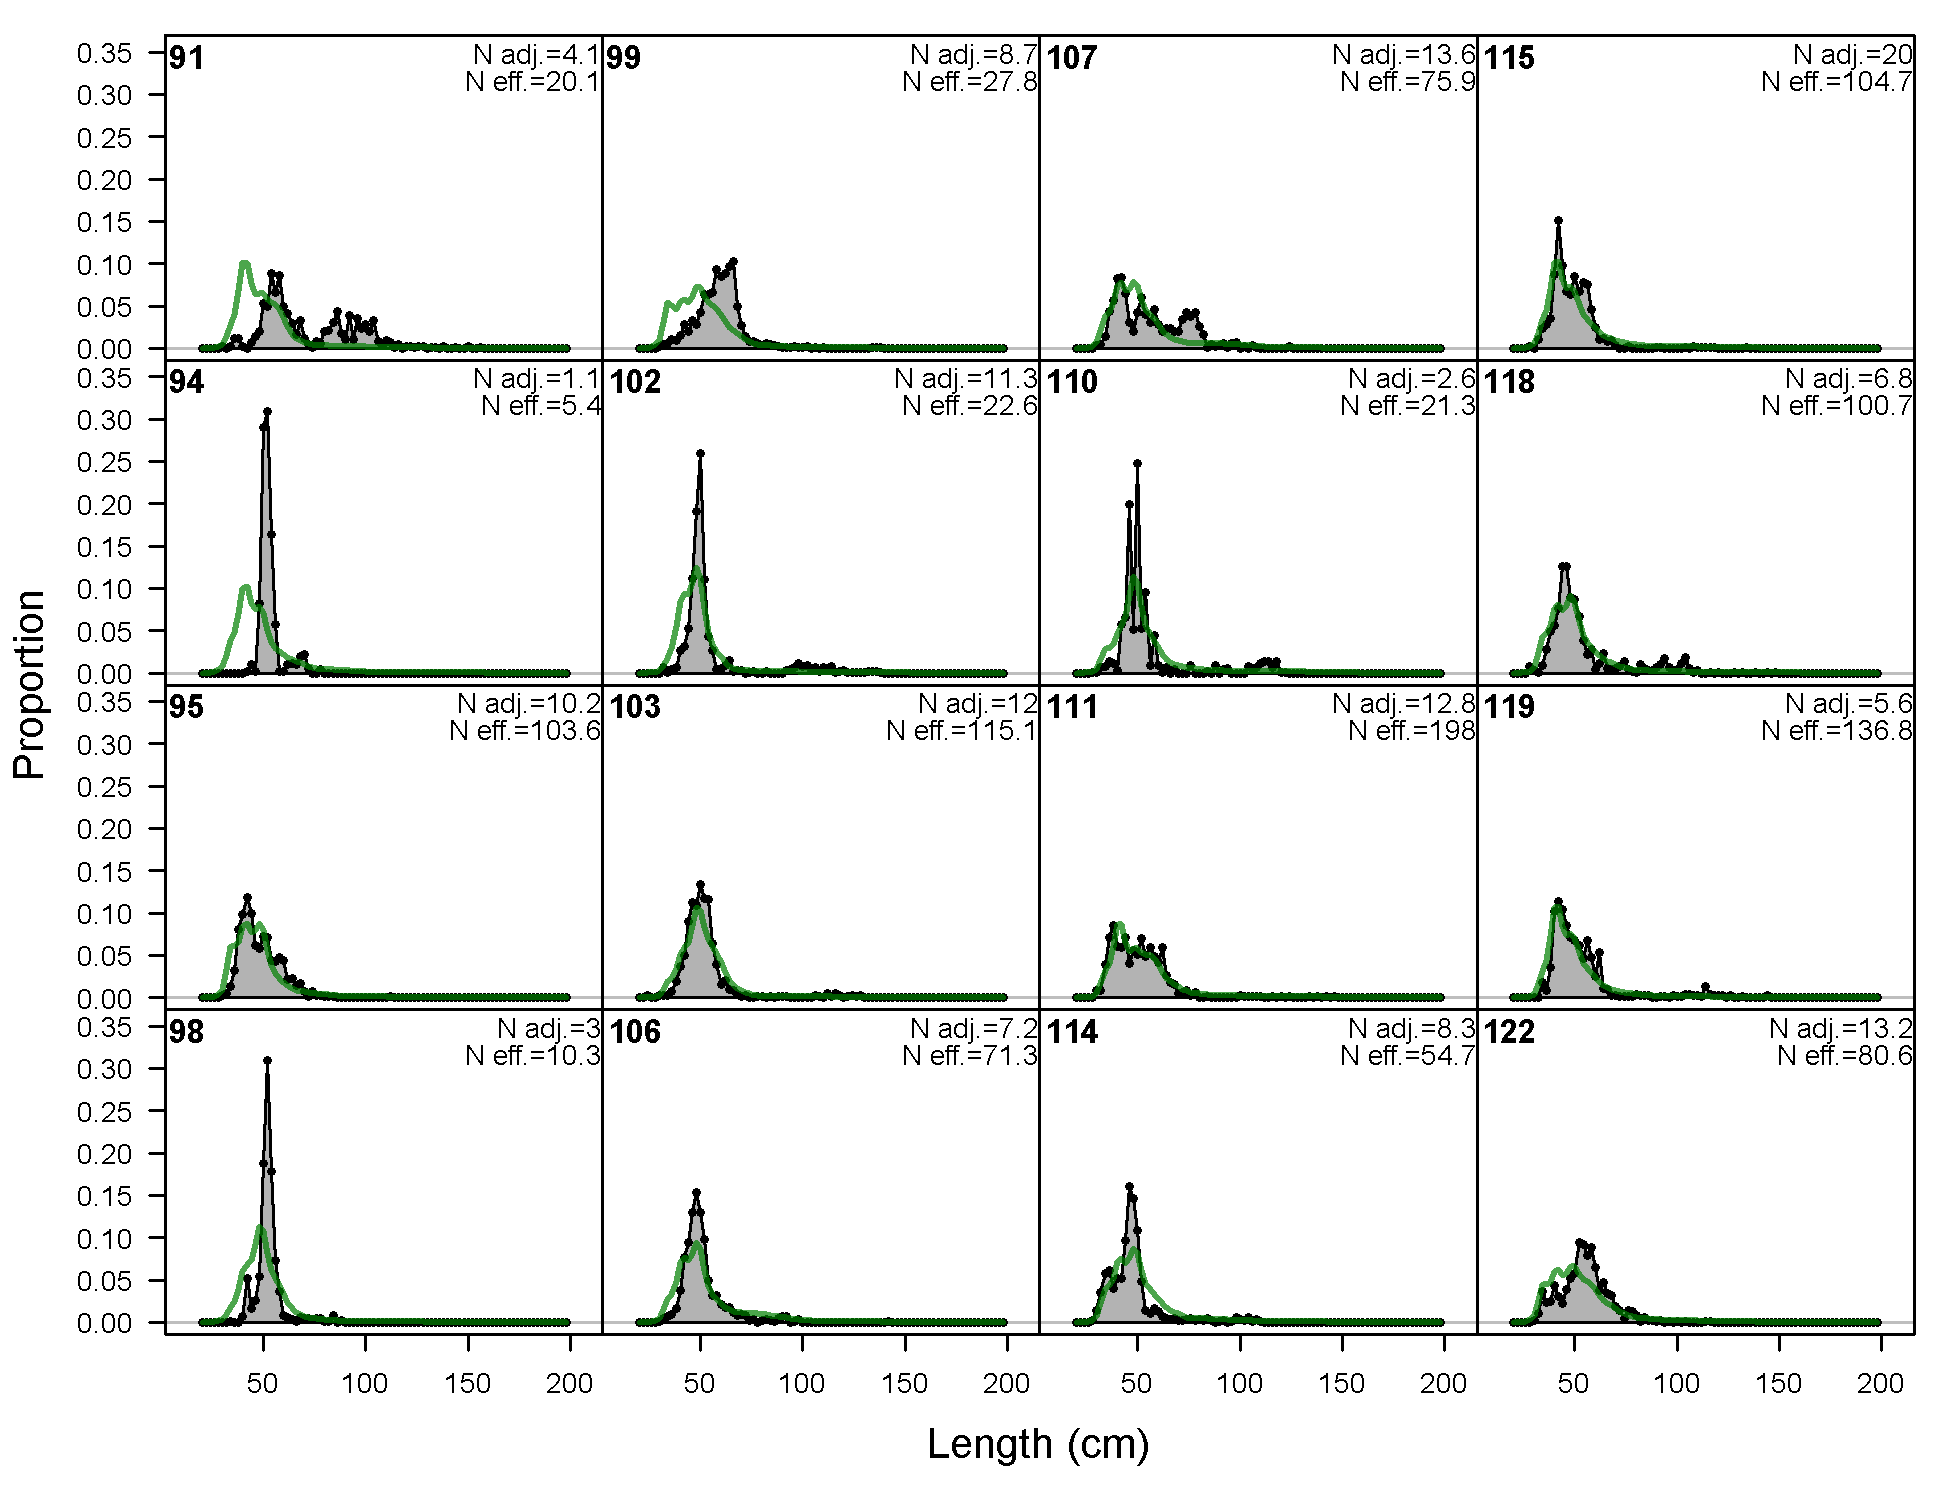
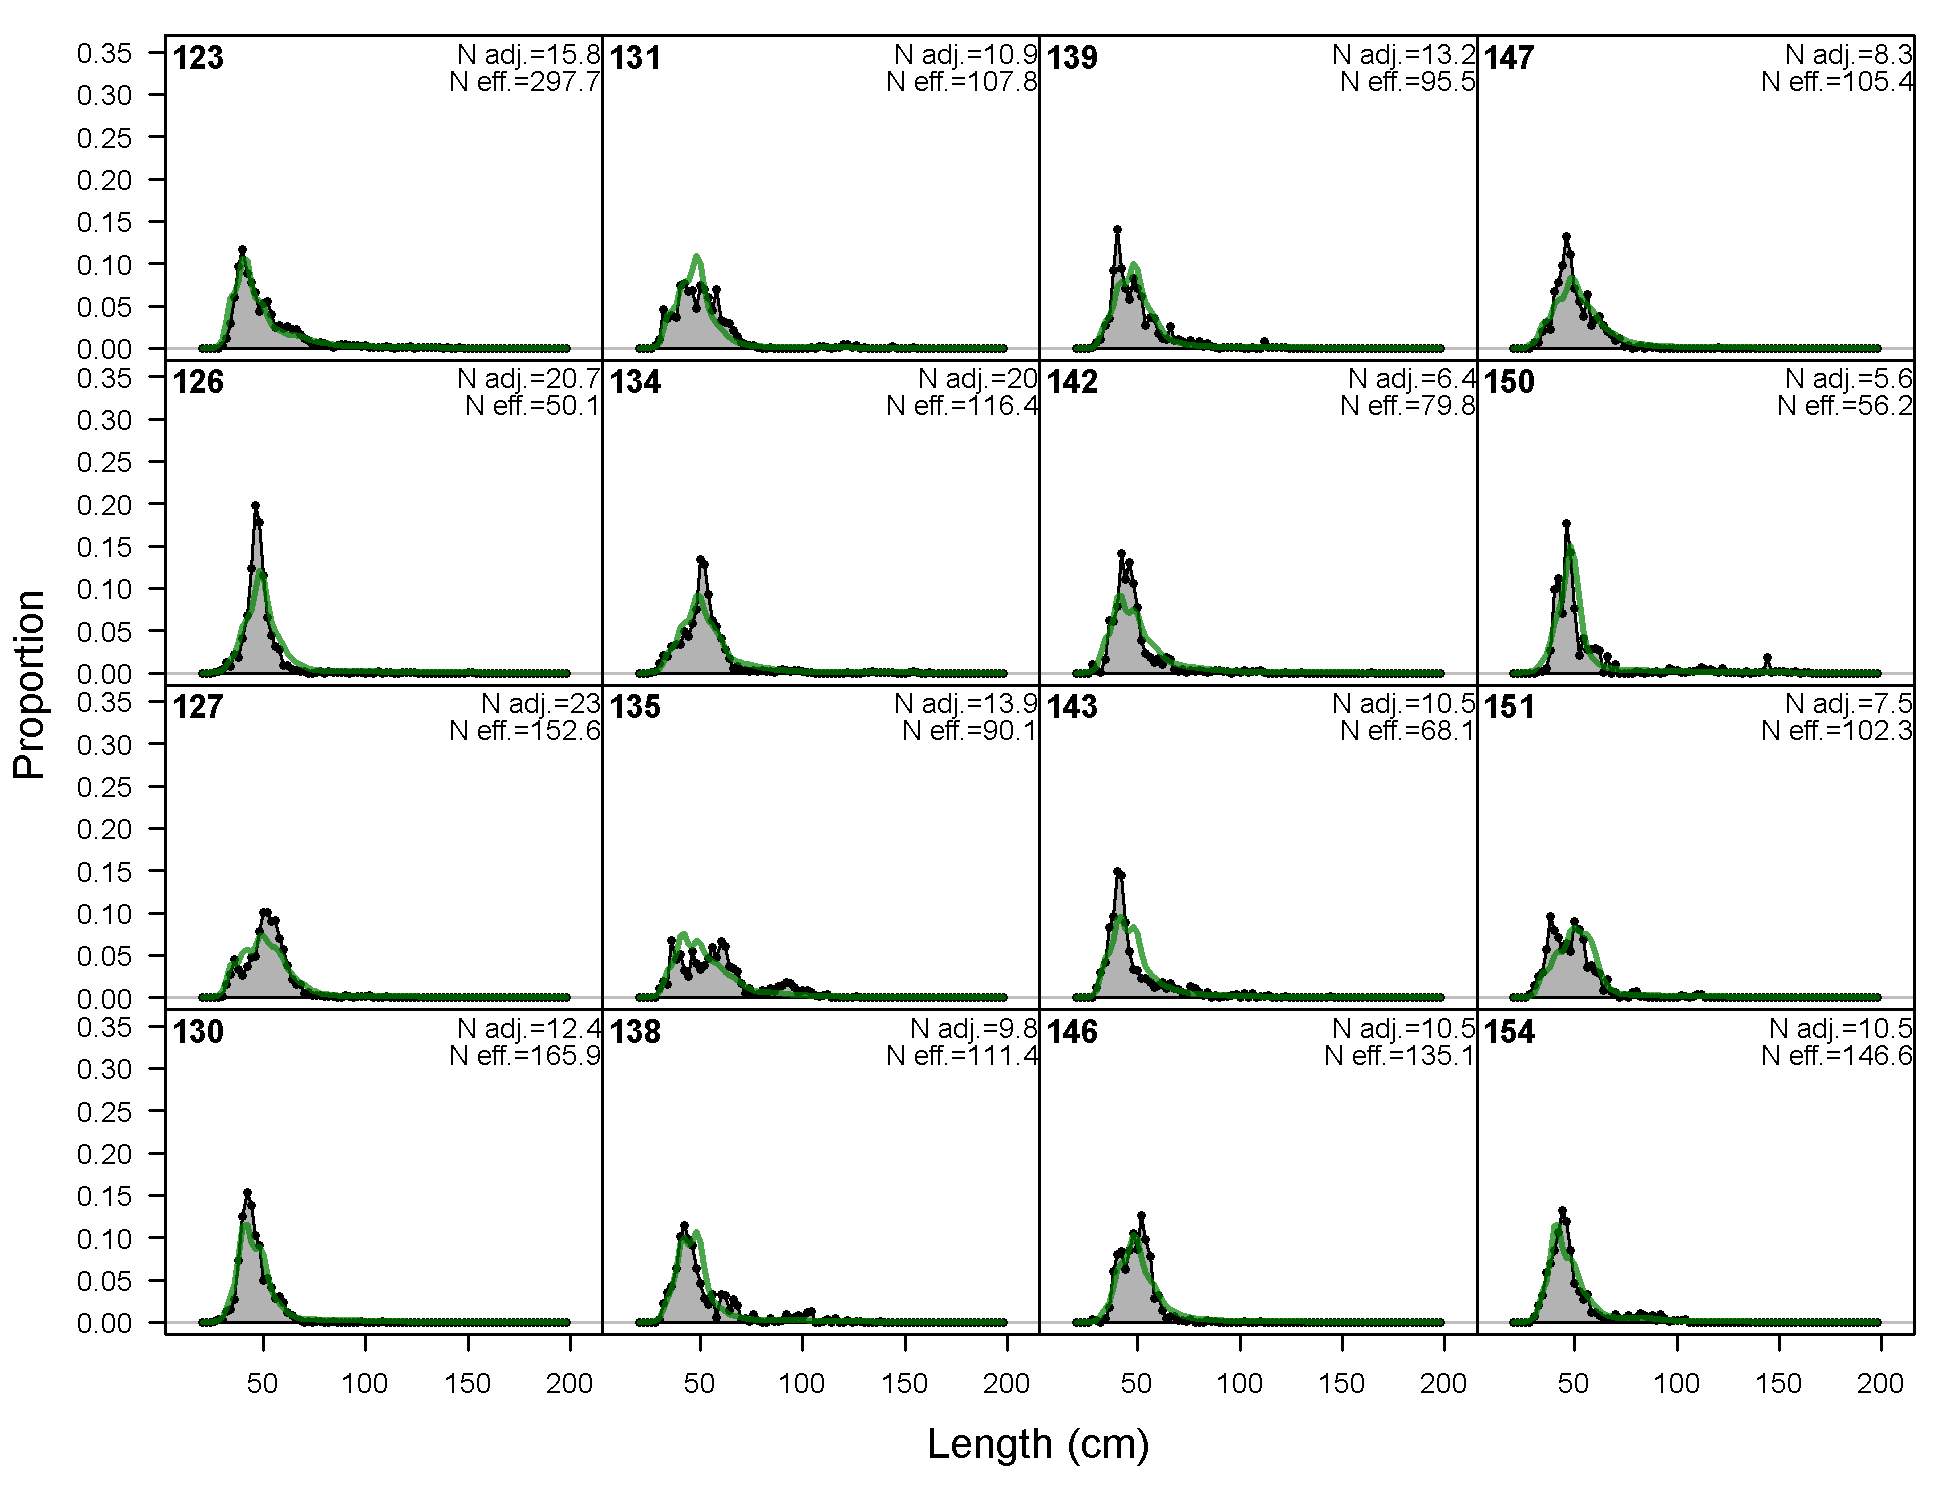
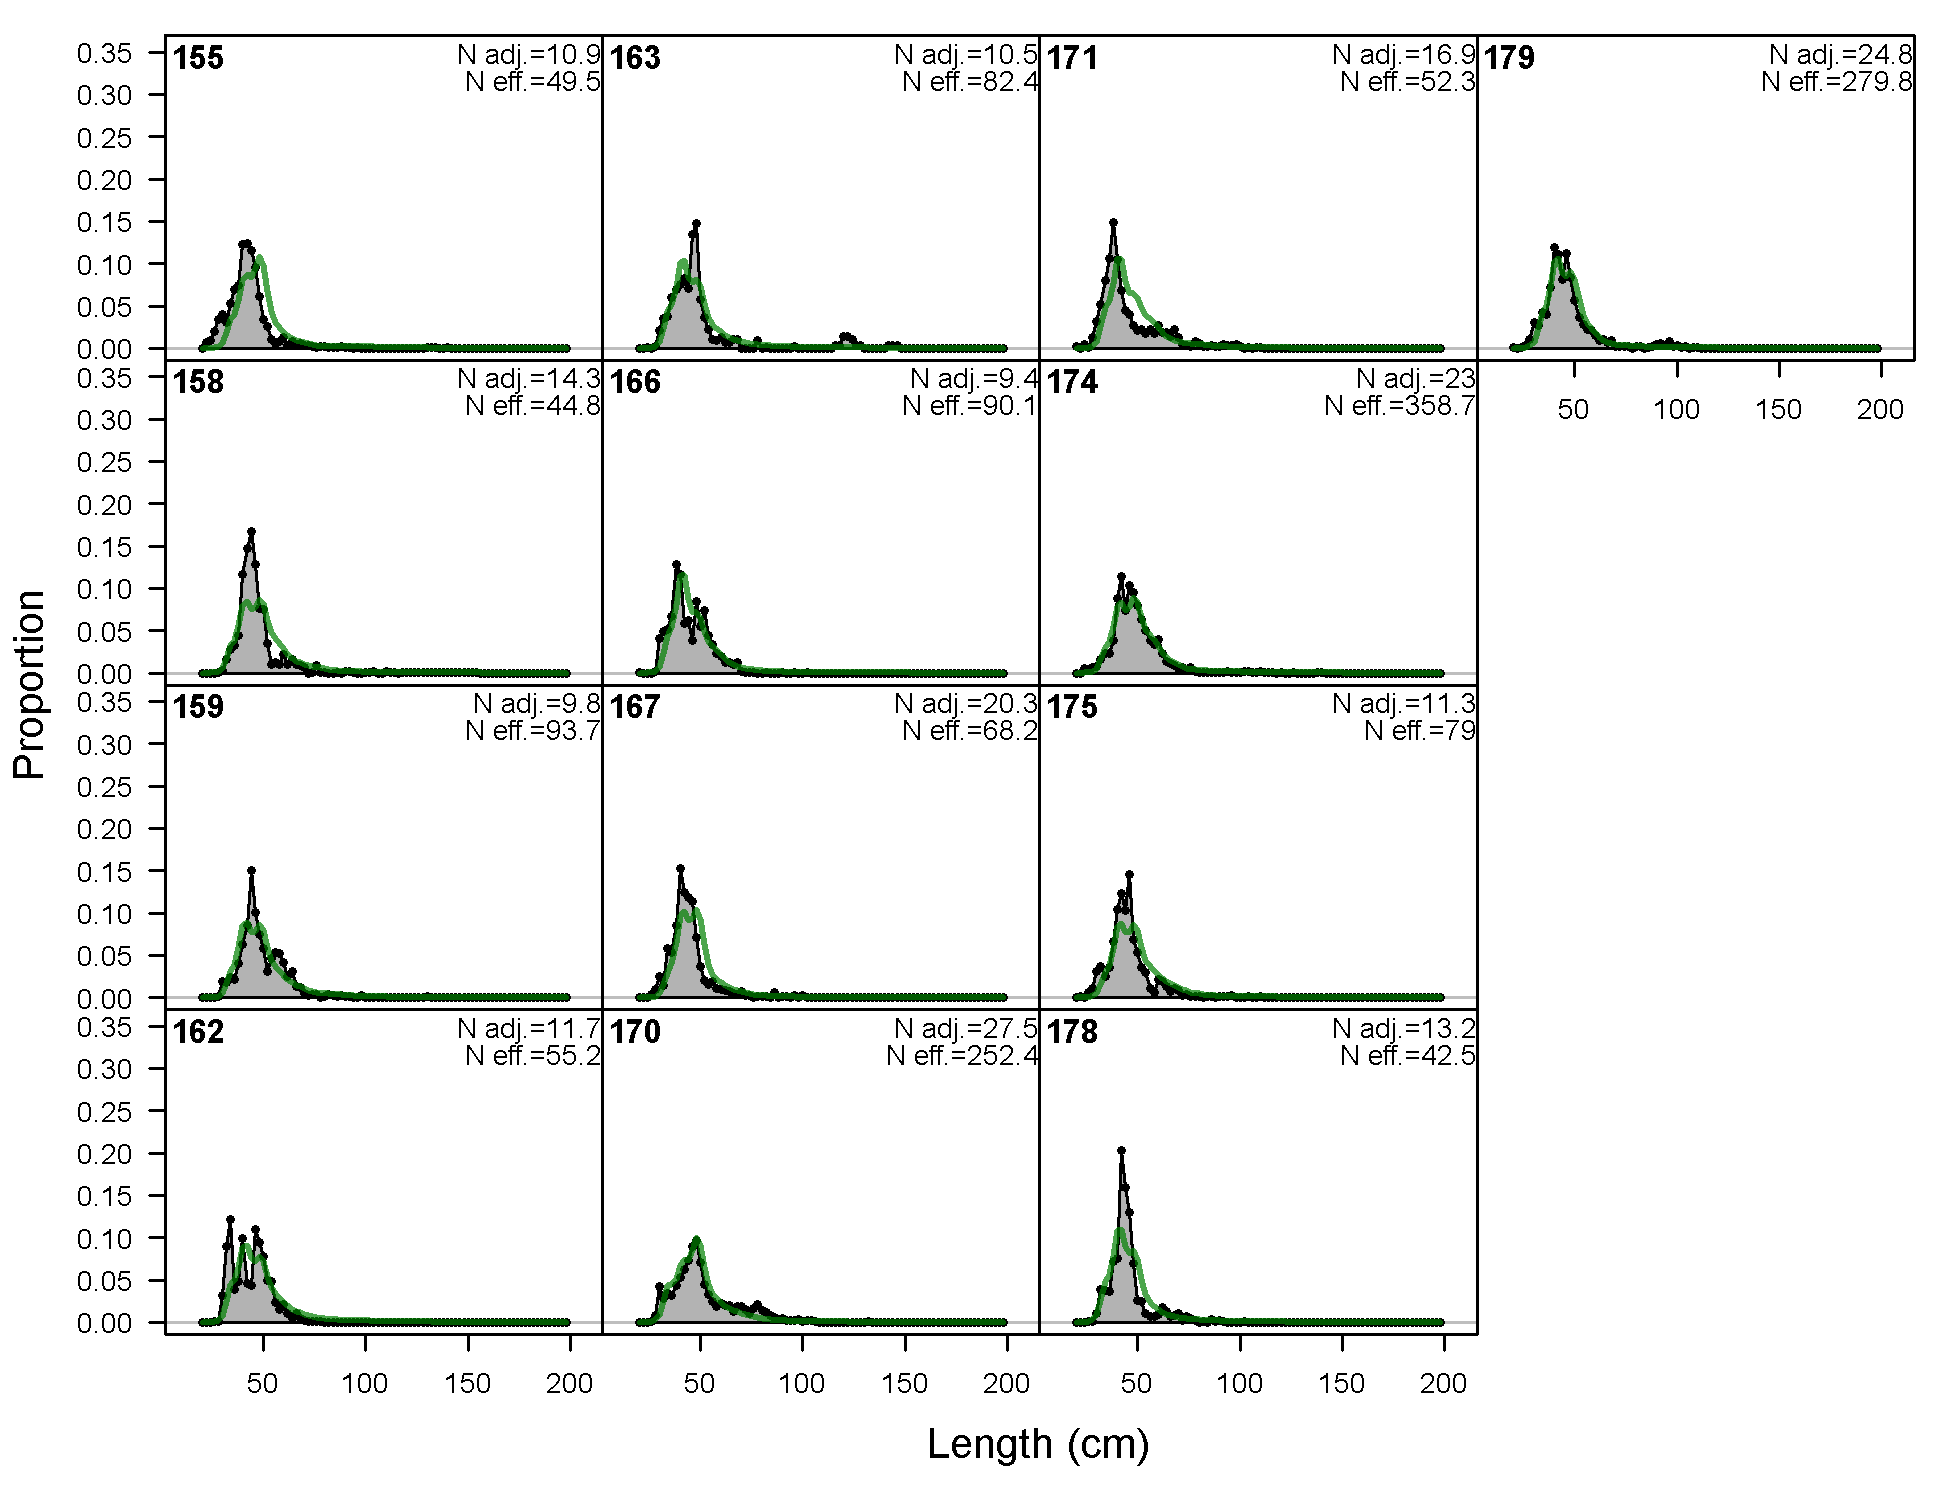
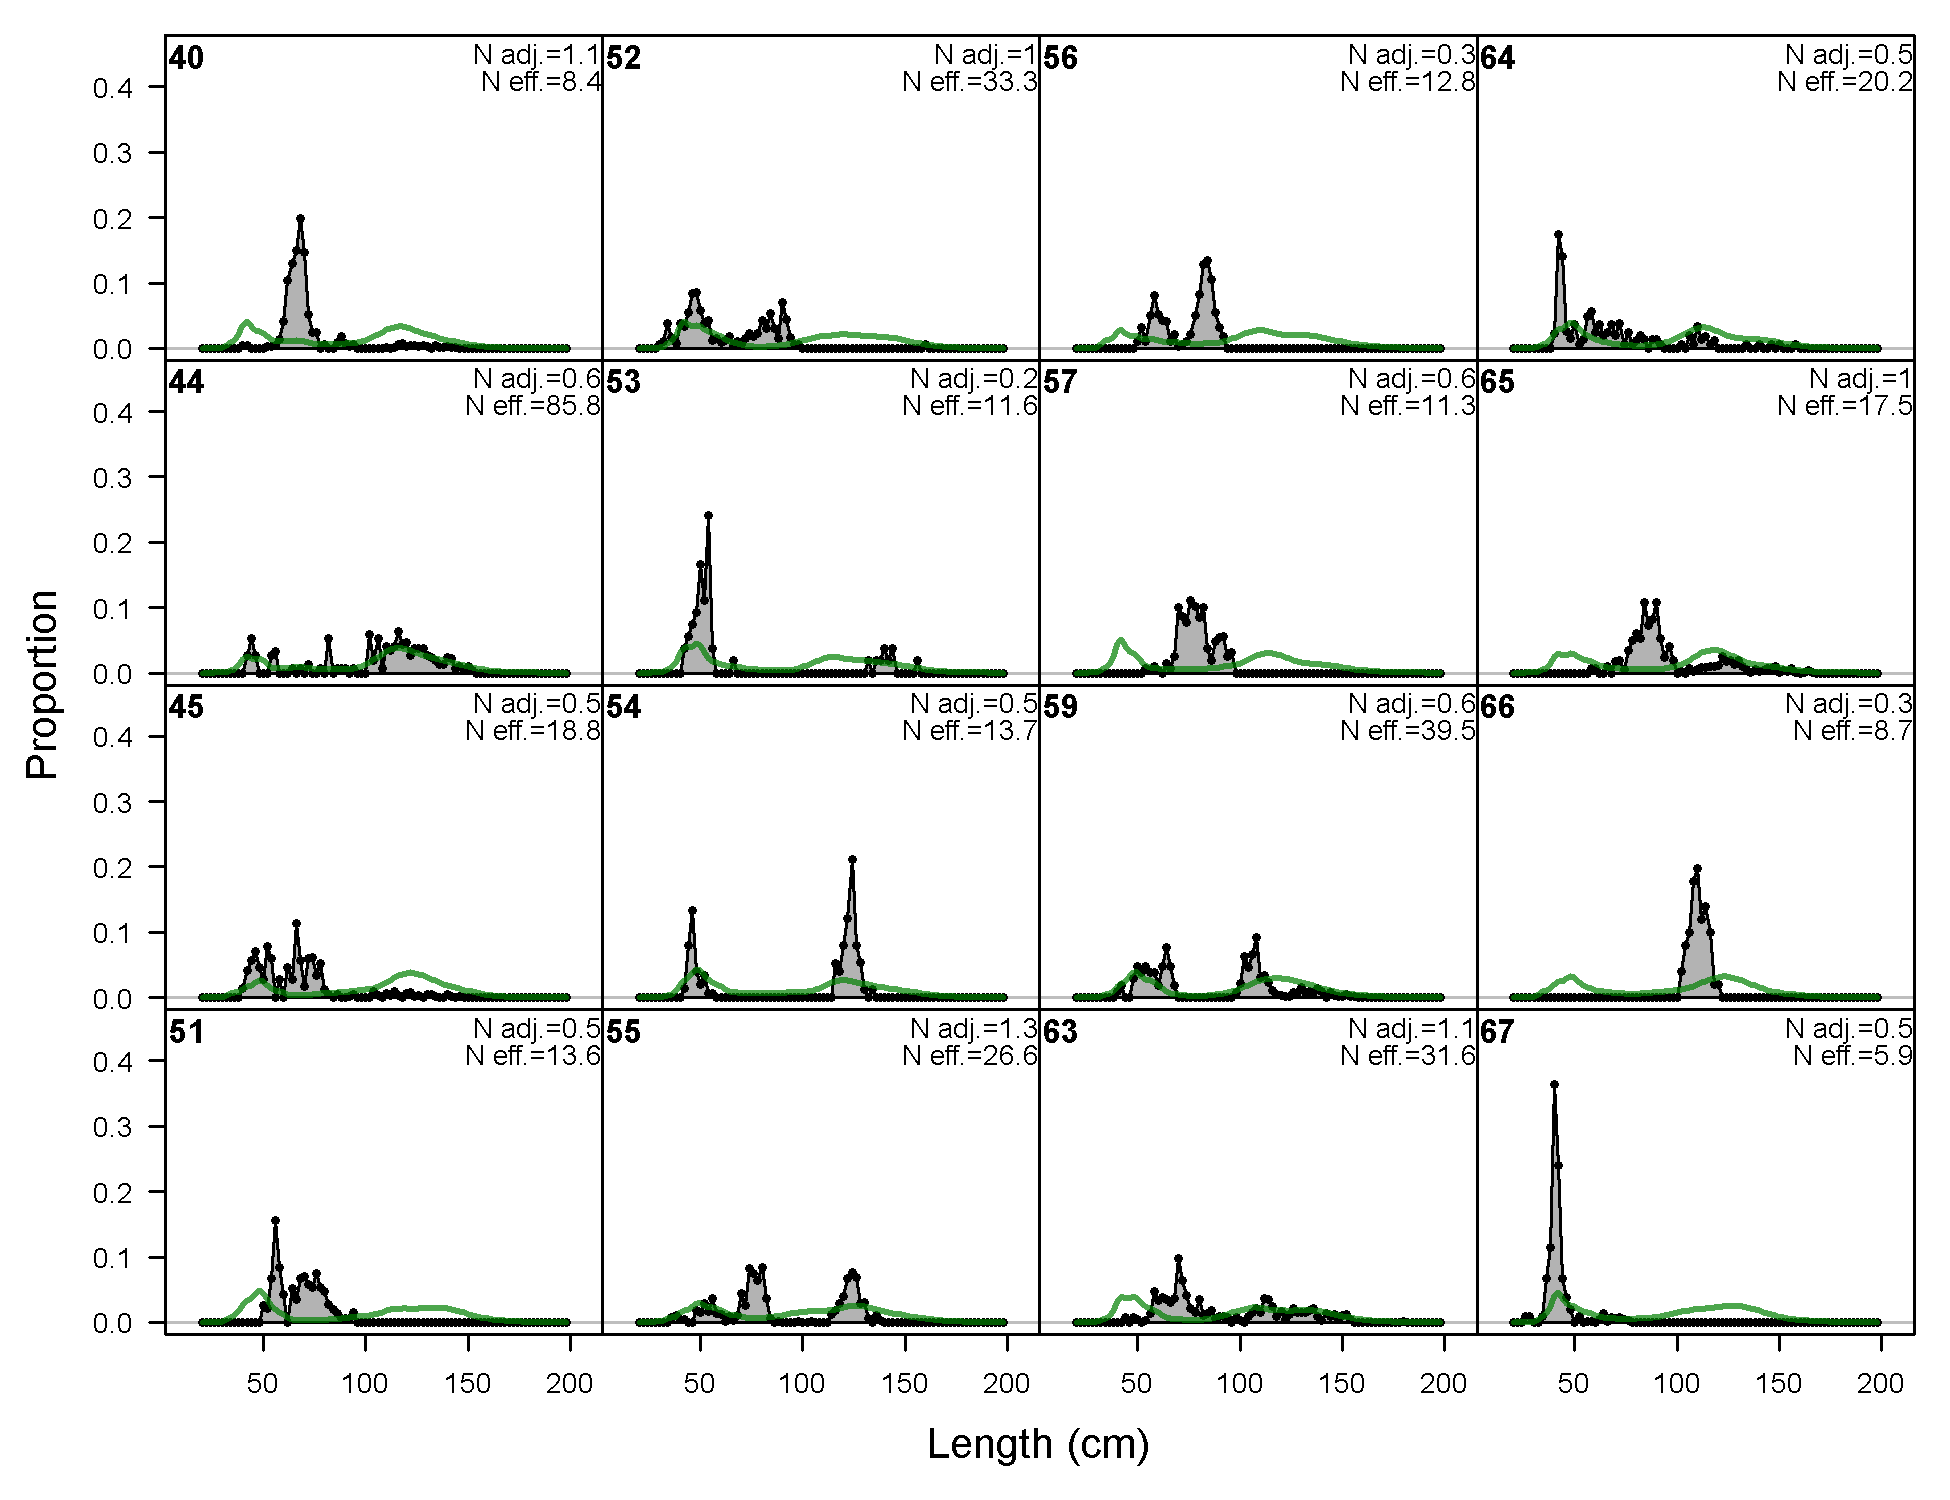
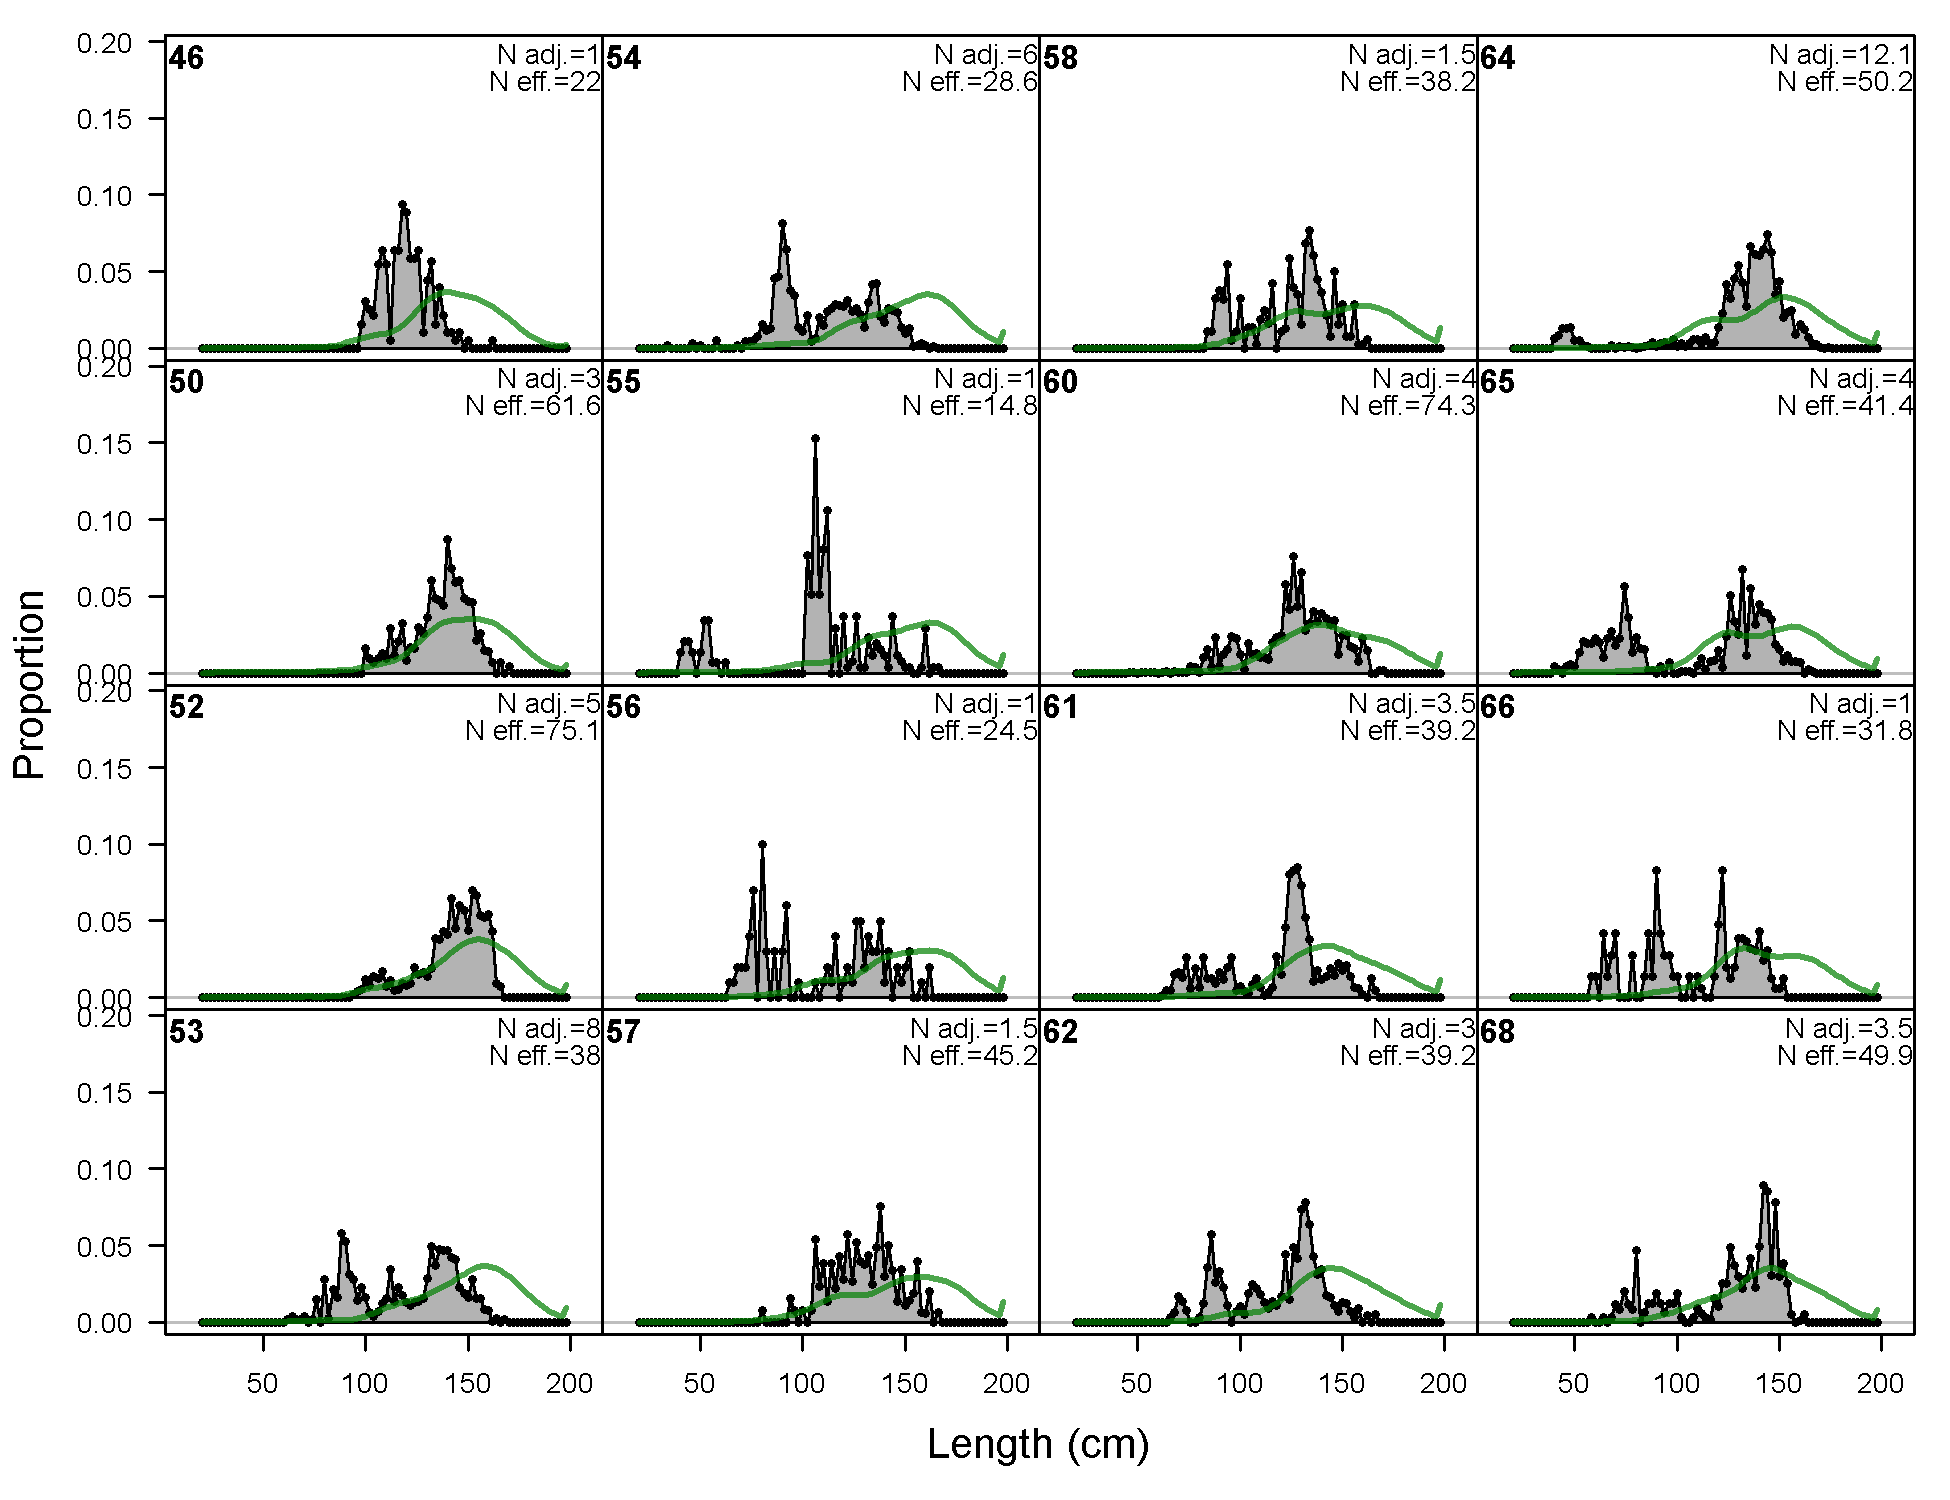
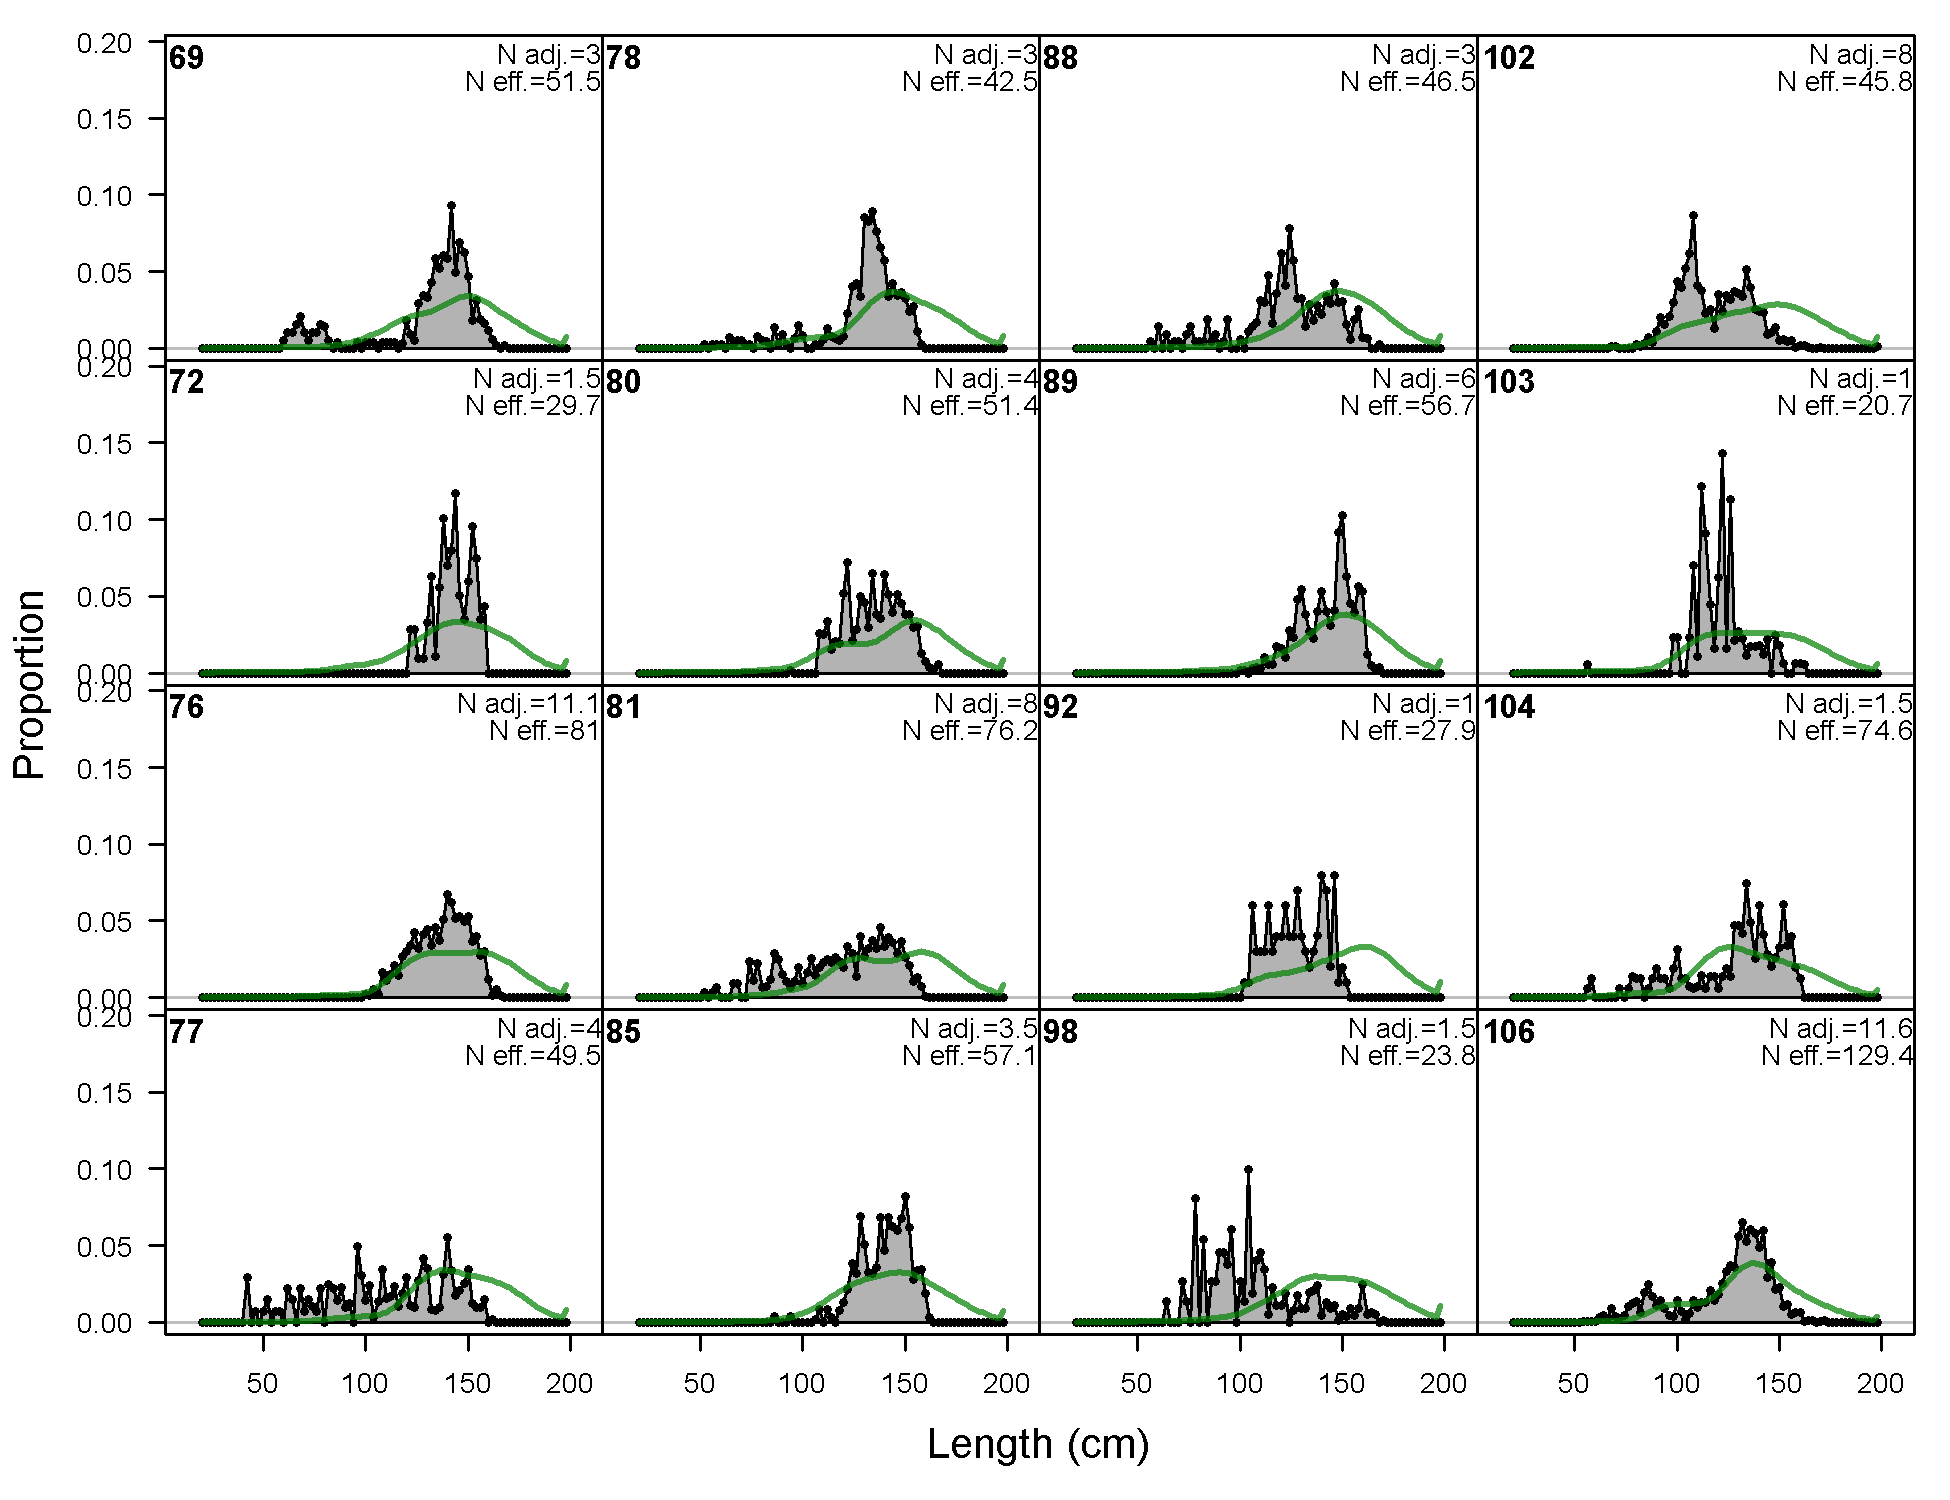
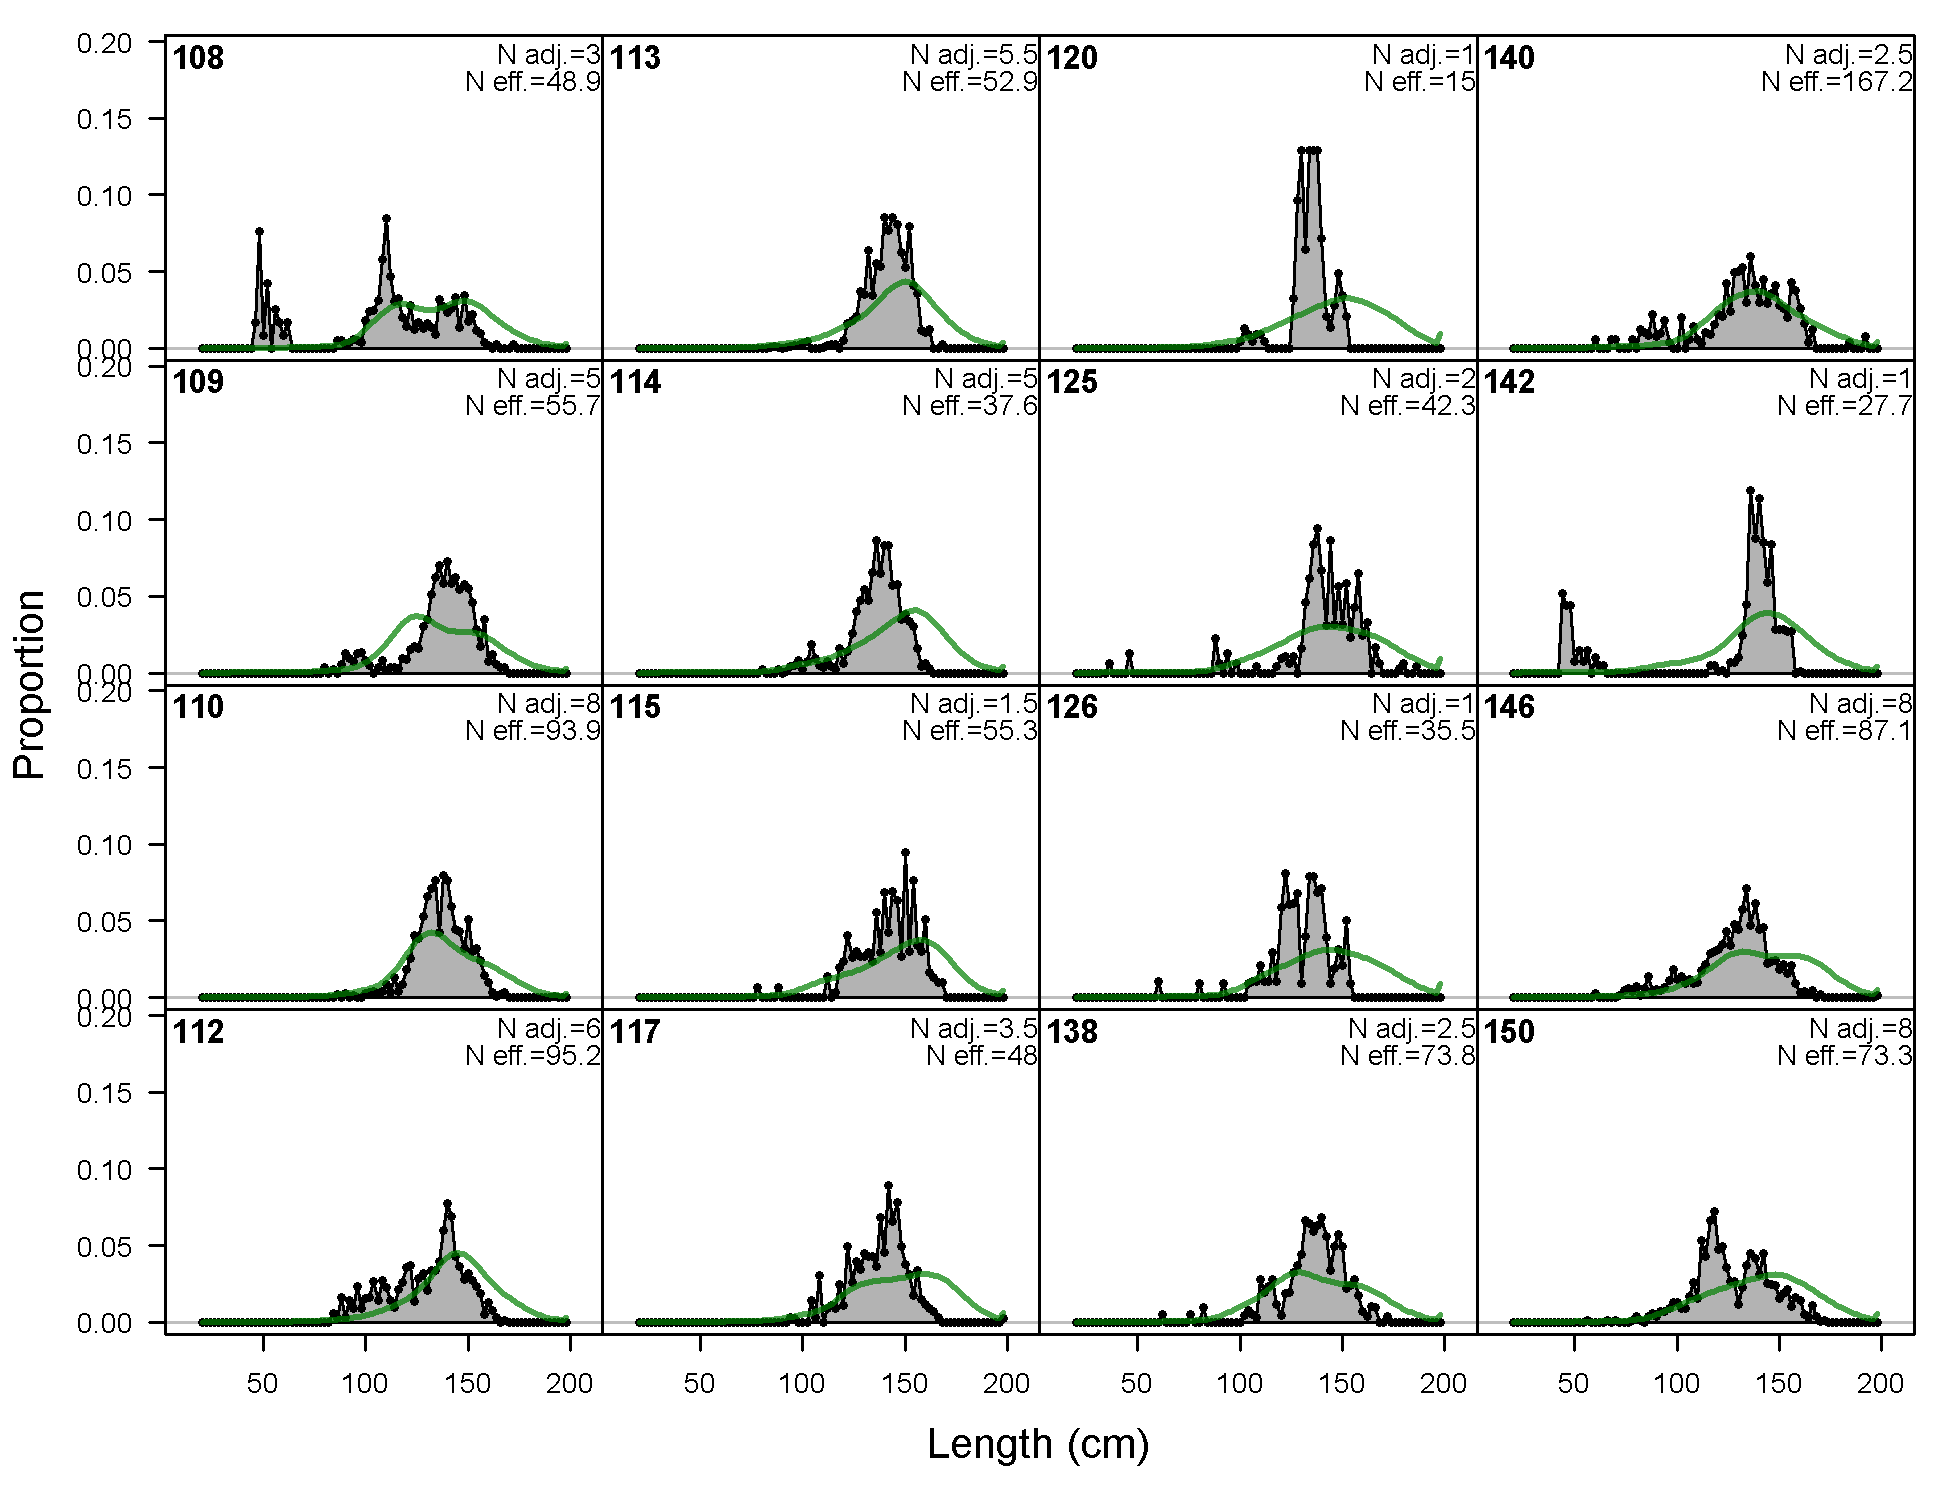
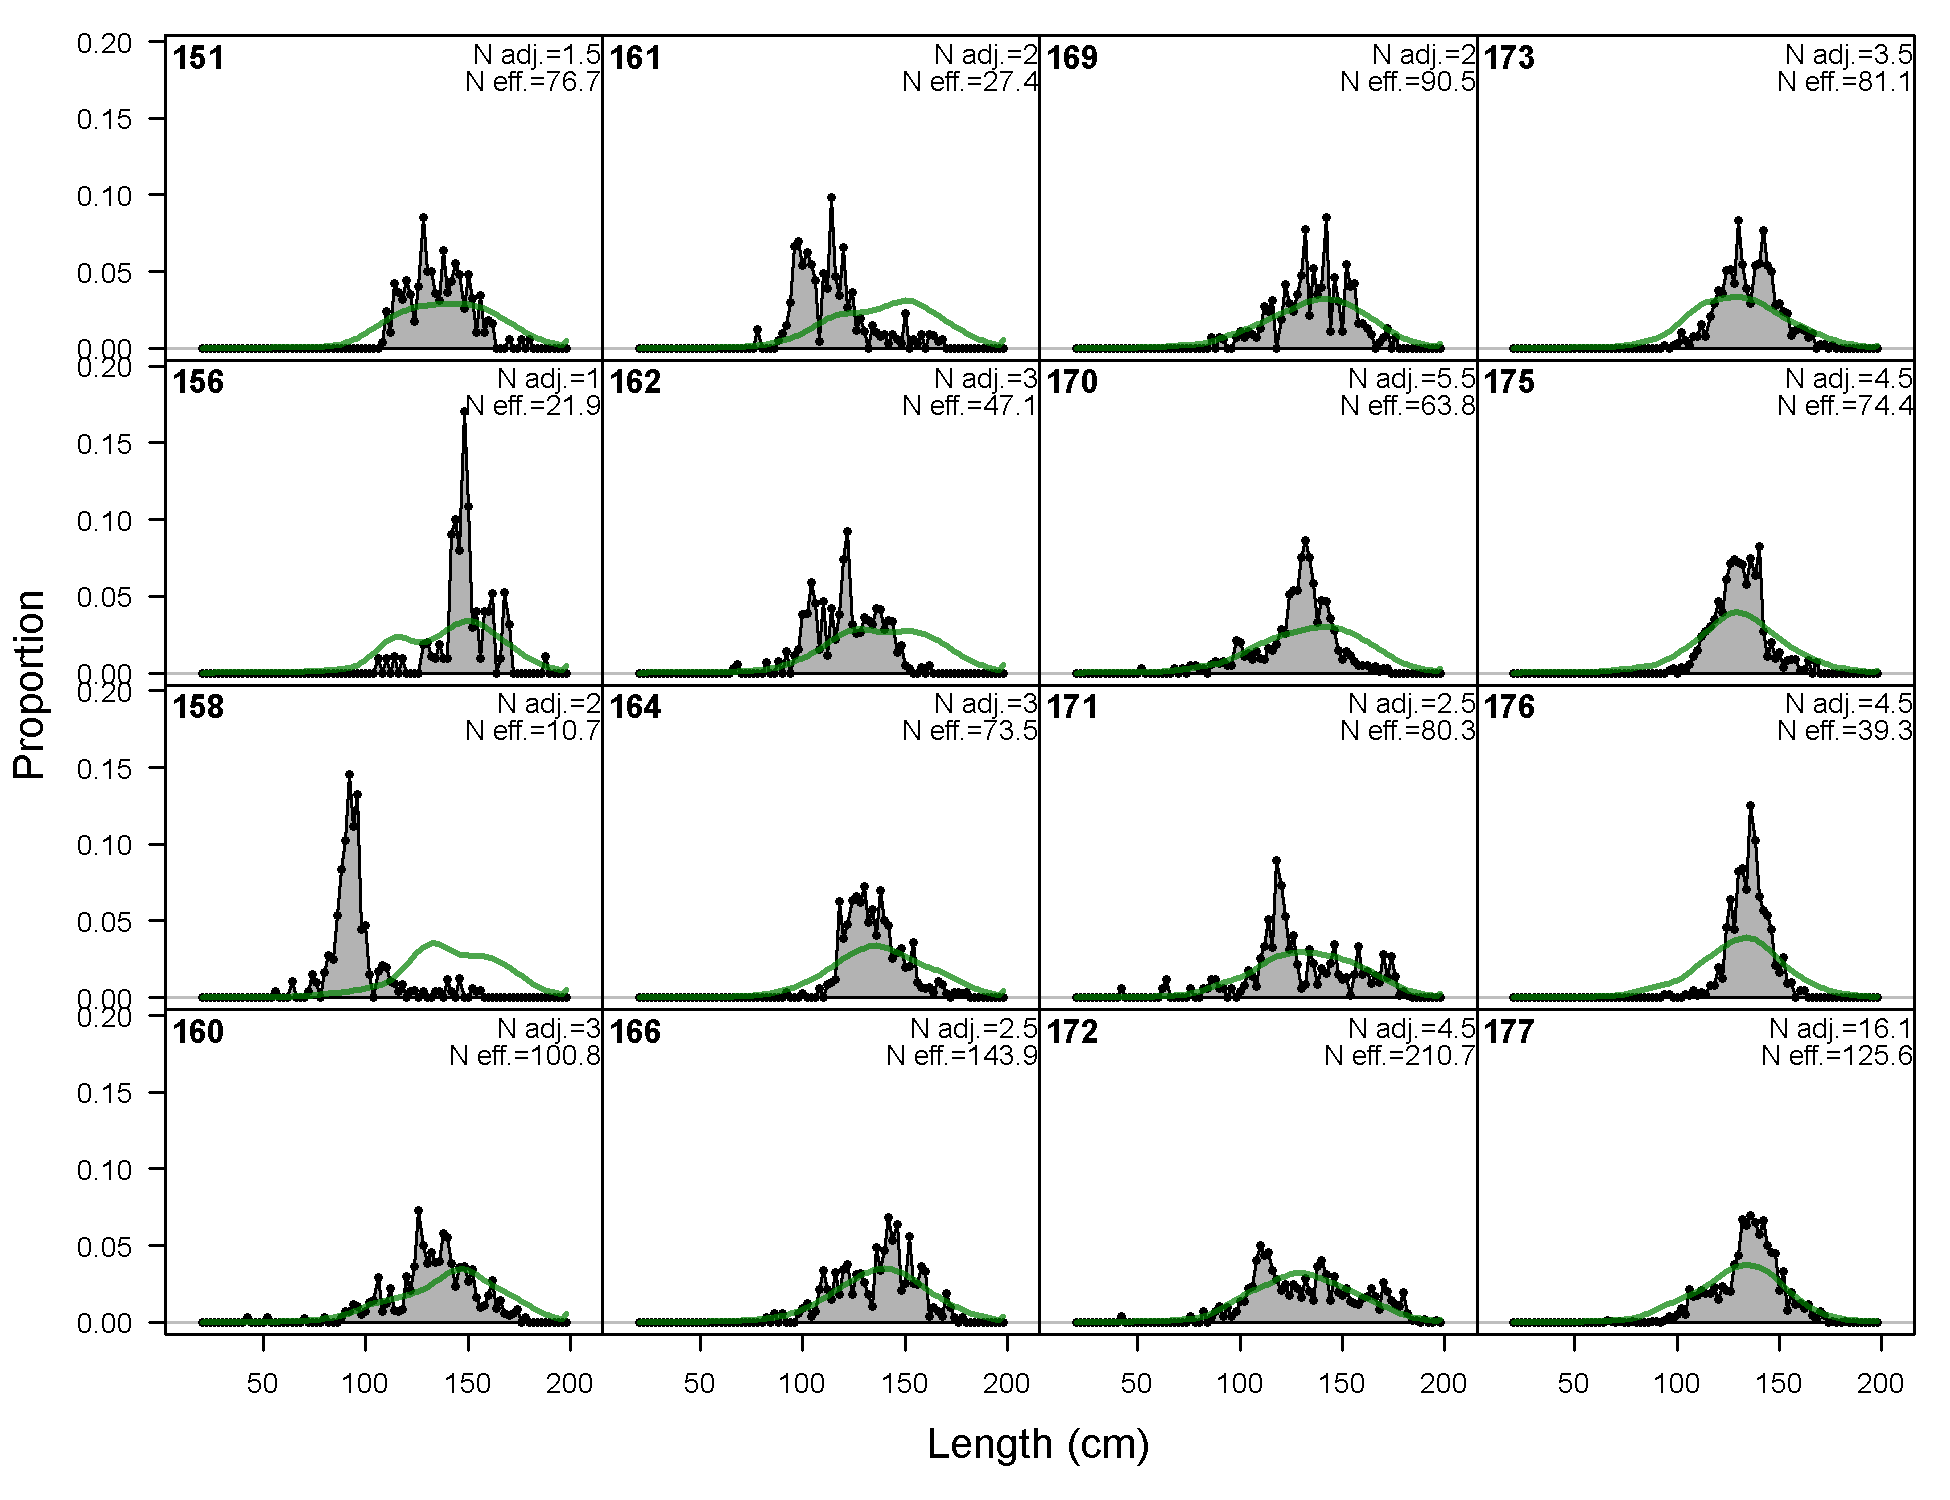
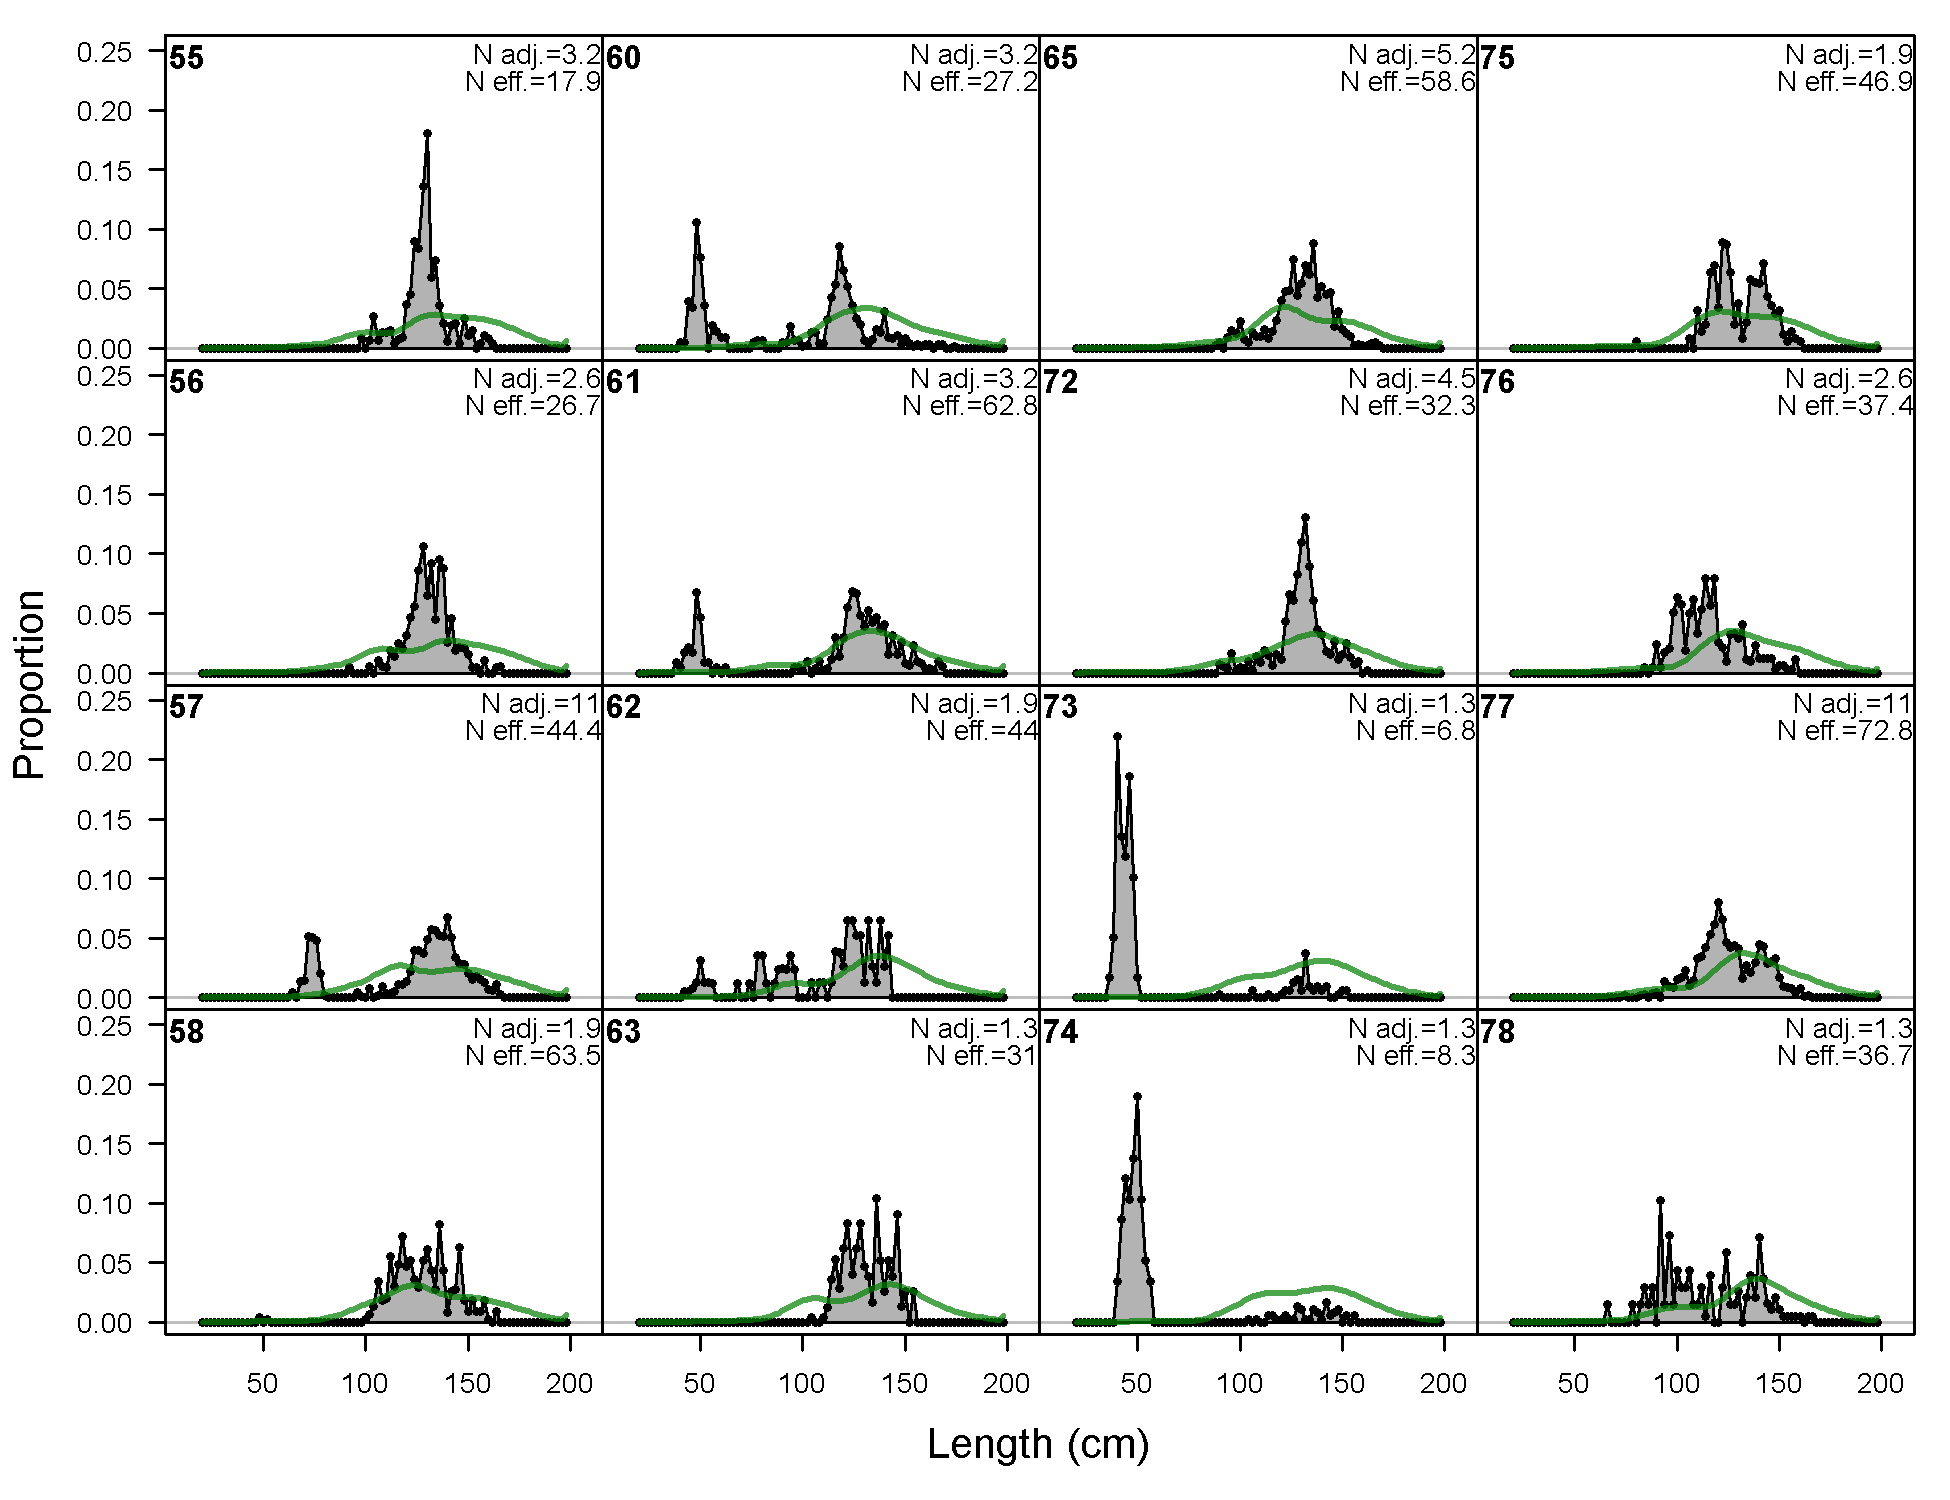
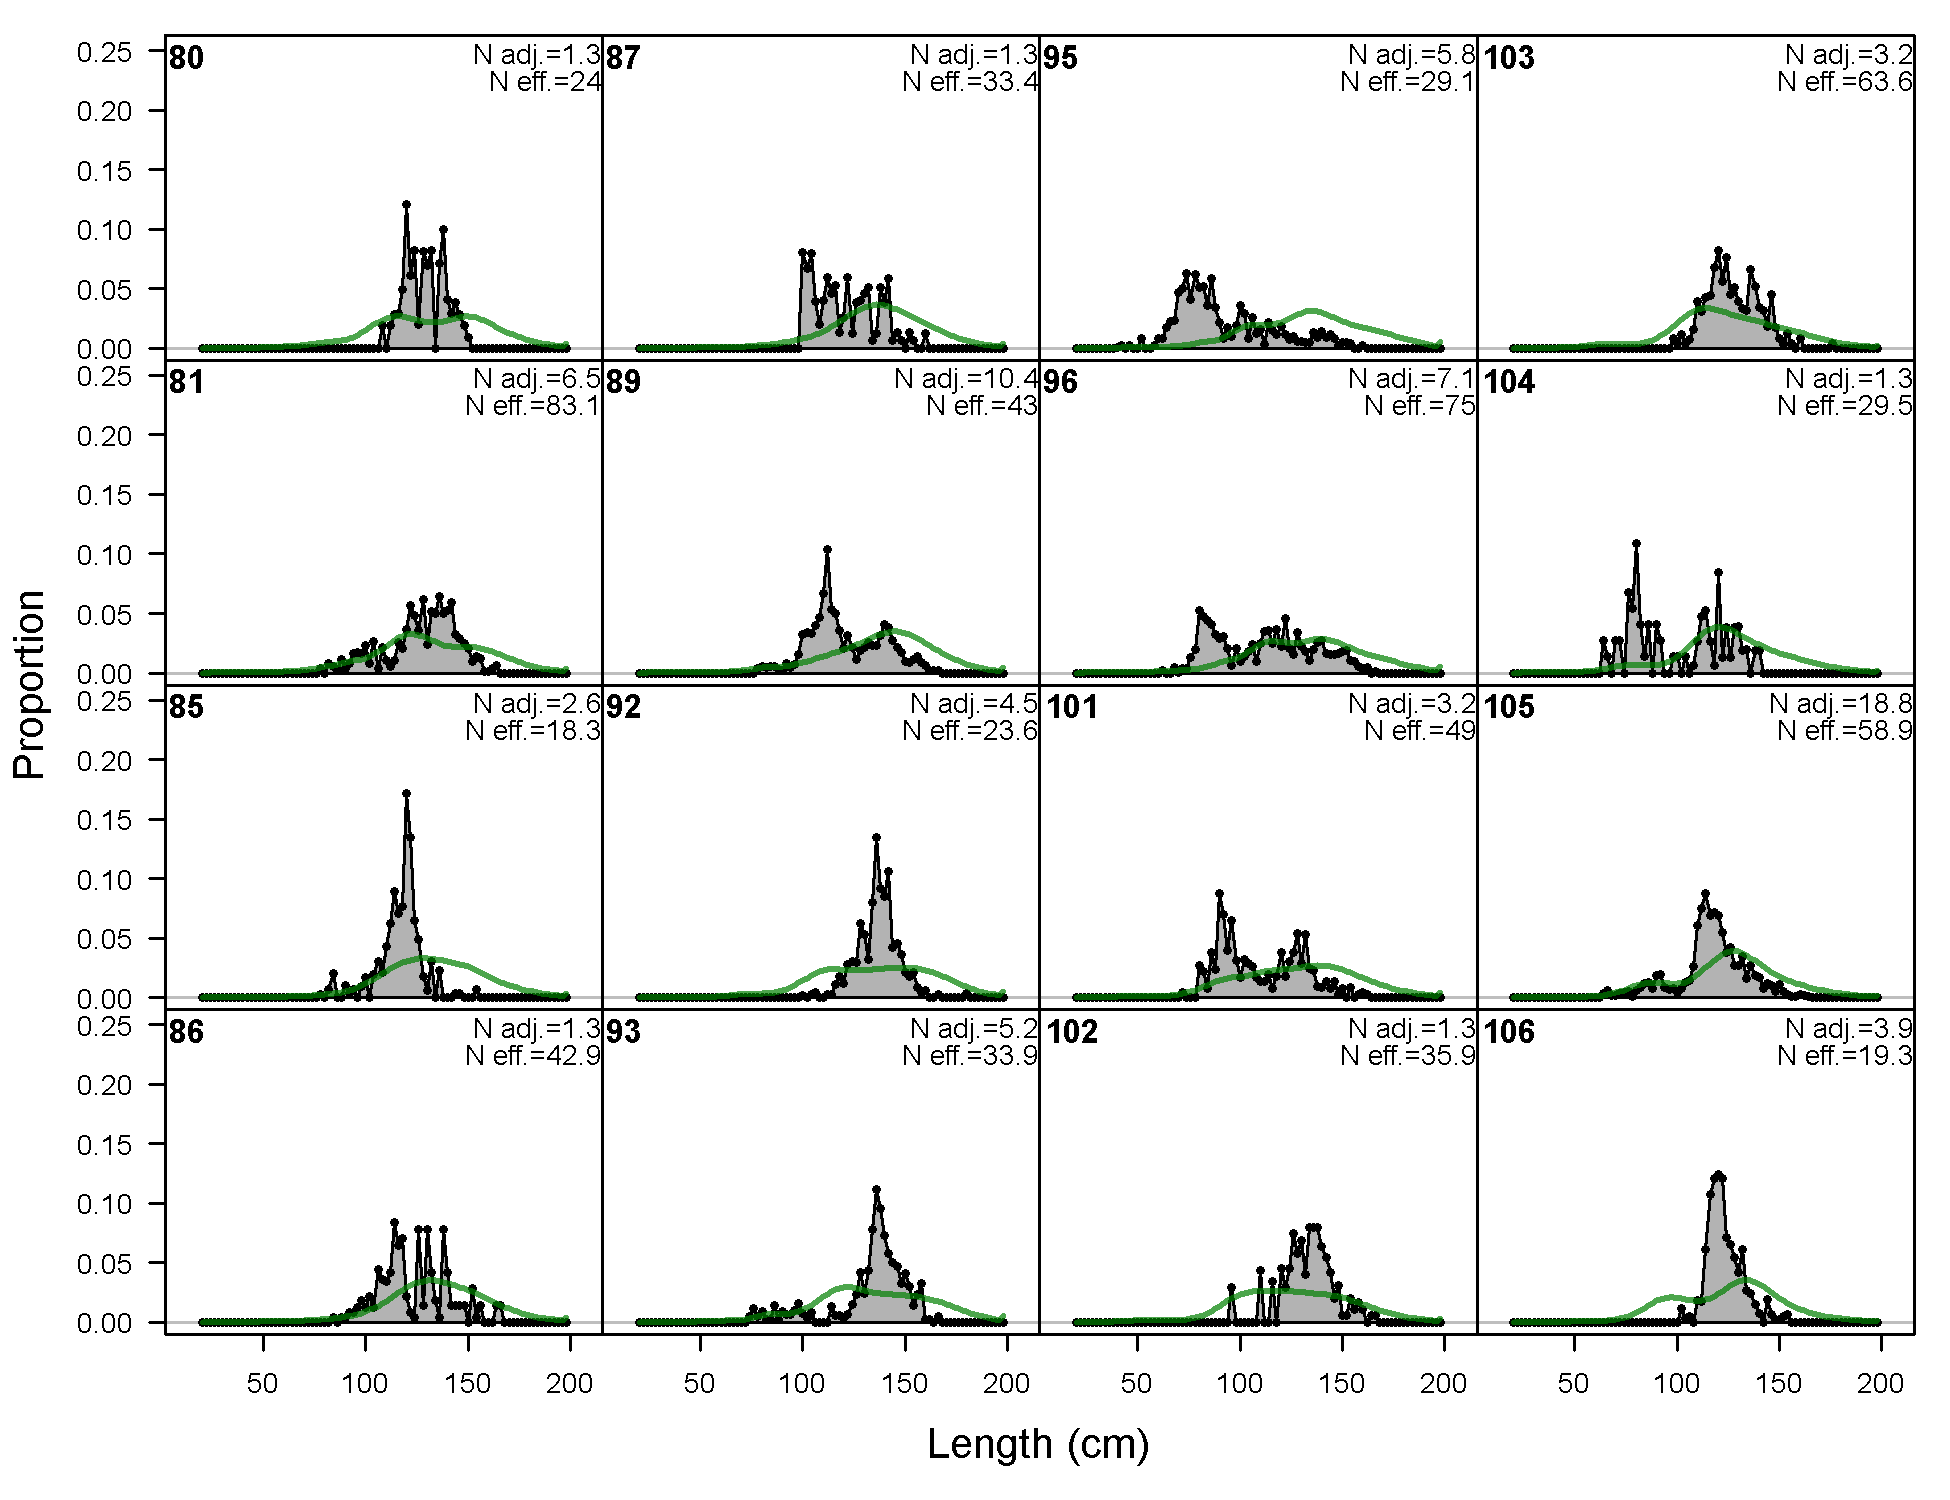
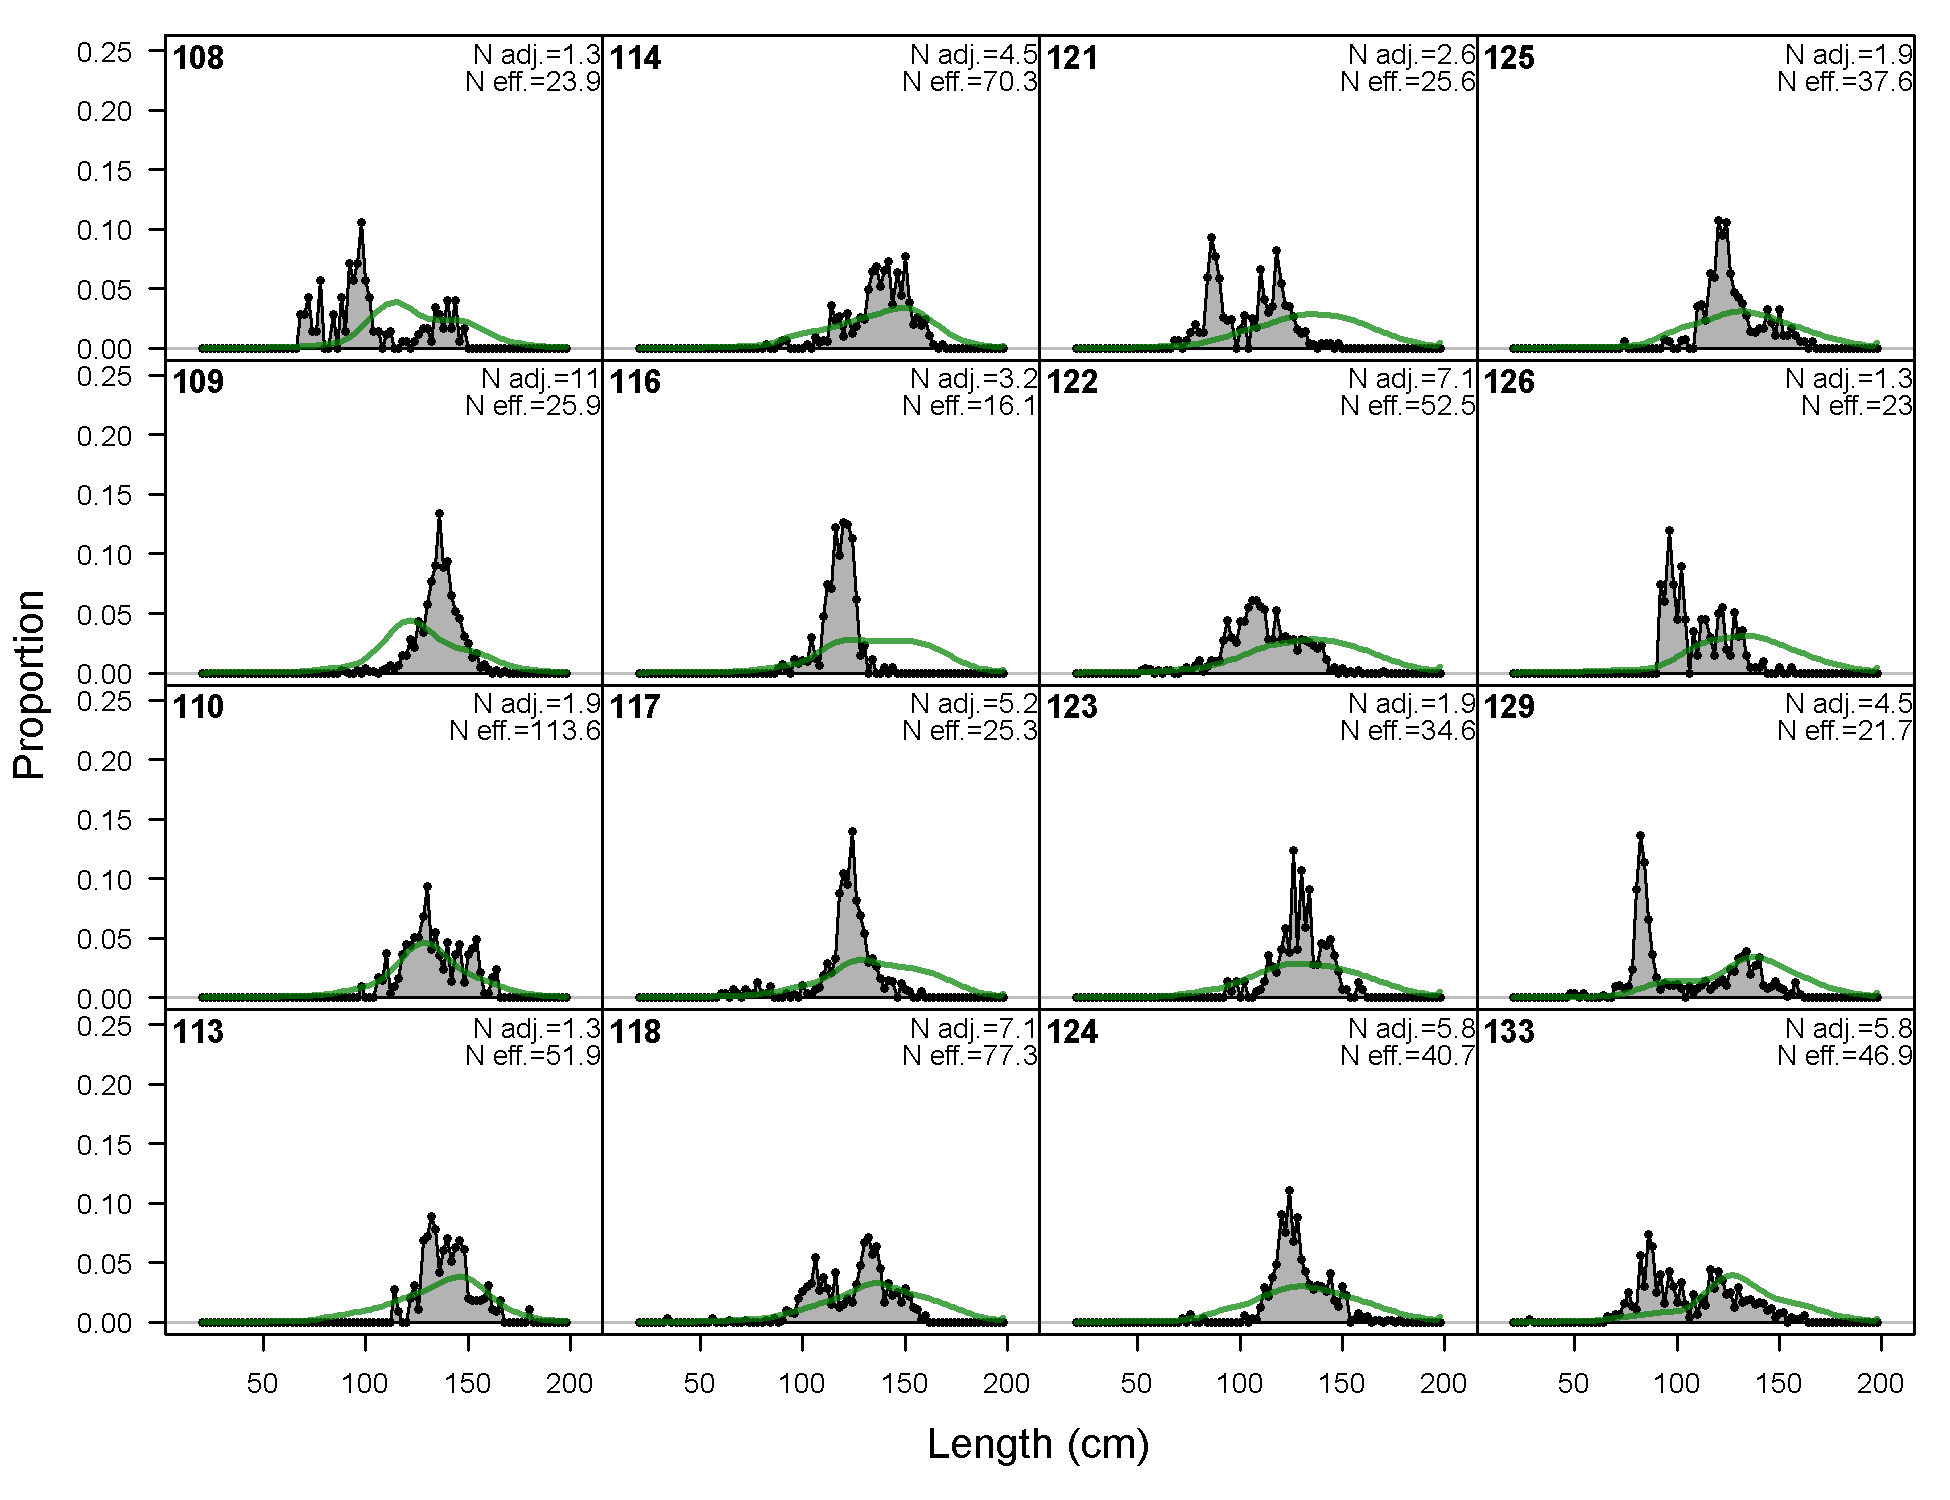
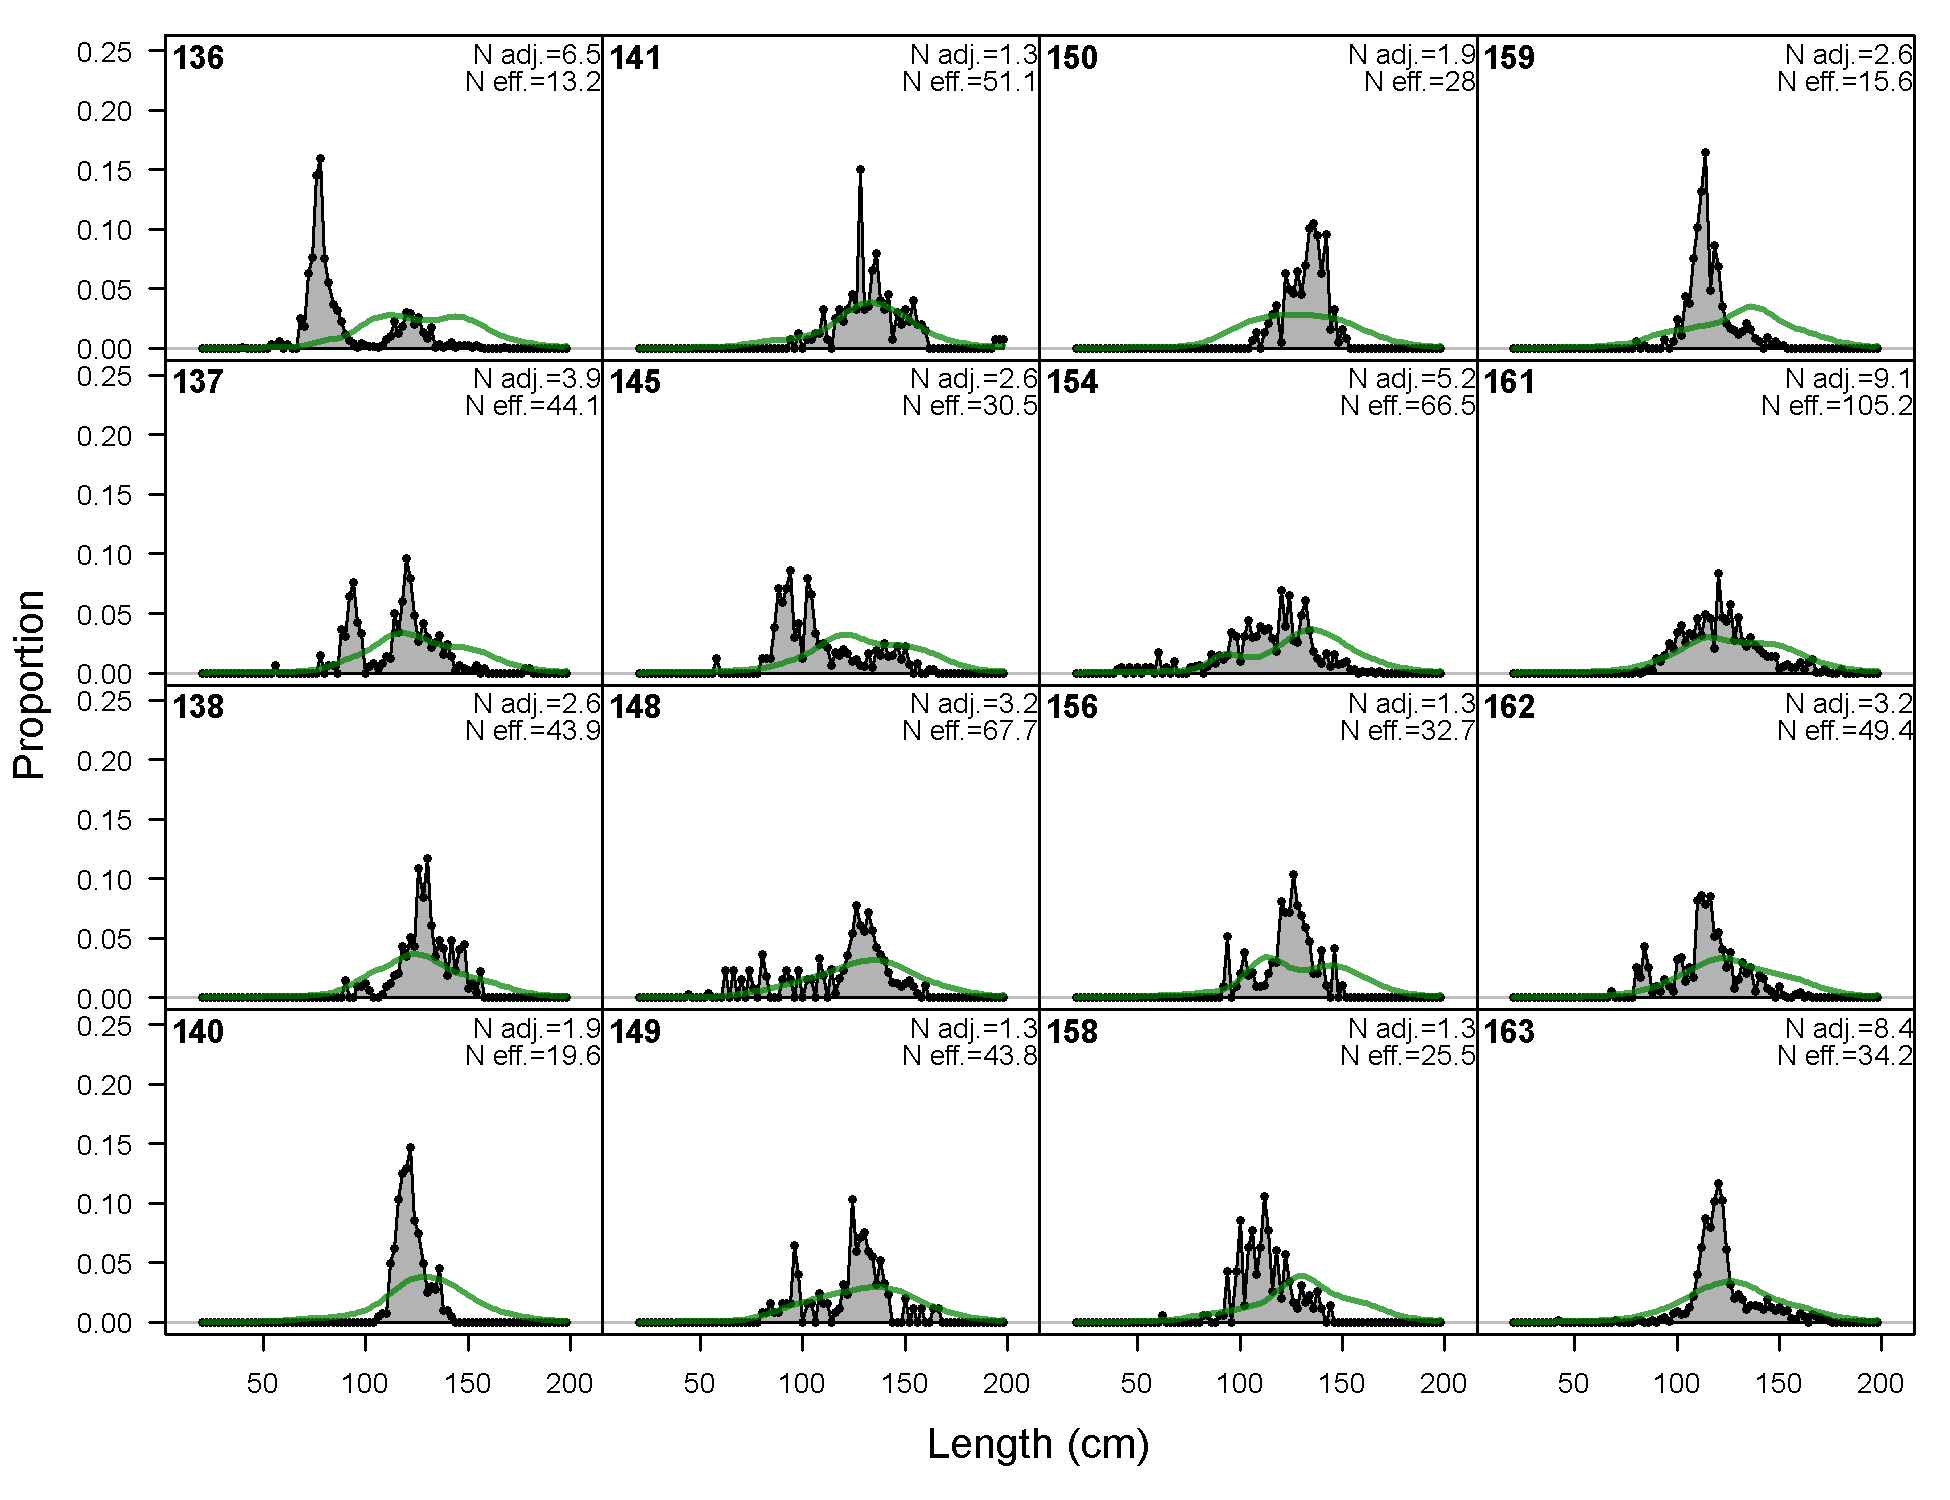
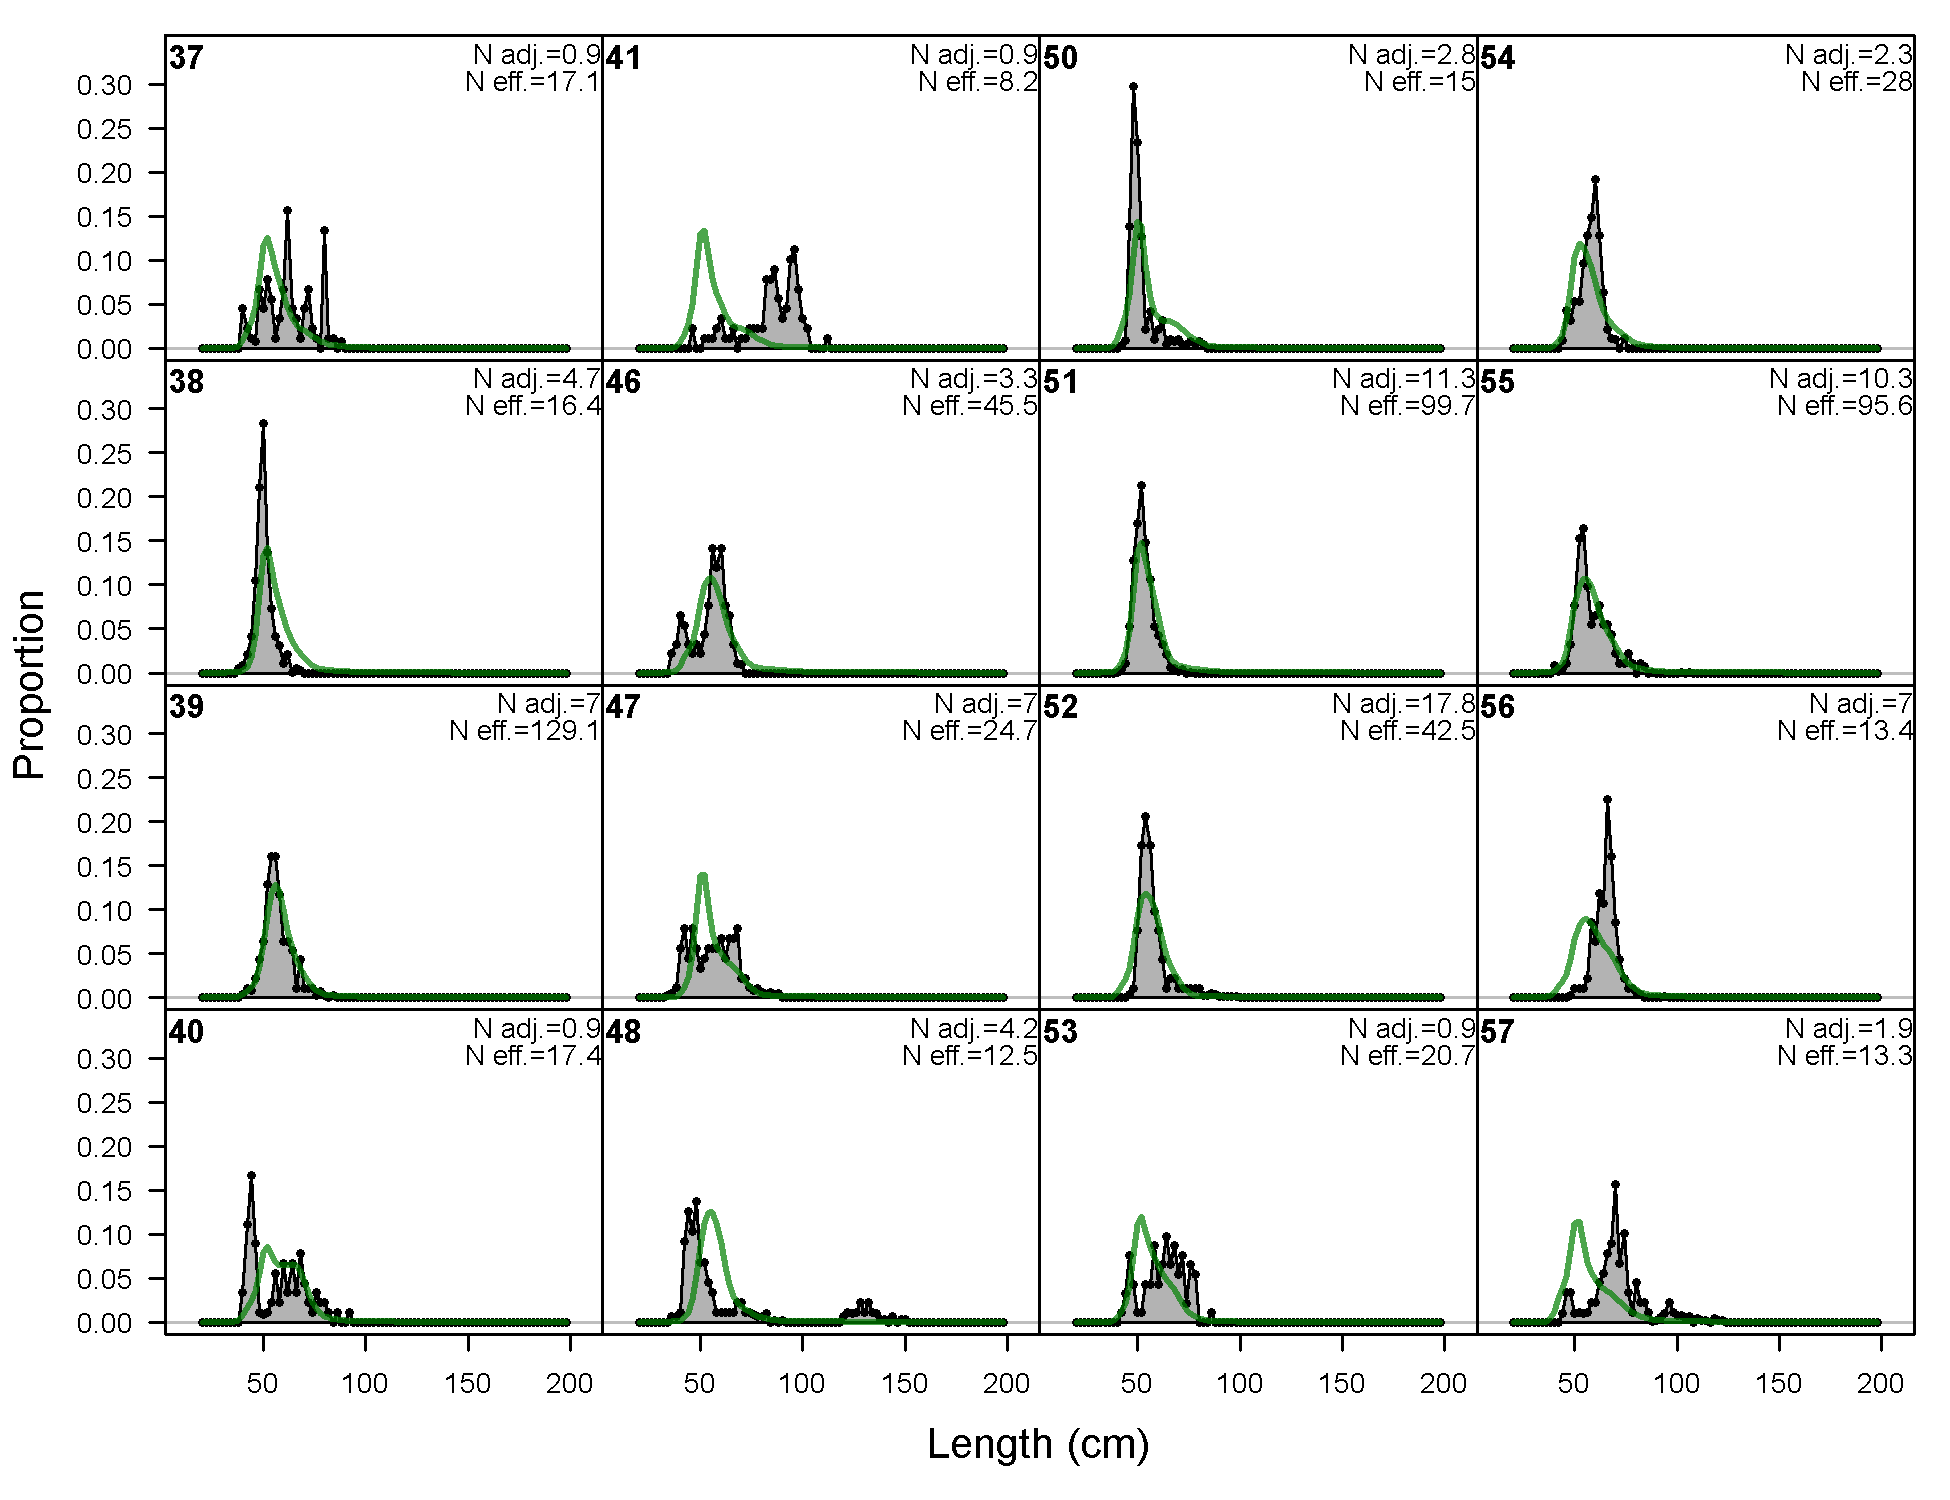
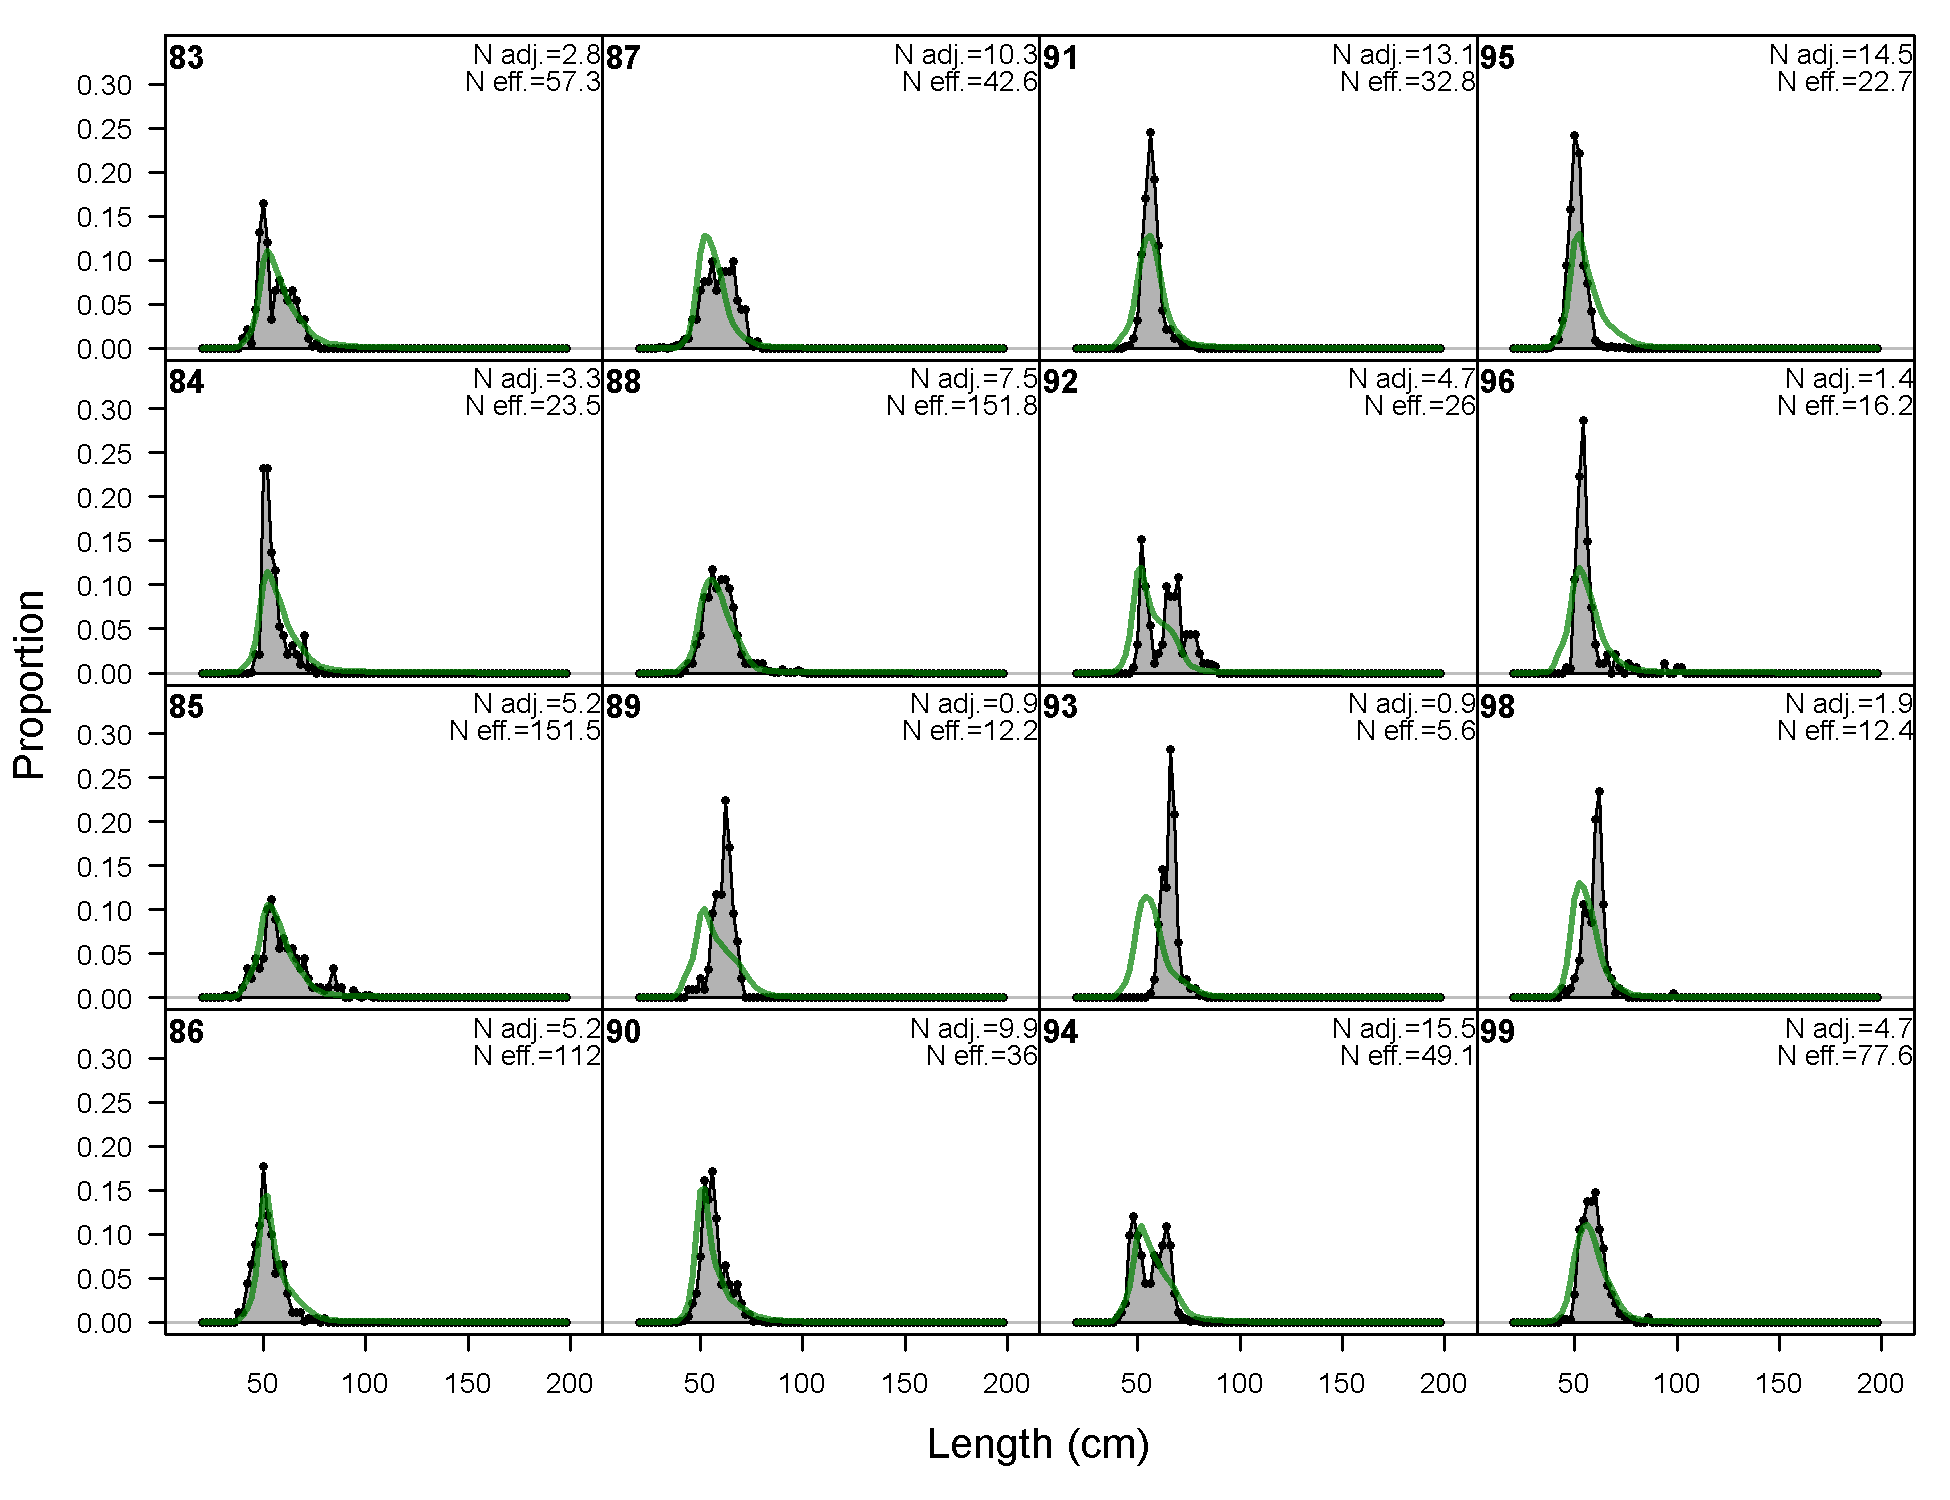
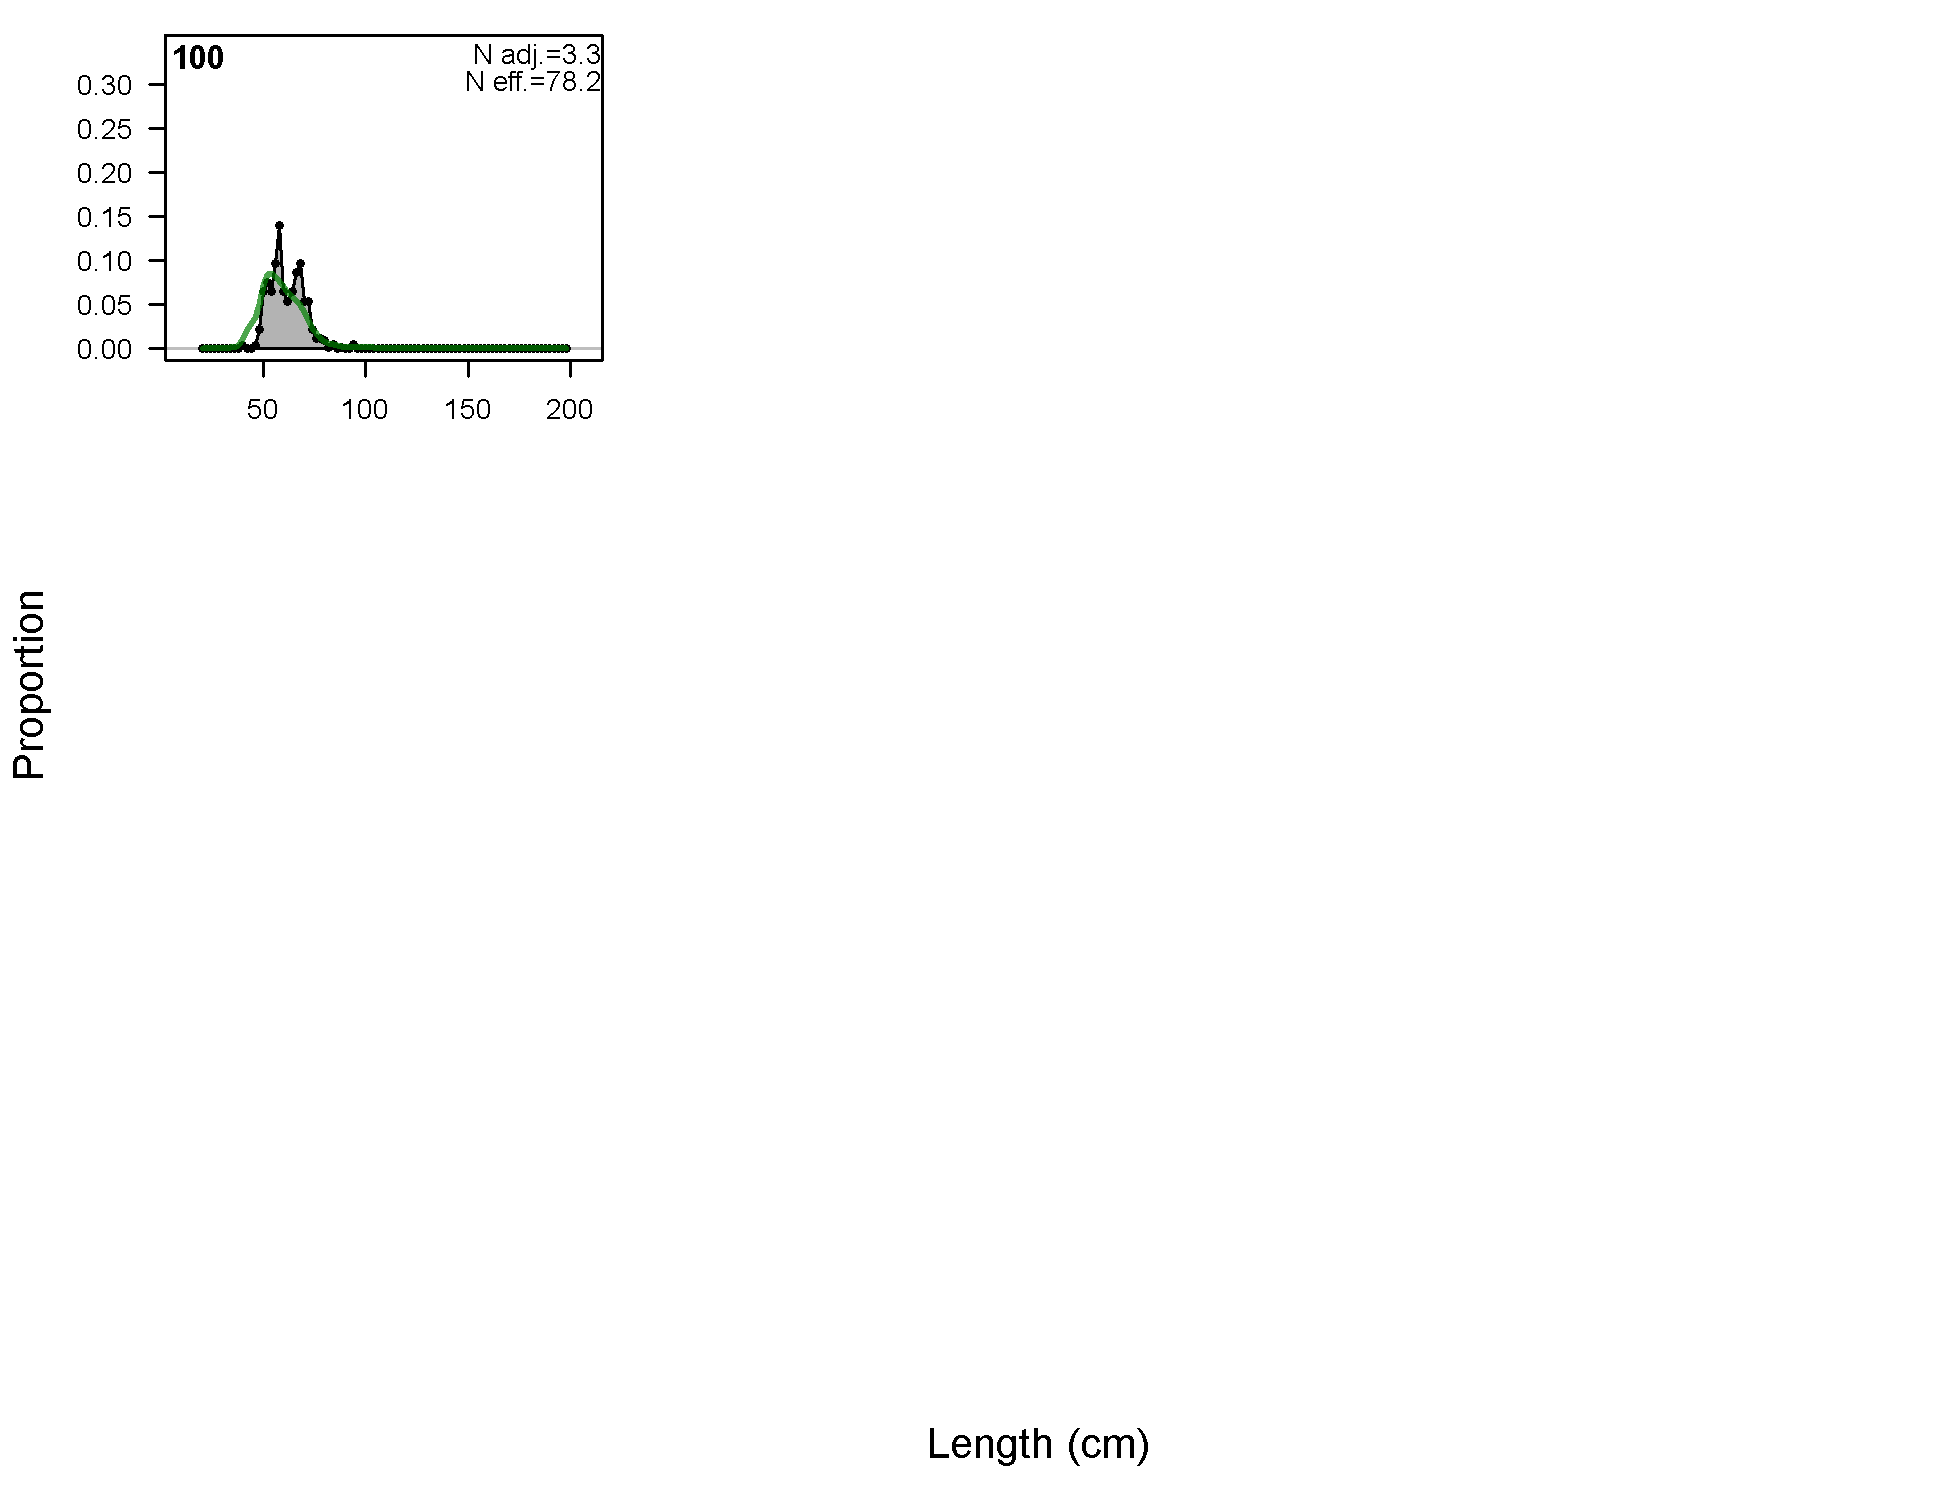
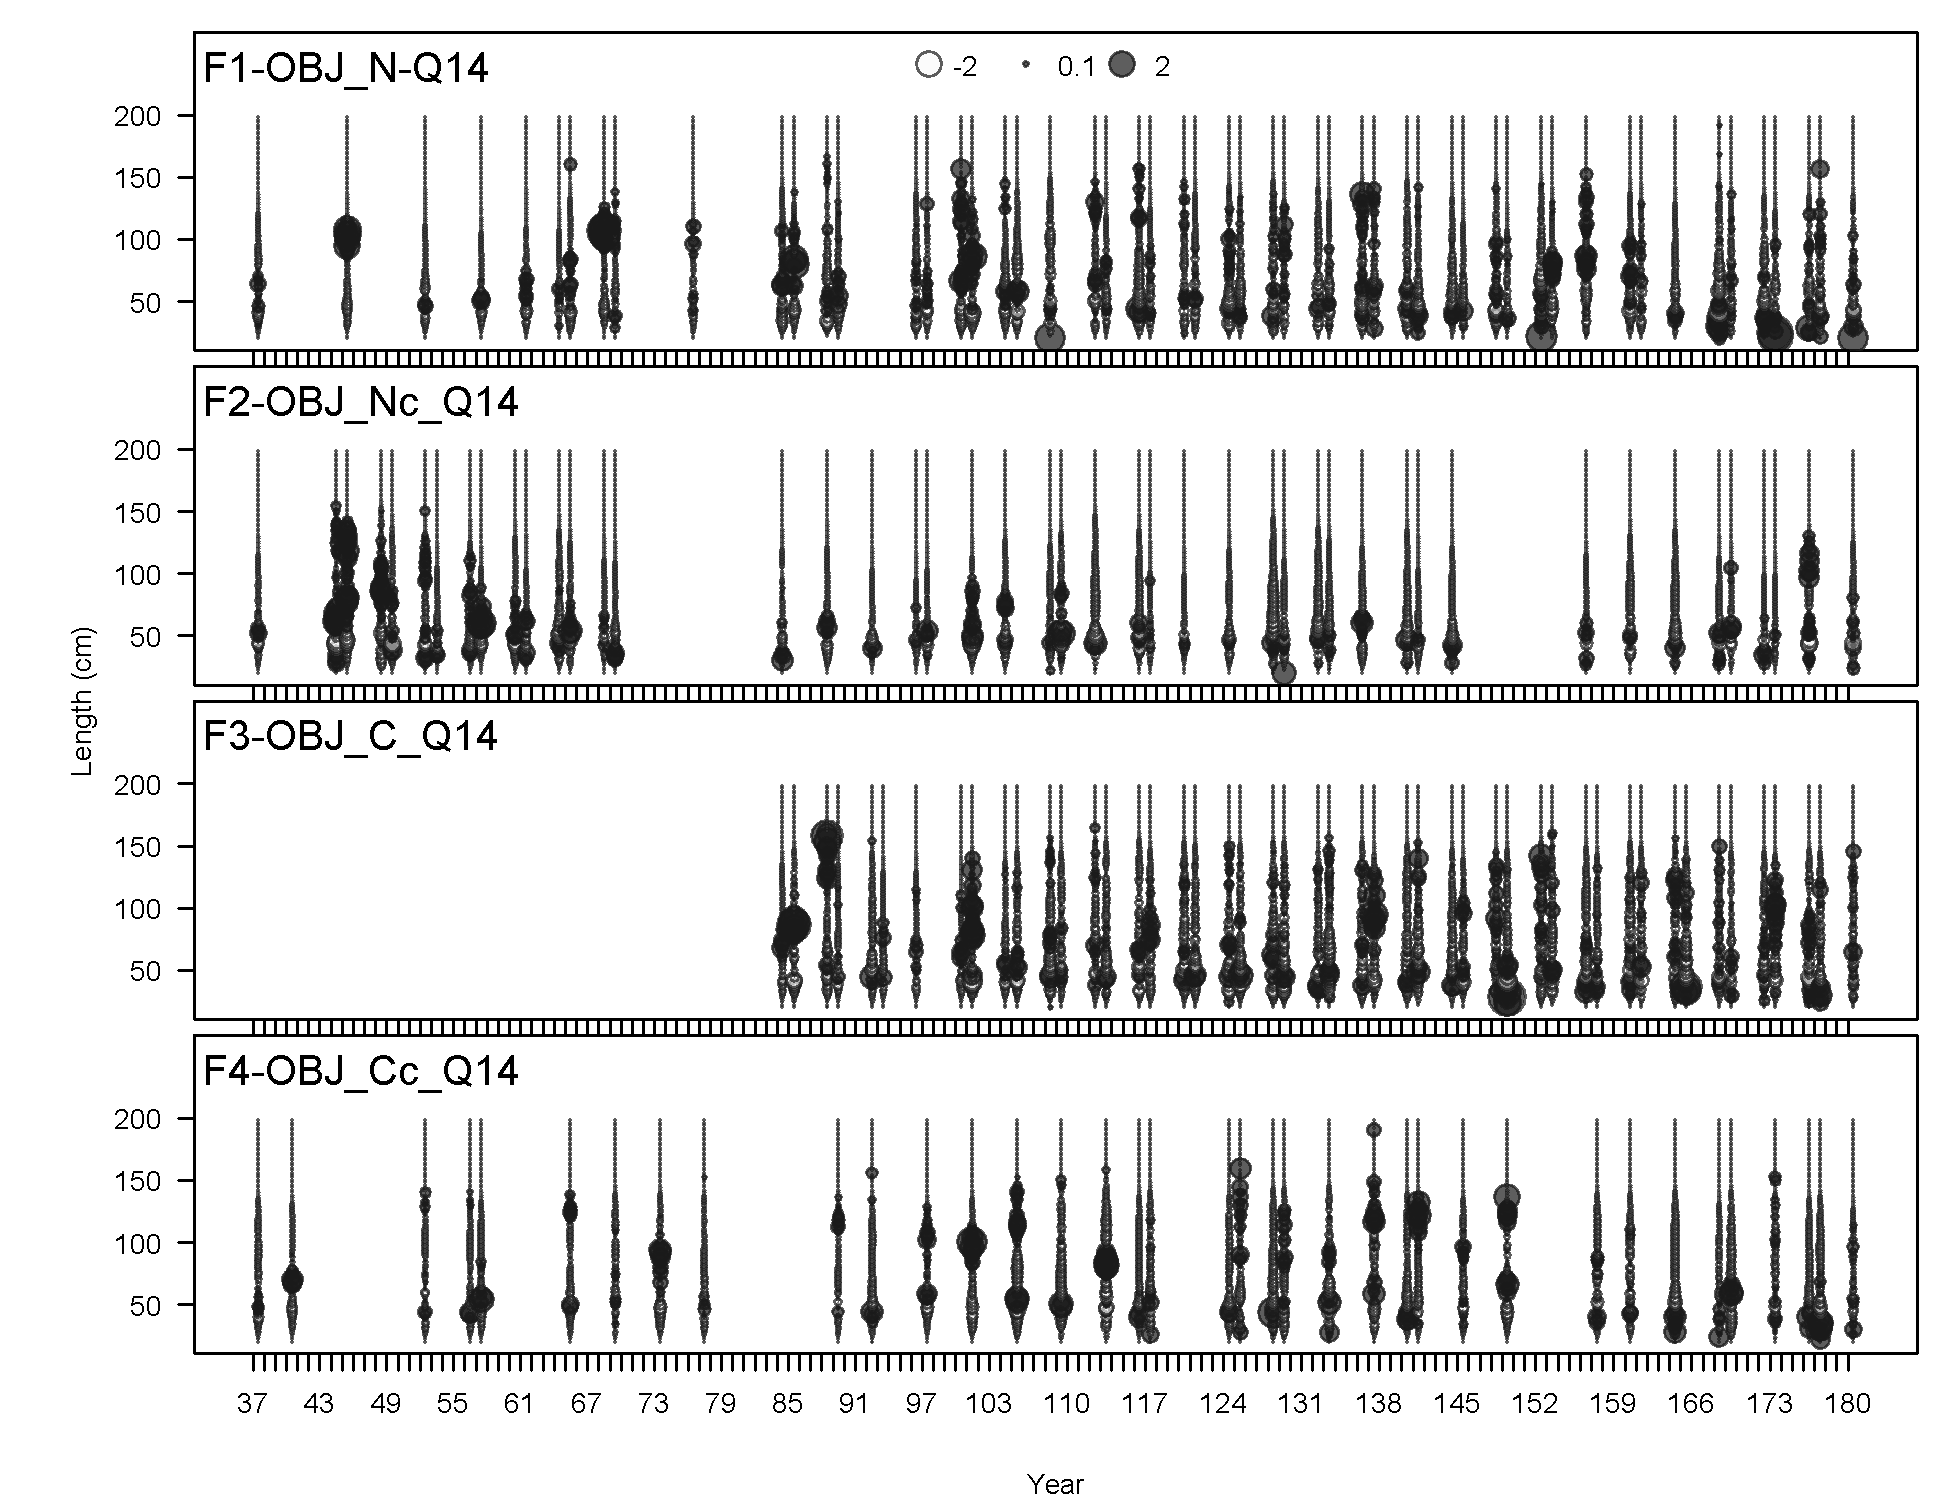
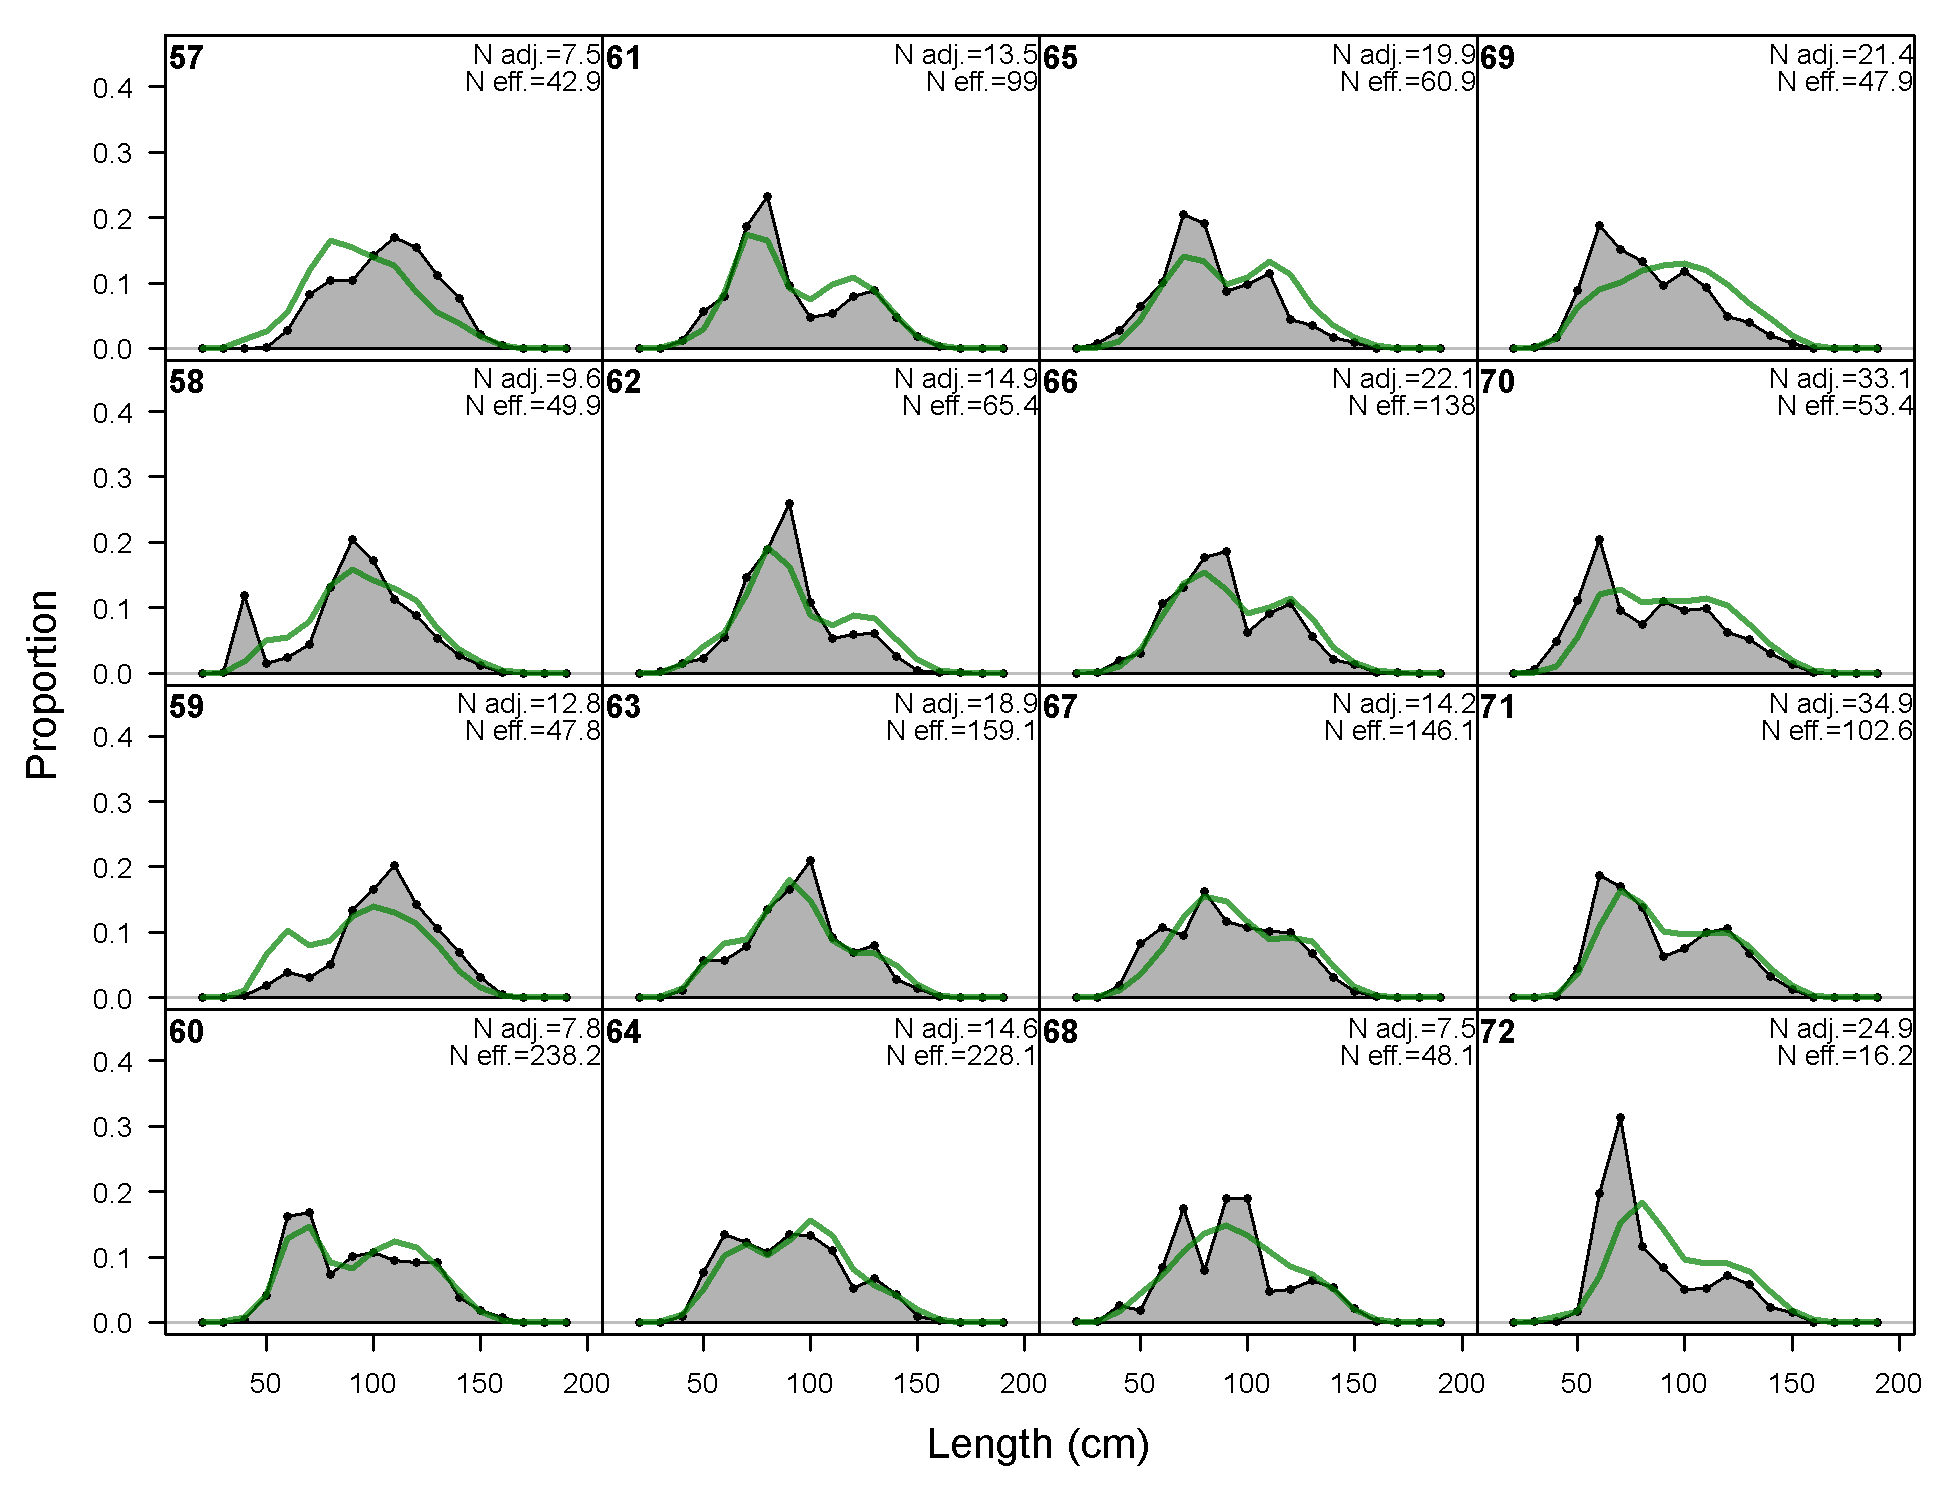
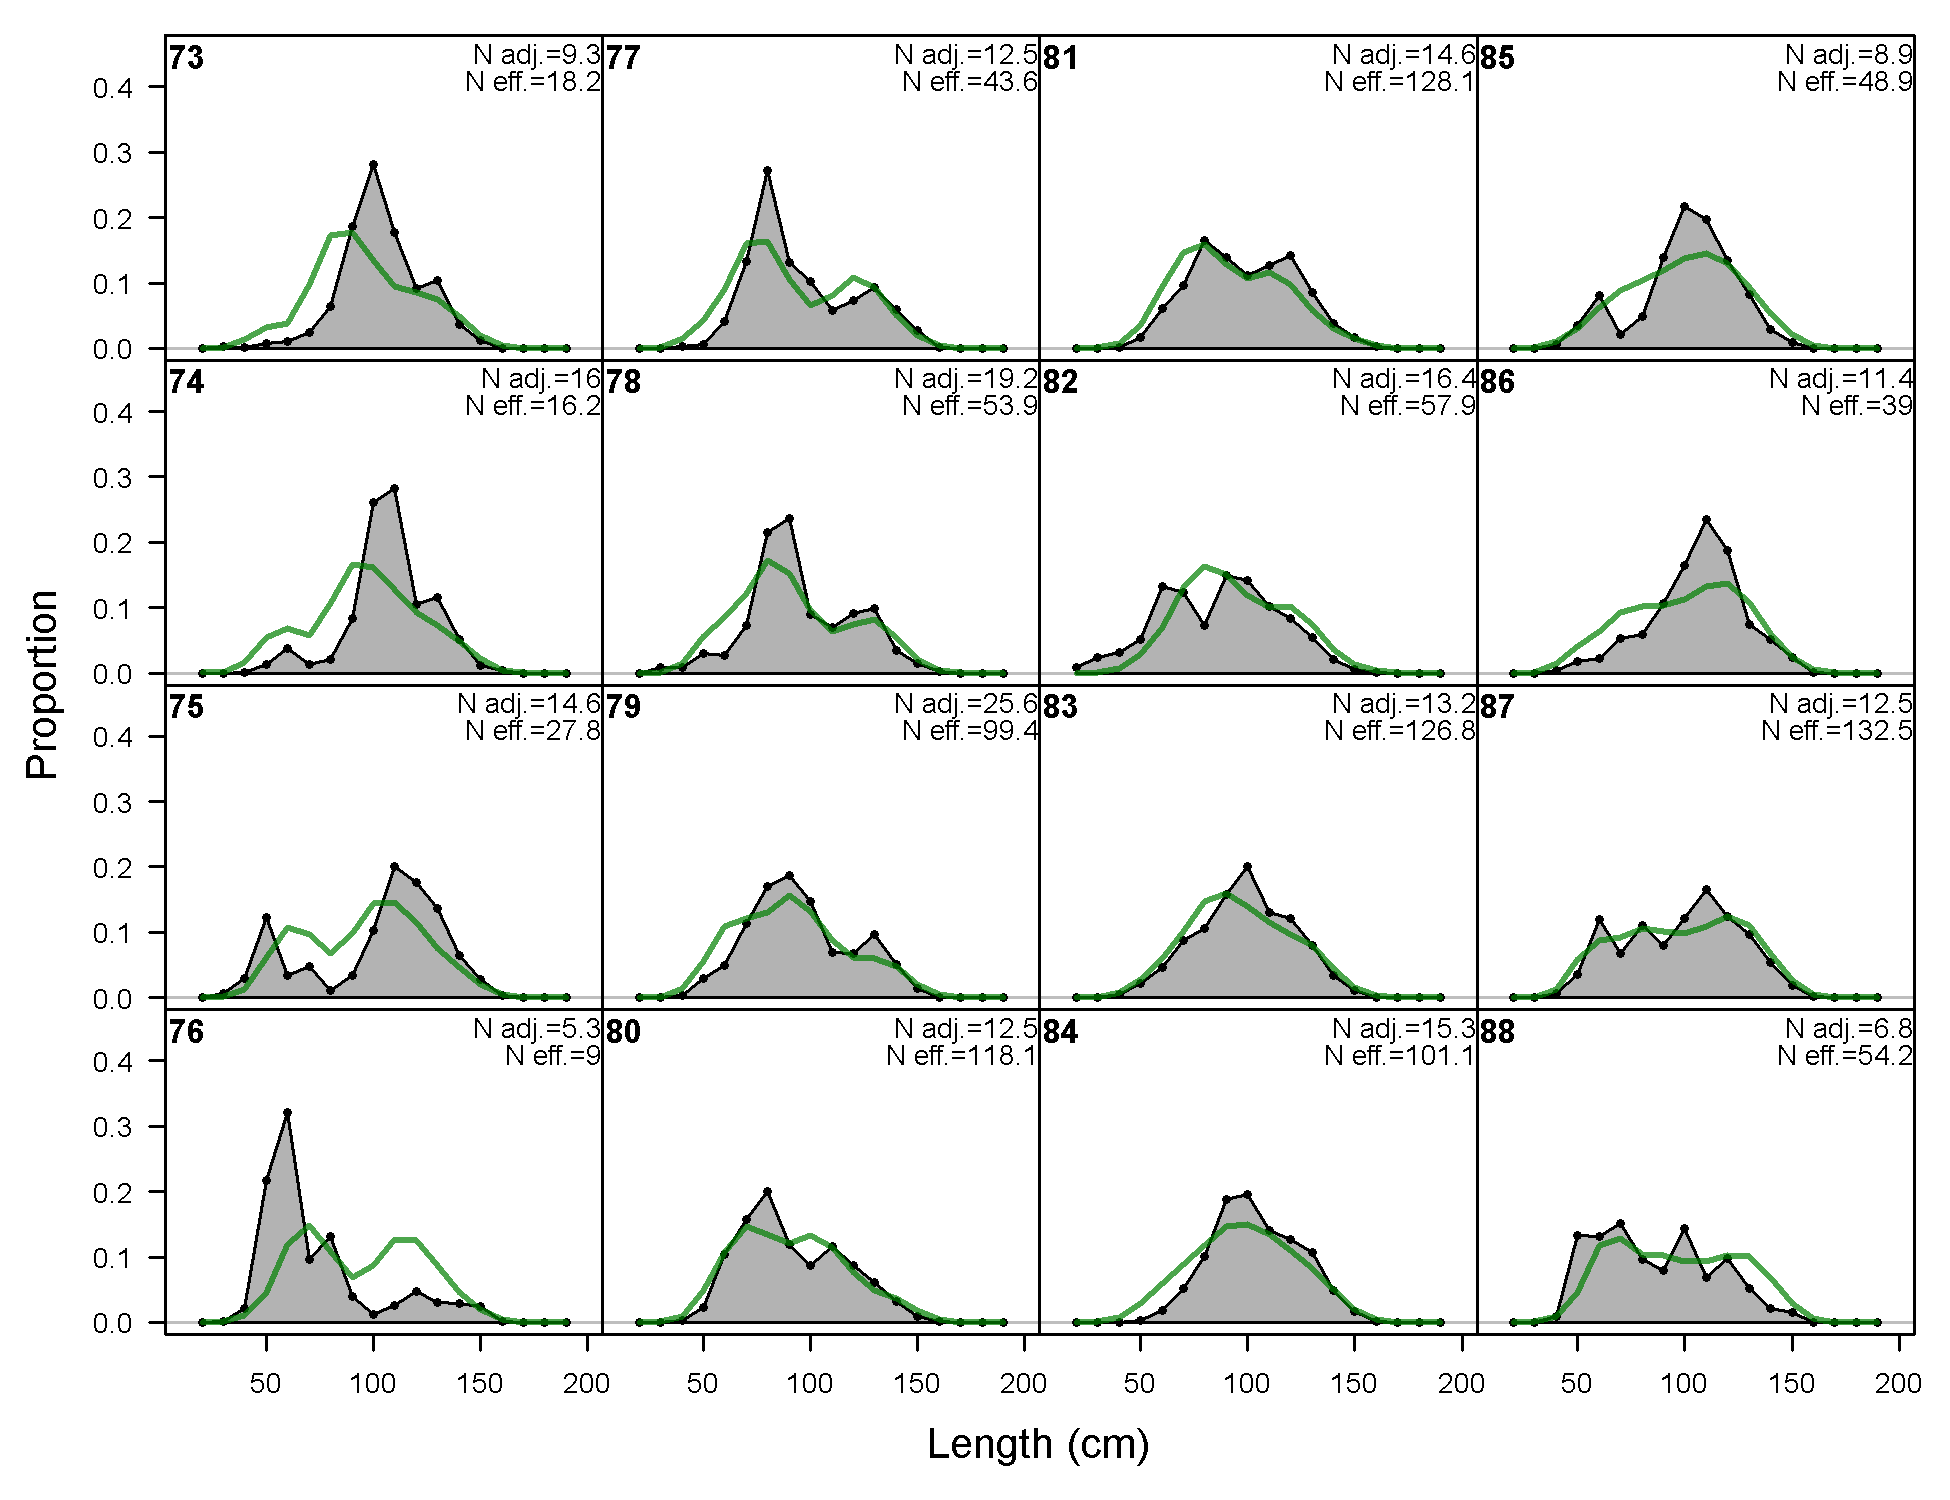
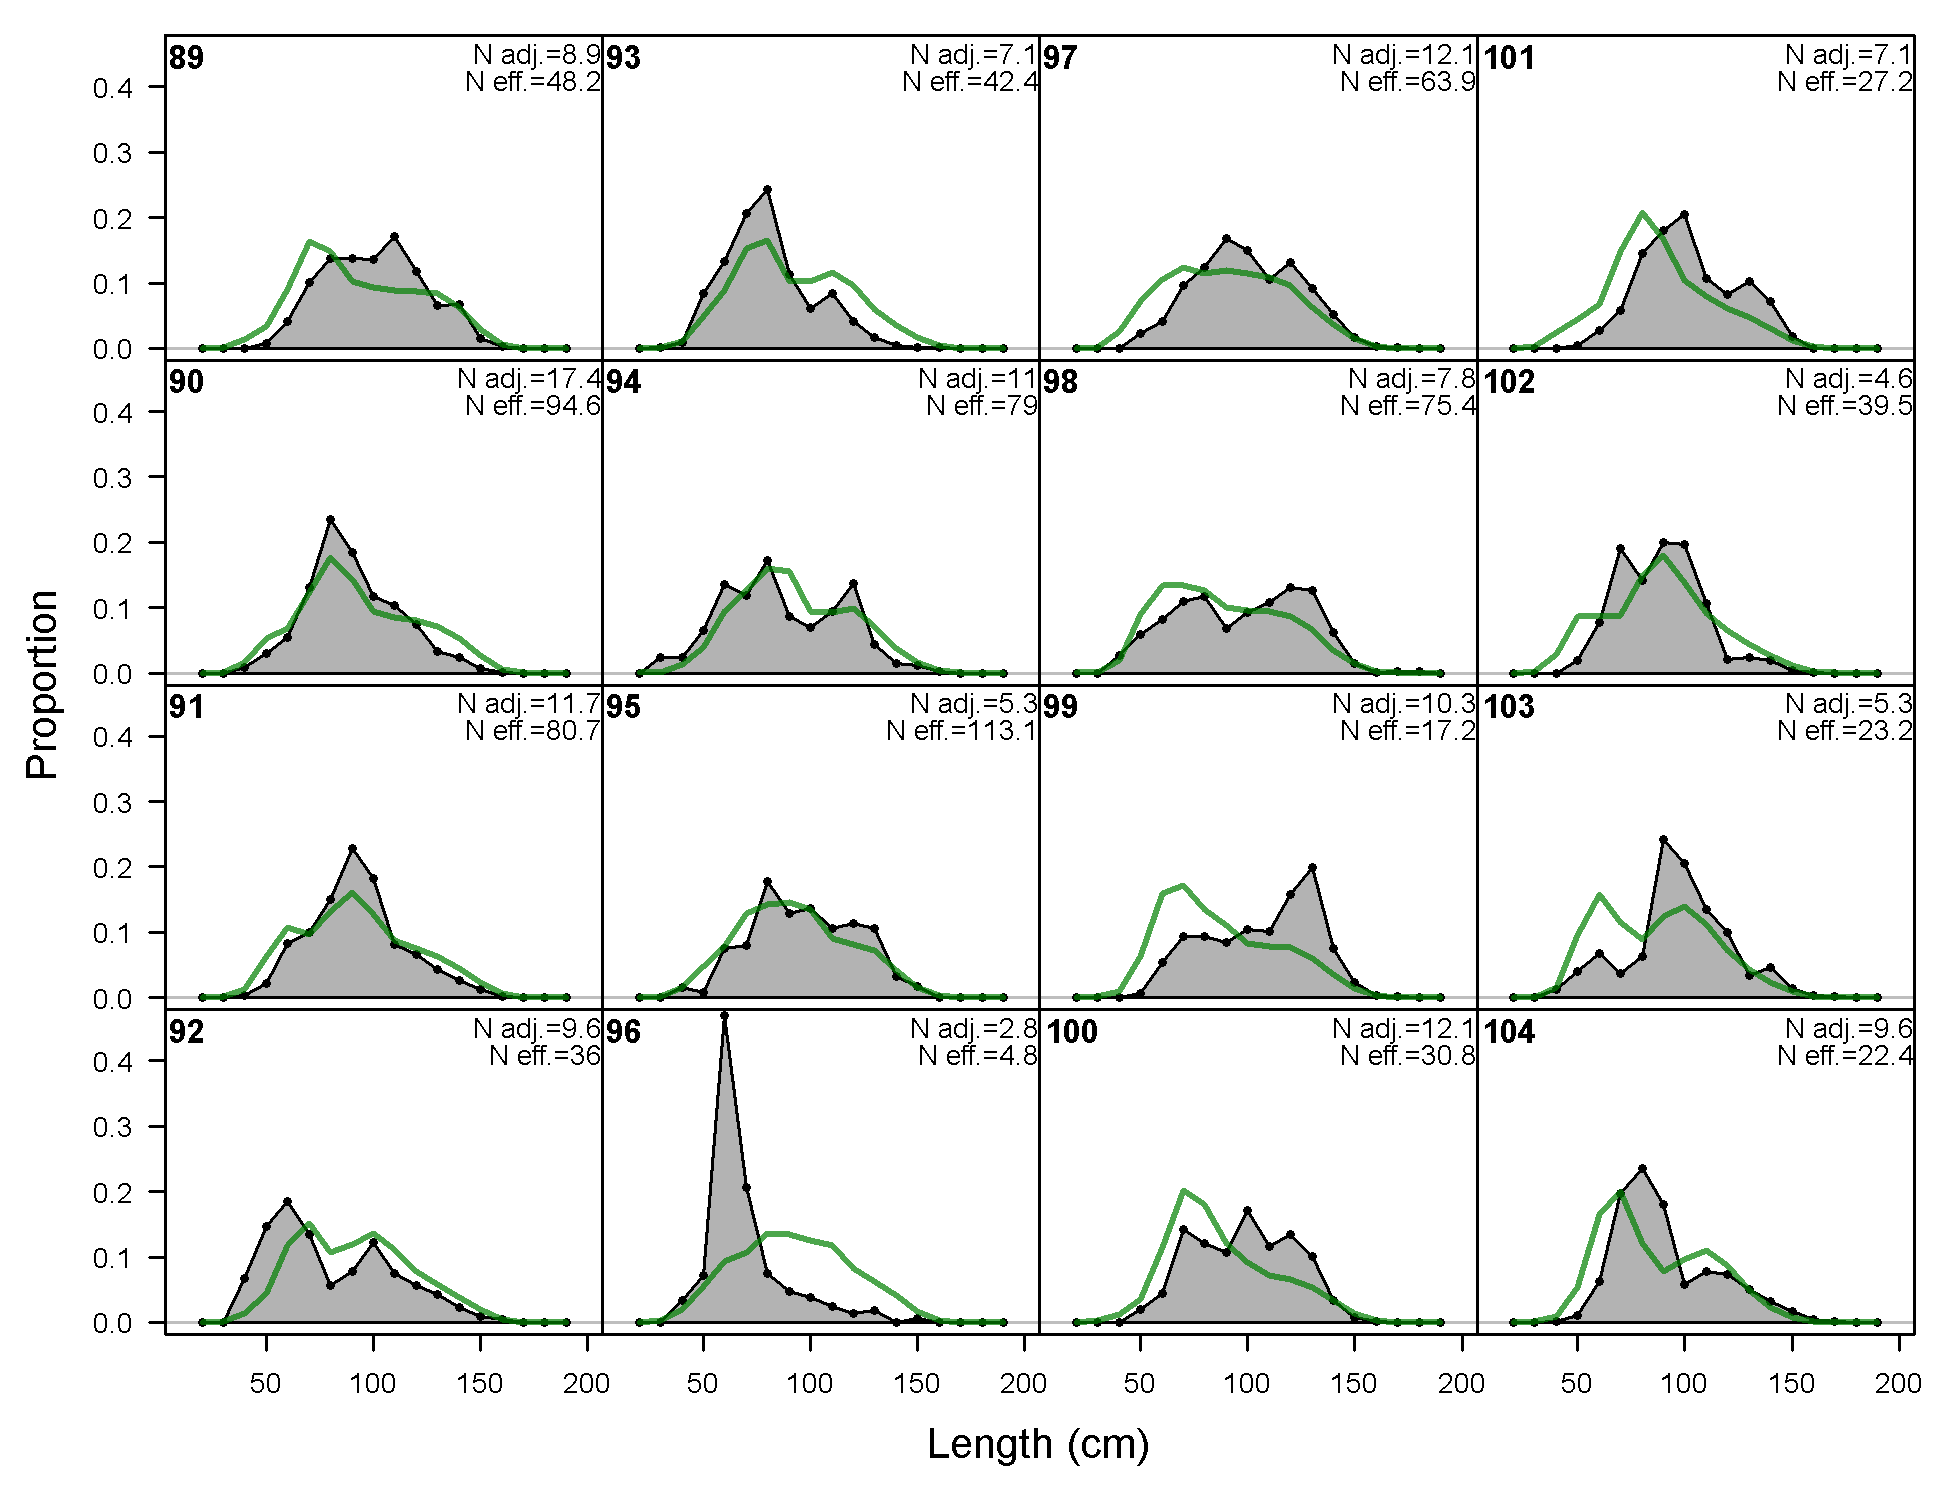
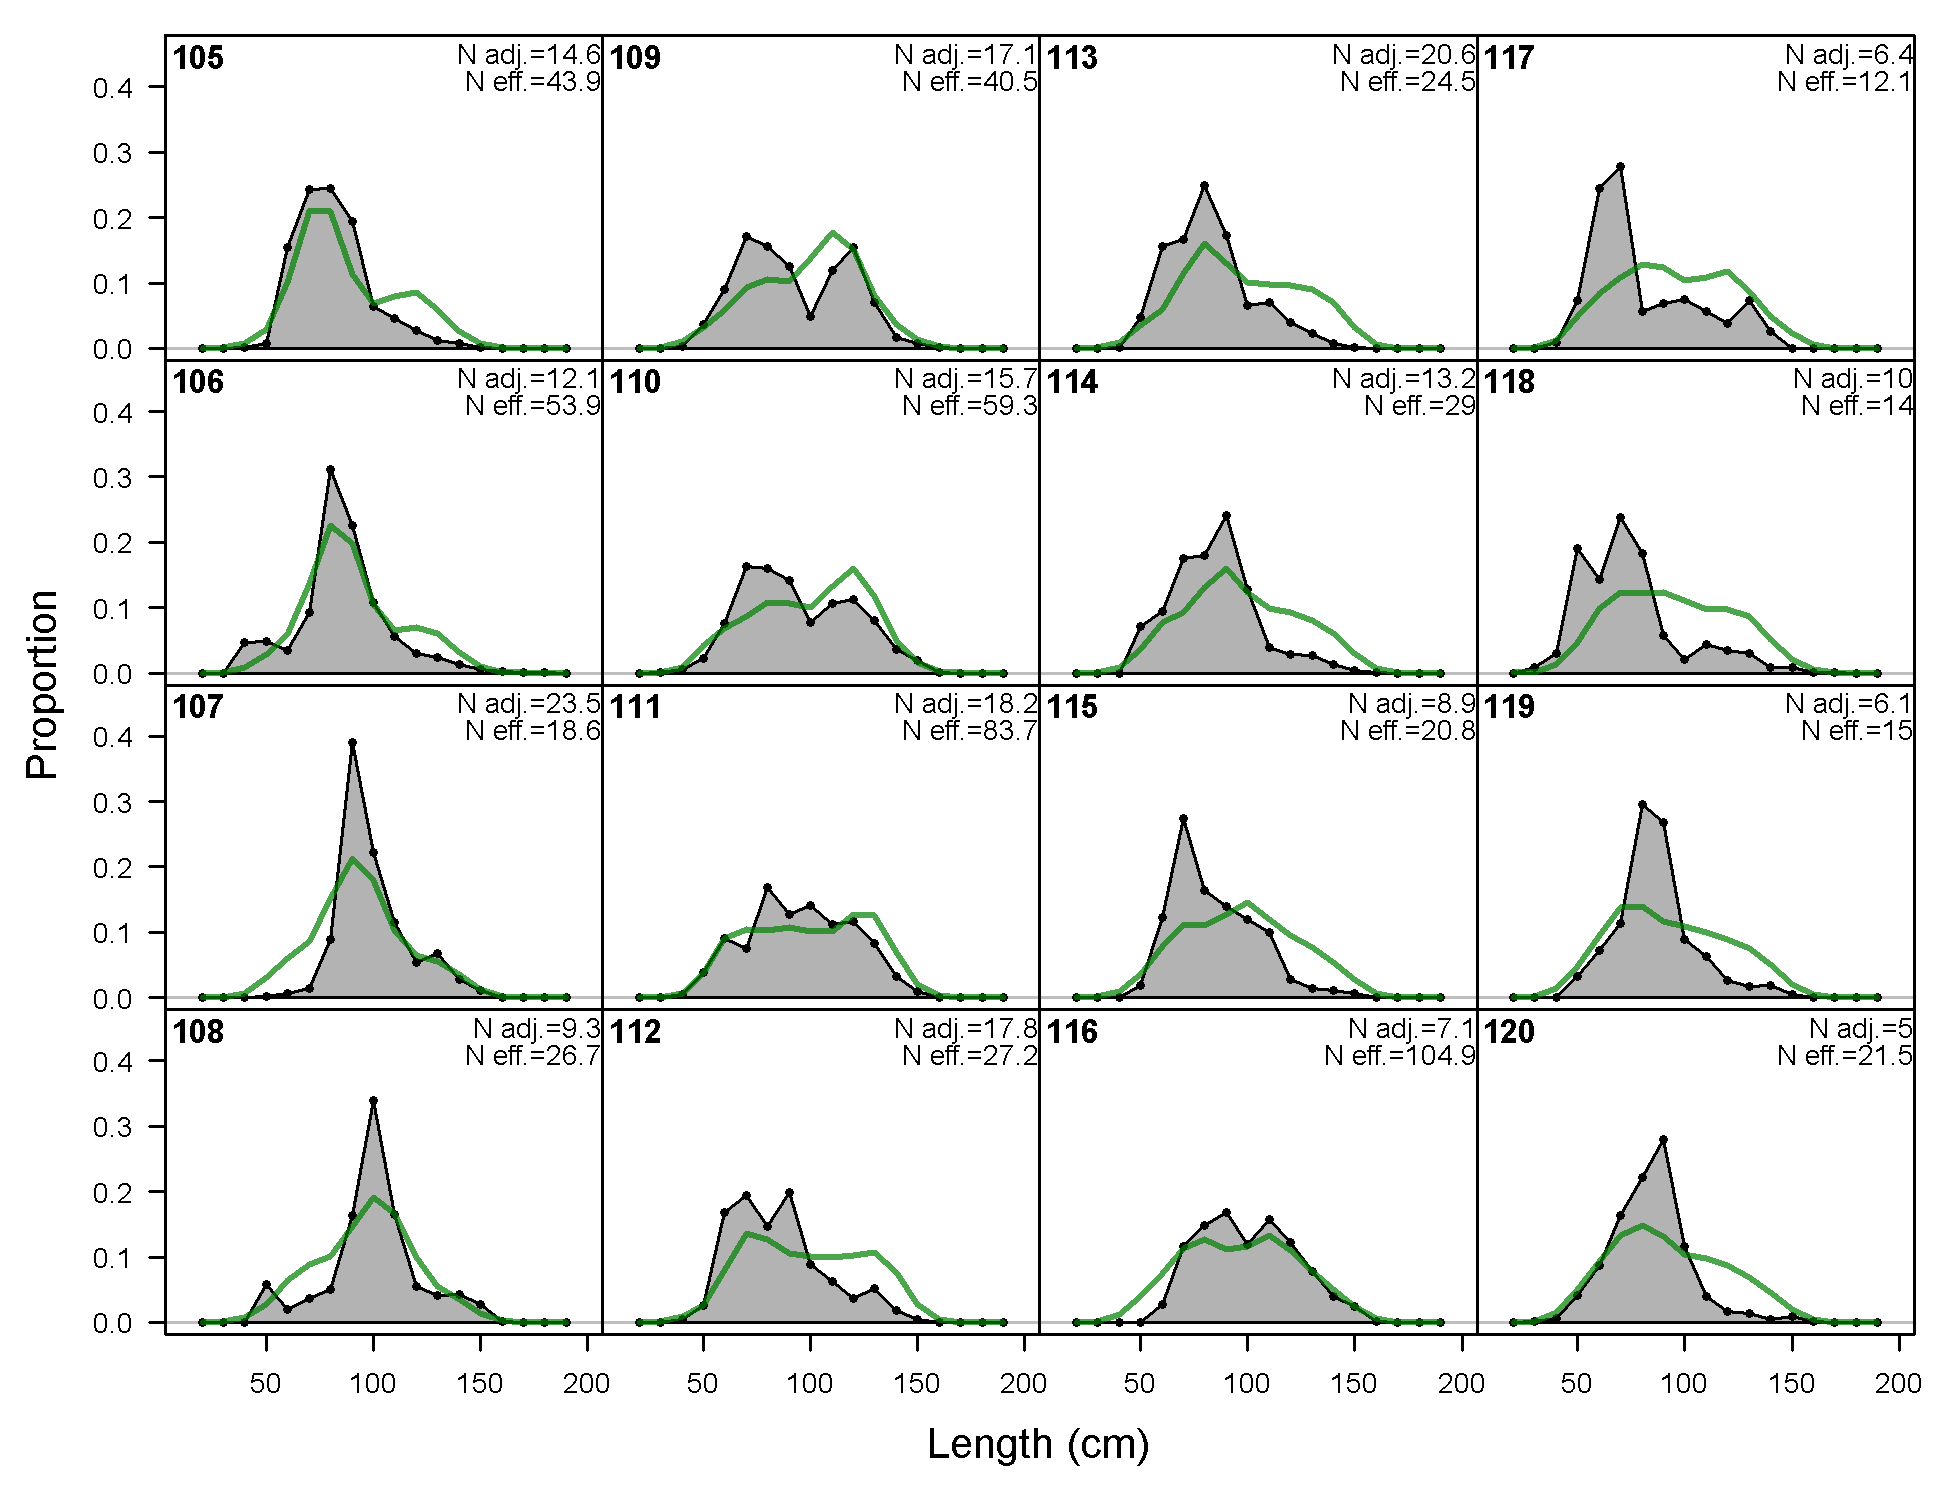
Length comps, whole catch, F1-OBJ_N-Q14 (plot 1 of 4).
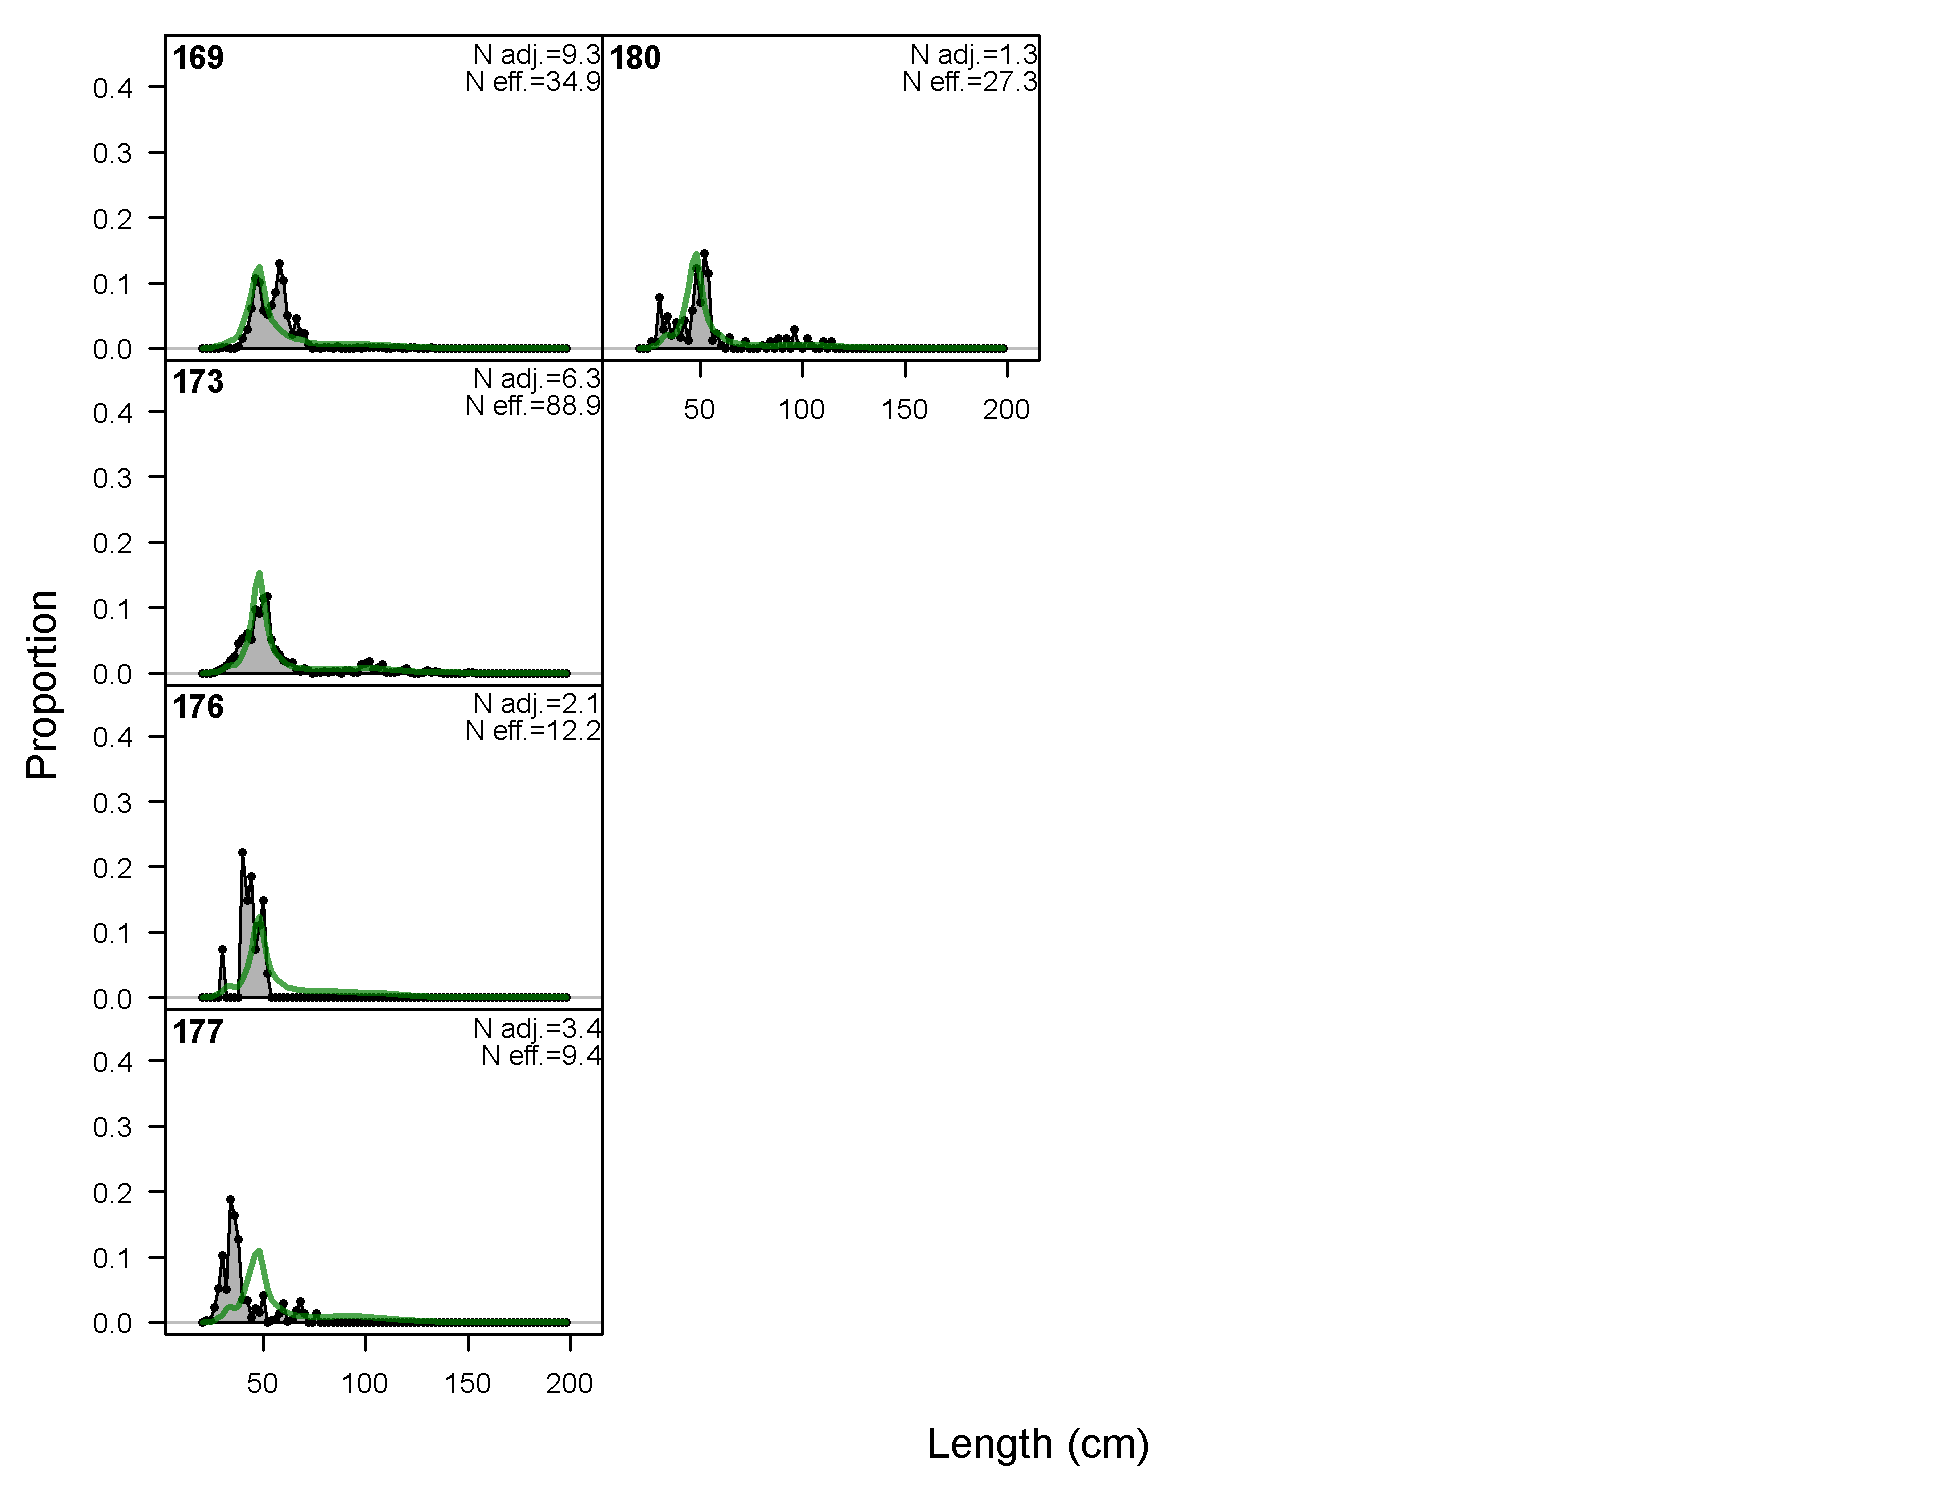
'N adj.' is the input sample size after data-weighting adjustment. N eff. is the calculated effective sample size used in the McAllister-Iannelli tuning method.
file: comp_lenfit_flt1mkt0_page1.png
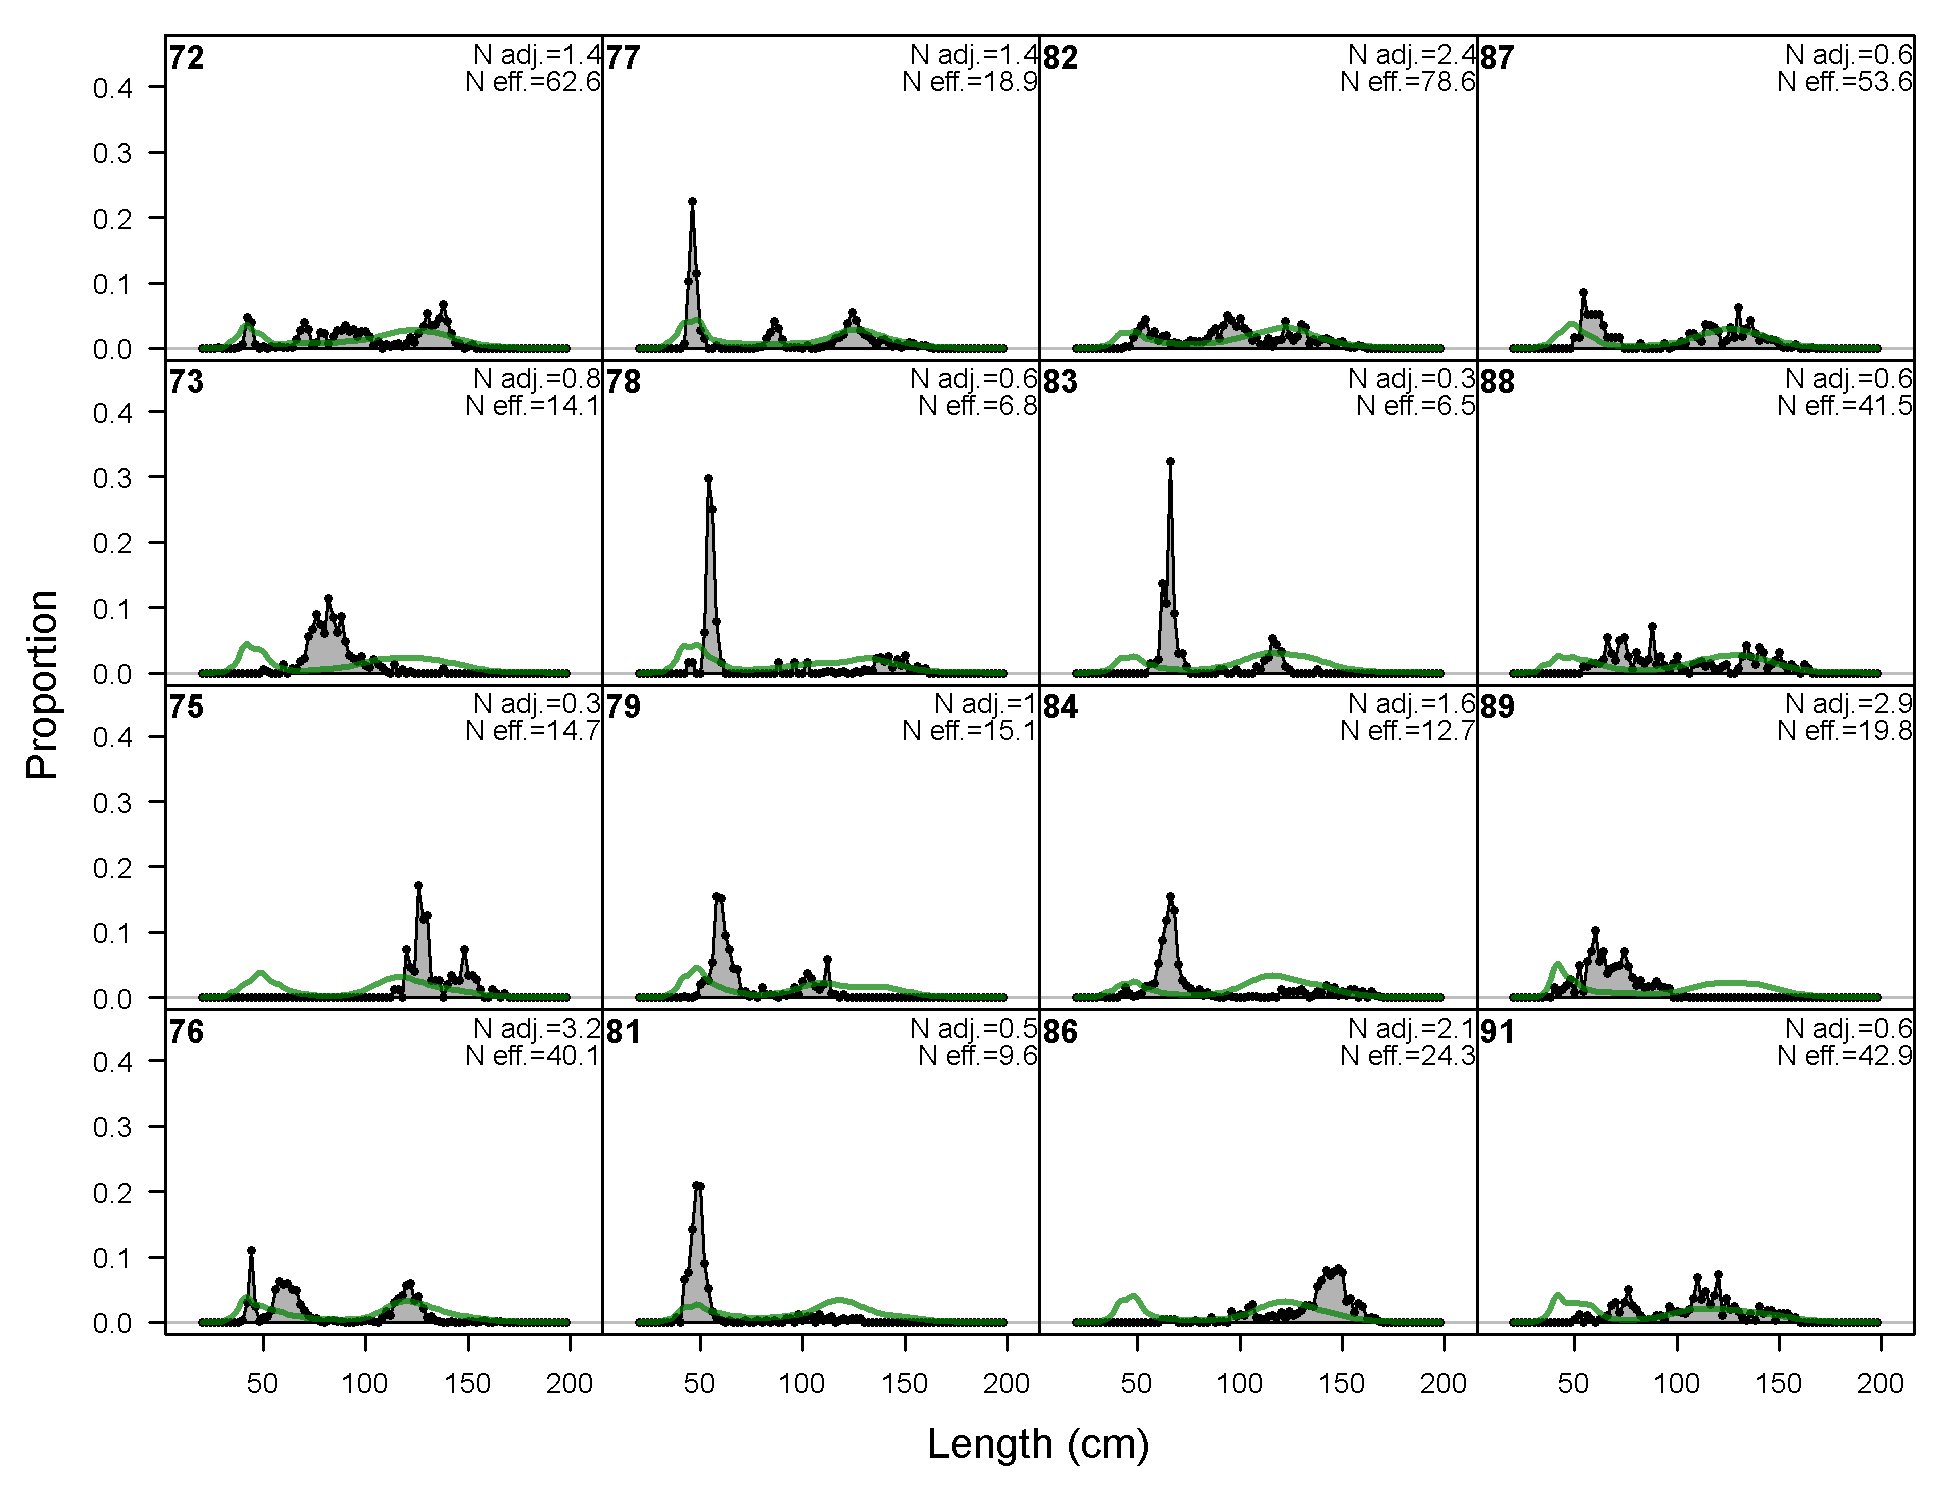
Length comps, whole catch, F1-OBJ_N-Q14 (plot 2 of 4)
file: comp_lenfit_flt1mkt0_page2.png
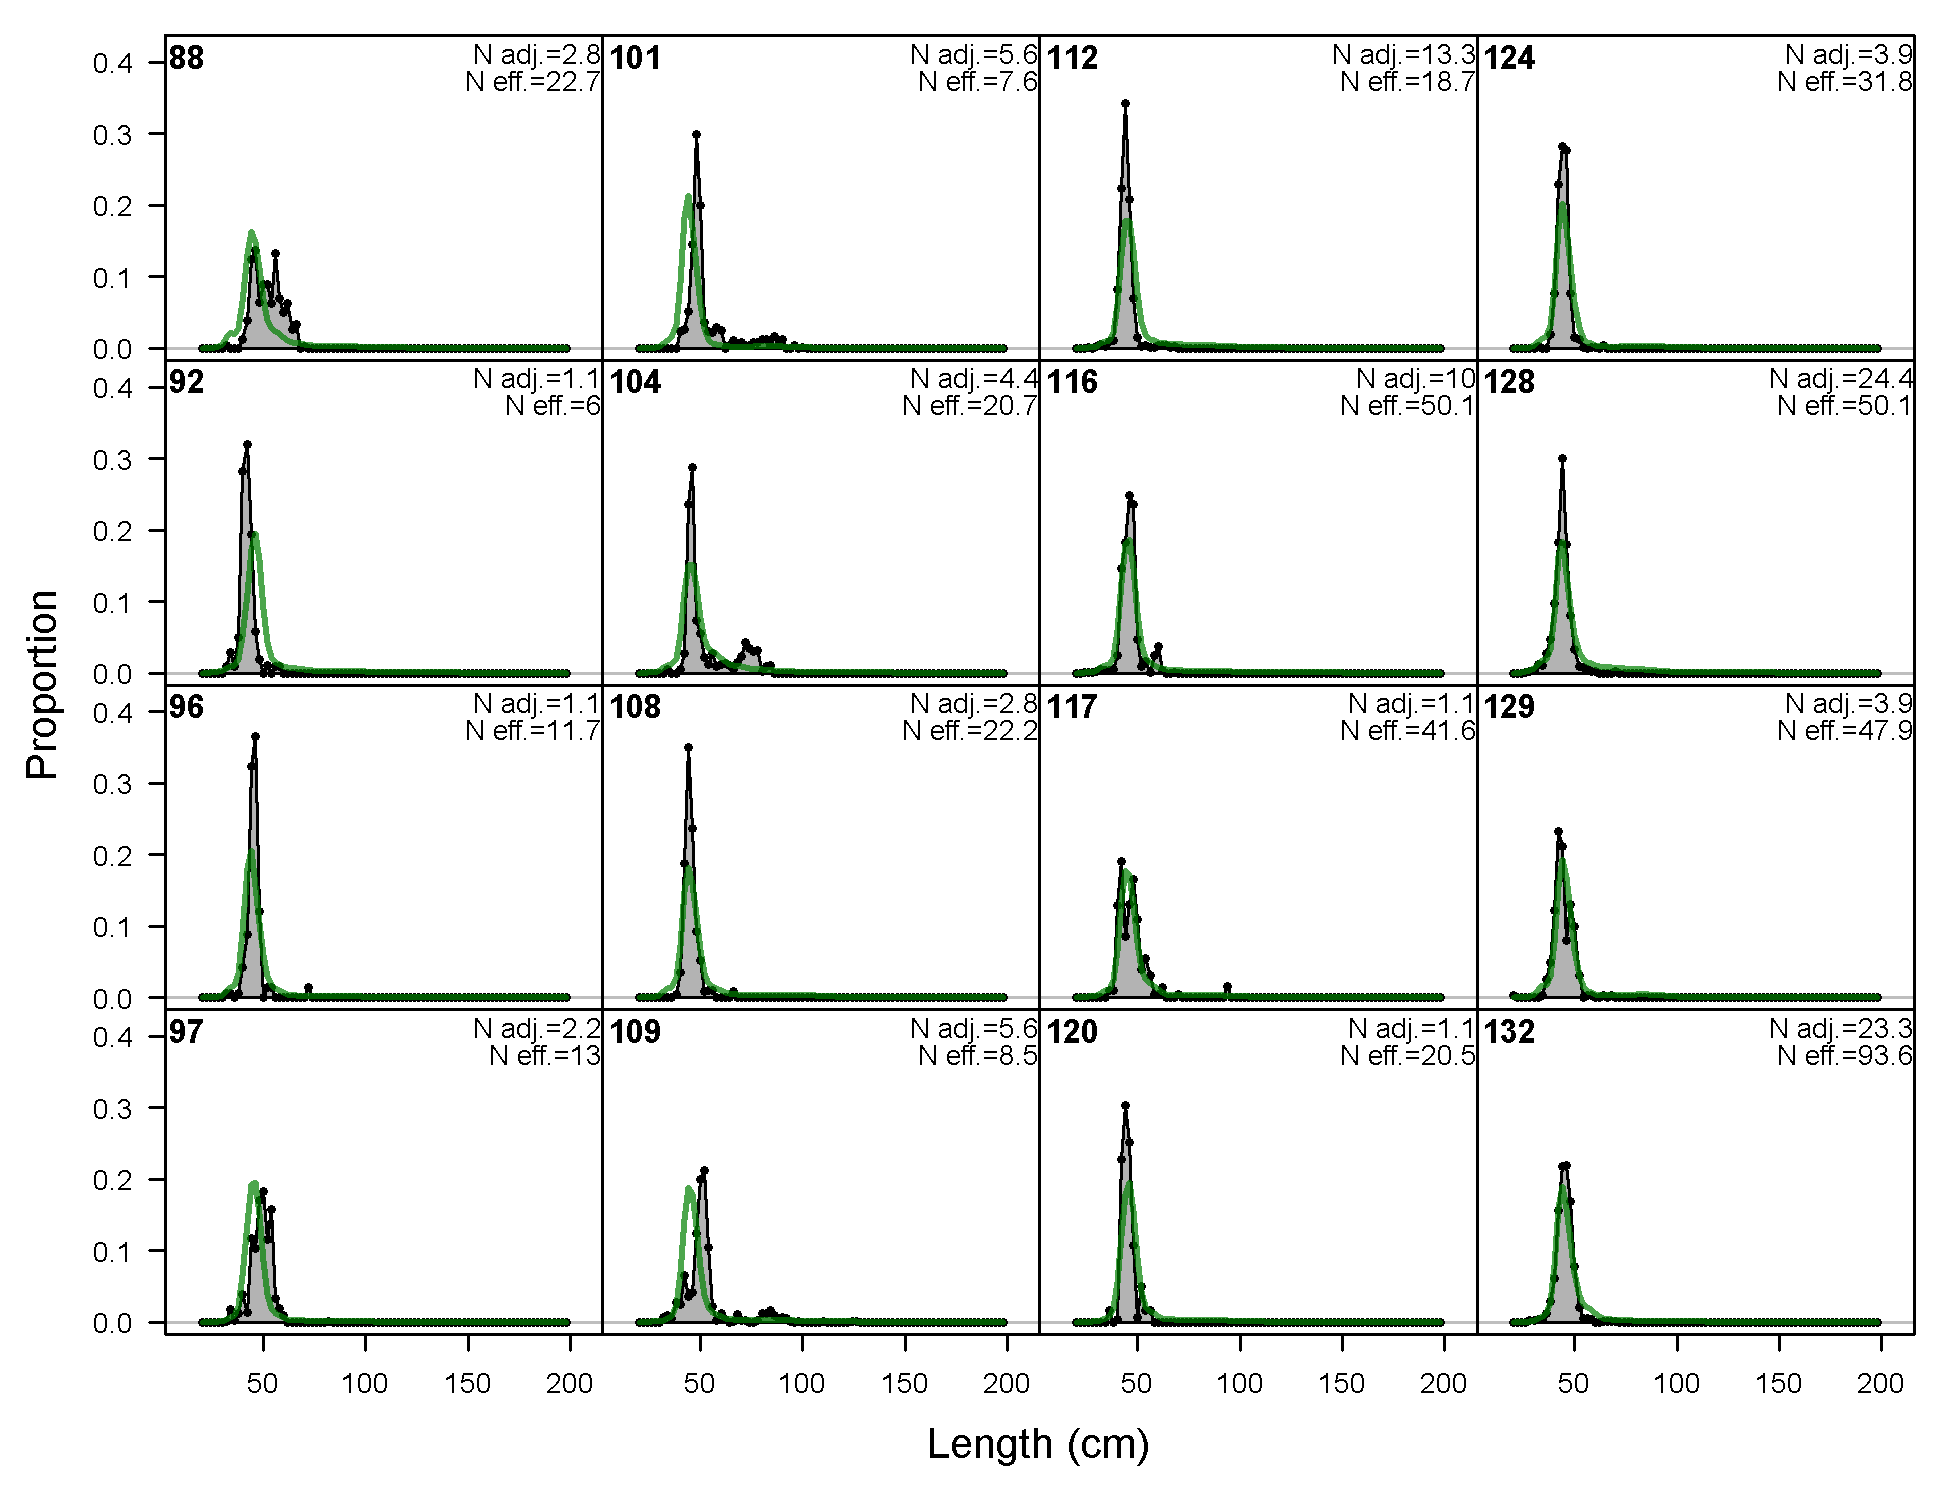
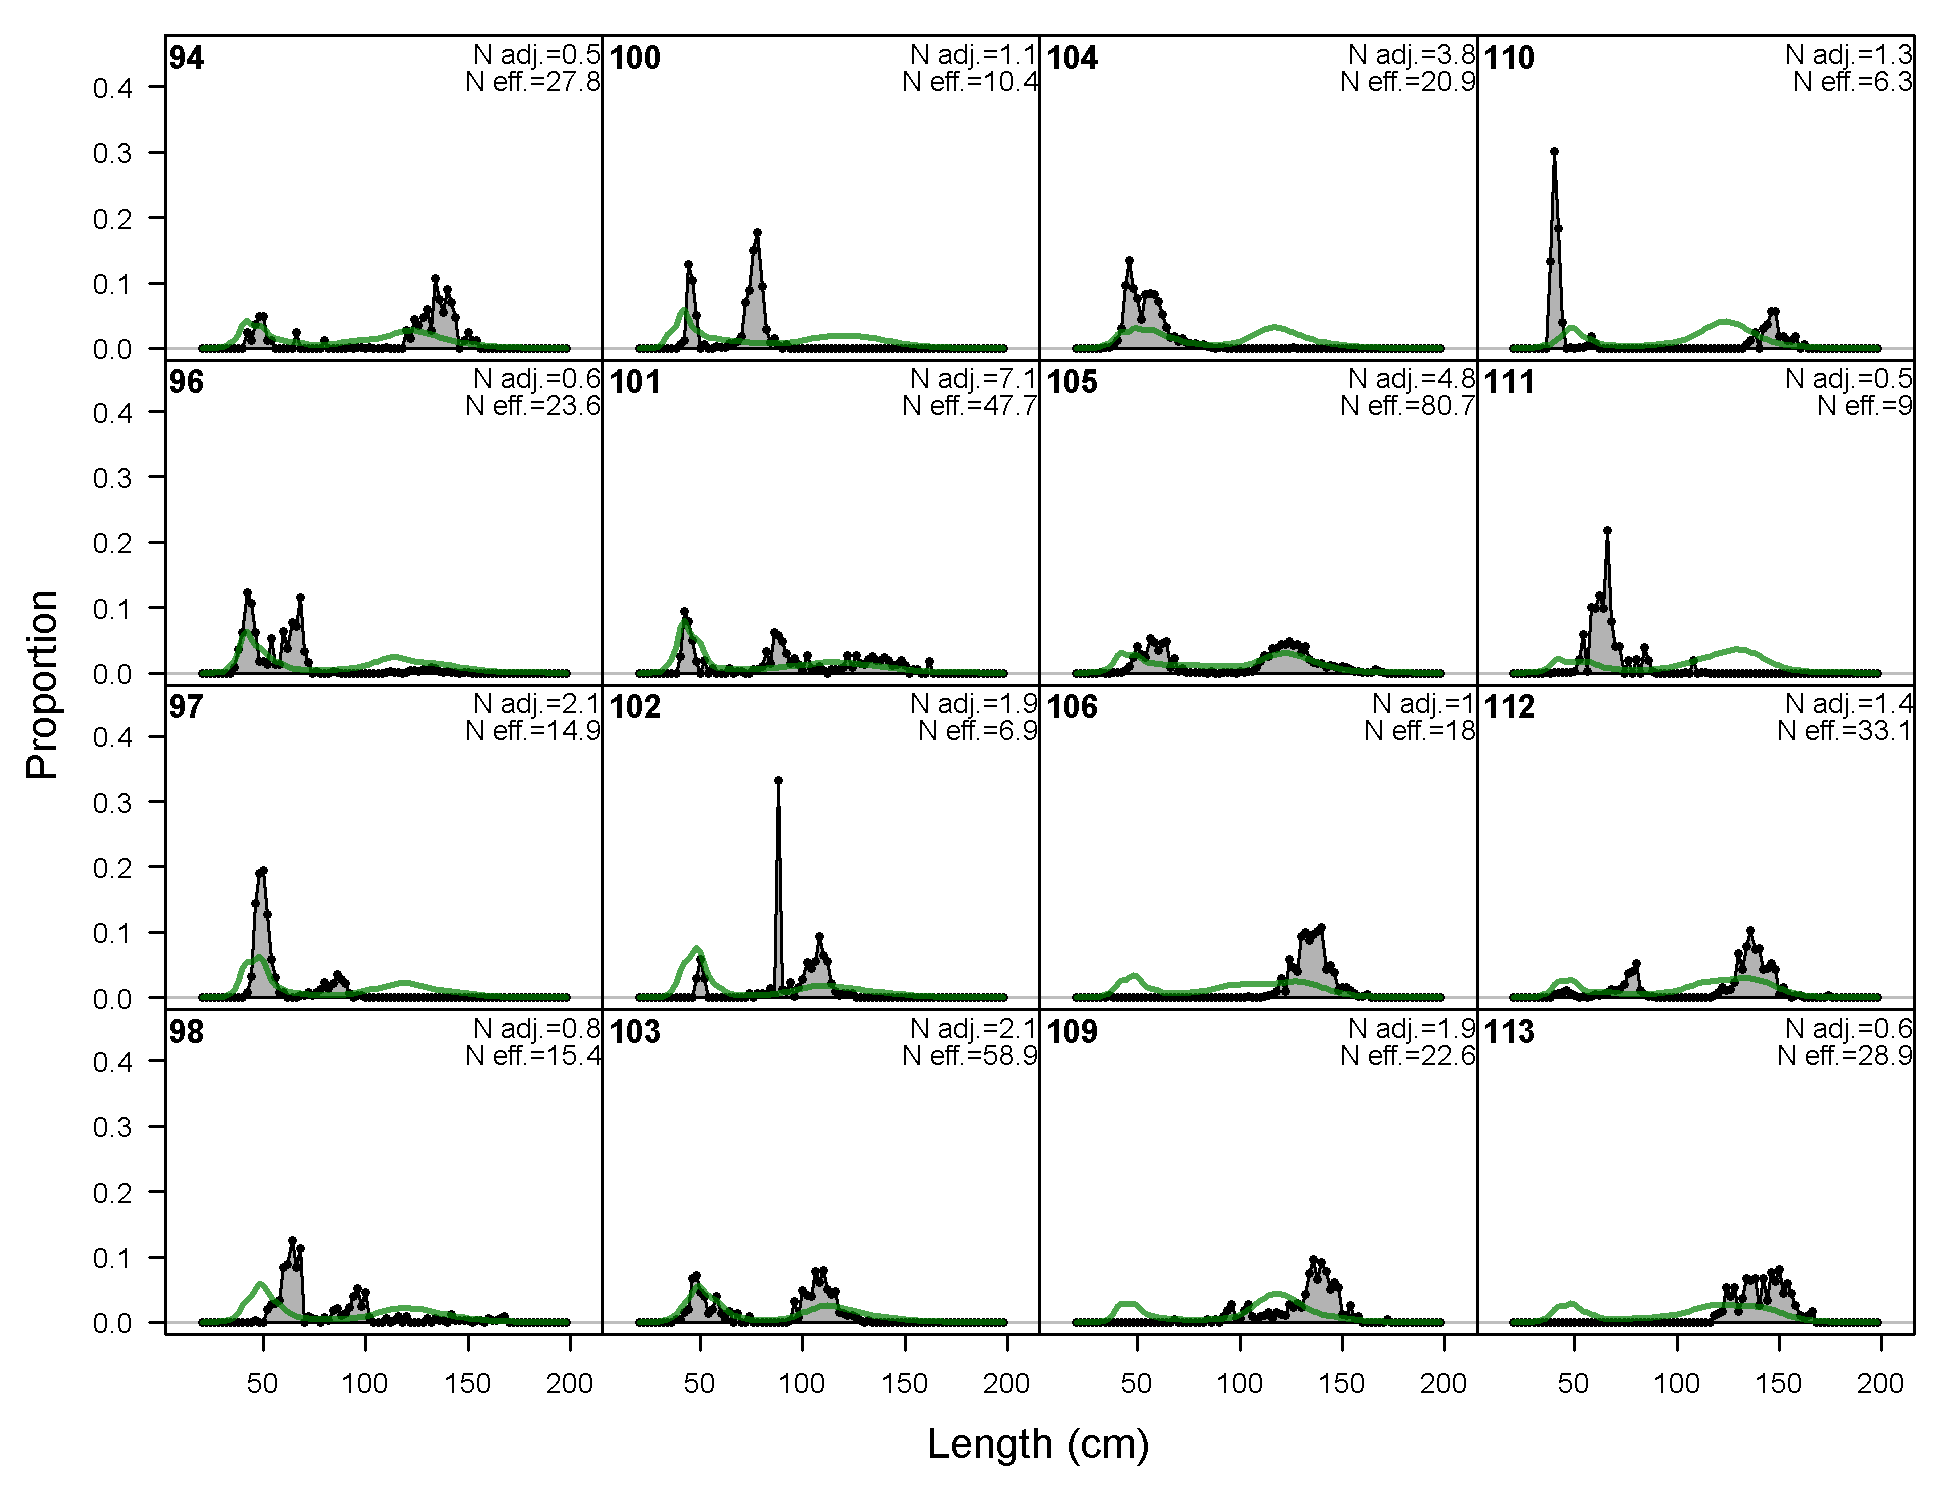
Length comps, whole catch, F1-OBJ_N-Q14 (plot 3 of 4)
file: comp_lenfit_flt1mkt0_page3.png

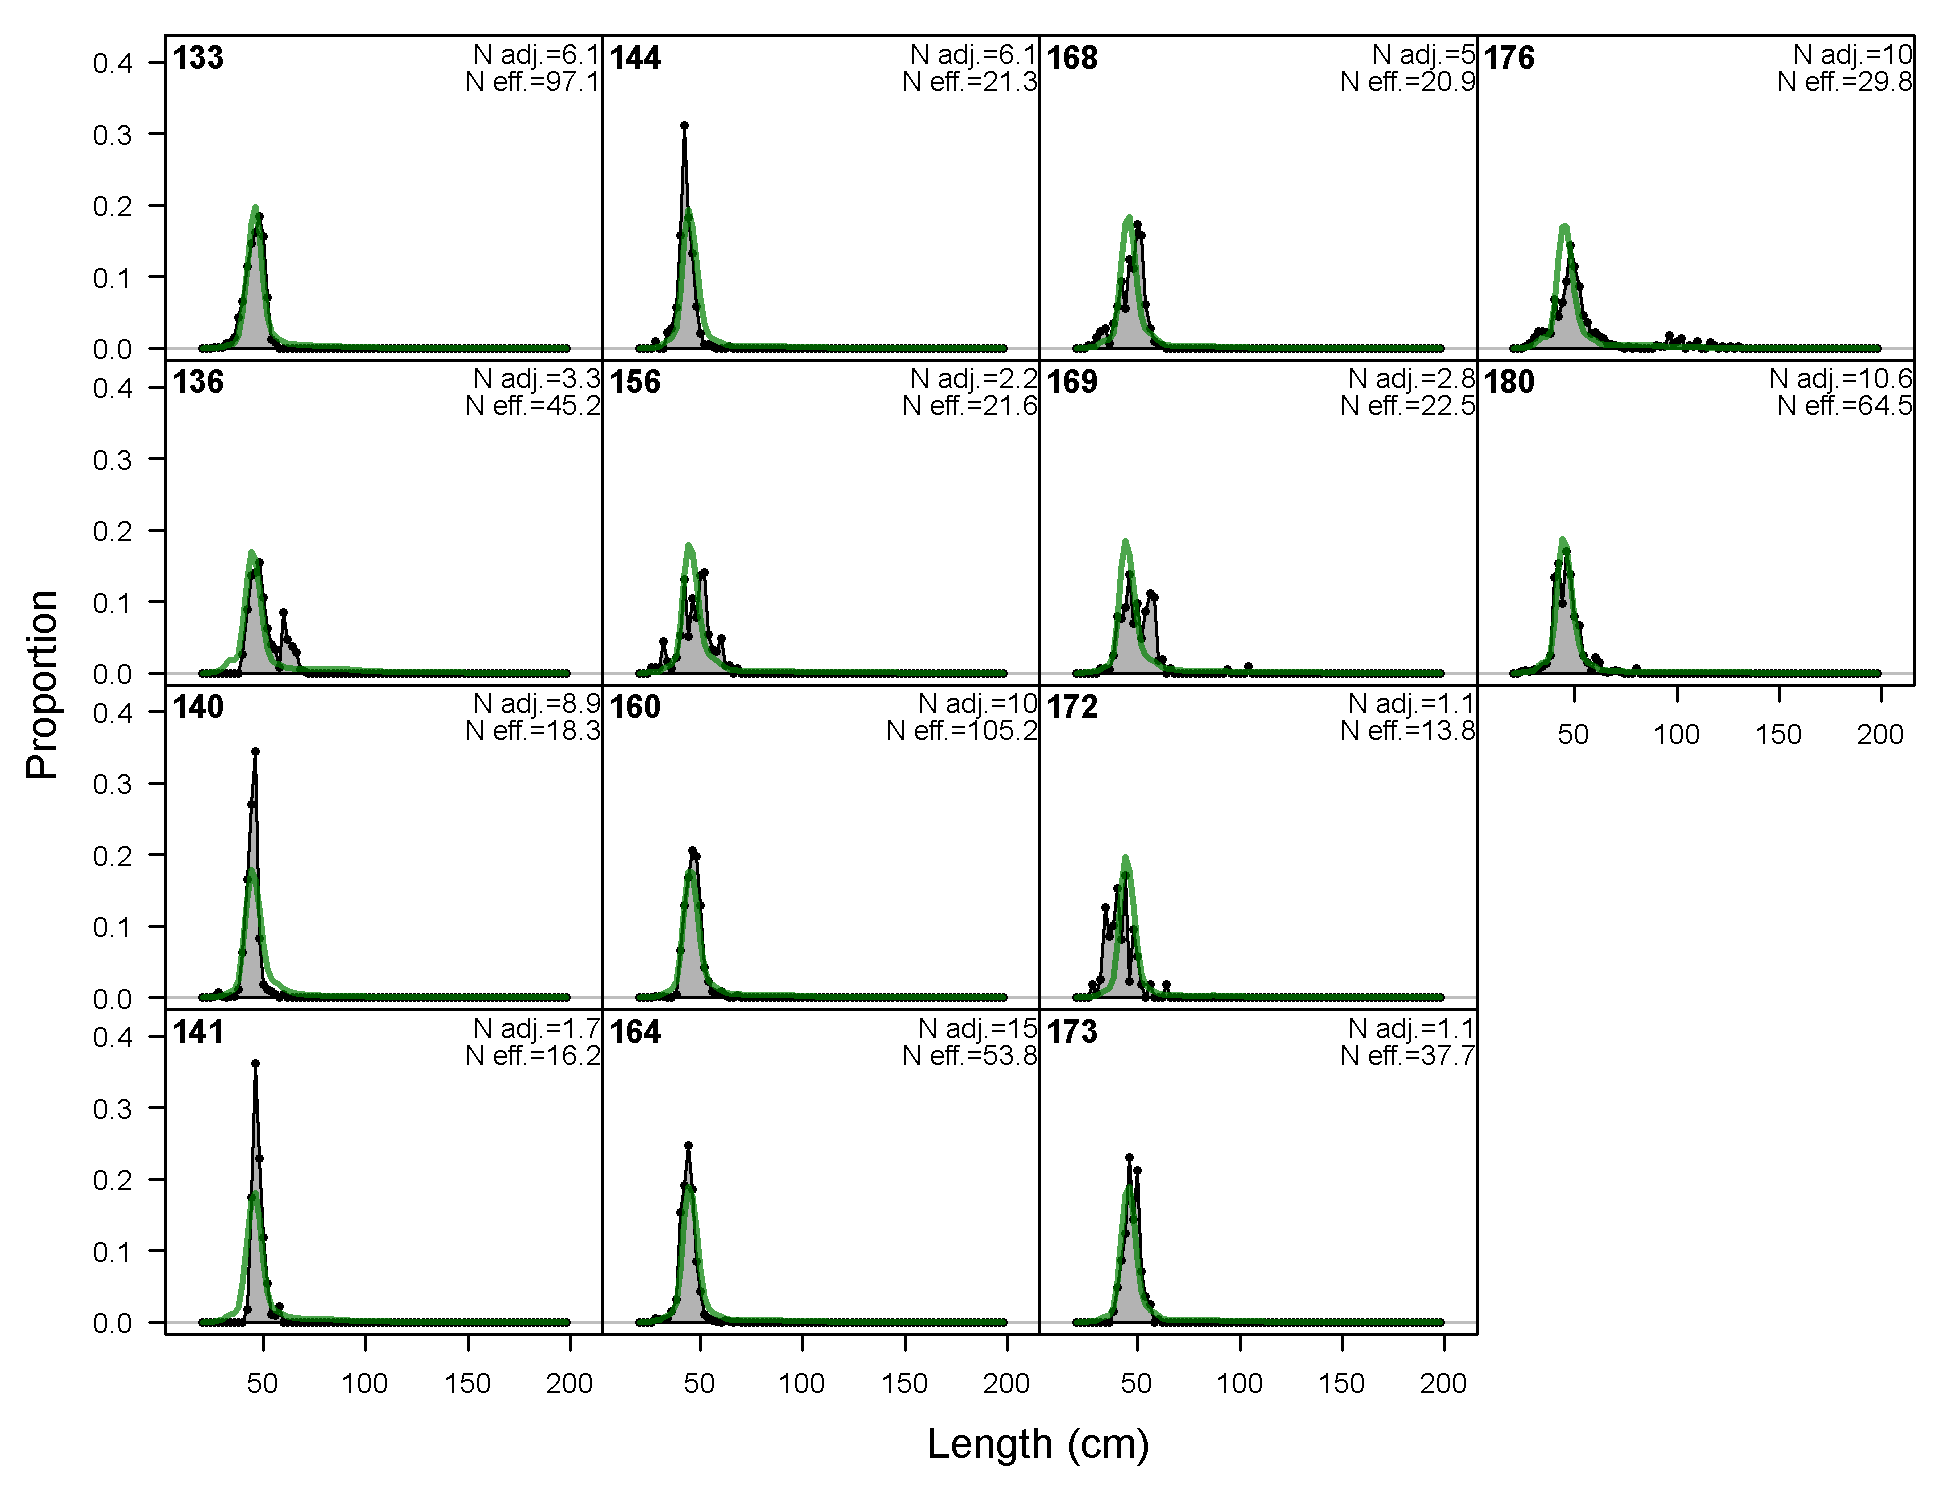
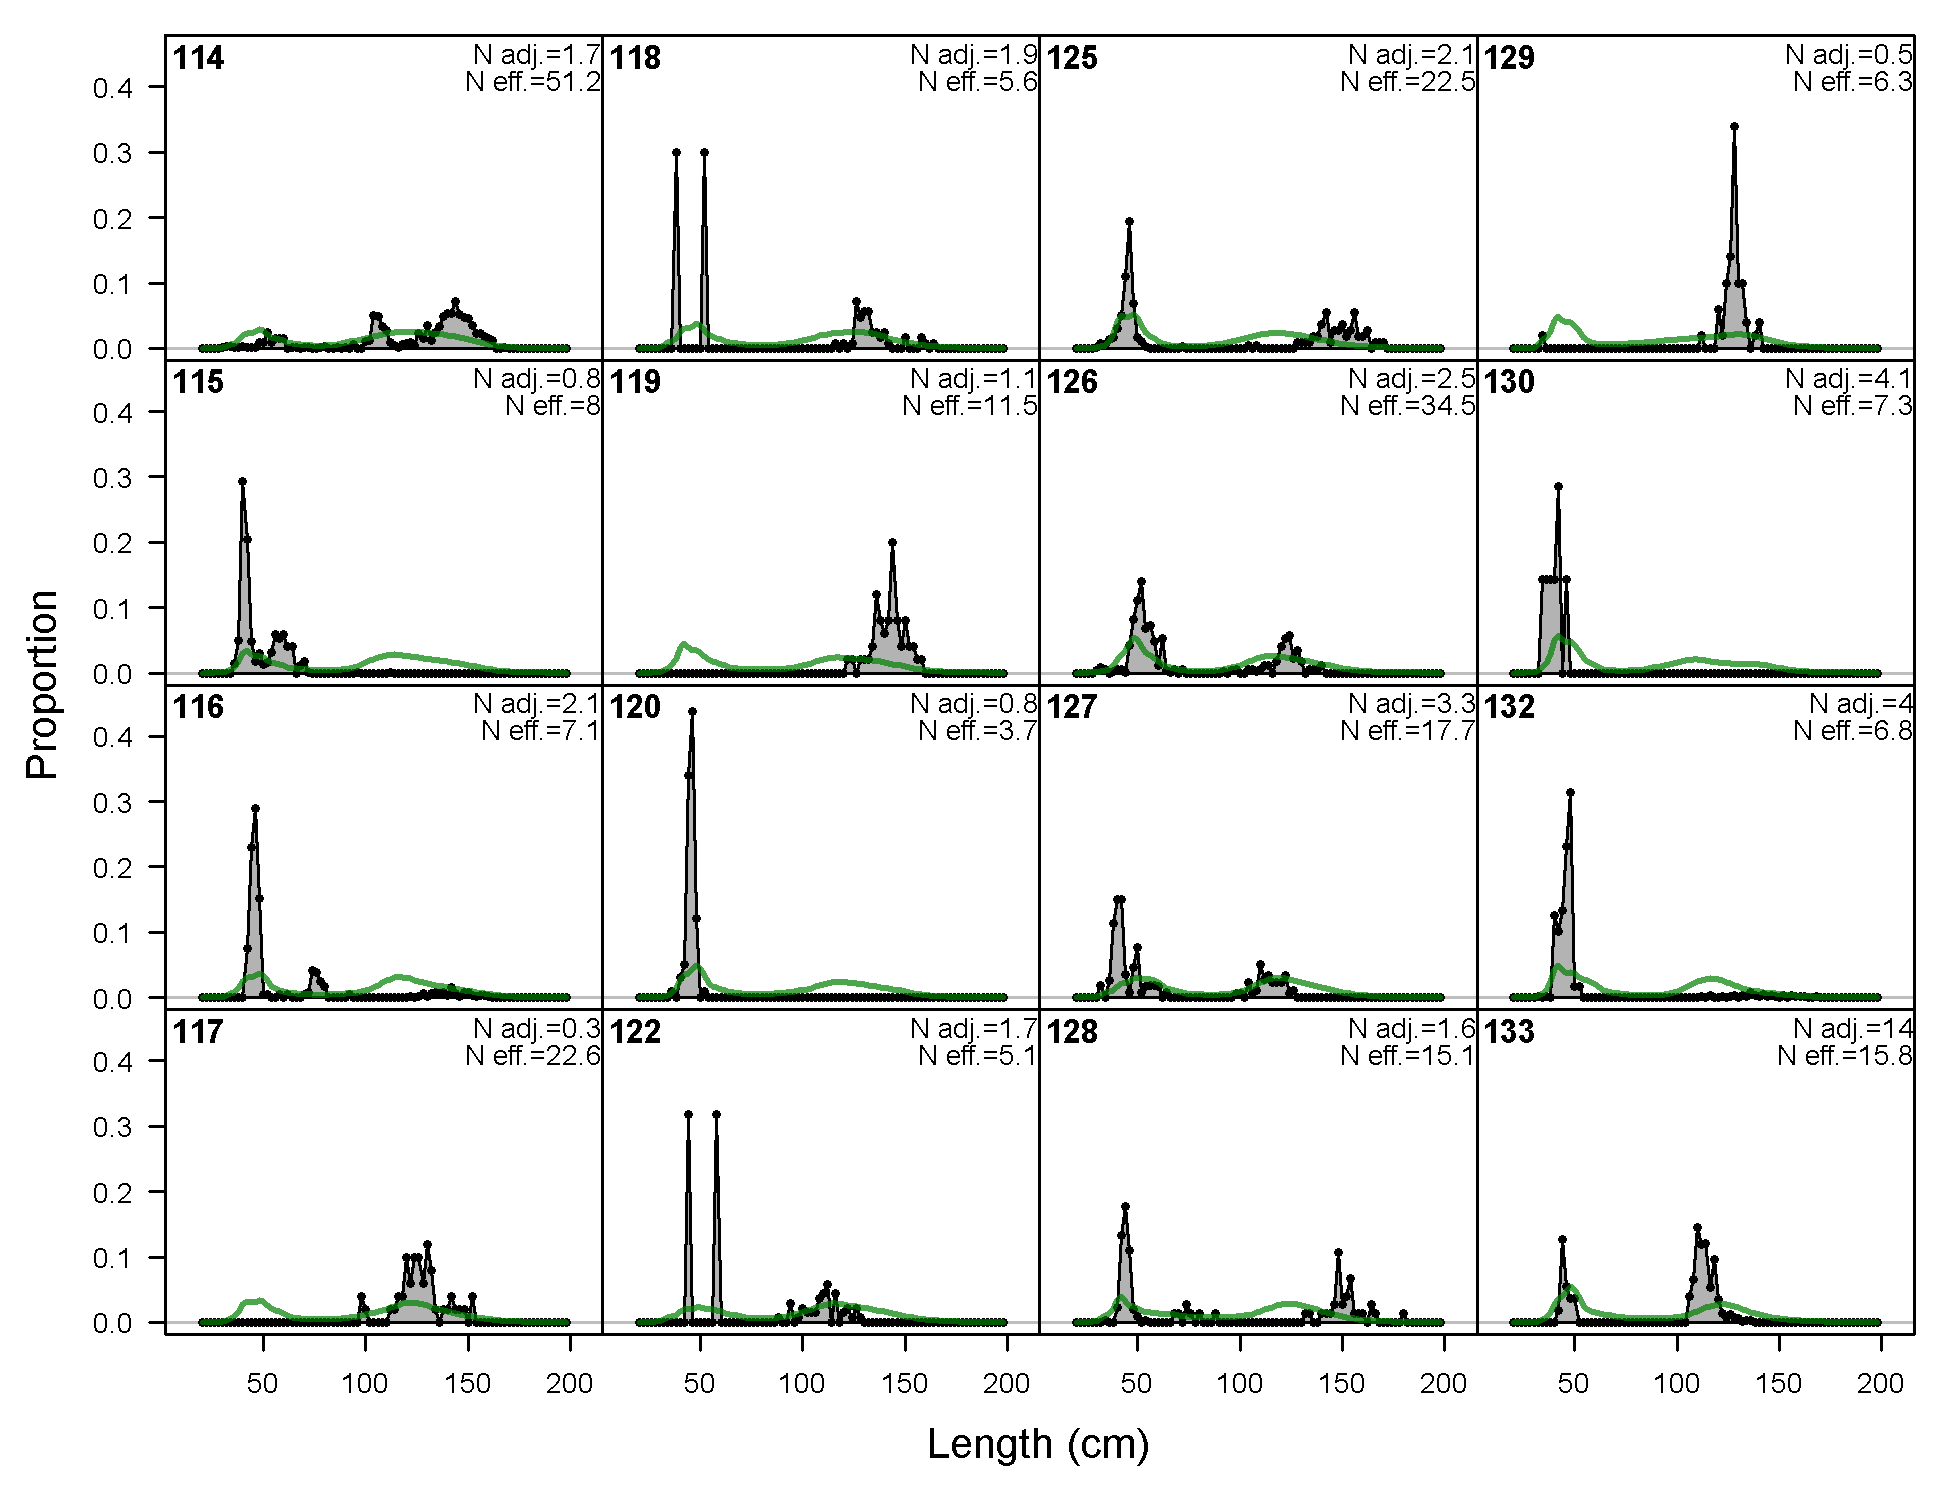
Length comps, whole catch, F1-OBJ_N-Q14 (plot 4 of 4)
file: comp_lenfit_flt1mkt0_page4.png
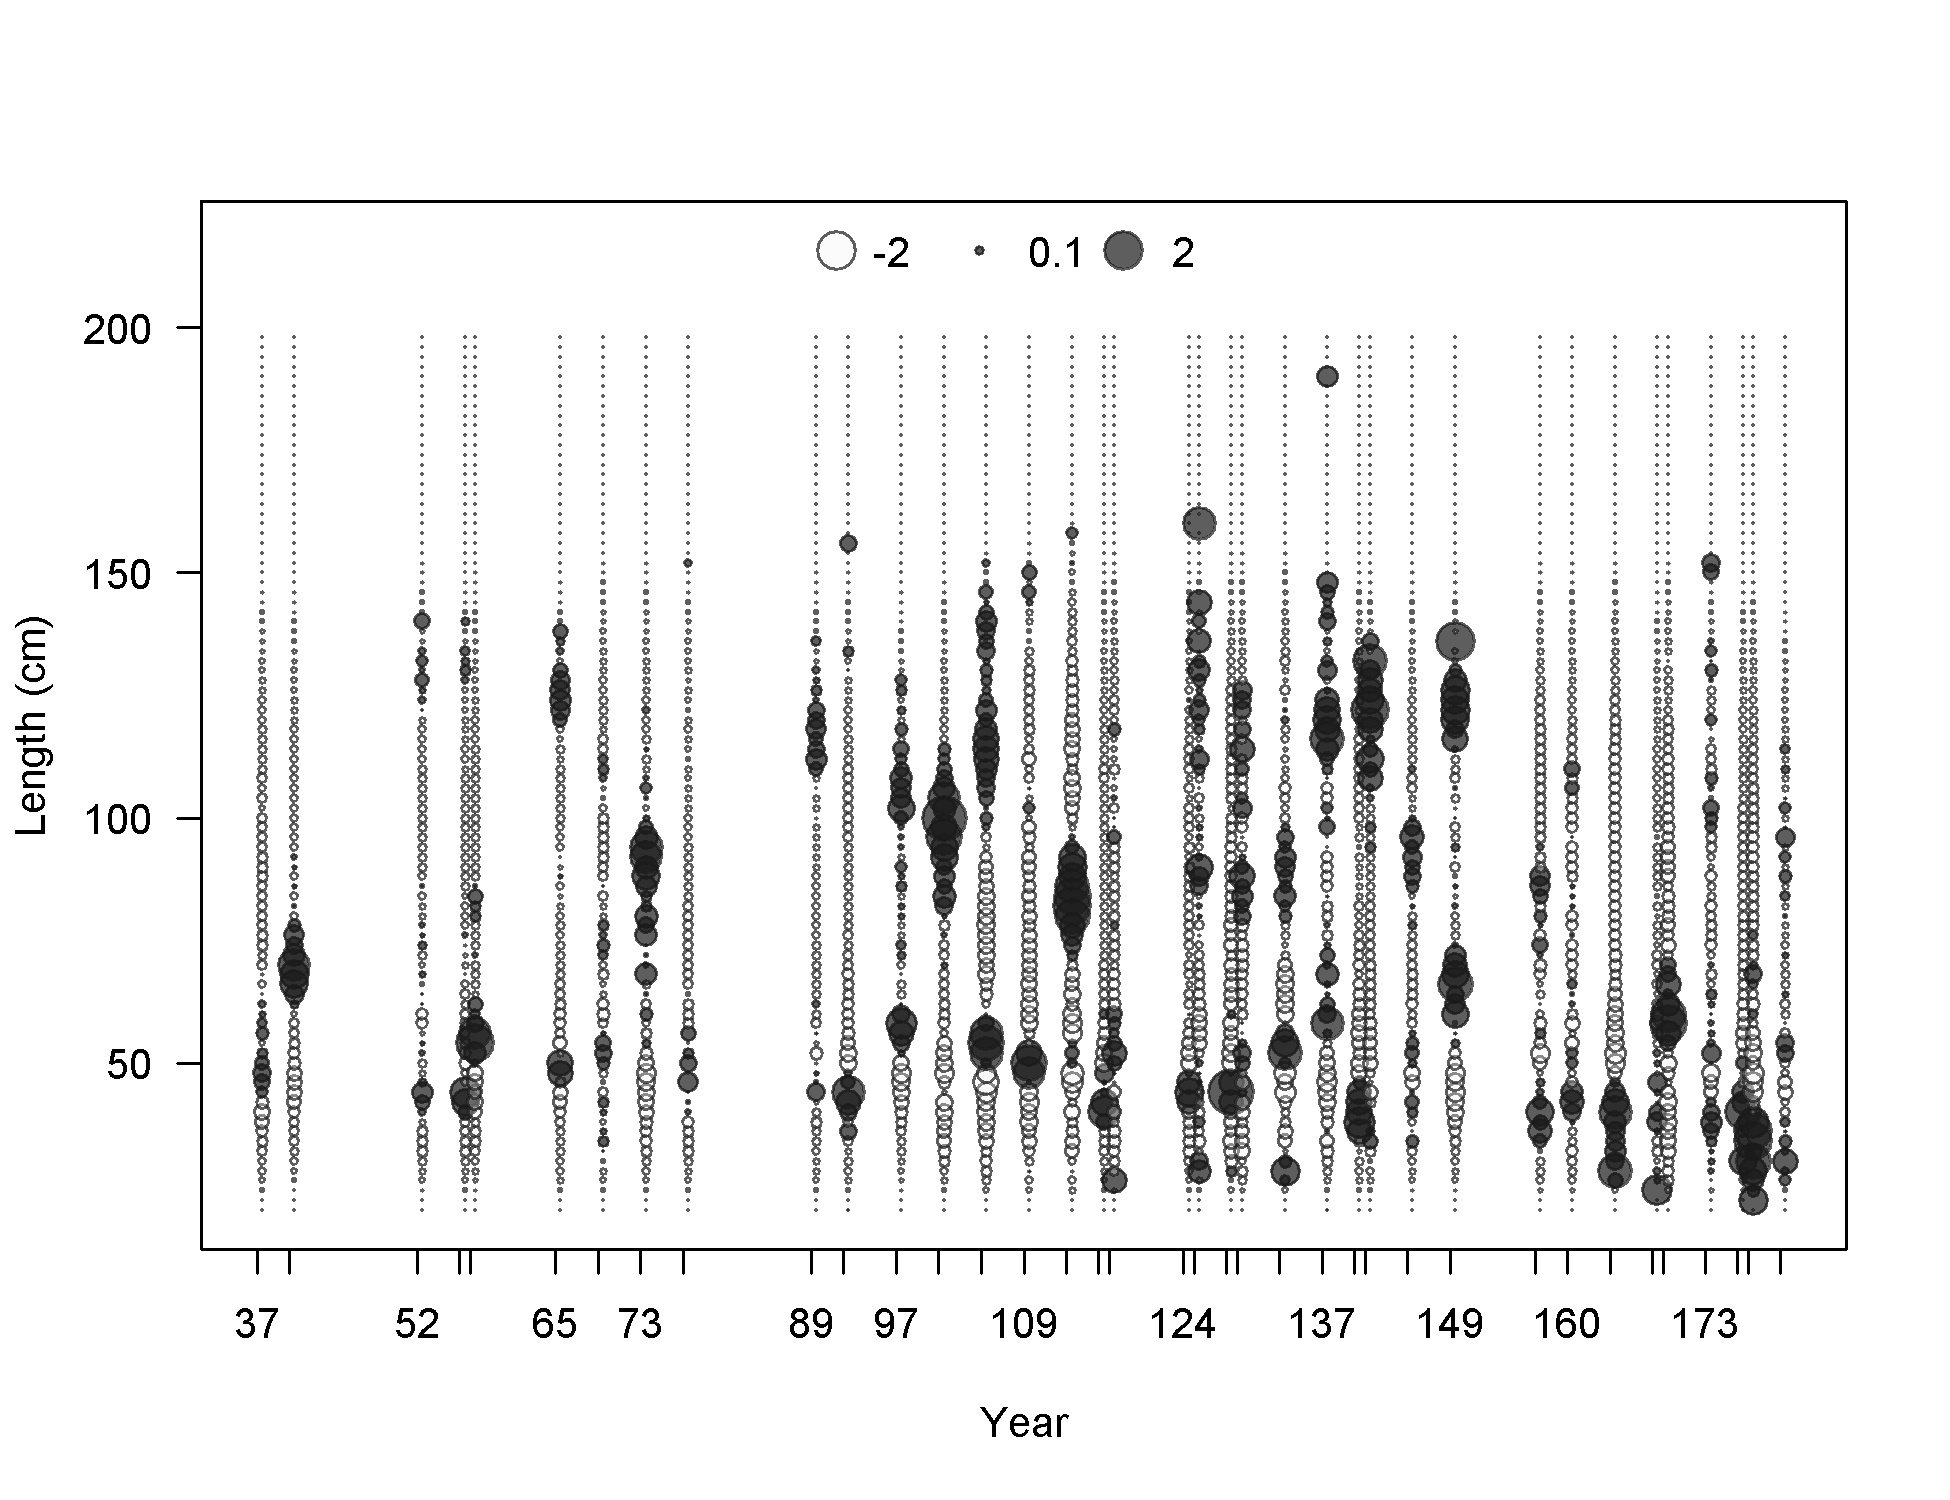
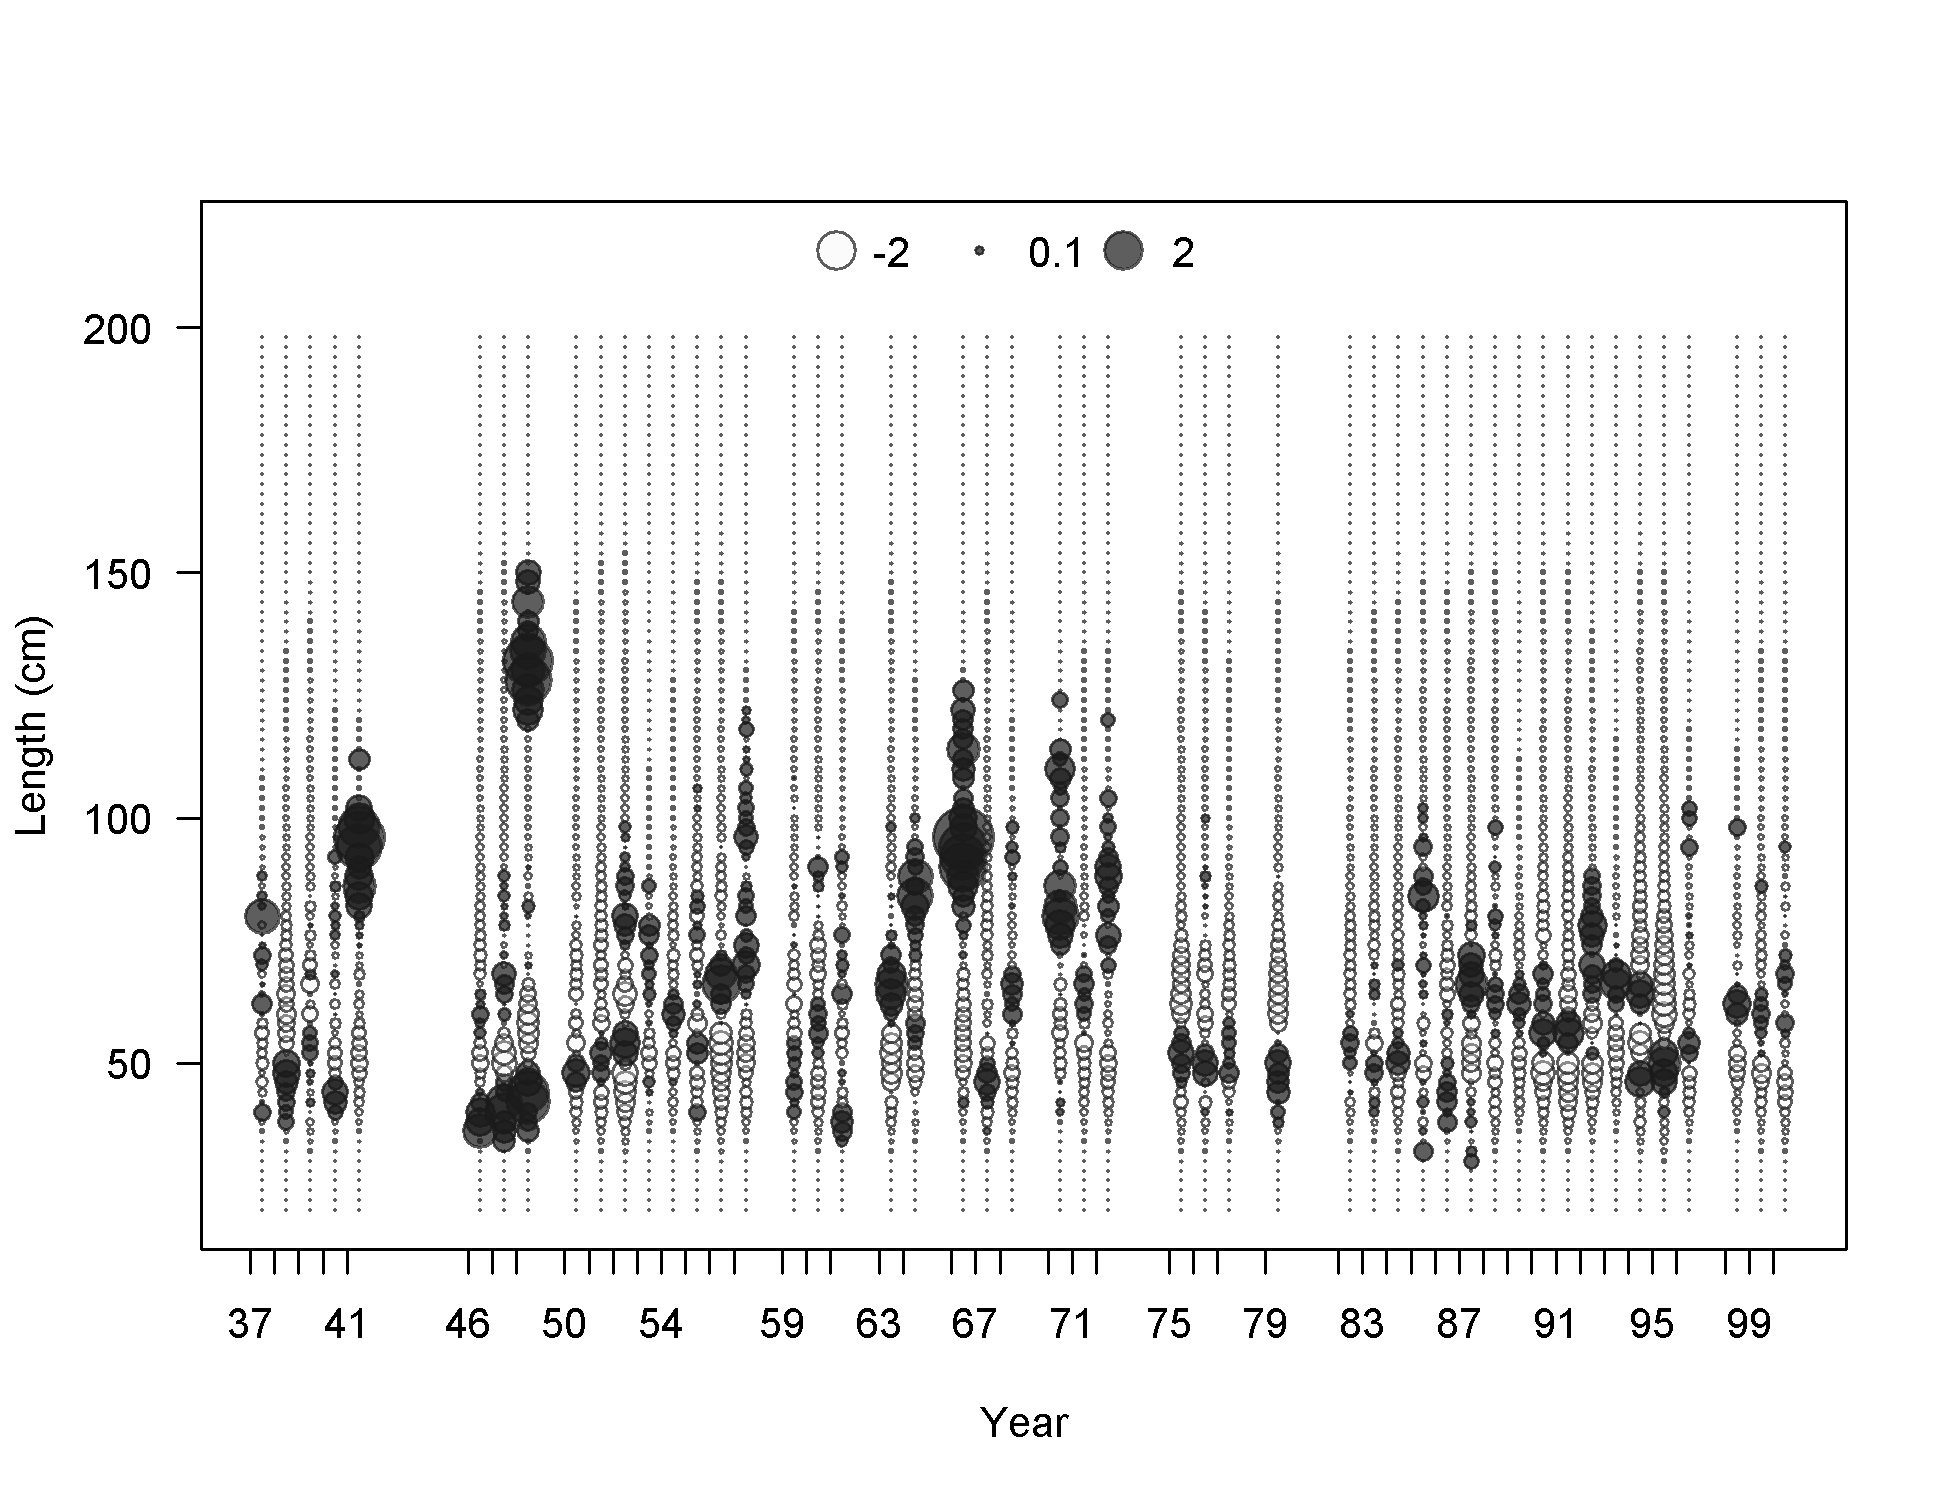
Pearson residuals, whole catch, F1-OBJ_N-Q14 (max=3.79) (plot 4 of 4)
Closed bubbles are positive residuals (observed > expected) and open bubbles are negative residuals (observed < expected).
file: comp_lenfit_residsflt1mkt0_page4.png
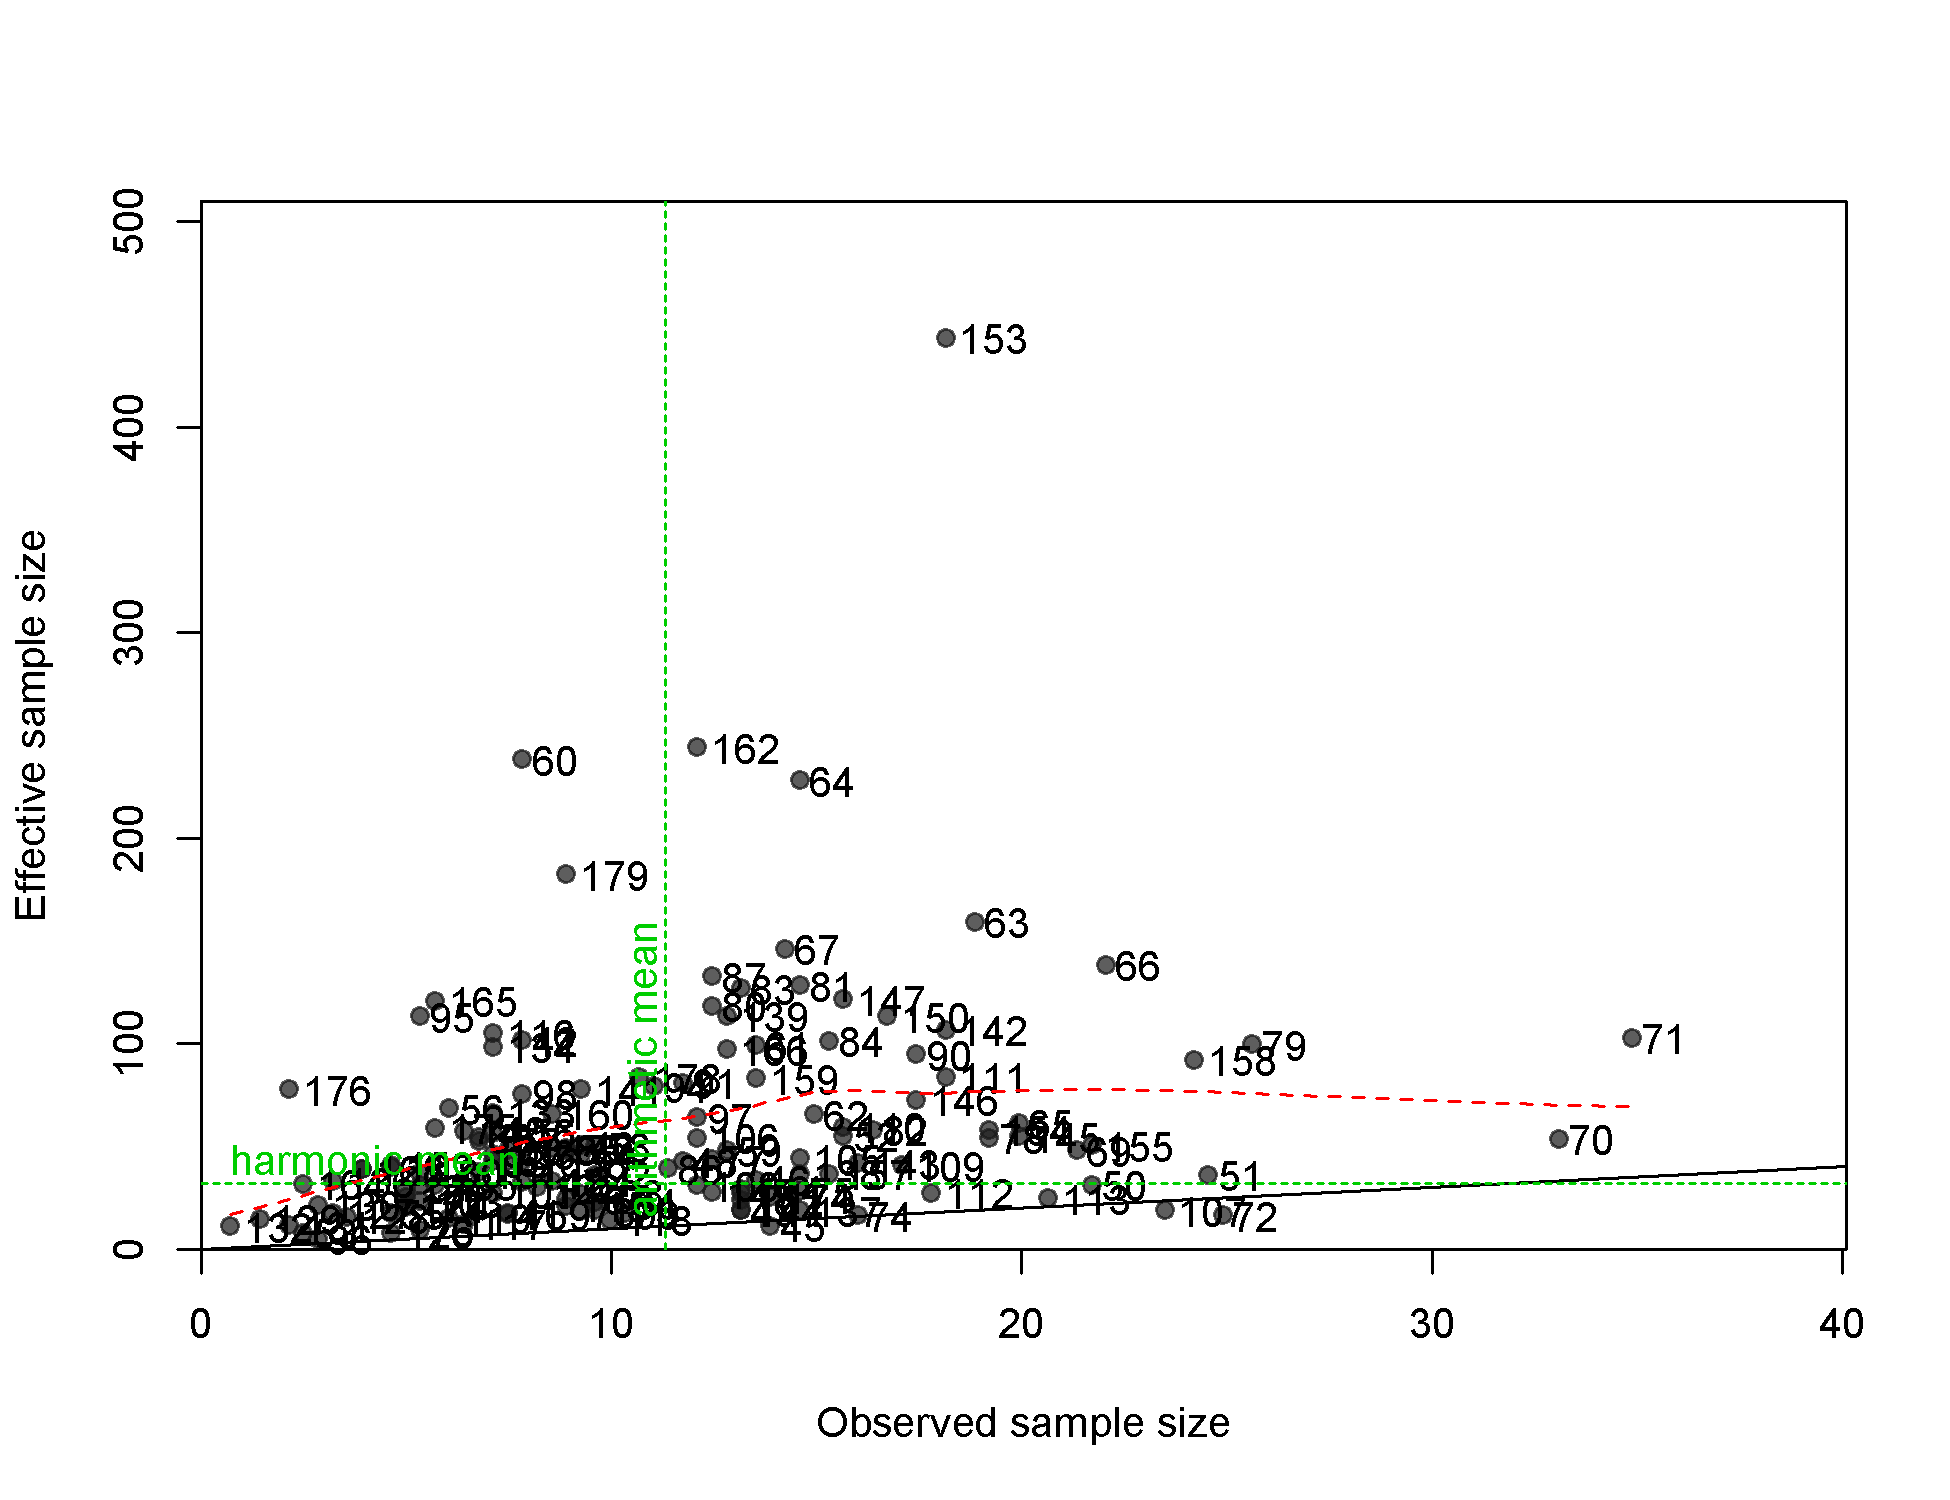
N-EffN comparison, Length comps, whole catch, F1-OBJ_N-Q14
file: comp_lenfit_sampsize_flt1mkt0.png
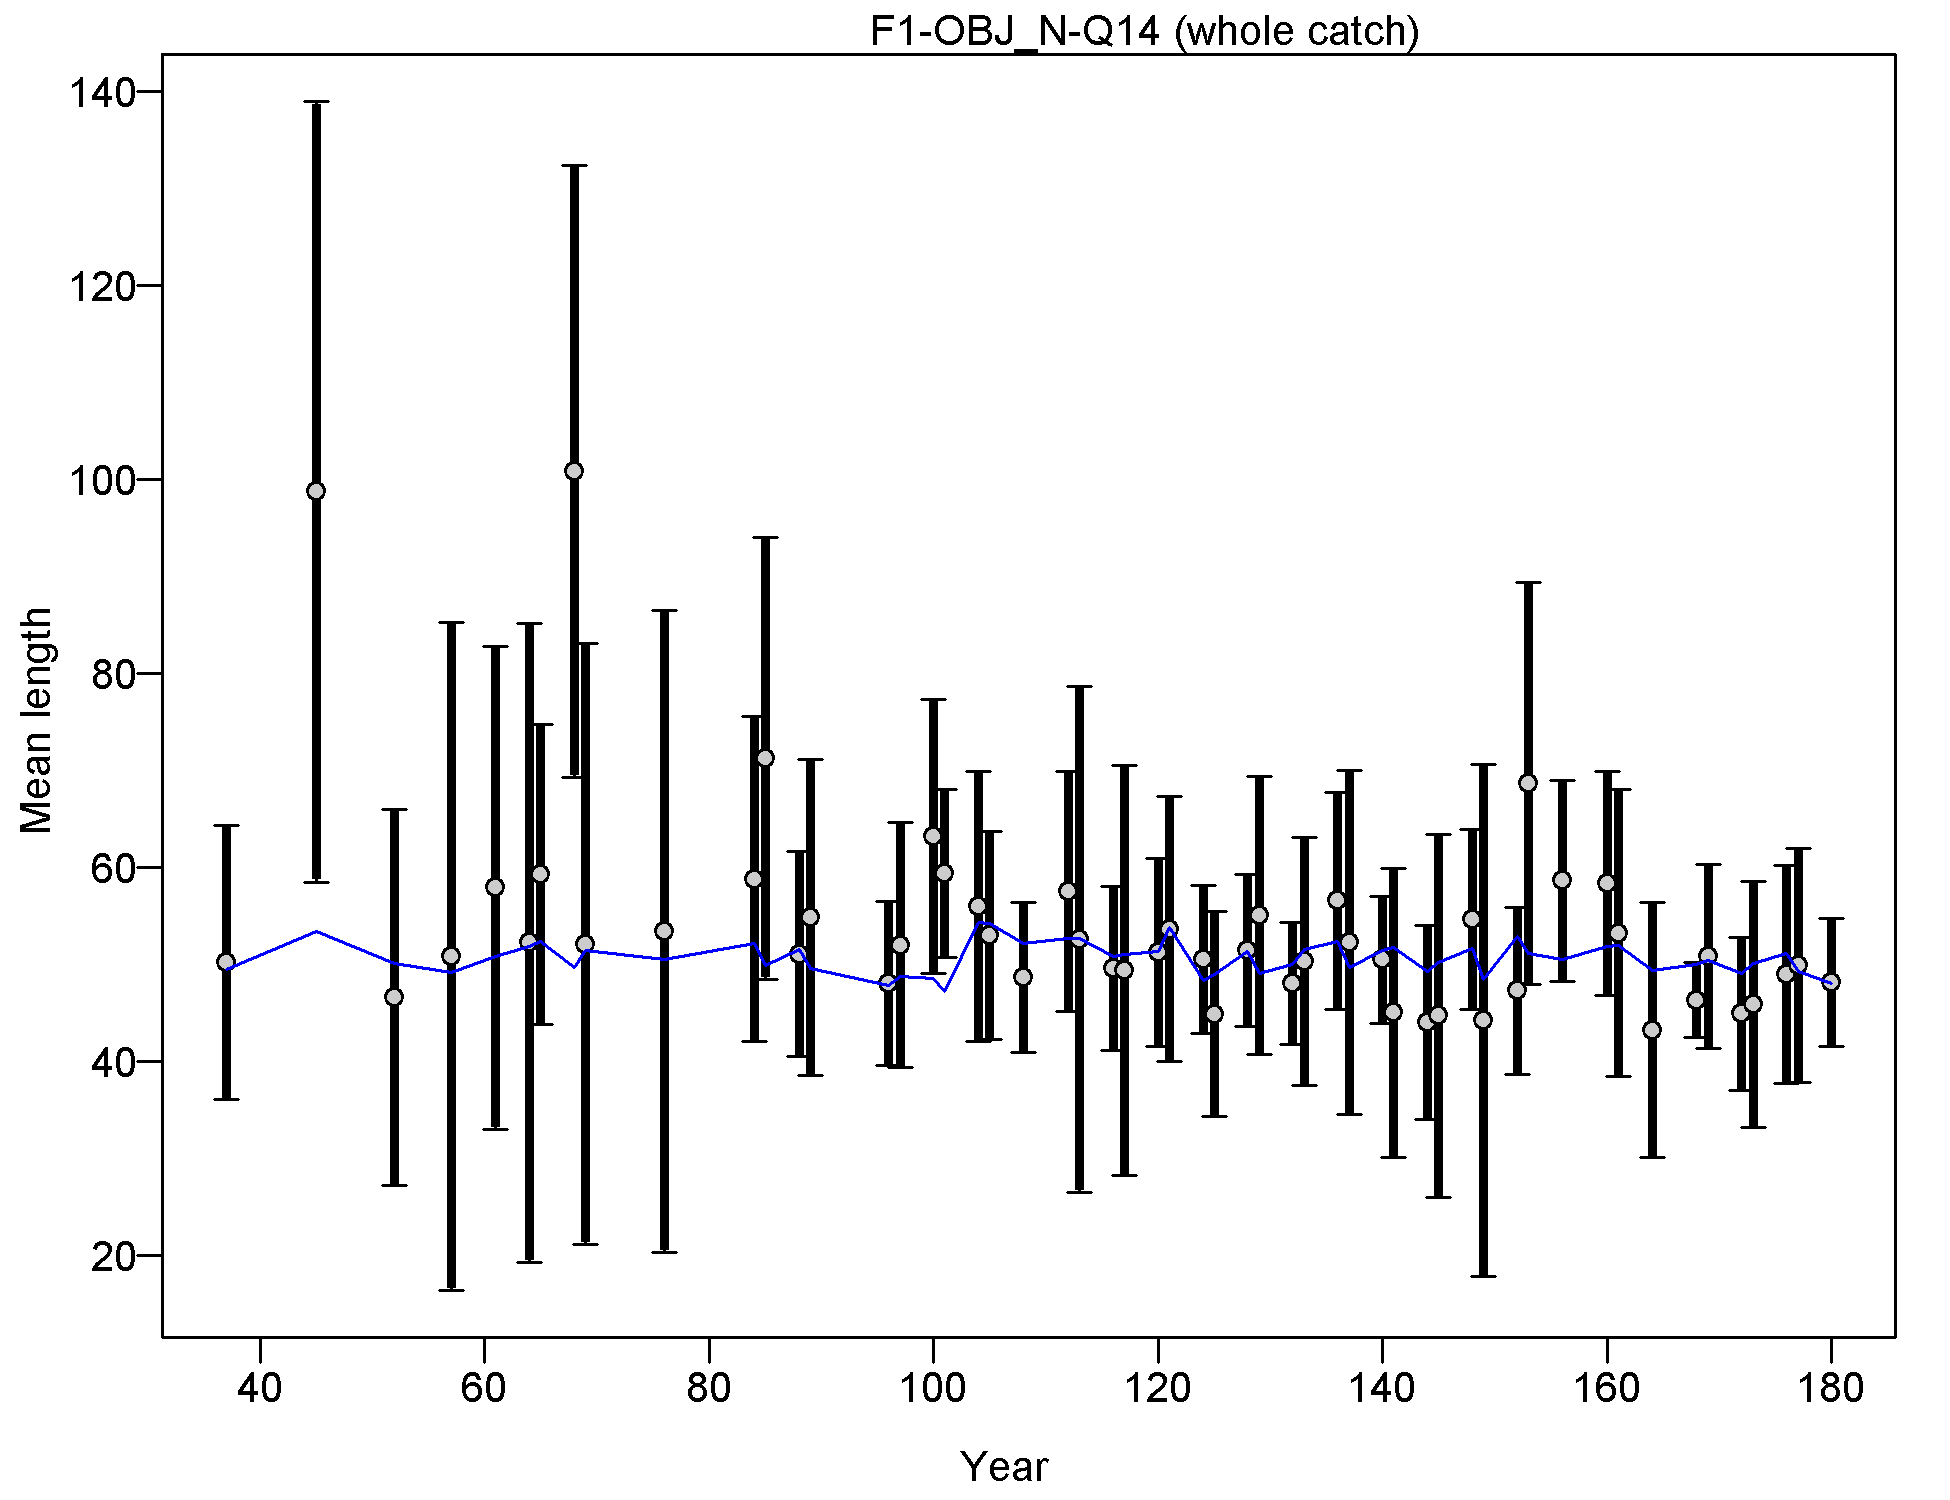
Mean length for F1-OBJ_N-Q14 with 95% confidence intervals based on current samples sizes.
Francis data weighting method TA1.8: thinner intervals (with capped ends) show result of further adjusting sample sizes based on suggested multiplier (with 95% interval) for len data from F1-OBJ_N-Q14:
0.9878 (0.6478-1.7791)
For more info, see
Francis, R.I.C.C. (2011). Data weighting in statistical fisheries stock assessment models. Can. J. Fish. Aquat. Sci. 68: 1124-1138. https://doi.org/10.1139/f2011-025
file: comp_lenfit_data_weighting_TA1.8_F1-OBJ_N-Q14.png
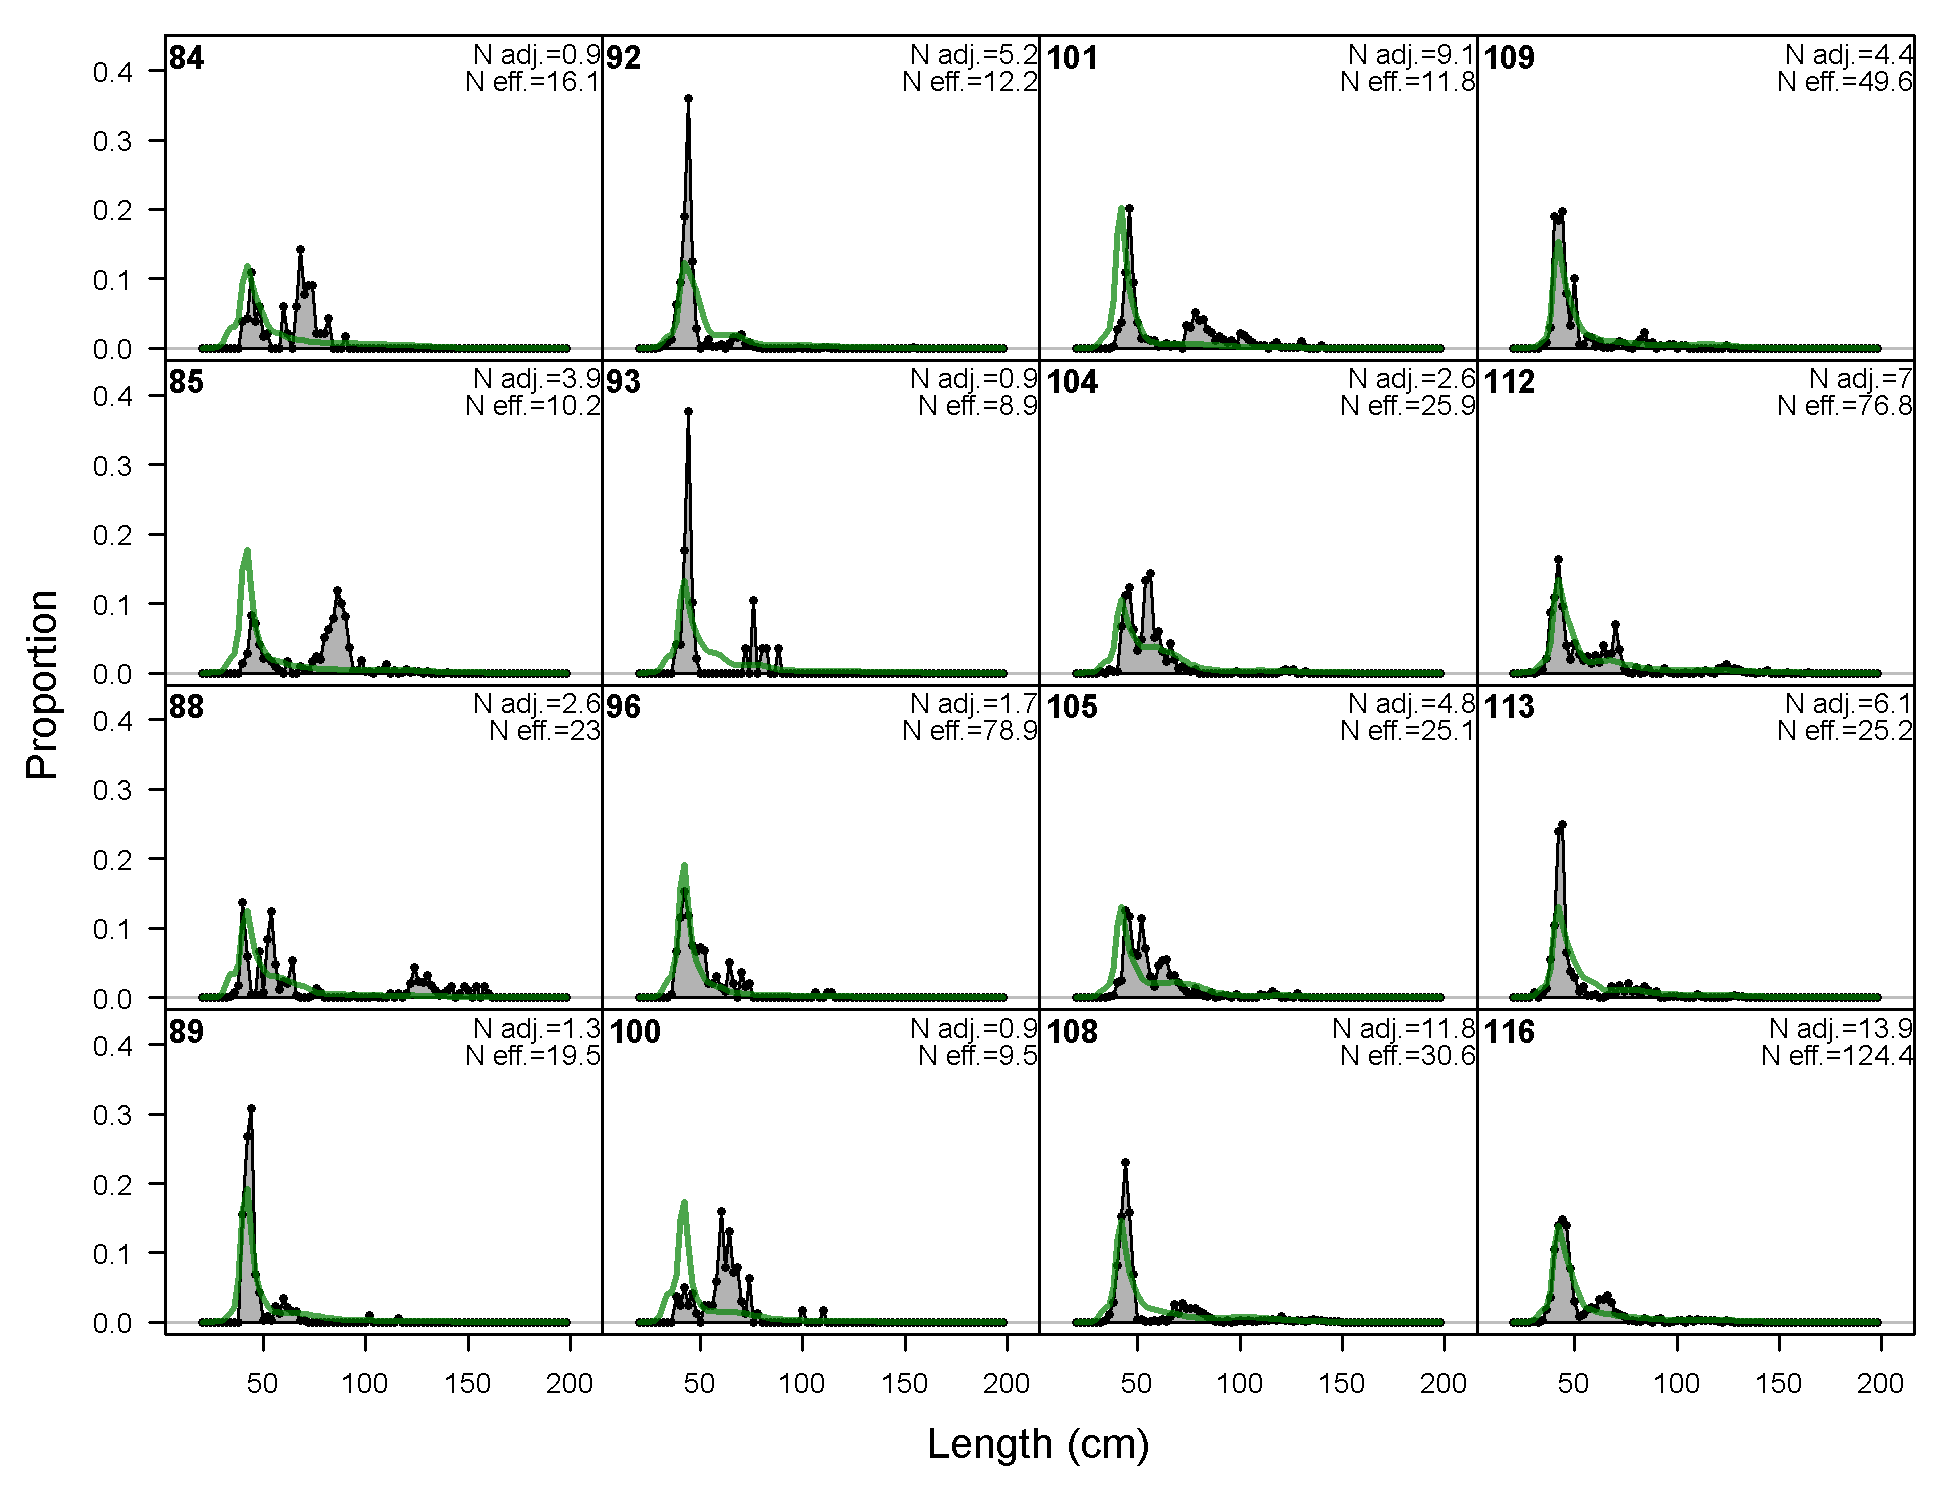
Length comps, whole catch, F2-OBJ_Nc_Q14 (plot 1 of 3).
'N adj.' is the input sample size after data-weighting adjustment. N eff. is the calculated effective sample size used in the McAllister-Iannelli tuning method.
file: comp_lenfit_flt2mkt0_page1.png
Length comps, whole catch, F2-OBJ_Nc_Q14 (plot 2 of 3)
file: comp_lenfit_flt2mkt0_page2.png
Length comps, whole catch, F2-OBJ_Nc_Q14 (plot 3 of 3)
file: comp_lenfit_flt2mkt0_page3.png
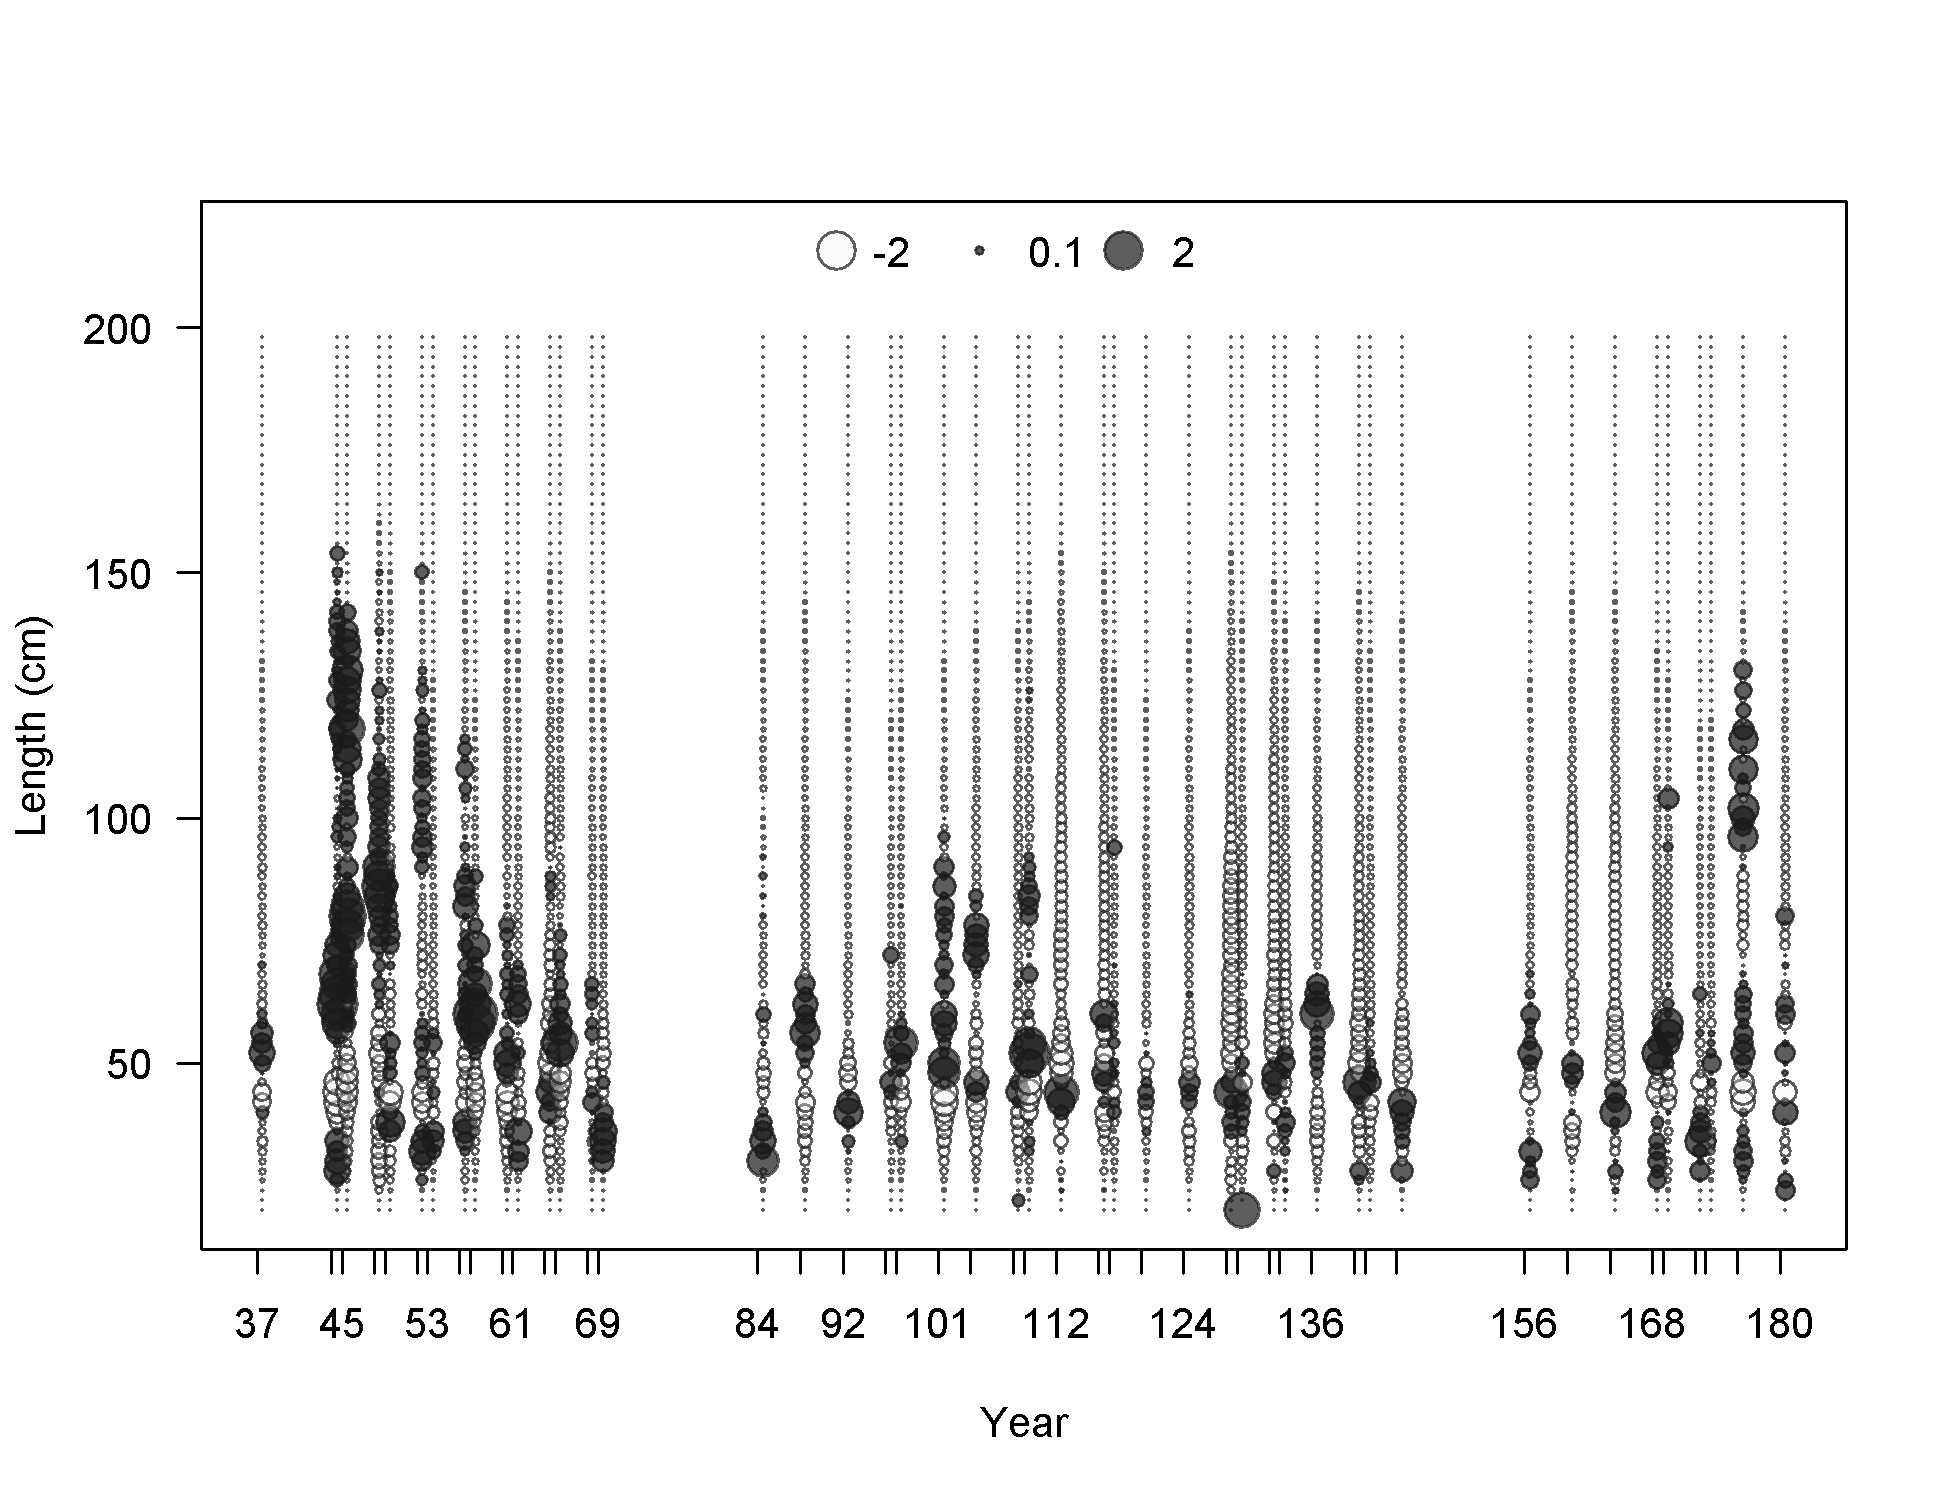
Pearson residuals, whole catch, F2-OBJ_Nc_Q14 (max=2.61) (plot 3 of 3)
Closed bubbles are positive residuals (observed > expected) and open bubbles are negative residuals (observed < expected).
file: comp_lenfit_residsflt2mkt0_page3.png
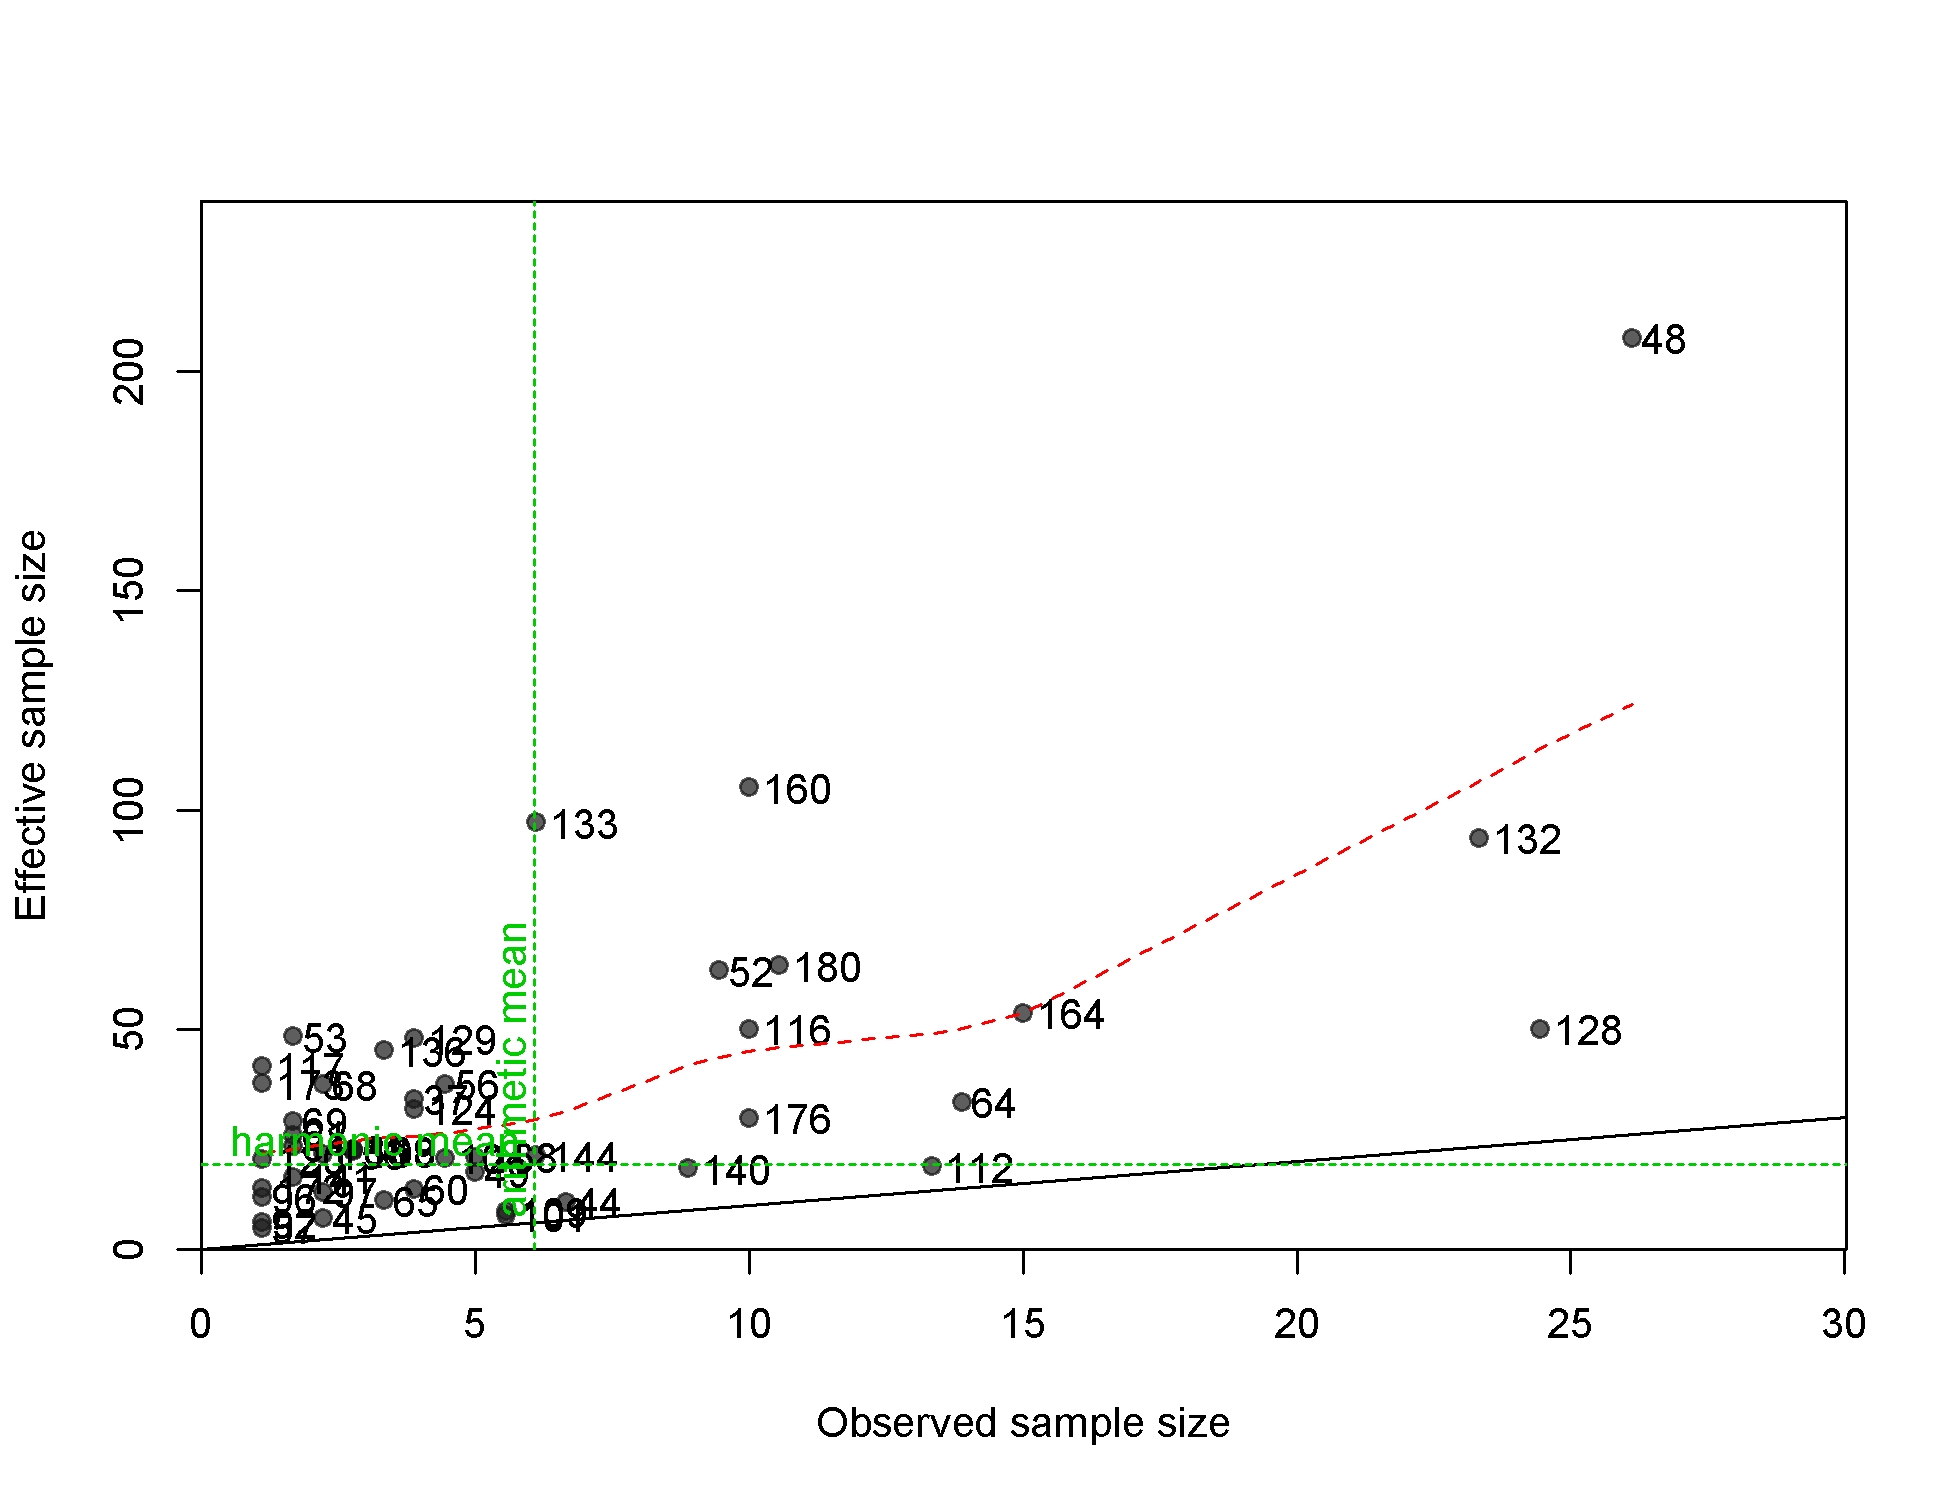
N-EffN comparison, Length comps, whole catch, F2-OBJ_Nc_Q14
file: comp_lenfit_sampsize_flt2mkt0.png
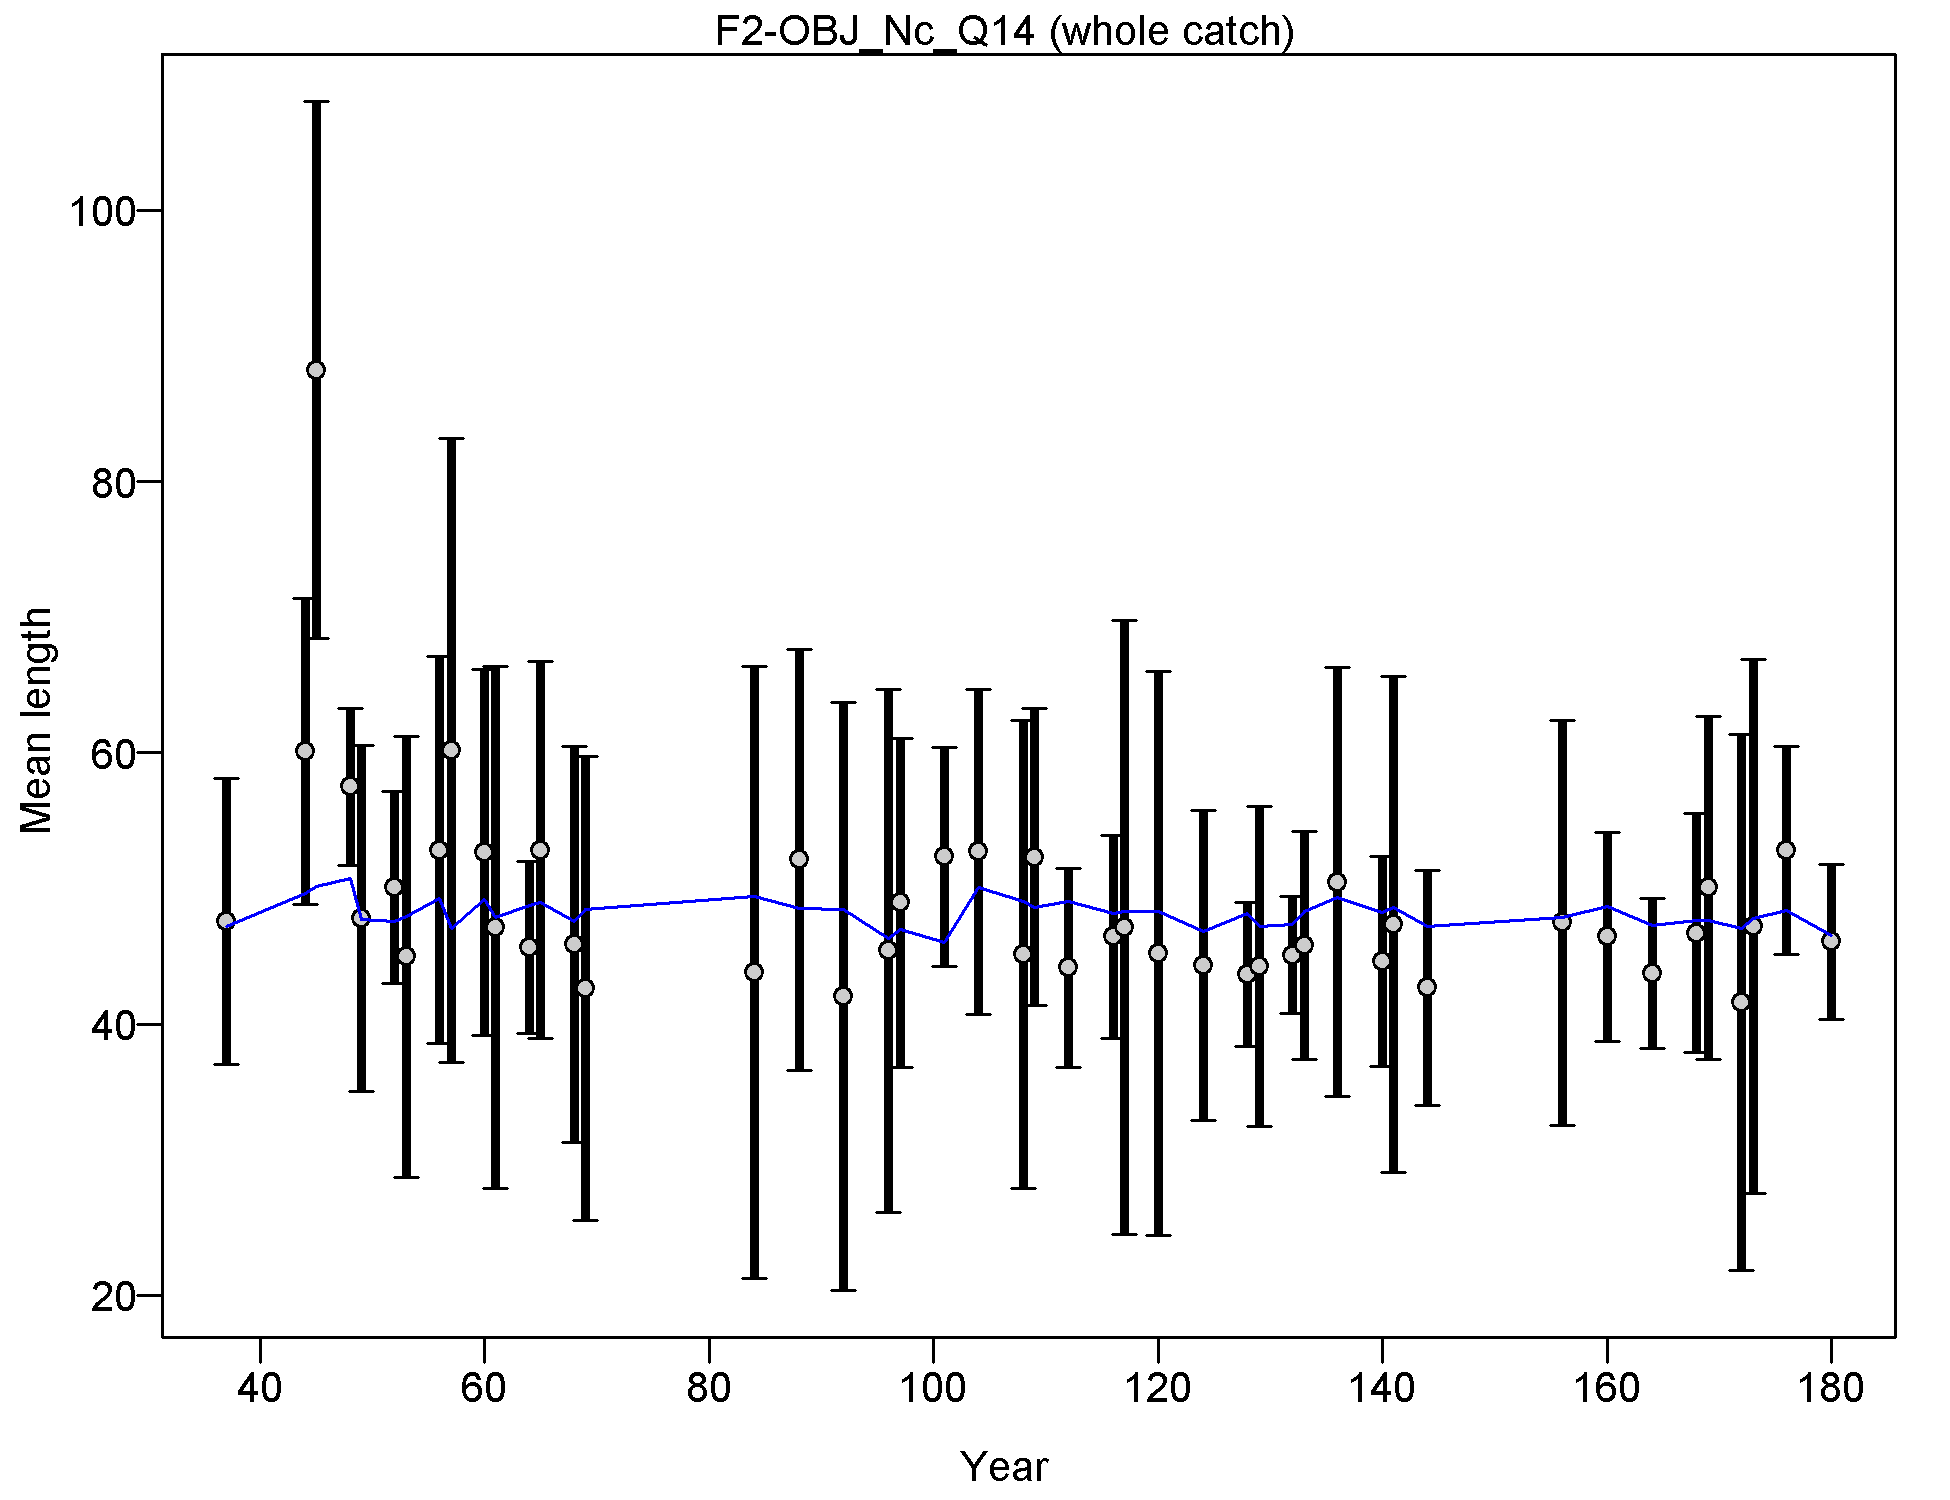
Mean length for F2-OBJ_Nc_Q14 with 95% confidence intervals based on current samples sizes.
Francis data weighting method TA1.8: thinner intervals (with capped ends) show result of further adjusting sample sizes based on suggested multiplier (with 95% interval) for len data from F2-OBJ_Nc_Q14:
0.9946 (0.5877-2.4173)
For more info, see
Francis, R.I.C.C. (2011). Data weighting in statistical fisheries stock assessment models. Can. J. Fish. Aquat. Sci. 68: 1124-1138. https://doi.org/10.1139/f2011-025
file: comp_lenfit_data_weighting_TA1.8_F2-OBJ_Nc_Q14.png
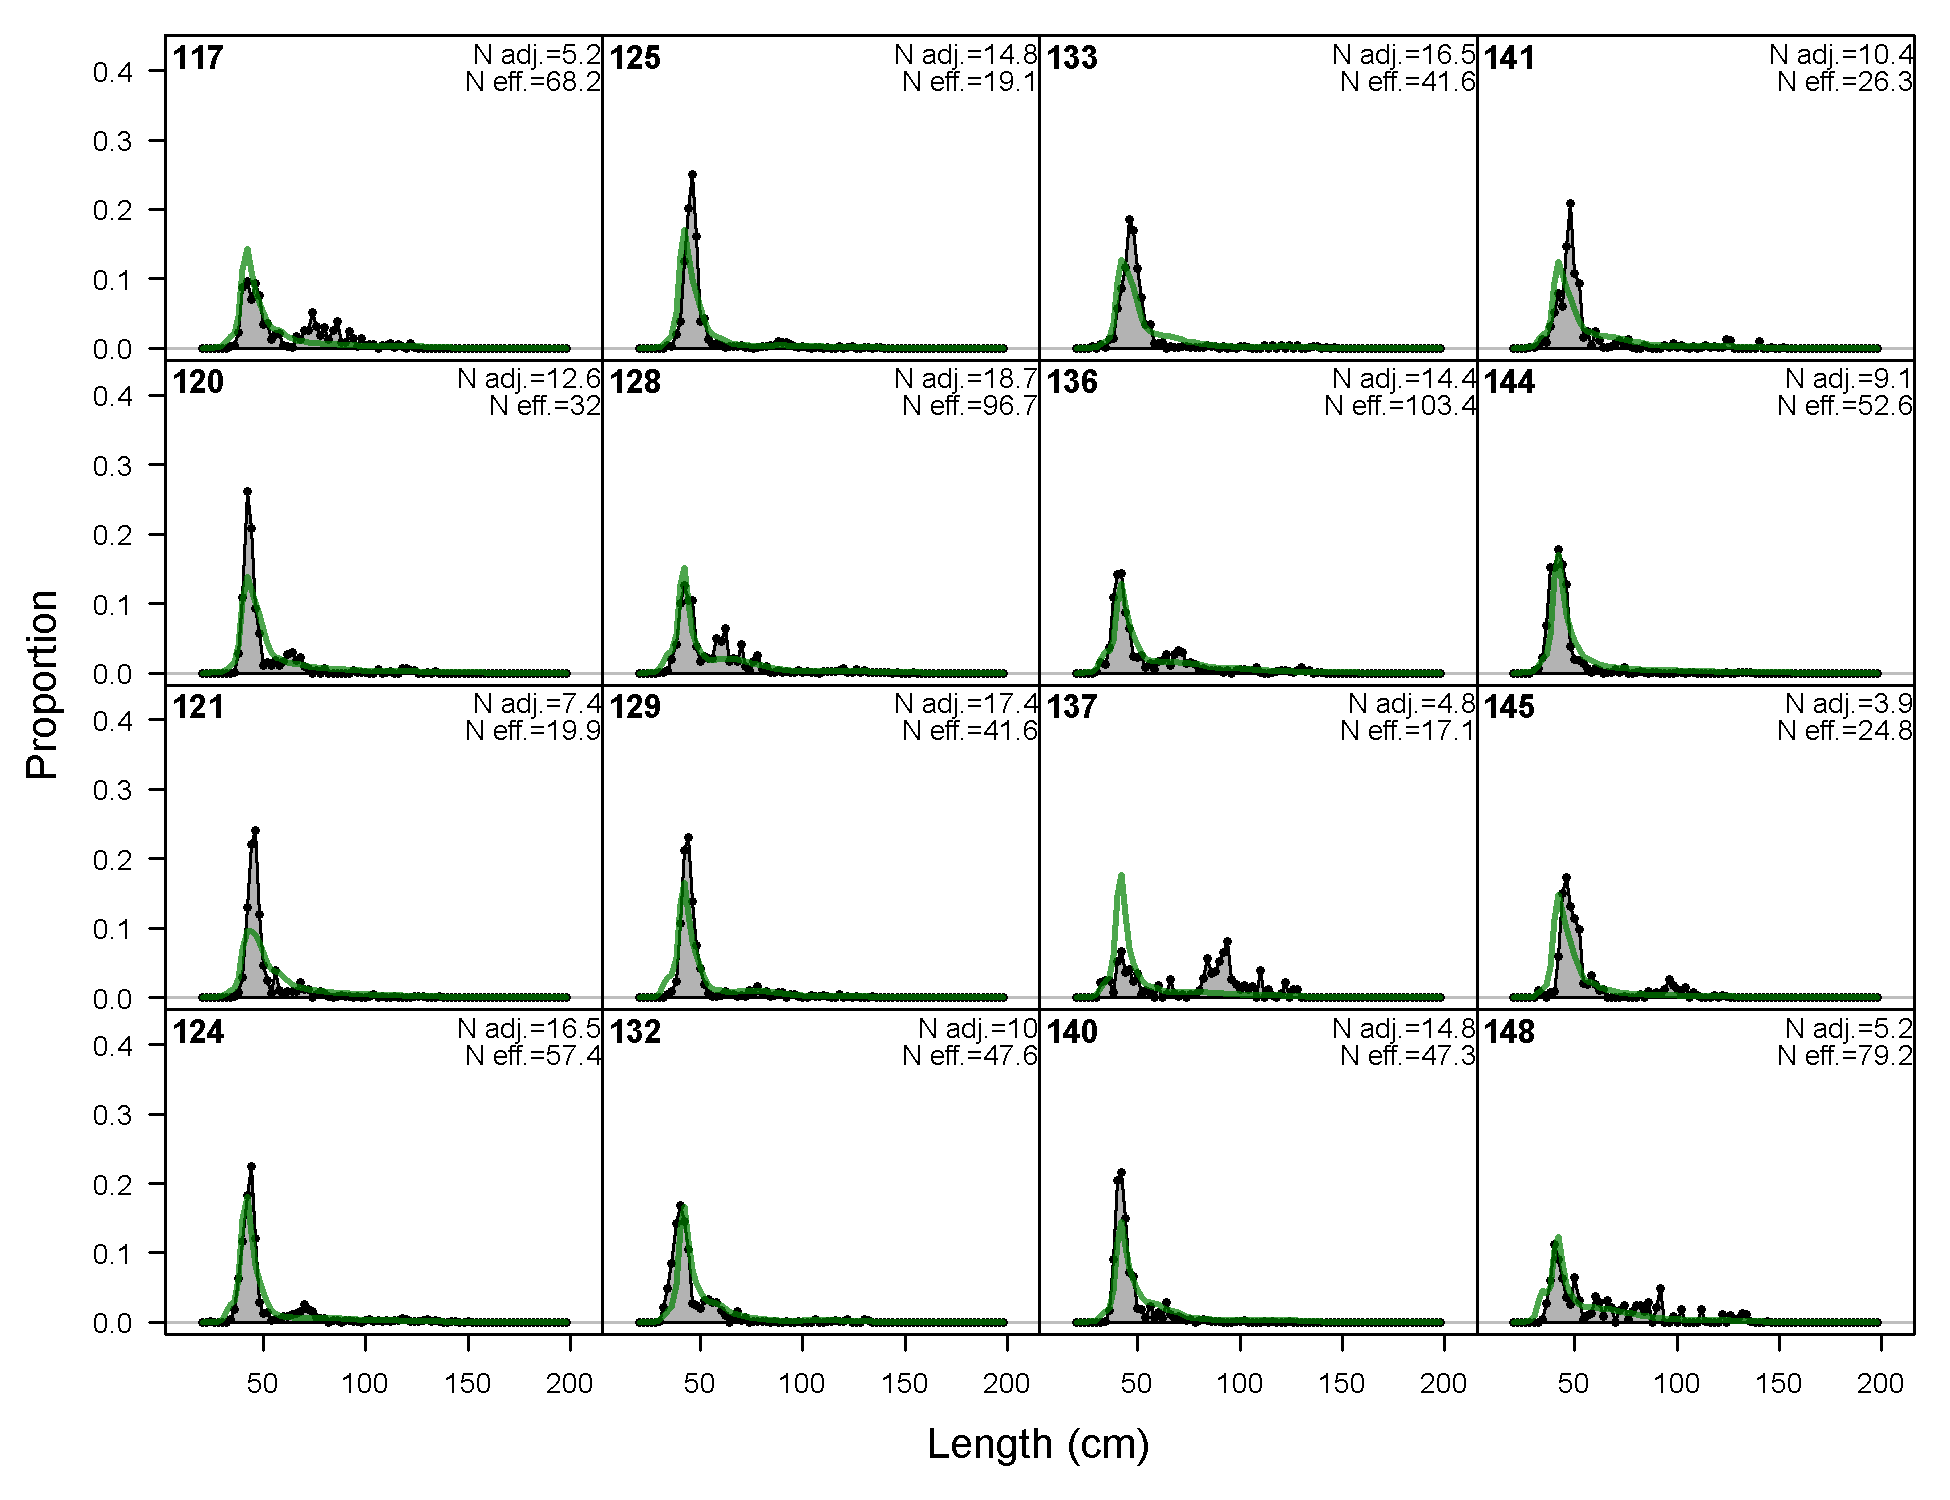
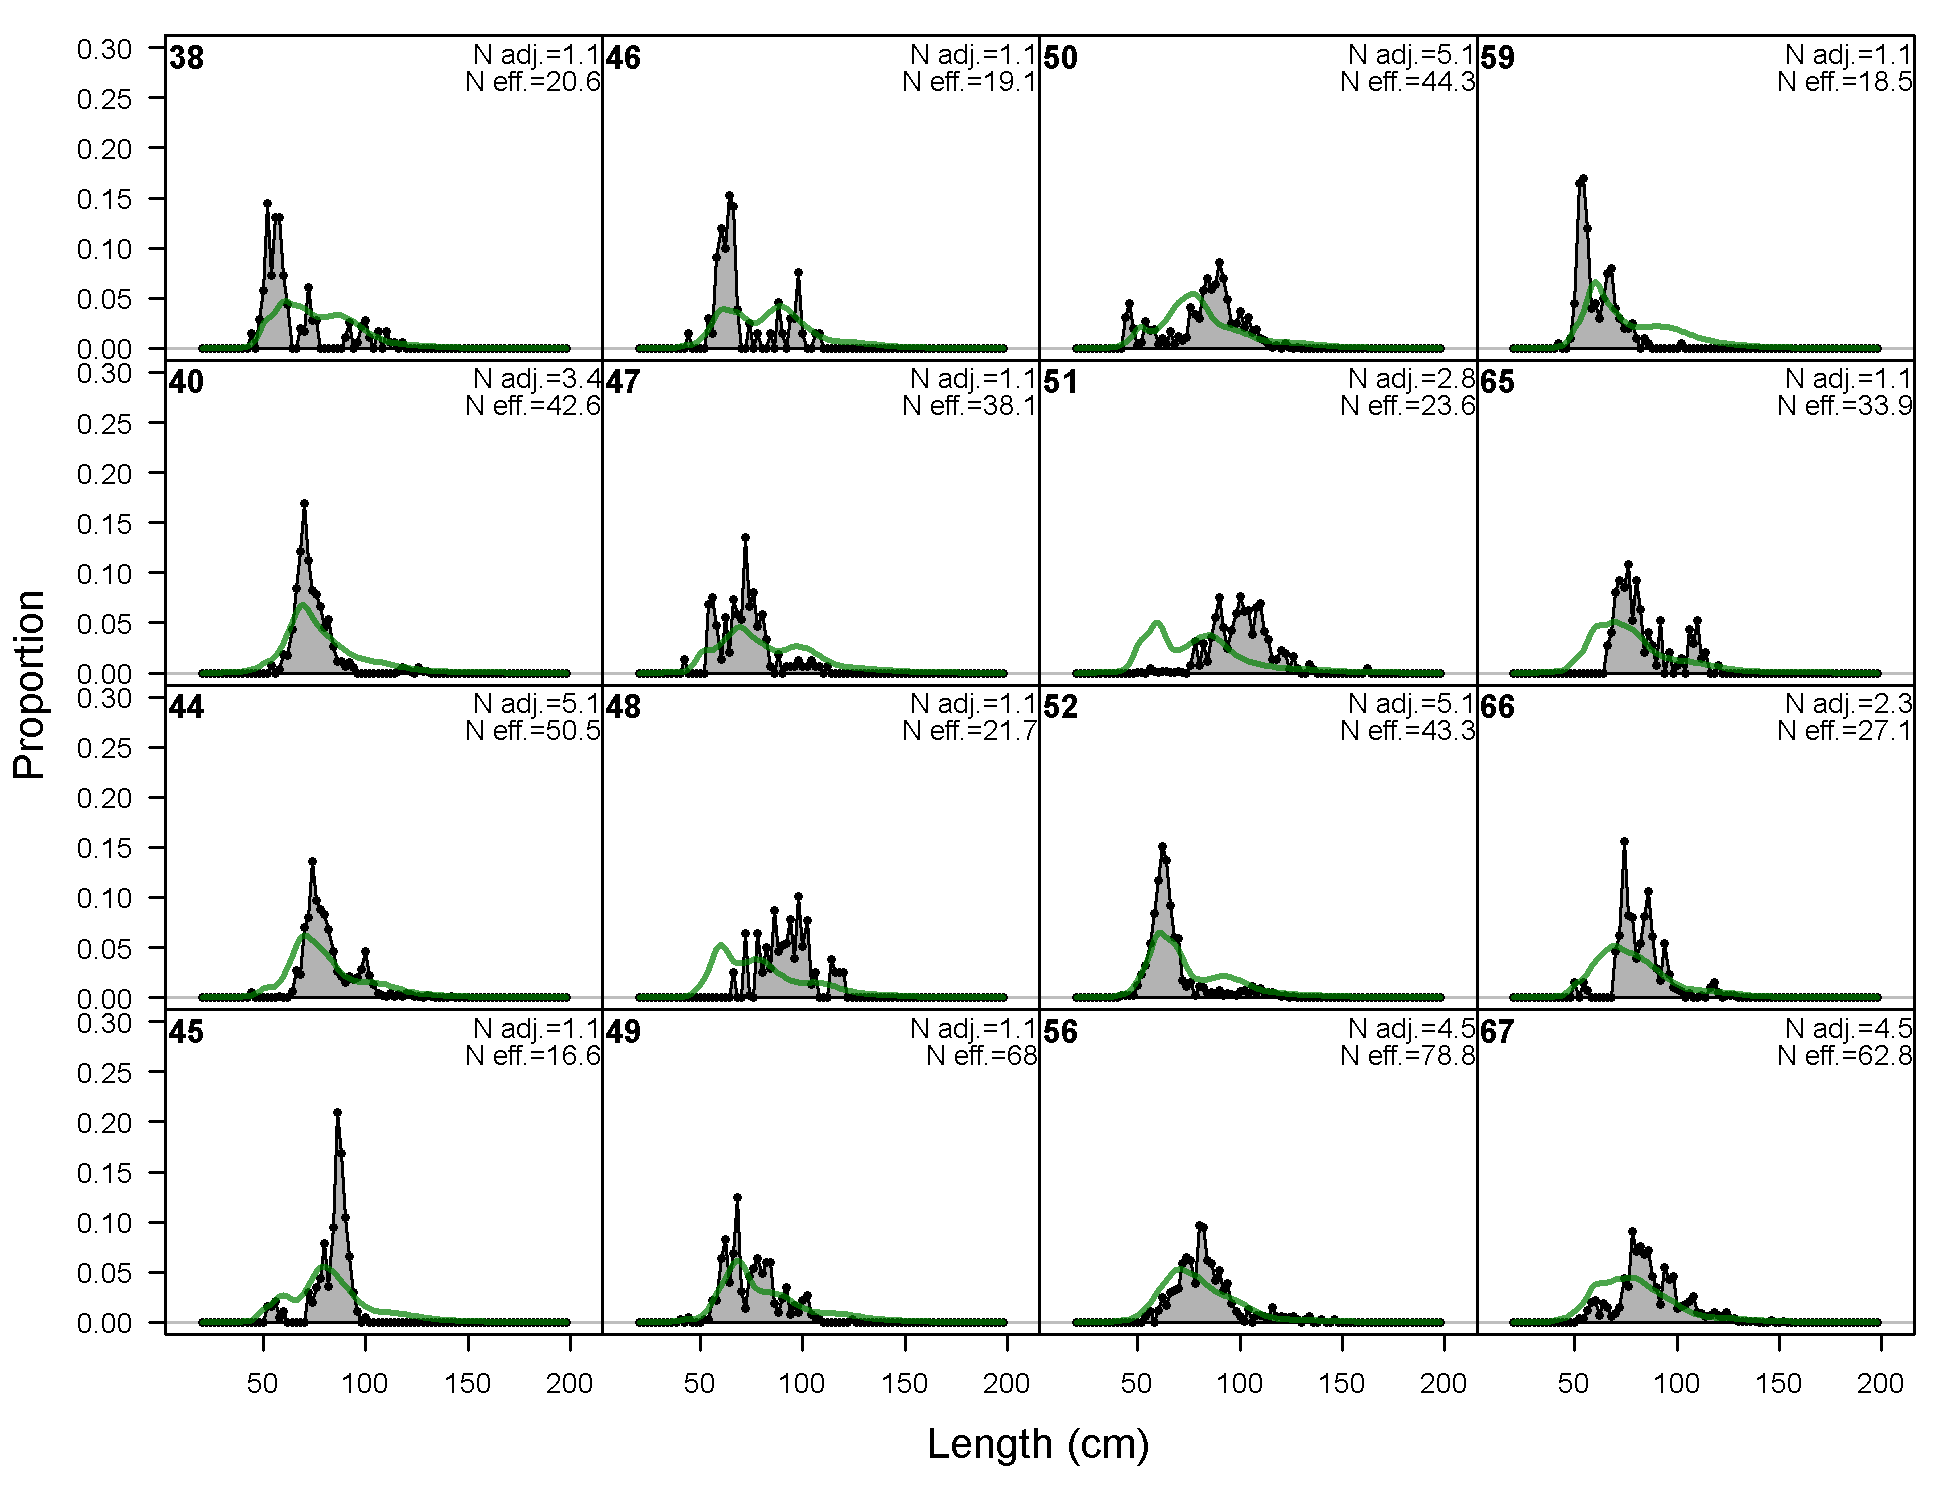
Length comps, whole catch, F3-OBJ_C_Q14 (plot 1 of 3).
'N adj.' is the input sample size after data-weighting adjustment. N eff. is the calculated effective sample size used in the McAllister-Iannelli tuning method.
file: comp_lenfit_flt3mkt0_page1.png
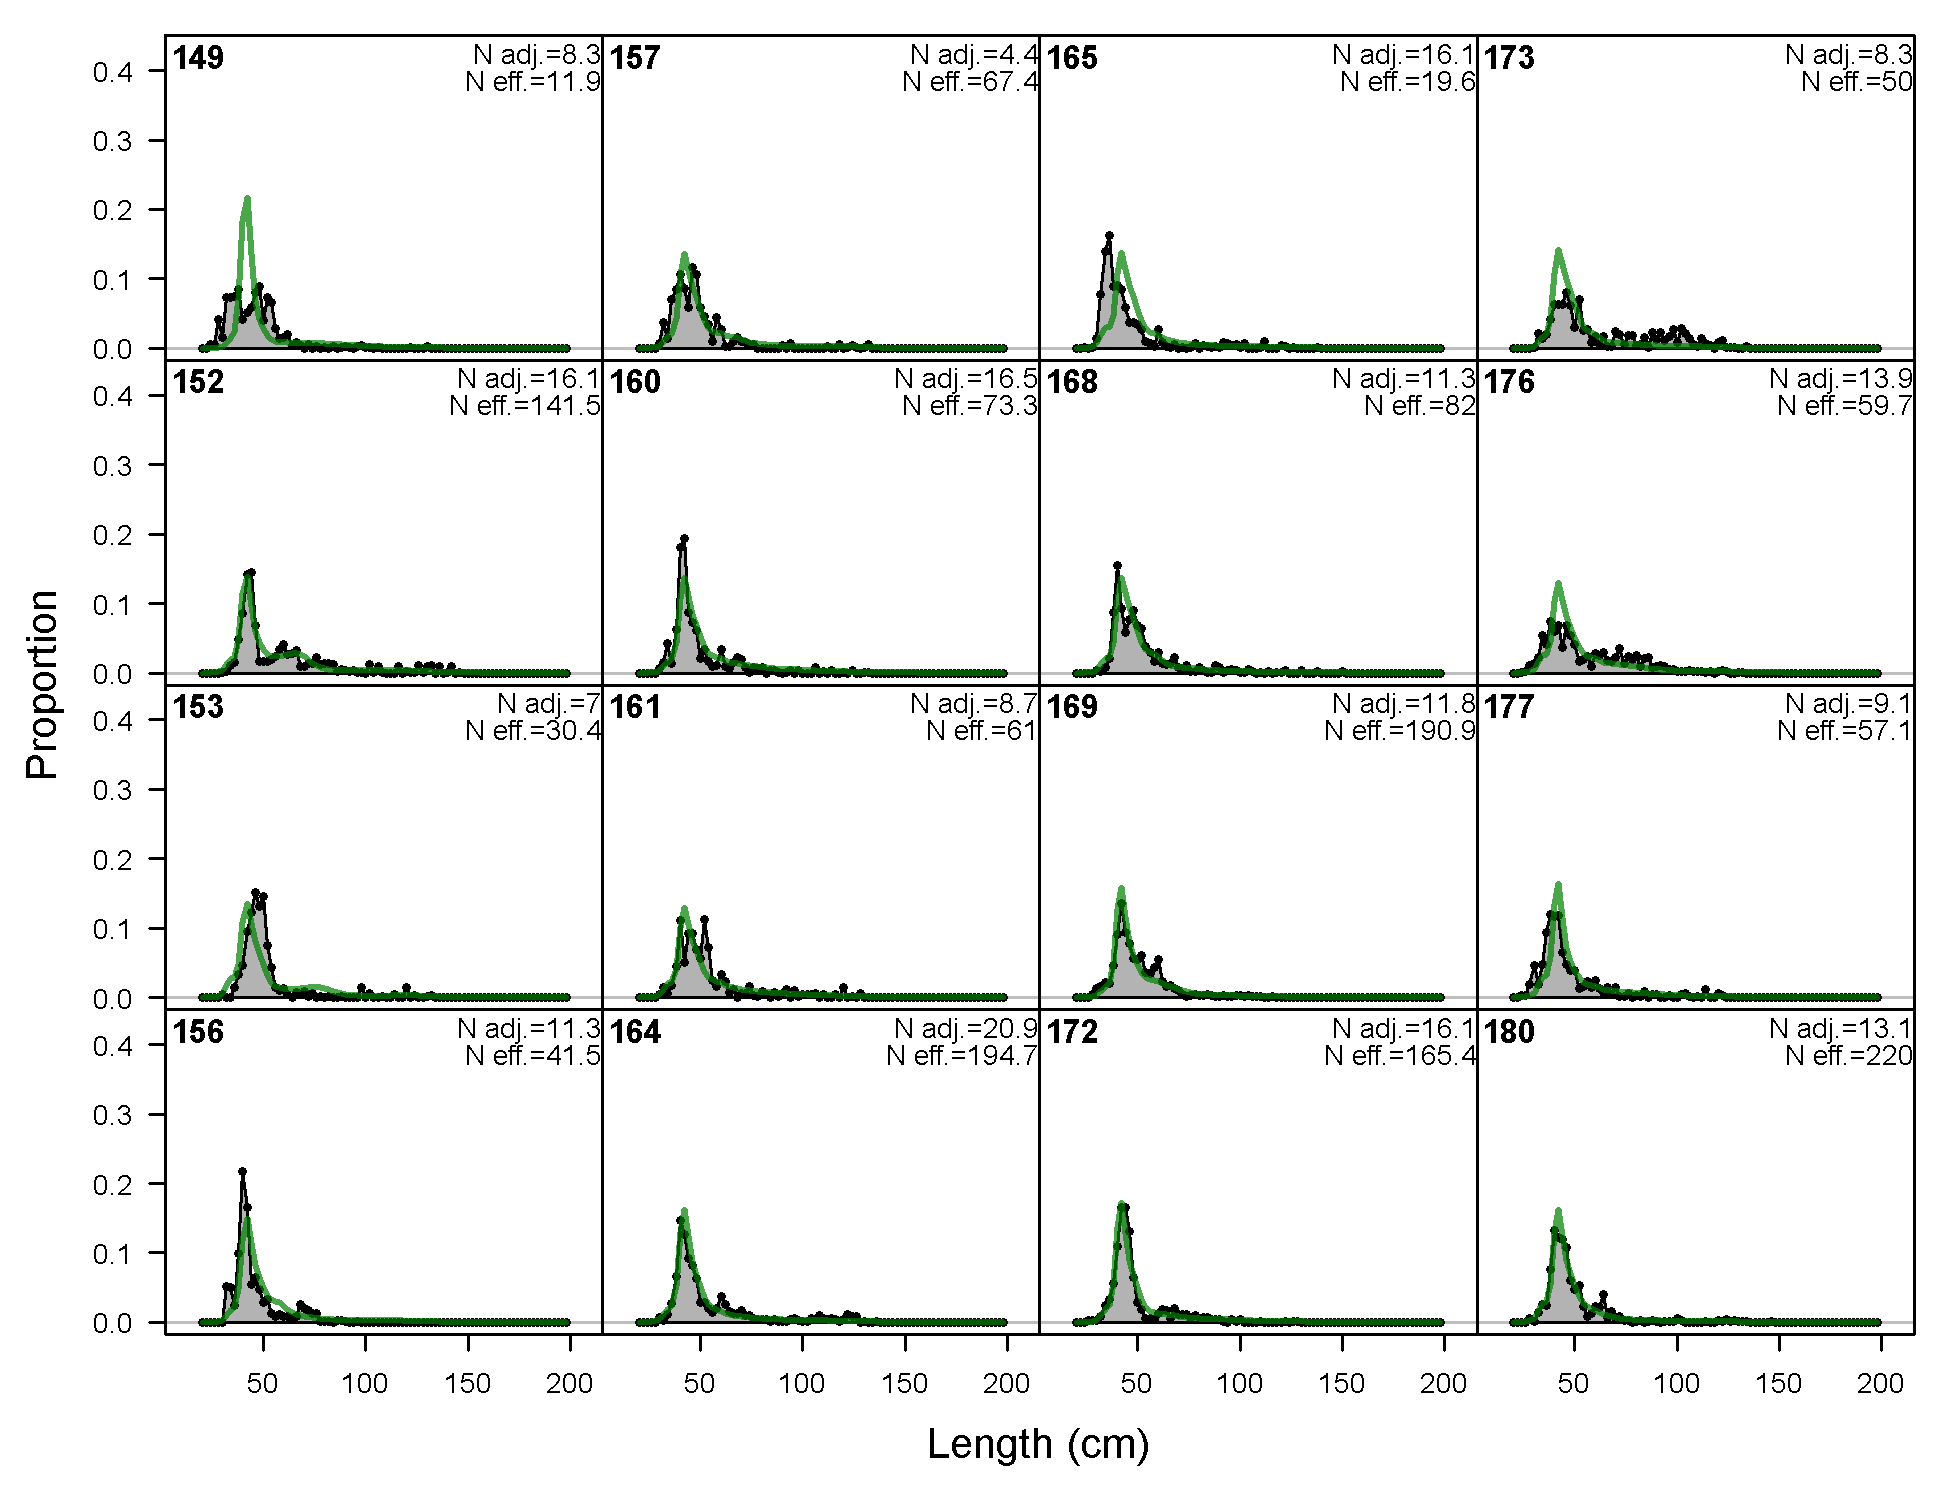
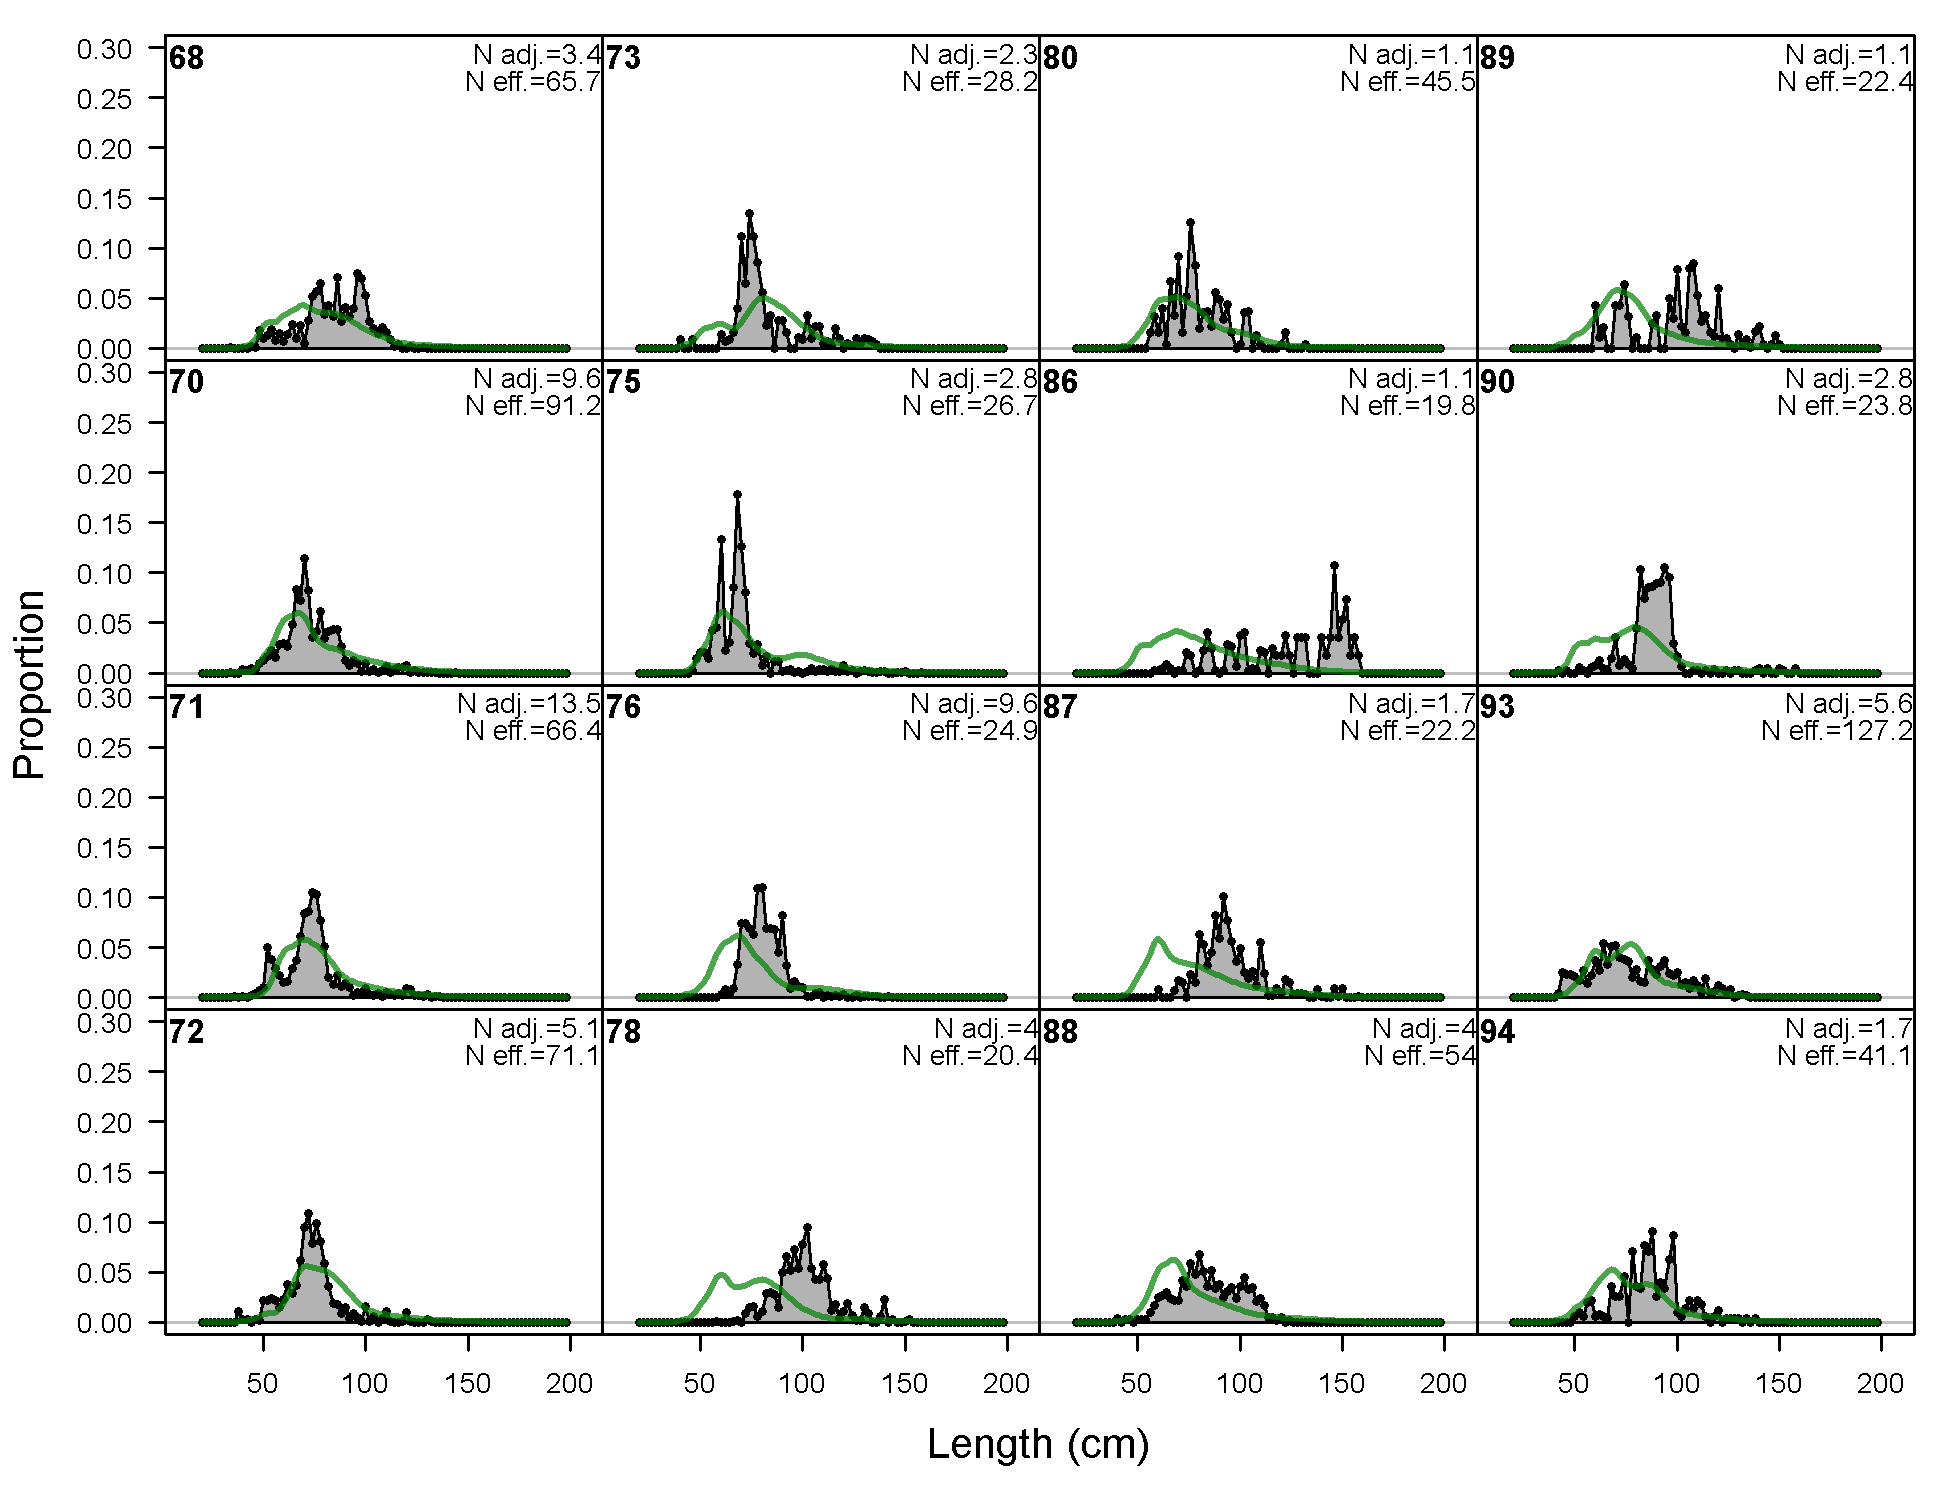
Length comps, whole catch, F3-OBJ_C_Q14 (plot 2 of 3)
file: comp_lenfit_flt3mkt0_page2.png
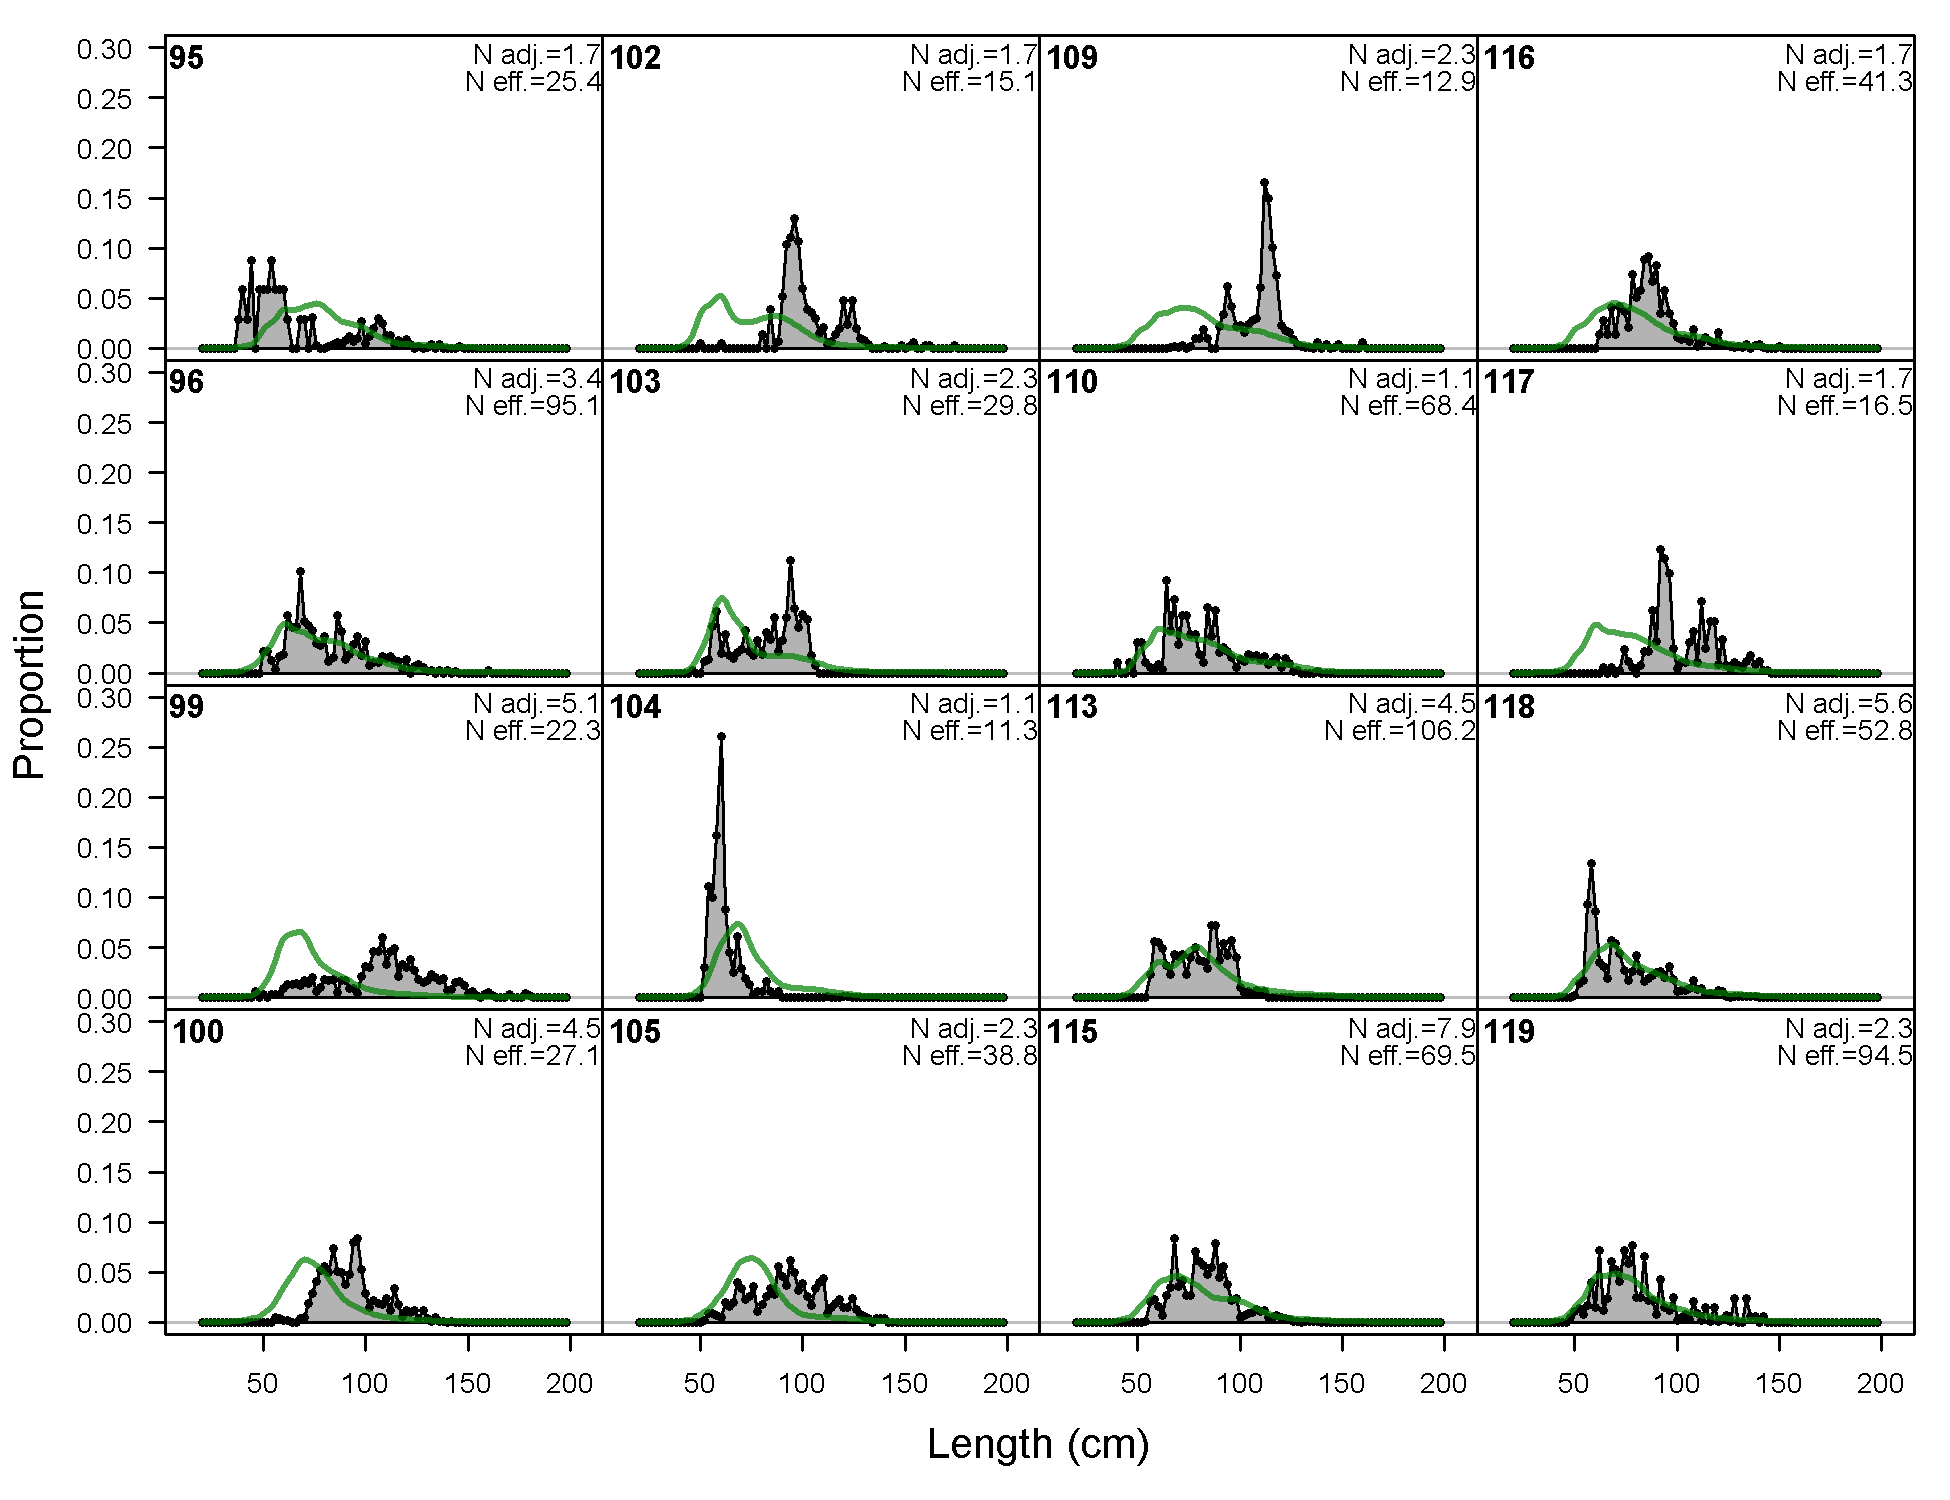
Length comps, whole catch, F3-OBJ_C_Q14 (plot 3 of 3)
file: comp_lenfit_flt3mkt0_page3.png

Pearson residuals, whole catch, F3-OBJ_C_Q14 (max=4.38) (plot 3 of 3)
Closed bubbles are positive residuals (observed > expected) and open bubbles are negative residuals (observed < expected).
file: comp_lenfit_residsflt3mkt0_page3.png
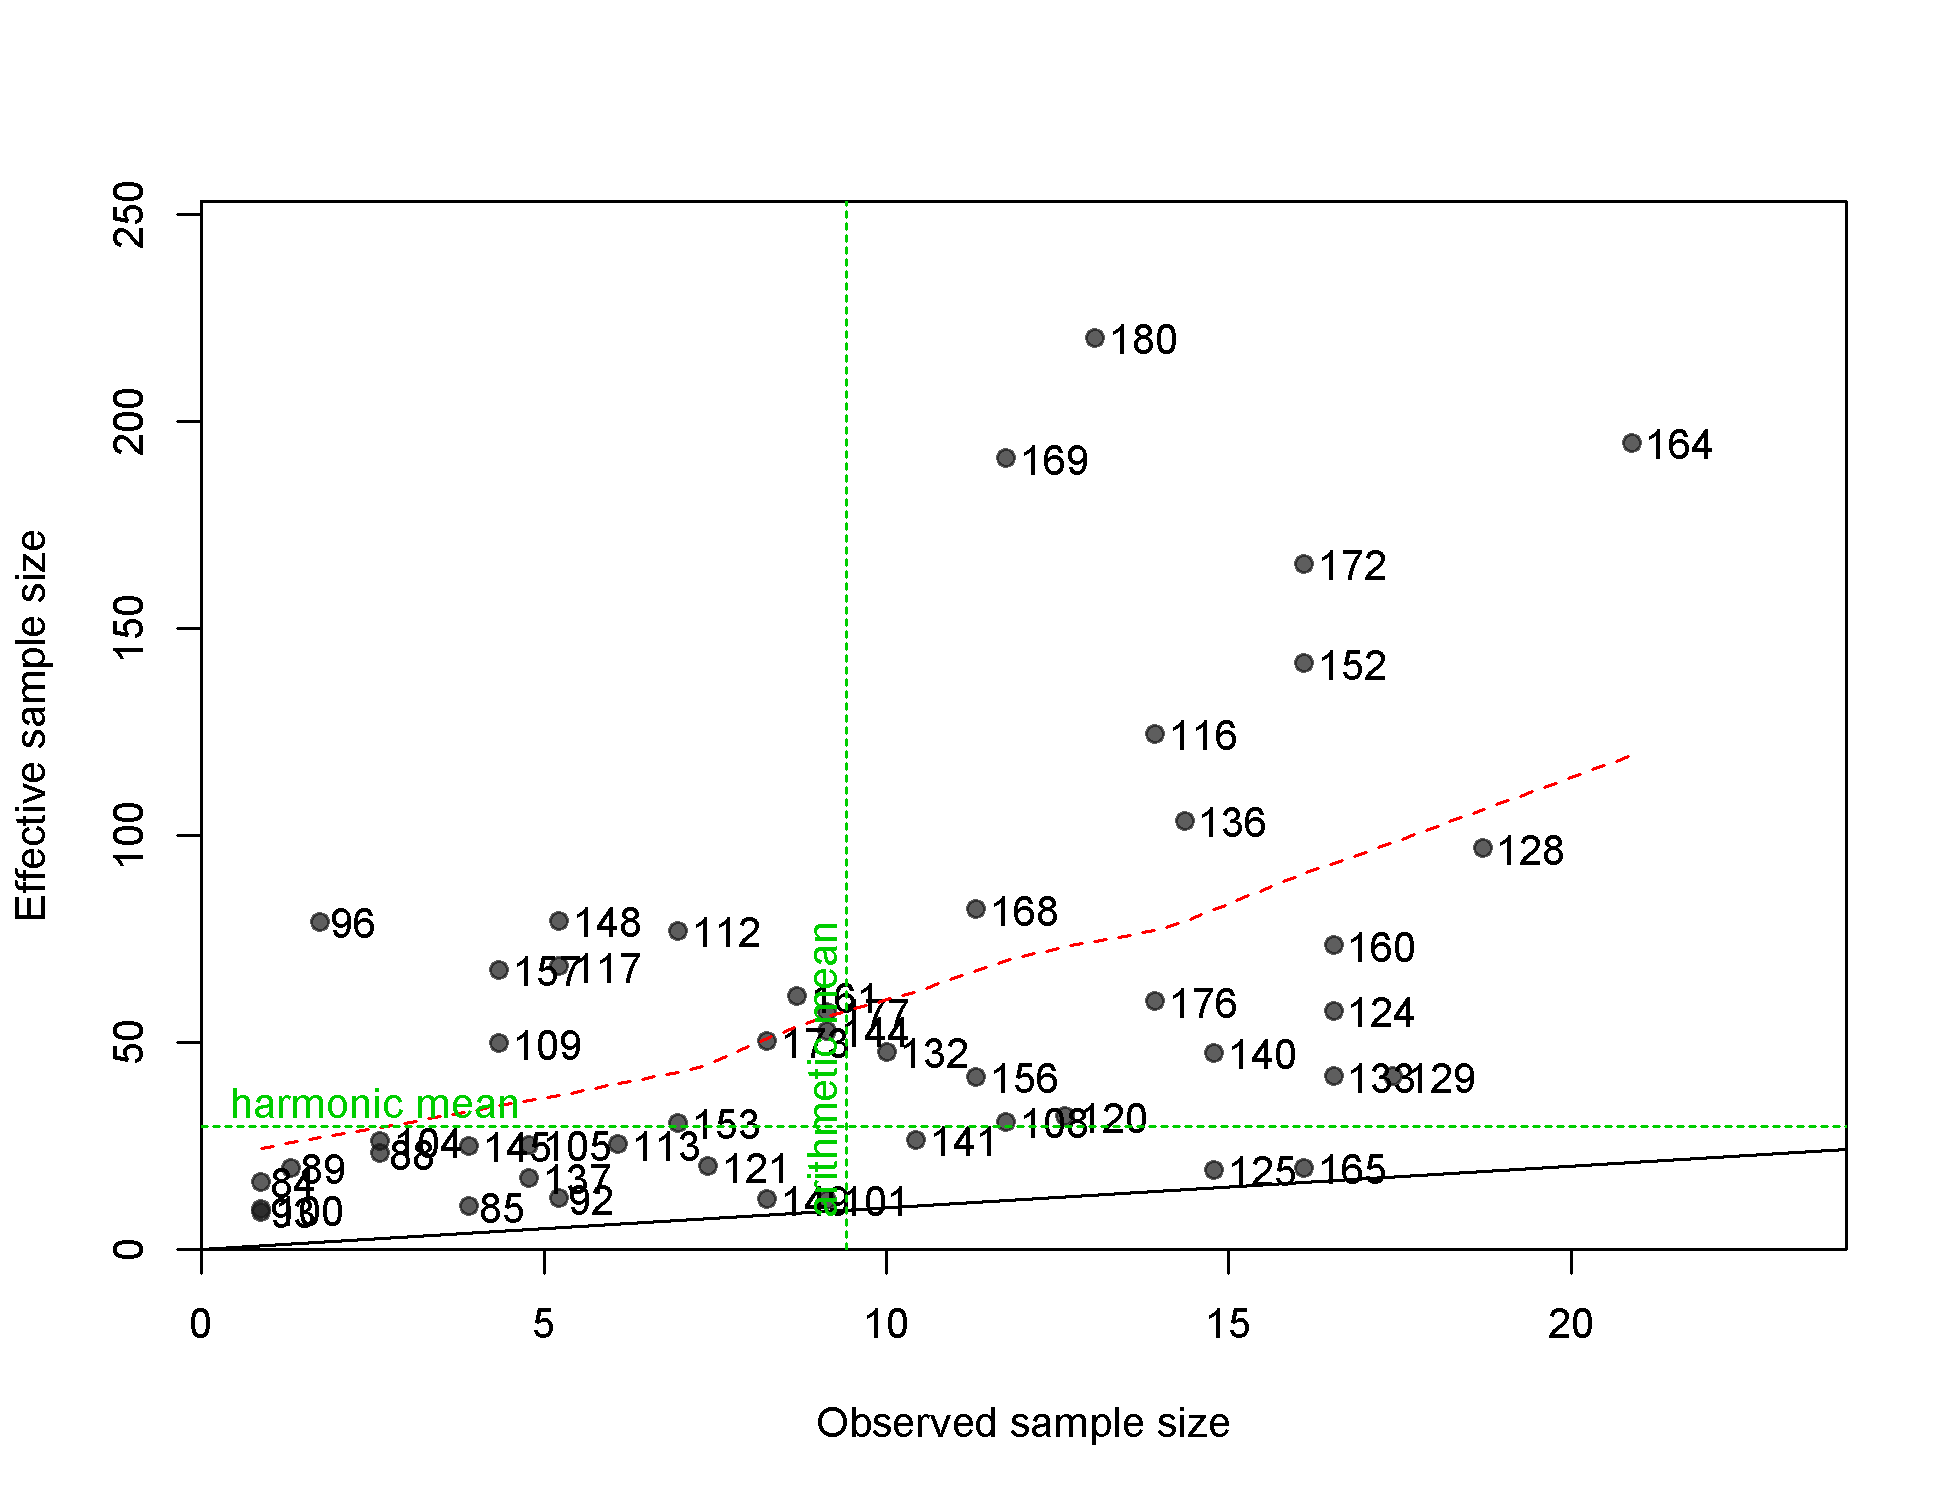
N-EffN comparison, Length comps, whole catch, F3-OBJ_C_Q14
file: comp_lenfit_sampsize_flt3mkt0.png
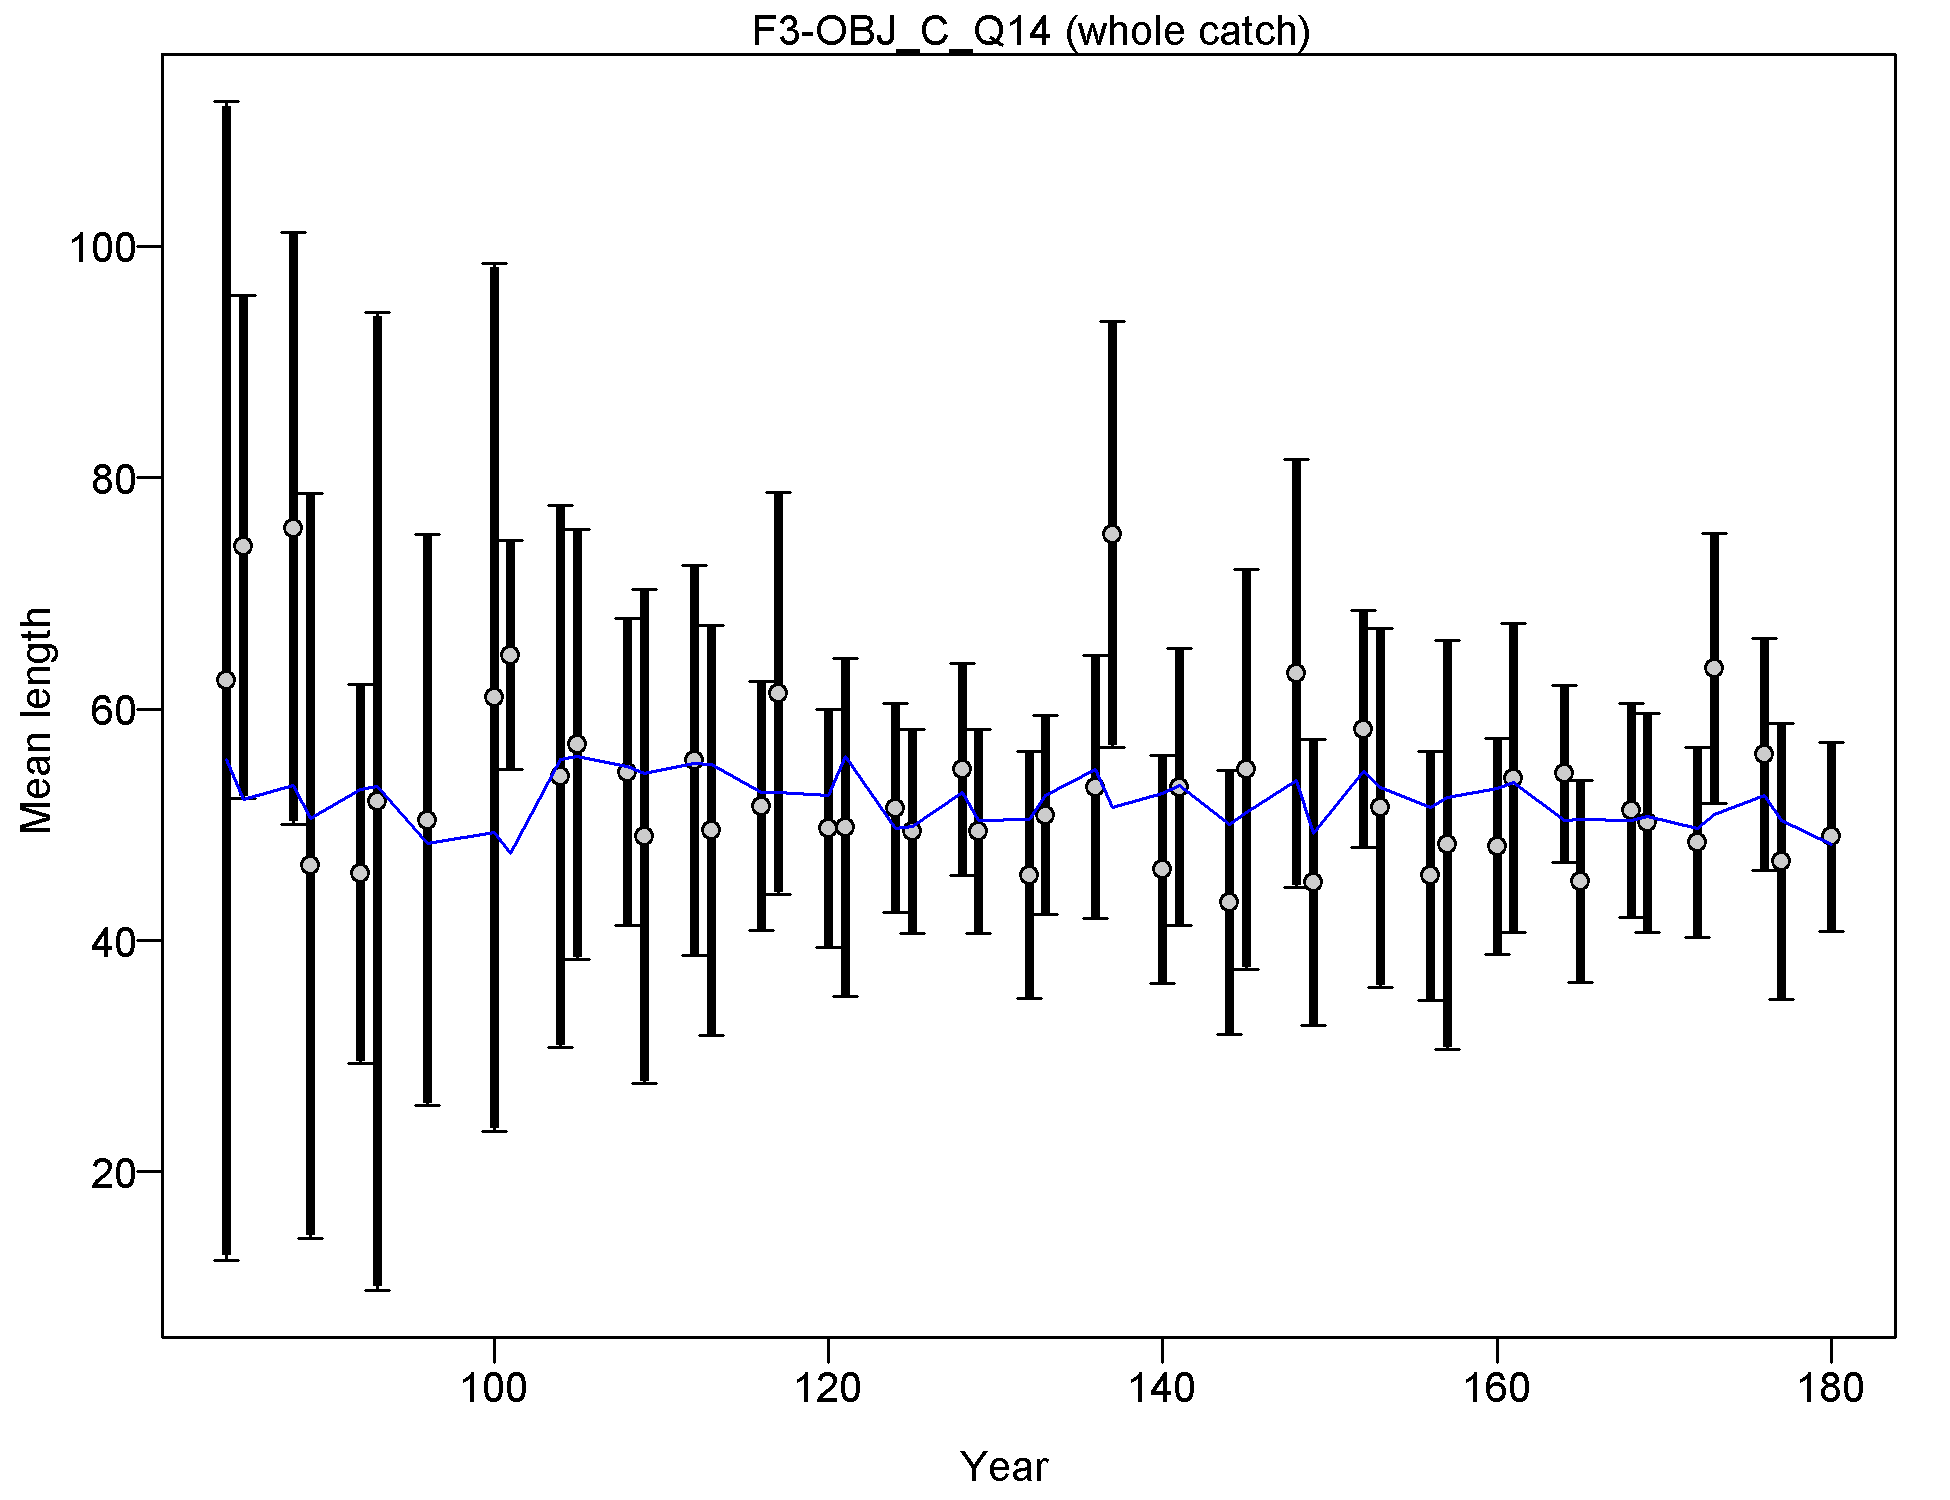
Mean length for F3-OBJ_C_Q14 with 95% confidence intervals based on current samples sizes.
Francis data weighting method TA1.8: thinner intervals (with capped ends) show result of further adjusting sample sizes based on suggested multiplier (with 95% interval) for len data from F3-OBJ_C_Q14:
0.9848 (0.6301-2.0175)
For more info, see
Francis, R.I.C.C. (2011). Data weighting in statistical fisheries stock assessment models. Can. J. Fish. Aquat. Sci. 68: 1124-1138. https://doi.org/10.1139/f2011-025
file: comp_lenfit_data_weighting_TA1.8_F3-OBJ_C_Q14.png
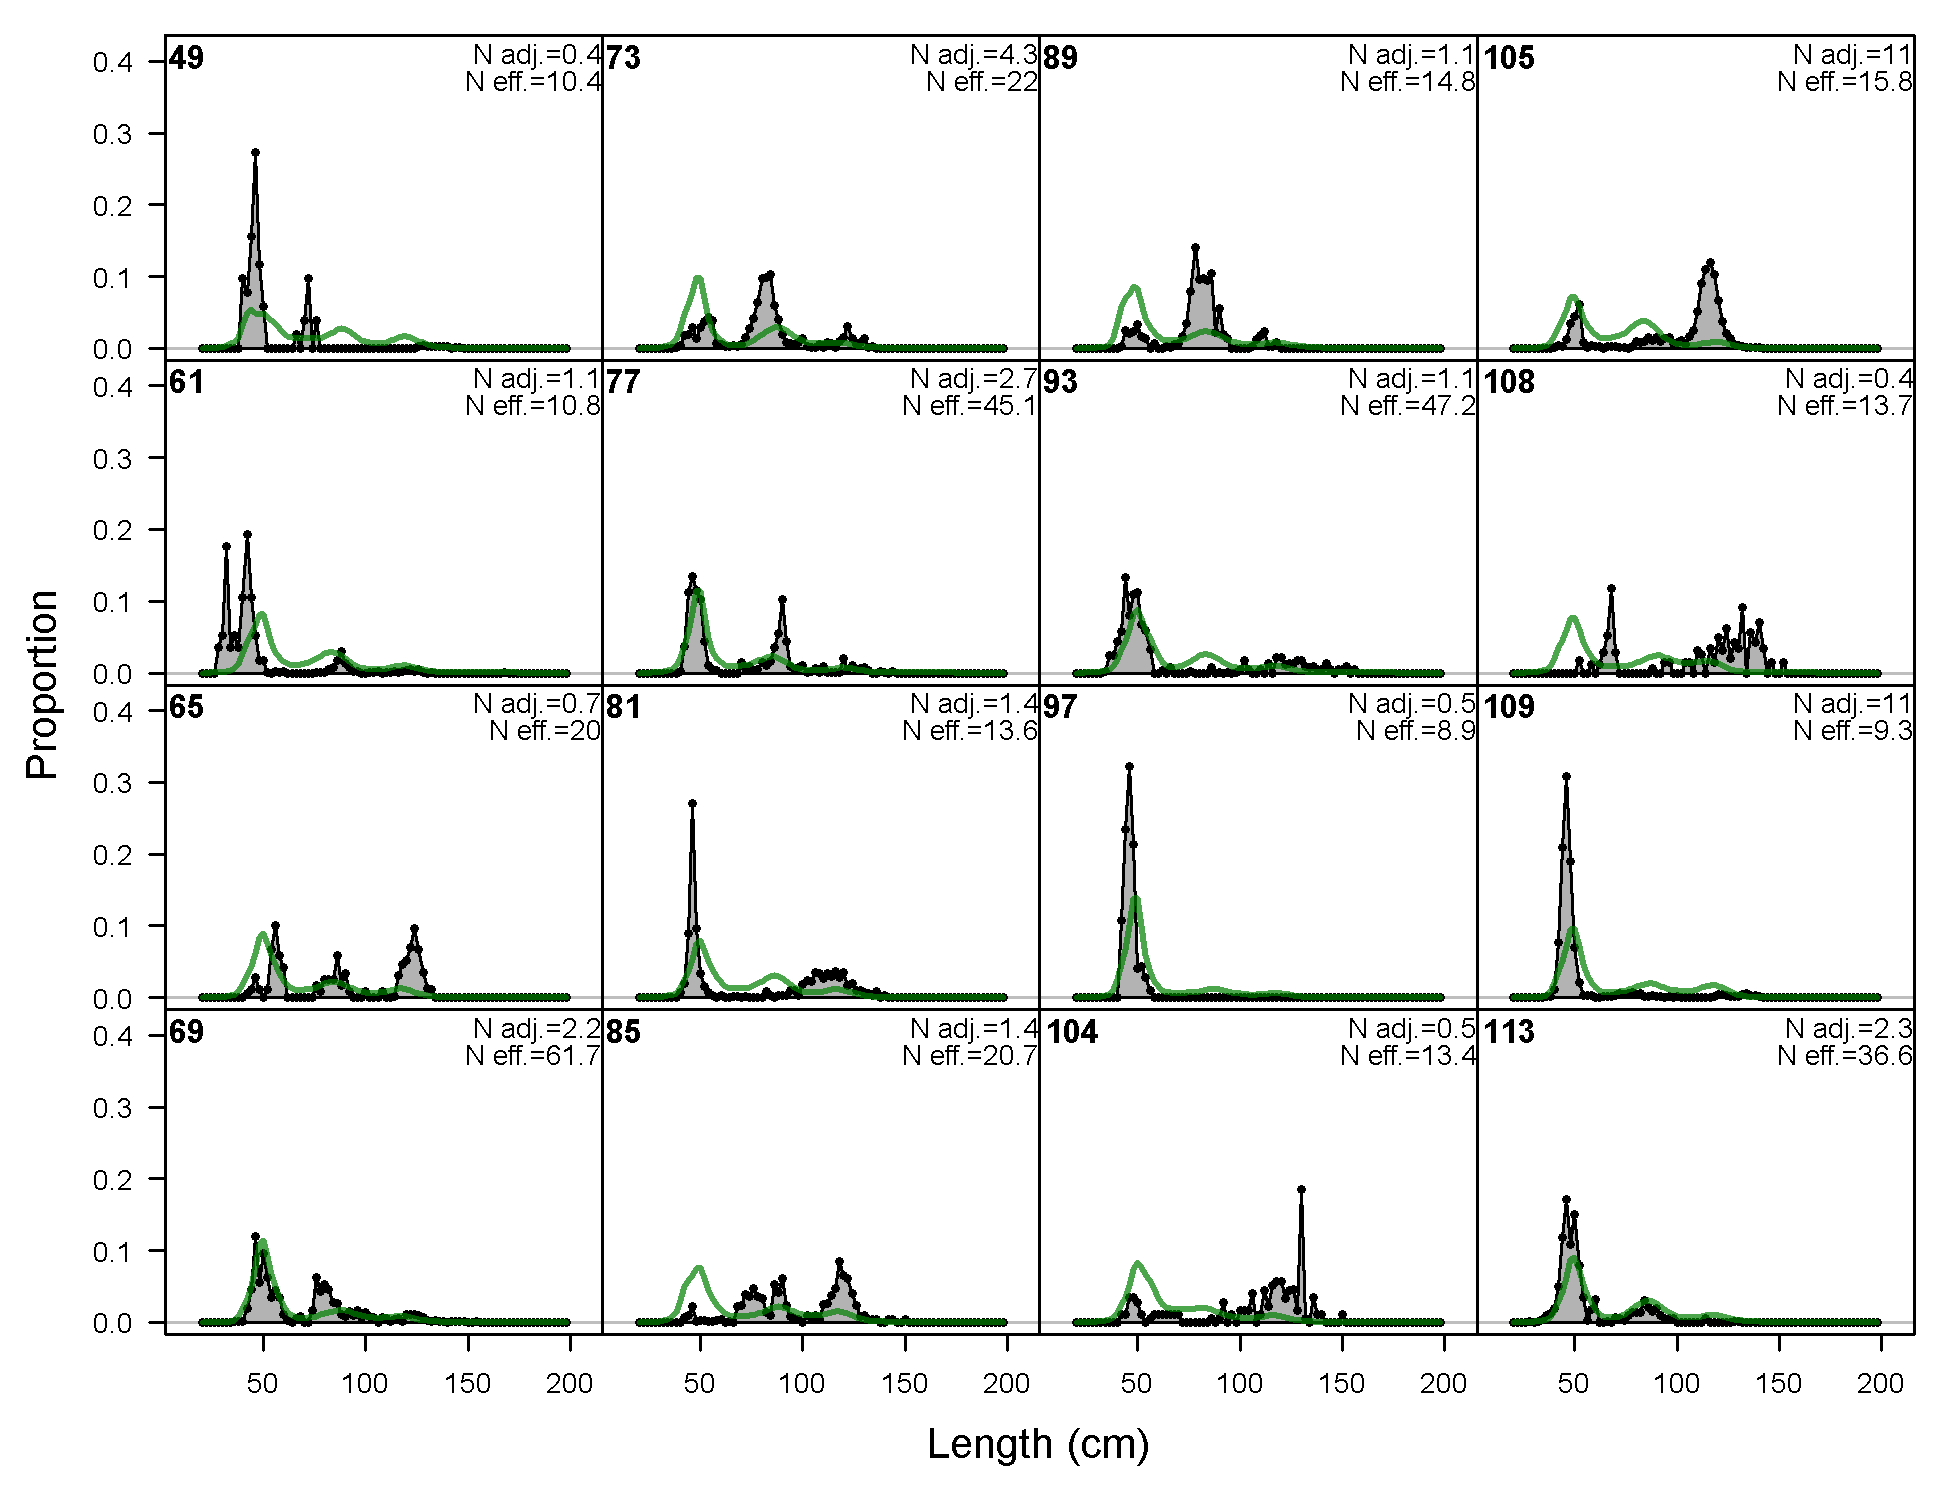
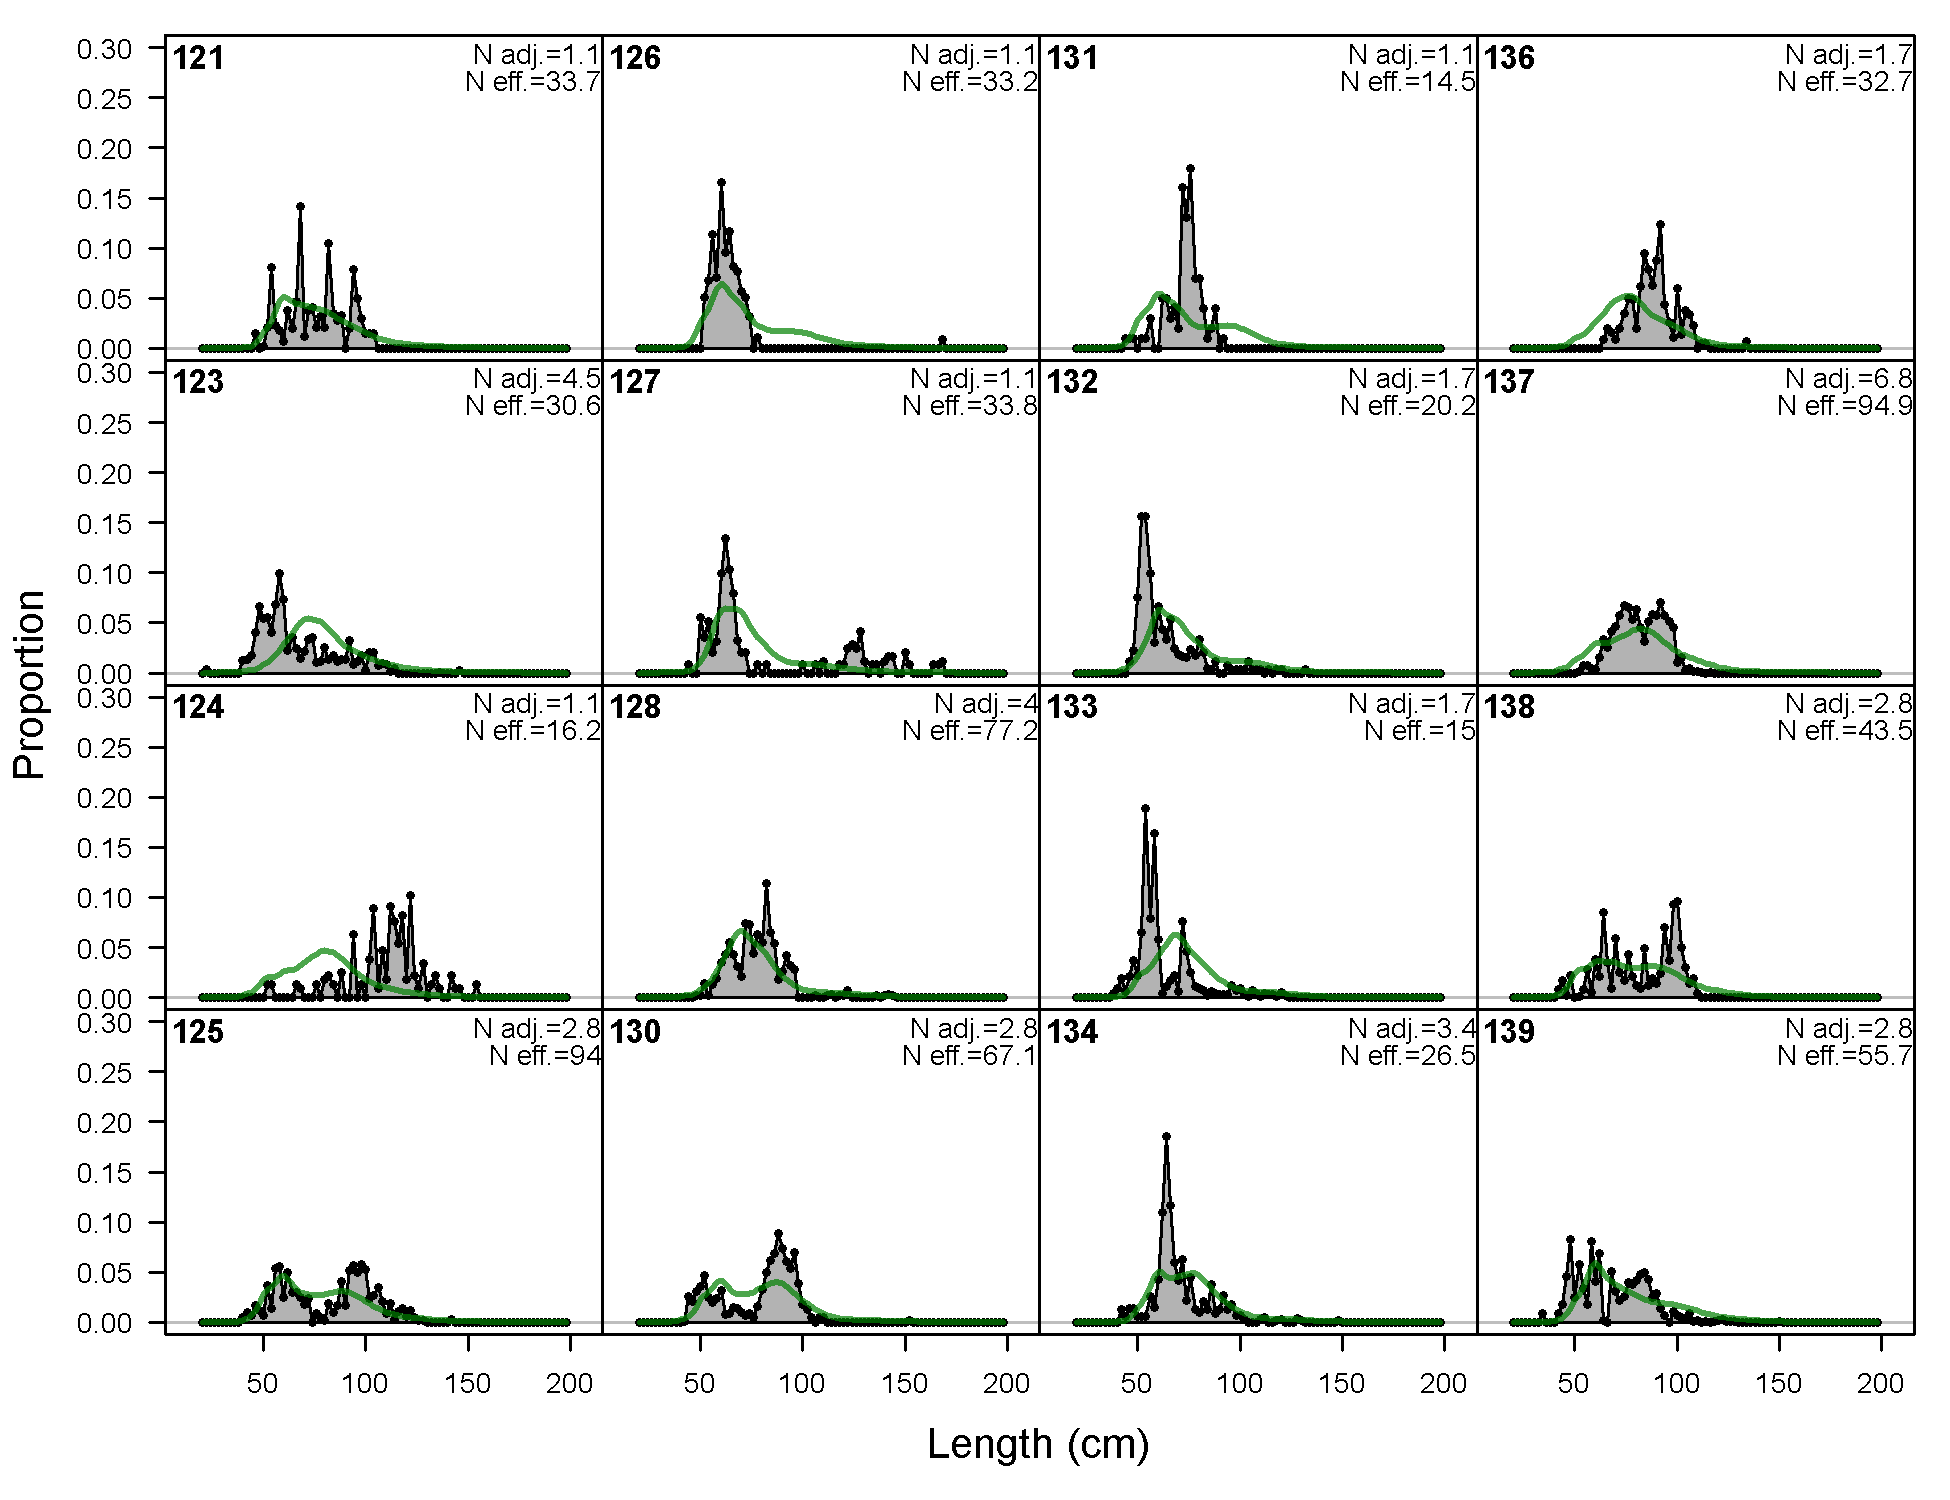
Length comps, whole catch, F4-OBJ_Cc_Q14 (plot 1 of 3).
'N adj.' is the input sample size after data-weighting adjustment. N eff. is the calculated effective sample size used in the McAllister-Iannelli tuning method.
file: comp_lenfit_flt4mkt0_page1.png
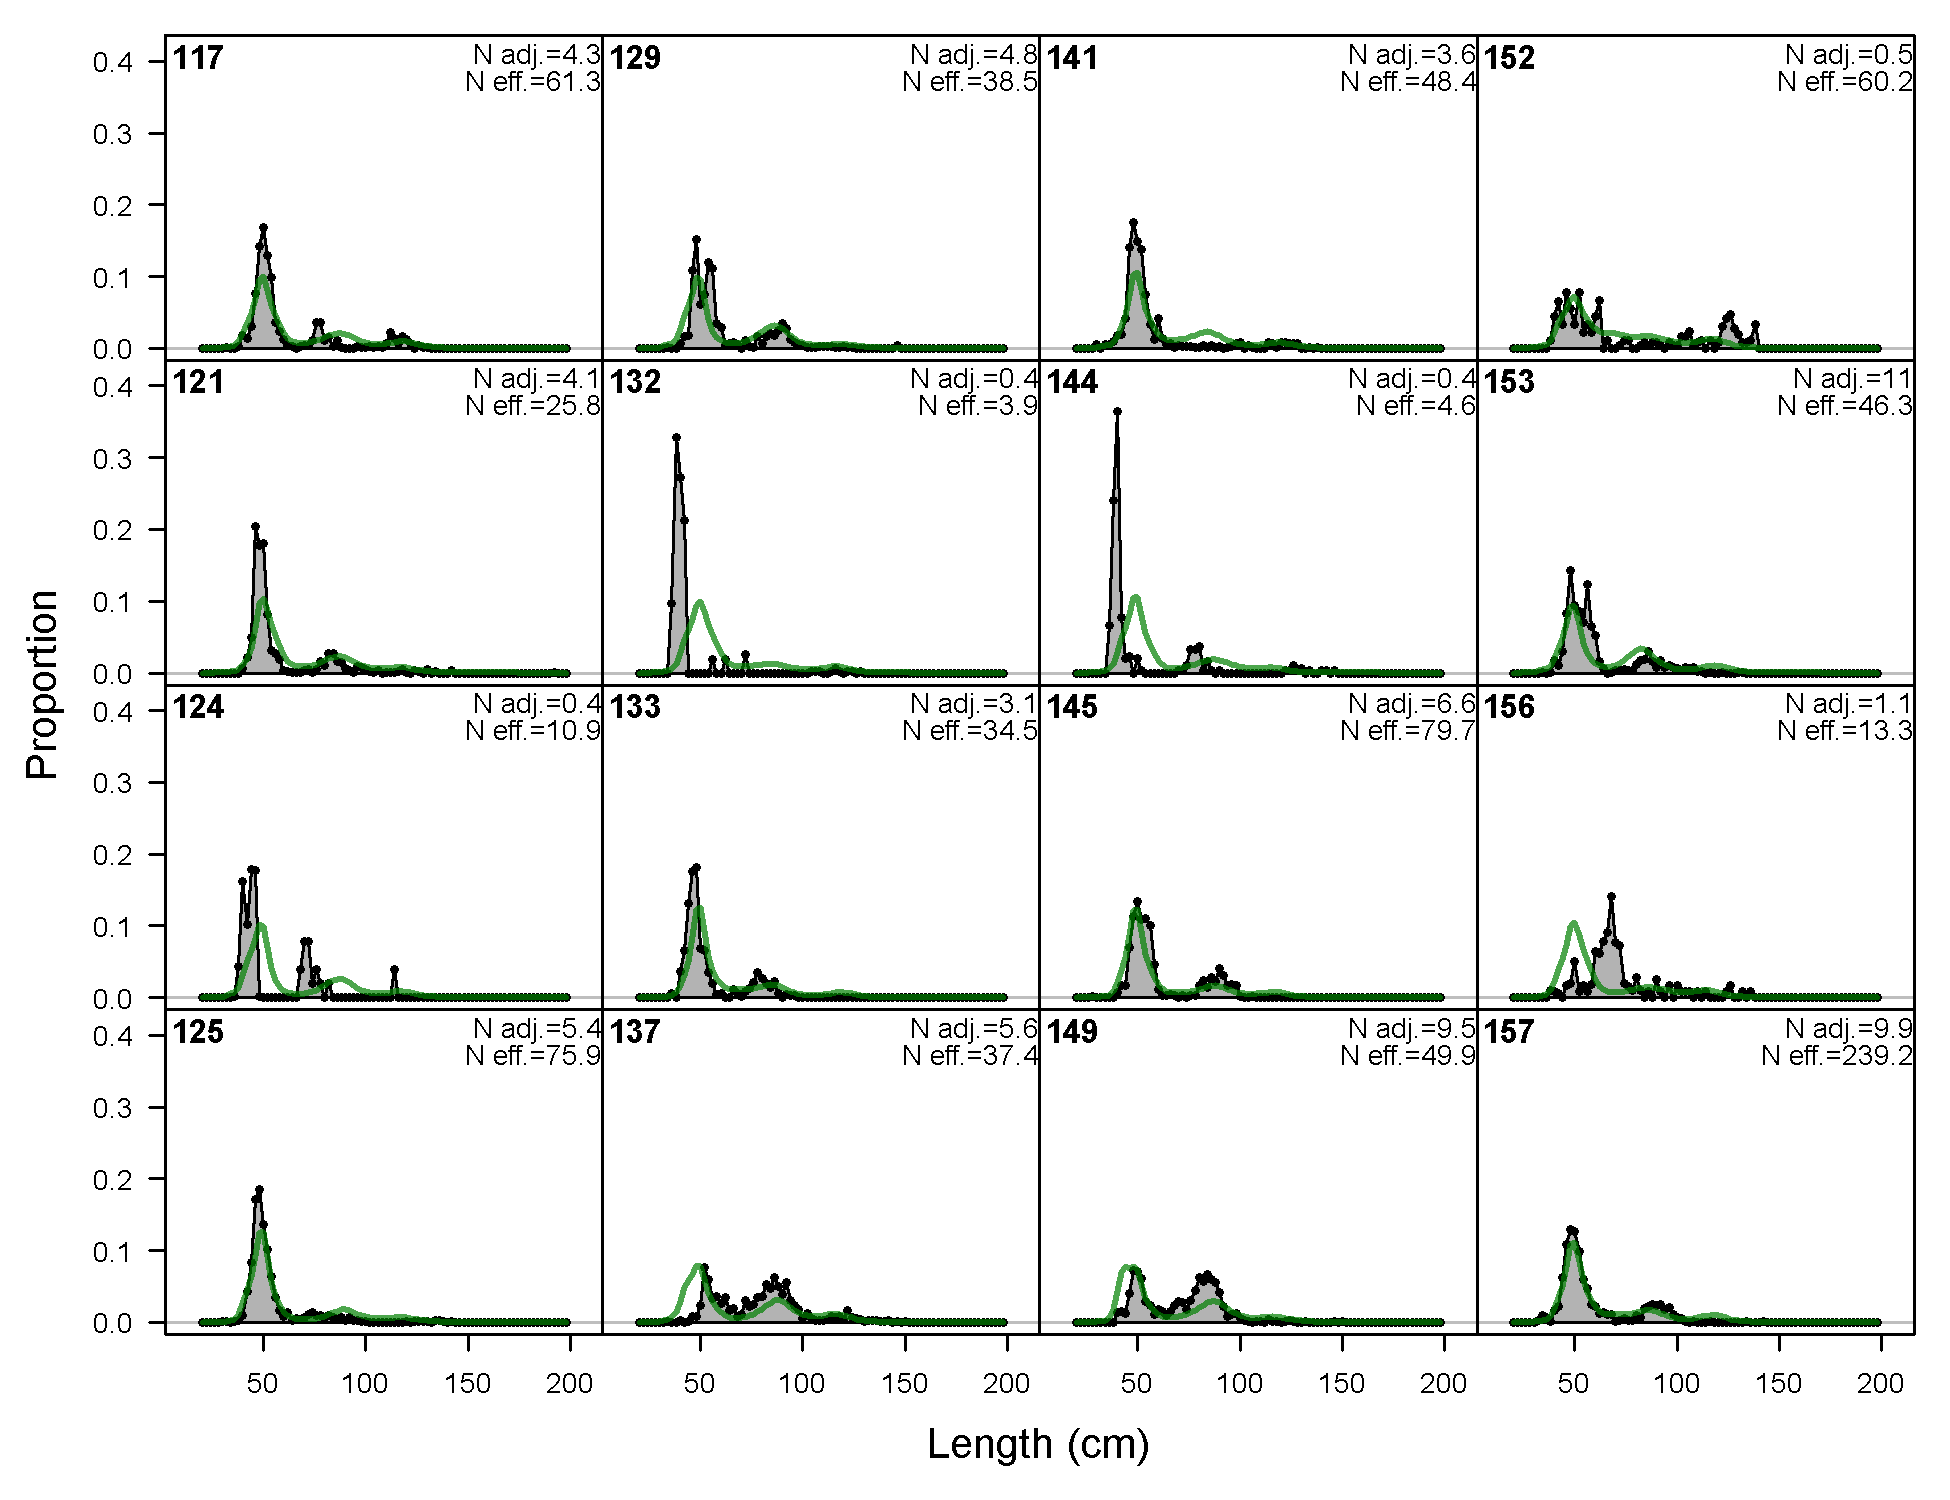
Length comps, whole catch, F4-OBJ_Cc_Q14 (plot 2 of 3)
file: comp_lenfit_flt4mkt0_page2.png
Length comps, whole catch, F4-OBJ_Cc_Q14 (plot 3 of 3)
file: comp_lenfit_flt4mkt0_page3.png
Pearson residuals, whole catch, F4-OBJ_Cc_Q14 (max=2.79) (plot 3 of 3)
Closed bubbles are positive residuals (observed > expected) and open bubbles are negative residuals (observed < expected).
file: comp_lenfit_residsflt4mkt0_page3.png
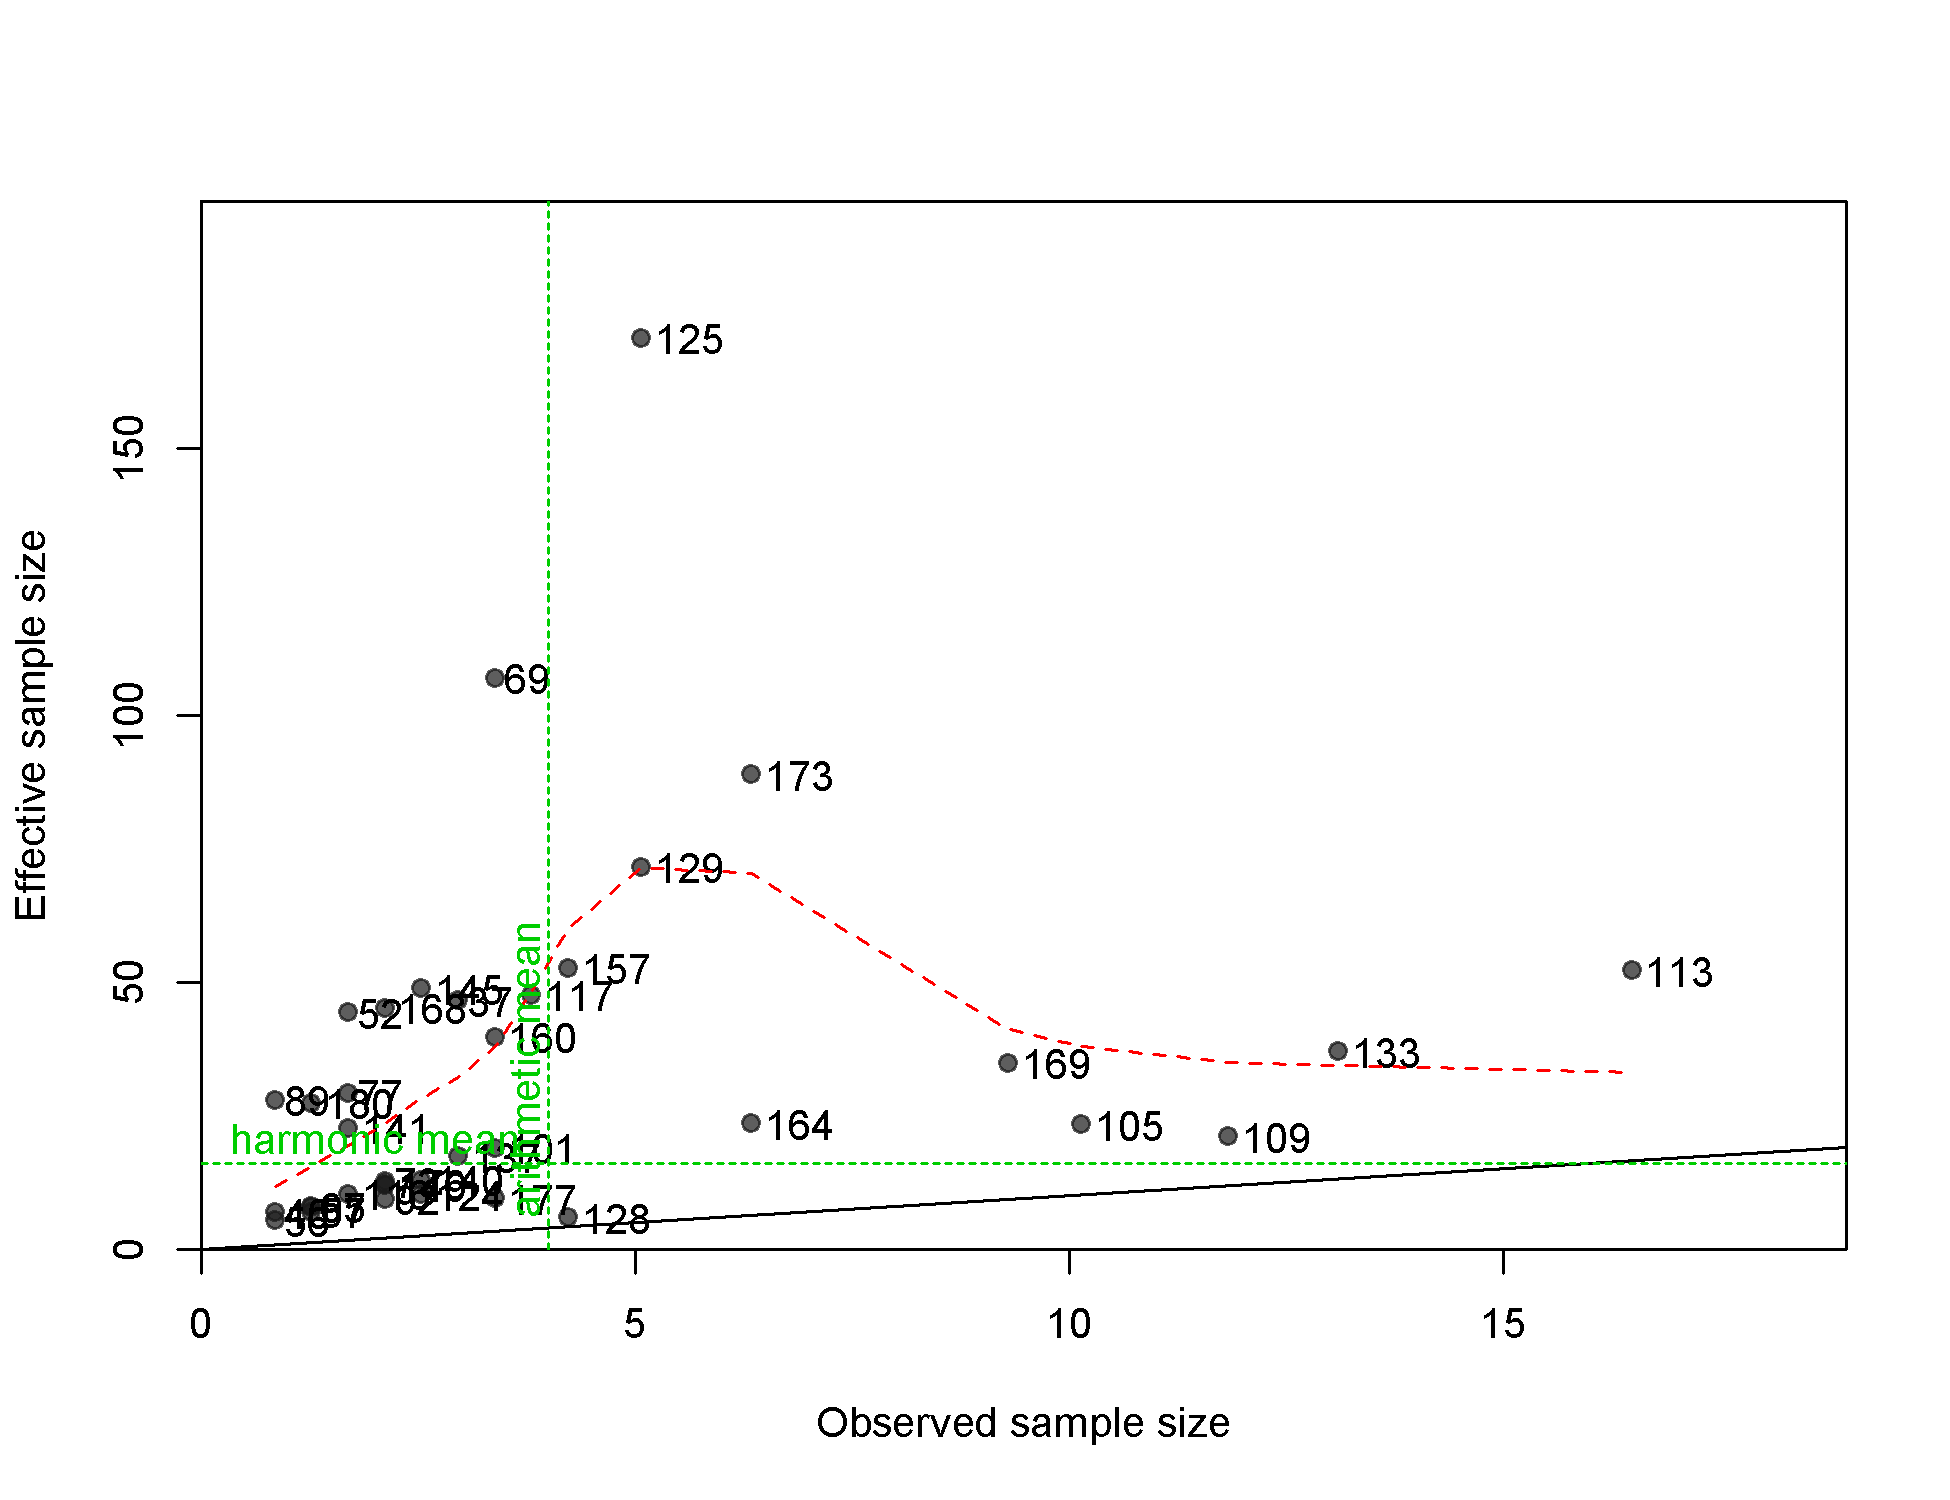
N-EffN comparison, Length comps, whole catch, F4-OBJ_Cc_Q14
file: comp_lenfit_sampsize_flt4mkt0.png
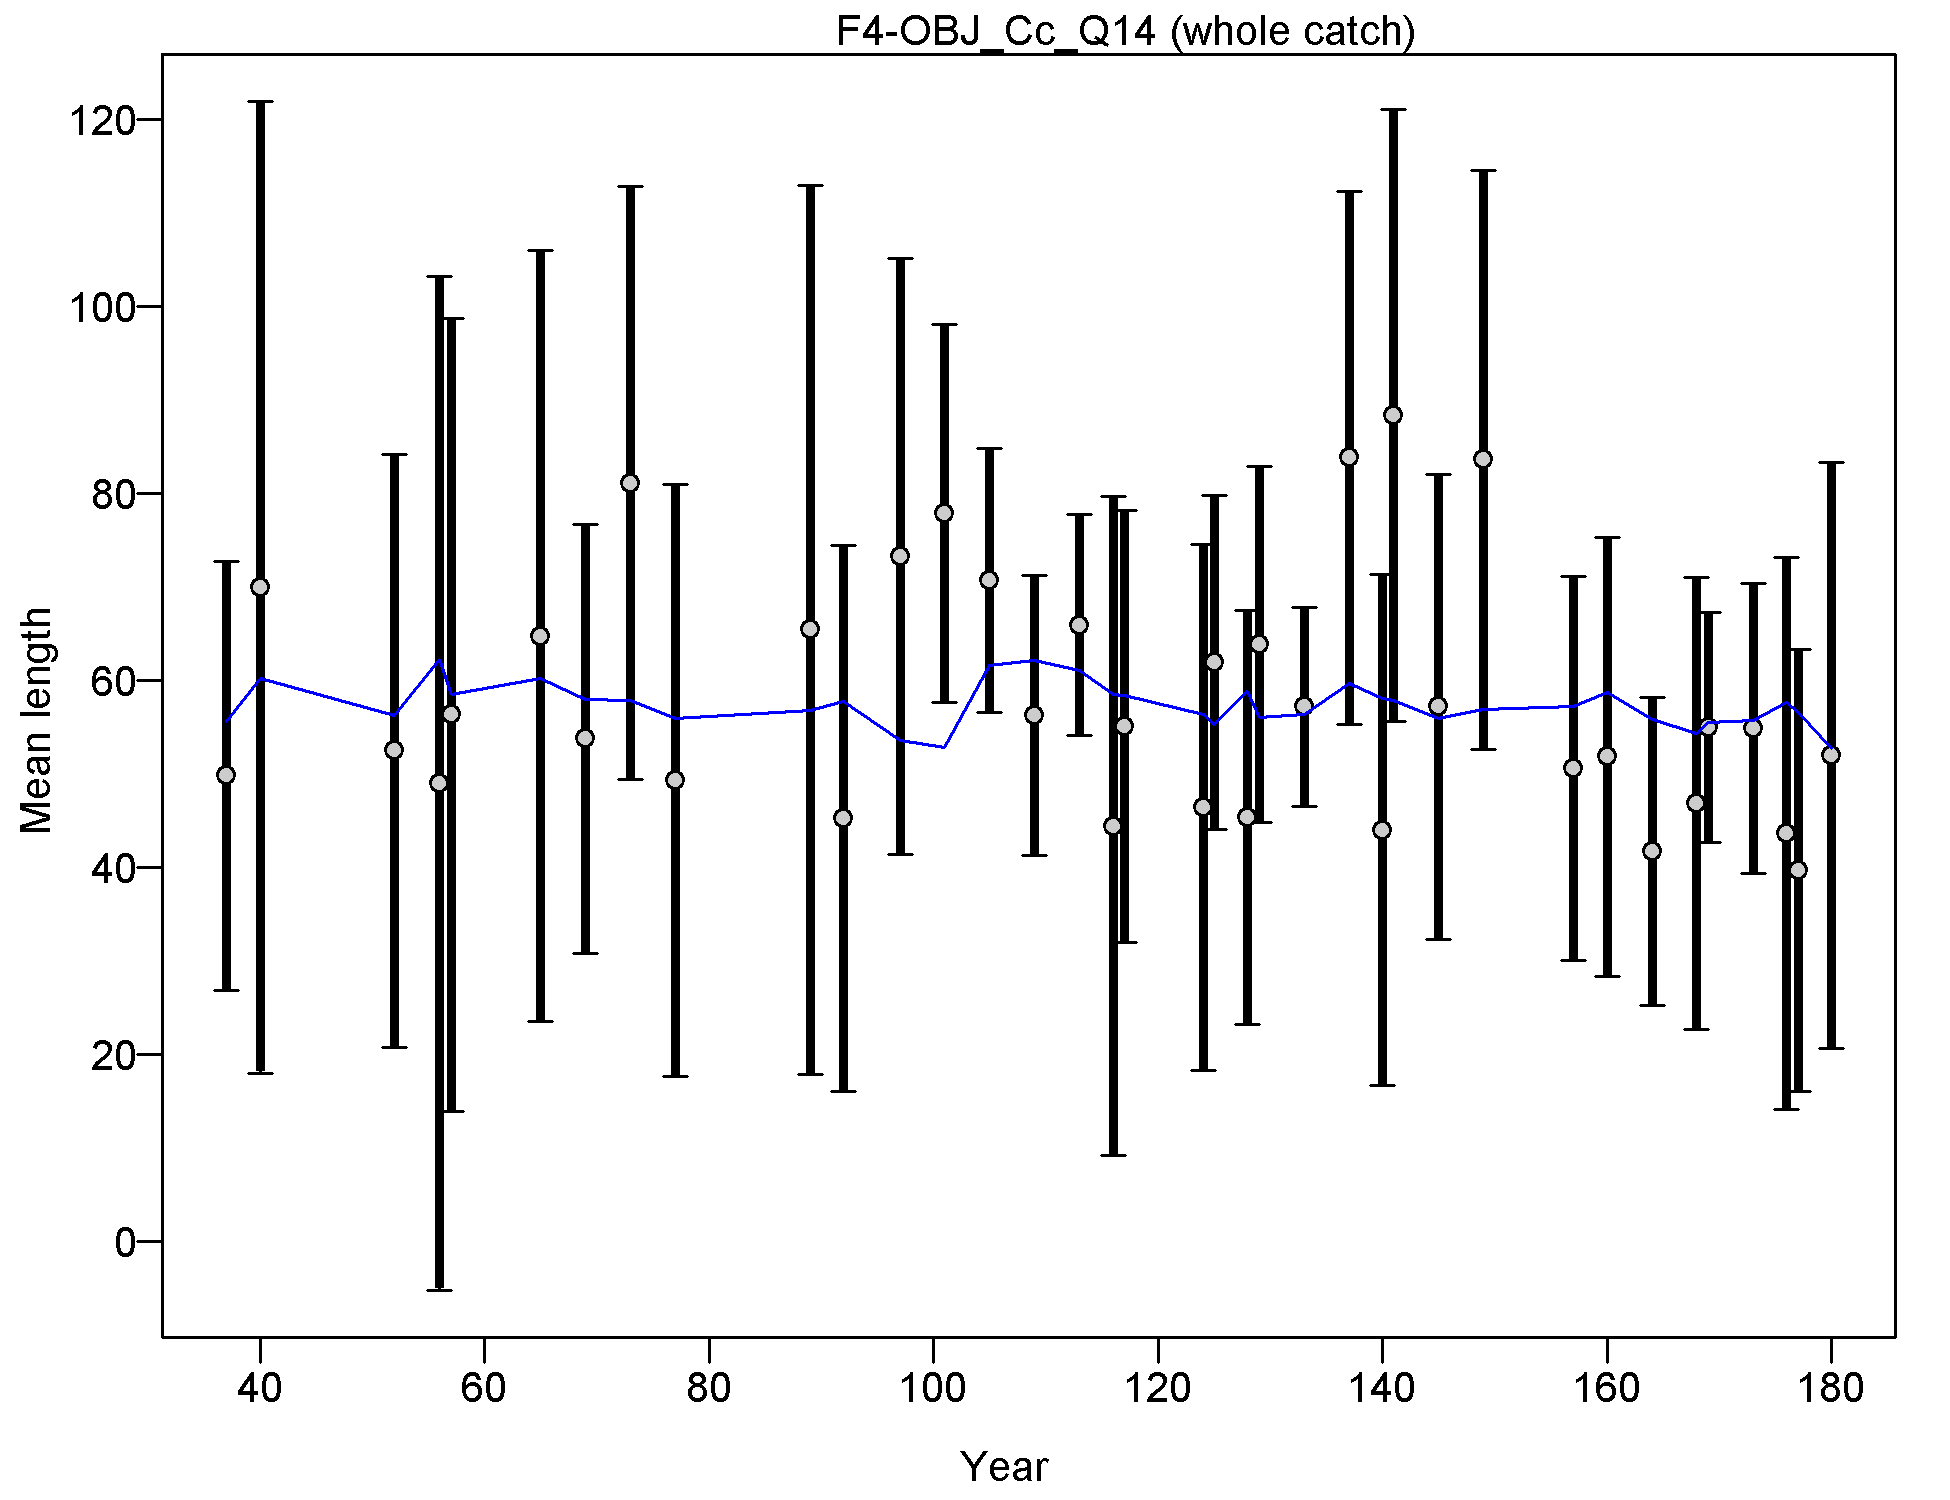
Mean length for F4-OBJ_Cc_Q14 with 95% confidence intervals based on current samples sizes.
Francis data weighting method TA1.8: thinner intervals (with capped ends) show result of further adjusting sample sizes based on suggested multiplier (with 95% interval) for len data from F4-OBJ_Cc_Q14:
0.9923 (0.7101-1.7952)
For more info, see
Francis, R.I.C.C. (2011). Data weighting in statistical fisheries stock assessment models. Can. J. Fish. Aquat. Sci. 68: 1124-1138. https://doi.org/10.1139/f2011-025
file: comp_lenfit_data_weighting_TA1.8_F4-OBJ_Cc_Q14.png
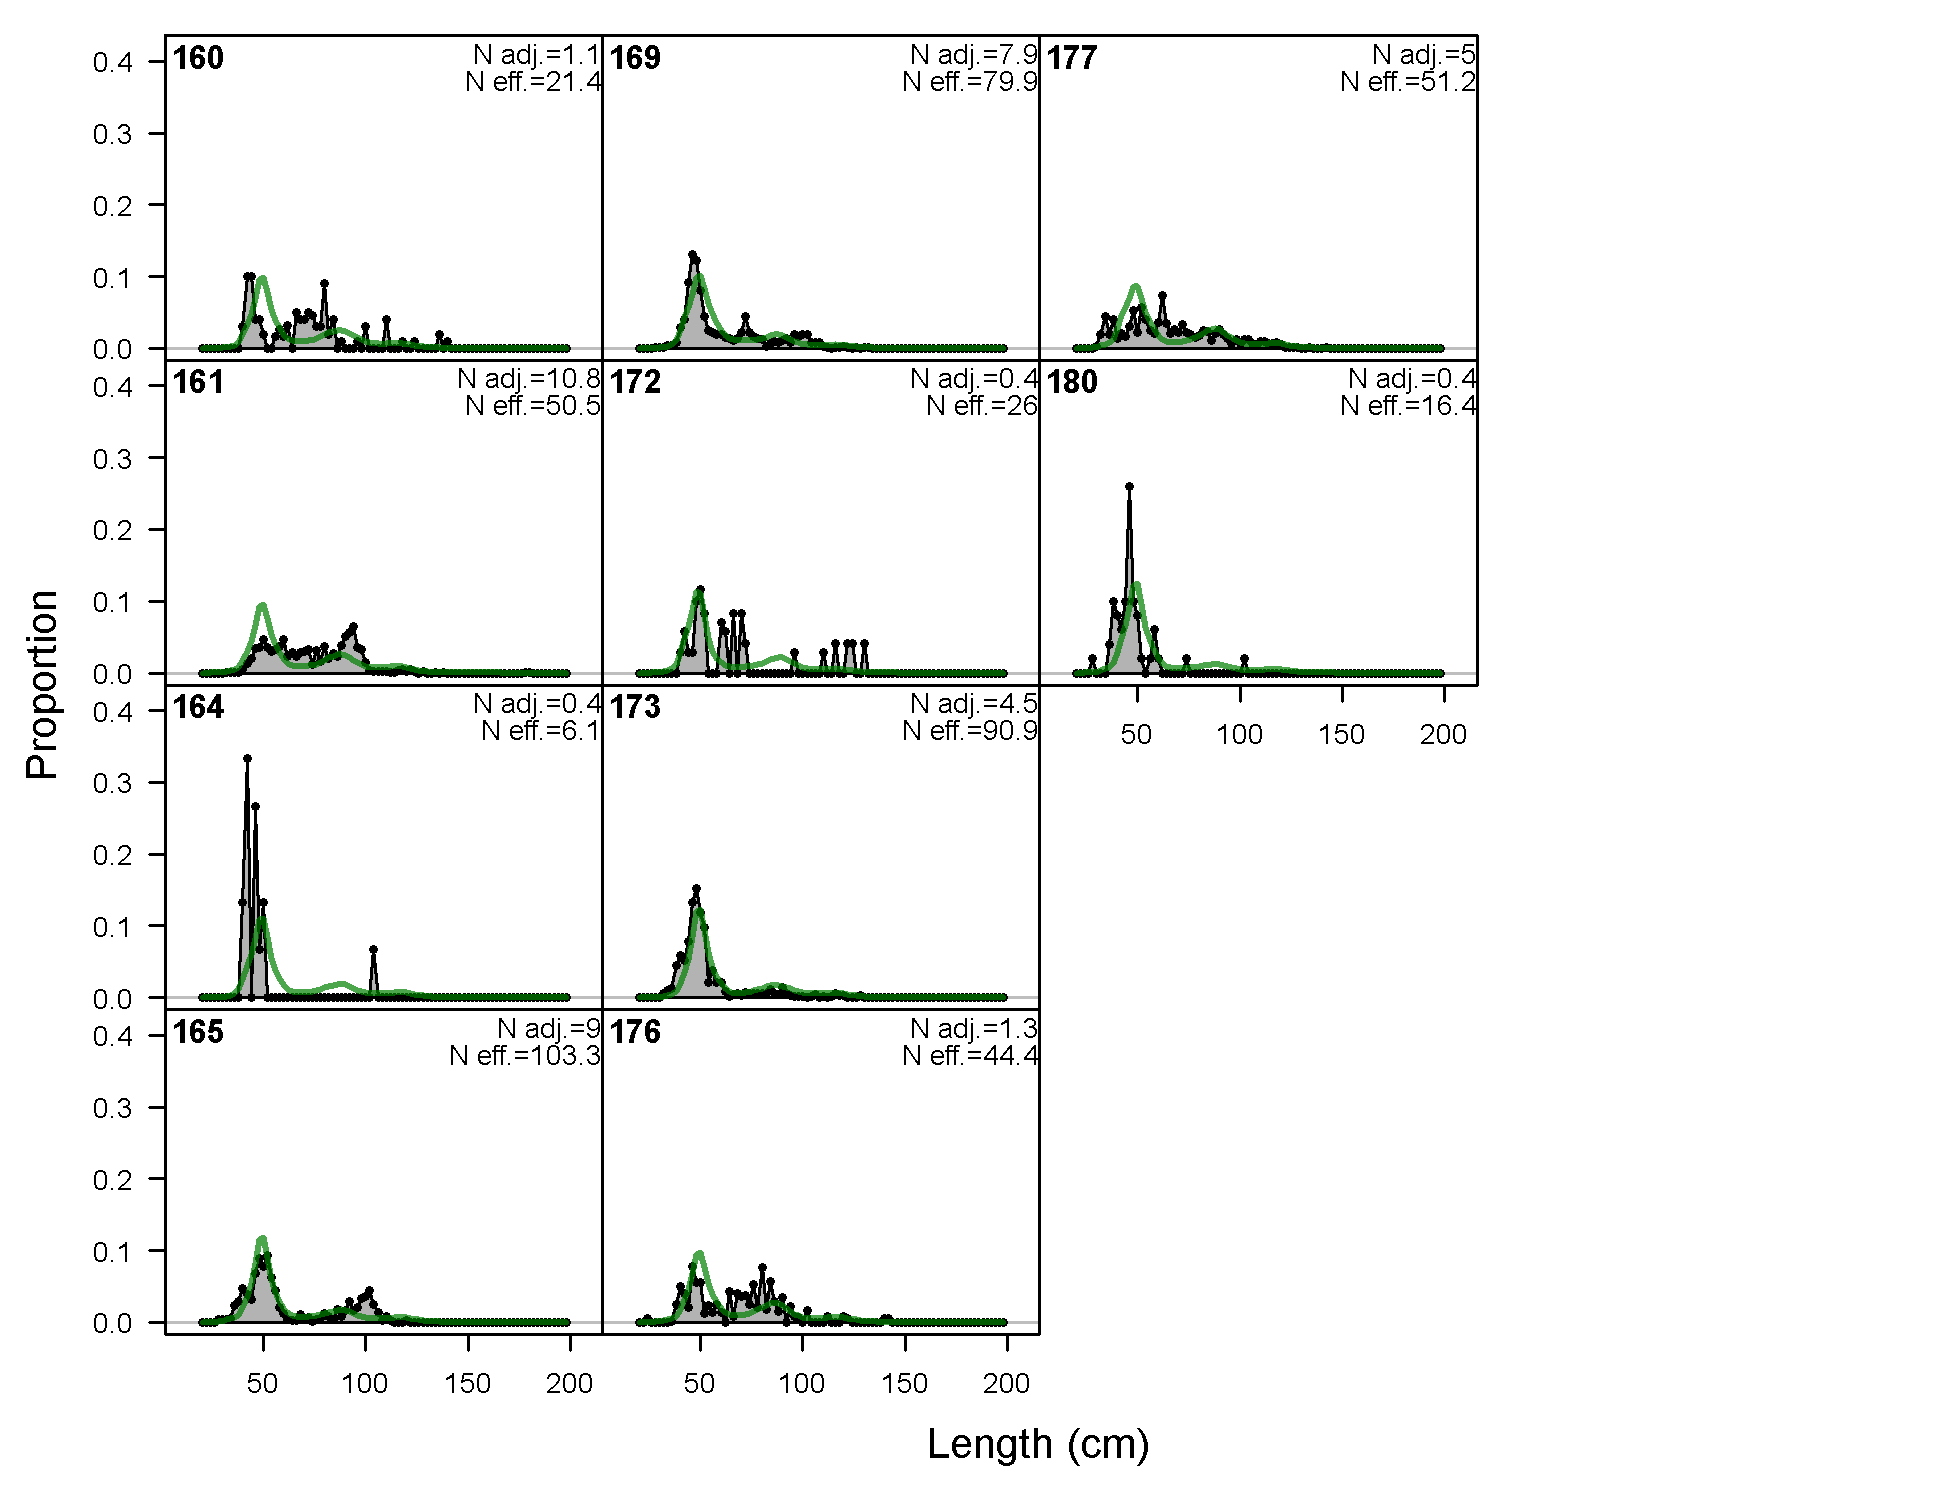
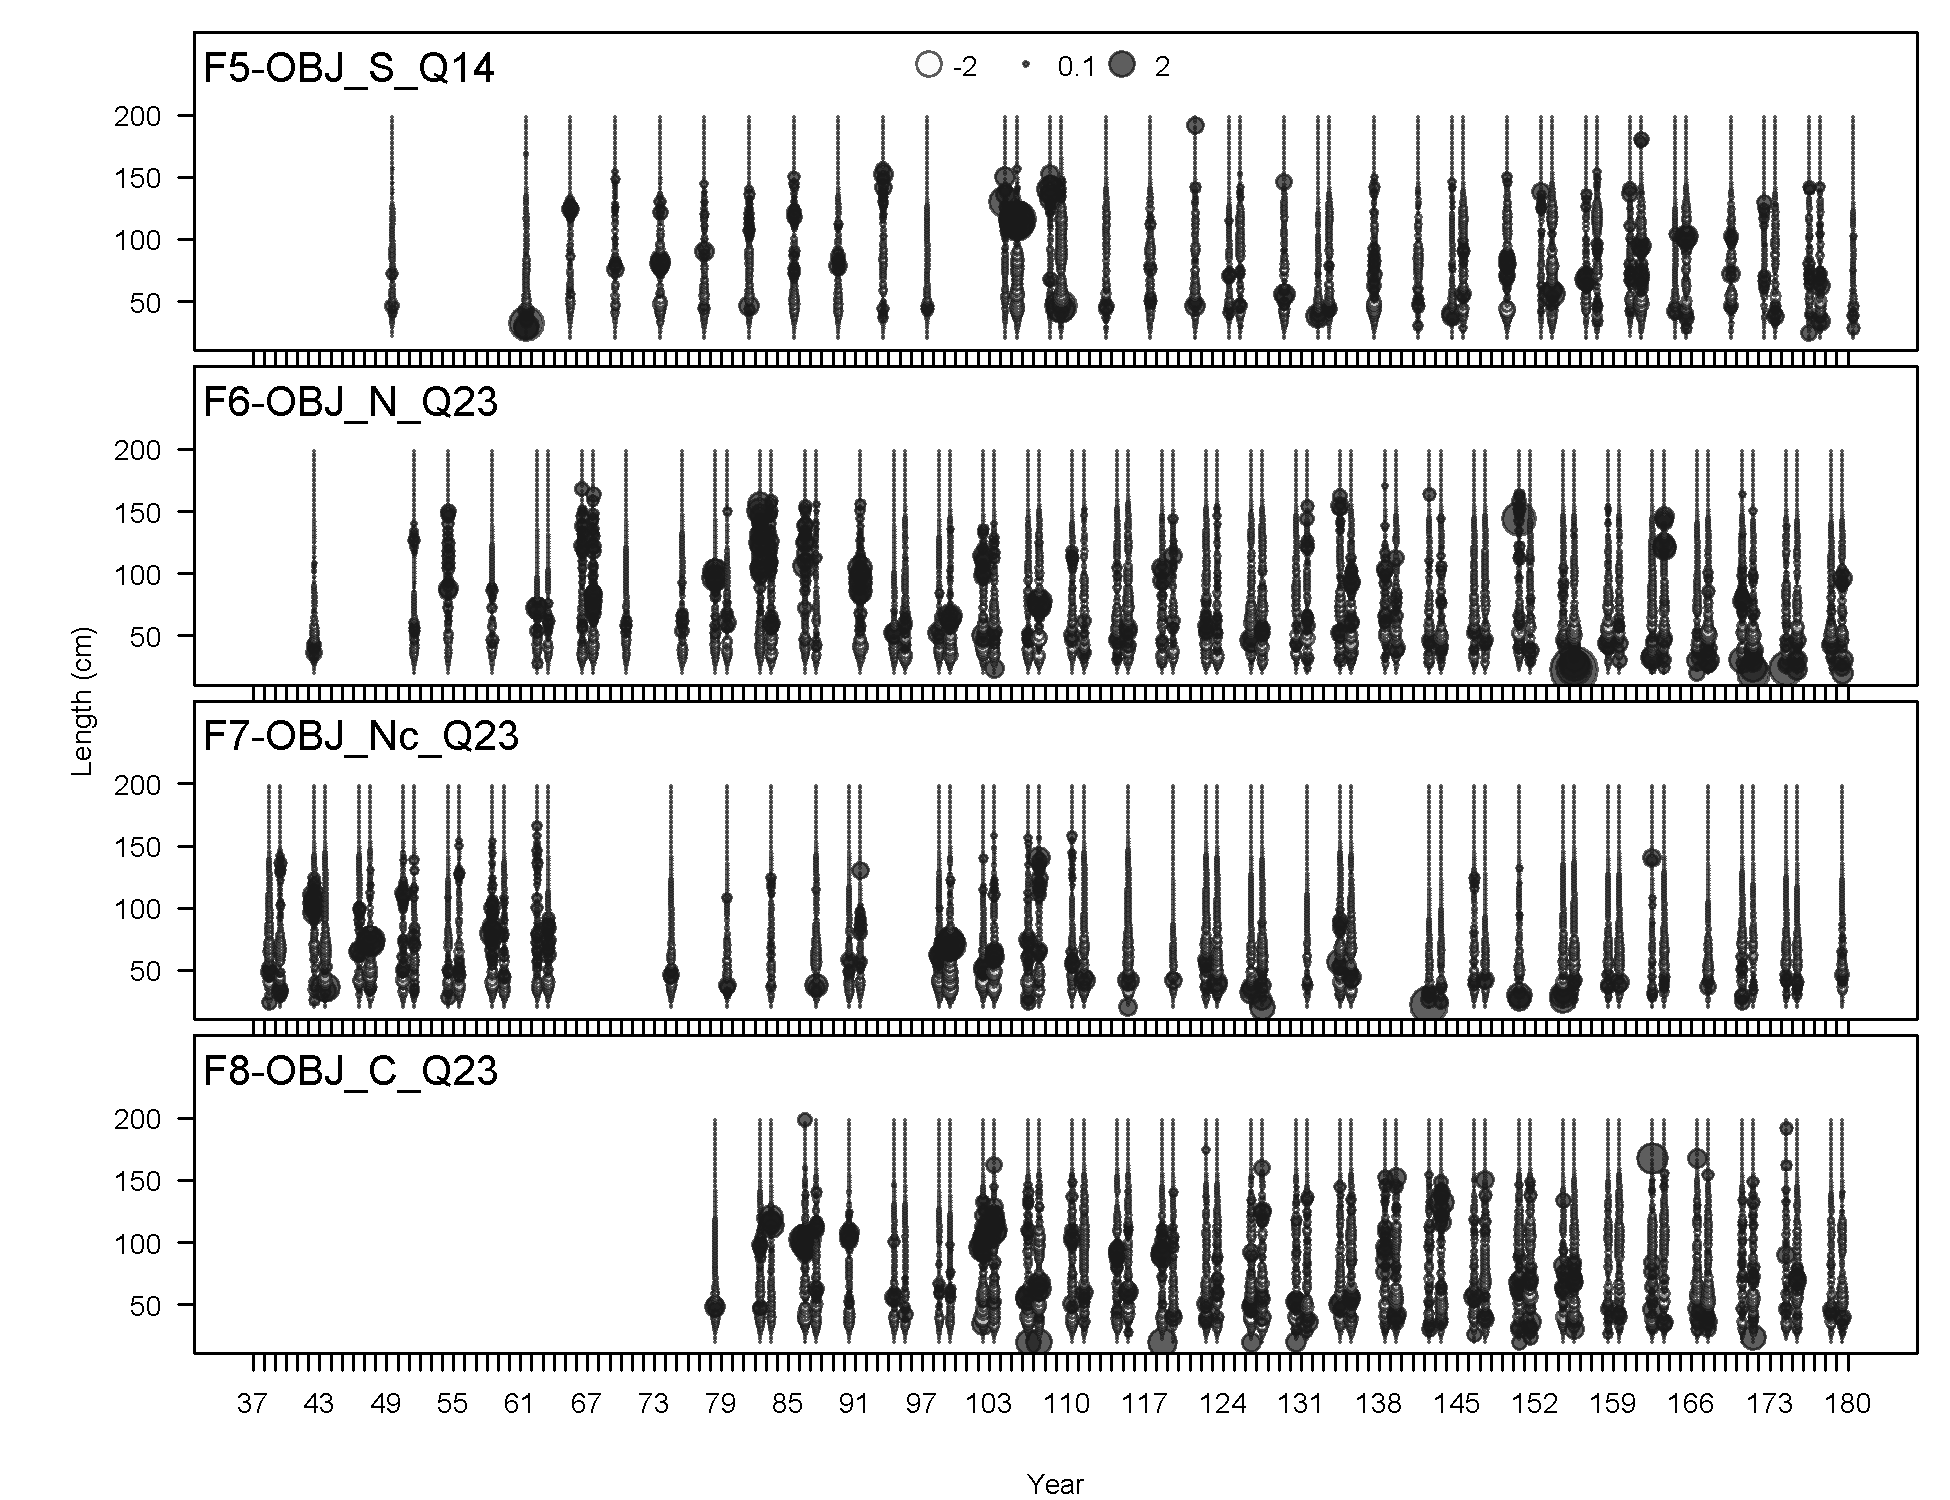
Length comps, whole catch, F5-OBJ_S_Q14 (plot 1 of 3).
'N adj.' is the input sample size after data-weighting adjustment. N eff. is the calculated effective sample size used in the McAllister-Iannelli tuning method.
file: comp_lenfit_flt5mkt0_page1.png
Length comps, whole catch, F5-OBJ_S_Q14 (plot 2 of 3)
file: comp_lenfit_flt5mkt0_page2.png
Length comps, whole catch, F5-OBJ_S_Q14 (plot 3 of 3)
file: comp_lenfit_flt5mkt0_page3.png
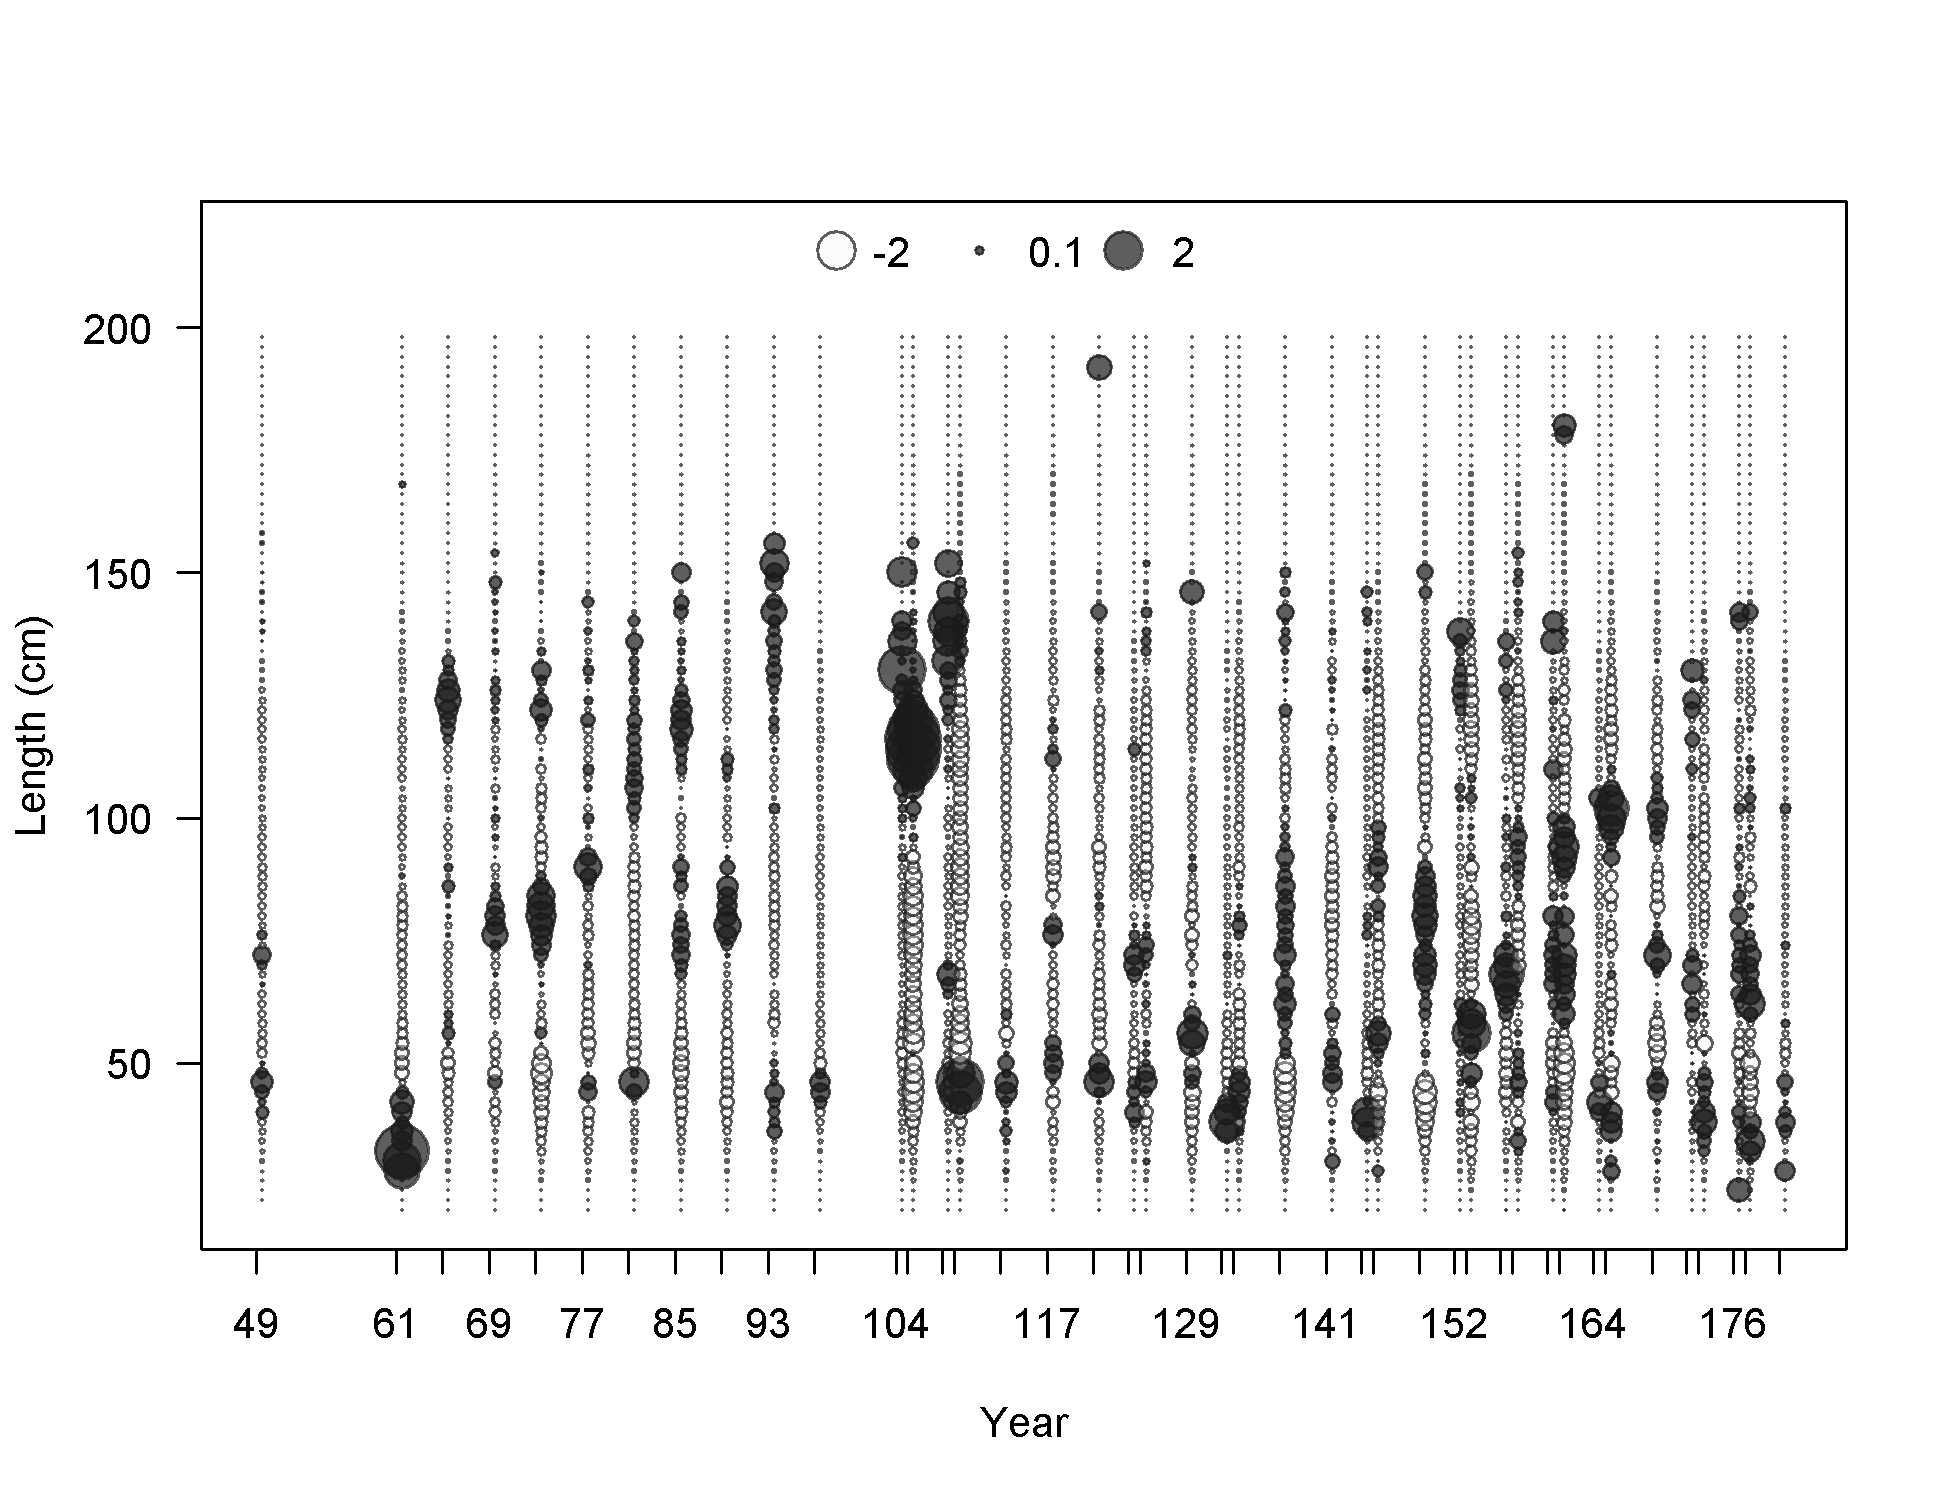
Pearson residuals, whole catch, F5-OBJ_S_Q14 (max=4.03) (plot 3 of 3)
Closed bubbles are positive residuals (observed > expected) and open bubbles are negative residuals (observed < expected).
file: comp_lenfit_residsflt5mkt0_page3.png
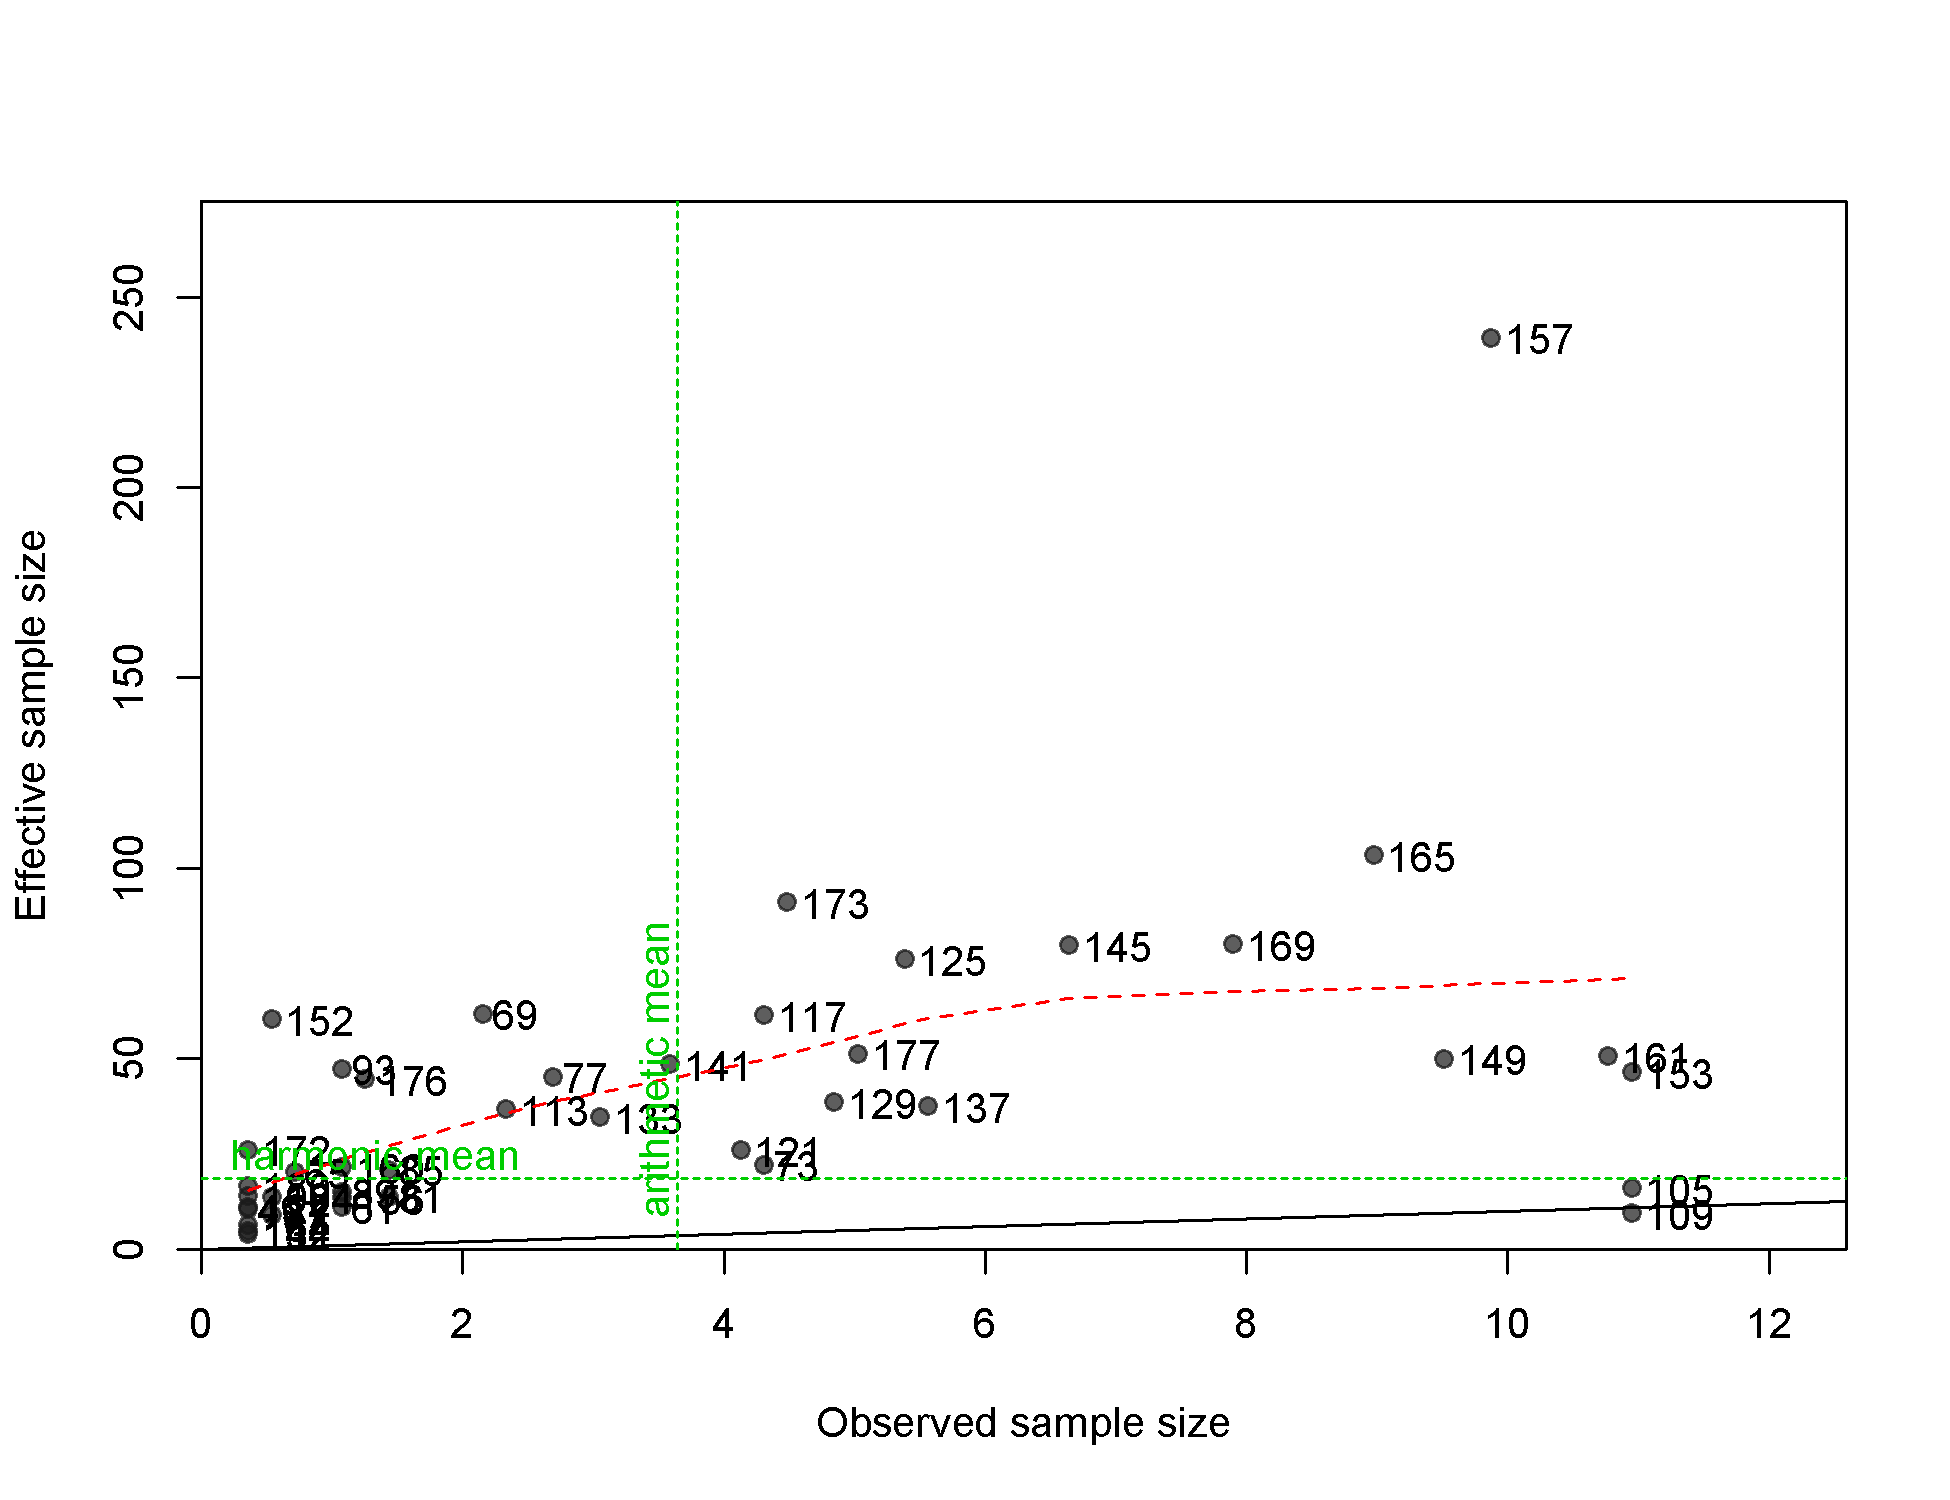
N-EffN comparison, Length comps, whole catch, F5-OBJ_S_Q14
file: comp_lenfit_sampsize_flt5mkt0.png
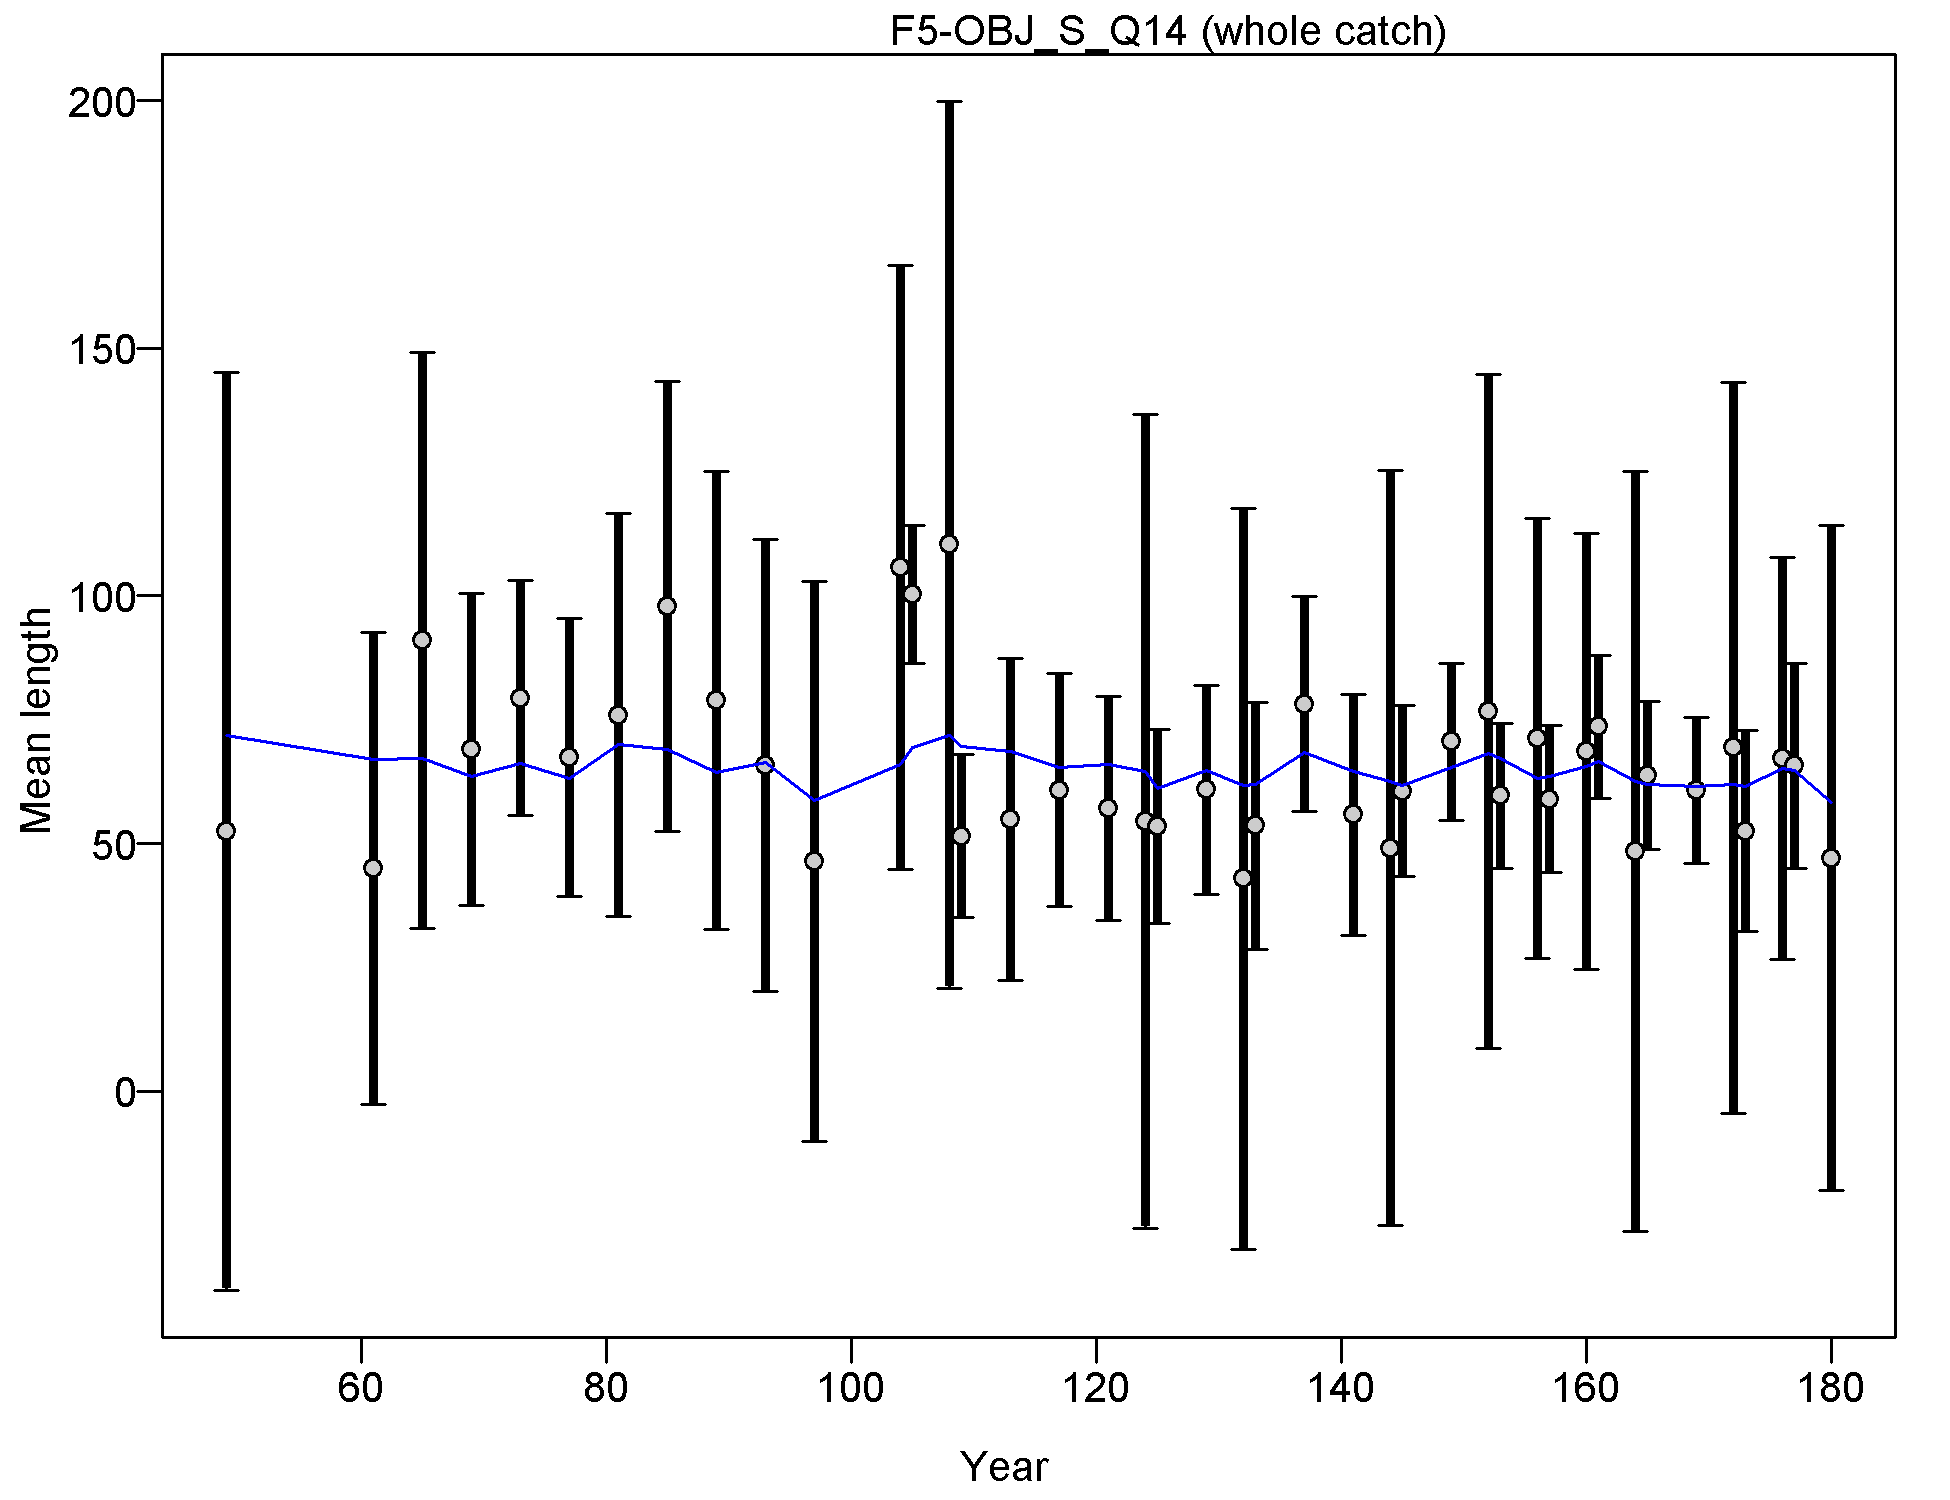
Mean length for F5-OBJ_S_Q14 with 95% confidence intervals based on current samples sizes.
Francis data weighting method TA1.8: thinner intervals (with capped ends) show result of further adjusting sample sizes based on suggested multiplier (with 95% interval) for len data from F5-OBJ_S_Q14:
0.9933 (0.5064-2.7491)
For more info, see
Francis, R.I.C.C. (2011). Data weighting in statistical fisheries stock assessment models. Can. J. Fish. Aquat. Sci. 68: 1124-1138. https://doi.org/10.1139/f2011-025
file: comp_lenfit_data_weighting_TA1.8_F5-OBJ_S_Q14.png
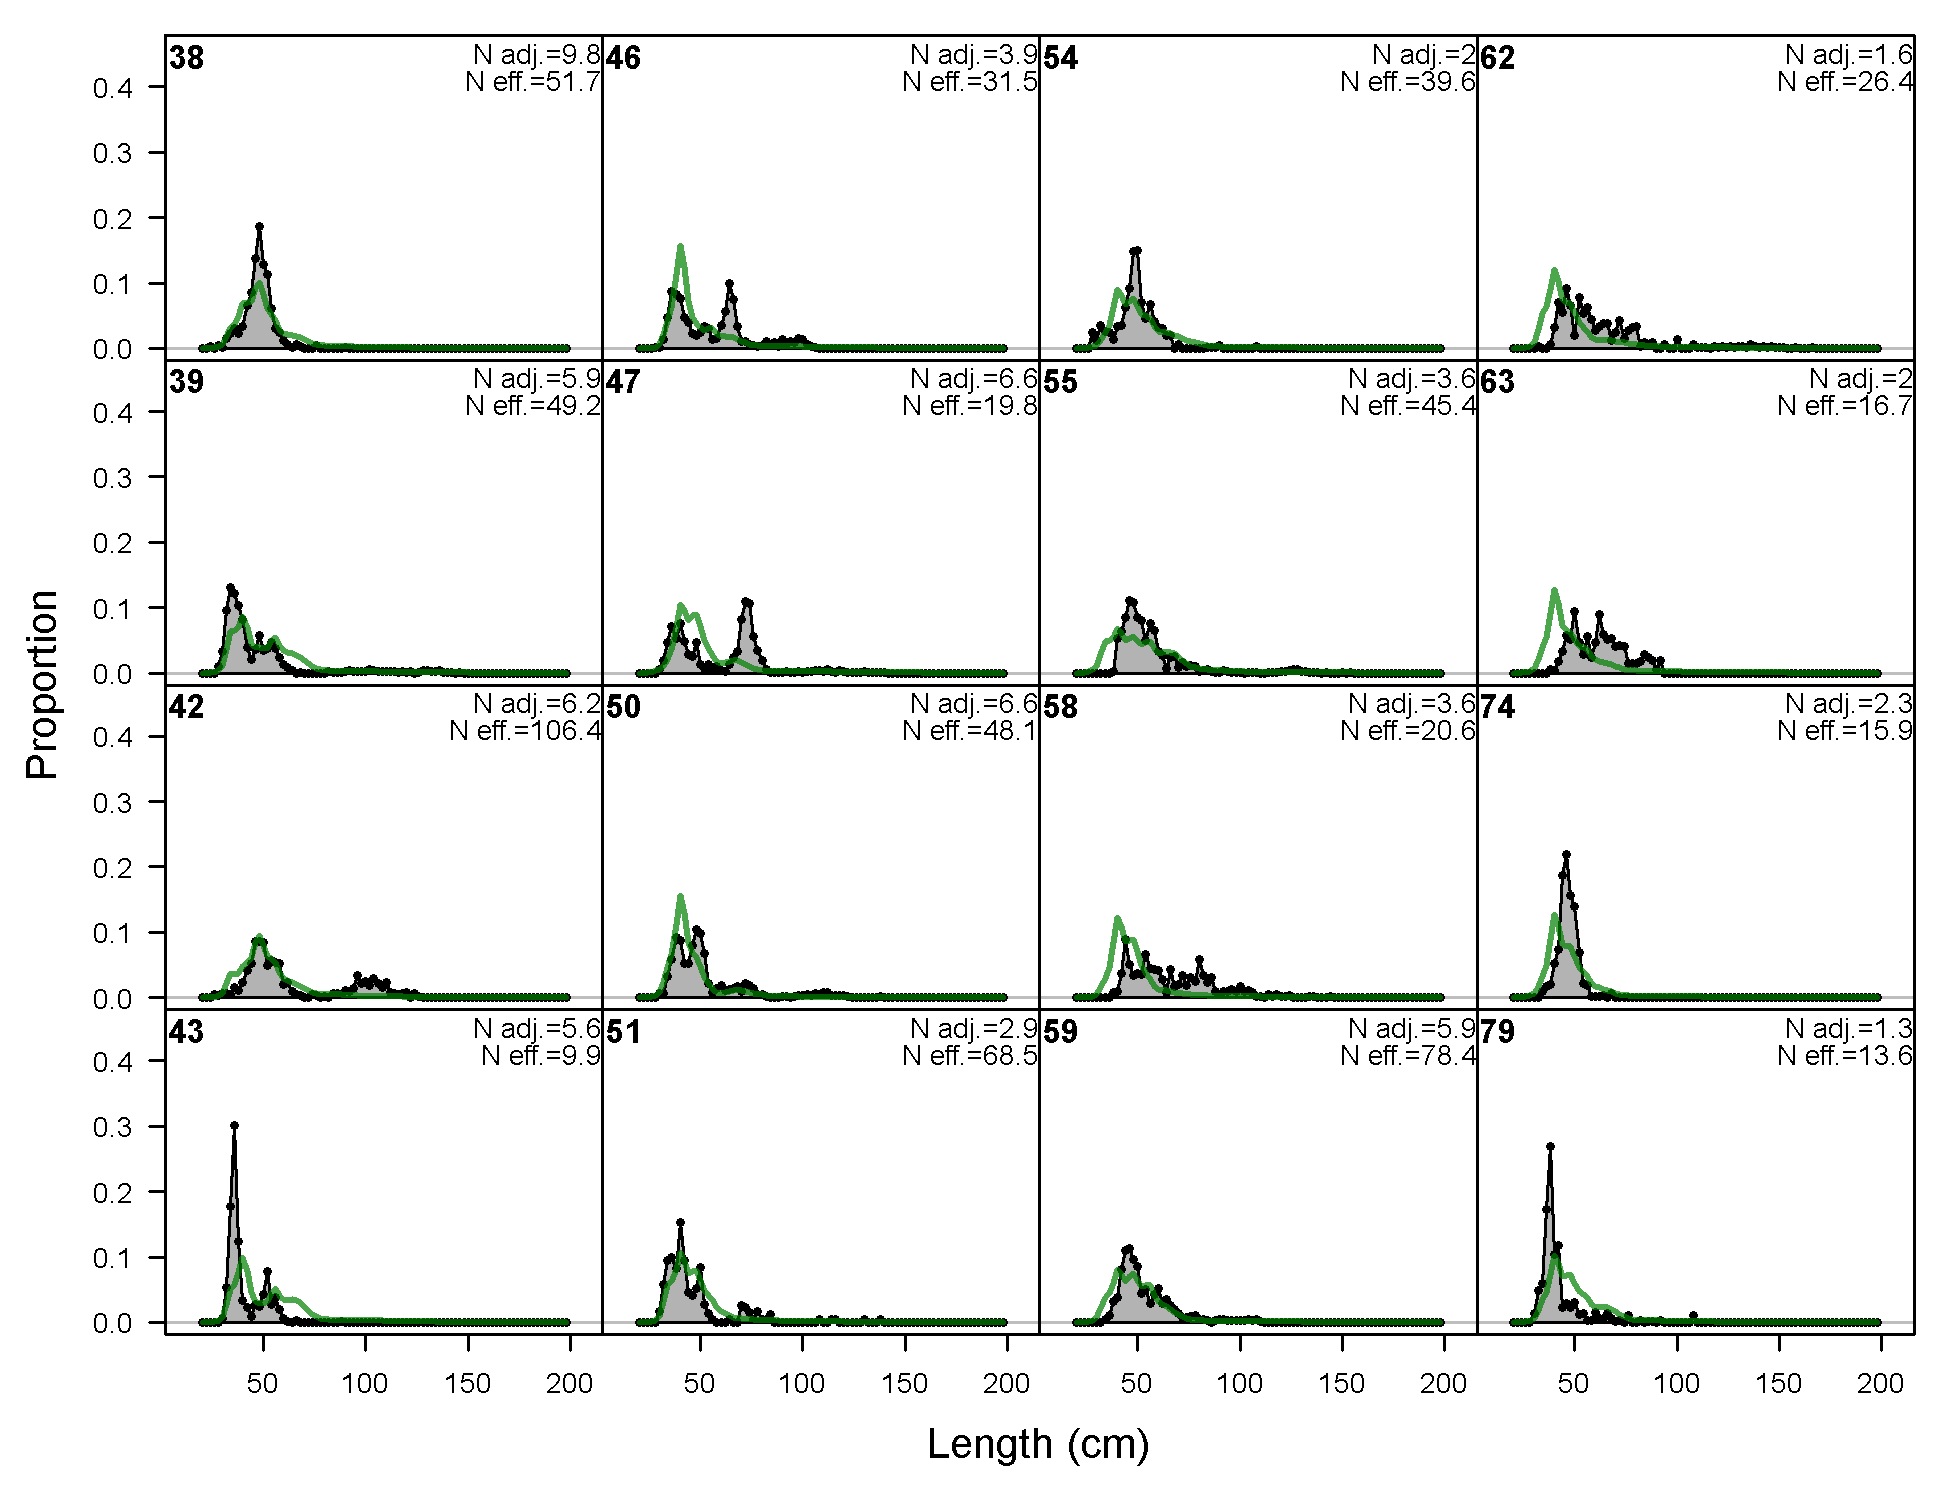
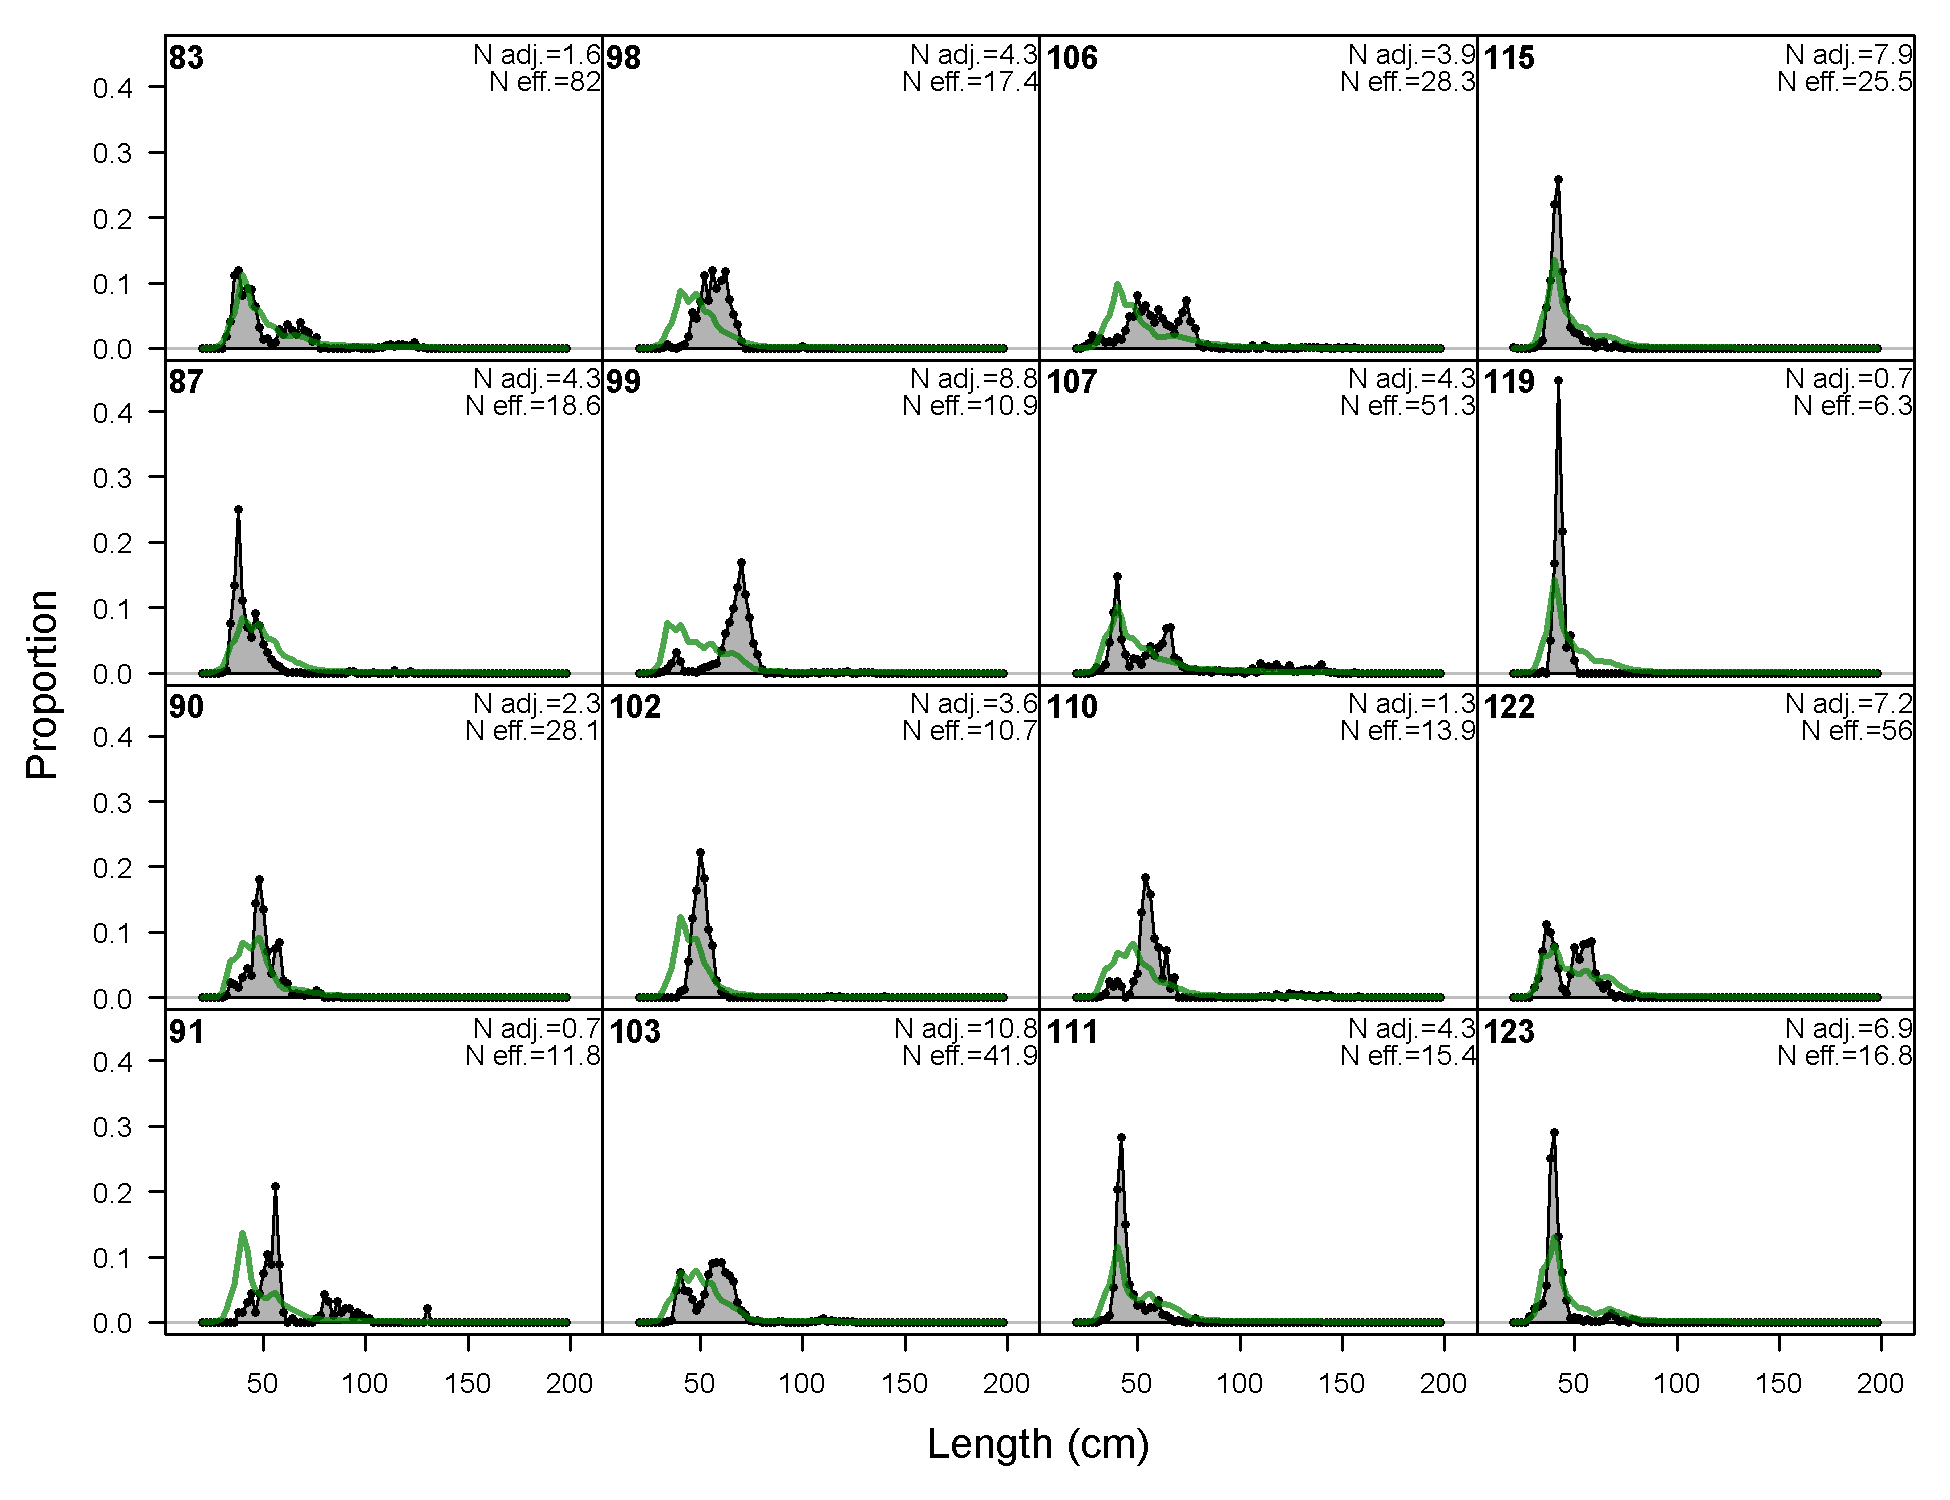
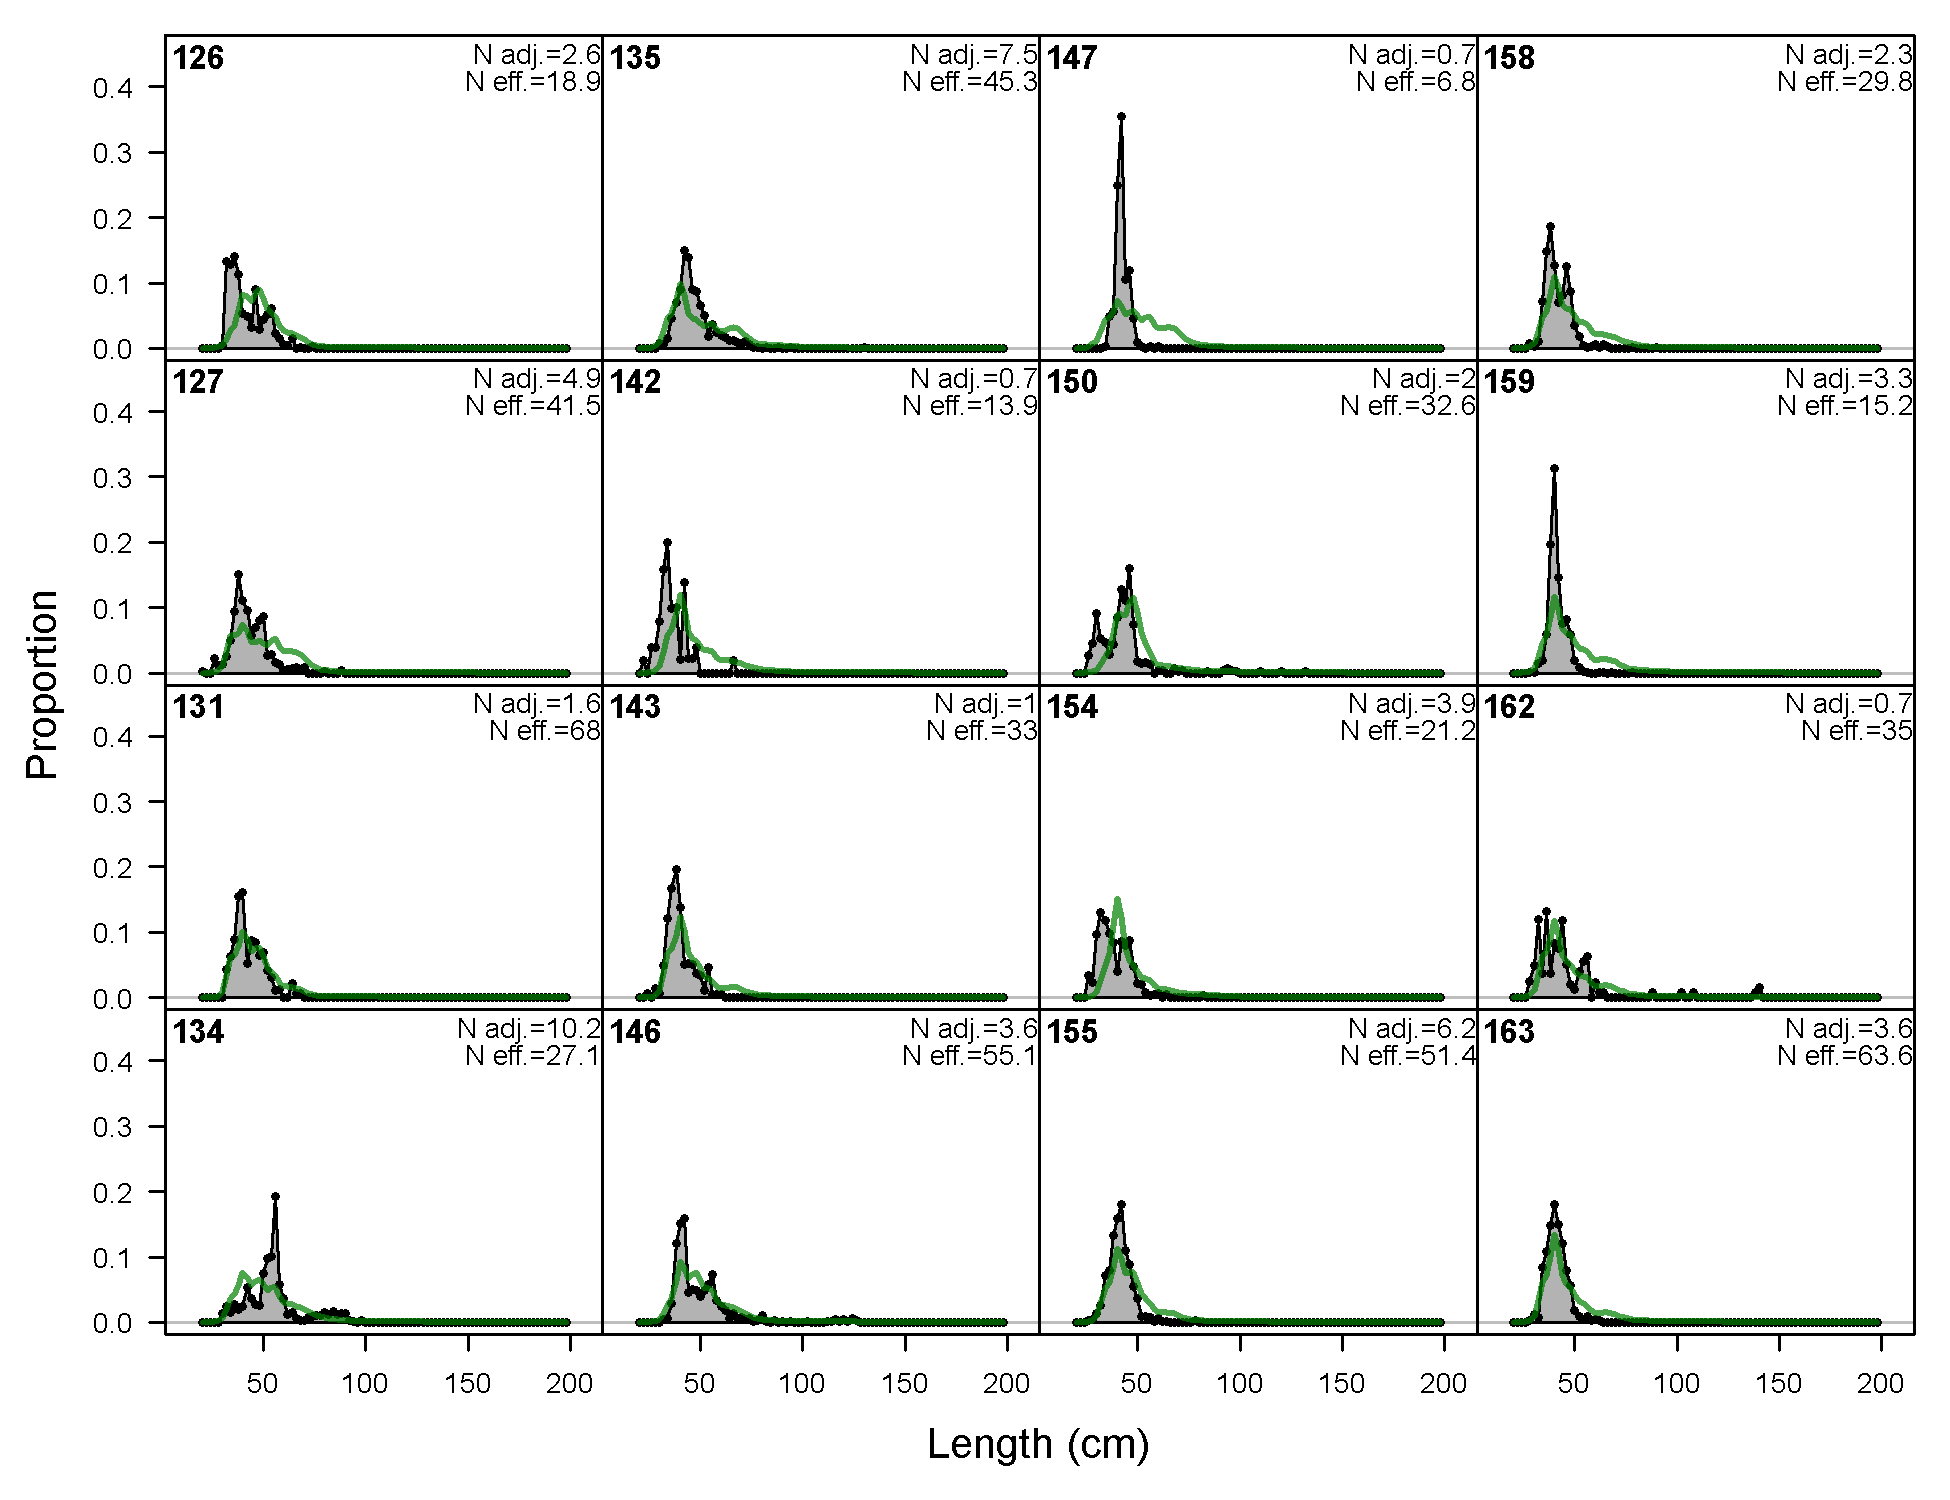
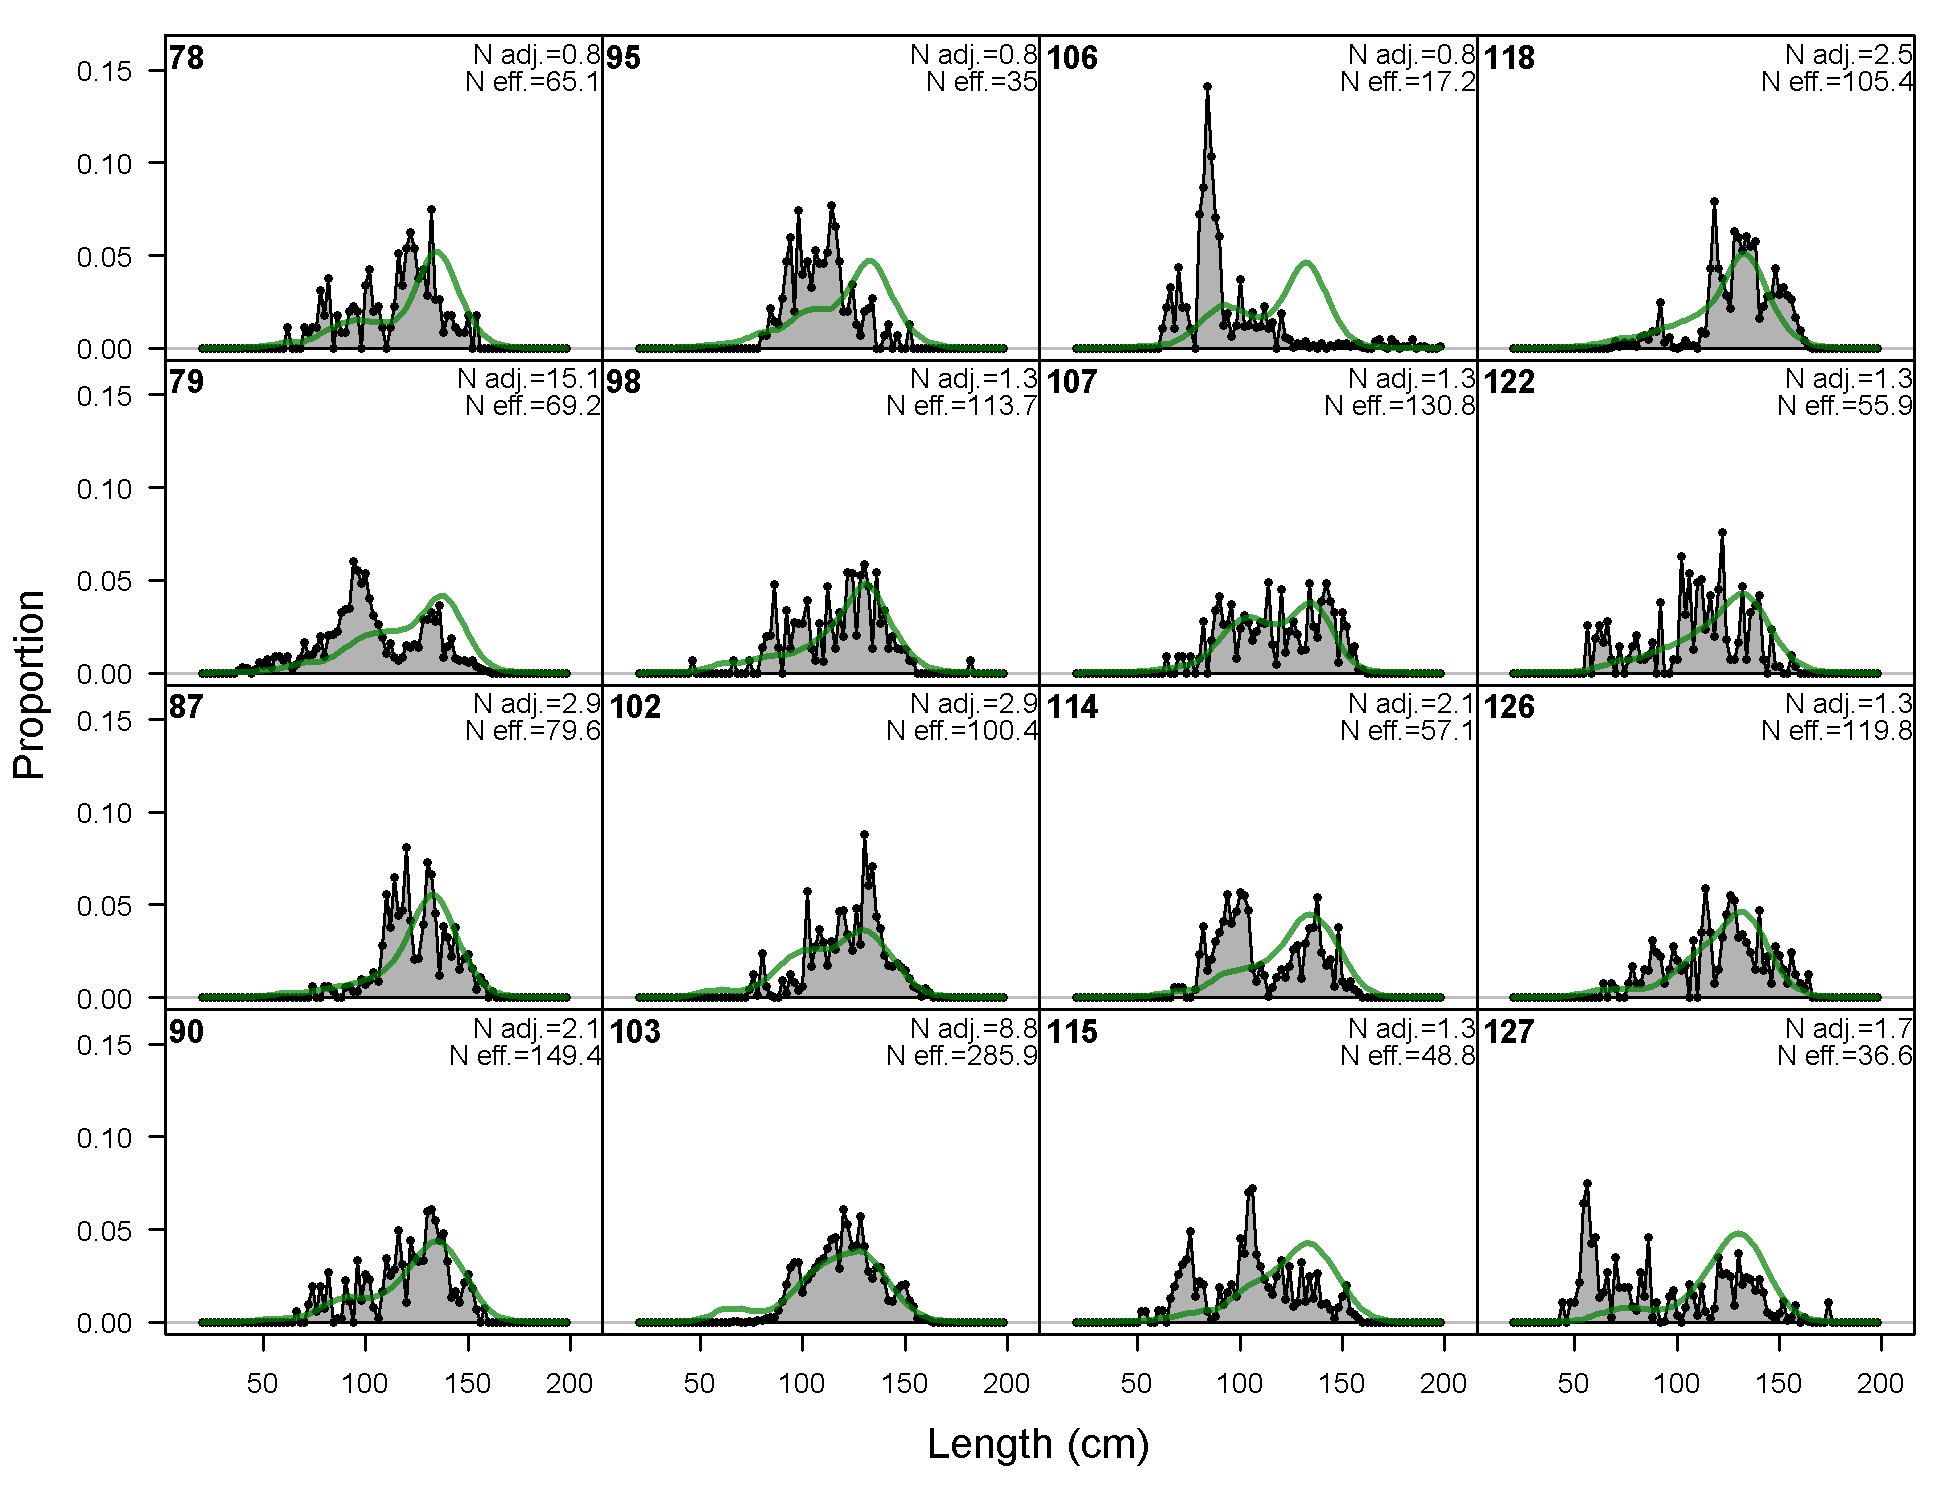
Length comps, whole catch, F6-OBJ_N_Q23 (plot 1 of 4).
'N adj.' is the input sample size after data-weighting adjustment. N eff. is the calculated effective sample size used in the McAllister-Iannelli tuning method.
file: comp_lenfit_flt6mkt0_page1.png
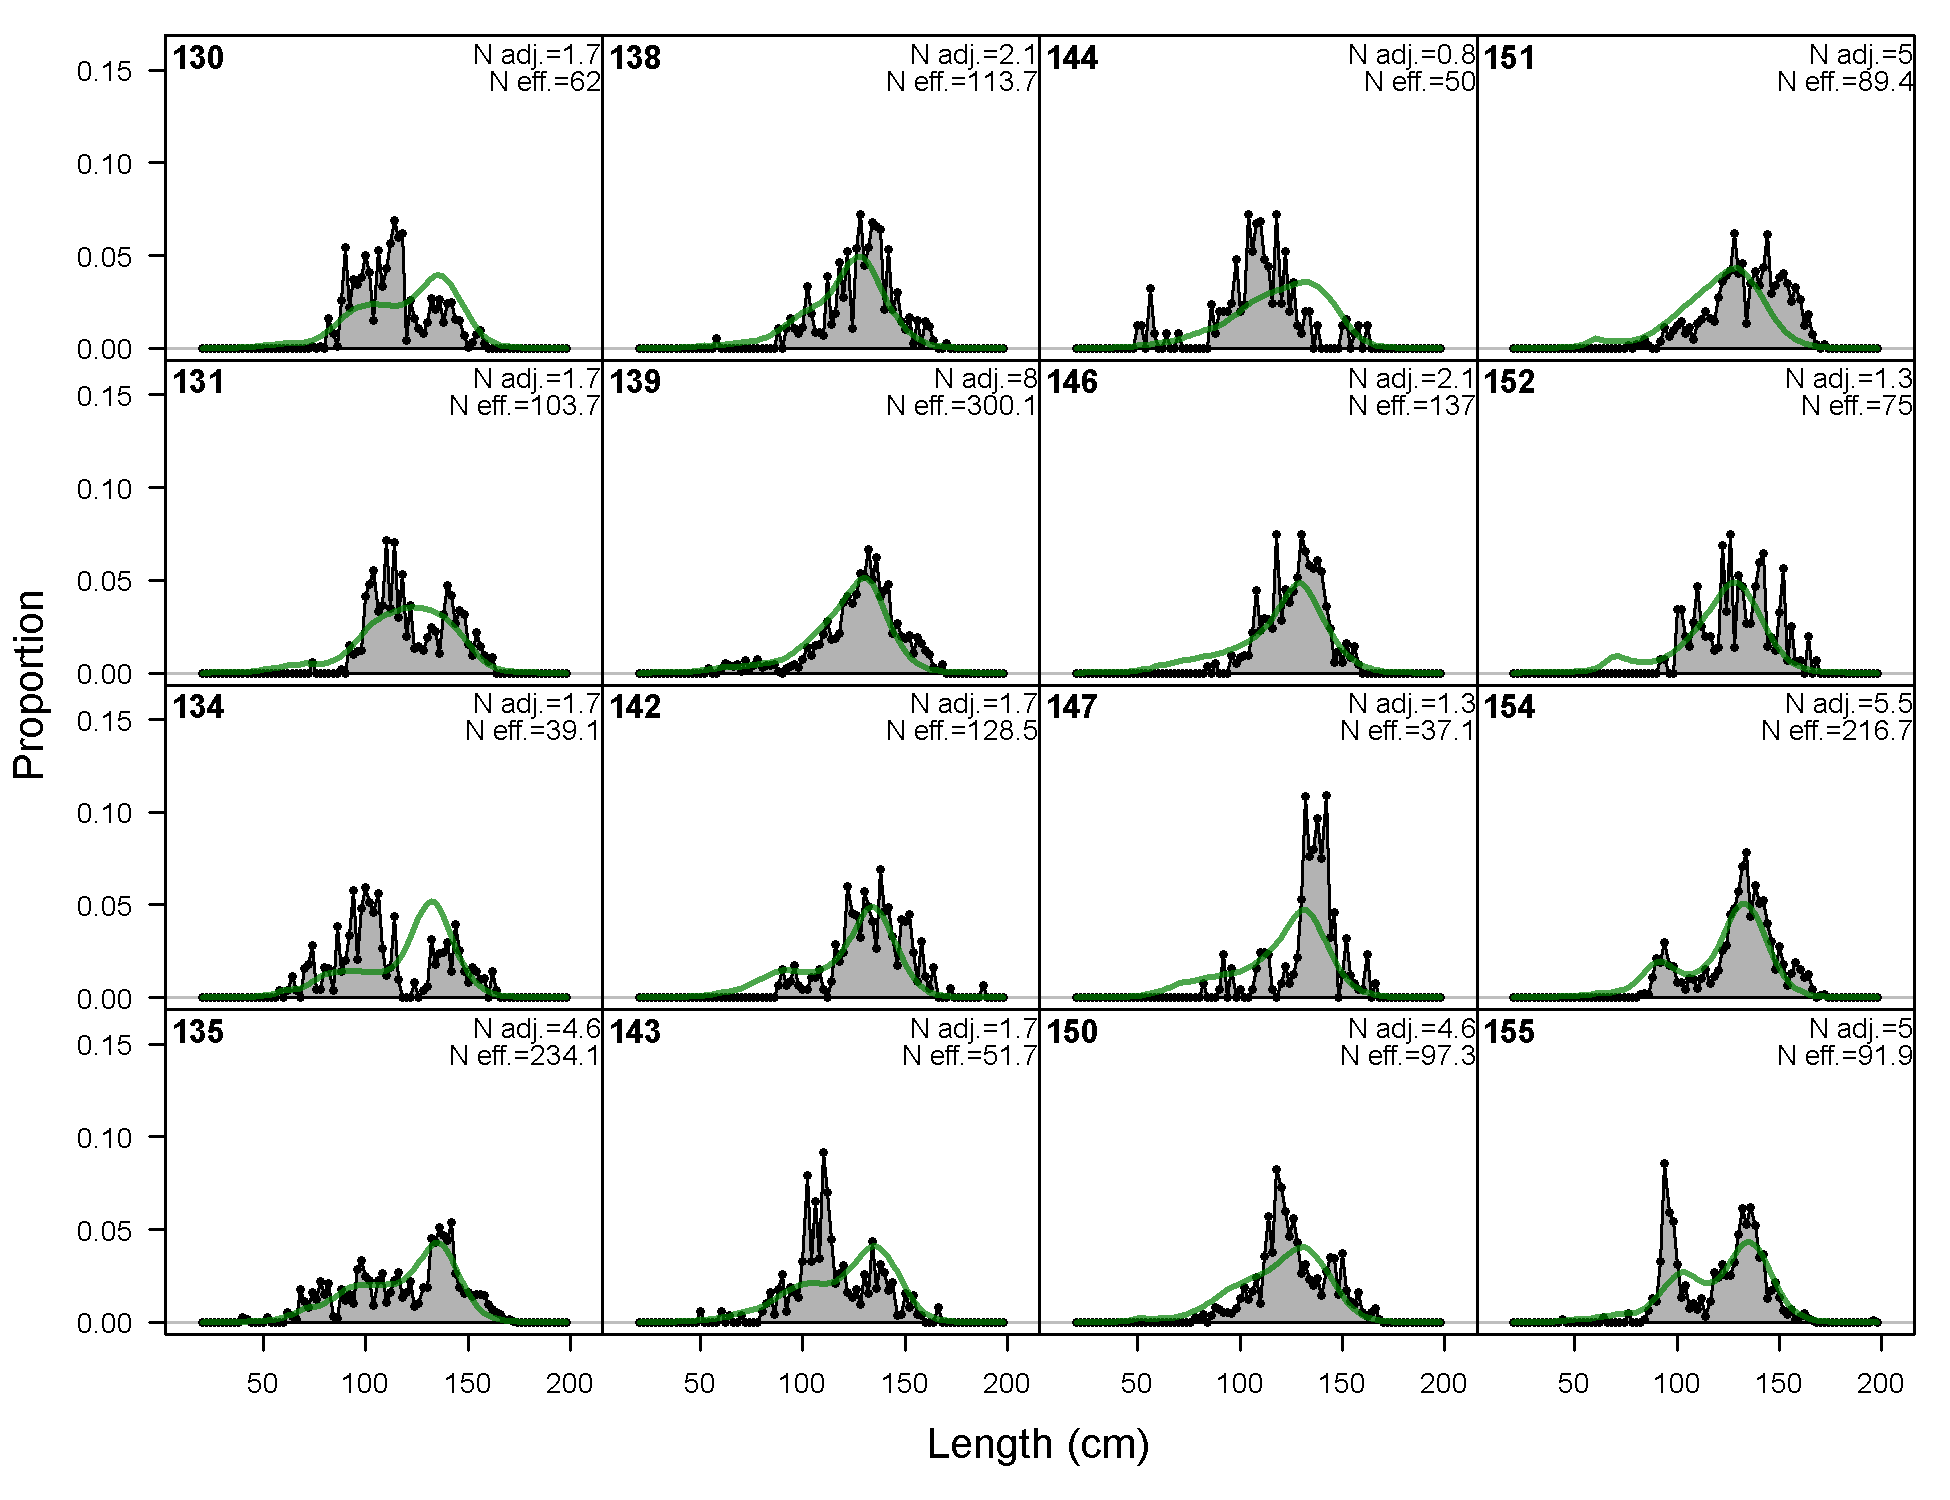
Length comps, whole catch, F6-OBJ_N_Q23 (plot 2 of 4)
file: comp_lenfit_flt6mkt0_page2.png
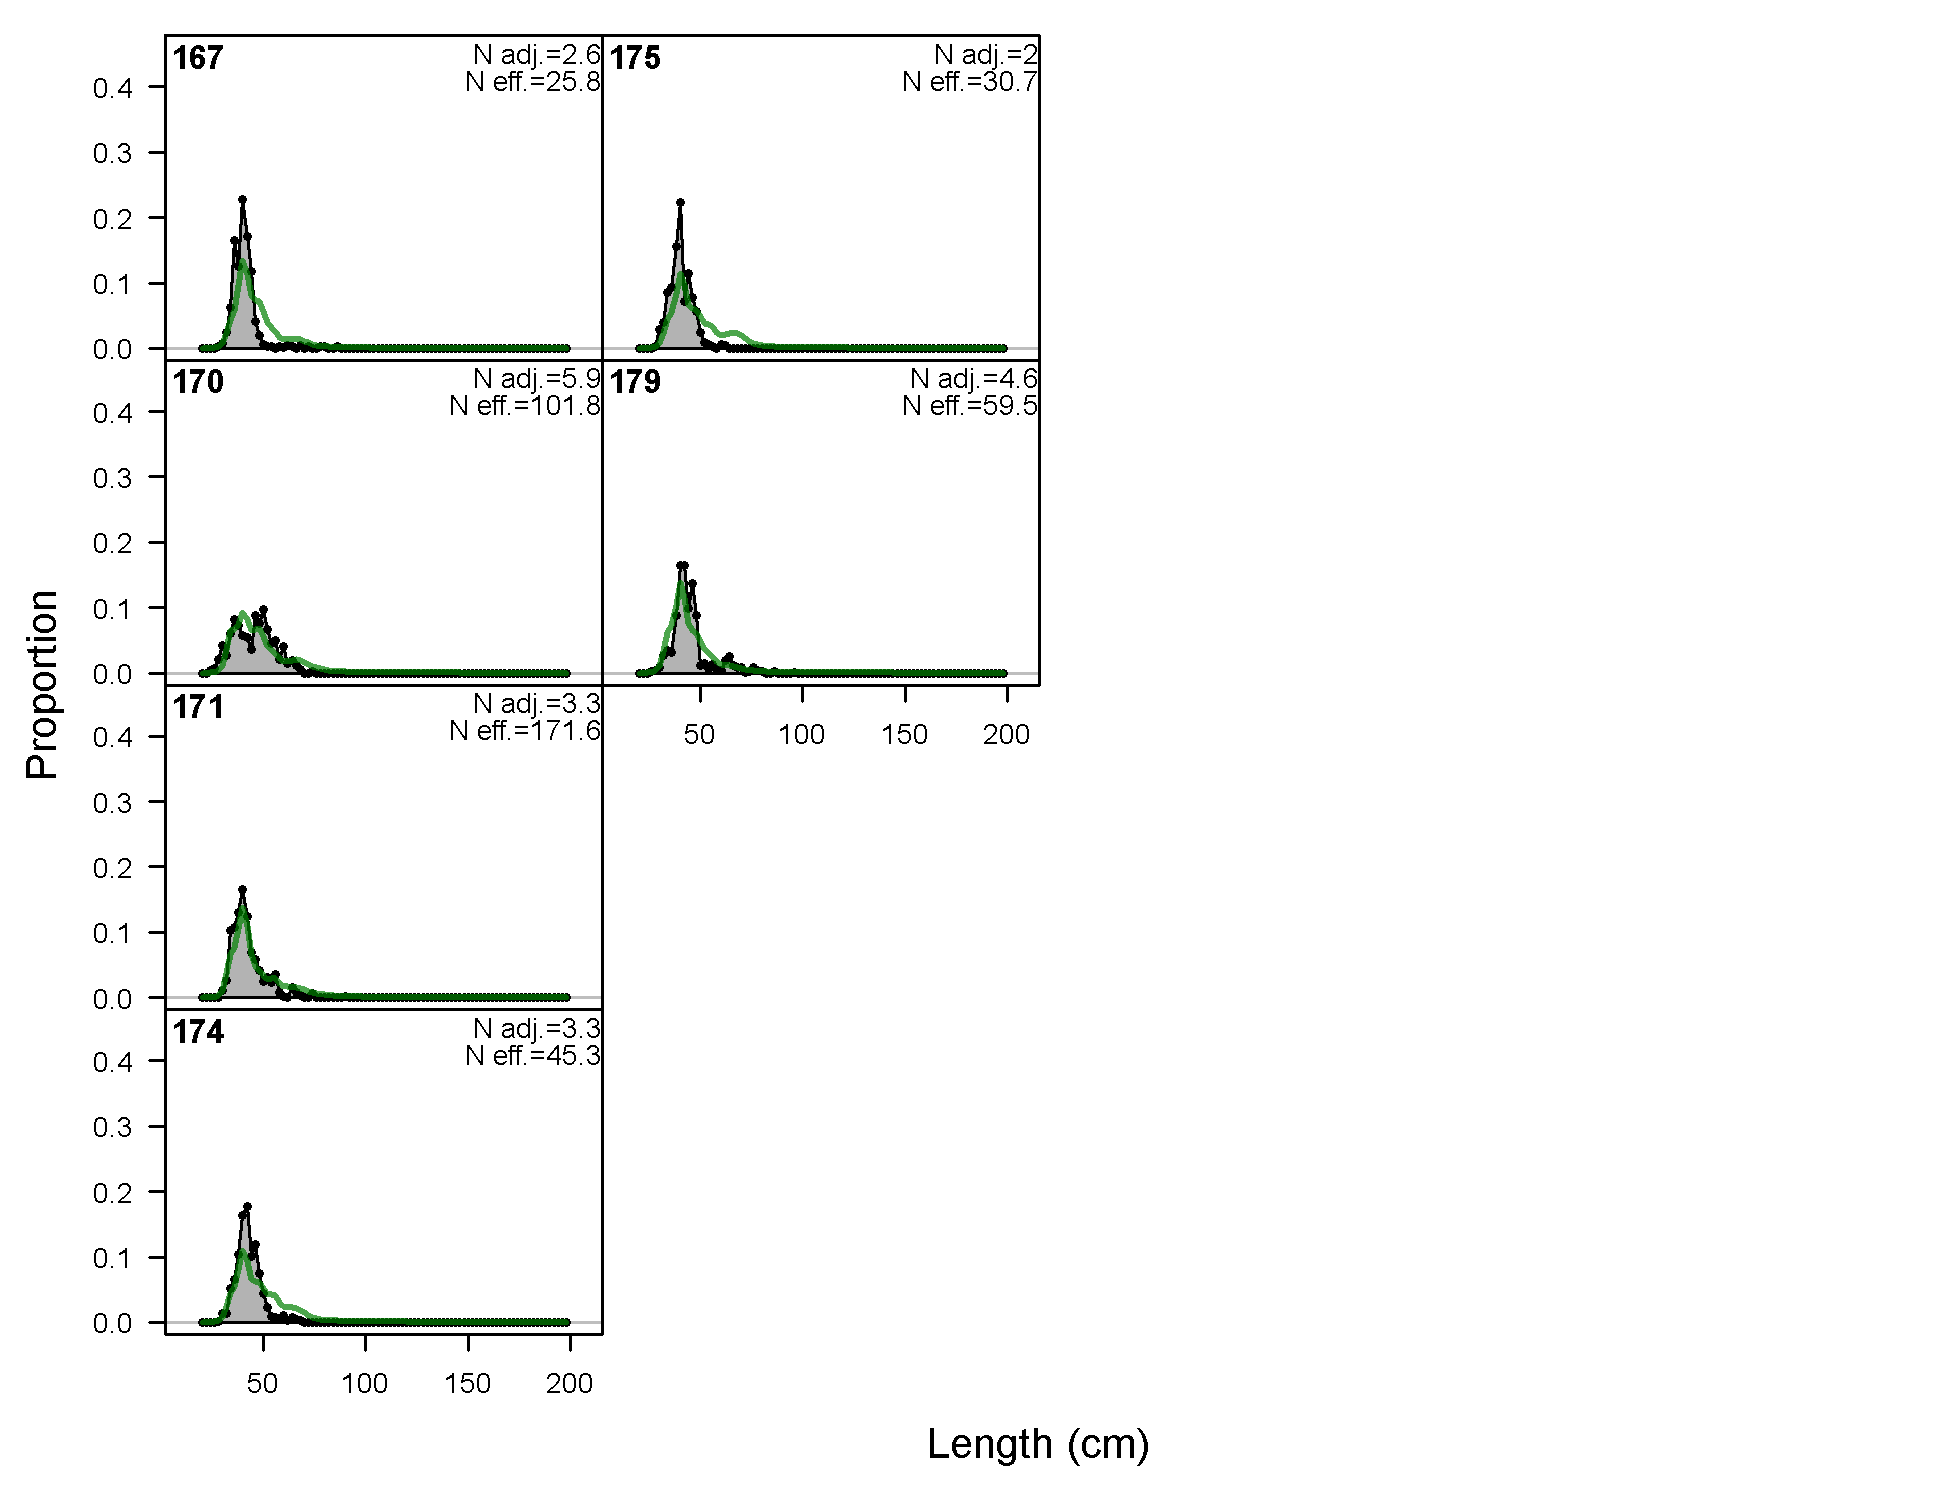
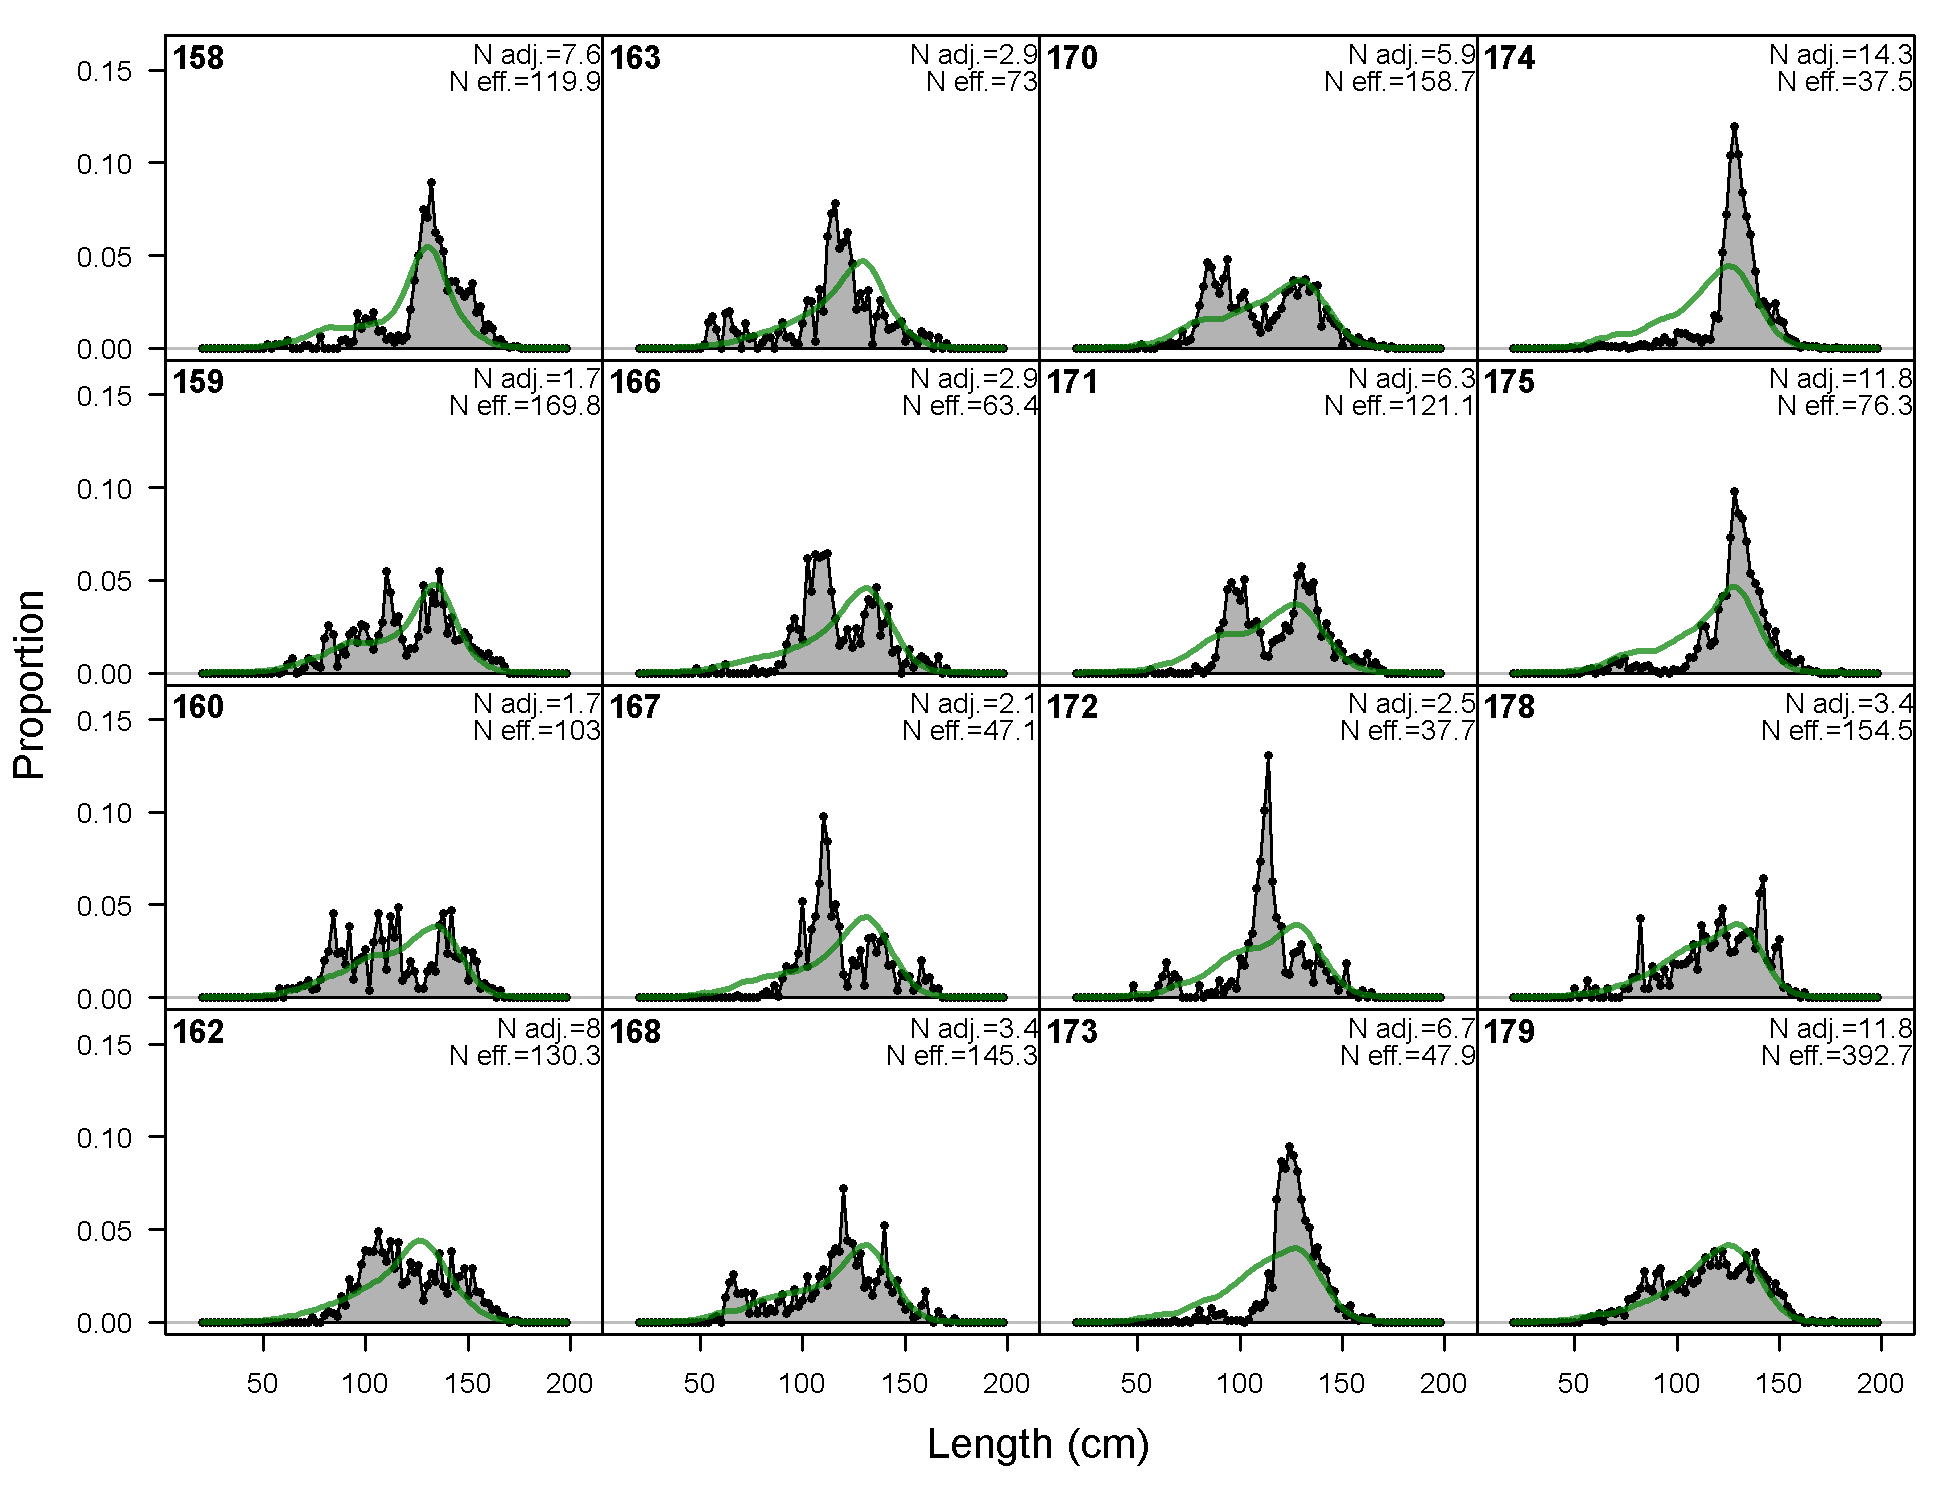
Length comps, whole catch, F6-OBJ_N_Q23 (plot 3 of 4)
file: comp_lenfit_flt6mkt0_page3.png
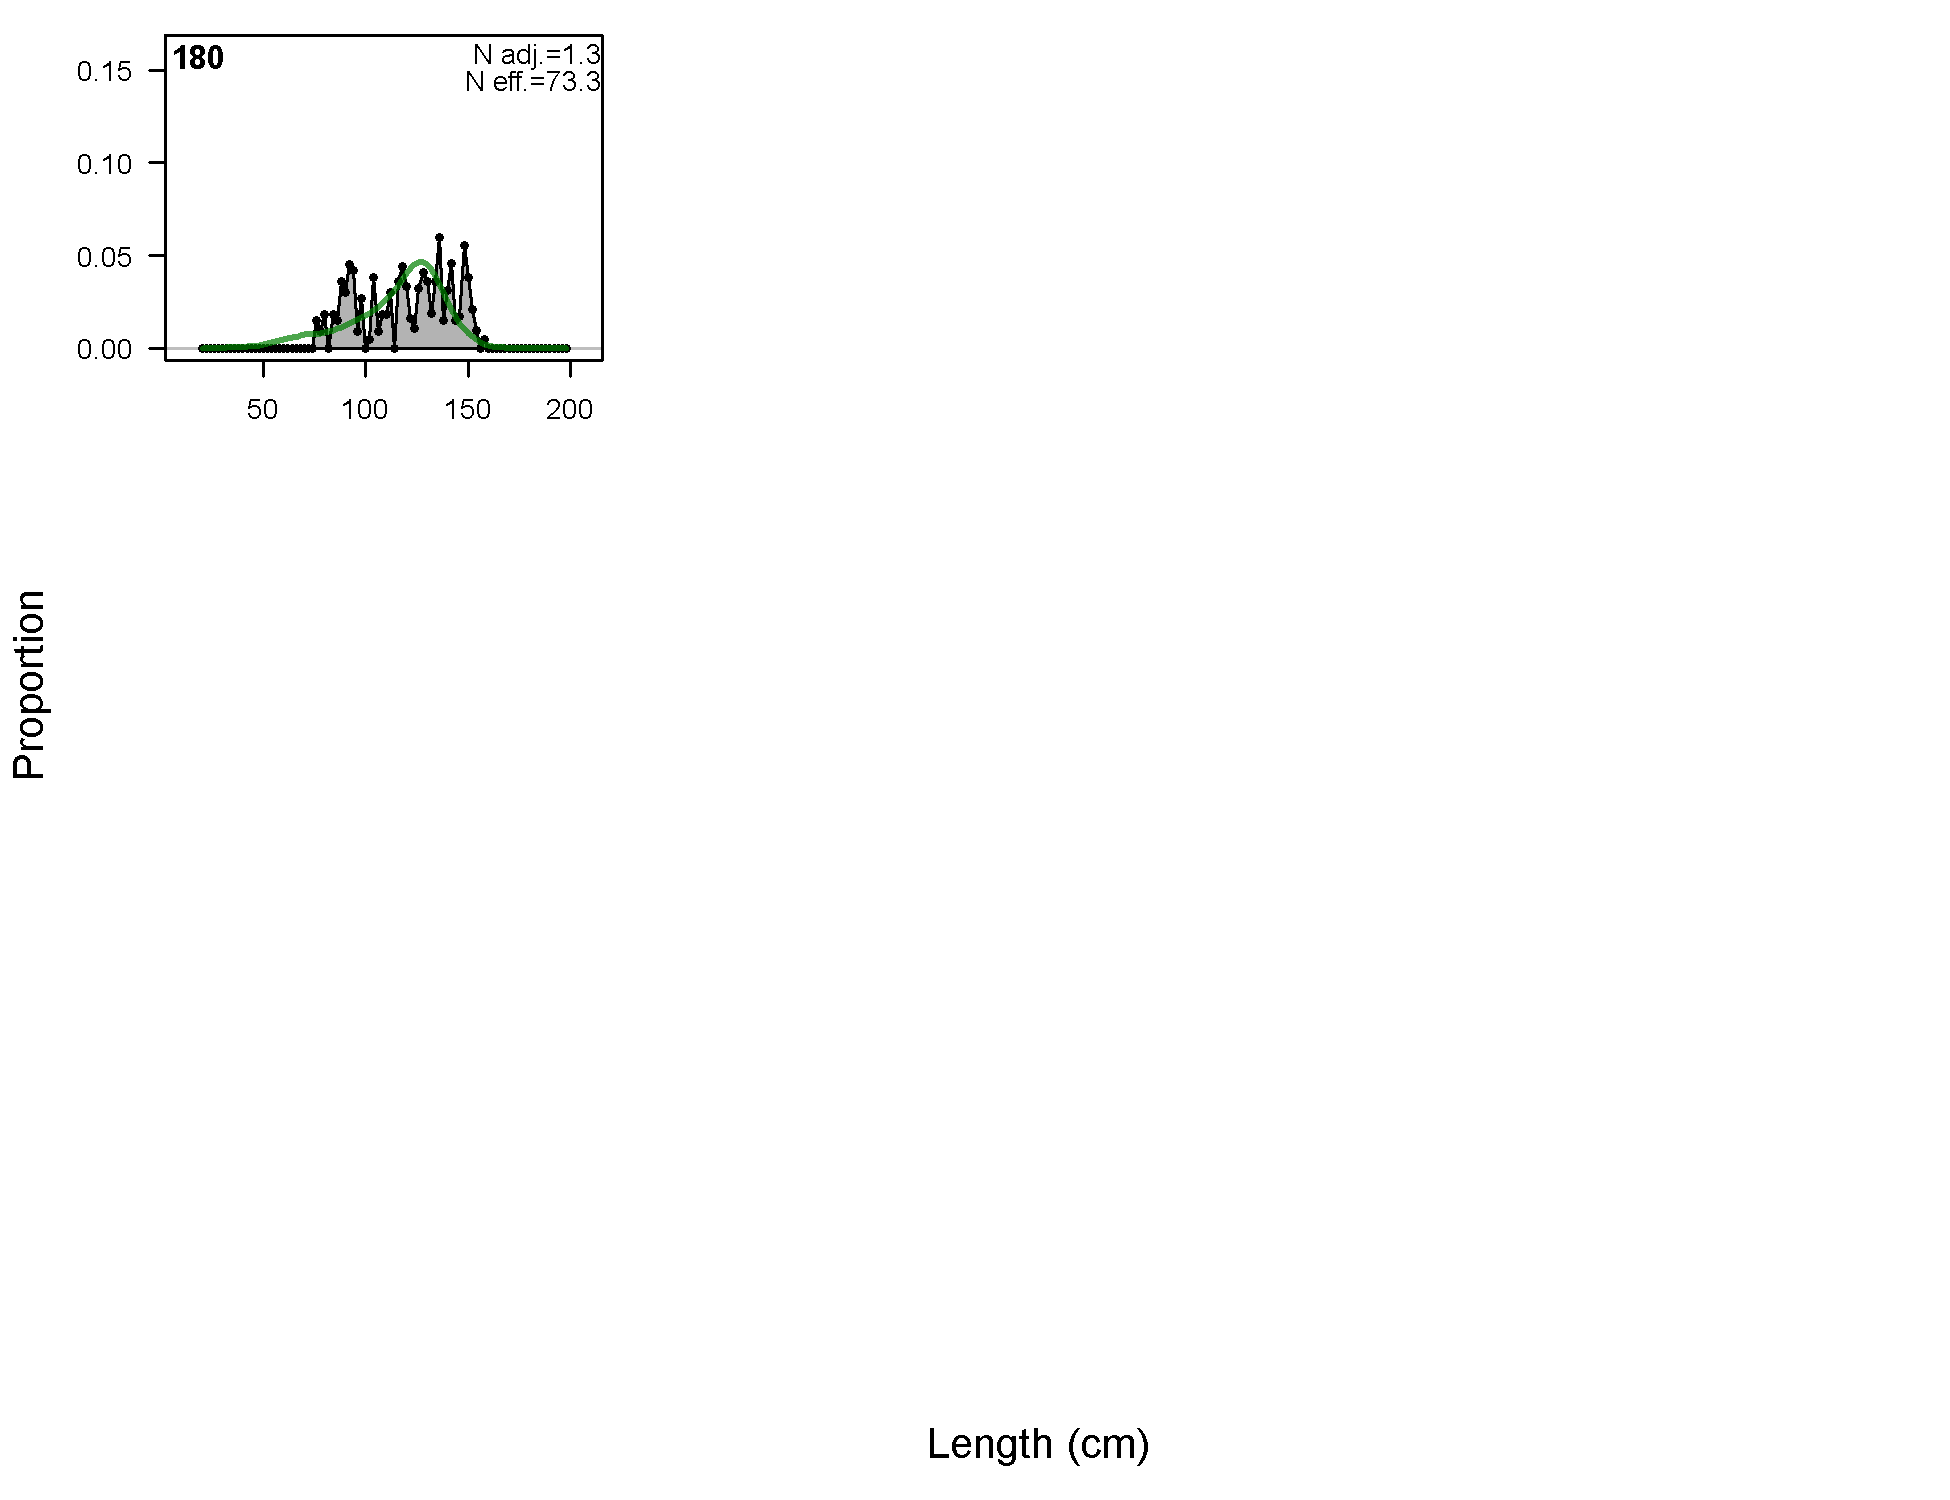
Length comps, whole catch, F6-OBJ_N_Q23 (plot 4 of 4)
file: comp_lenfit_flt6mkt0_page4.png
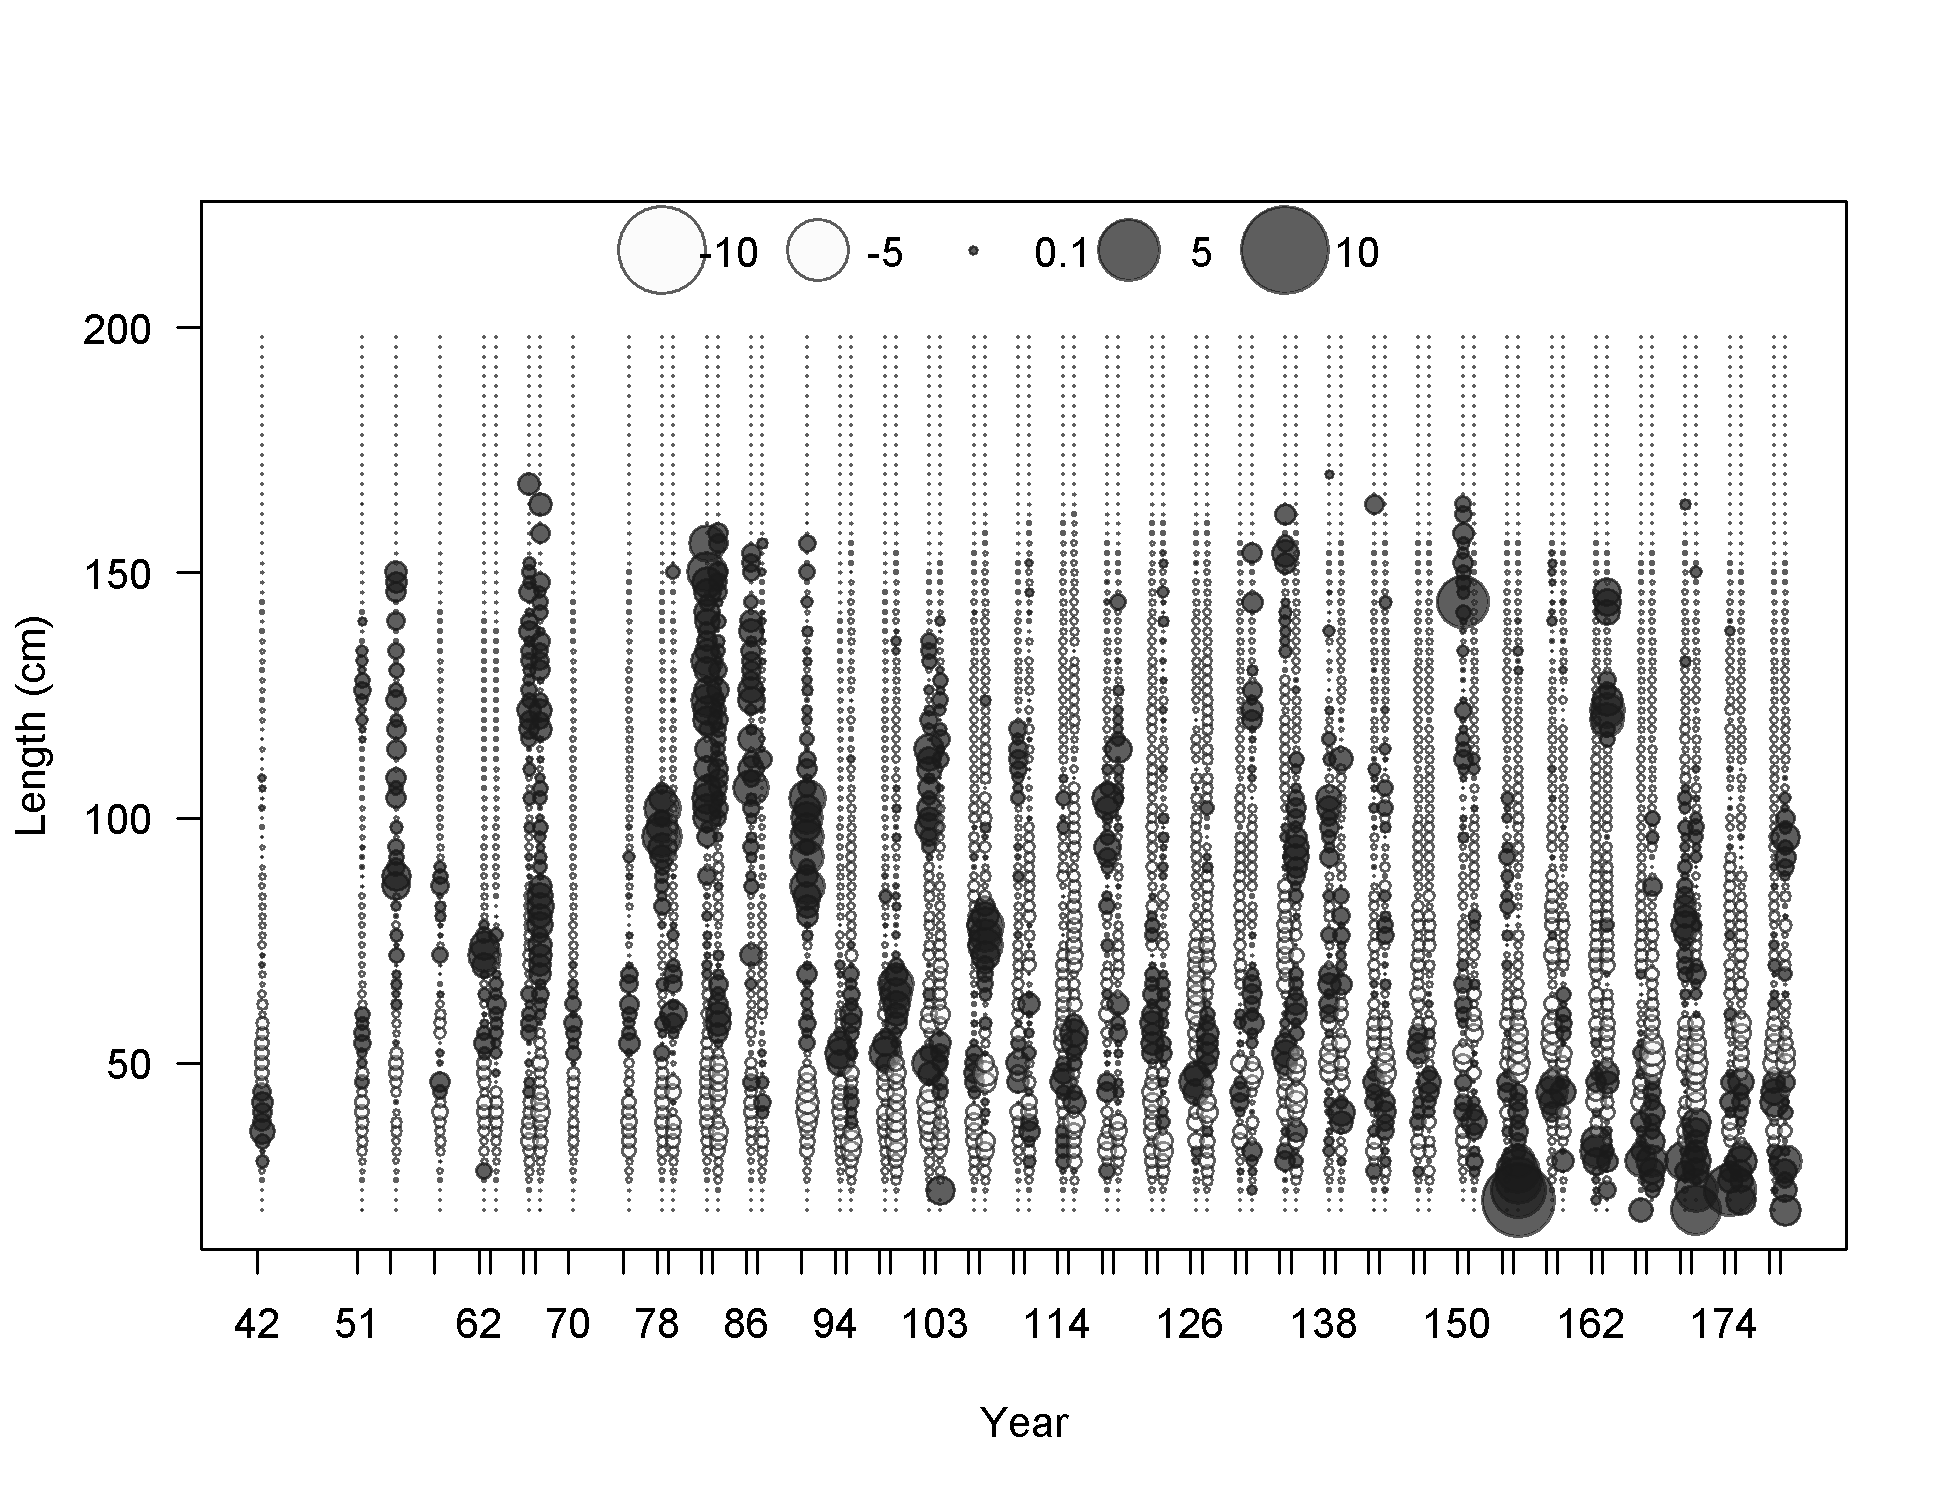
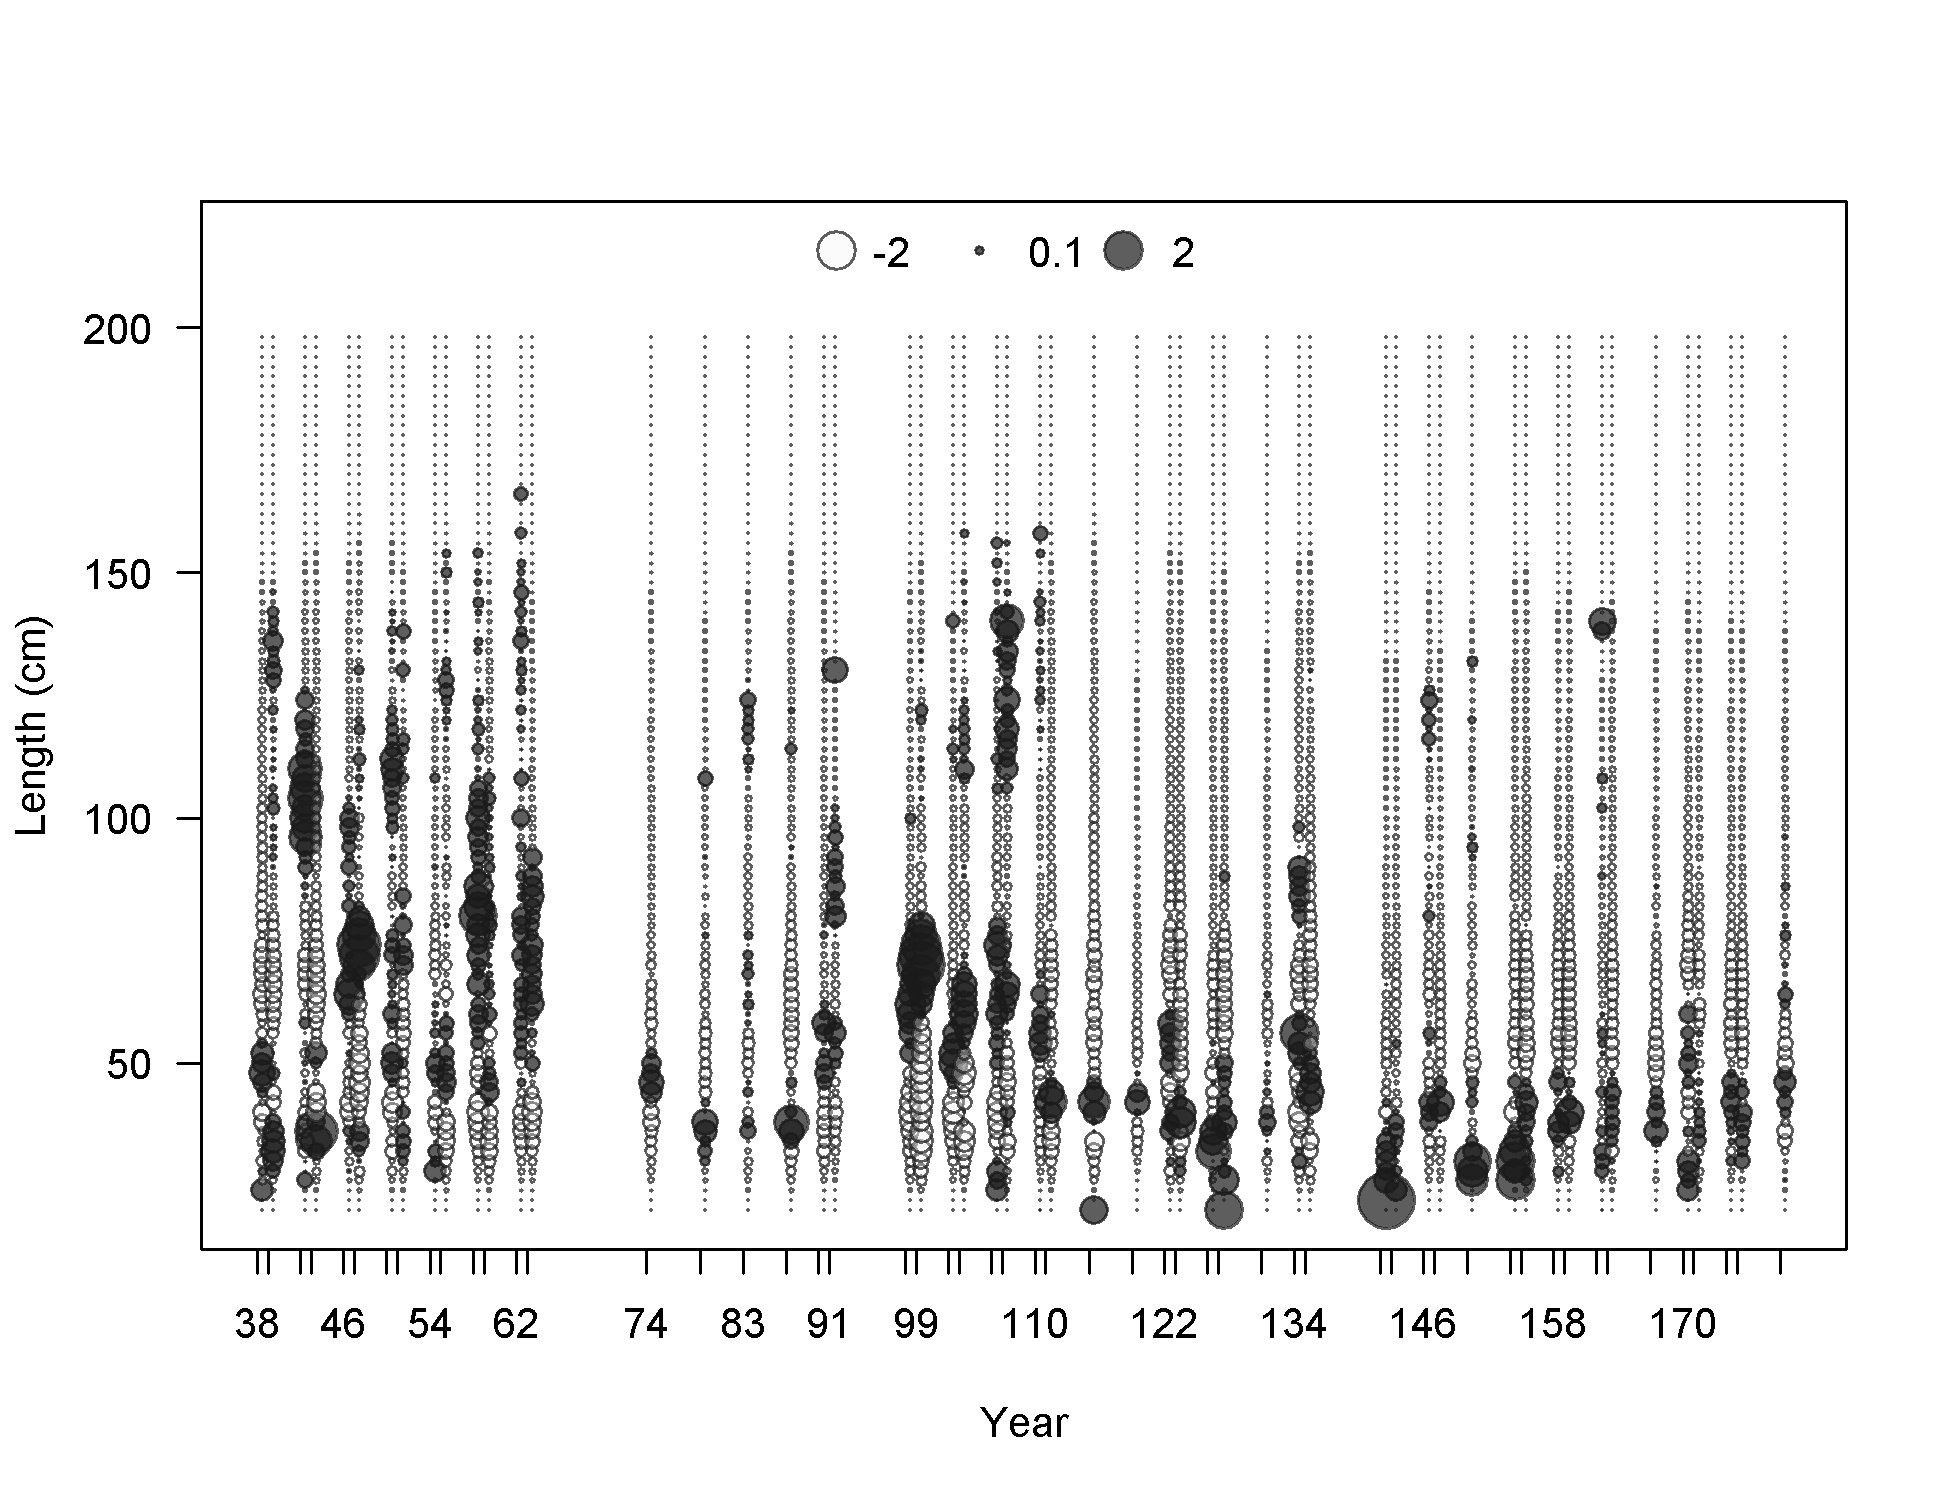
Pearson residuals, whole catch, F6-OBJ_N_Q23 (max=6.87) (plot 4 of 4)
Closed bubbles are positive residuals (observed > expected) and open bubbles are negative residuals (observed < expected).
file: comp_lenfit_residsflt6mkt0_page4.png
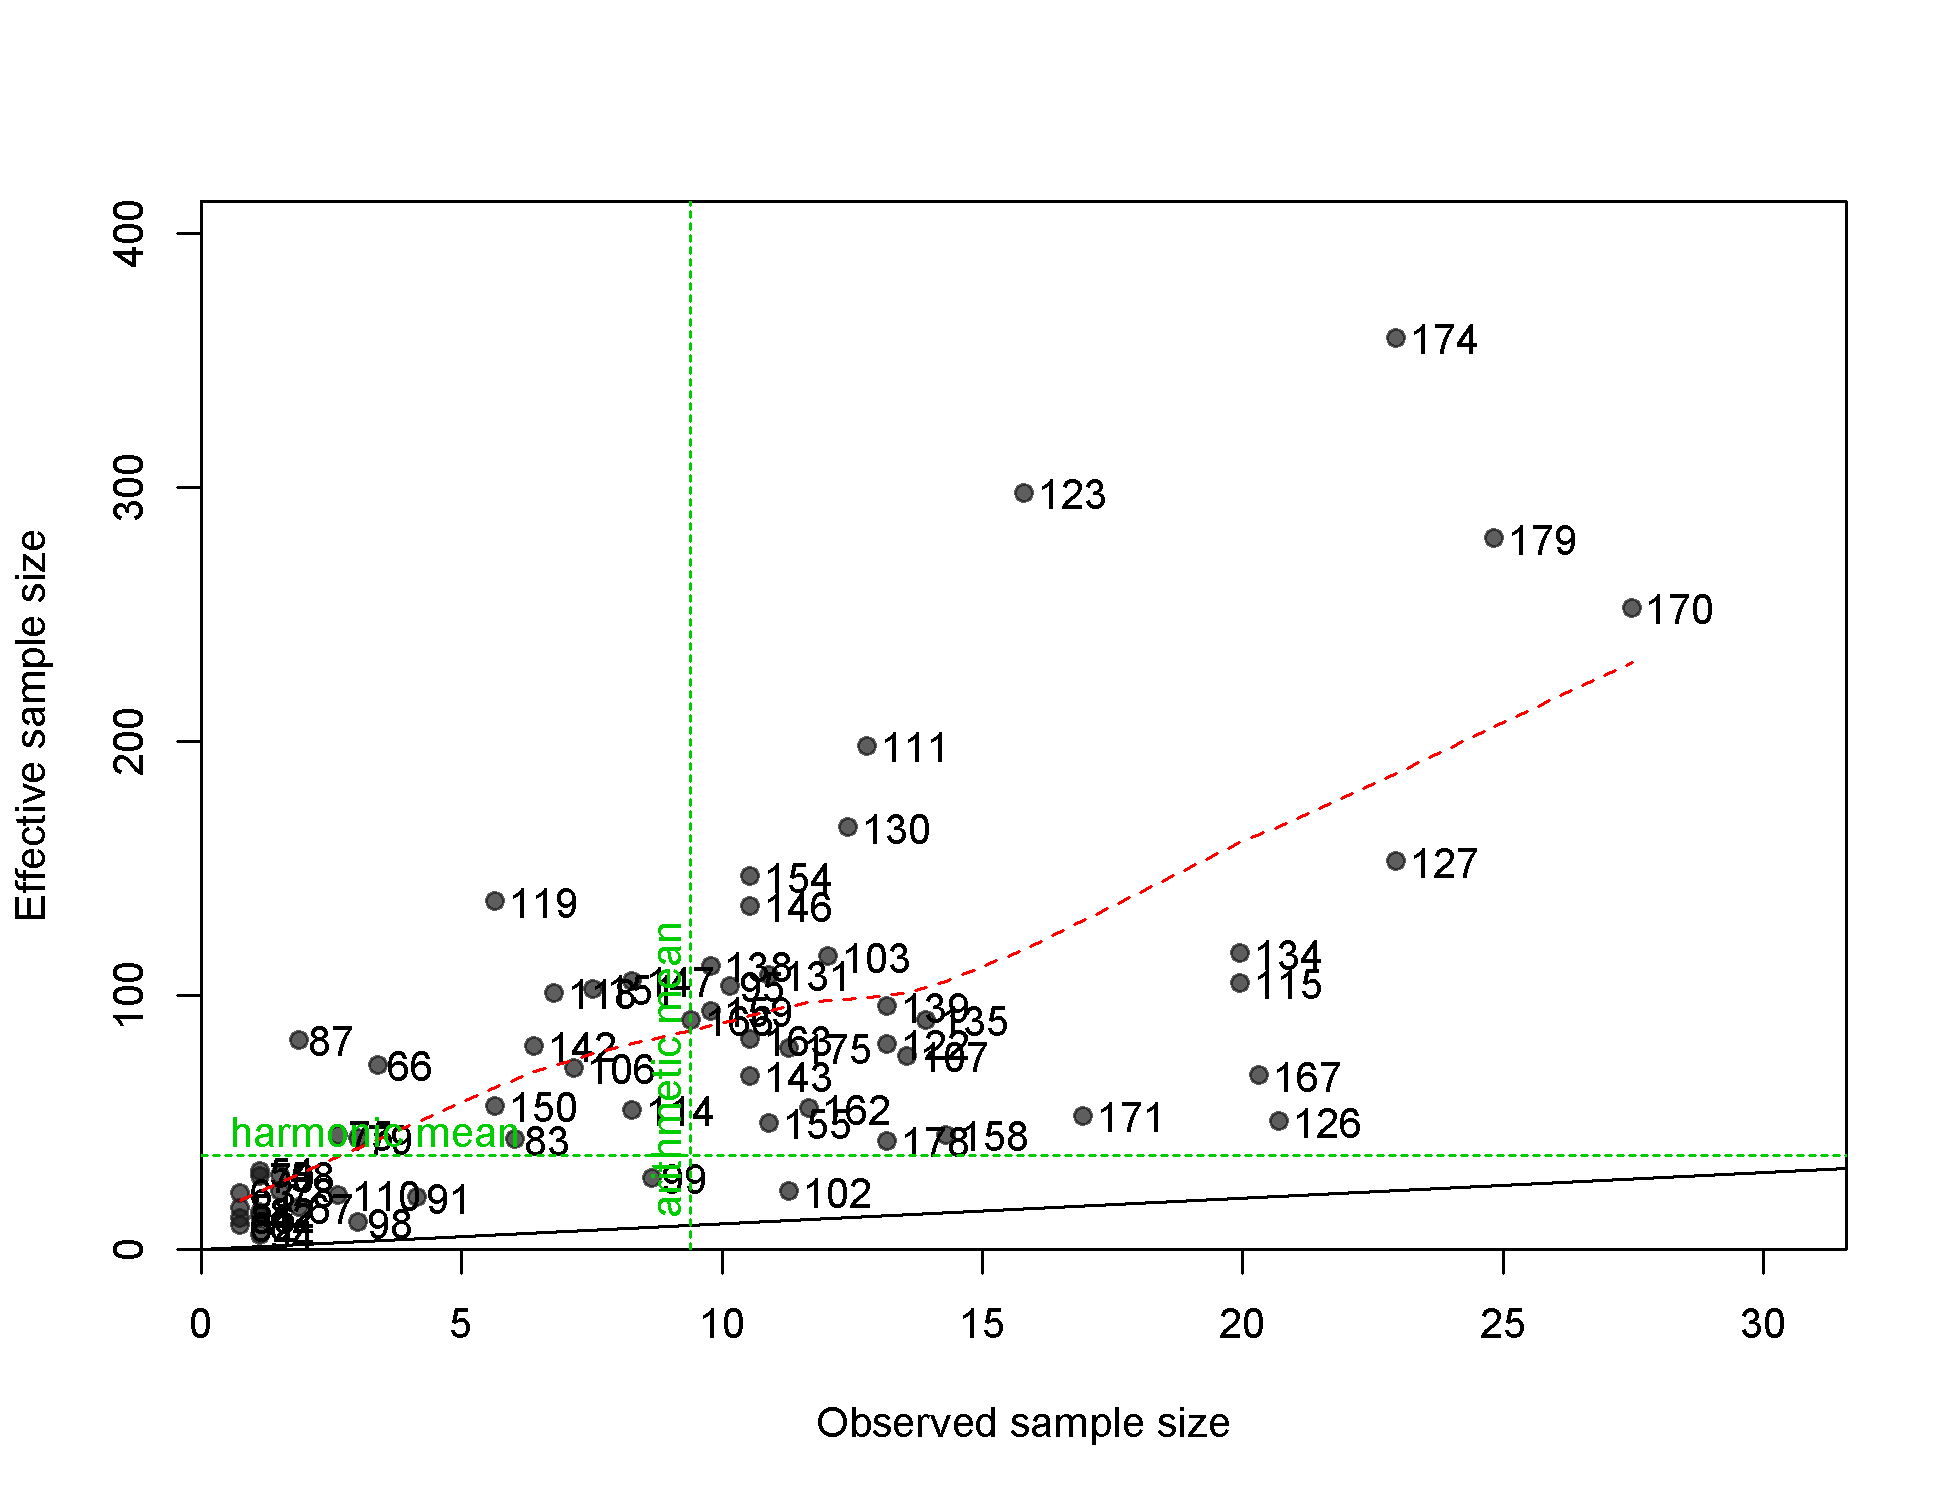
N-EffN comparison, Length comps, whole catch, F6-OBJ_N_Q23
file: comp_lenfit_sampsize_flt6mkt0.png
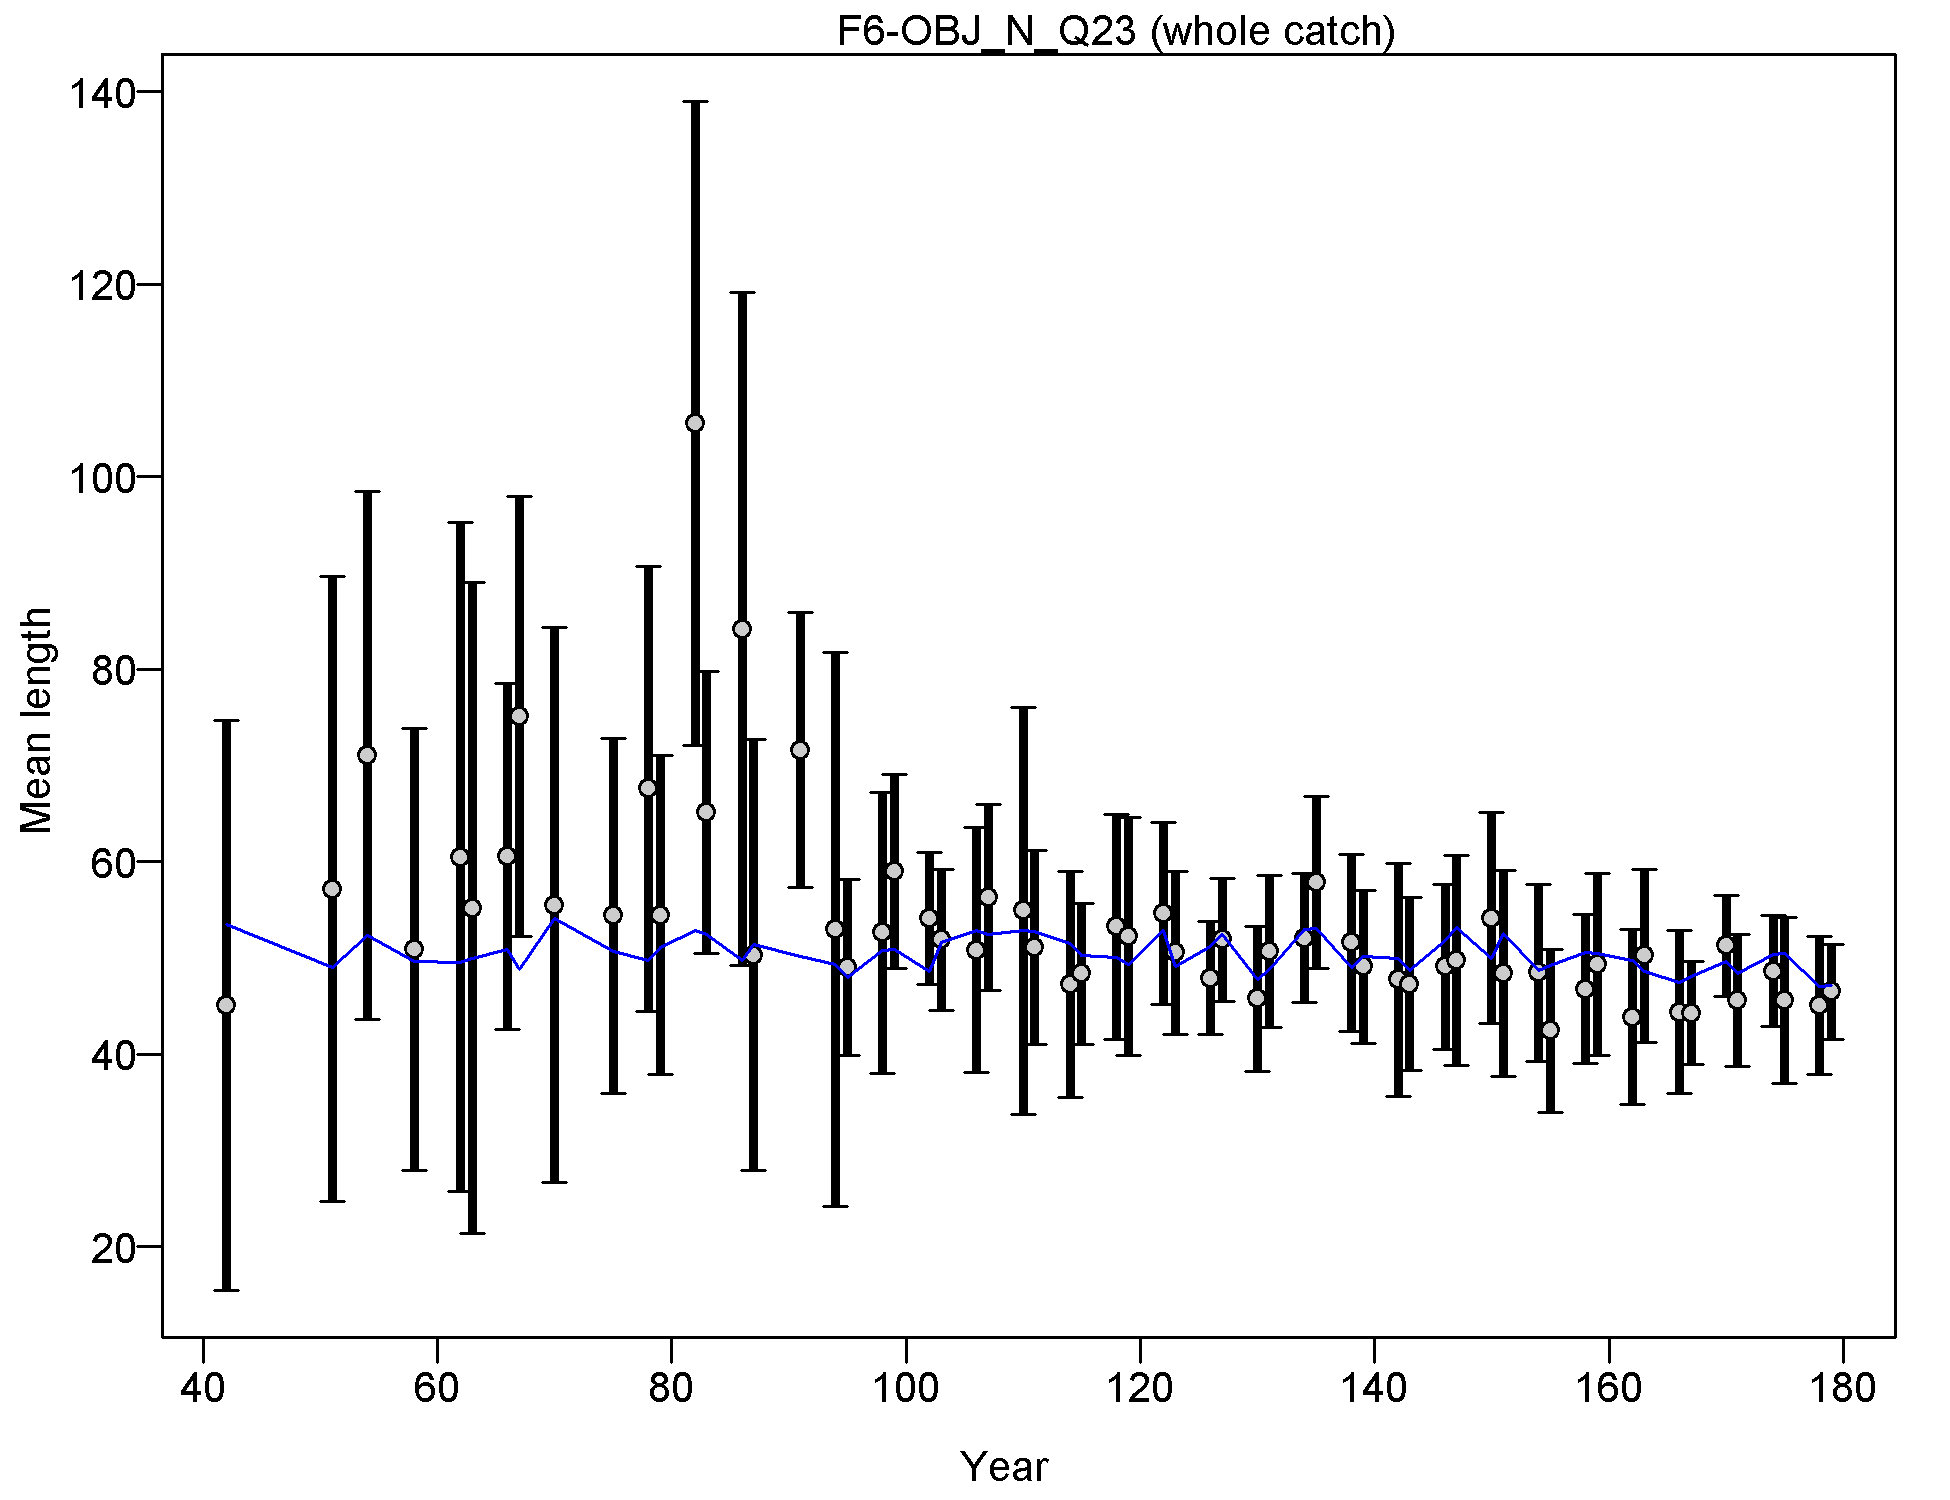
Mean length for F6-OBJ_N_Q23 with 95% confidence intervals based on current samples sizes.
Francis data weighting method TA1.8: thinner intervals (with capped ends) show result of further adjusting sample sizes based on suggested multiplier (with 95% interval) for len data from F6-OBJ_N_Q23:
0.9938 (0.6916-1.694)
For more info, see
Francis, R.I.C.C. (2011). Data weighting in statistical fisheries stock assessment models. Can. J. Fish. Aquat. Sci. 68: 1124-1138. https://doi.org/10.1139/f2011-025
file: comp_lenfit_data_weighting_TA1.8_F6-OBJ_N_Q23.png
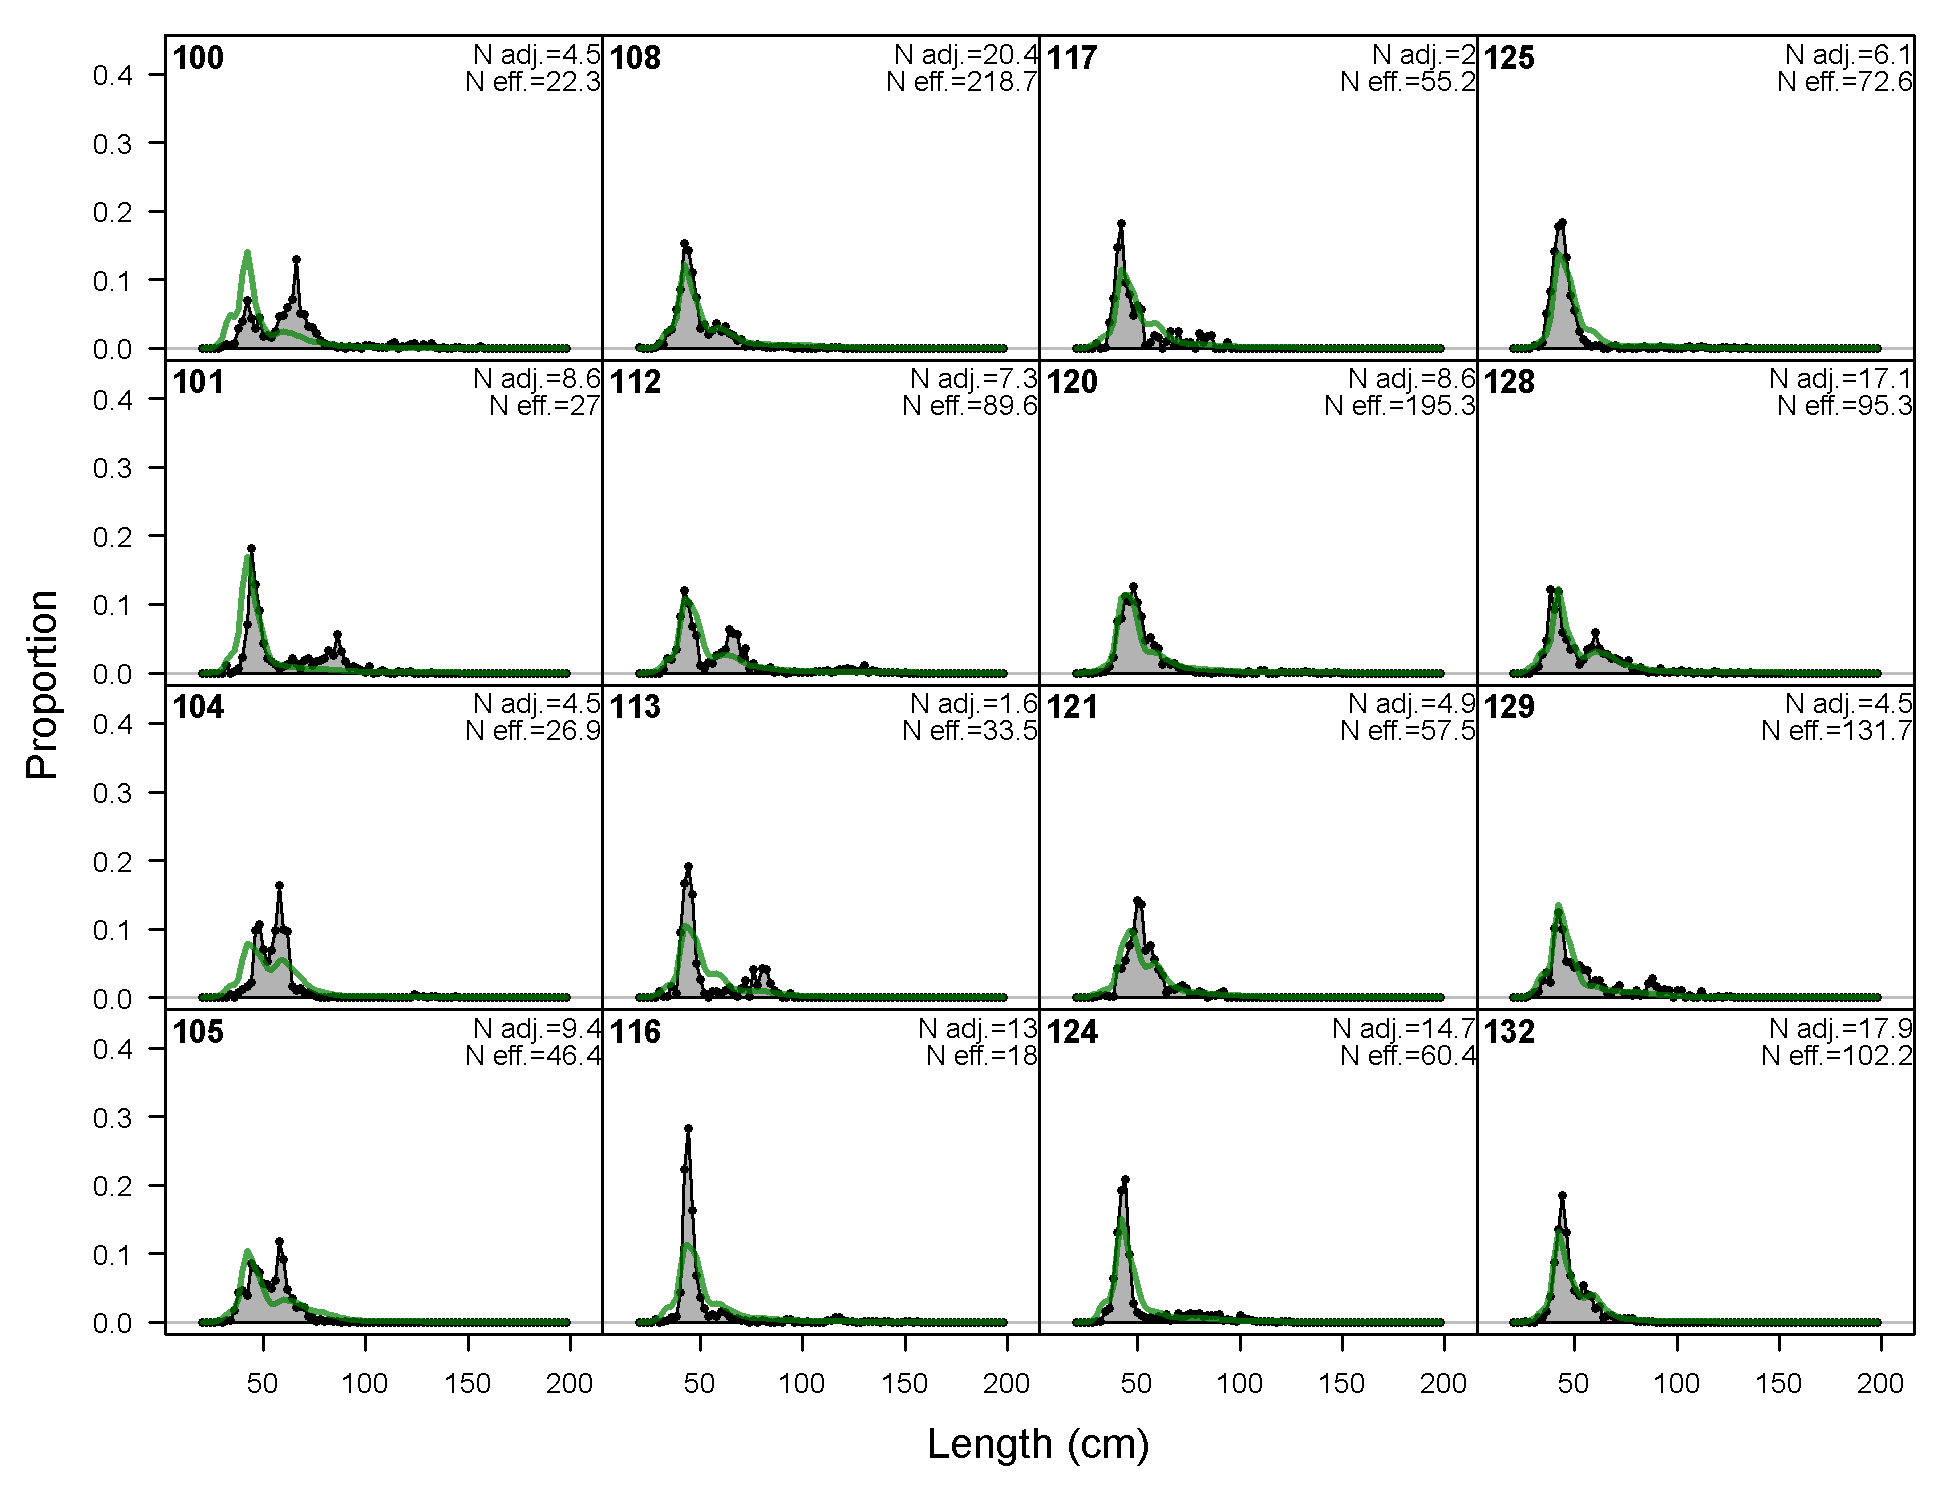
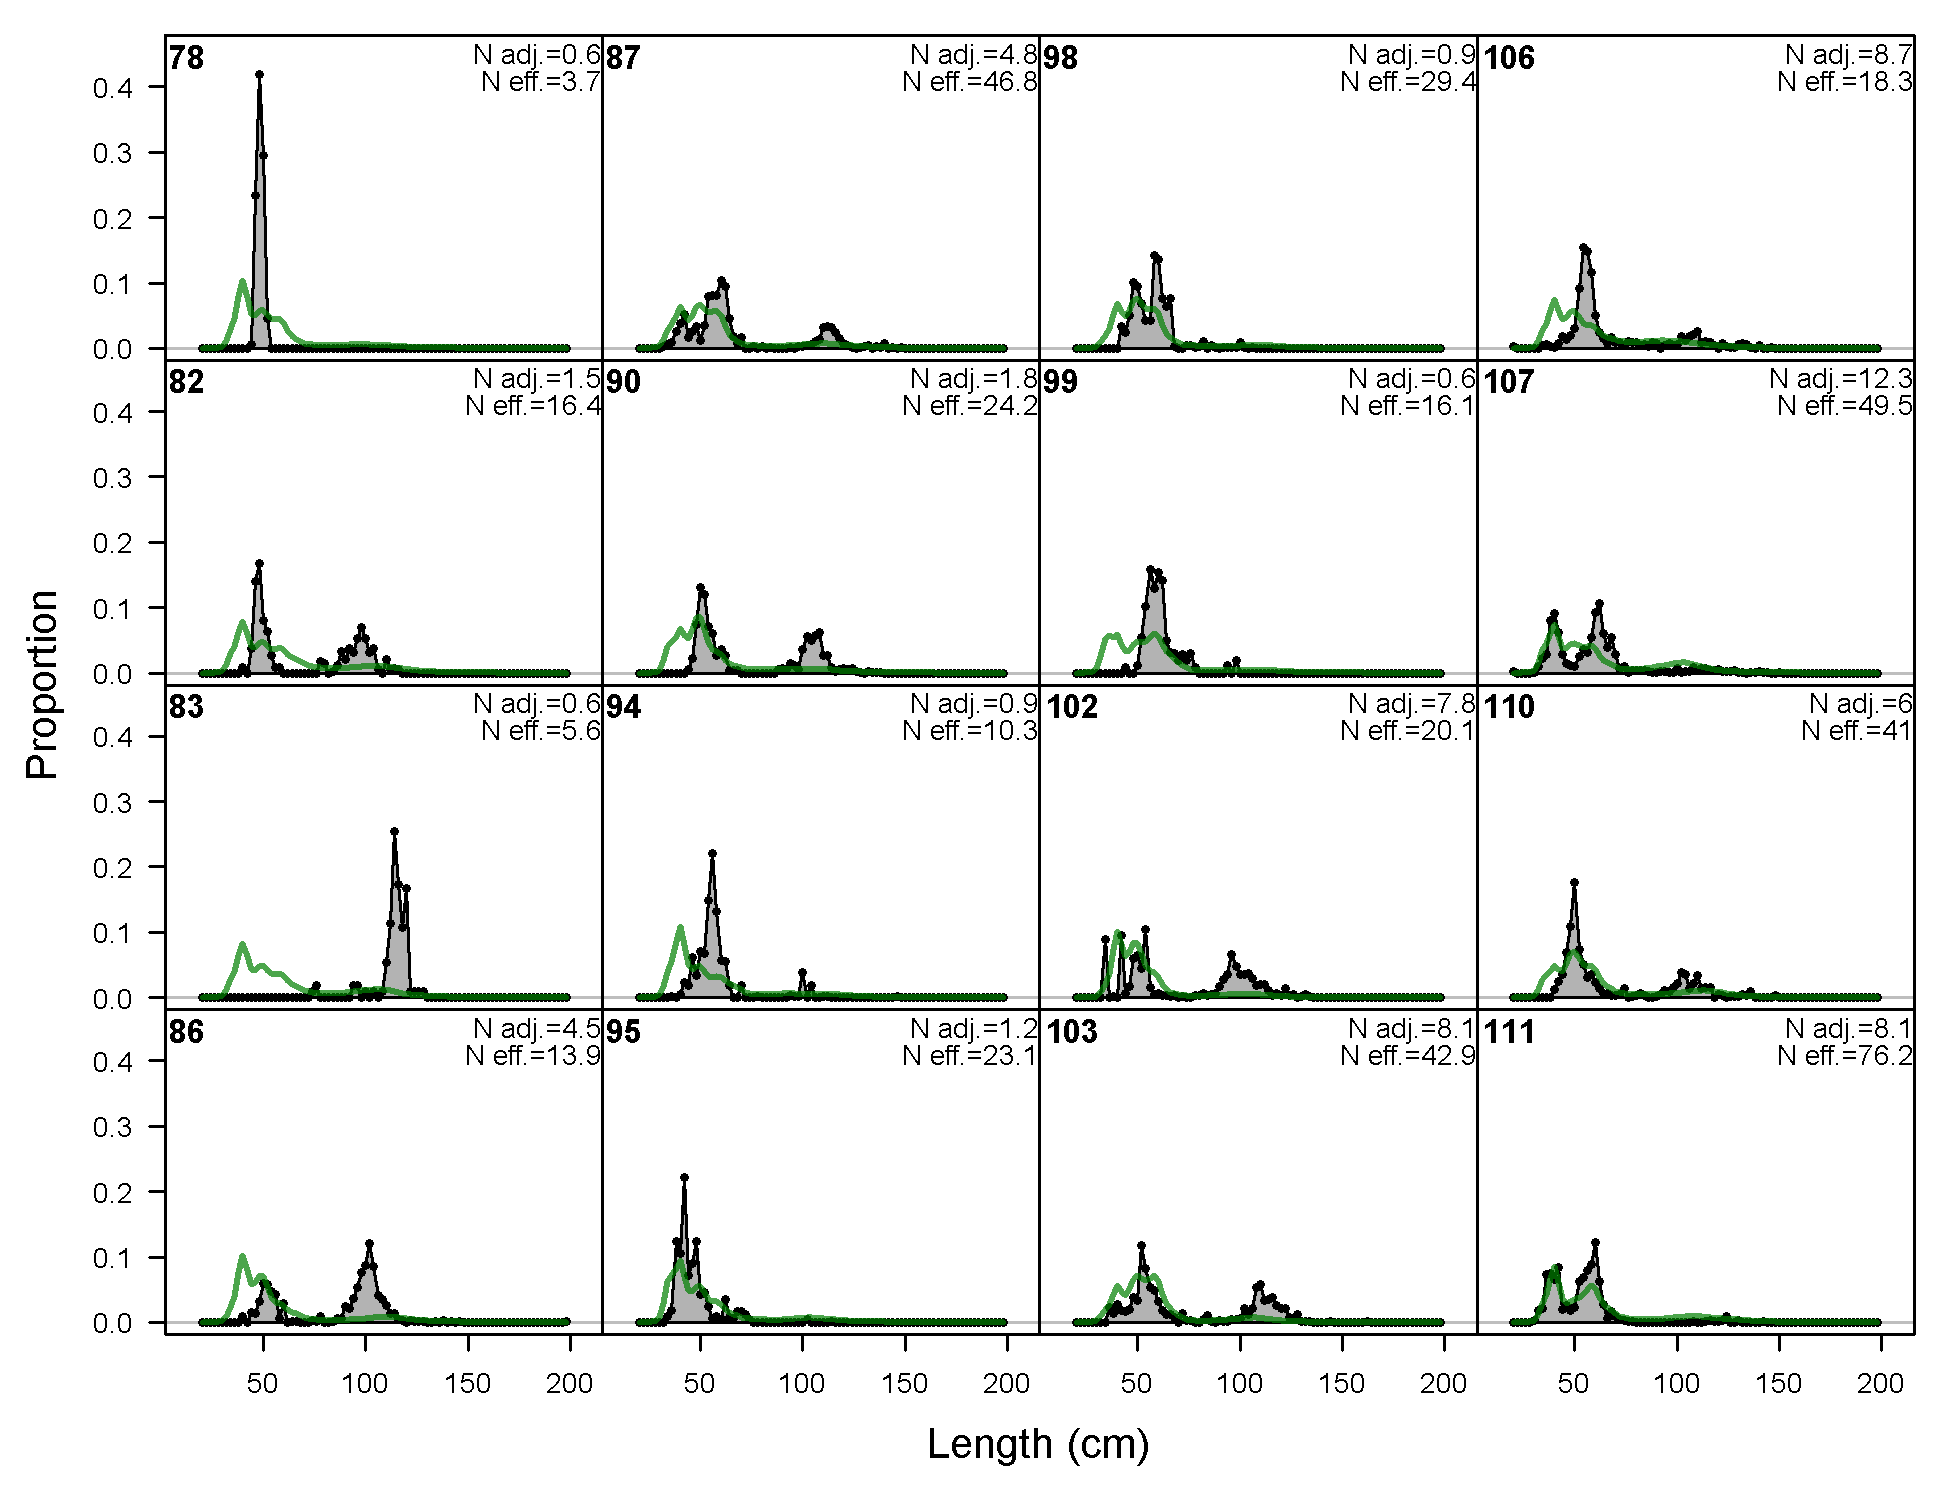
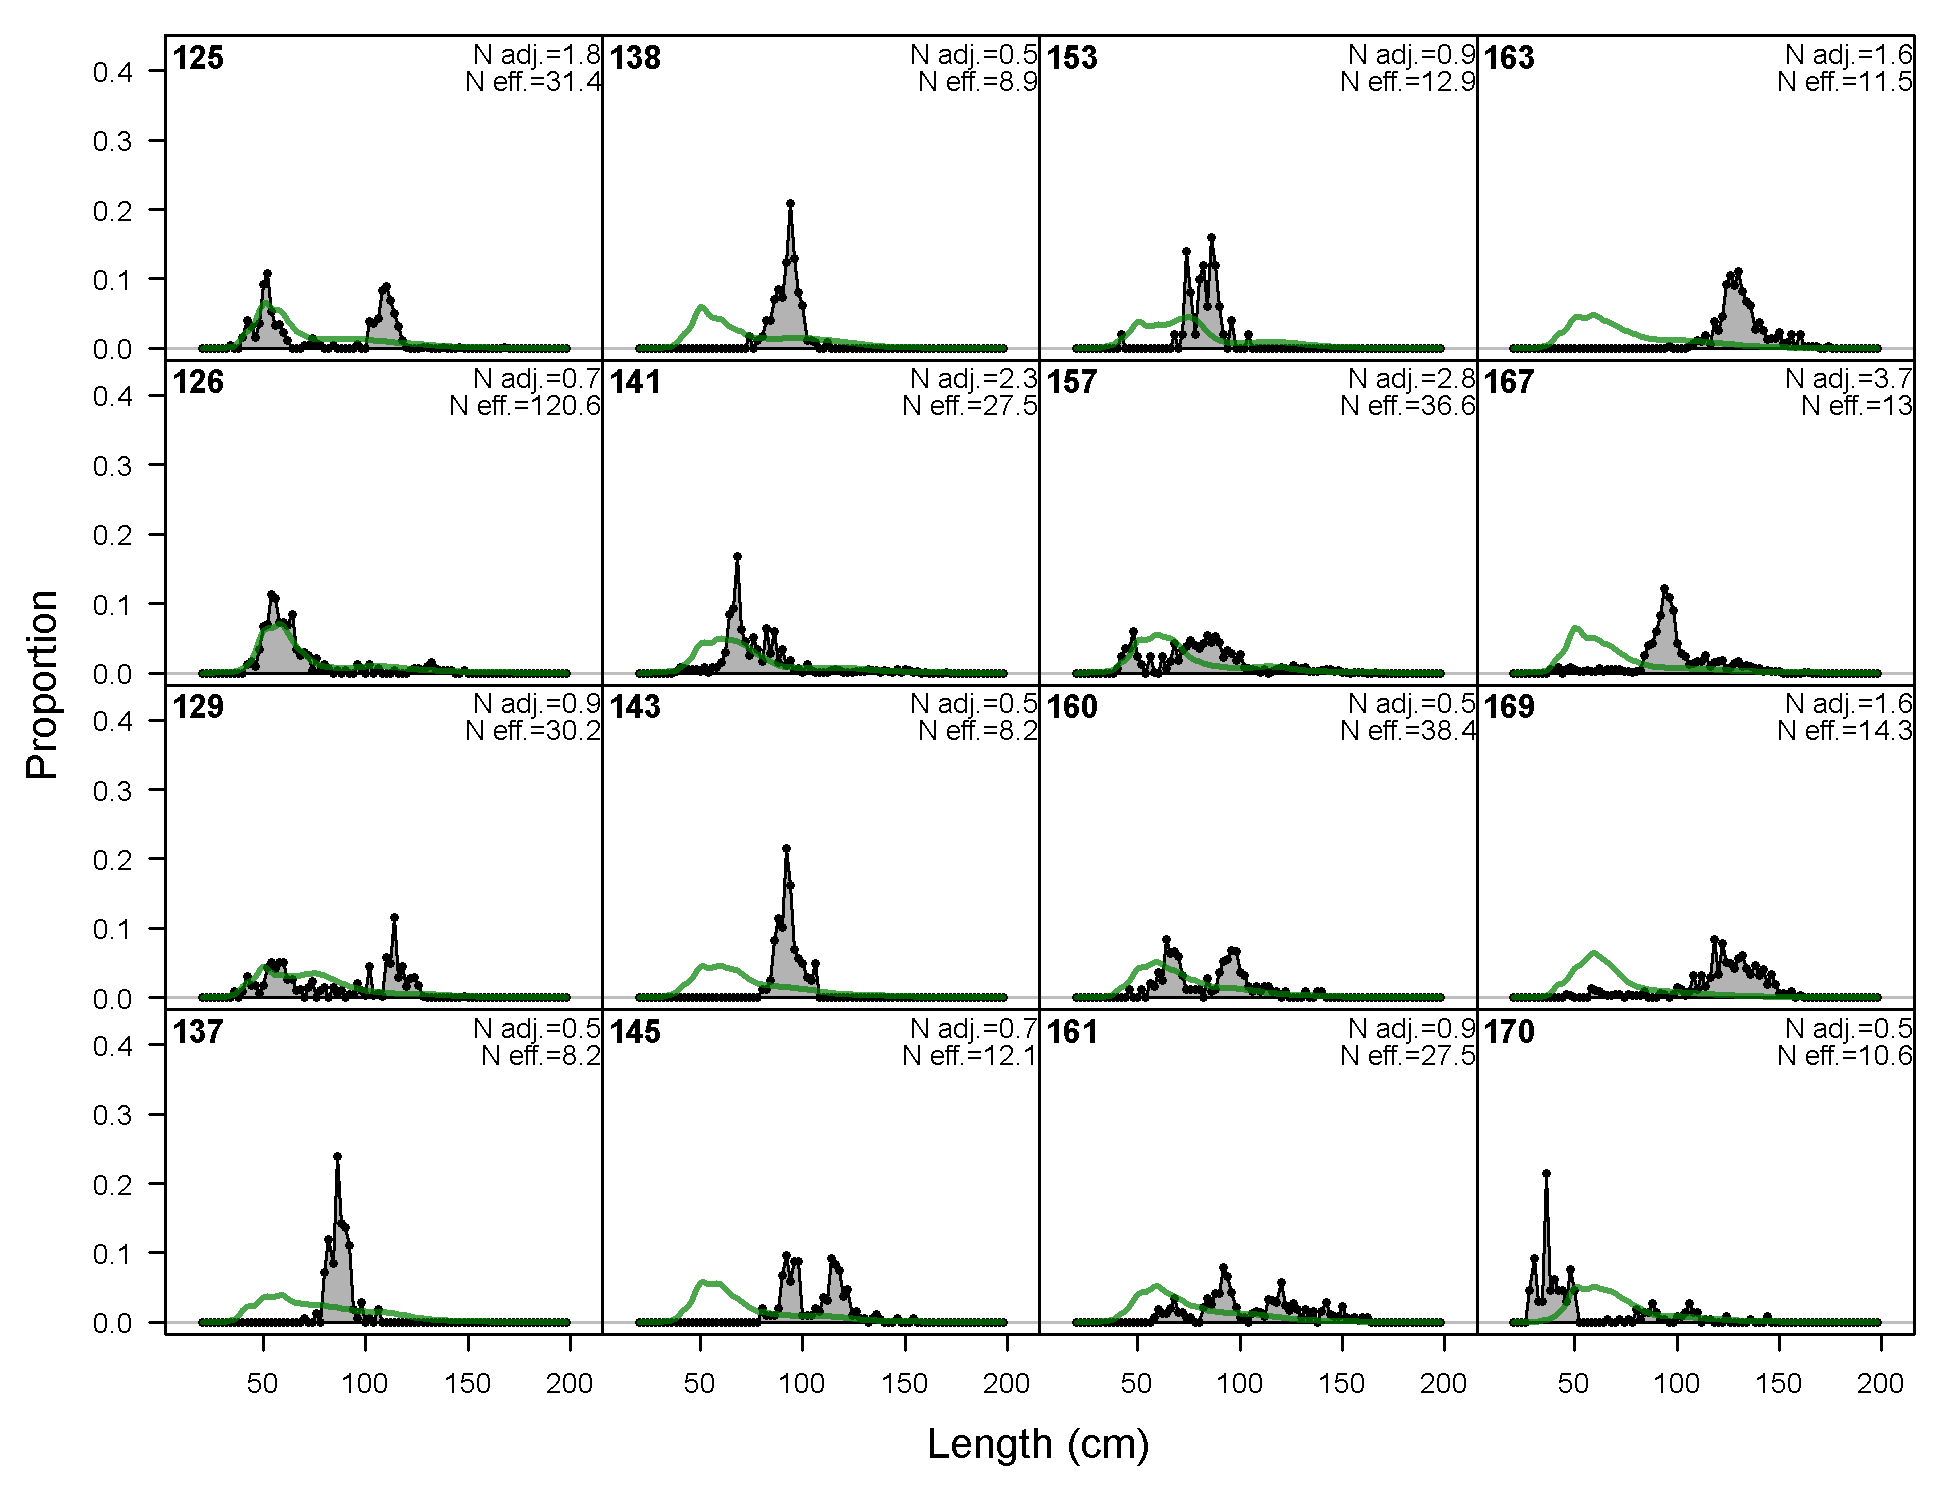
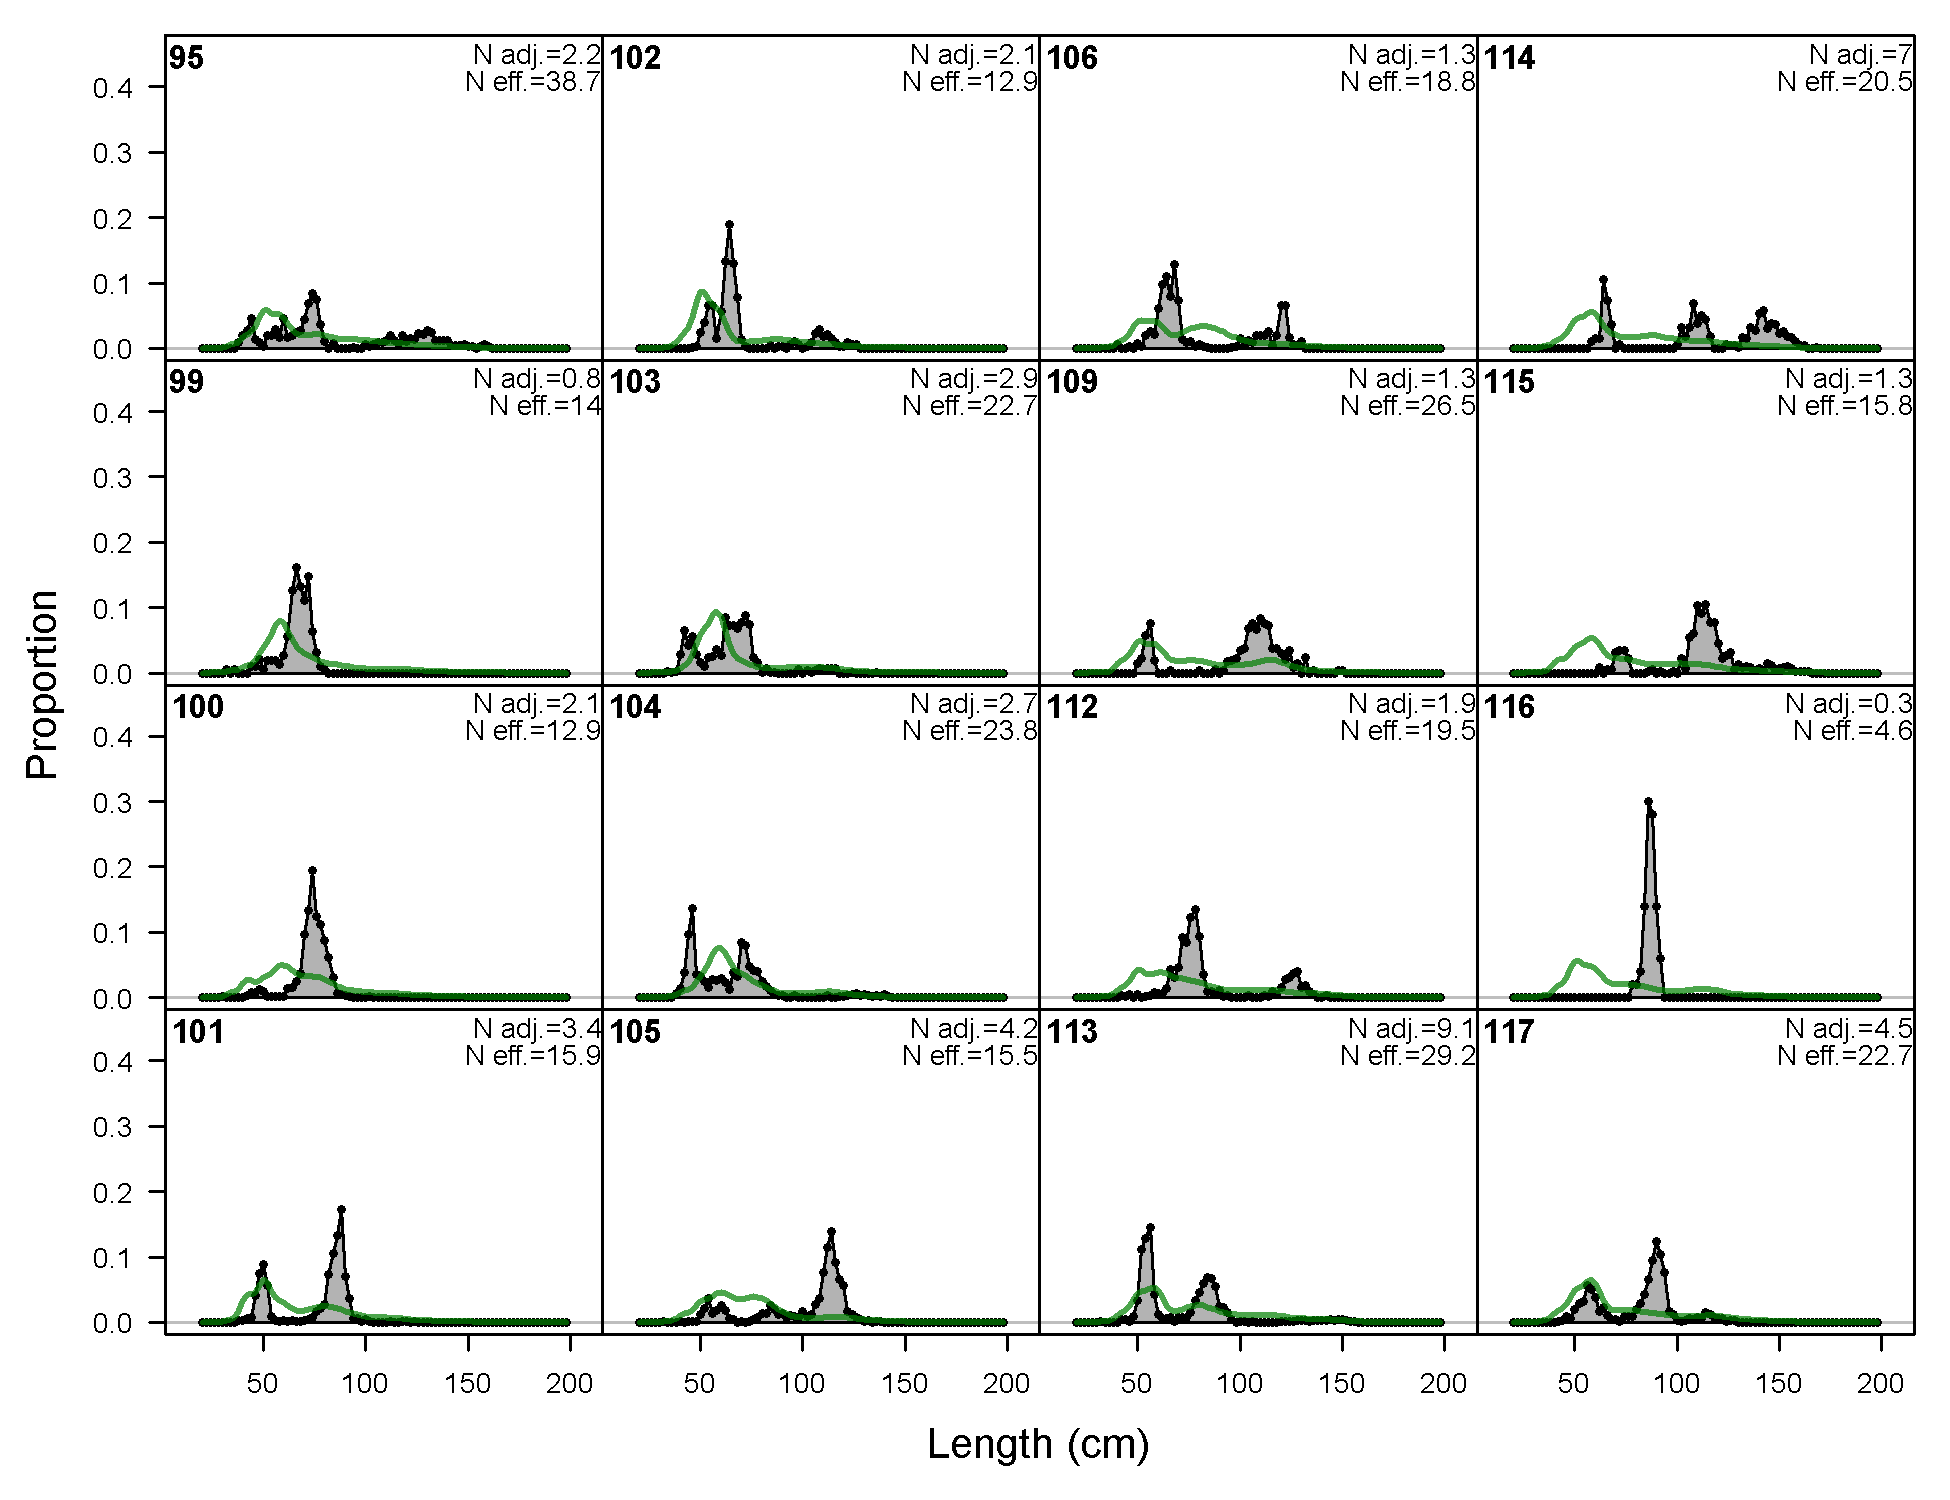
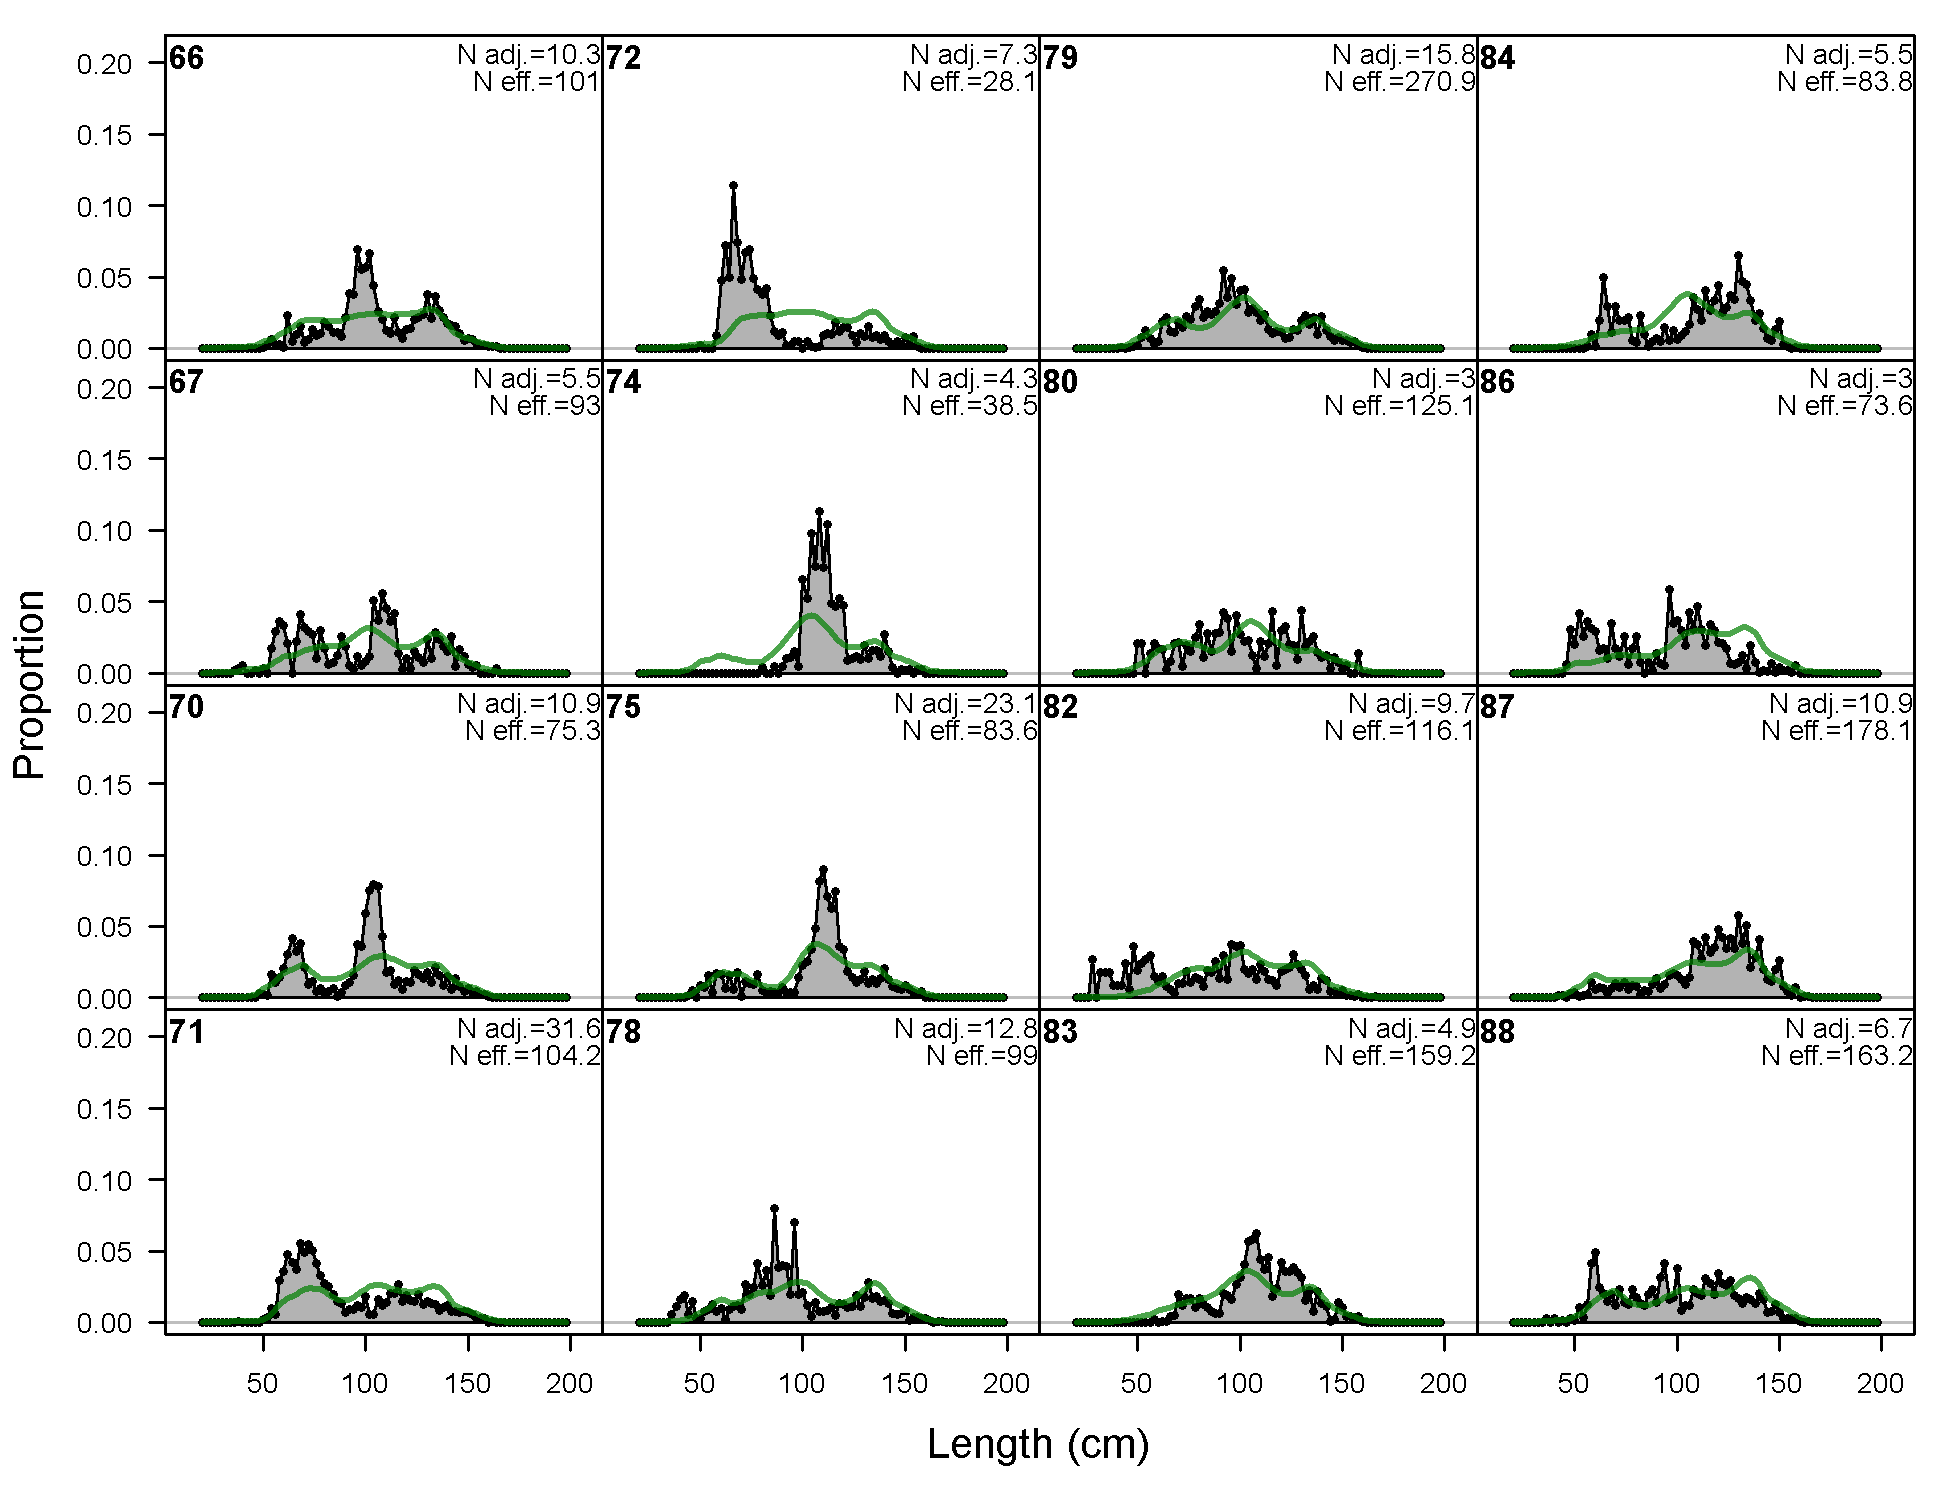
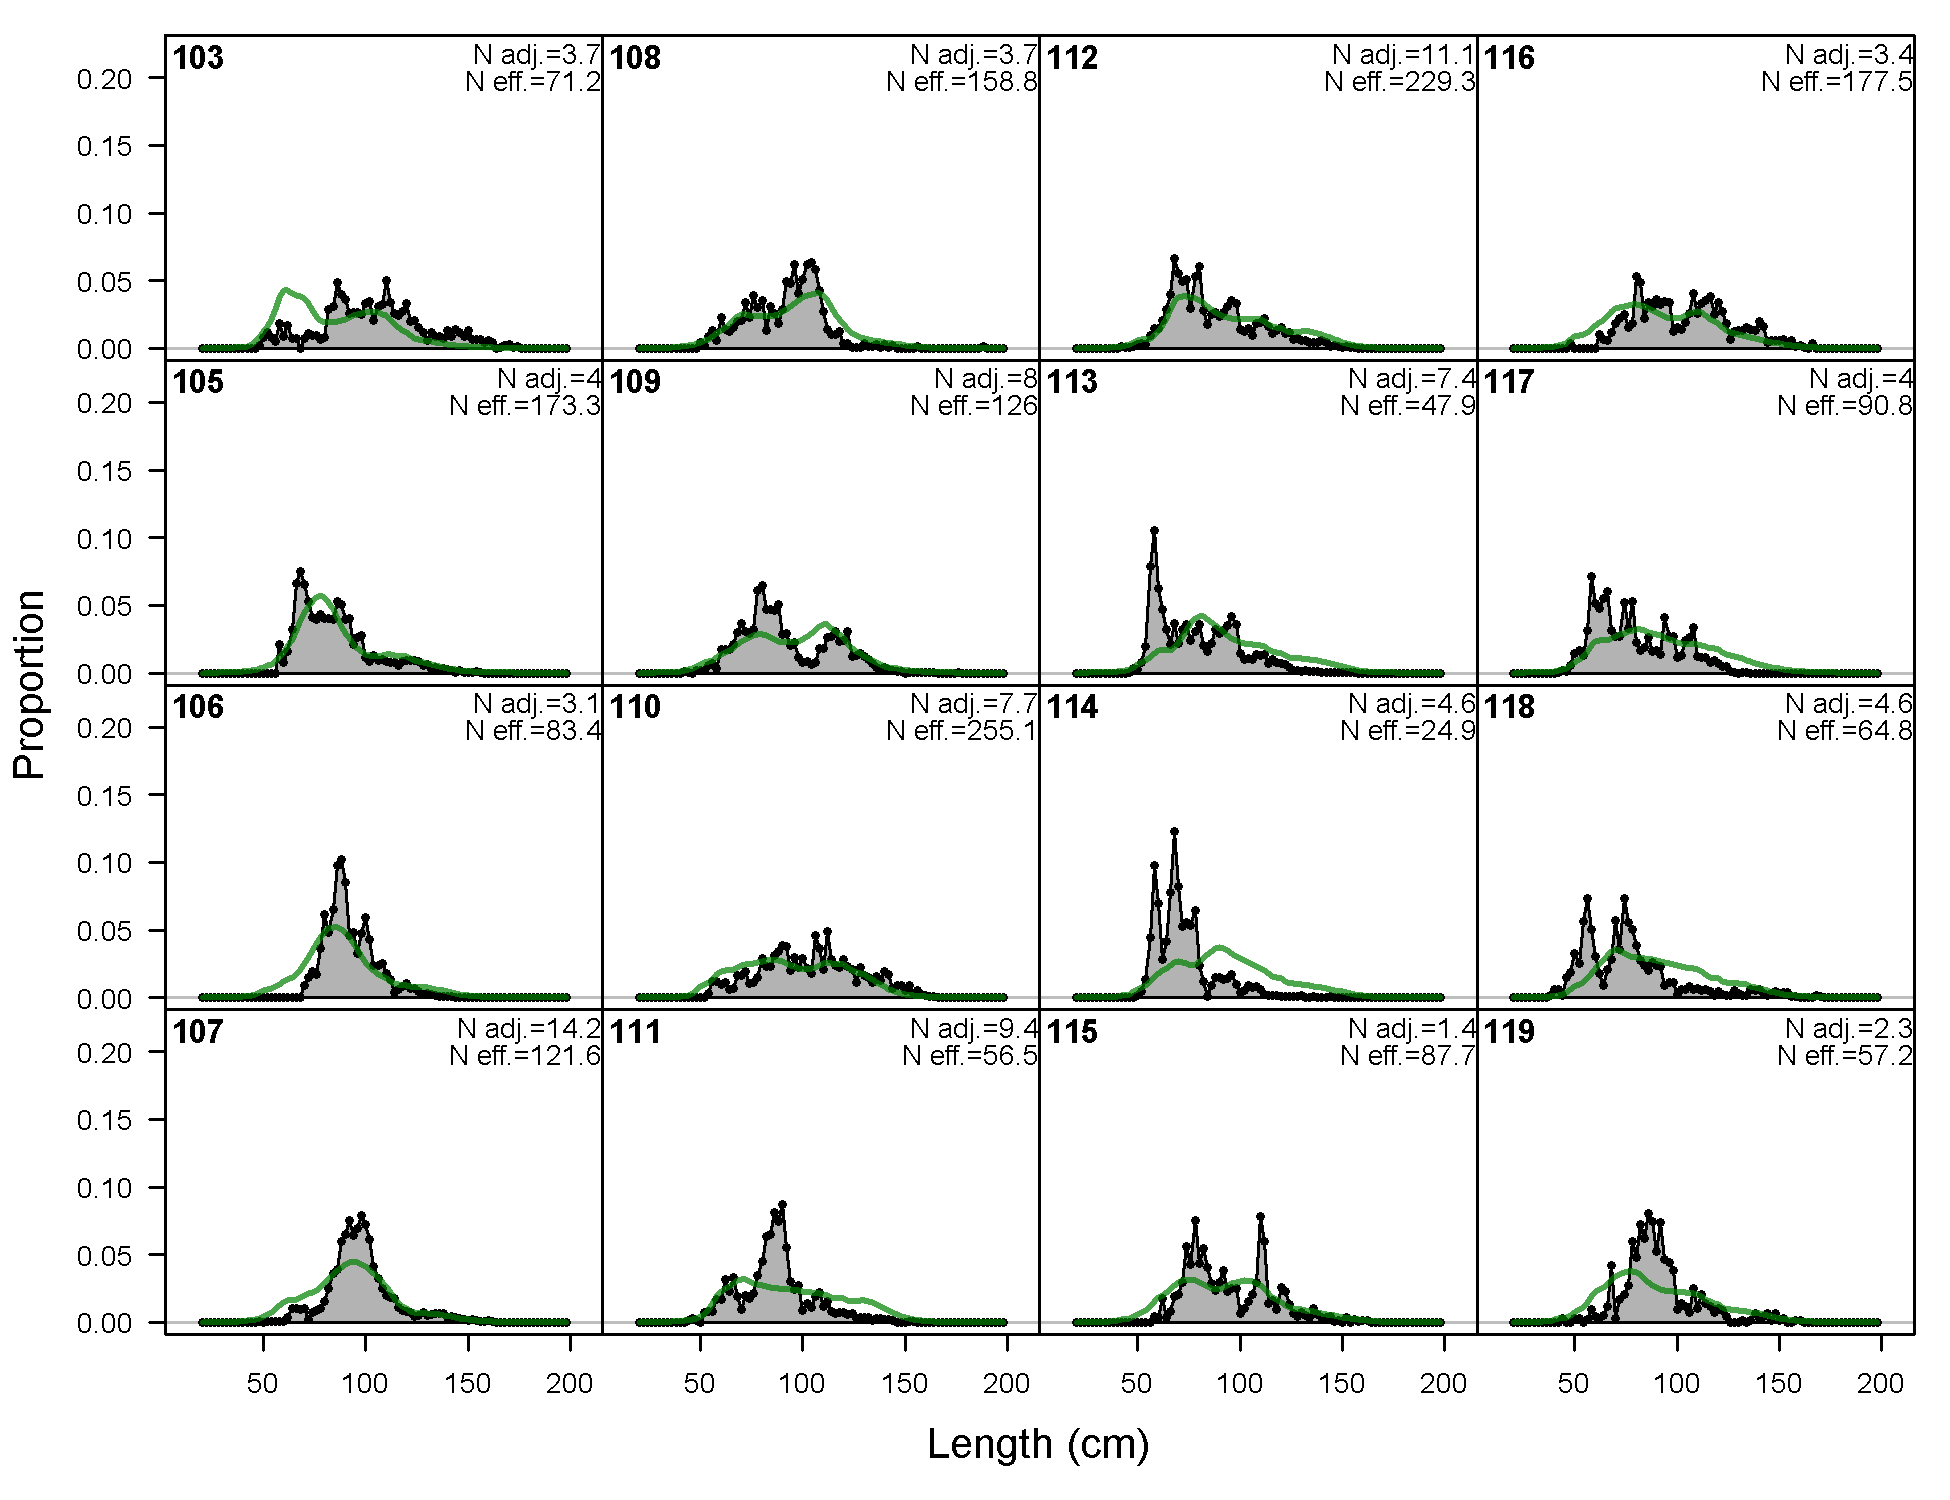
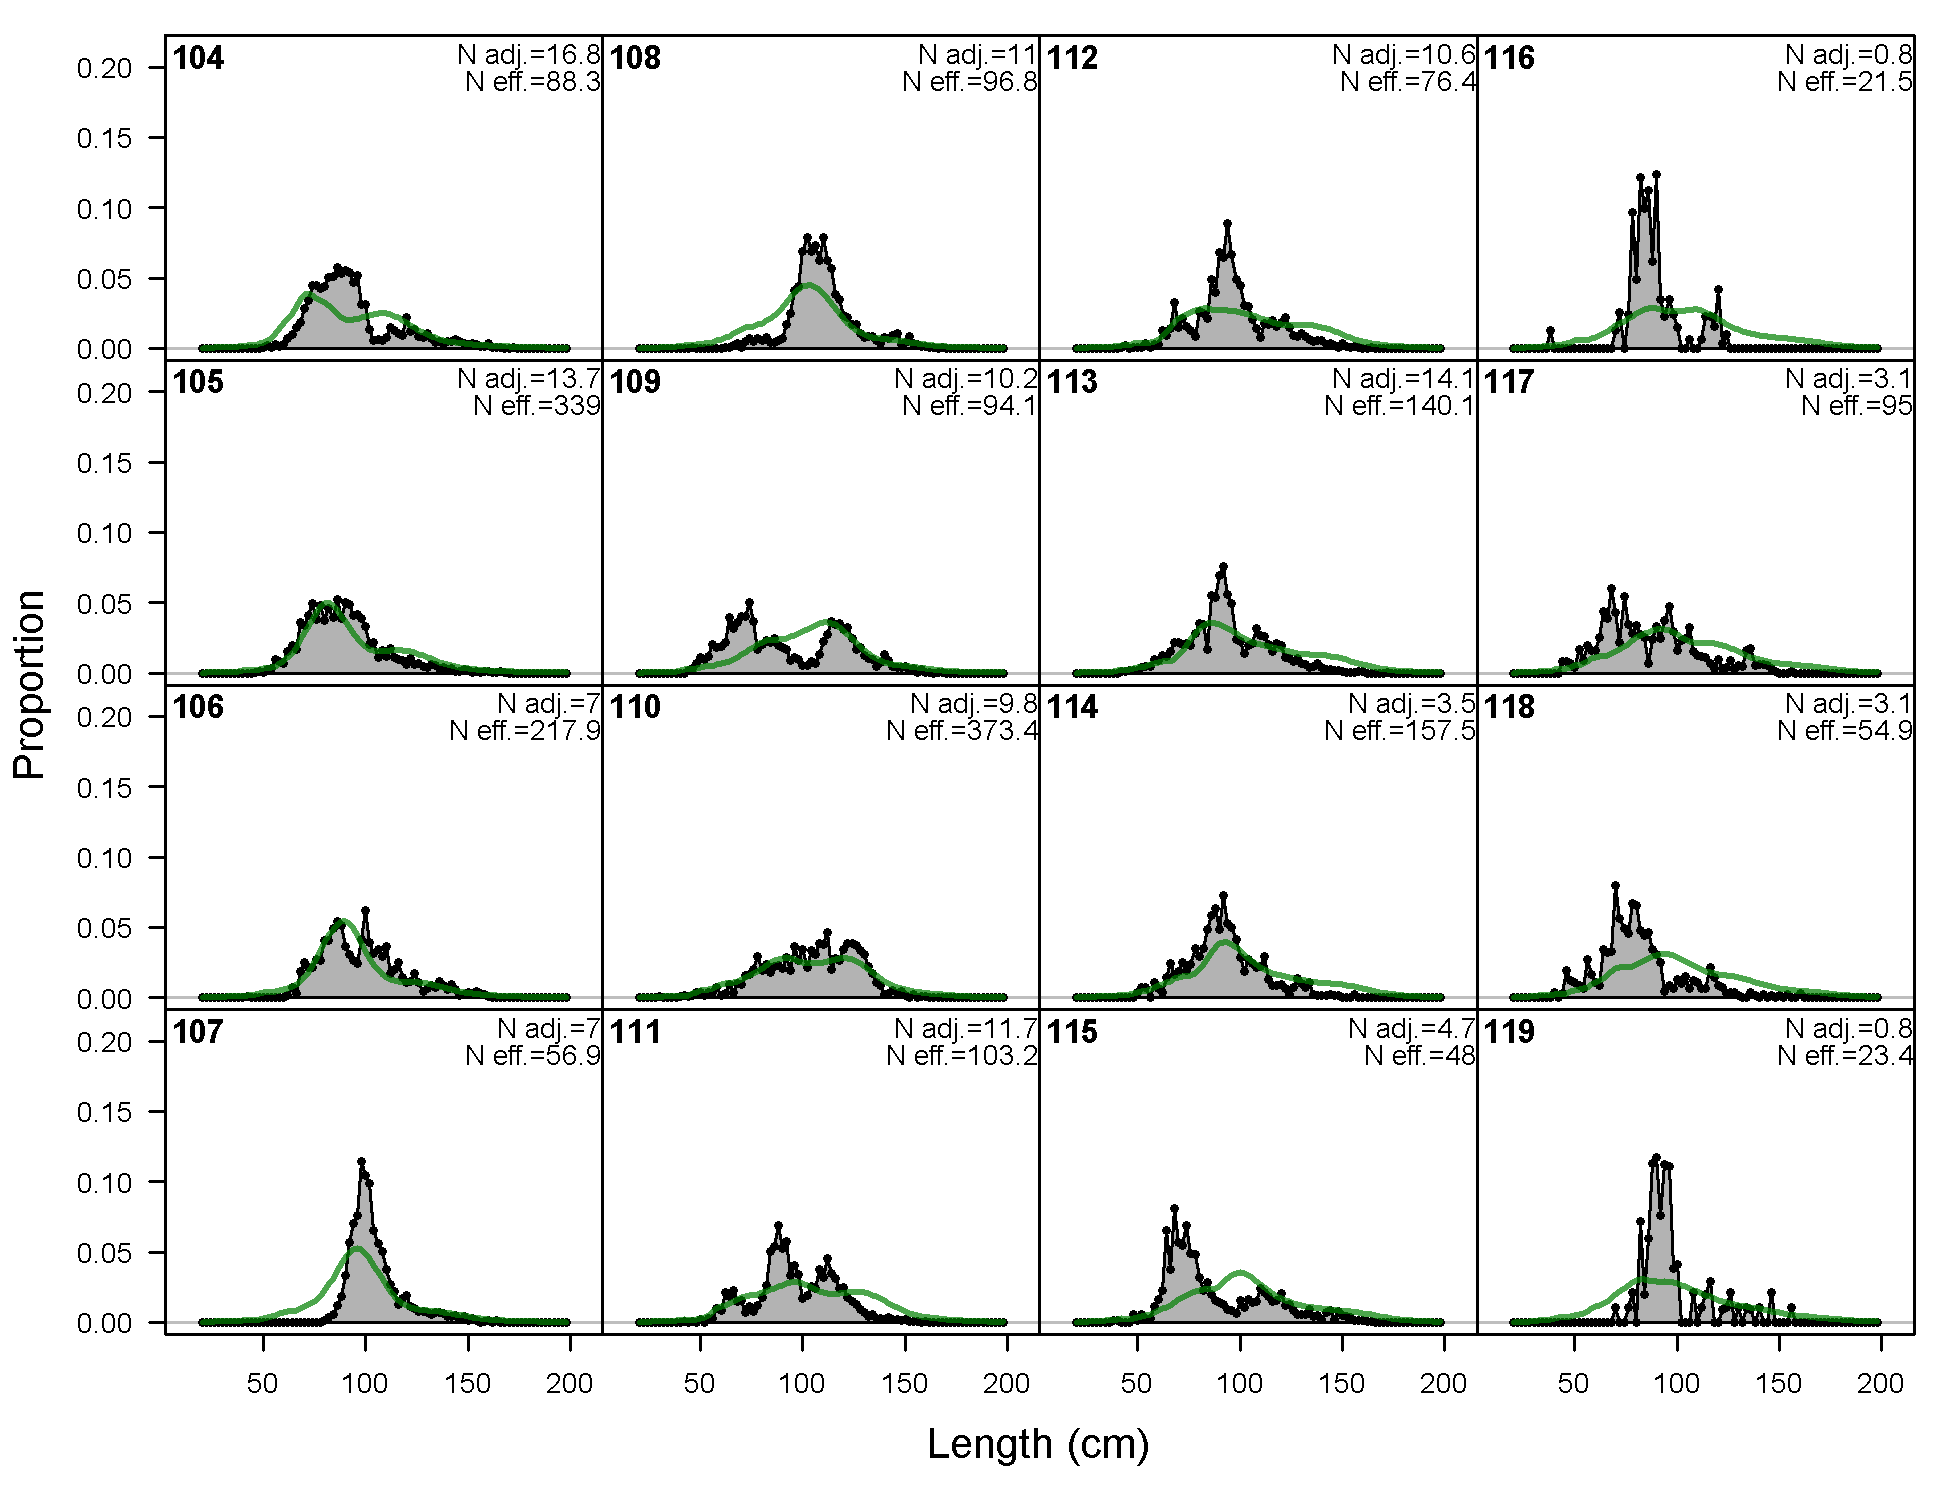
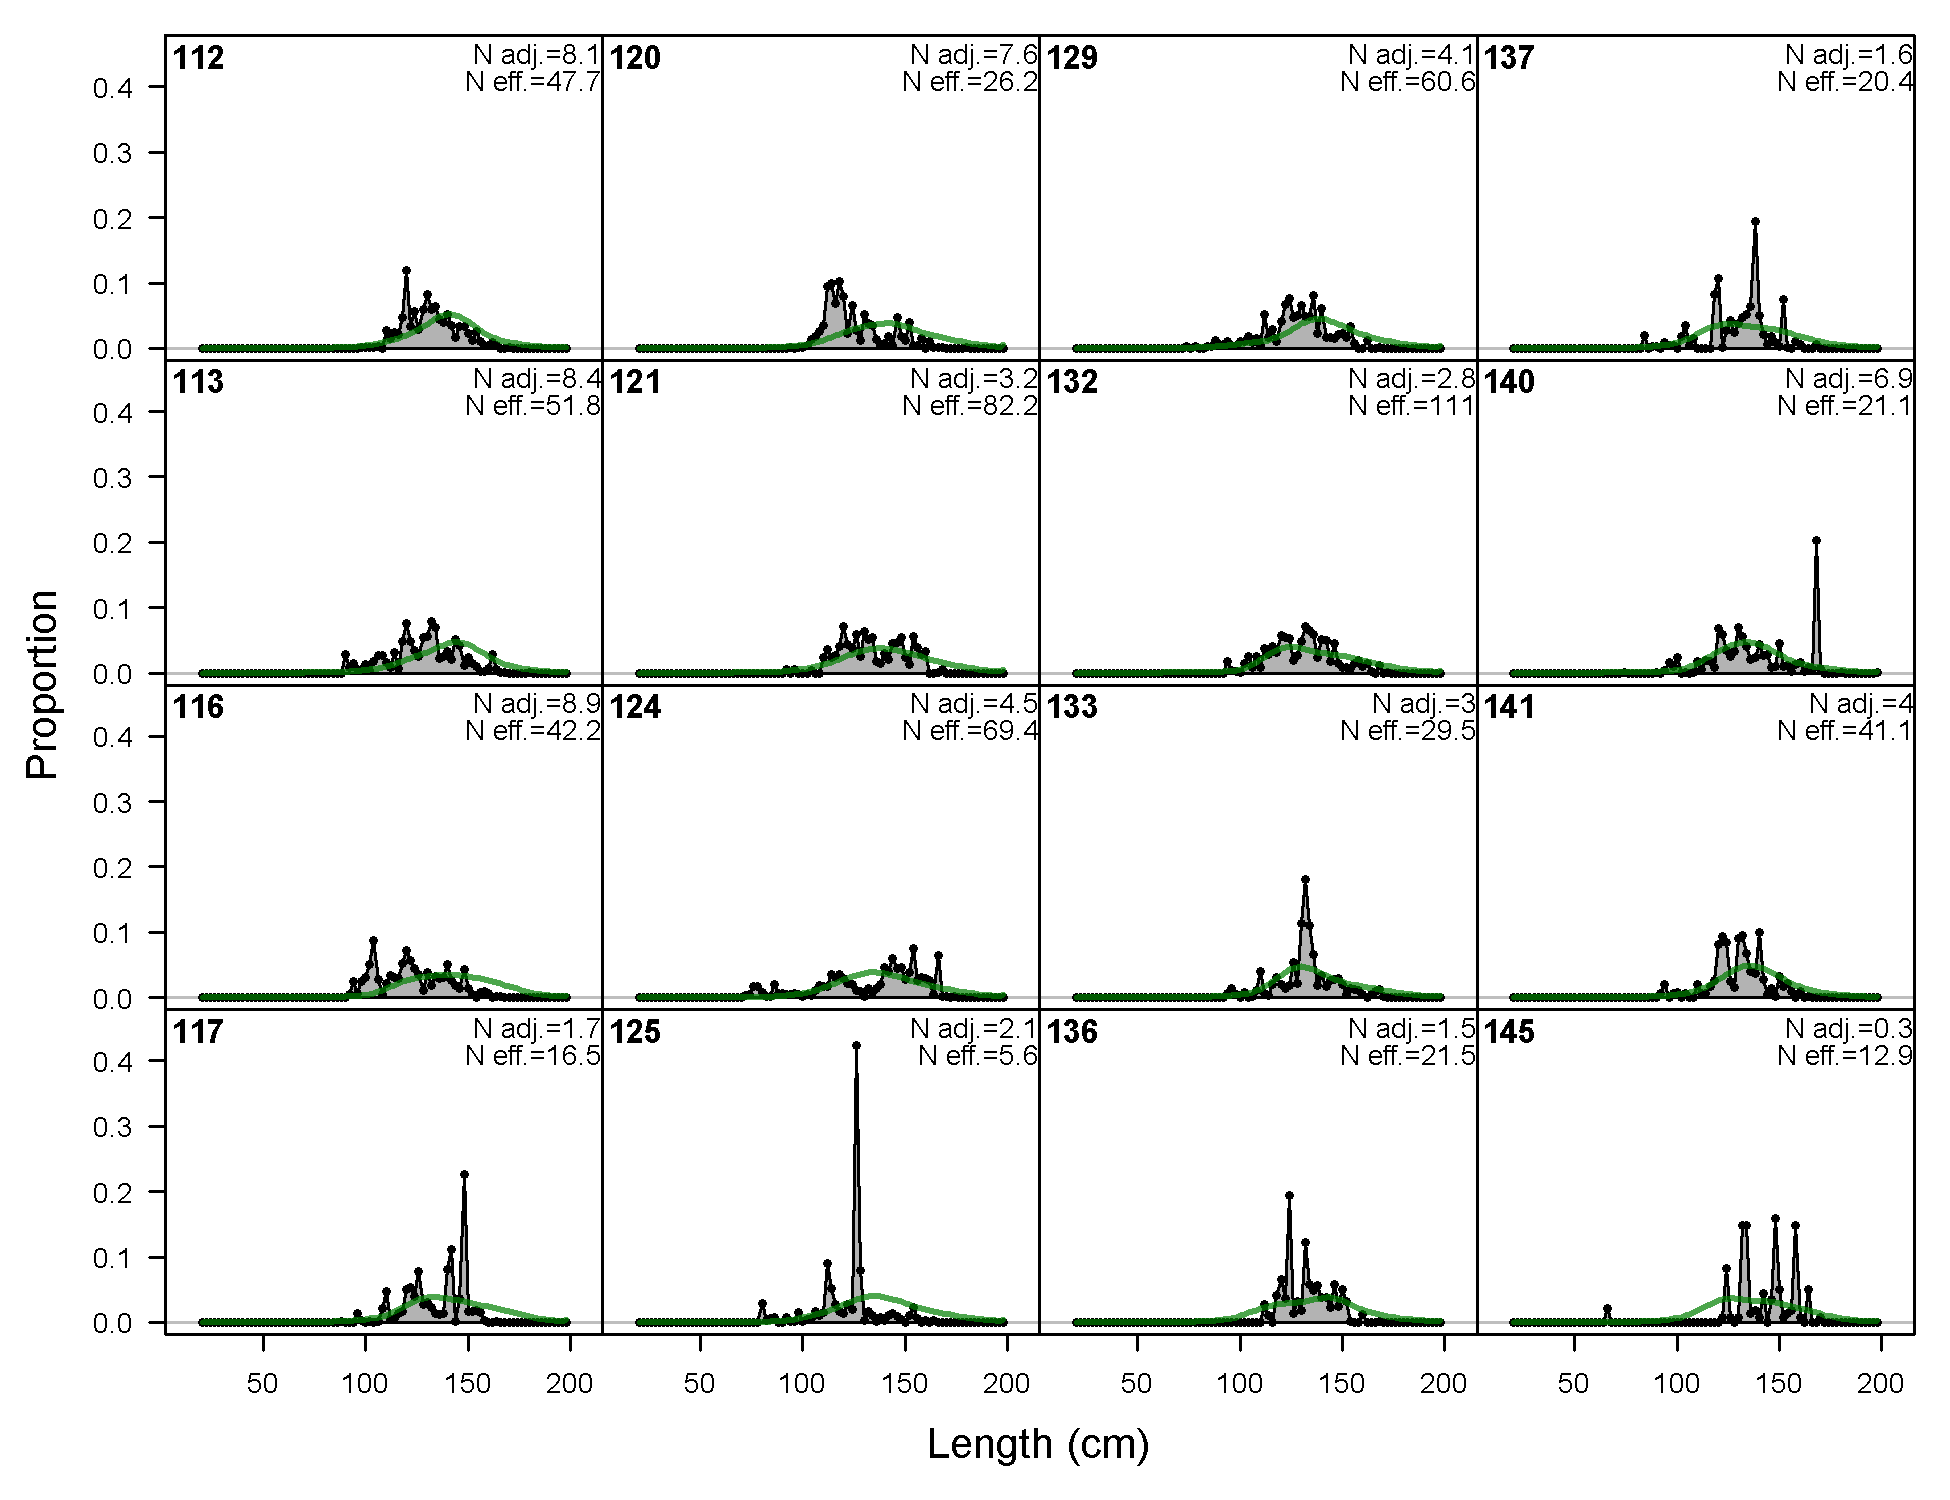
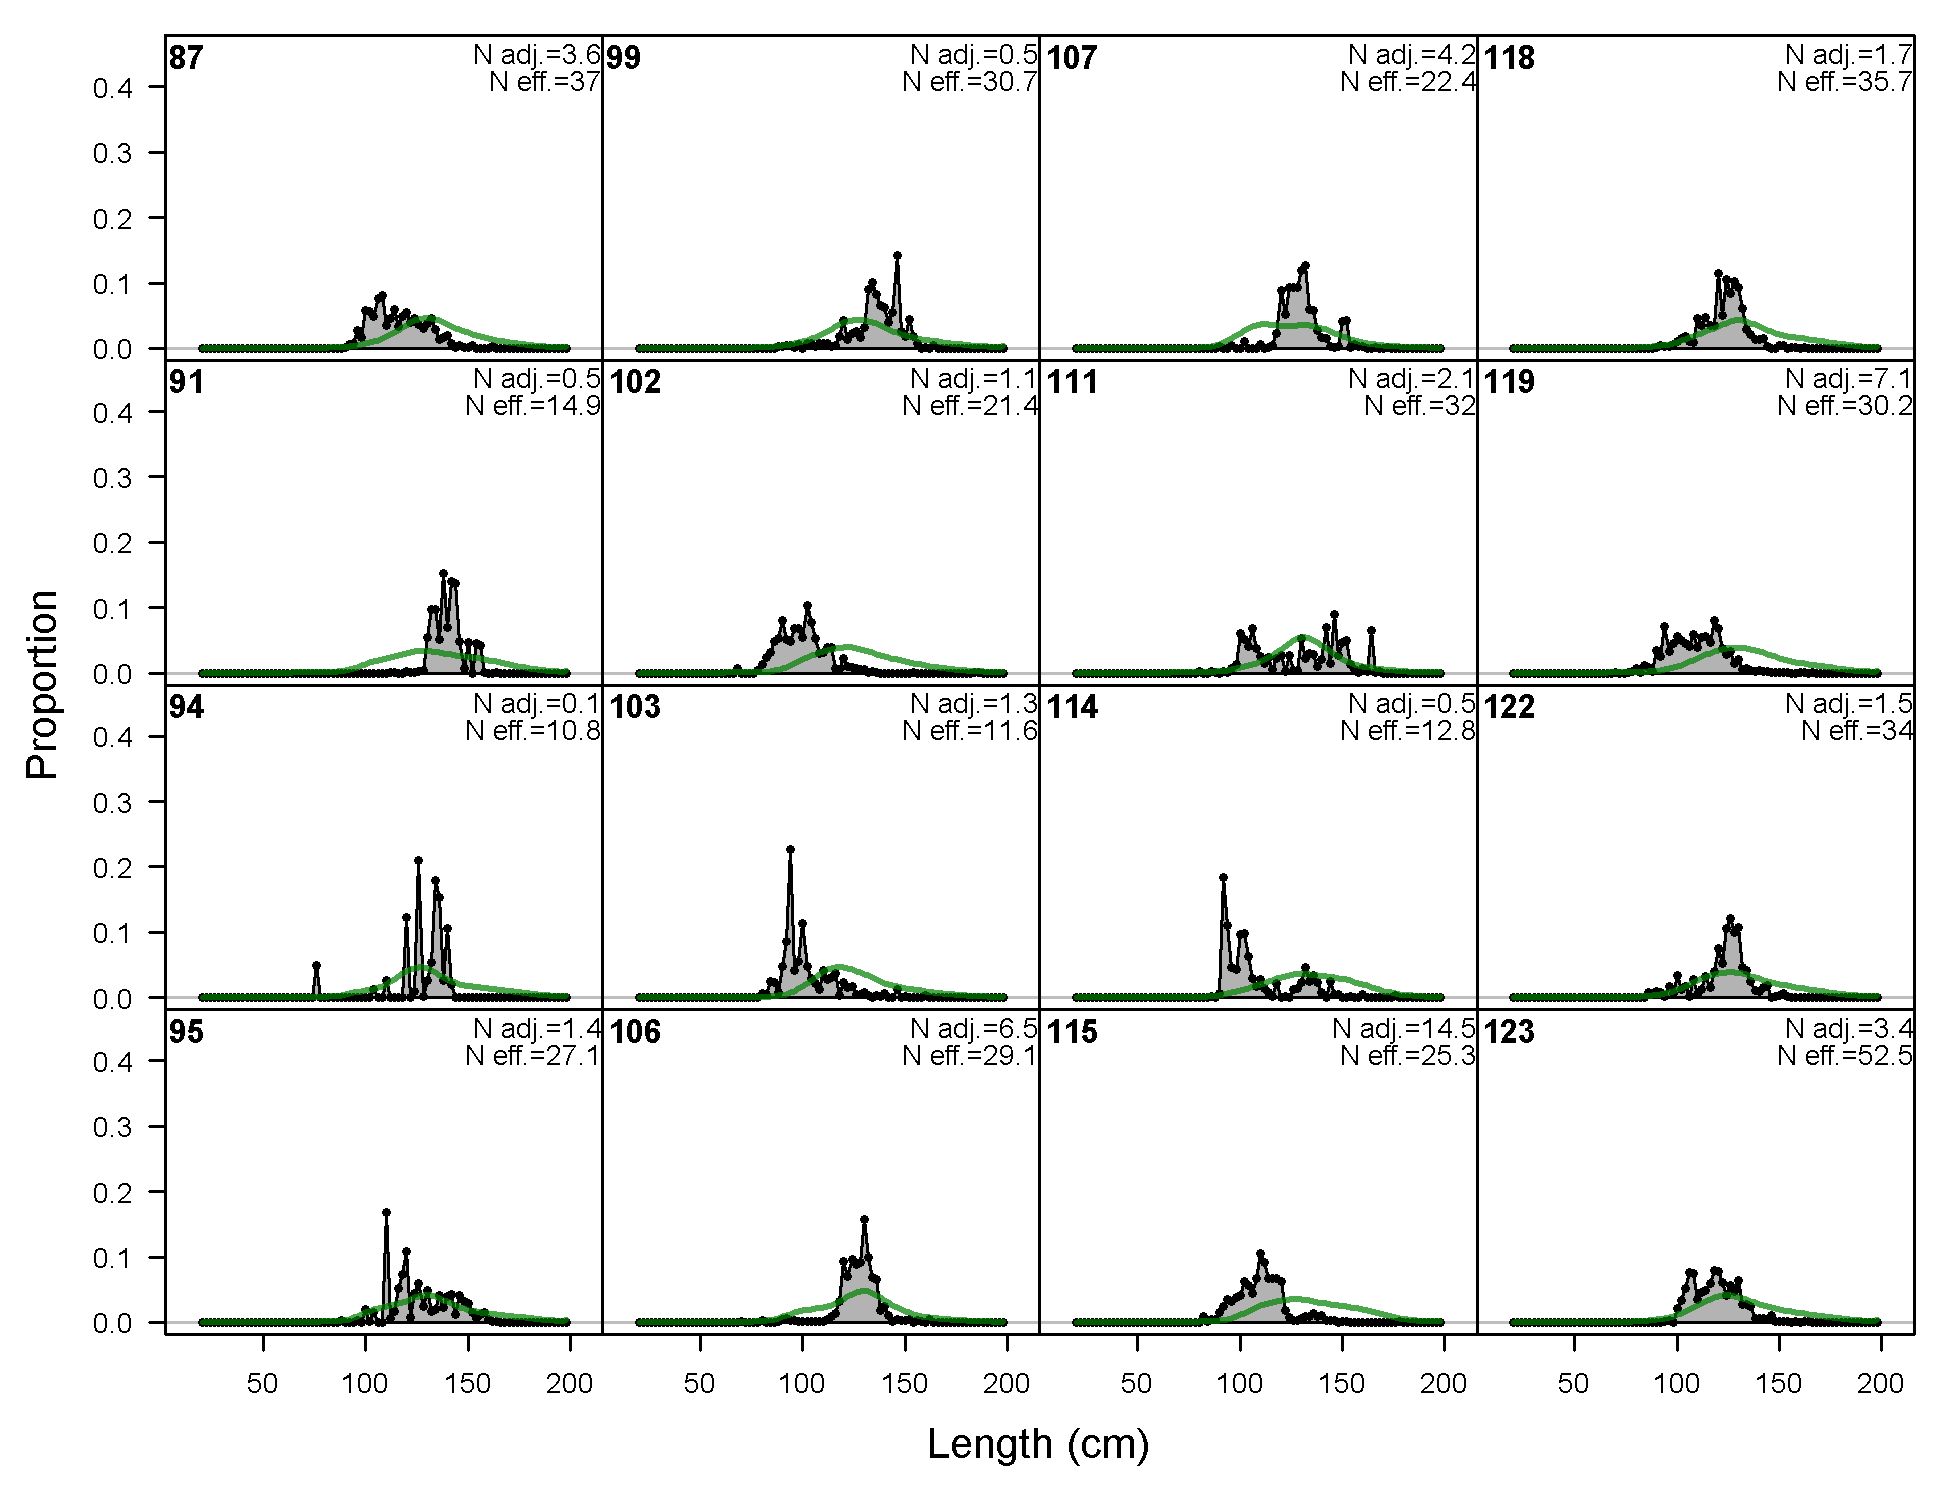
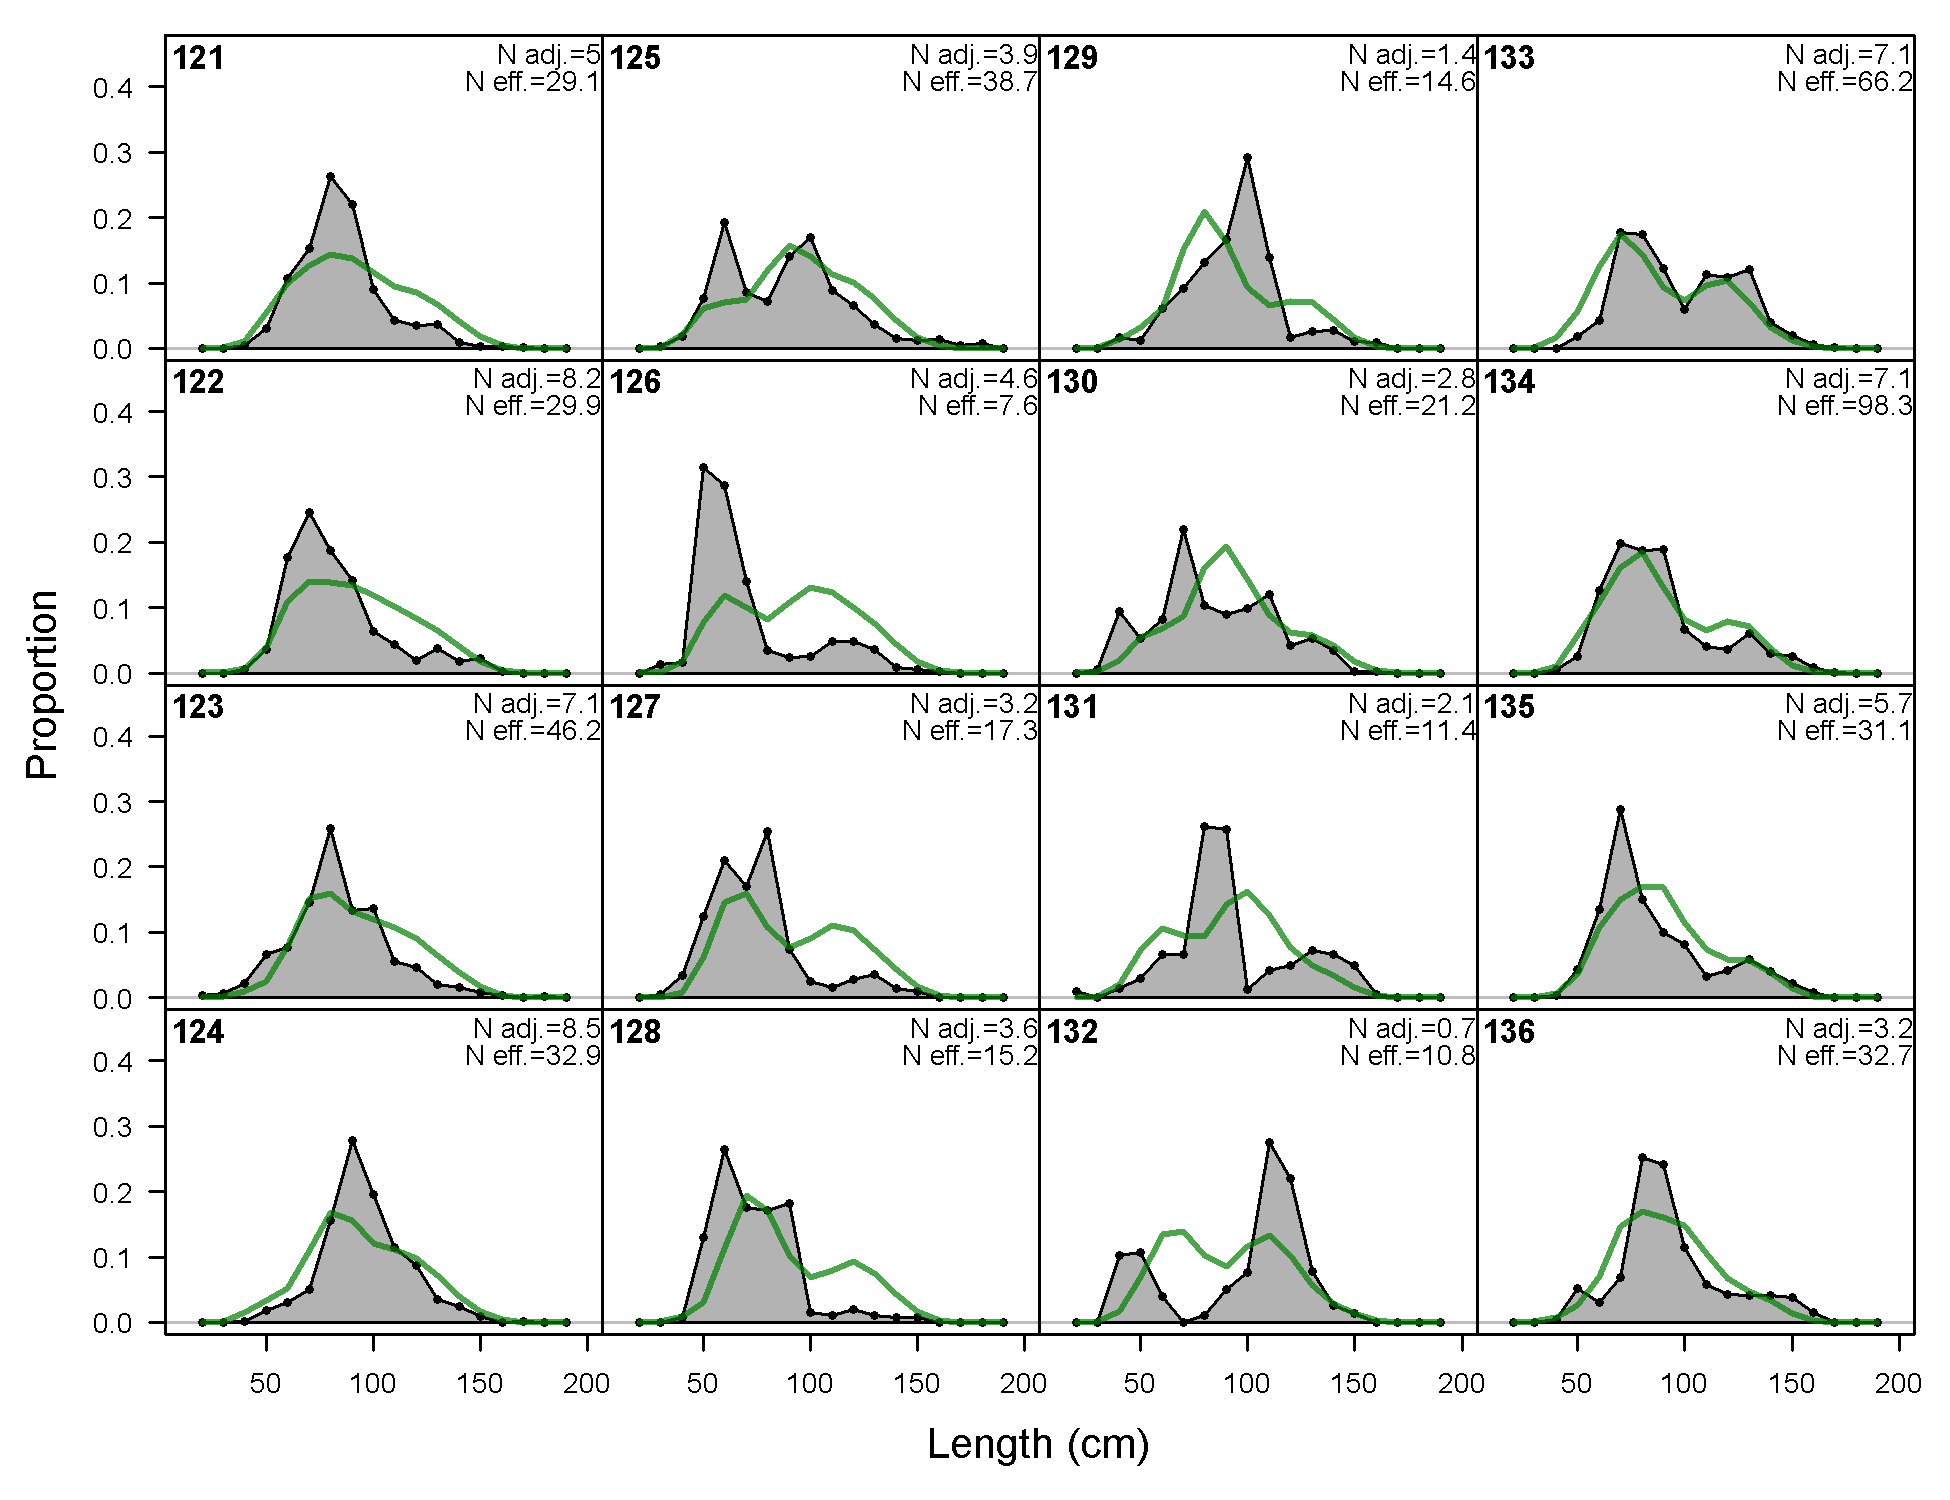
Length comps, whole catch, F7-OBJ_Nc_Q23 (plot 1 of 4).
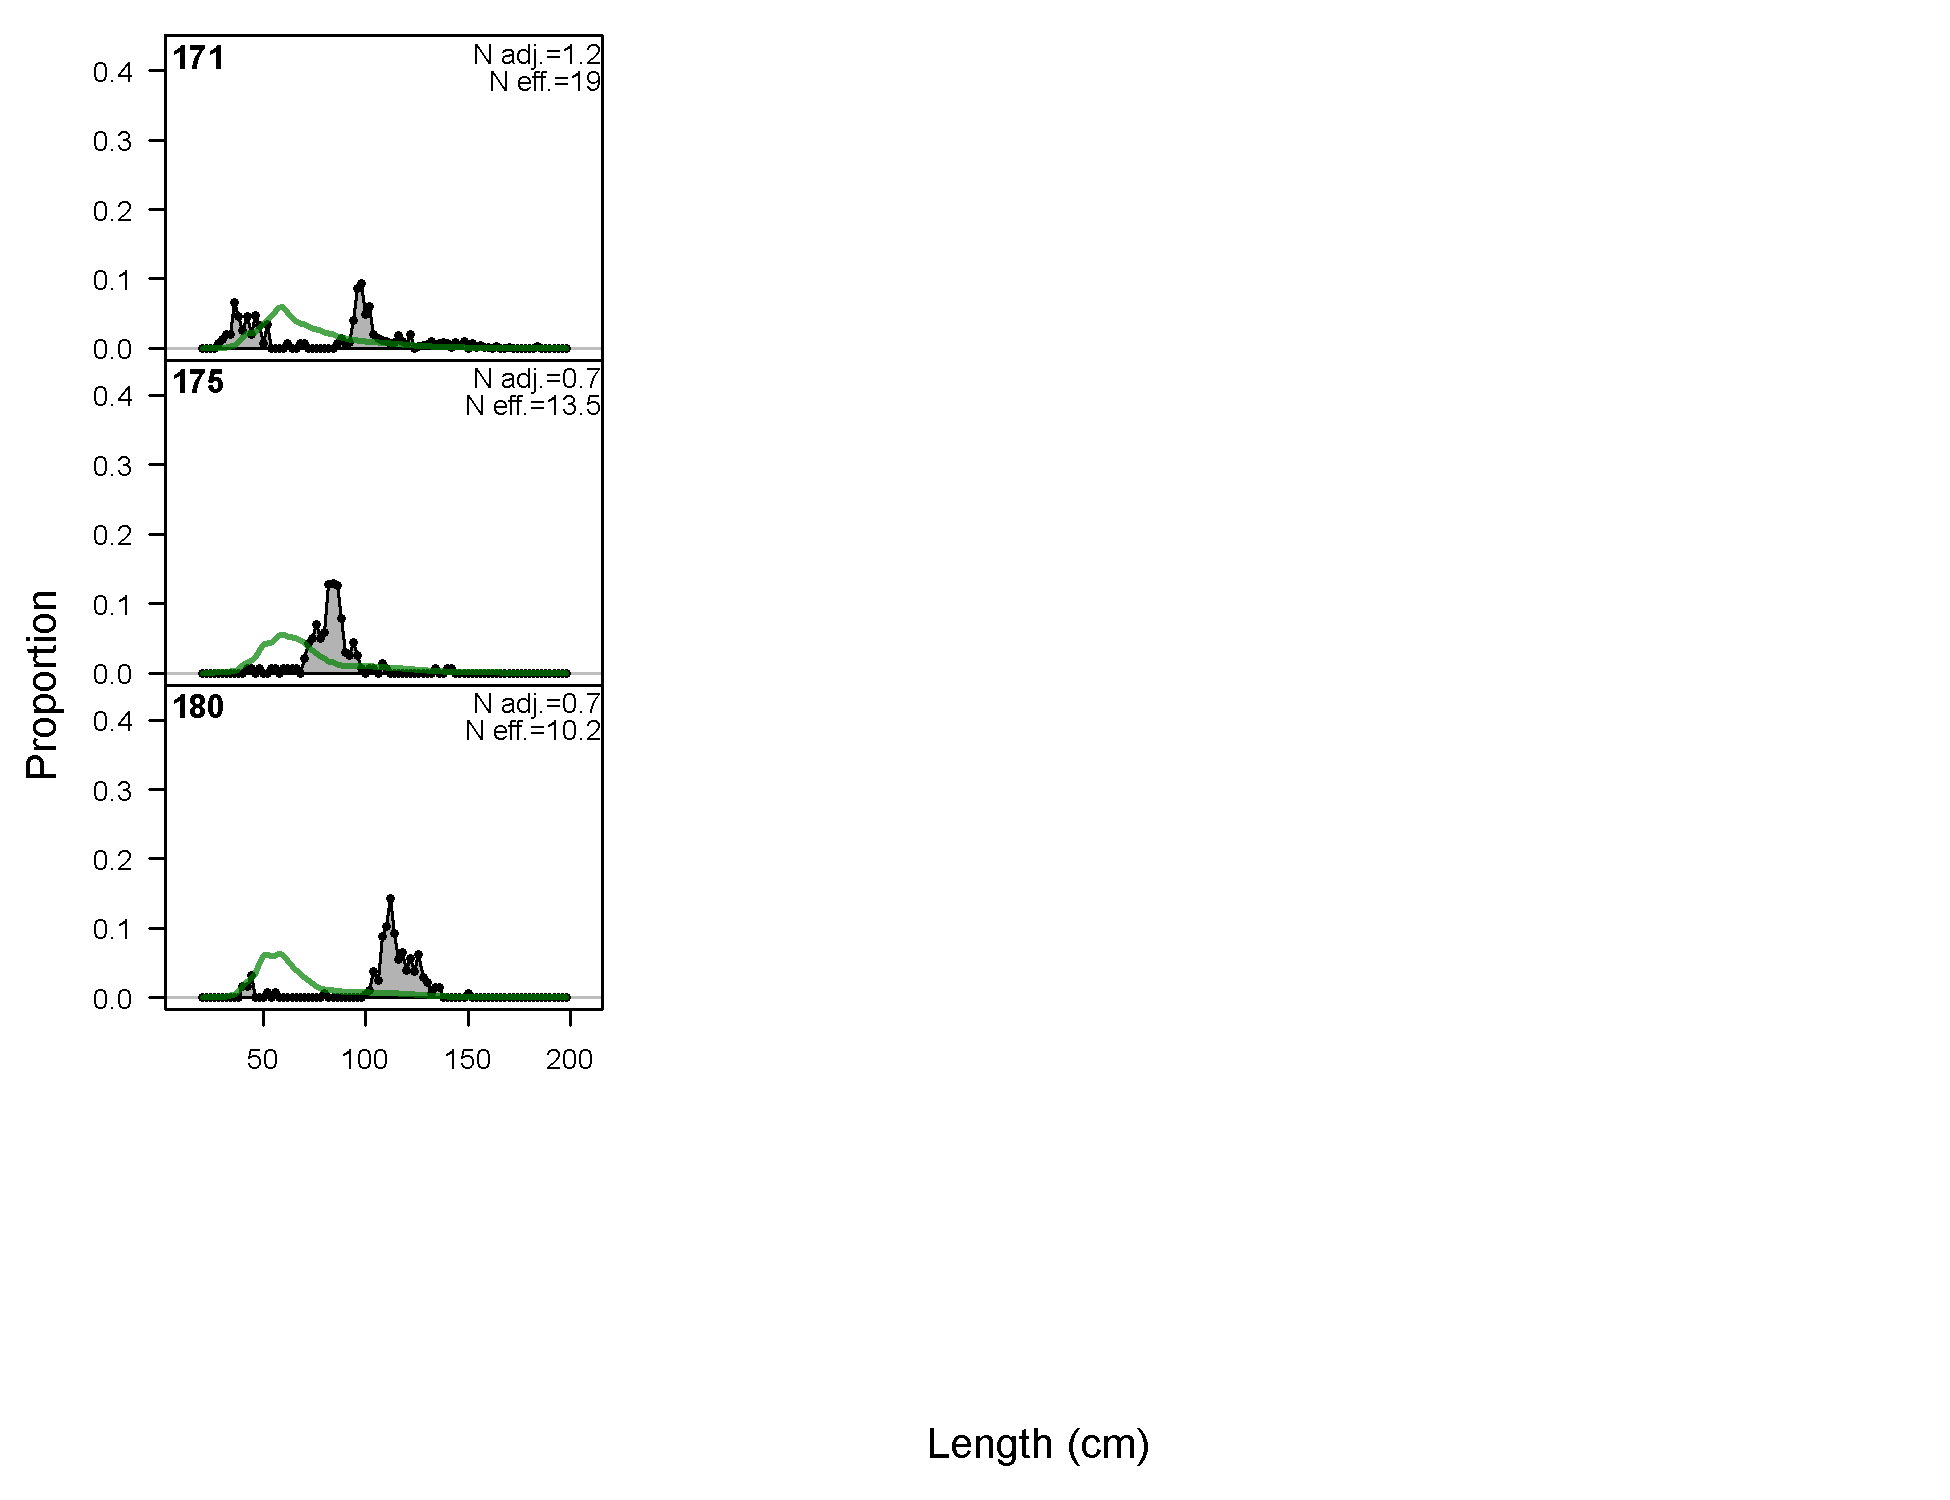
'N adj.' is the input sample size after data-weighting adjustment. N eff. is the calculated effective sample size used in the McAllister-Iannelli tuning method.
file: comp_lenfit_flt7mkt0_page1.png
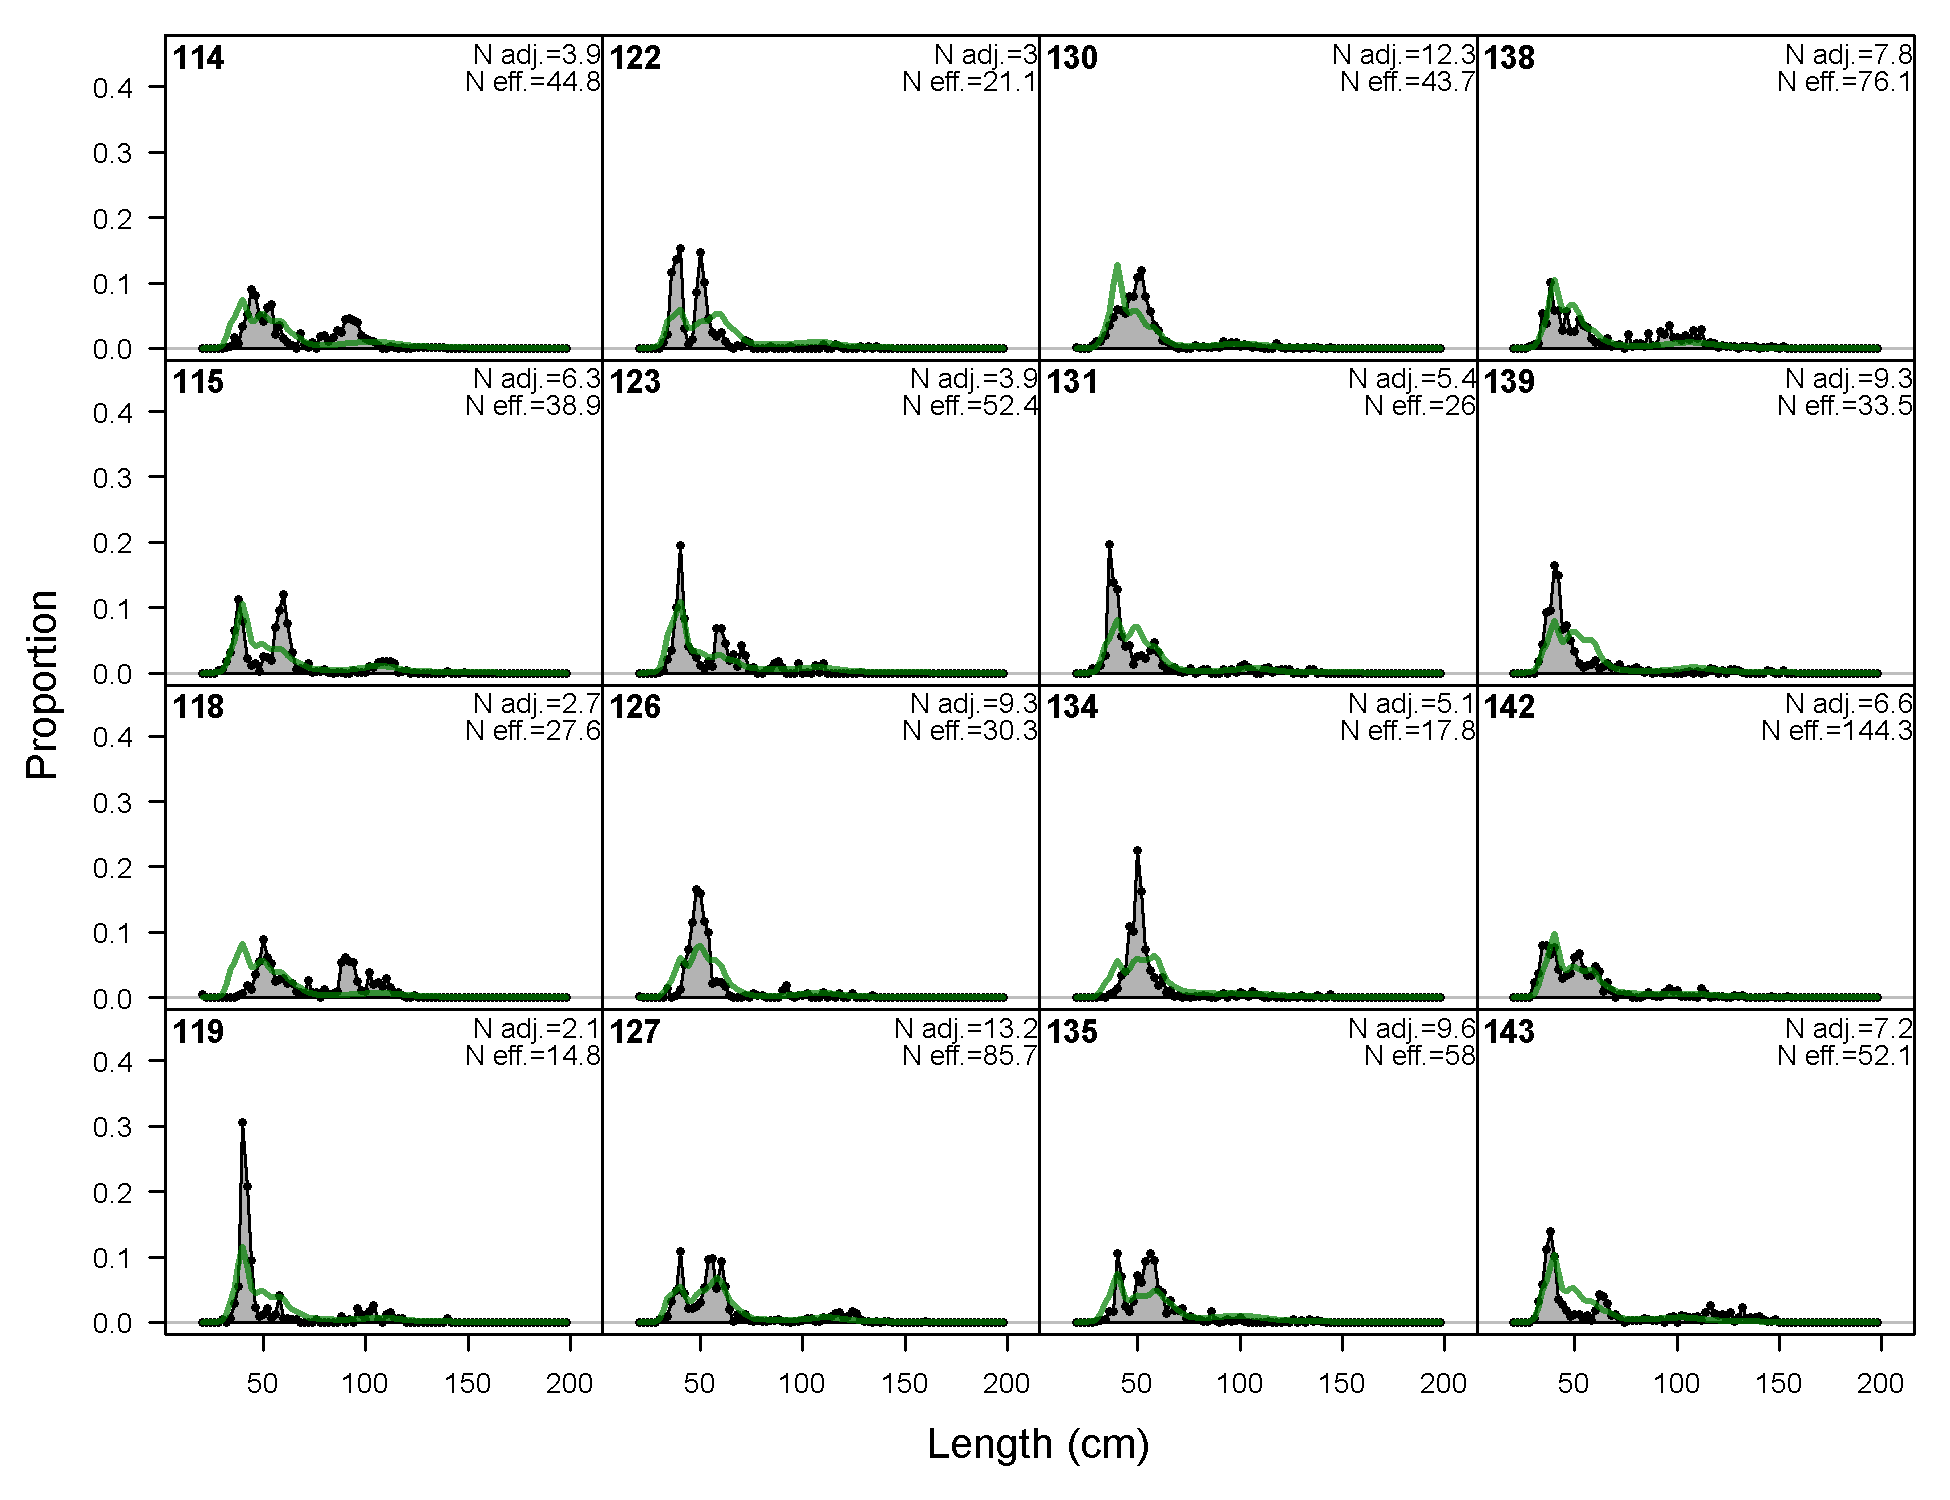
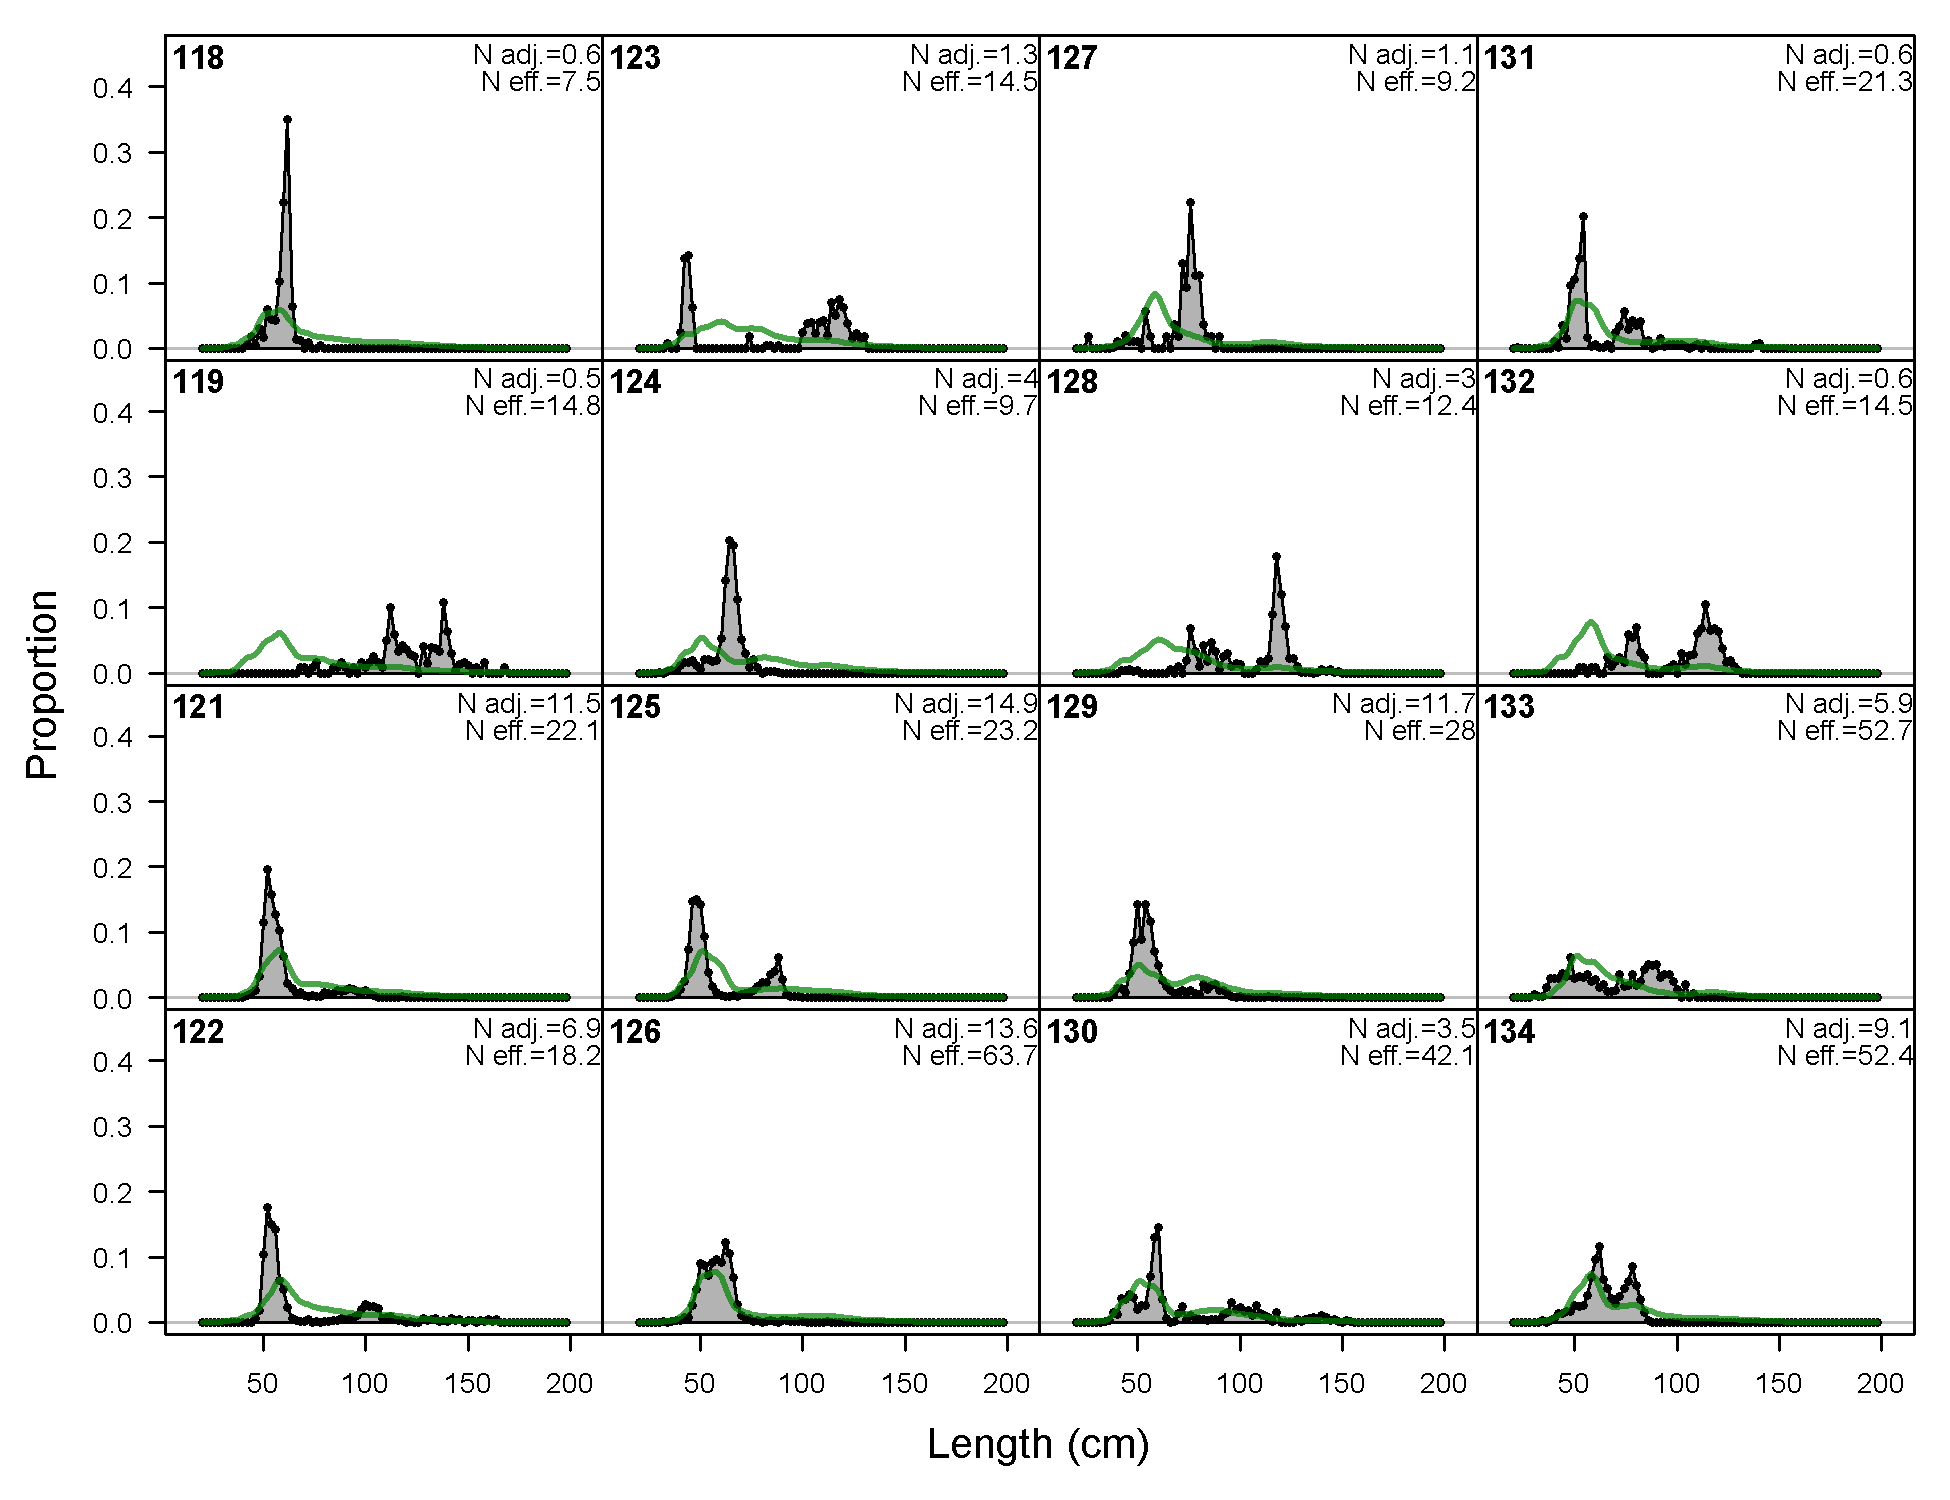
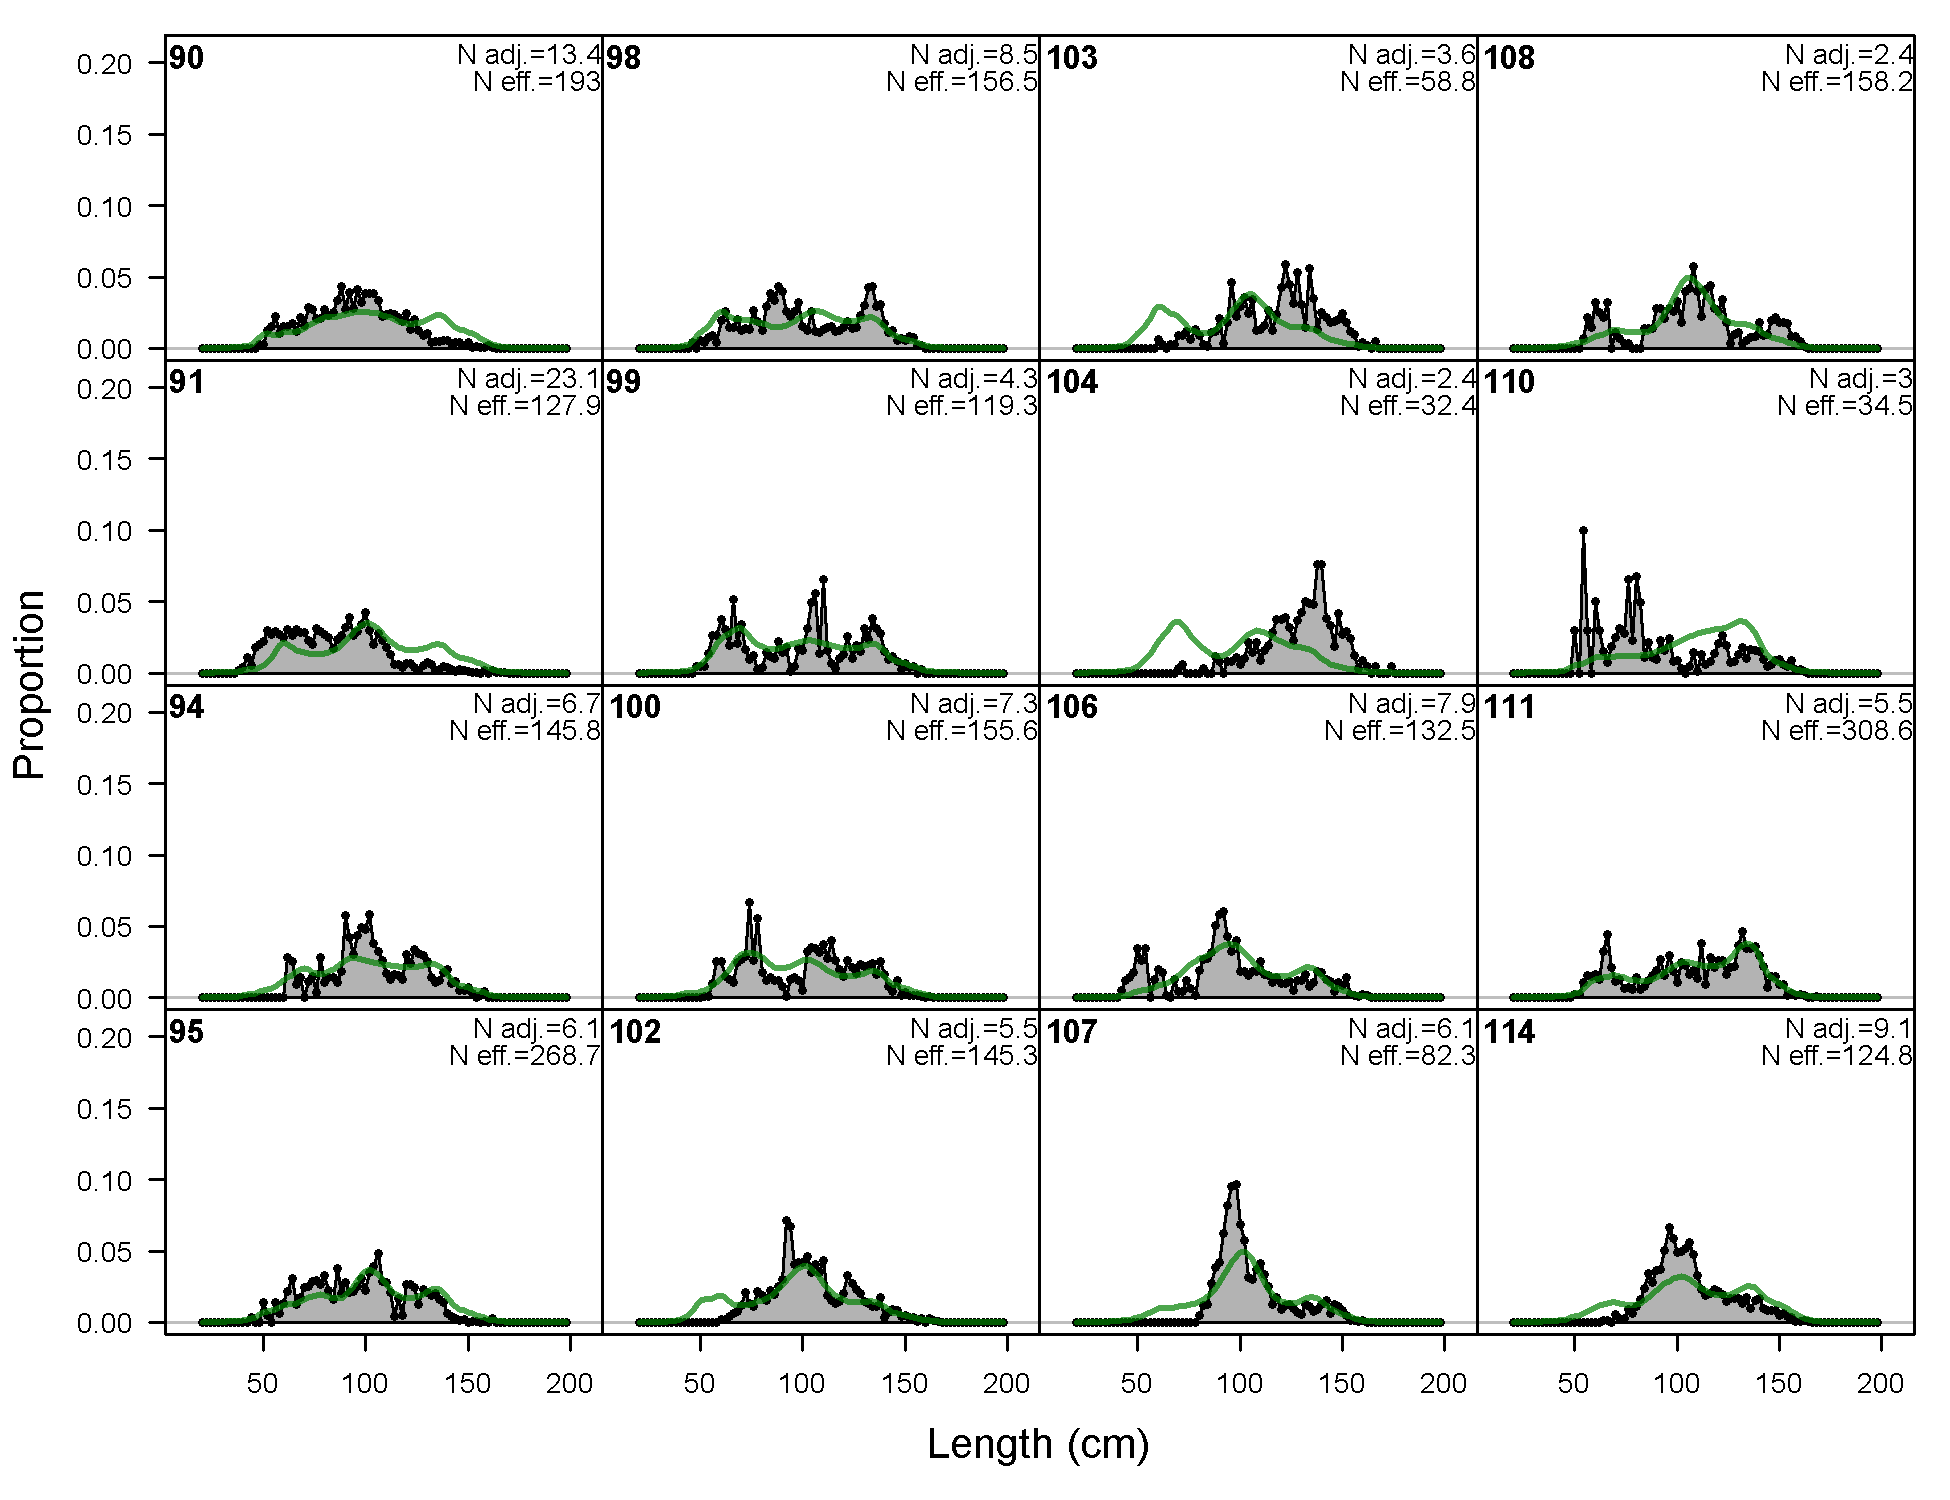
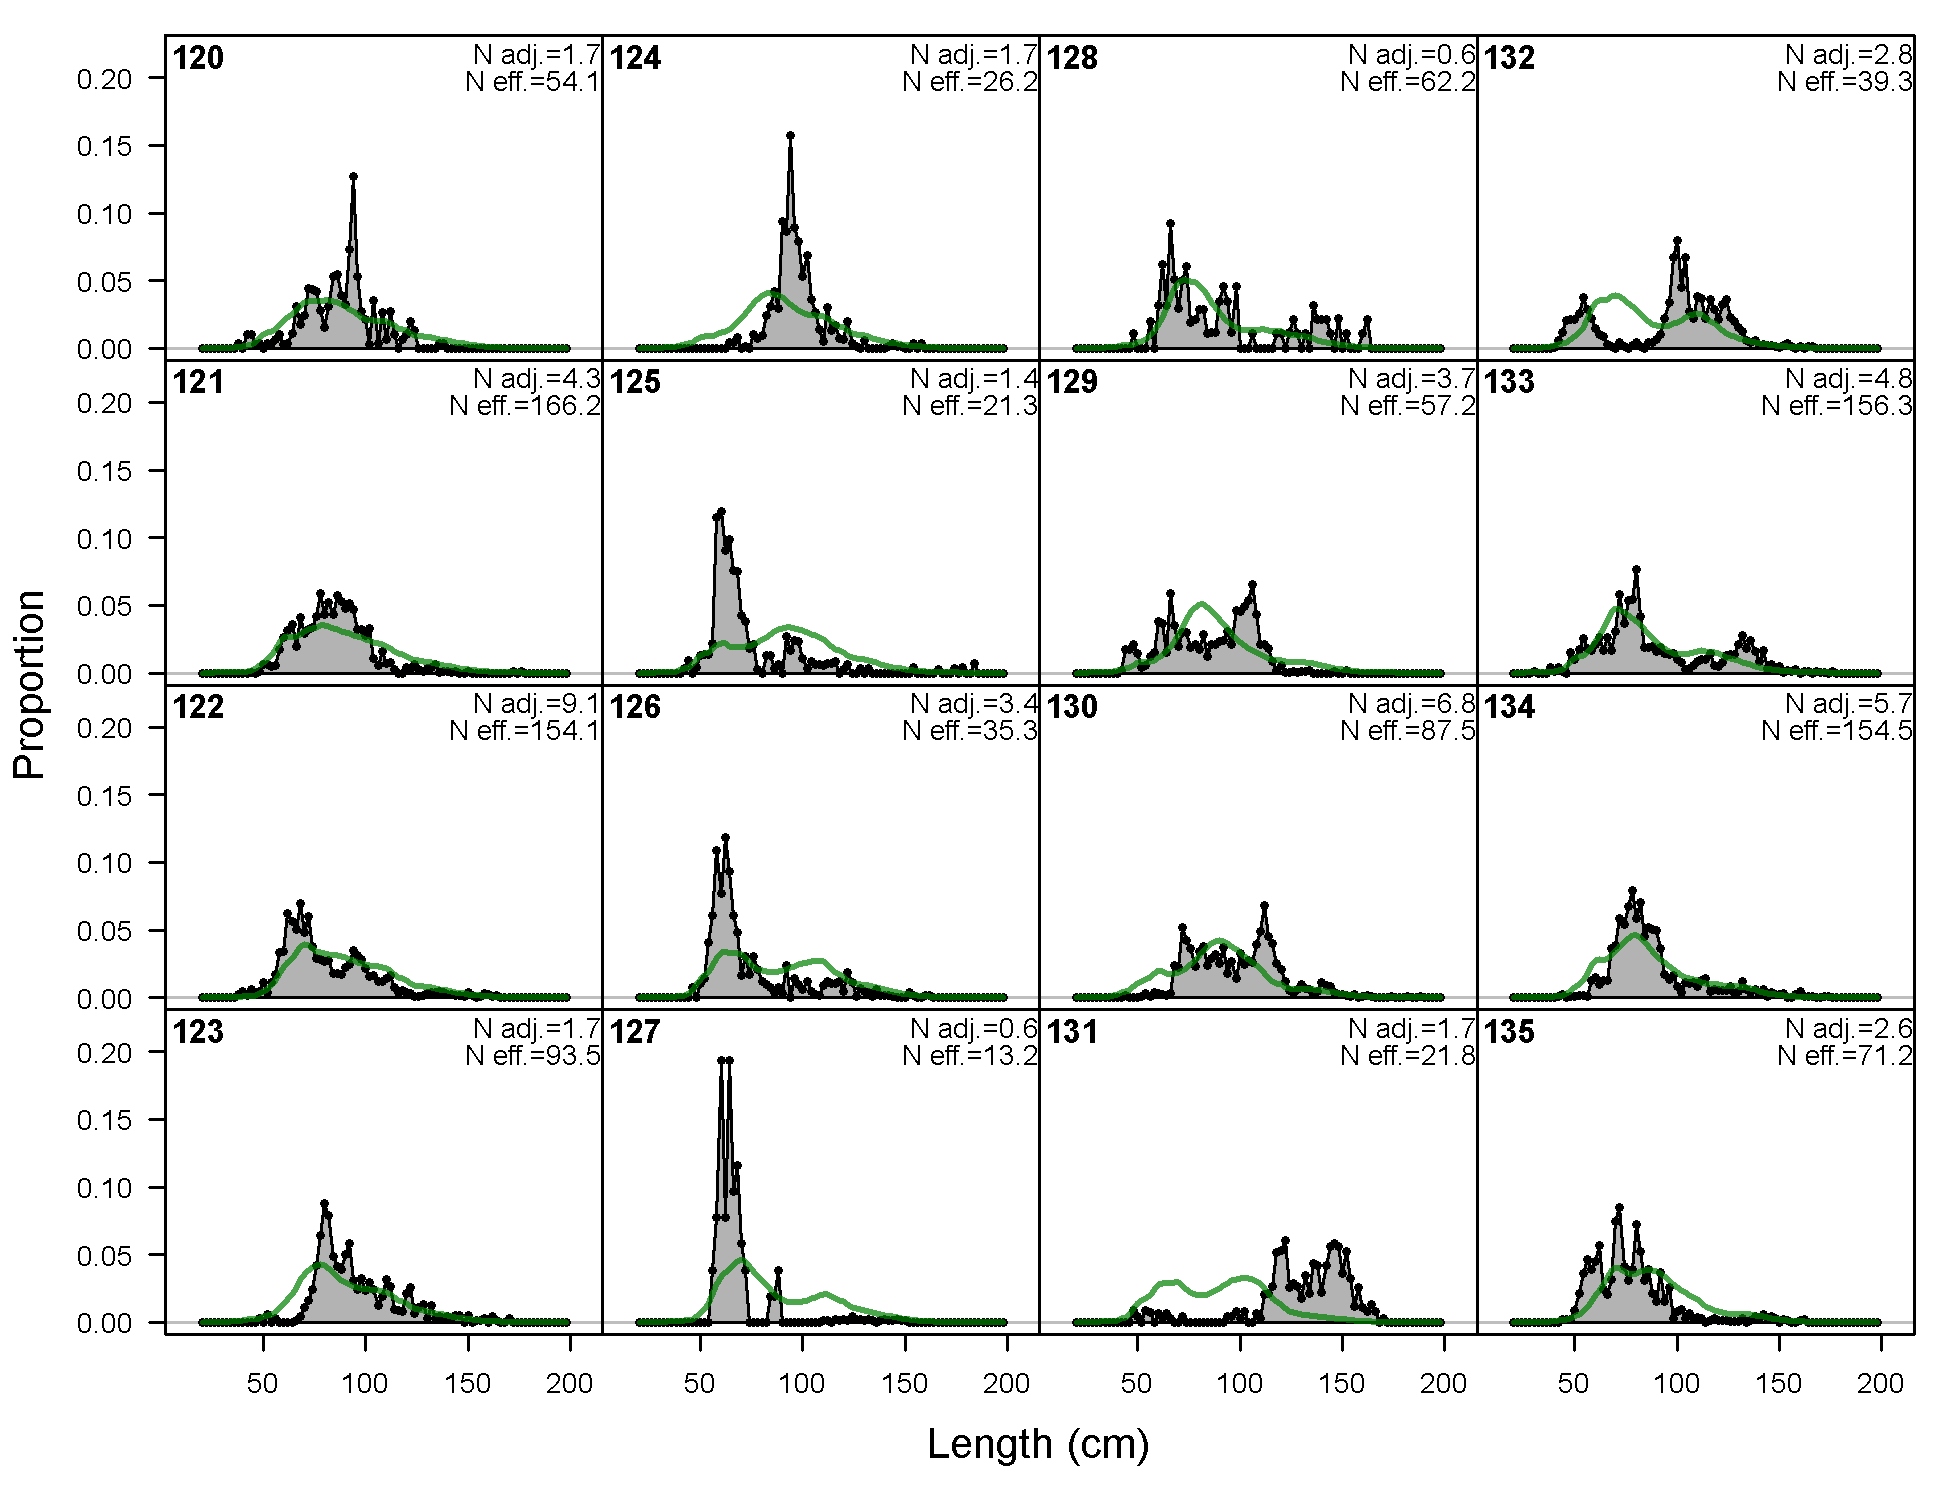
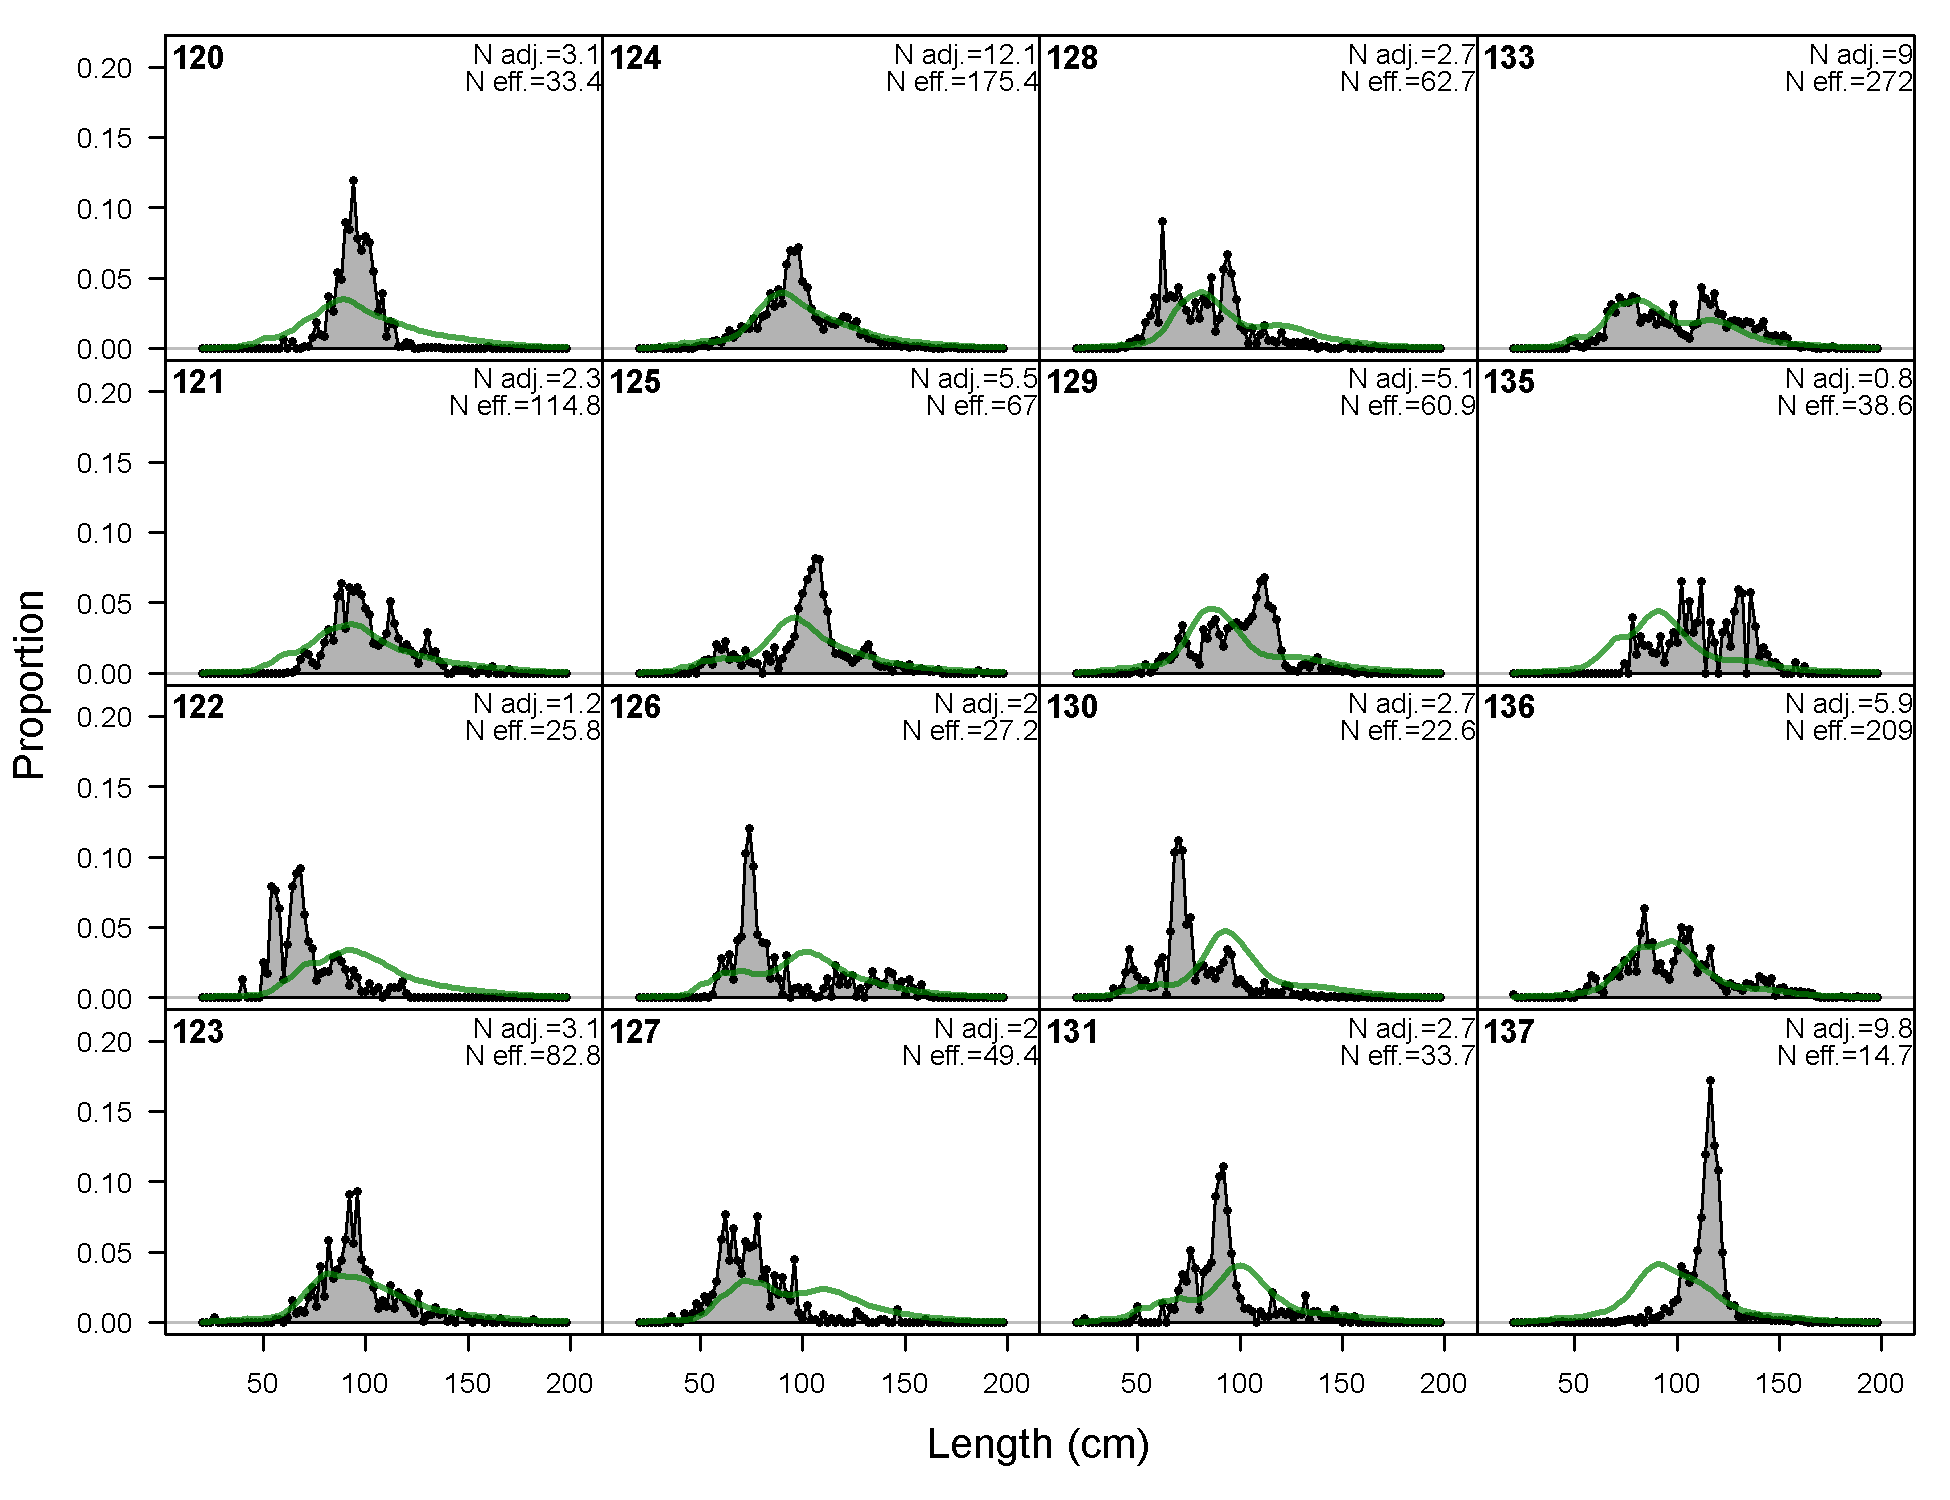
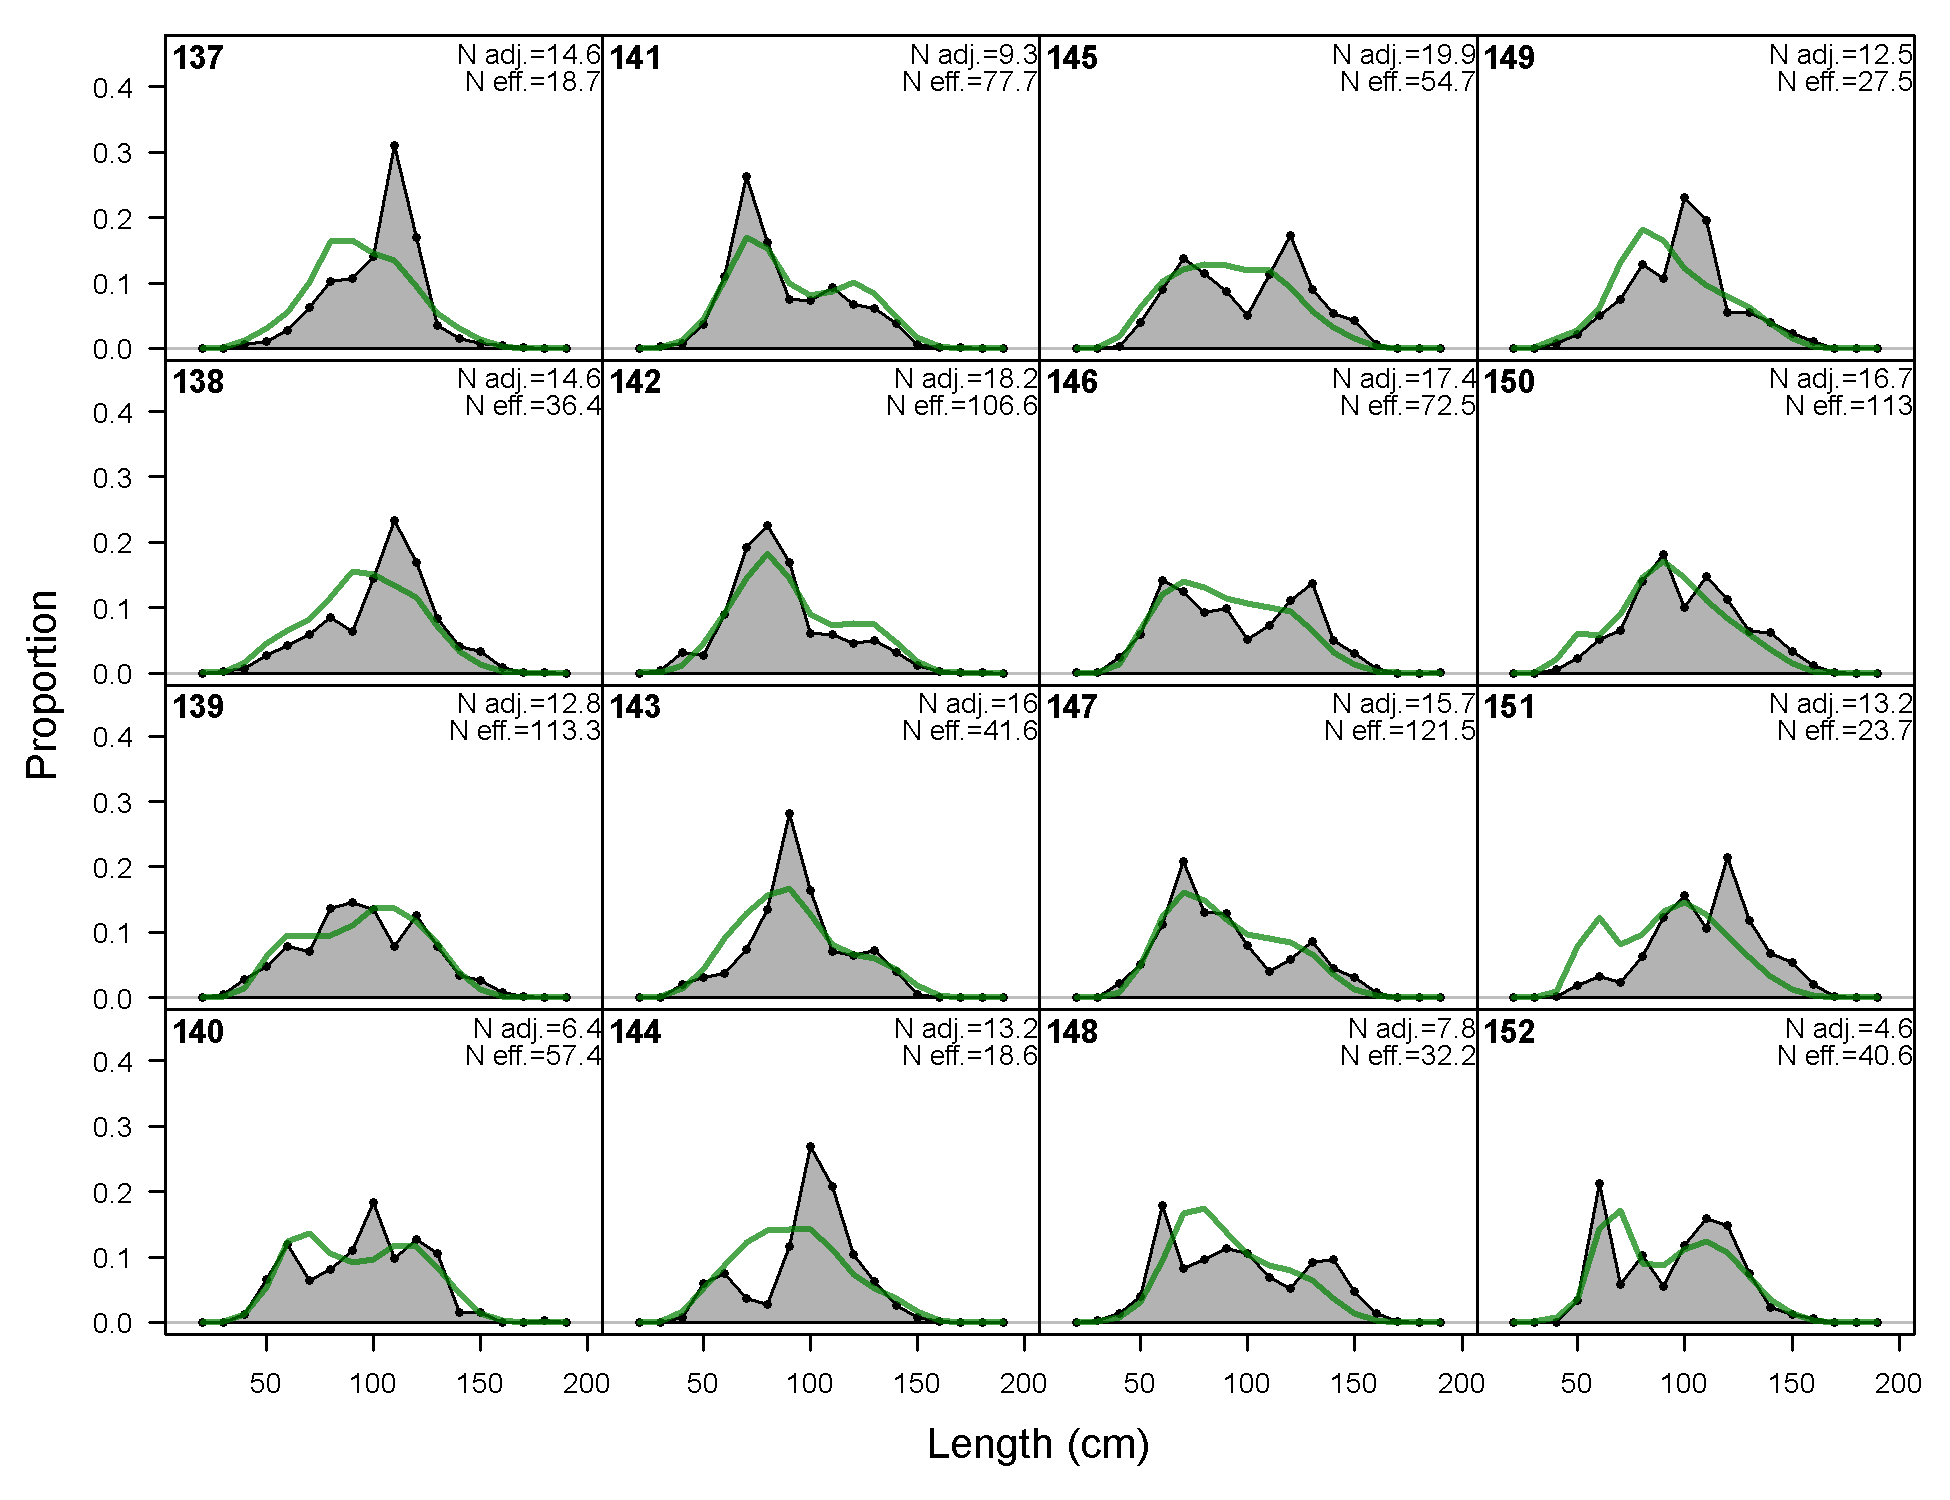
Length comps, whole catch, F7-OBJ_Nc_Q23 (plot 2 of 4)
file: comp_lenfit_flt7mkt0_page2.png
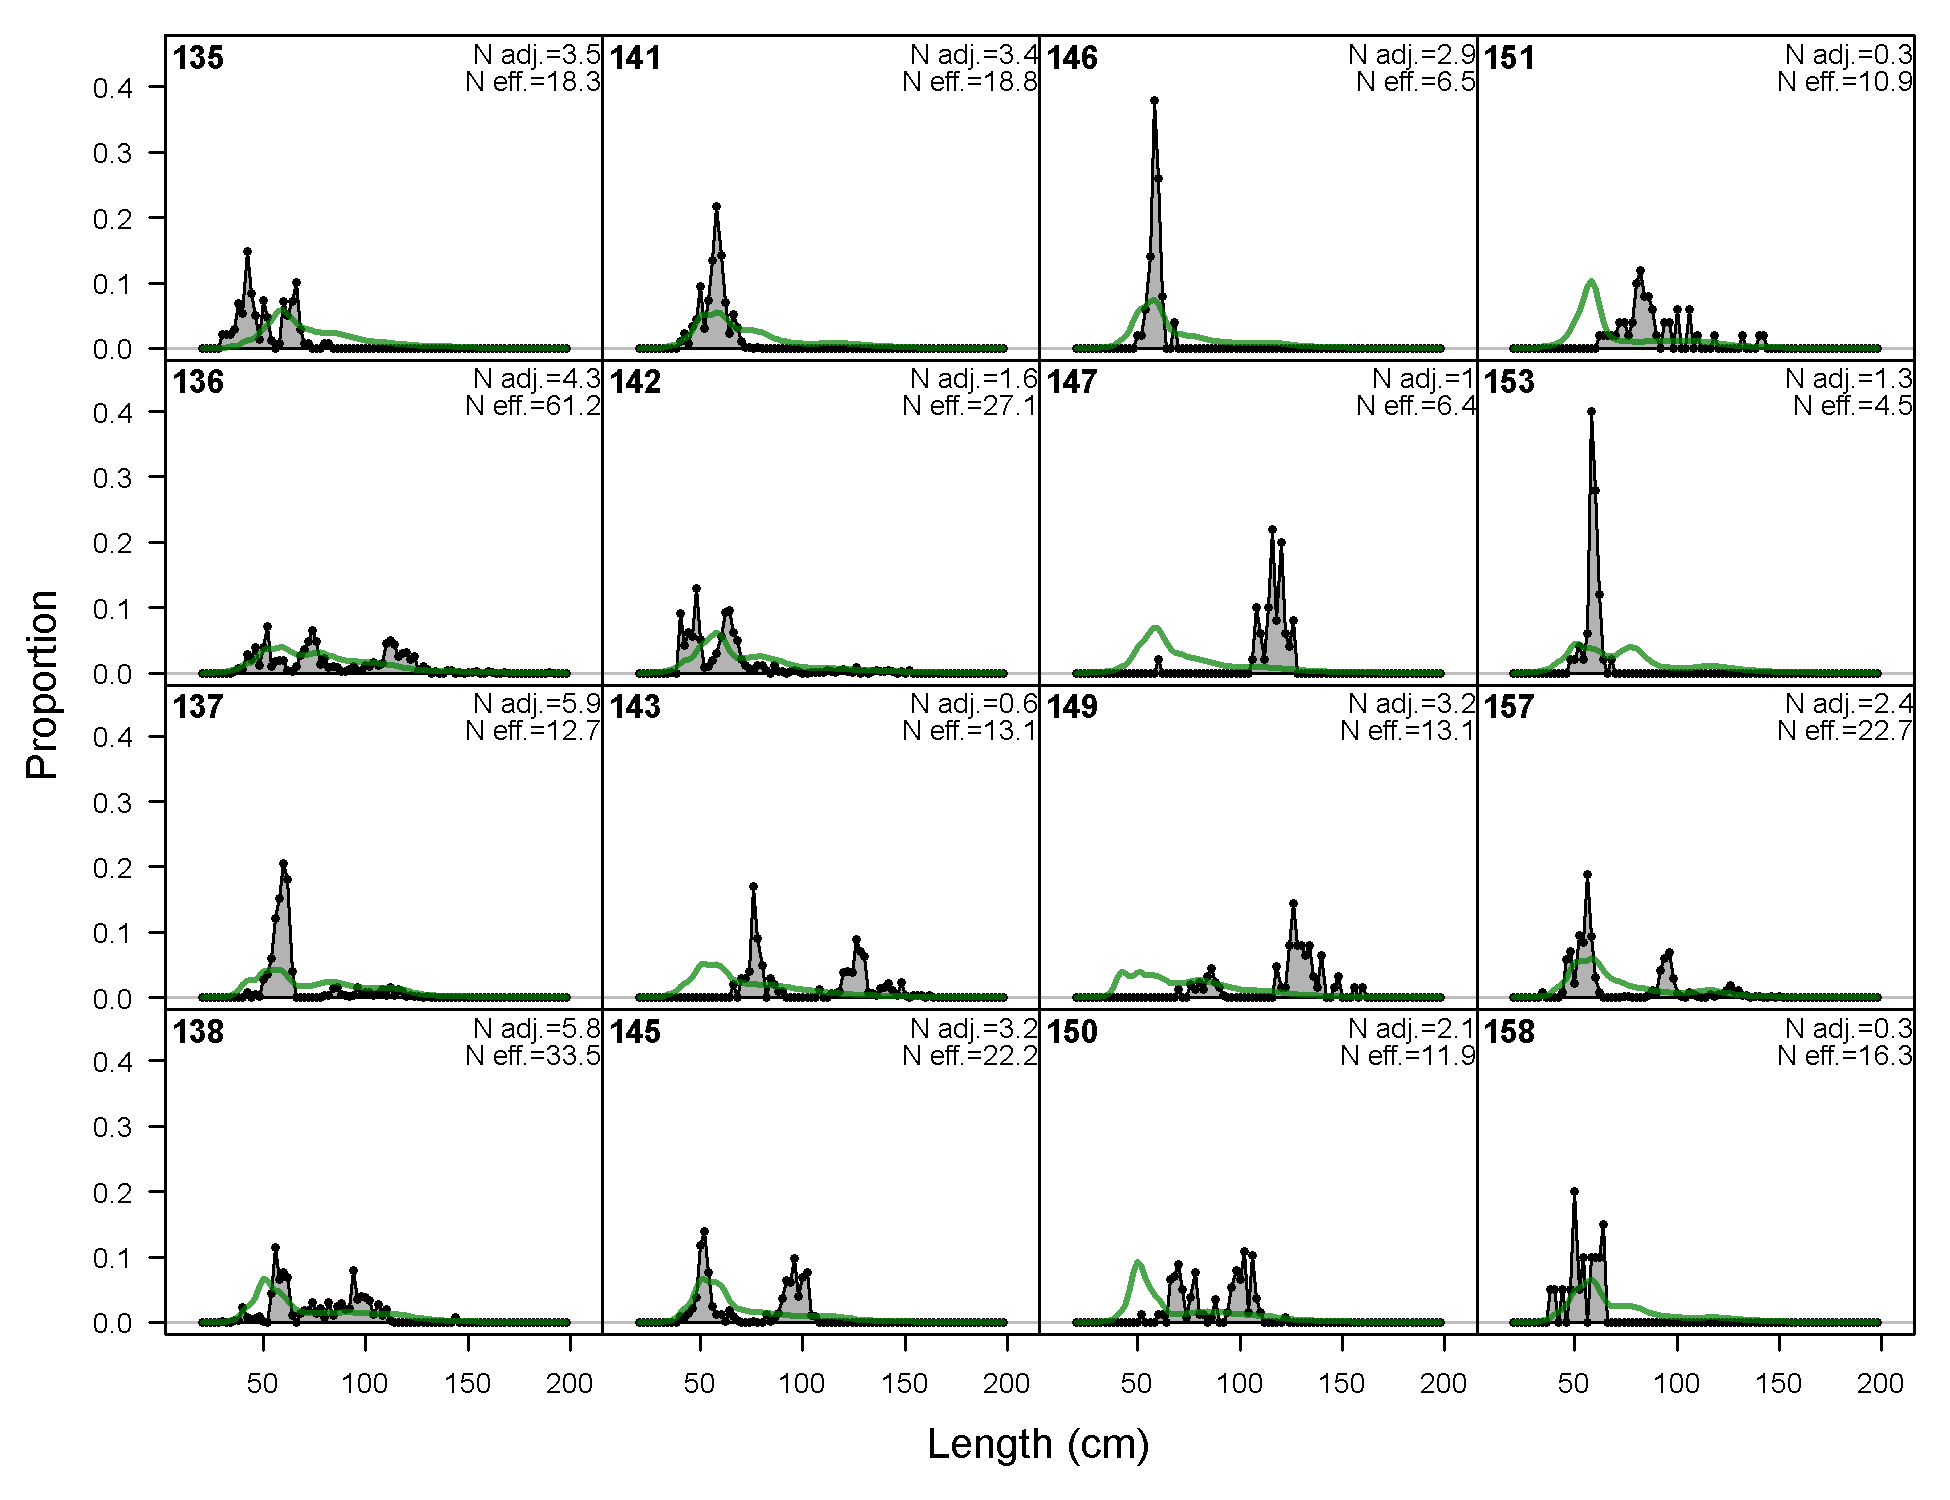
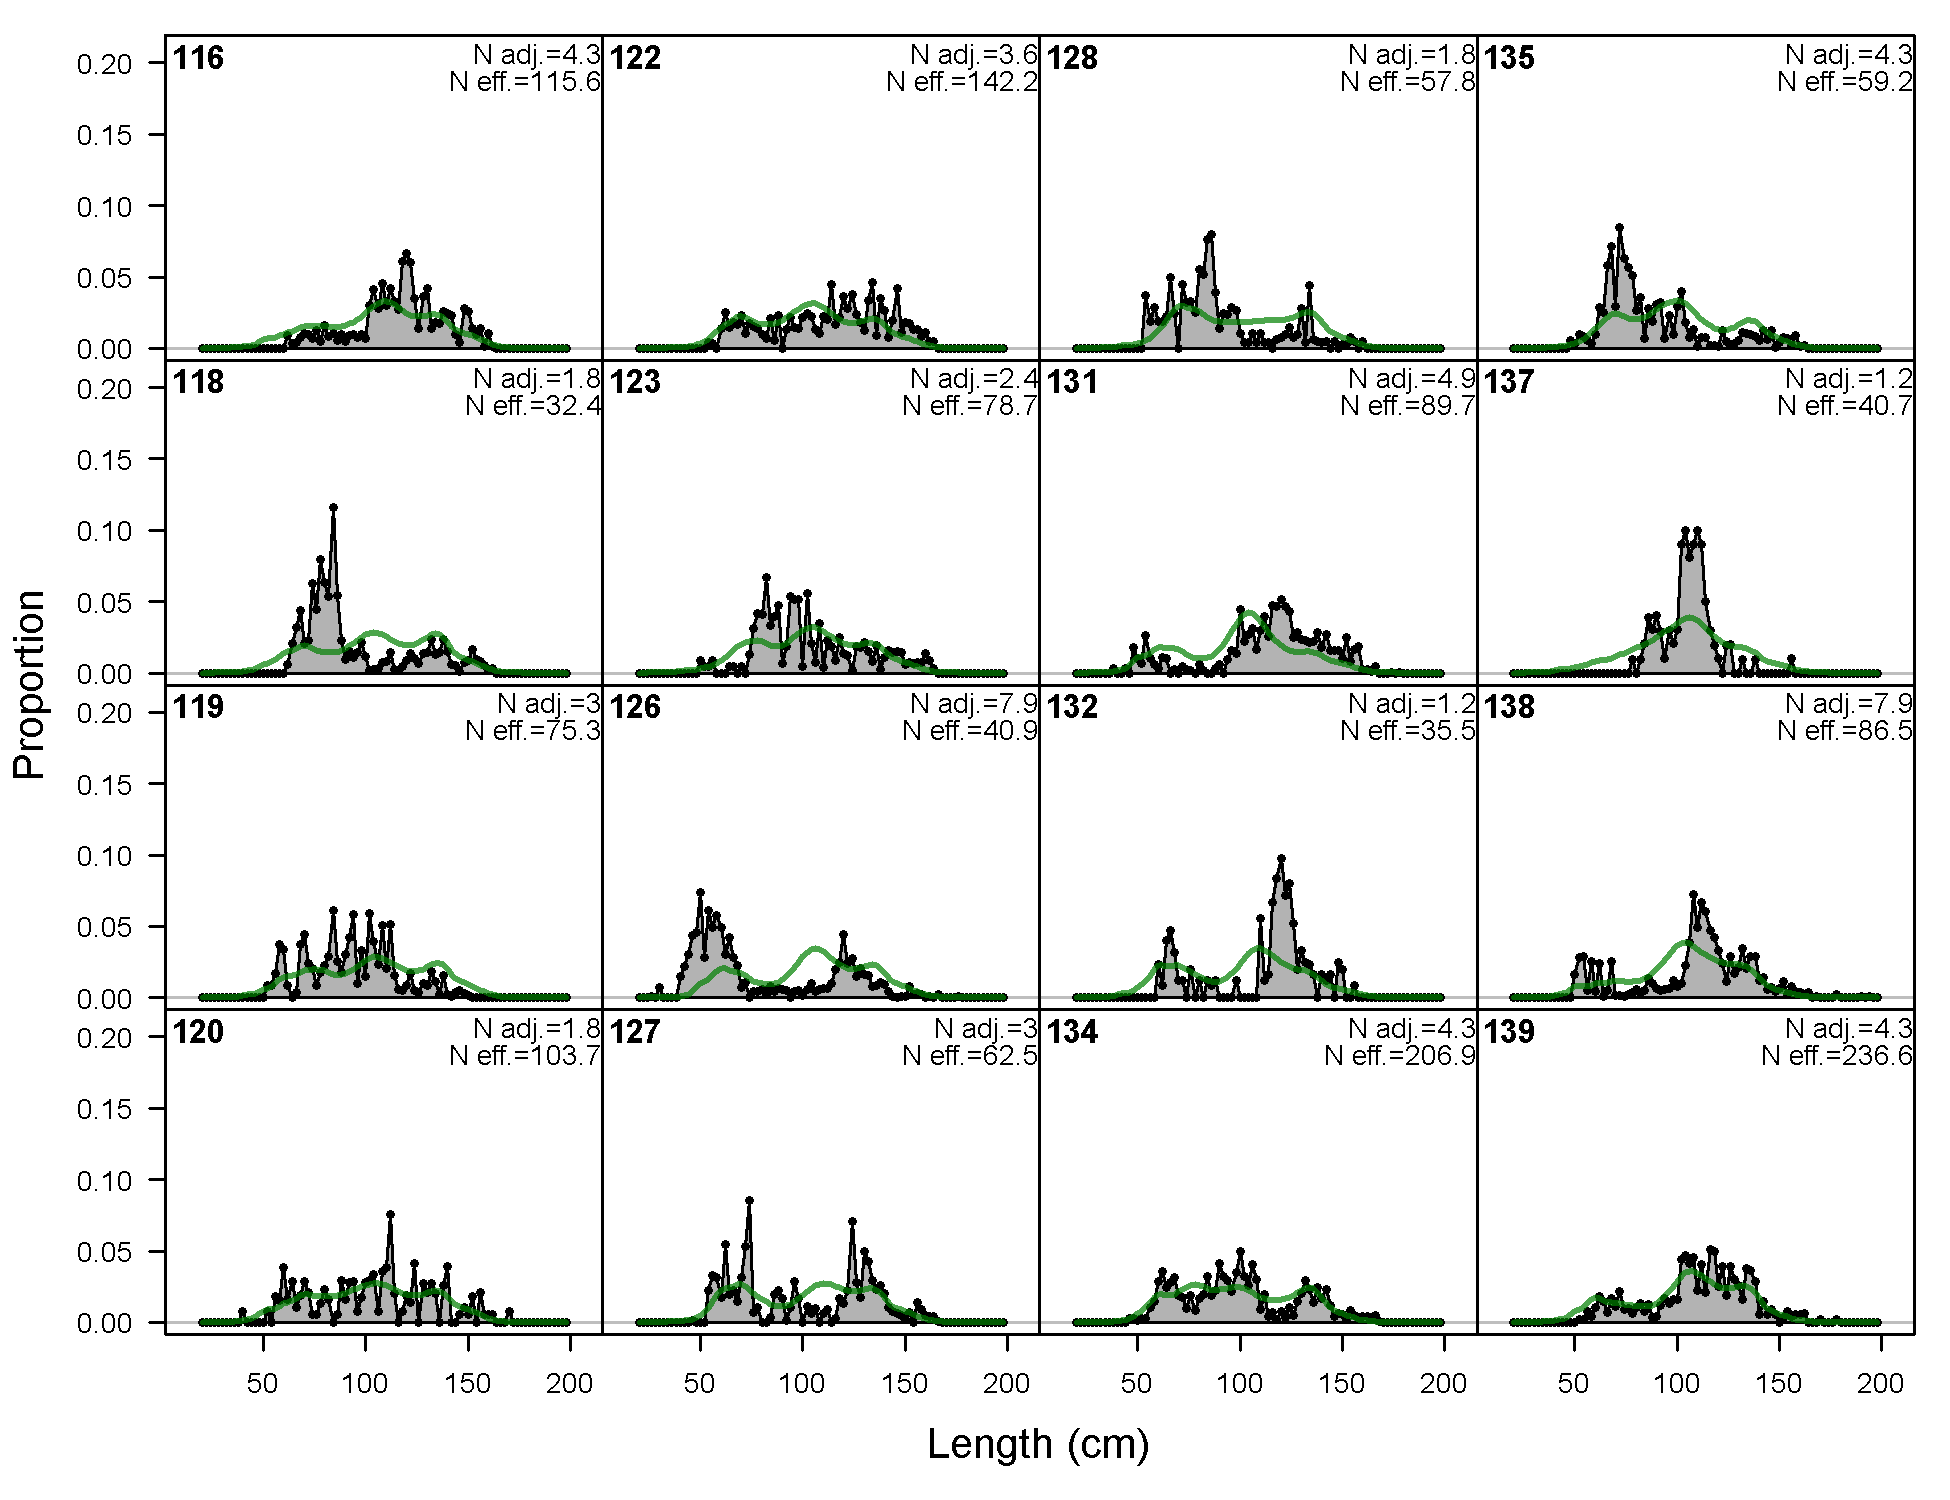
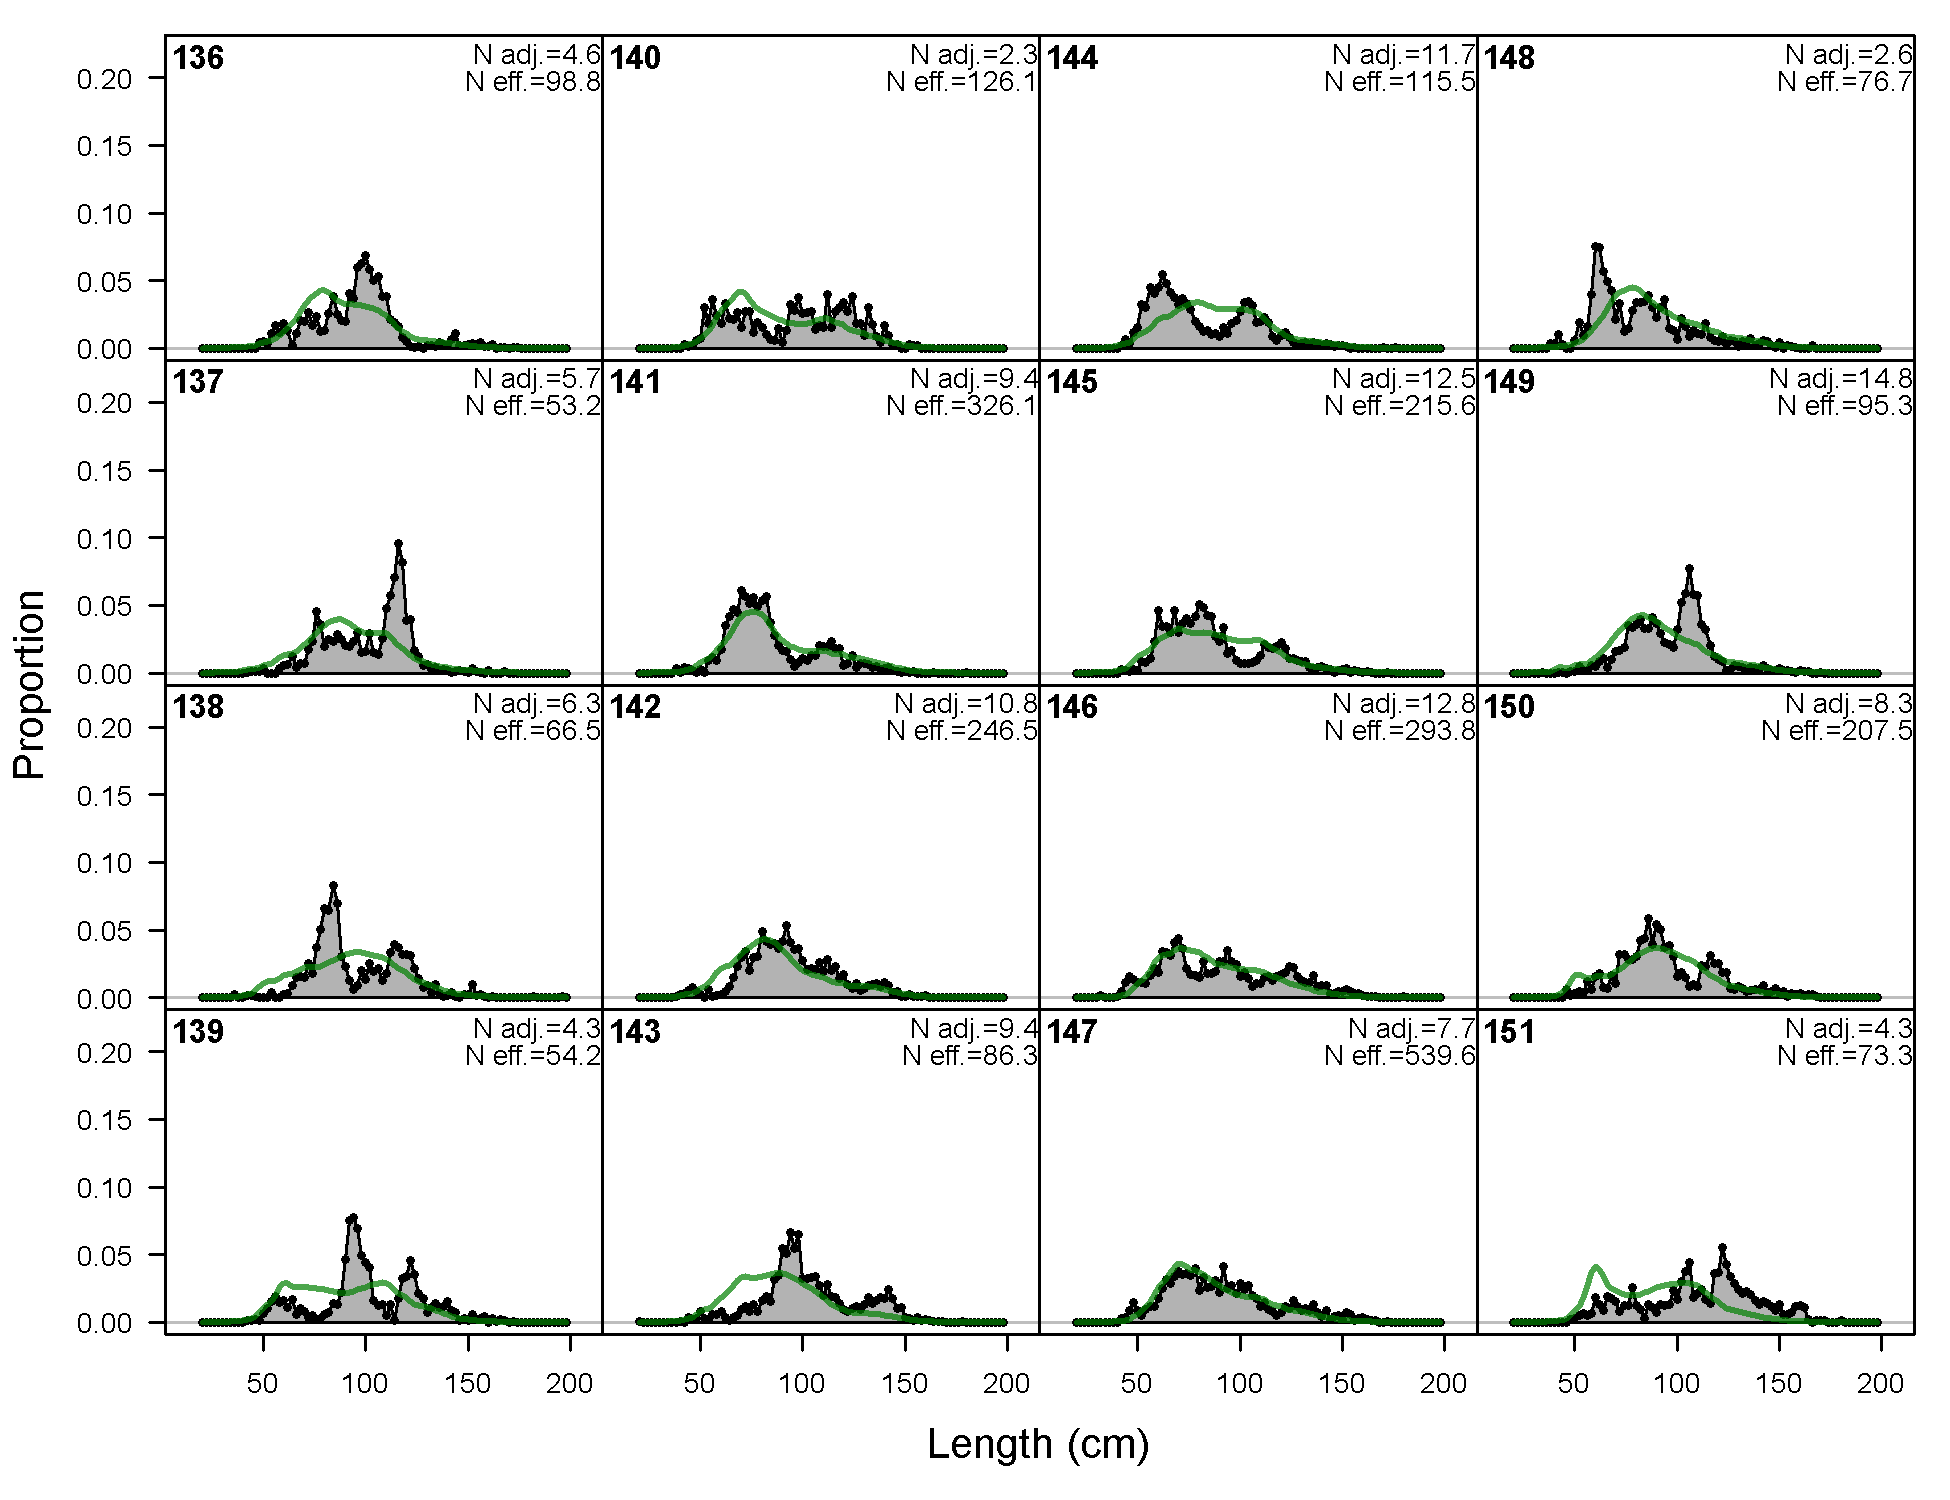
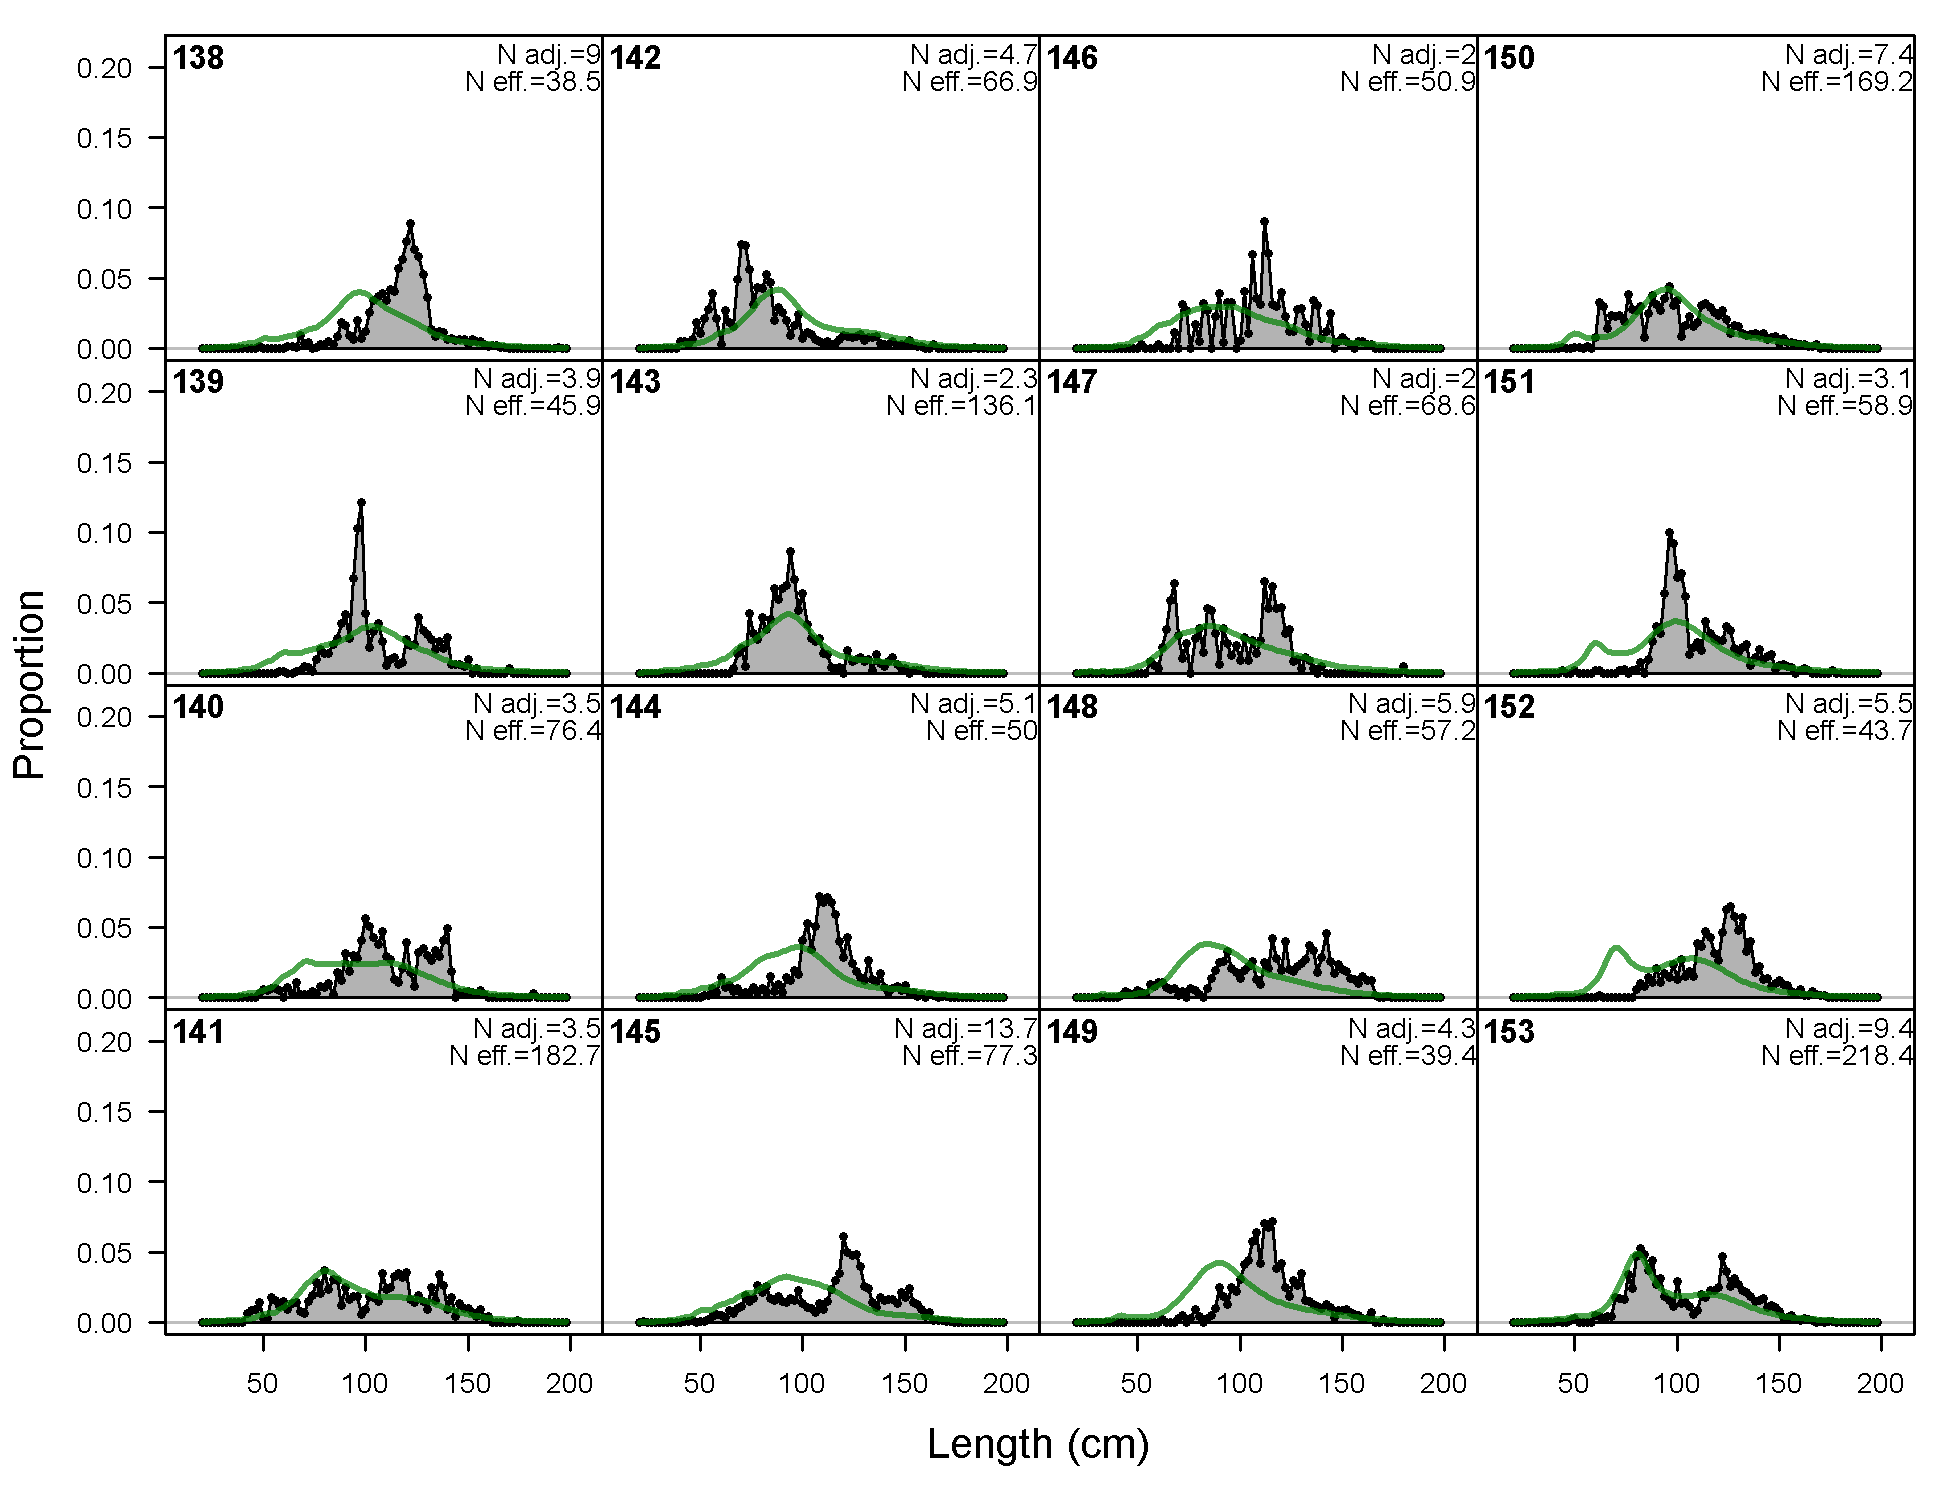
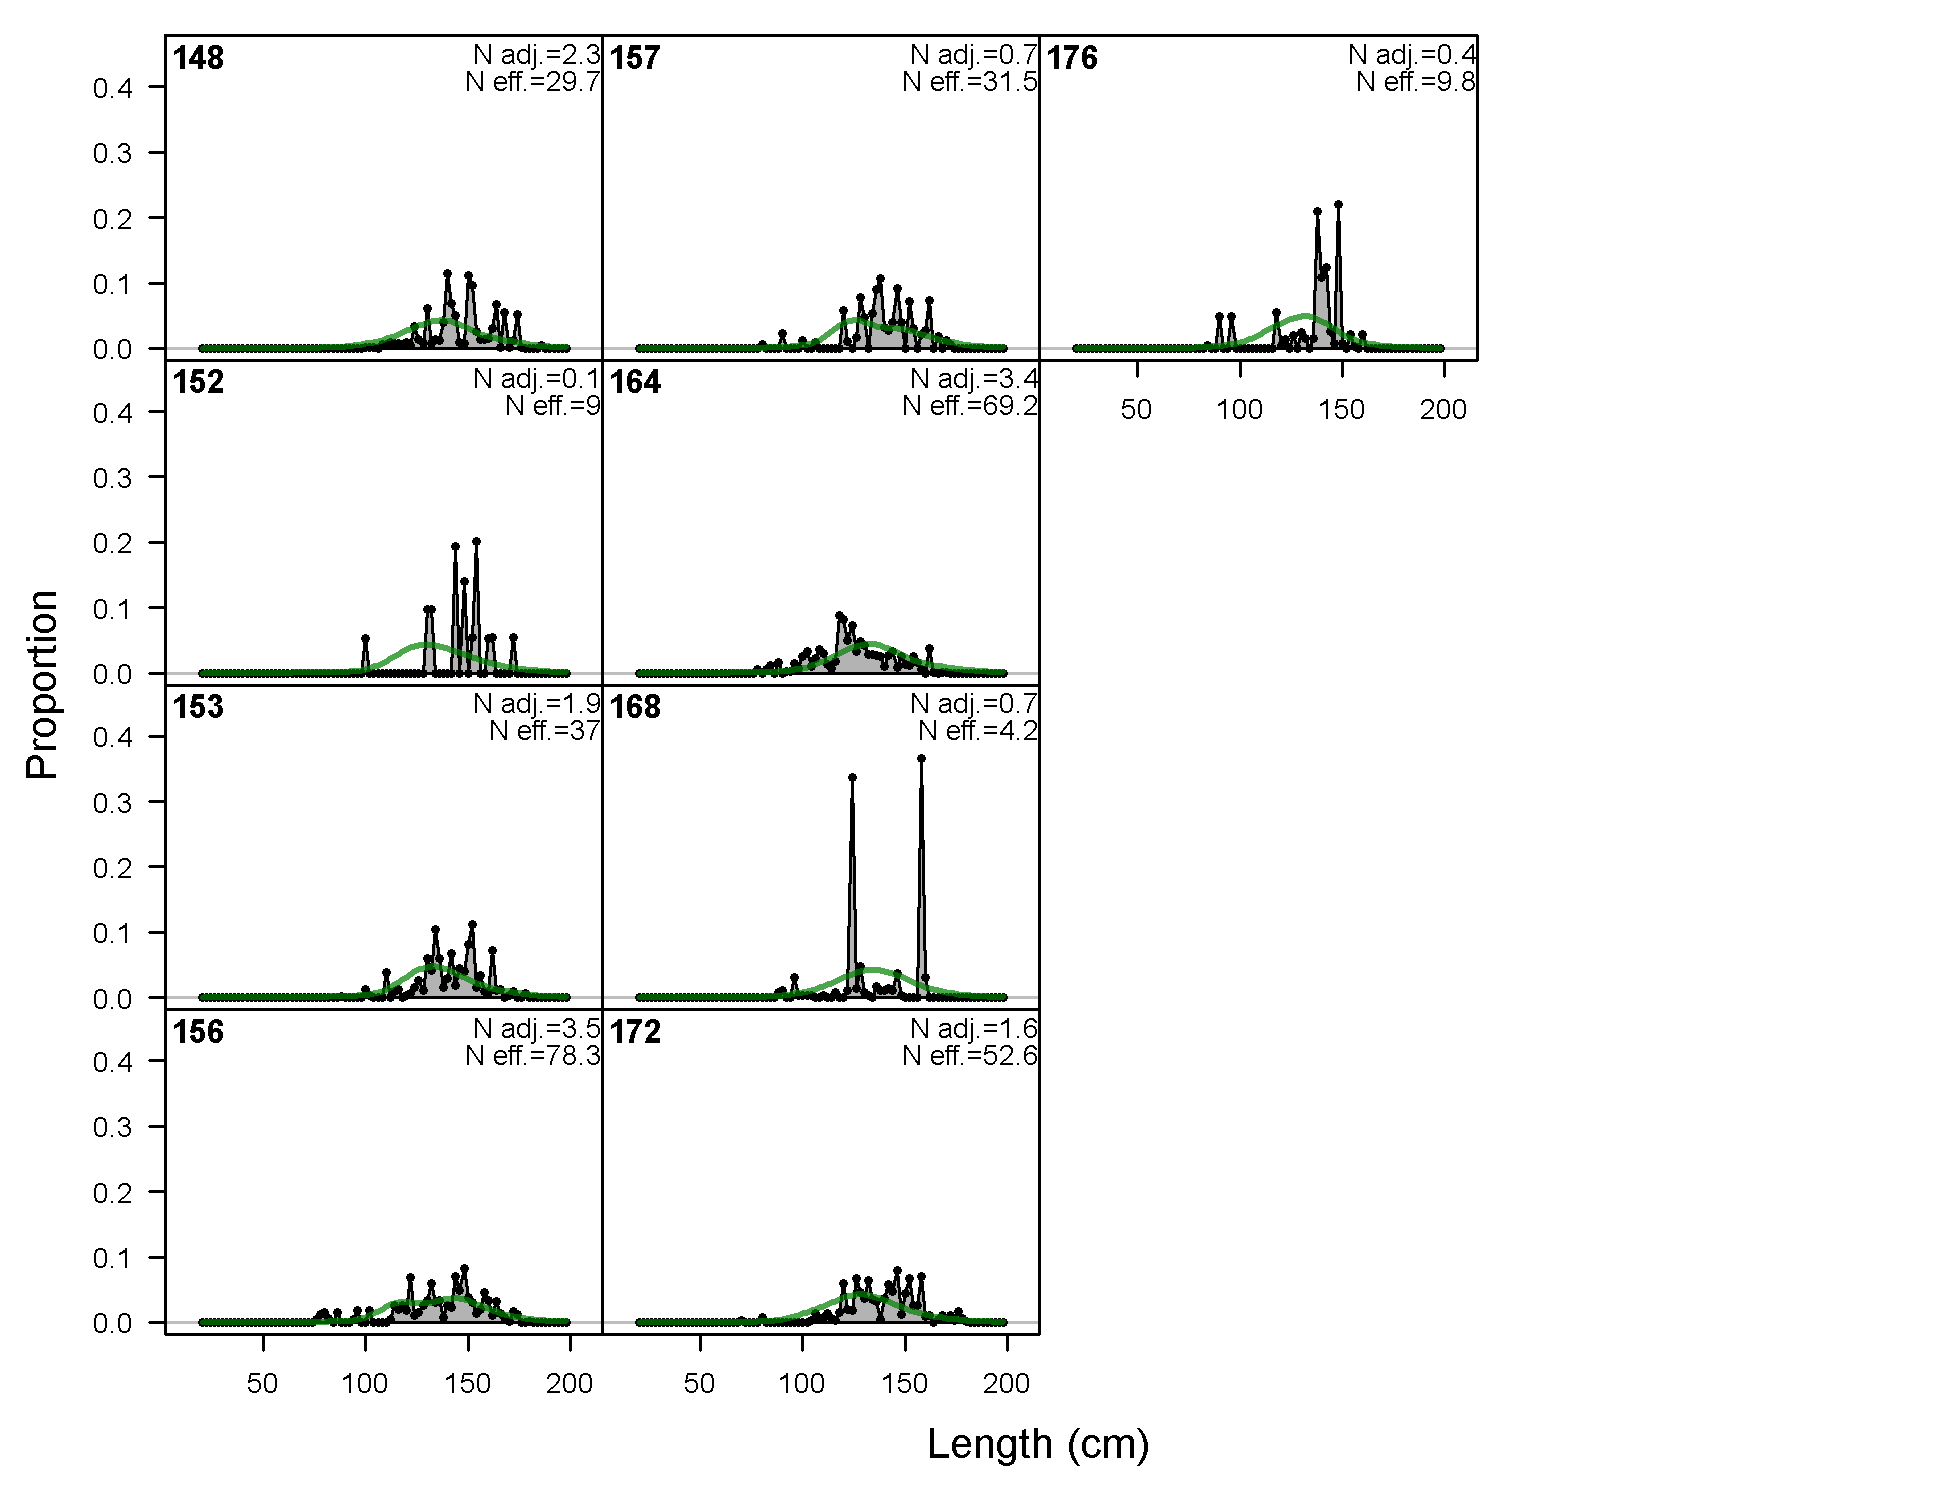
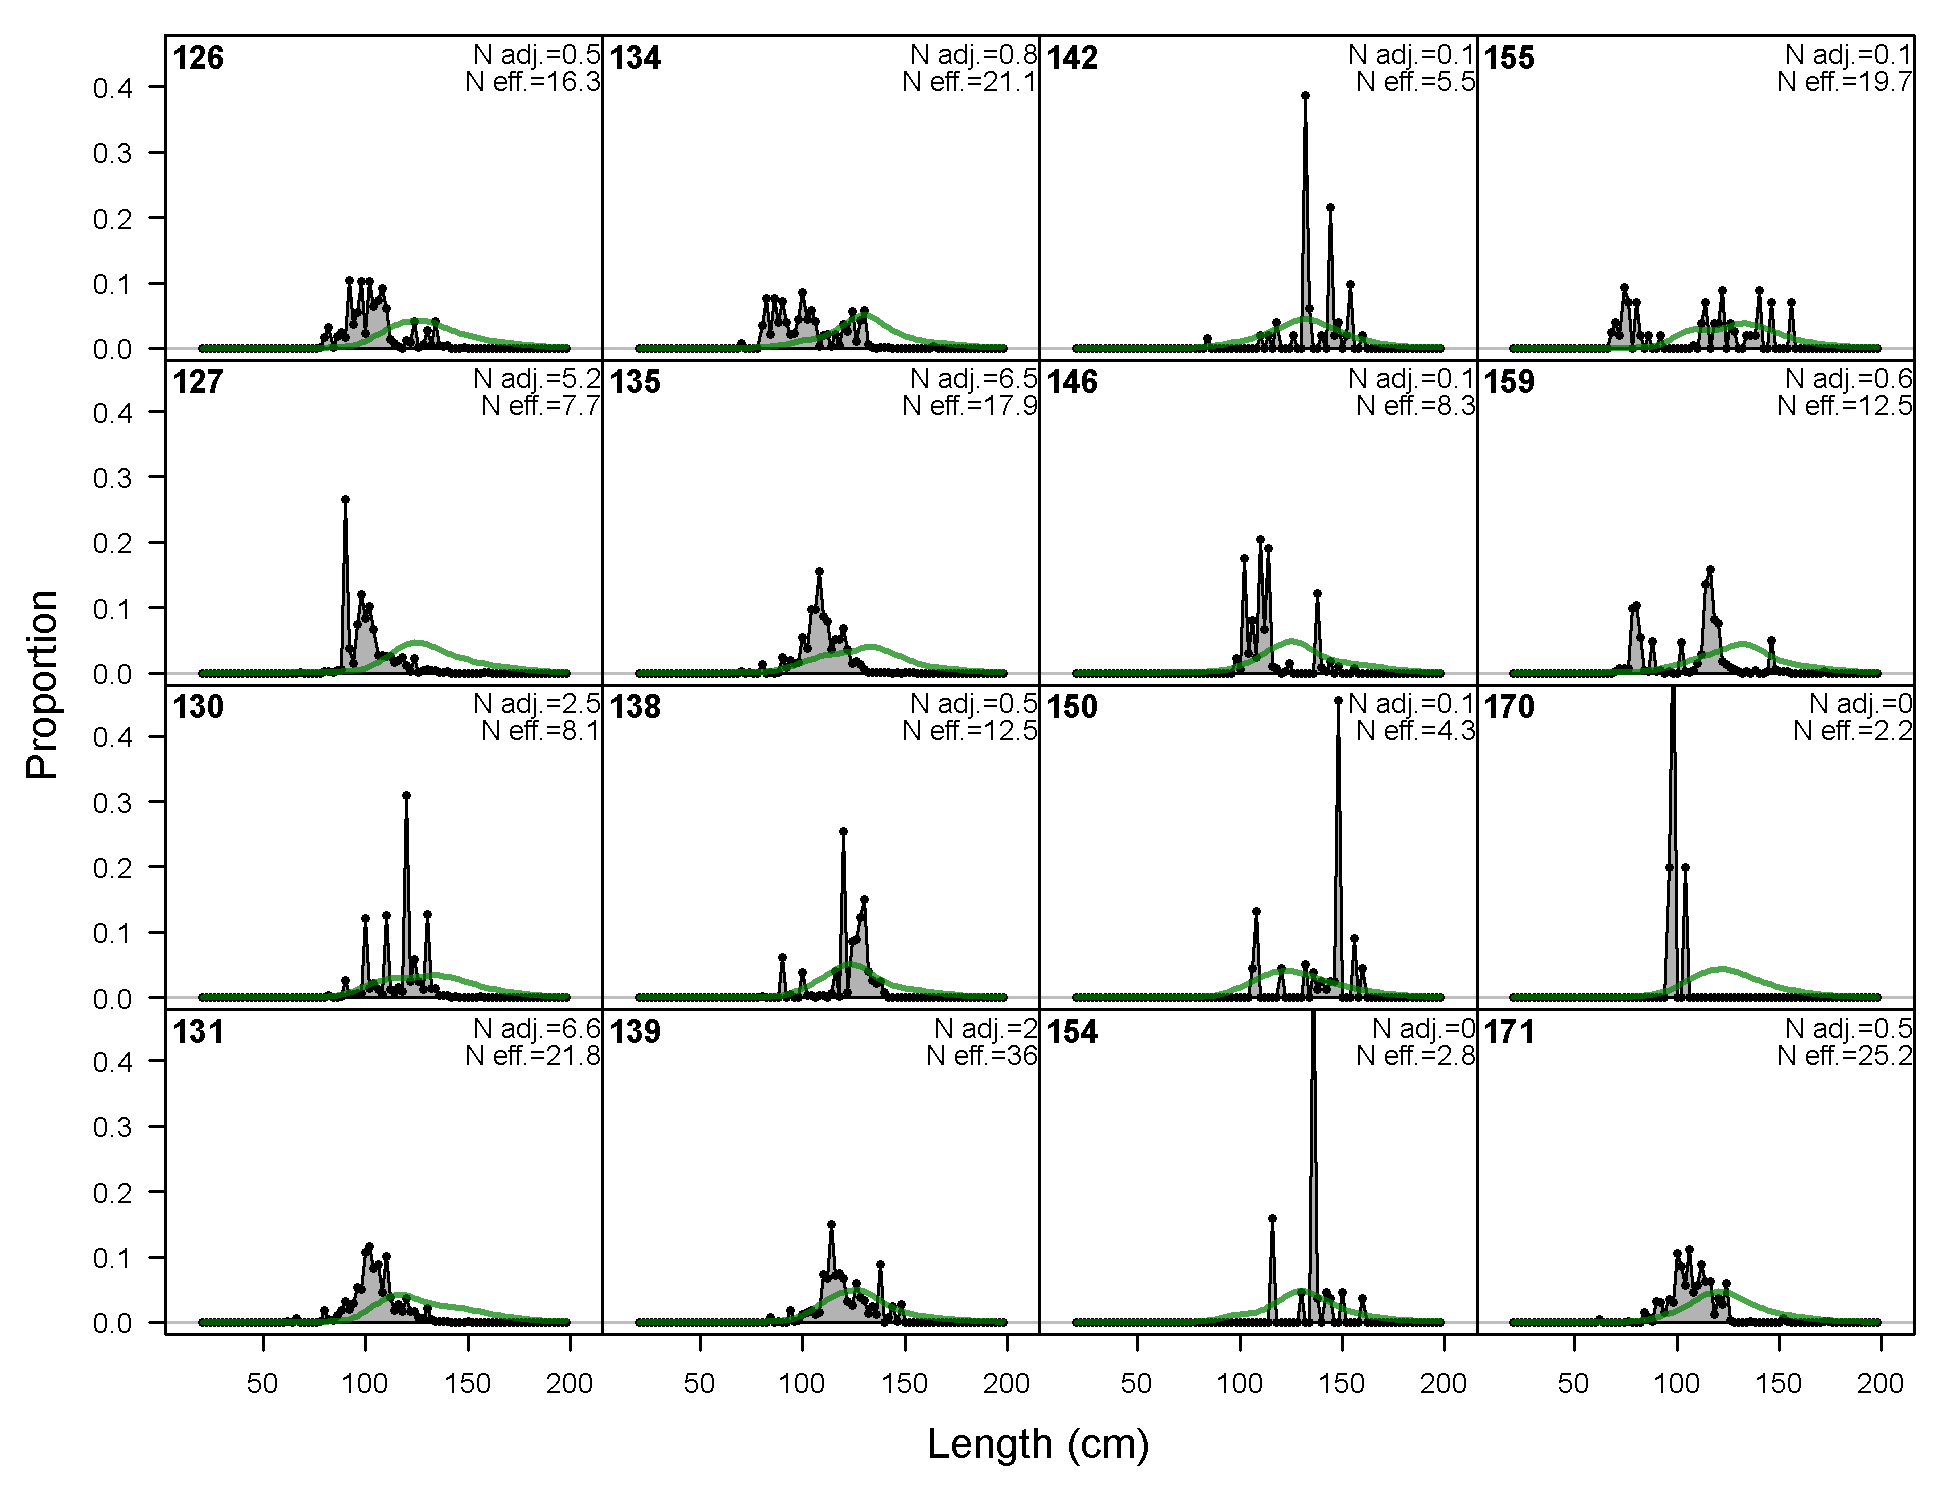
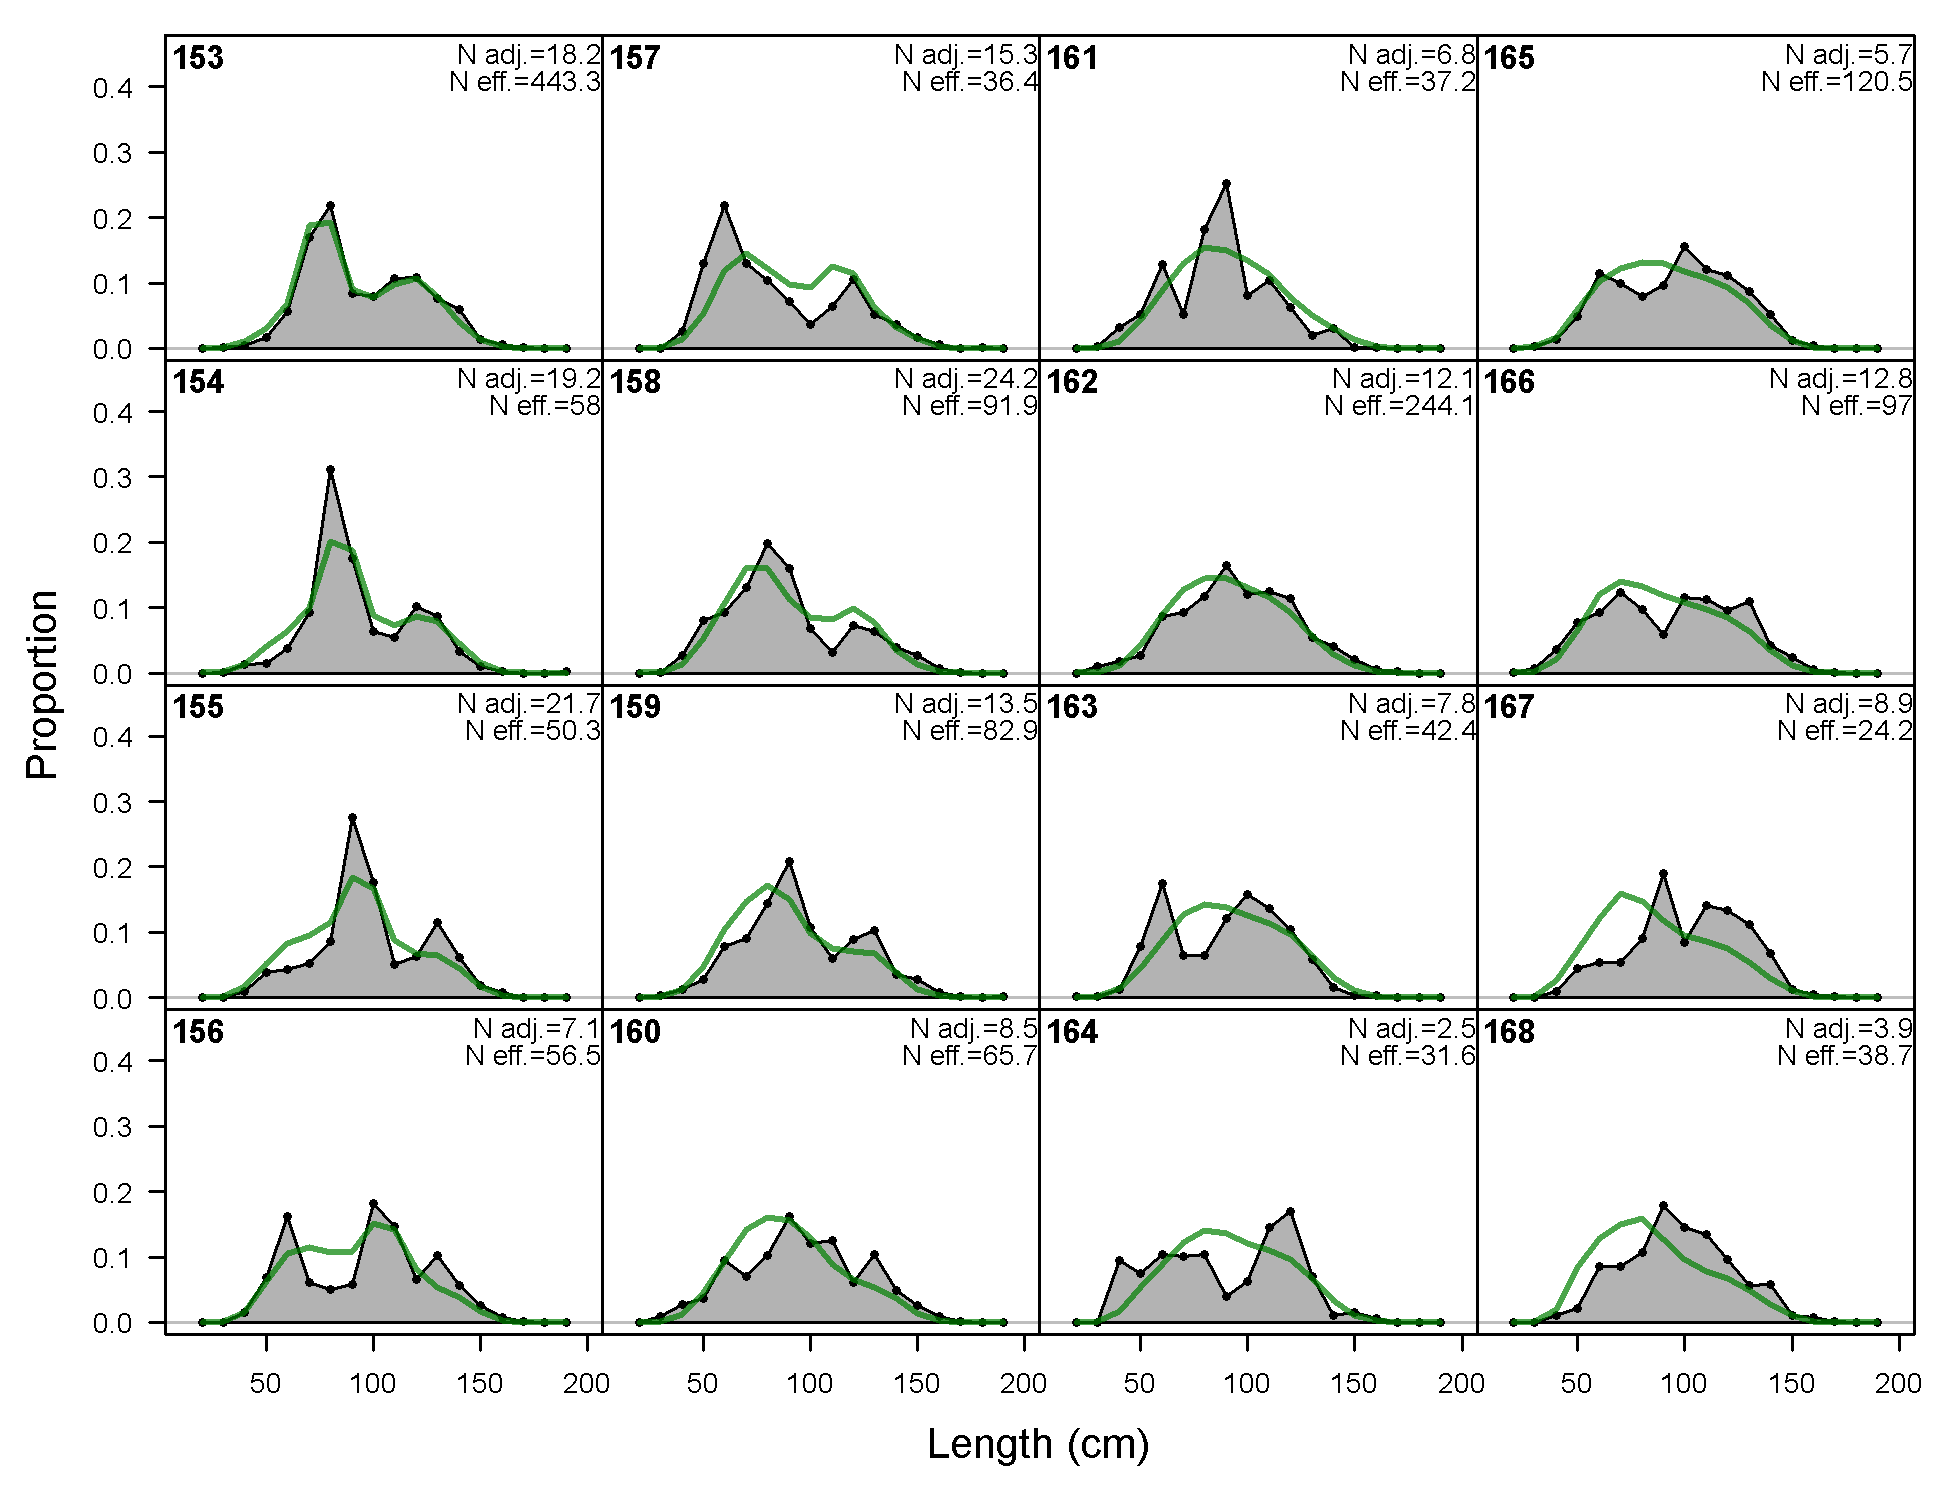
Length comps, whole catch, F7-OBJ_Nc_Q23 (plot 3 of 4)
file: comp_lenfit_flt7mkt0_page3.png
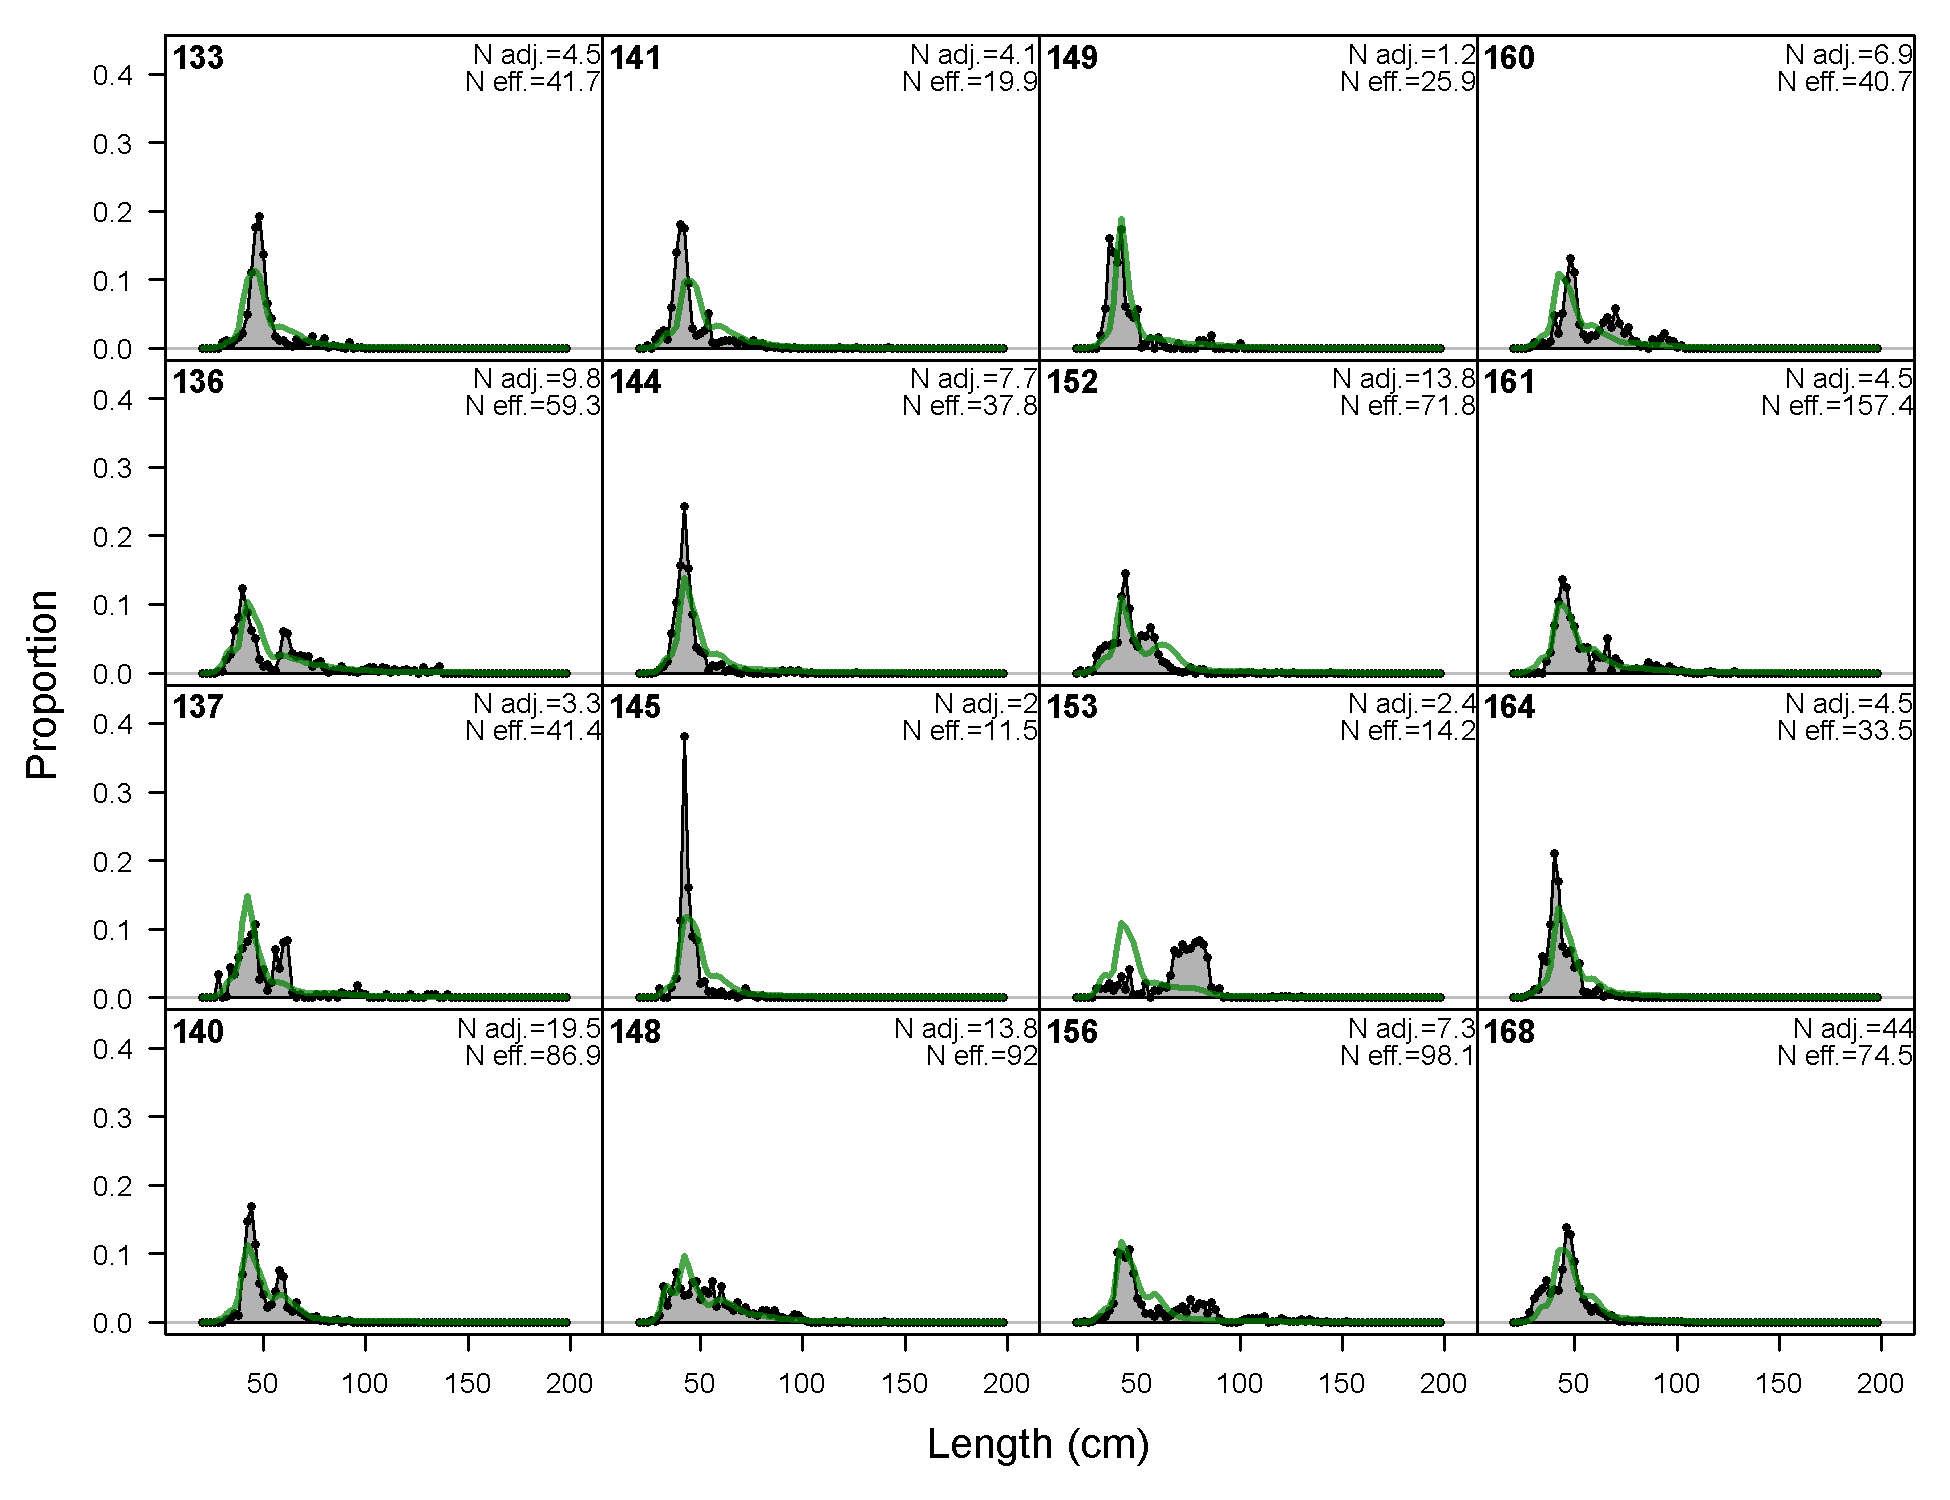
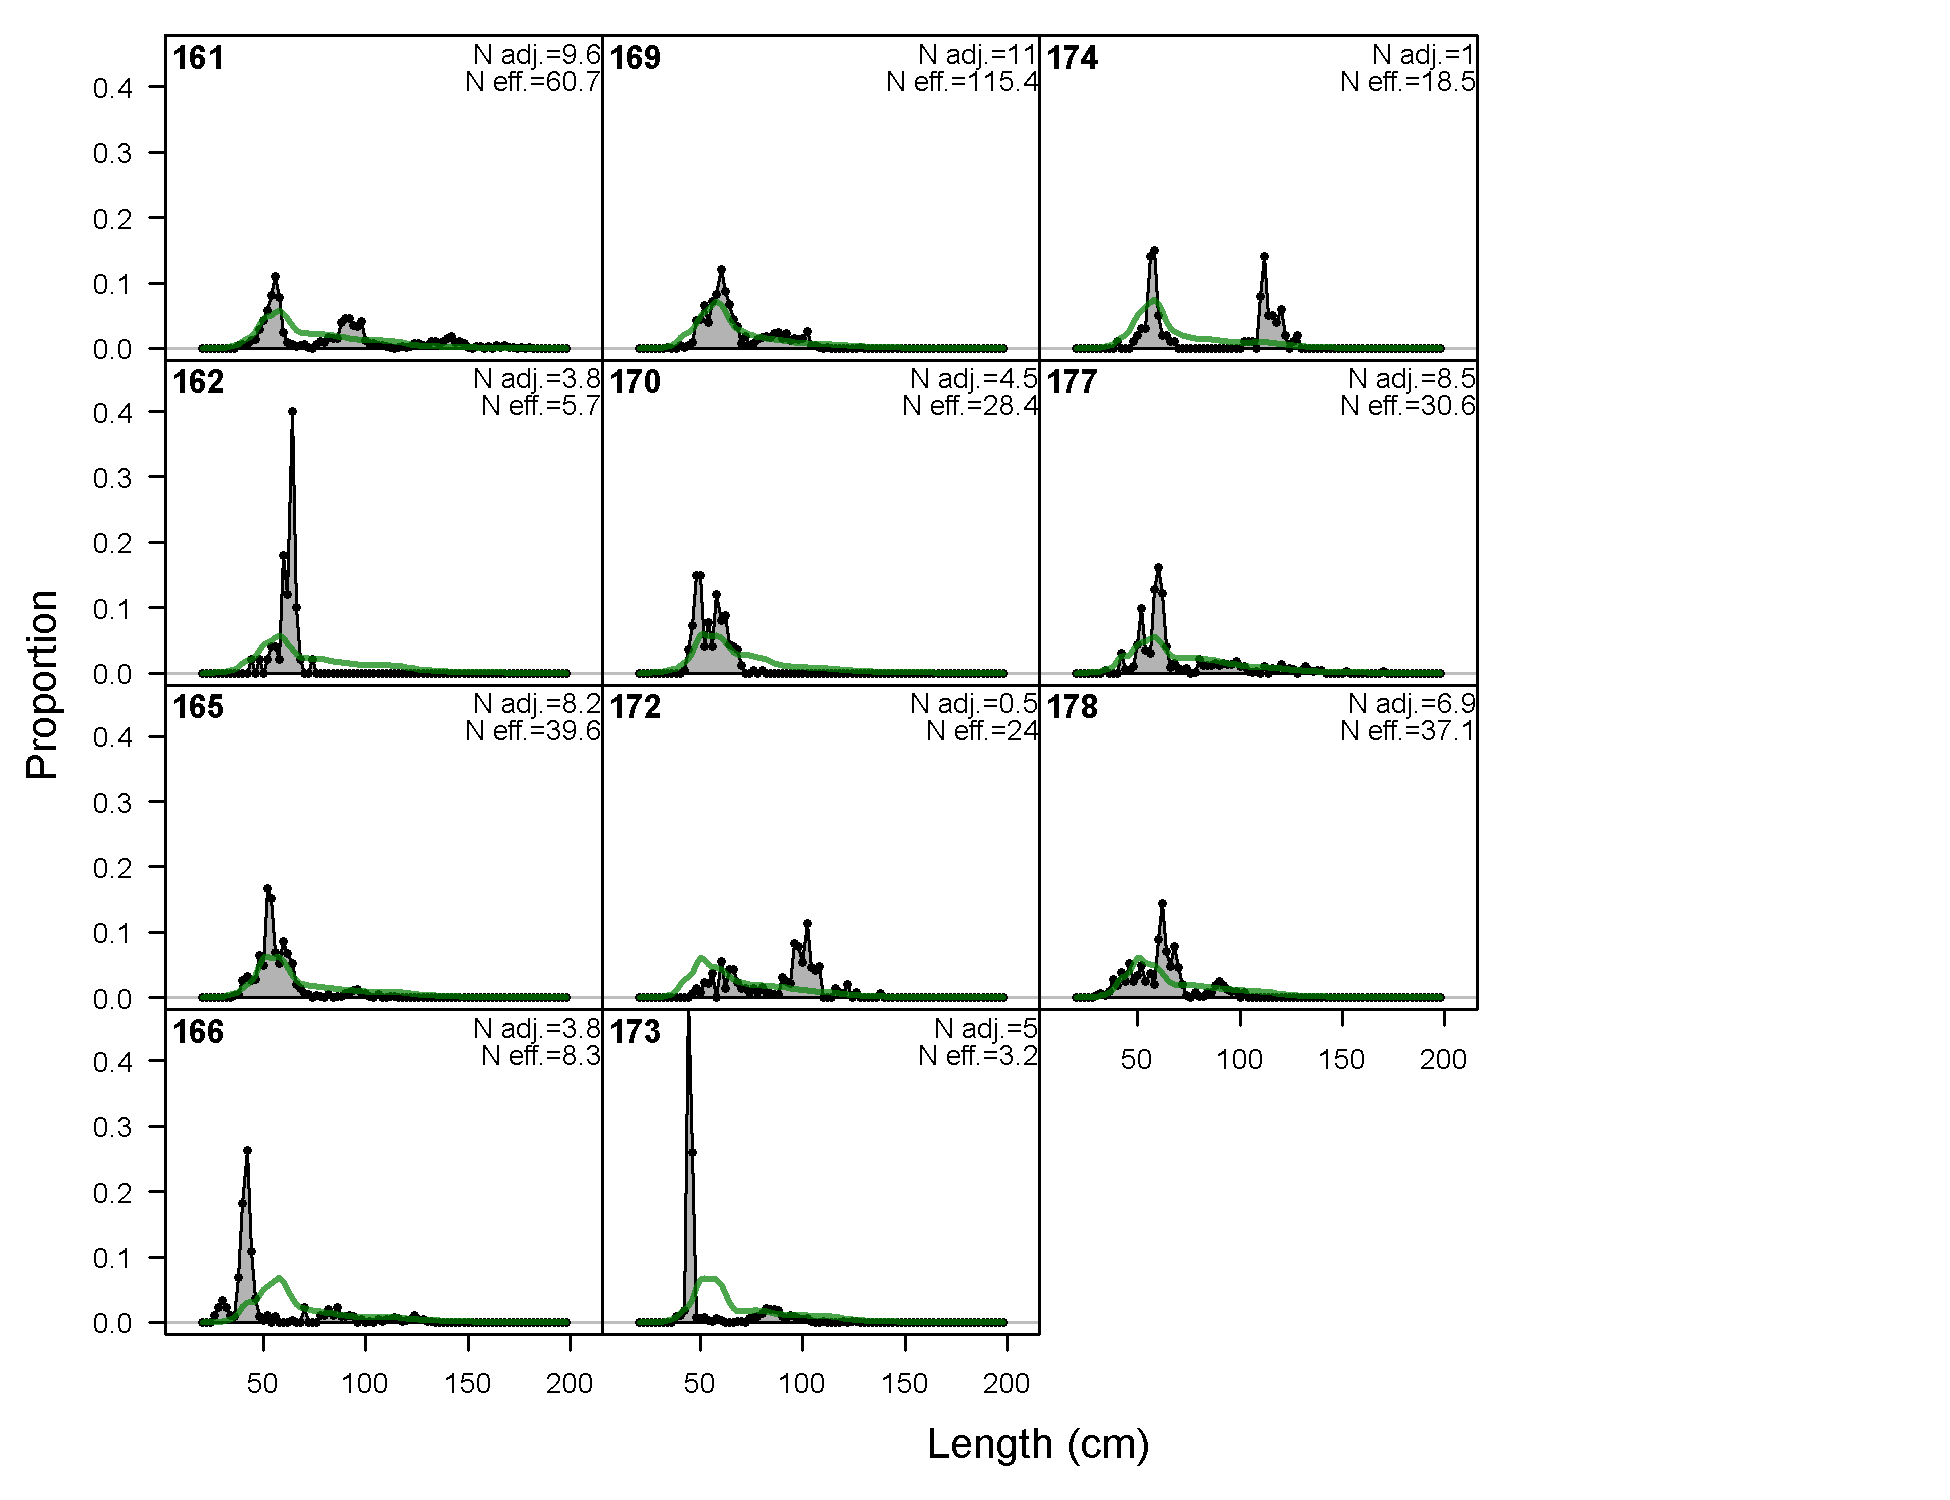
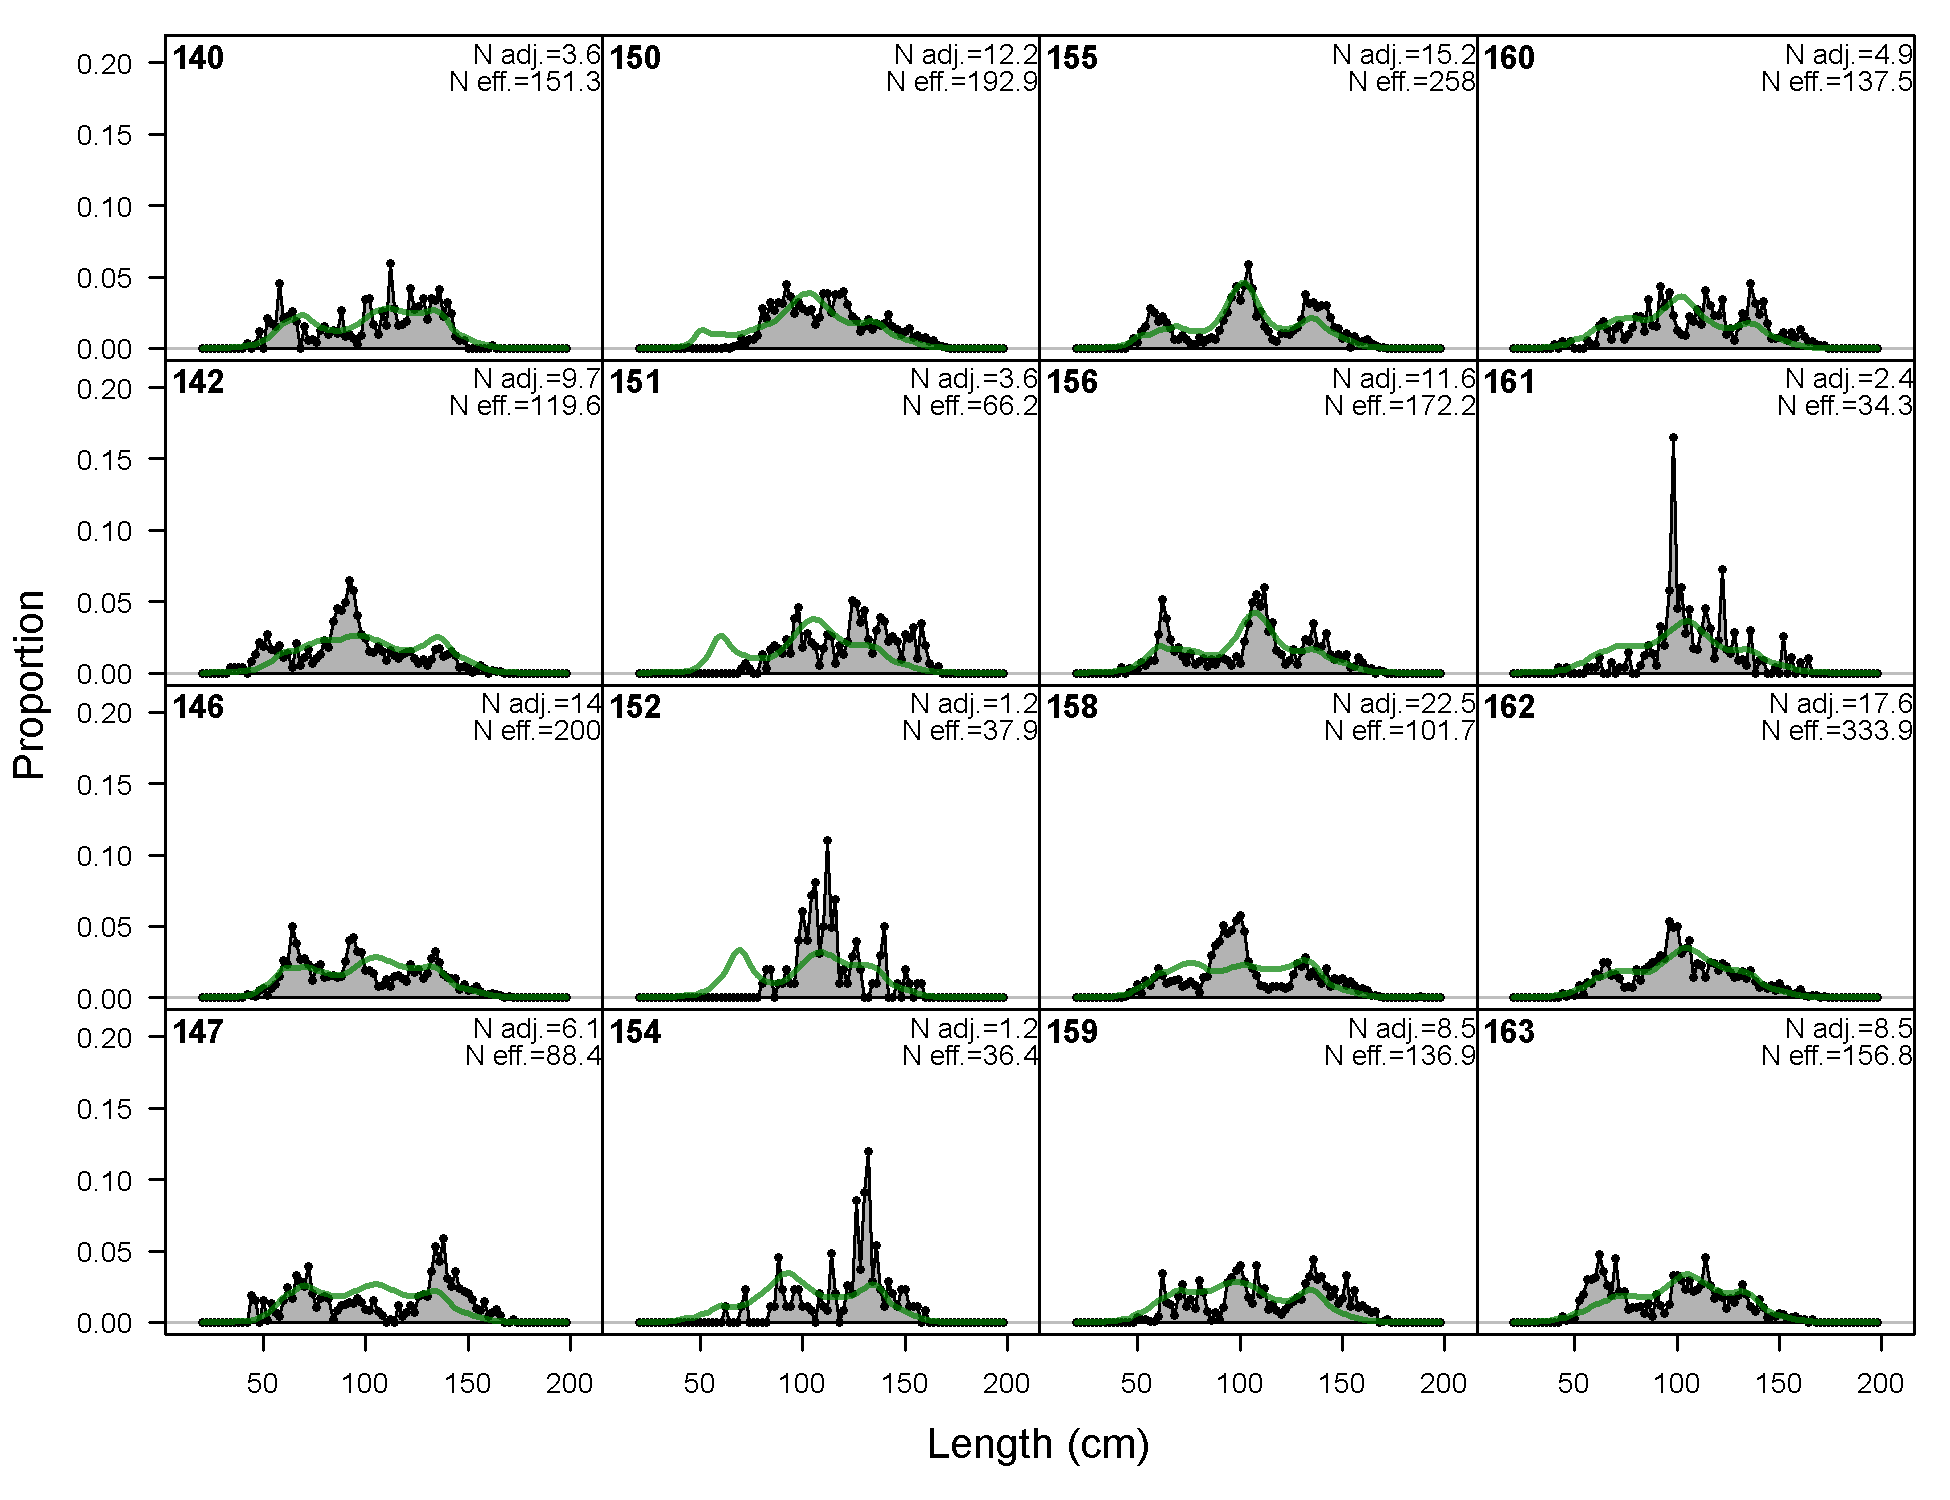
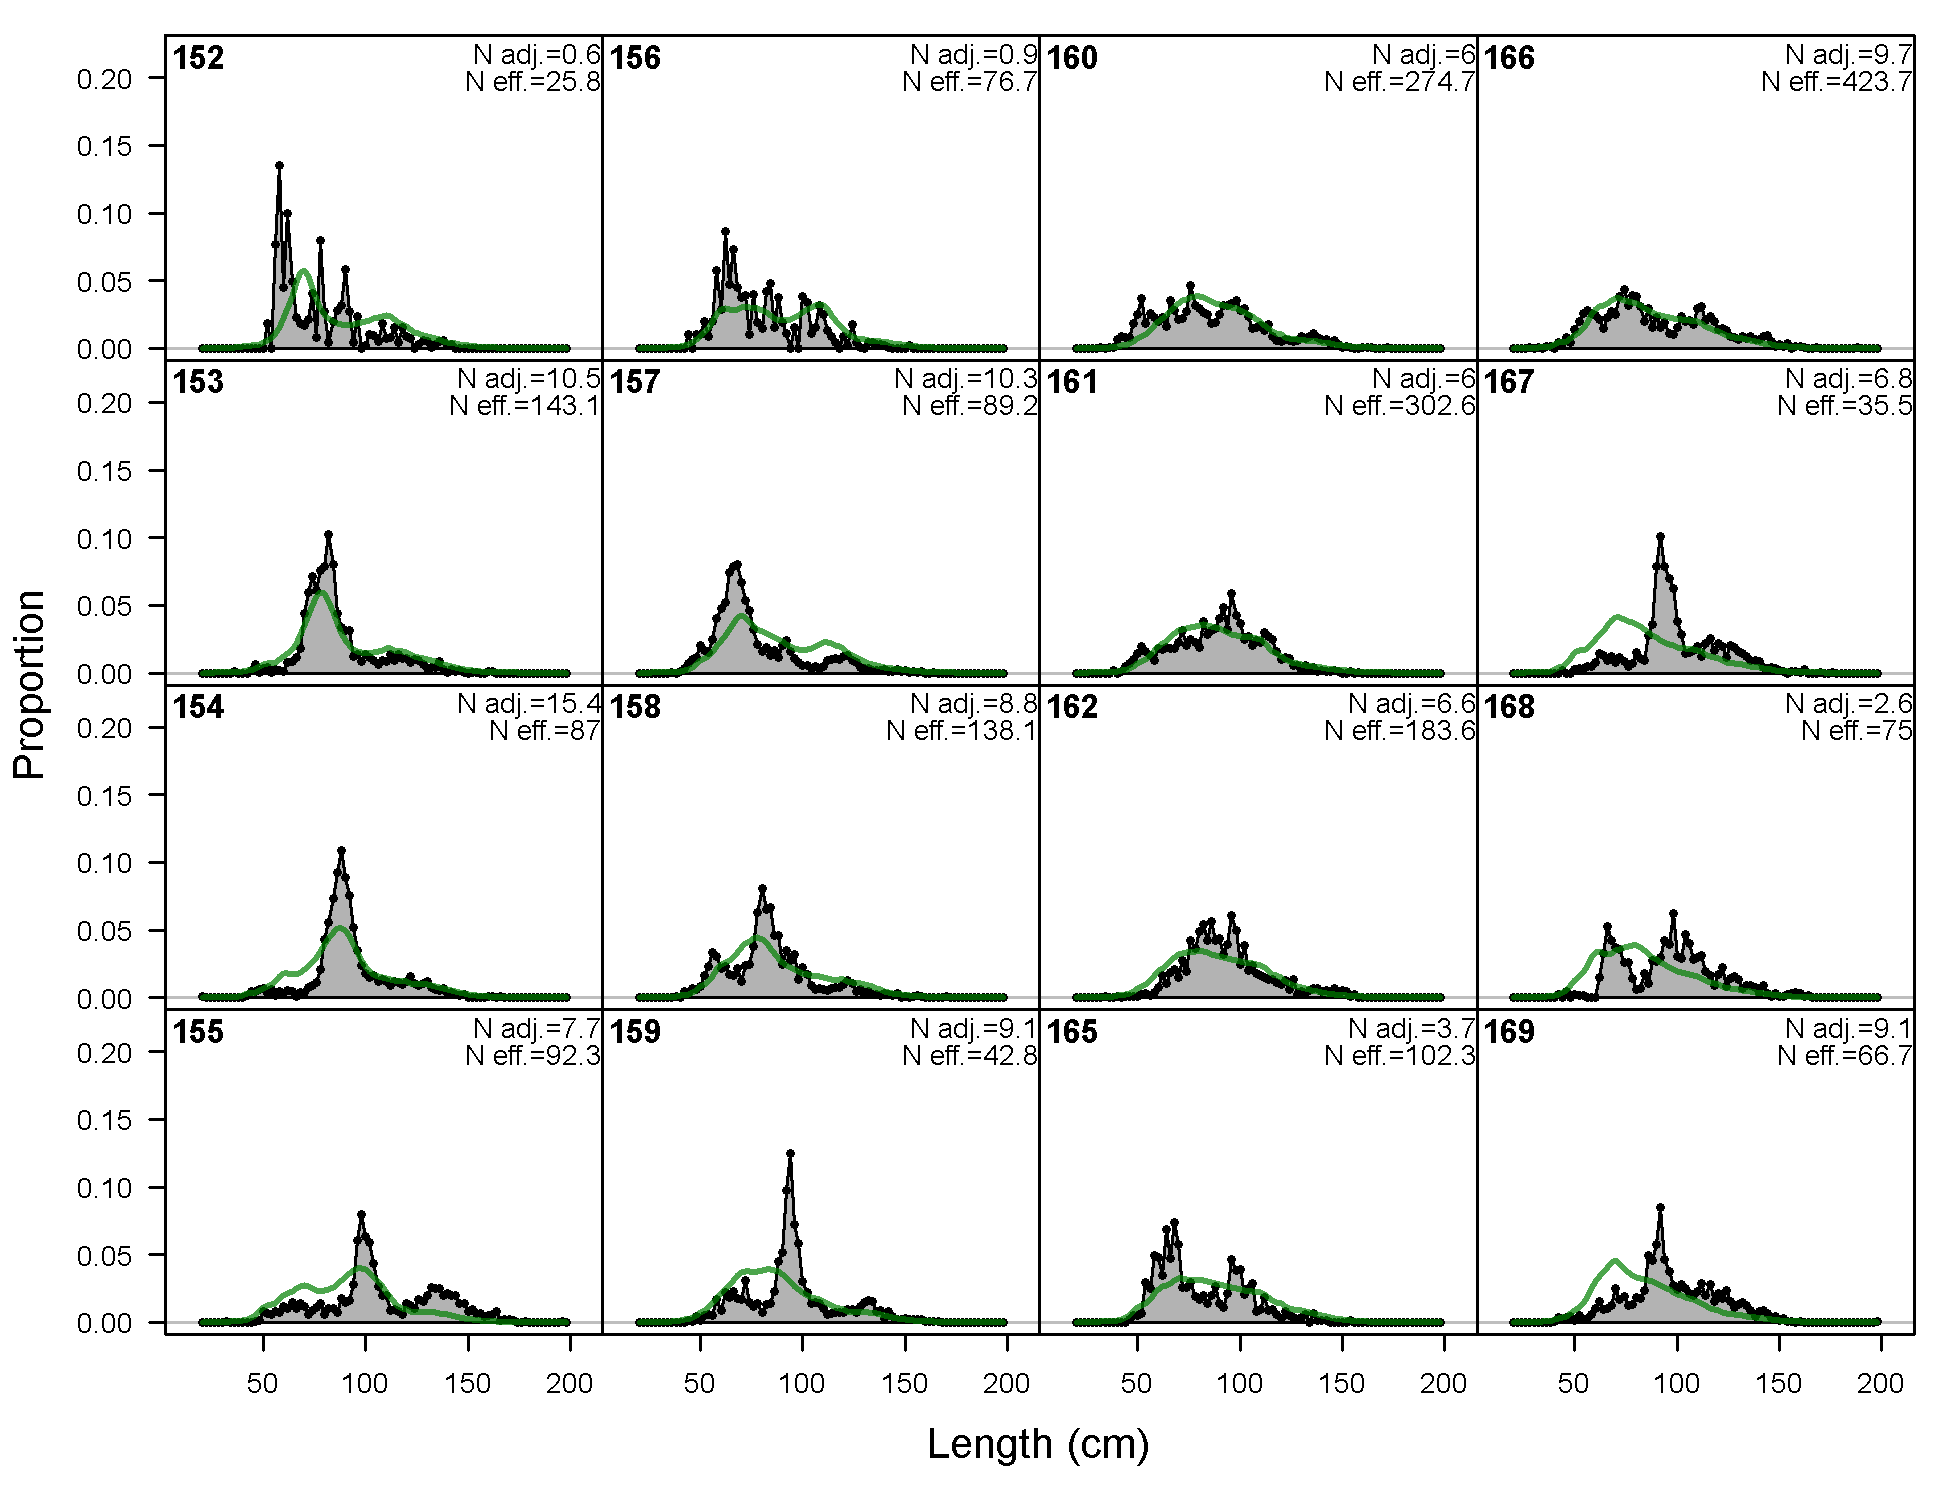
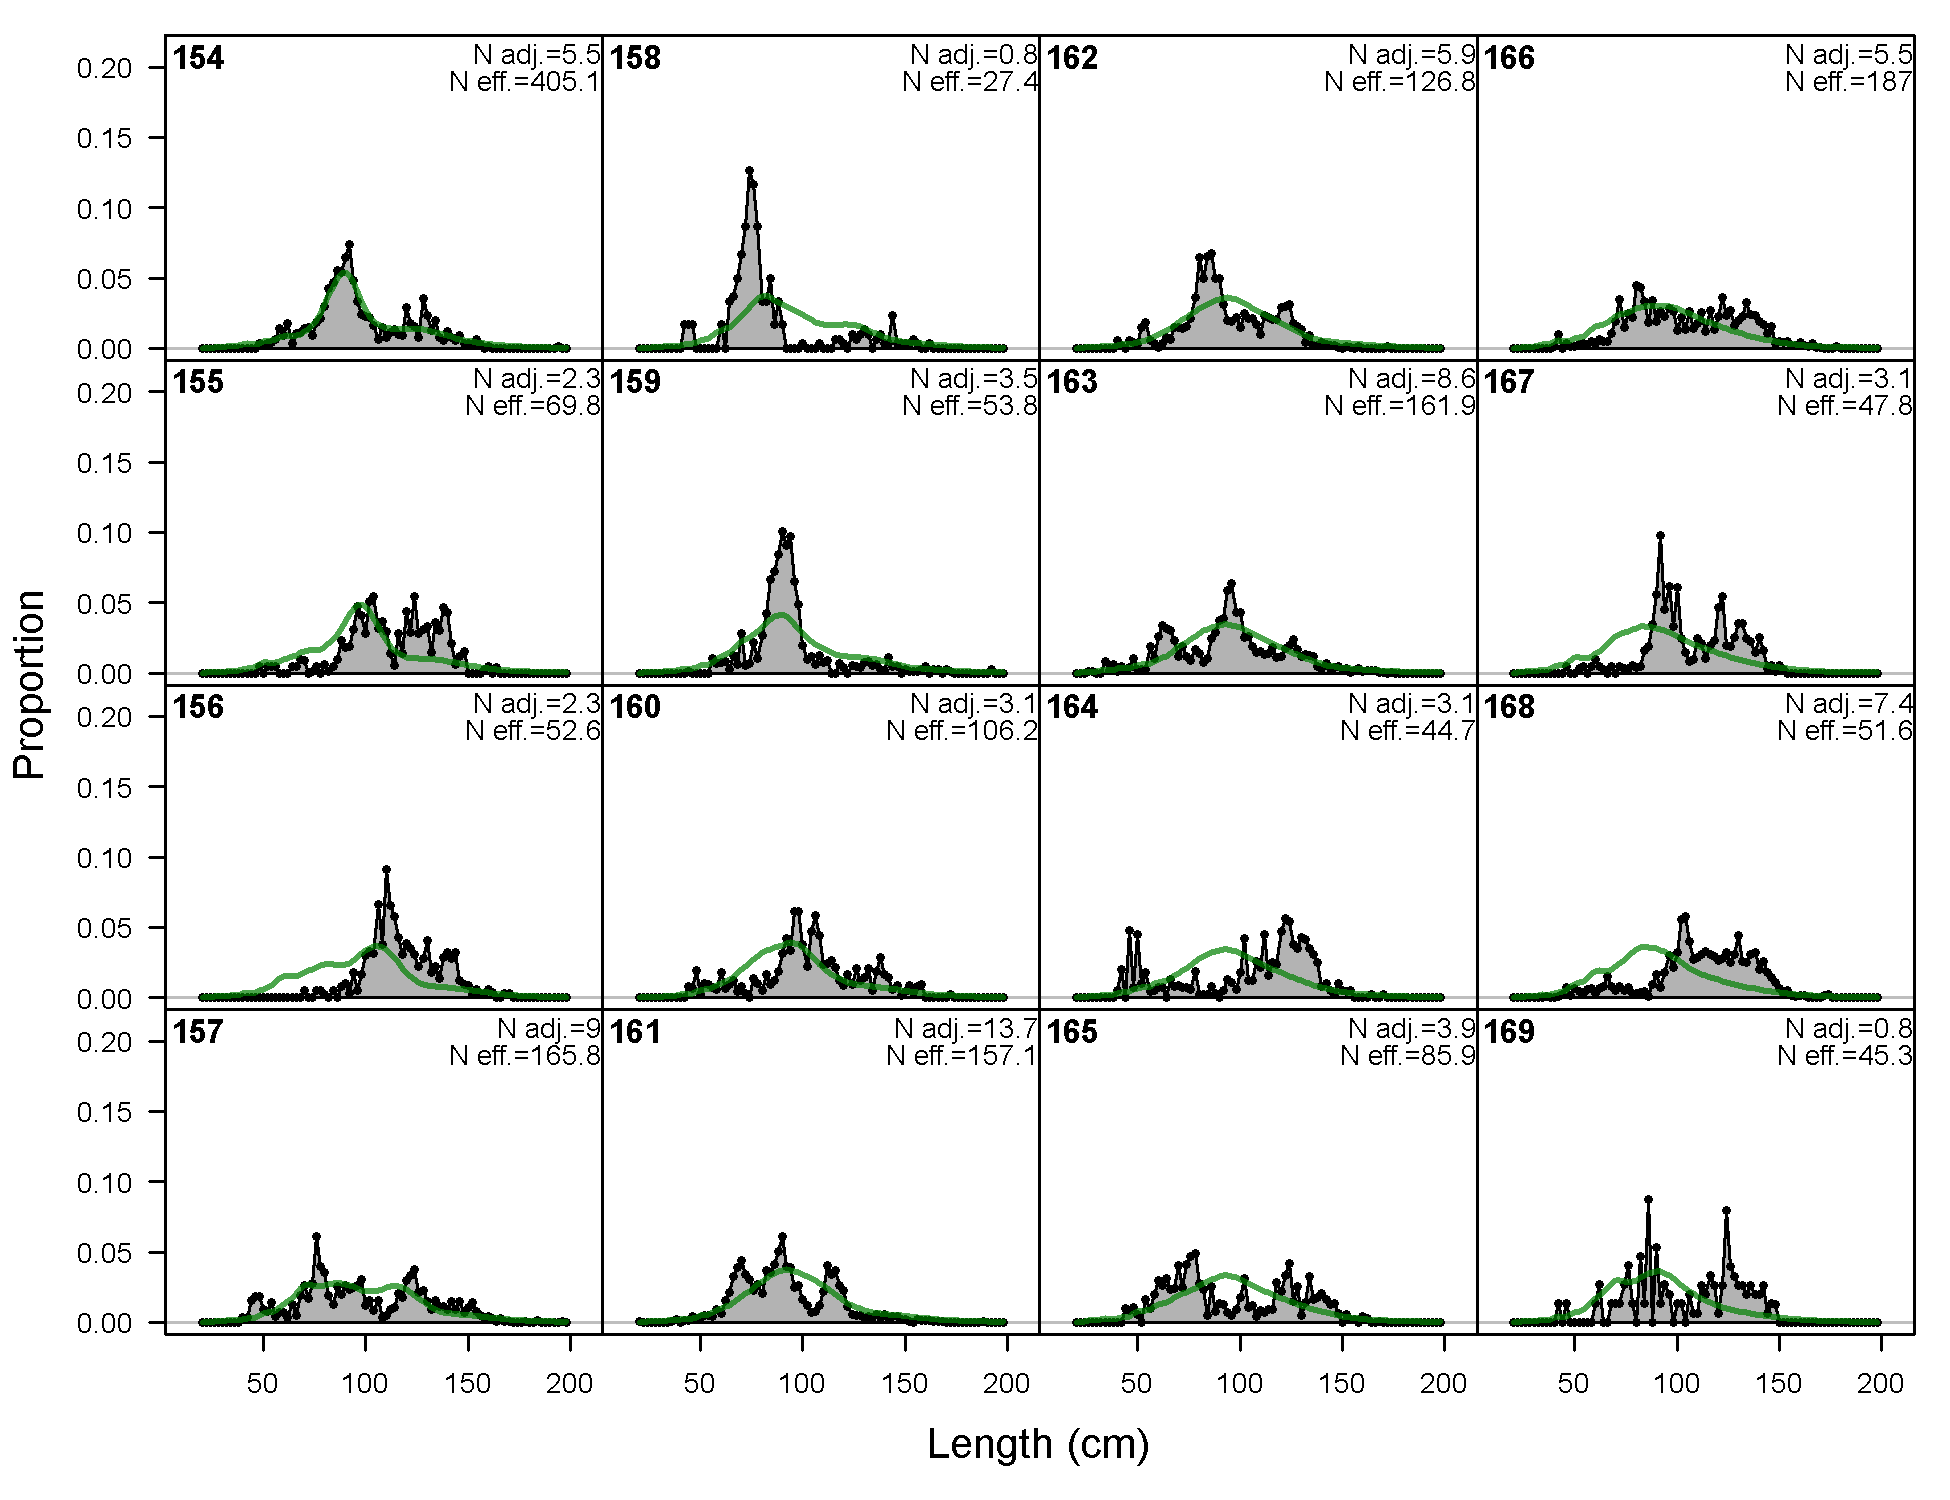
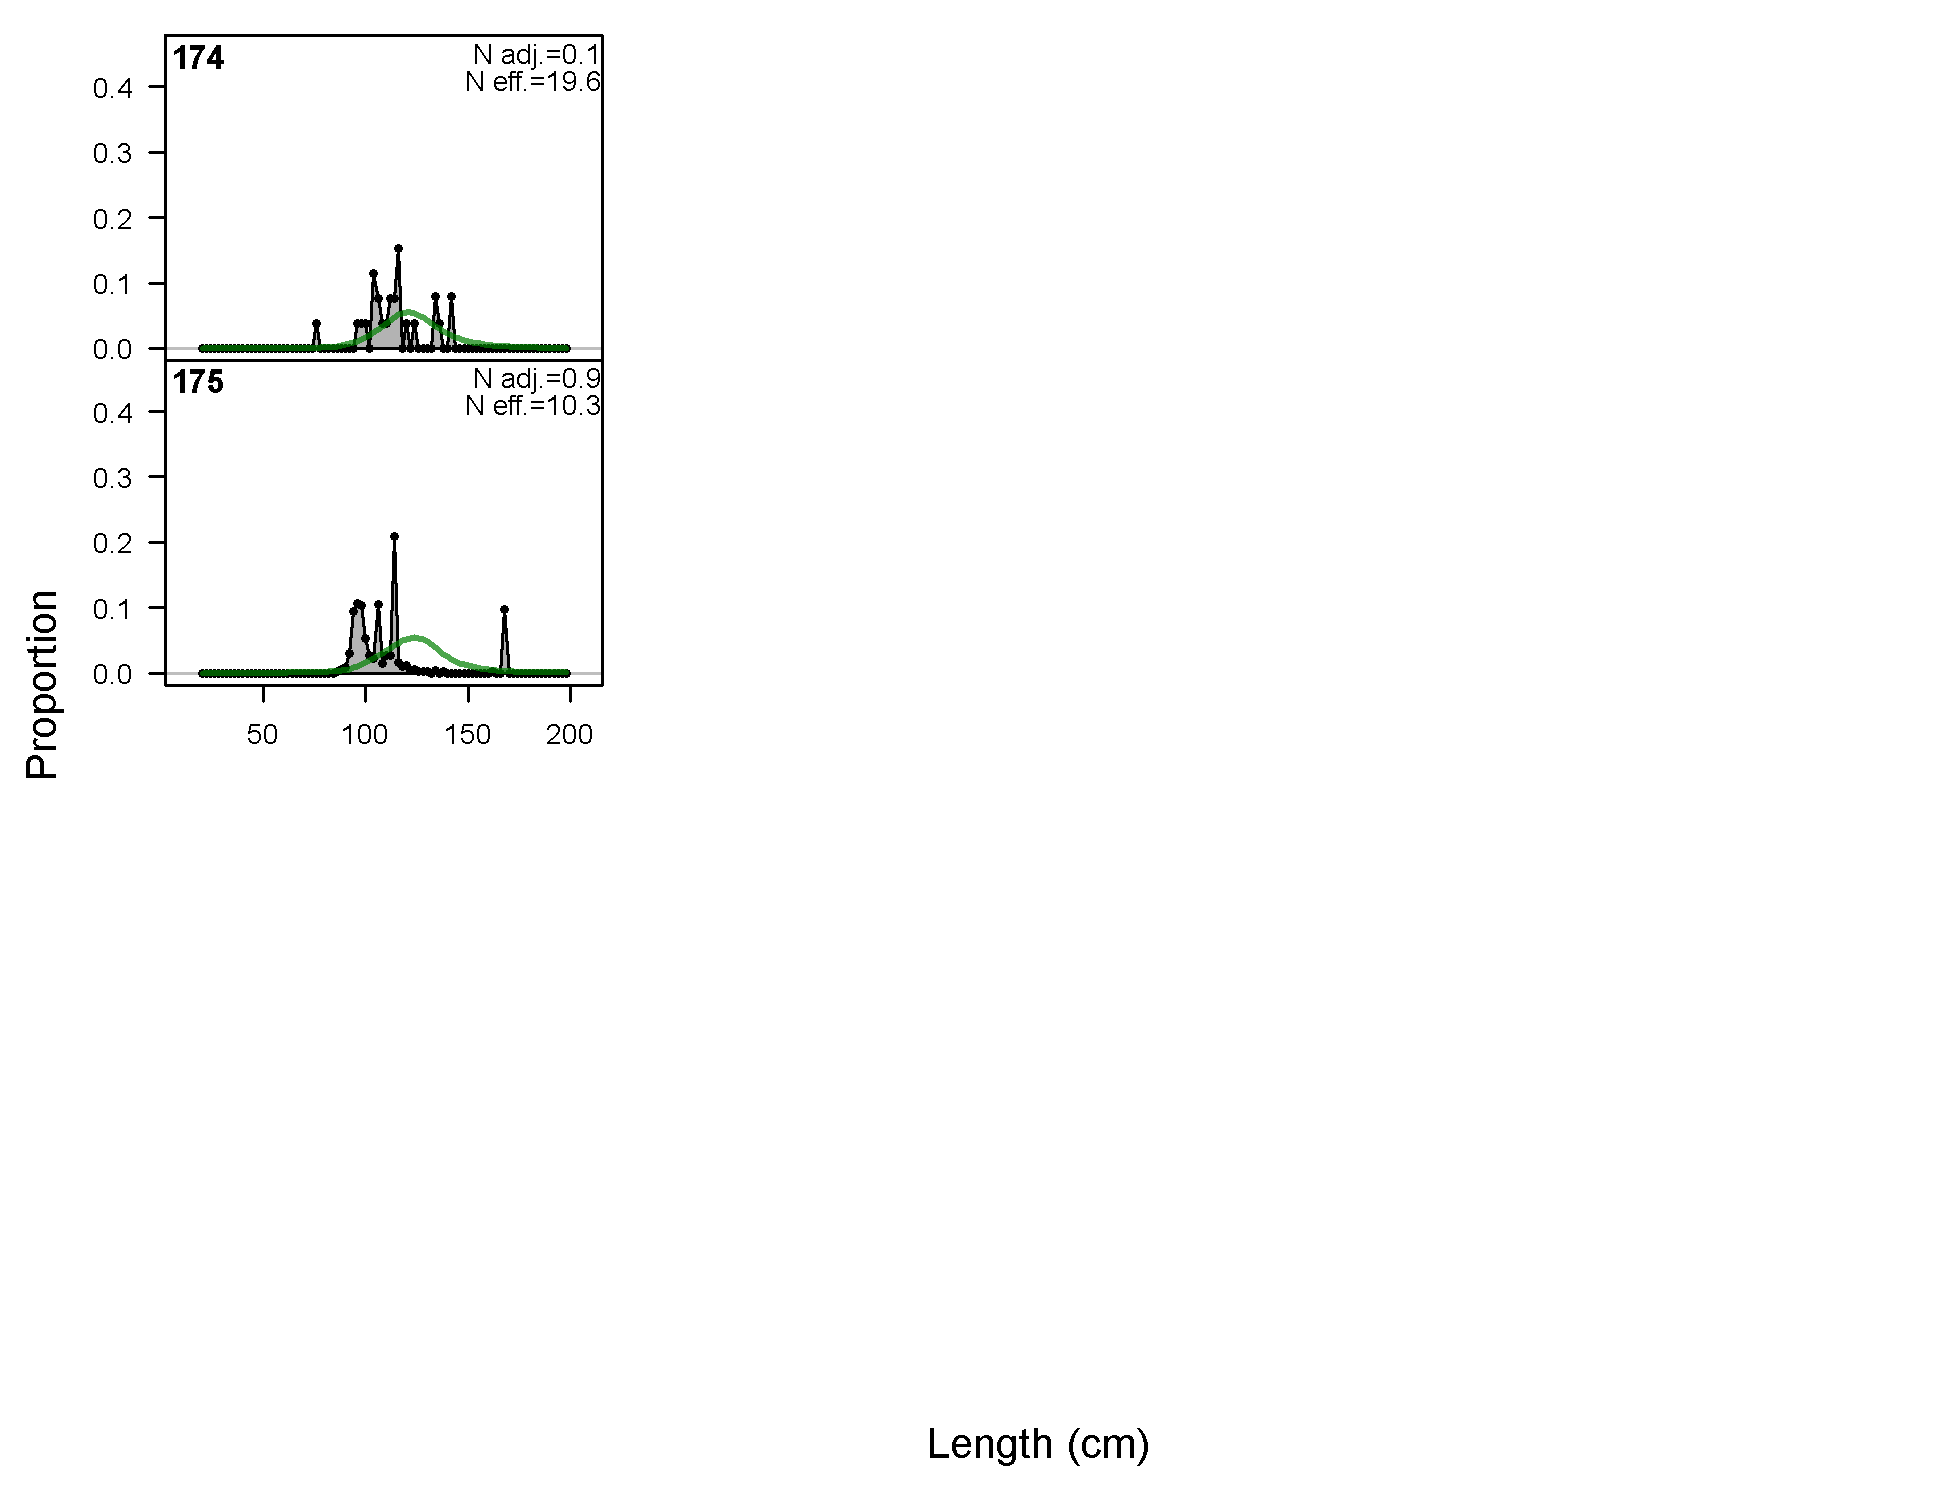
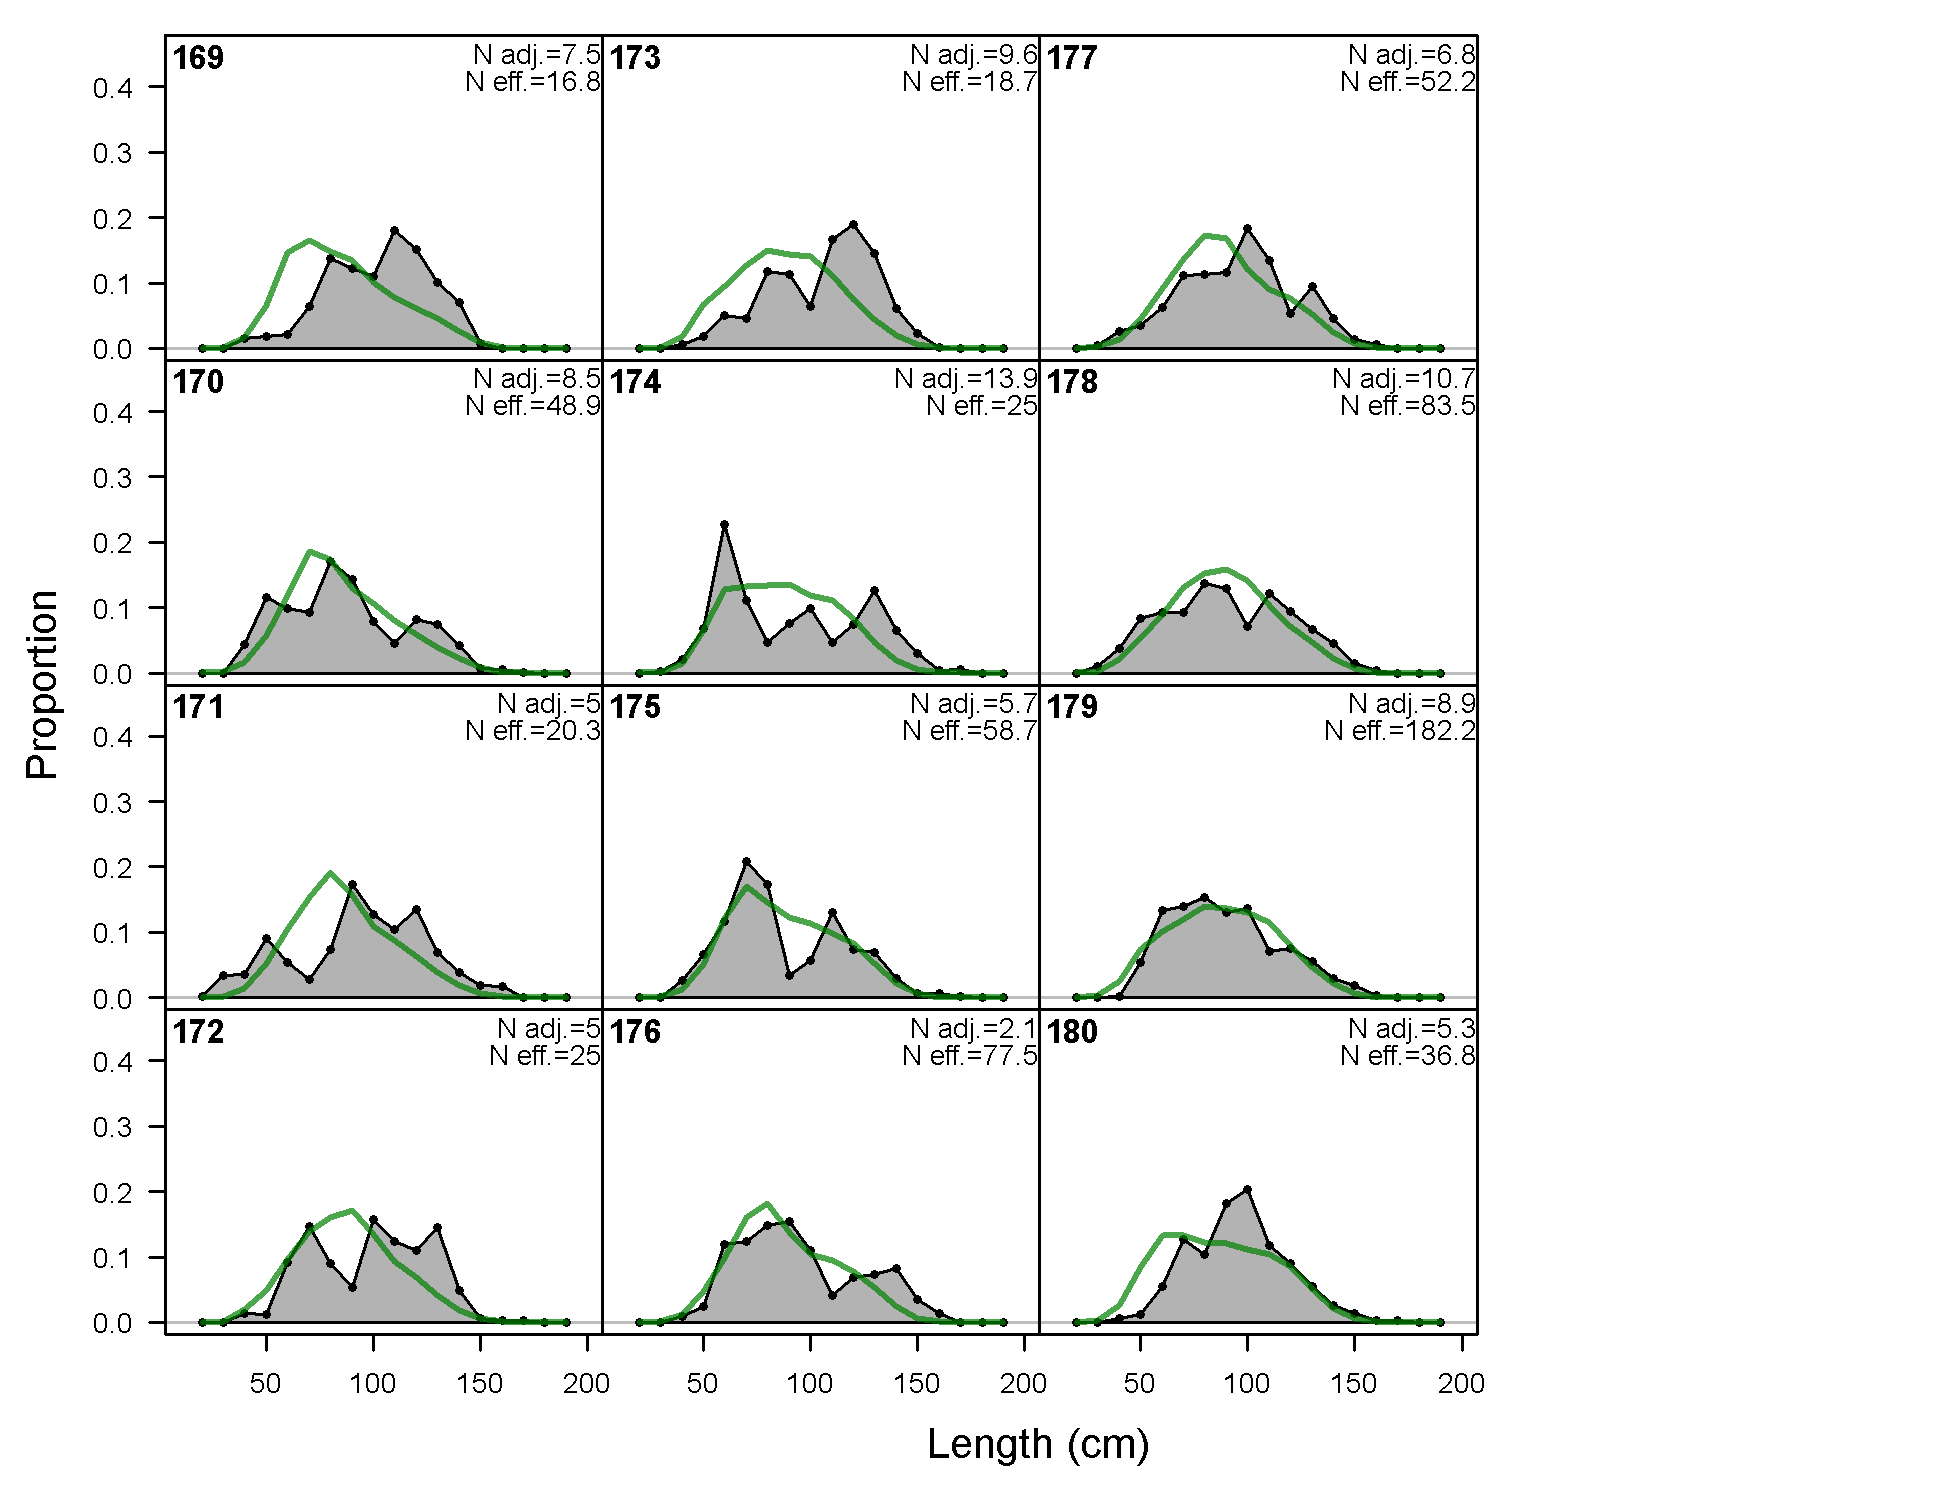
Length comps, whole catch, F7-OBJ_Nc_Q23 (plot 4 of 4)
file: comp_lenfit_flt7mkt0_page4.png
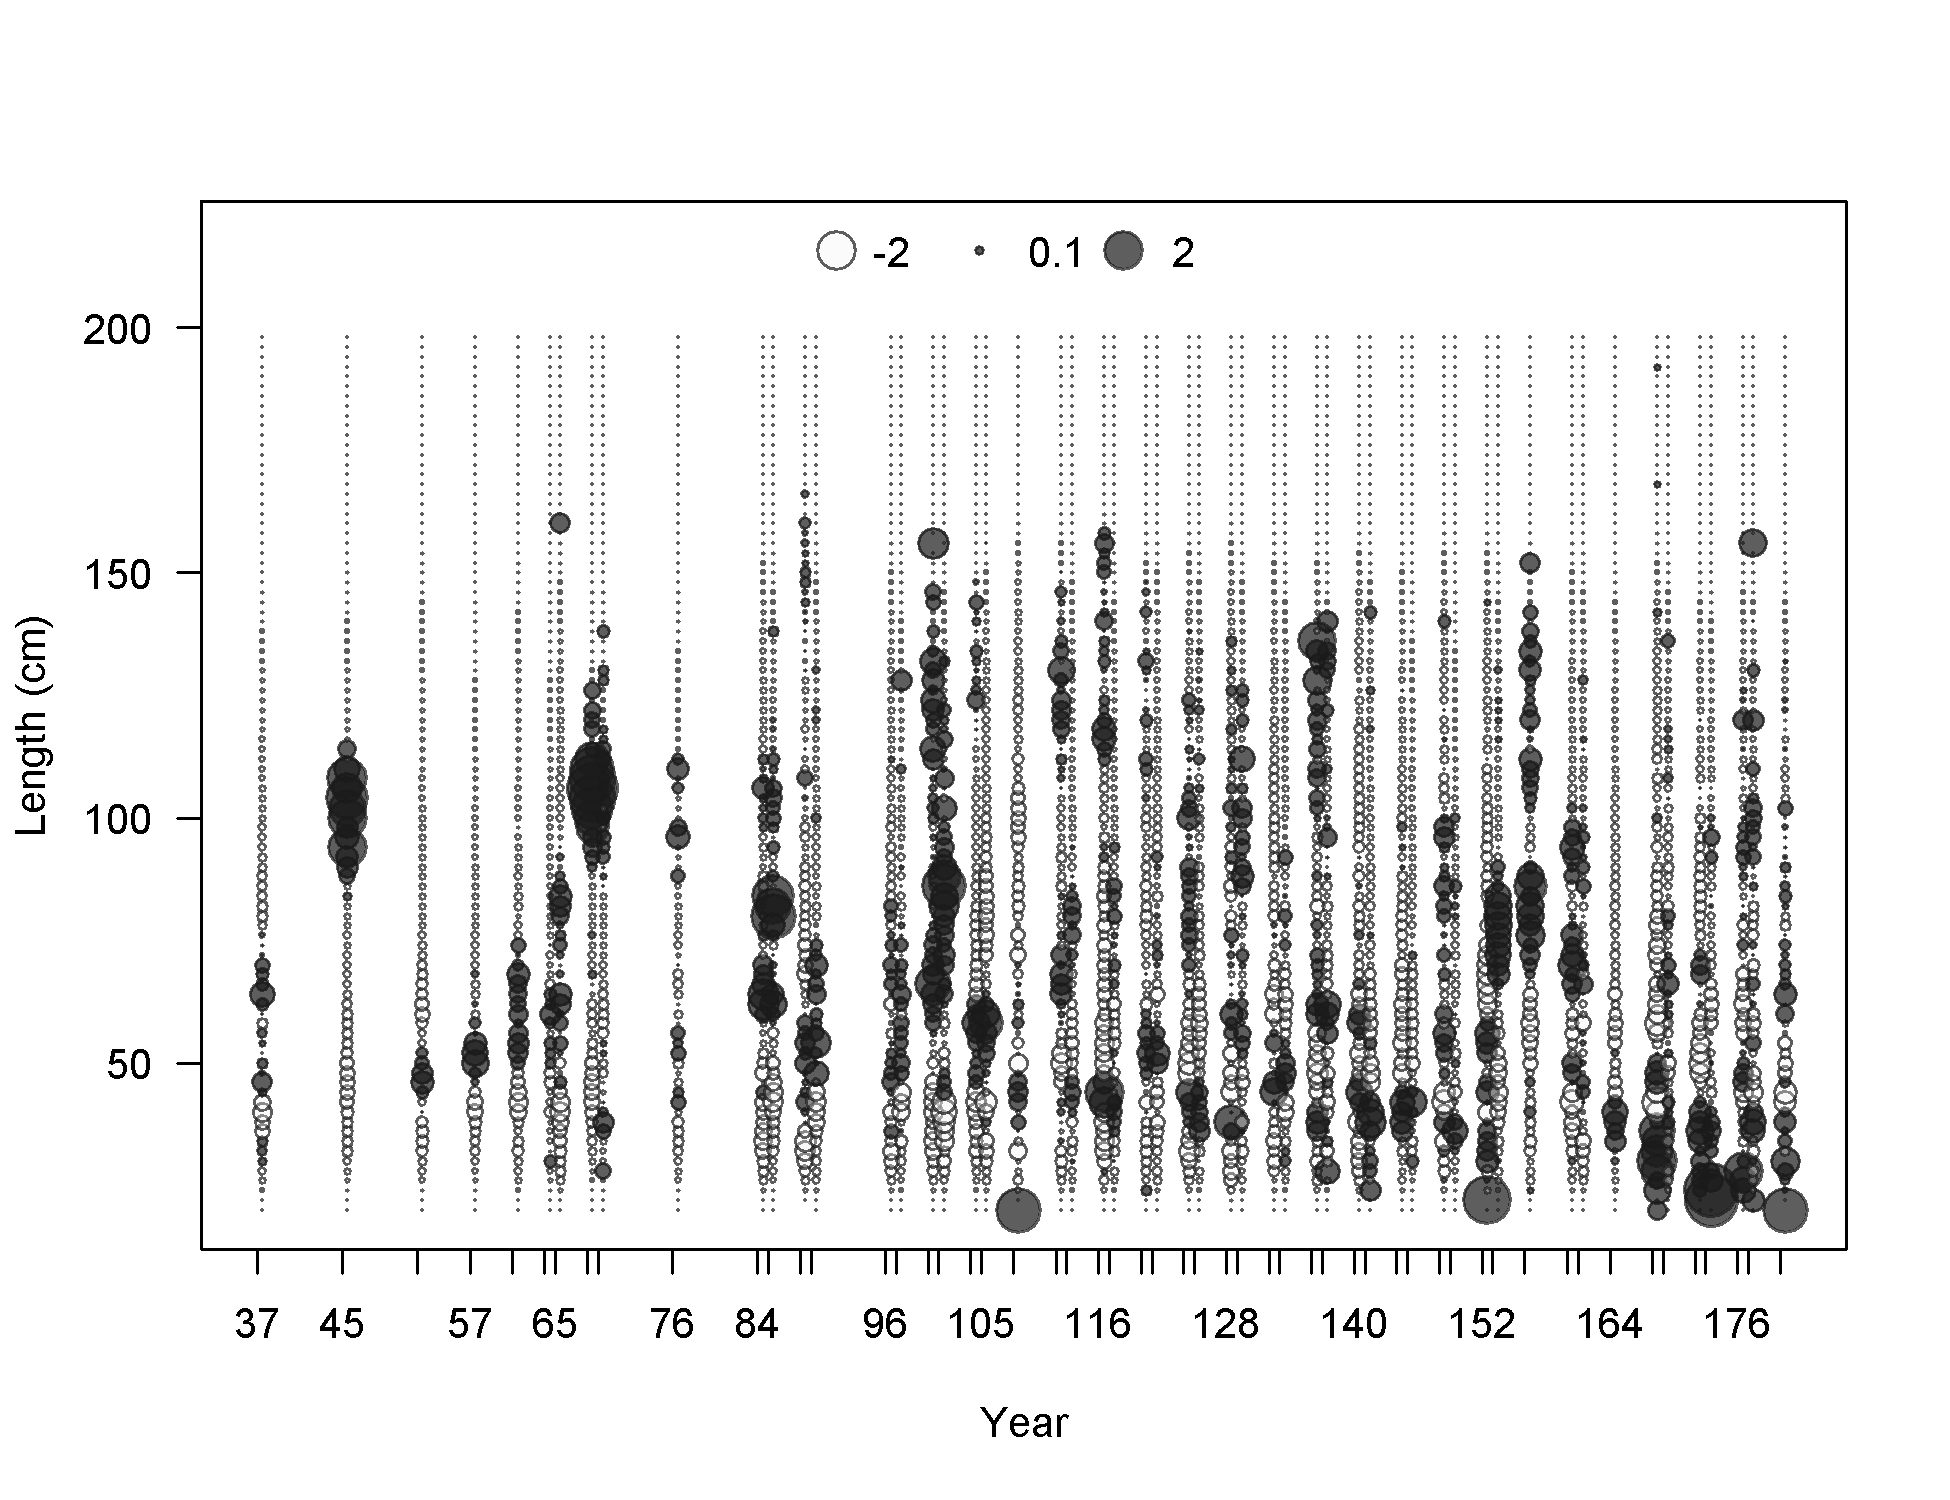
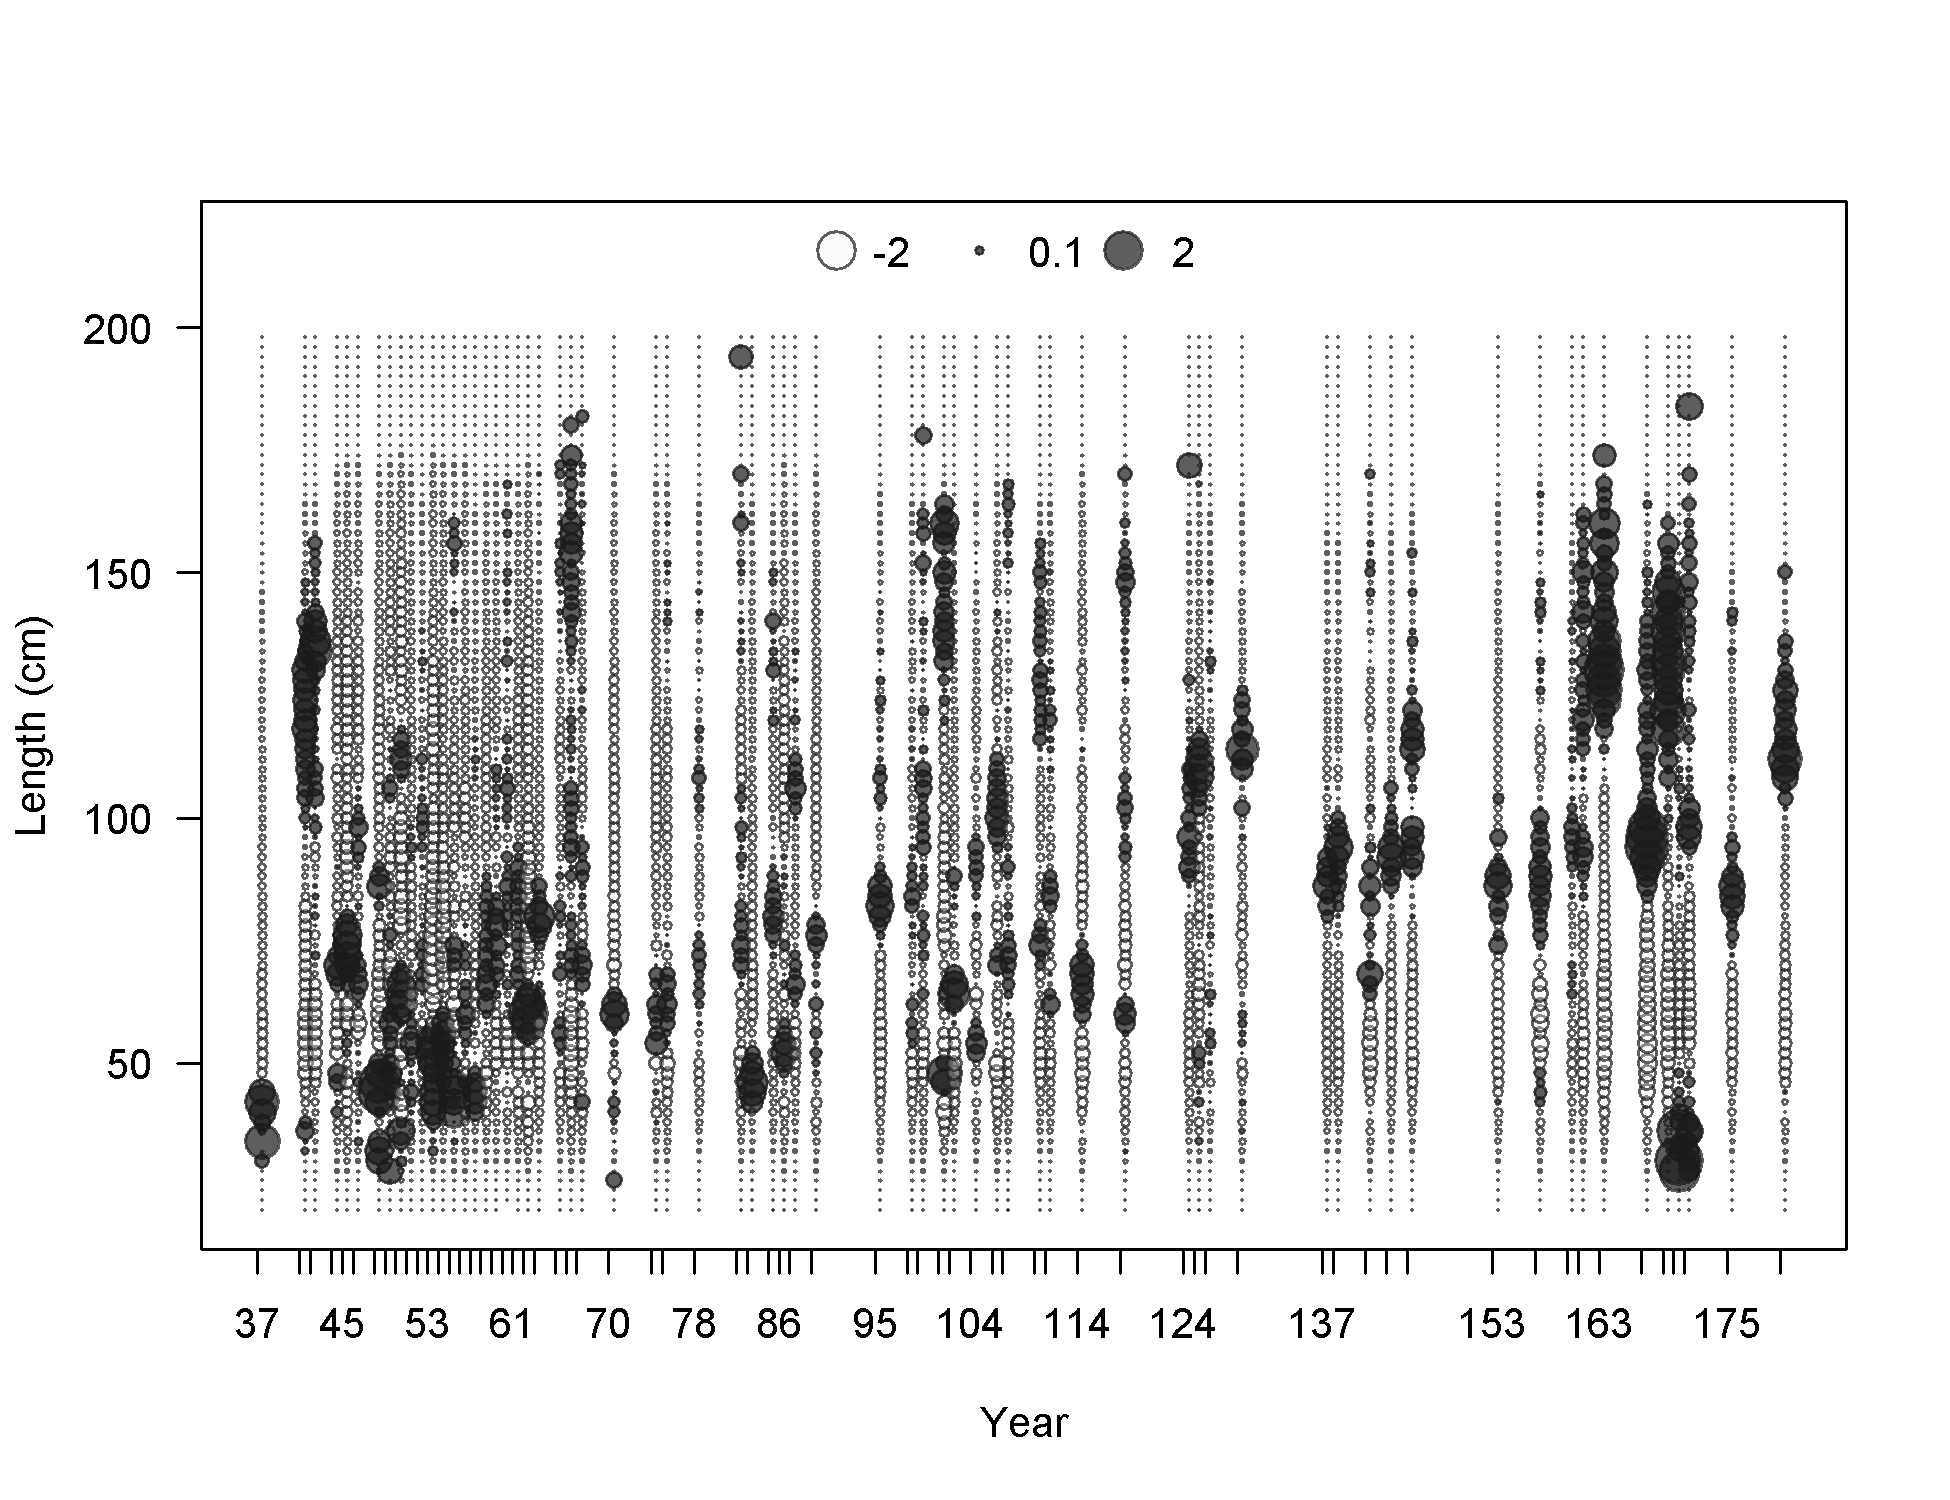
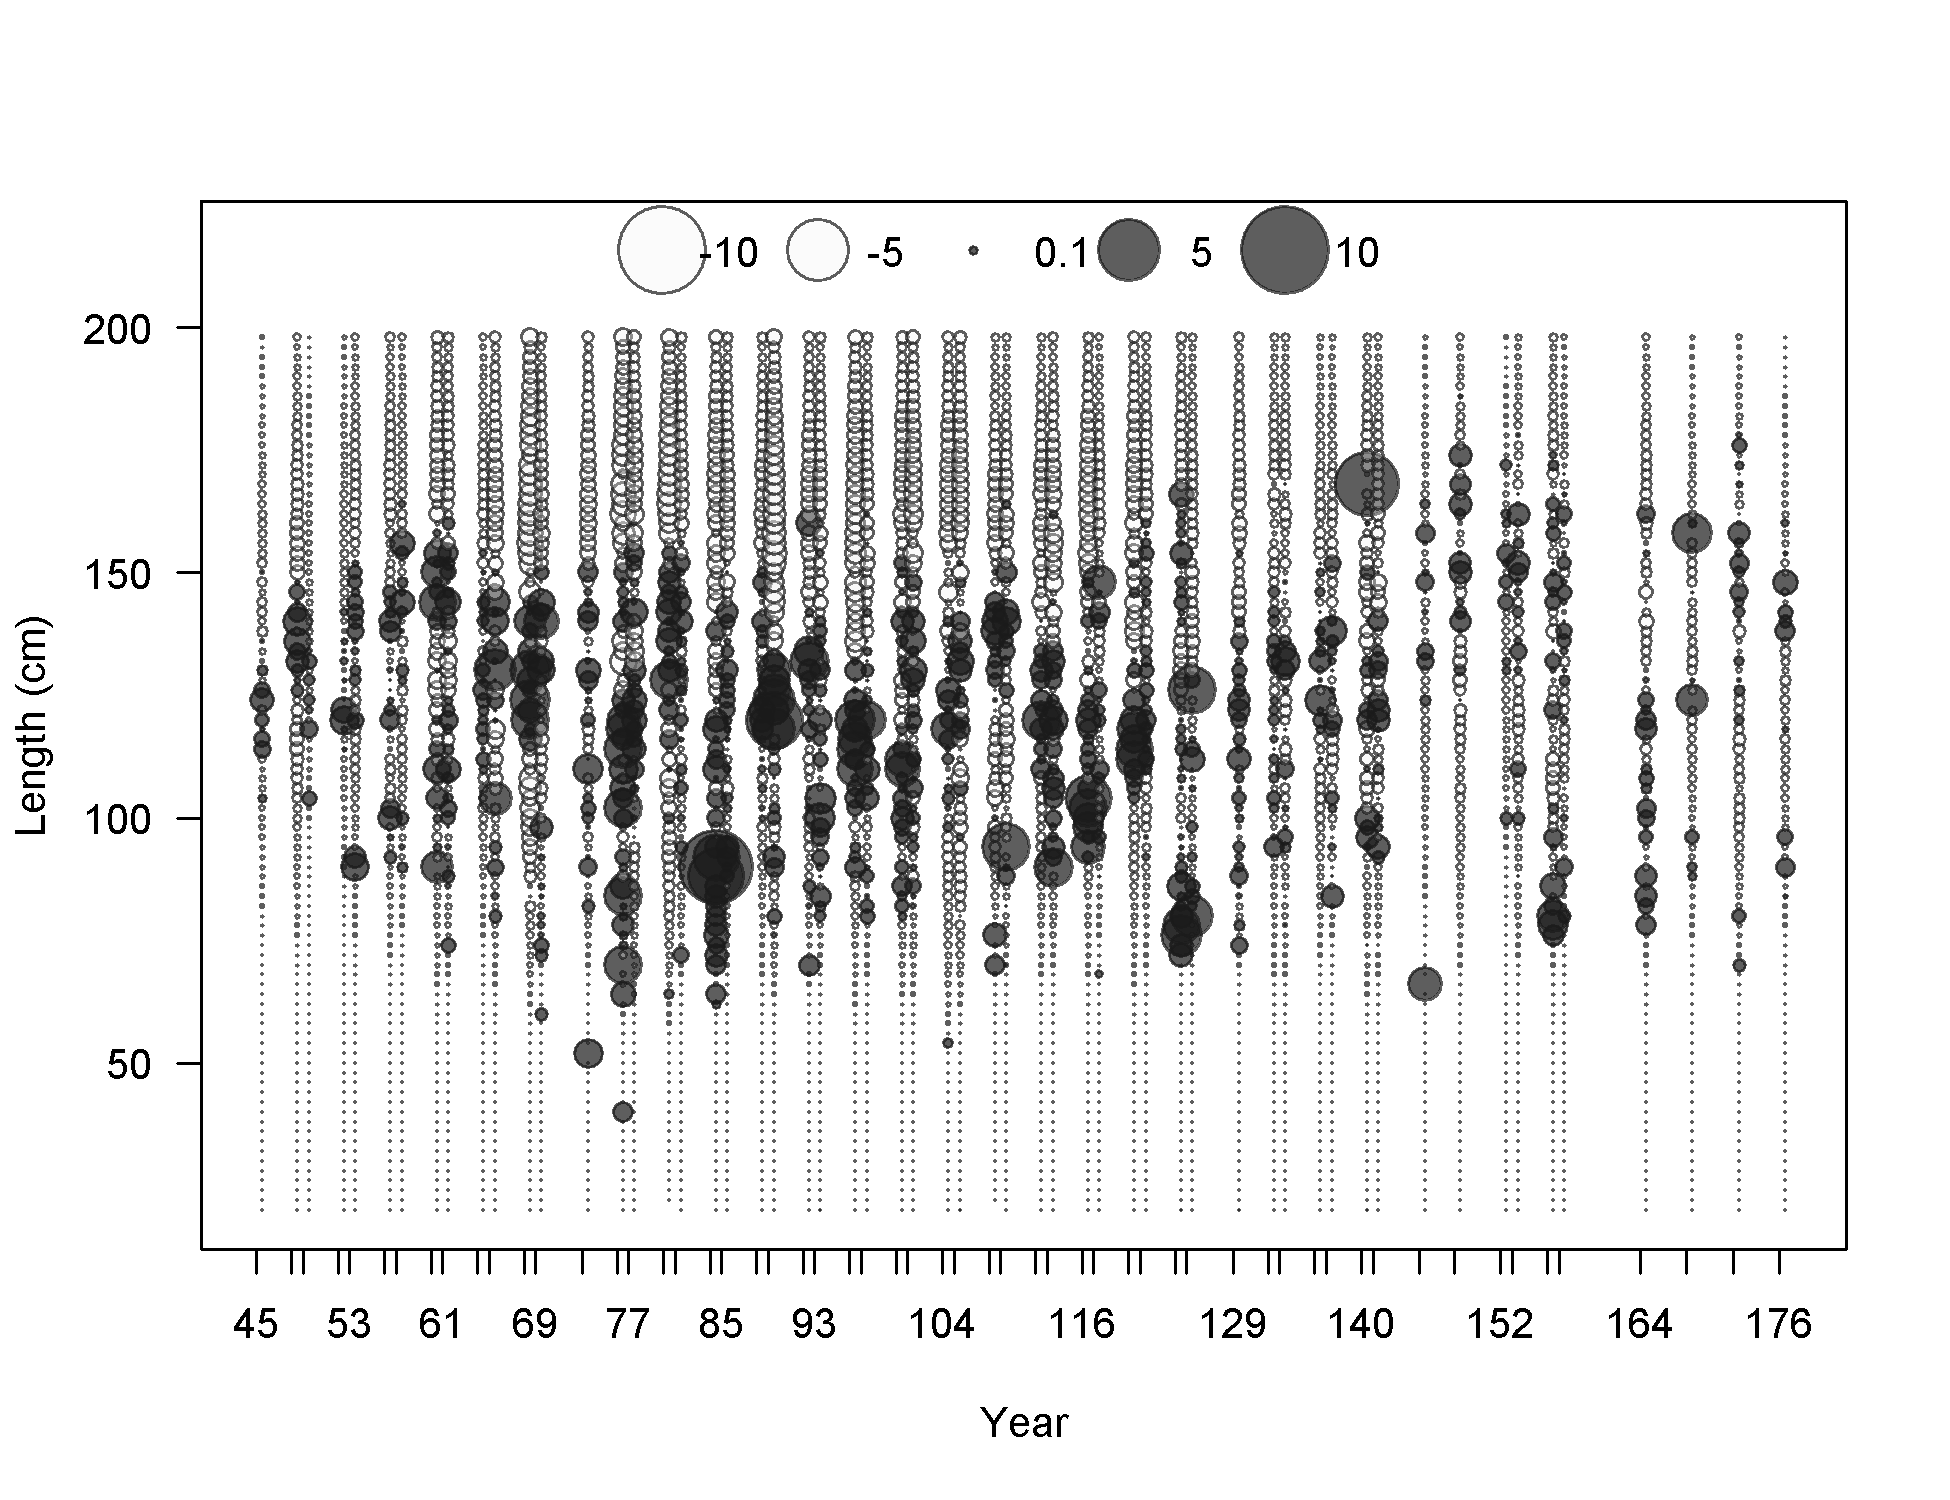
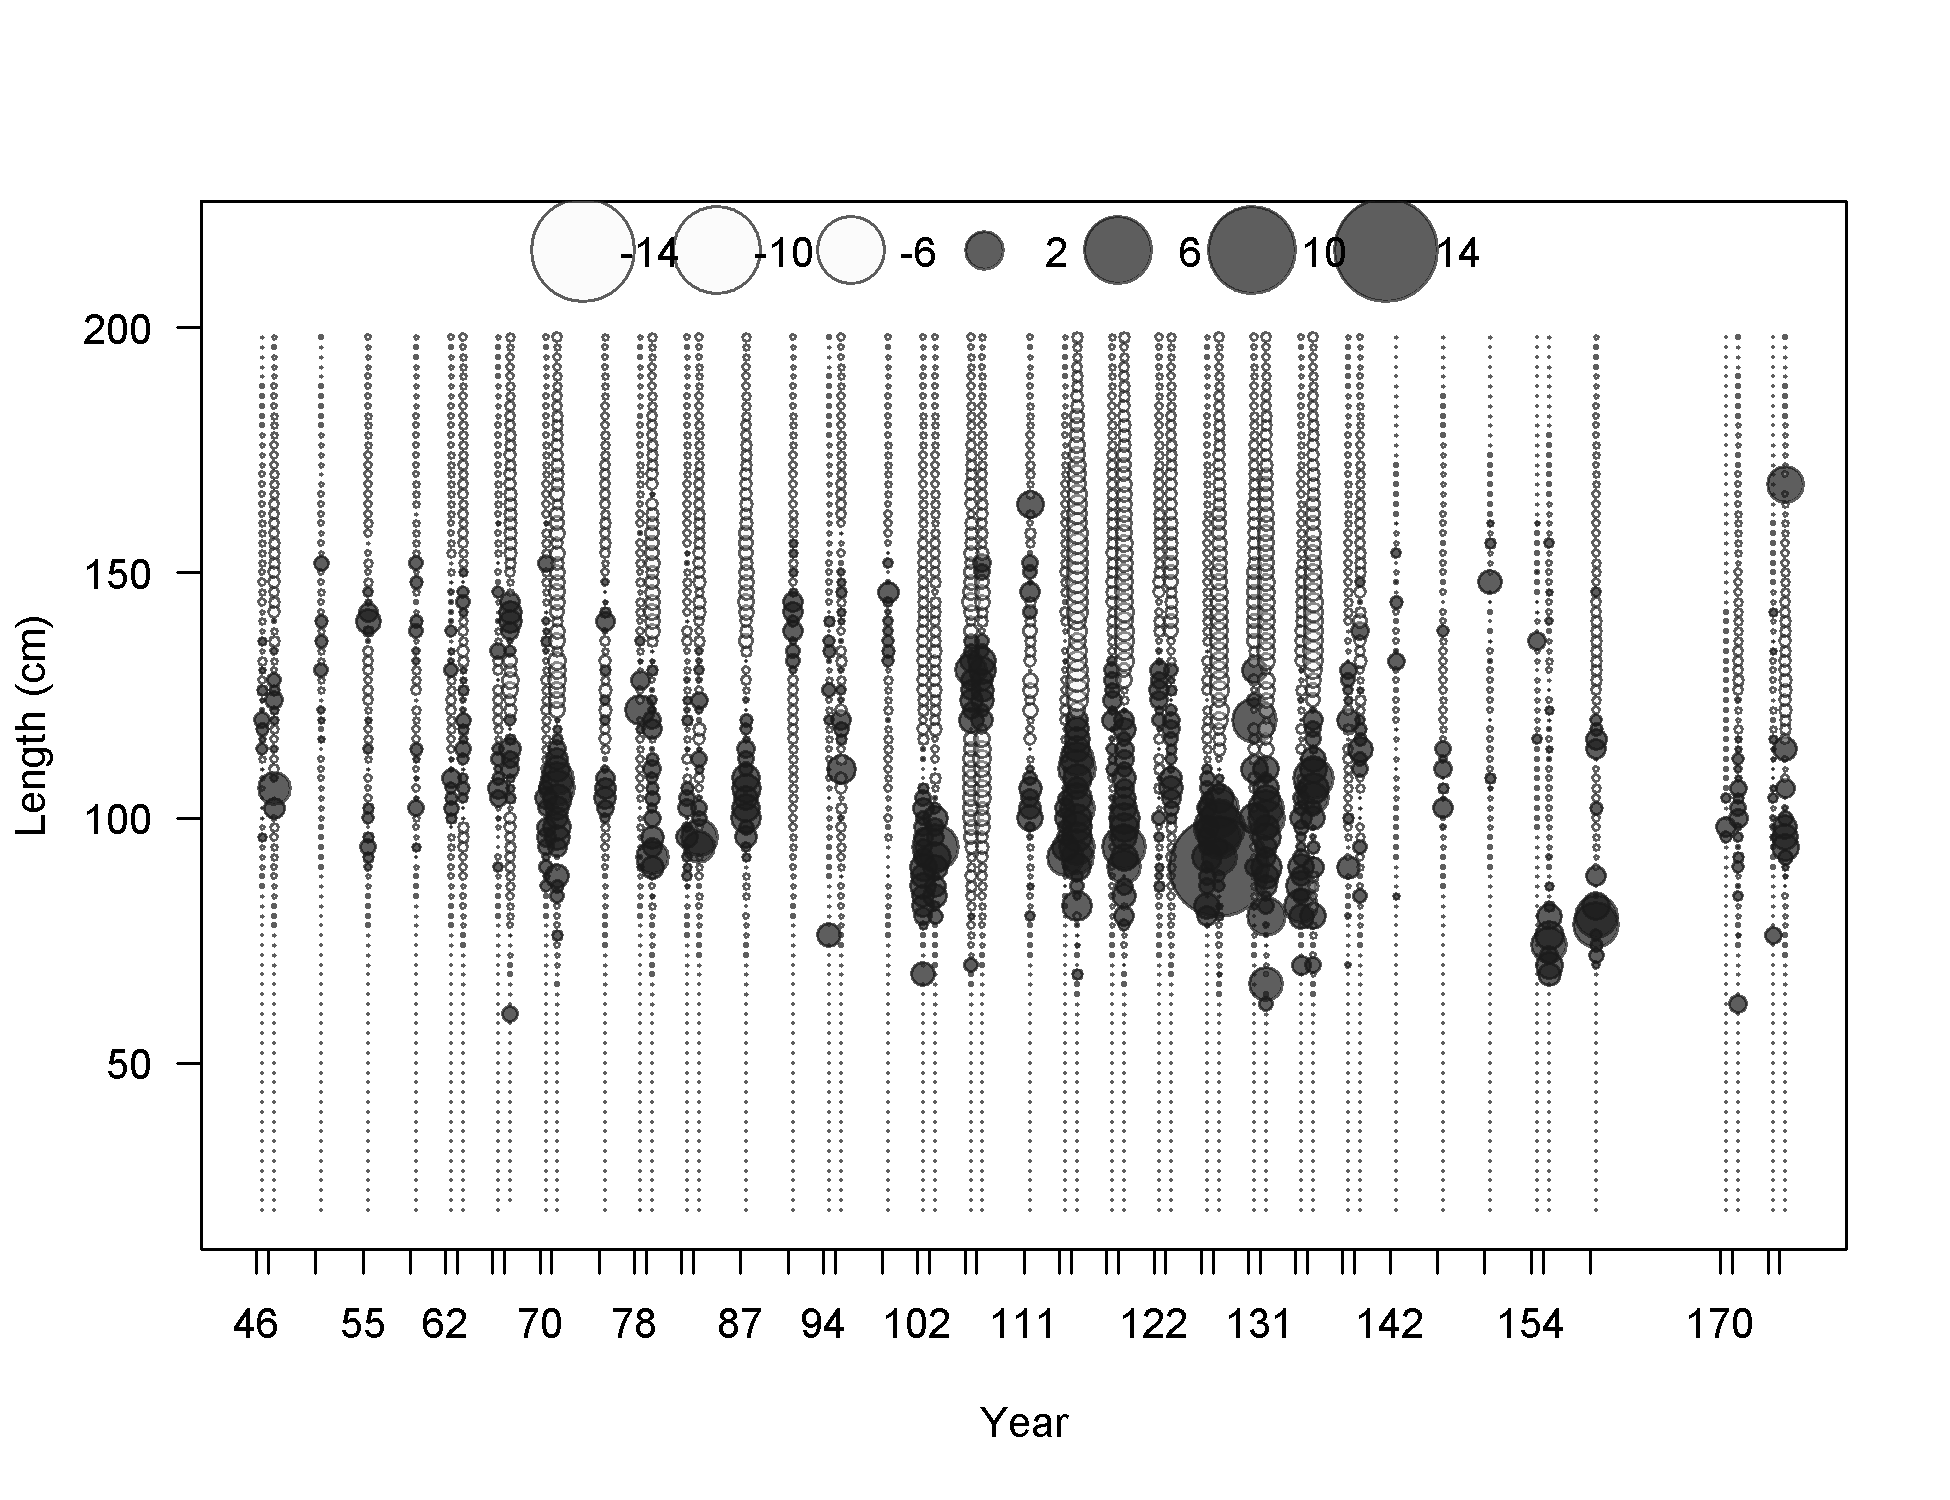
Pearson residuals, whole catch, F7-OBJ_Nc_Q23 (max=4.24) (plot 4 of 4)
Closed bubbles are positive residuals (observed > expected) and open bubbles are negative residuals (observed < expected).
file: comp_lenfit_residsflt7mkt0_page4.png
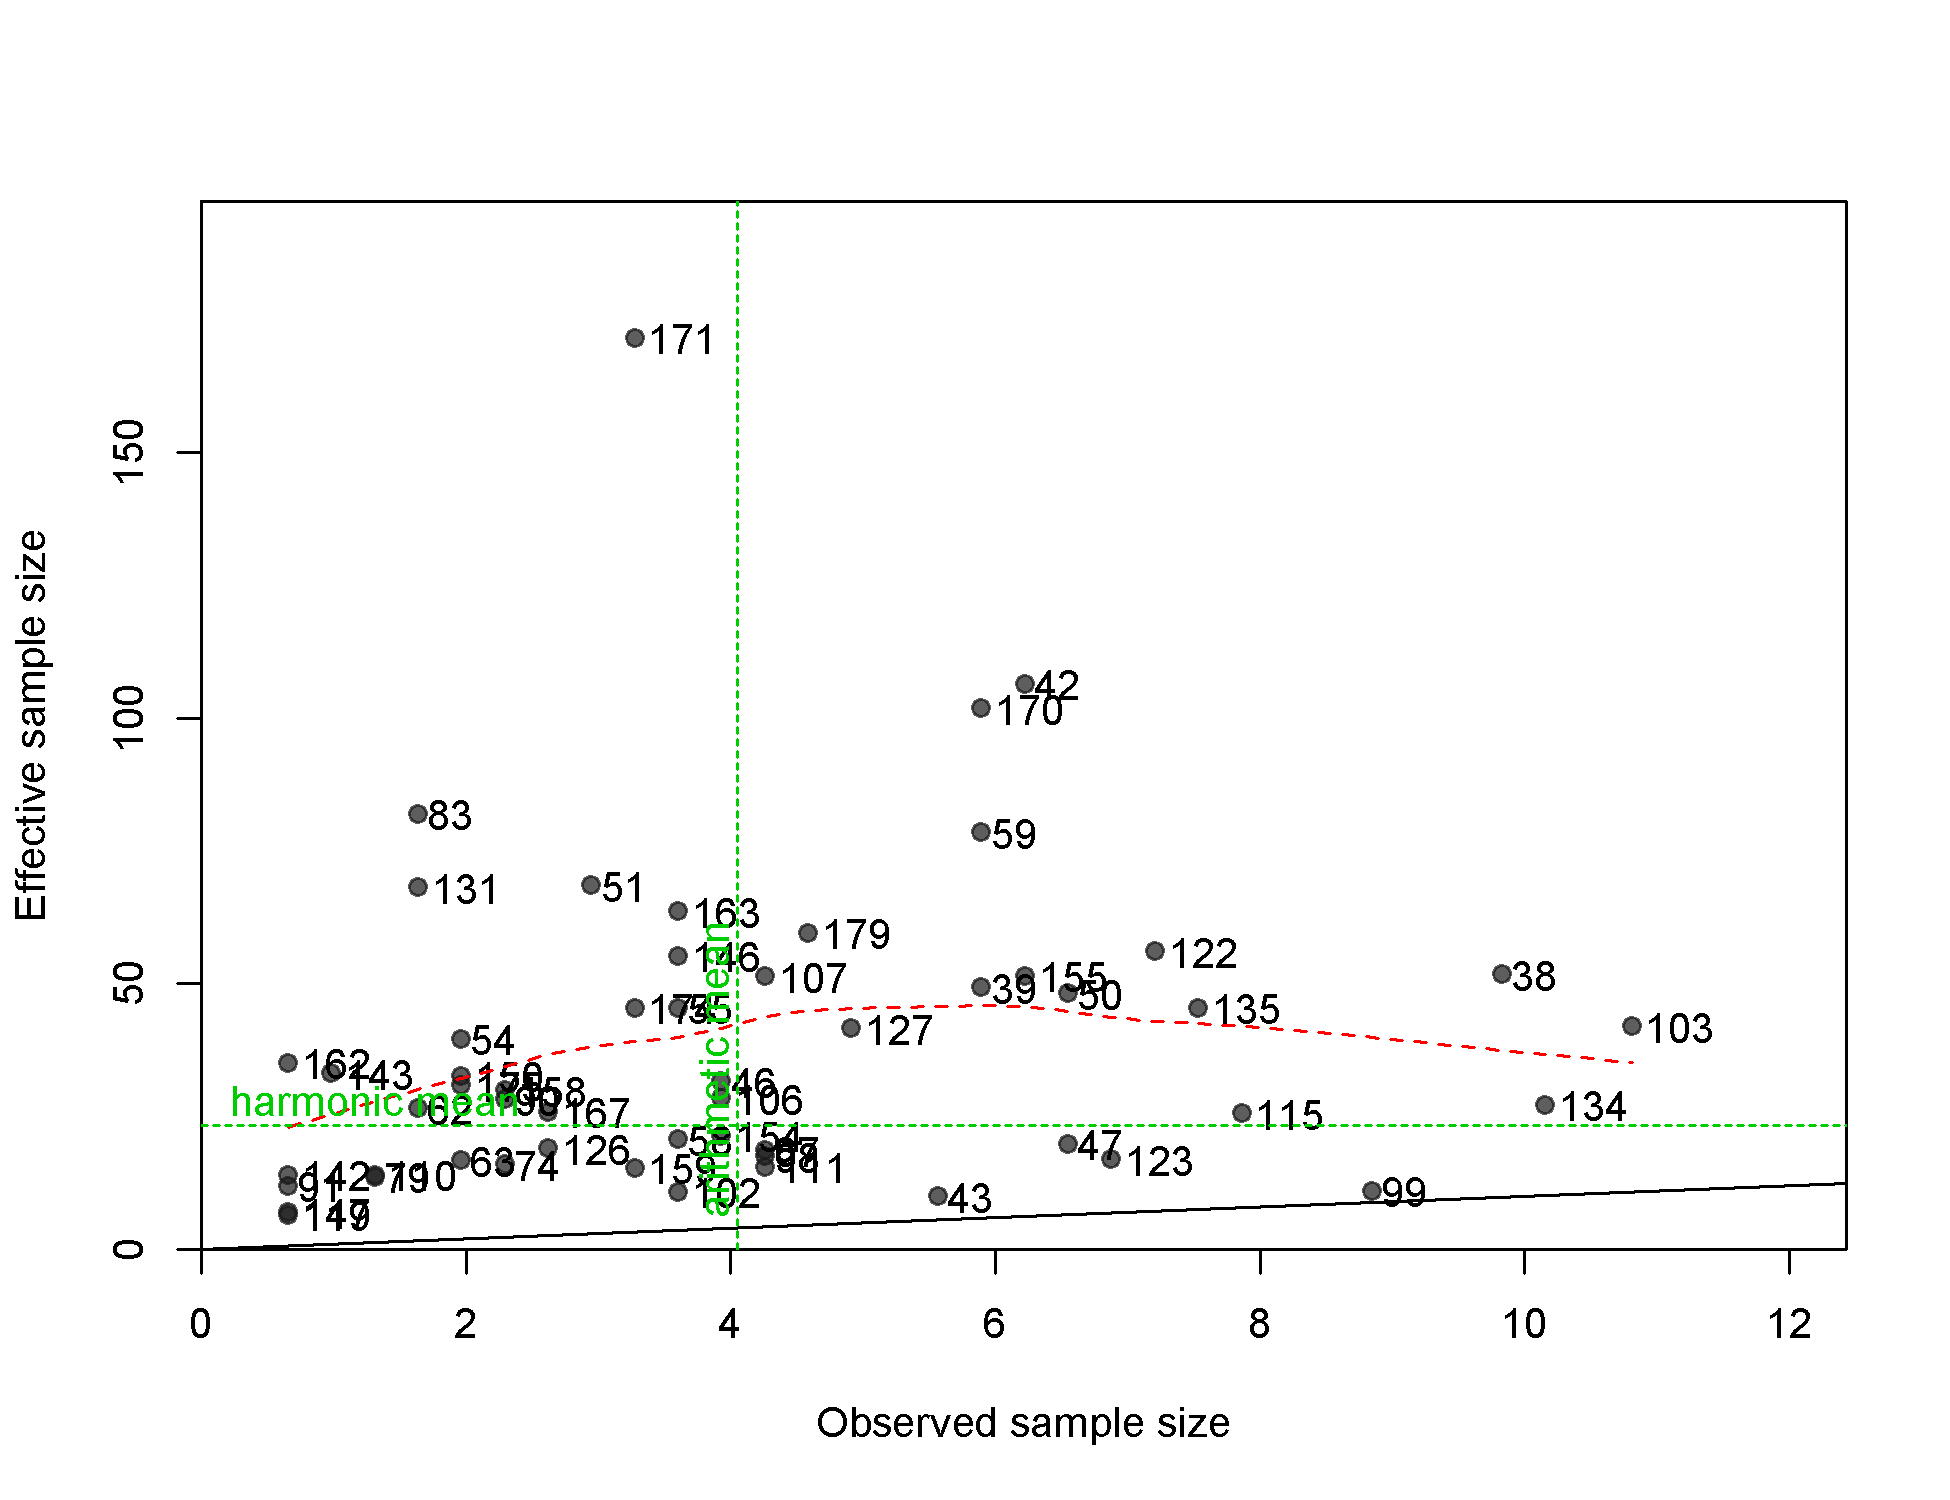
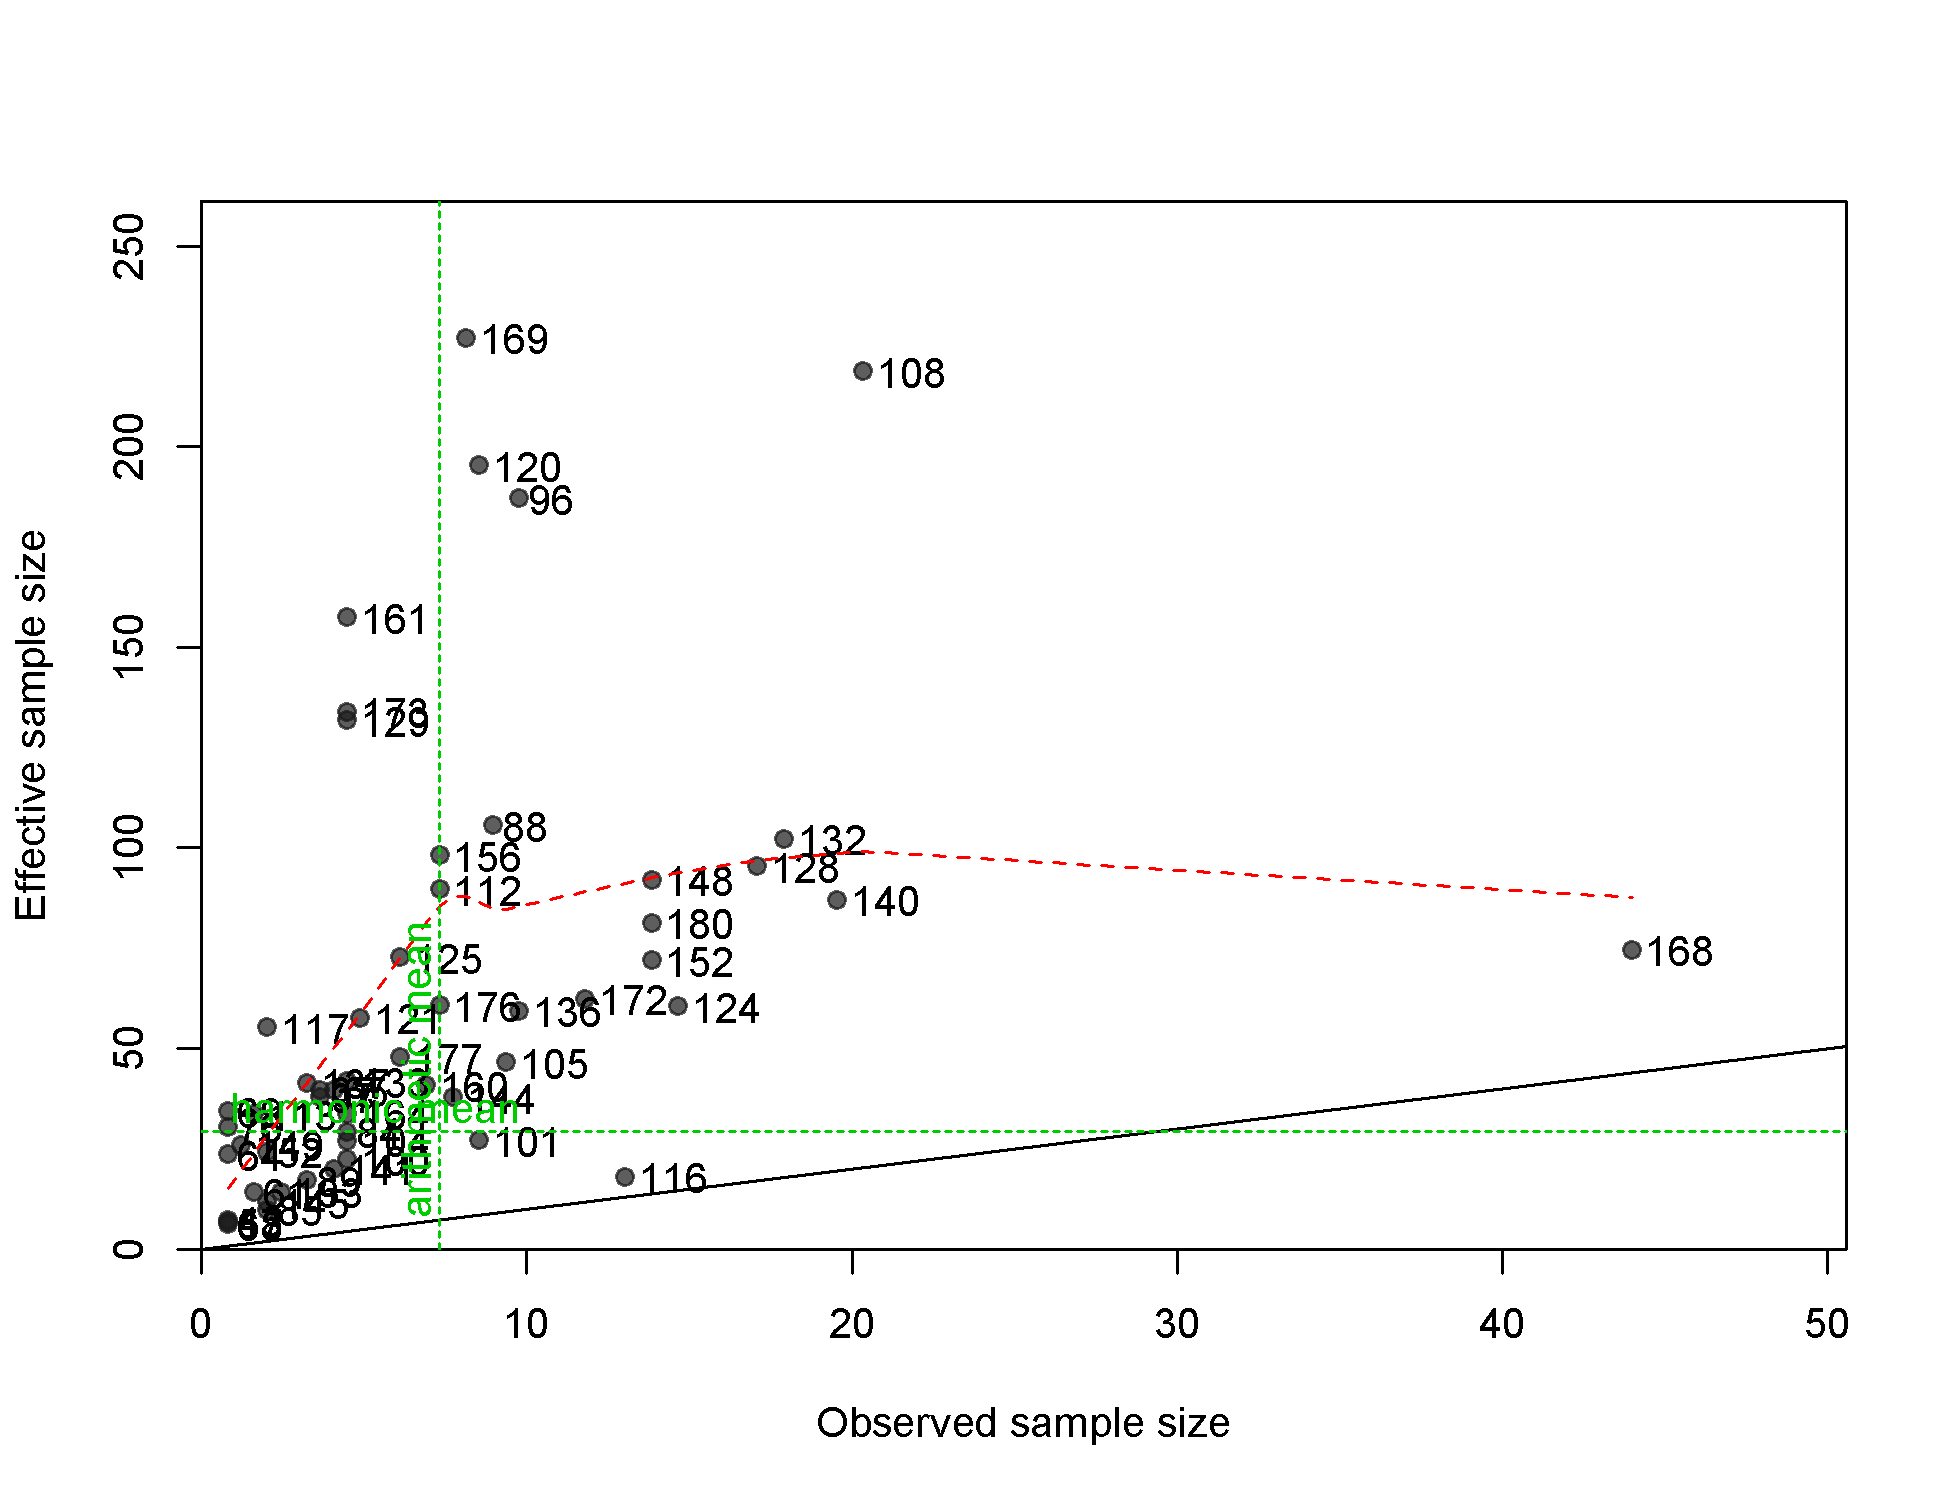
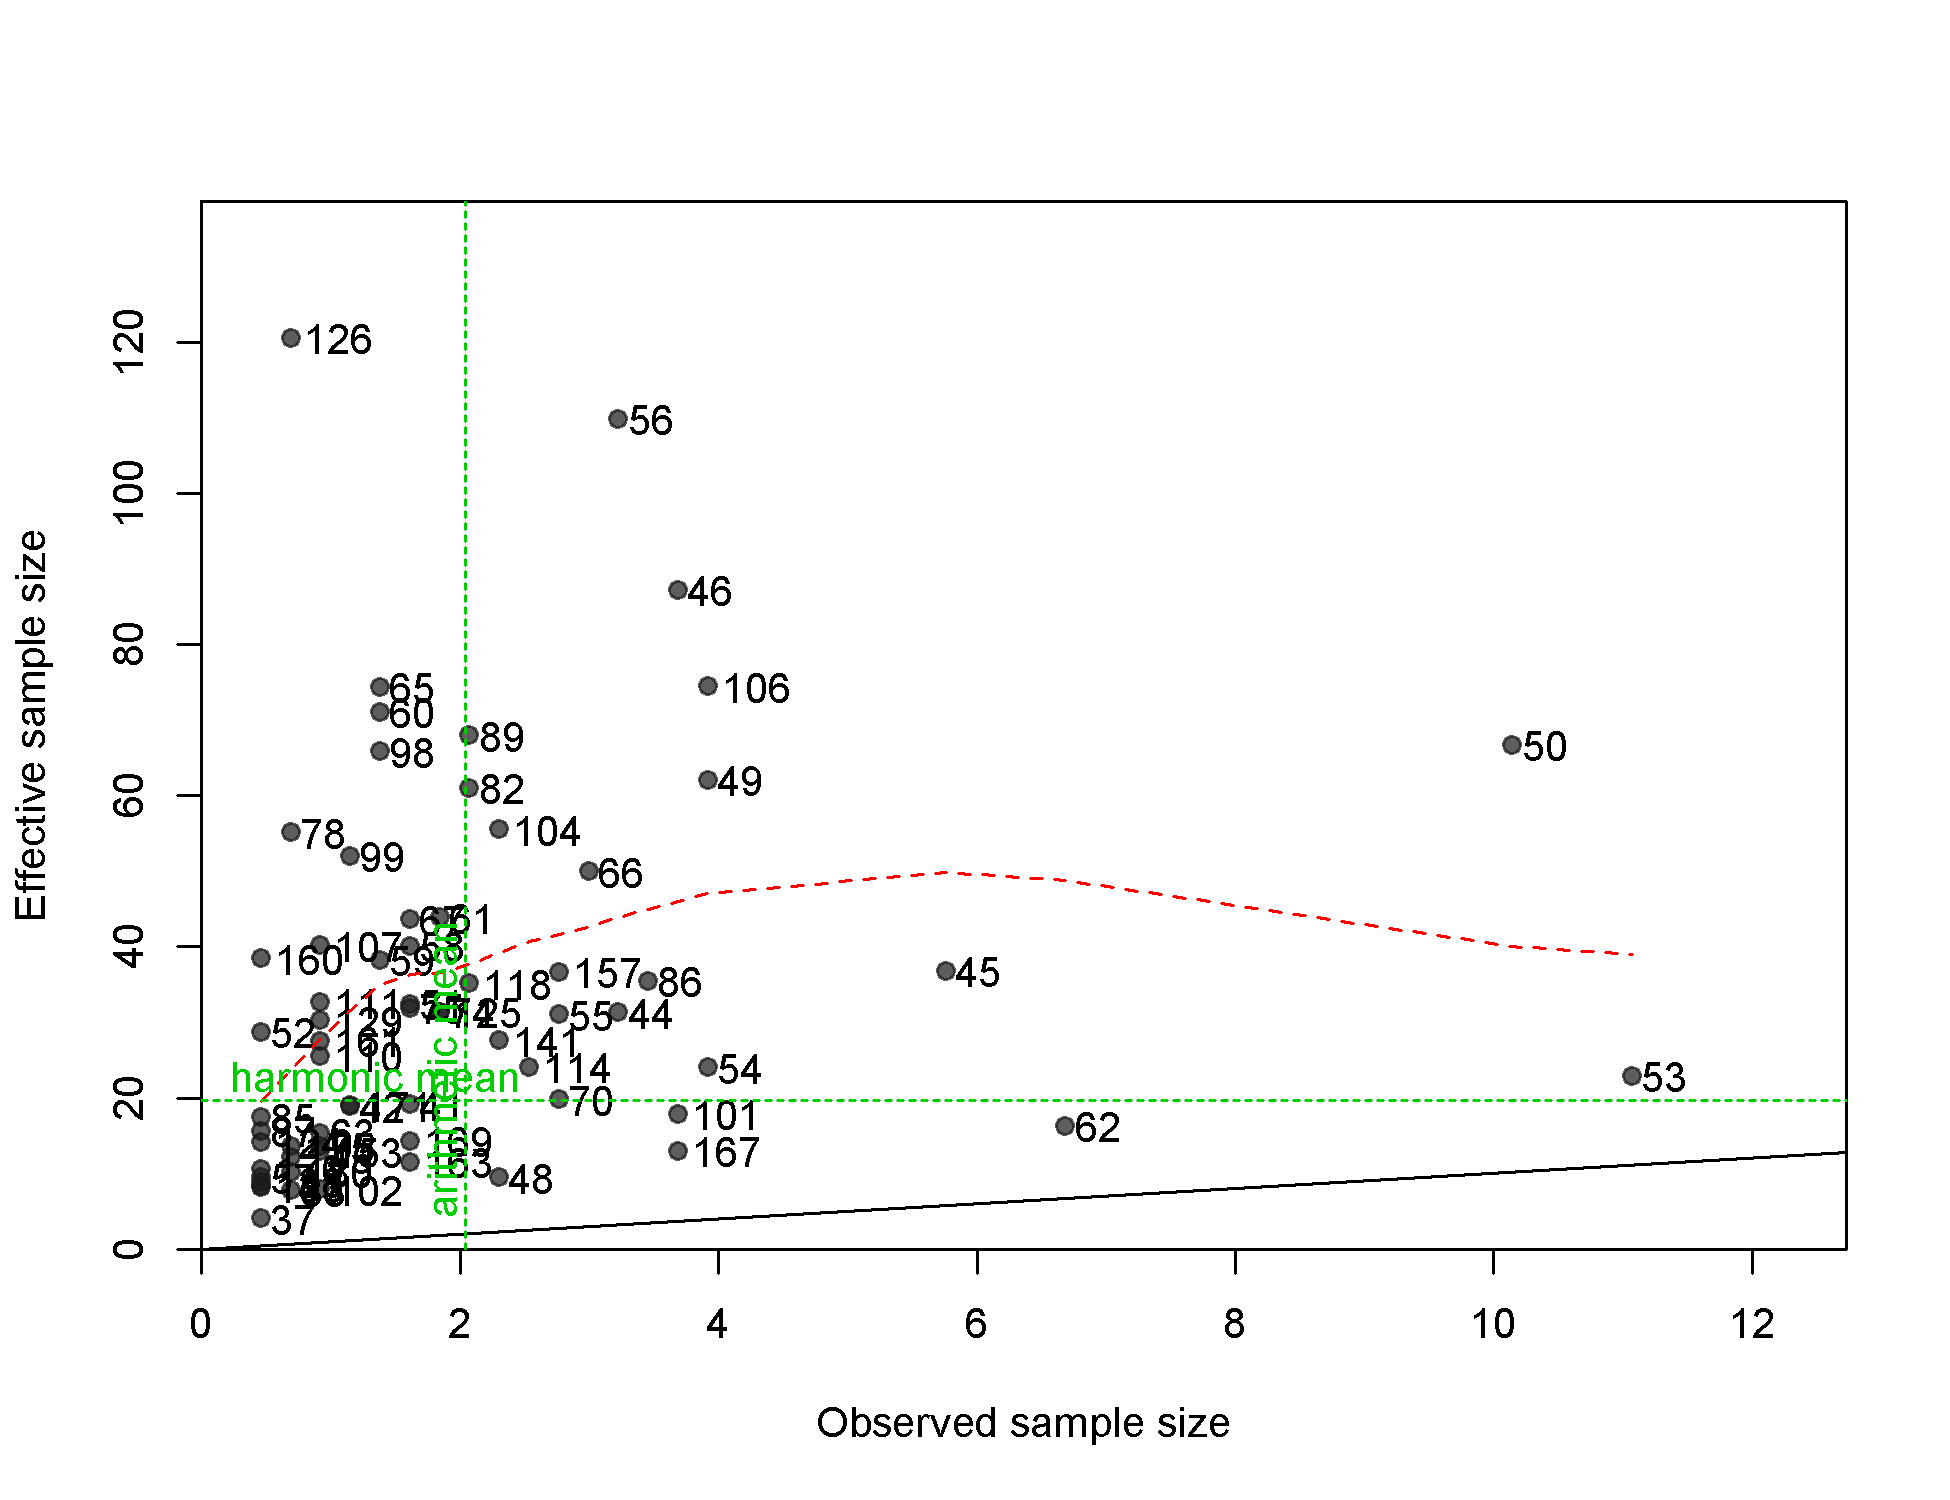
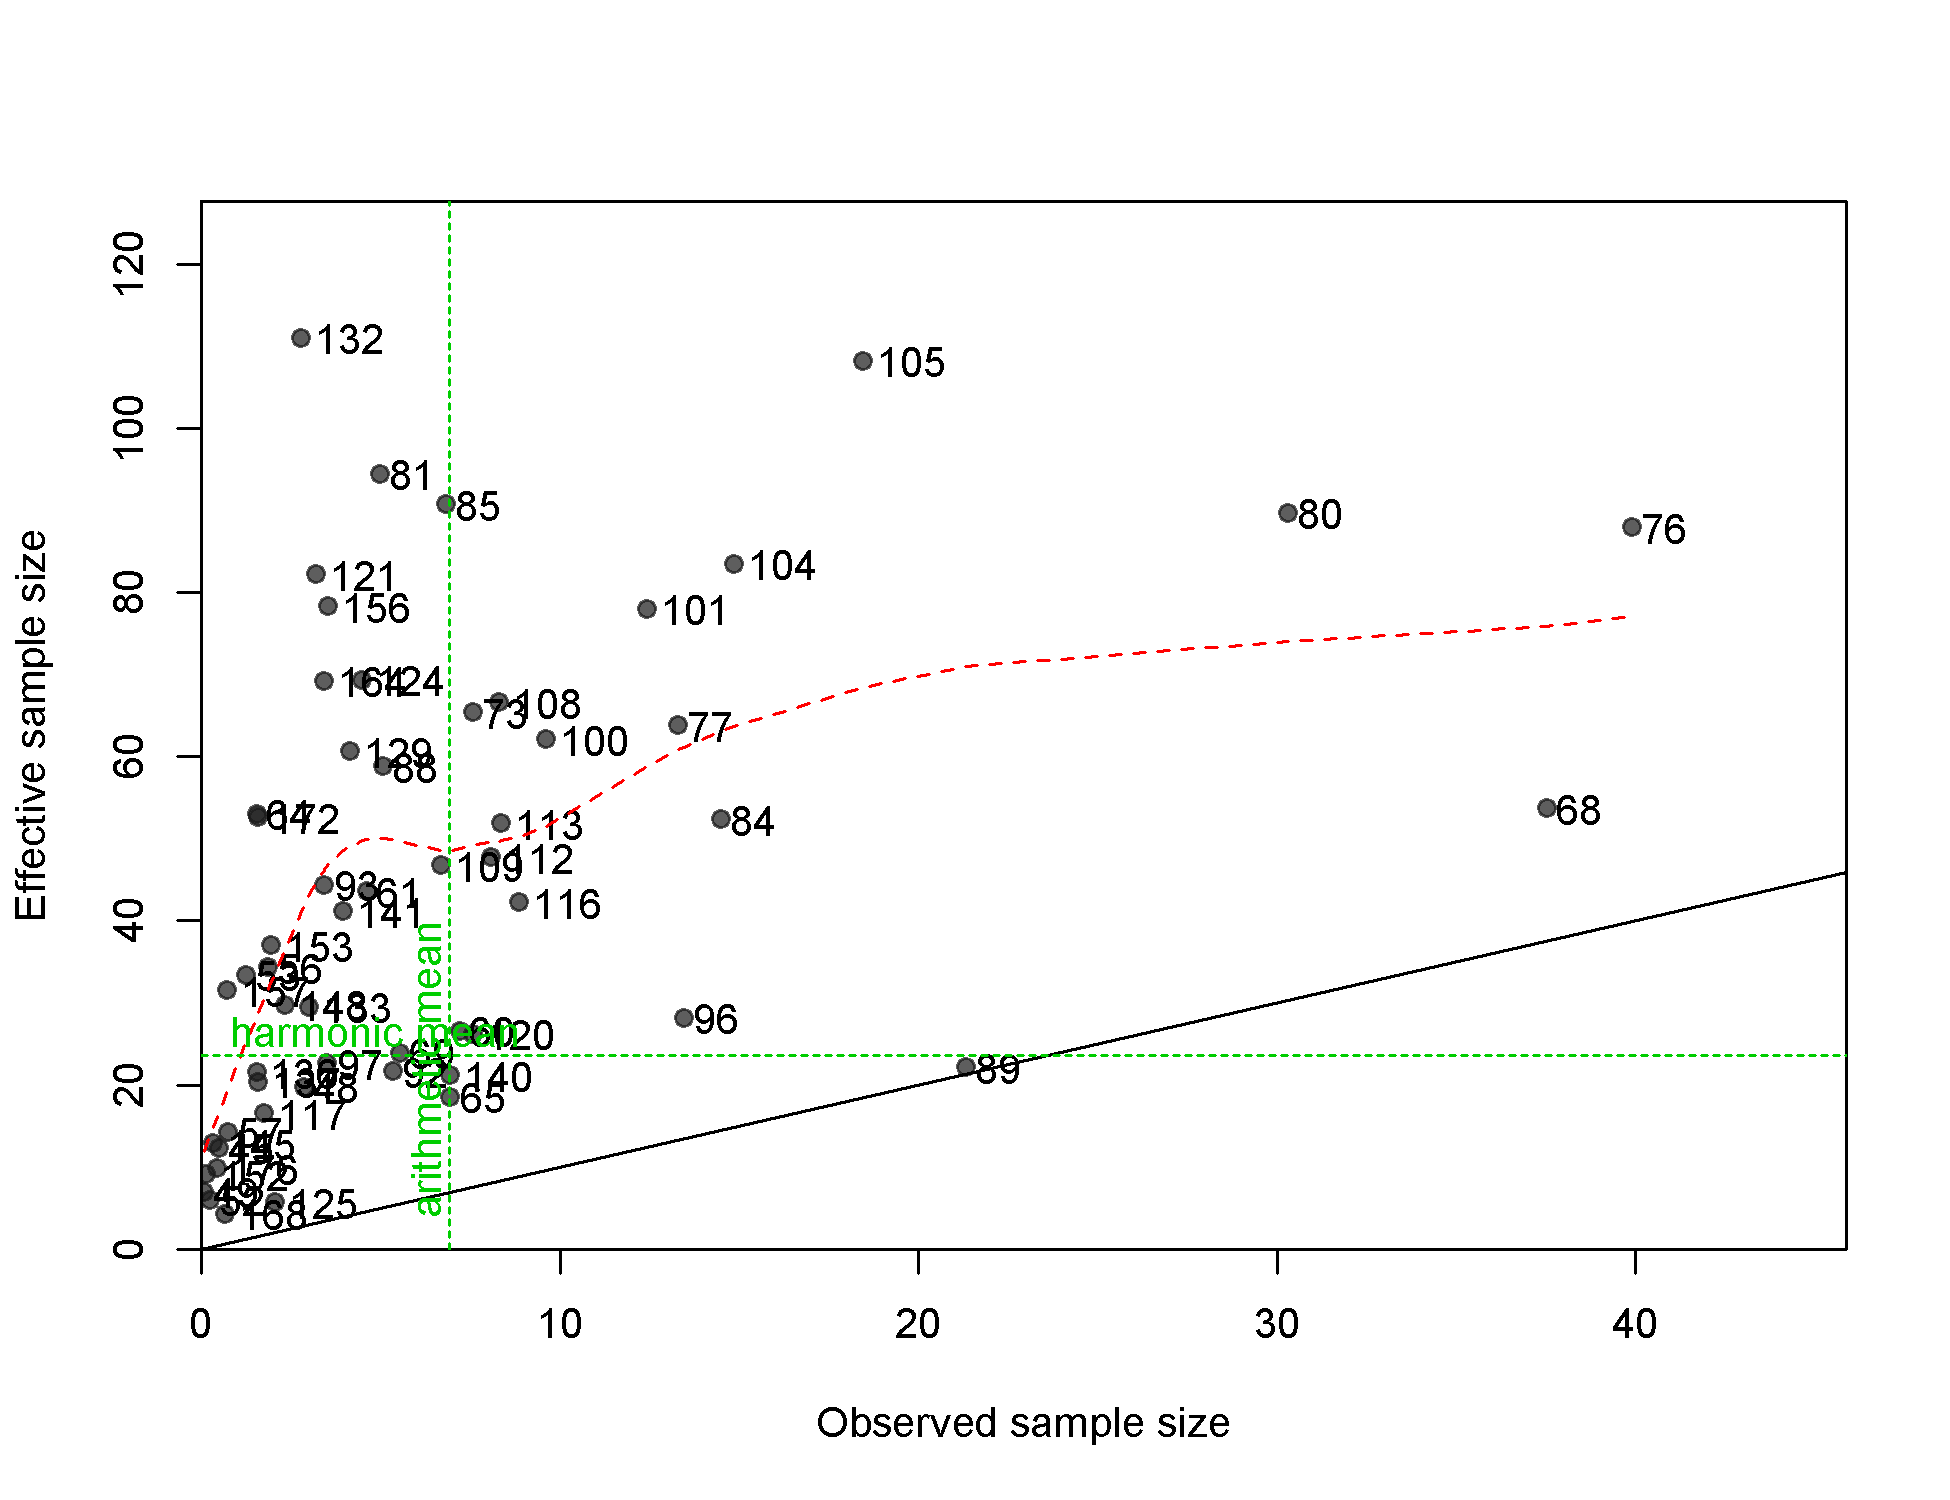
N-EffN comparison, Length comps, whole catch, F7-OBJ_Nc_Q23
file: comp_lenfit_sampsize_flt7mkt0.png
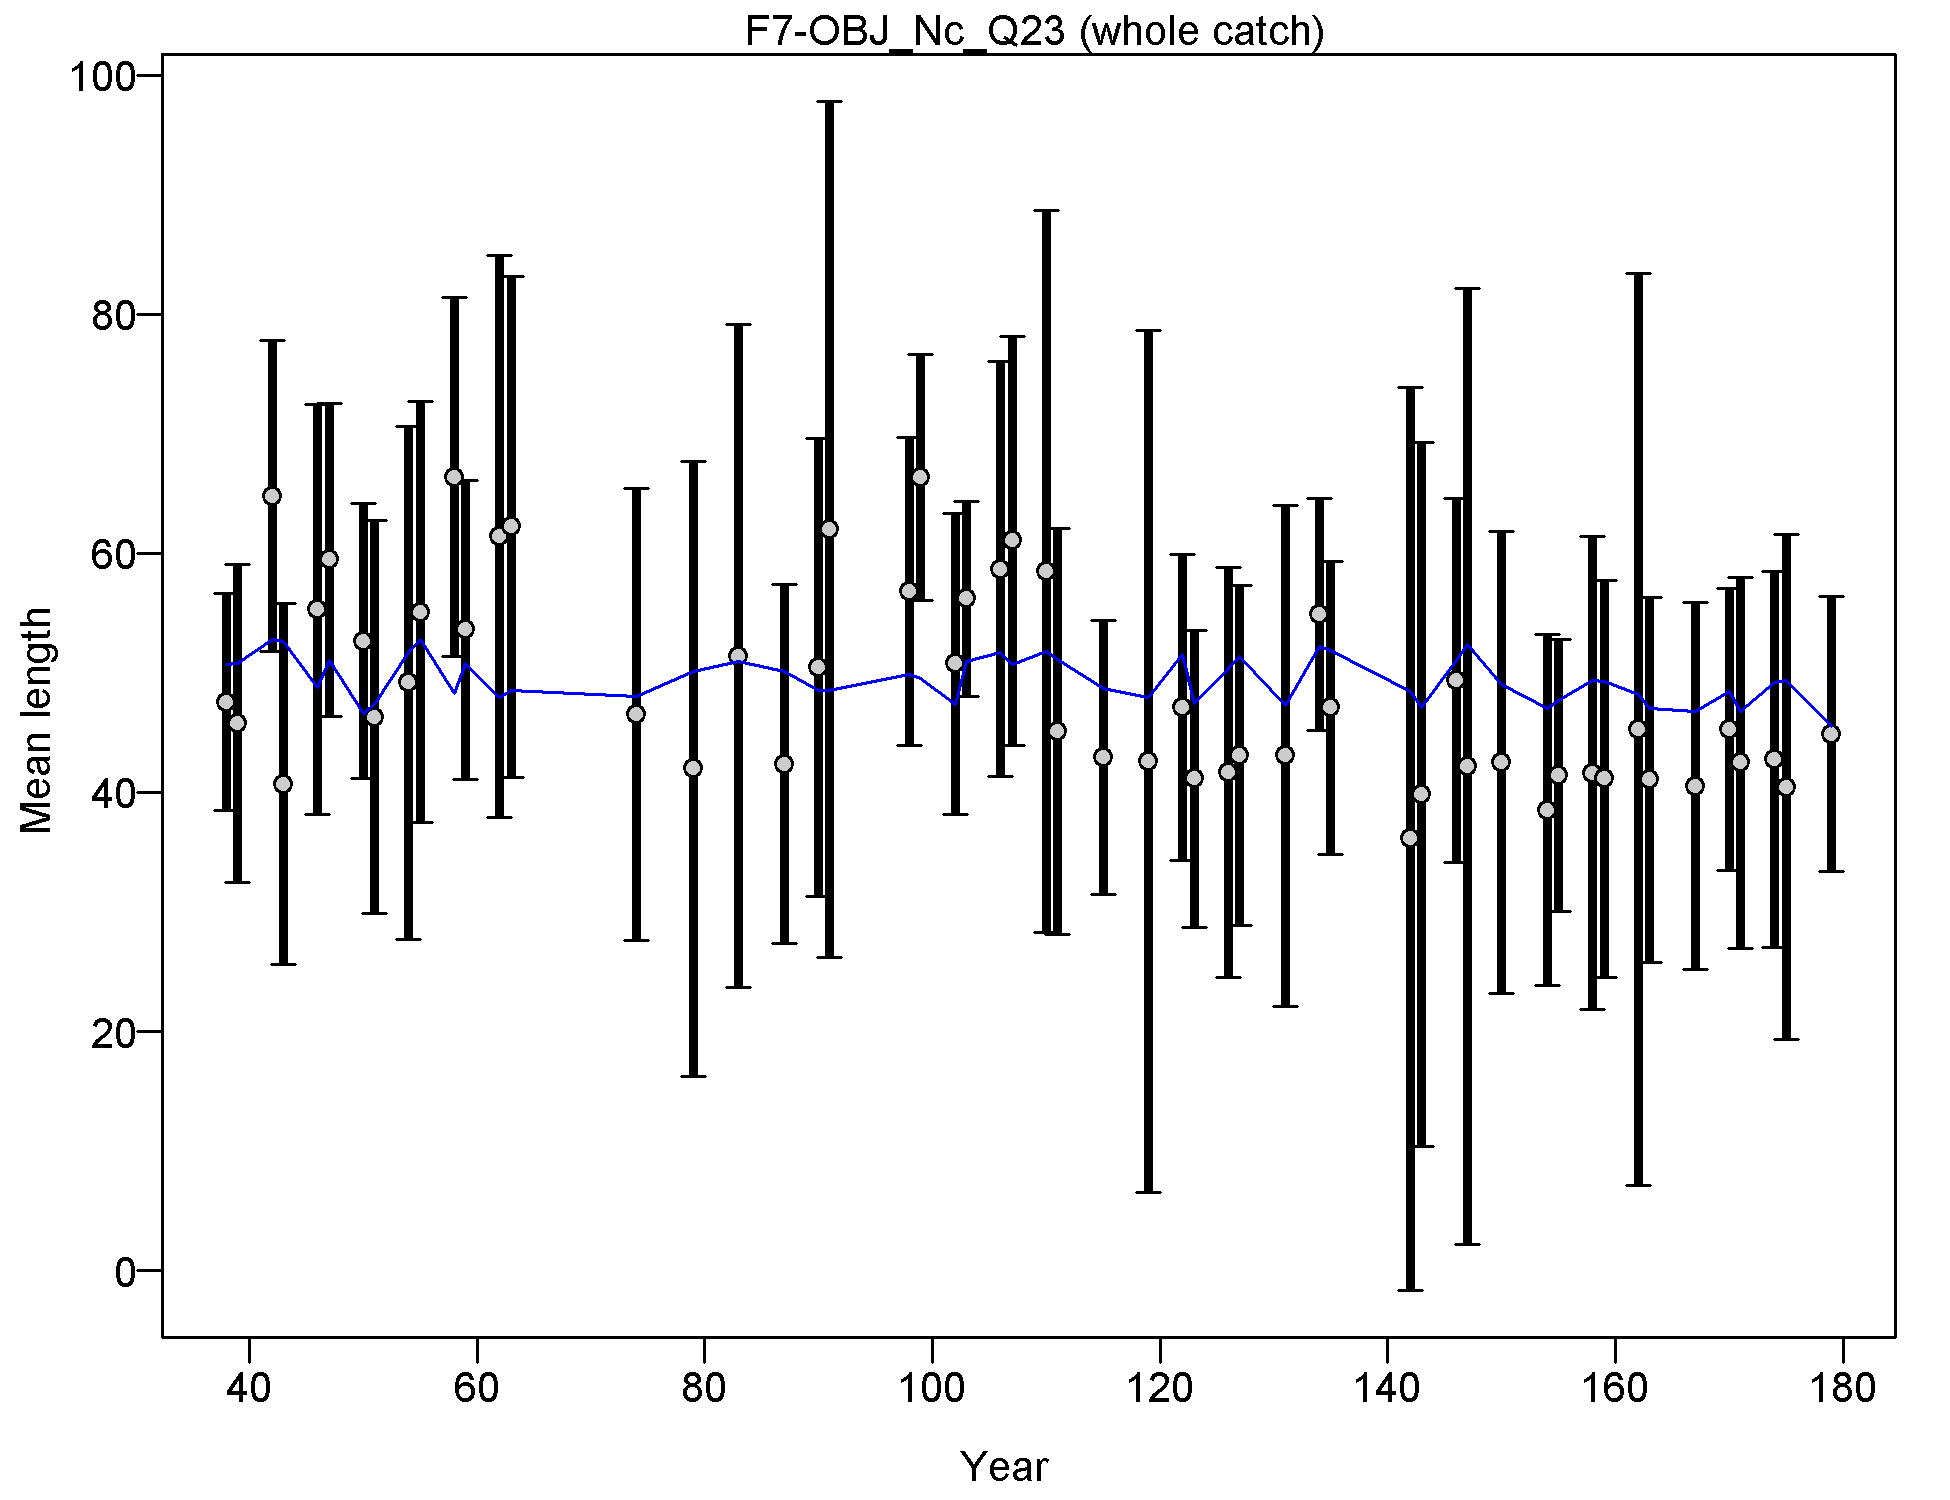
Mean length for F7-OBJ_Nc_Q23 with 95% confidence intervals based on current samples sizes.
Francis data weighting method TA1.8: thinner intervals (with capped ends) show result of further adjusting sample sizes based on suggested multiplier (with 95% interval) for len data from F7-OBJ_Nc_Q23:
0.9957 (0.6698-1.6812)
For more info, see
Francis, R.I.C.C. (2011). Data weighting in statistical fisheries stock assessment models. Can. J. Fish. Aquat. Sci. 68: 1124-1138. https://doi.org/10.1139/f2011-025
file: comp_lenfit_data_weighting_TA1.8_F7-OBJ_Nc_Q23.png
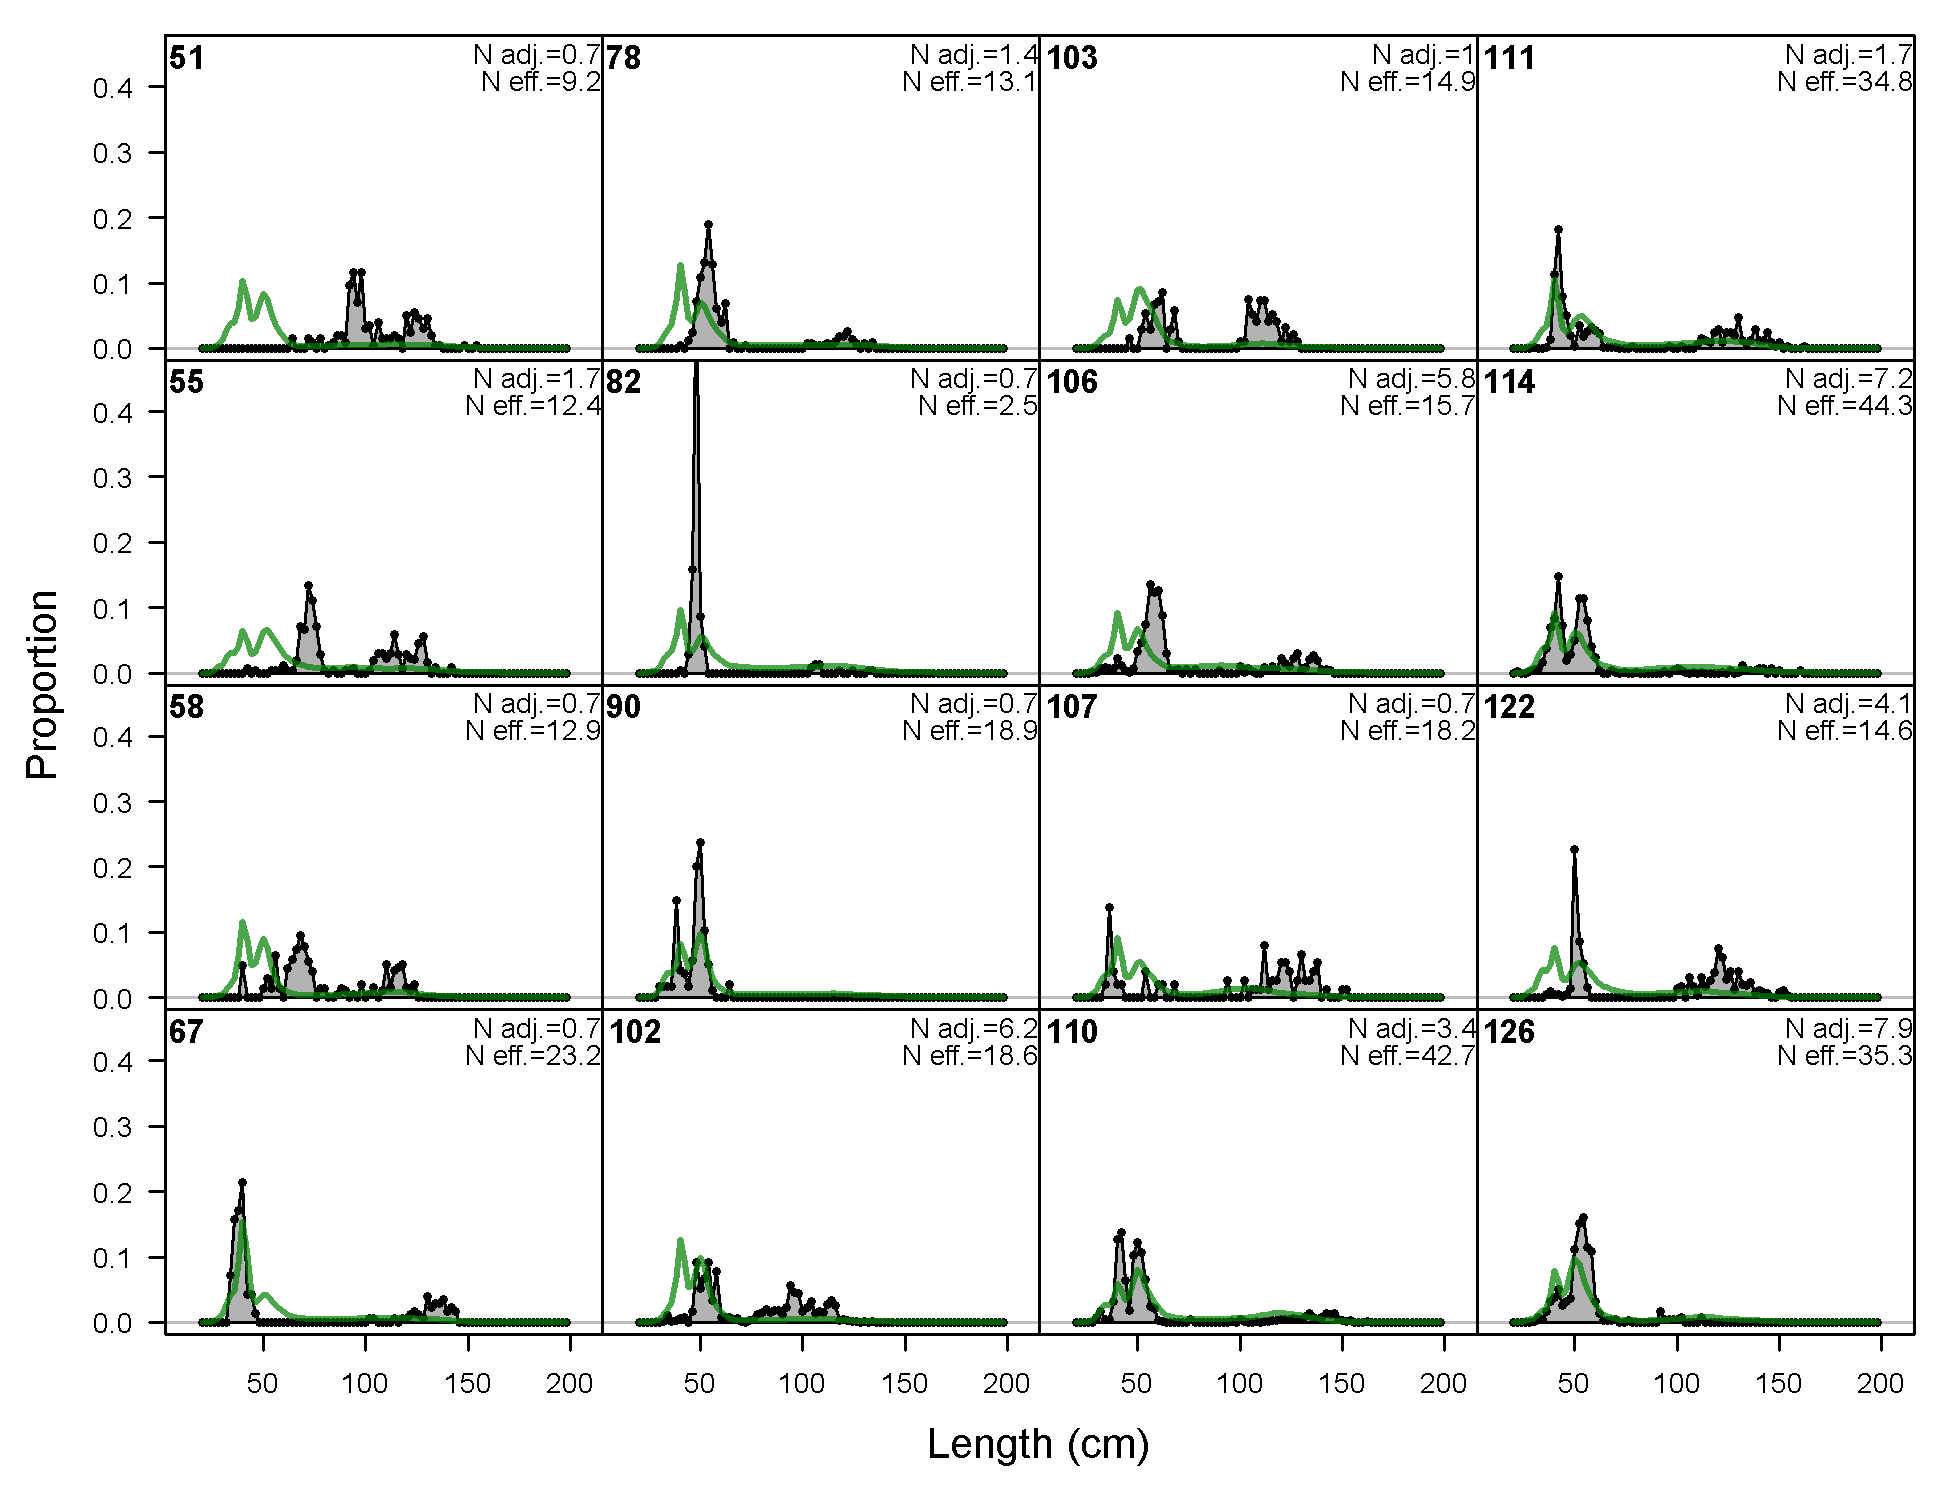
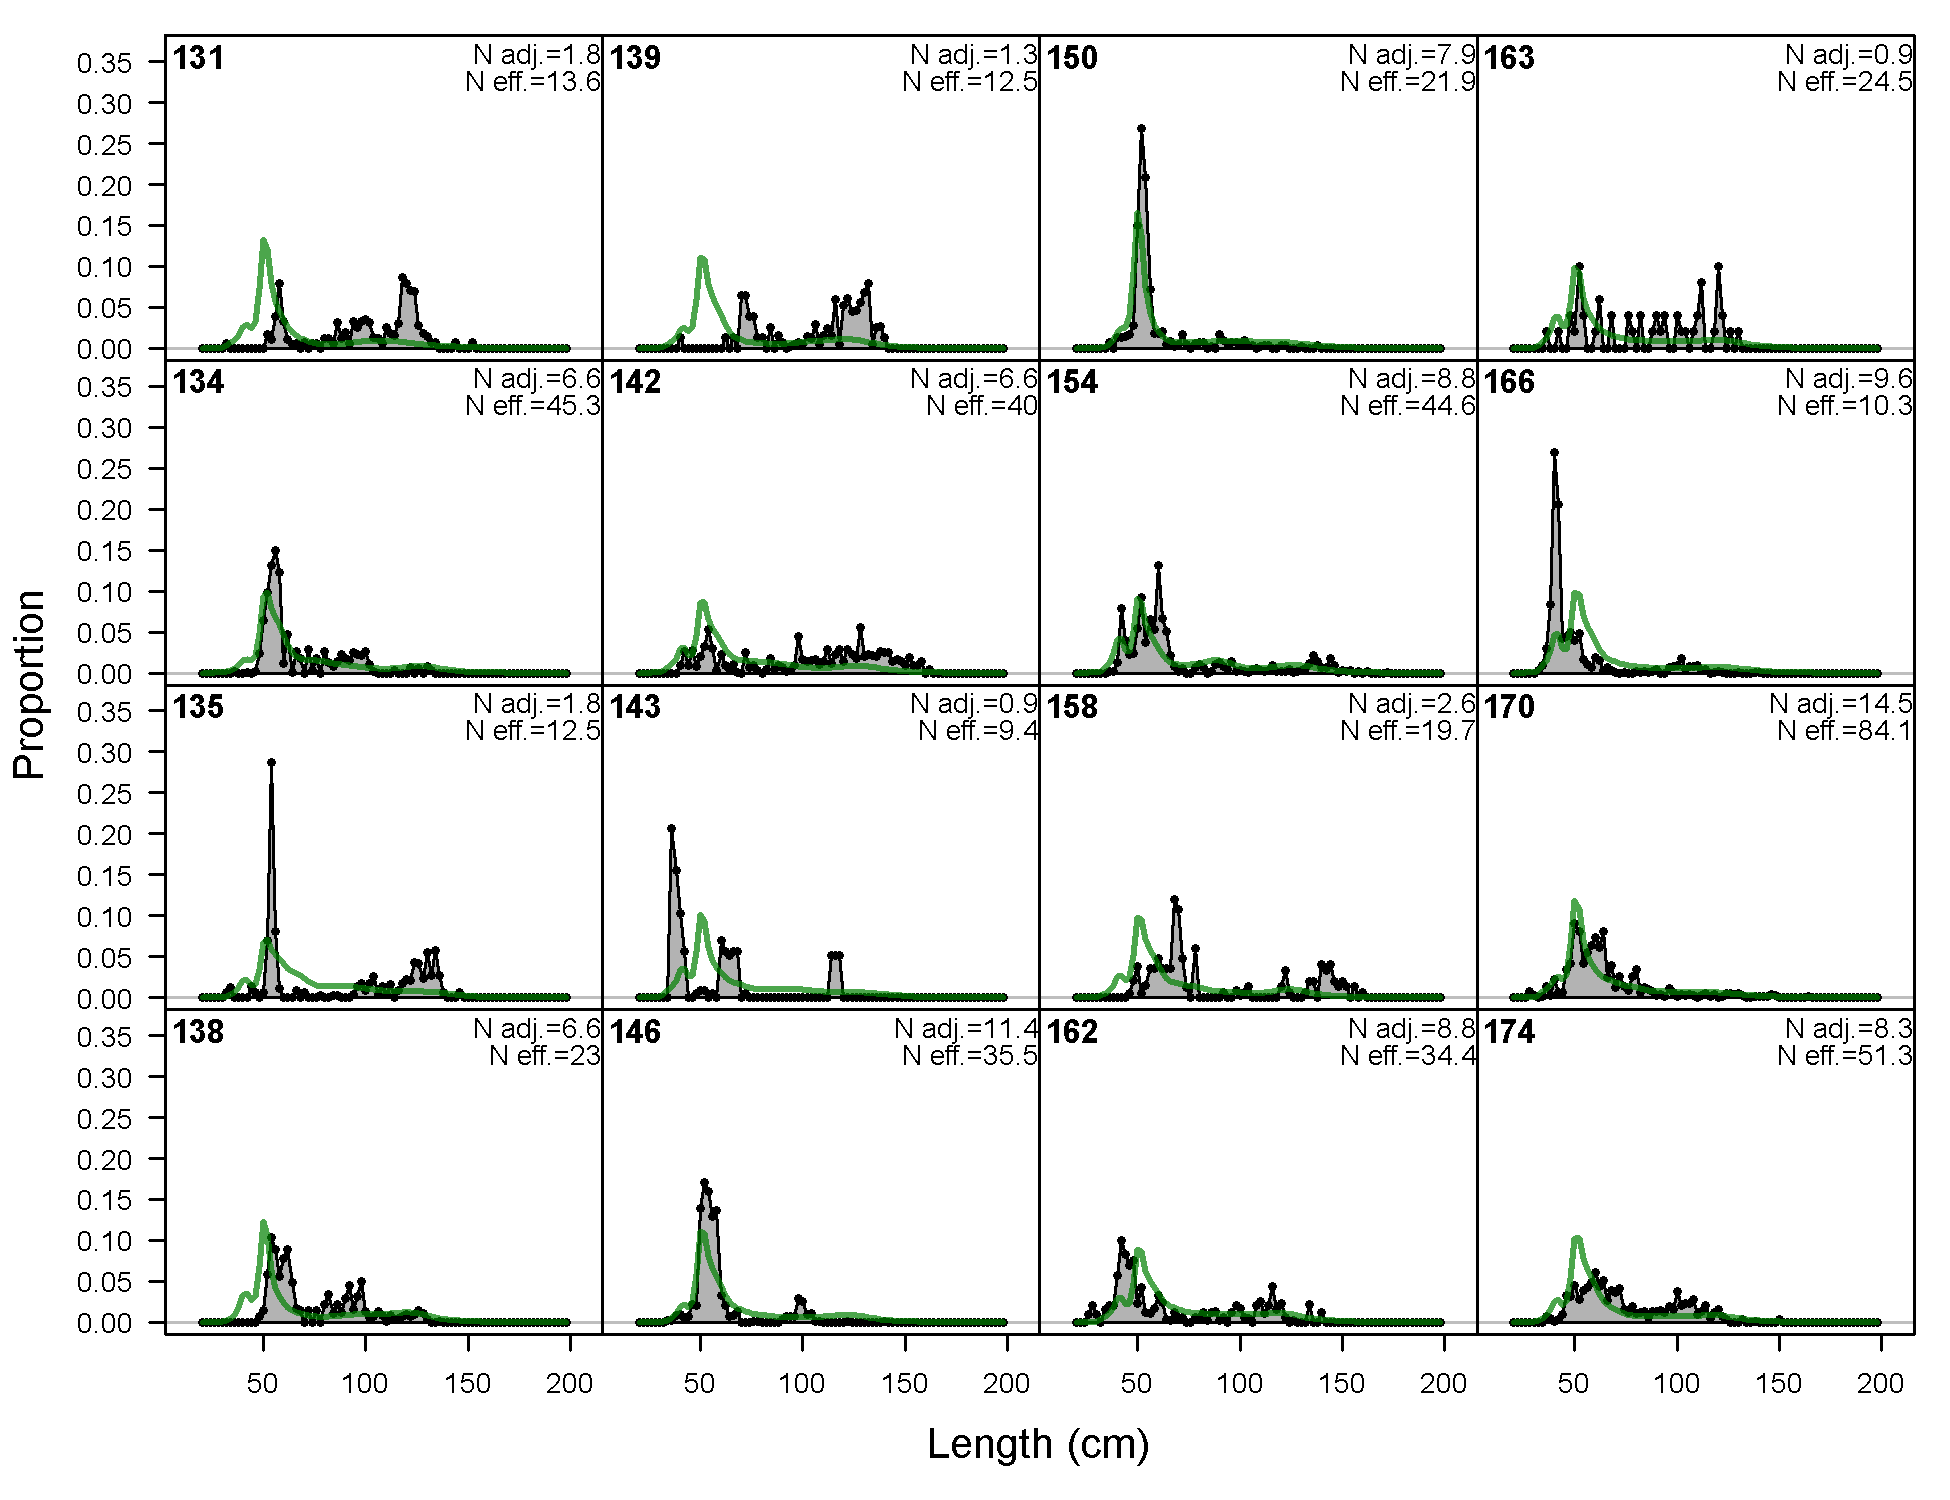
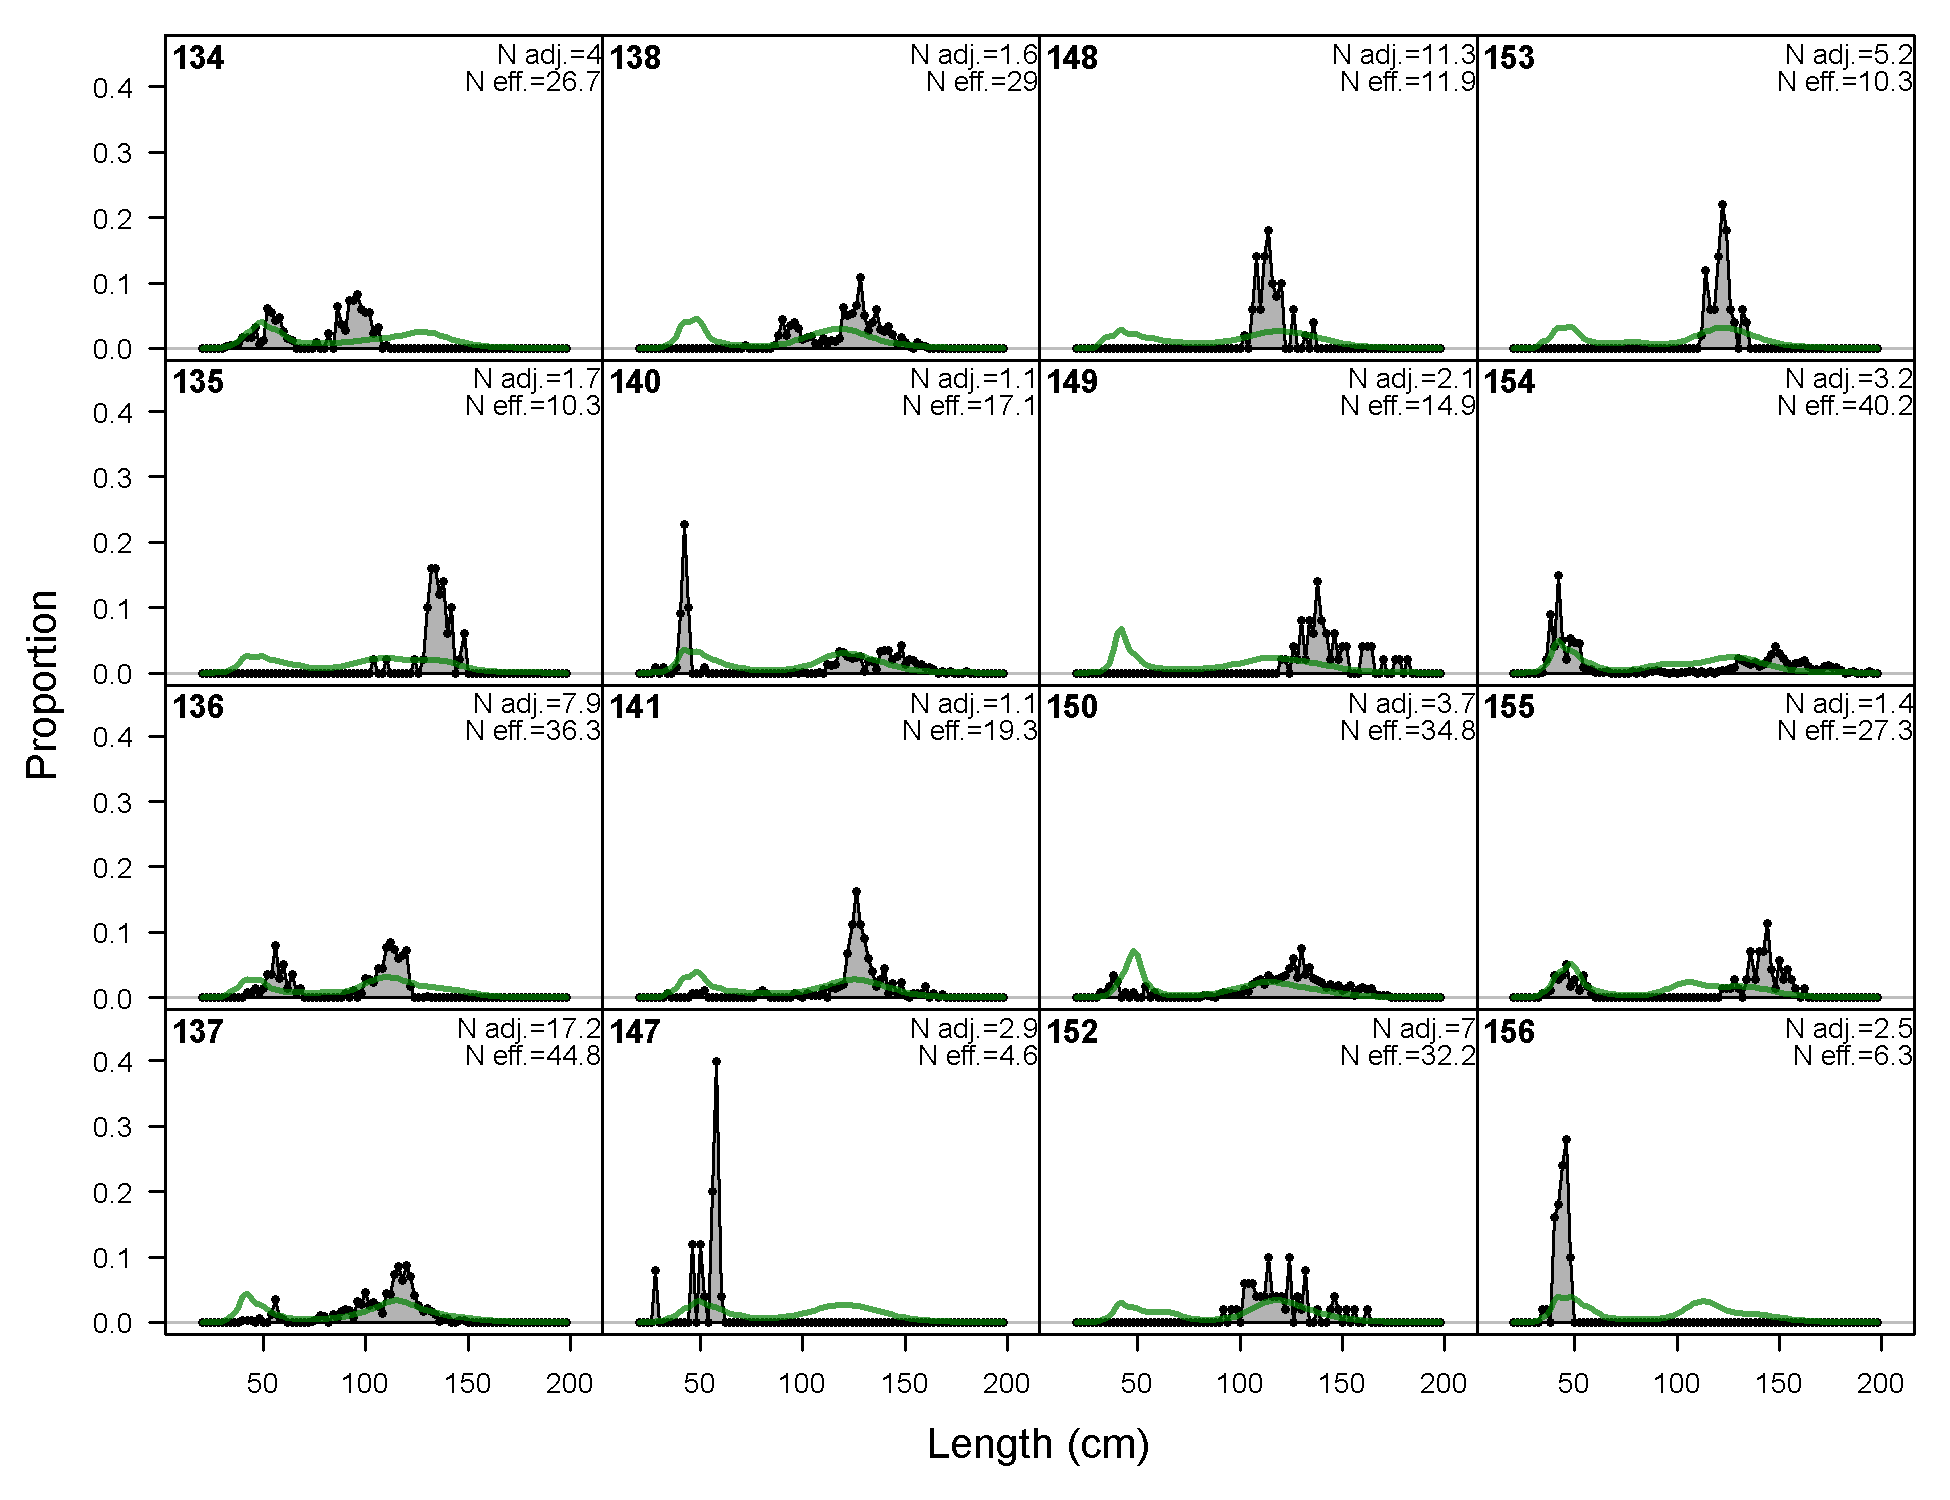
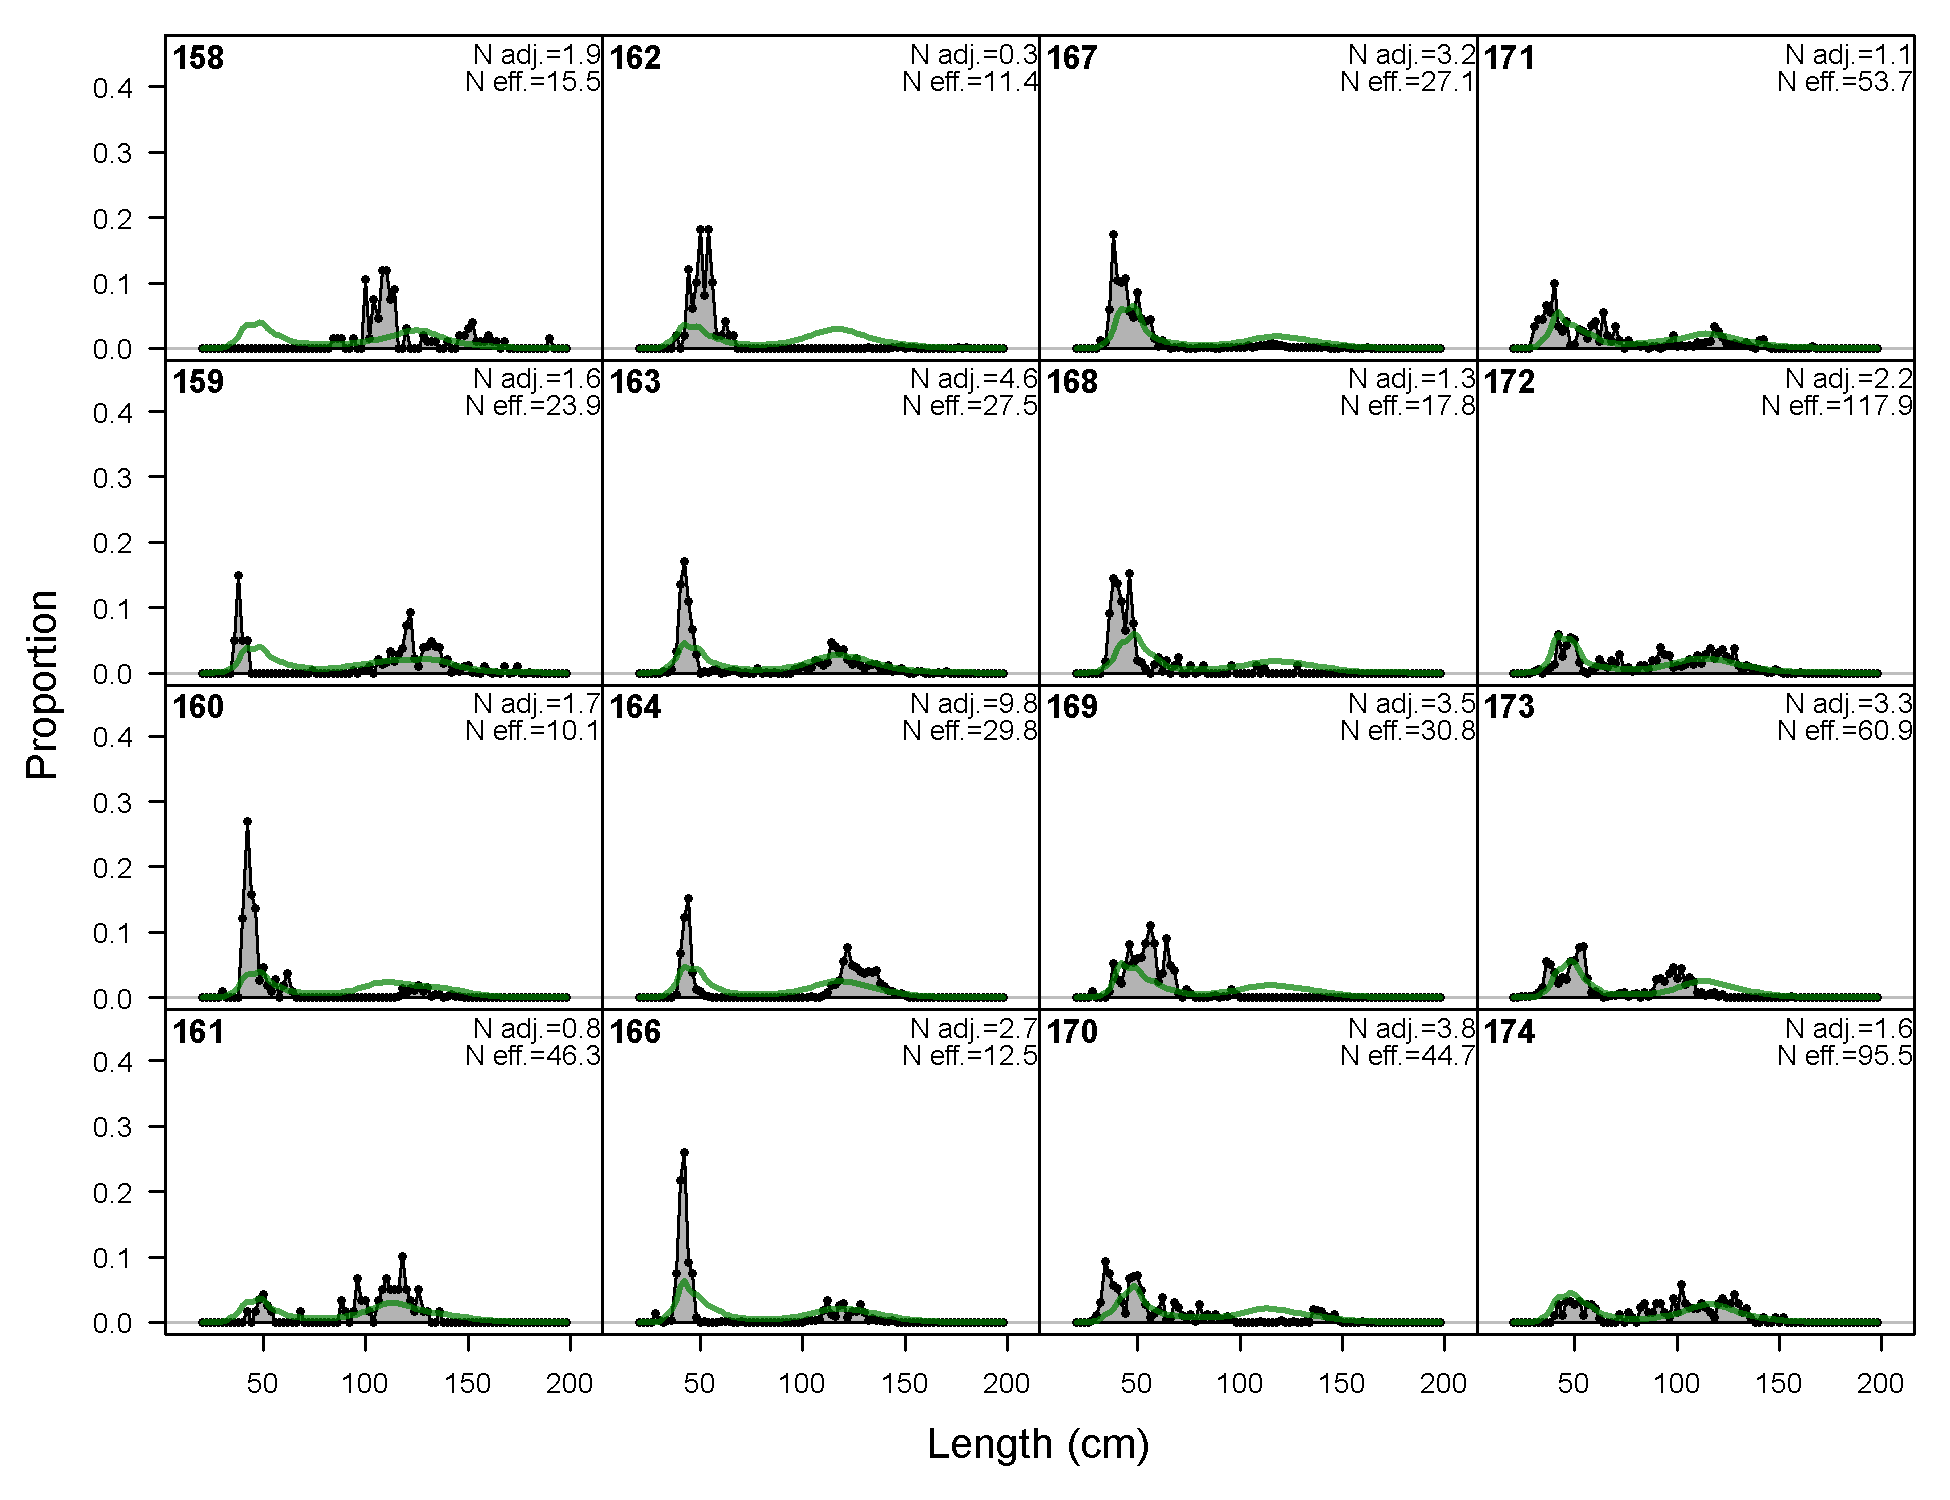
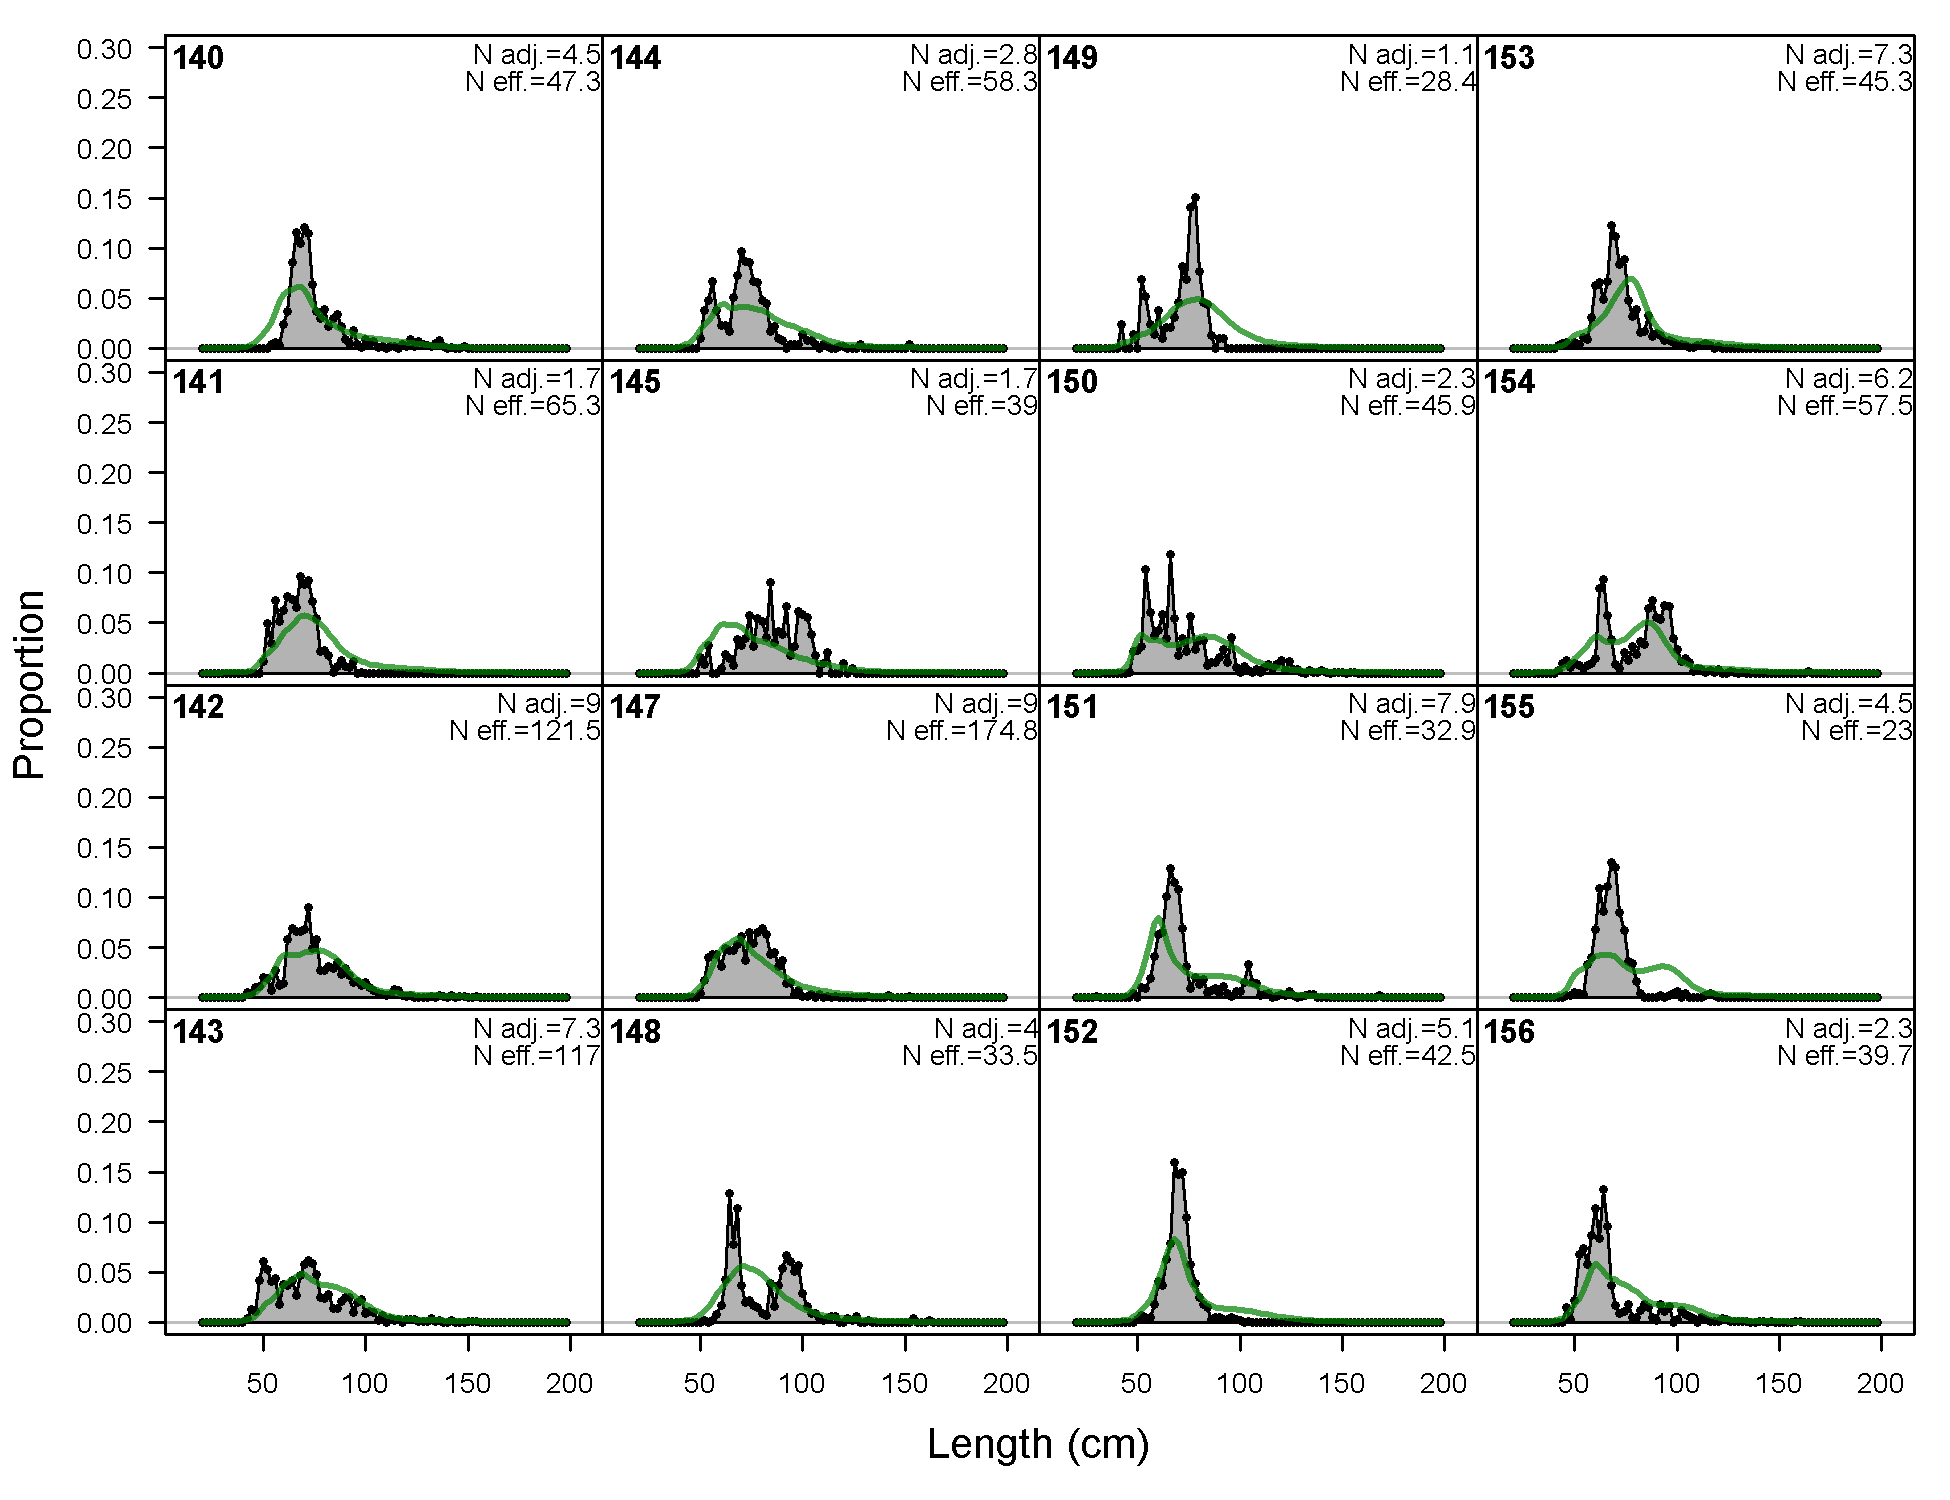
Length comps, whole catch, F8-OBJ_C_Q23 (plot 1 of 4).
'N adj.' is the input sample size after data-weighting adjustment. N eff. is the calculated effective sample size used in the McAllister-Iannelli tuning method.
file: comp_lenfit_flt8mkt0_page1.png
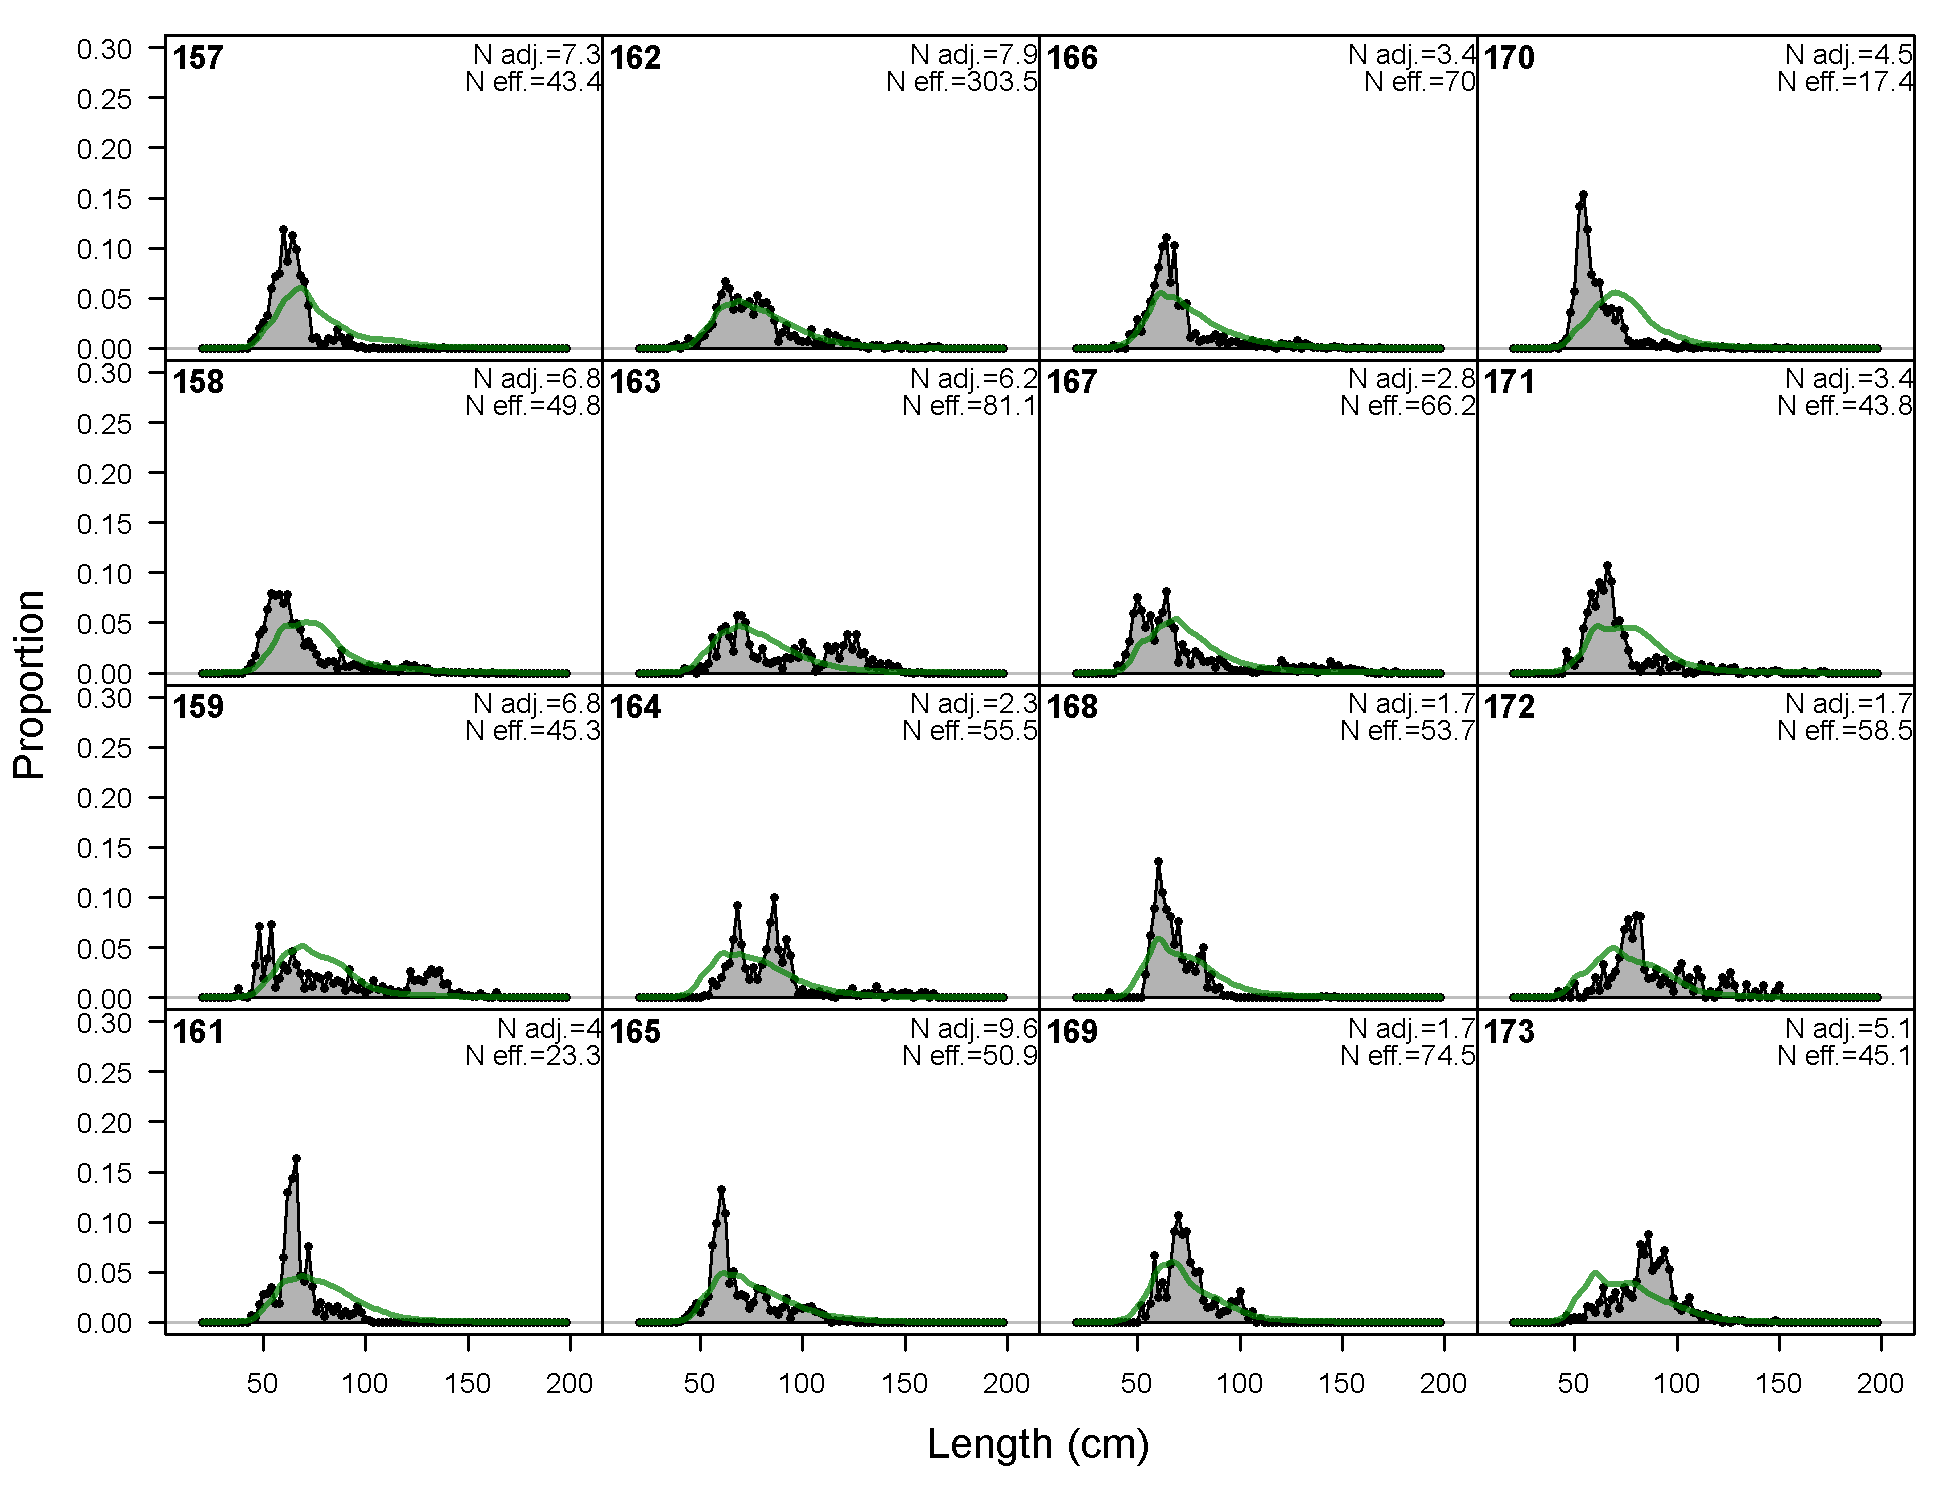
Length comps, whole catch, F8-OBJ_C_Q23 (plot 2 of 4)
file: comp_lenfit_flt8mkt0_page2.png
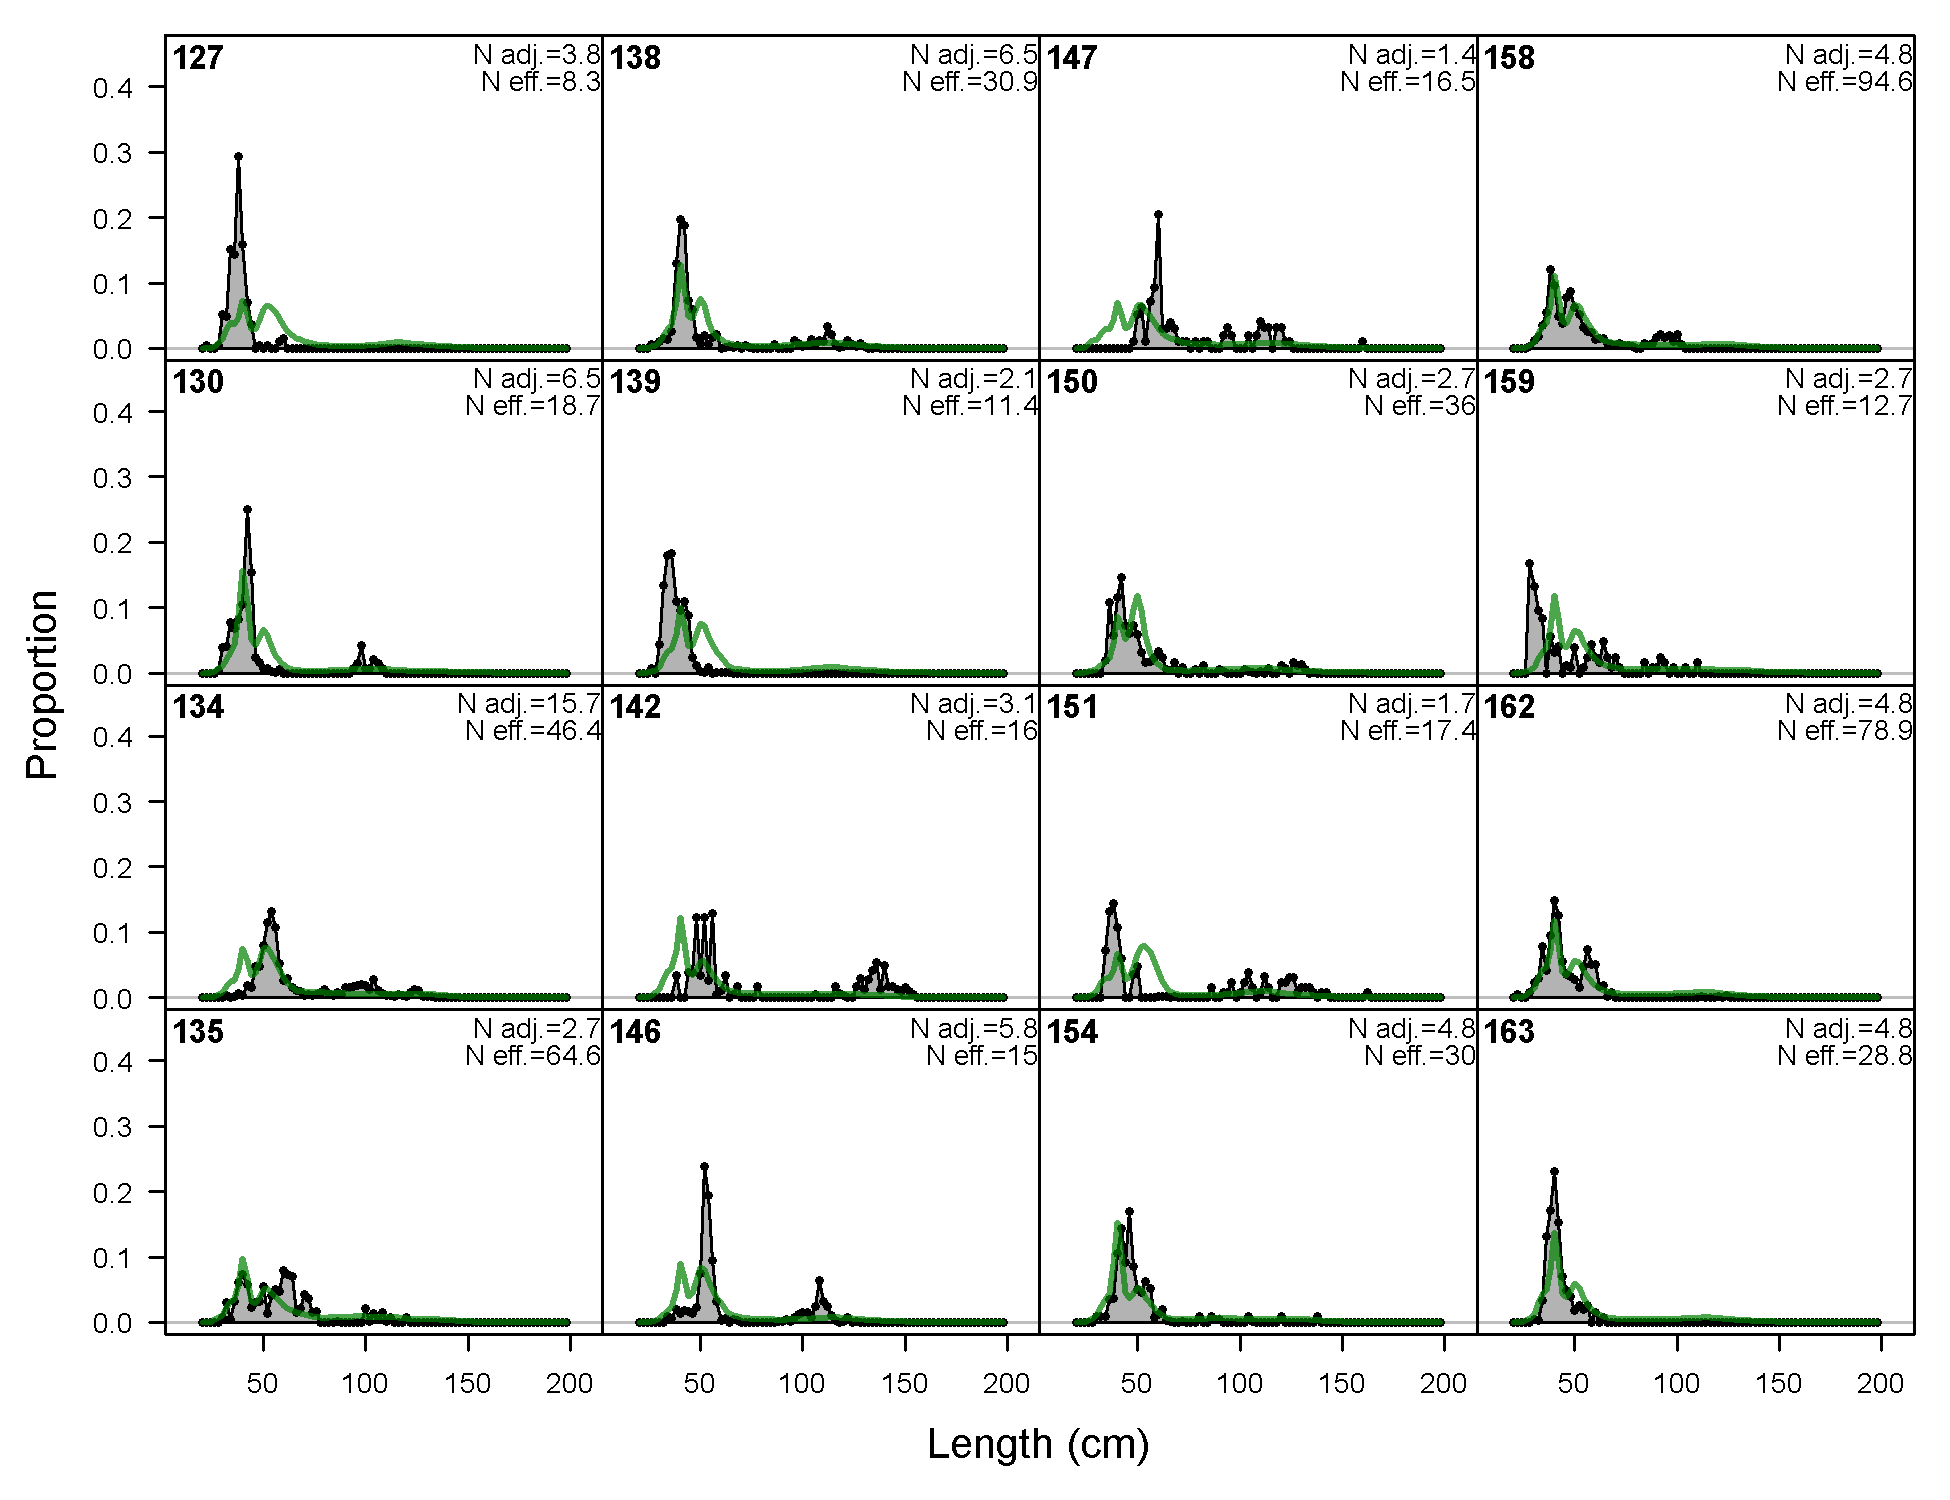
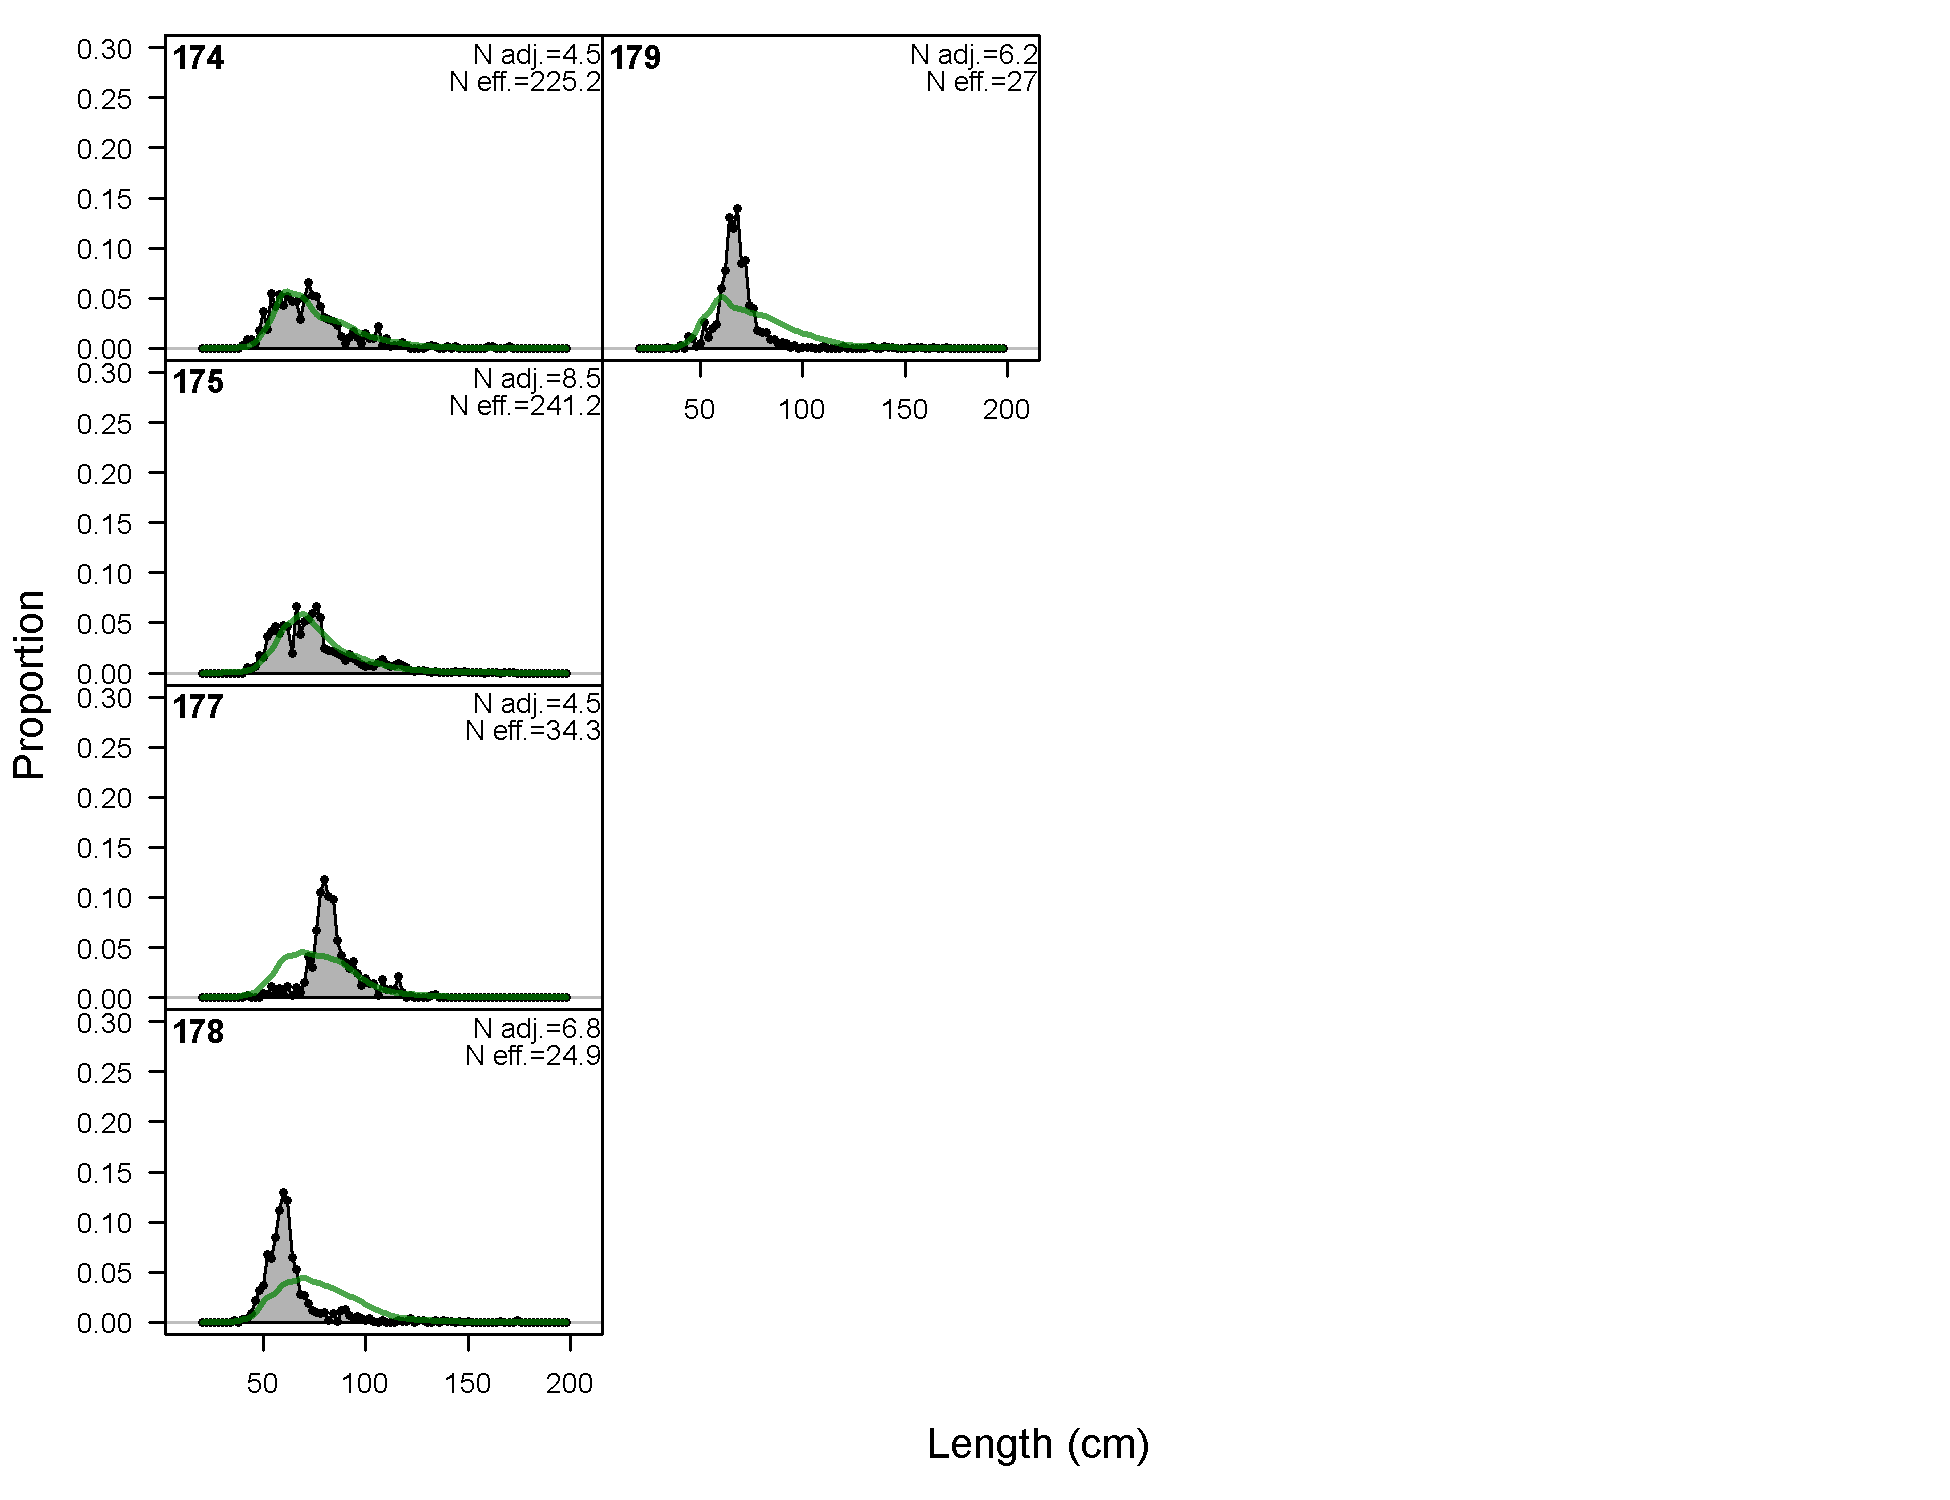
Length comps, whole catch, F8-OBJ_C_Q23 (plot 3 of 4)
file: comp_lenfit_flt8mkt0_page3.png
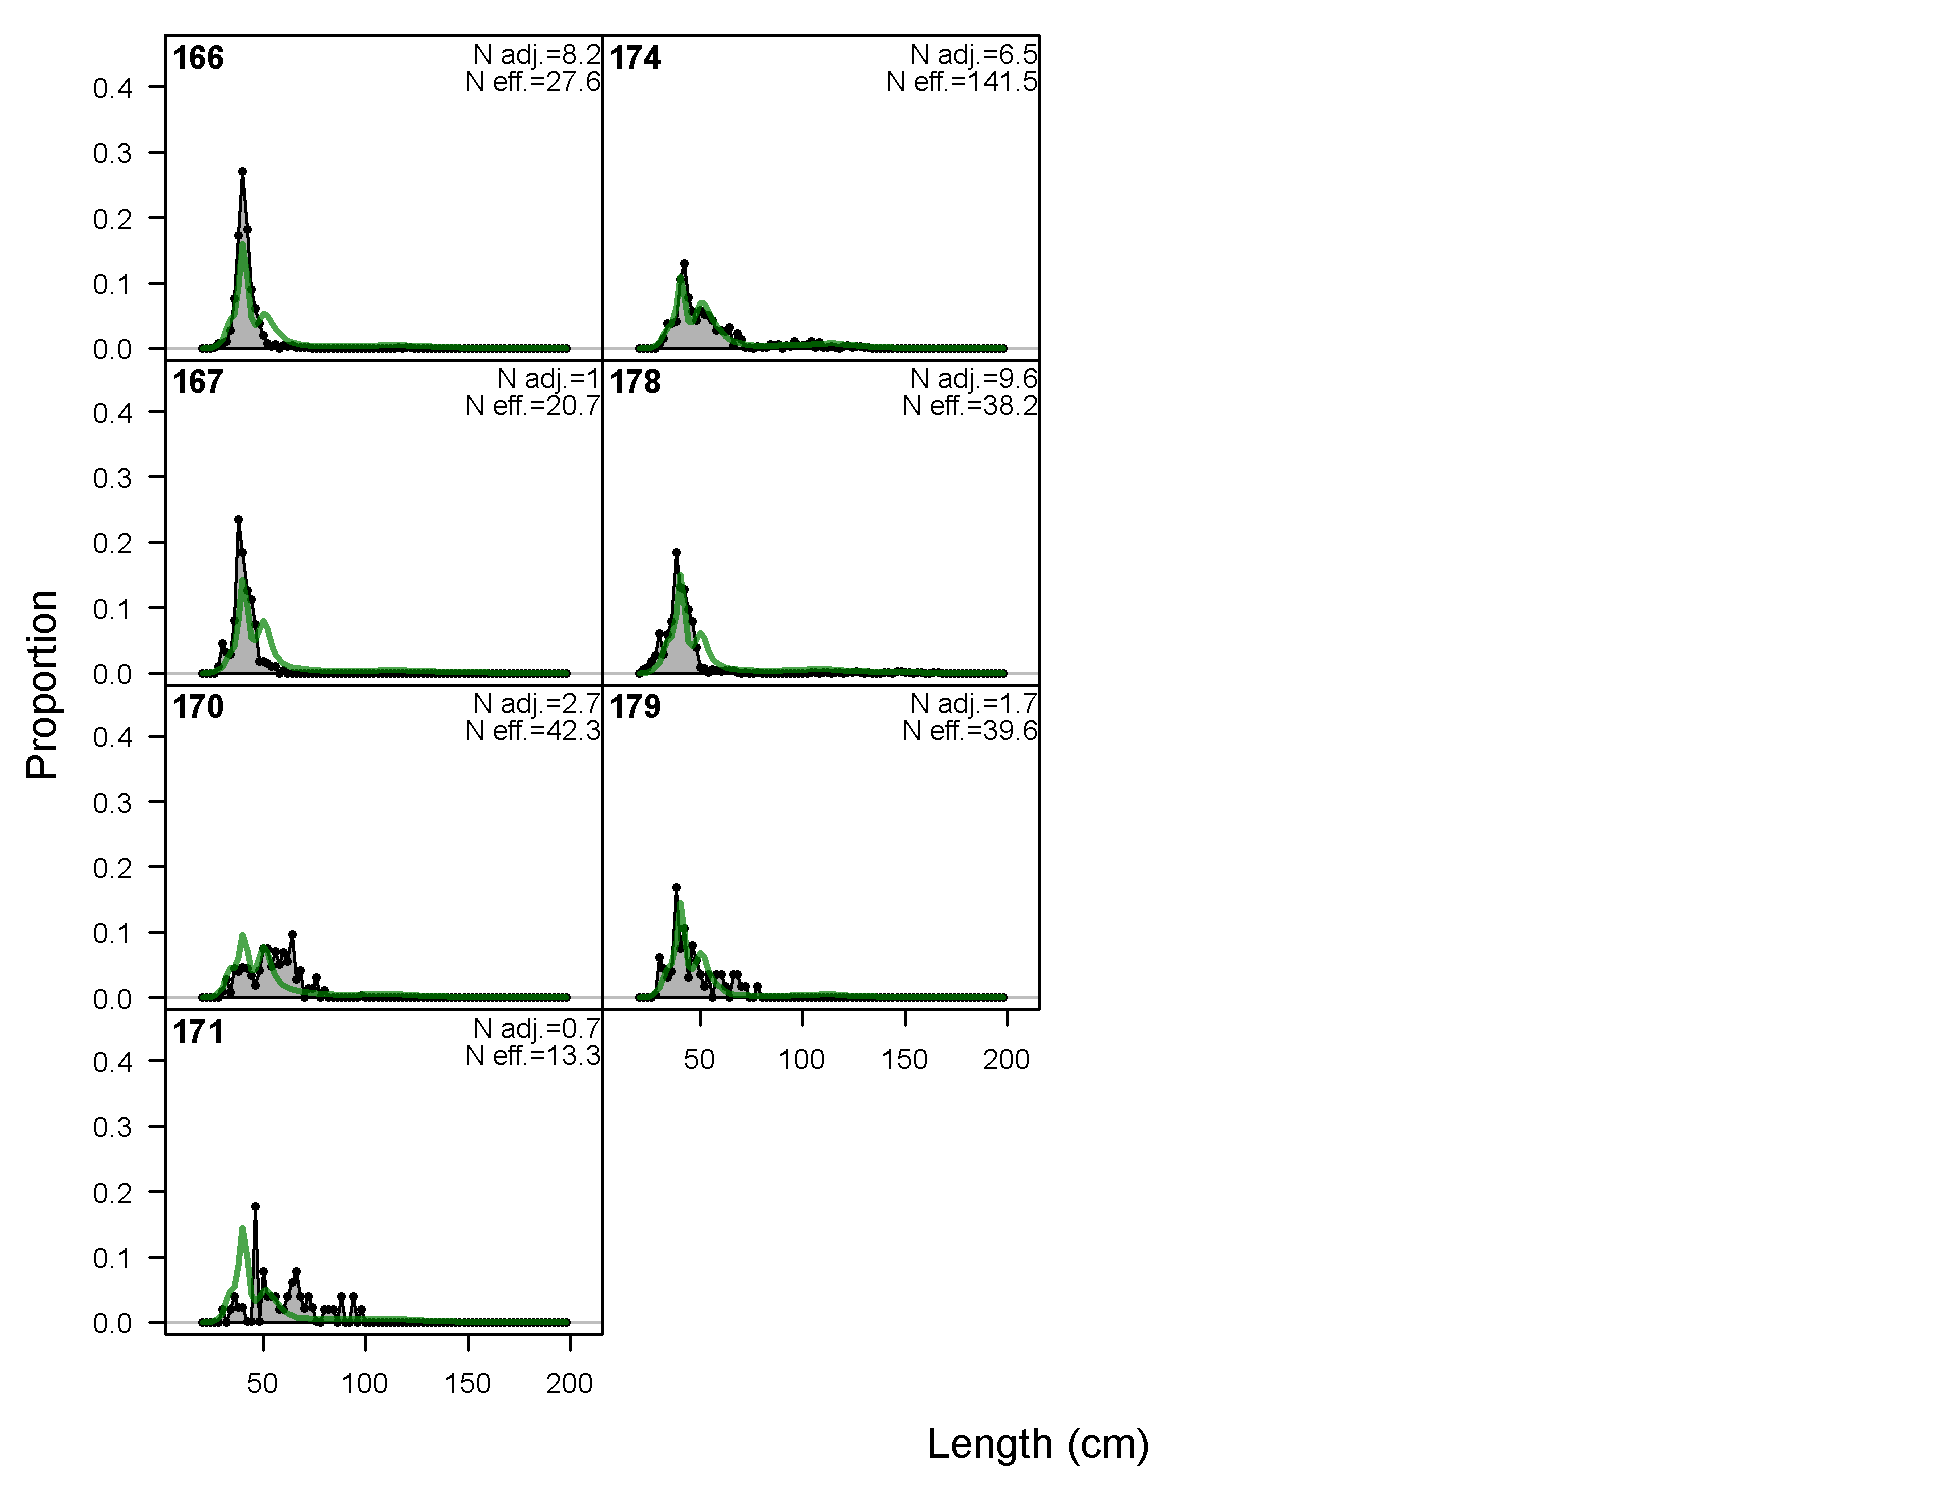
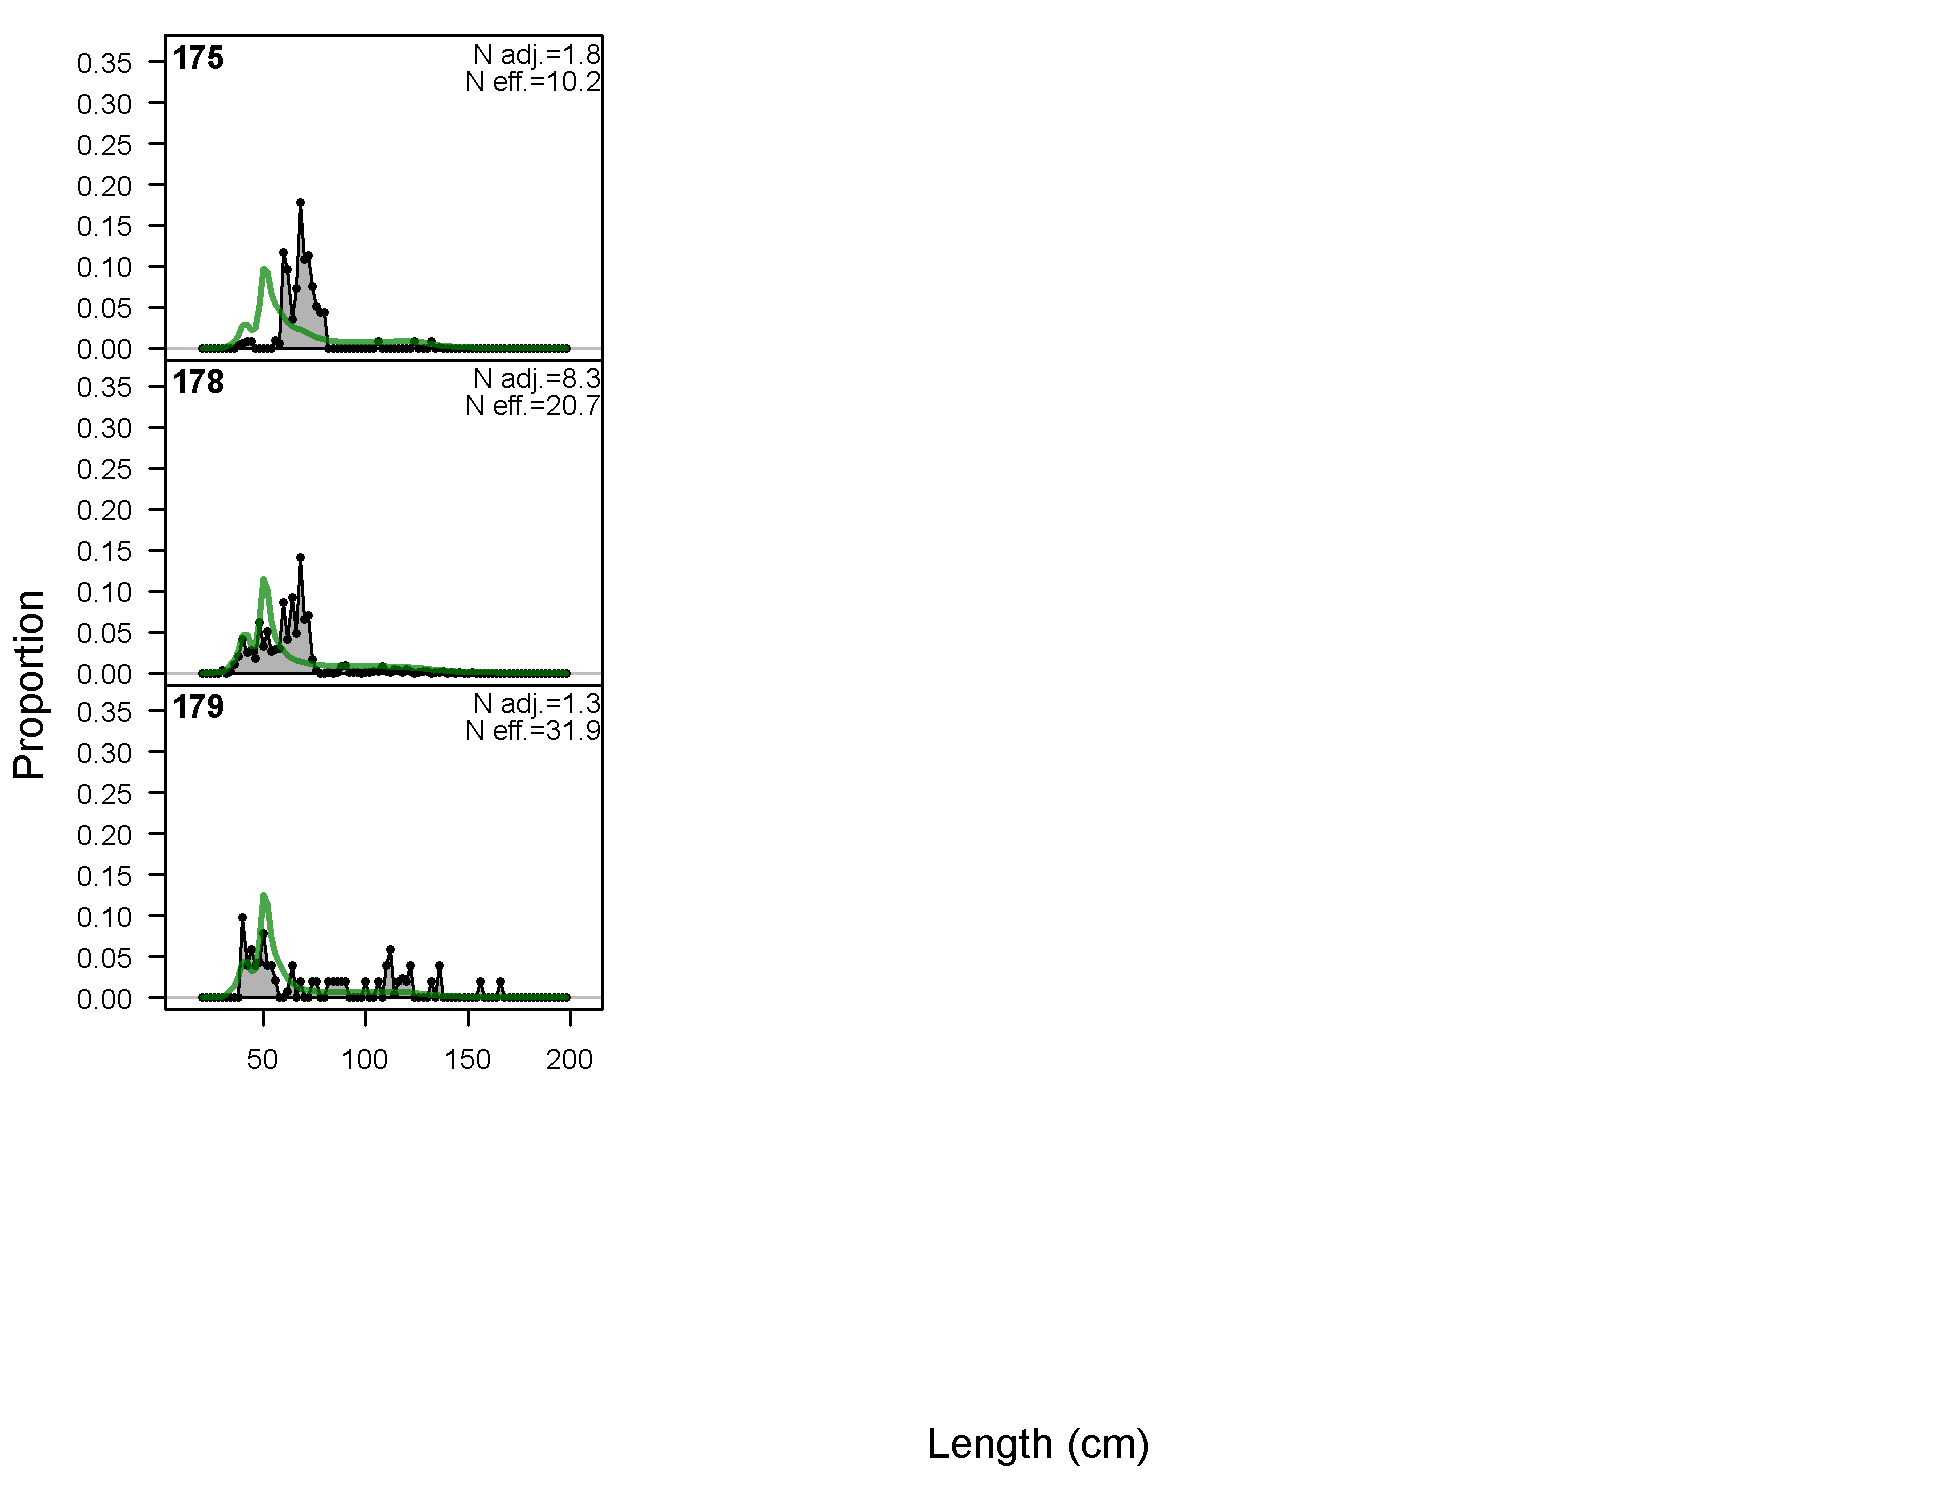
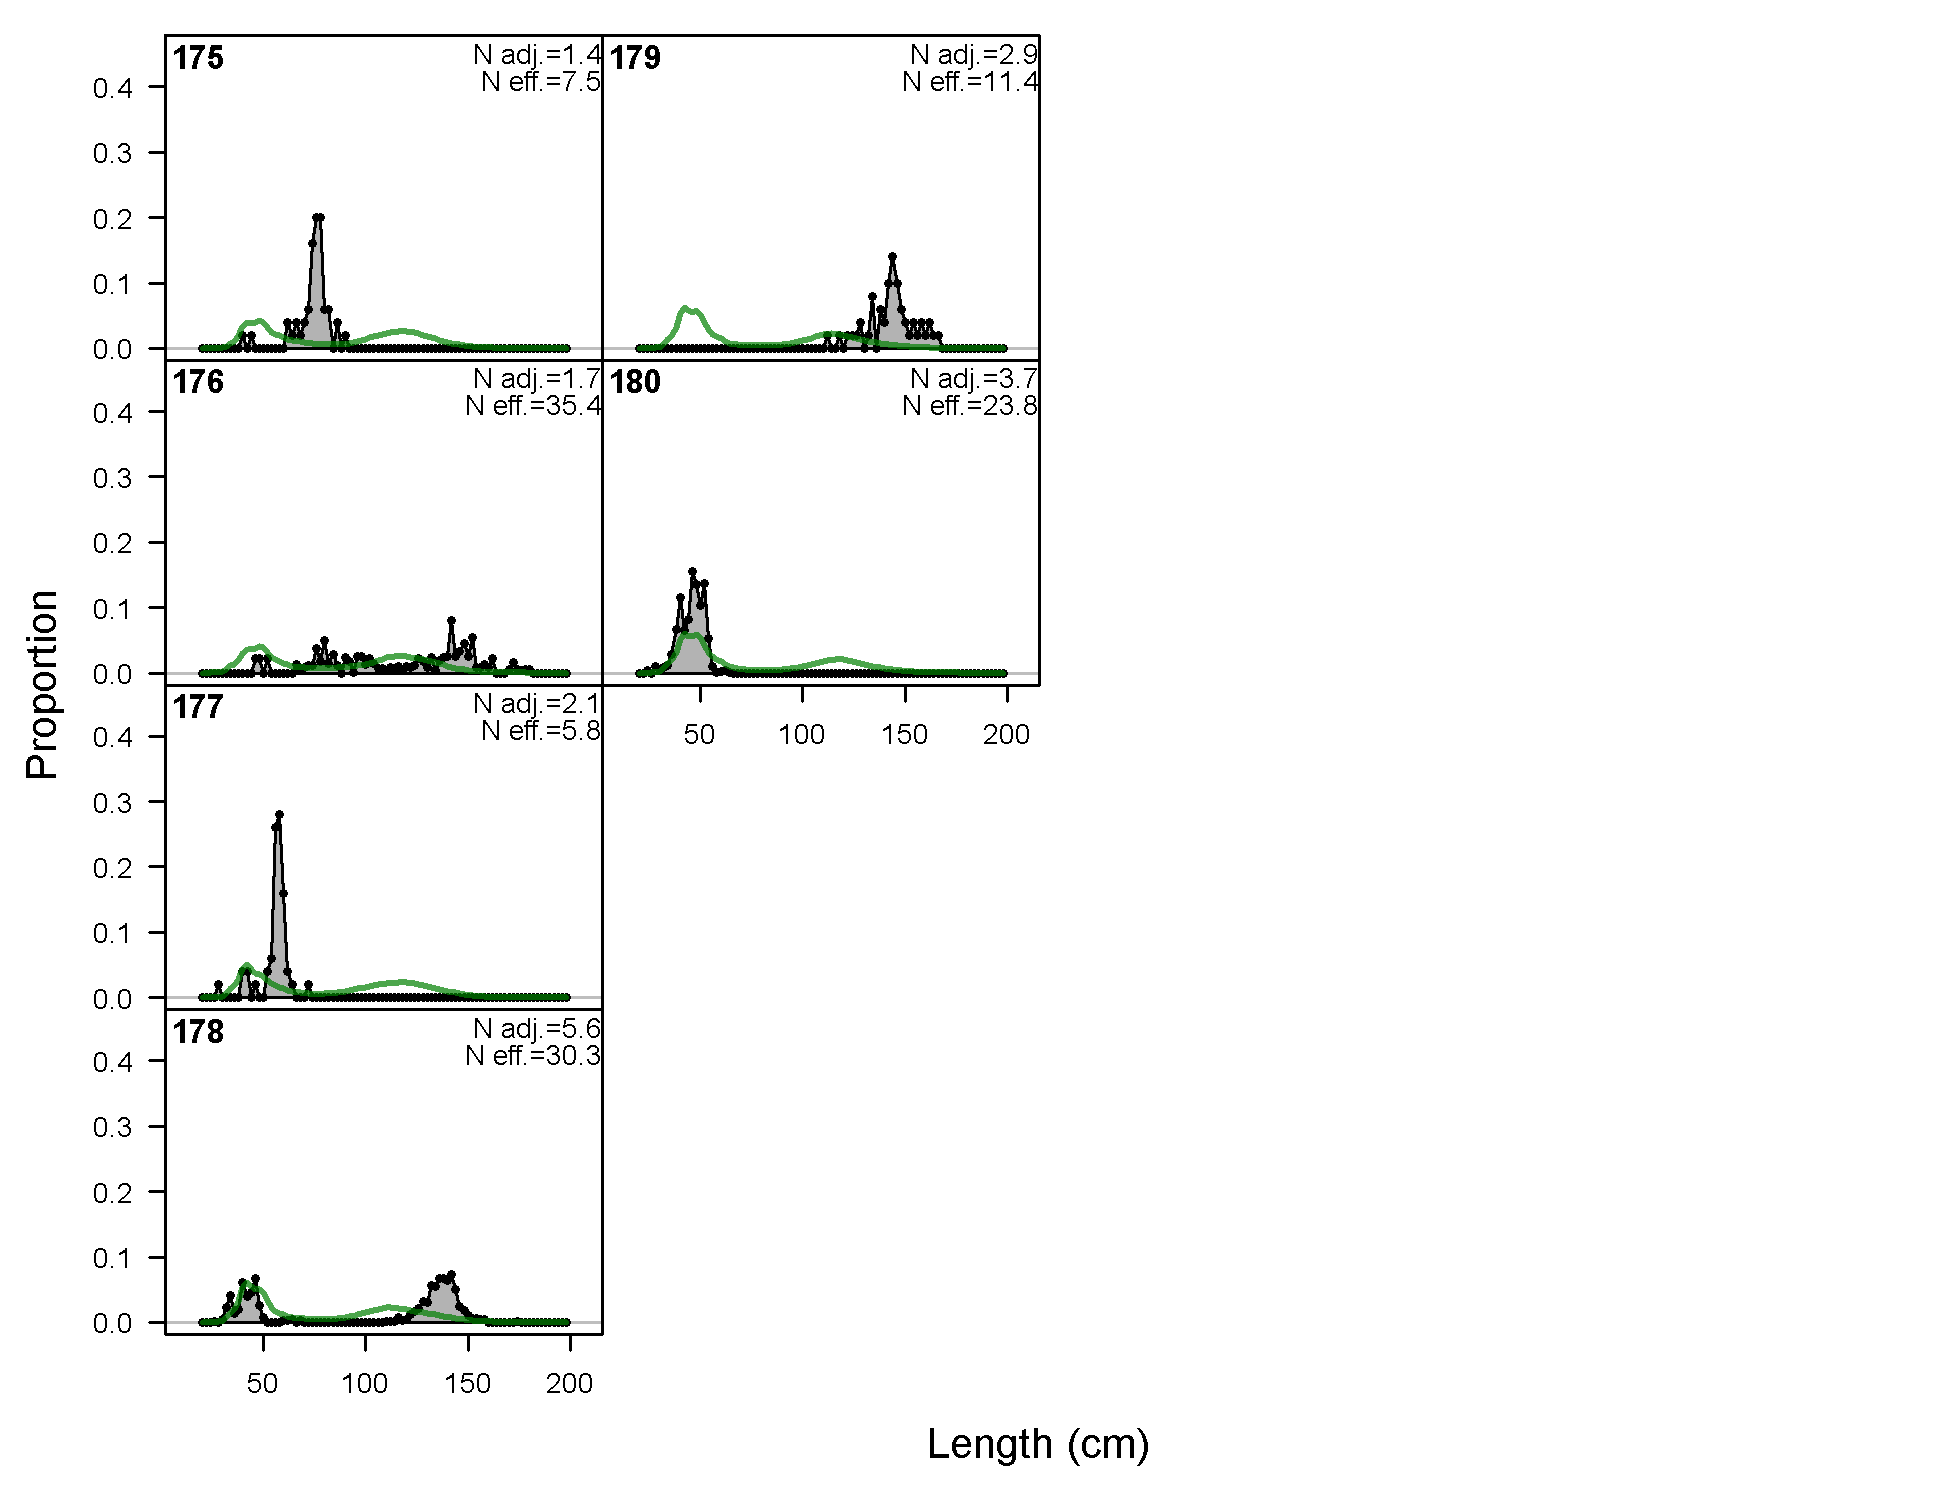
Length comps, whole catch, F8-OBJ_C_Q23 (plot 4 of 4)
file: comp_lenfit_flt8mkt0_page4.png
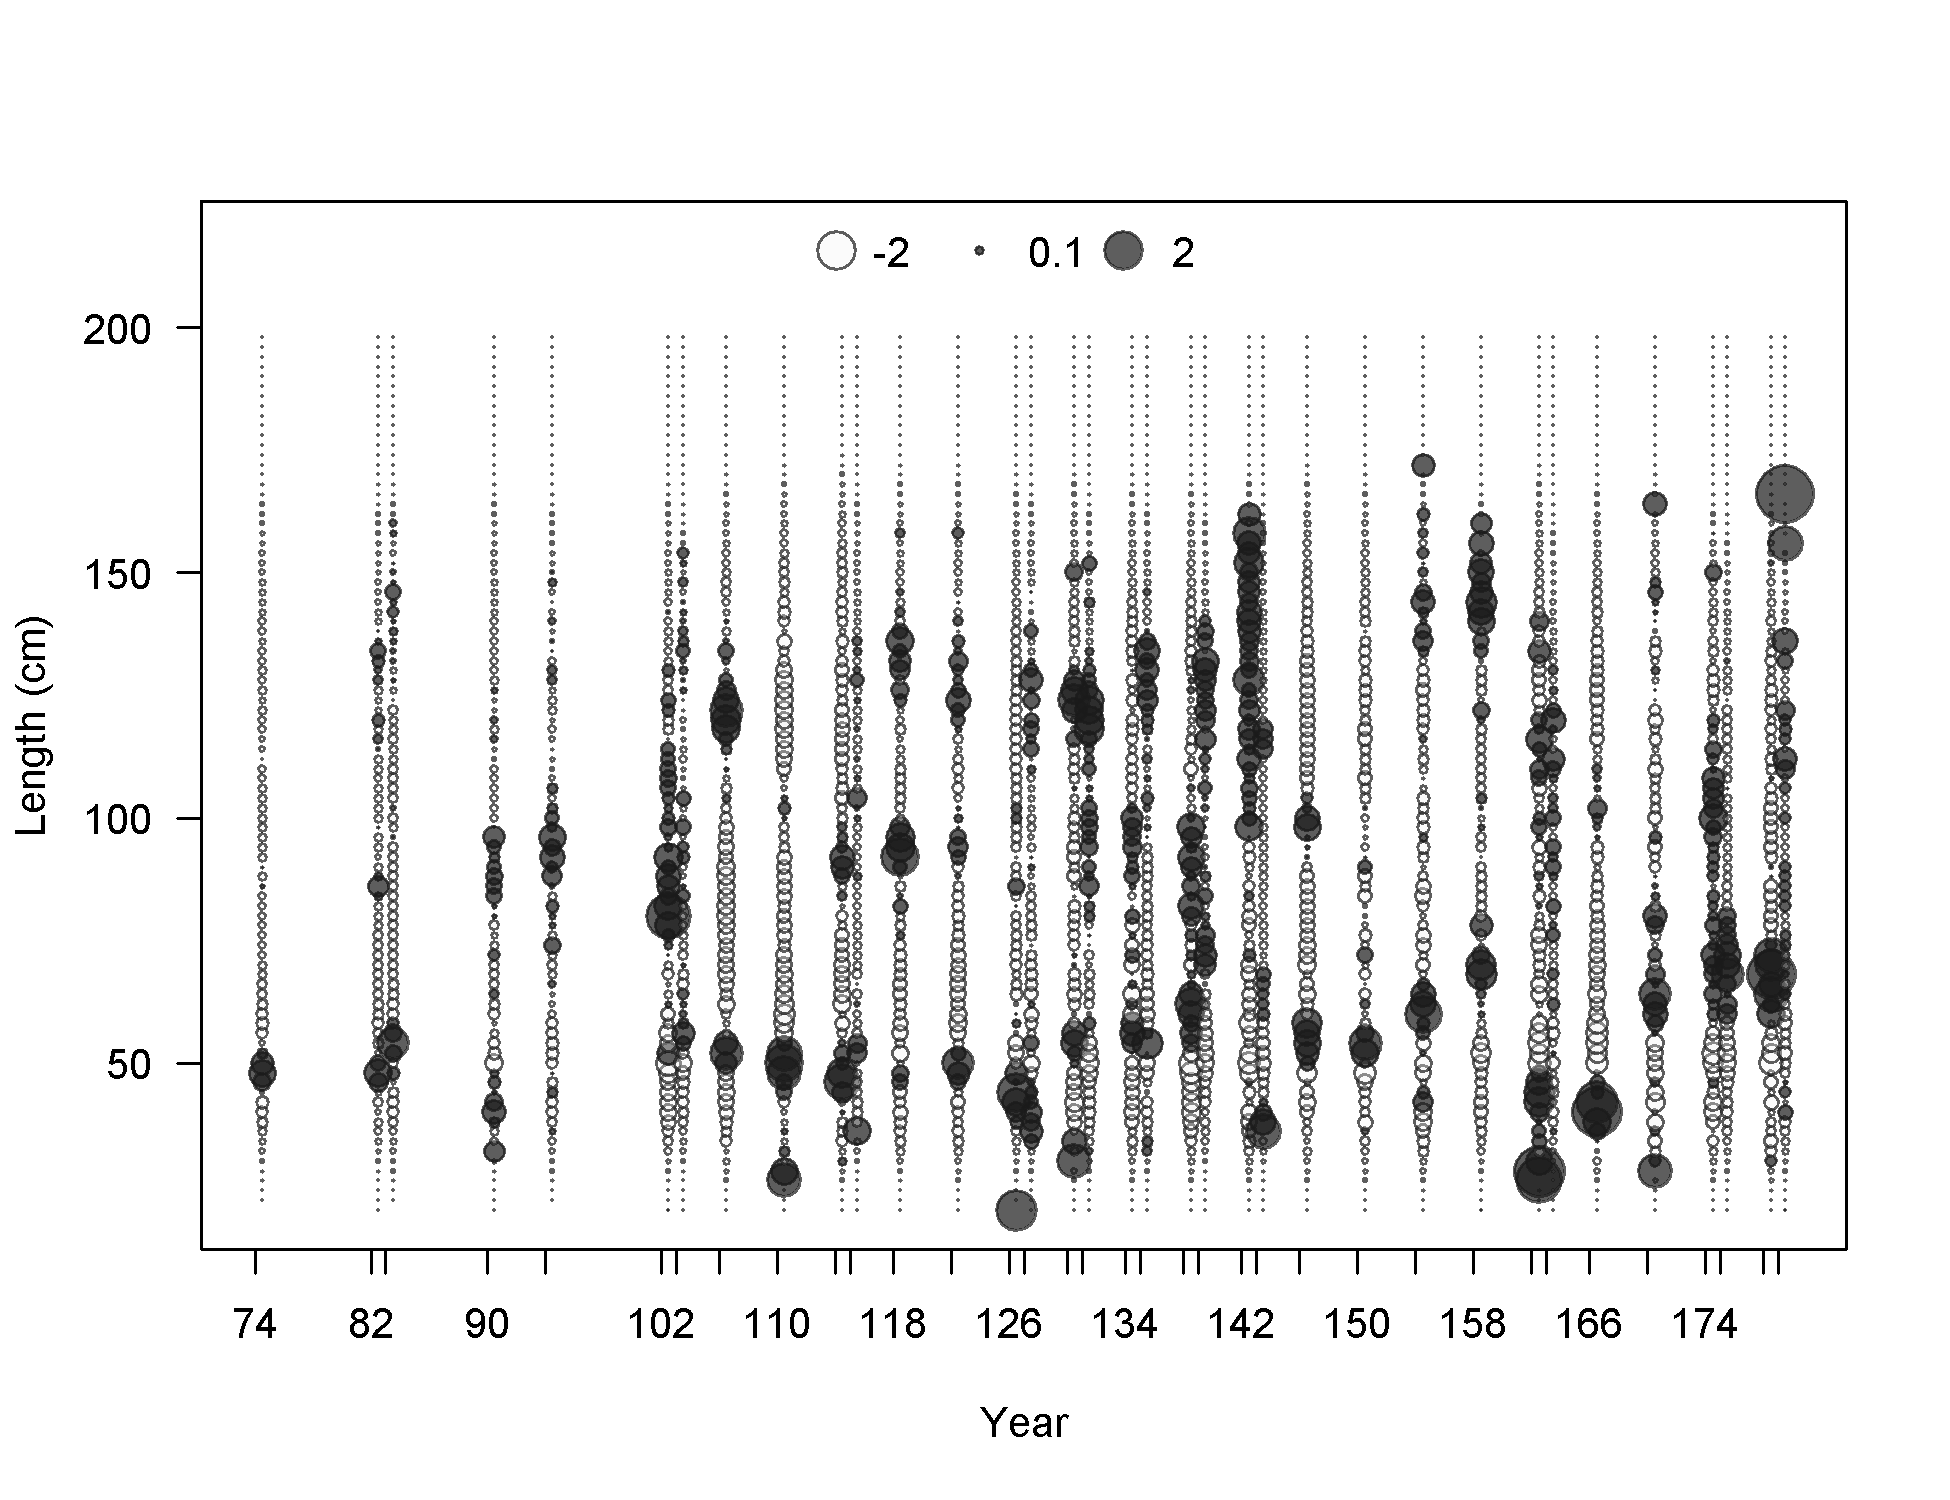
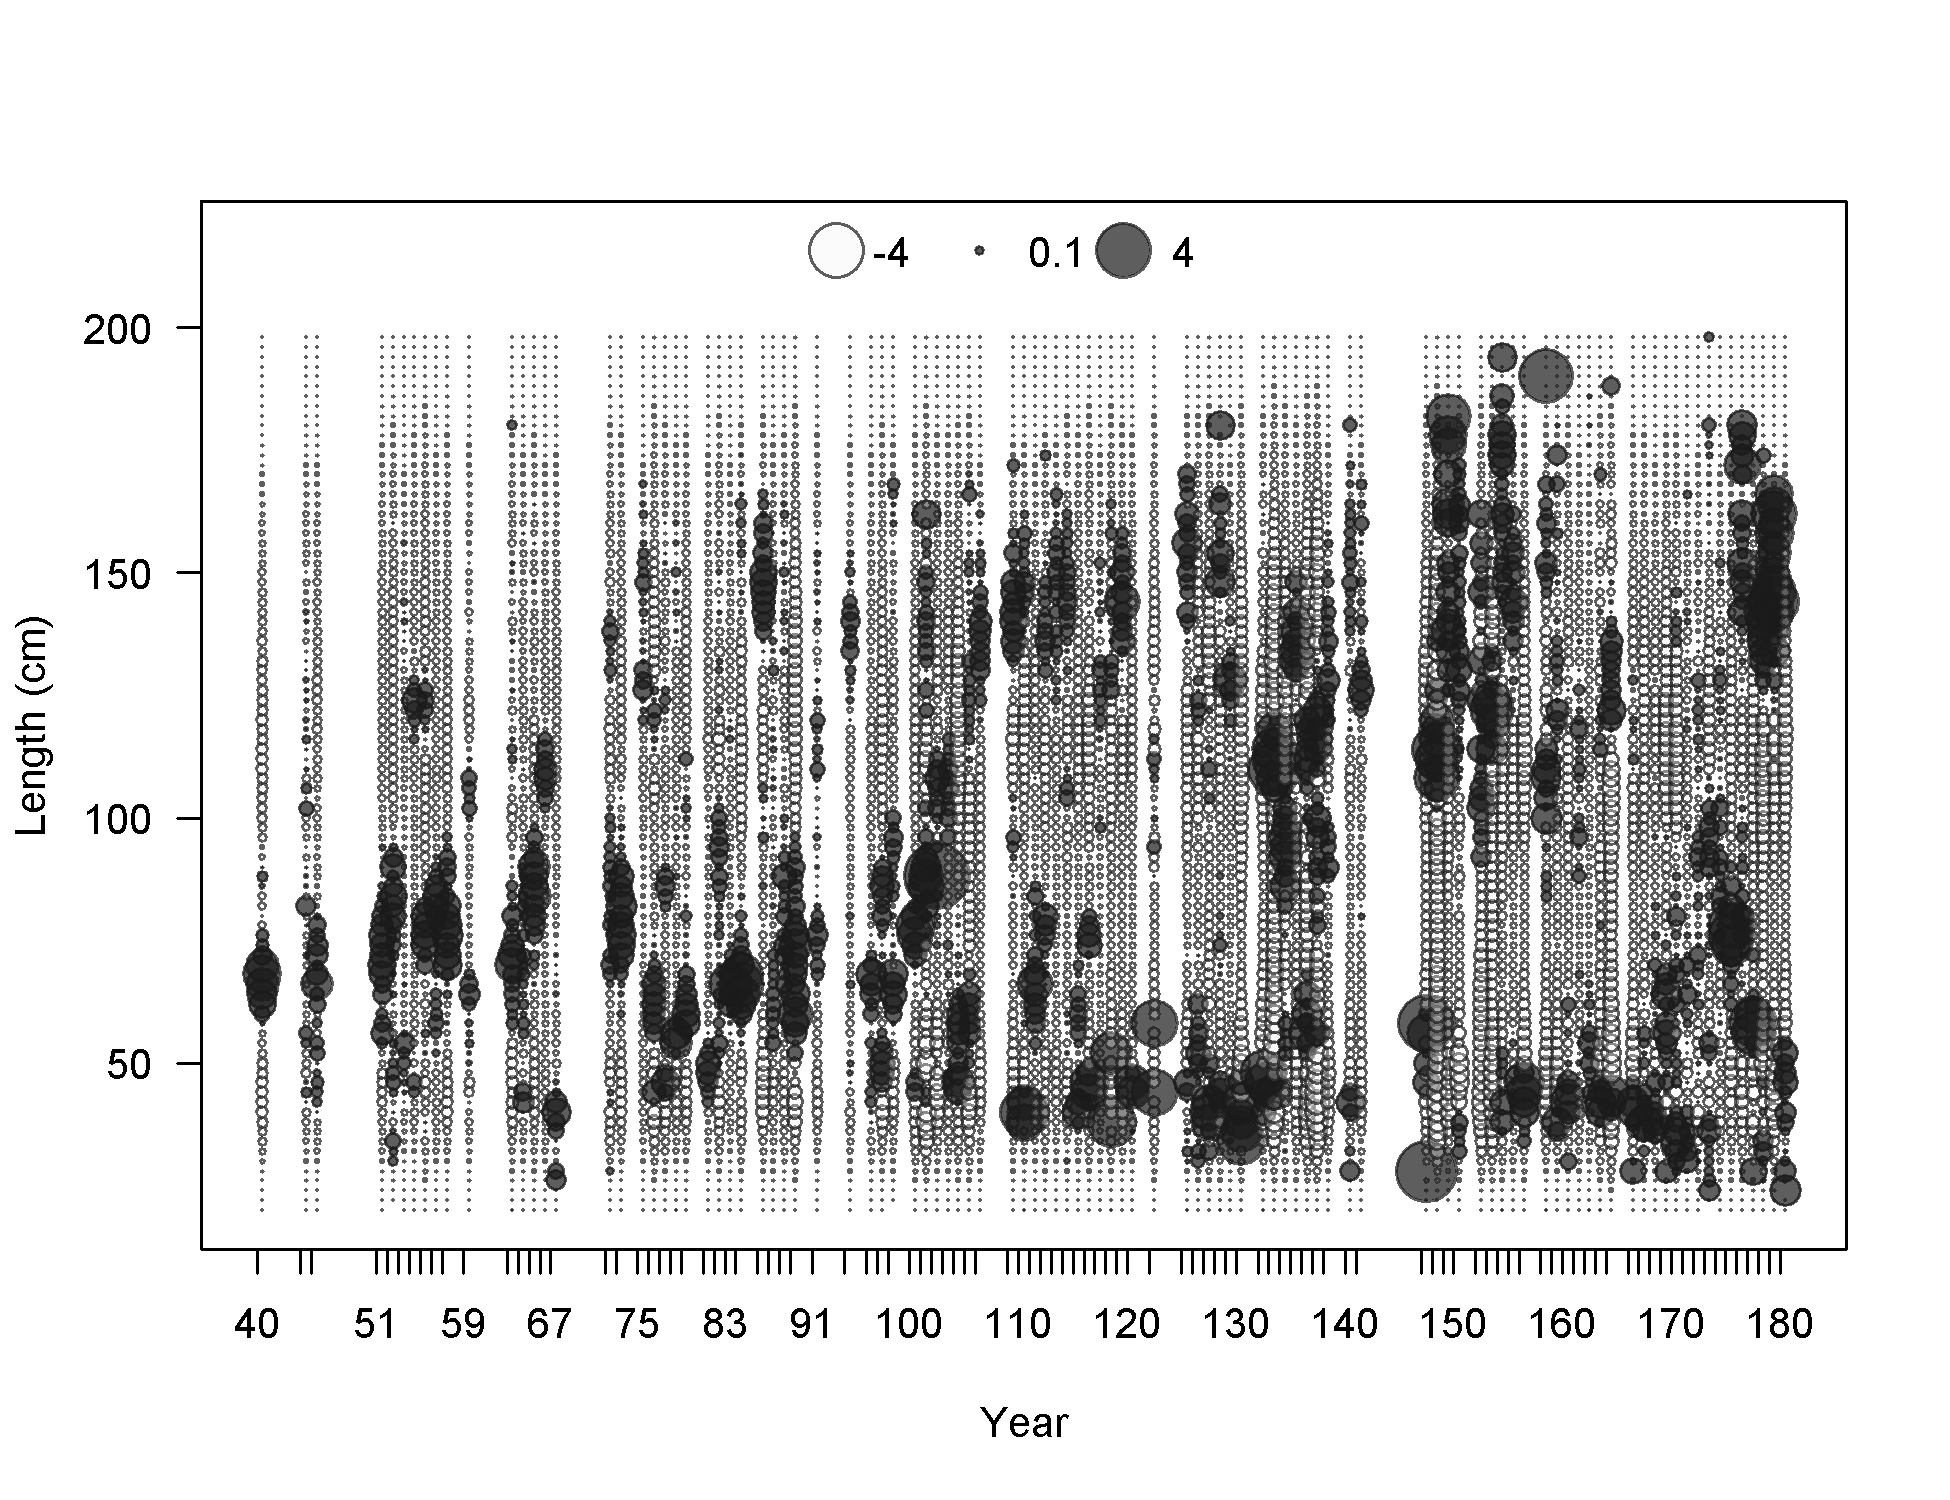
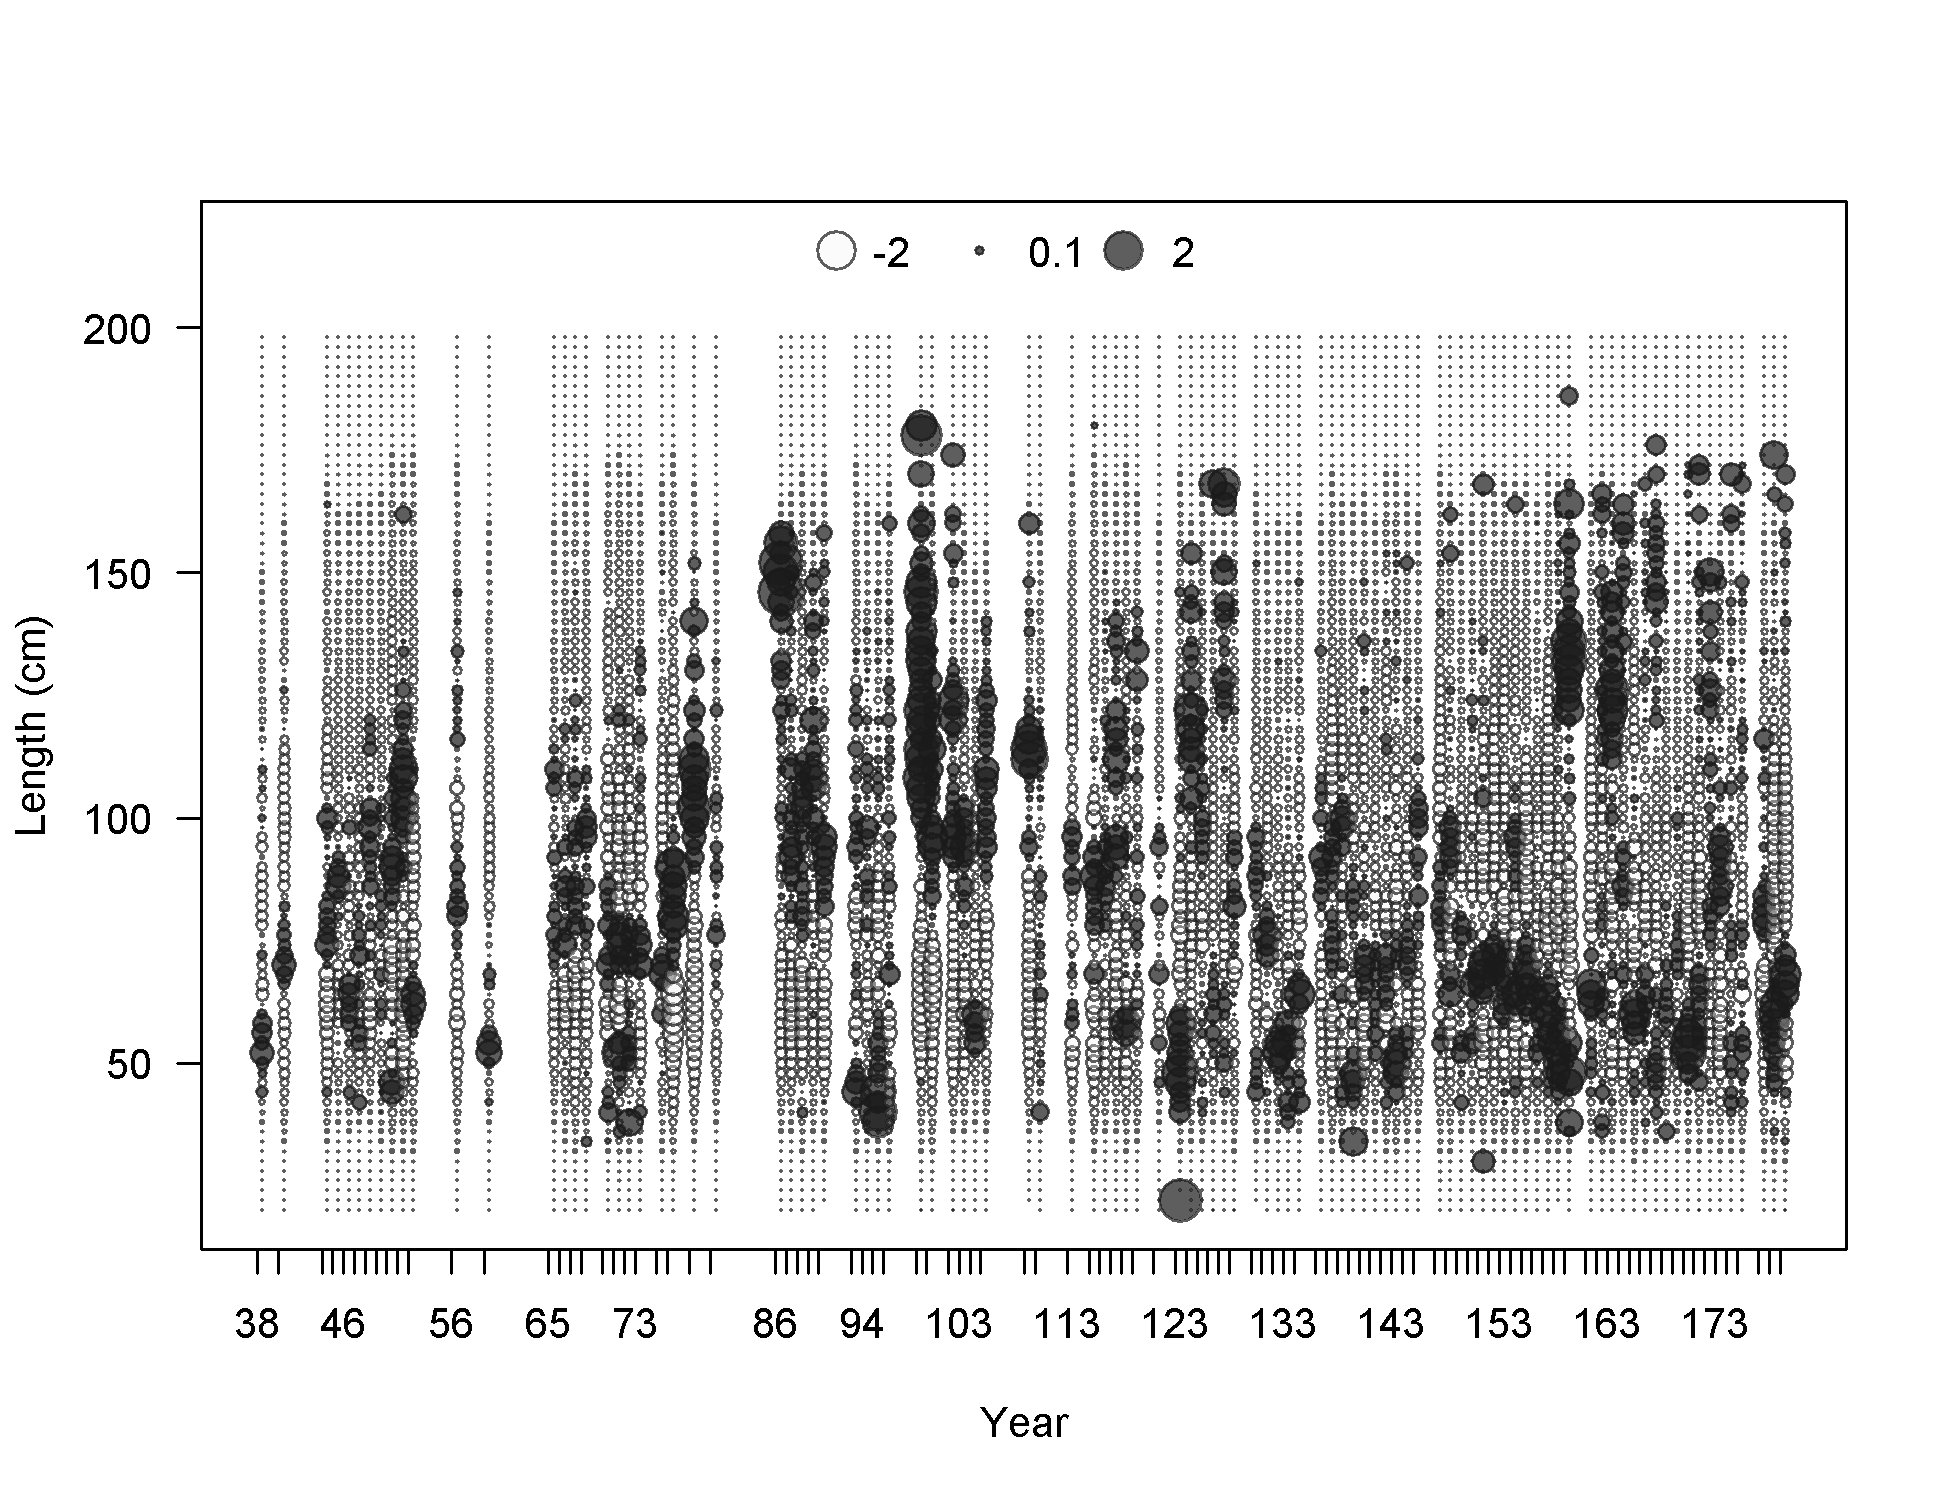
Pearson residuals, whole catch, F8-OBJ_C_Q23 (max=3.08) (plot 4 of 4)
Closed bubbles are positive residuals (observed > expected) and open bubbles are negative residuals (observed < expected).
file: comp_lenfit_residsflt8mkt0_page4.png
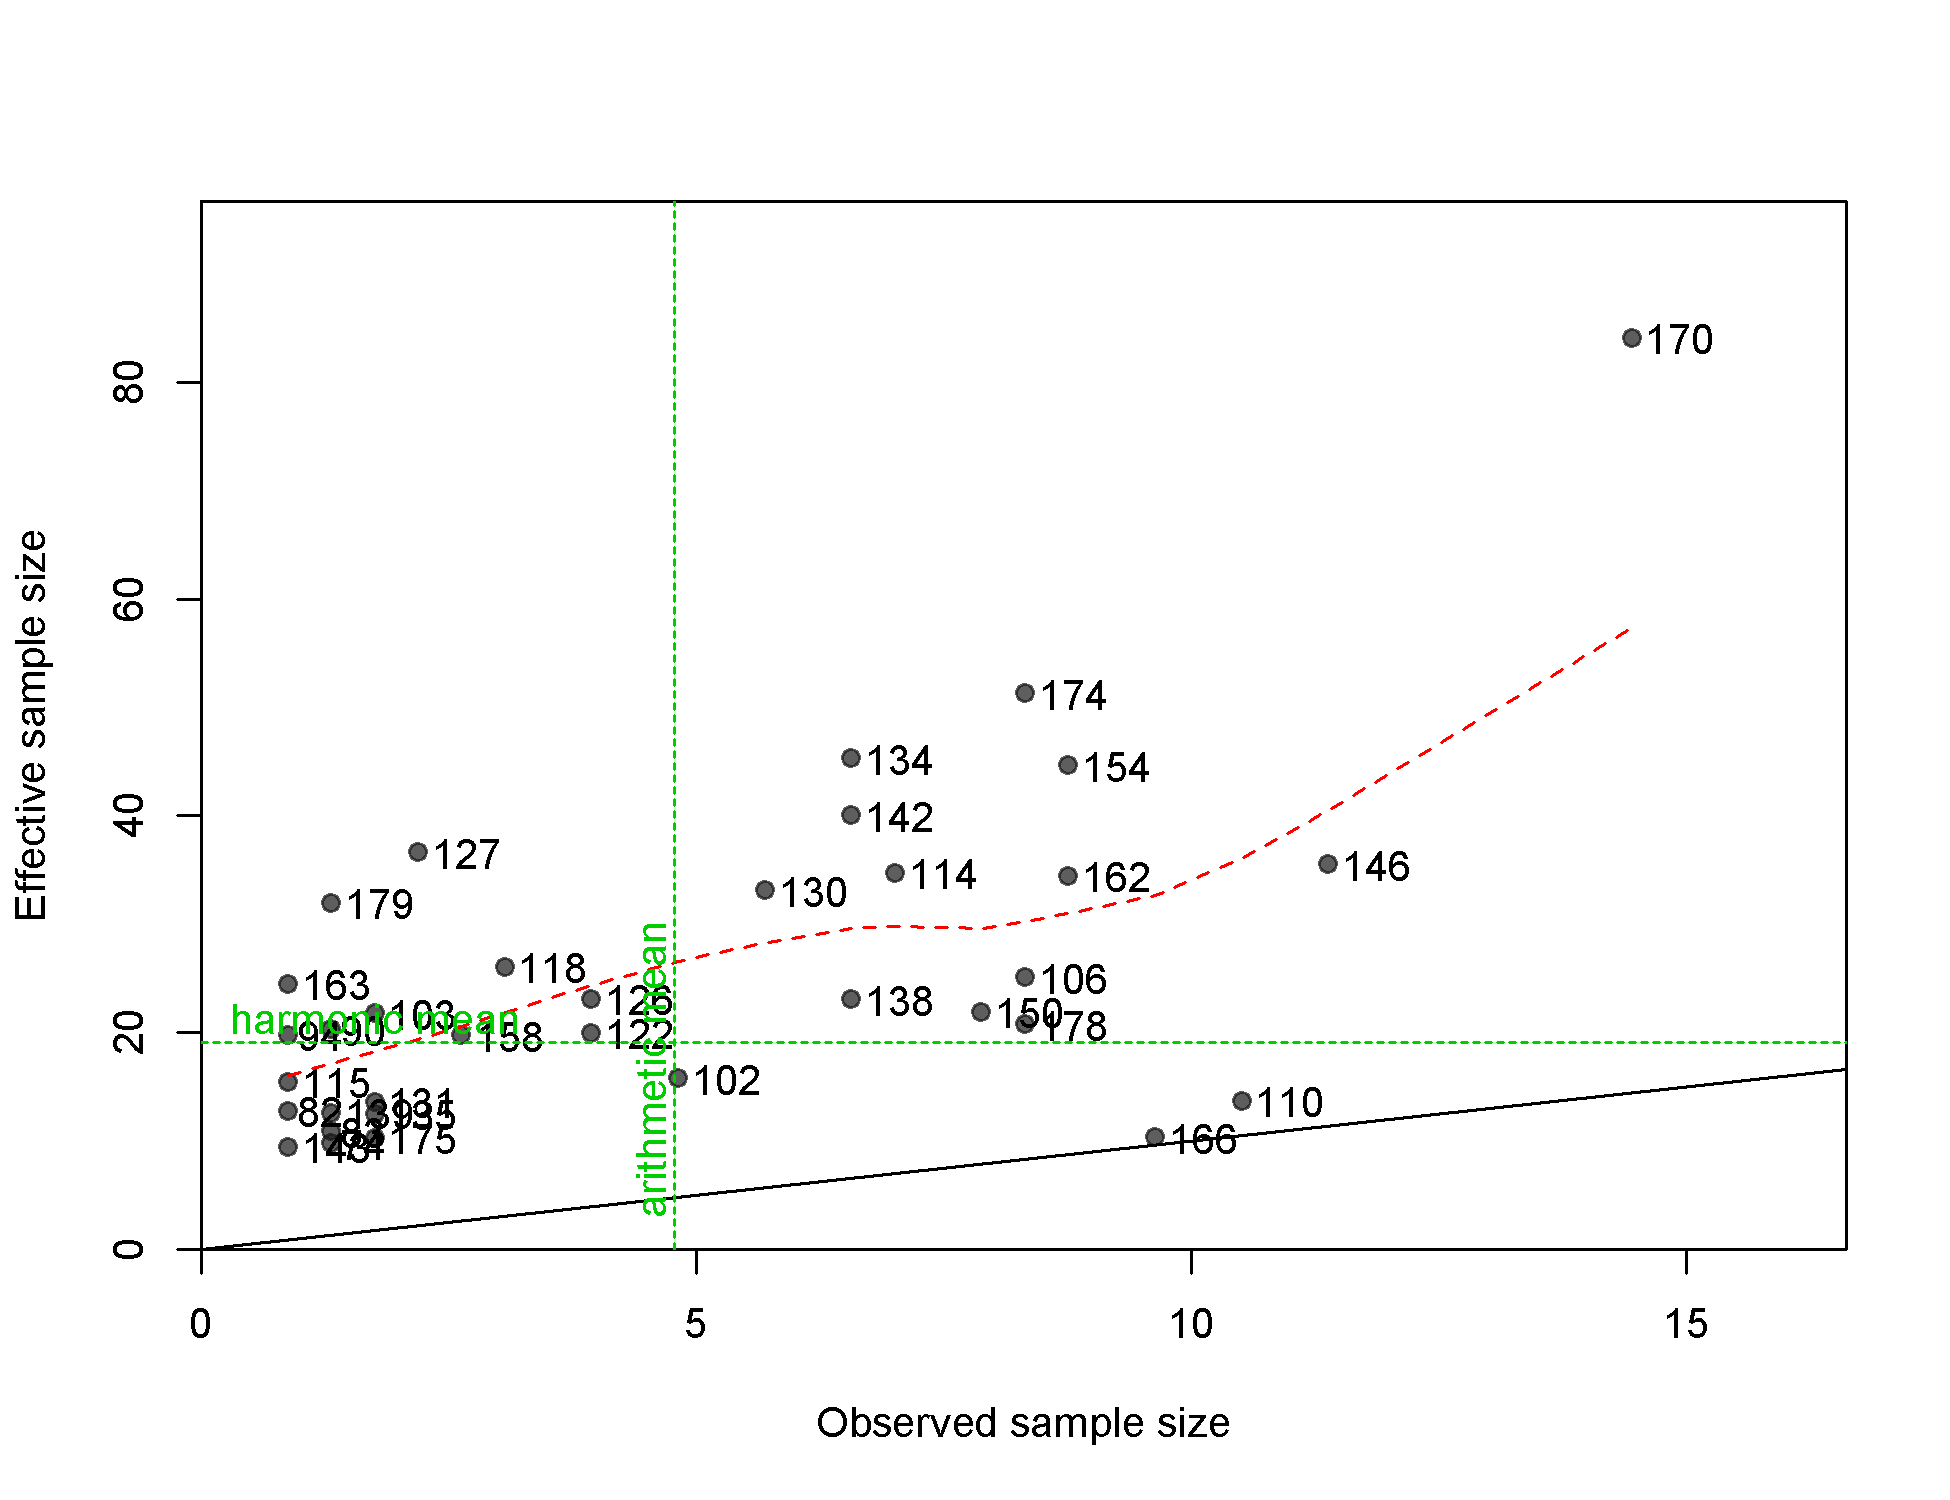
N-EffN comparison, Length comps, whole catch, F8-OBJ_C_Q23
file: comp_lenfit_sampsize_flt8mkt0.png
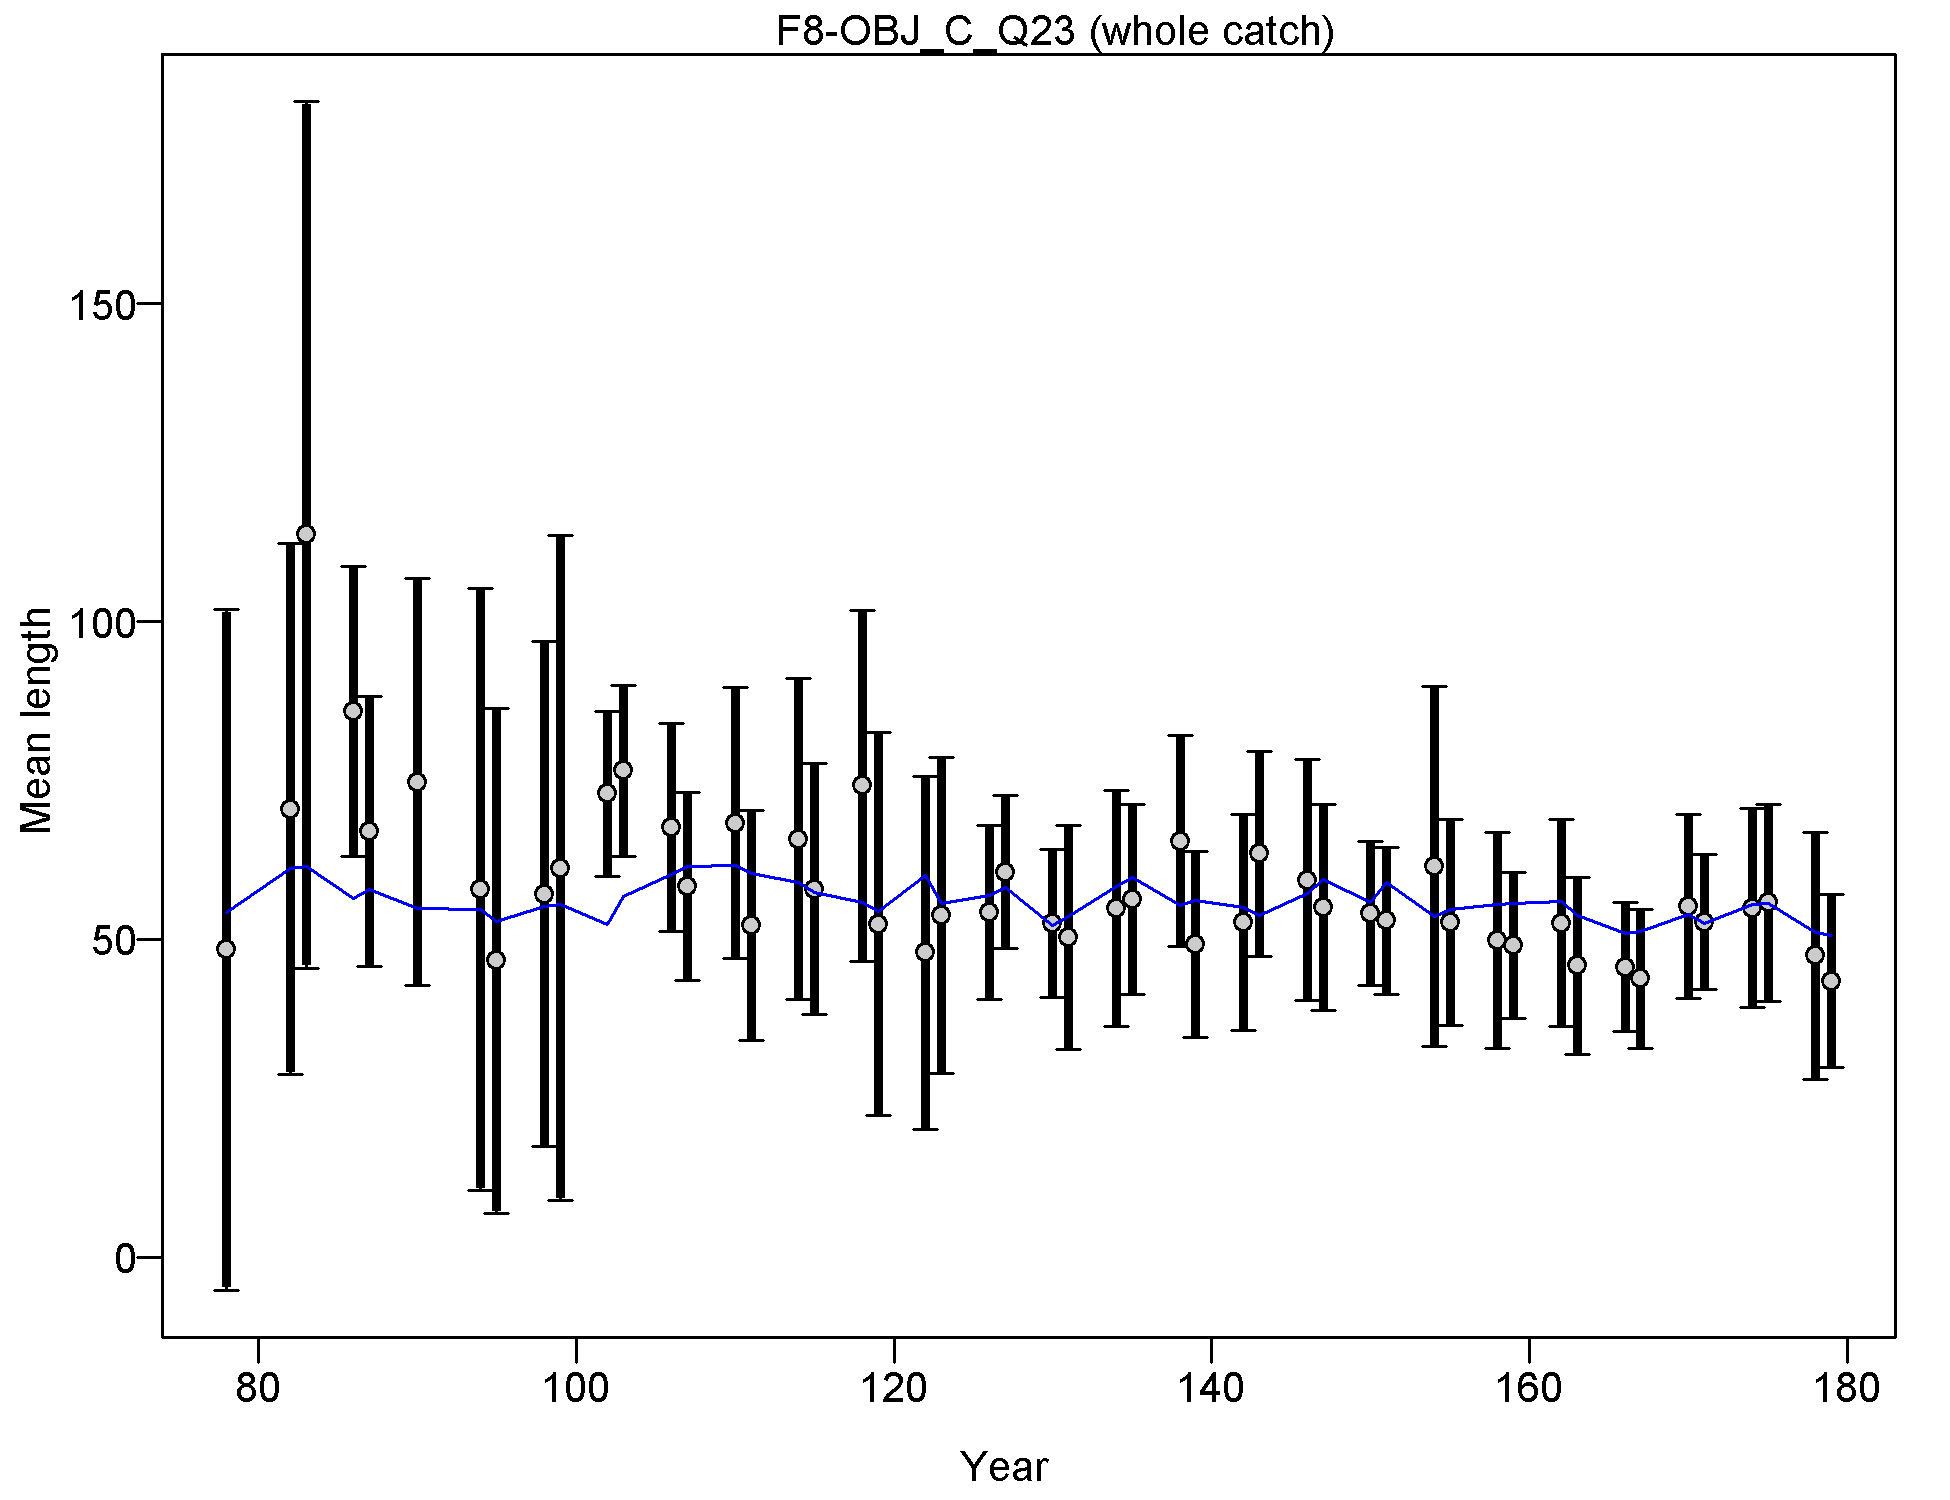
Mean length for F8-OBJ_C_Q23 with 95% confidence intervals based on current samples sizes.
Francis data weighting method TA1.8: thinner intervals (with capped ends) show result of further adjusting sample sizes based on suggested multiplier (with 95% interval) for len data from F8-OBJ_C_Q23:
0.9867 (0.6324-2.0444)
For more info, see
Francis, R.I.C.C. (2011). Data weighting in statistical fisheries stock assessment models. Can. J. Fish. Aquat. Sci. 68: 1124-1138. https://doi.org/10.1139/f2011-025
file: comp_lenfit_data_weighting_TA1.8_F8-OBJ_C_Q23.png
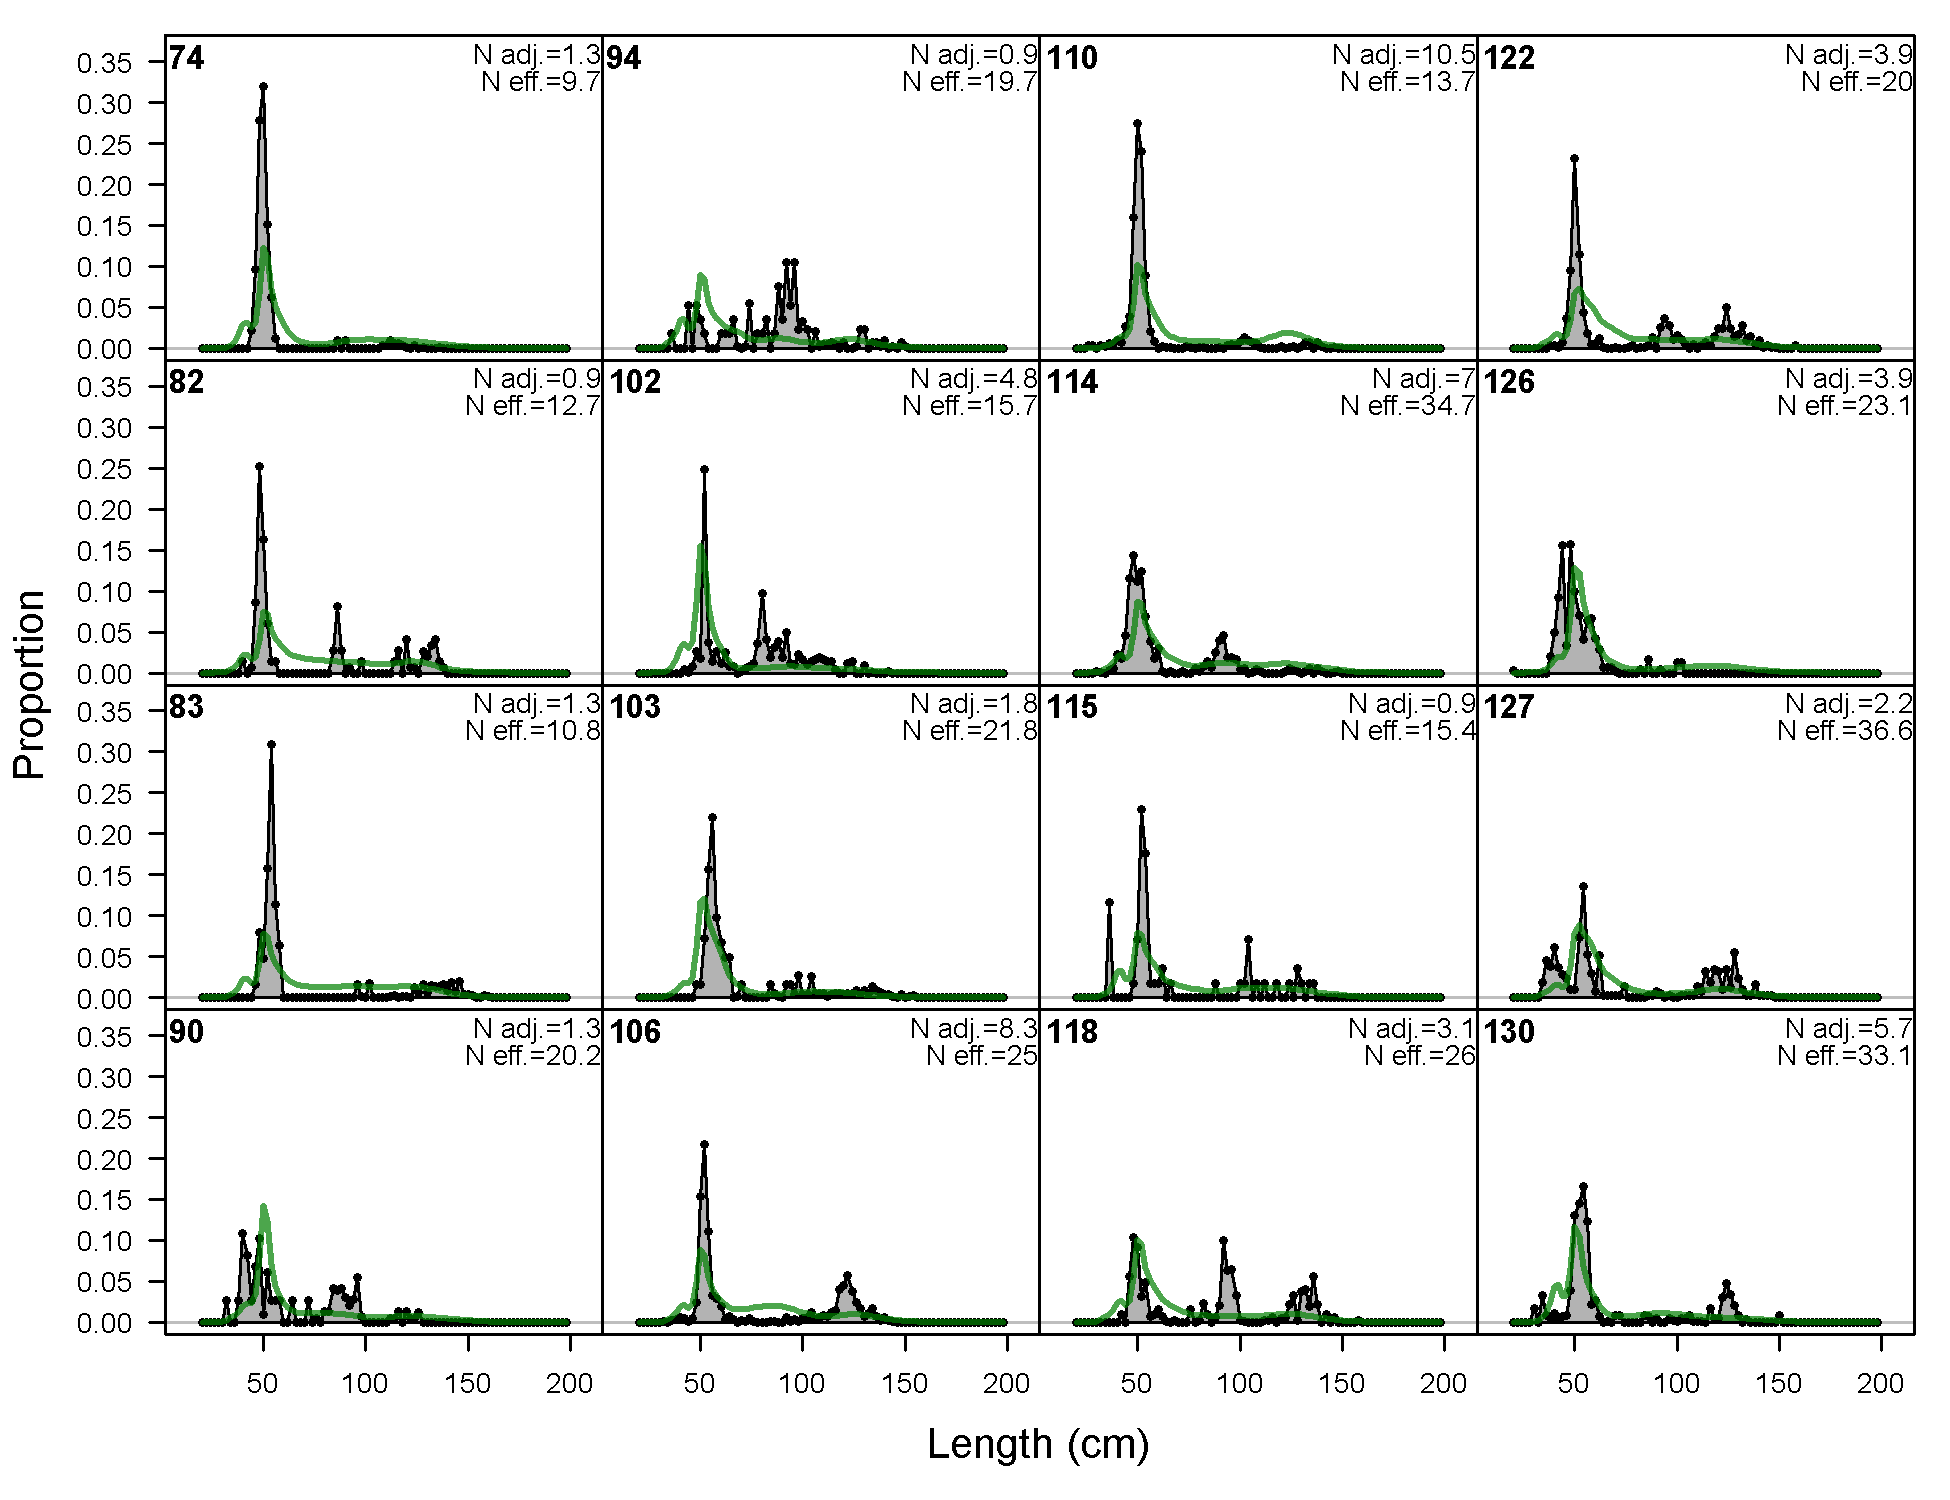
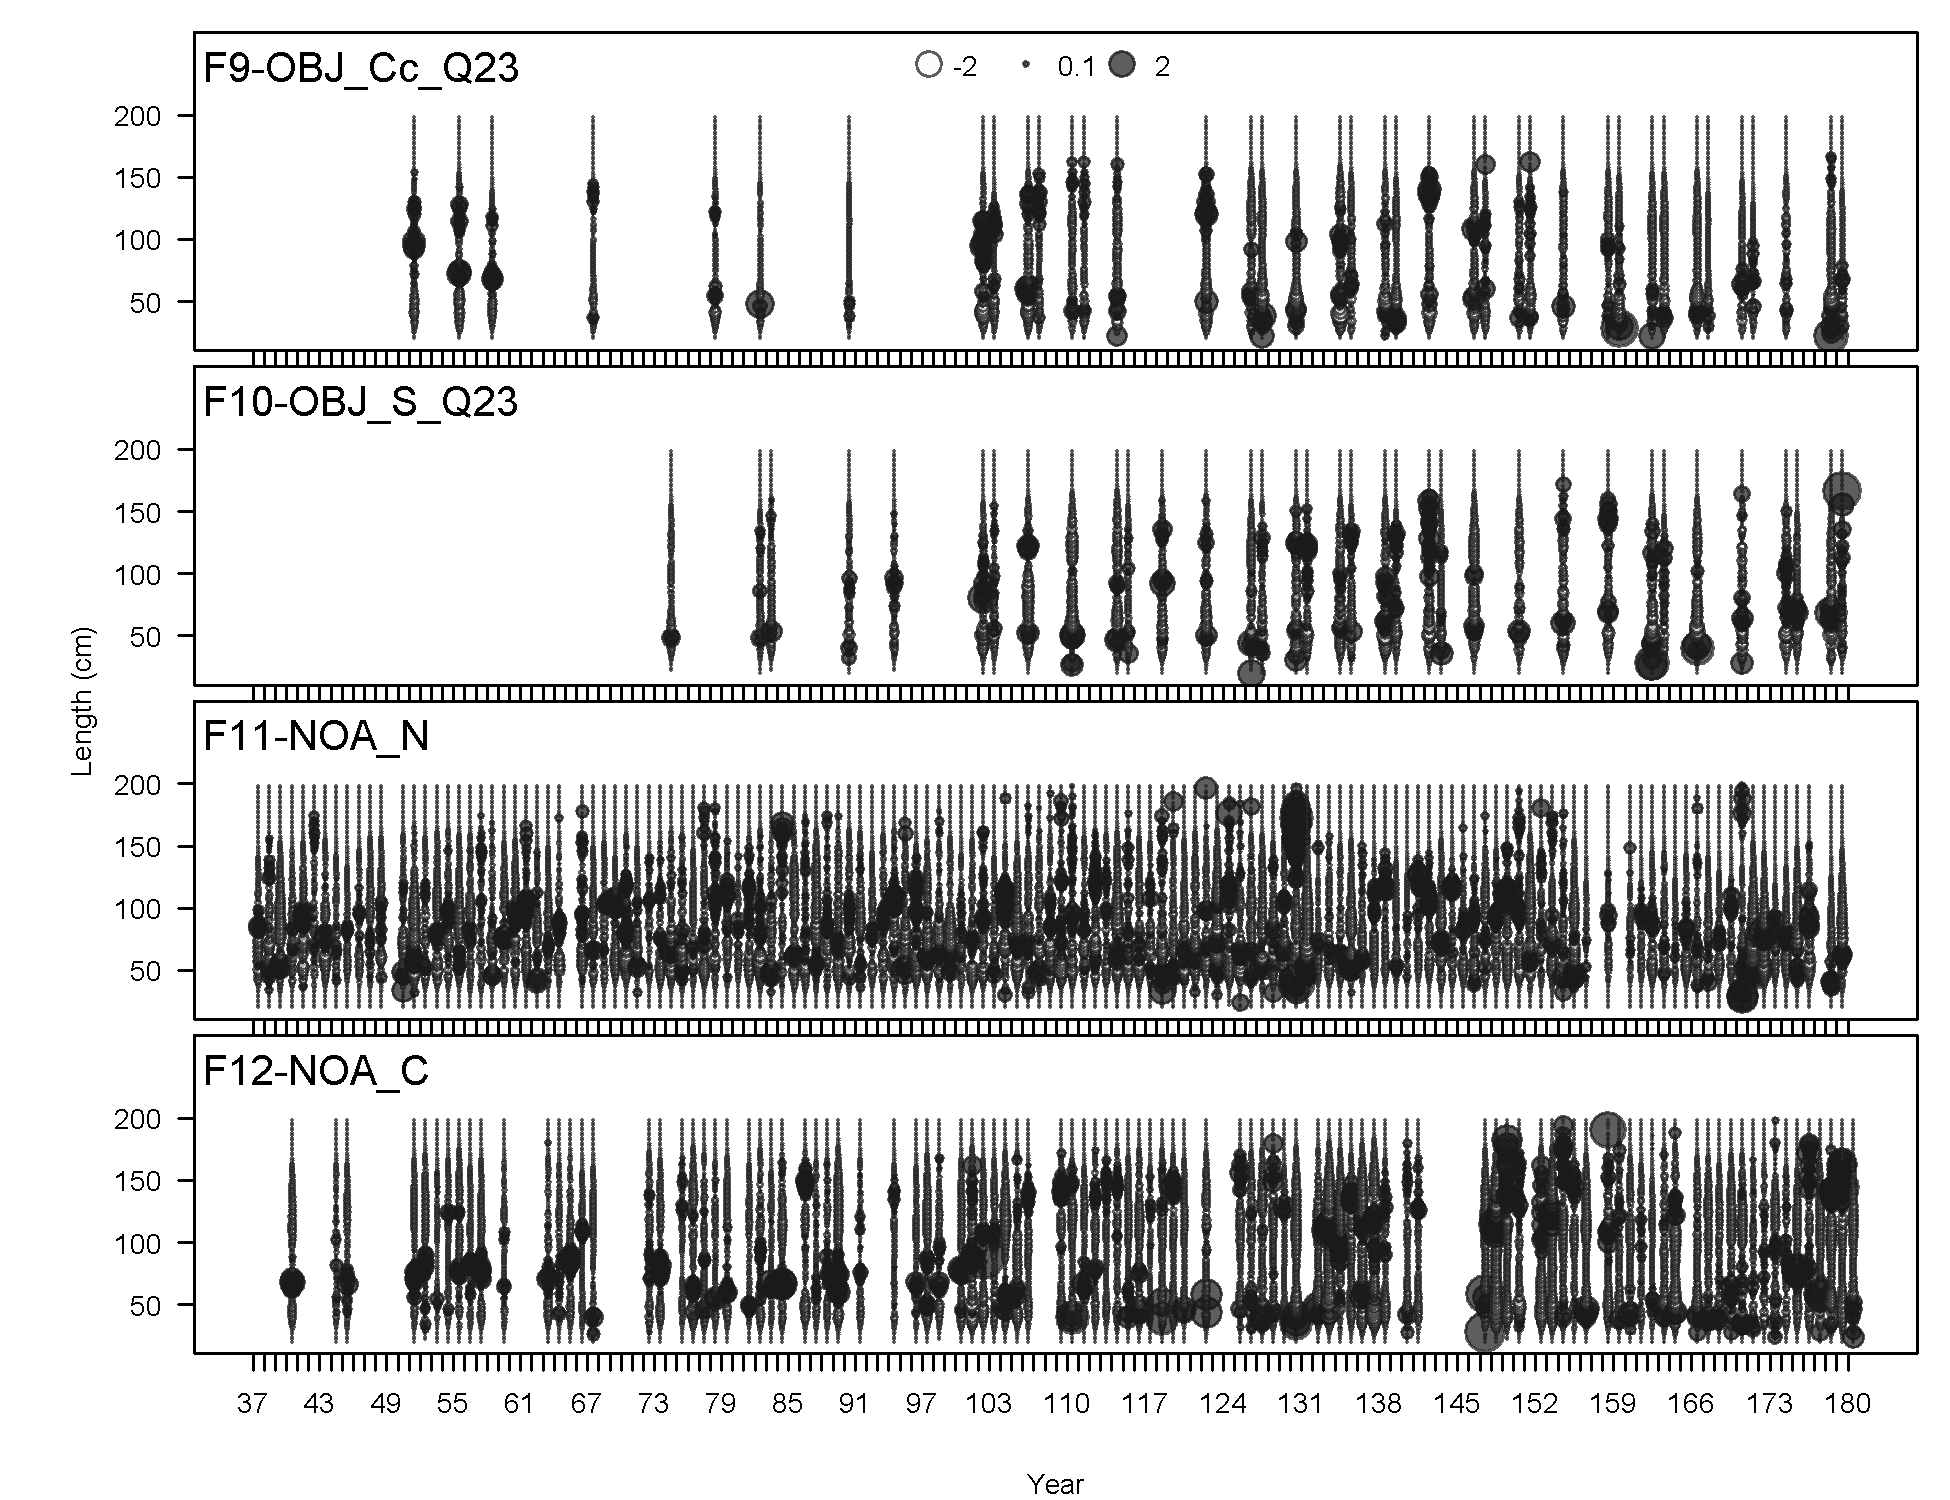
Length comps, whole catch, F9-OBJ_Cc_Q23 (plot 1 of 3).
'N adj.' is the input sample size after data-weighting adjustment. N eff. is the calculated effective sample size used in the McAllister-Iannelli tuning method.
file: comp_lenfit_flt9mkt0_page1.png
Length comps, whole catch, F9-OBJ_Cc_Q23 (plot 2 of 3)
file: comp_lenfit_flt9mkt0_page2.png
Length comps, whole catch, F9-OBJ_Cc_Q23 (plot 3 of 3)
file: comp_lenfit_flt9mkt0_page3.png
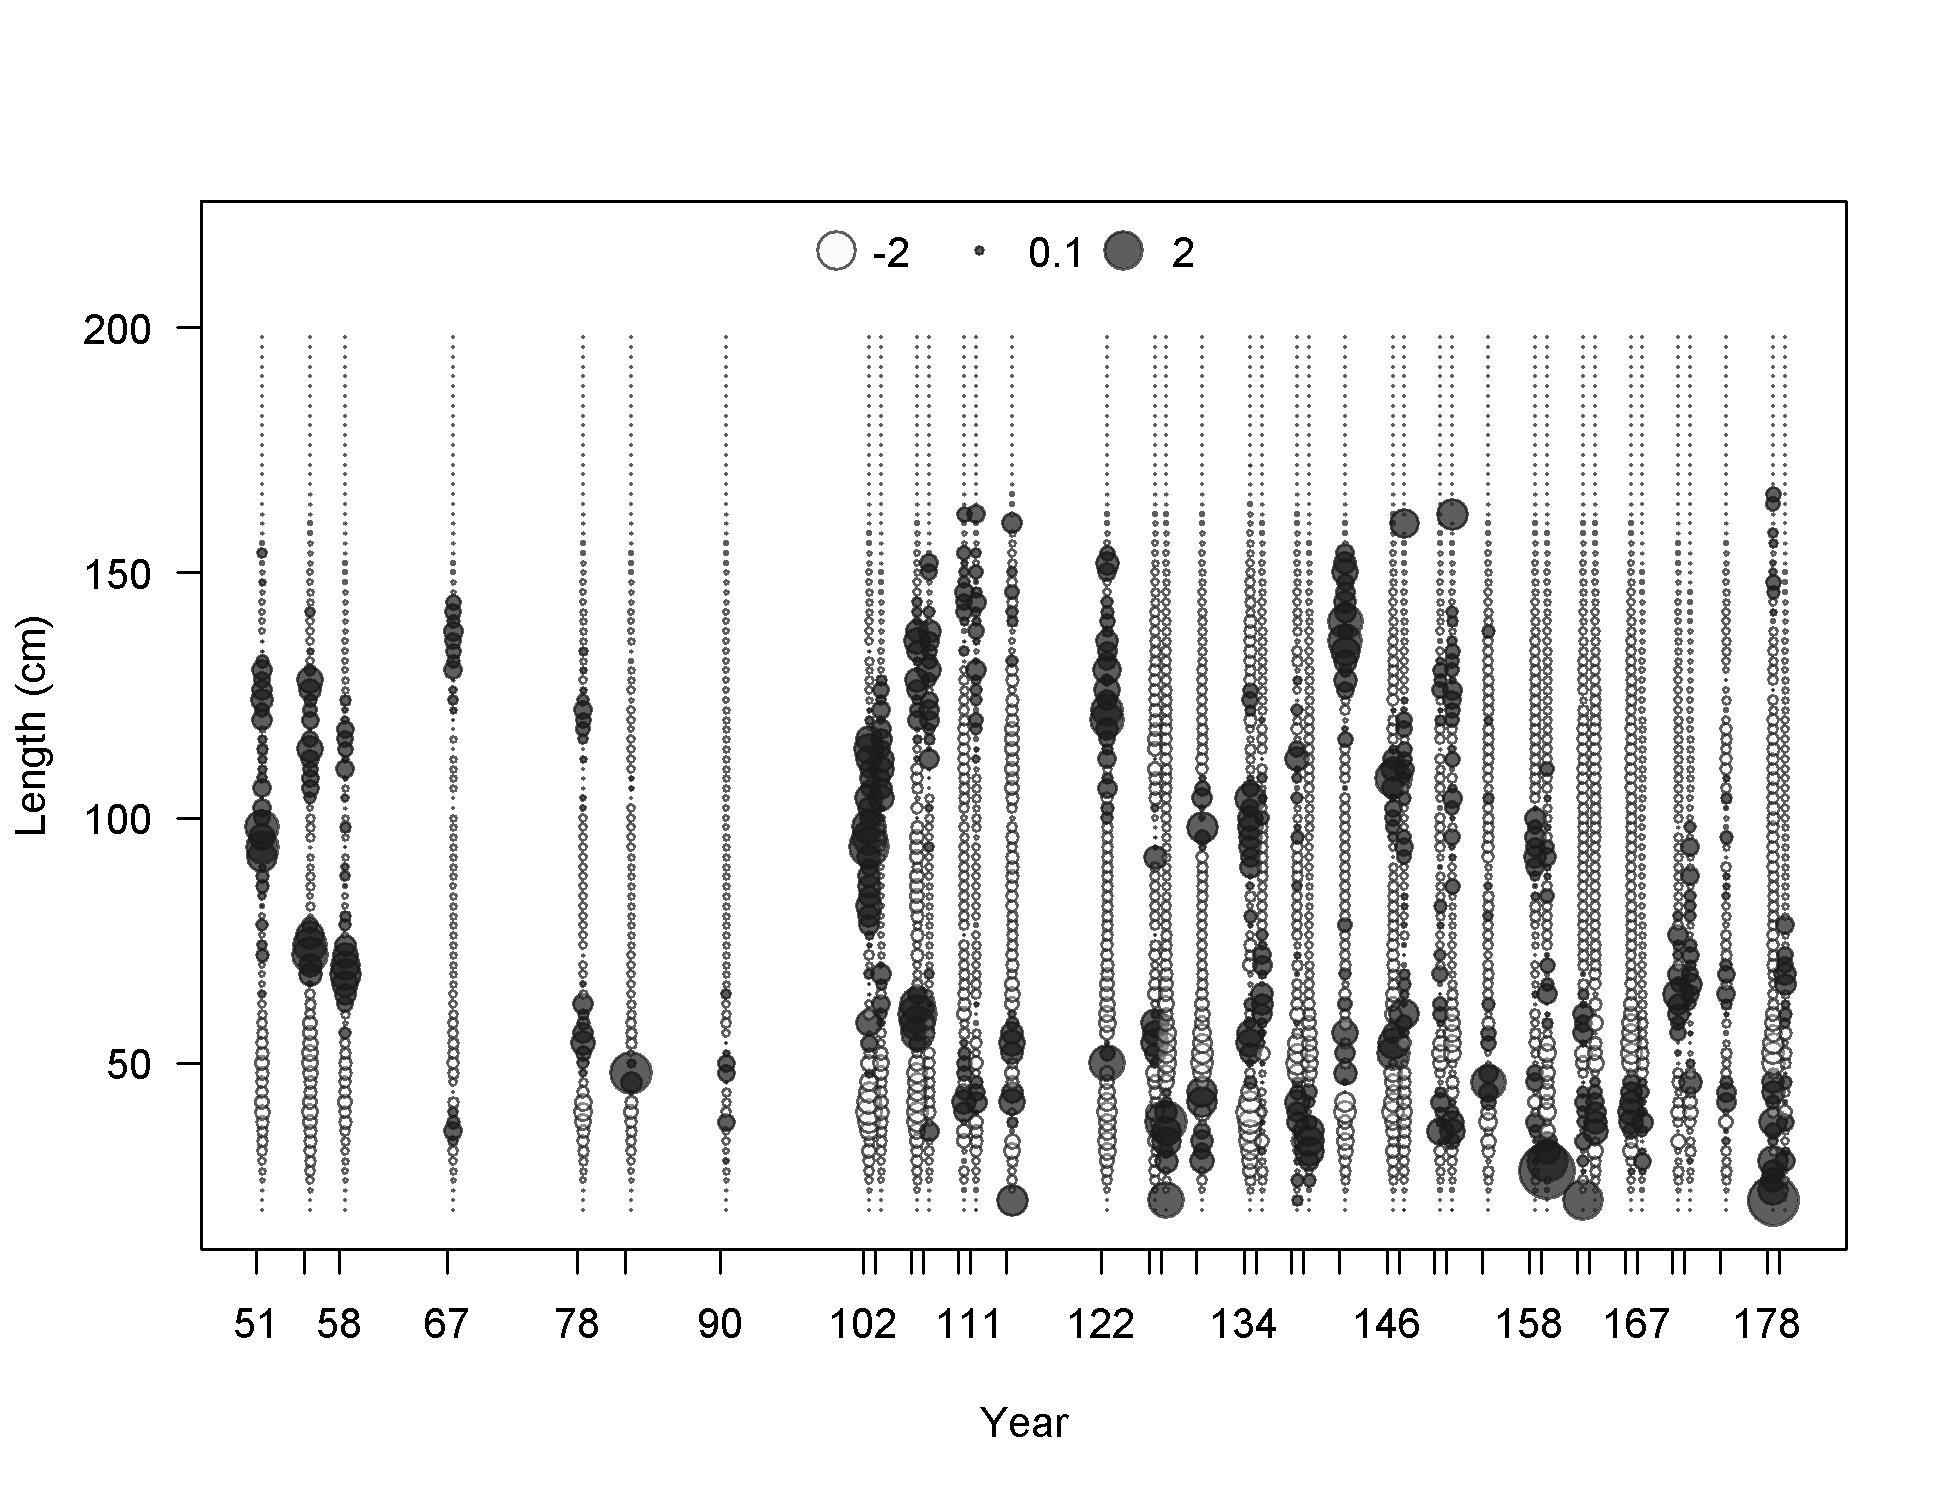
Pearson residuals, whole catch, F9-OBJ_Cc_Q23 (max=4.16) (plot 3 of 3)
Closed bubbles are positive residuals (observed > expected) and open bubbles are negative residuals (observed < expected).
file: comp_lenfit_residsflt9mkt0_page3.png
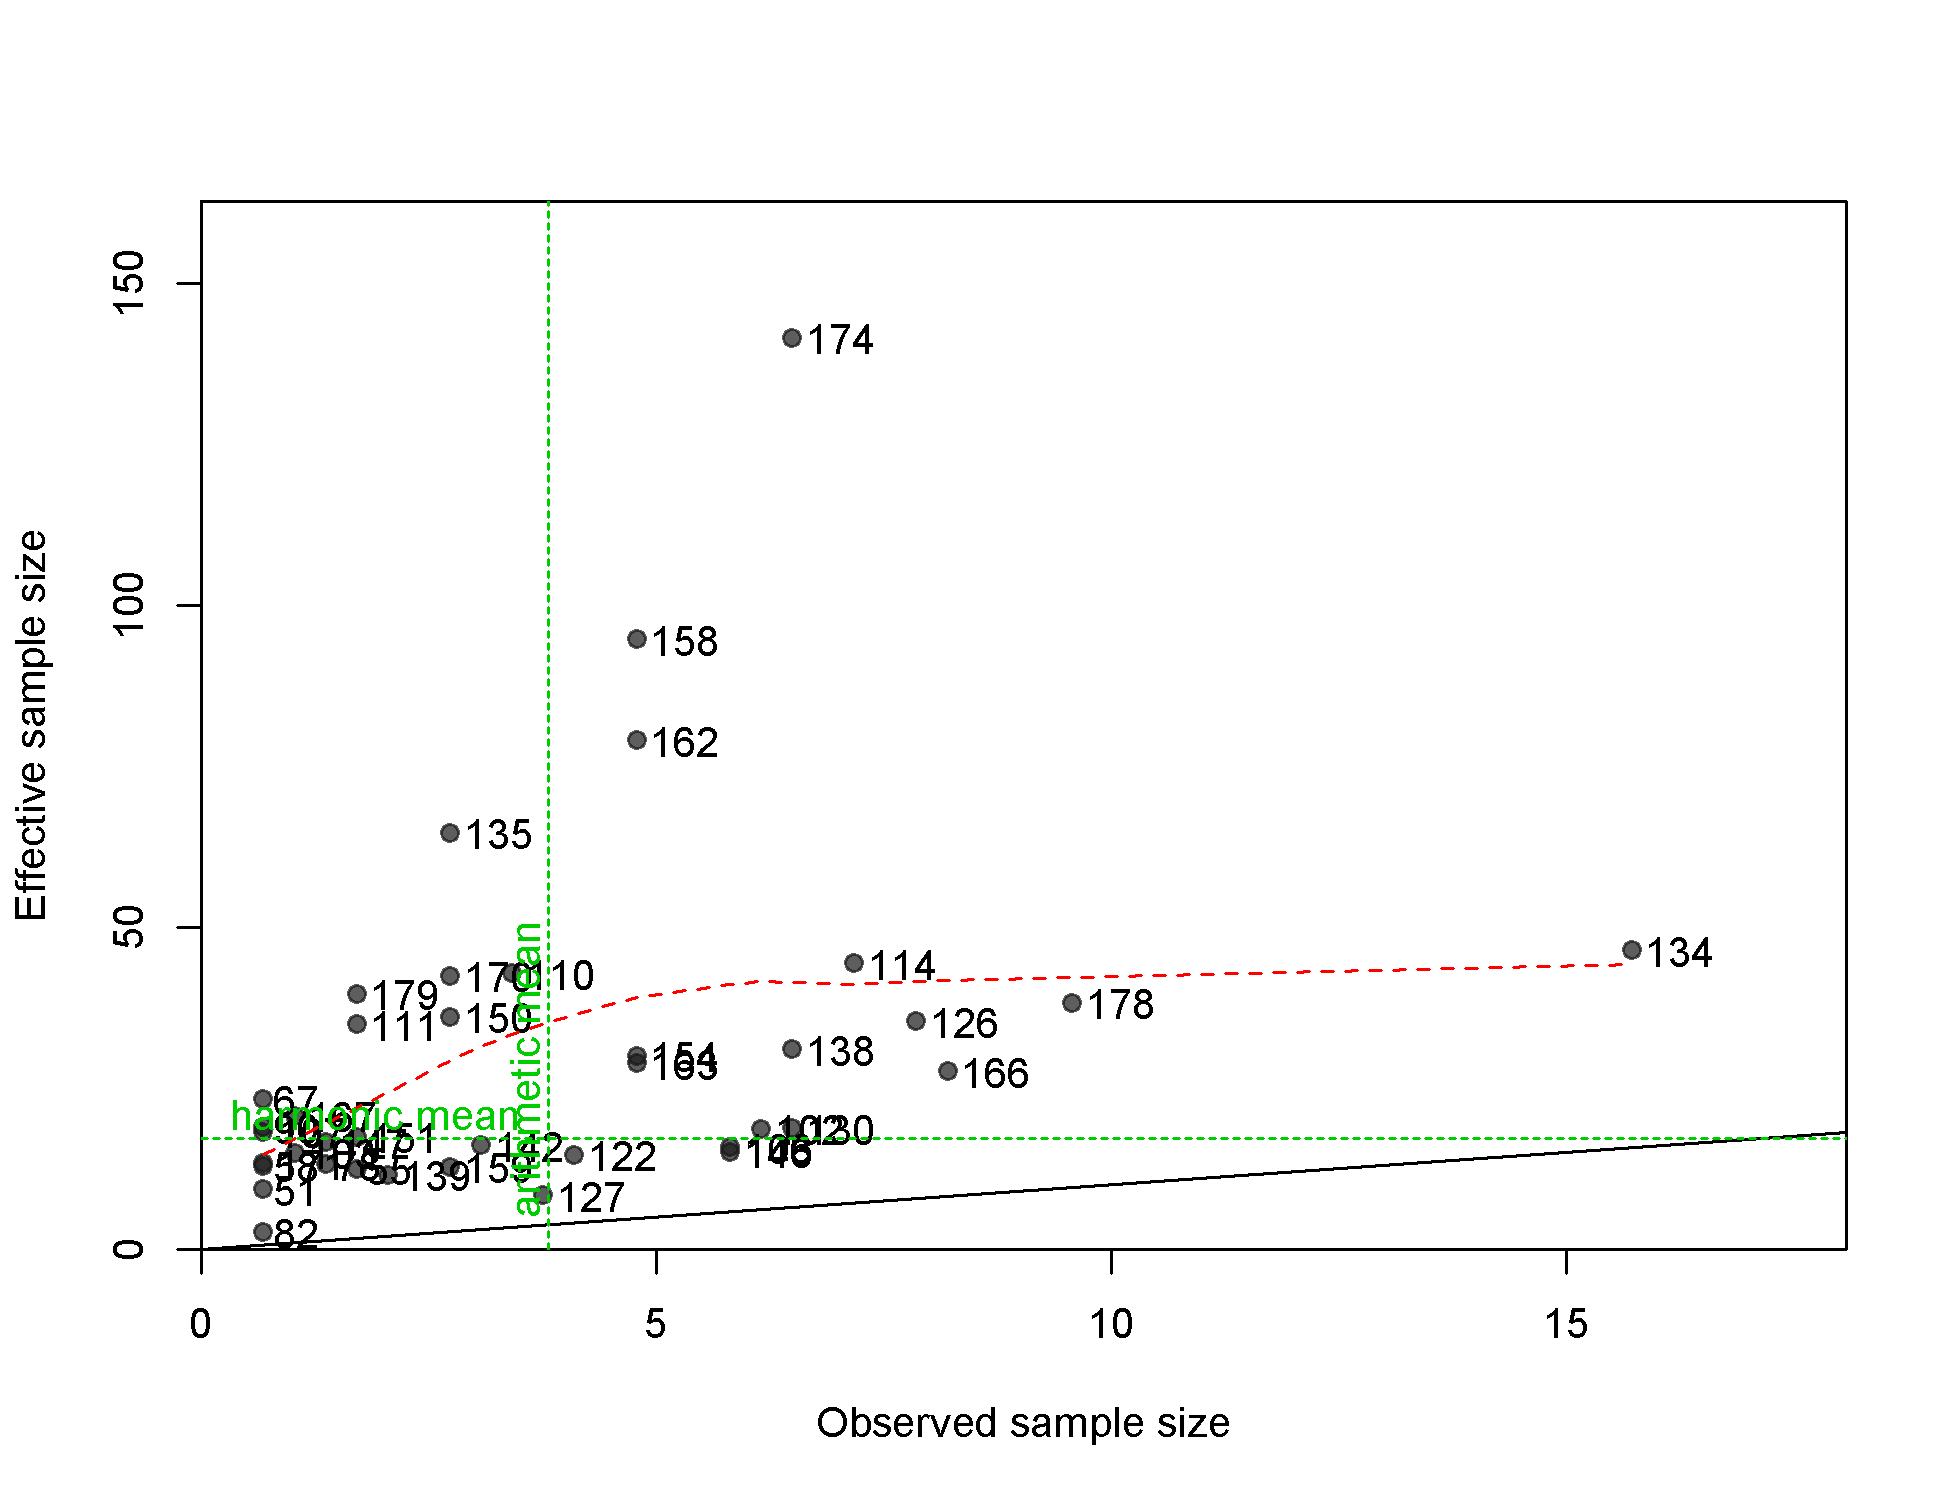
N-EffN comparison, Length comps, whole catch, F9-OBJ_Cc_Q23
file: comp_lenfit_sampsize_flt9mkt0.png
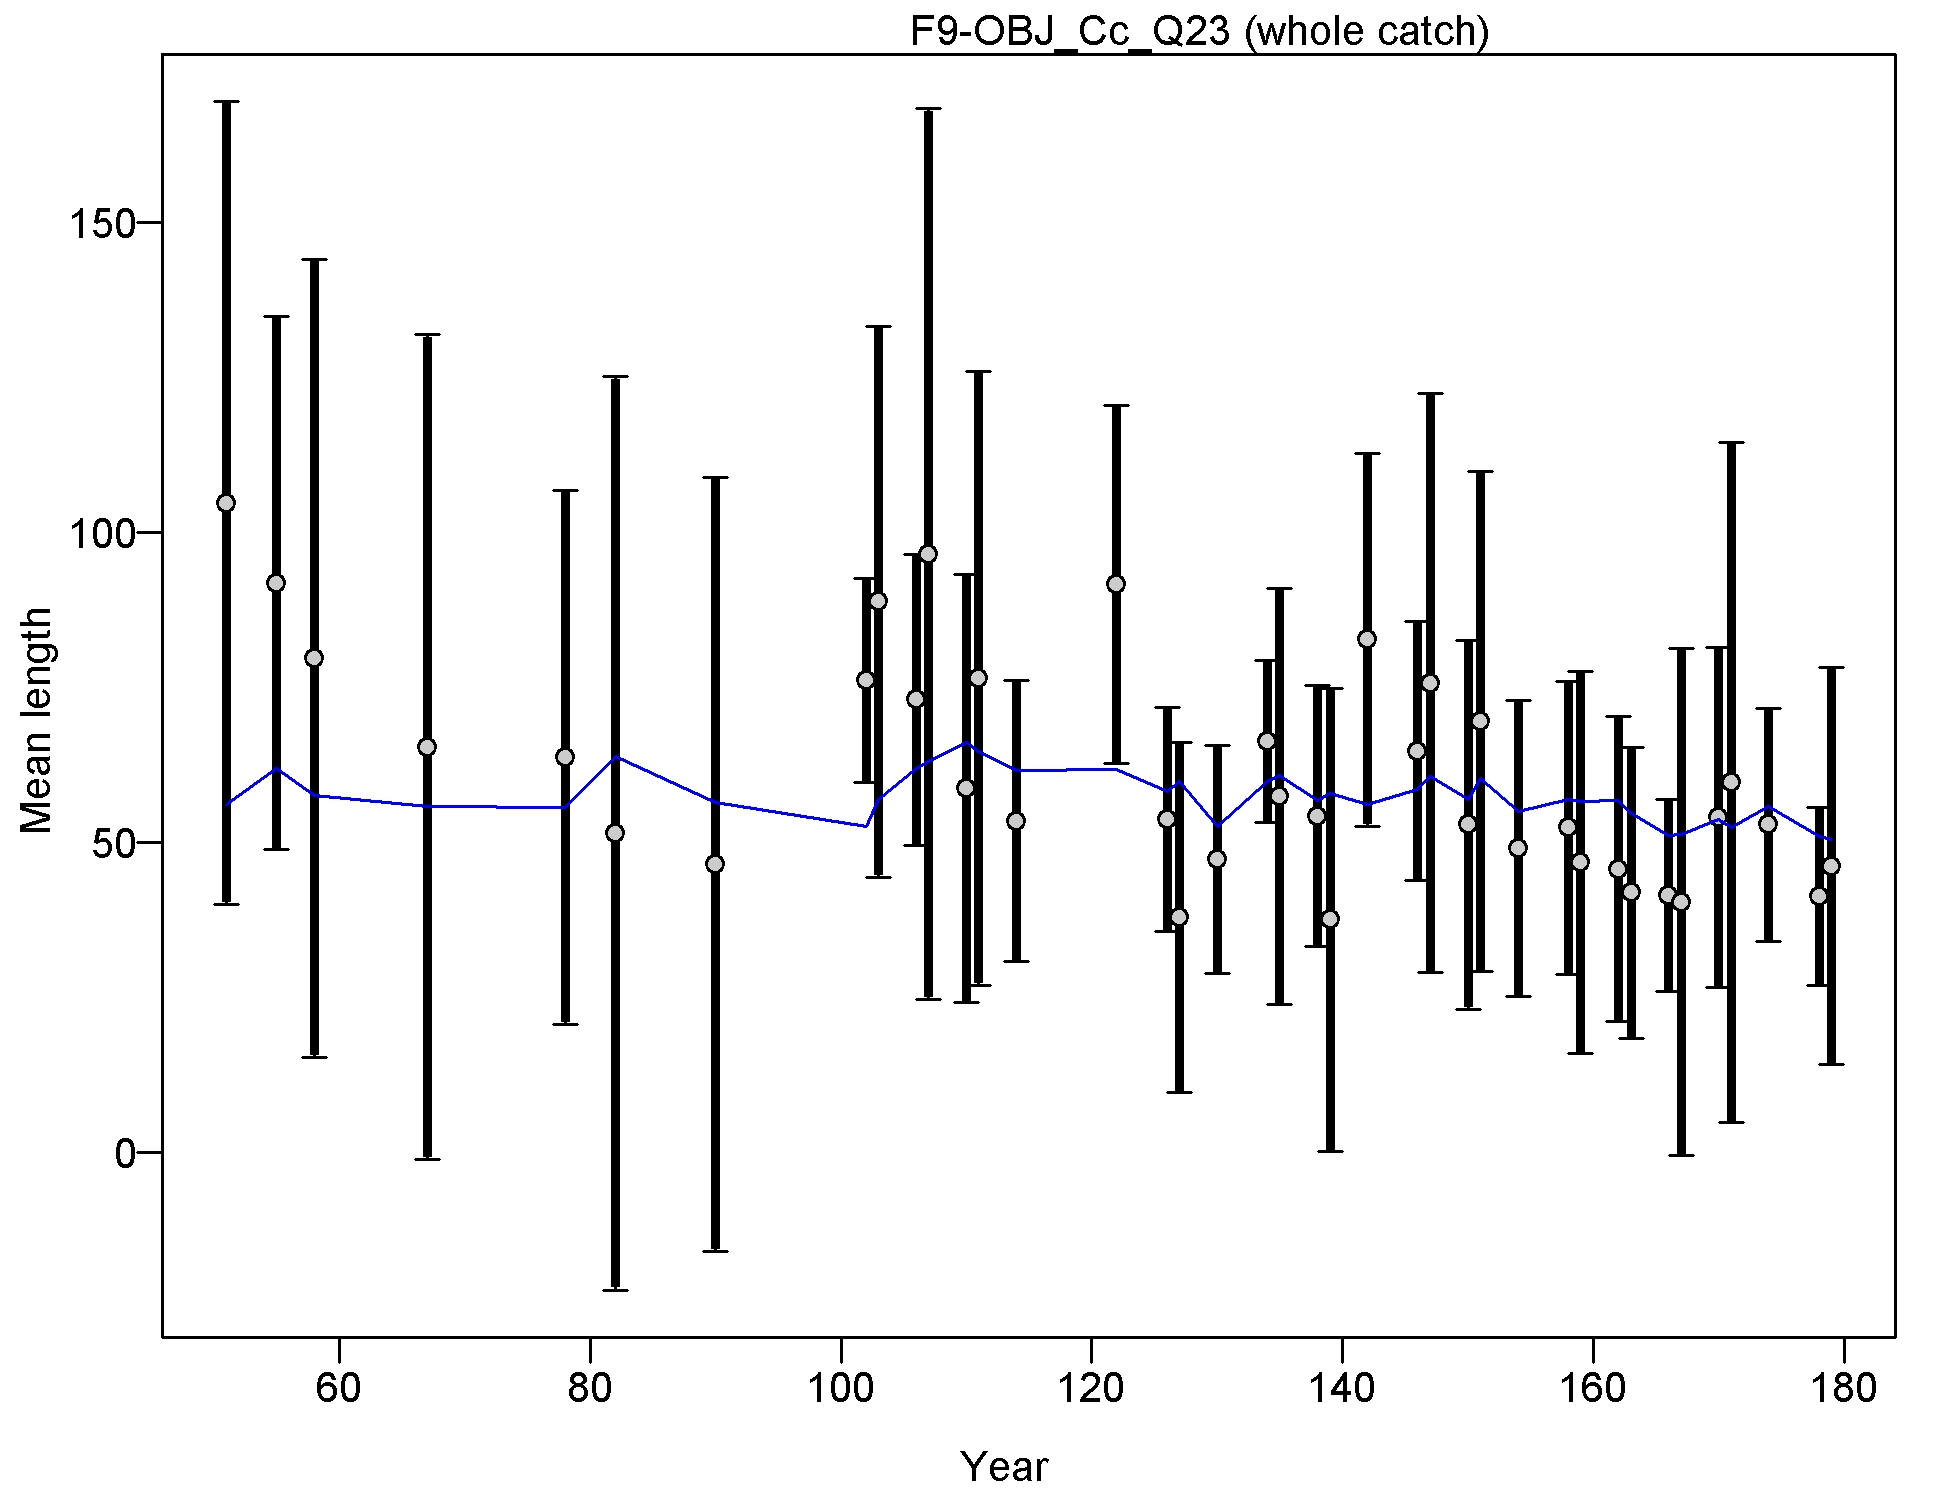
Mean length for F9-OBJ_Cc_Q23 with 95% confidence intervals based on current samples sizes.
Francis data weighting method TA1.8: thinner intervals (with capped ends) show result of further adjusting sample sizes based on suggested multiplier (with 95% interval) for len data from F9-OBJ_Cc_Q23:
0.9887 (0.6921-1.7696)
For more info, see
Francis, R.I.C.C. (2011). Data weighting in statistical fisheries stock assessment models. Can. J. Fish. Aquat. Sci. 68: 1124-1138. https://doi.org/10.1139/f2011-025
file: comp_lenfit_data_weighting_TA1.8_F9-OBJ_Cc_Q23.png
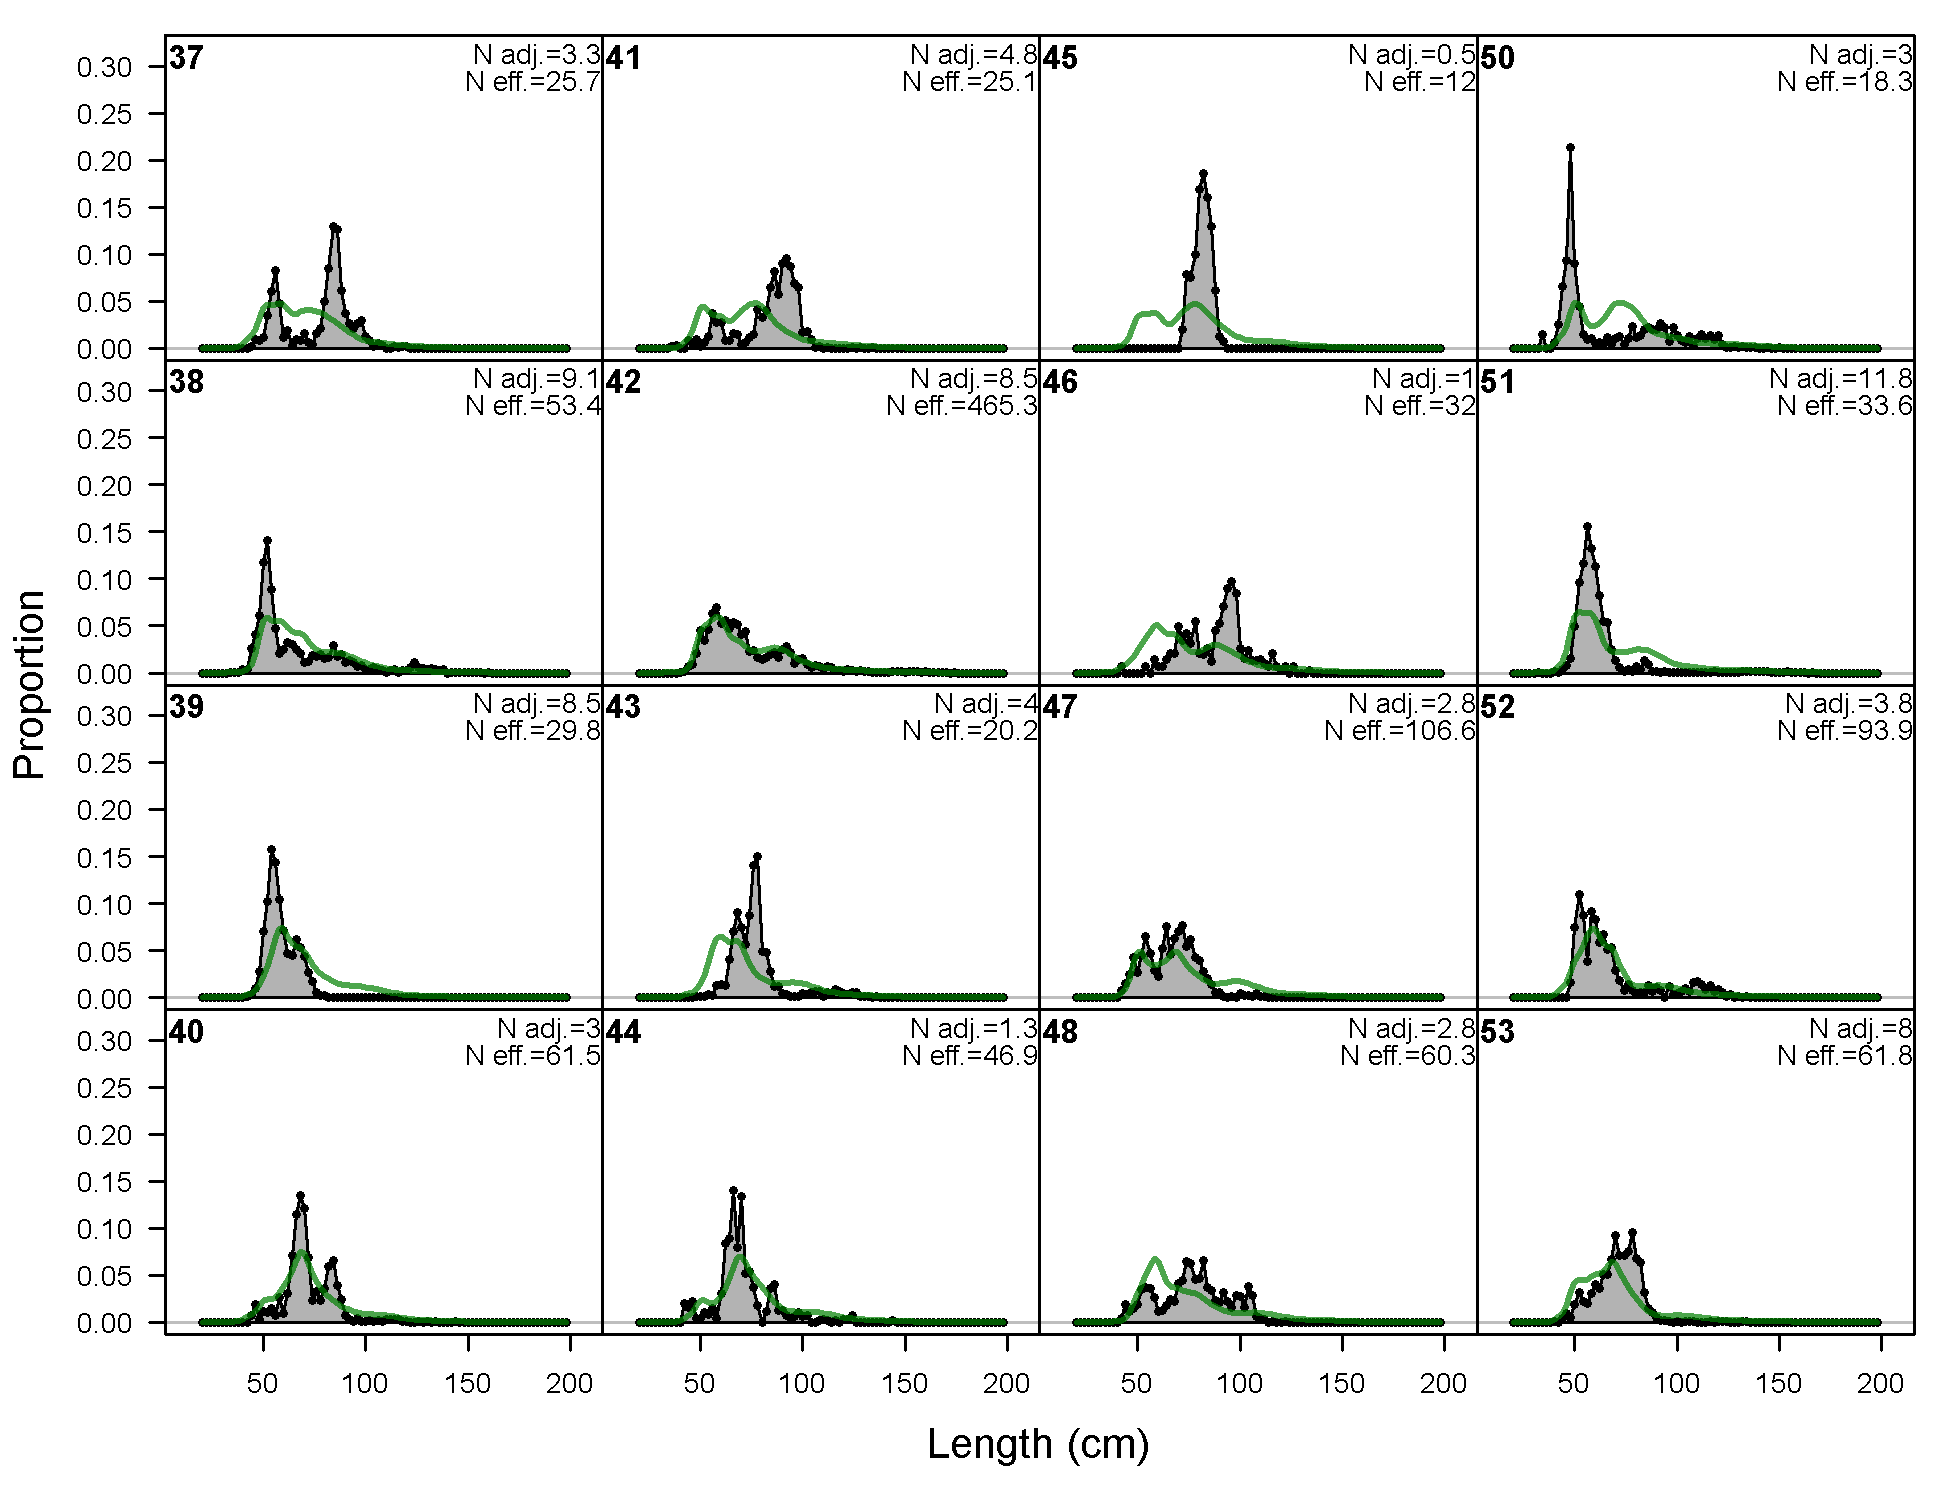
Length comps, whole catch, F10-OBJ_S_Q23 (plot 1 of 3).
'N adj.' is the input sample size after data-weighting adjustment. N eff. is the calculated effective sample size used in the McAllister-Iannelli tuning method.
file: comp_lenfit_flt10mkt0_page1.png
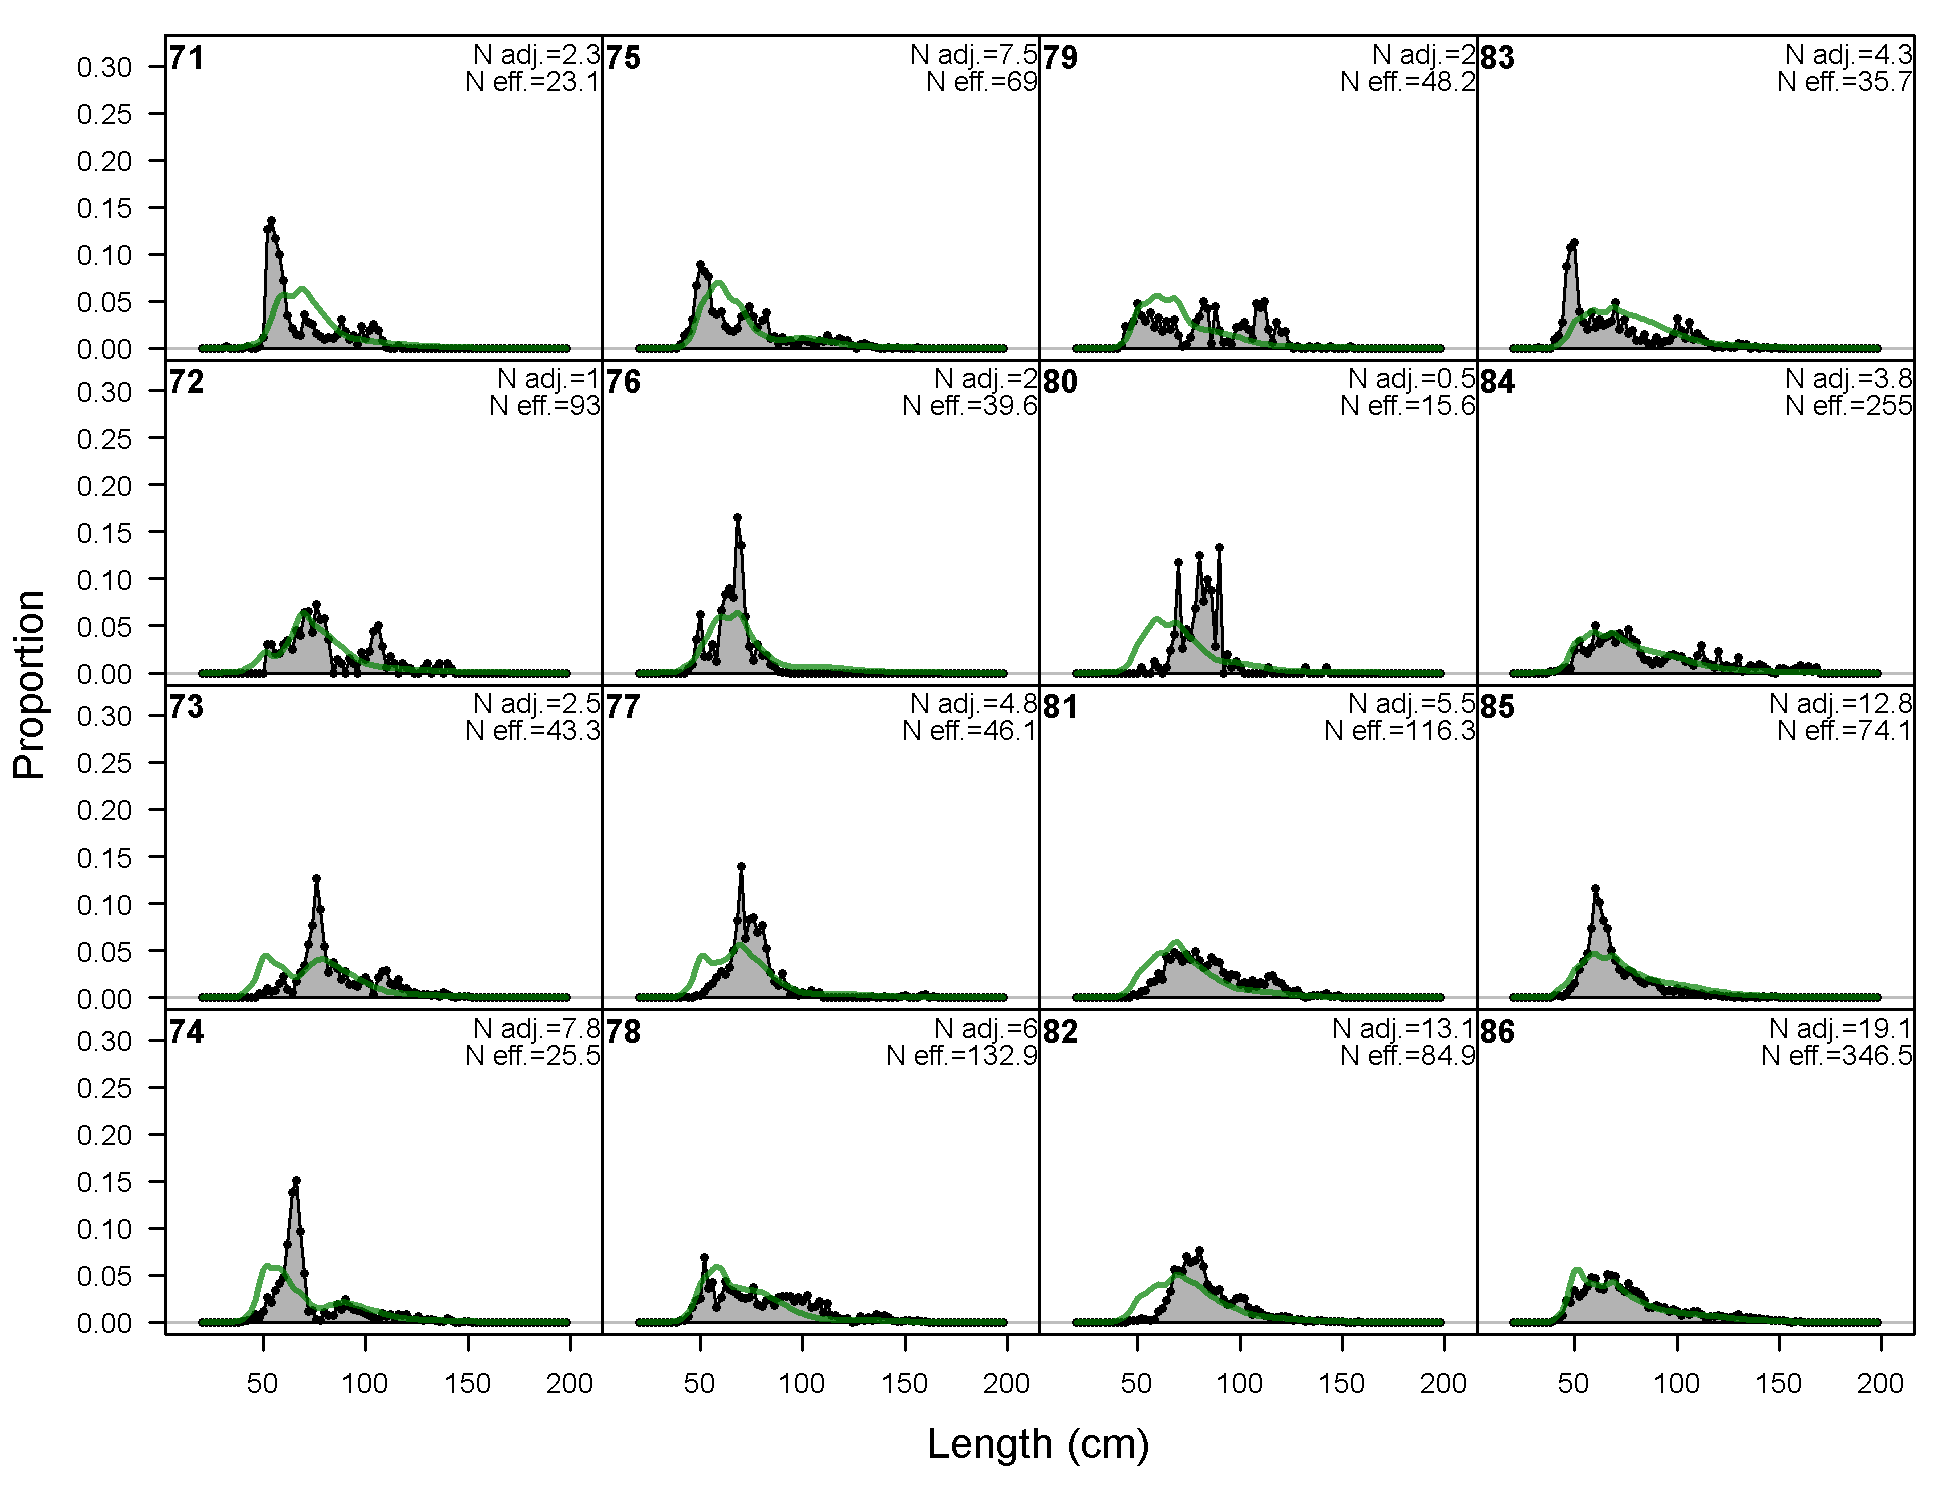
Length comps, whole catch, F10-OBJ_S_Q23 (plot 2 of 3)
file: comp_lenfit_flt10mkt0_page2.png
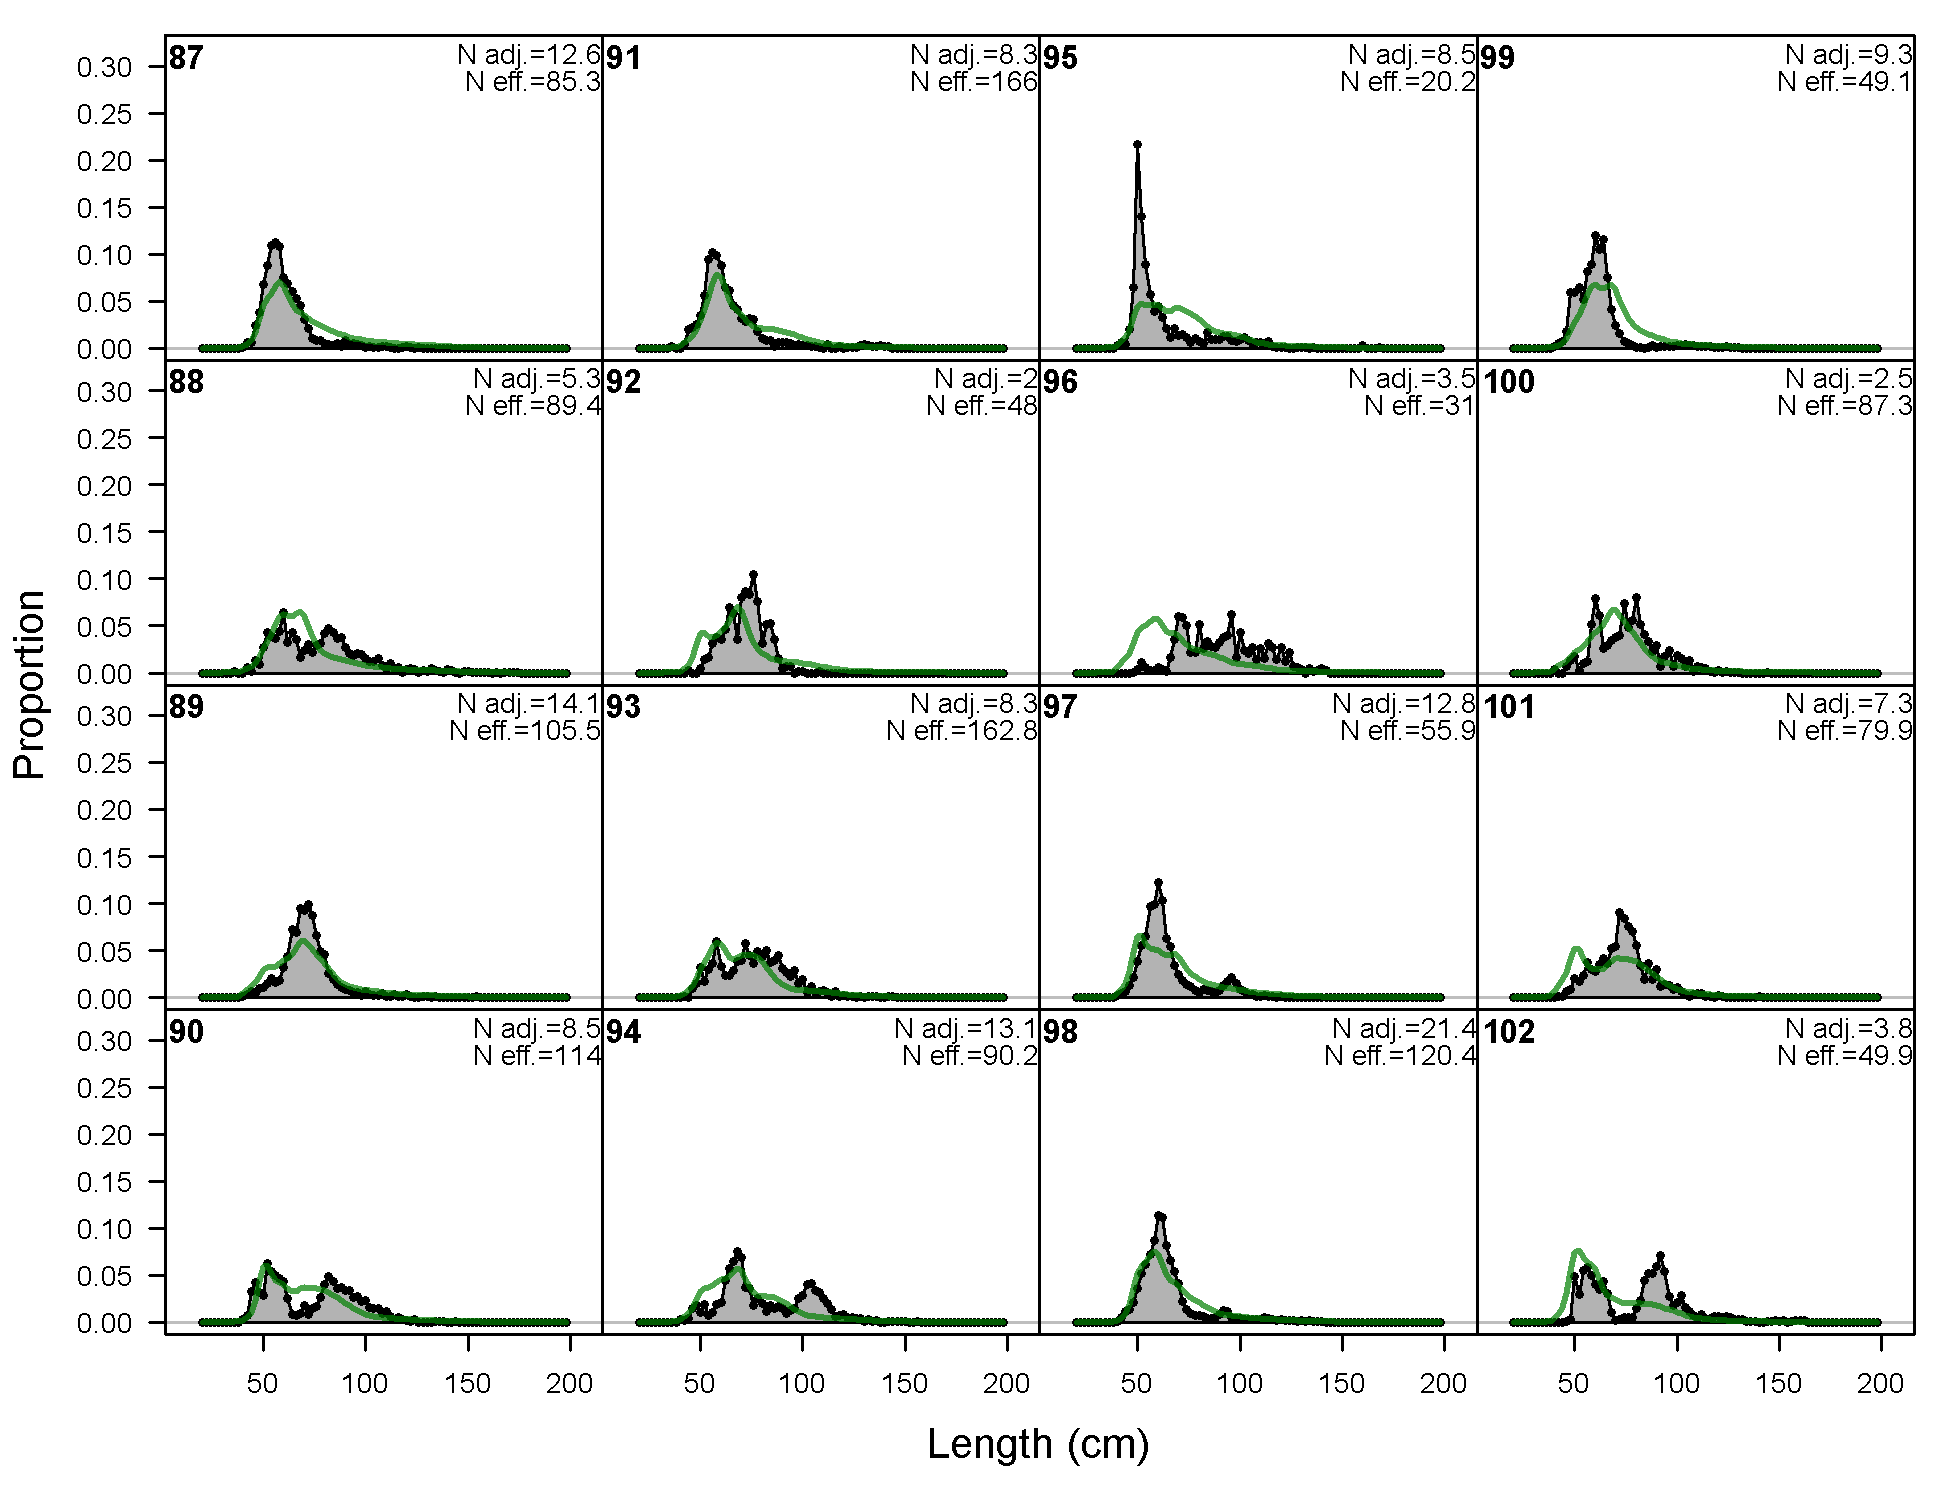
Length comps, whole catch, F10-OBJ_S_Q23 (plot 3 of 3)
file: comp_lenfit_flt10mkt0_page3.png
Pearson residuals, whole catch, F10-OBJ_S_Q23 (max=4.36) (plot 3 of 3)
Closed bubbles are positive residuals (observed > expected) and open bubbles are negative residuals (observed < expected).
file: comp_lenfit_residsflt10mkt0_page3.png
N-EffN comparison, Length comps, whole catch, F10-OBJ_S_Q23
file: comp_lenfit_sampsize_flt10mkt0.png
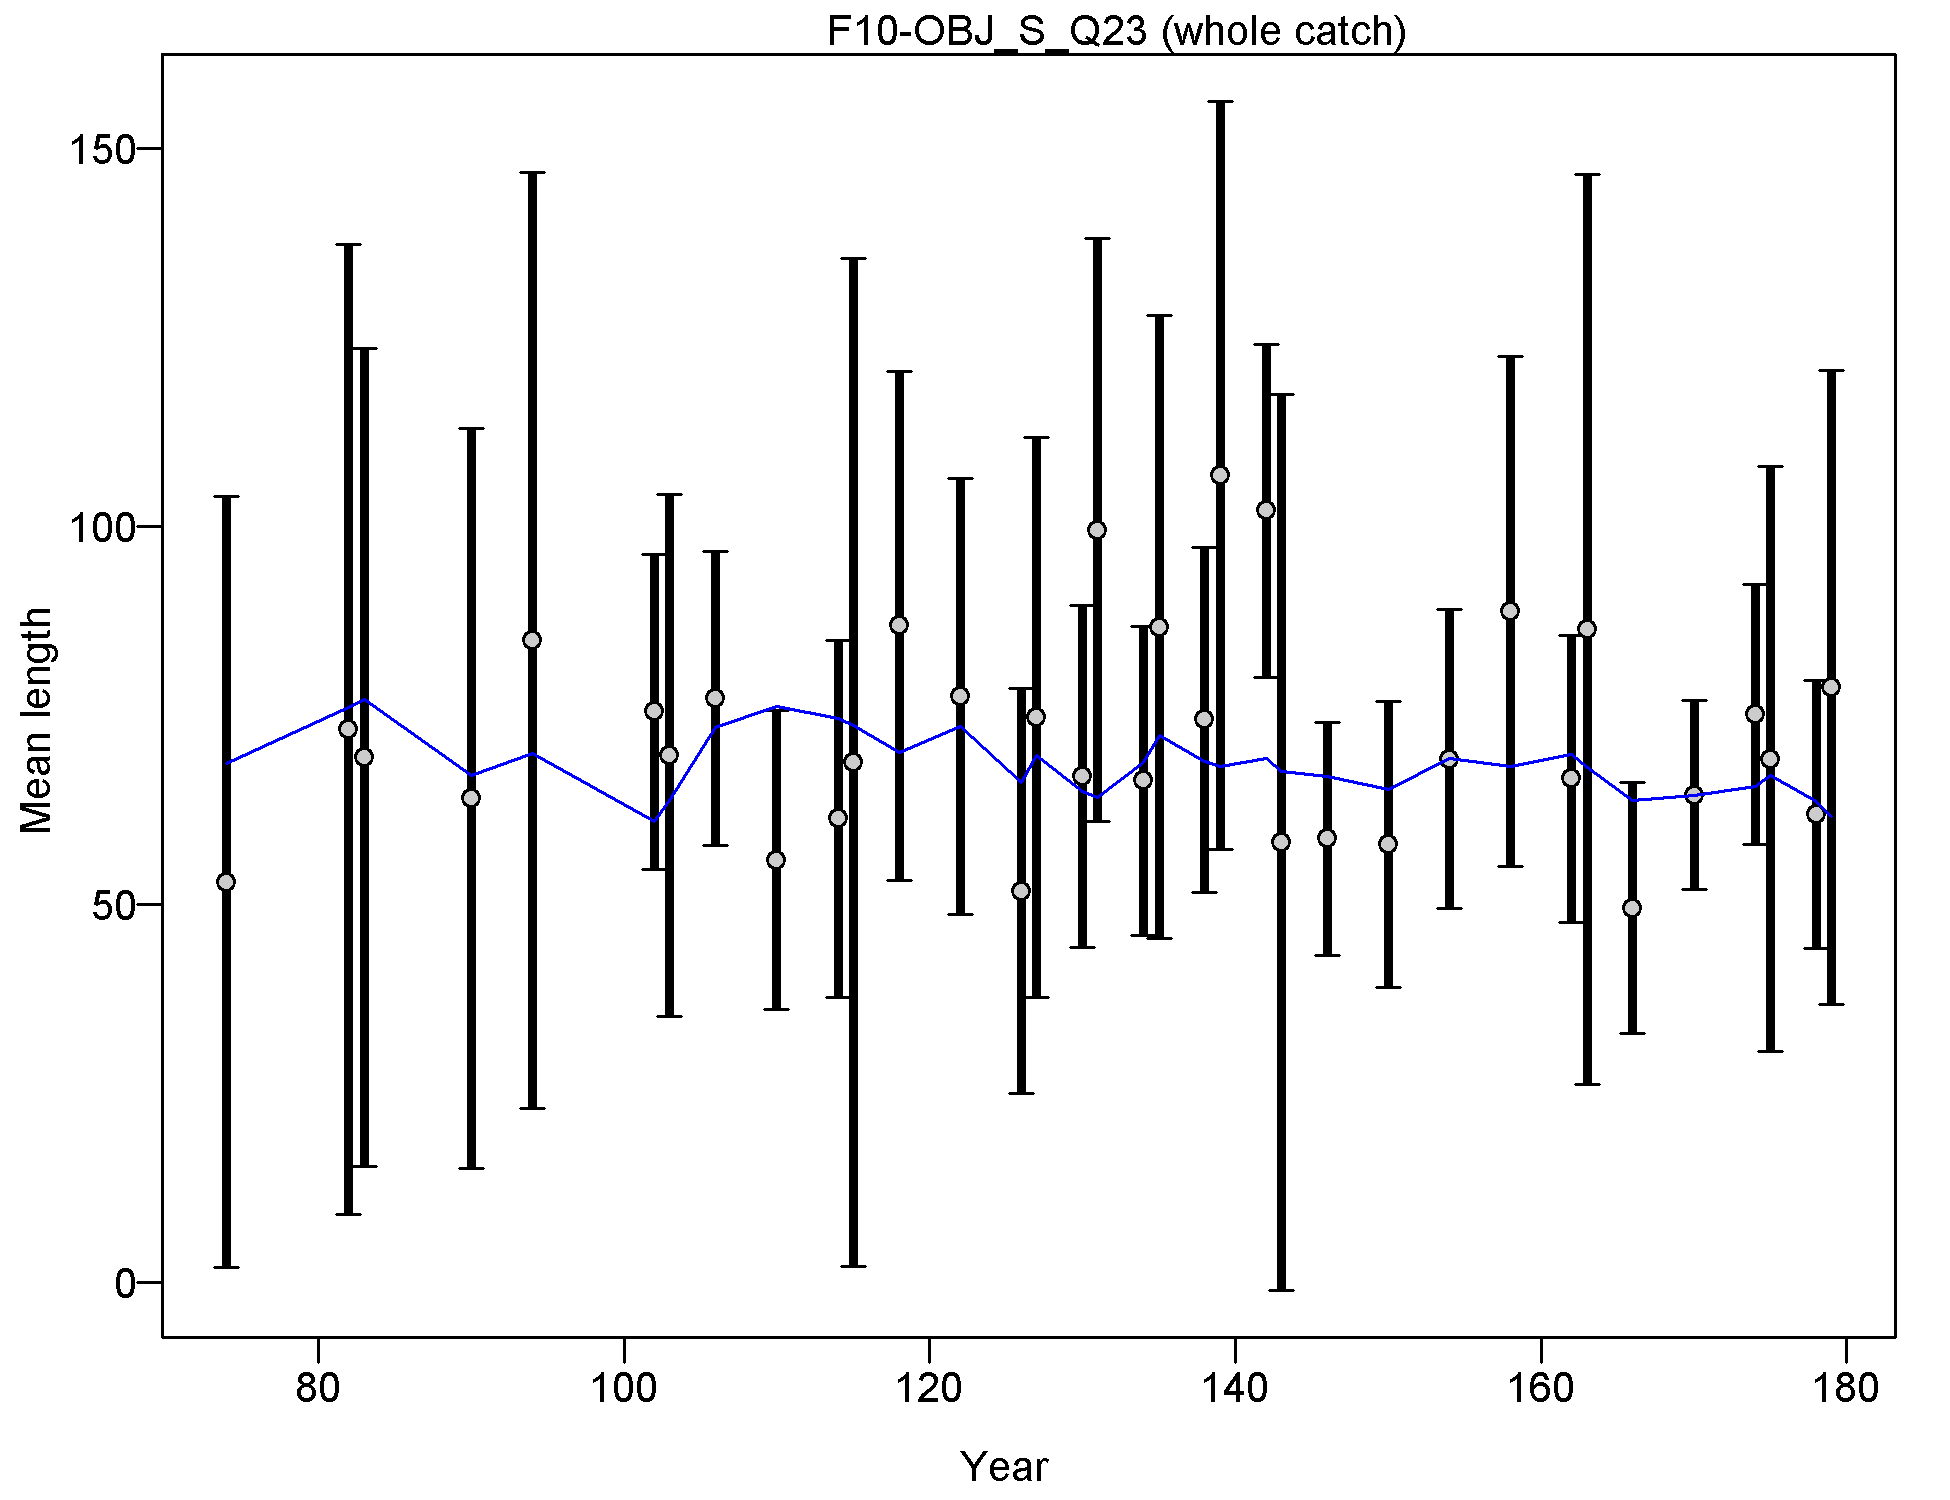
Mean length for F10-OBJ_S_Q23 with 95% confidence intervals based on current samples sizes.
Francis data weighting method TA1.8: thinner intervals (with capped ends) show result of further adjusting sample sizes based on suggested multiplier (with 95% interval) for len data from F10-OBJ_S_Q23:
0.9967 (0.6471-1.9846)
For more info, see
Francis, R.I.C.C. (2011). Data weighting in statistical fisheries stock assessment models. Can. J. Fish. Aquat. Sci. 68: 1124-1138. https://doi.org/10.1139/f2011-025
file: comp_lenfit_data_weighting_TA1.8_F10-OBJ_S_Q23.png
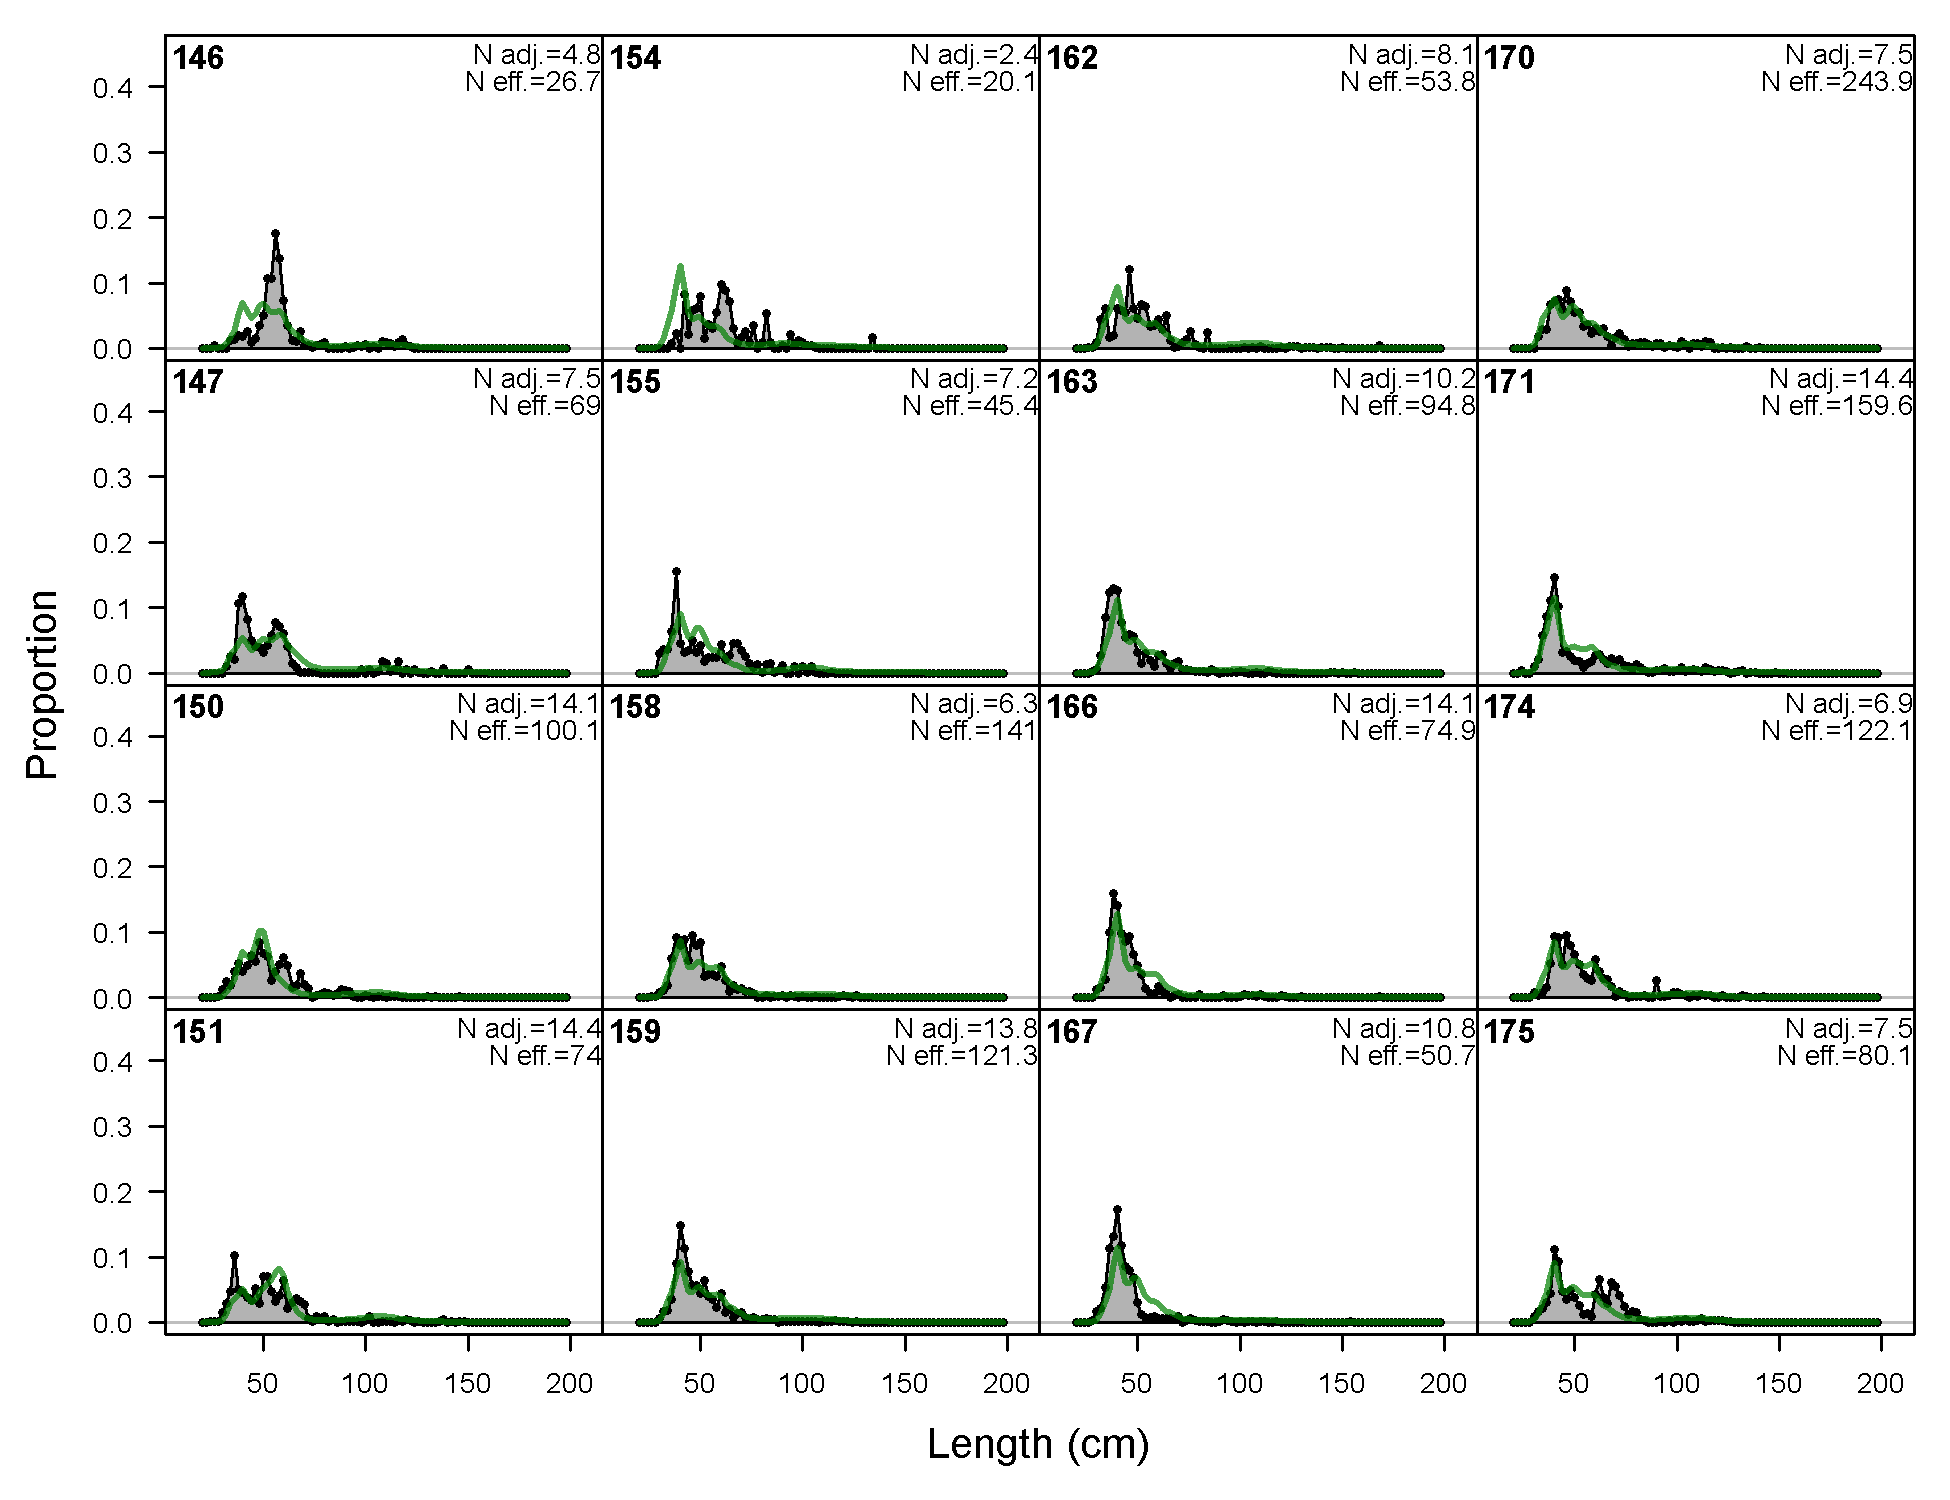
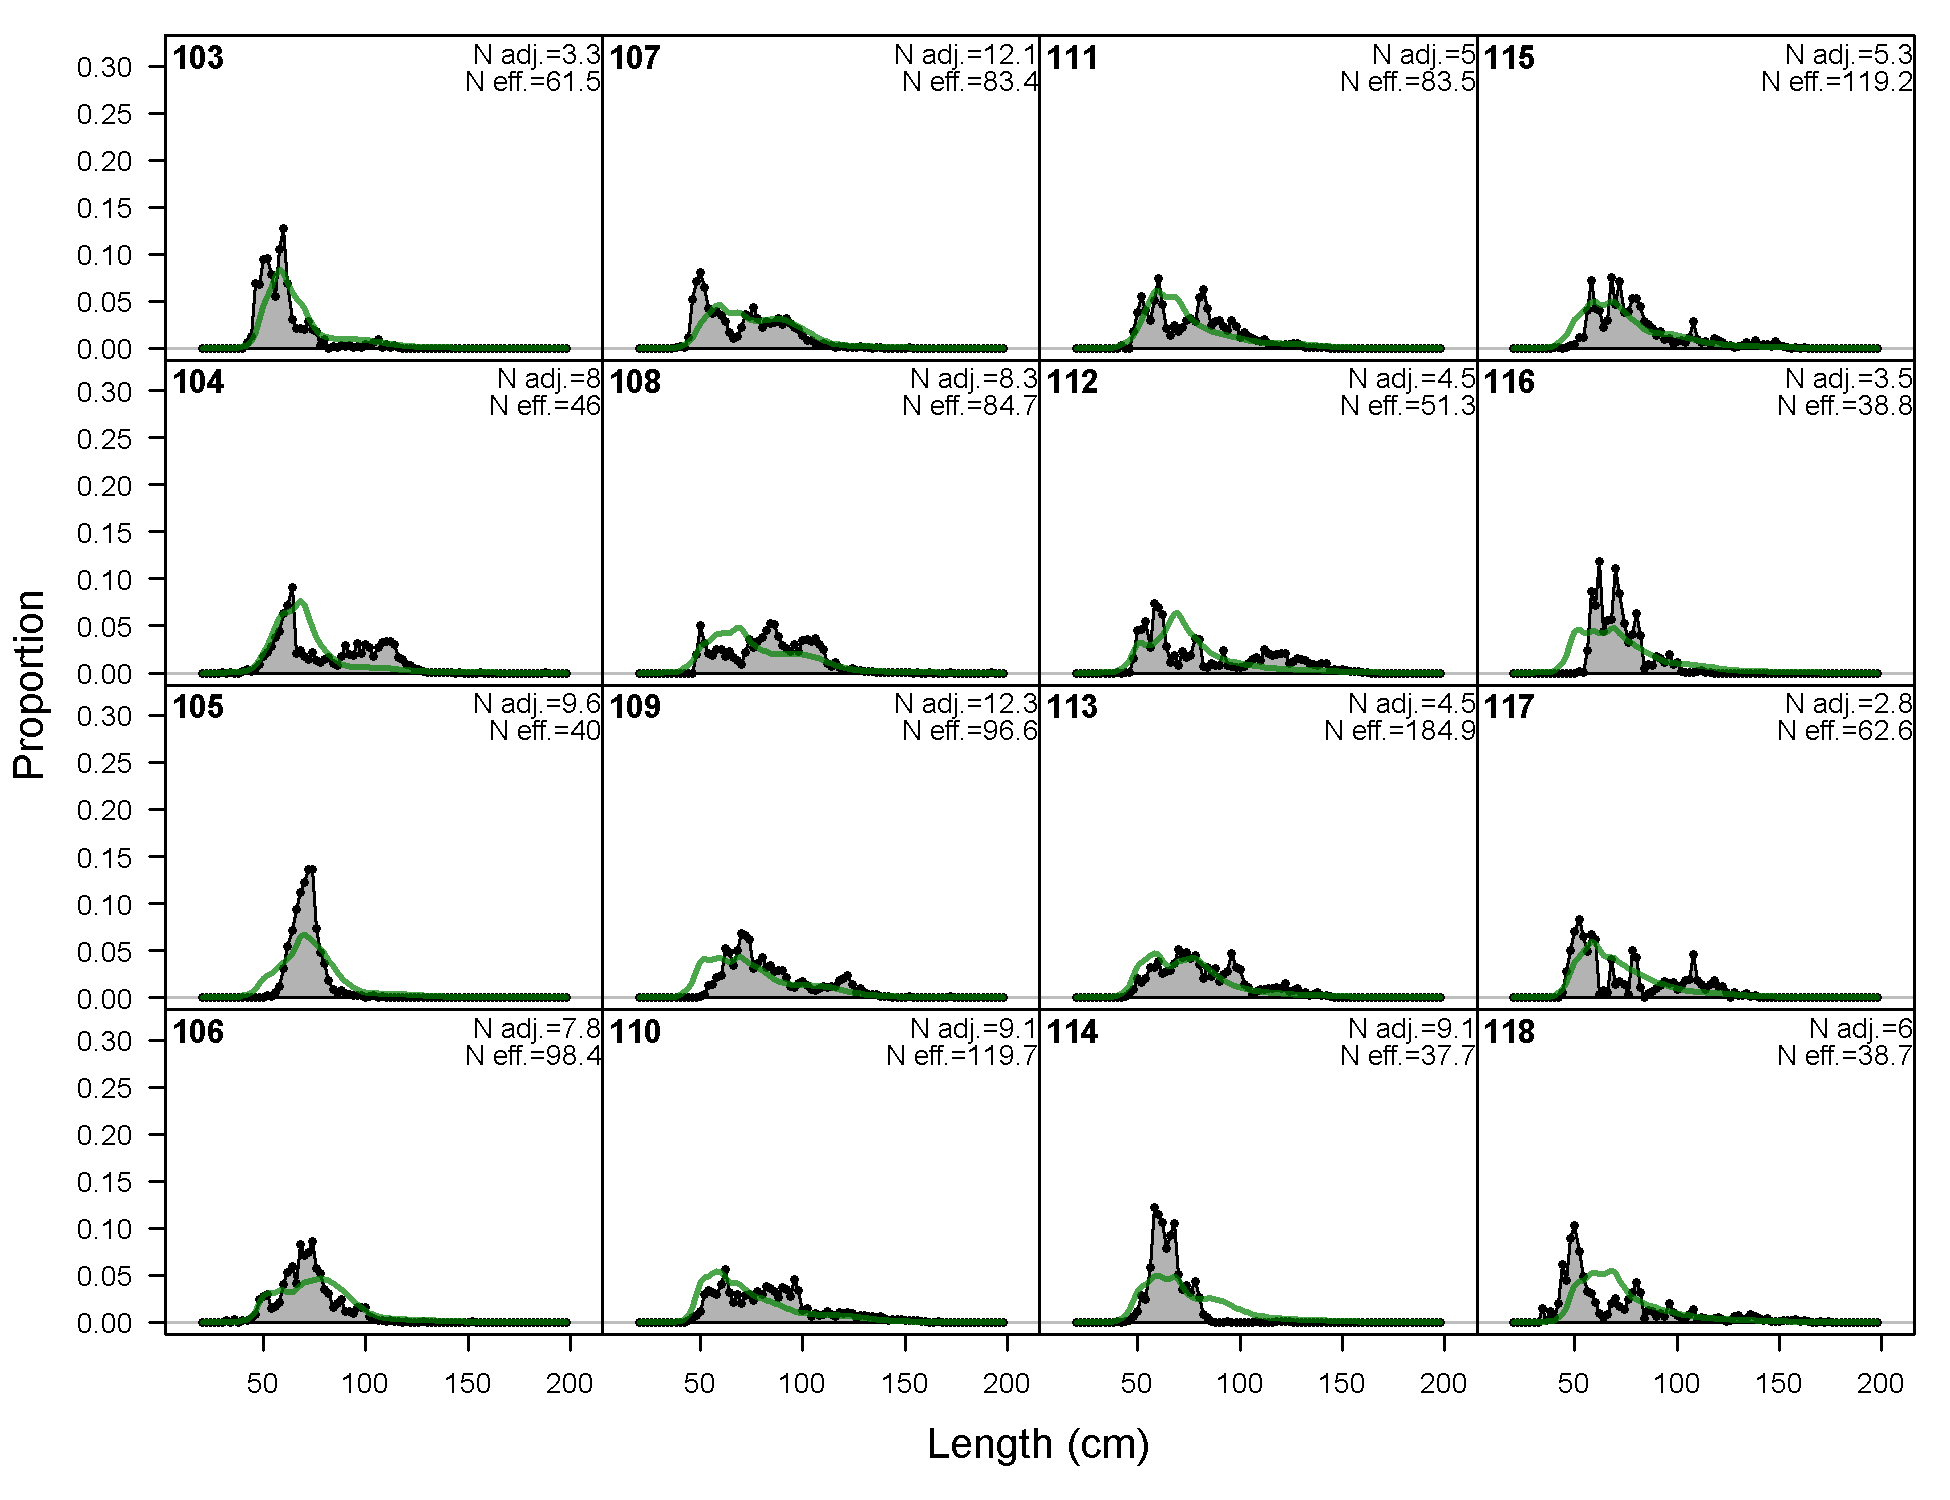
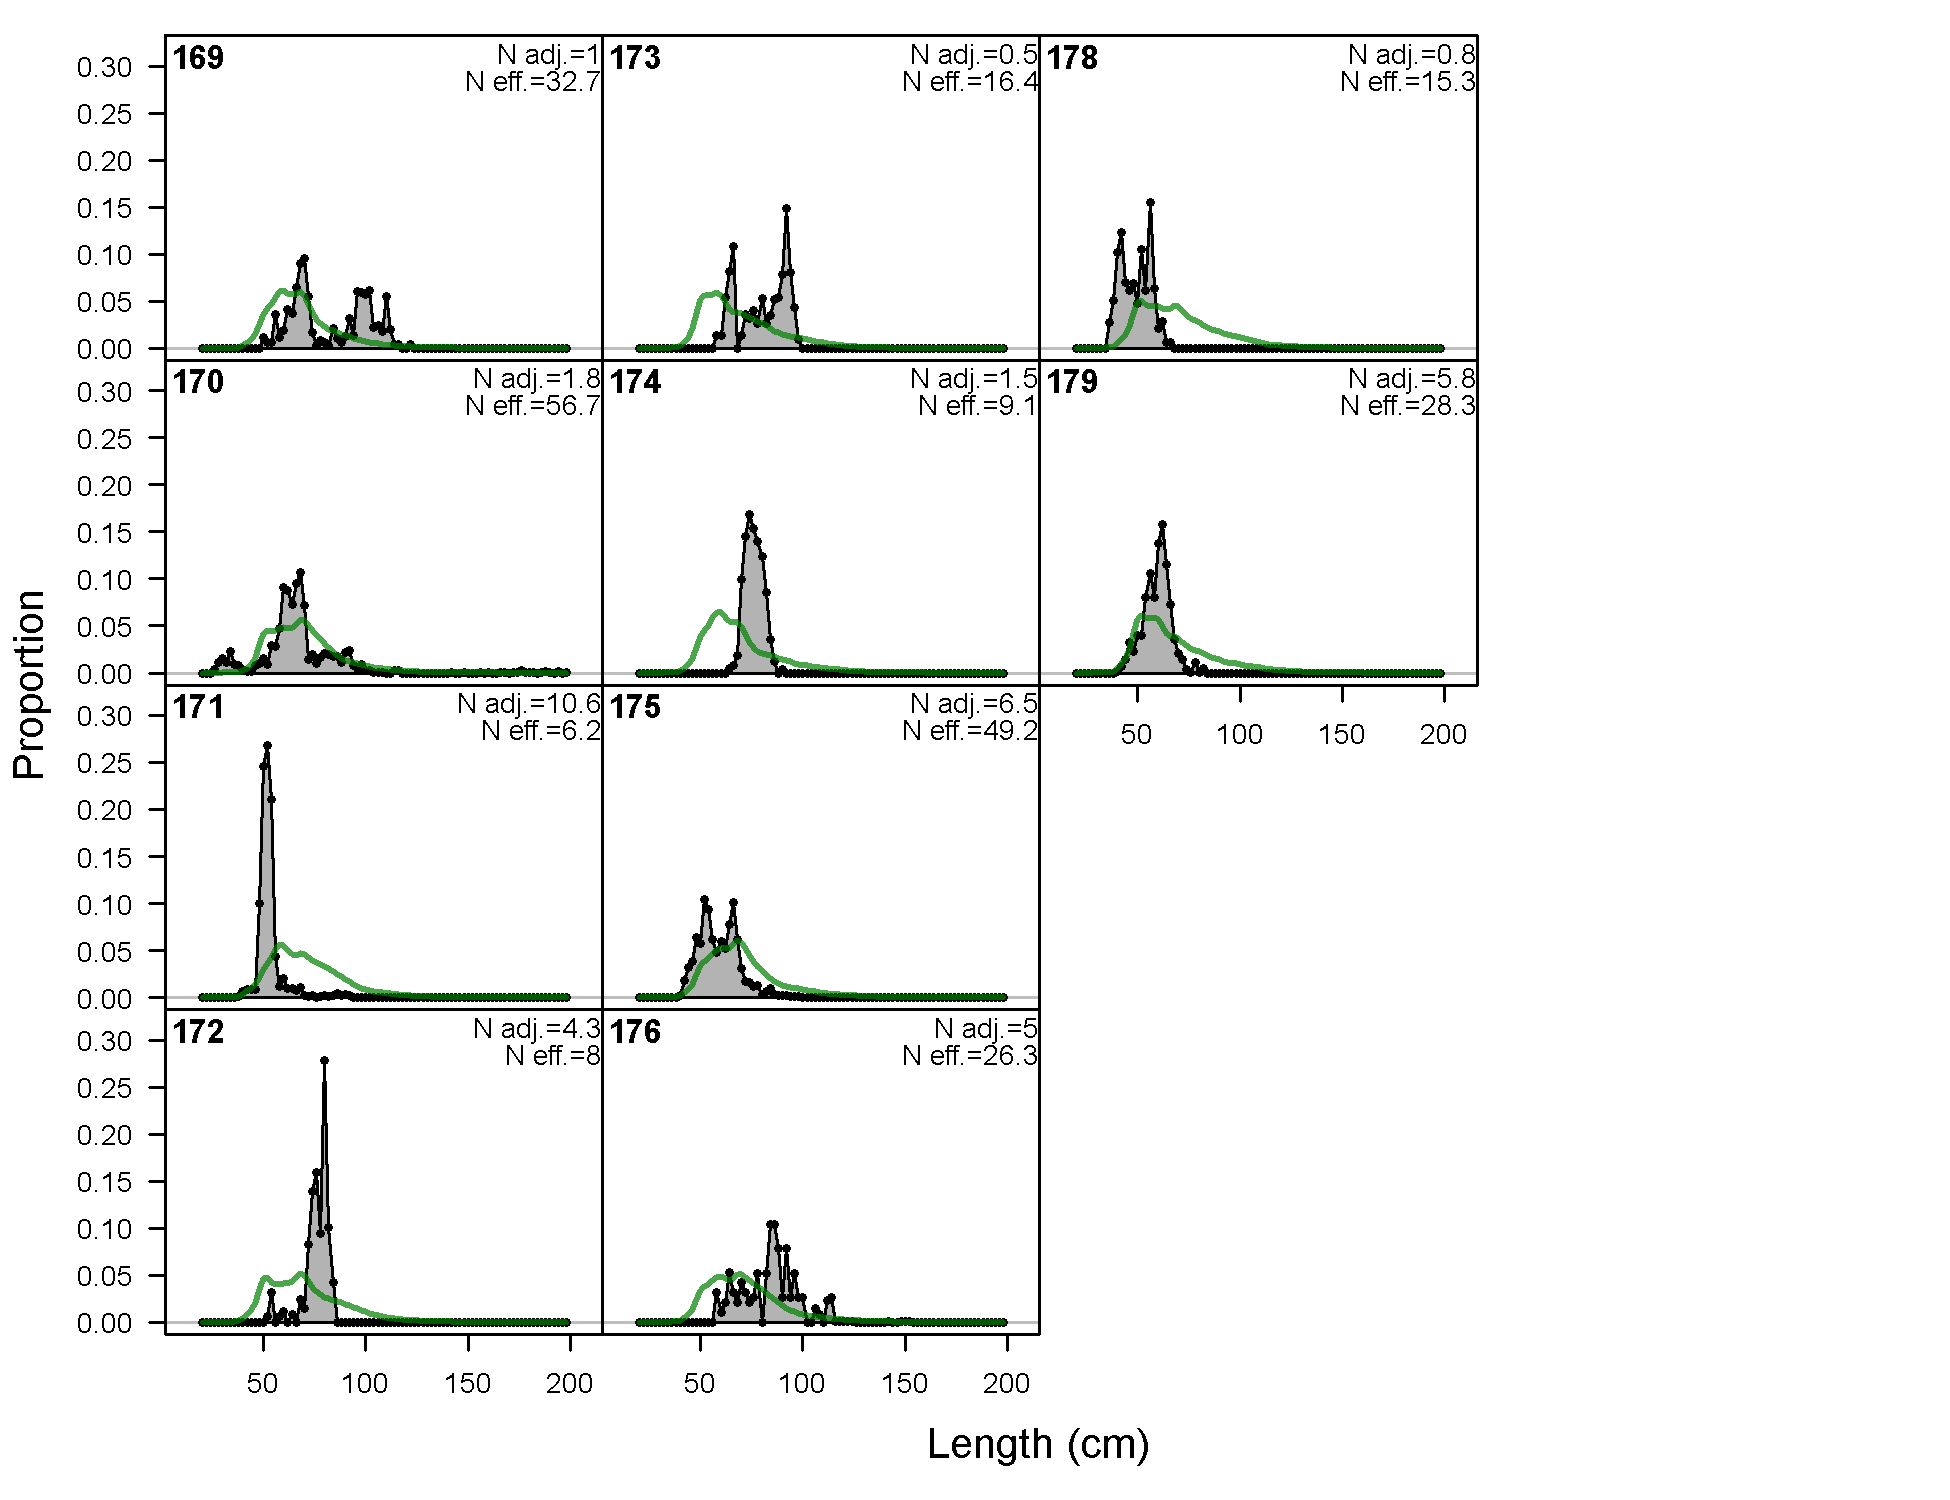
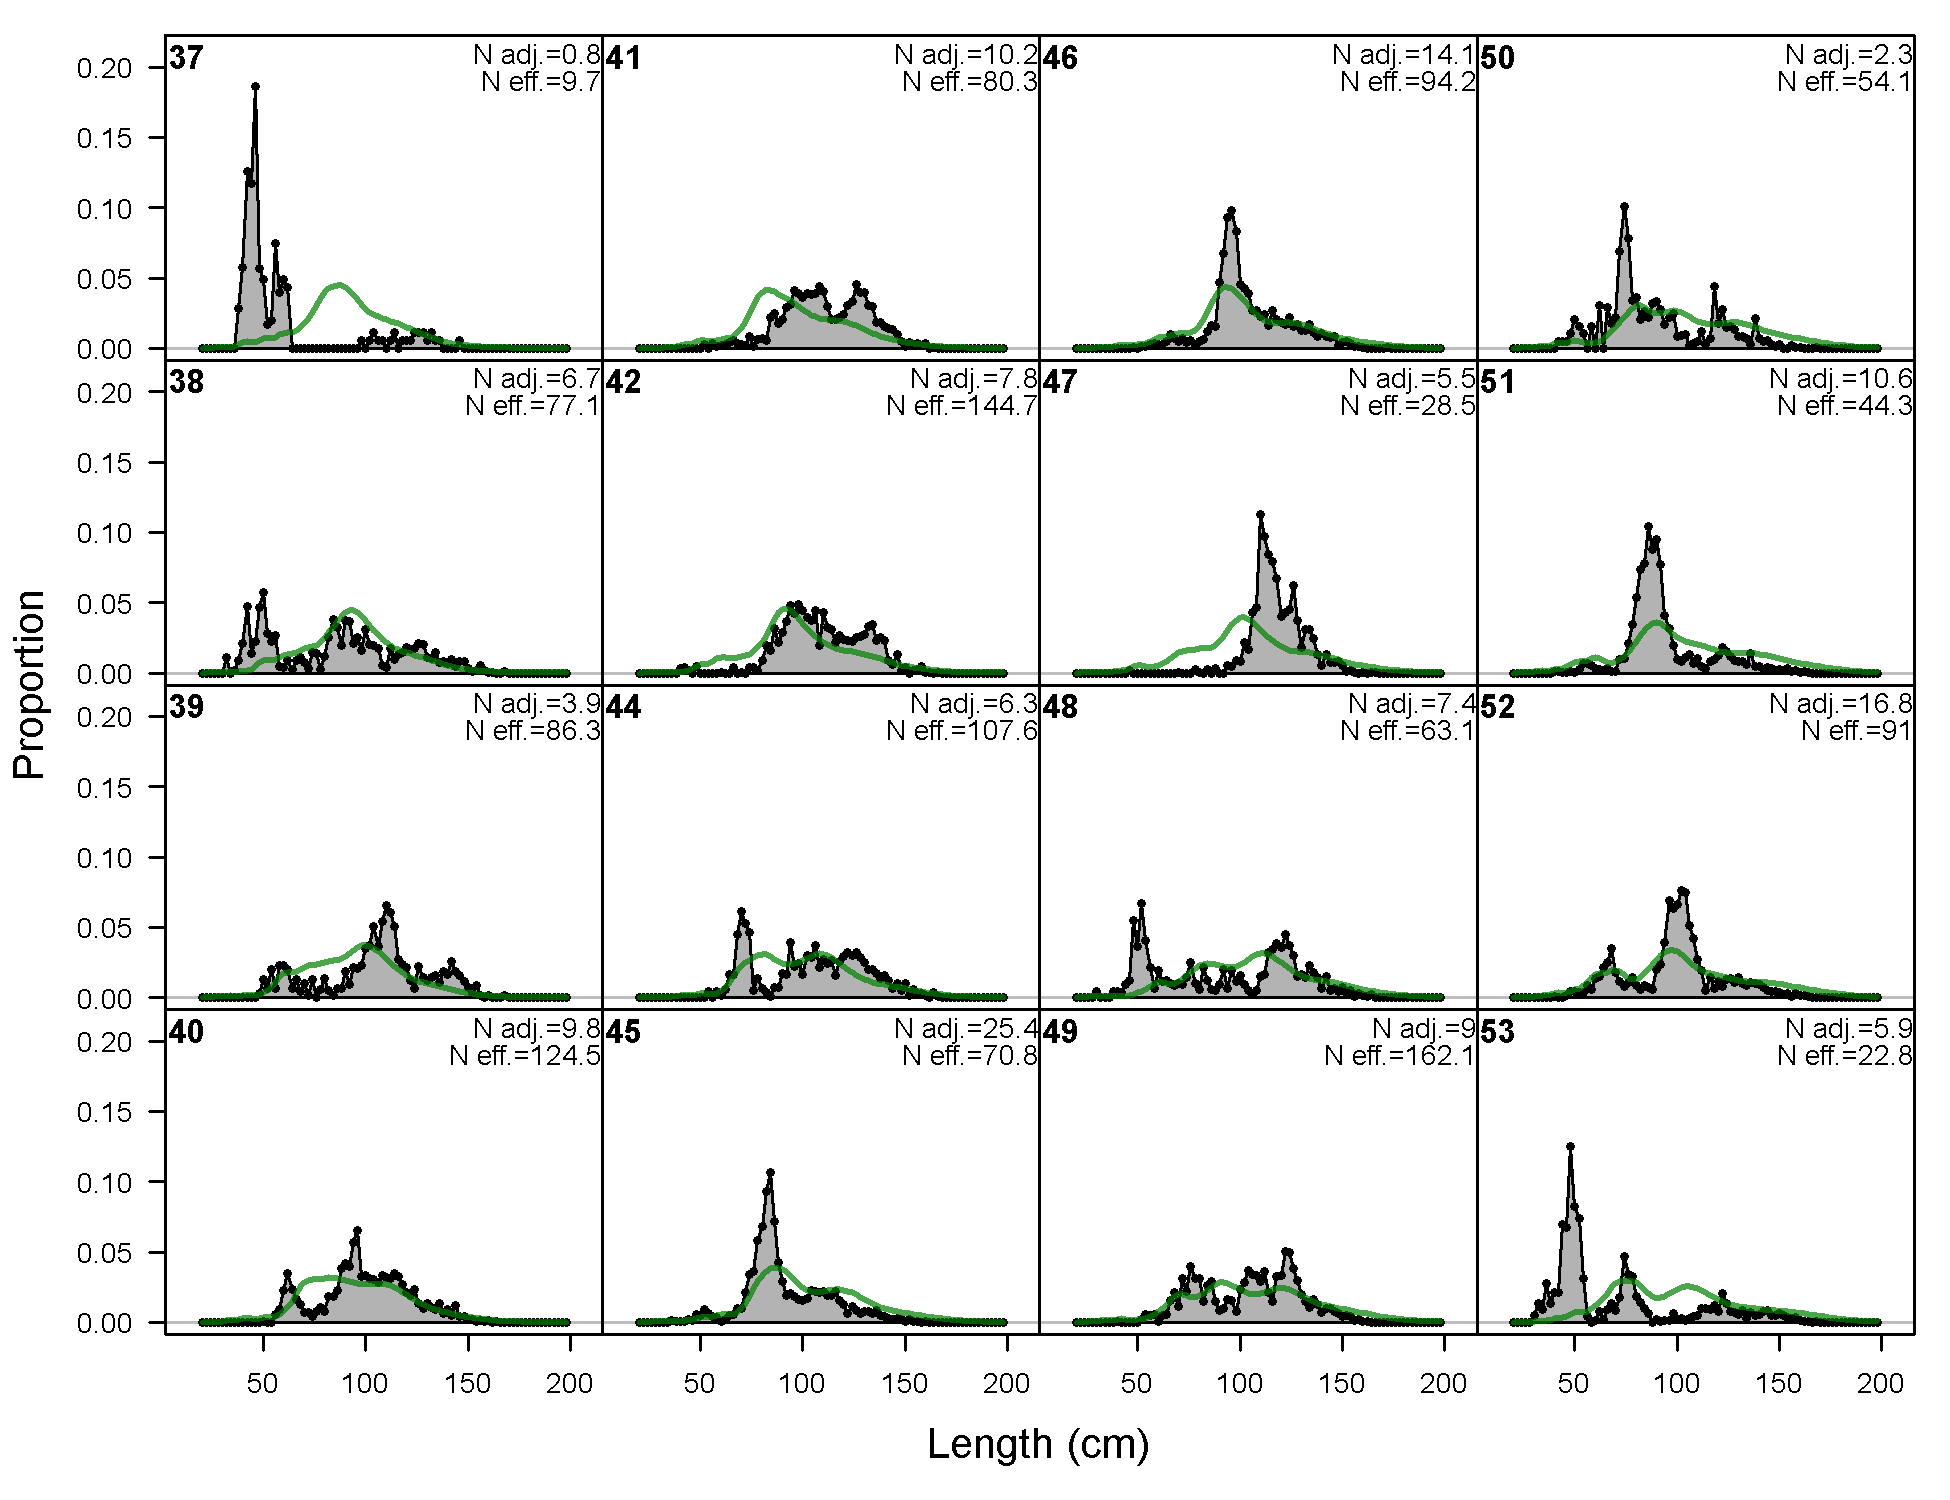
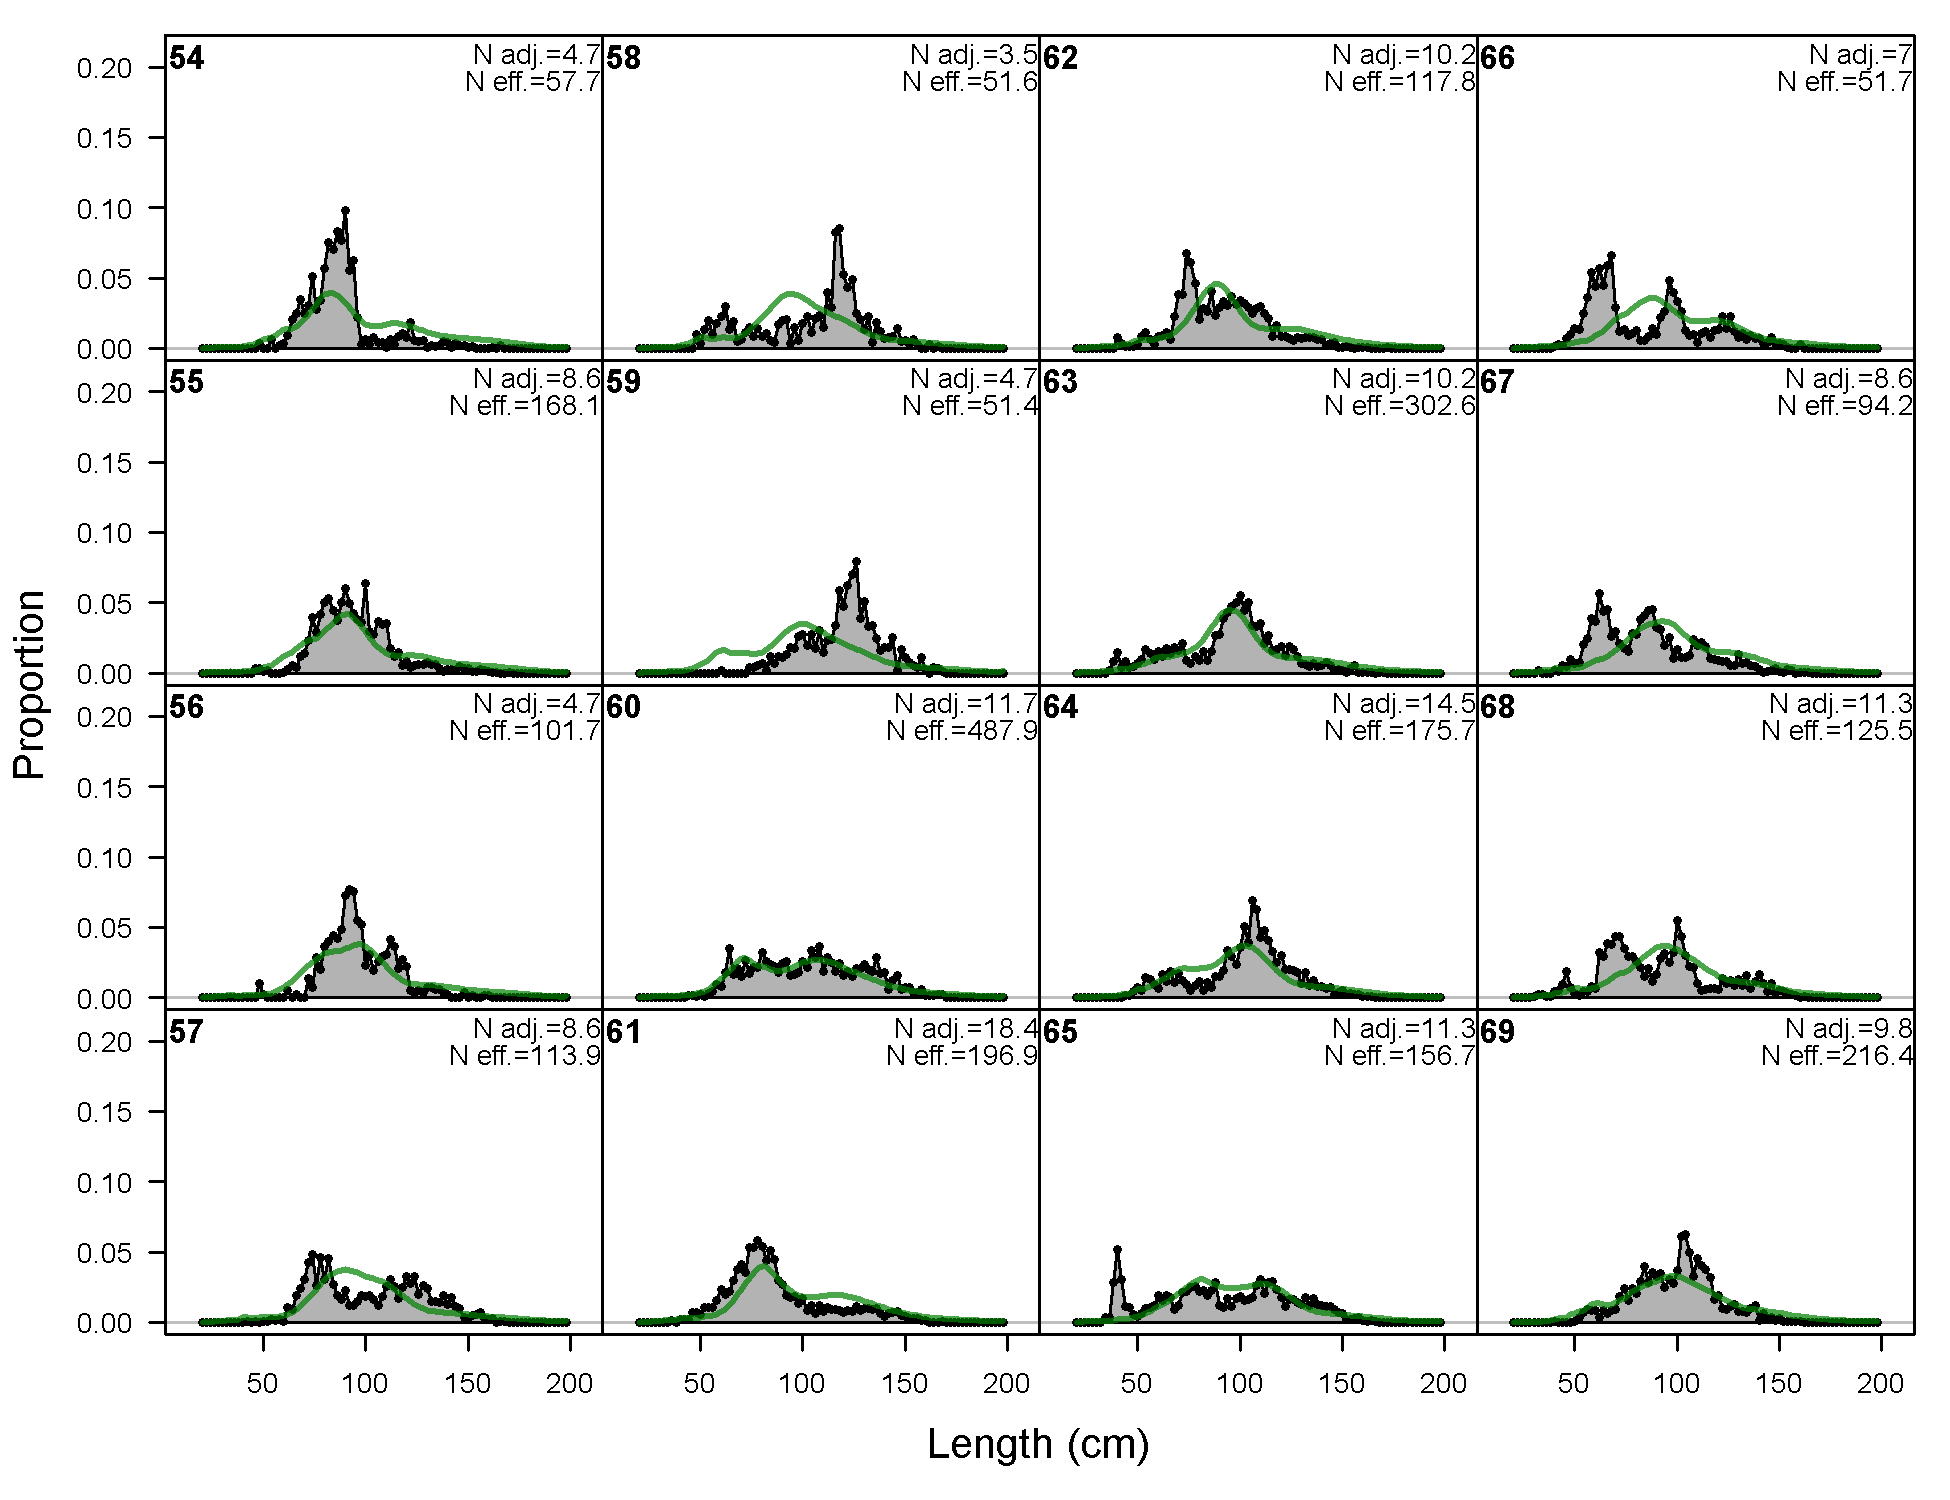
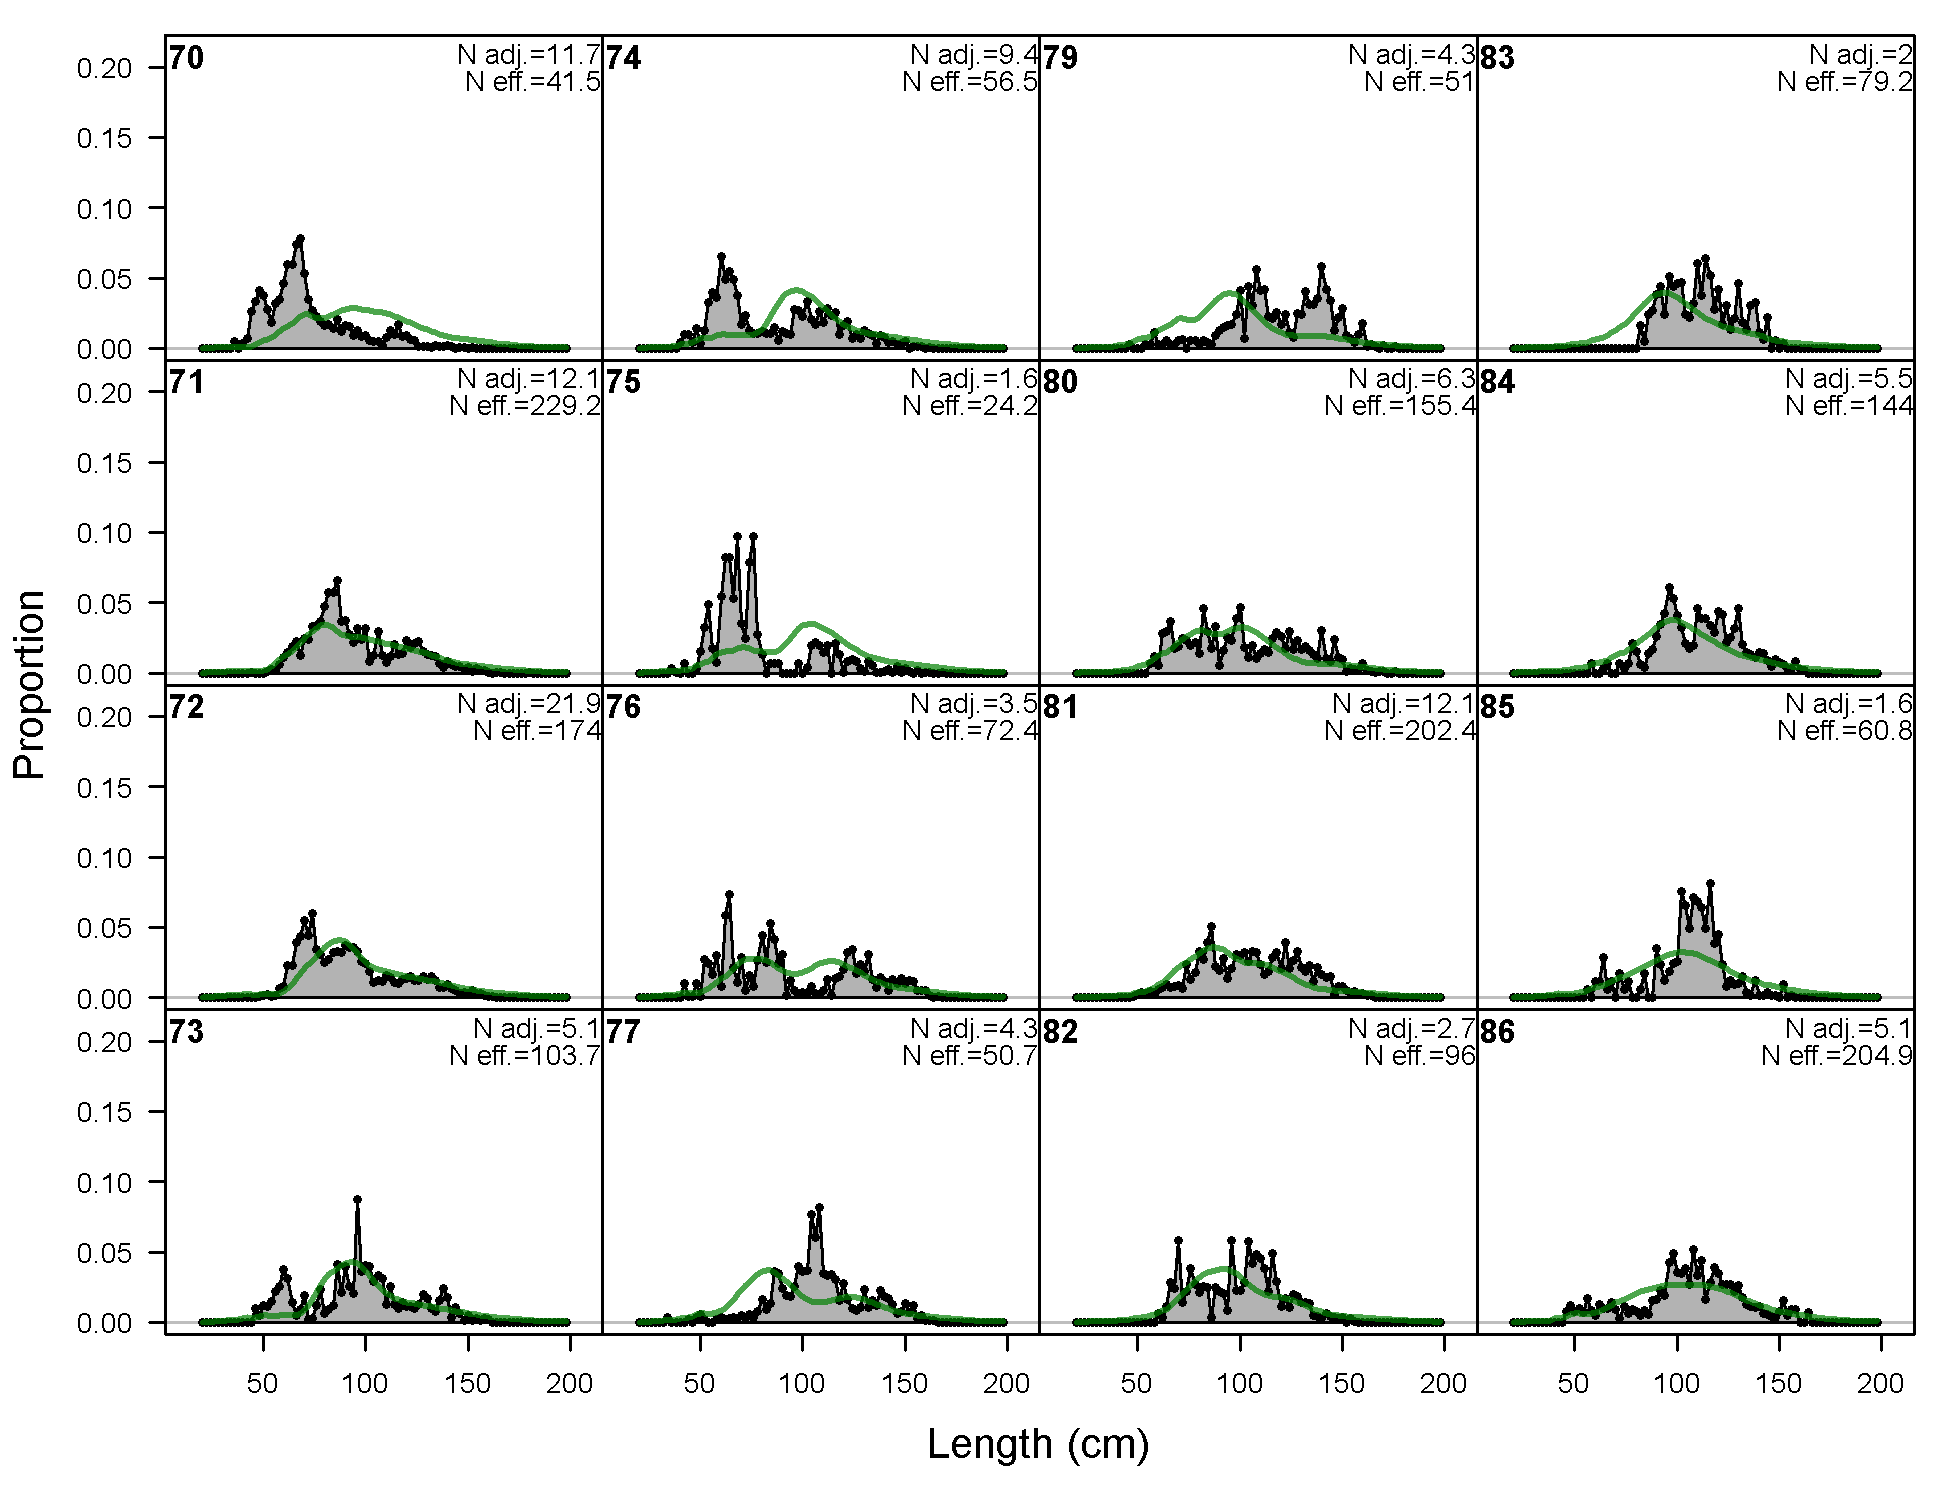
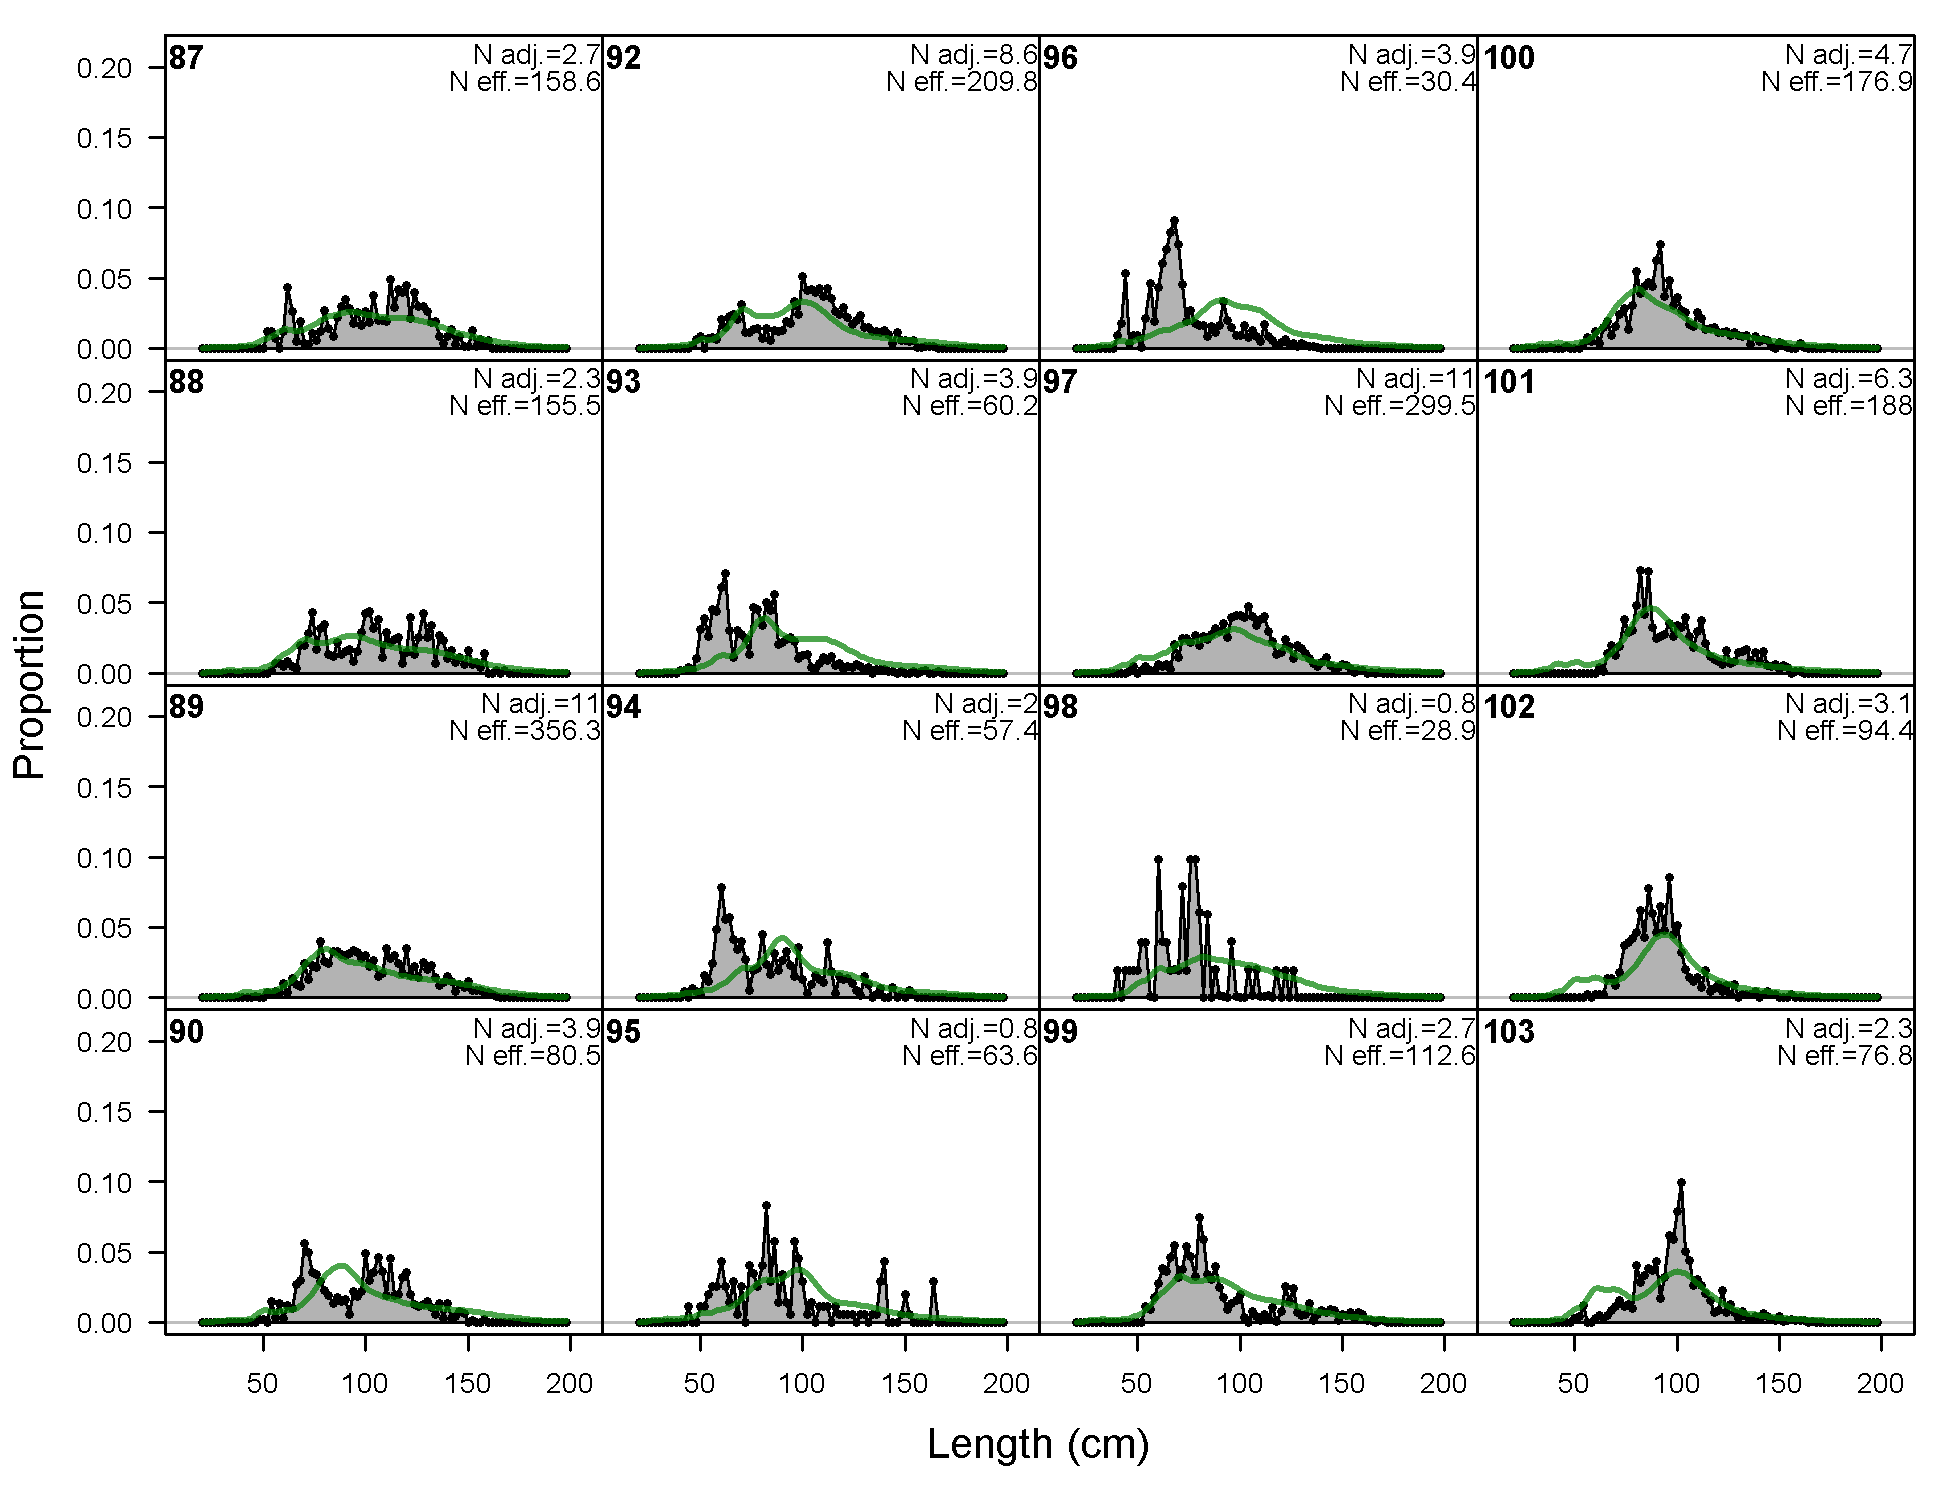
Length comps, whole catch, F11-NOA_N (plot 1 of 9).
'N adj.' is the input sample size after data-weighting adjustment. N eff. is the calculated effective sample size used in the McAllister-Iannelli tuning method.
file: comp_lenfit_flt11mkt0_page1.png

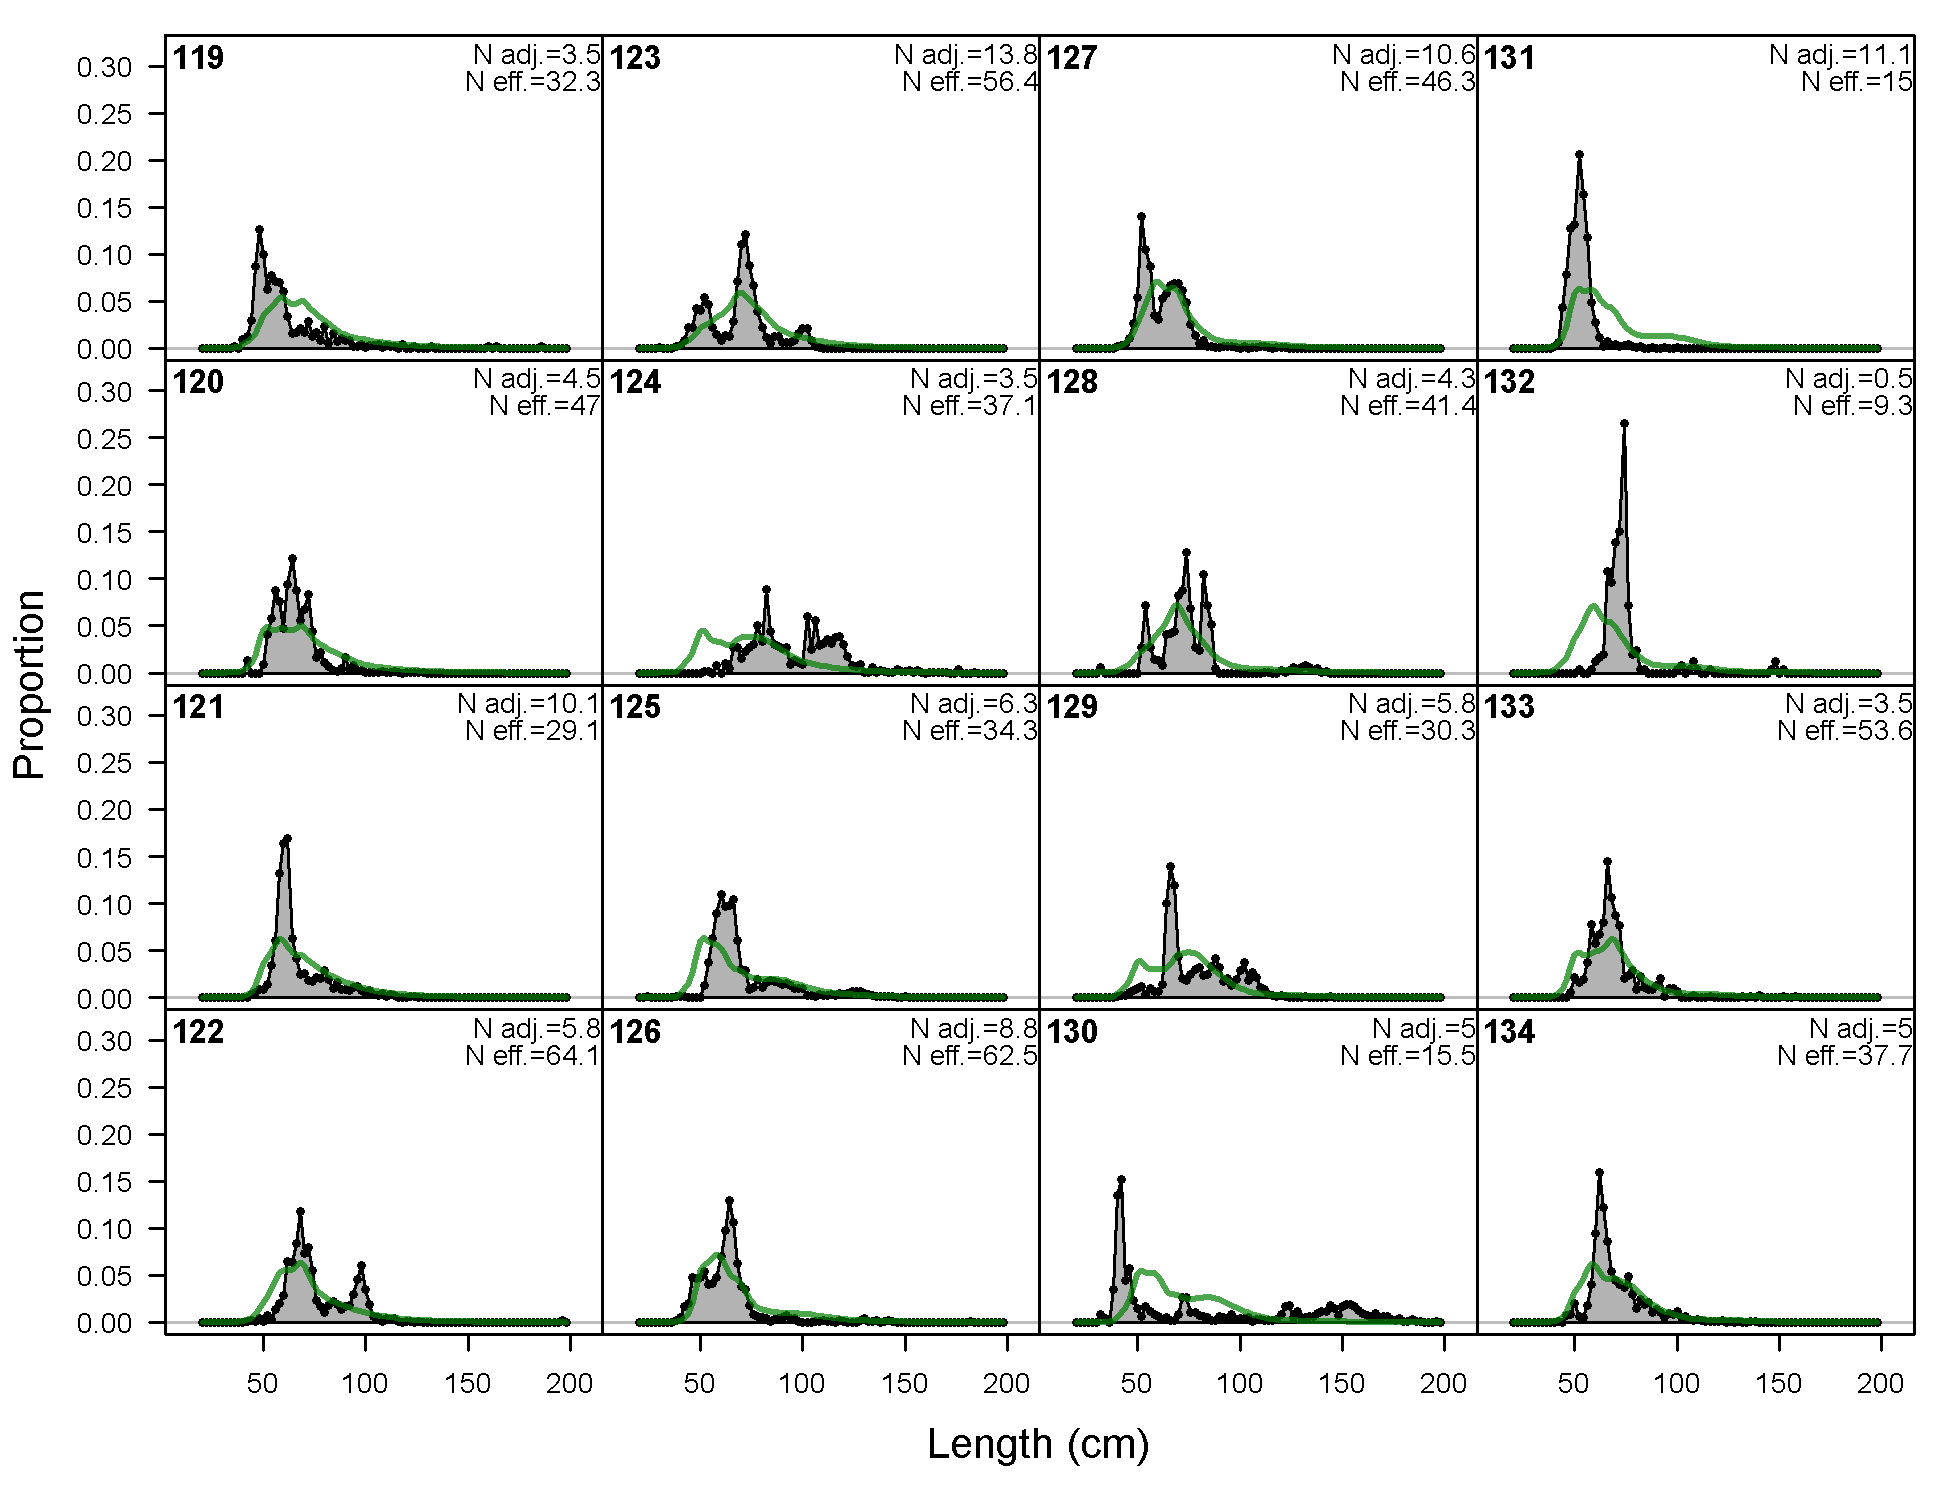
Length comps, whole catch, F11-NOA_N (plot 2 of 9)
file: comp_lenfit_flt11mkt0_page2.png
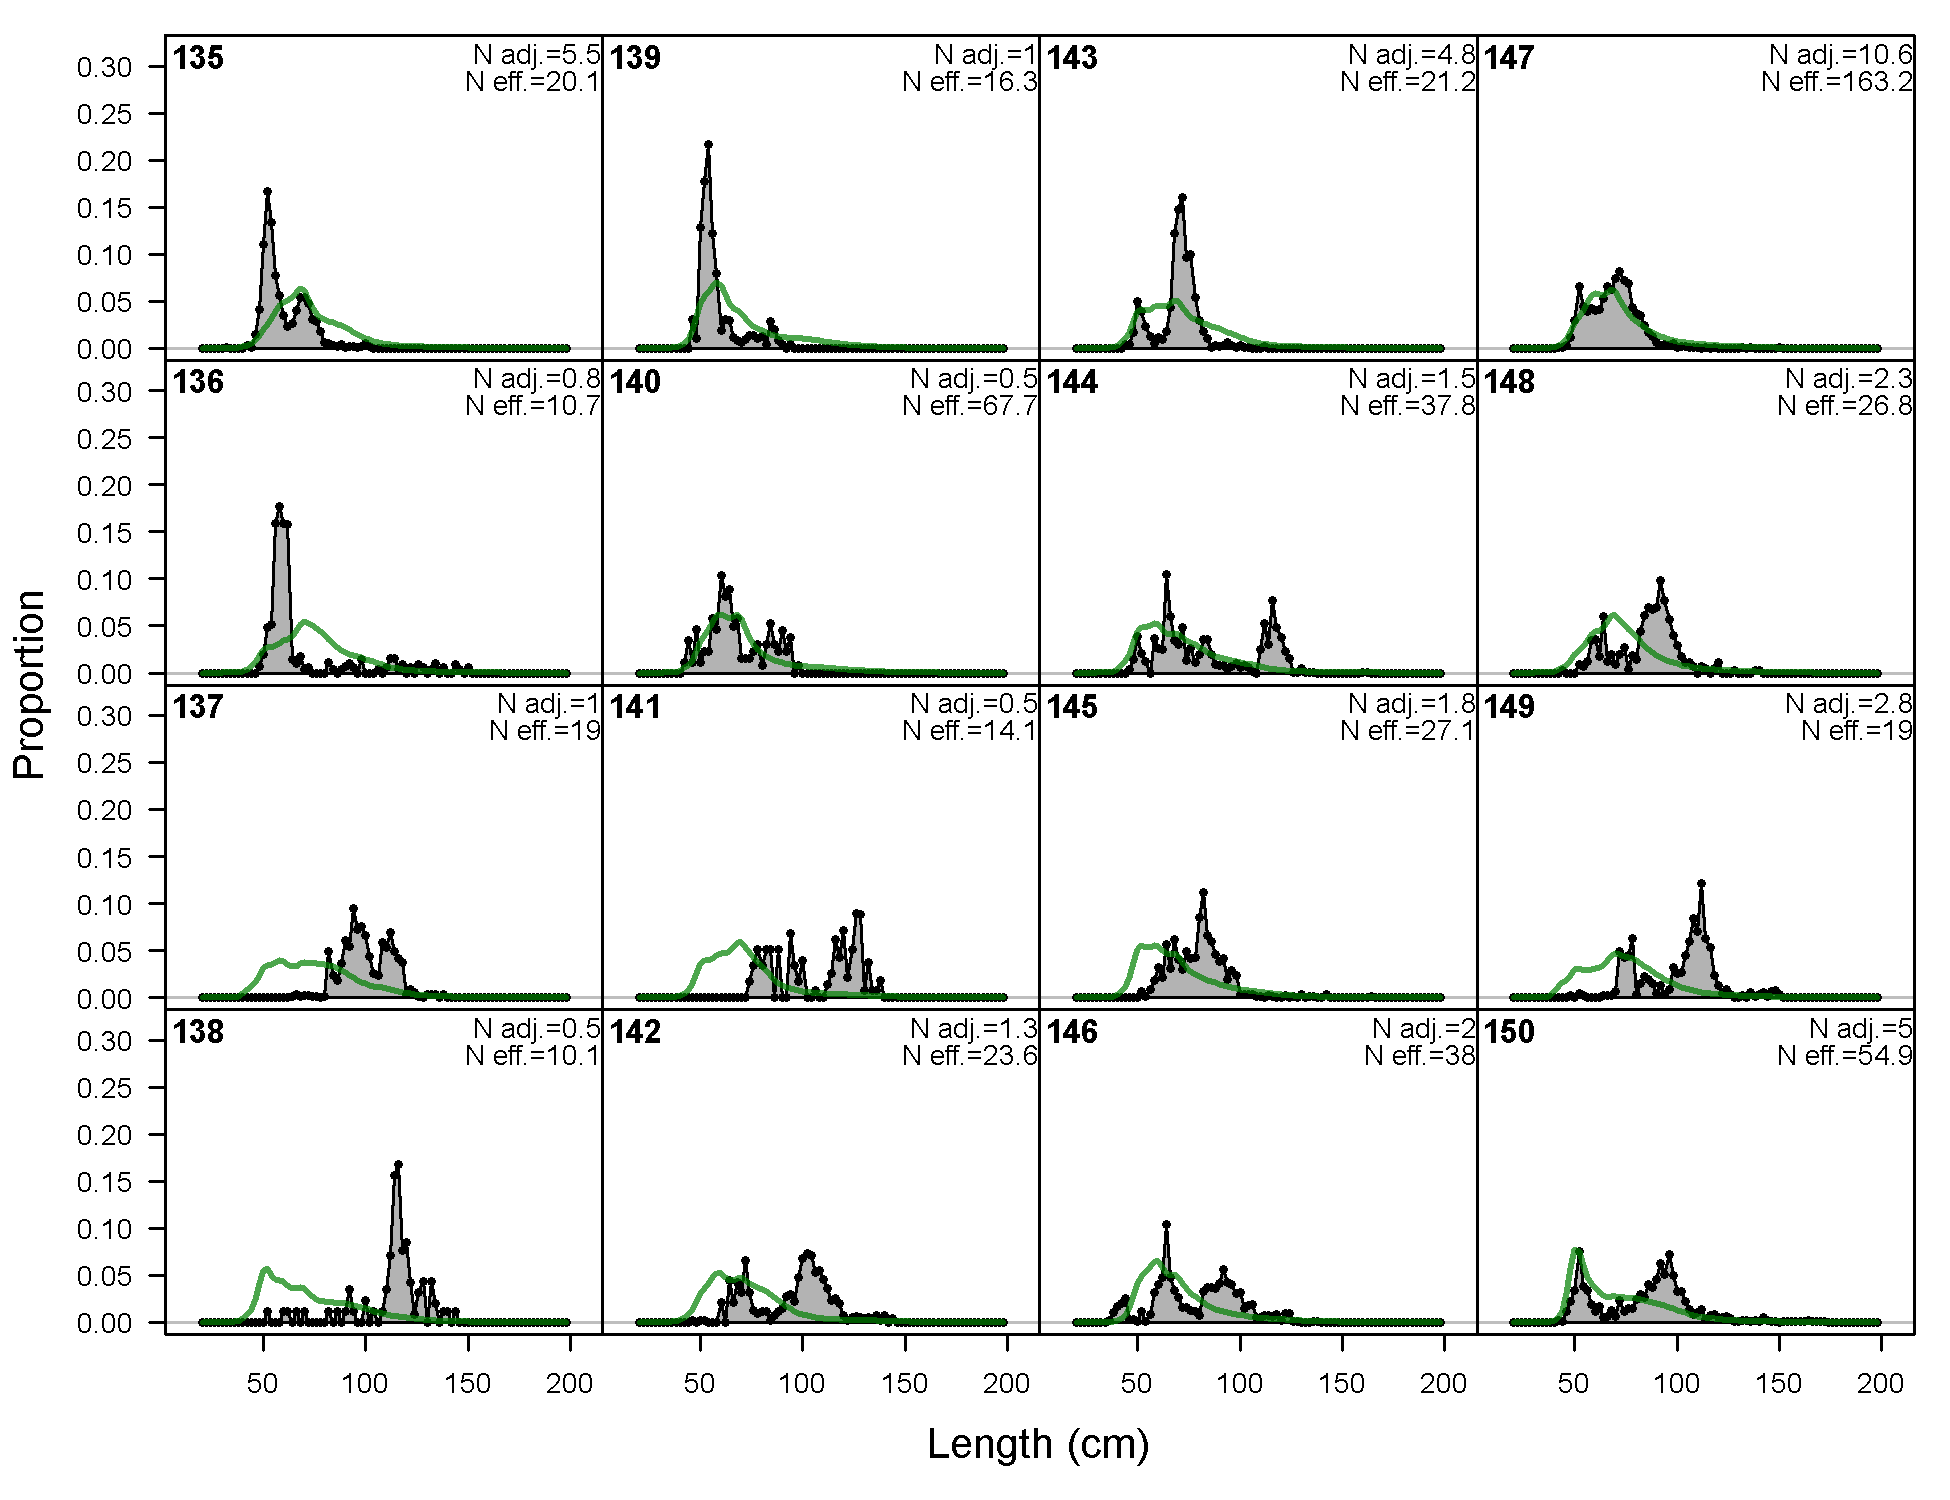
Length comps, whole catch, F11-NOA_N (plot 3 of 9)
file: comp_lenfit_flt11mkt0_page3.png
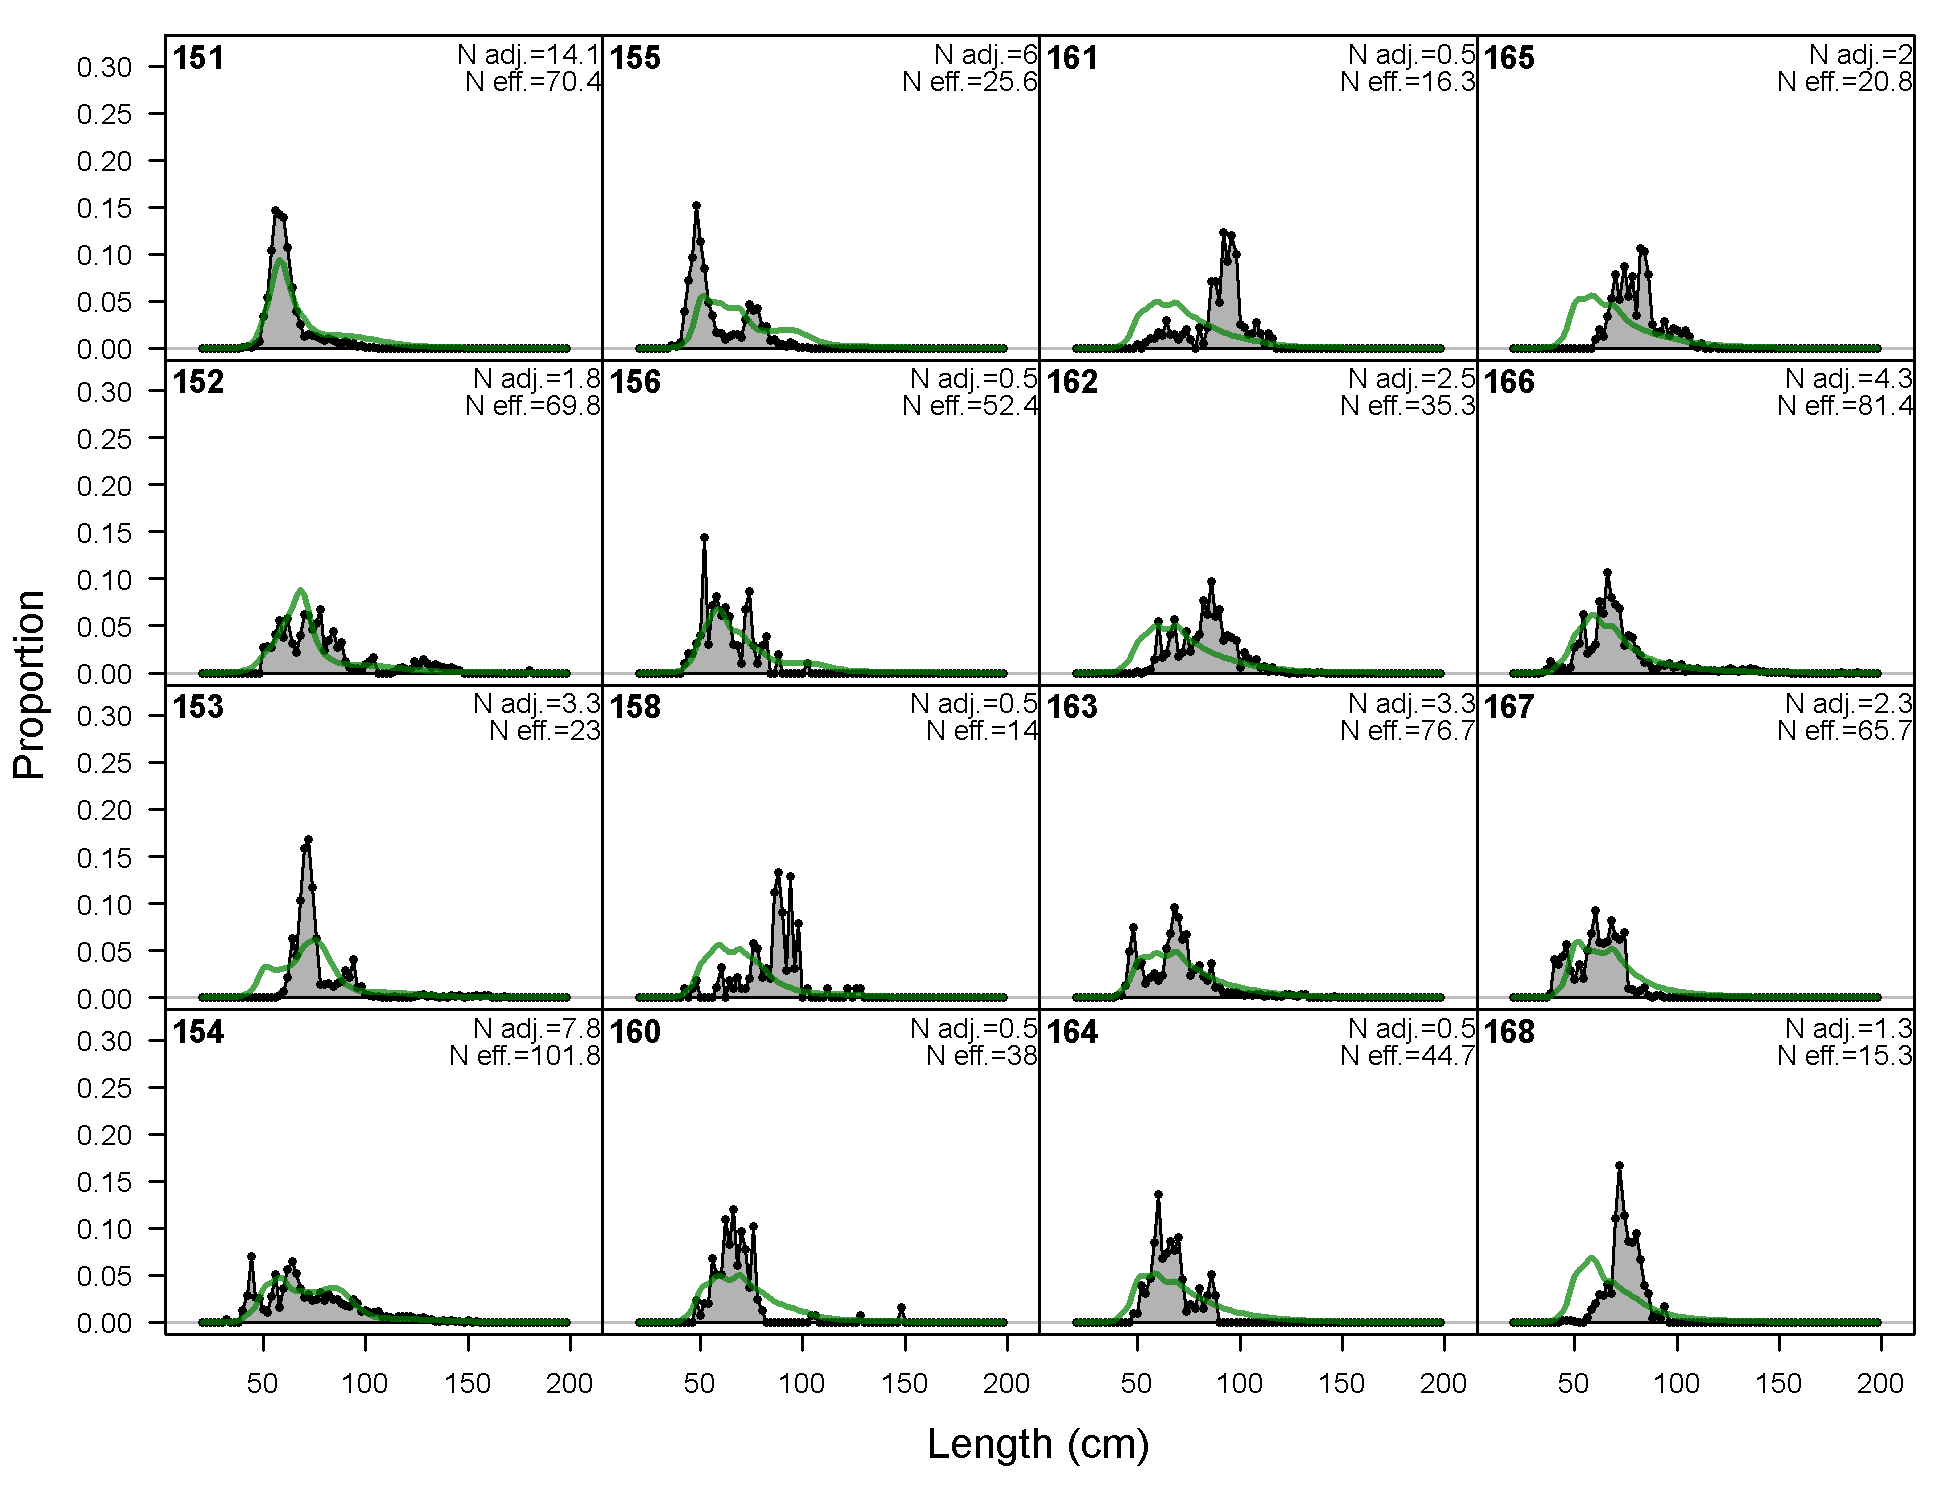
Length comps, whole catch, F11-NOA_N (plot 4 of 9)
file: comp_lenfit_flt11mkt0_page4.png
Length comps, whole catch, F11-NOA_N (plot 5 of 9)
file: comp_lenfit_flt11mkt0_page5.png
Length comps, whole catch, F11-NOA_N (plot 6 of 9)
file: comp_lenfit_flt11mkt0_page6.png
Length comps, whole catch, F11-NOA_N (plot 7 of 9)
file: comp_lenfit_flt11mkt0_page7.png
Length comps, whole catch, F11-NOA_N (plot 8 of 9)
file: comp_lenfit_flt11mkt0_page8.png
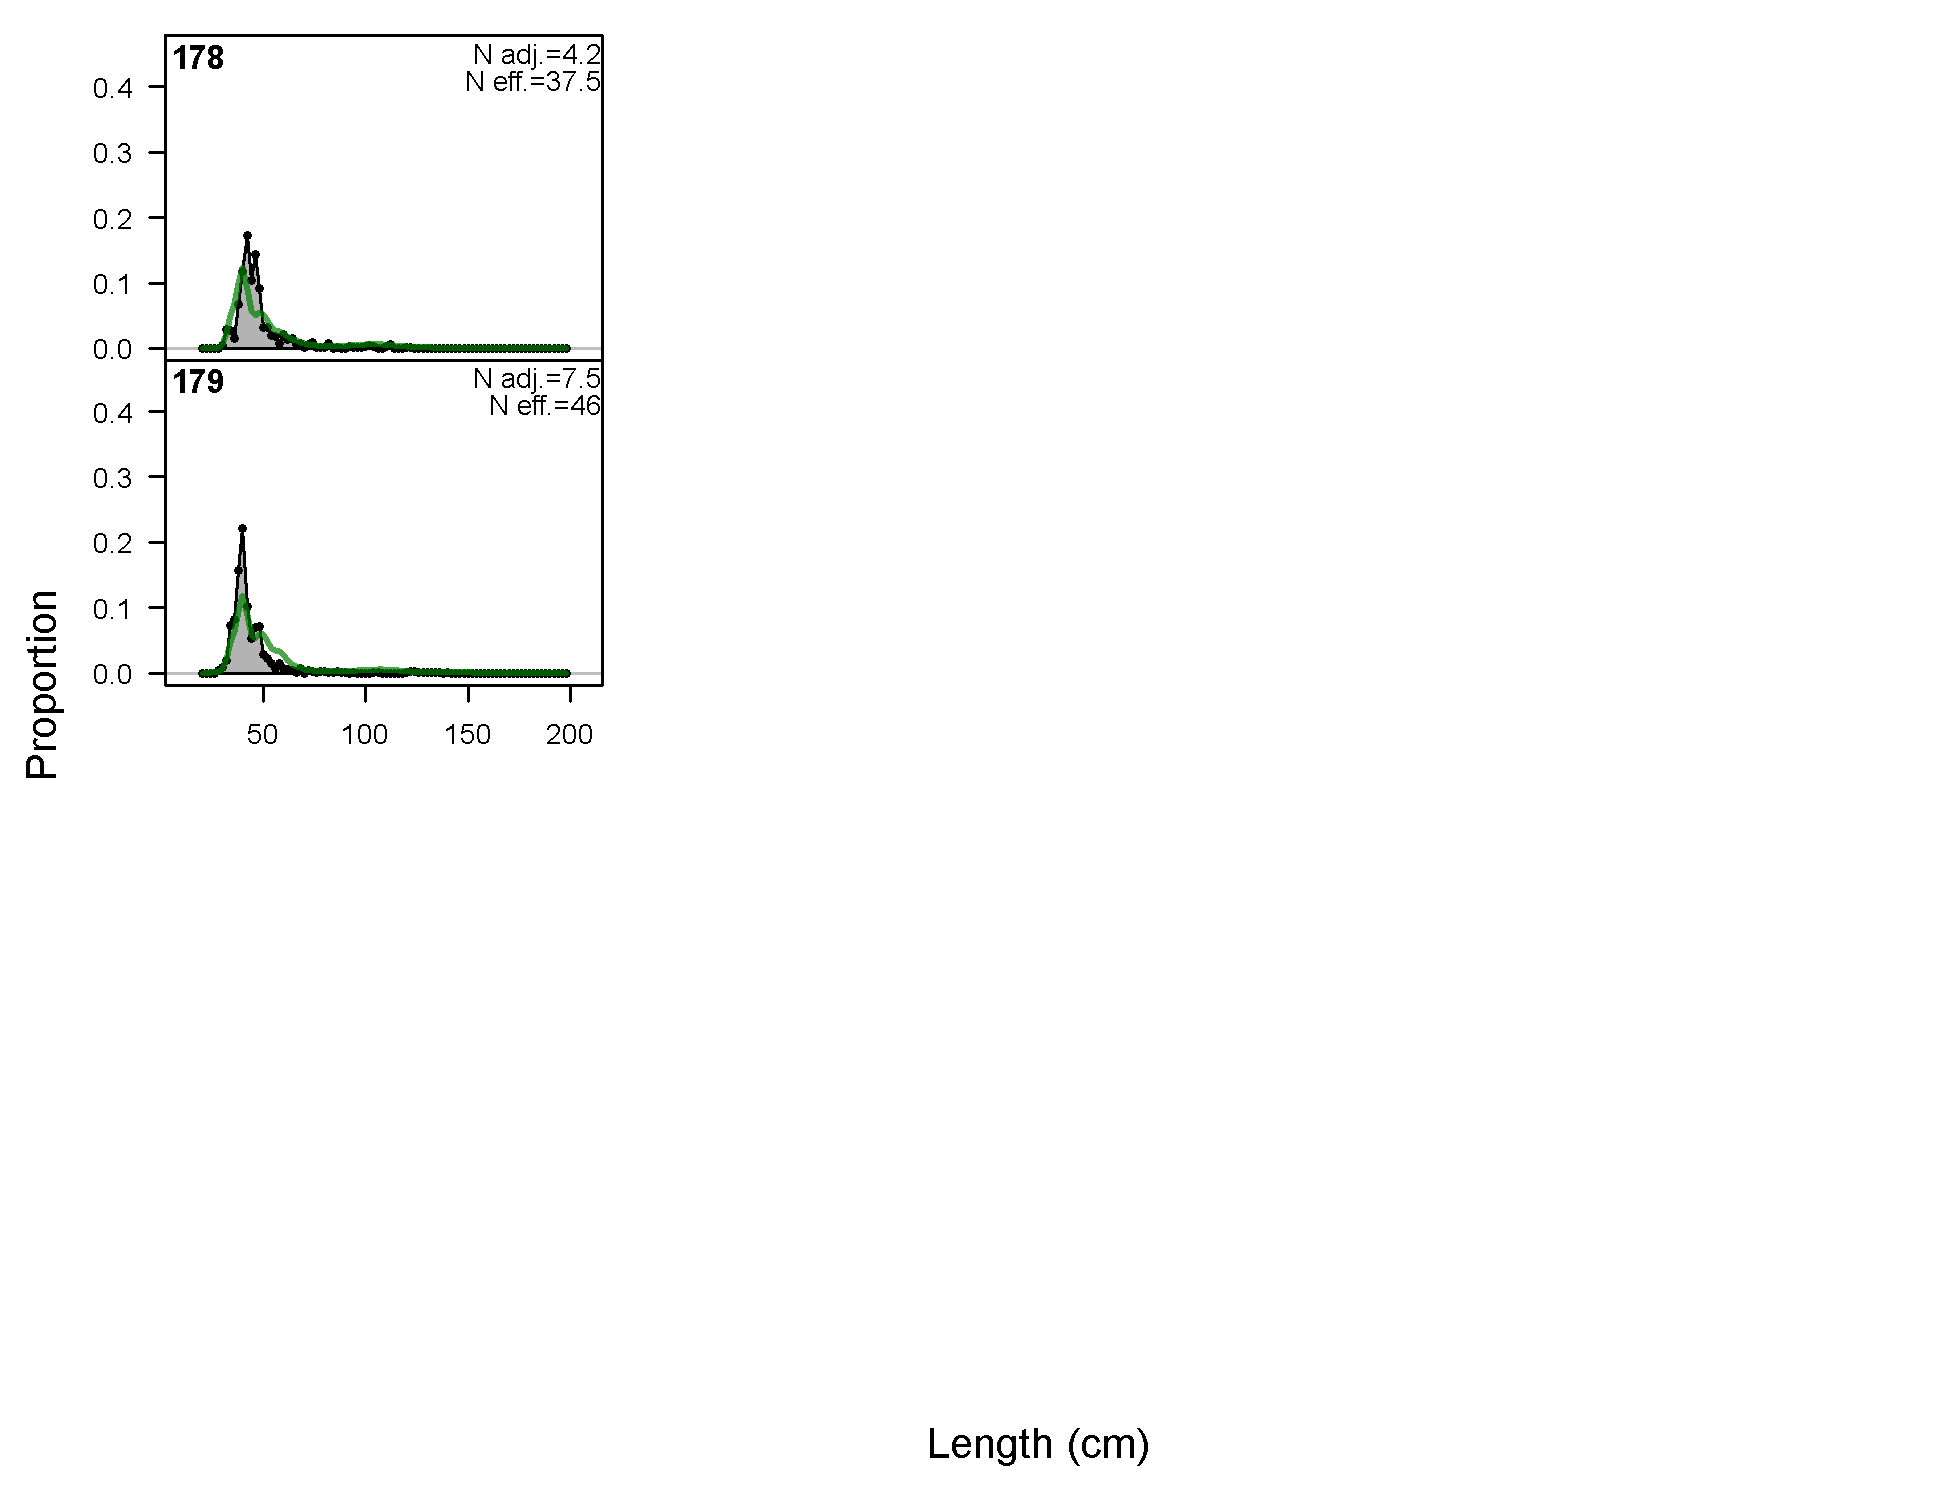
Length comps, whole catch, F11-NOA_N (plot 9 of 9)
file: comp_lenfit_flt11mkt0_page9.png
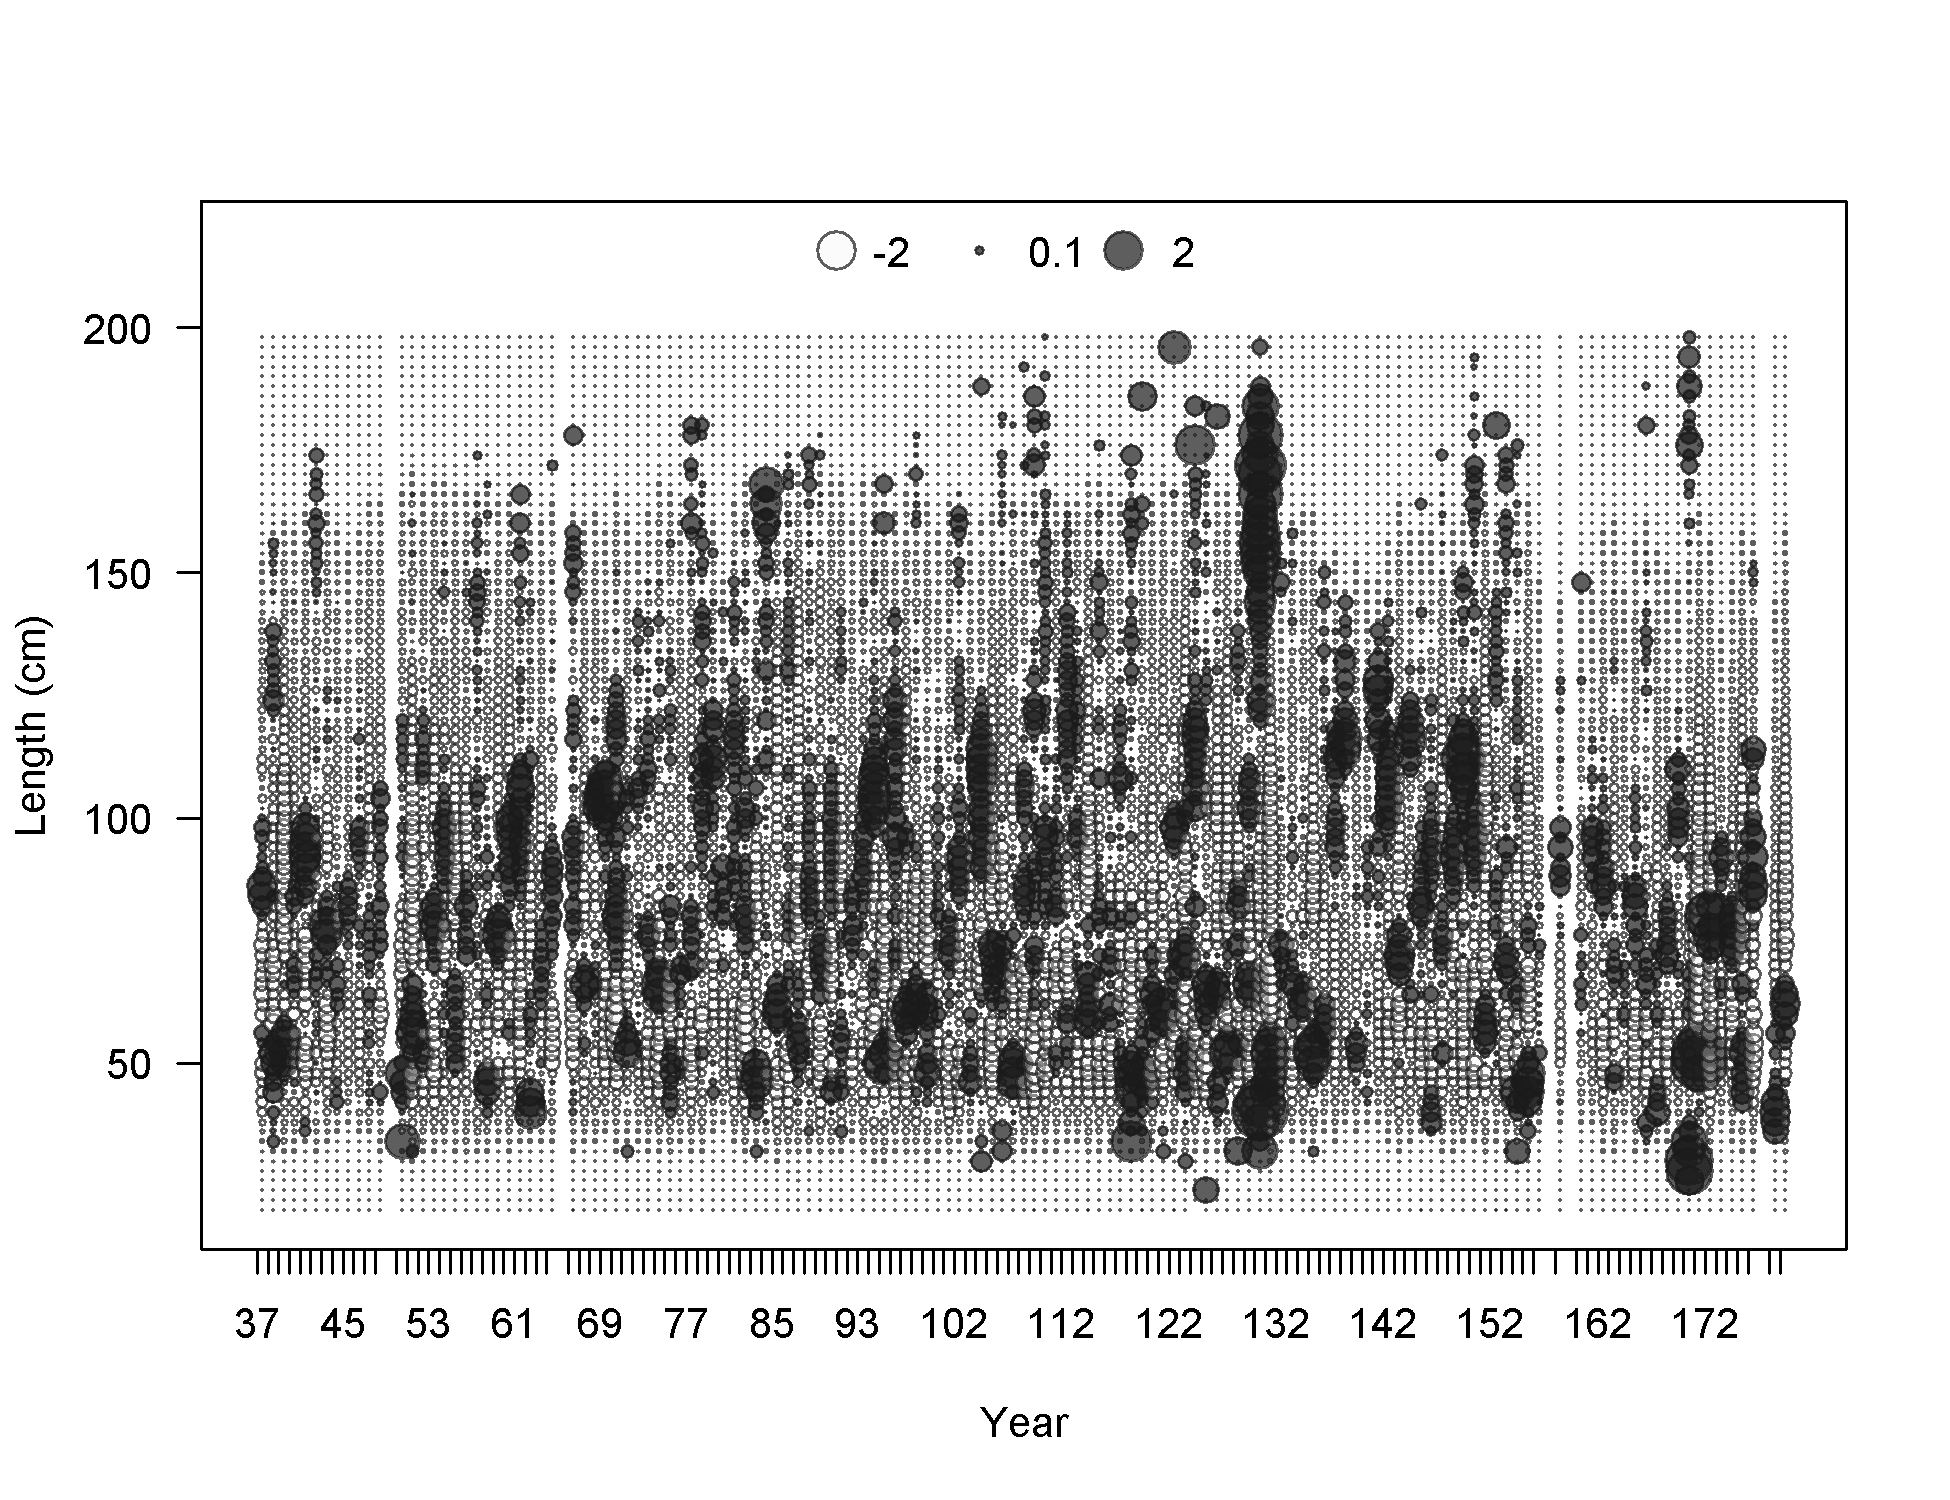
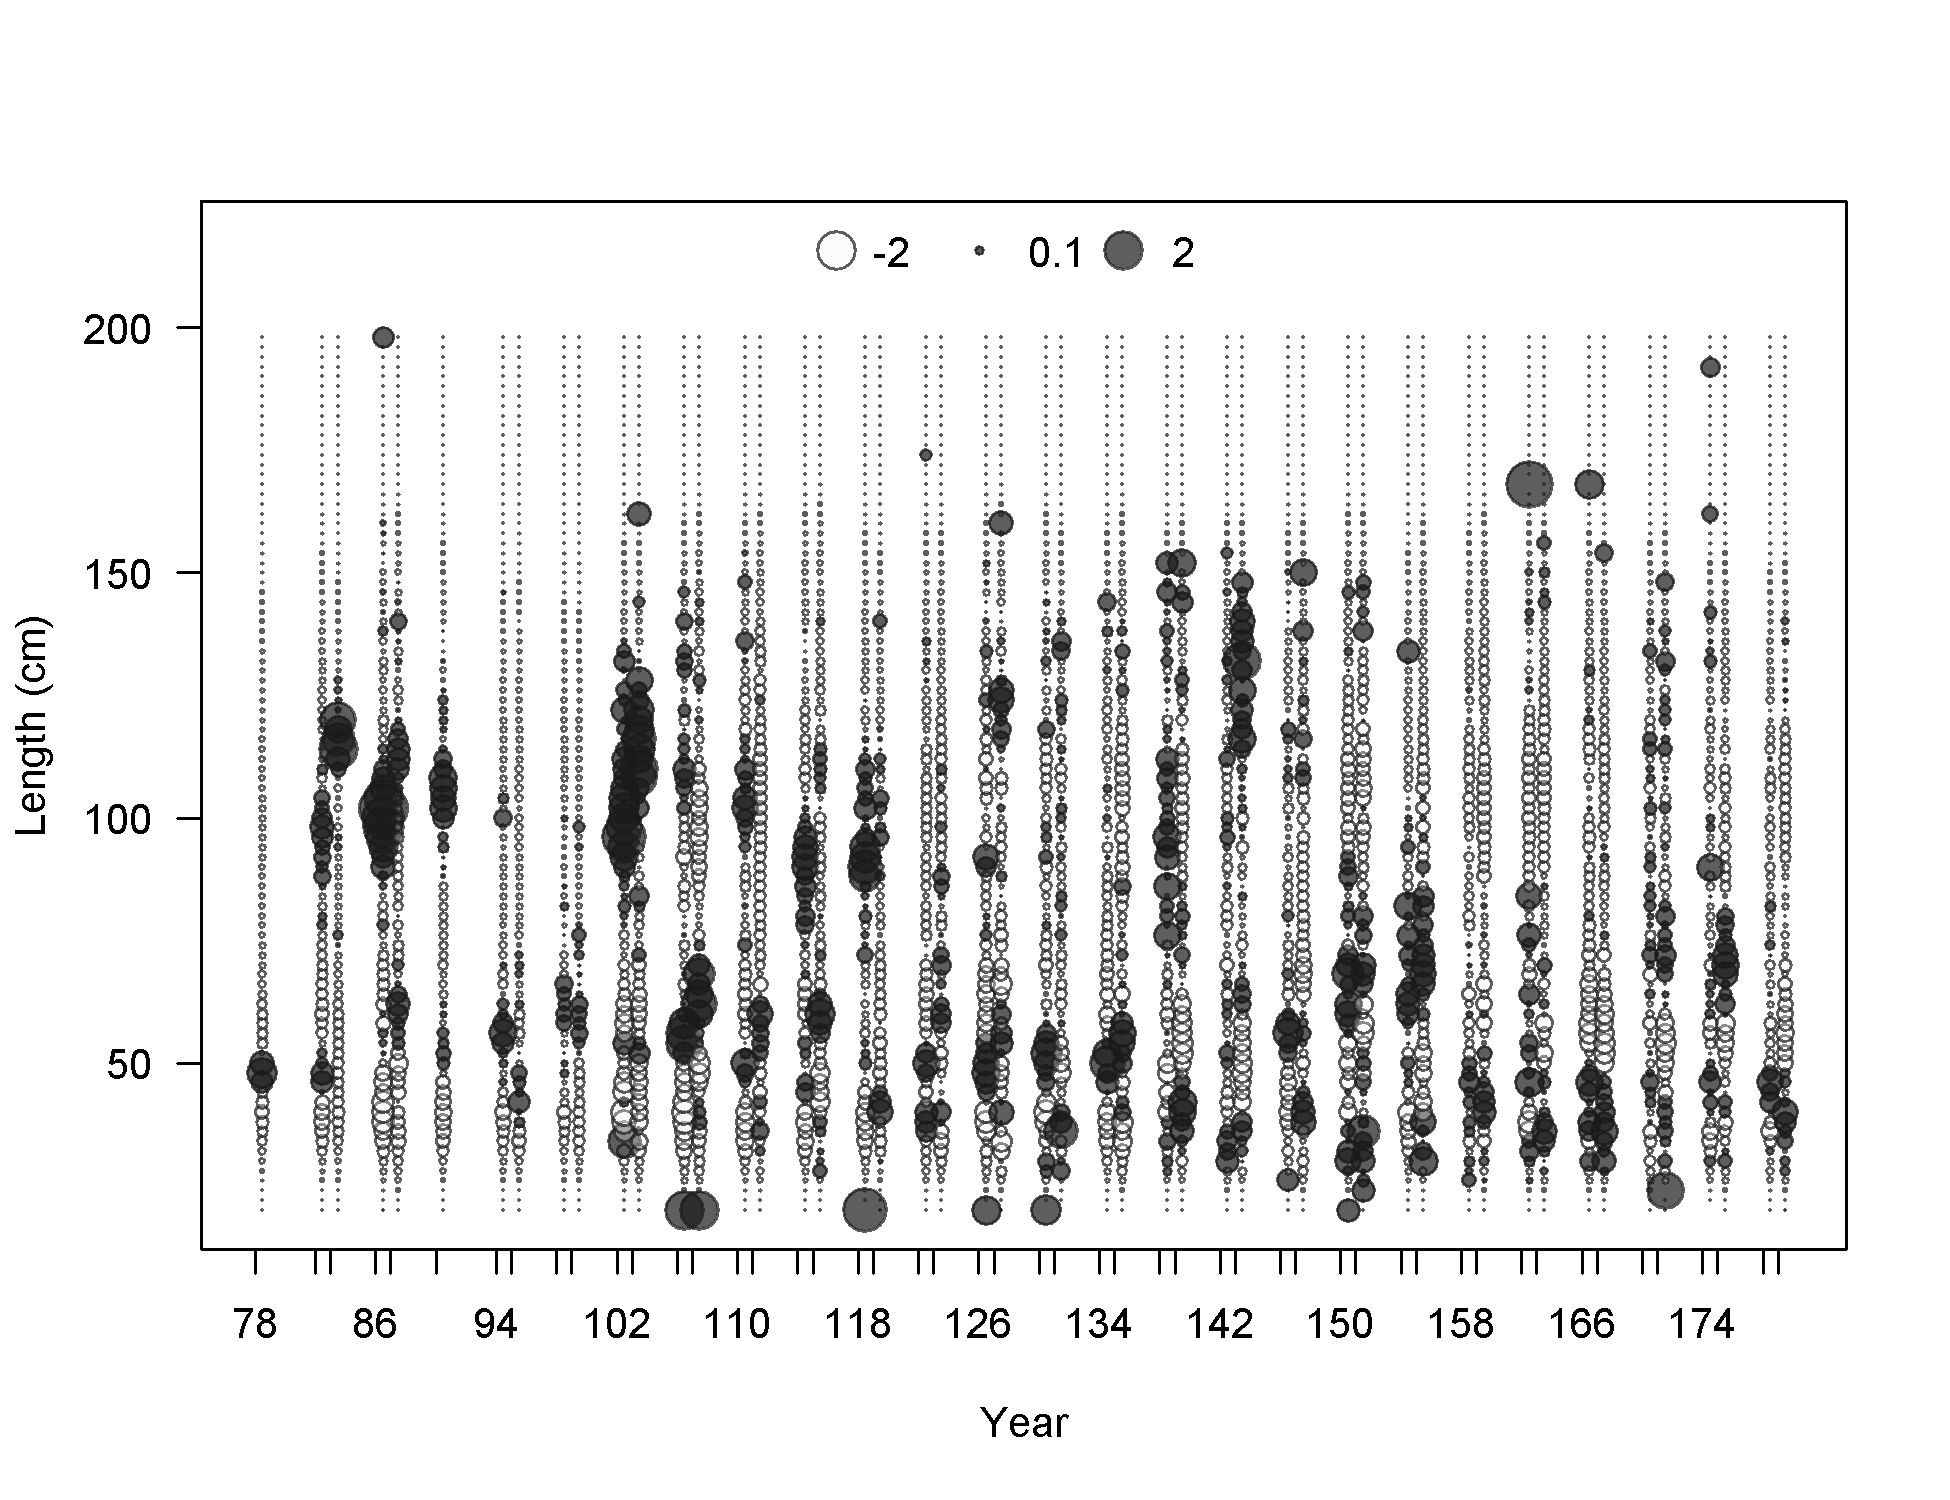
Pearson residuals, whole catch, F11-NOA_N (max=4.08) (plot 9 of 9)
Closed bubbles are positive residuals (observed > expected) and open bubbles are negative residuals (observed < expected).
file: comp_lenfit_residsflt11mkt0_page9.png
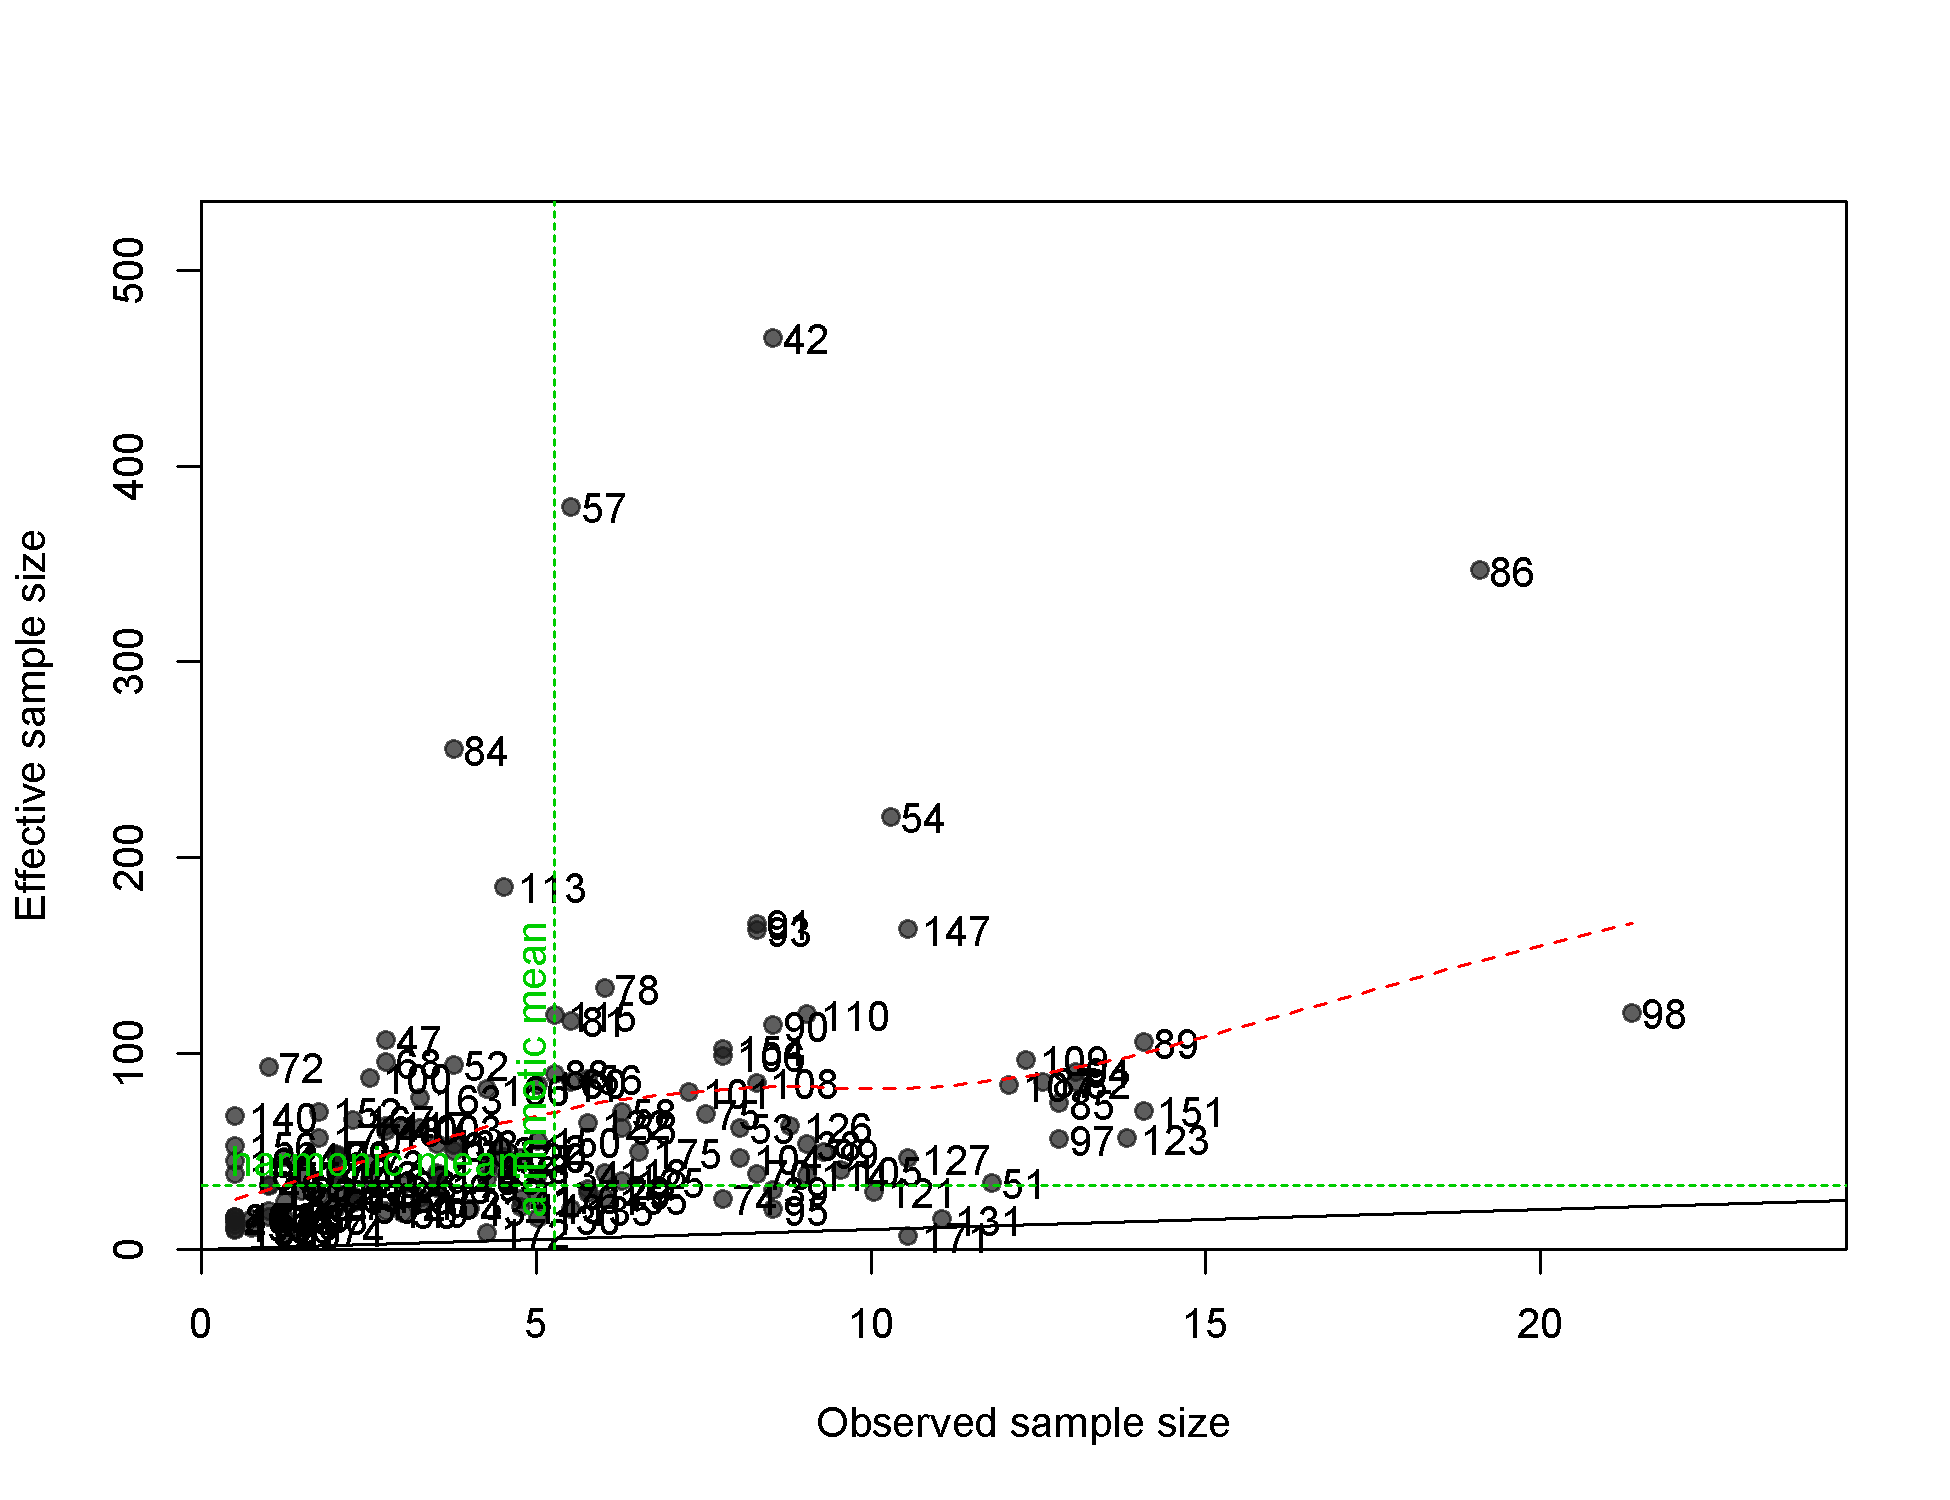
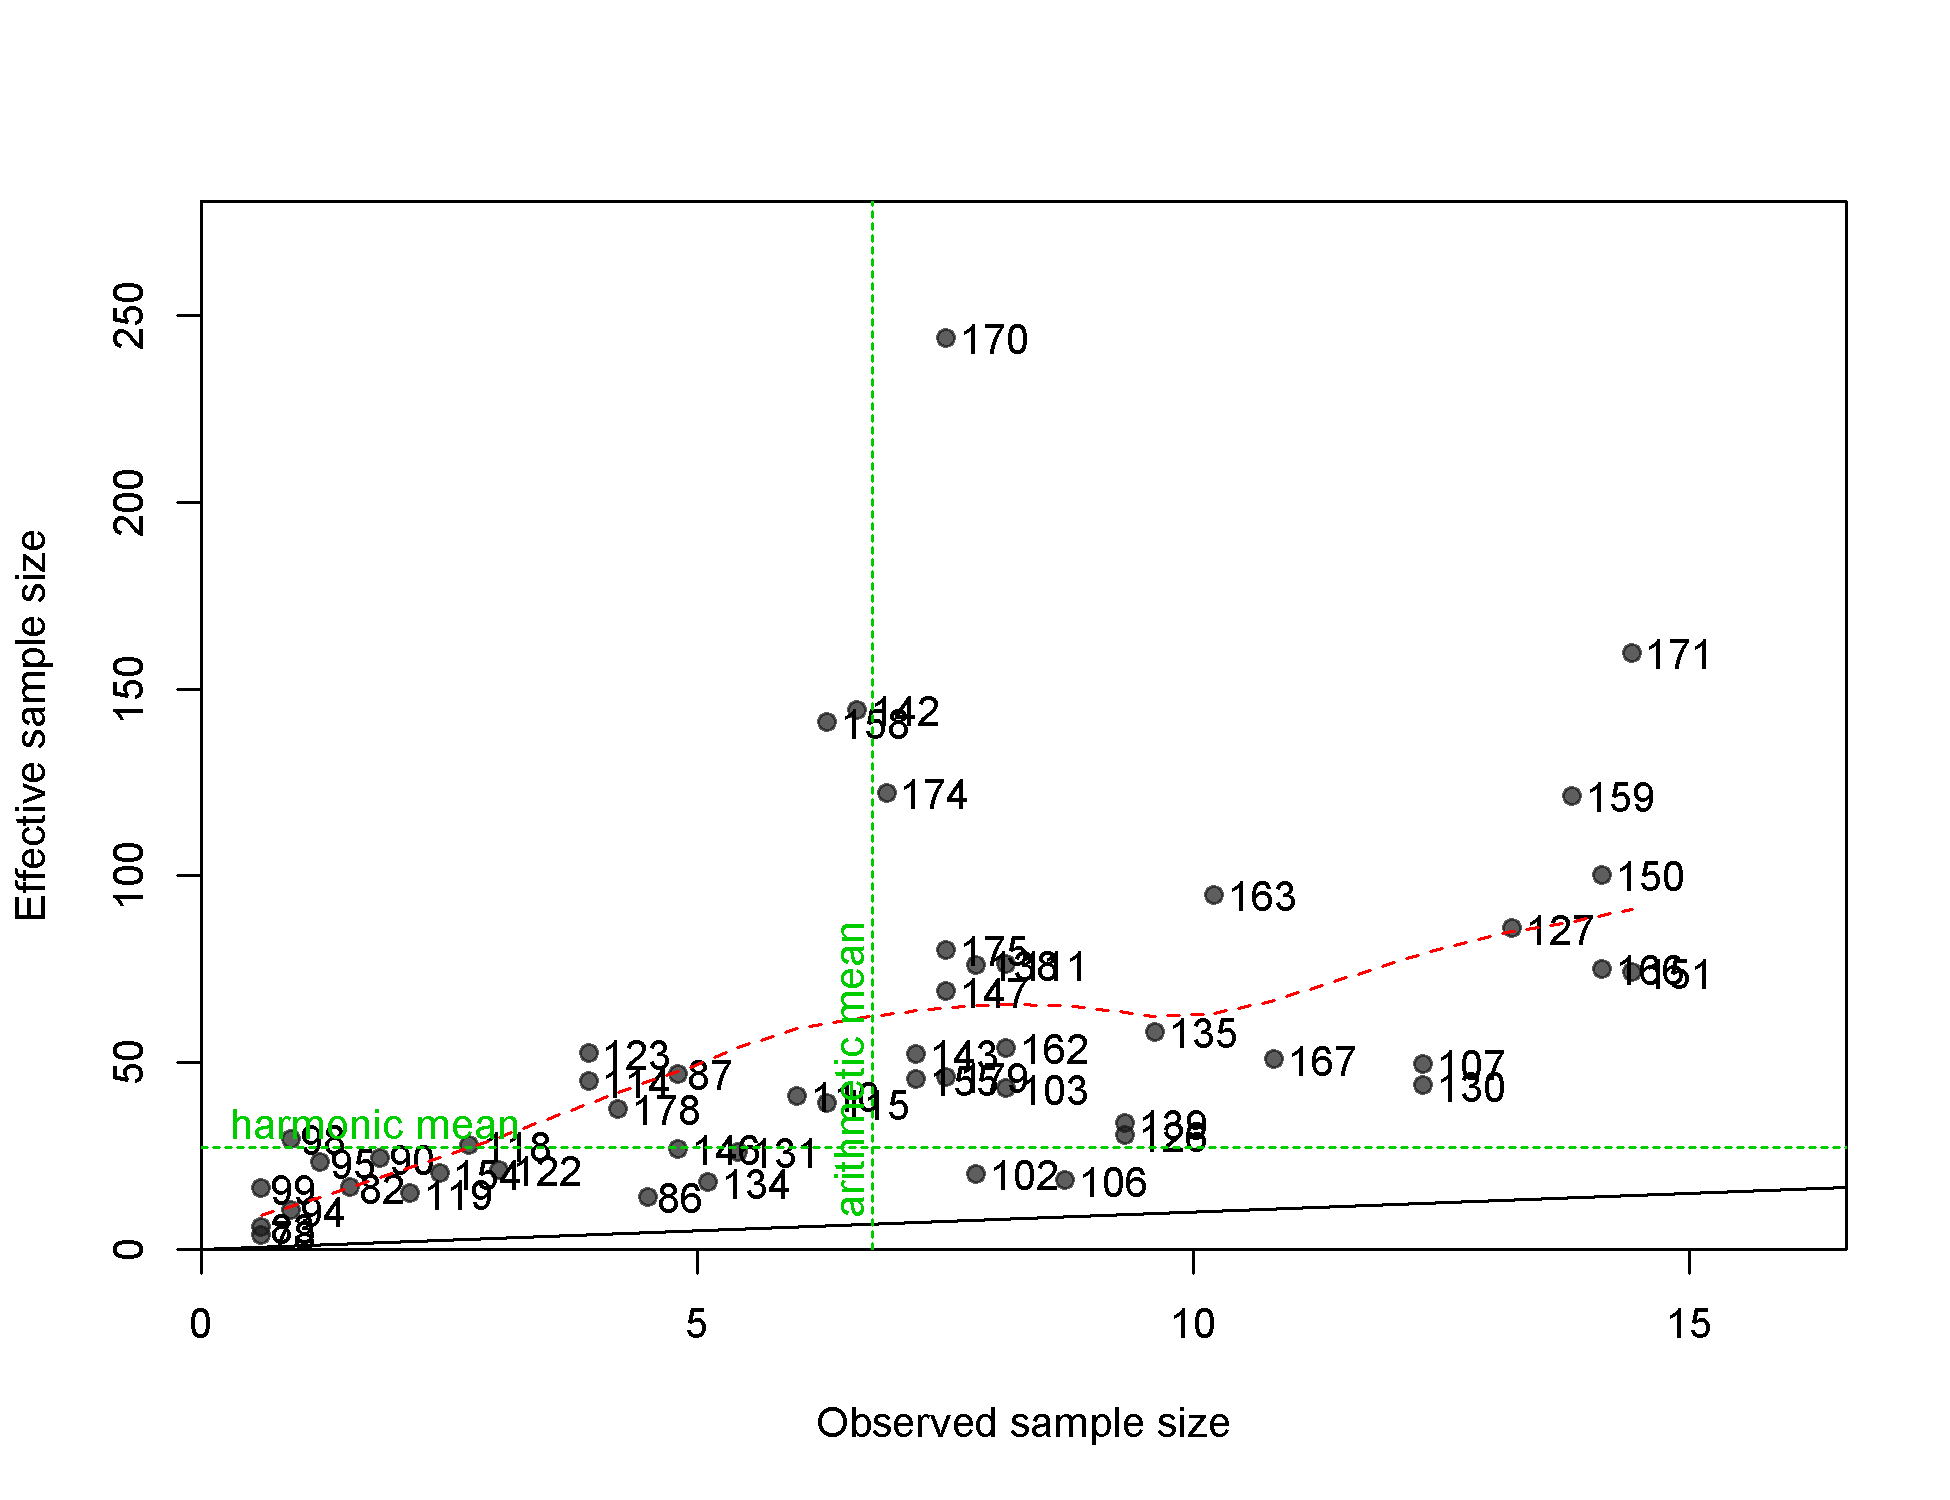
N-EffN comparison, Length comps, whole catch, F11-NOA_N
file: comp_lenfit_sampsize_flt11mkt0.png
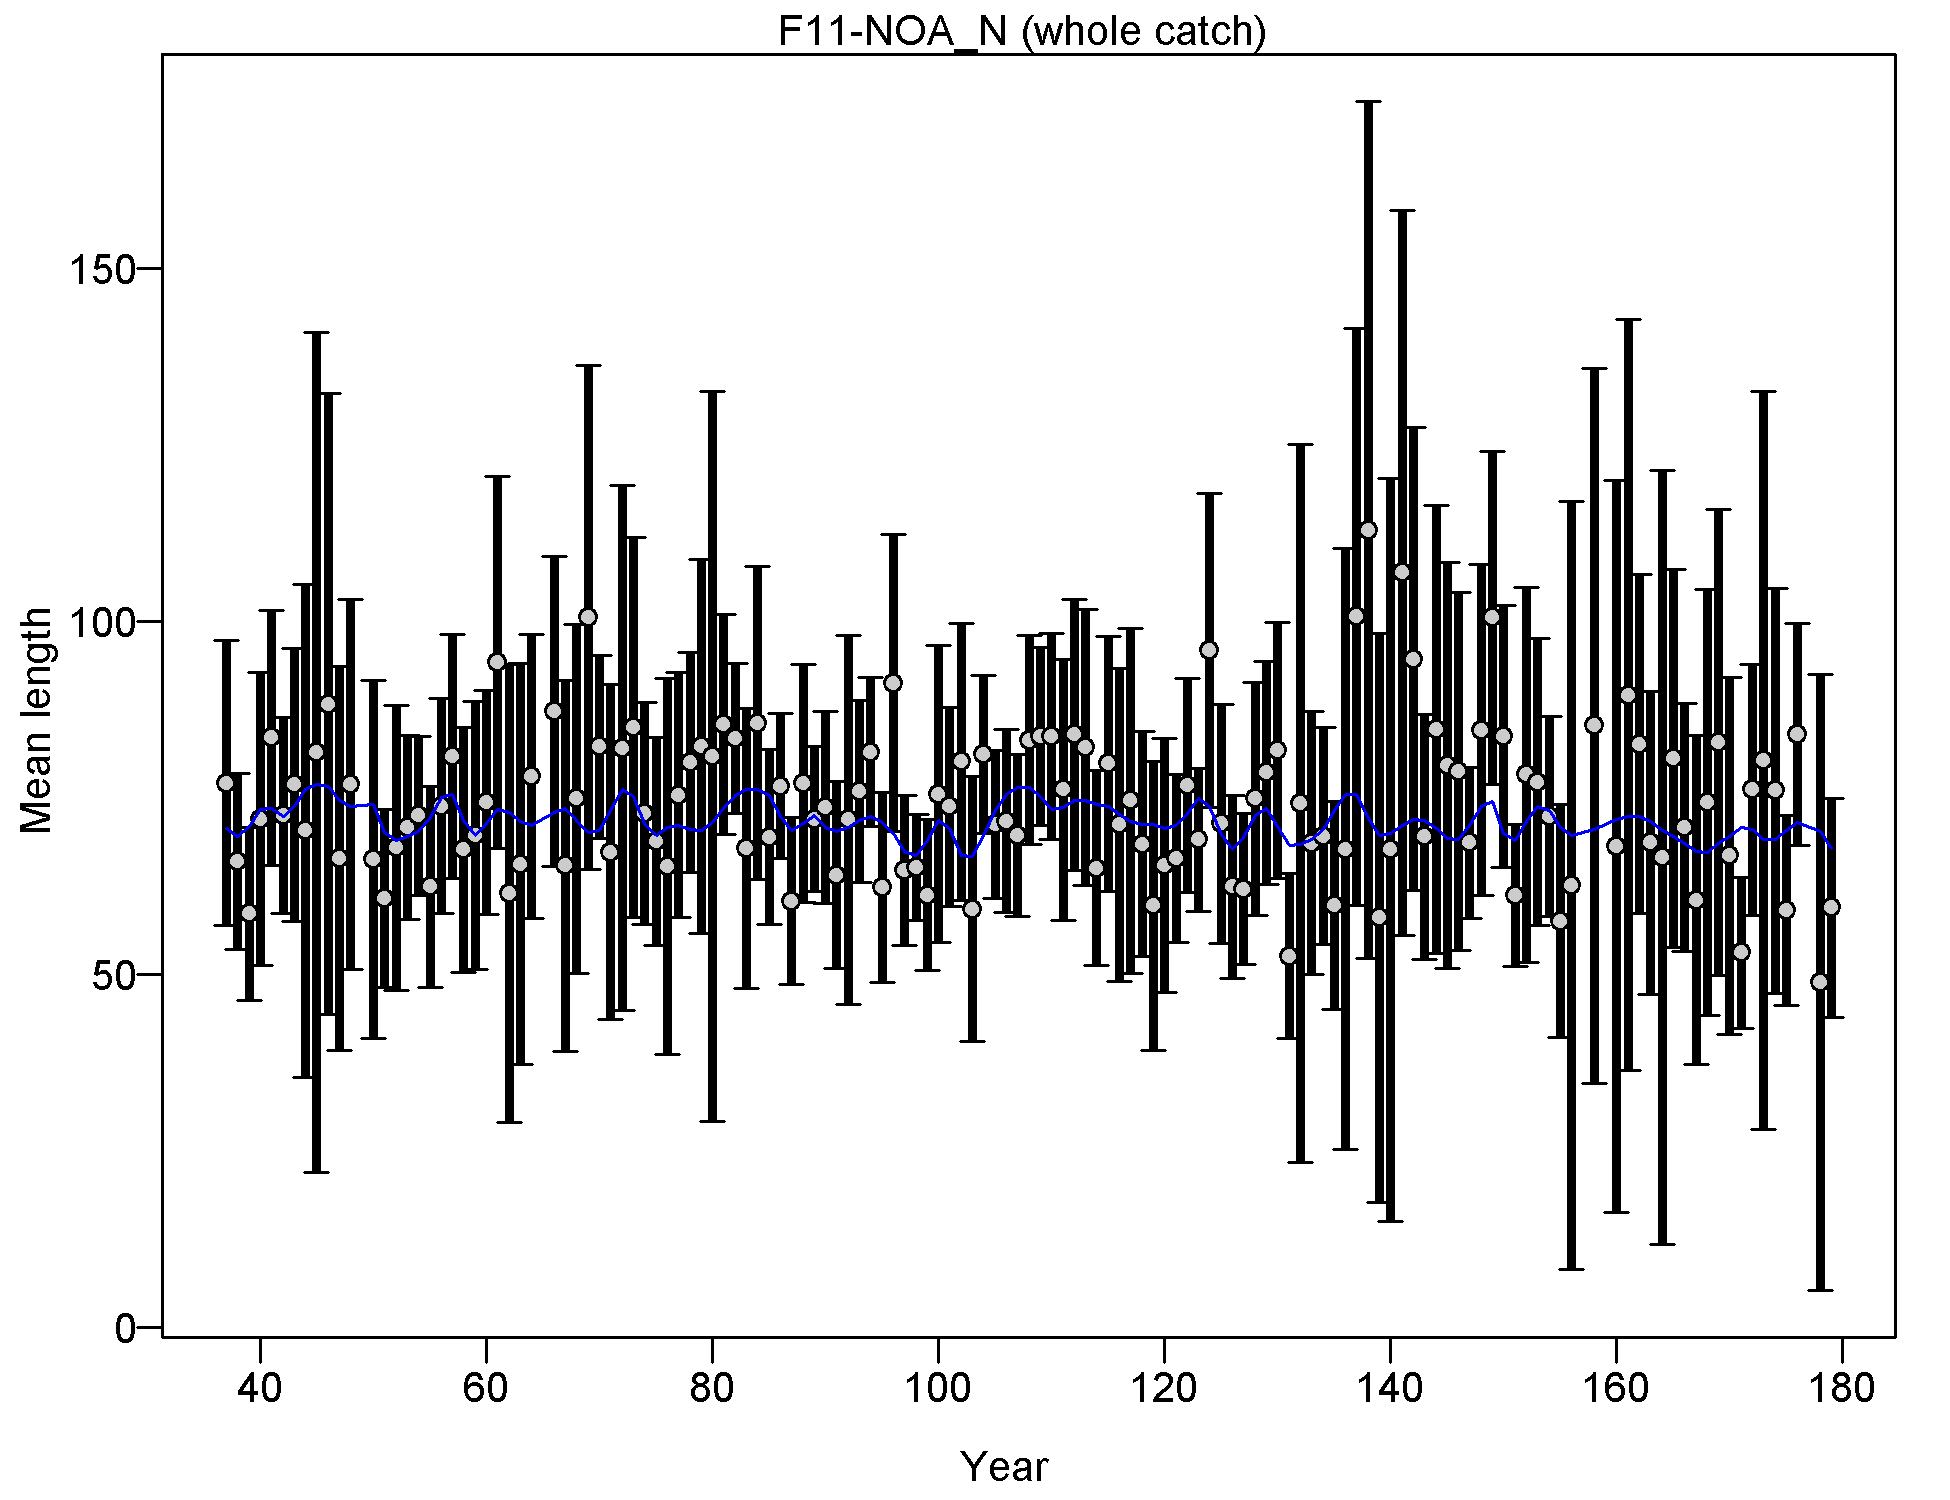
Mean length for F11-NOA_N with 95% confidence intervals based on current samples sizes.
Francis data weighting method TA1.8: thinner intervals (with capped ends) show result of further adjusting sample sizes based on suggested multiplier (with 95% interval) for len data from F11-NOA_N:
0.999 (0.7966-1.2877)
For more info, see
Francis, R.I.C.C. (2011). Data weighting in statistical fisheries stock assessment models. Can. J. Fish. Aquat. Sci. 68: 1124-1138. https://doi.org/10.1139/f2011-025
file: comp_lenfit_data_weighting_TA1.8_F11-NOA_N.png
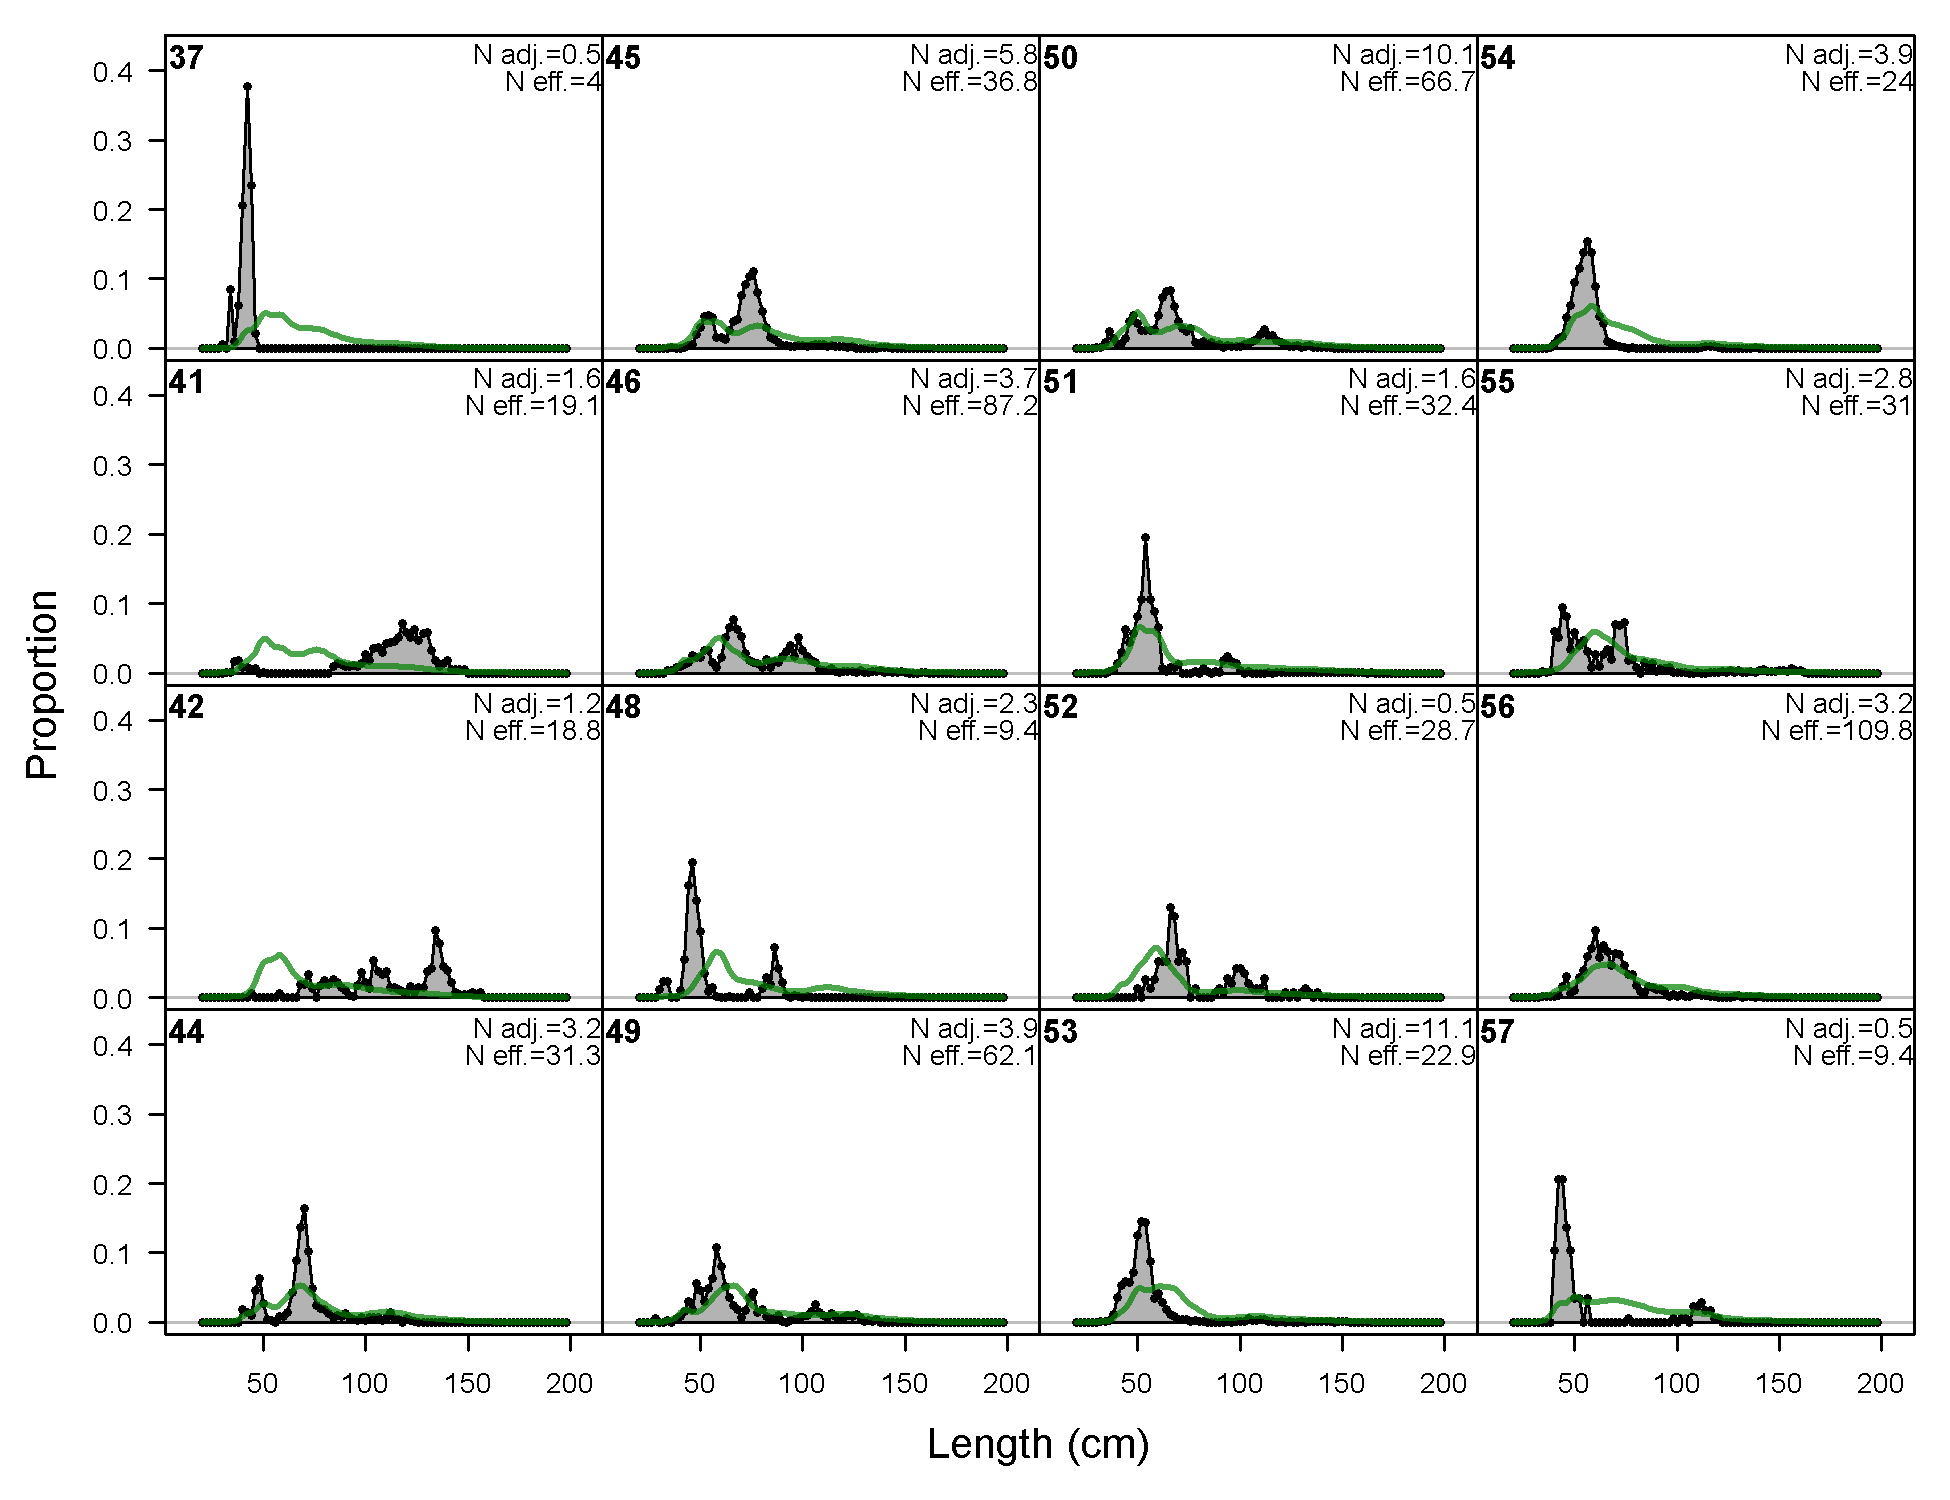
Length comps, whole catch, F12-NOA_C (plot 1 of 7).
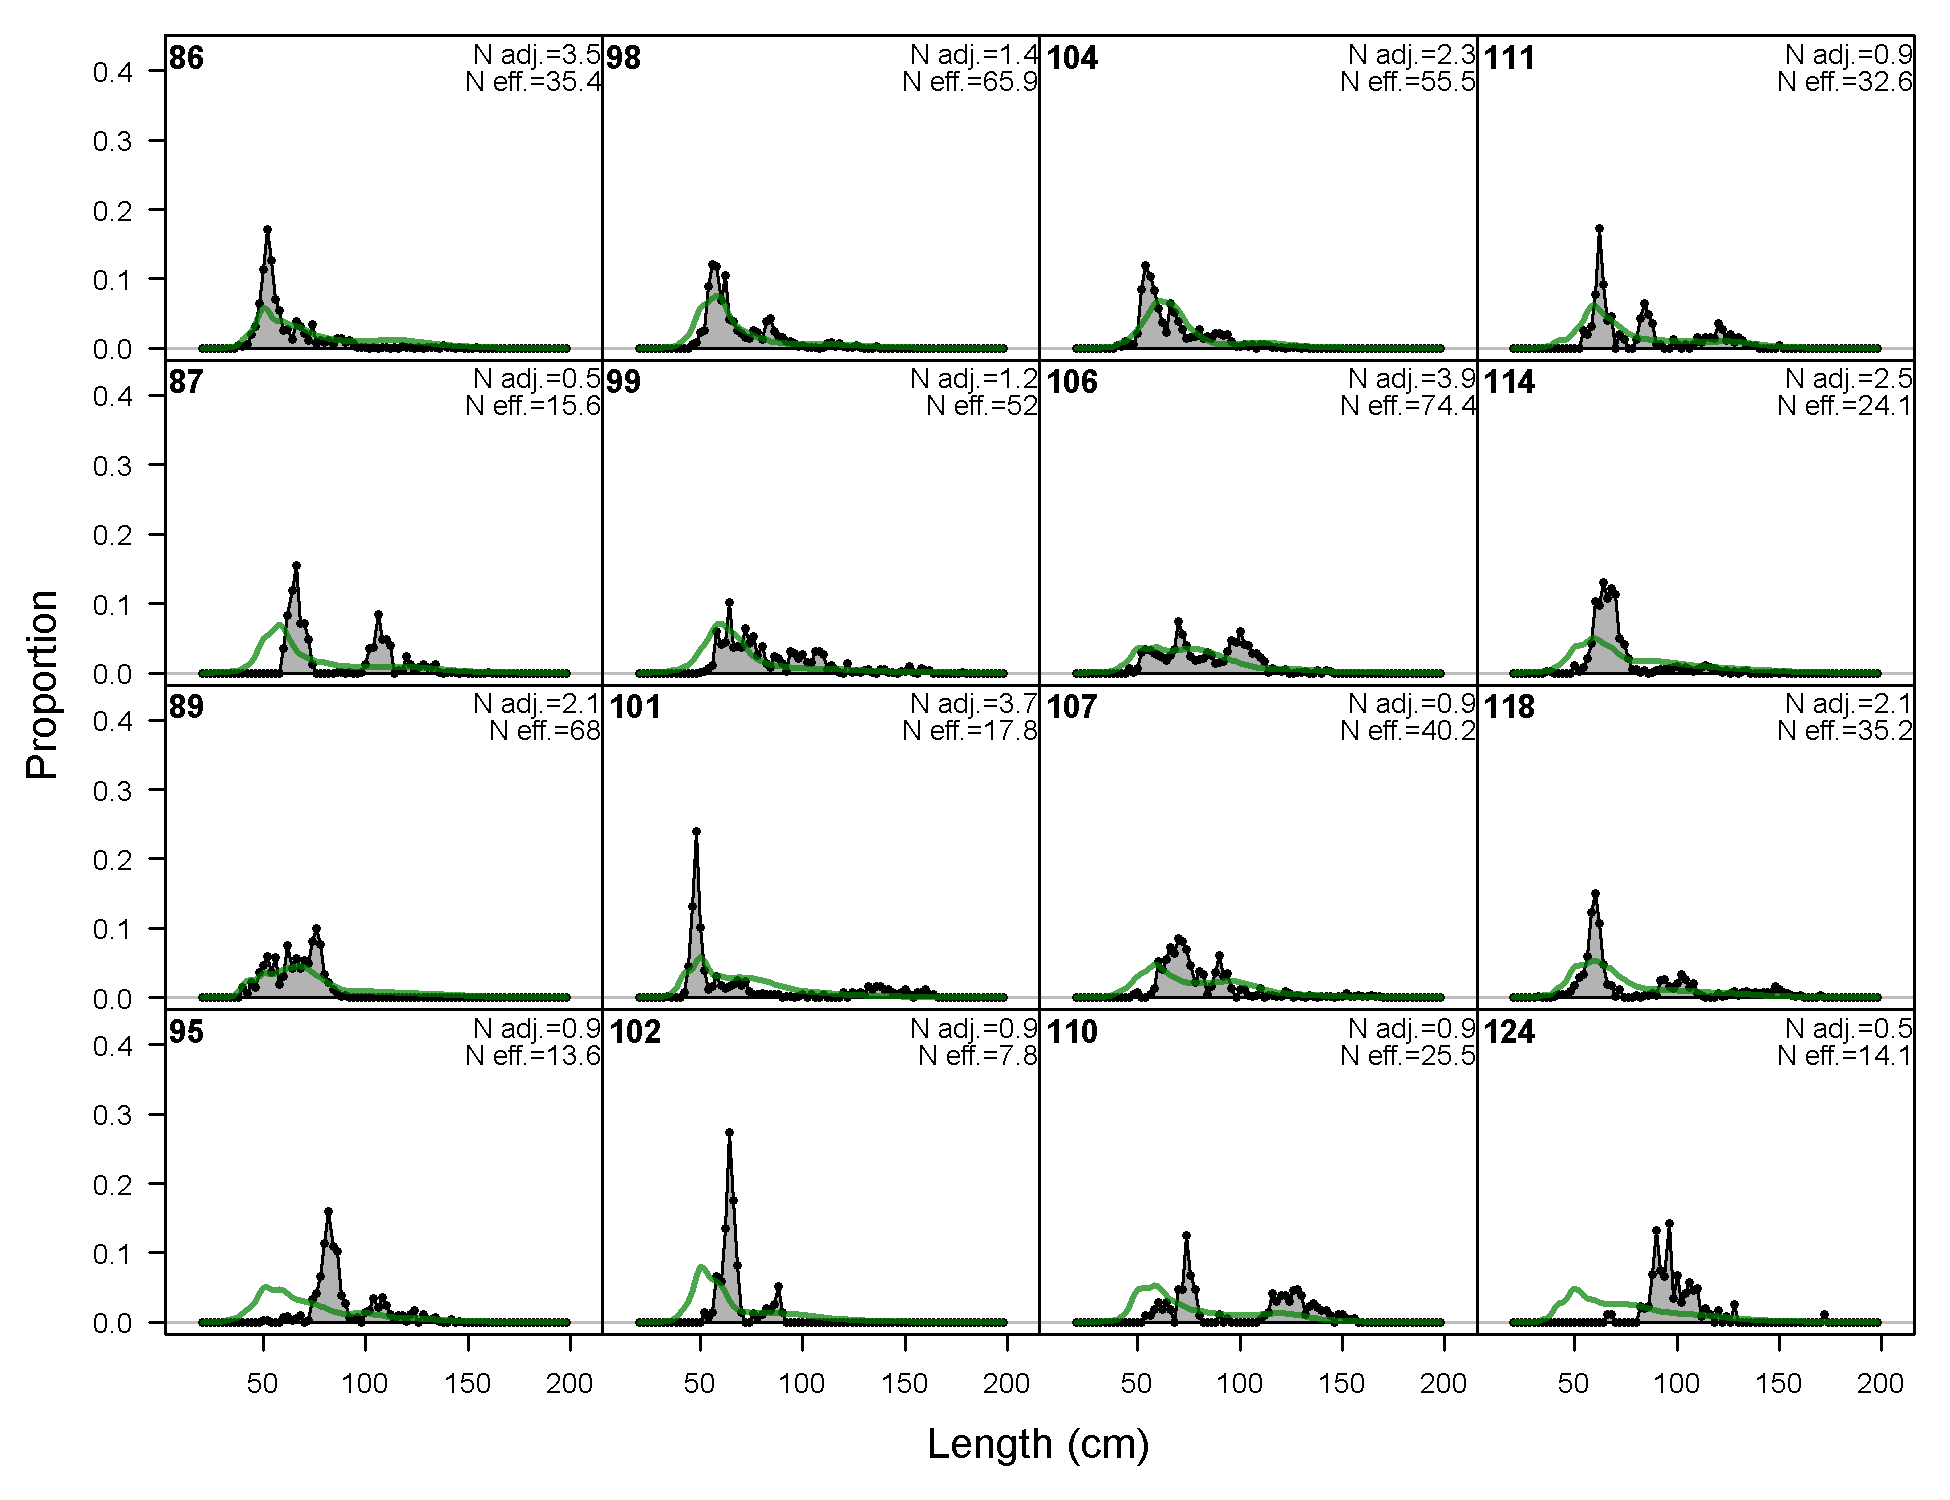
'N adj.' is the input sample size after data-weighting adjustment. N eff. is the calculated effective sample size used in the McAllister-Iannelli tuning method.
file: comp_lenfit_flt12mkt0_page1.png
Length comps, whole catch, F12-NOA_C (plot 2 of 7)
file: comp_lenfit_flt12mkt0_page2.png
Length comps, whole catch, F12-NOA_C (plot 3 of 7)
file: comp_lenfit_flt12mkt0_page3.png
Length comps, whole catch, F12-NOA_C (plot 4 of 7)
file: comp_lenfit_flt12mkt0_page4.png
Length comps, whole catch, F12-NOA_C (plot 5 of 7)
file: comp_lenfit_flt12mkt0_page5.png
Length comps, whole catch, F12-NOA_C (plot 6 of 7)
file: comp_lenfit_flt12mkt0_page6.png
Length comps, whole catch, F12-NOA_C (plot 7 of 7)
file: comp_lenfit_flt12mkt0_page7.png
Pearson residuals, whole catch, F12-NOA_C (max=5.72) (plot 7 of 7)
Closed bubbles are positive residuals (observed > expected) and open bubbles are negative residuals (observed < expected).
file: comp_lenfit_residsflt12mkt0_page7.png
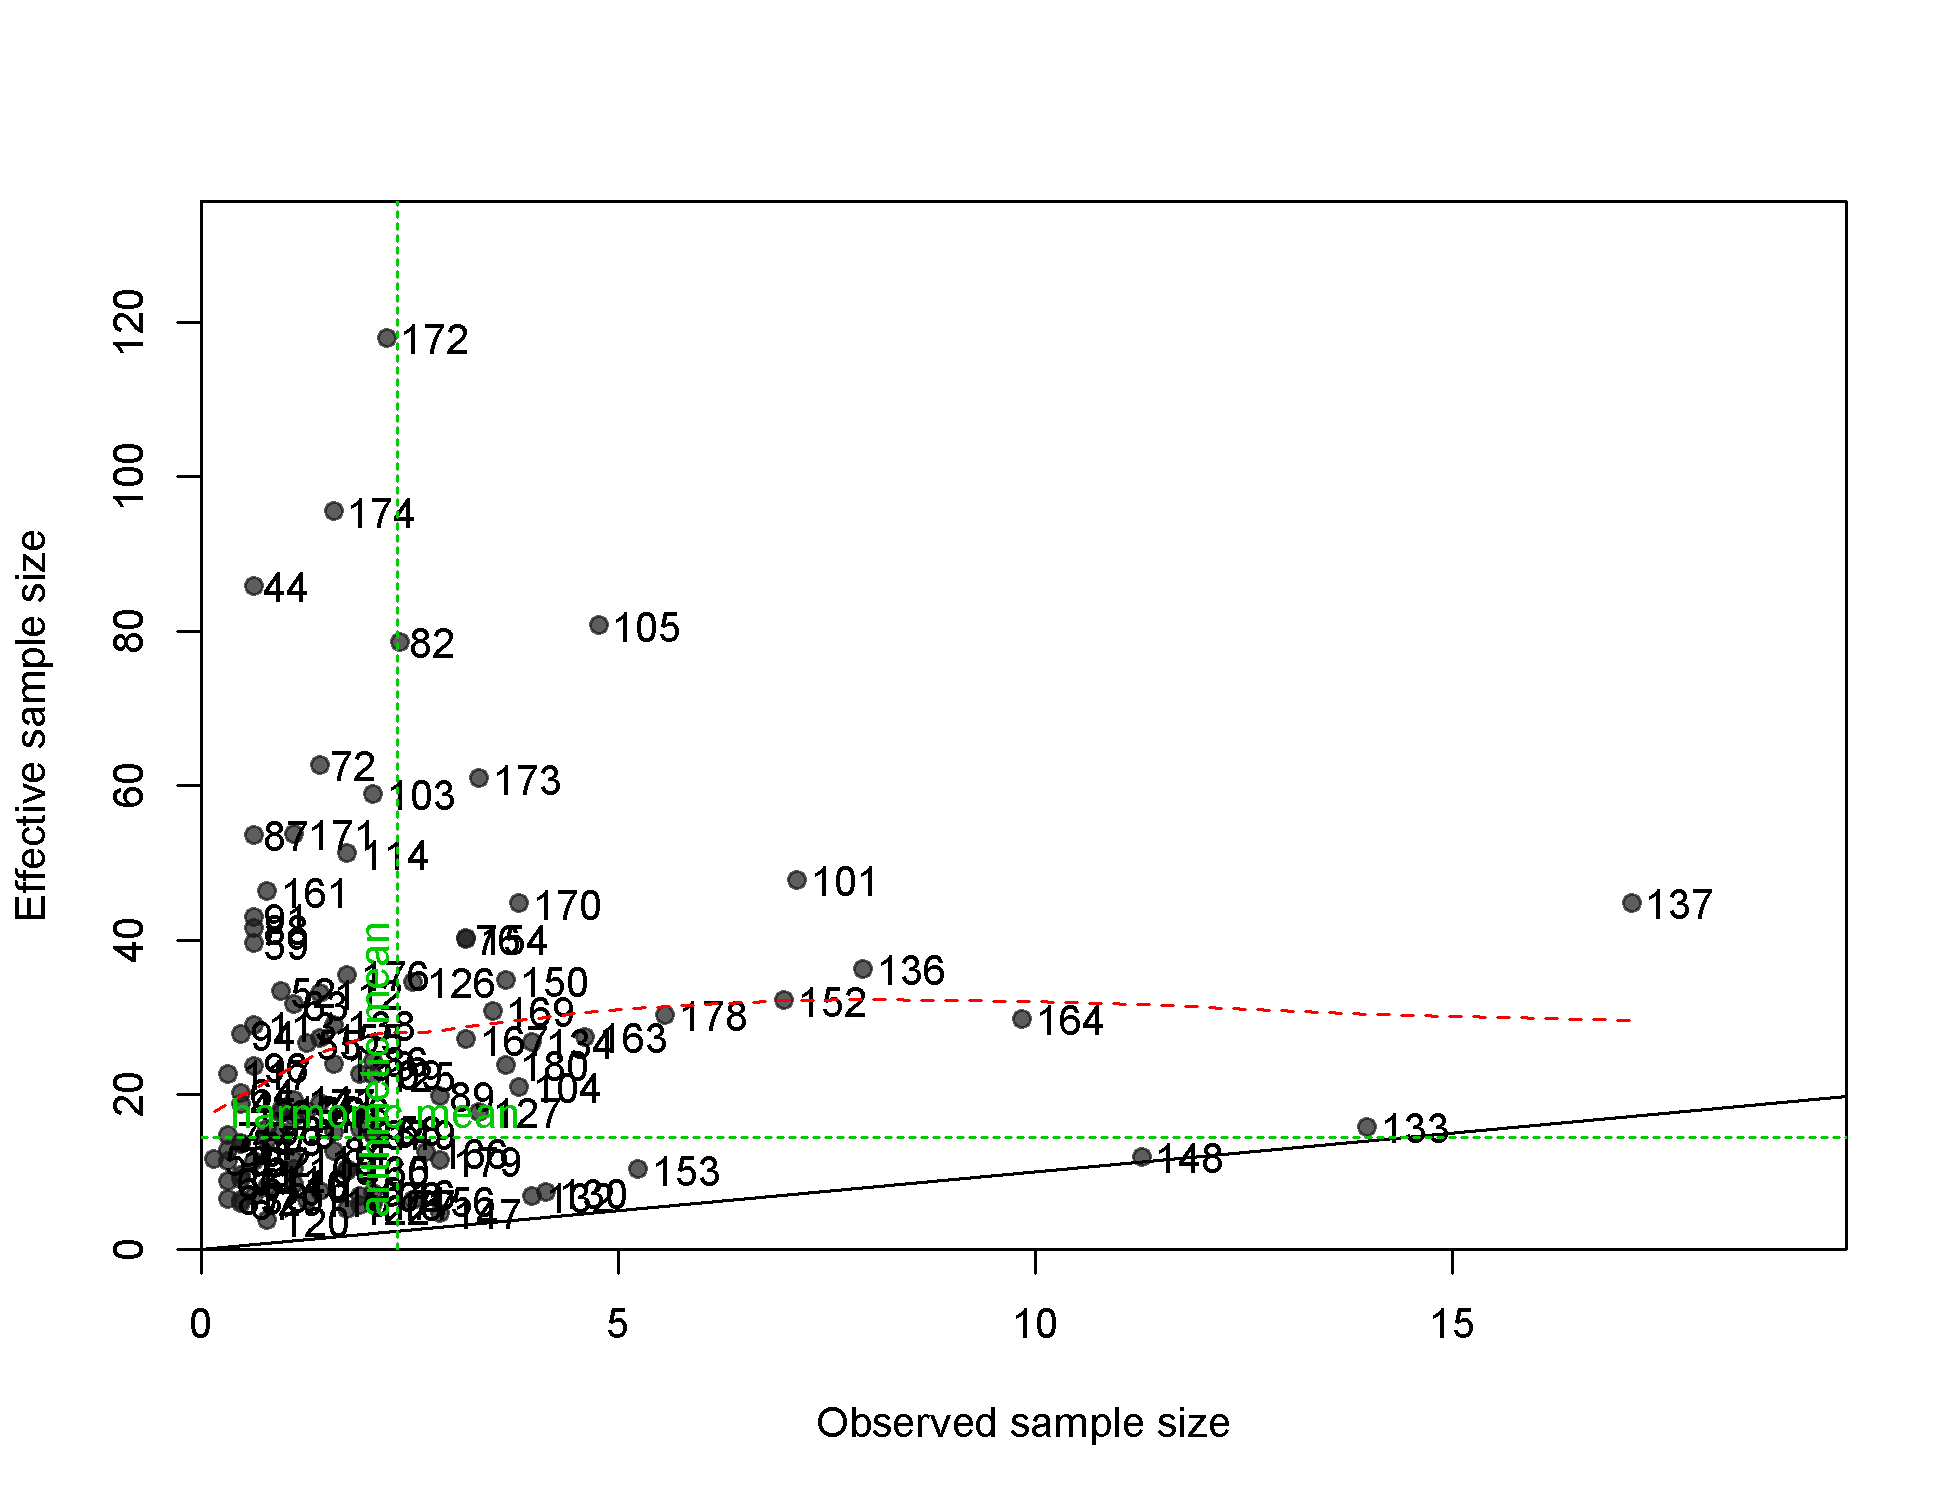
N-EffN comparison, Length comps, whole catch, F12-NOA_C
file: comp_lenfit_sampsize_flt12mkt0.png
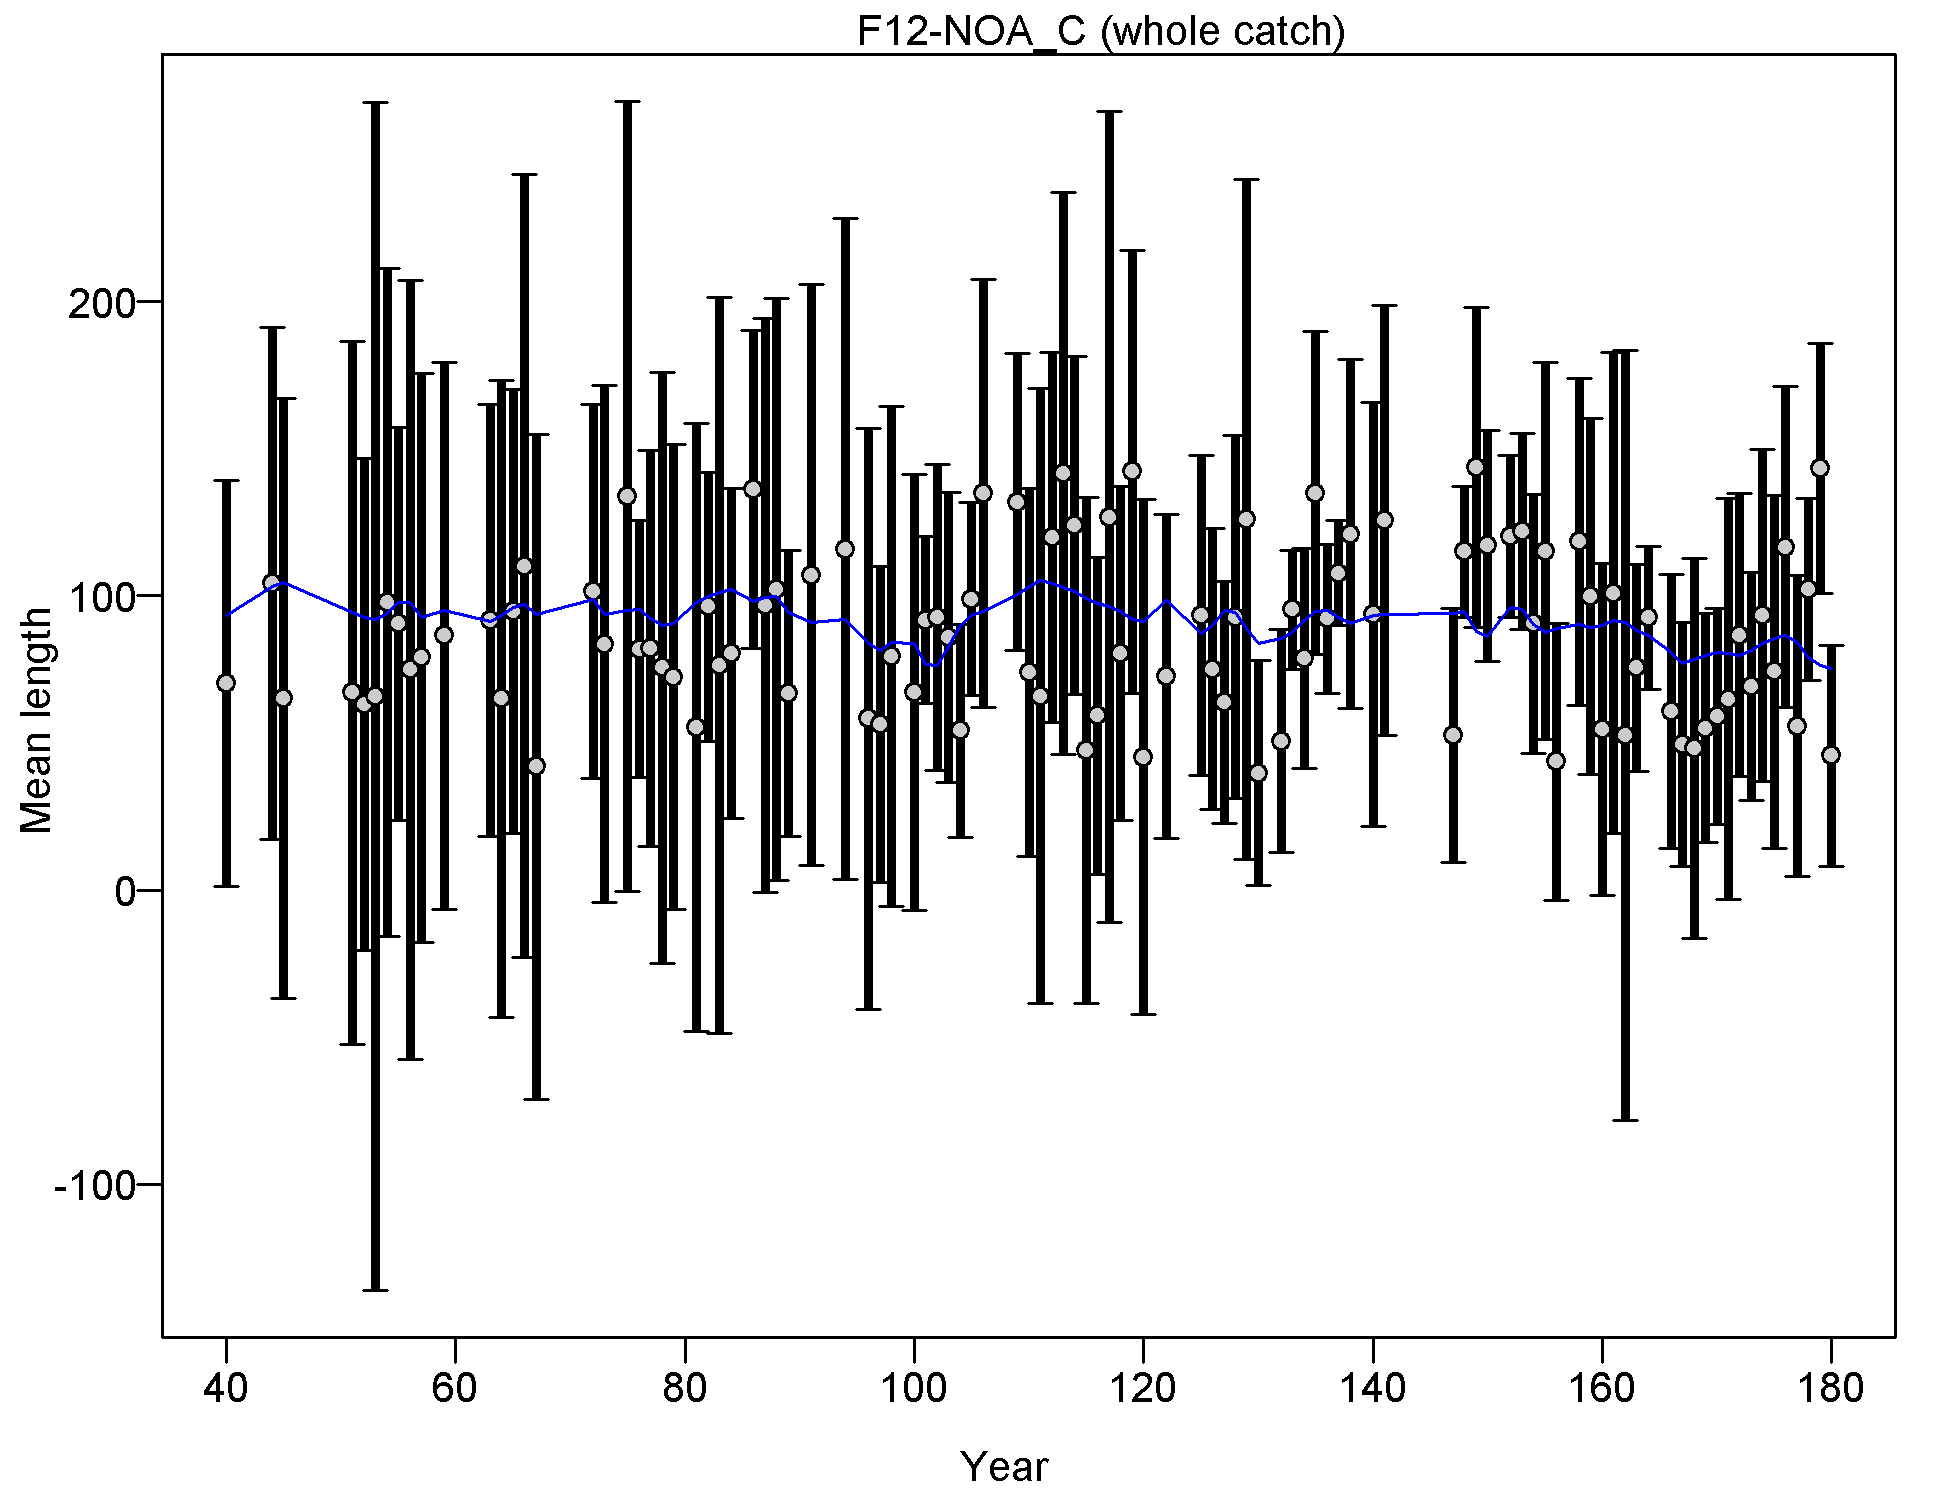
Mean length for F12-NOA_C with 95% confidence intervals based on current samples sizes.
Francis data weighting method TA1.8: thinner intervals (with capped ends) show result of further adjusting sample sizes based on suggested multiplier (with 95% interval) for len data from F12-NOA_C:
0.9986 (0.7741-1.4174)
For more info, see
Francis, R.I.C.C. (2011). Data weighting in statistical fisheries stock assessment models. Can. J. Fish. Aquat. Sci. 68: 1124-1138. https://doi.org/10.1139/f2011-025
file: comp_lenfit_data_weighting_TA1.8_F12-NOA_C.png
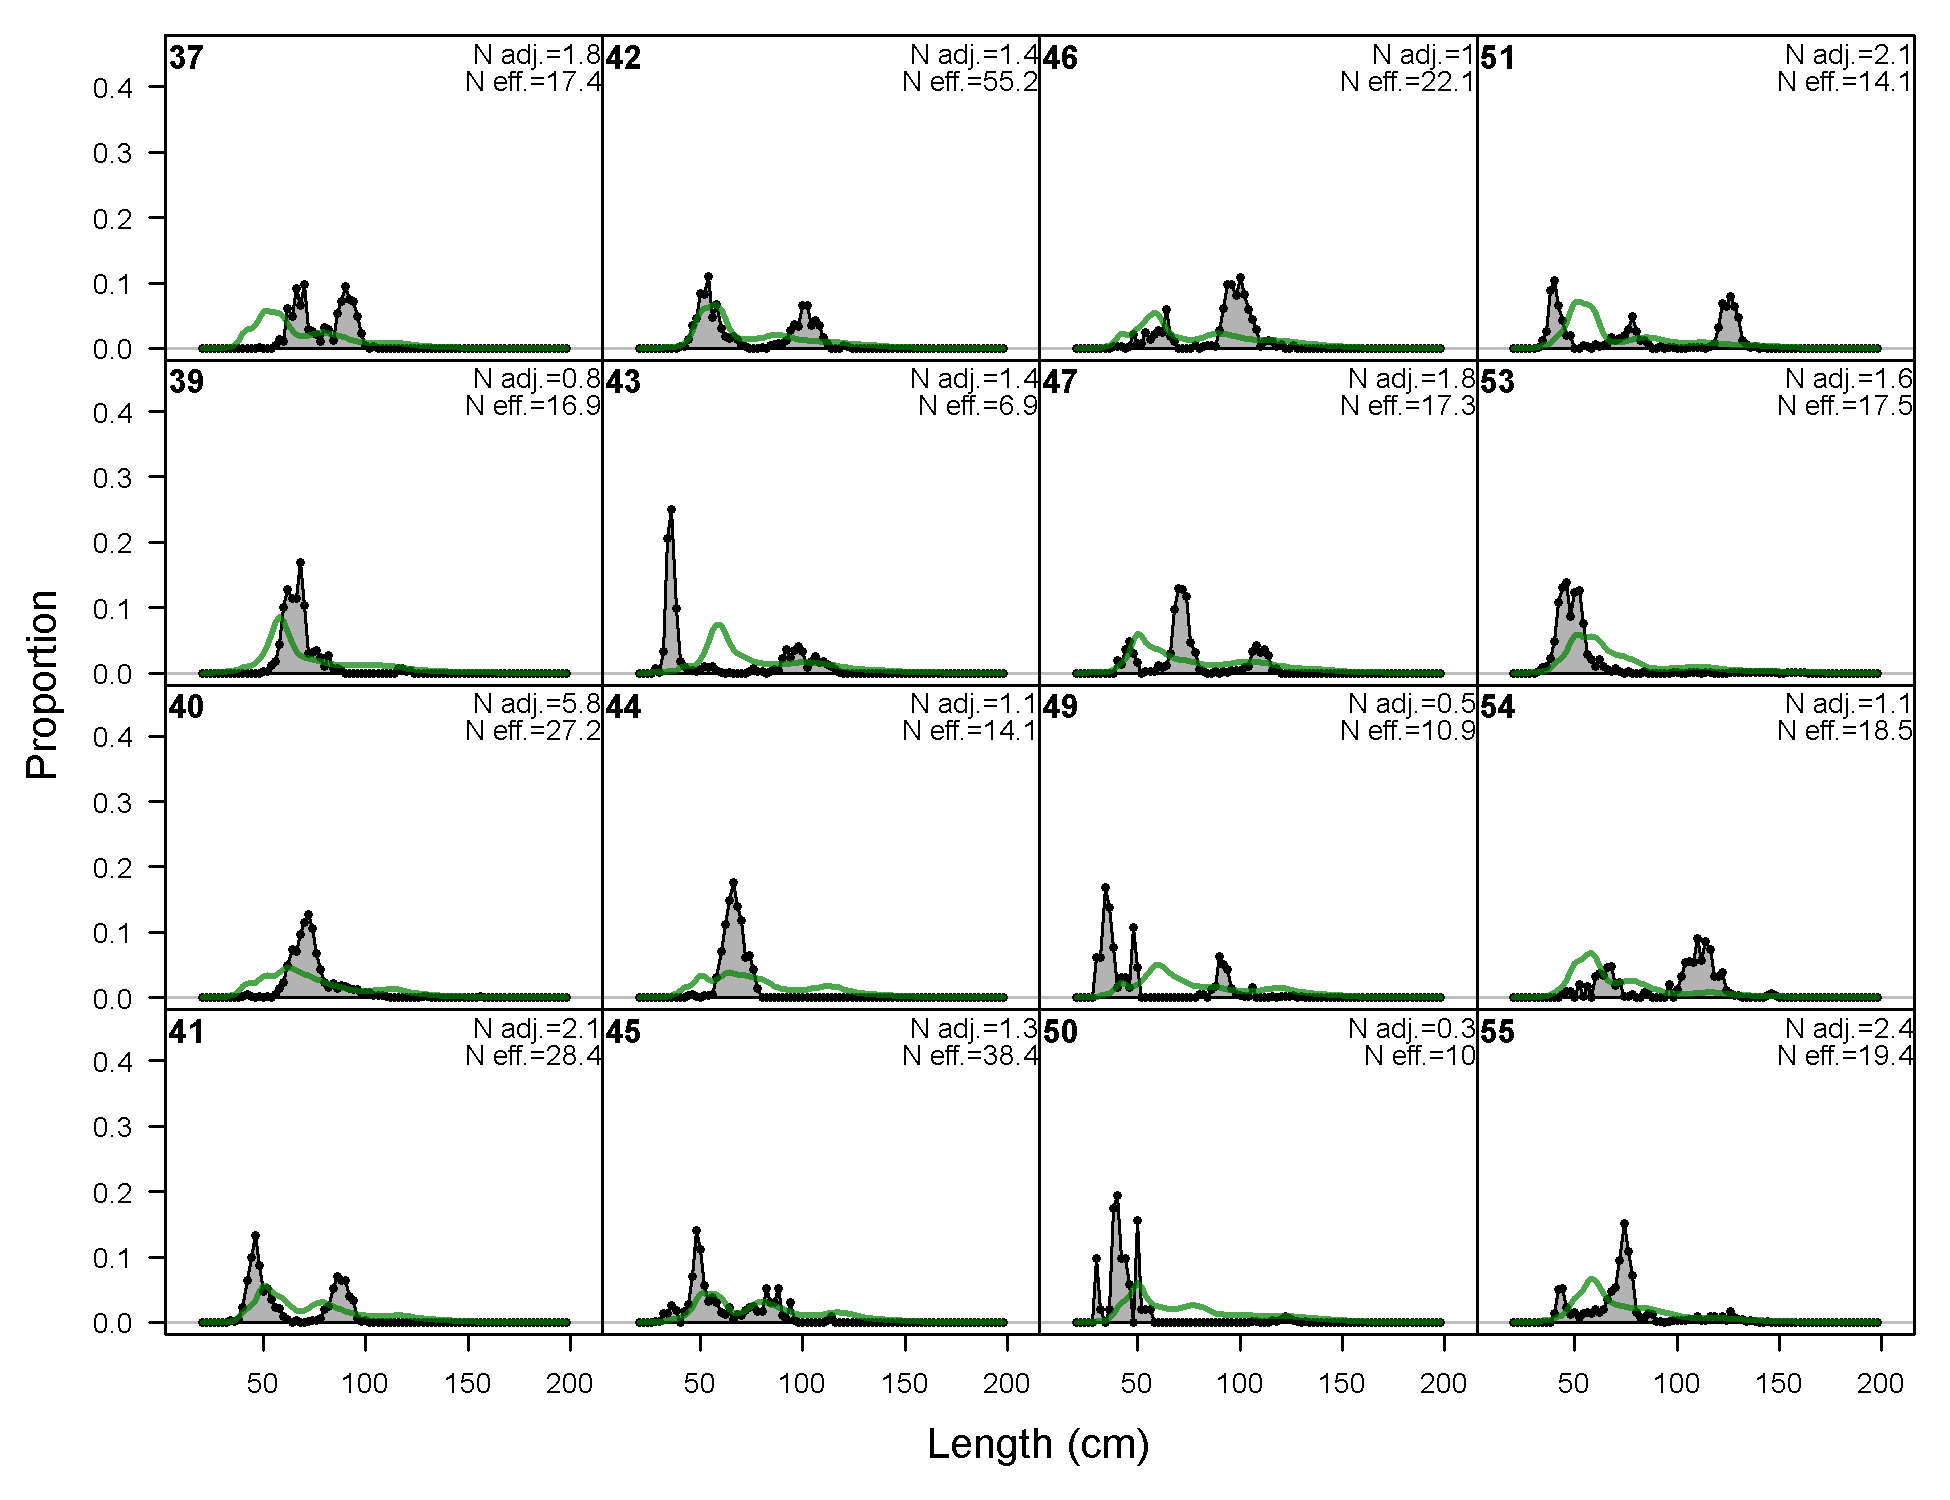
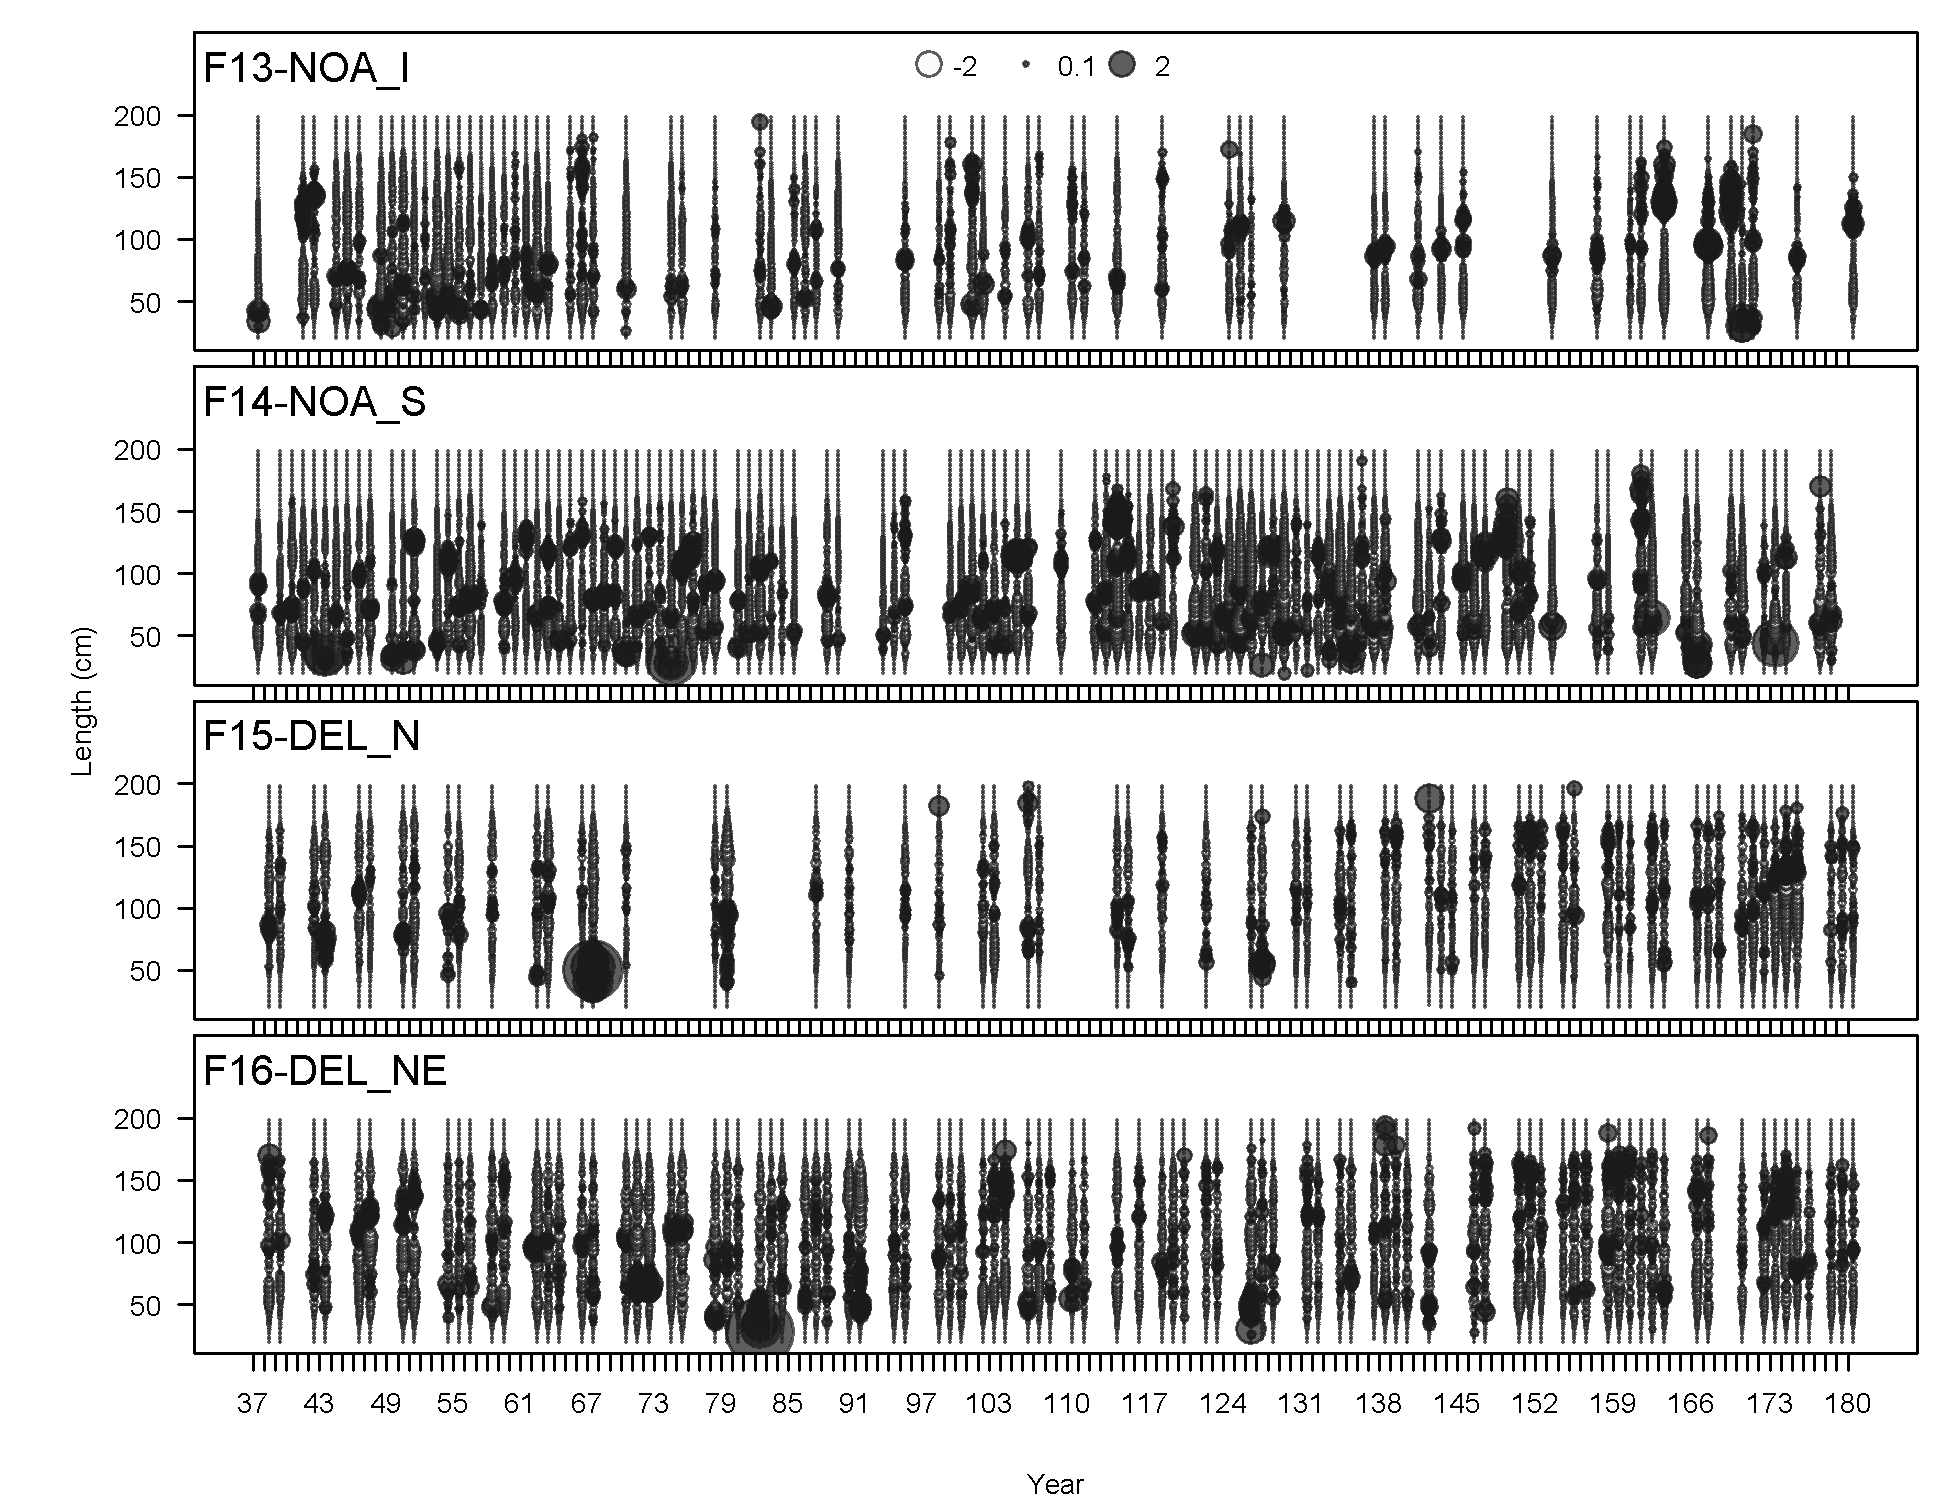
Length comps, whole catch, F13-NOA_I (plot 1 of 5).
'N adj.' is the input sample size after data-weighting adjustment. N eff. is the calculated effective sample size used in the McAllister-Iannelli tuning method.
file: comp_lenfit_flt13mkt0_page1.png

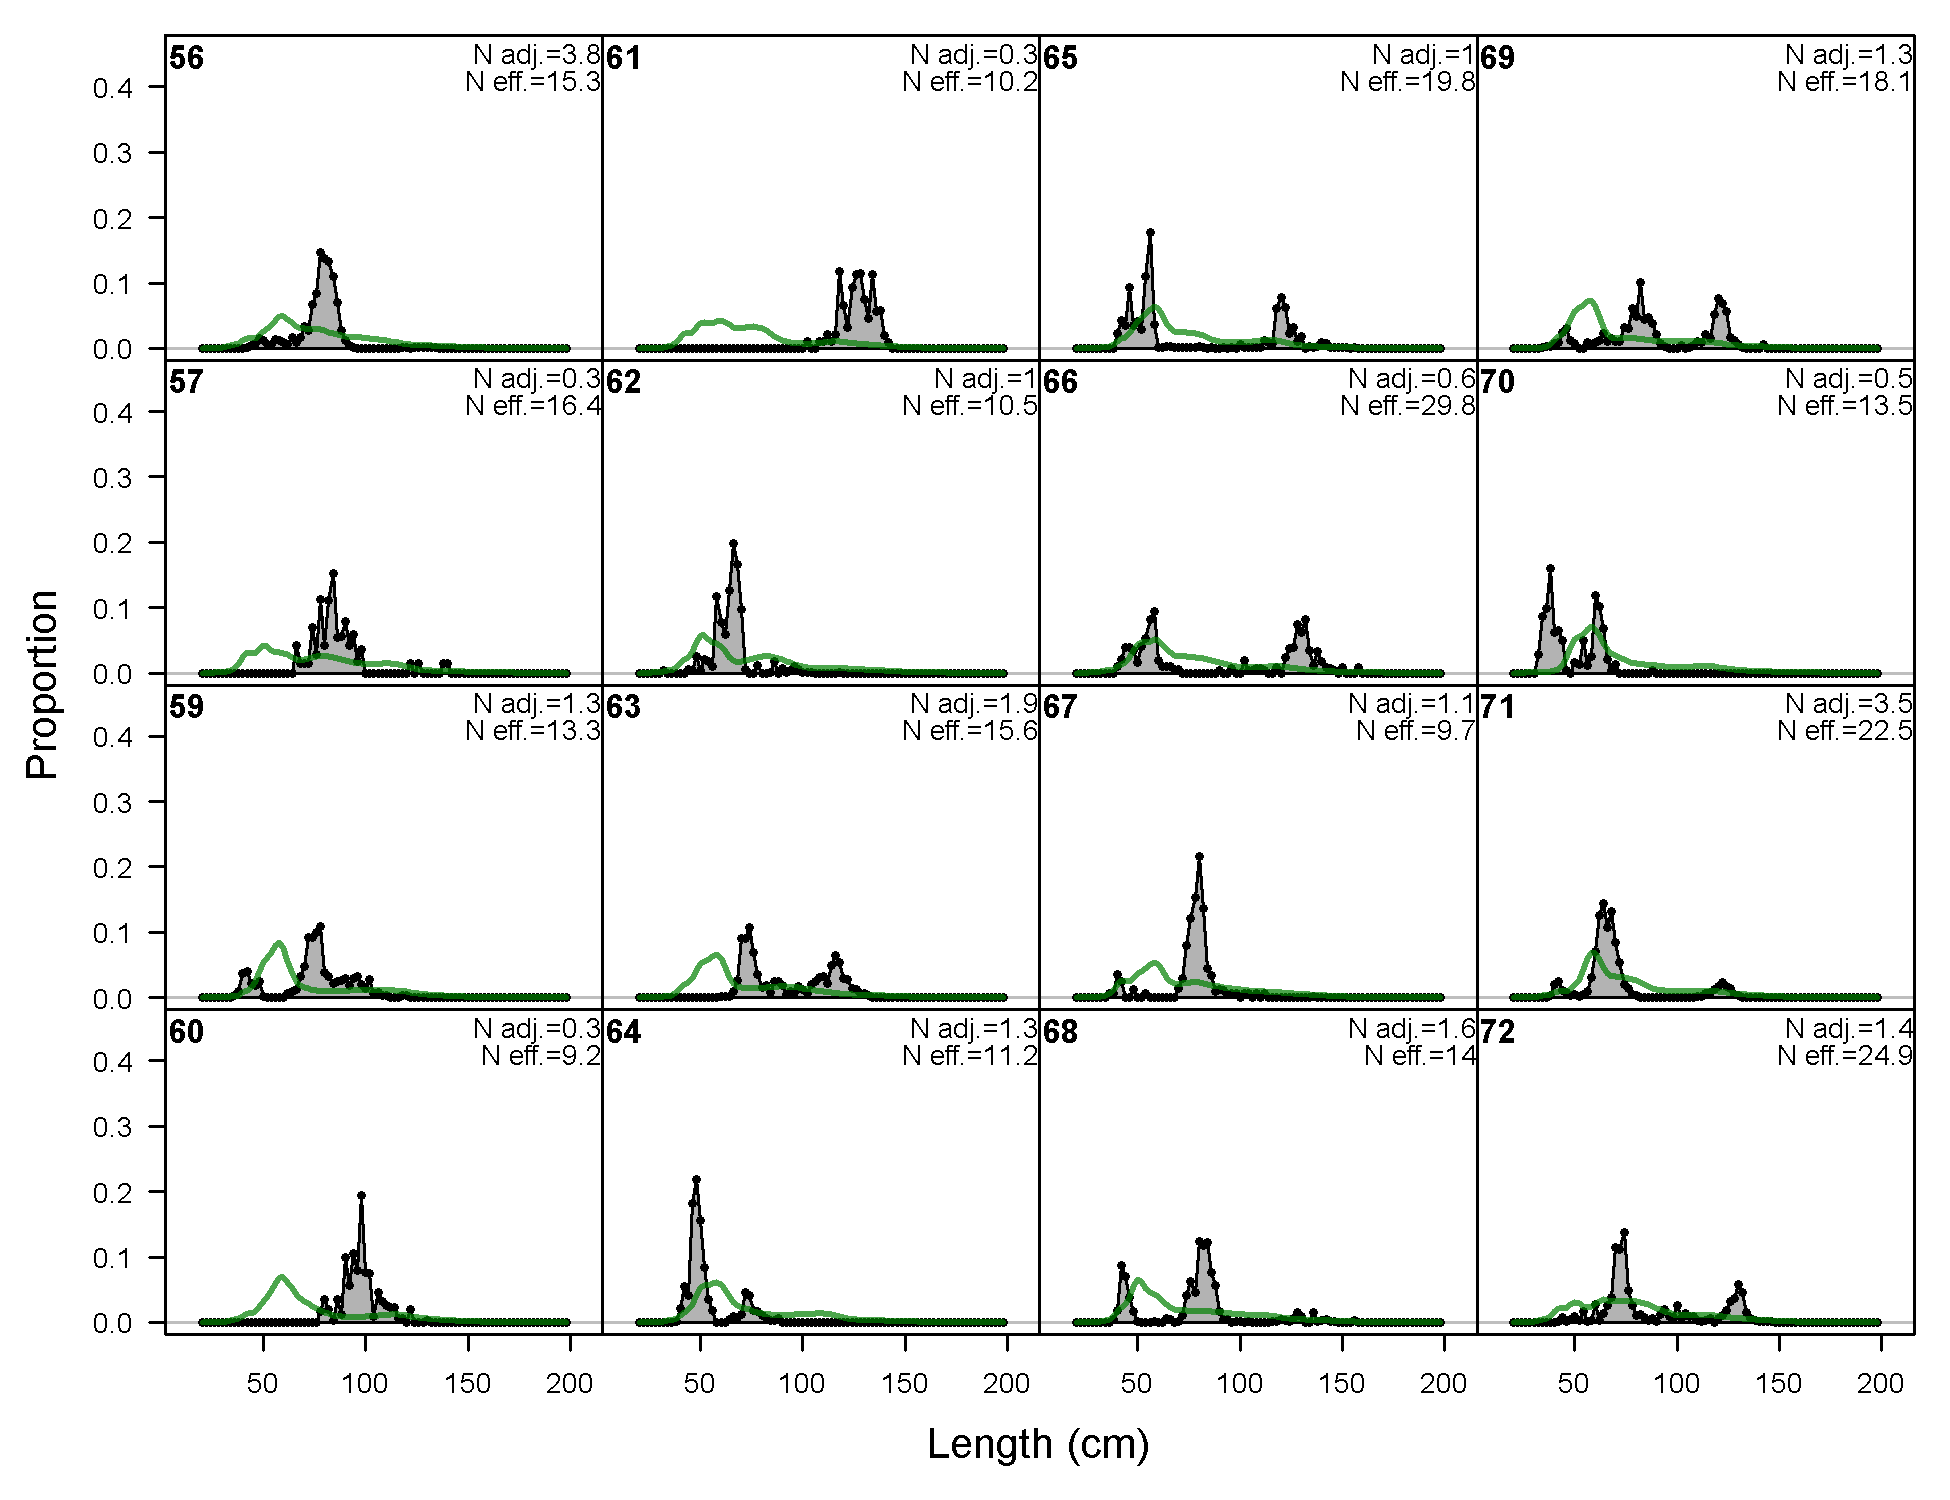
Length comps, whole catch, F13-NOA_I (plot 2 of 5)
file: comp_lenfit_flt13mkt0_page2.png
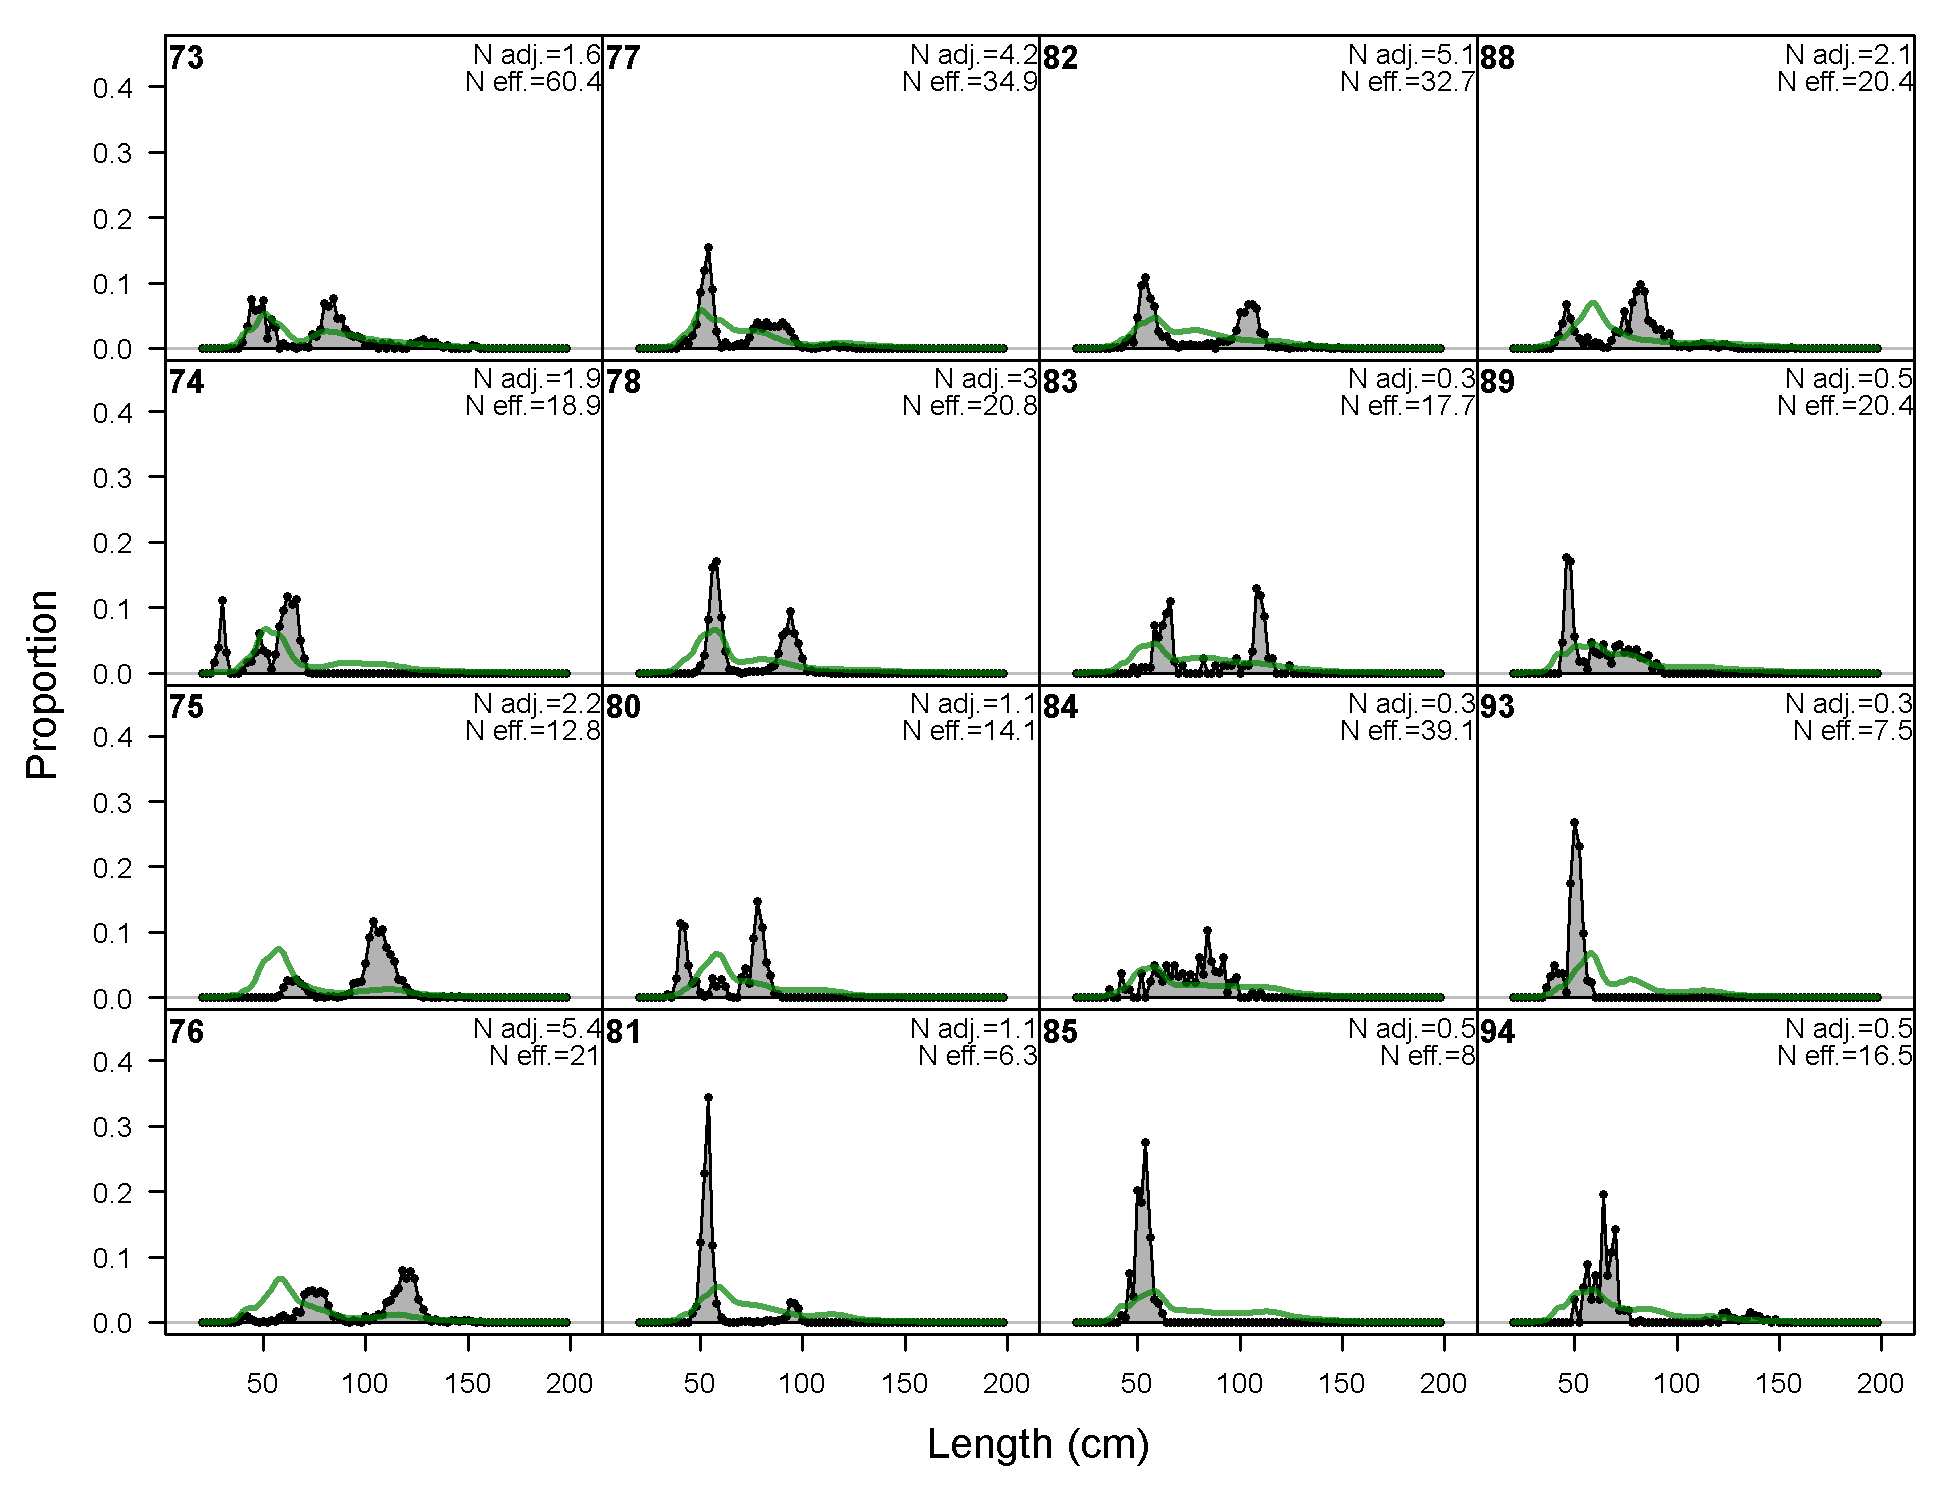
Length comps, whole catch, F13-NOA_I (plot 3 of 5)
file: comp_lenfit_flt13mkt0_page3.png
Length comps, whole catch, F13-NOA_I (plot 4 of 5)
file: comp_lenfit_flt13mkt0_page4.png
Length comps, whole catch, F13-NOA_I (plot 5 of 5)
file: comp_lenfit_flt13mkt0_page5.png
Pearson residuals, whole catch, F13-NOA_I (max=3.02) (plot 5 of 5)
Closed bubbles are positive residuals (observed > expected) and open bubbles are negative residuals (observed < expected).
file: comp_lenfit_residsflt13mkt0_page5.png
N-EffN comparison, Length comps, whole catch, F13-NOA_I
file: comp_lenfit_sampsize_flt13mkt0.png
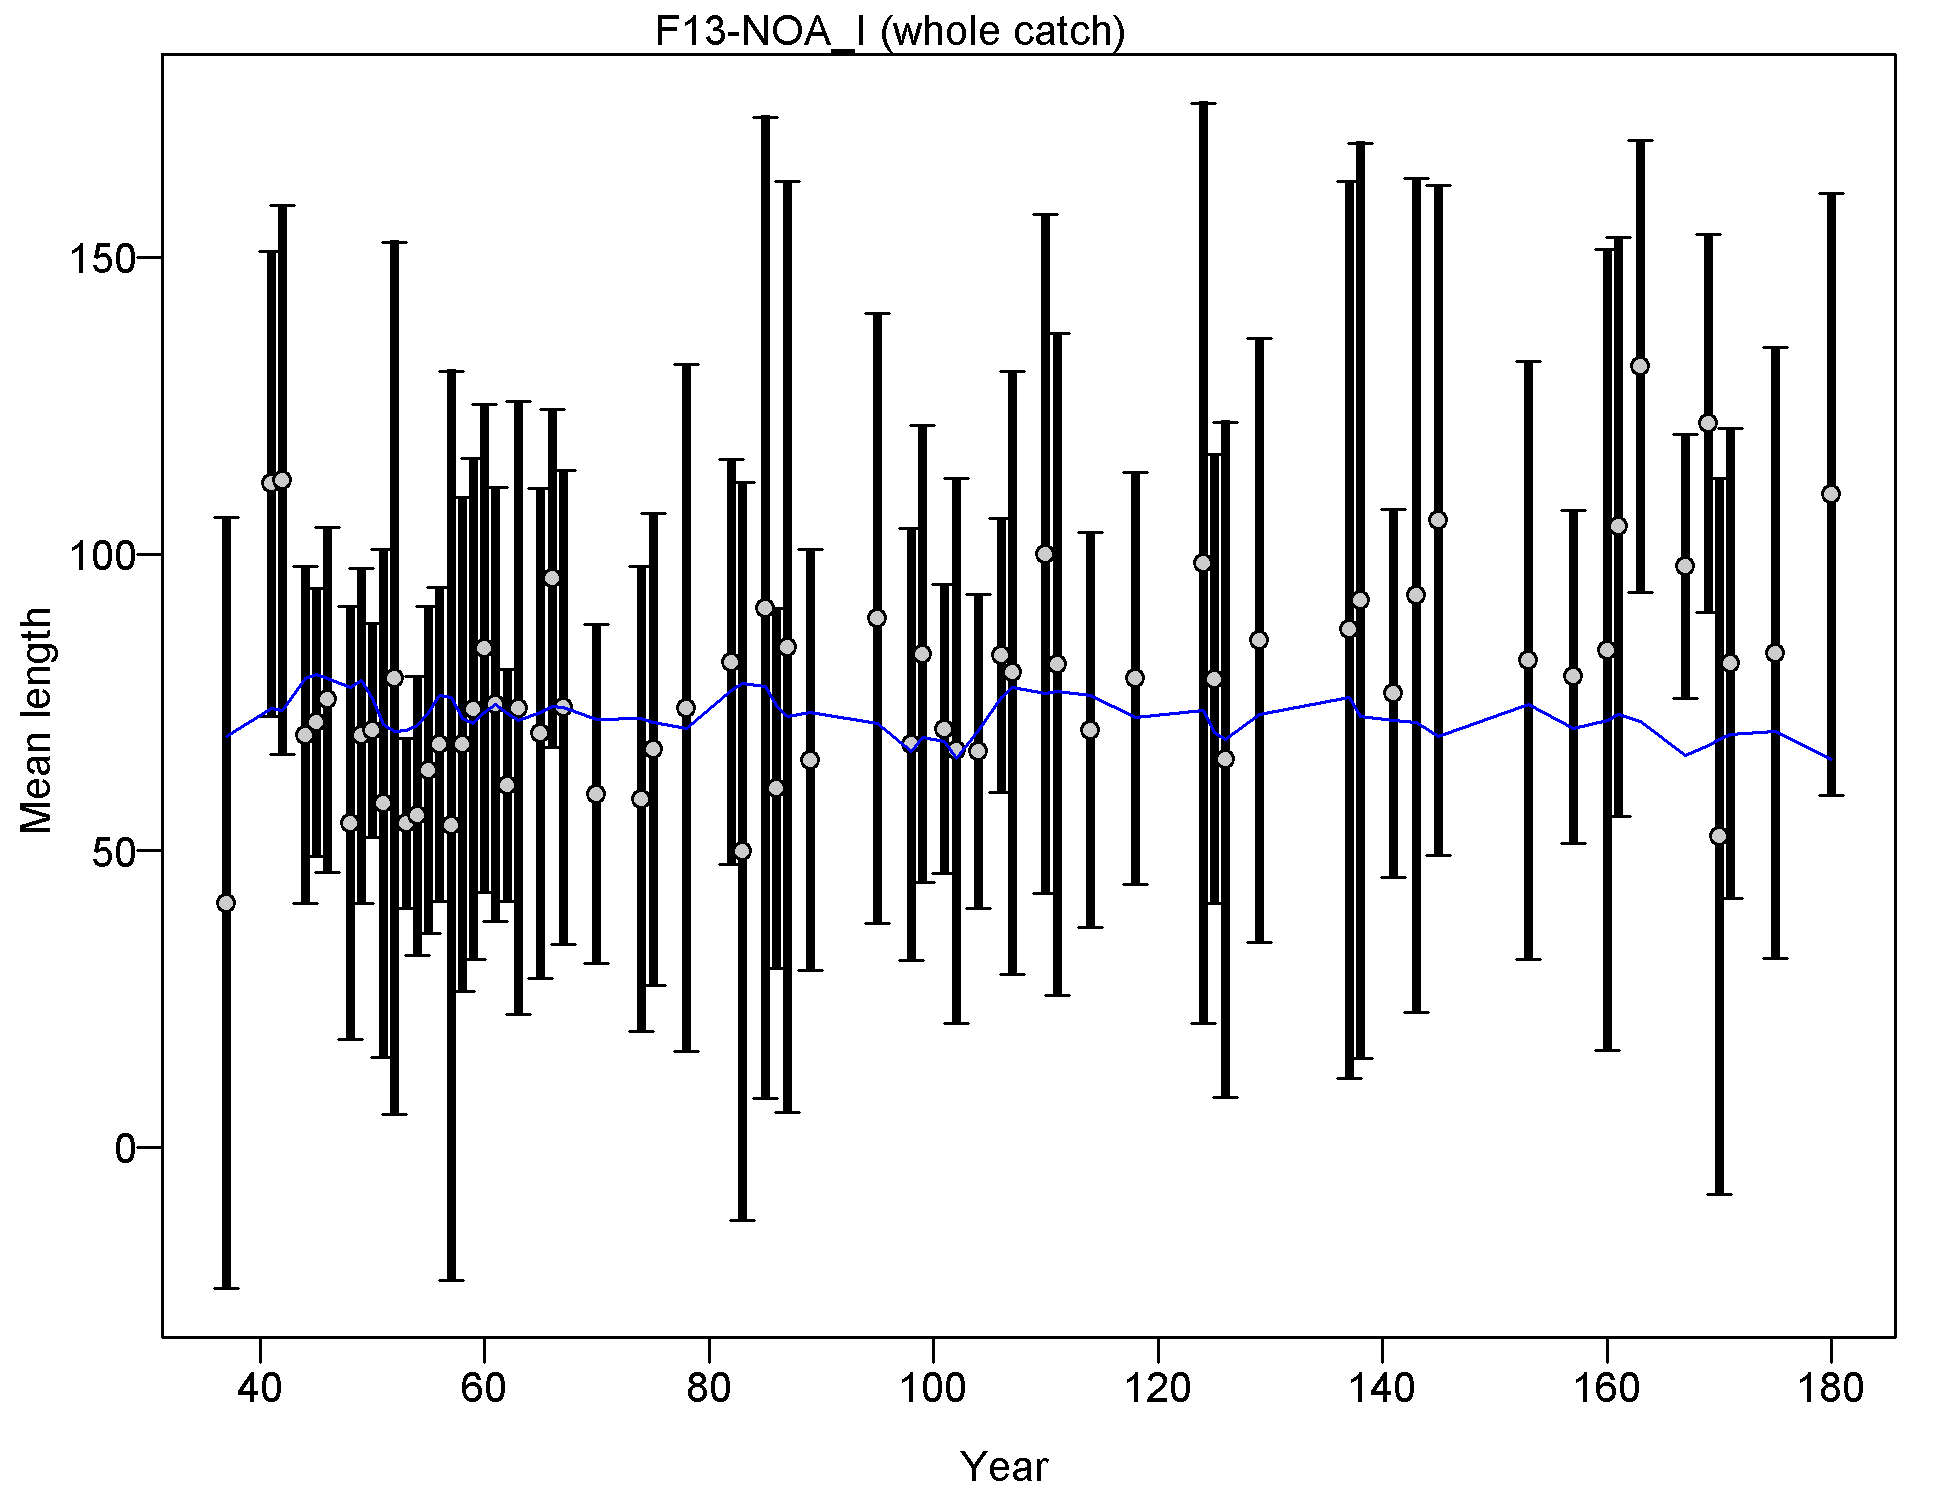
Mean length for F13-NOA_I with 95% confidence intervals based on current samples sizes.
Francis data weighting method TA1.8: thinner intervals (with capped ends) show result of further adjusting sample sizes based on suggested multiplier (with 95% interval) for len data from F13-NOA_I:
1.0063 (0.6871-1.7498)
For more info, see
Francis, R.I.C.C. (2011). Data weighting in statistical fisheries stock assessment models. Can. J. Fish. Aquat. Sci. 68: 1124-1138. https://doi.org/10.1139/f2011-025
file: comp_lenfit_data_weighting_TA1.8_F13-NOA_I.png
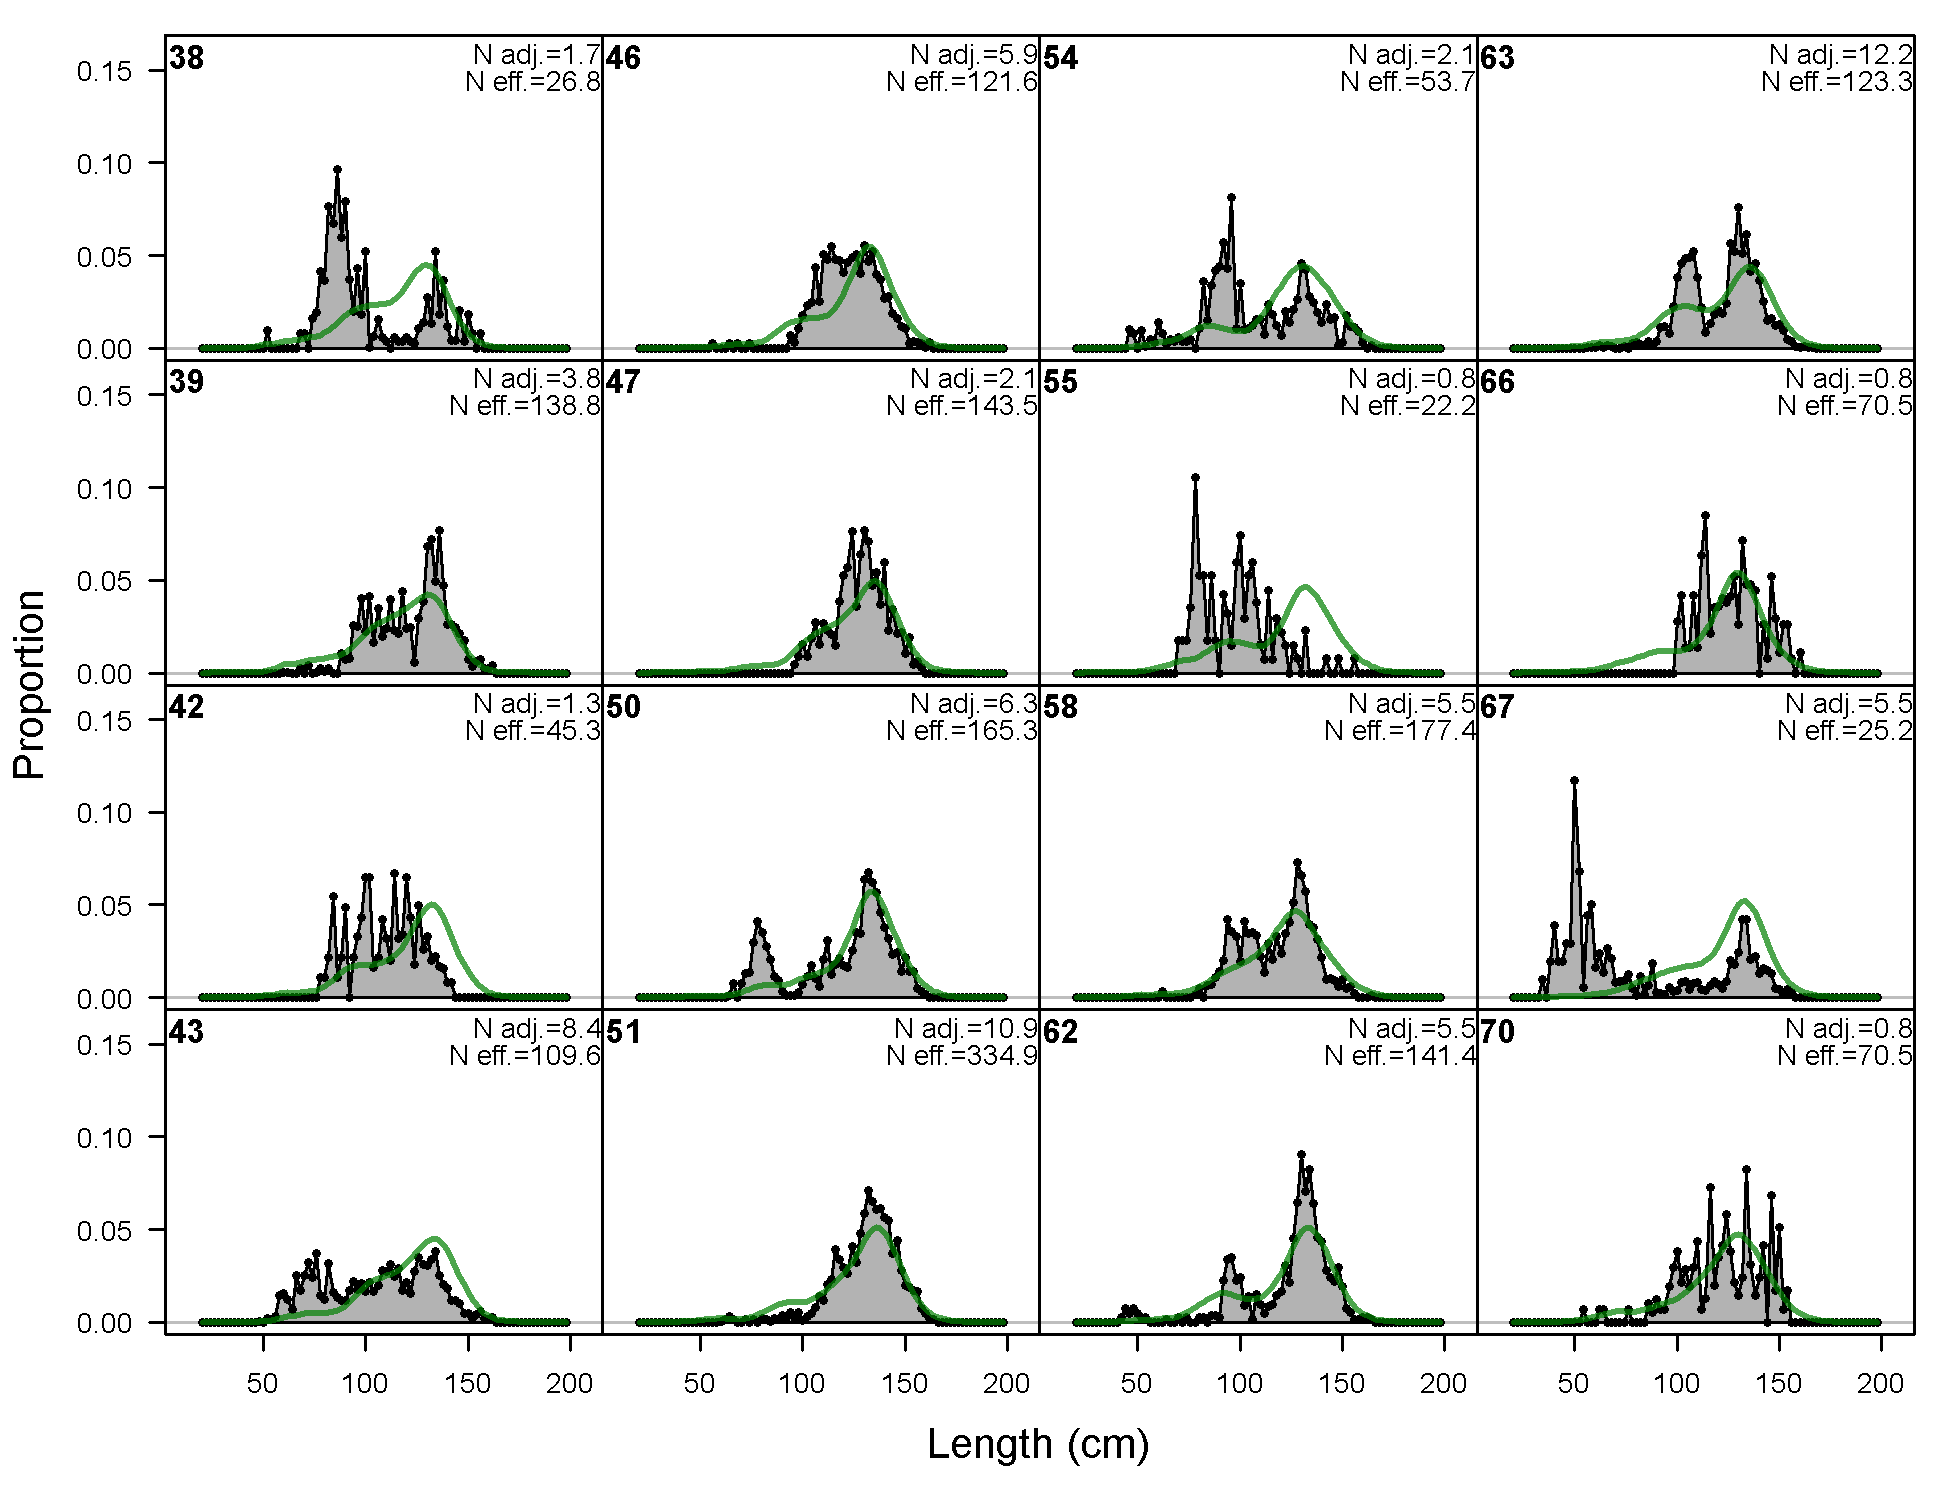
Length comps, whole catch, F14-NOA_S (plot 1 of 7).
'N adj.' is the input sample size after data-weighting adjustment. N eff. is the calculated effective sample size used in the McAllister-Iannelli tuning method.
file: comp_lenfit_flt14mkt0_page1.png
Length comps, whole catch, F14-NOA_S (plot 2 of 7)
file: comp_lenfit_flt14mkt0_page2.png
Length comps, whole catch, F14-NOA_S (plot 3 of 7)
file: comp_lenfit_flt14mkt0_page3.png
Length comps, whole catch, F14-NOA_S (plot 4 of 7)
file: comp_lenfit_flt14mkt0_page4.png
Length comps, whole catch, F14-NOA_S (plot 5 of 7)
file: comp_lenfit_flt14mkt0_page5.png
Length comps, whole catch, F14-NOA_S (plot 6 of 7)
file: comp_lenfit_flt14mkt0_page6.png
Length comps, whole catch, F14-NOA_S (plot 7 of 7)
file: comp_lenfit_flt14mkt0_page7.png
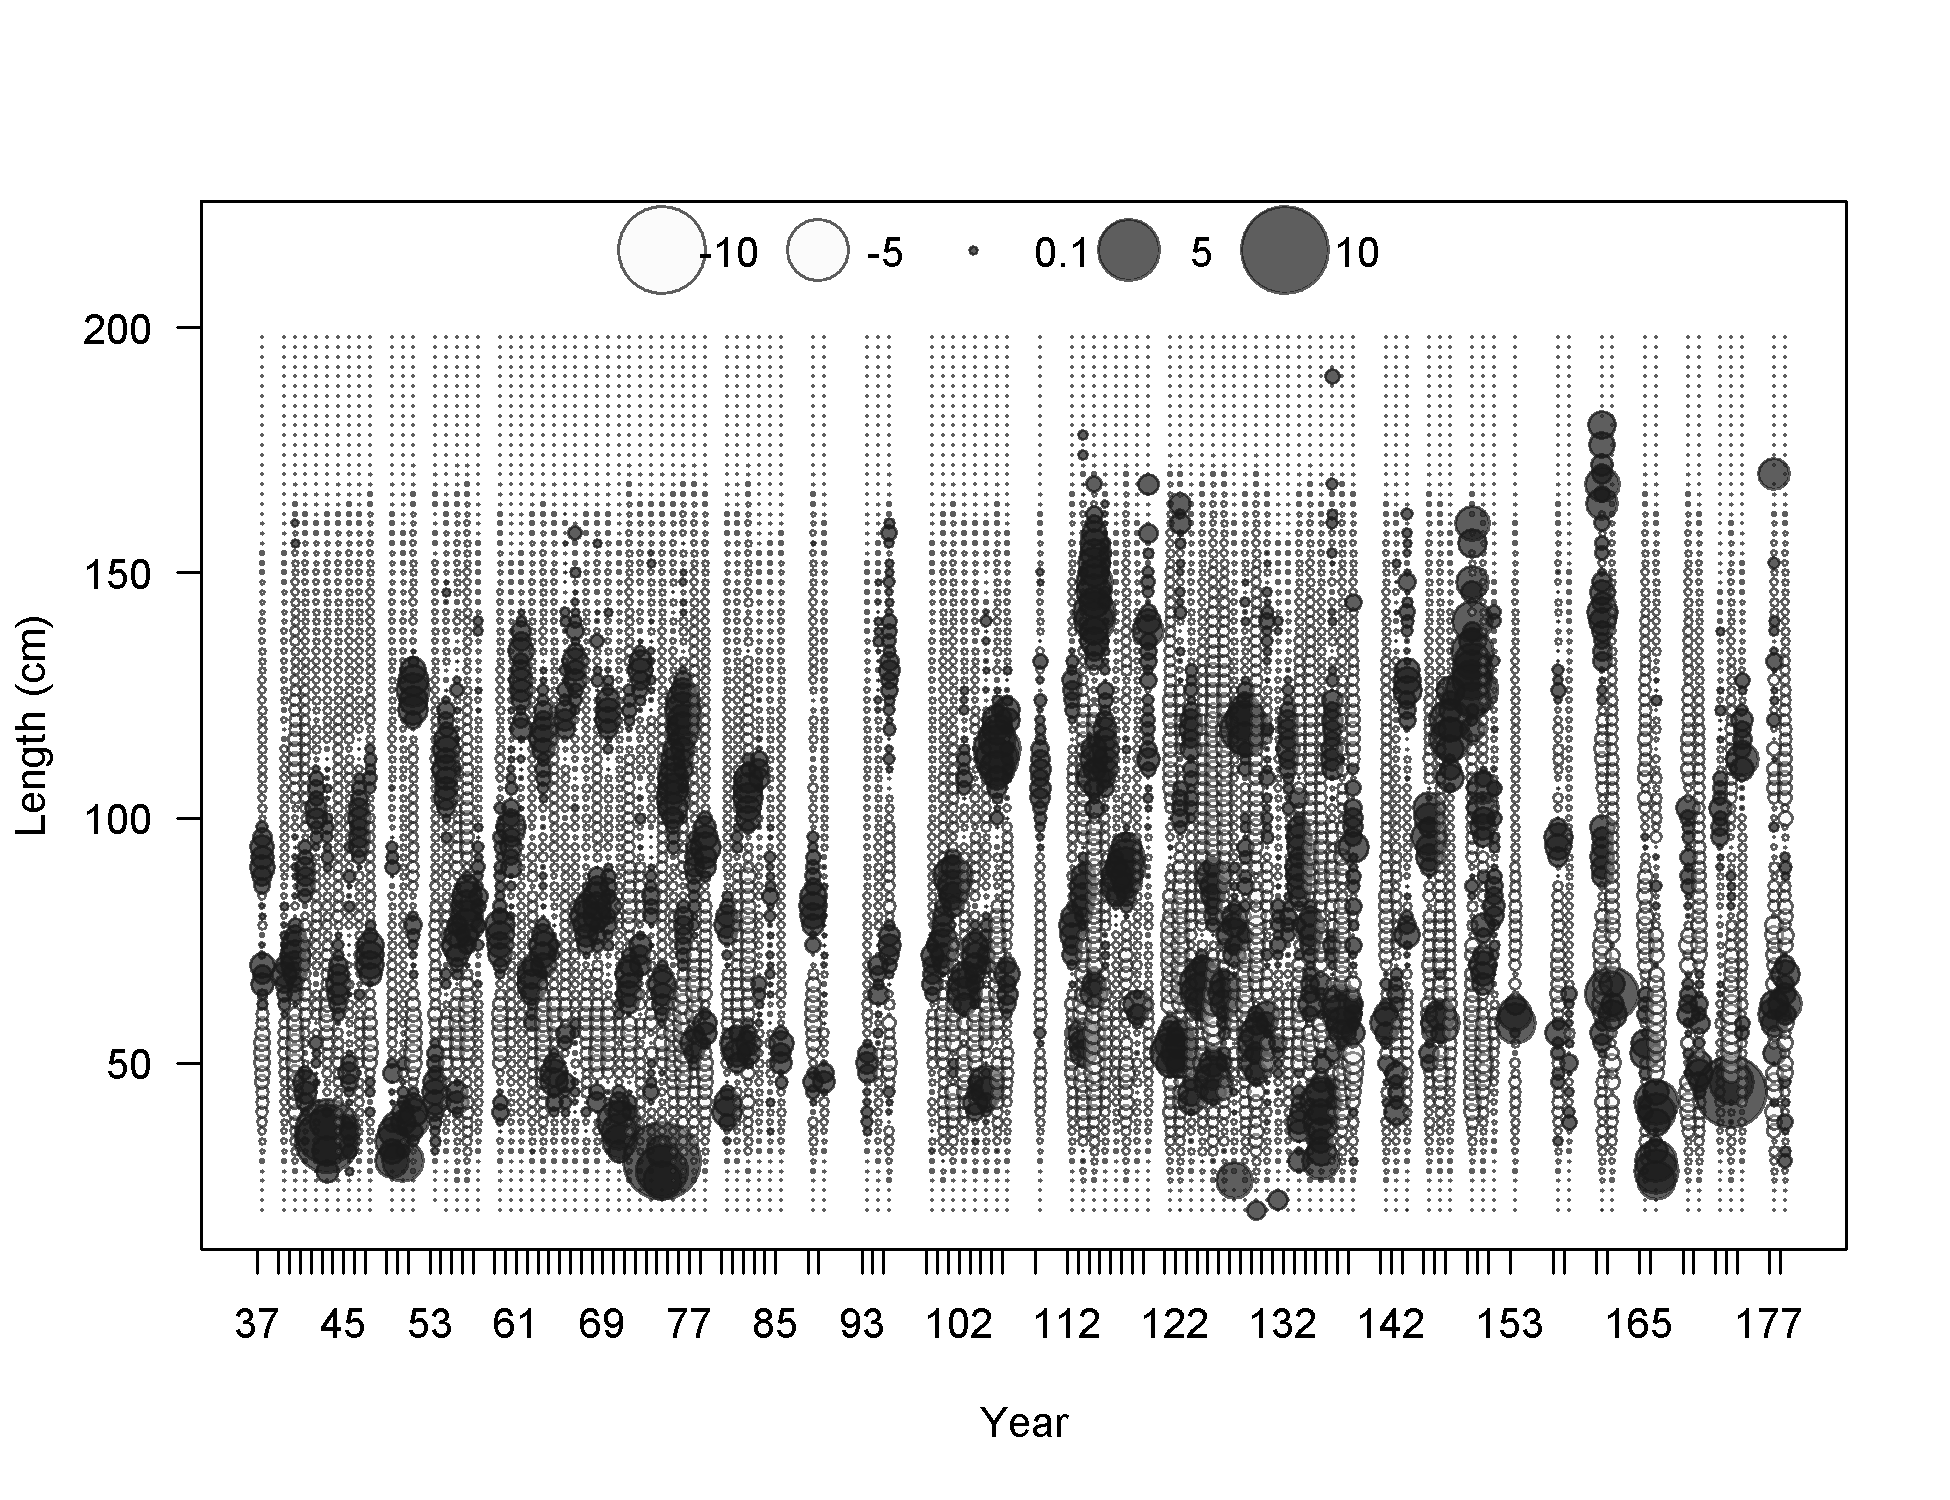
Pearson residuals, whole catch, F14-NOA_S (max=7.85) (plot 7 of 7)
Closed bubbles are positive residuals (observed > expected) and open bubbles are negative residuals (observed < expected).
file: comp_lenfit_residsflt14mkt0_page7.png
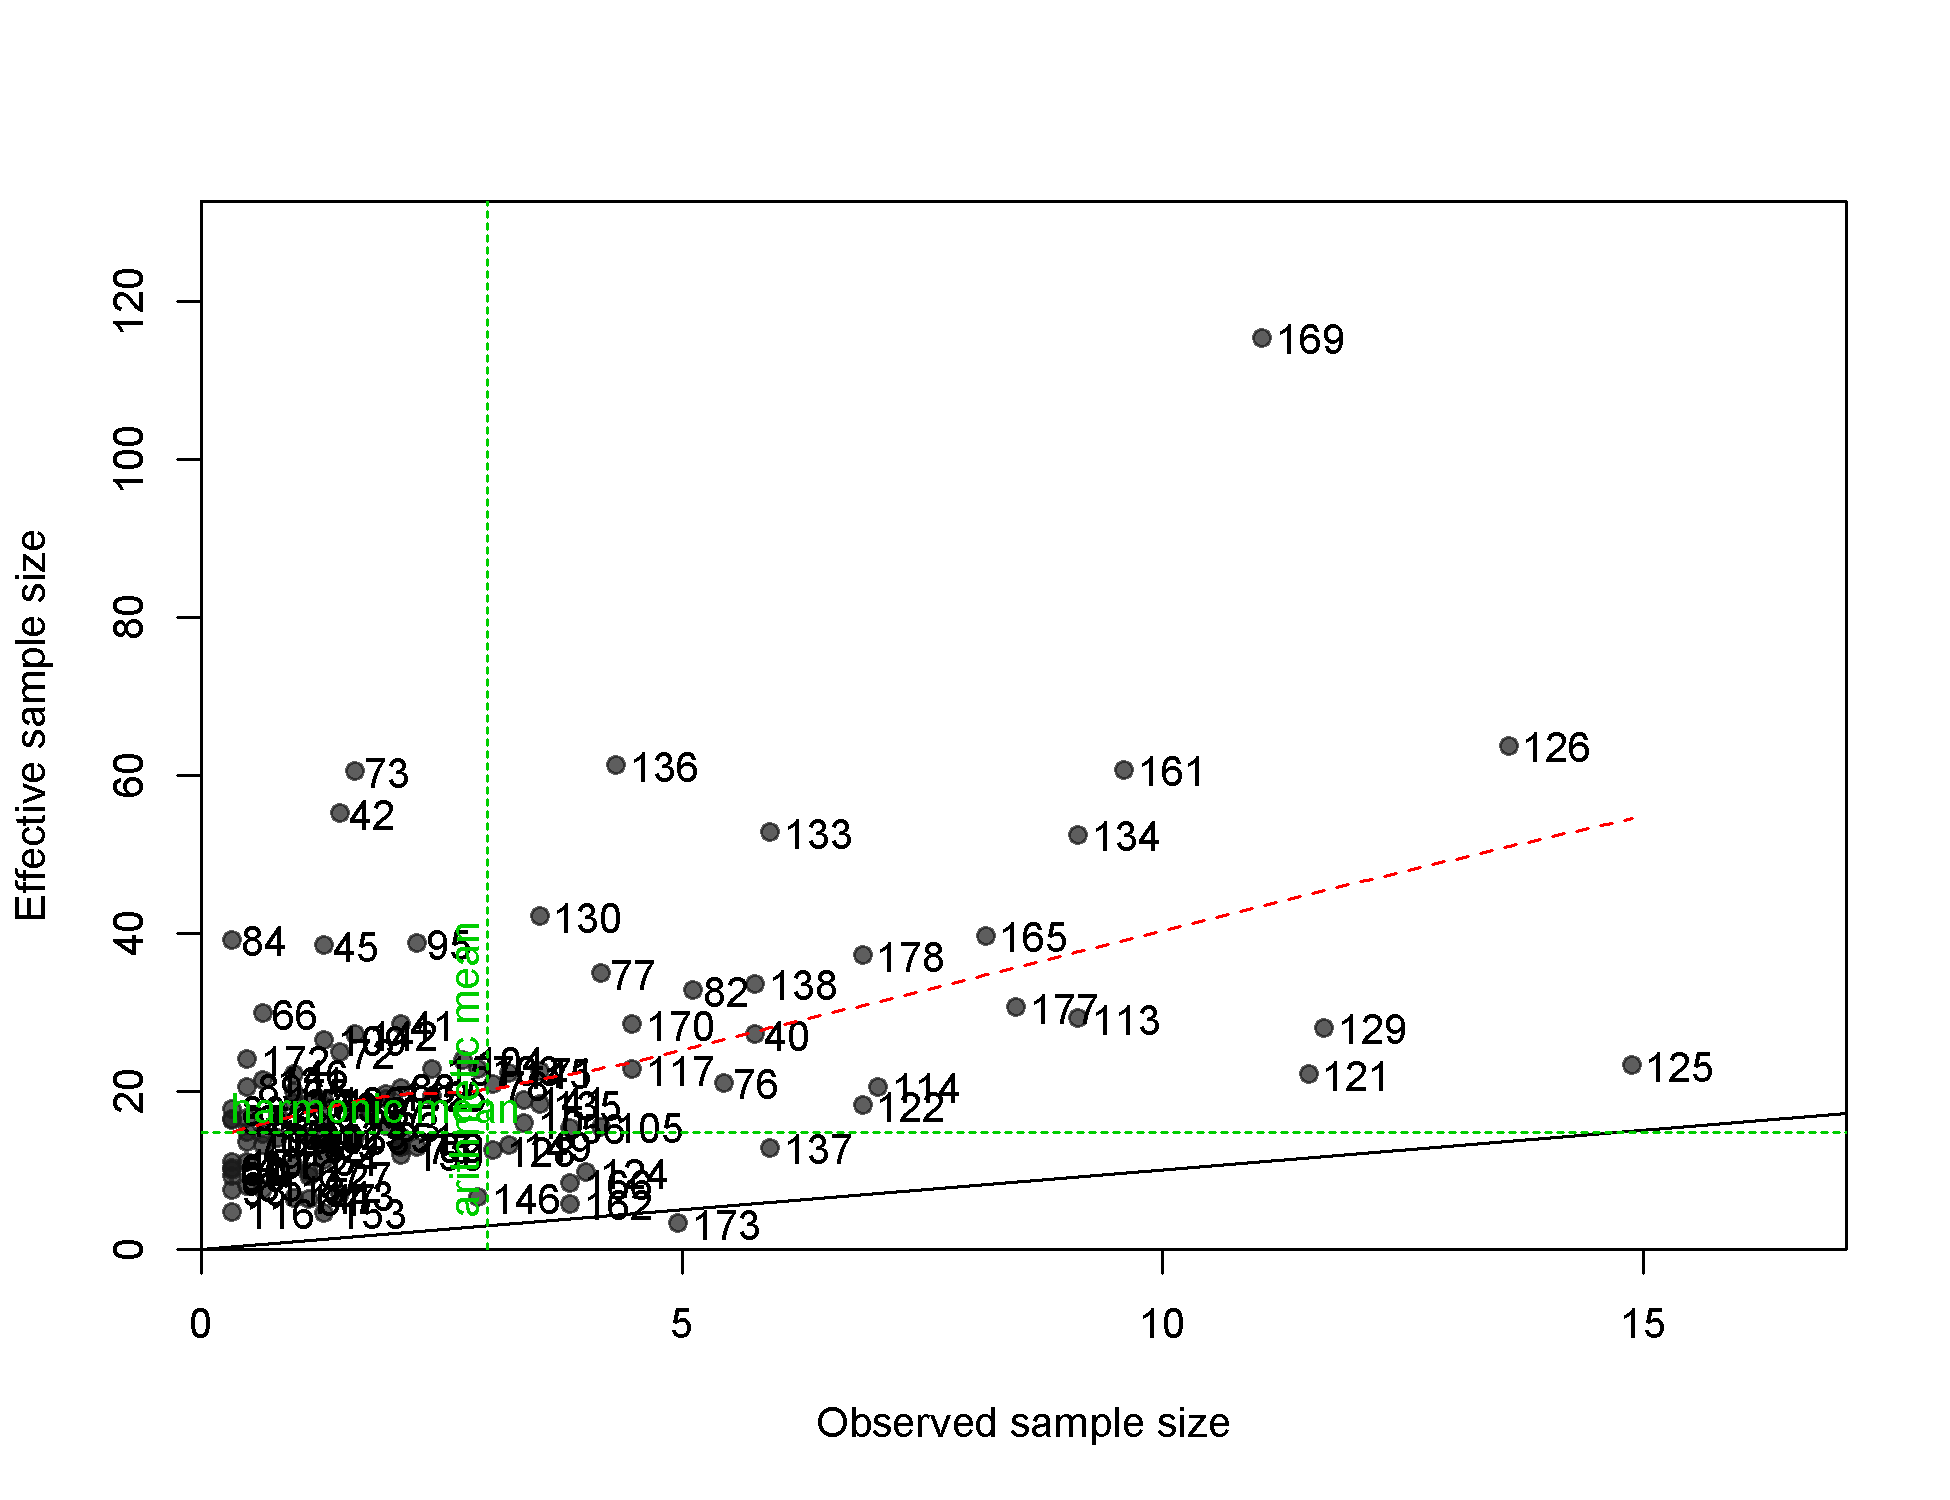
N-EffN comparison, Length comps, whole catch, F14-NOA_S
file: comp_lenfit_sampsize_flt14mkt0.png
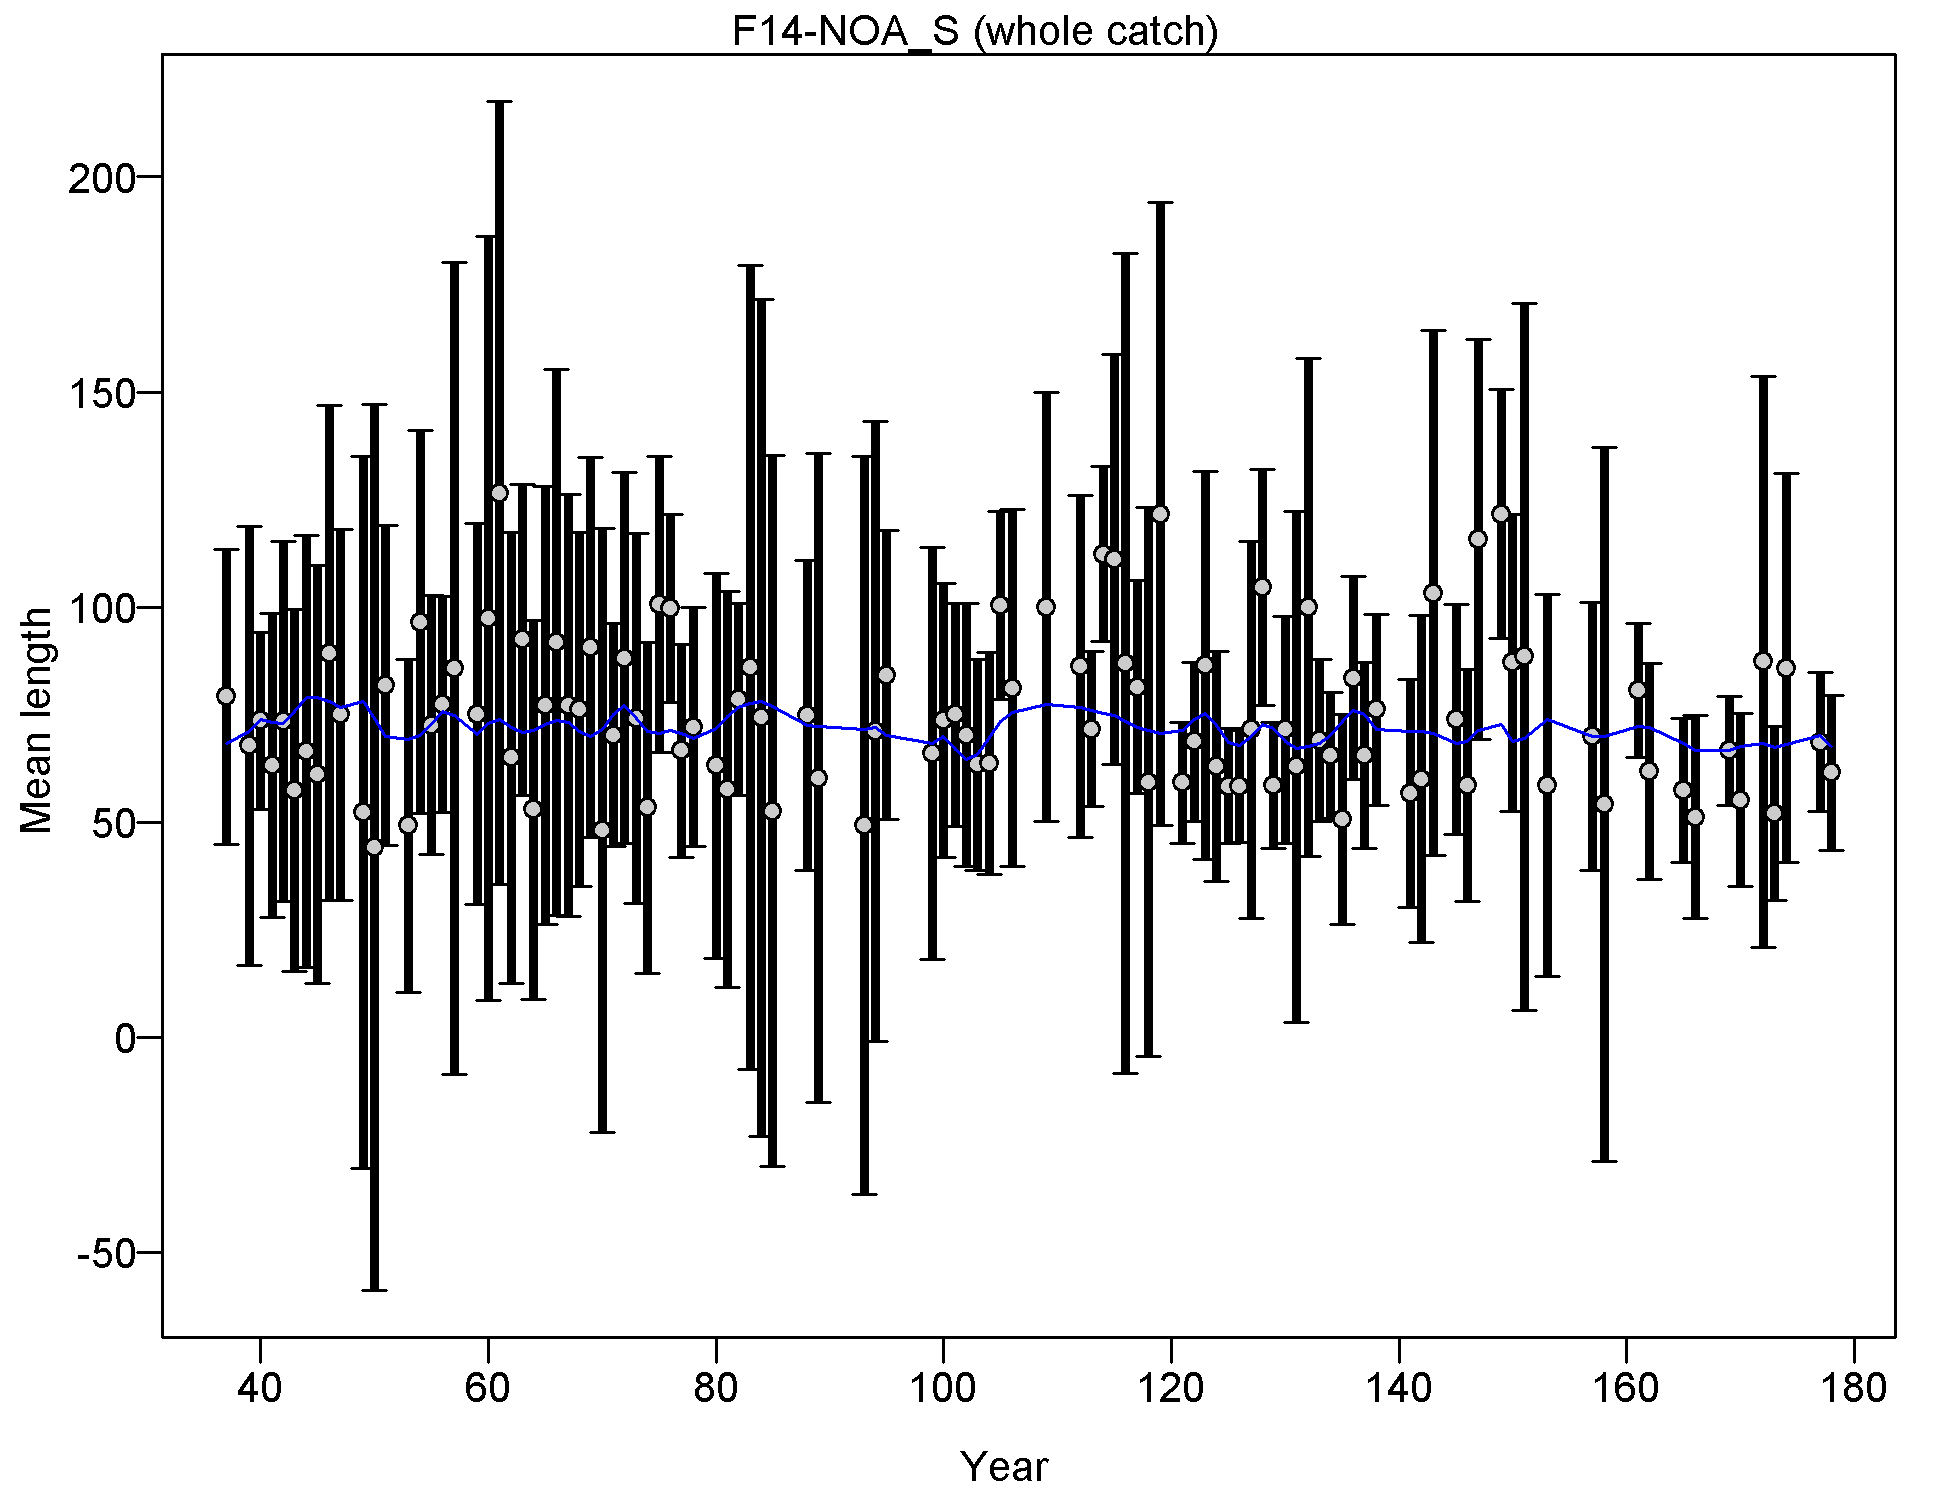
Mean length for F14-NOA_S with 95% confidence intervals based on current samples sizes.
Francis data weighting method TA1.8: thinner intervals (with capped ends) show result of further adjusting sample sizes based on suggested multiplier (with 95% interval) for len data from F14-NOA_S:
0.9978 (0.7285-1.4883)
For more info, see
Francis, R.I.C.C. (2011). Data weighting in statistical fisheries stock assessment models. Can. J. Fish. Aquat. Sci. 68: 1124-1138. https://doi.org/10.1139/f2011-025
file: comp_lenfit_data_weighting_TA1.8_F14-NOA_S.png
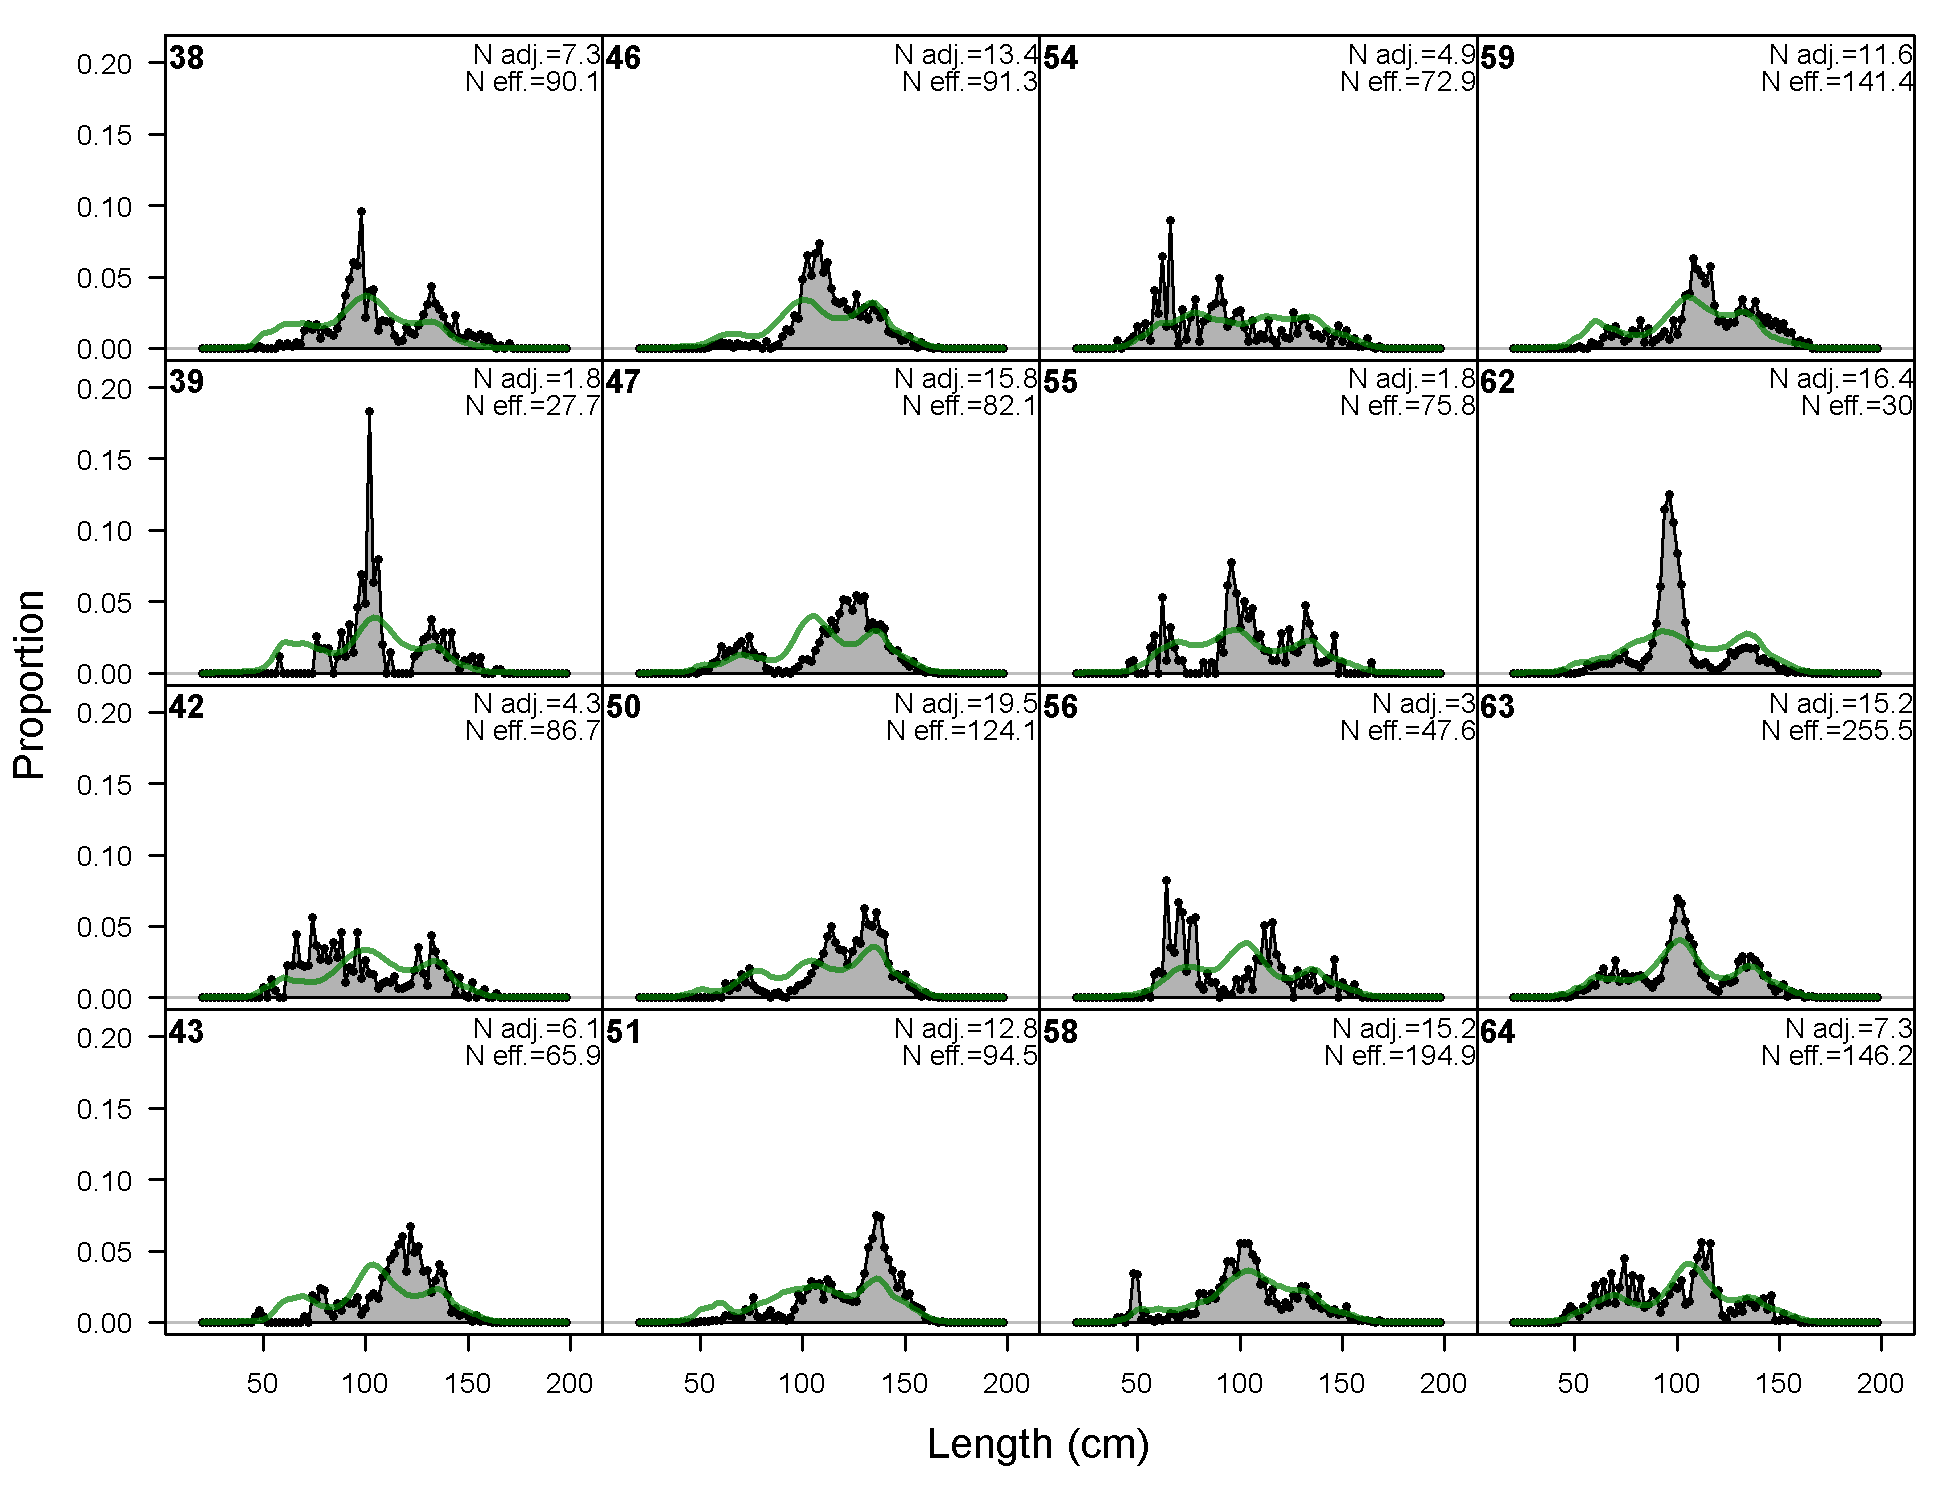
Length comps, whole catch, F15-DEL_N (plot 1 of 5).
'N adj.' is the input sample size after data-weighting adjustment. N eff. is the calculated effective sample size used in the McAllister-Iannelli tuning method.
file: comp_lenfit_flt15mkt0_page1.png
Length comps, whole catch, F15-DEL_N (plot 2 of 5)
file: comp_lenfit_flt15mkt0_page2.png
Length comps, whole catch, F15-DEL_N (plot 3 of 5)
file: comp_lenfit_flt15mkt0_page3.png
Length comps, whole catch, F15-DEL_N (plot 4 of 5)
file: comp_lenfit_flt15mkt0_page4.png
Length comps, whole catch, F15-DEL_N (plot 5 of 5)
file: comp_lenfit_flt15mkt0_page5.png
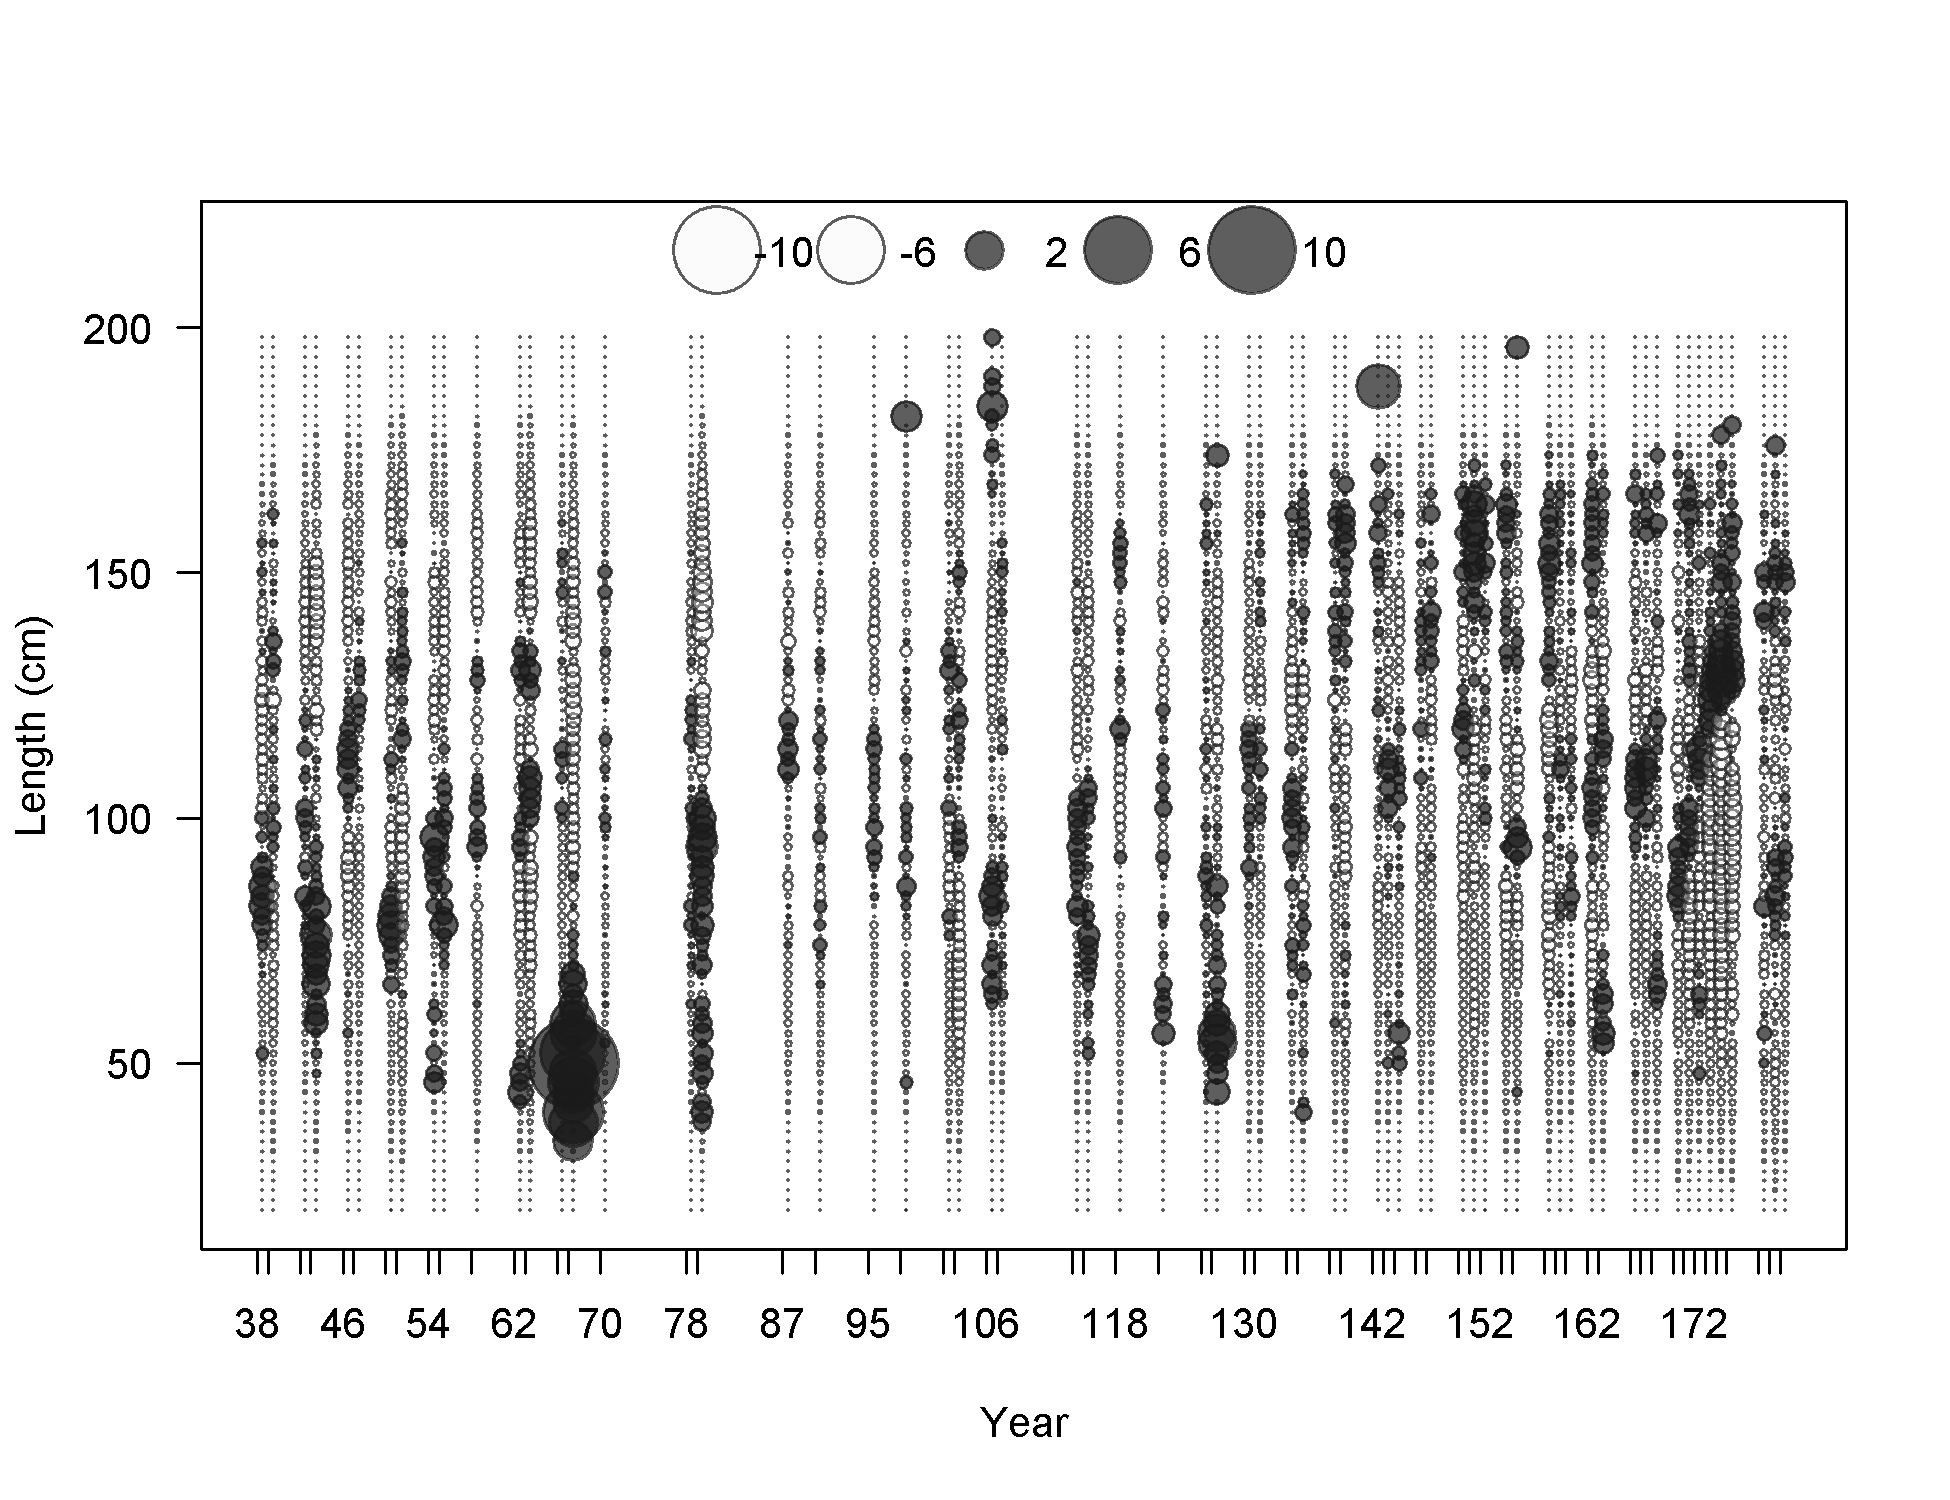
Pearson residuals, whole catch, F15-DEL_N (max=10.84) (plot 5 of 5)
Closed bubbles are positive residuals (observed > expected) and open bubbles are negative residuals (observed < expected).
file: comp_lenfit_residsflt15mkt0_page5.png
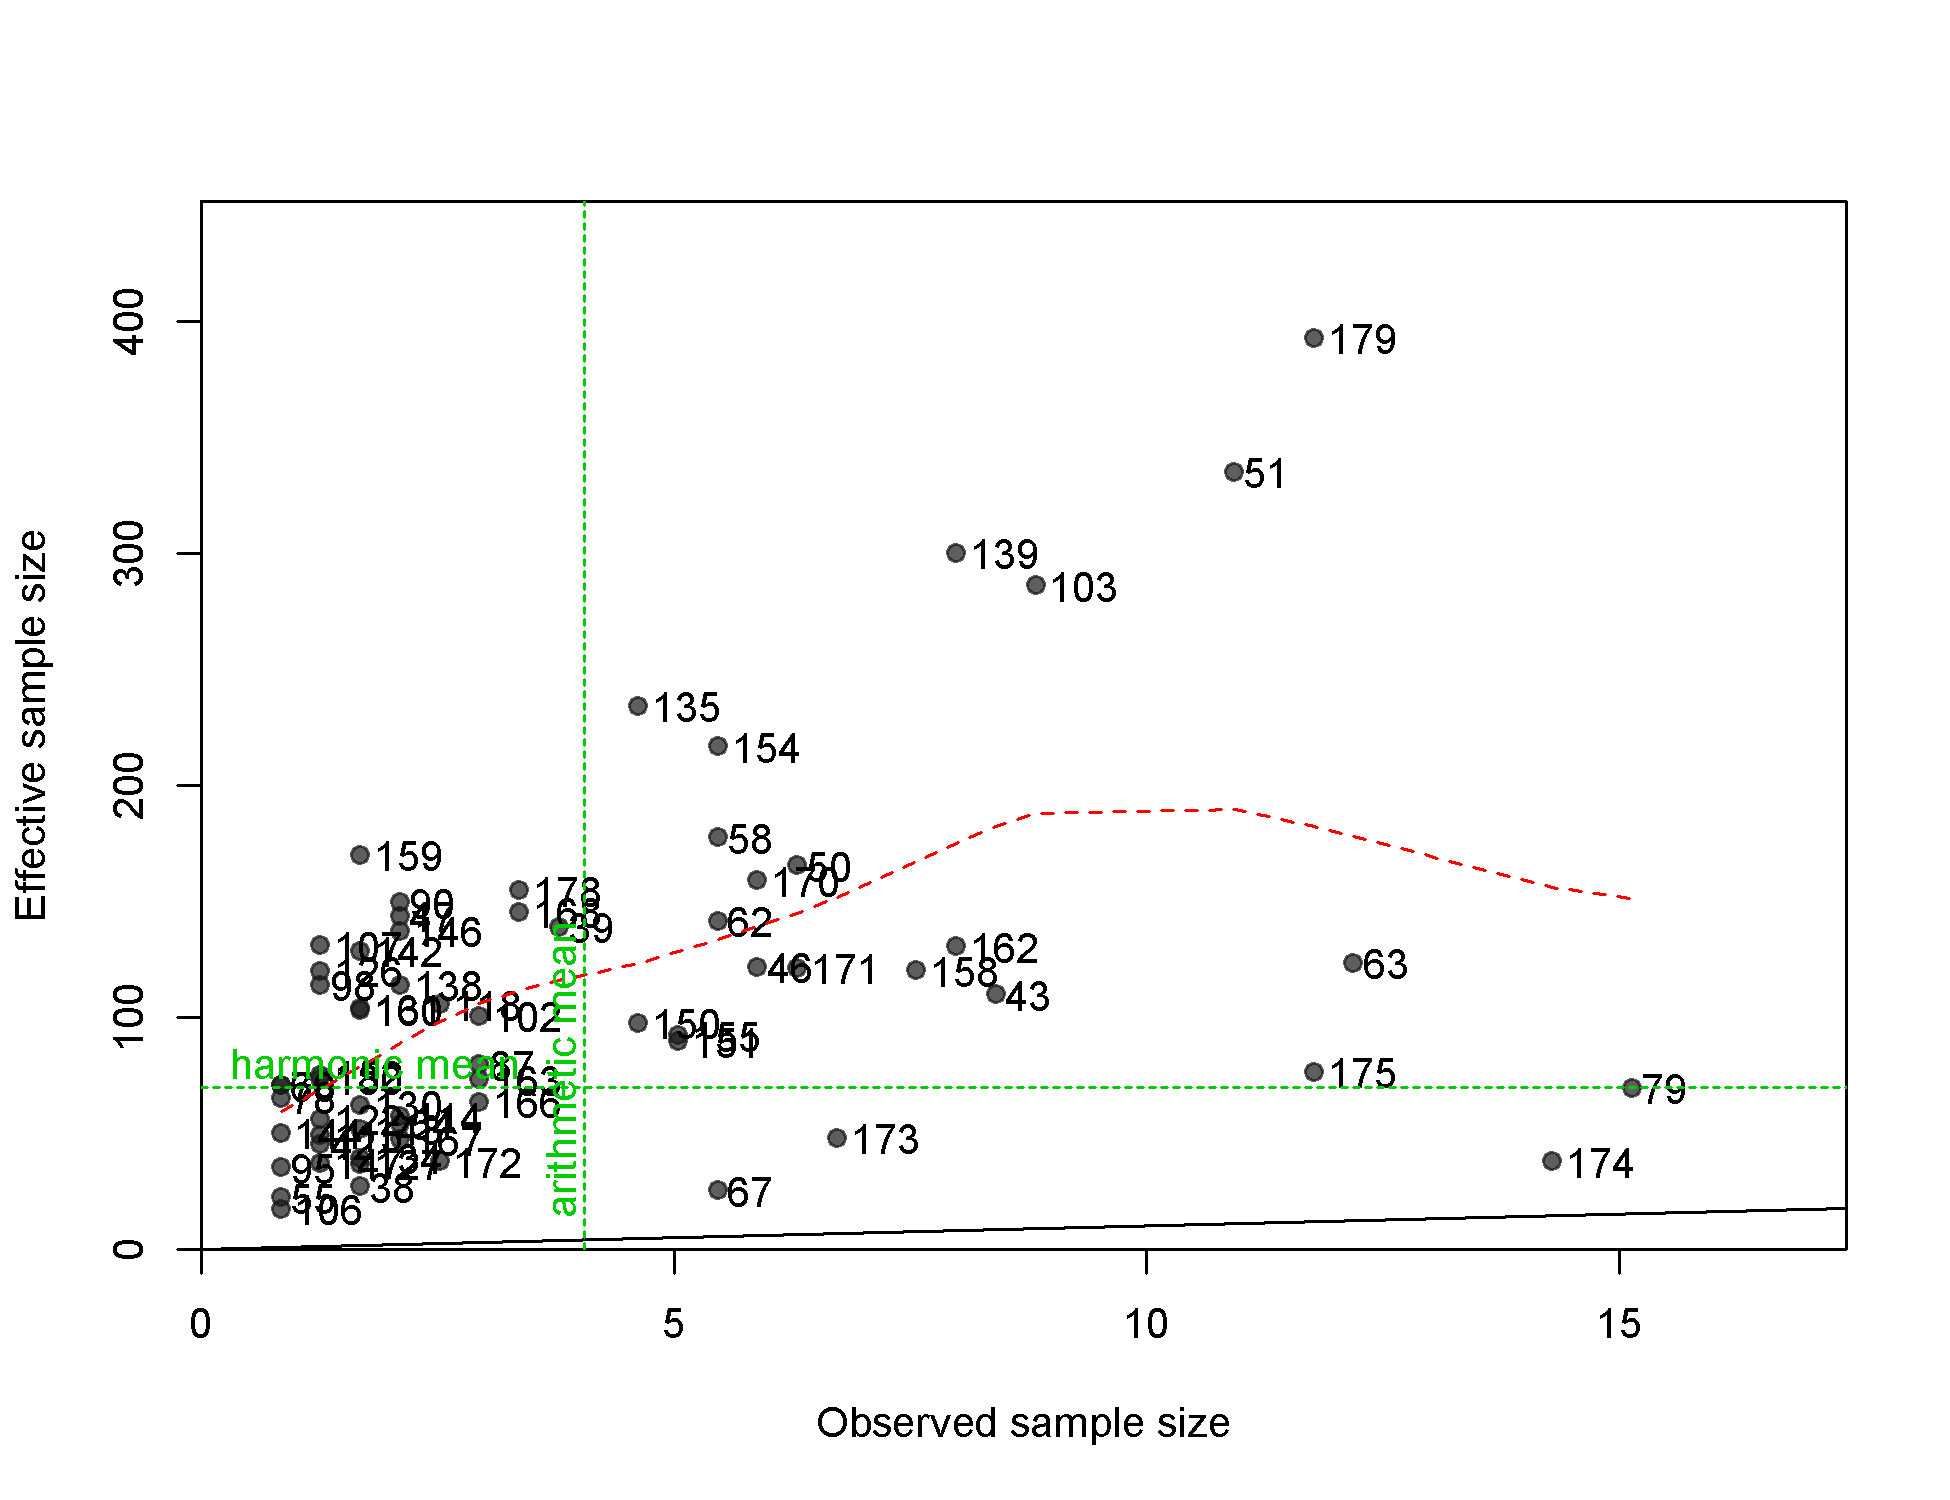
N-EffN comparison, Length comps, whole catch, F15-DEL_N
file: comp_lenfit_sampsize_flt15mkt0.png
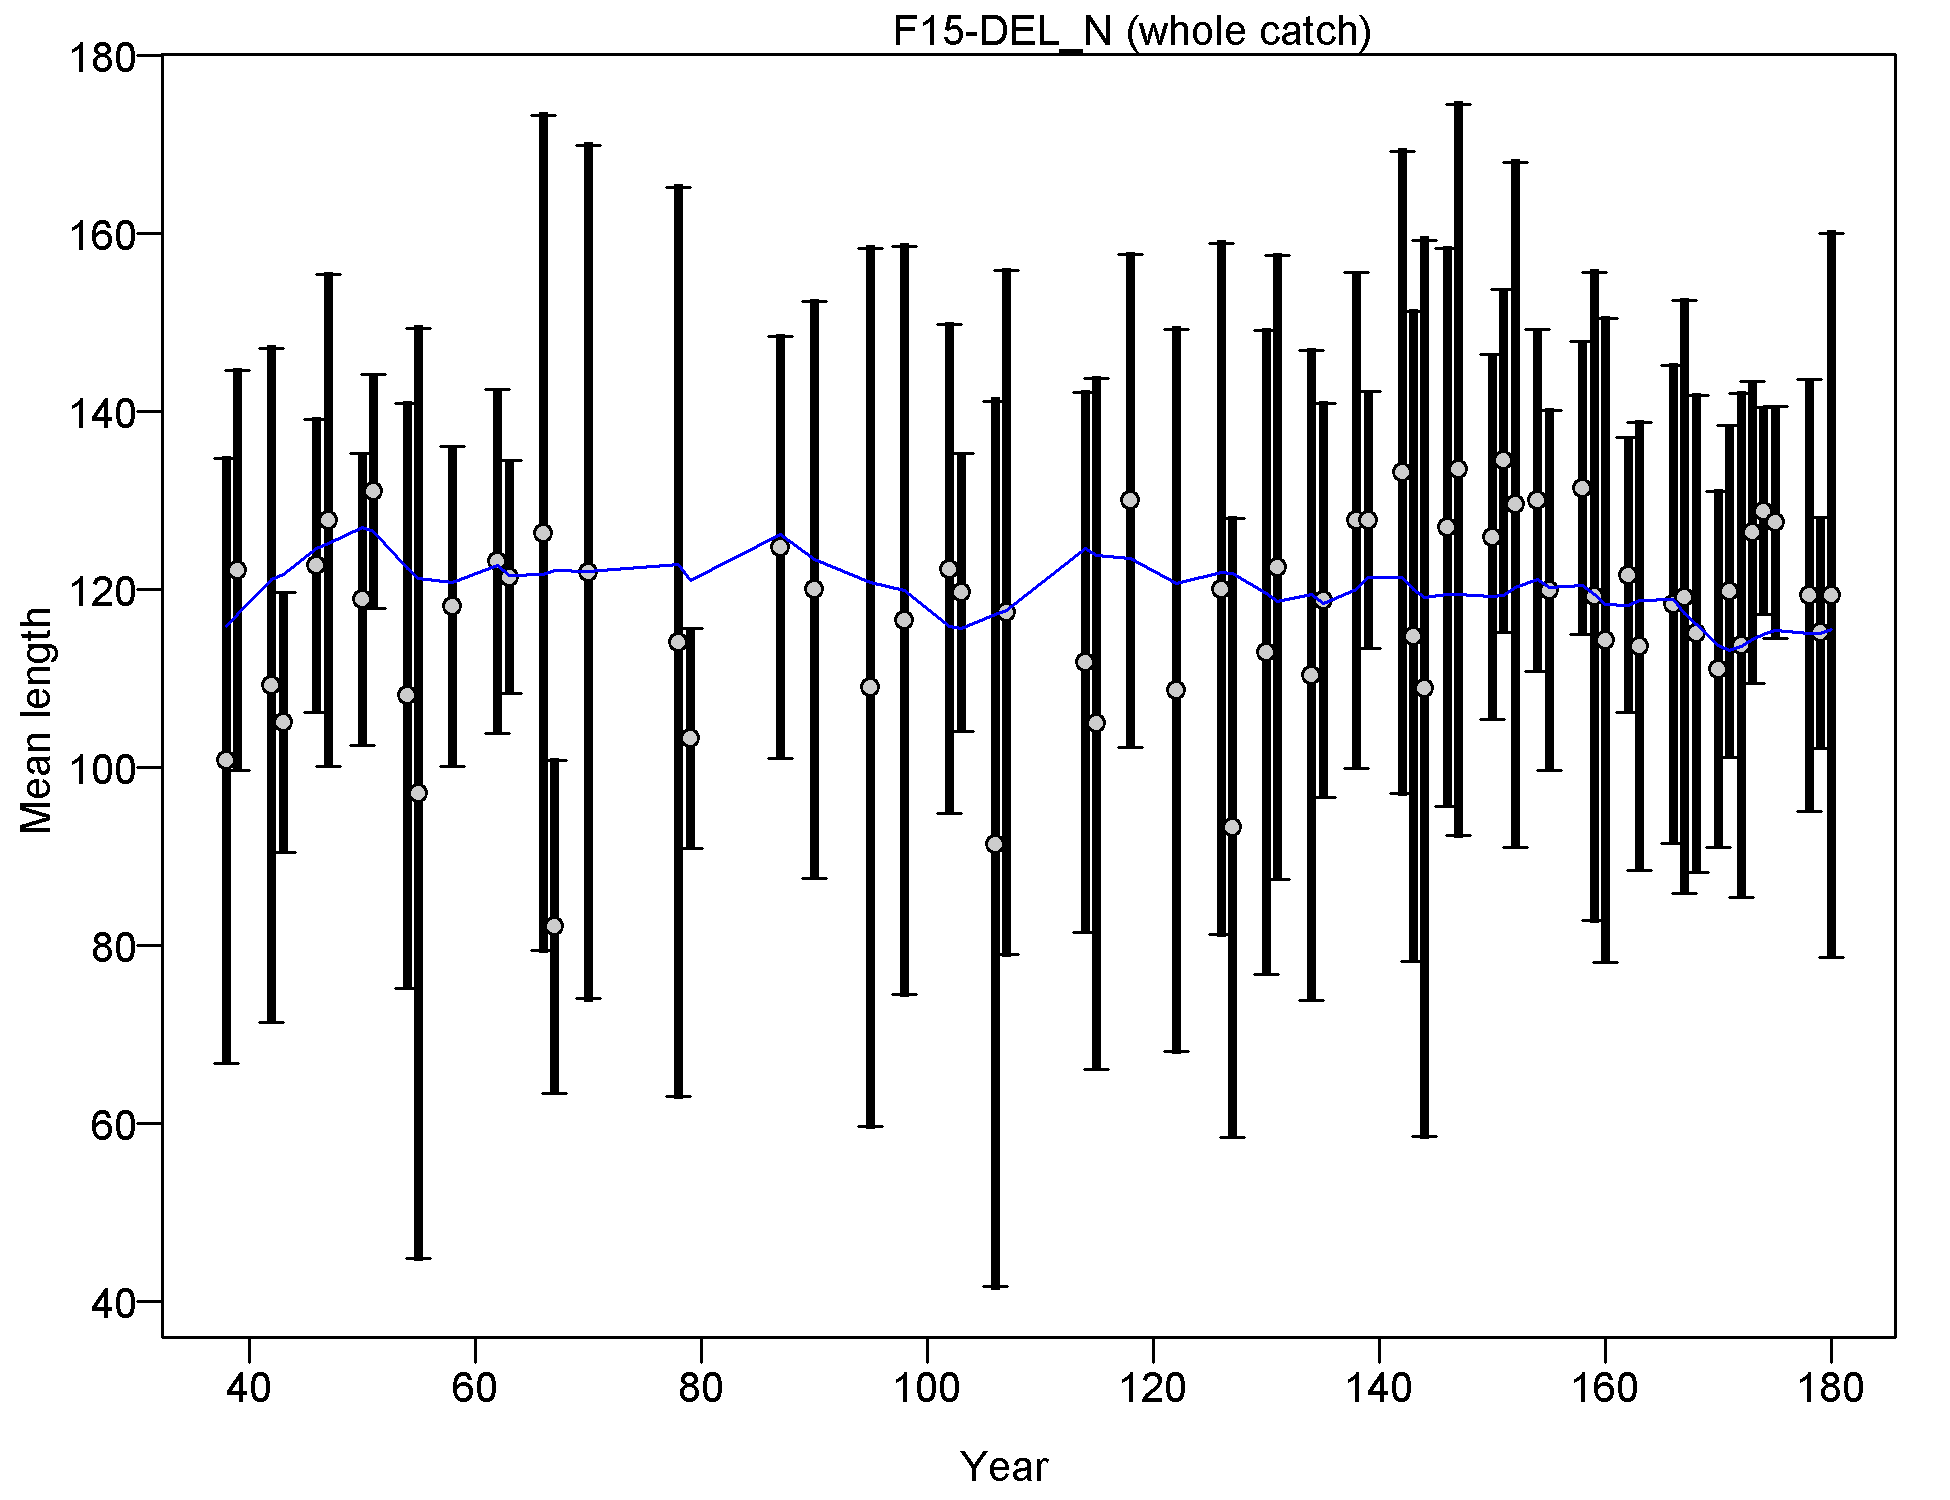
Mean length for F15-DEL_N with 95% confidence intervals based on current samples sizes.
Francis data weighting method TA1.8: thinner intervals (with capped ends) show result of further adjusting sample sizes based on suggested multiplier (with 95% interval) for len data from F15-DEL_N:
1.0145 (0.6003-2.1997)
For more info, see
Francis, R.I.C.C. (2011). Data weighting in statistical fisheries stock assessment models. Can. J. Fish. Aquat. Sci. 68: 1124-1138. https://doi.org/10.1139/f2011-025
file: comp_lenfit_data_weighting_TA1.8_F15-DEL_N.png
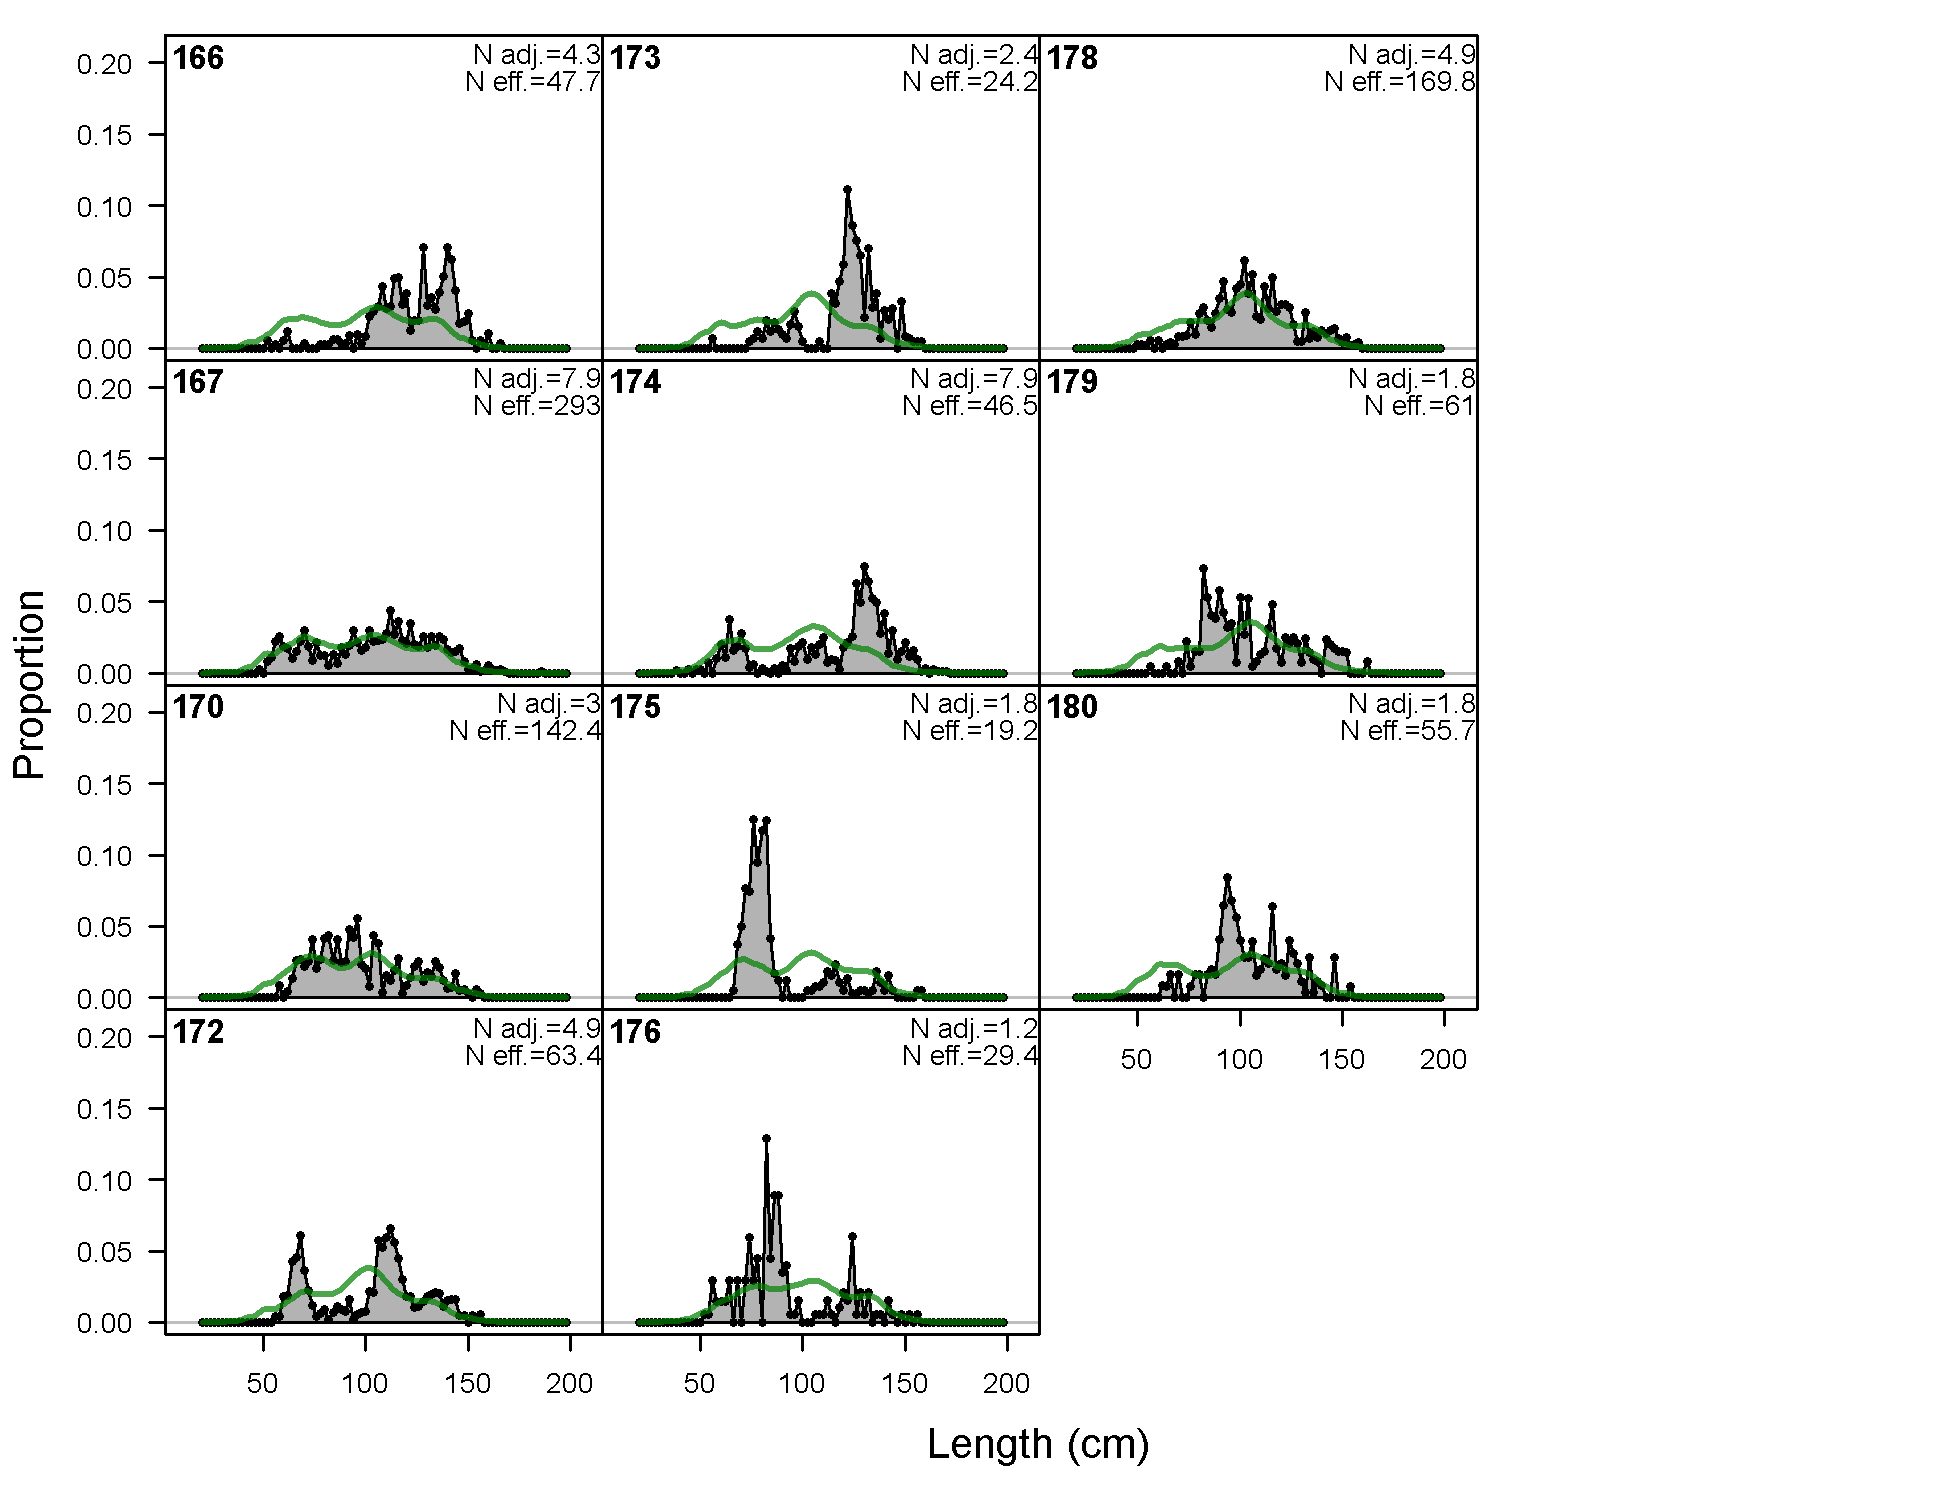
Length comps, whole catch, F16-DEL_NE (plot 1 of 6).
'N adj.' is the input sample size after data-weighting adjustment. N eff. is the calculated effective sample size used in the McAllister-Iannelli tuning method.
file: comp_lenfit_flt16mkt0_page1.png
Length comps, whole catch, F16-DEL_NE (plot 2 of 6)
file: comp_lenfit_flt16mkt0_page2.png
Length comps, whole catch, F16-DEL_NE (plot 3 of 6)
file: comp_lenfit_flt16mkt0_page3.png
Length comps, whole catch, F16-DEL_NE (plot 4 of 6)
file: comp_lenfit_flt16mkt0_page4.png
Length comps, whole catch, F16-DEL_NE (plot 5 of 6)
file: comp_lenfit_flt16mkt0_page5.png
Length comps, whole catch, F16-DEL_NE (plot 6 of 6)
file: comp_lenfit_flt16mkt0_page6.png
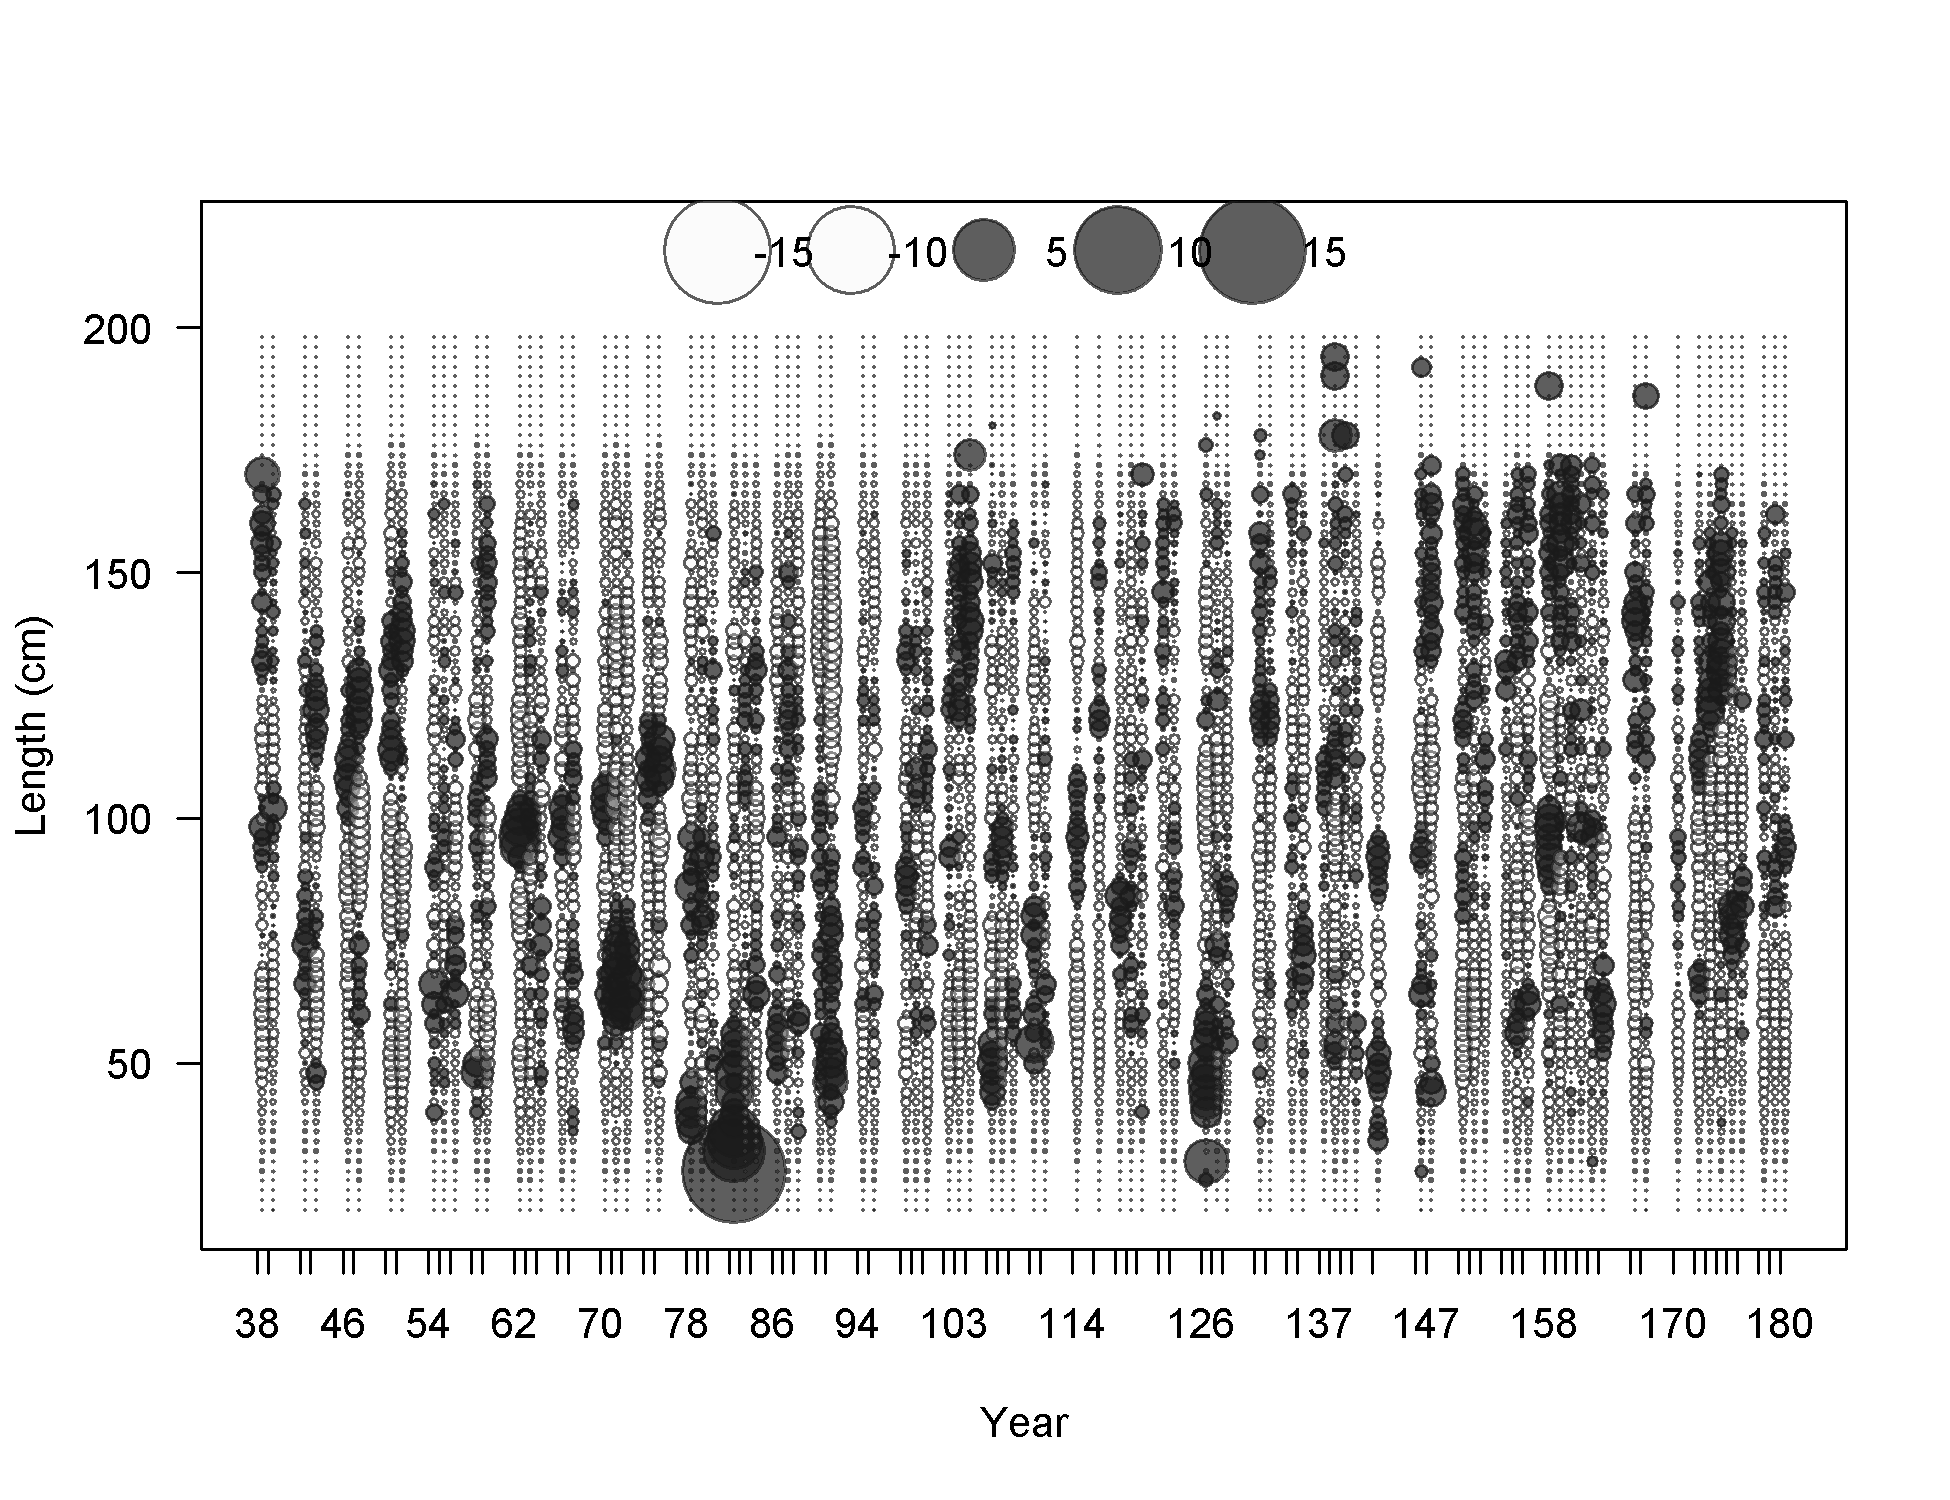
Pearson residuals, whole catch, F16-DEL_NE (max=14.05) (plot 6 of 6)
Closed bubbles are positive residuals (observed > expected) and open bubbles are negative residuals (observed < expected).
file: comp_lenfit_residsflt16mkt0_page6.png
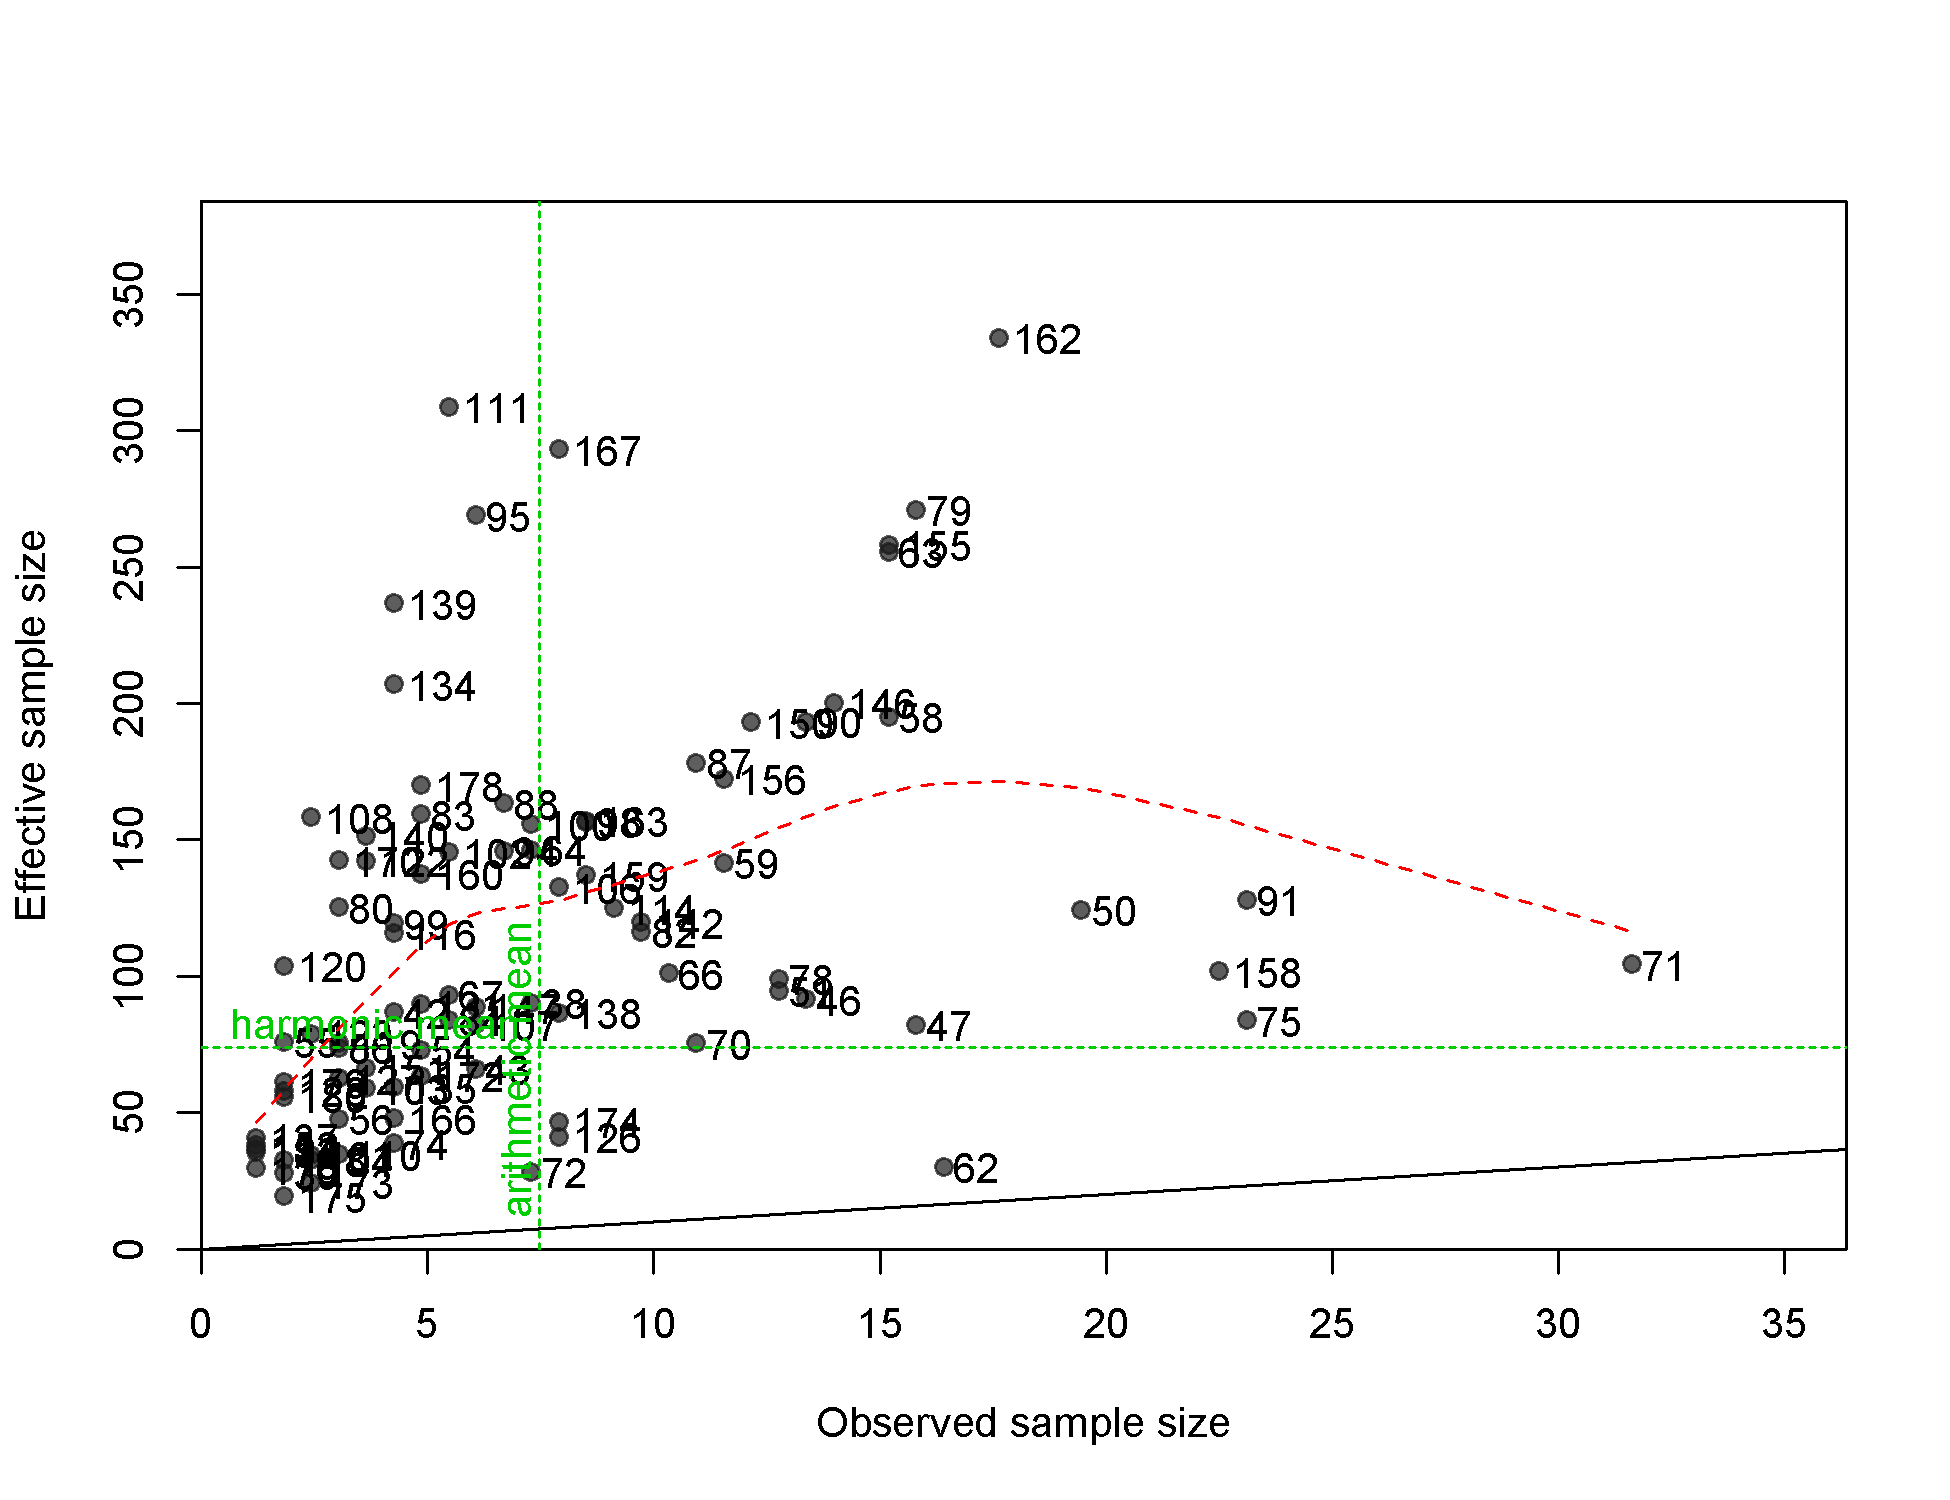
N-EffN comparison, Length comps, whole catch, F16-DEL_NE
file: comp_lenfit_sampsize_flt16mkt0.png
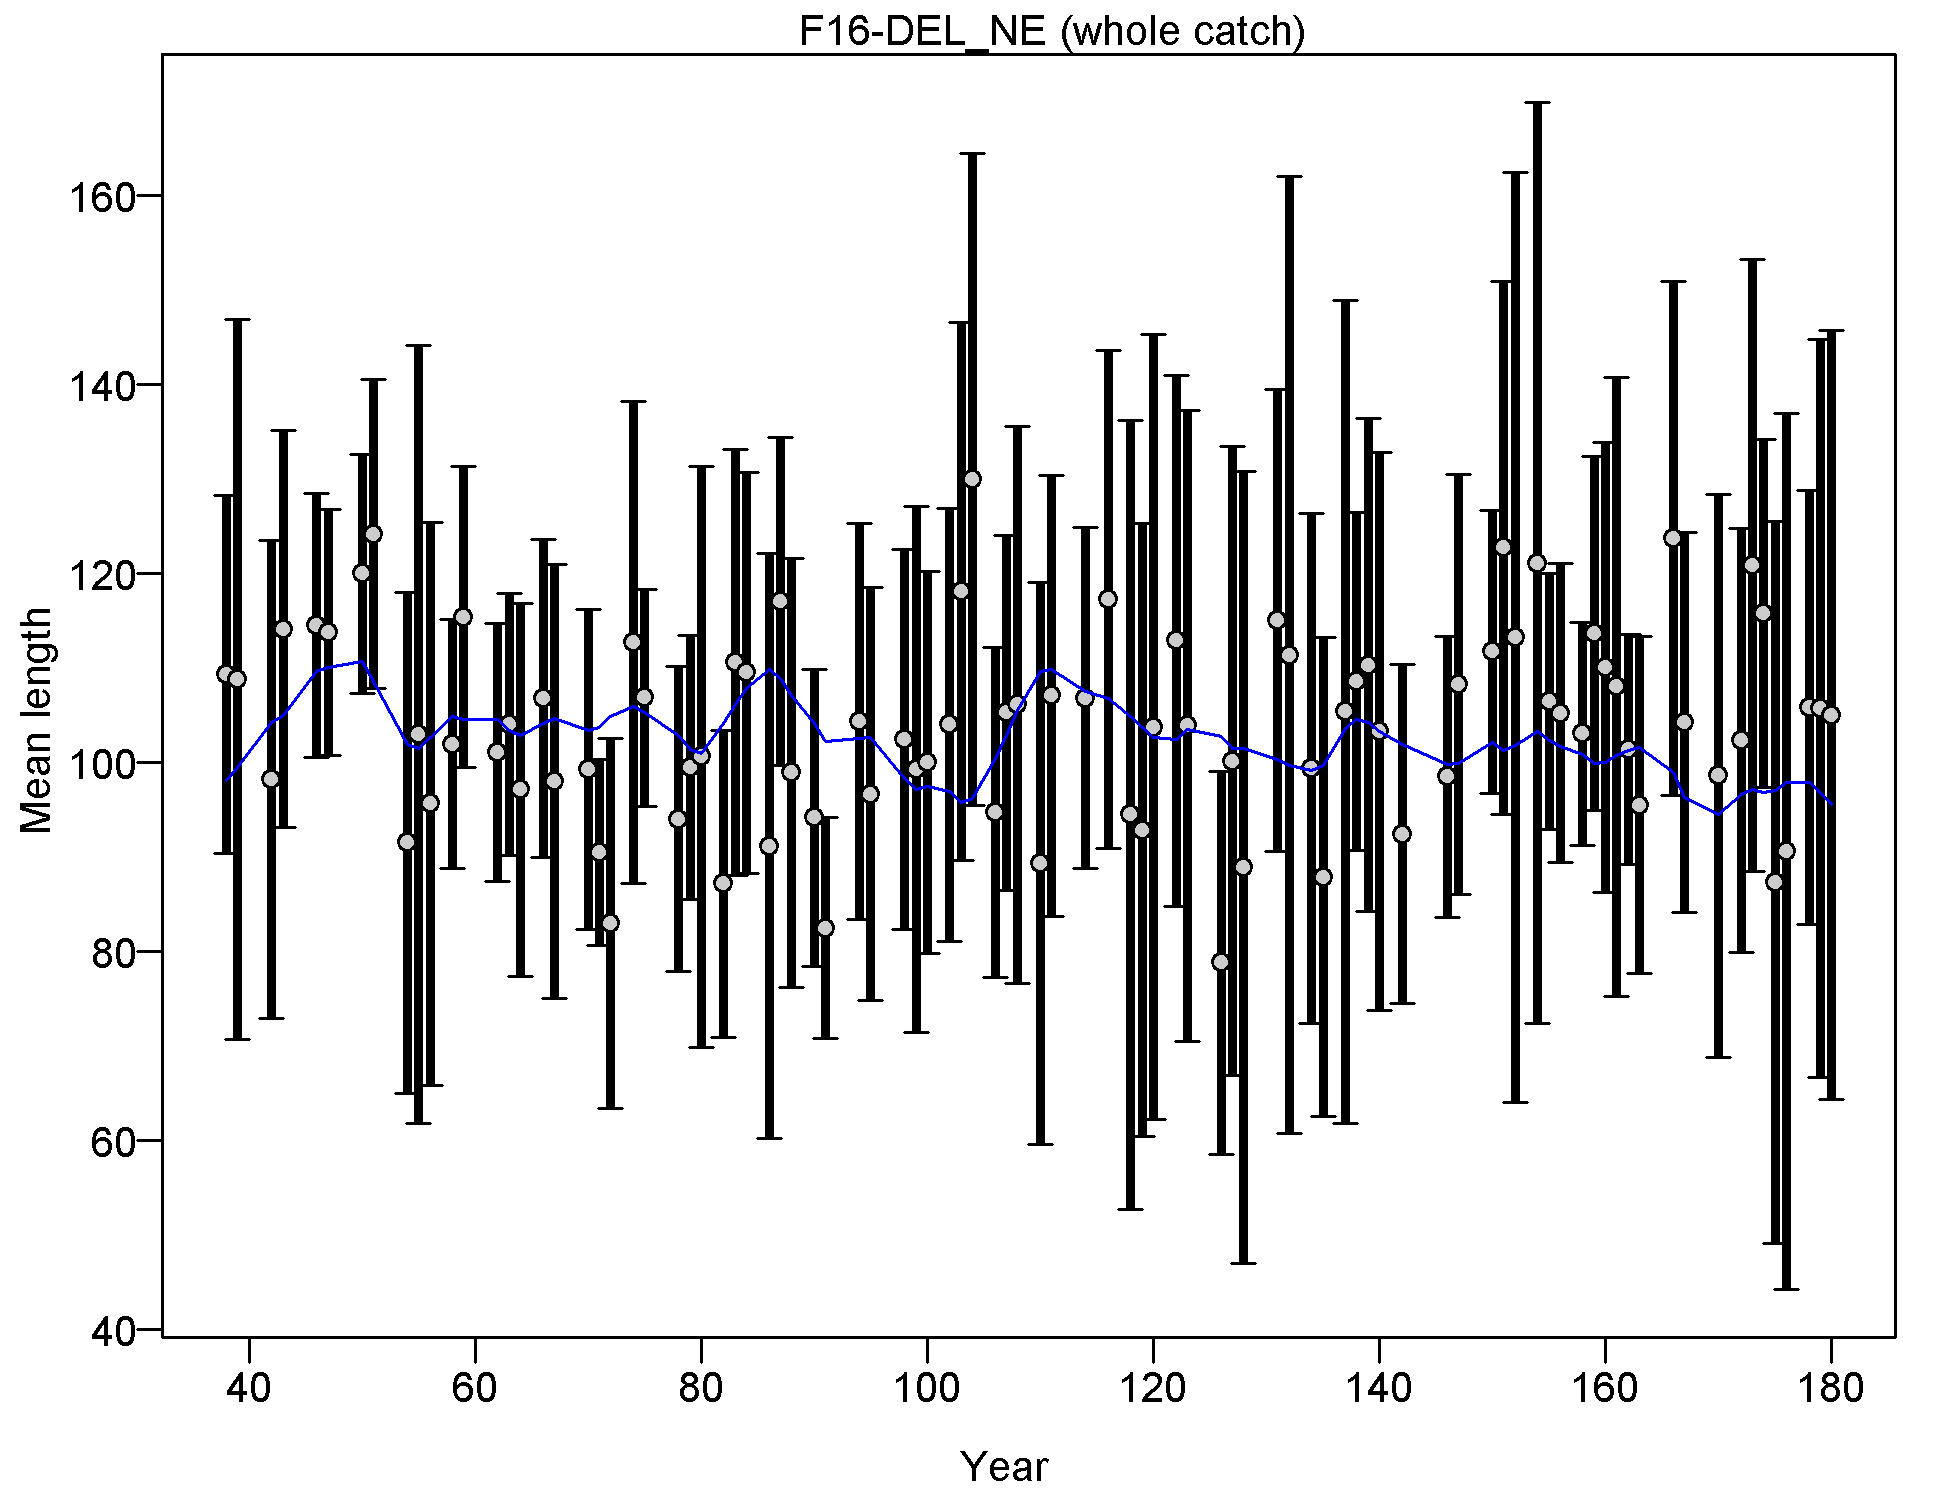
Mean length for F16-DEL_NE with 95% confidence intervals based on current samples sizes.
Francis data weighting method TA1.8: thinner intervals (with capped ends) show result of further adjusting sample sizes based on suggested multiplier (with 95% interval) for len data from F16-DEL_NE:
1.0048 (0.7331-1.5751)
For more info, see
Francis, R.I.C.C. (2011). Data weighting in statistical fisheries stock assessment models. Can. J. Fish. Aquat. Sci. 68: 1124-1138. https://doi.org/10.1139/f2011-025
file: comp_lenfit_data_weighting_TA1.8_F16-DEL_NE.png
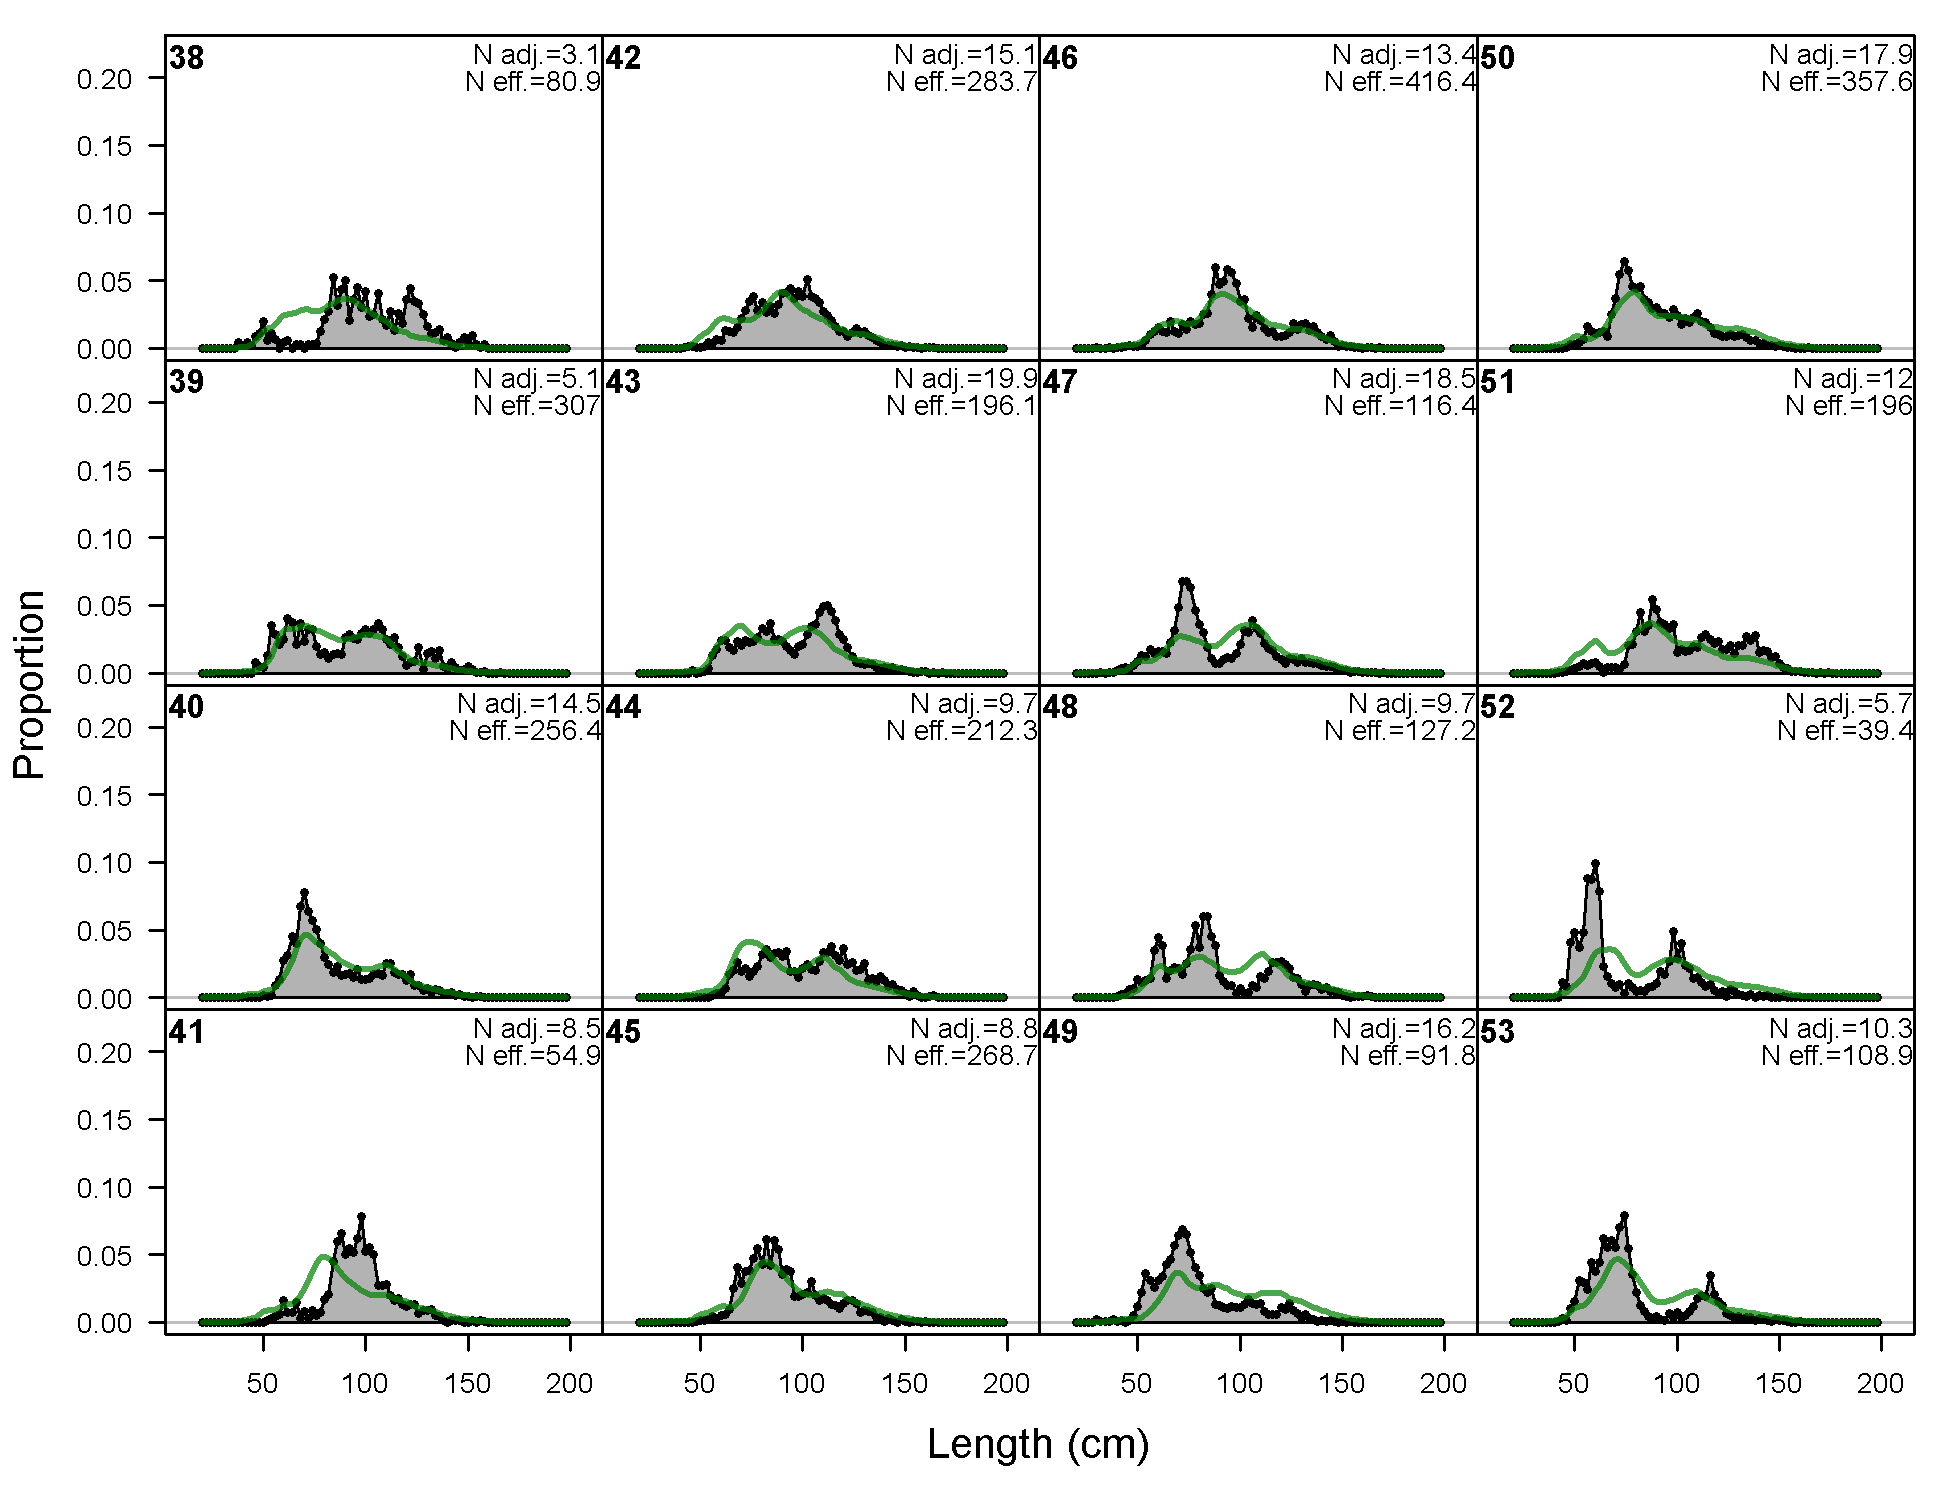
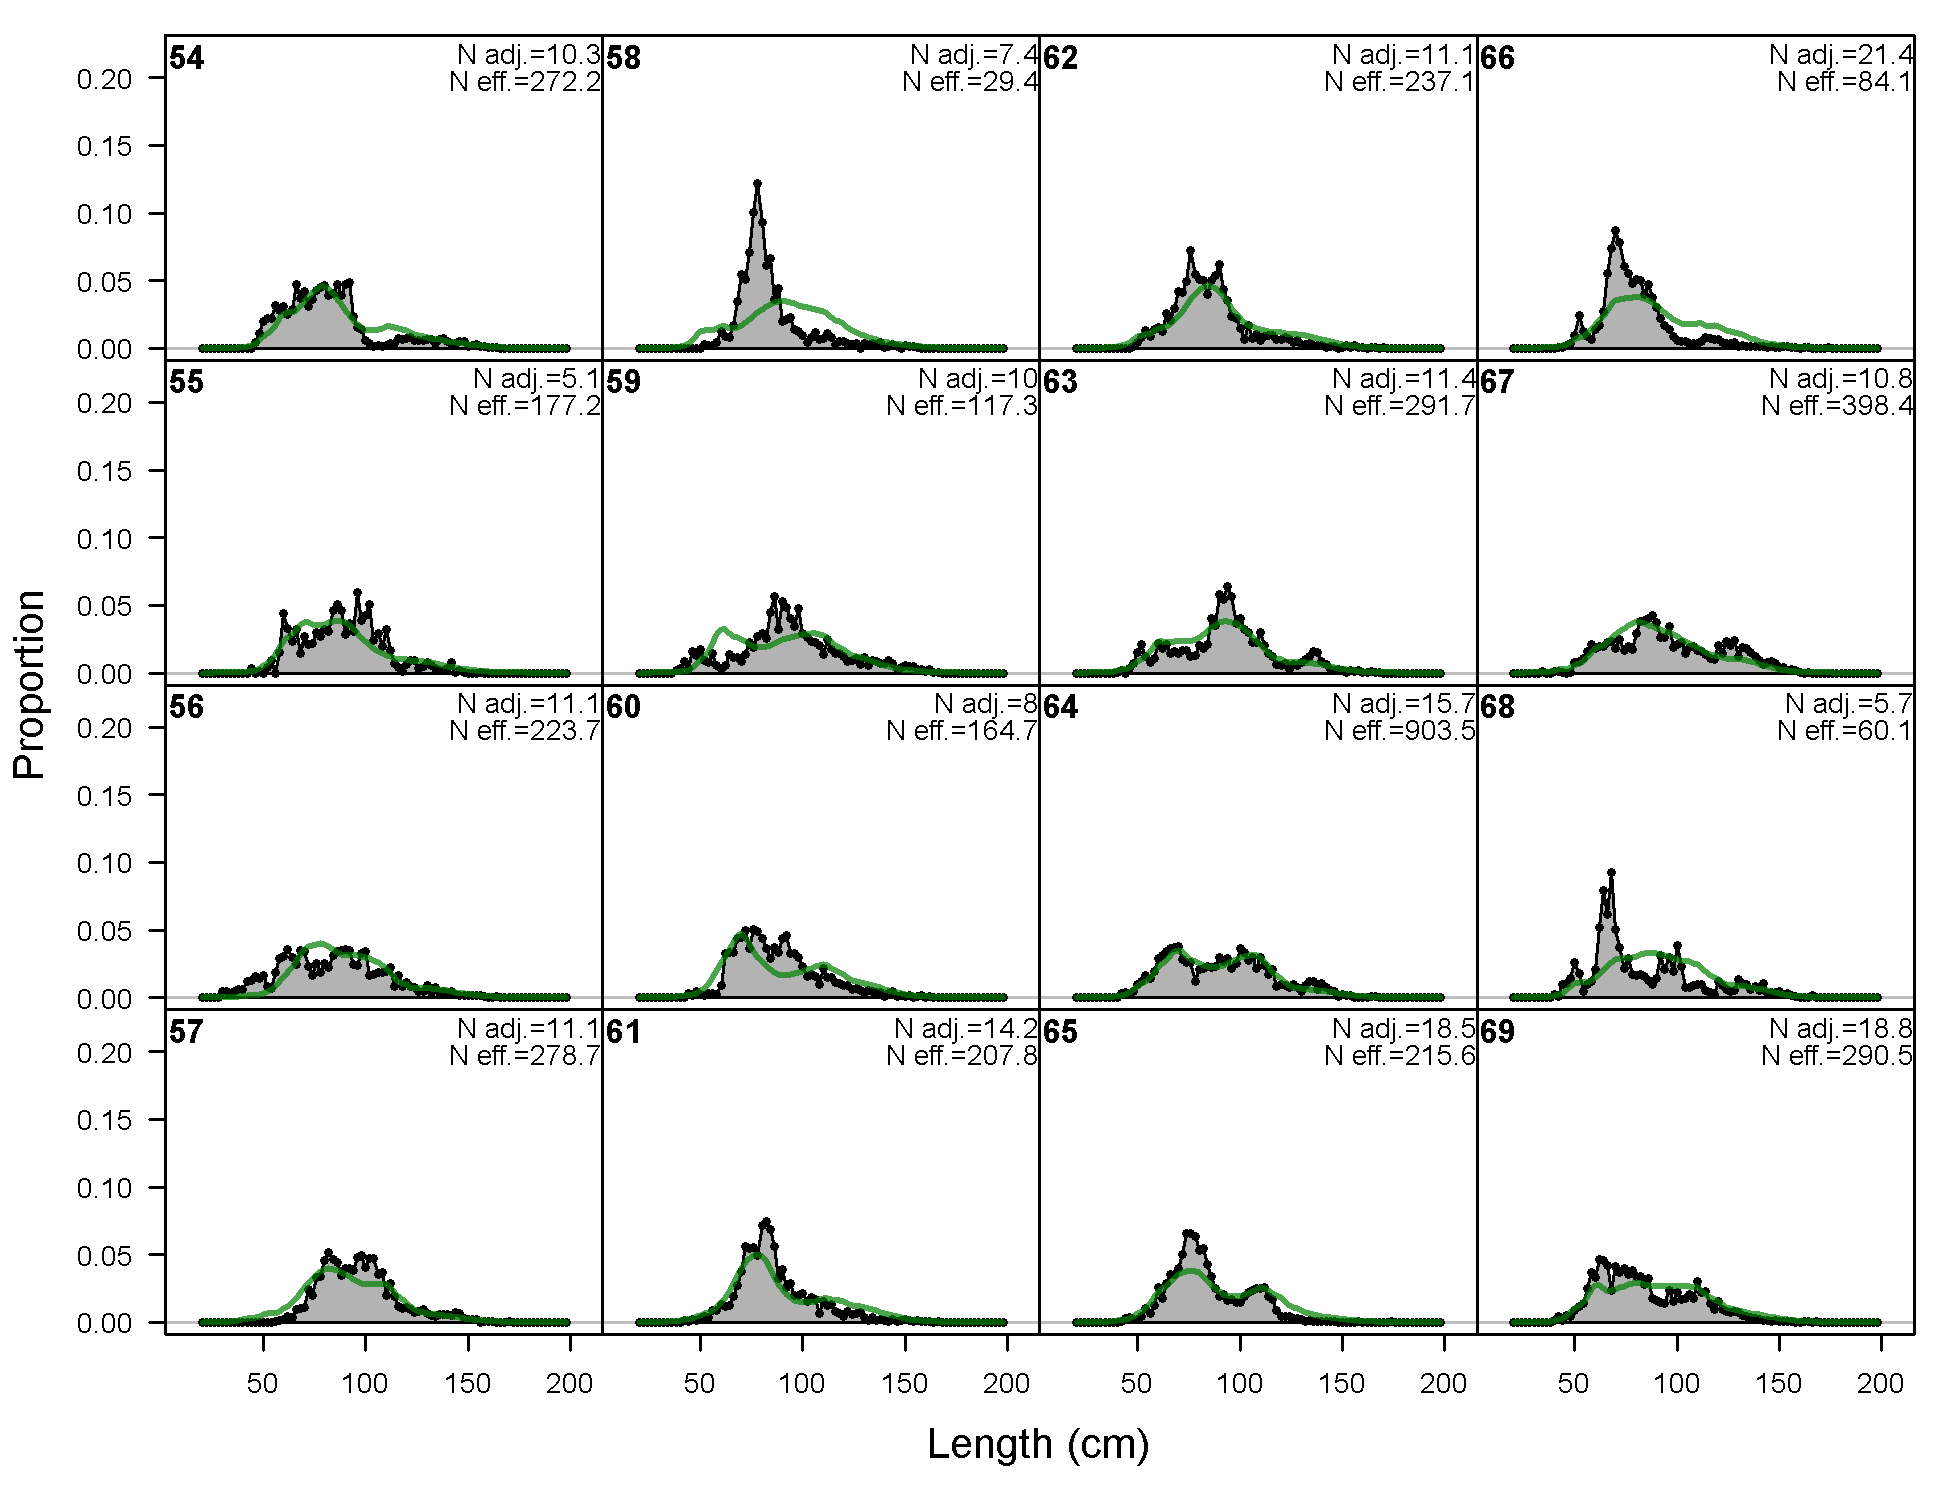
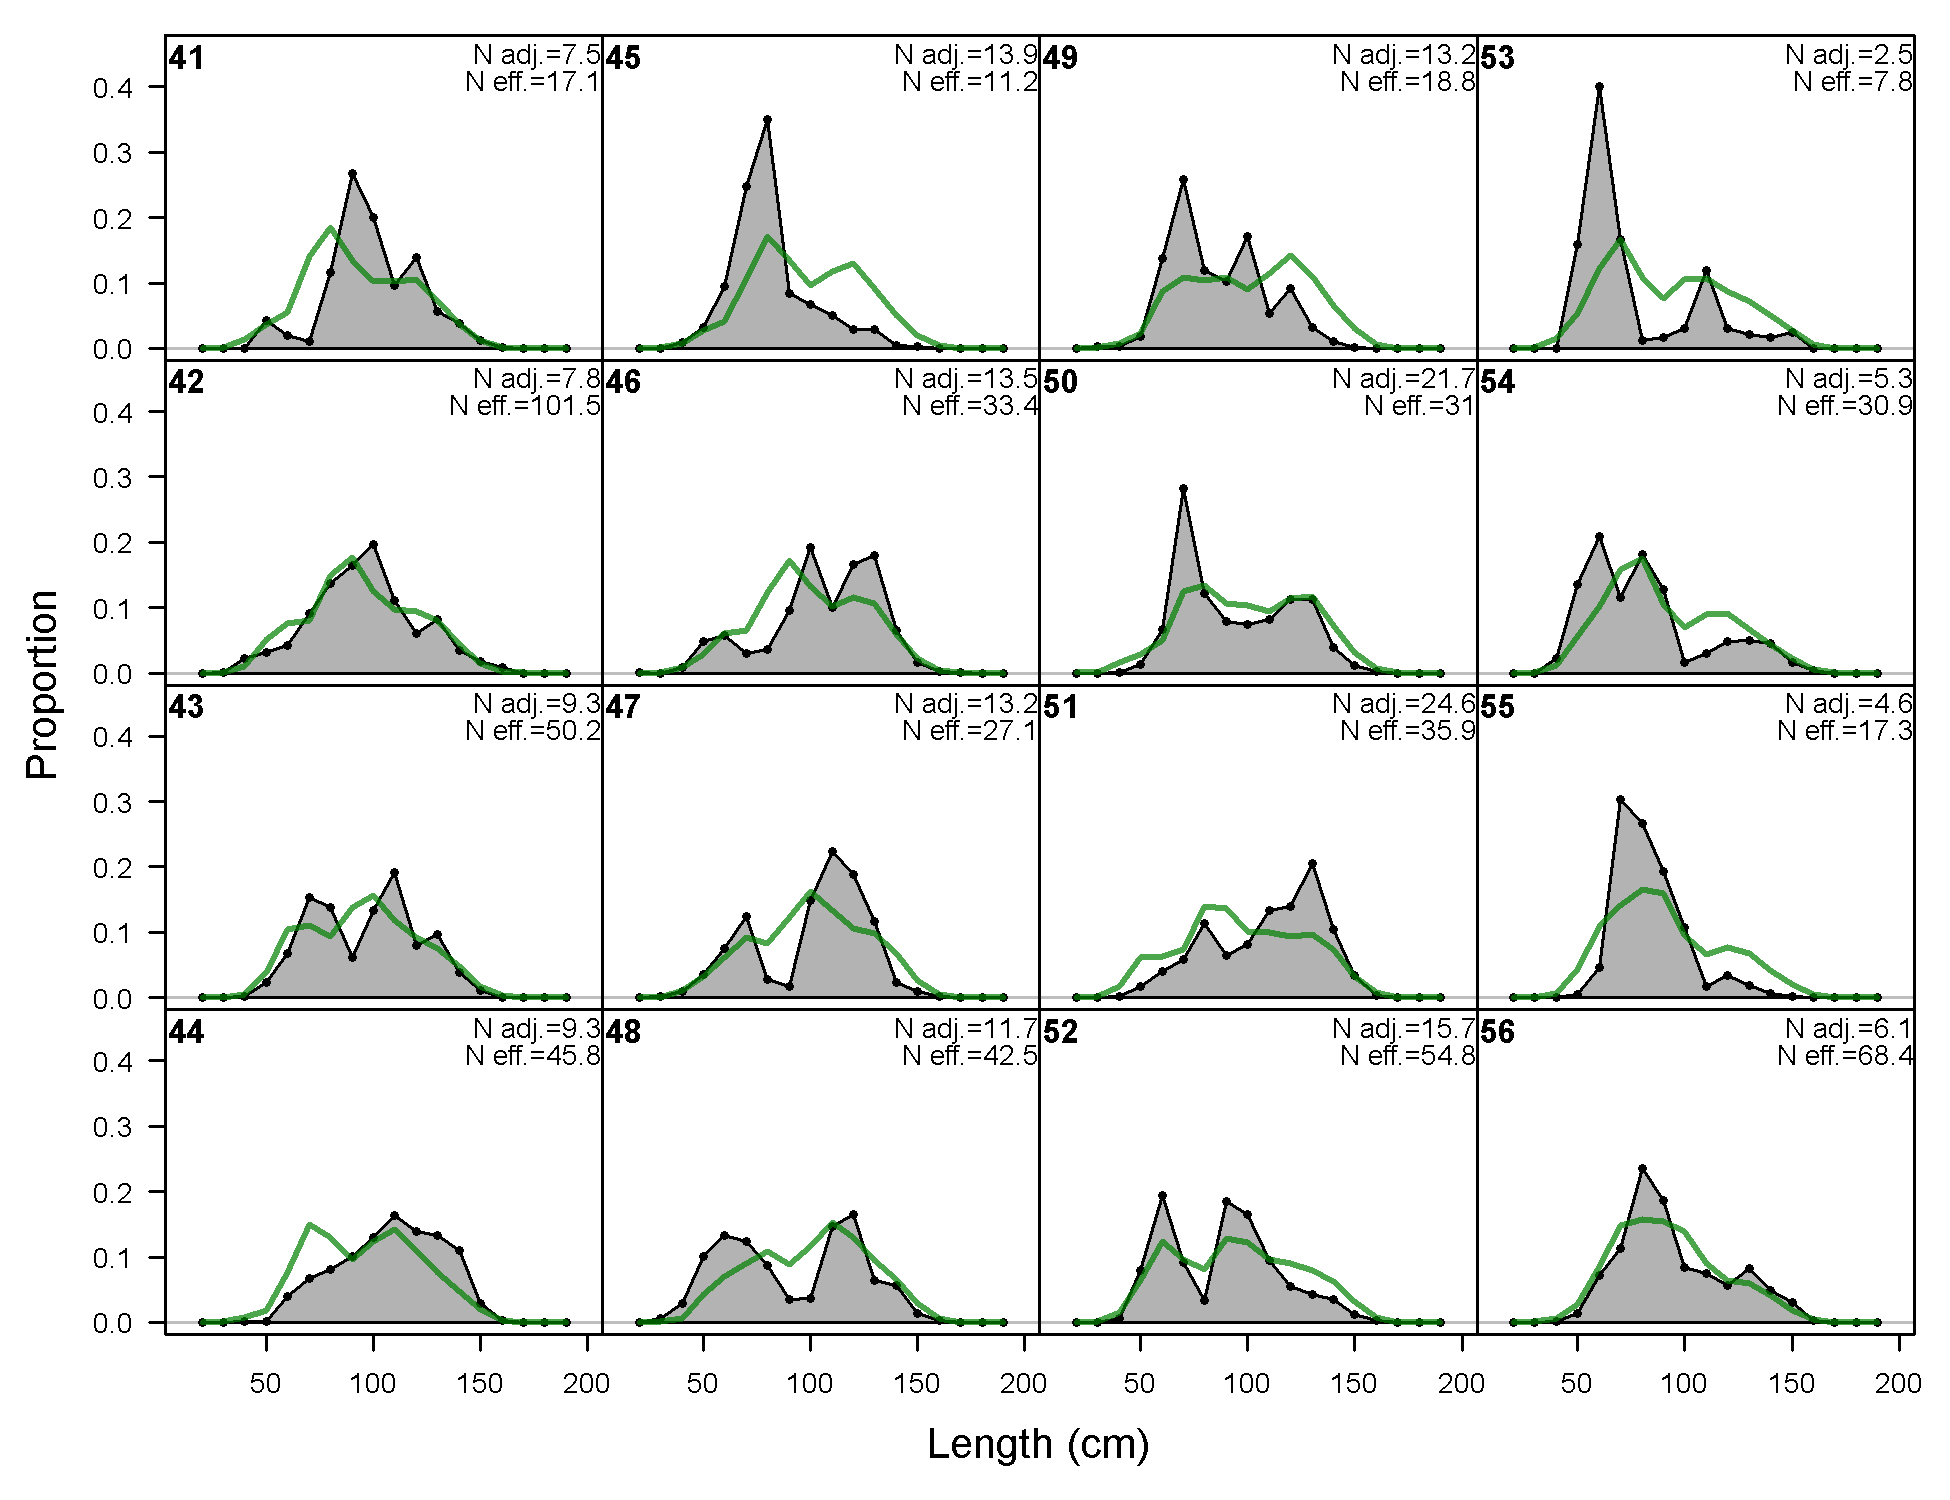
Length comps, whole catch, F17-DEL_M (plot 1 of 7).
'N adj.' is the input sample size after data-weighting adjustment. N eff. is the calculated effective sample size used in the McAllister-Iannelli tuning method.
file: comp_lenfit_flt17mkt0_page1.png
Length comps, whole catch, F17-DEL_M (plot 2 of 7)
file: comp_lenfit_flt17mkt0_page2.png
Length comps, whole catch, F17-DEL_M (plot 3 of 7)
file: comp_lenfit_flt17mkt0_page3.png
Length comps, whole catch, F17-DEL_M (plot 4 of 7)
file: comp_lenfit_flt17mkt0_page4.png
Length comps, whole catch, F17-DEL_M (plot 5 of 7)
file: comp_lenfit_flt17mkt0_page5.png
Length comps, whole catch, F17-DEL_M (plot 6 of 7)
file: comp_lenfit_flt17mkt0_page6.png
Length comps, whole catch, F17-DEL_M (plot 7 of 7)
file: comp_lenfit_flt17mkt0_page7.png
Pearson residuals, whole catch, F17-DEL_M (max=2.87) (plot 7 of 7)
Closed bubbles are positive residuals (observed > expected) and open bubbles are negative residuals (observed < expected).
file: comp_lenfit_residsflt17mkt0_page7.png
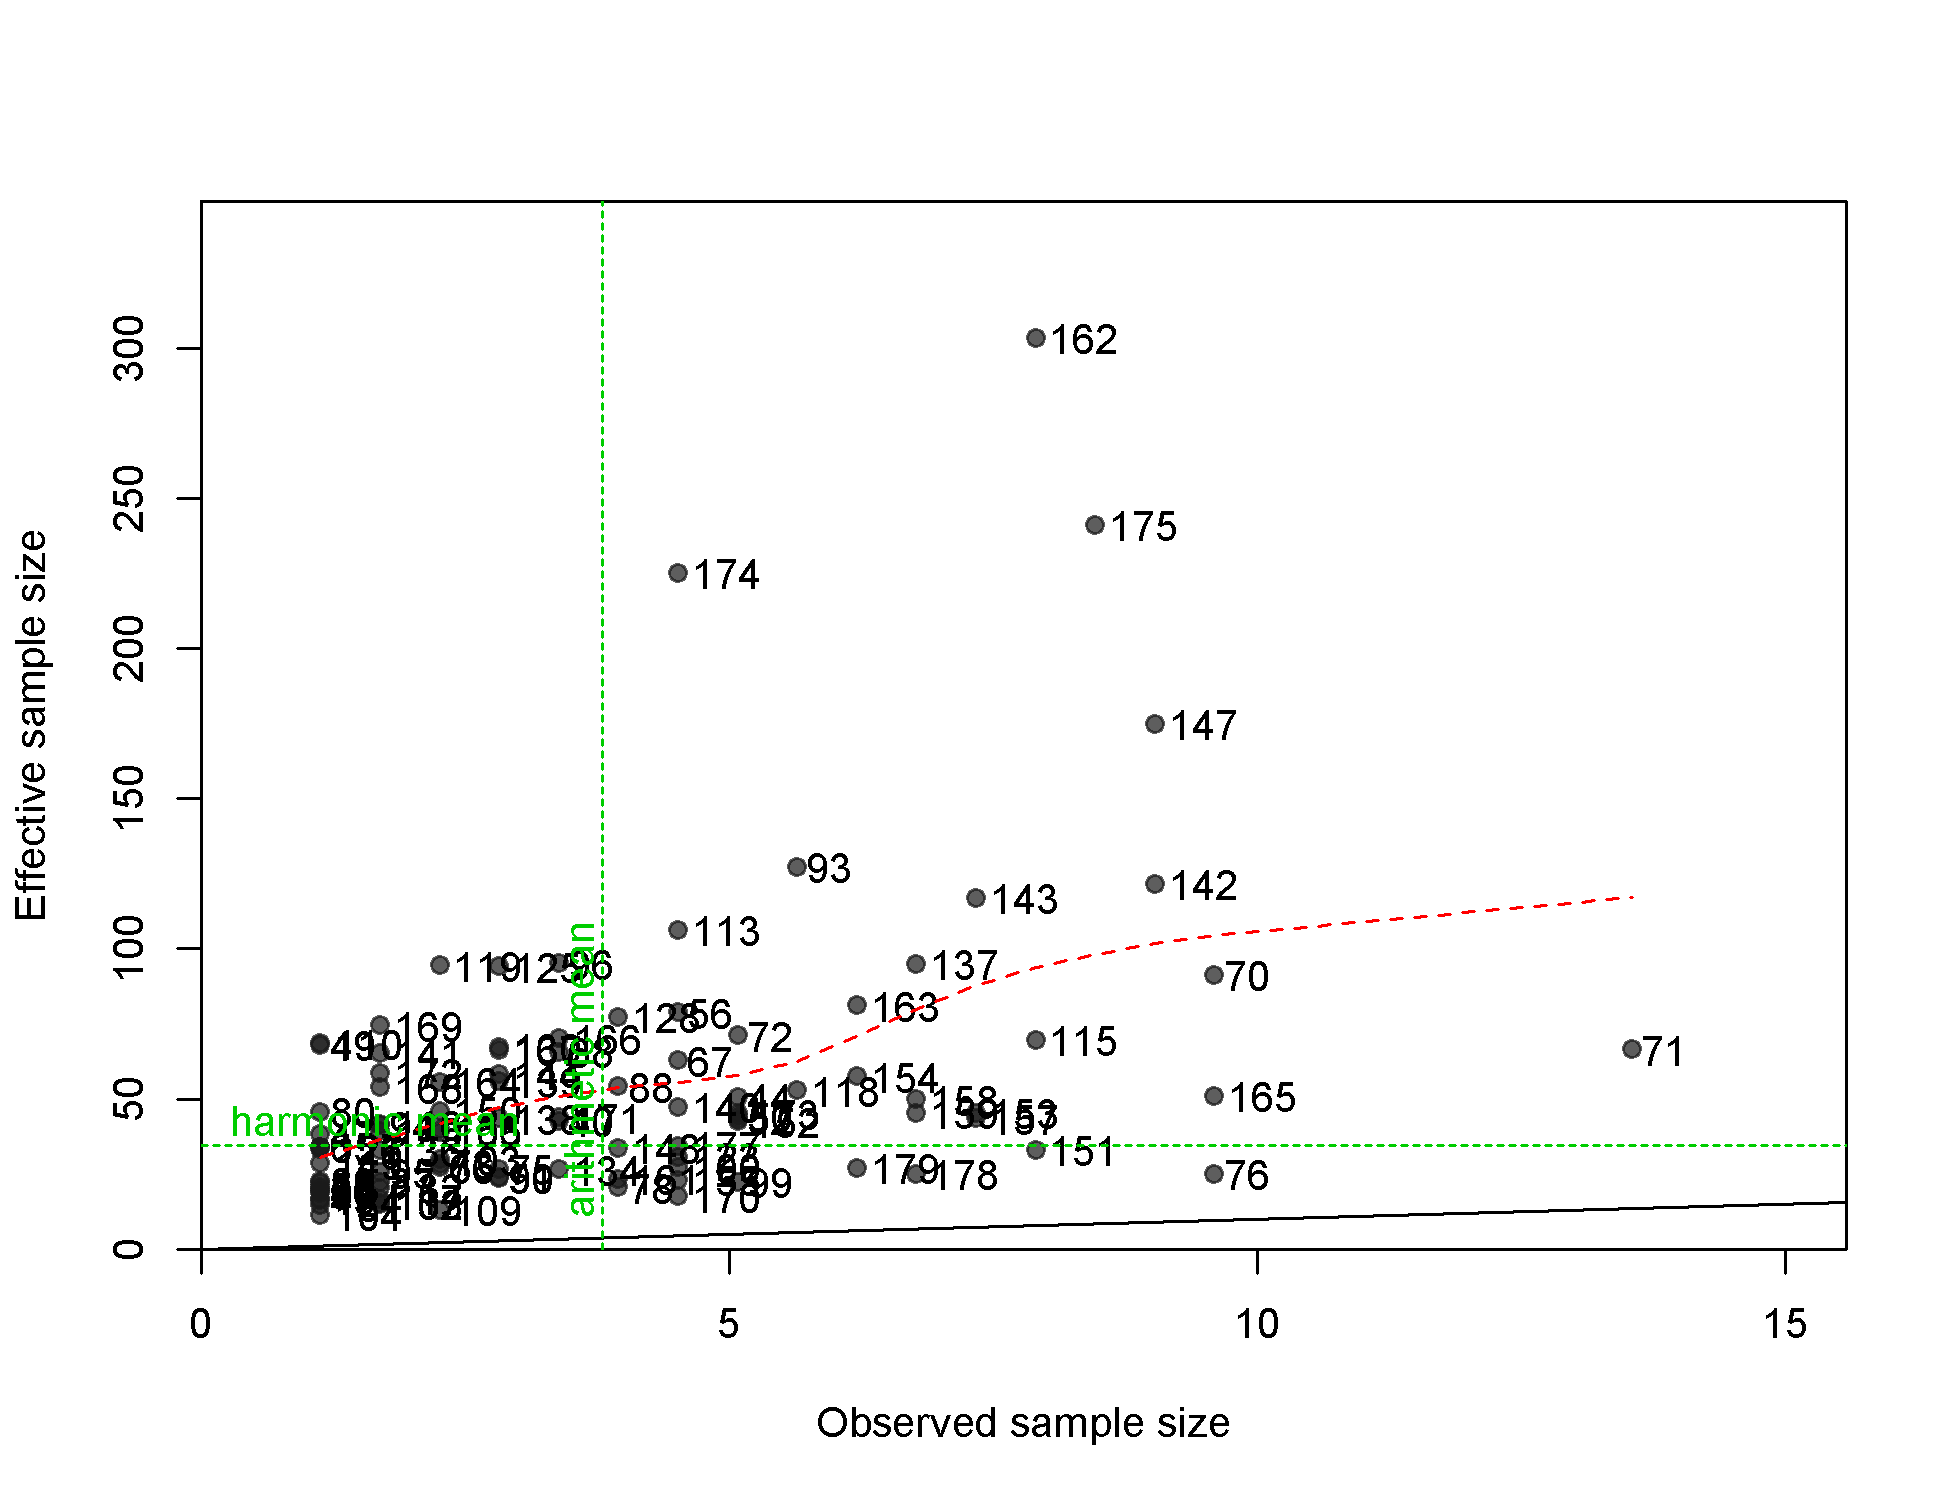
N-EffN comparison, Length comps, whole catch, F17-DEL_M
file: comp_lenfit_sampsize_flt17mkt0.png
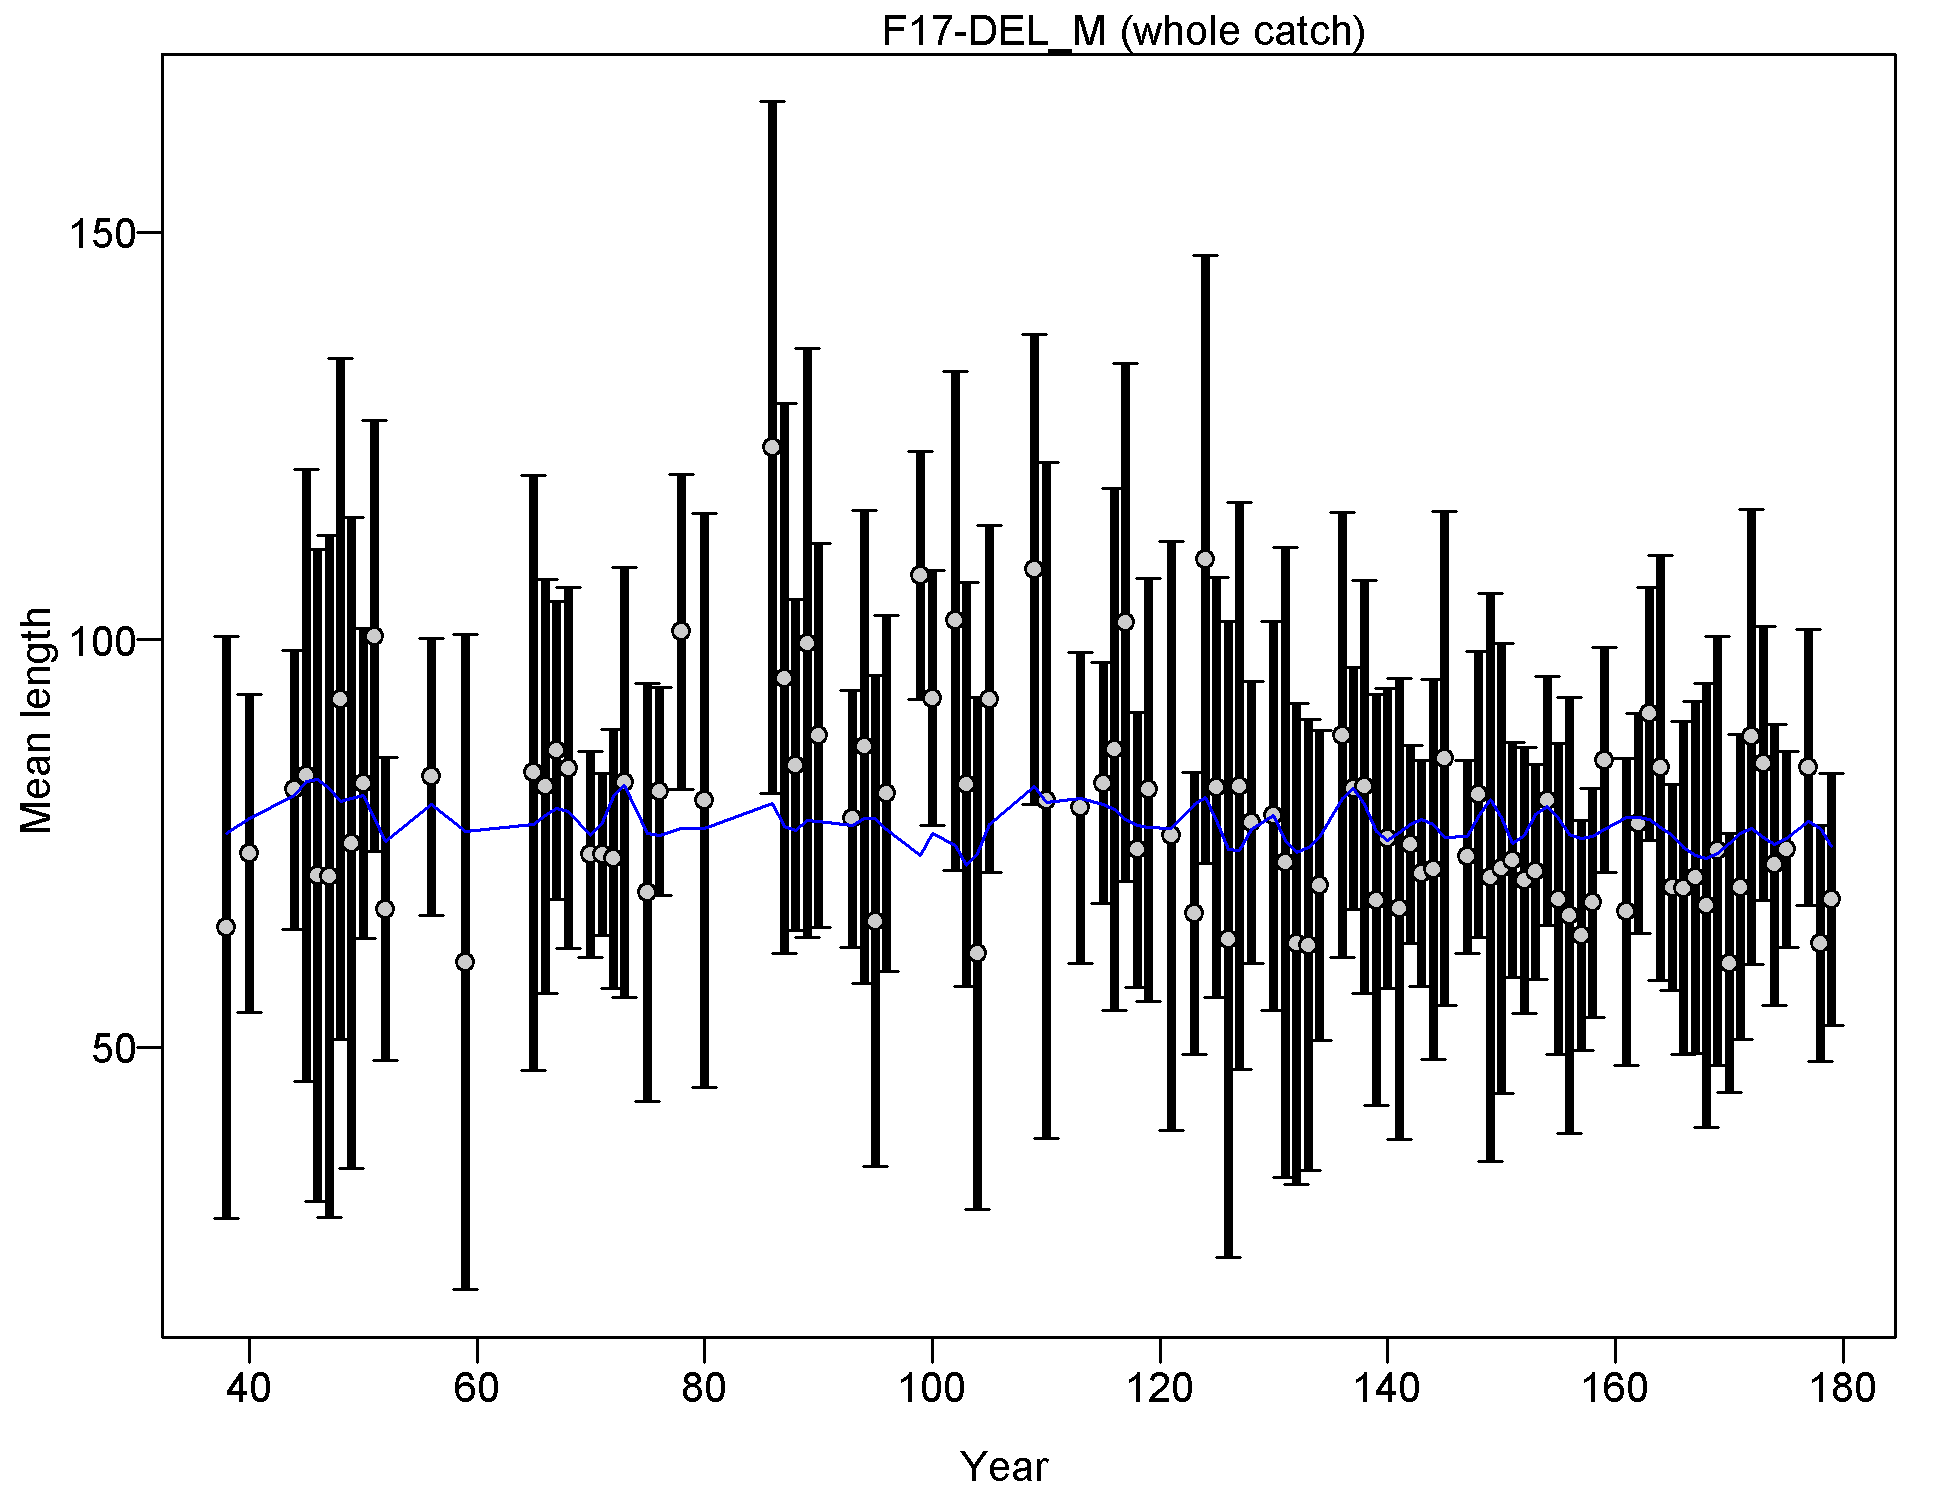
Mean length for F17-DEL_M with 95% confidence intervals based on current samples sizes.
Francis data weighting method TA1.8: thinner intervals (with capped ends) show result of further adjusting sample sizes based on suggested multiplier (with 95% interval) for len data from F17-DEL_M:
1.0007 (0.6567-1.5781)
For more info, see
Francis, R.I.C.C. (2011). Data weighting in statistical fisheries stock assessment models. Can. J. Fish. Aquat. Sci. 68: 1124-1138. https://doi.org/10.1139/f2011-025
file: comp_lenfit_data_weighting_TA1.8_F17-DEL_M.png
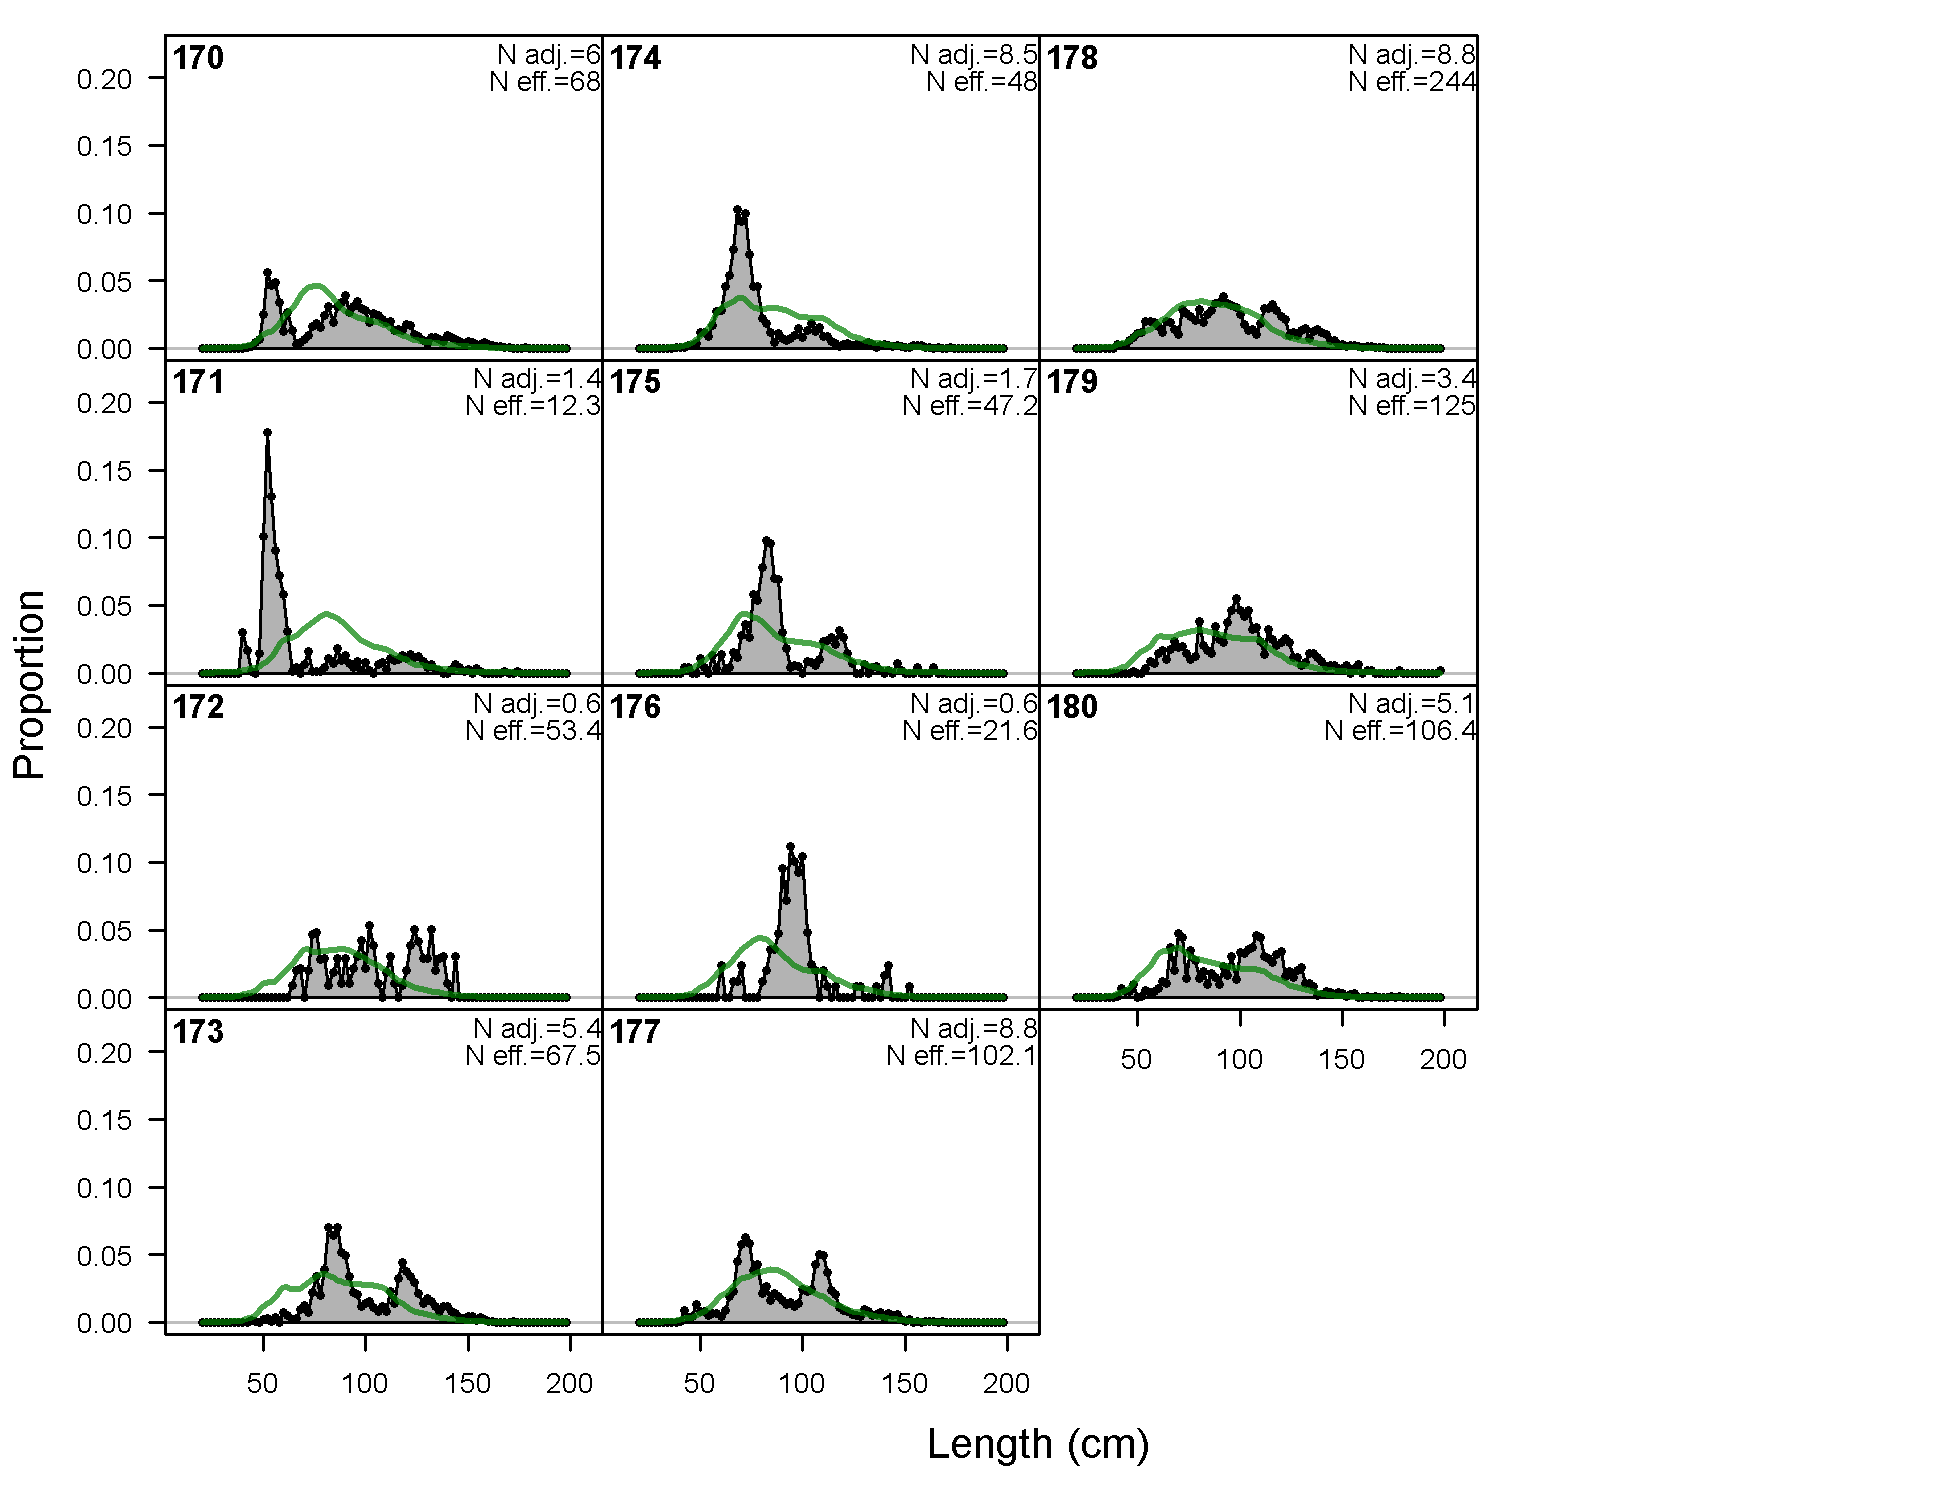
Length comps, whole catch, F18-DEL_C (plot 1 of 9).
'N adj.' is the input sample size after data-weighting adjustment. N eff. is the calculated effective sample size used in the McAllister-Iannelli tuning method.
file: comp_lenfit_flt18mkt0_page1.png
Length comps, whole catch, F18-DEL_C (plot 2 of 9)
file: comp_lenfit_flt18mkt0_page2.png

Length comps, whole catch, F18-DEL_C (plot 3 of 9)
file: comp_lenfit_flt18mkt0_page3.png

Length comps, whole catch, F18-DEL_C (plot 4 of 9)
file: comp_lenfit_flt18mkt0_page4.png
Length comps, whole catch, F18-DEL_C (plot 5 of 9)
file: comp_lenfit_flt18mkt0_page5.png
Length comps, whole catch, F18-DEL_C (plot 6 of 9)
file: comp_lenfit_flt18mkt0_page6.png
Length comps, whole catch, F18-DEL_C (plot 7 of 9)
file: comp_lenfit_flt18mkt0_page7.png
Length comps, whole catch, F18-DEL_C (plot 8 of 9)
file: comp_lenfit_flt18mkt0_page8.png
Length comps, whole catch, F18-DEL_C (plot 9 of 9)
file: comp_lenfit_flt18mkt0_page9.png
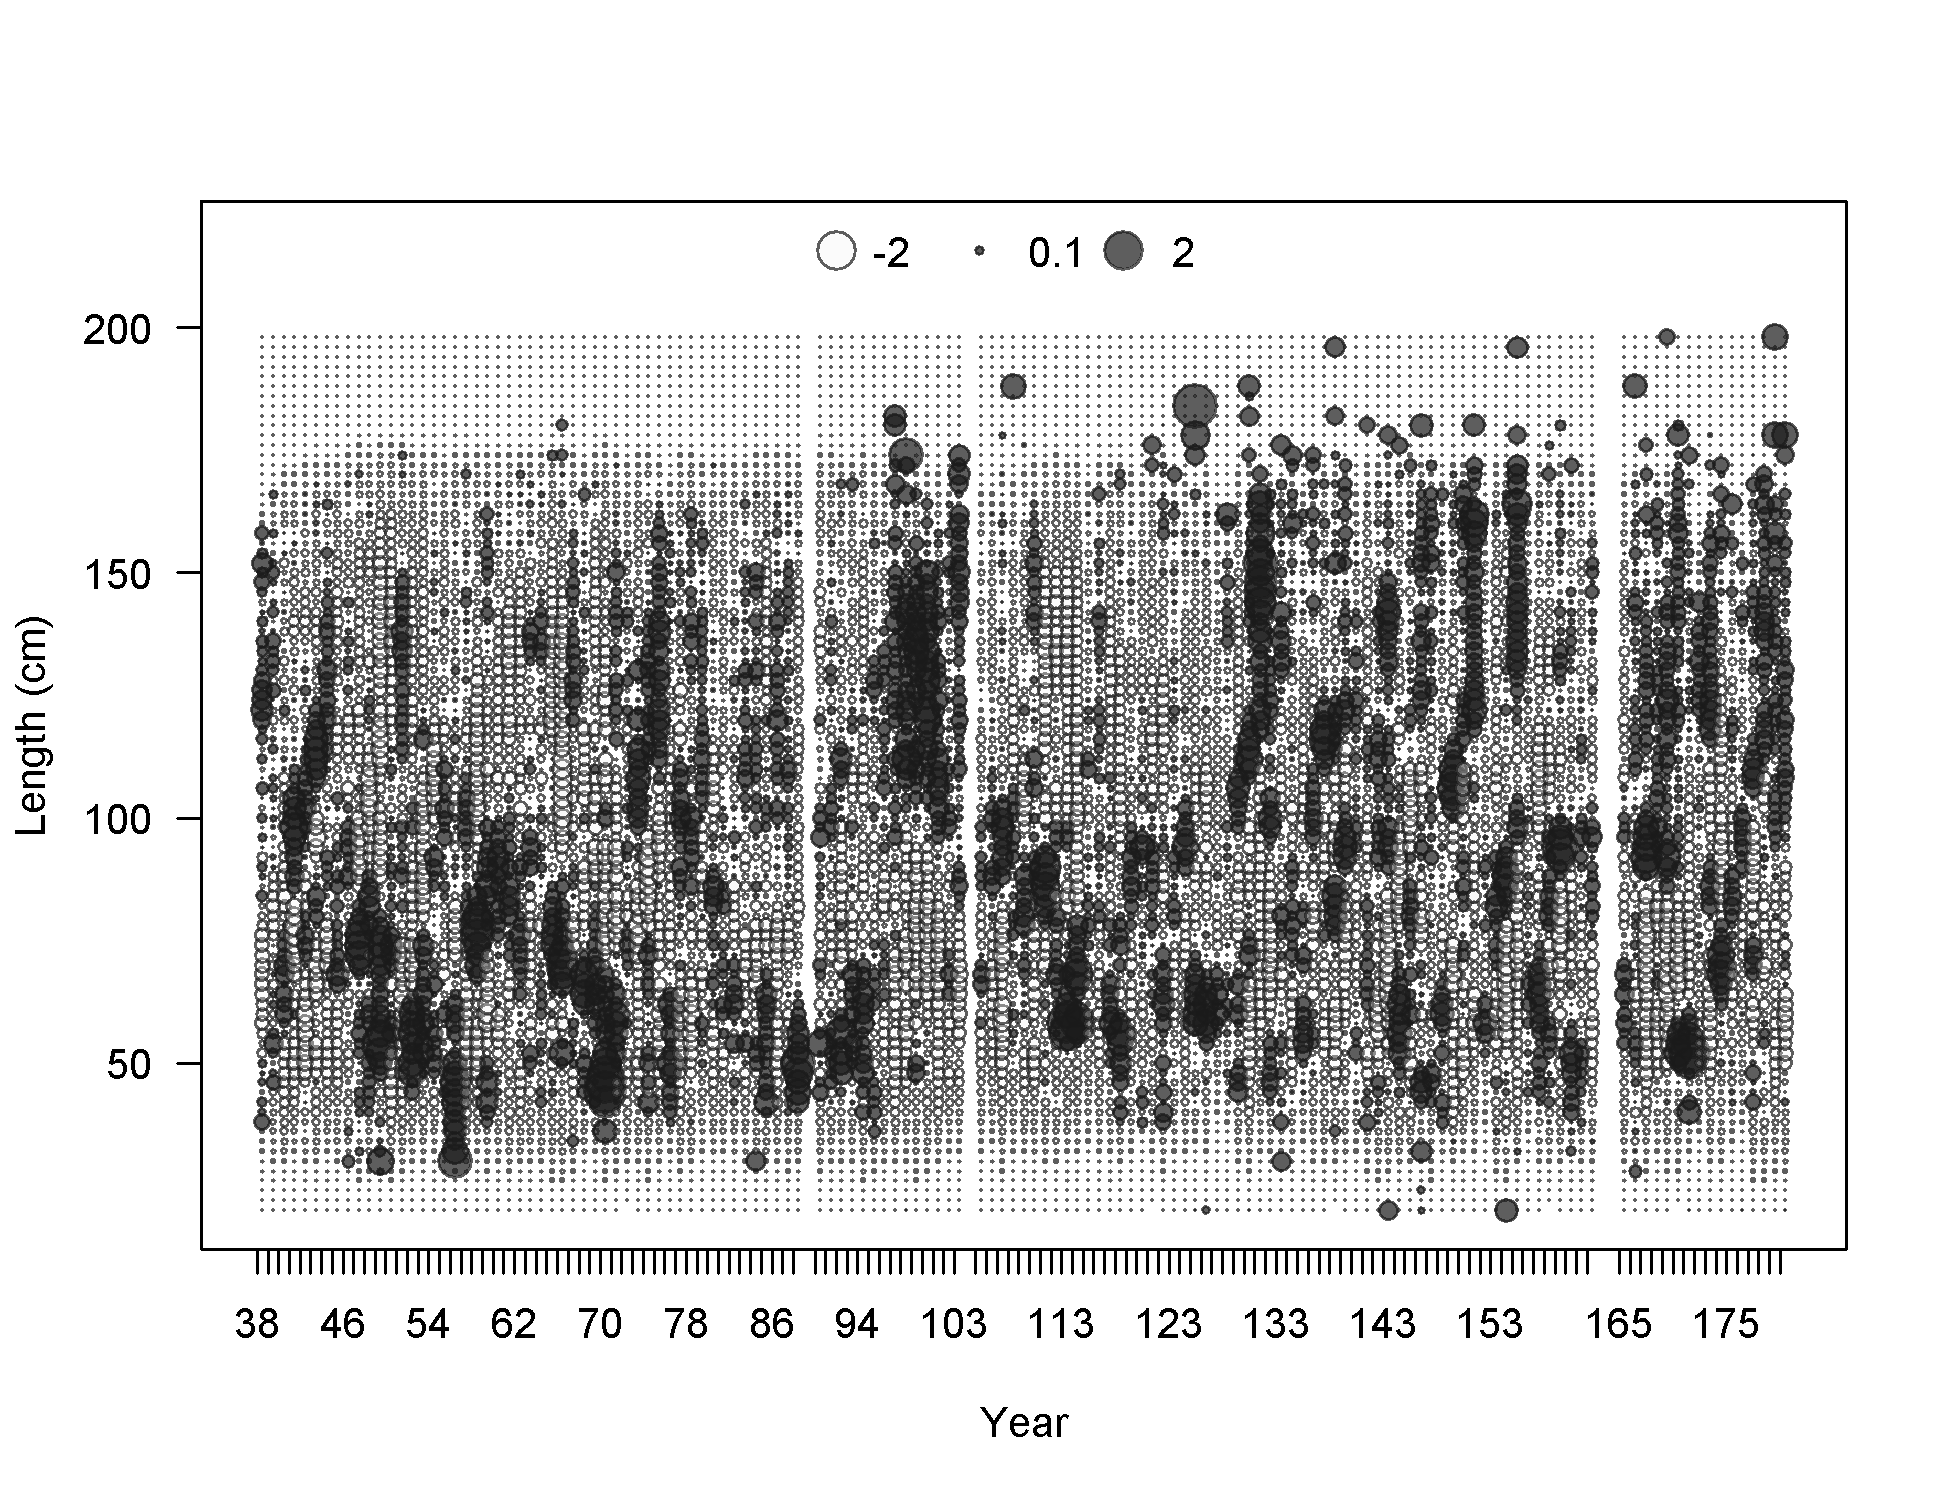
Pearson residuals, whole catch, F18-DEL_C (max=2.52) (plot 9 of 9)
Closed bubbles are positive residuals (observed > expected) and open bubbles are negative residuals (observed < expected).
file: comp_lenfit_residsflt18mkt0_page9.png
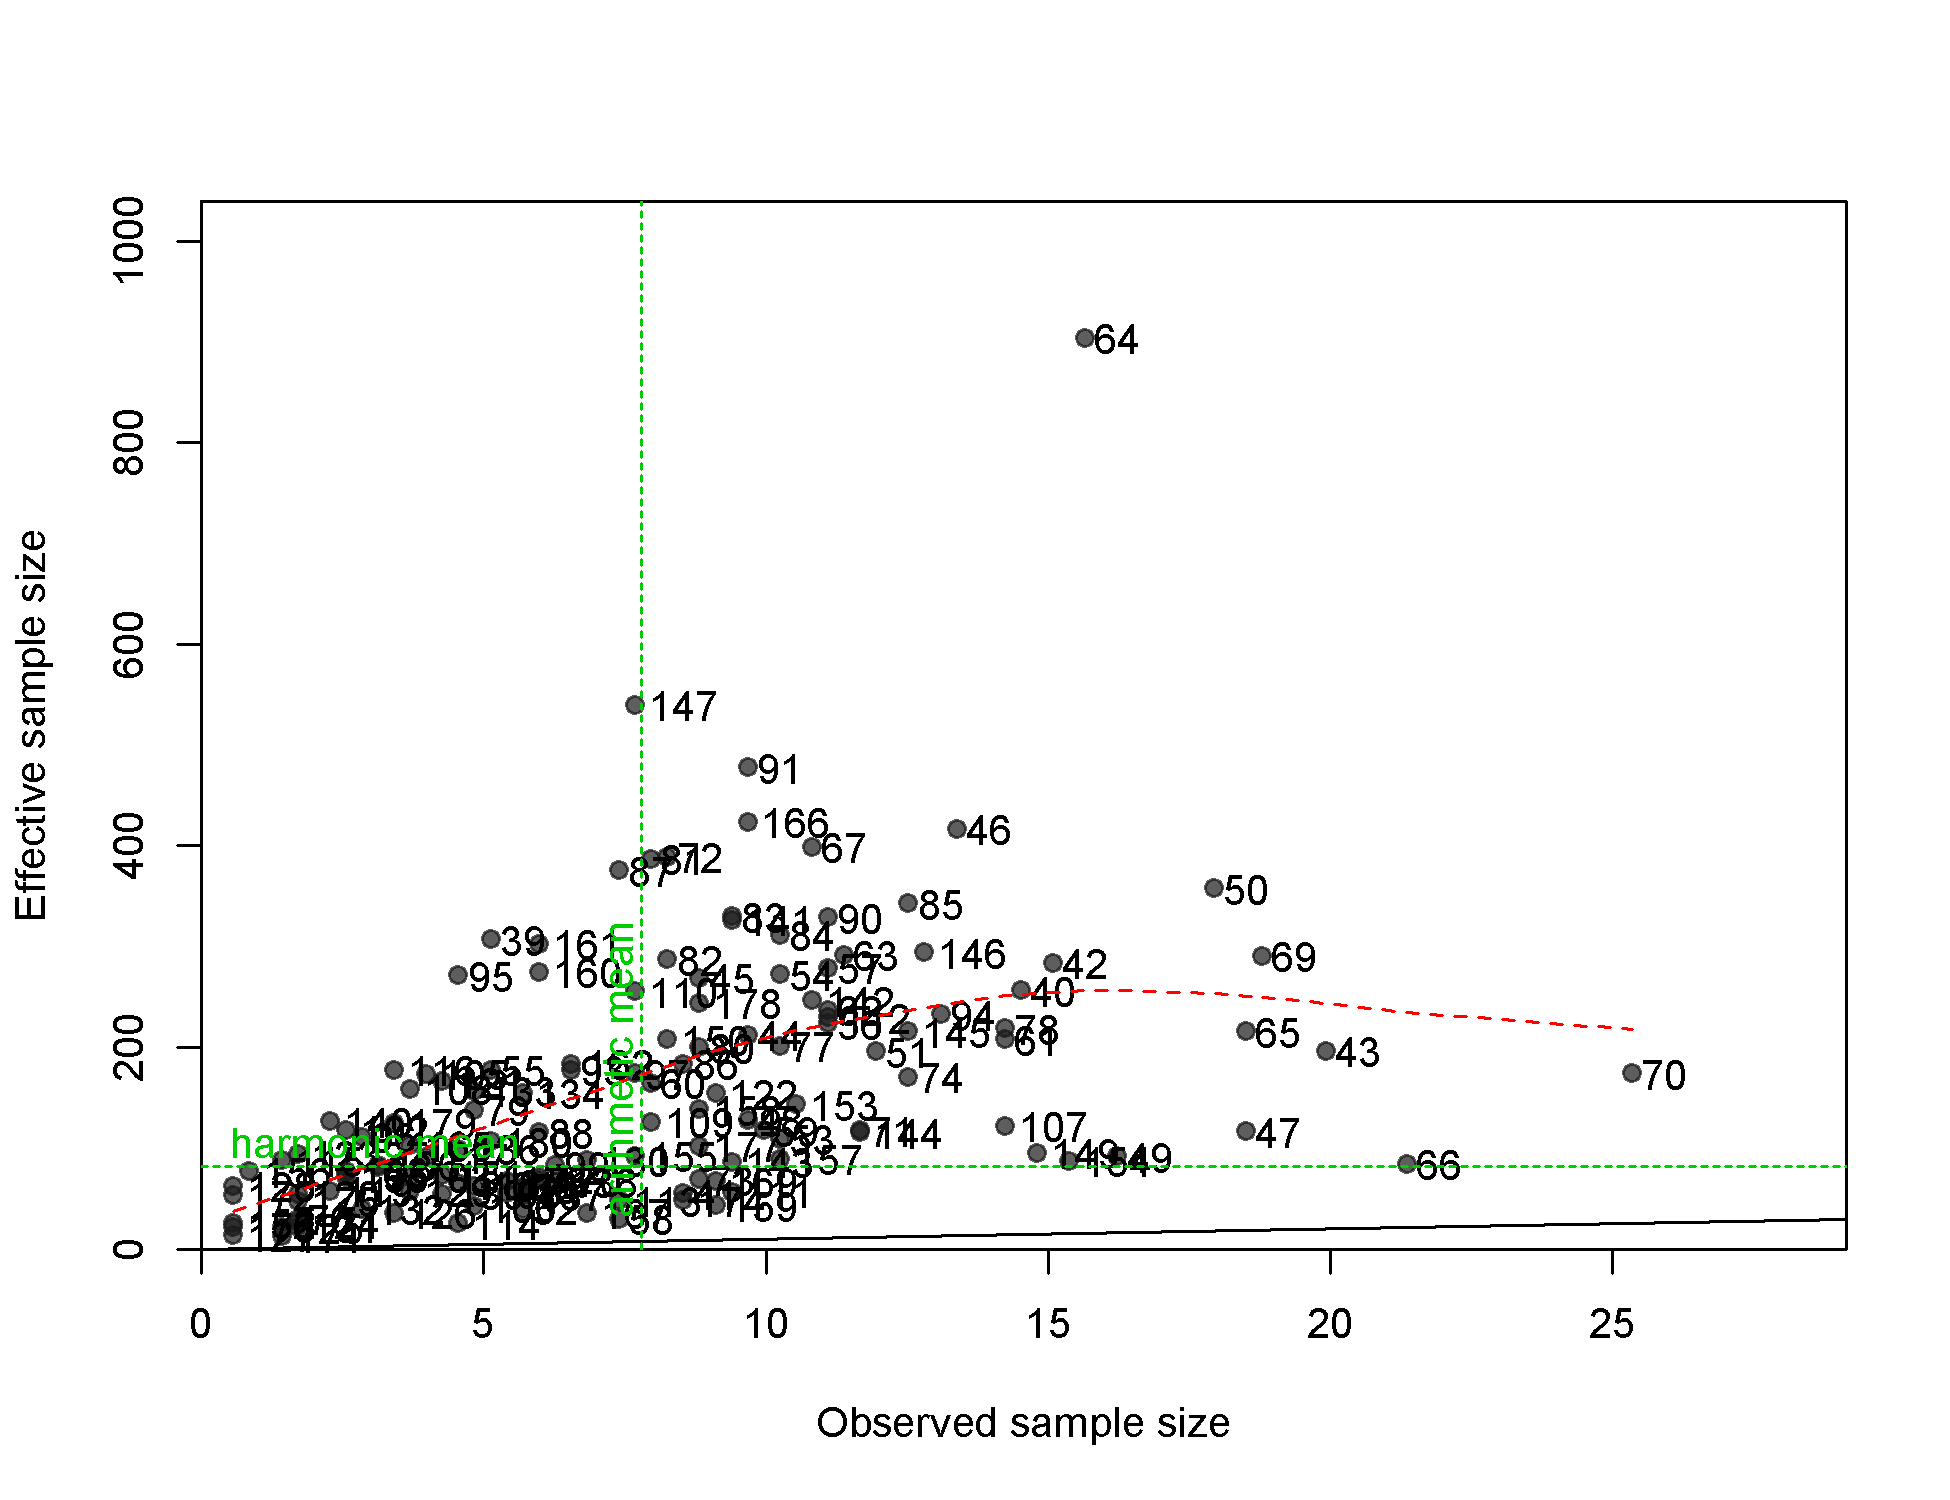
N-EffN comparison, Length comps, whole catch, F18-DEL_C
file: comp_lenfit_sampsize_flt18mkt0.png
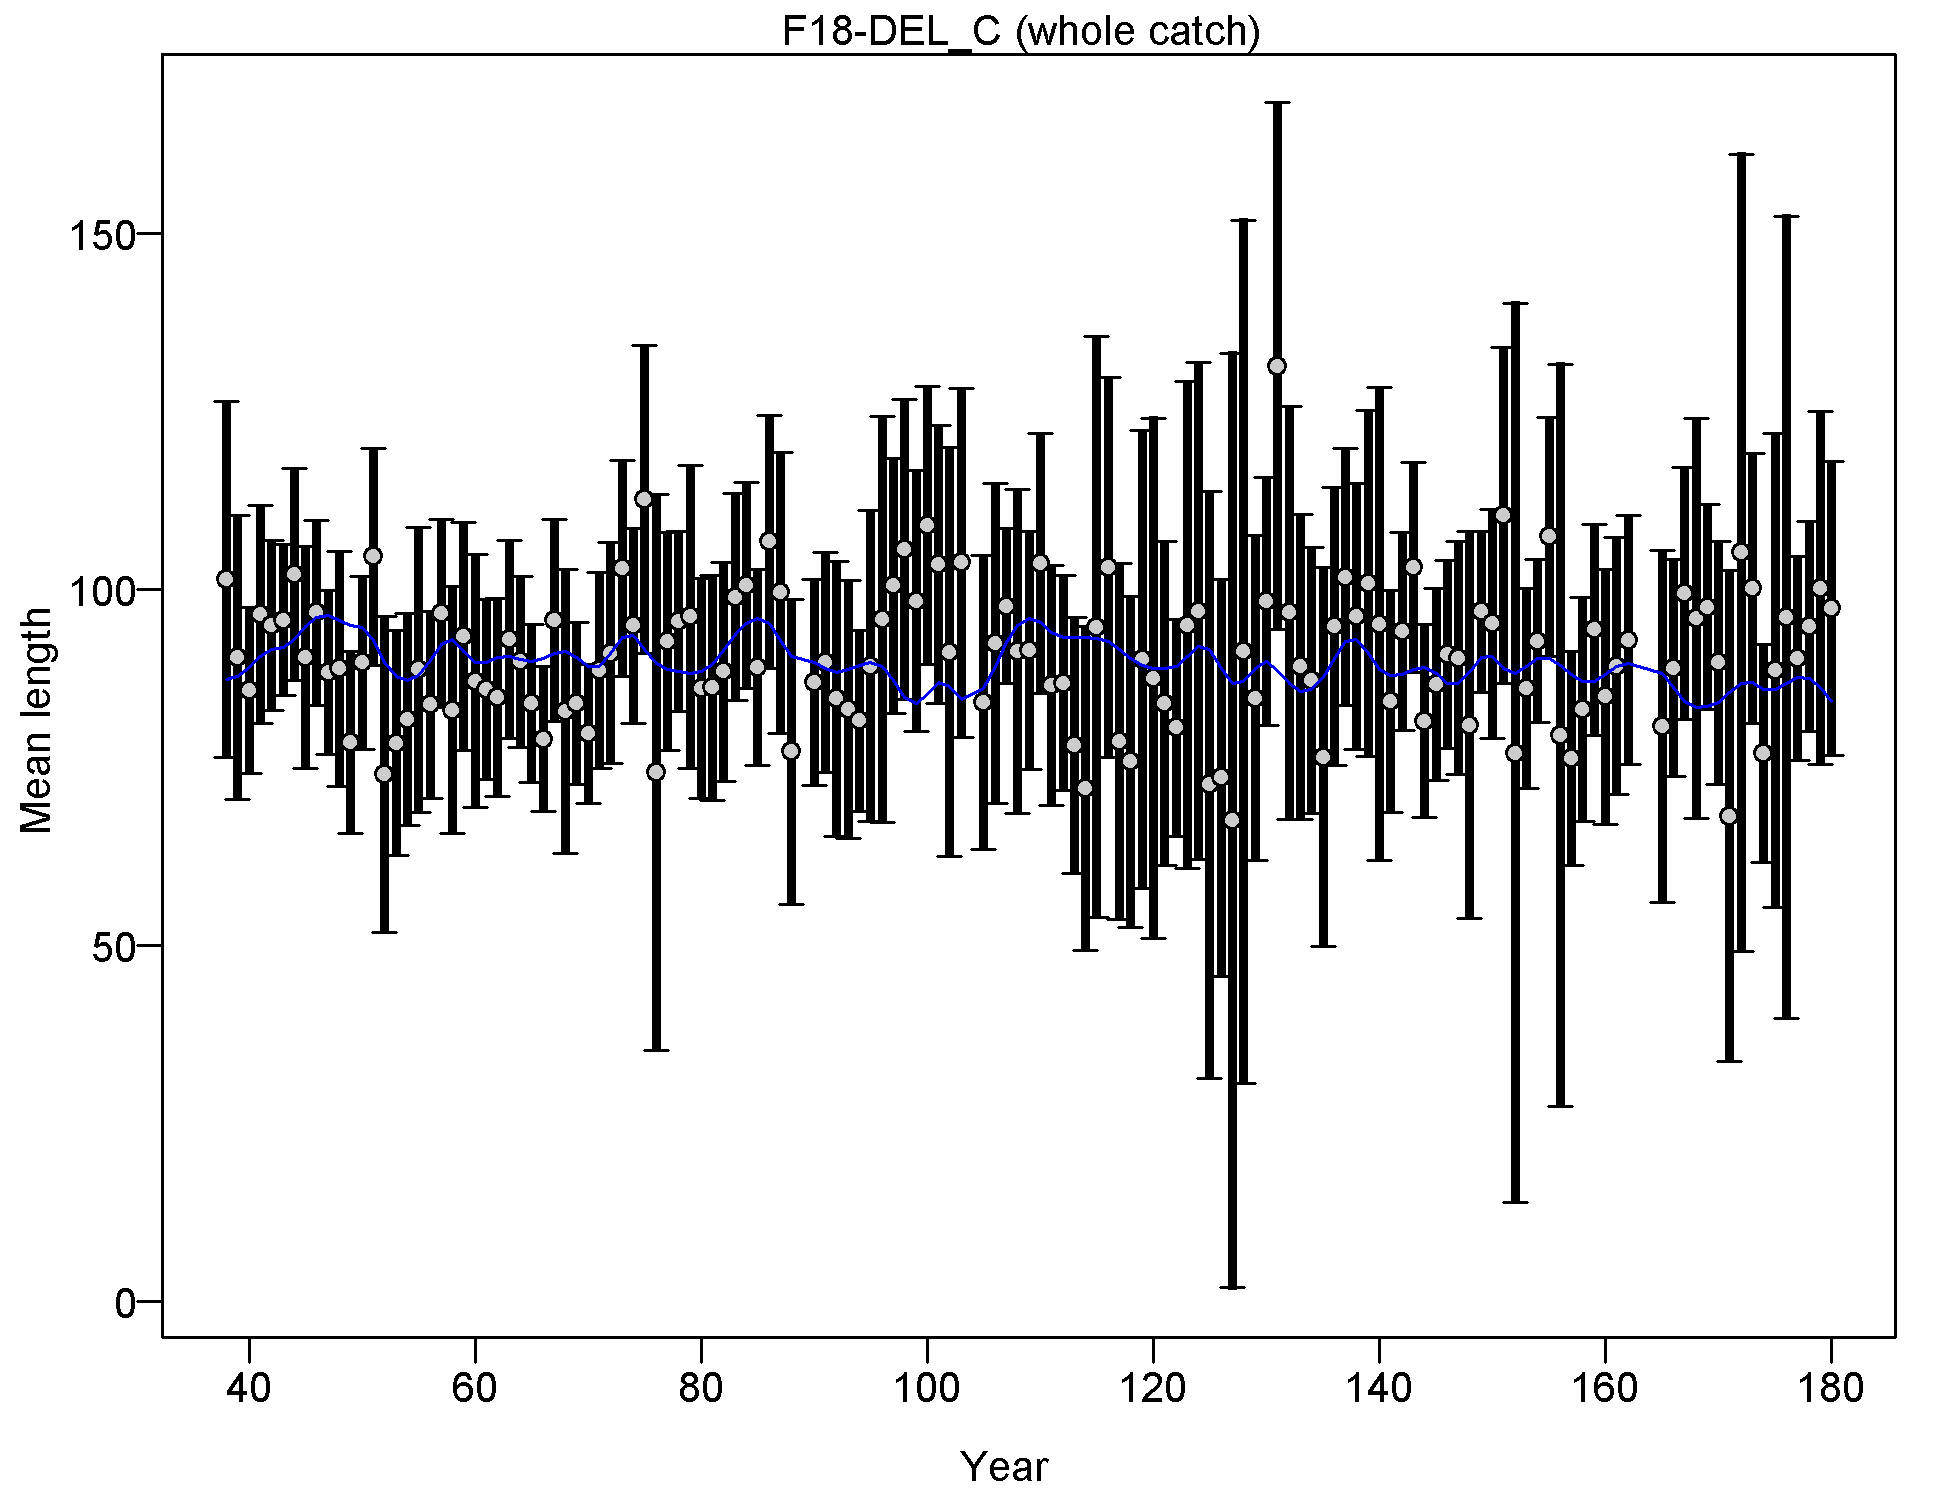
Mean length for F18-DEL_C with 95% confidence intervals based on current samples sizes.
Francis data weighting method TA1.8: thinner intervals (with capped ends) show result of further adjusting sample sizes based on suggested multiplier (with 95% interval) for len data from F18-DEL_C:
1.0093 (0.8391-1.2773)
For more info, see
Francis, R.I.C.C. (2011). Data weighting in statistical fisheries stock assessment models. Can. J. Fish. Aquat. Sci. 68: 1124-1138. https://doi.org/10.1139/f2011-025
file: comp_lenfit_data_weighting_TA1.8_F18-DEL_C.png
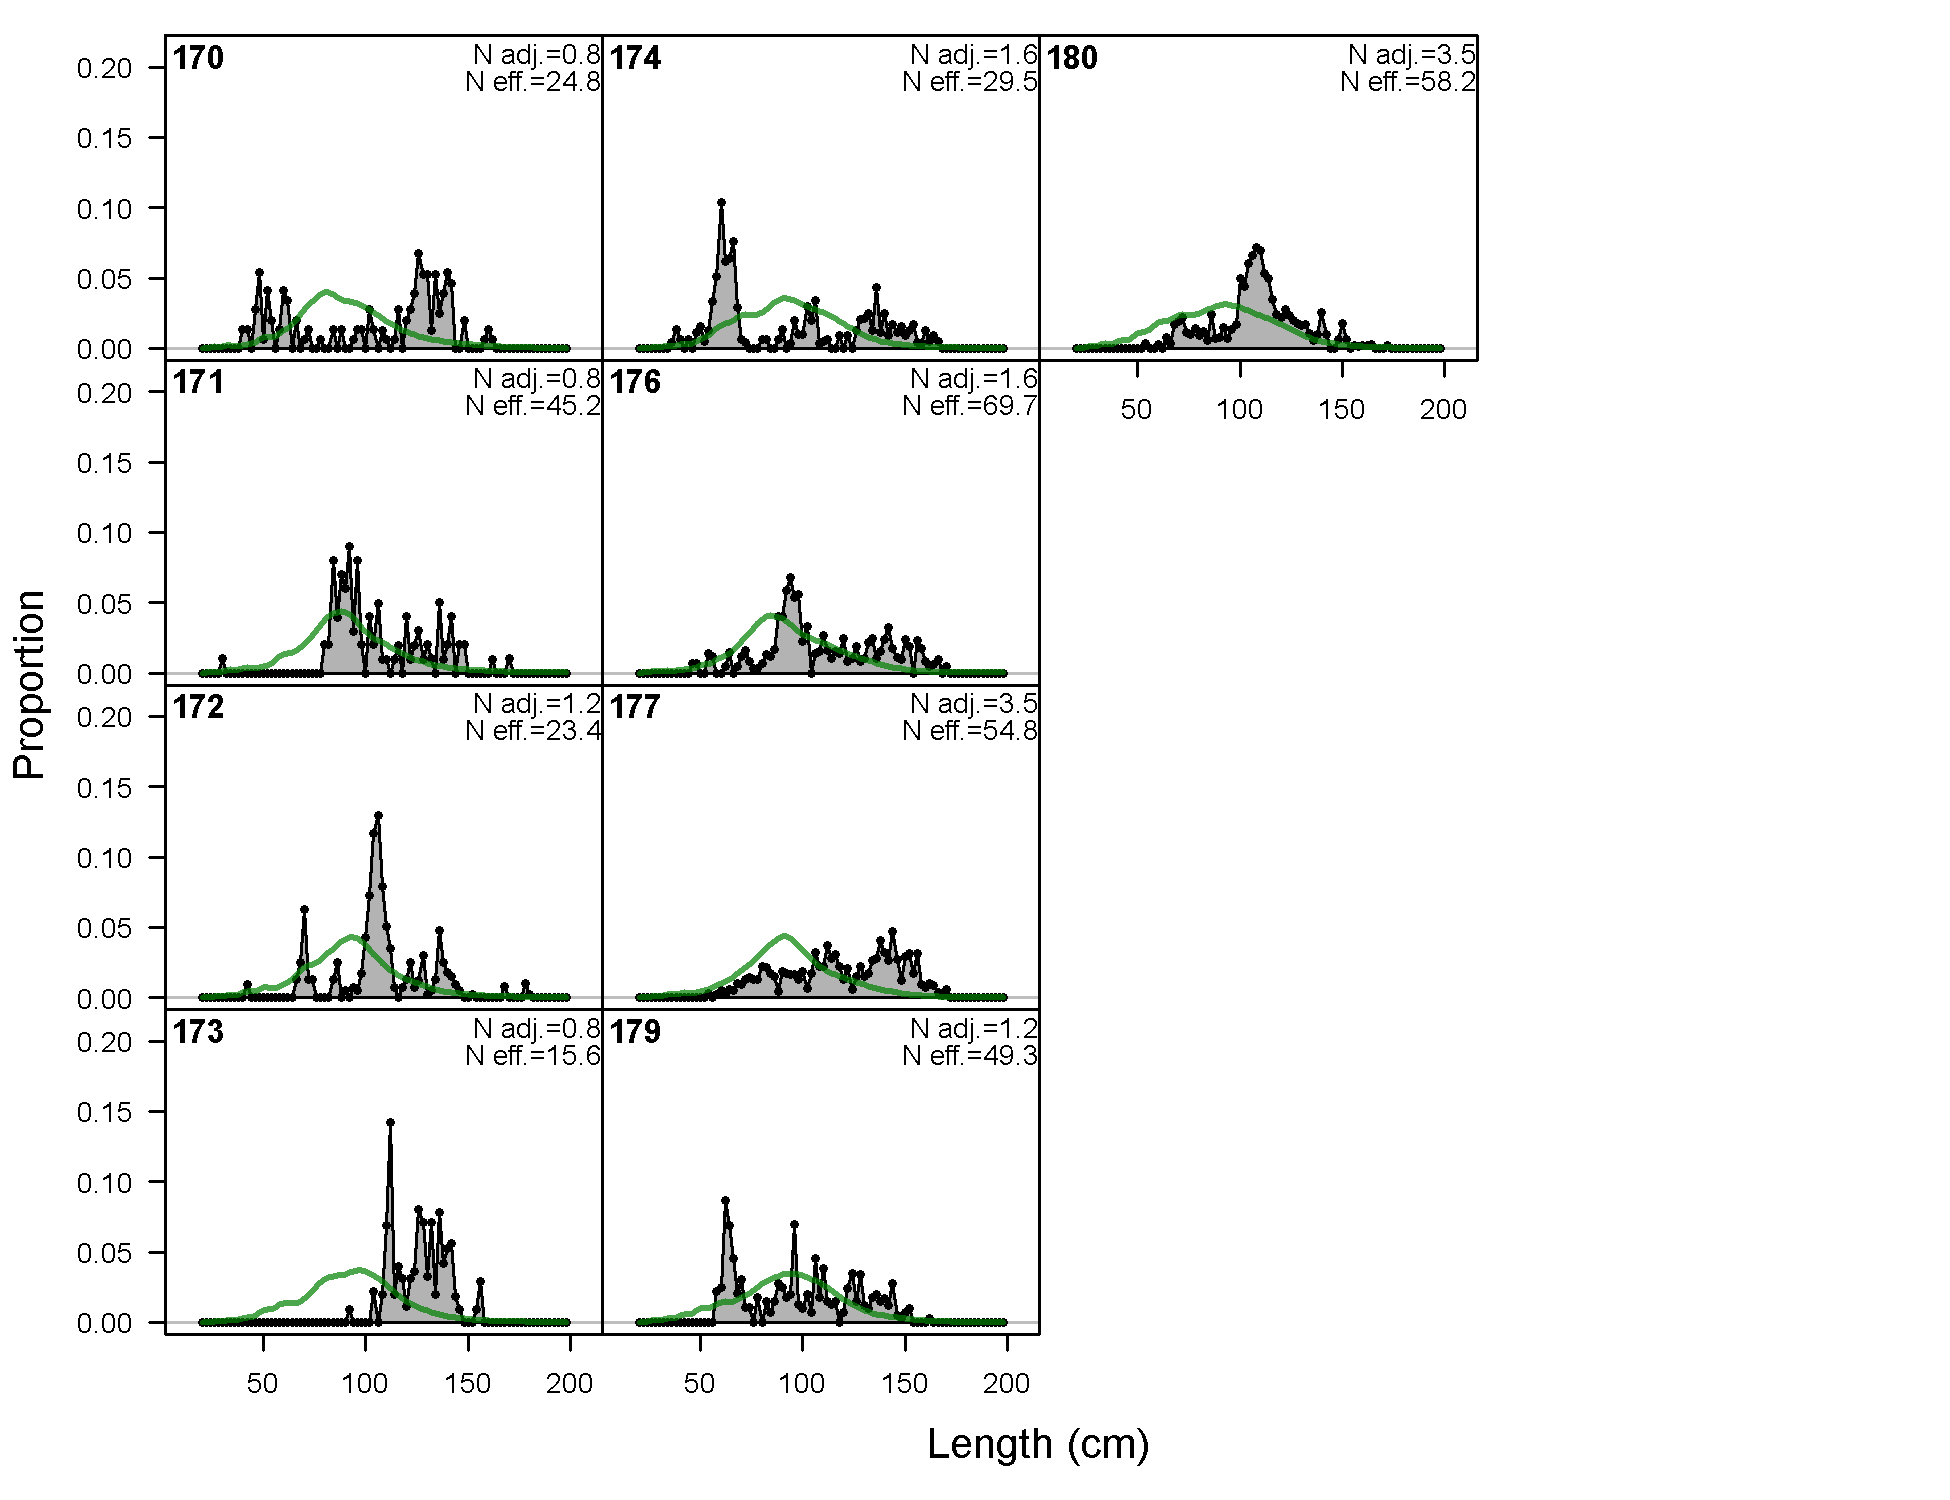
Length comps, whole catch, F19-DEL_P (plot 1 of 9).
'N adj.' is the input sample size after data-weighting adjustment. N eff. is the calculated effective sample size used in the McAllister-Iannelli tuning method.
file: comp_lenfit_flt19mkt0_page1.png
Length comps, whole catch, F19-DEL_P (plot 2 of 9)
file: comp_lenfit_flt19mkt0_page2.png
Length comps, whole catch, F19-DEL_P (plot 3 of 9)
file: comp_lenfit_flt19mkt0_page3.png
Length comps, whole catch, F19-DEL_P (plot 4 of 9)
file: comp_lenfit_flt19mkt0_page4.png
Length comps, whole catch, F19-DEL_P (plot 5 of 9)
file: comp_lenfit_flt19mkt0_page5.png
Length comps, whole catch, F19-DEL_P (plot 6 of 9)
file: comp_lenfit_flt19mkt0_page6.png
Length comps, whole catch, F19-DEL_P (plot 7 of 9)
file: comp_lenfit_flt19mkt0_page7.png
Length comps, whole catch, F19-DEL_P (plot 8 of 9)
file: comp_lenfit_flt19mkt0_page8.png
Length comps, whole catch, F19-DEL_P (plot 9 of 9)
file: comp_lenfit_flt19mkt0_page9.png
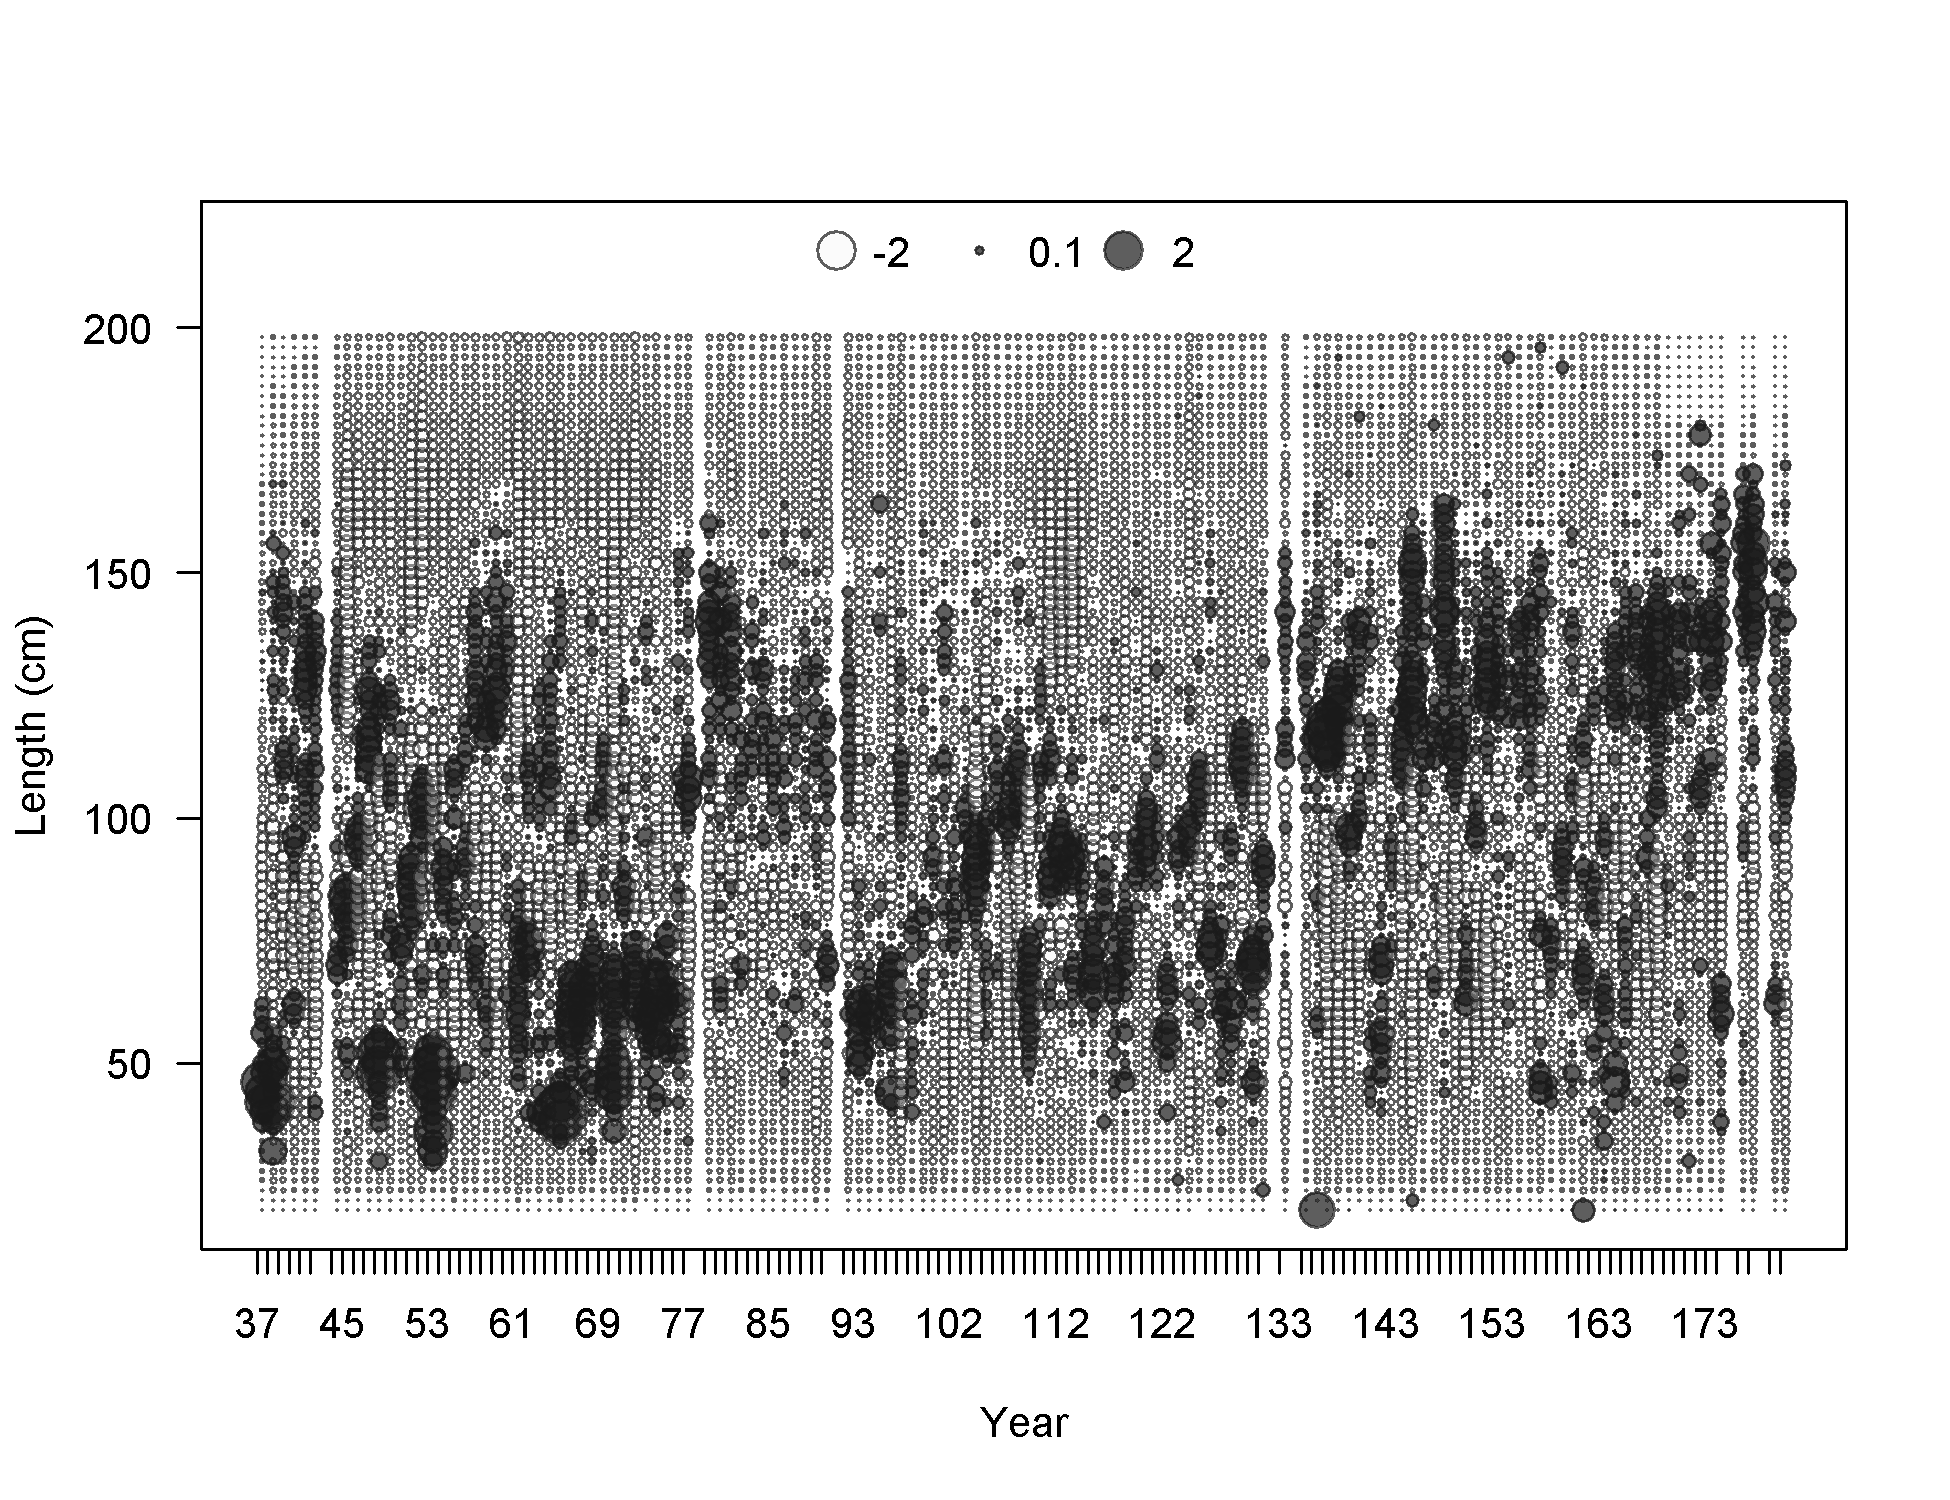
Pearson residuals, whole catch, F19-DEL_P (max=3.96) (plot 9 of 9)
Closed bubbles are positive residuals (observed > expected) and open bubbles are negative residuals (observed < expected).
file: comp_lenfit_residsflt19mkt0_page9.png
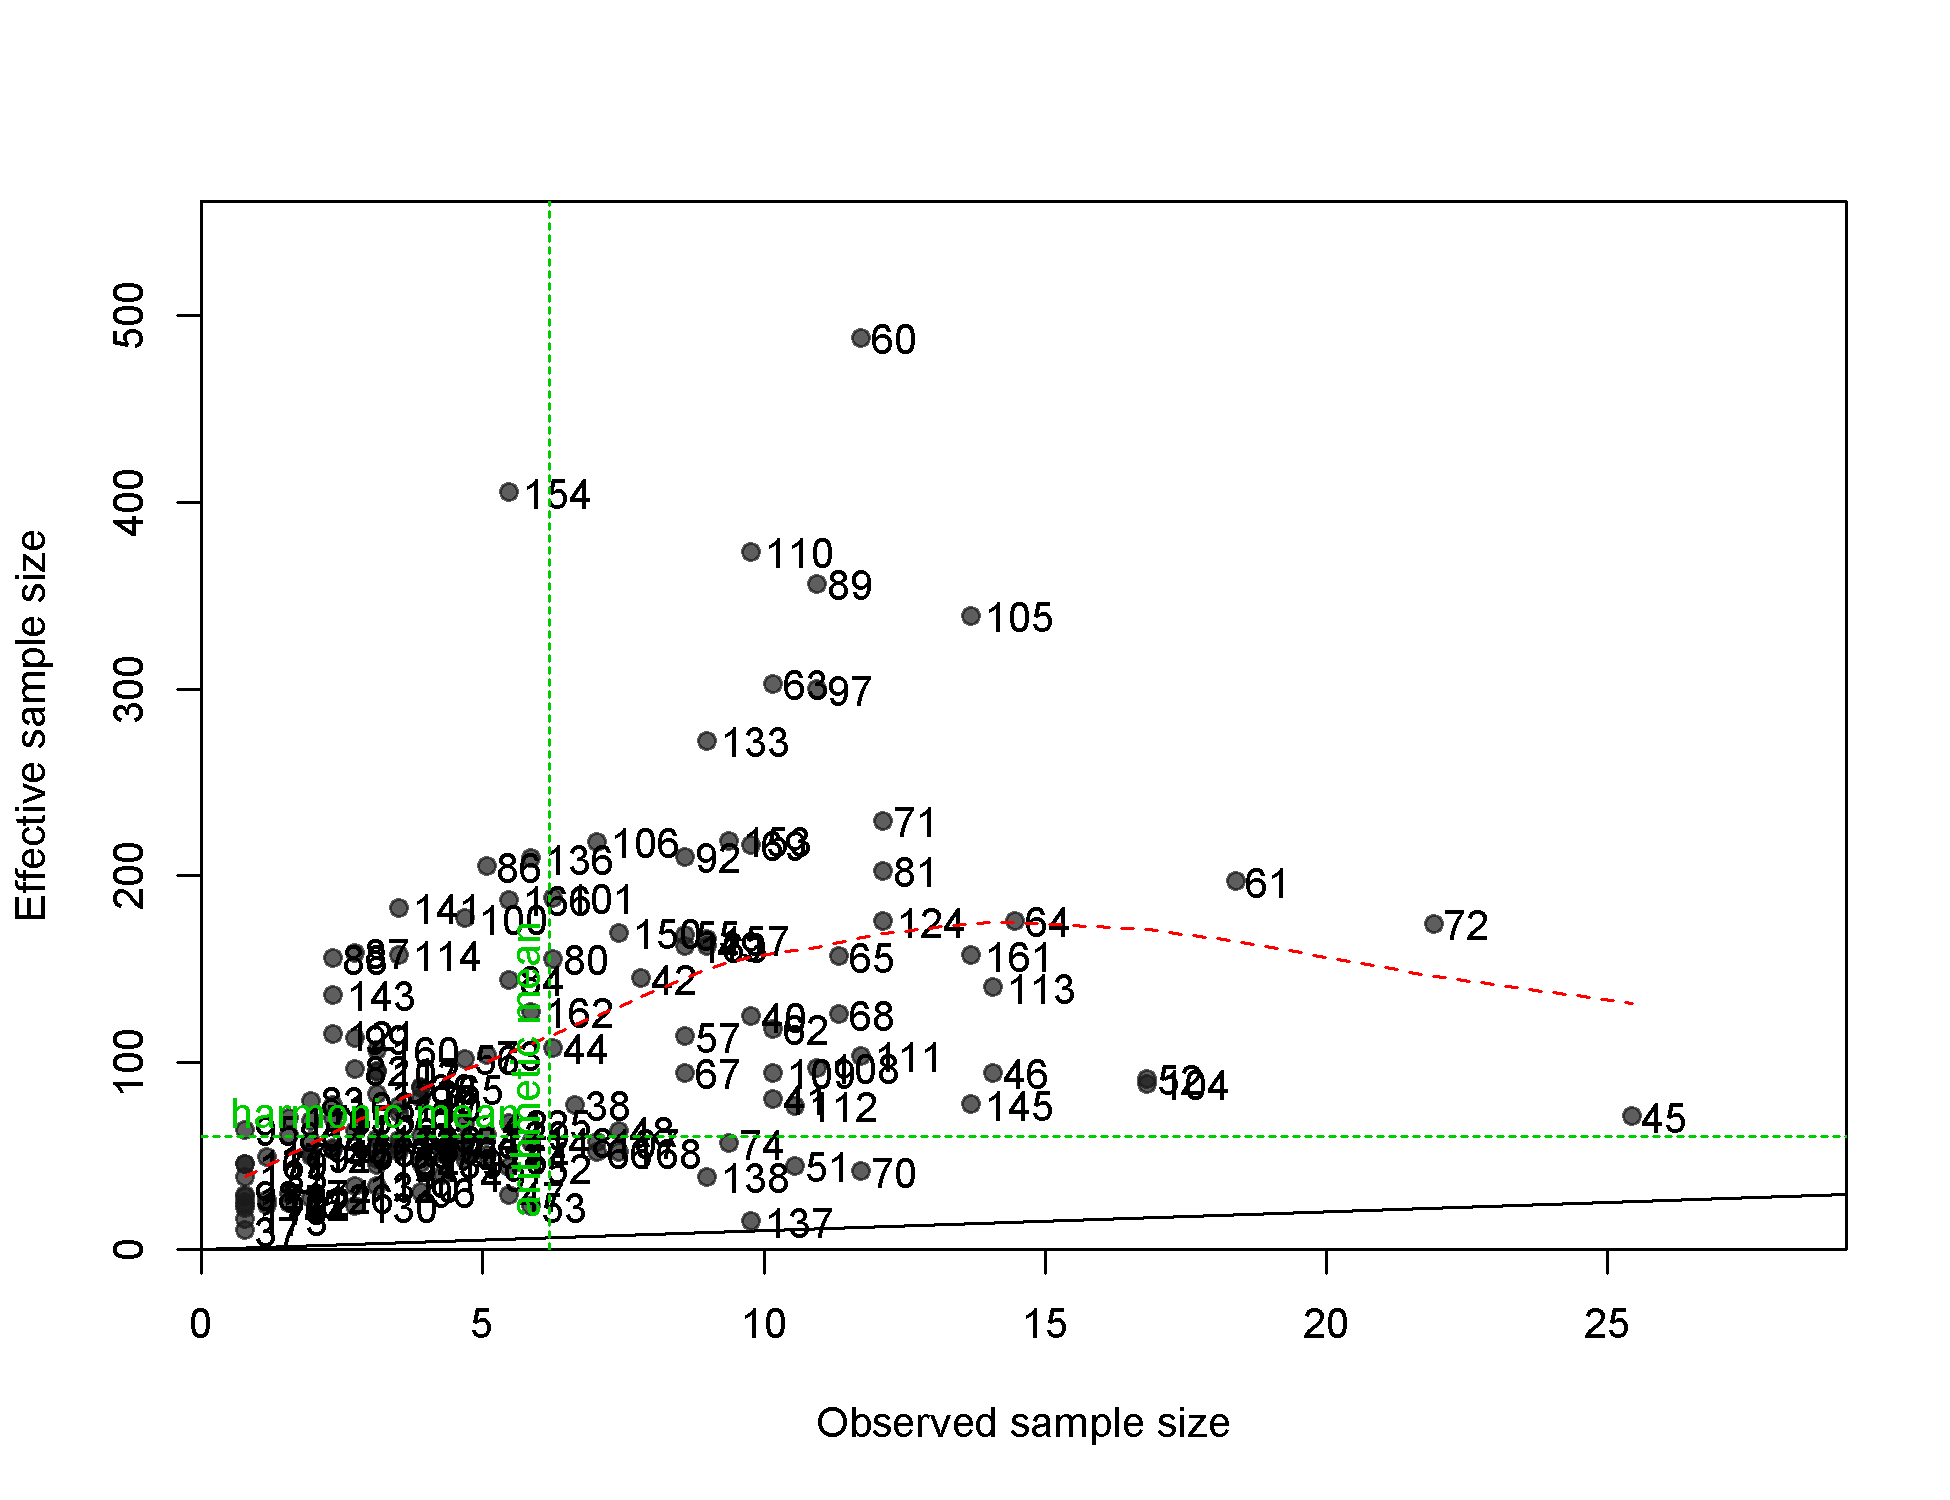
N-EffN comparison, Length comps, whole catch, F19-DEL_P
file: comp_lenfit_sampsize_flt19mkt0.png
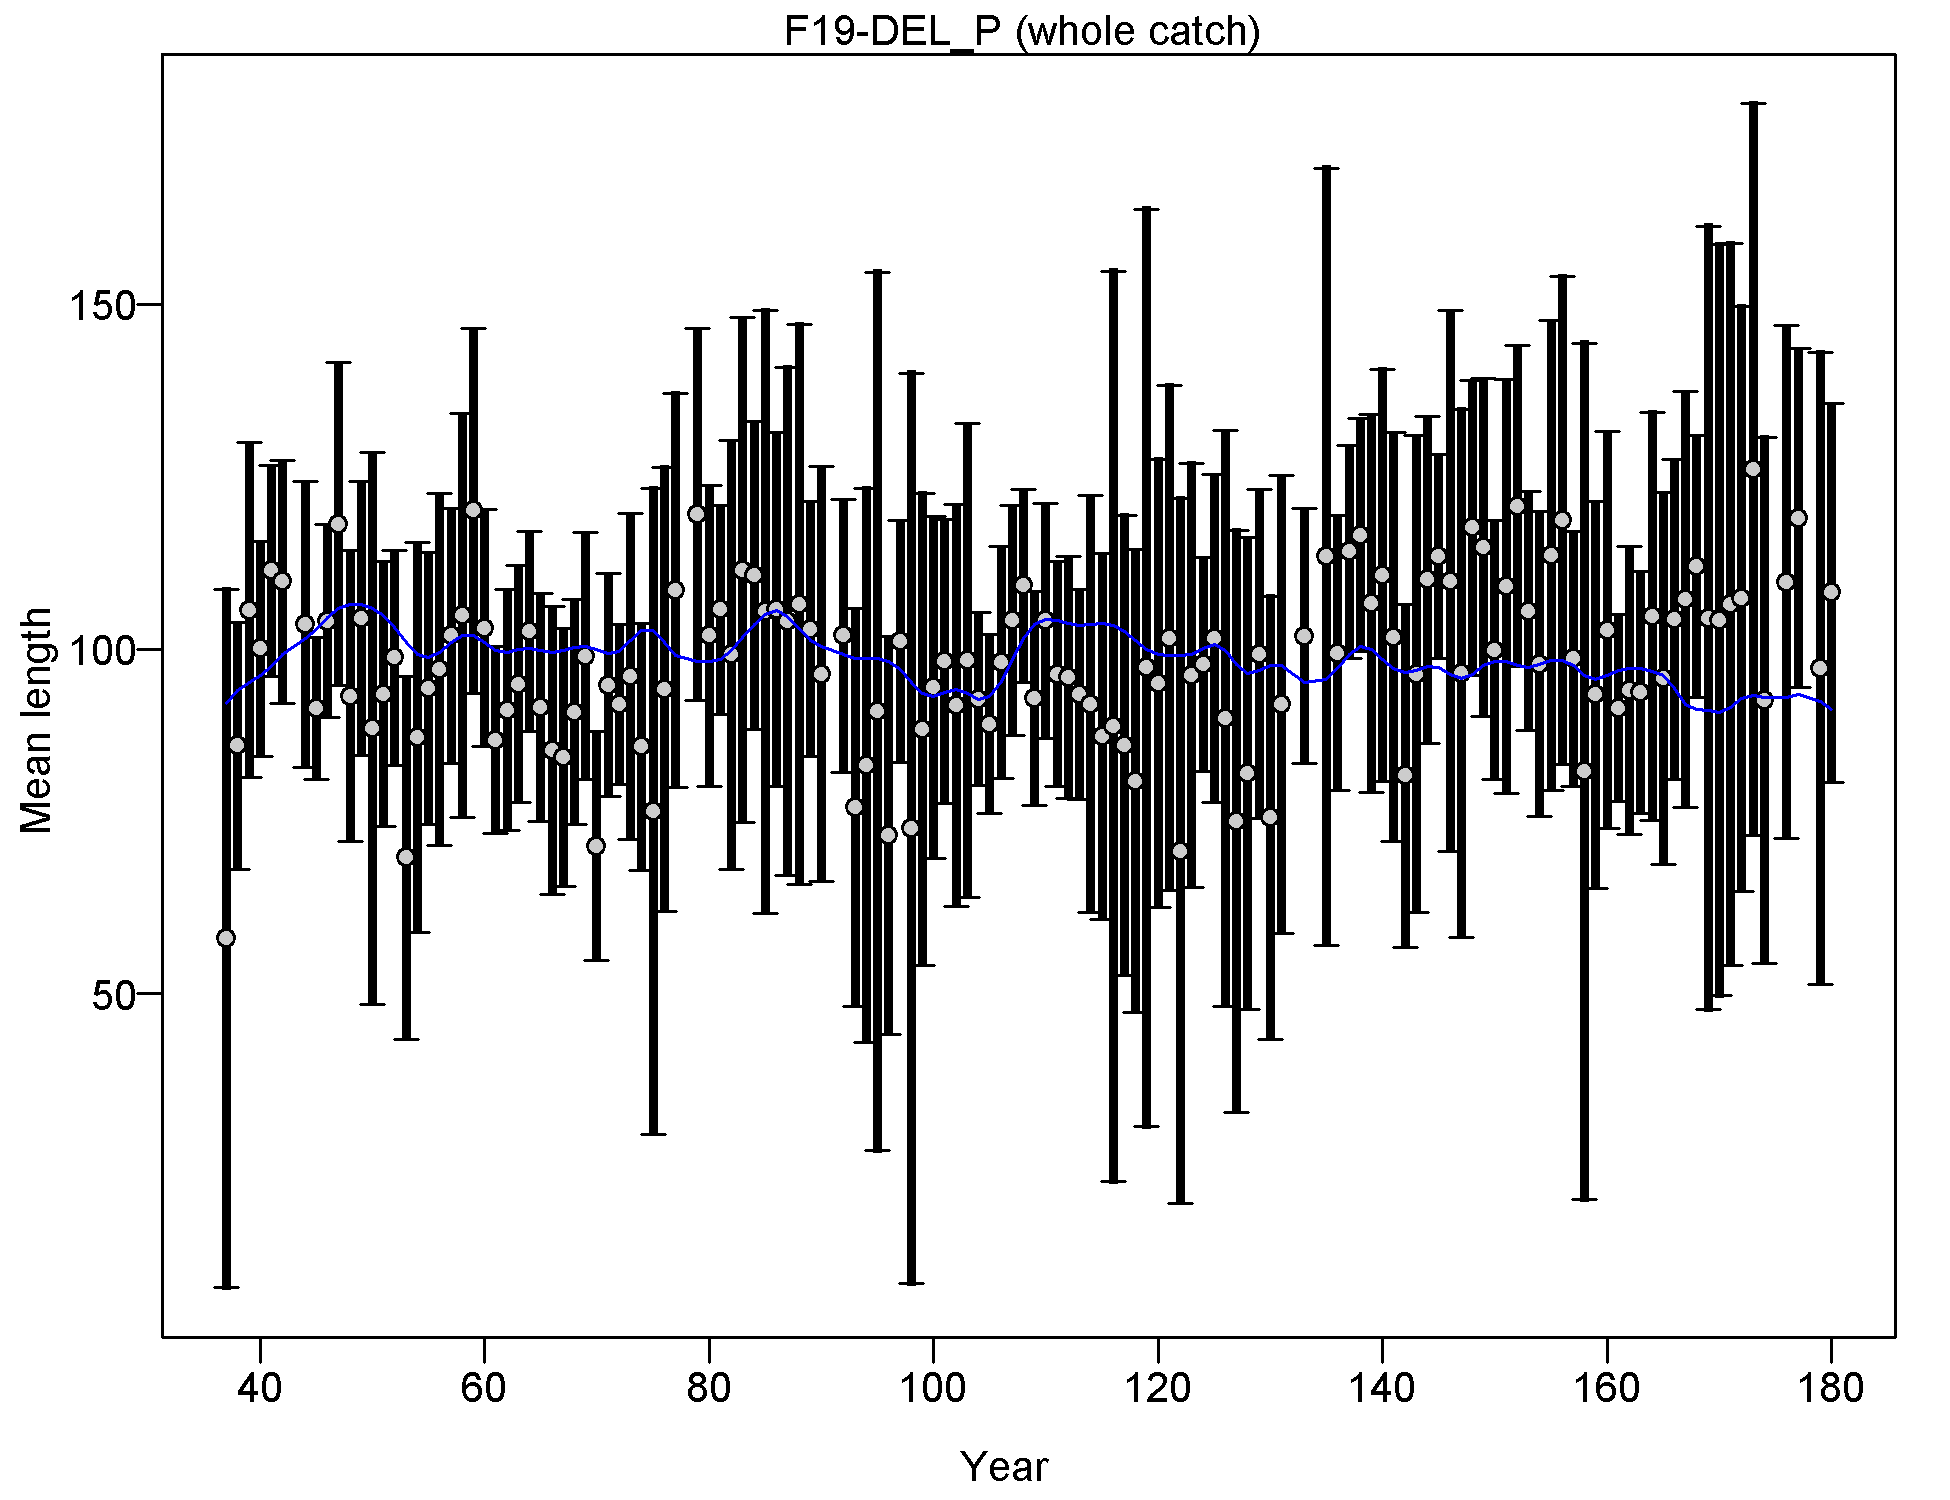
Mean length for F19-DEL_P with 95% confidence intervals based on current samples sizes.
Francis data weighting method TA1.8: thinner intervals (with capped ends) show result of further adjusting sample sizes based on suggested multiplier (with 95% interval) for len data from F19-DEL_P:
1.0121 (0.7951-1.3468)
For more info, see
Francis, R.I.C.C. (2011). Data weighting in statistical fisheries stock assessment models. Can. J. Fish. Aquat. Sci. 68: 1124-1138. https://doi.org/10.1139/f2011-025
file: comp_lenfit_data_weighting_TA1.8_F19-DEL_P.png
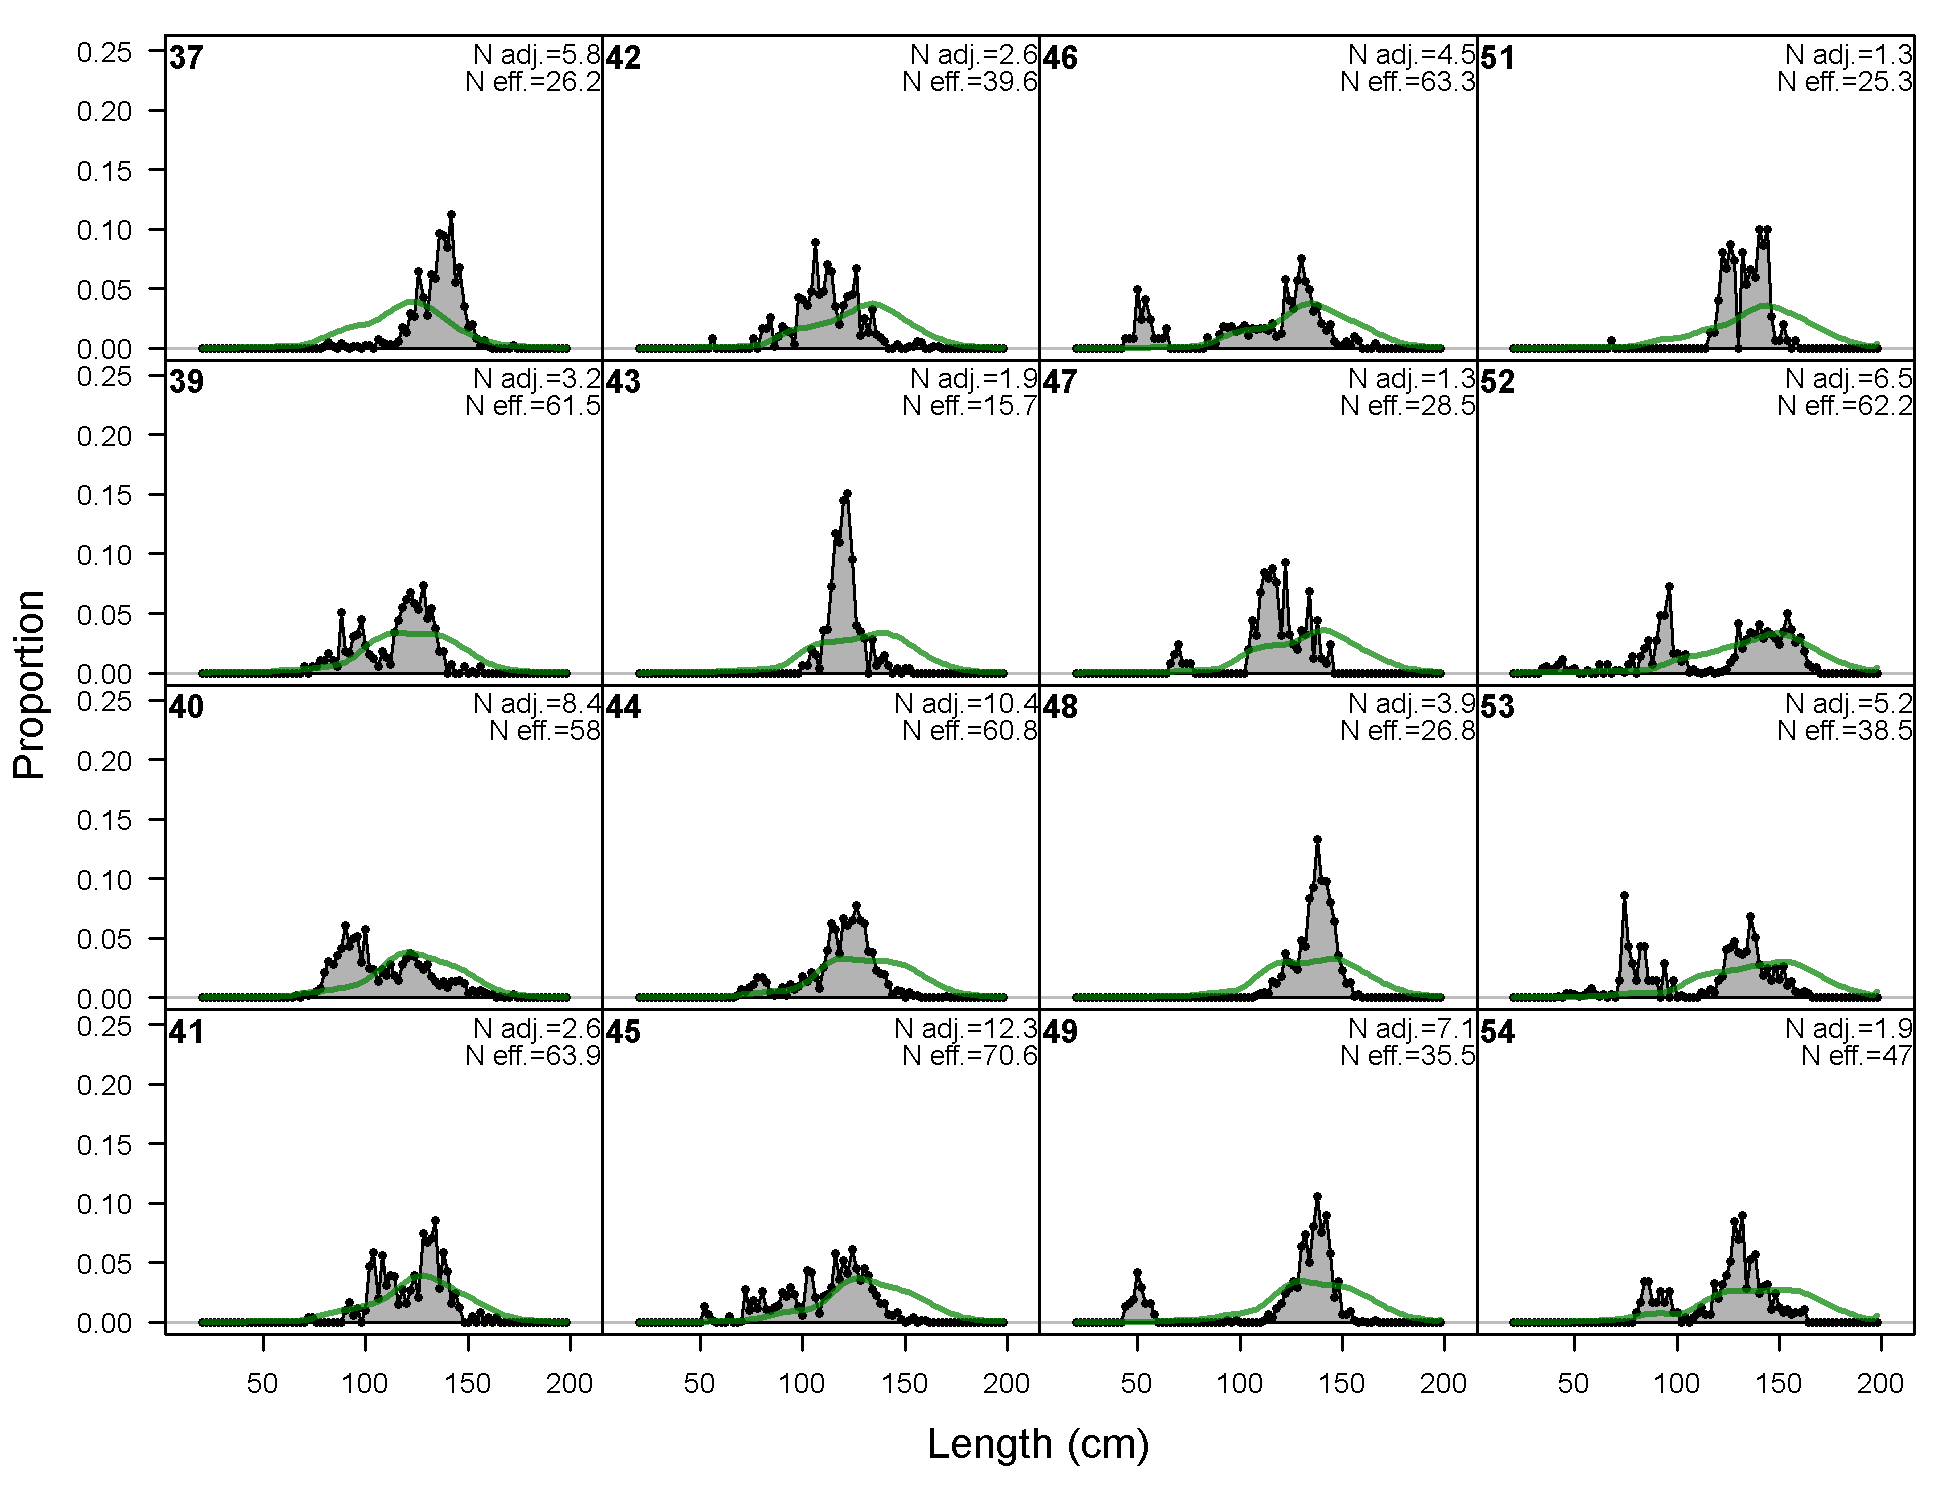
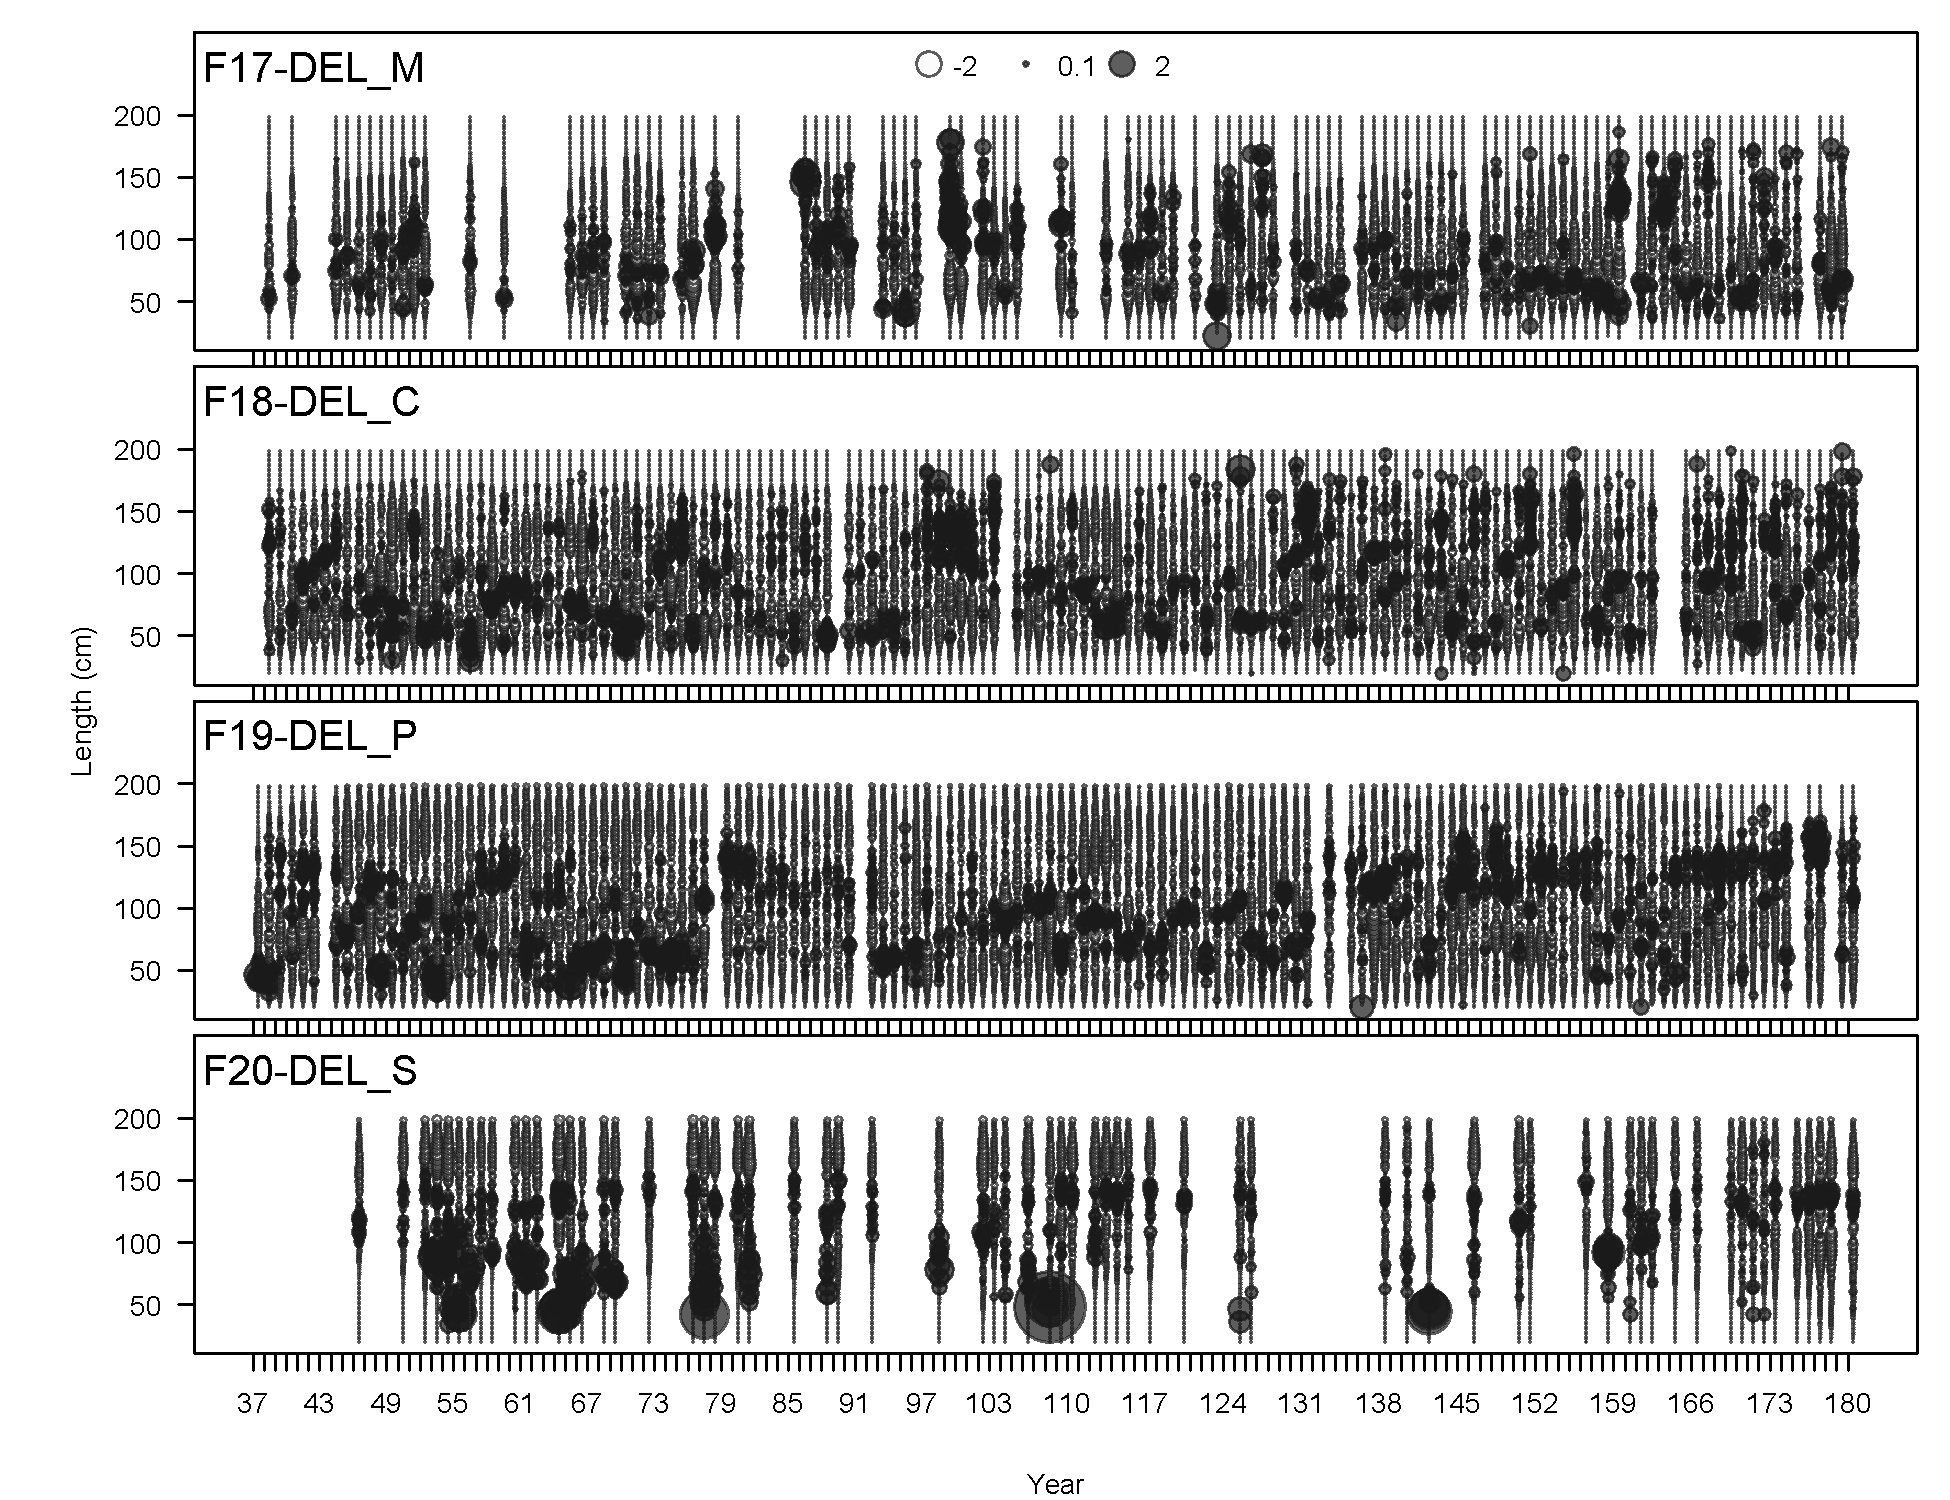
Length comps, whole catch, F20-DEL_S (plot 1 of 5).
'N adj.' is the input sample size after data-weighting adjustment. N eff. is the calculated effective sample size used in the McAllister-Iannelli tuning method.
file: comp_lenfit_flt20mkt0_page1.png
Length comps, whole catch, F20-DEL_S (plot 2 of 5)
file: comp_lenfit_flt20mkt0_page2.png
Length comps, whole catch, F20-DEL_S (plot 3 of 5)
file: comp_lenfit_flt20mkt0_page3.png
Length comps, whole catch, F20-DEL_S (plot 4 of 5)
file: comp_lenfit_flt20mkt0_page4.png
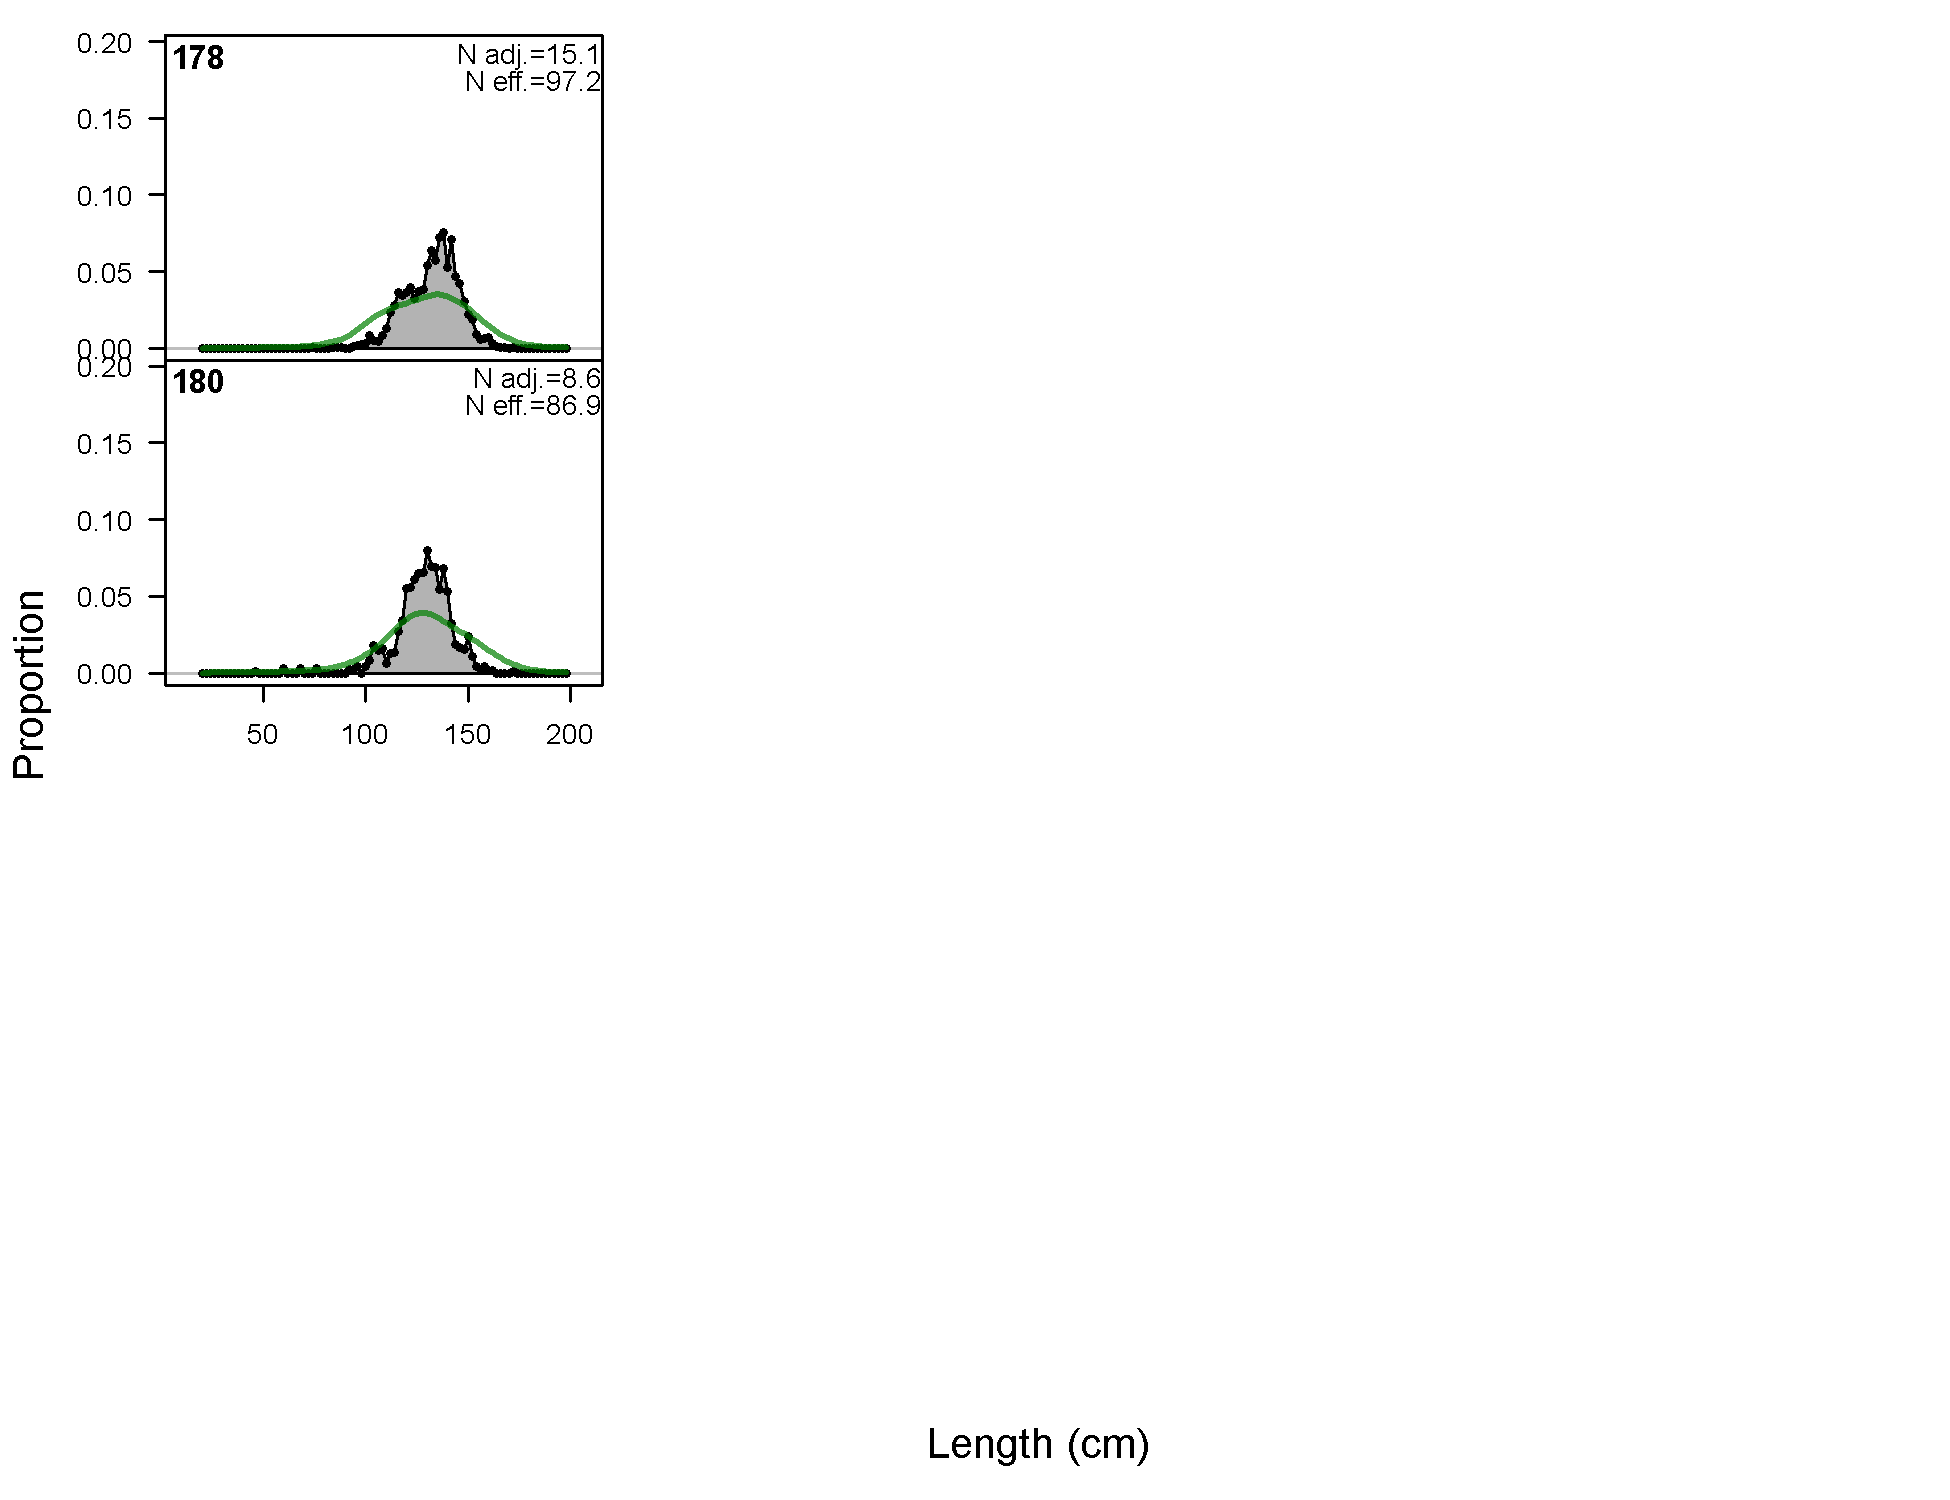
Length comps, whole catch, F20-DEL_S (plot 5 of 5)
file: comp_lenfit_flt20mkt0_page5.png
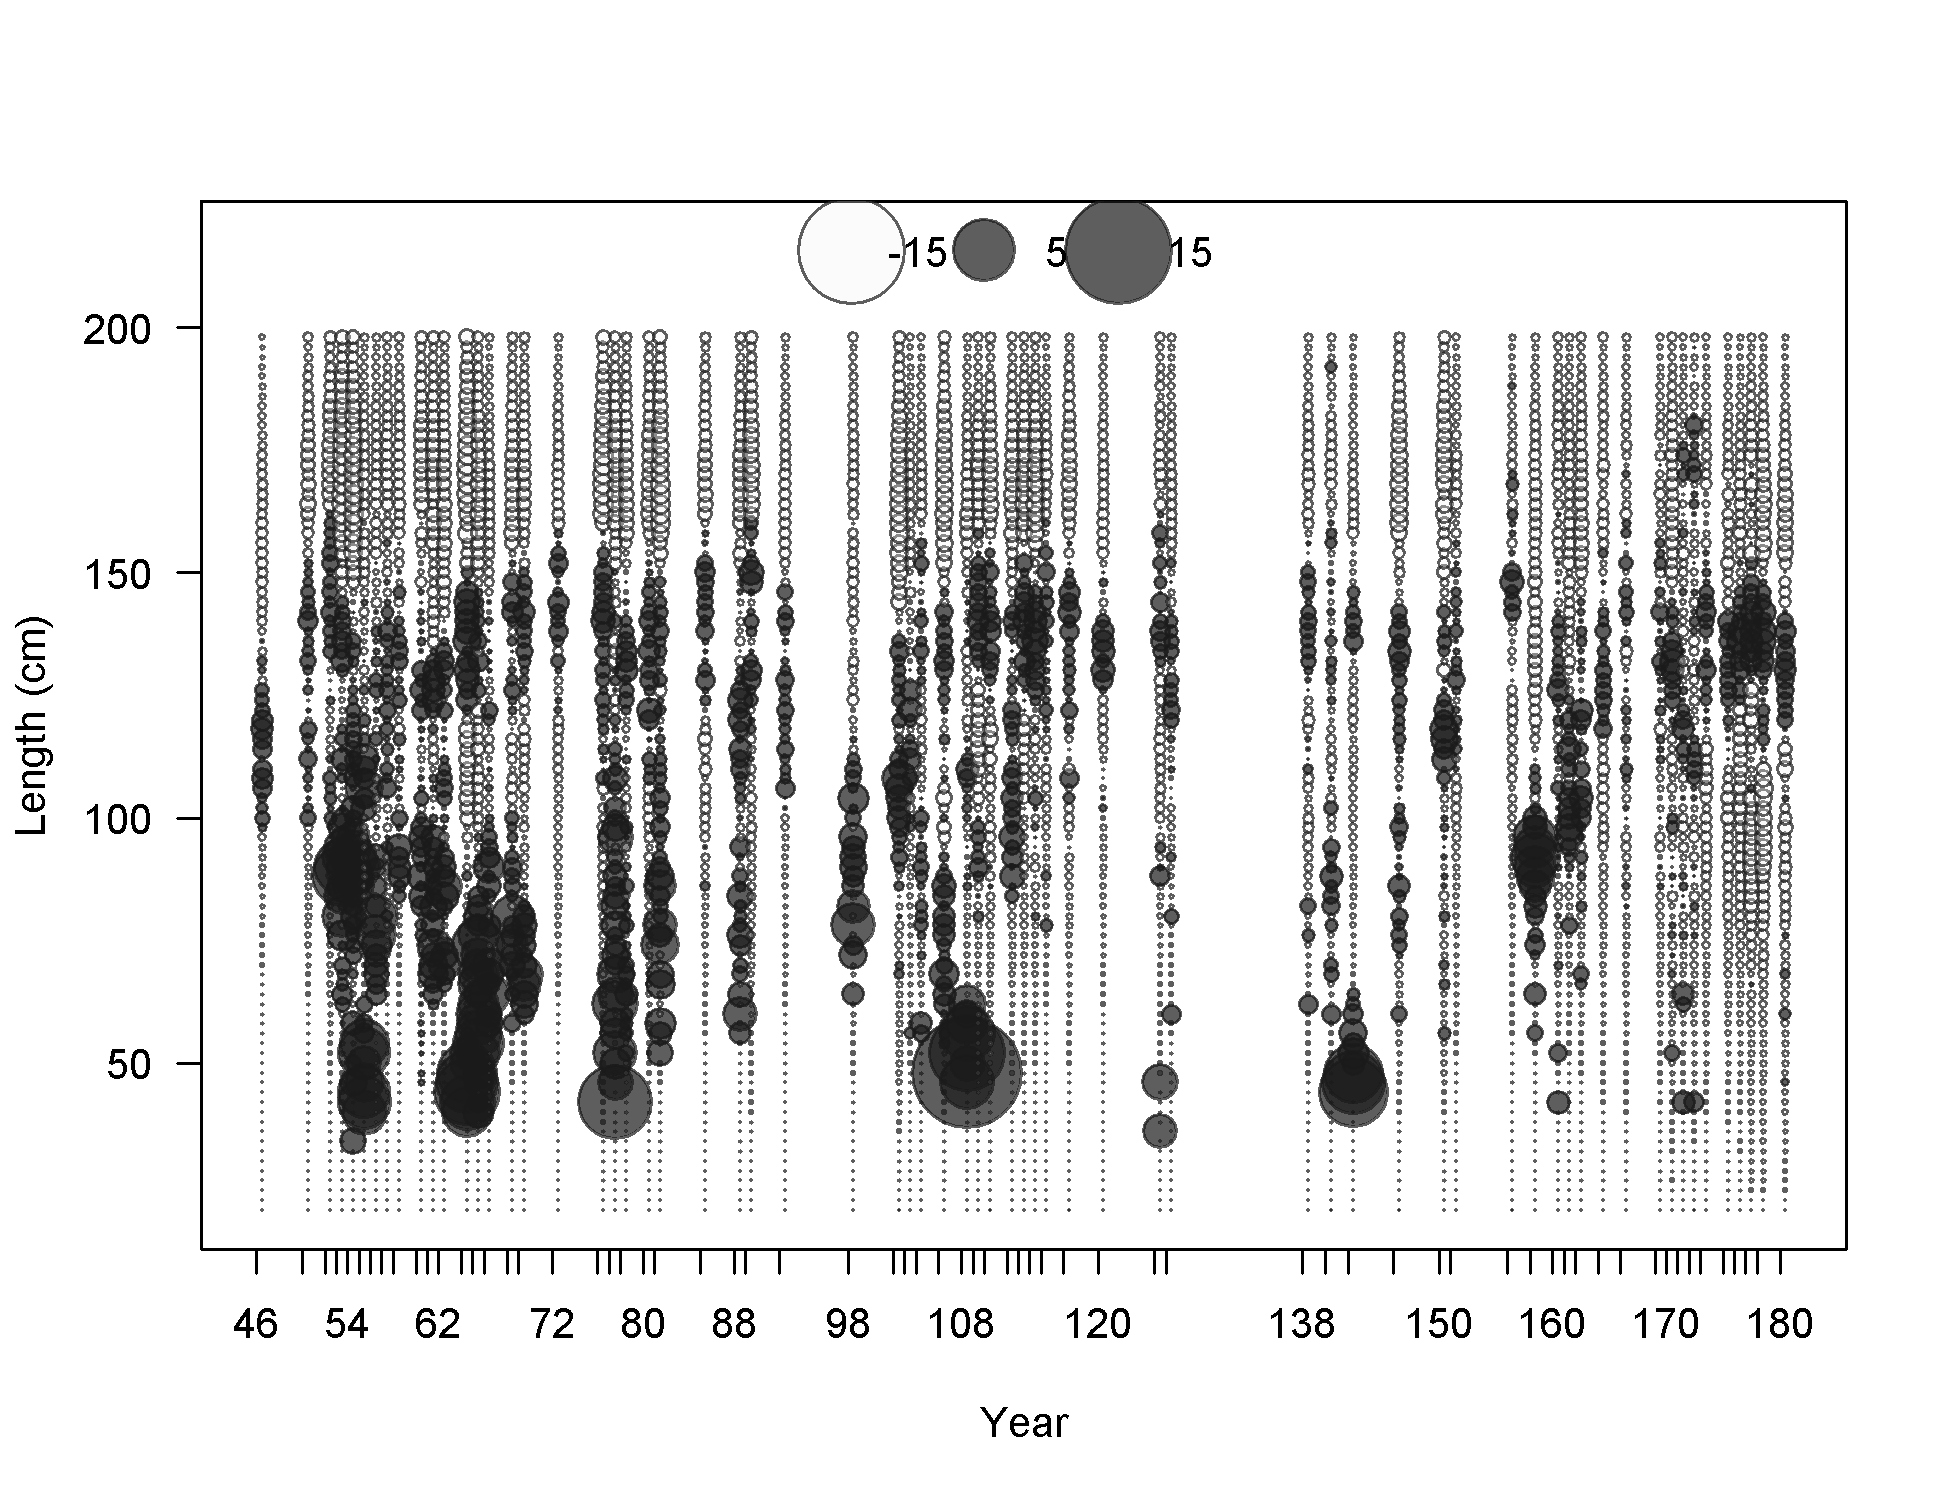
Pearson residuals, whole catch, F20-DEL_S (max=15.7) (plot 5 of 5)
Closed bubbles are positive residuals (observed > expected) and open bubbles are negative residuals (observed < expected).
file: comp_lenfit_residsflt20mkt0_page5.png

N-EffN comparison, Length comps, whole catch, F20-DEL_S
file: comp_lenfit_sampsize_flt20mkt0.png
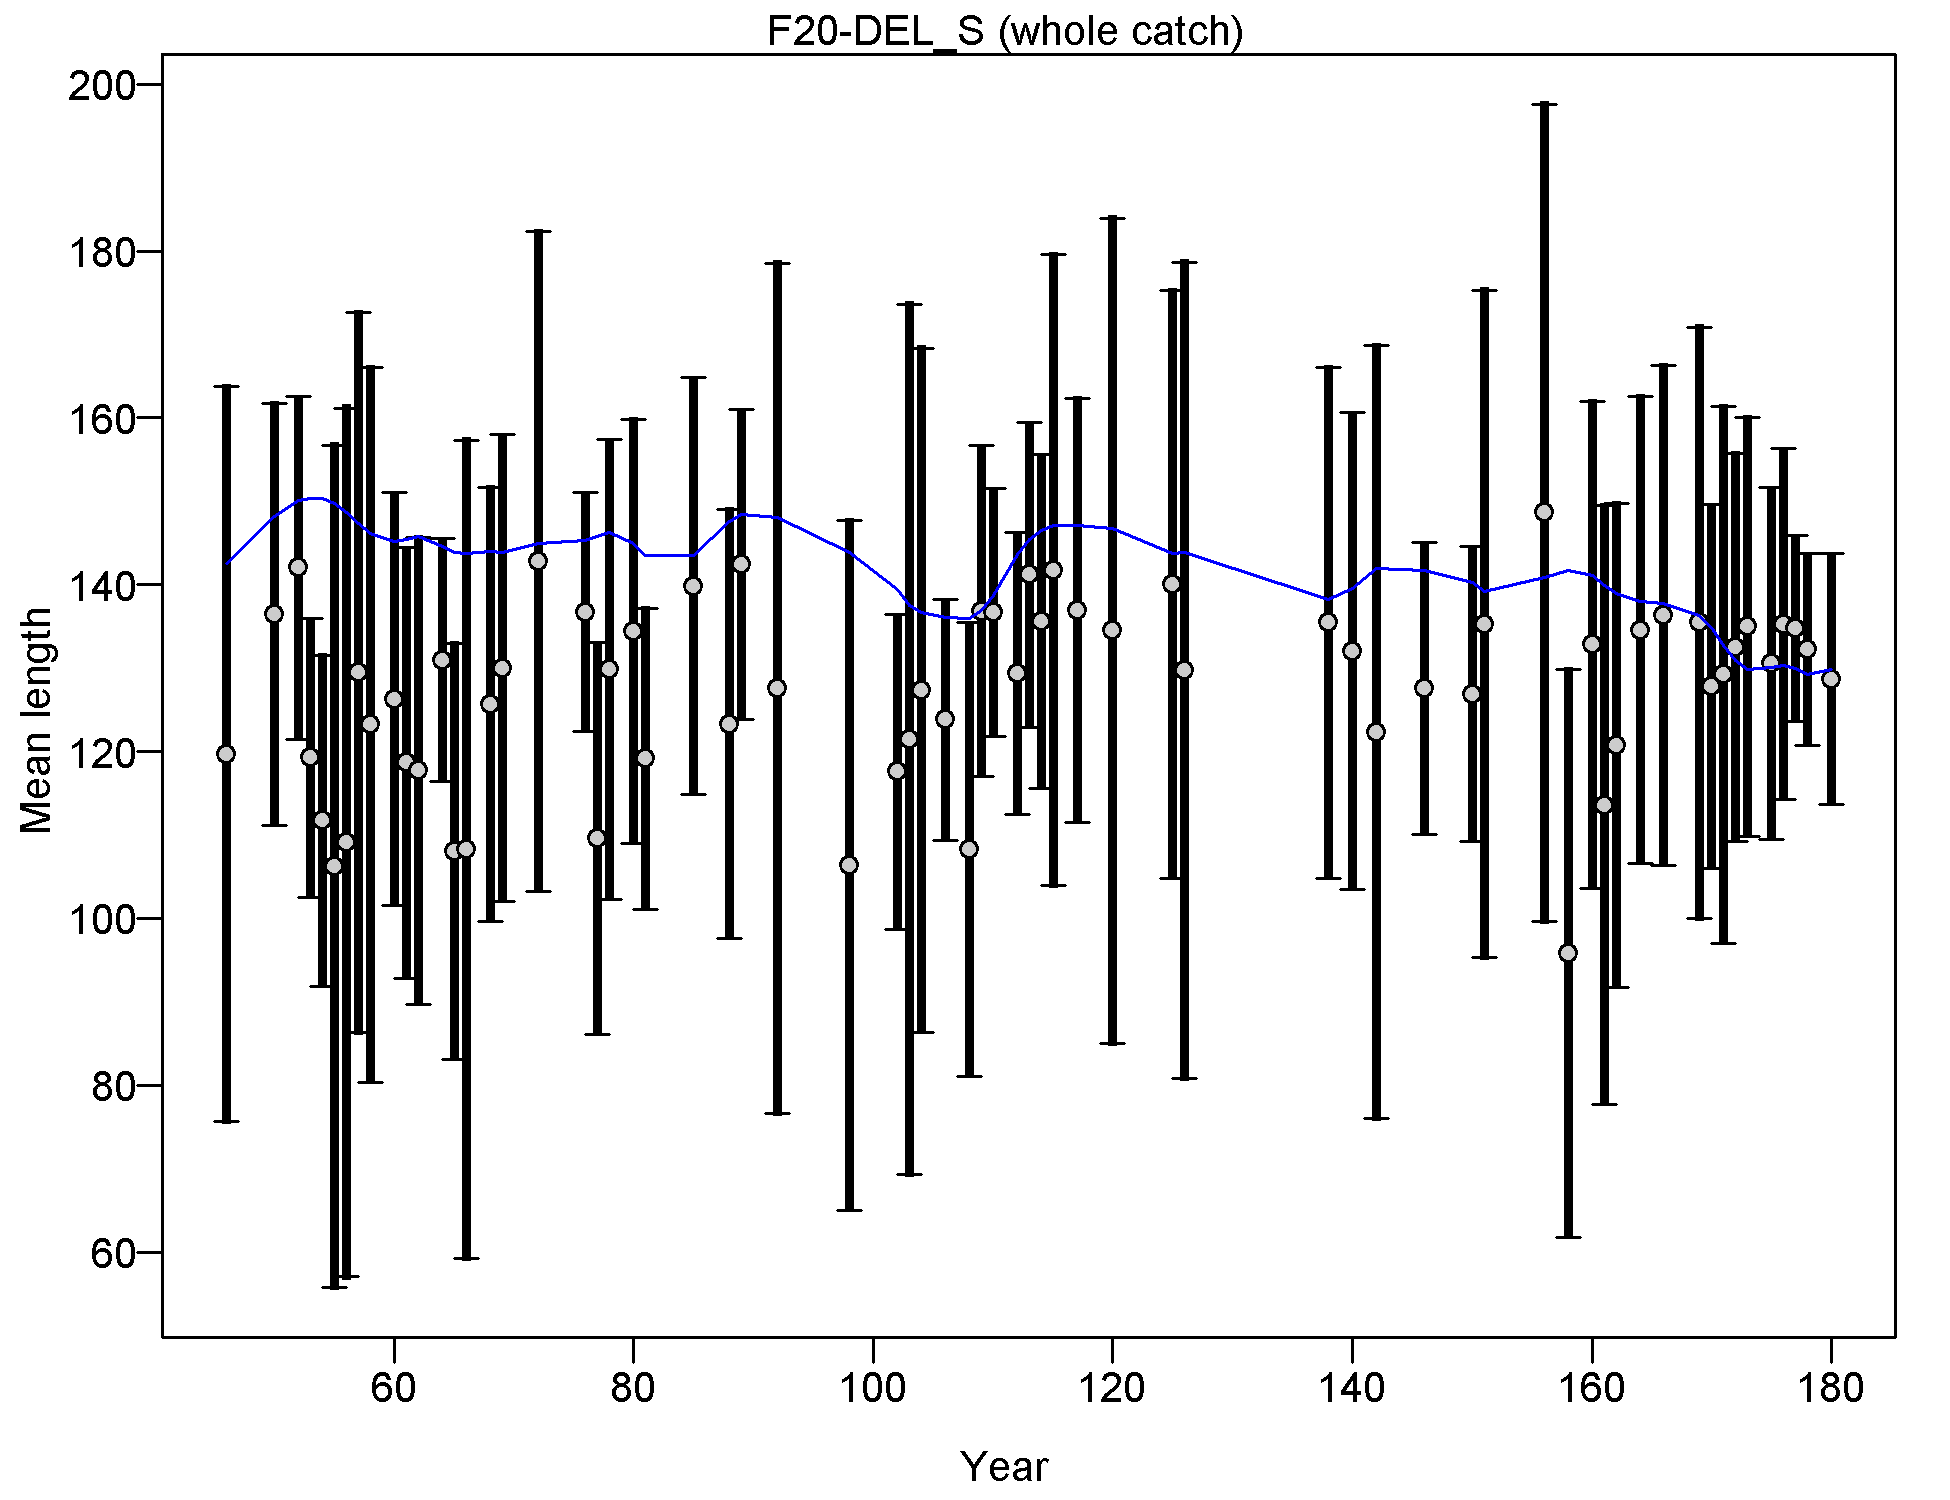
Mean length for F20-DEL_S with 95% confidence intervals based on current samples sizes.
Francis data weighting method TA1.8: thinner intervals (with capped ends) show result of further adjusting sample sizes based on suggested multiplier (with 95% interval) for len data from F20-DEL_S:
1.0146 (0.7429-1.6314)
For more info, see
Francis, R.I.C.C. (2011). Data weighting in statistical fisheries stock assessment models. Can. J. Fish. Aquat. Sci. 68: 1124-1138. https://doi.org/10.1139/f2011-025
file: comp_lenfit_data_weighting_TA1.8_F20-DEL_S.png
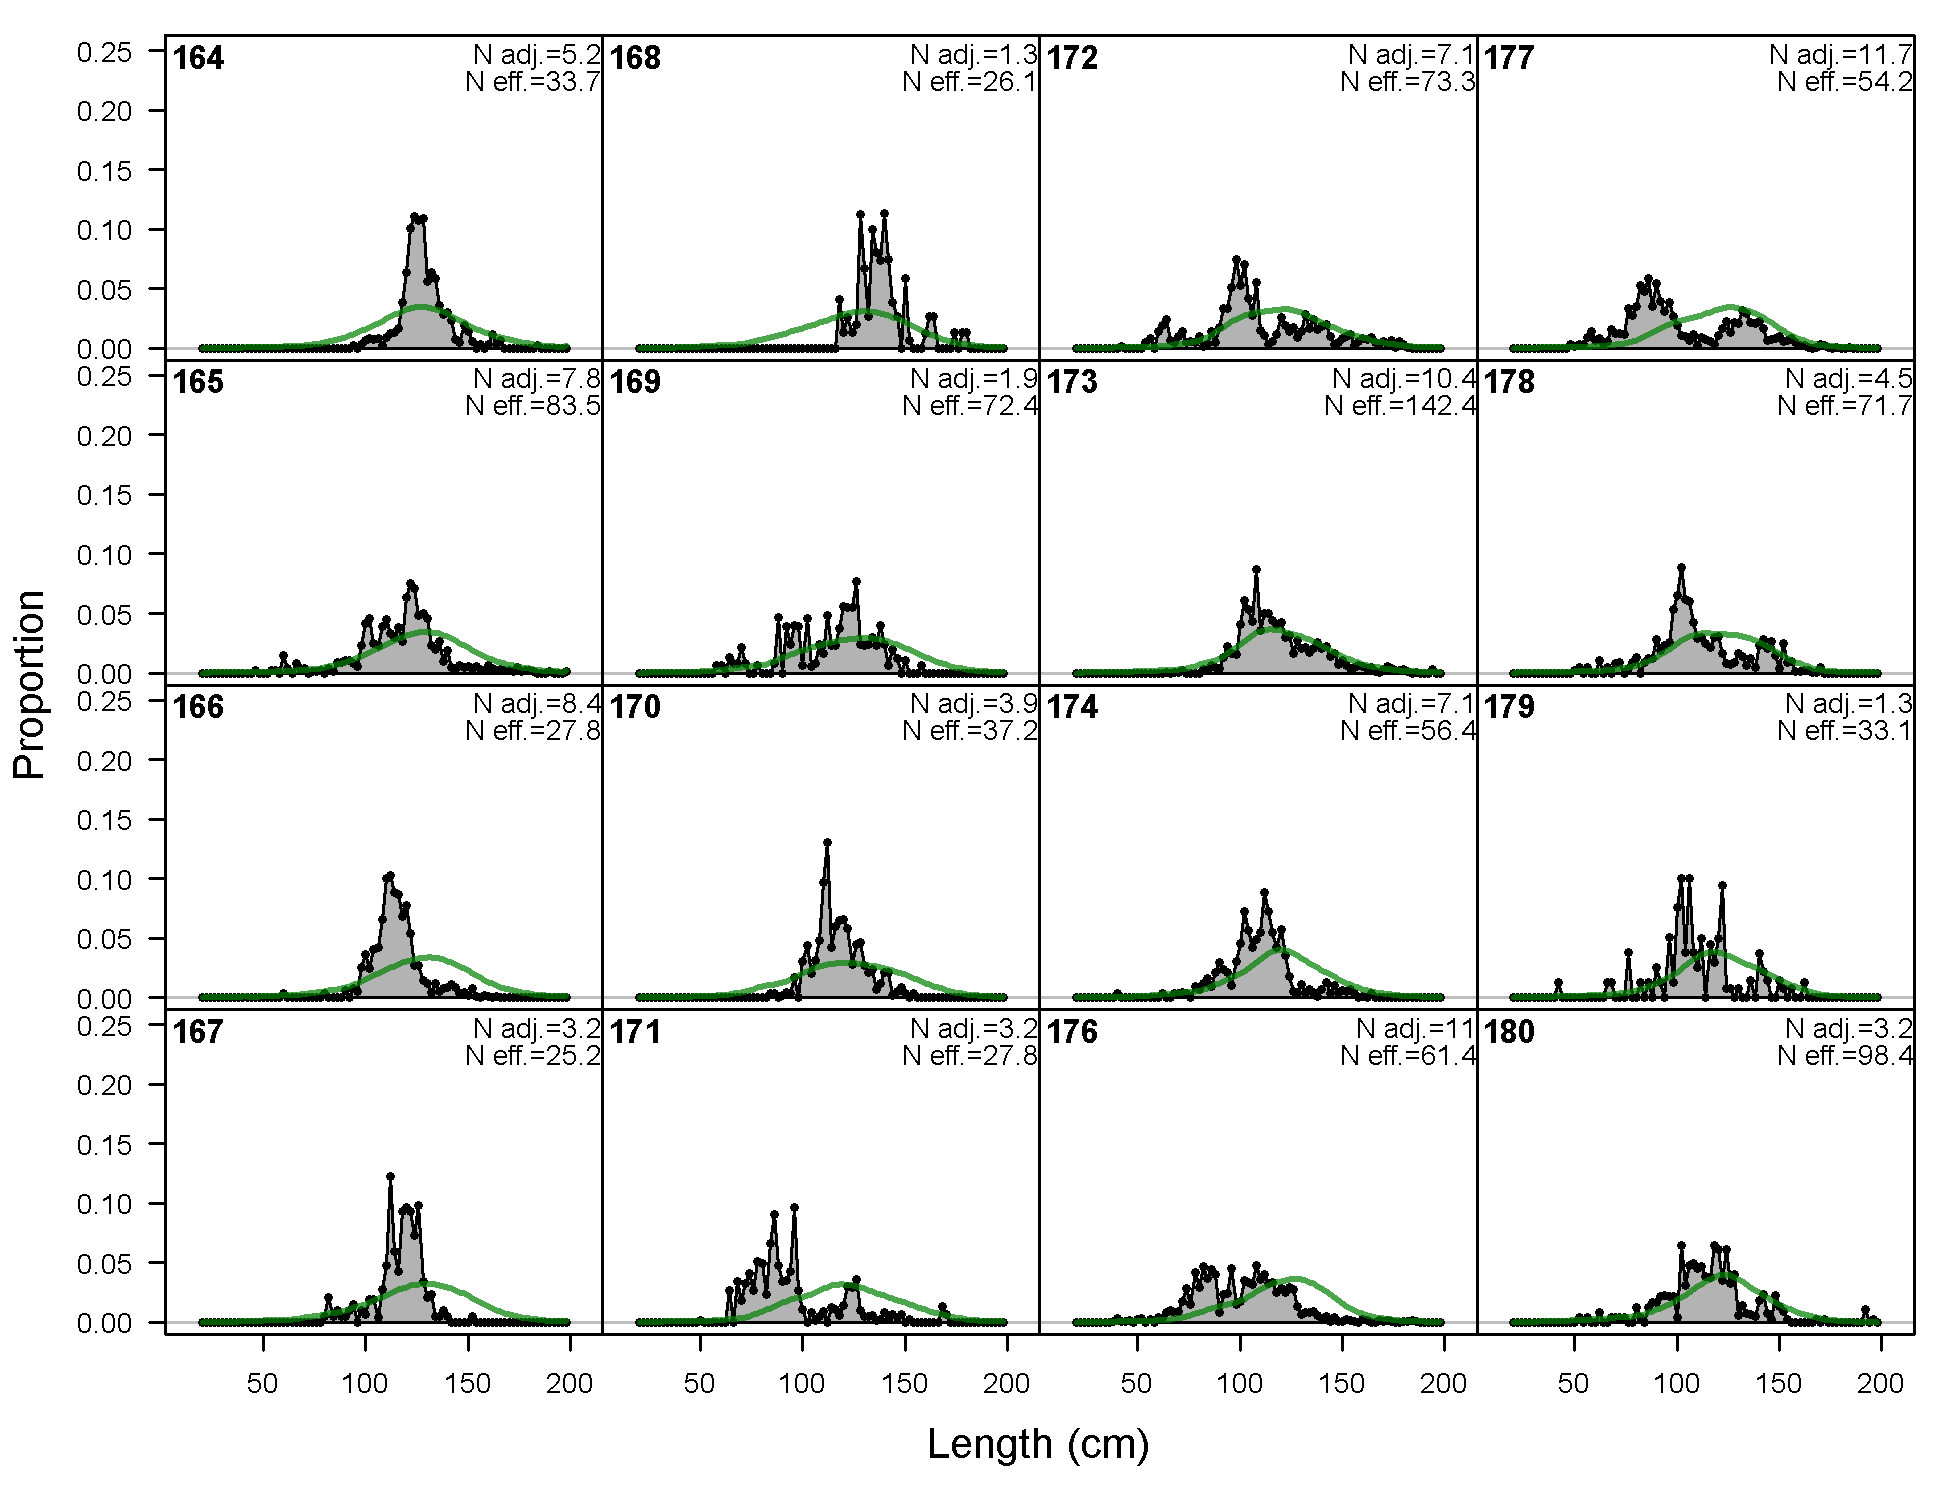
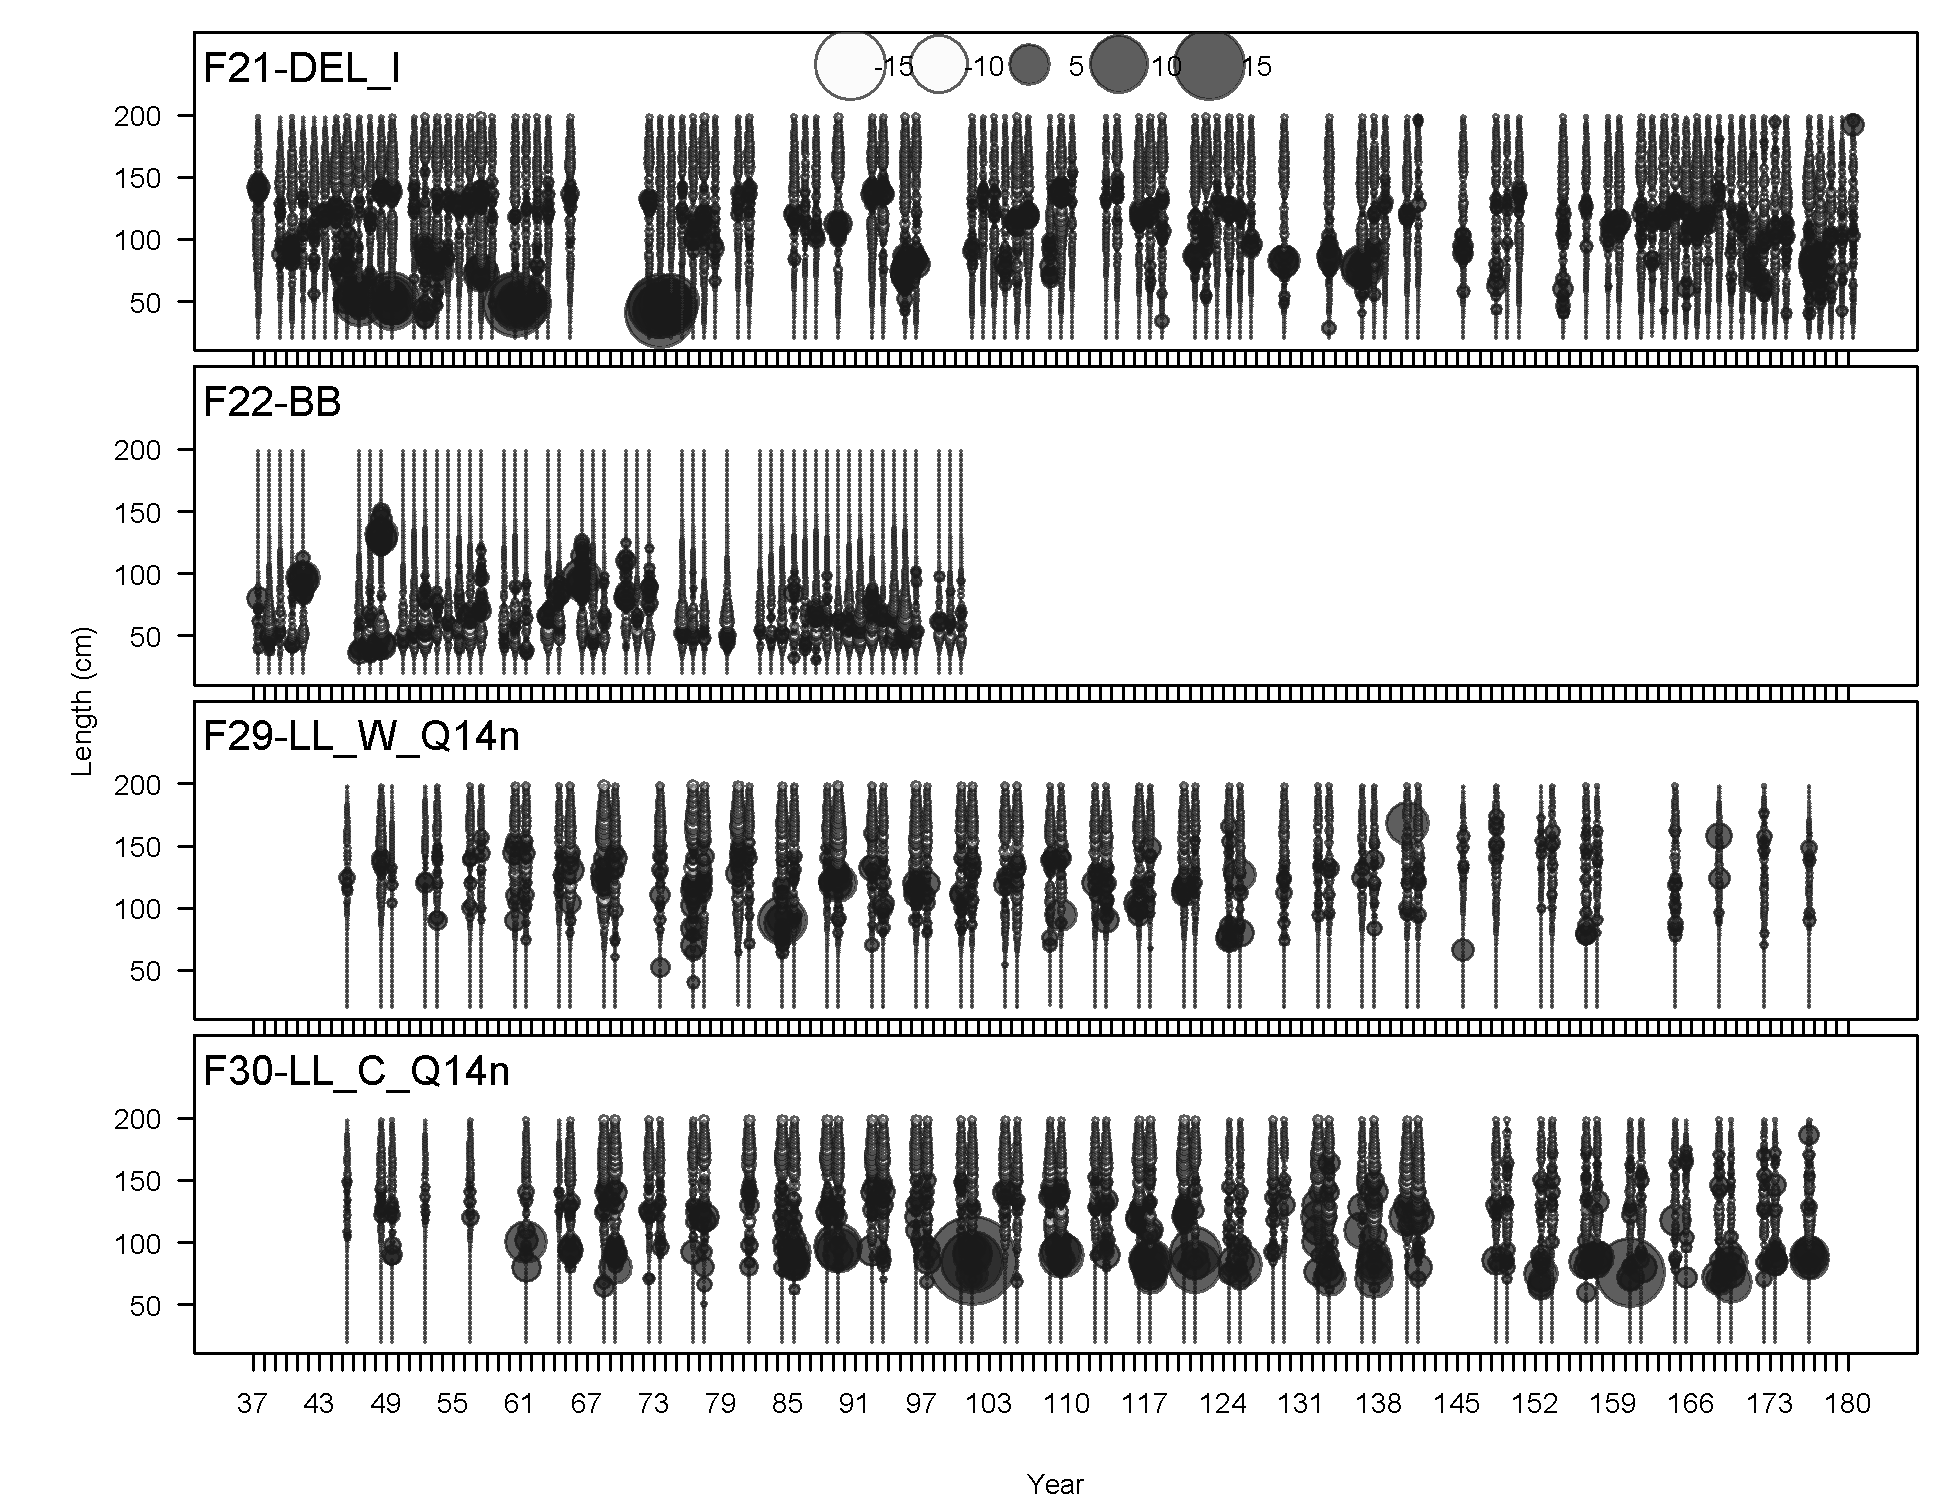
Length comps, whole catch, F21-DEL_I (plot 1 of 6).
'N adj.' is the input sample size after data-weighting adjustment. N eff. is the calculated effective sample size used in the McAllister-Iannelli tuning method.
file: comp_lenfit_flt21mkt0_page1.png
Length comps, whole catch, F21-DEL_I (plot 2 of 6)
file: comp_lenfit_flt21mkt0_page2.png
Length comps, whole catch, F21-DEL_I (plot 3 of 6)
file: comp_lenfit_flt21mkt0_page3.png
Length comps, whole catch, F21-DEL_I (plot 4 of 6)
file: comp_lenfit_flt21mkt0_page4.png
Length comps, whole catch, F21-DEL_I (plot 5 of 6)
file: comp_lenfit_flt21mkt0_page5.png
Length comps, whole catch, F21-DEL_I (plot 6 of 6)
file: comp_lenfit_flt21mkt0_page6.png
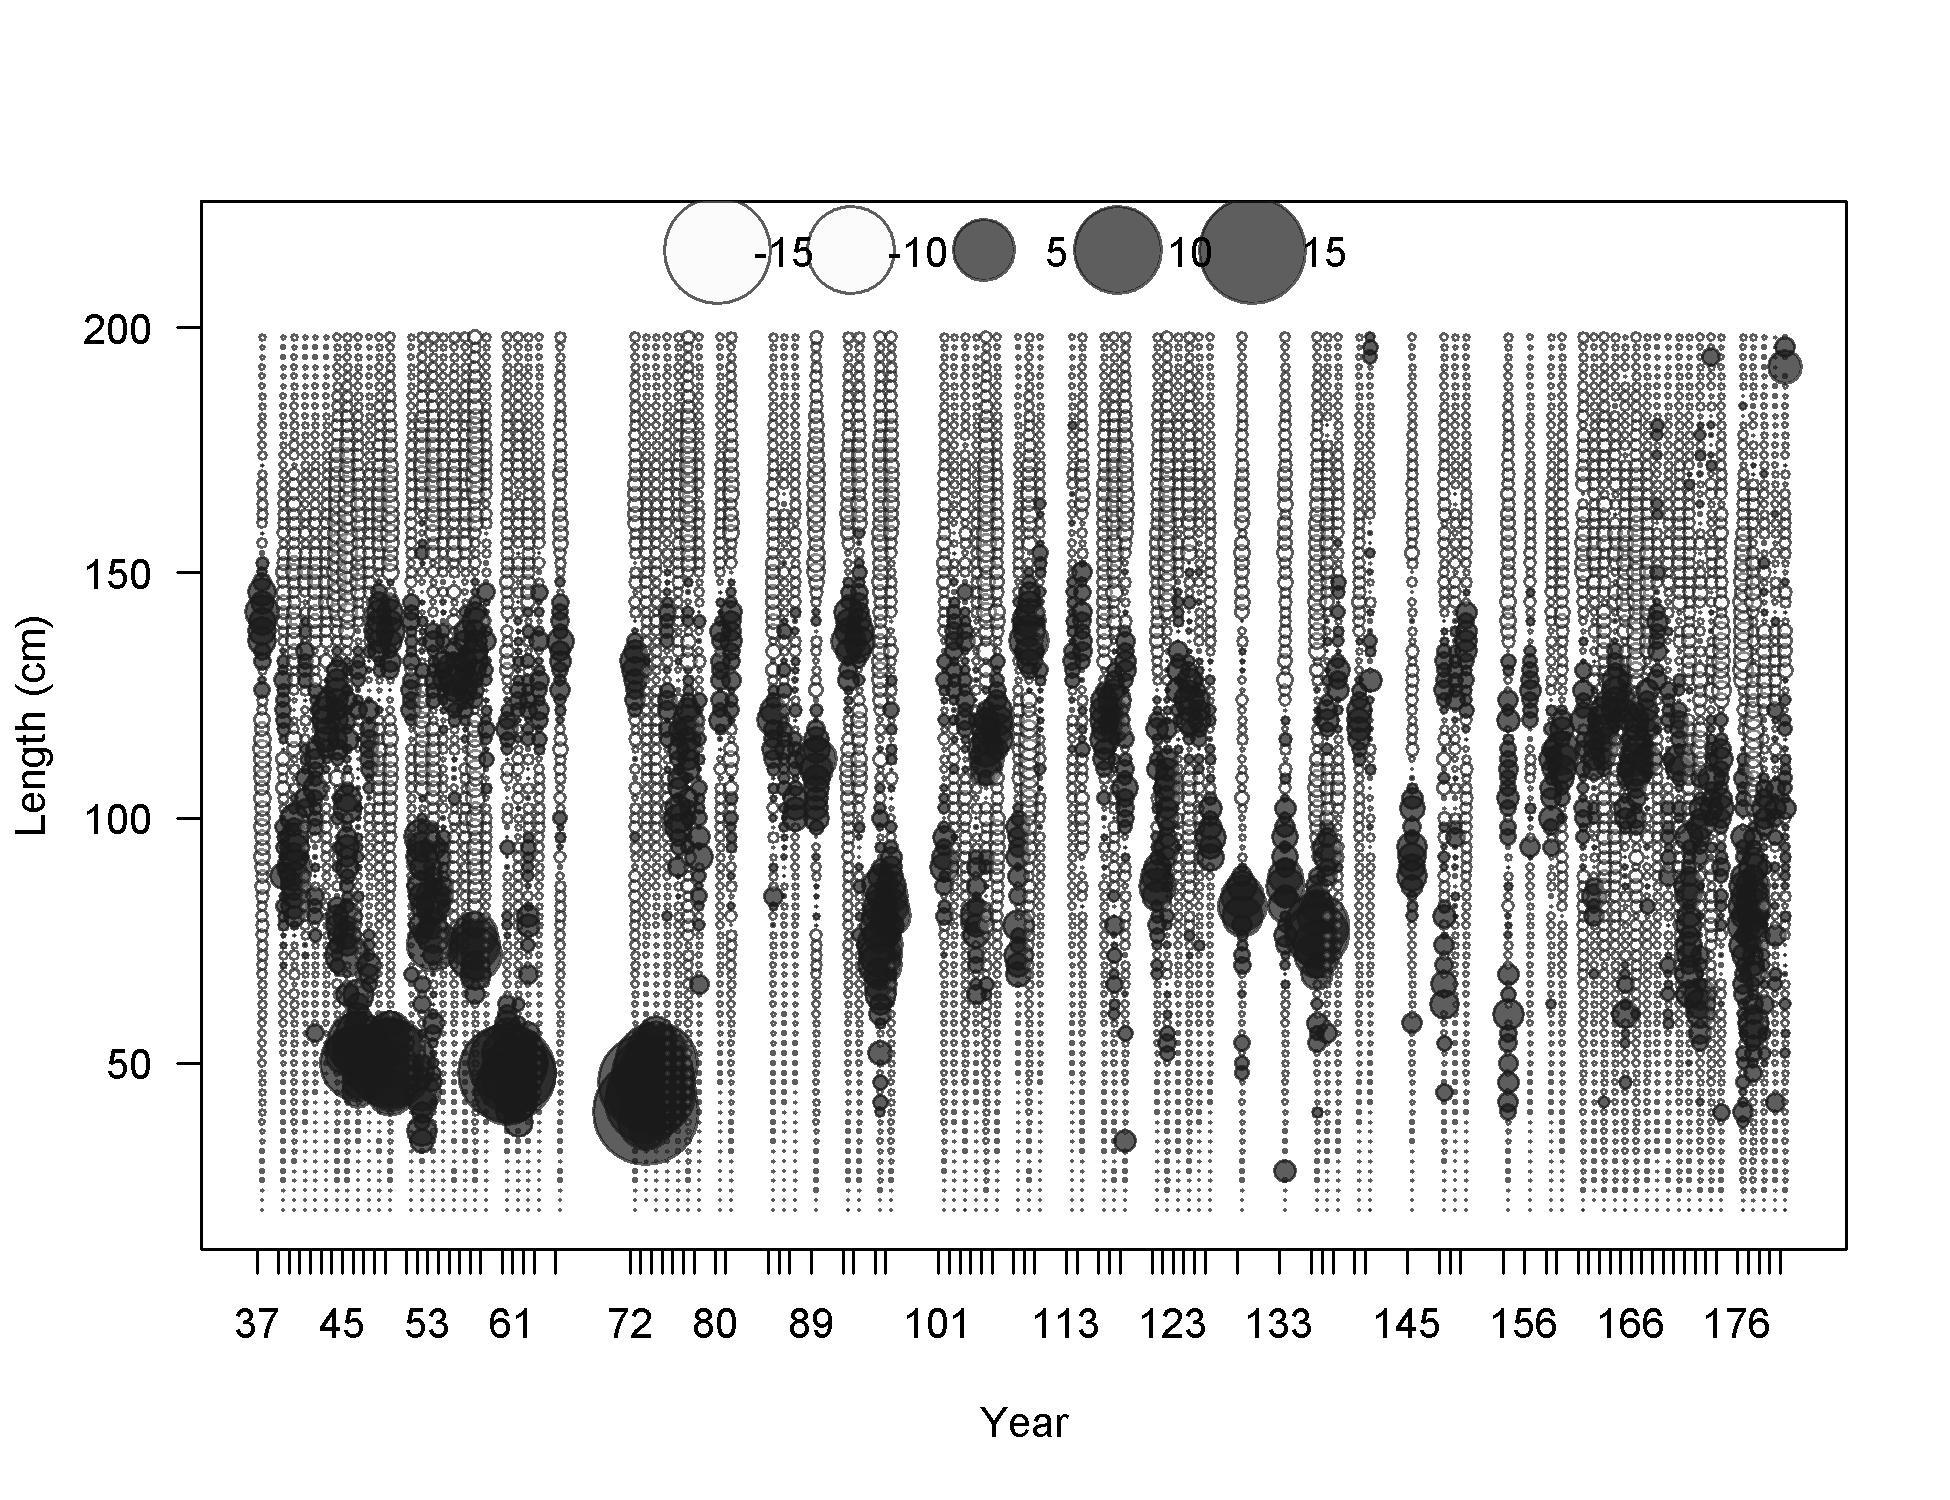
Pearson residuals, whole catch, F21-DEL_I (max=14.81) (plot 6 of 6)
Closed bubbles are positive residuals (observed > expected) and open bubbles are negative residuals (observed < expected).
file: comp_lenfit_residsflt21mkt0_page6.png
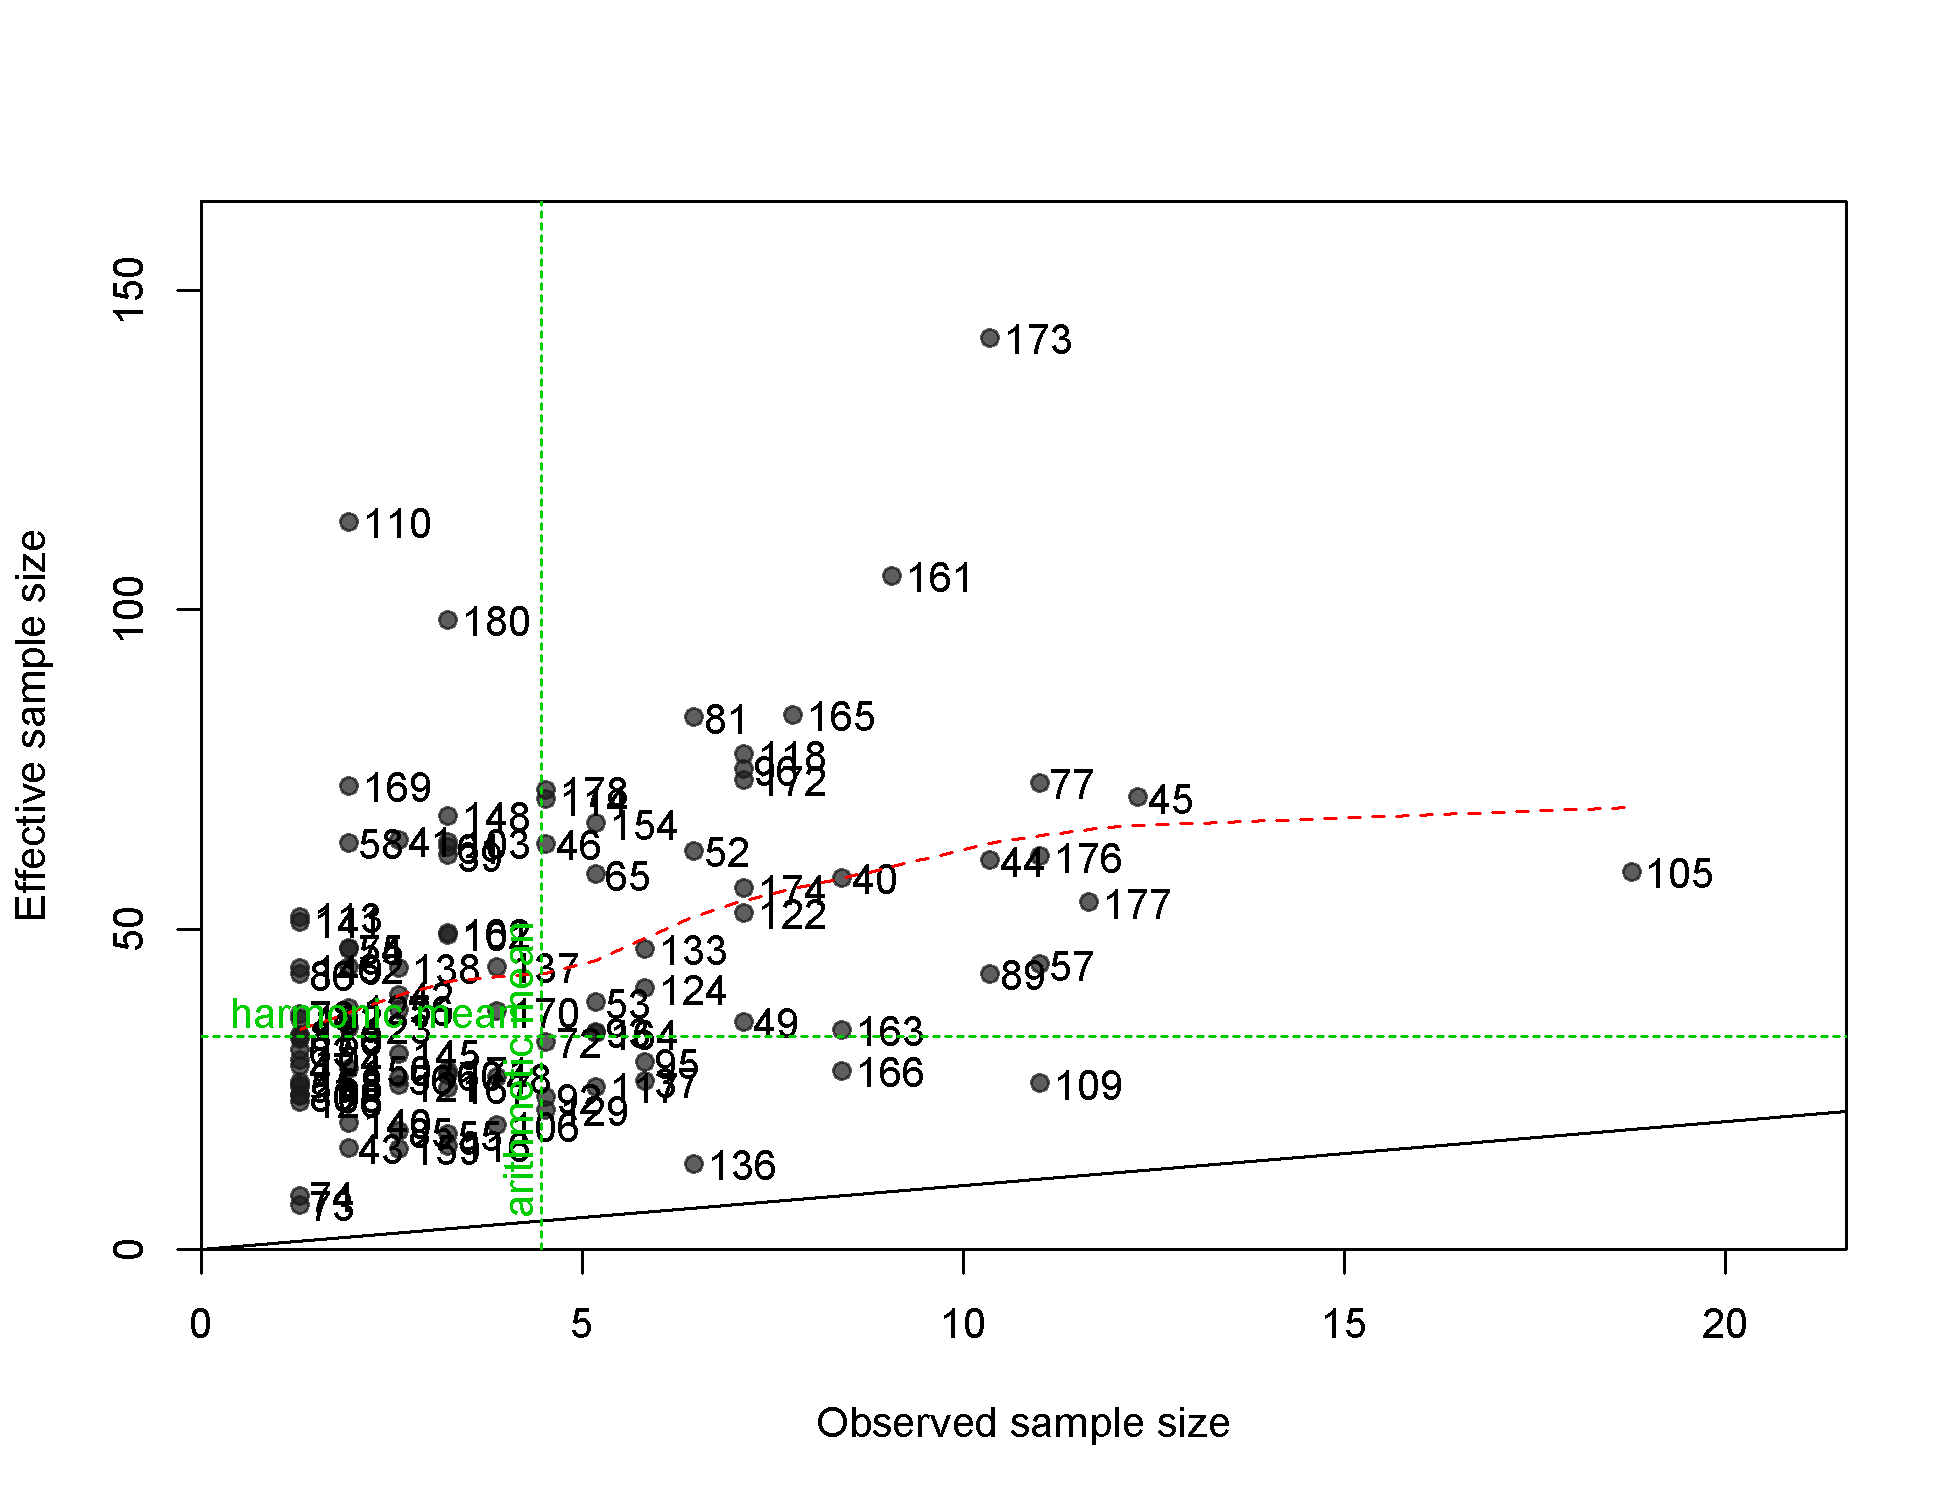
N-EffN comparison, Length comps, whole catch, F21-DEL_I
file: comp_lenfit_sampsize_flt21mkt0.png
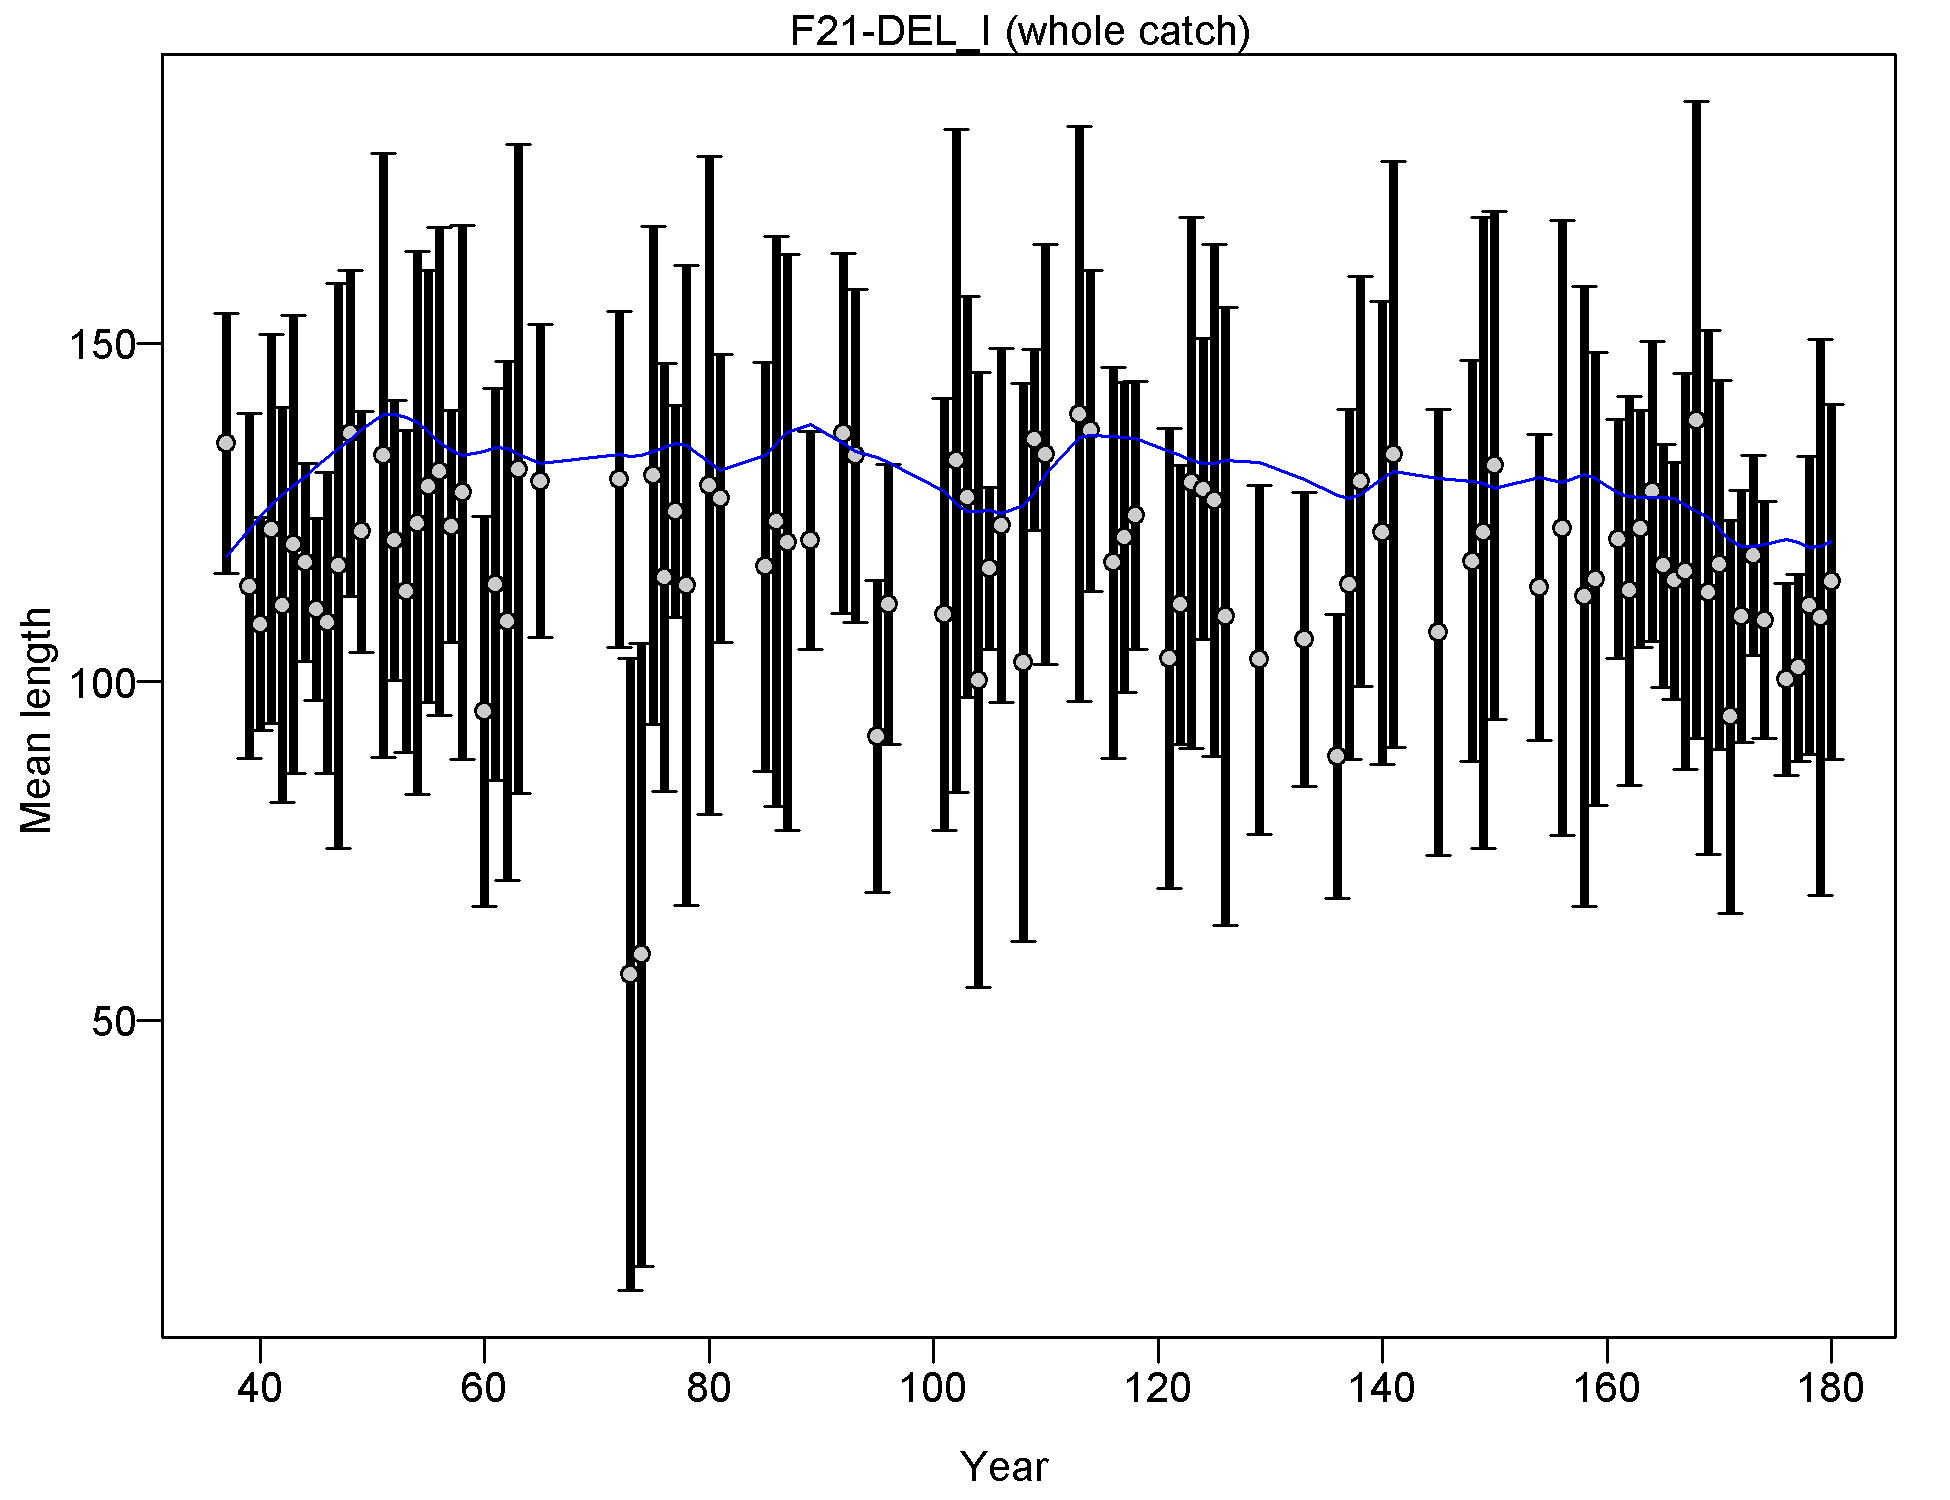
Mean length for F21-DEL_I with 95% confidence intervals based on current samples sizes.
Francis data weighting method TA1.8: thinner intervals (with capped ends) show result of further adjusting sample sizes based on suggested multiplier (with 95% interval) for len data from F21-DEL_I:
0.9984 (0.7533-1.5298)
For more info, see
Francis, R.I.C.C. (2011). Data weighting in statistical fisheries stock assessment models. Can. J. Fish. Aquat. Sci. 68: 1124-1138. https://doi.org/10.1139/f2011-025
file: comp_lenfit_data_weighting_TA1.8_F21-DEL_I.png
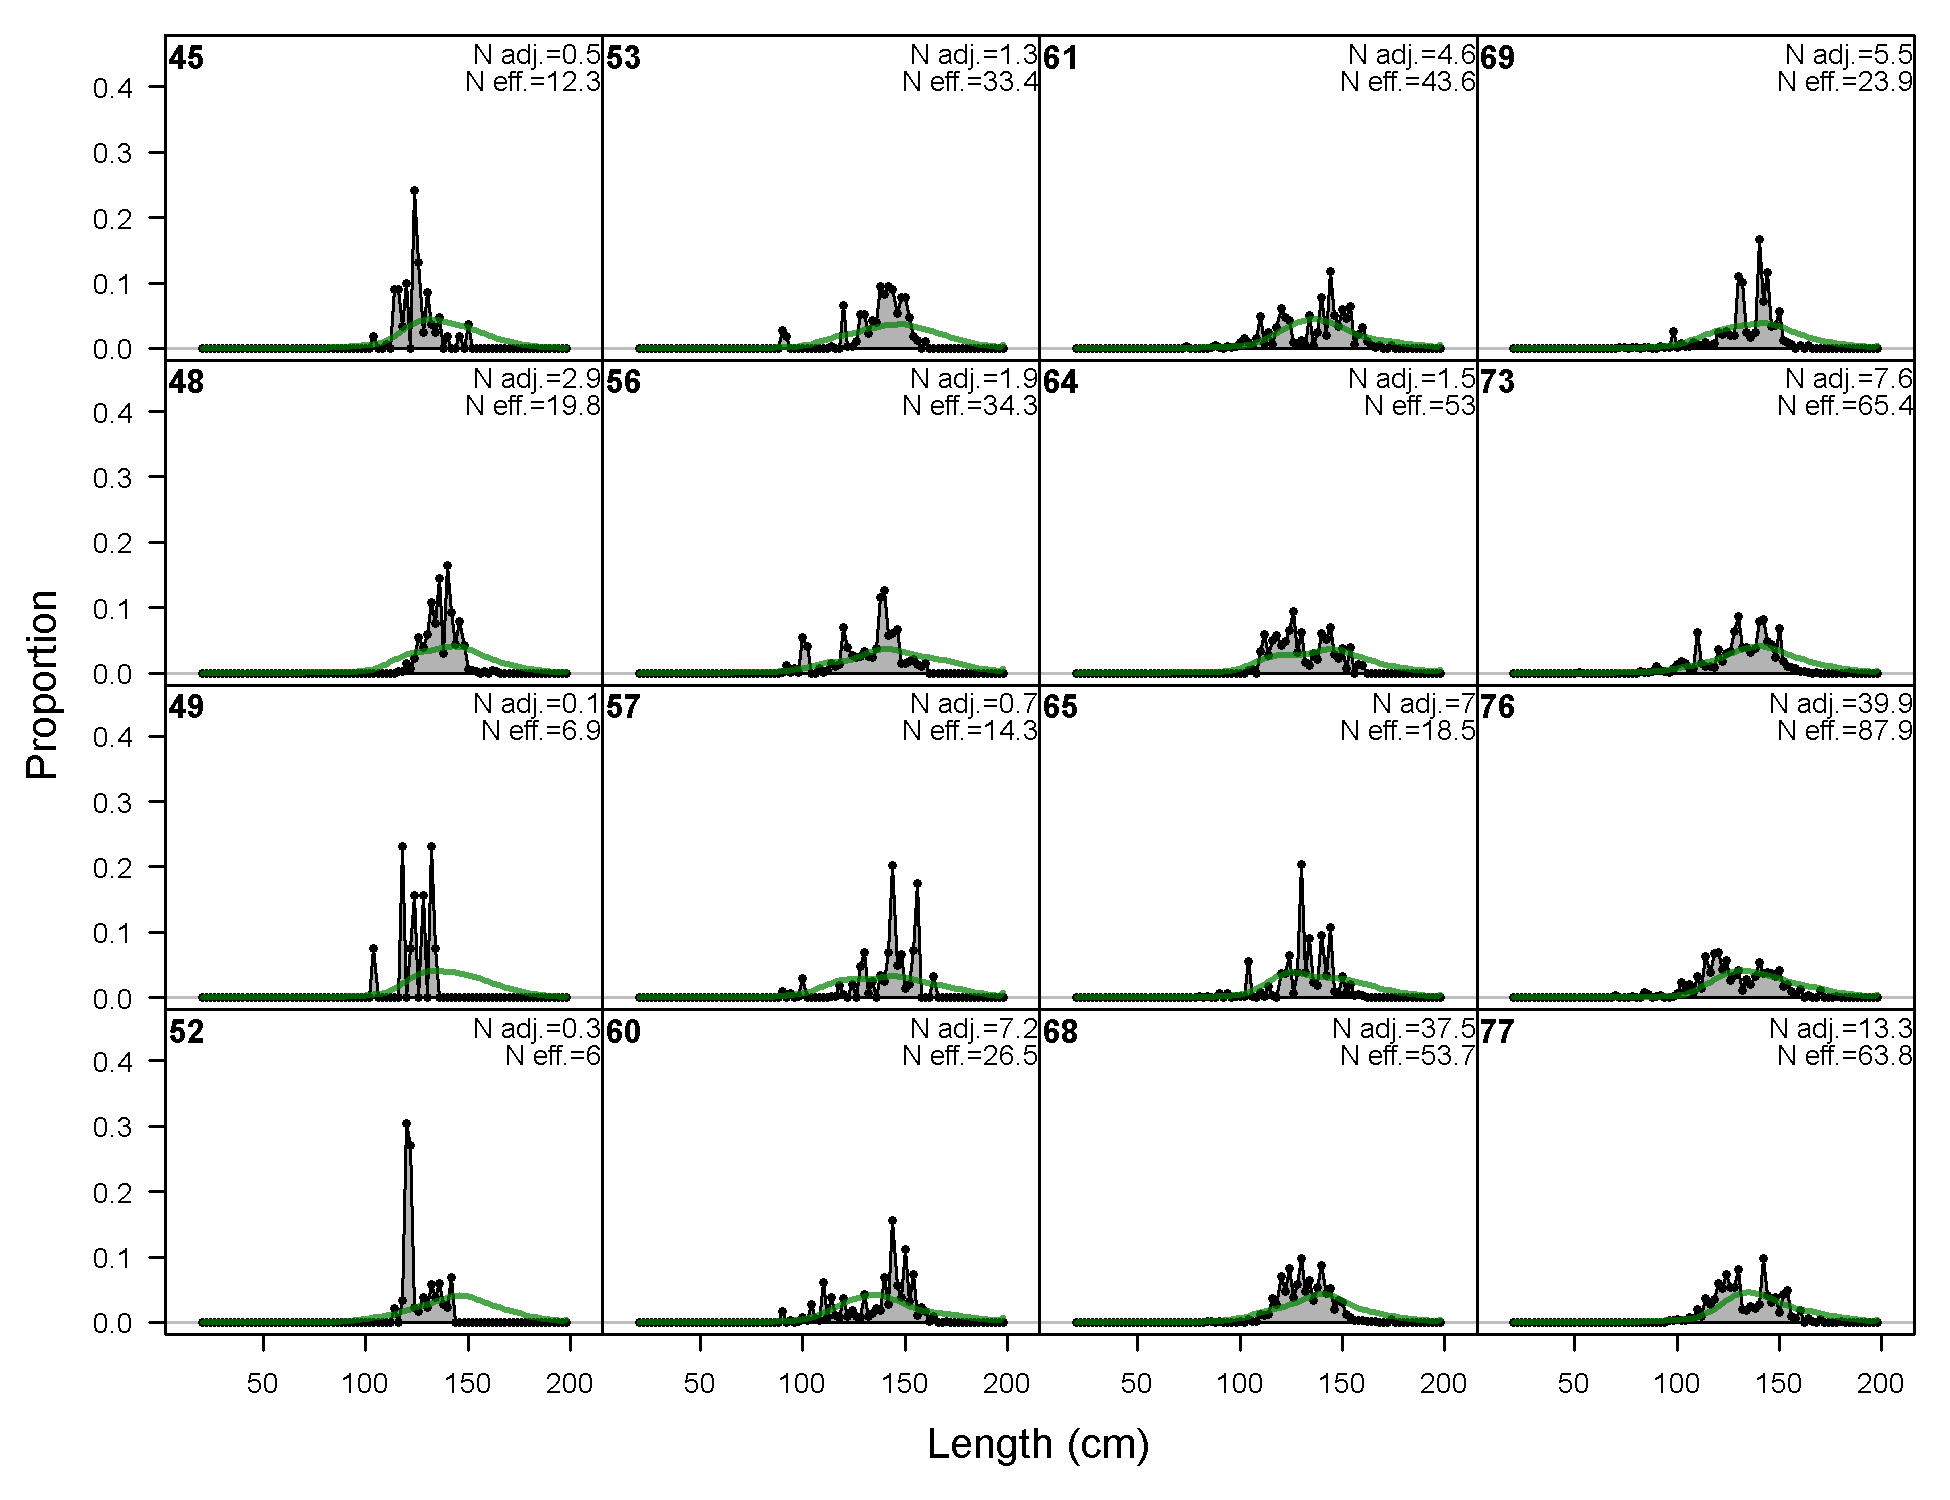
Length comps, whole catch, F22-BB (plot 1 of 4).
'N adj.' is the input sample size after data-weighting adjustment. N eff. is the calculated effective sample size used in the McAllister-Iannelli tuning method.
file: comp_lenfit_flt22mkt0_page1.png

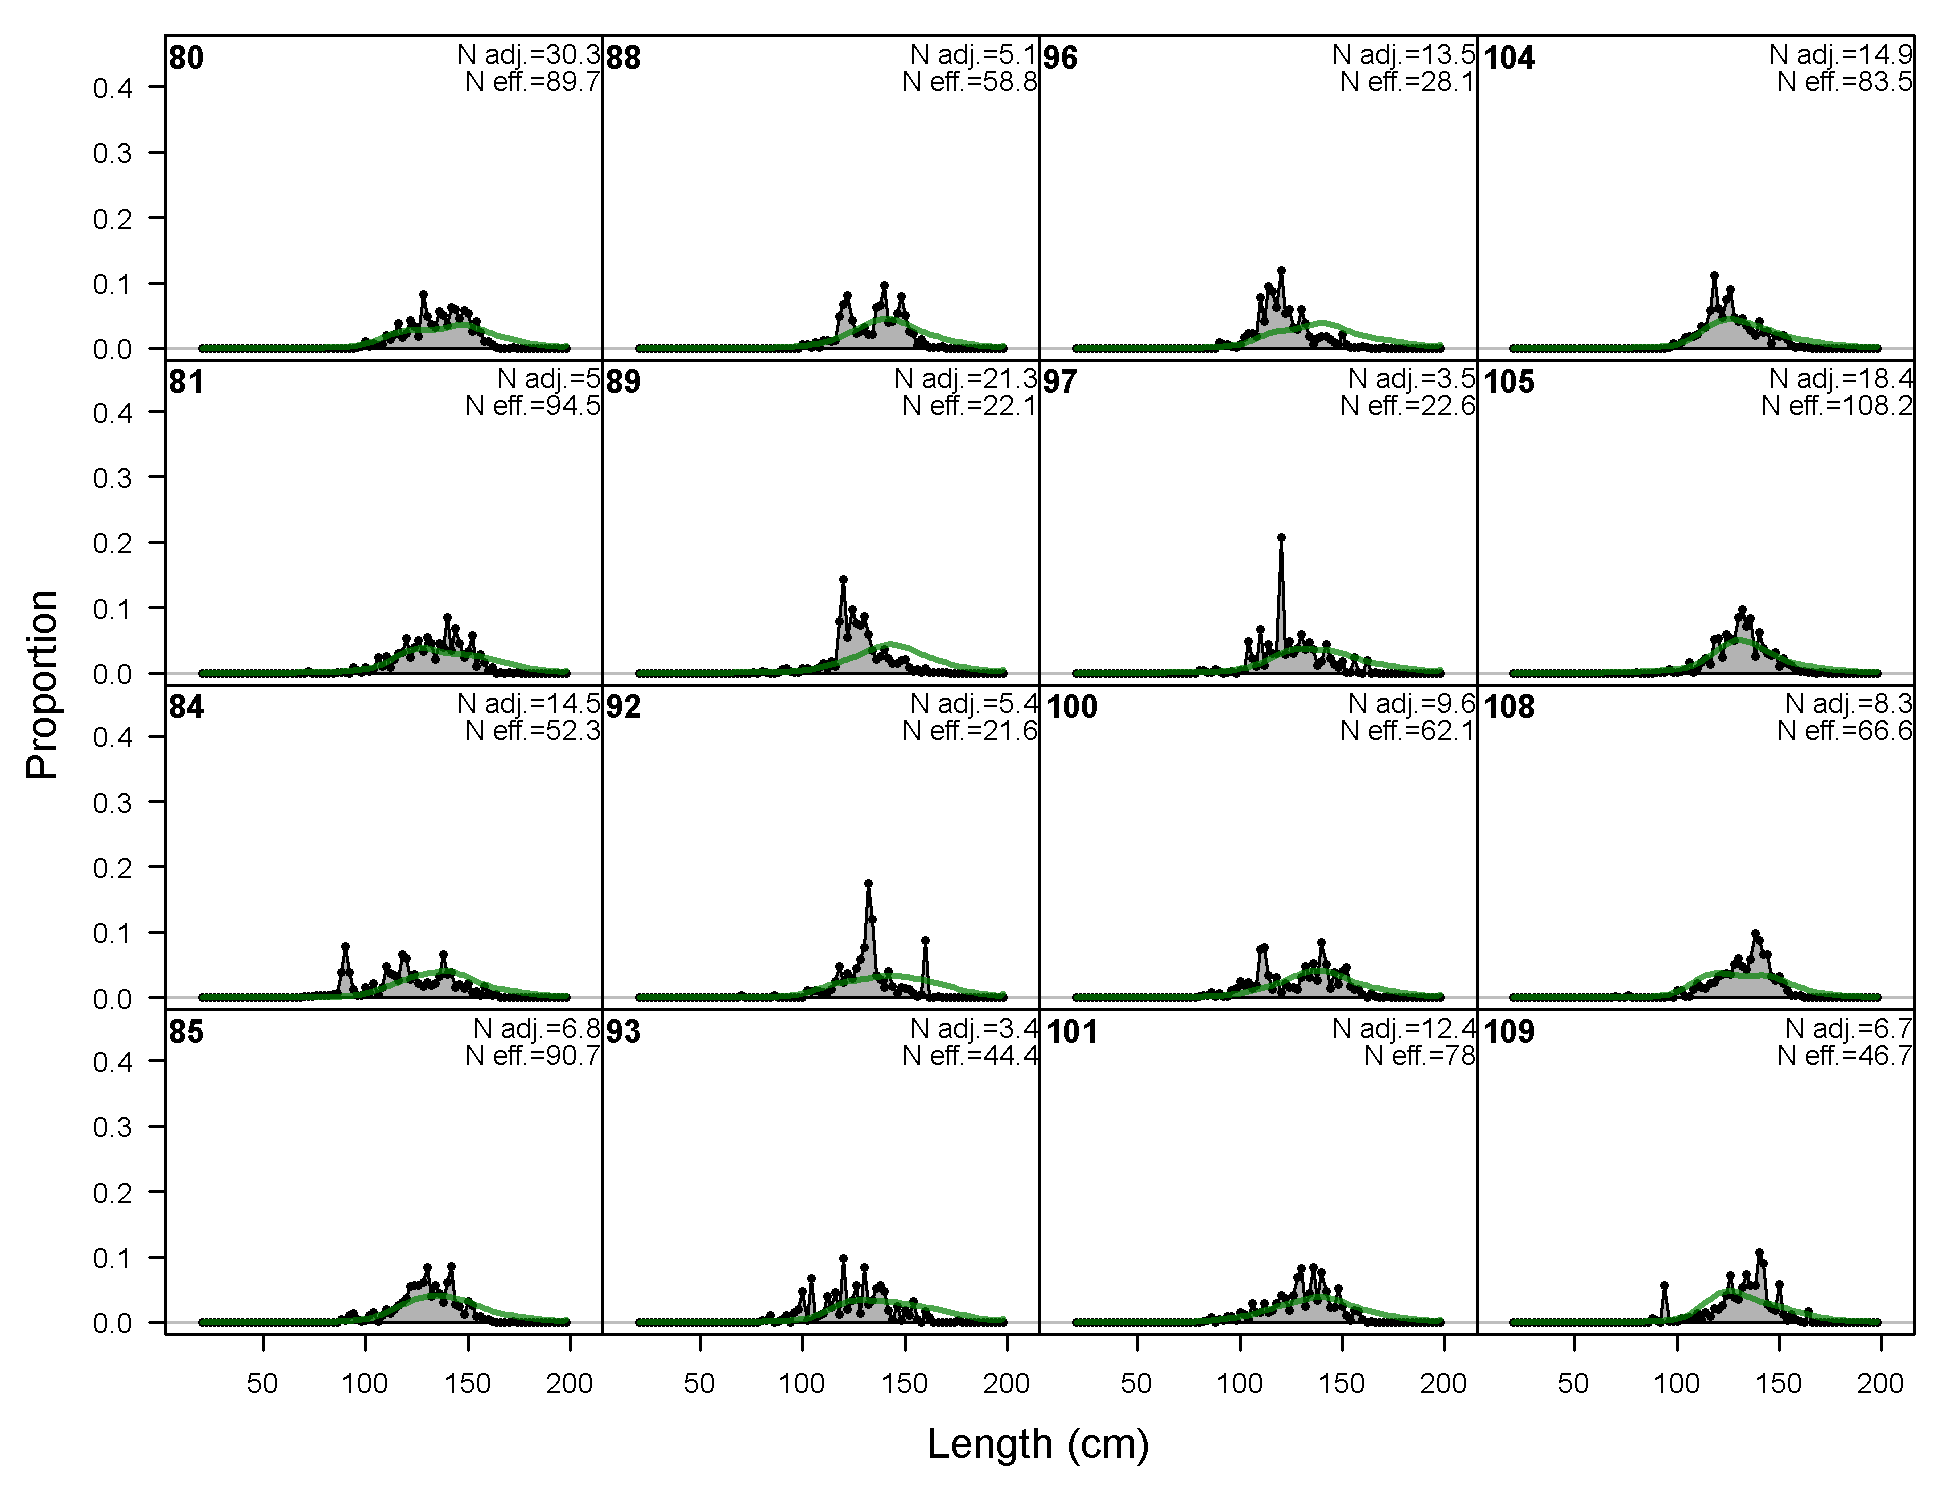
Length comps, whole catch, F22-BB (plot 2 of 4)
file: comp_lenfit_flt22mkt0_page2.png
Length comps, whole catch, F22-BB (plot 3 of 4)
file: comp_lenfit_flt22mkt0_page3.png
Length comps, whole catch, F22-BB (plot 4 of 4)
file: comp_lenfit_flt22mkt0_page4.png
Pearson residuals, whole catch, F22-BB (max=4.81) (plot 4 of 4)
Closed bubbles are positive residuals (observed > expected) and open bubbles are negative residuals (observed < expected).
file: comp_lenfit_residsflt22mkt0_page4.png
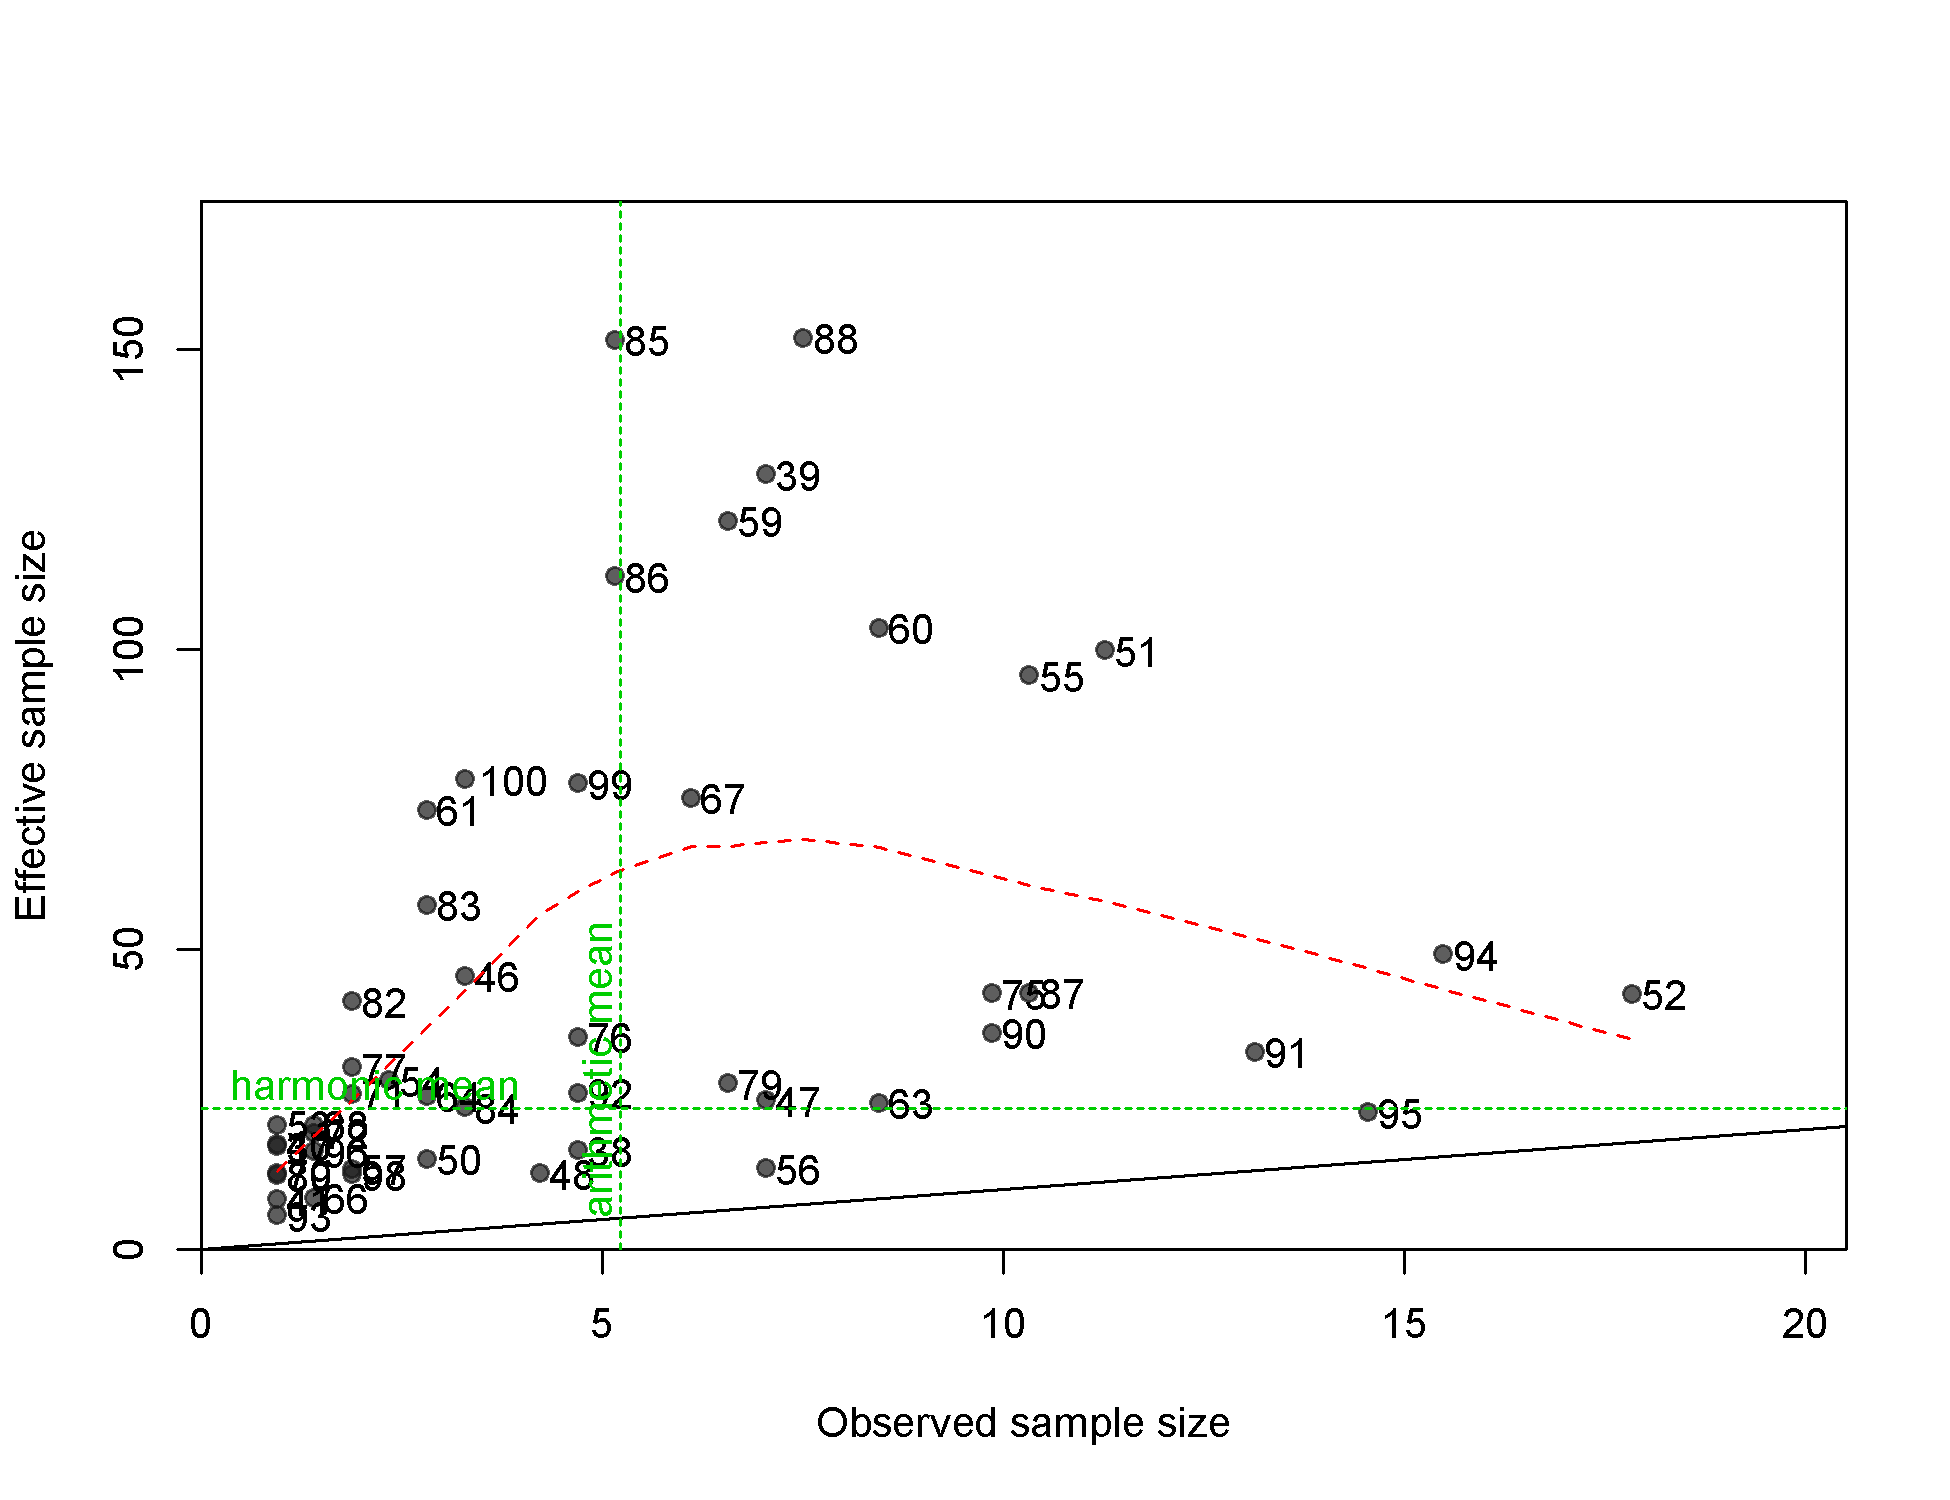
N-EffN comparison, Length comps, whole catch, F22-BB
file: comp_lenfit_sampsize_flt22mkt0.png
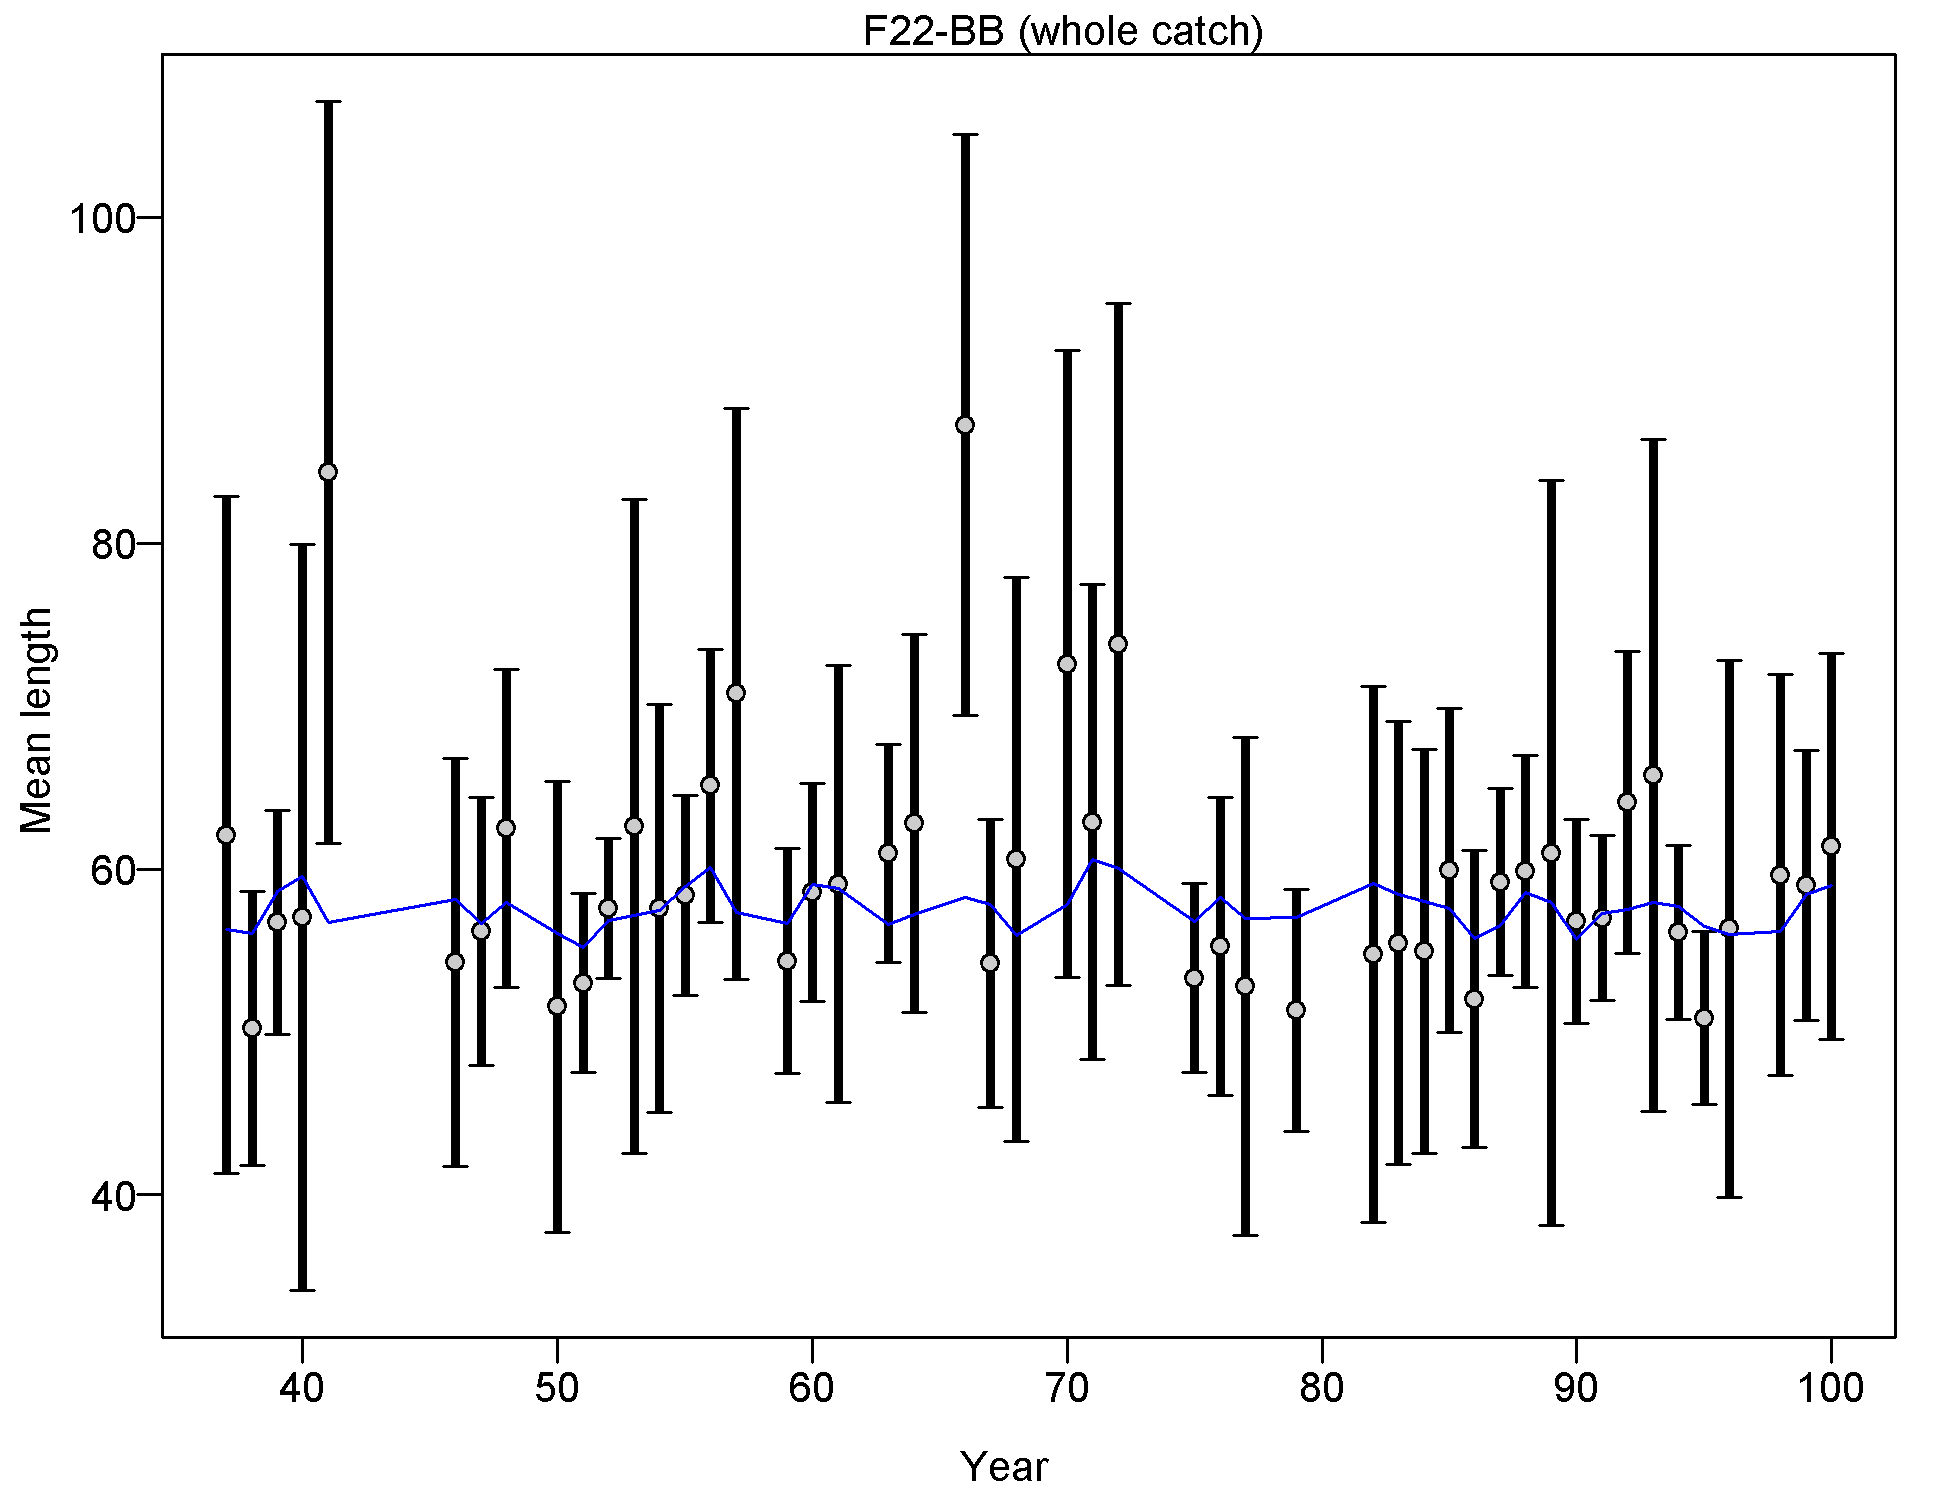
Mean length for F22-BB with 95% confidence intervals based on current samples sizes.
Francis data weighting method TA1.8: thinner intervals (with capped ends) show result of further adjusting sample sizes based on suggested multiplier (with 95% interval) for len data from F22-BB:
0.9966 (0.6605-1.789)
For more info, see
Francis, R.I.C.C. (2011). Data weighting in statistical fisheries stock assessment models. Can. J. Fish. Aquat. Sci. 68: 1124-1138. https://doi.org/10.1139/f2011-025
file: comp_lenfit_data_weighting_TA1.8_F22-BB.png
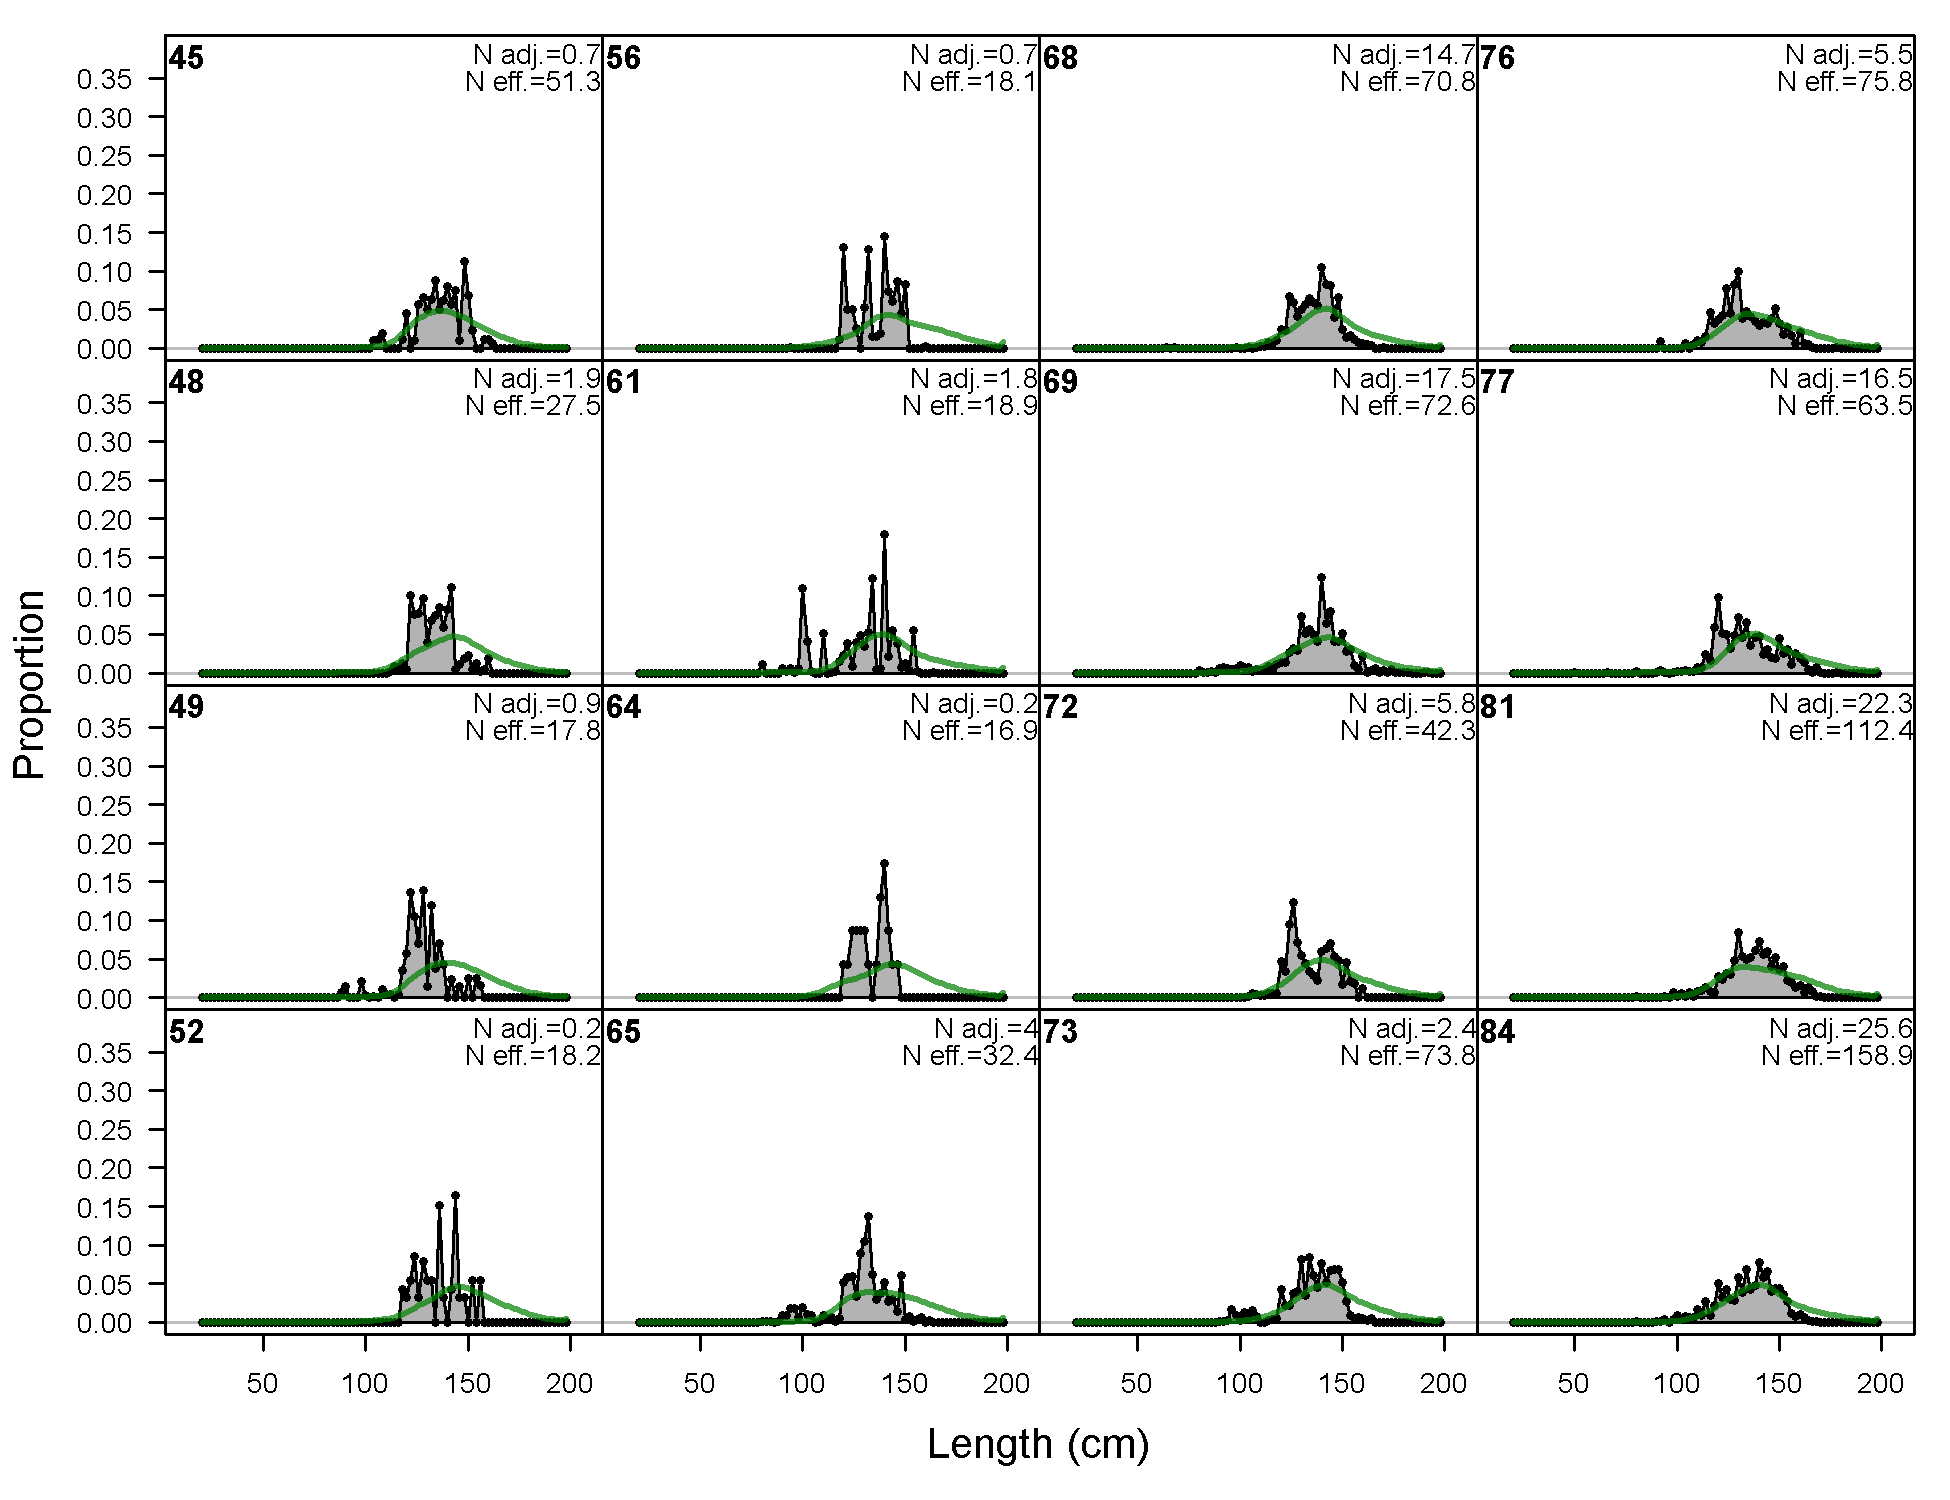
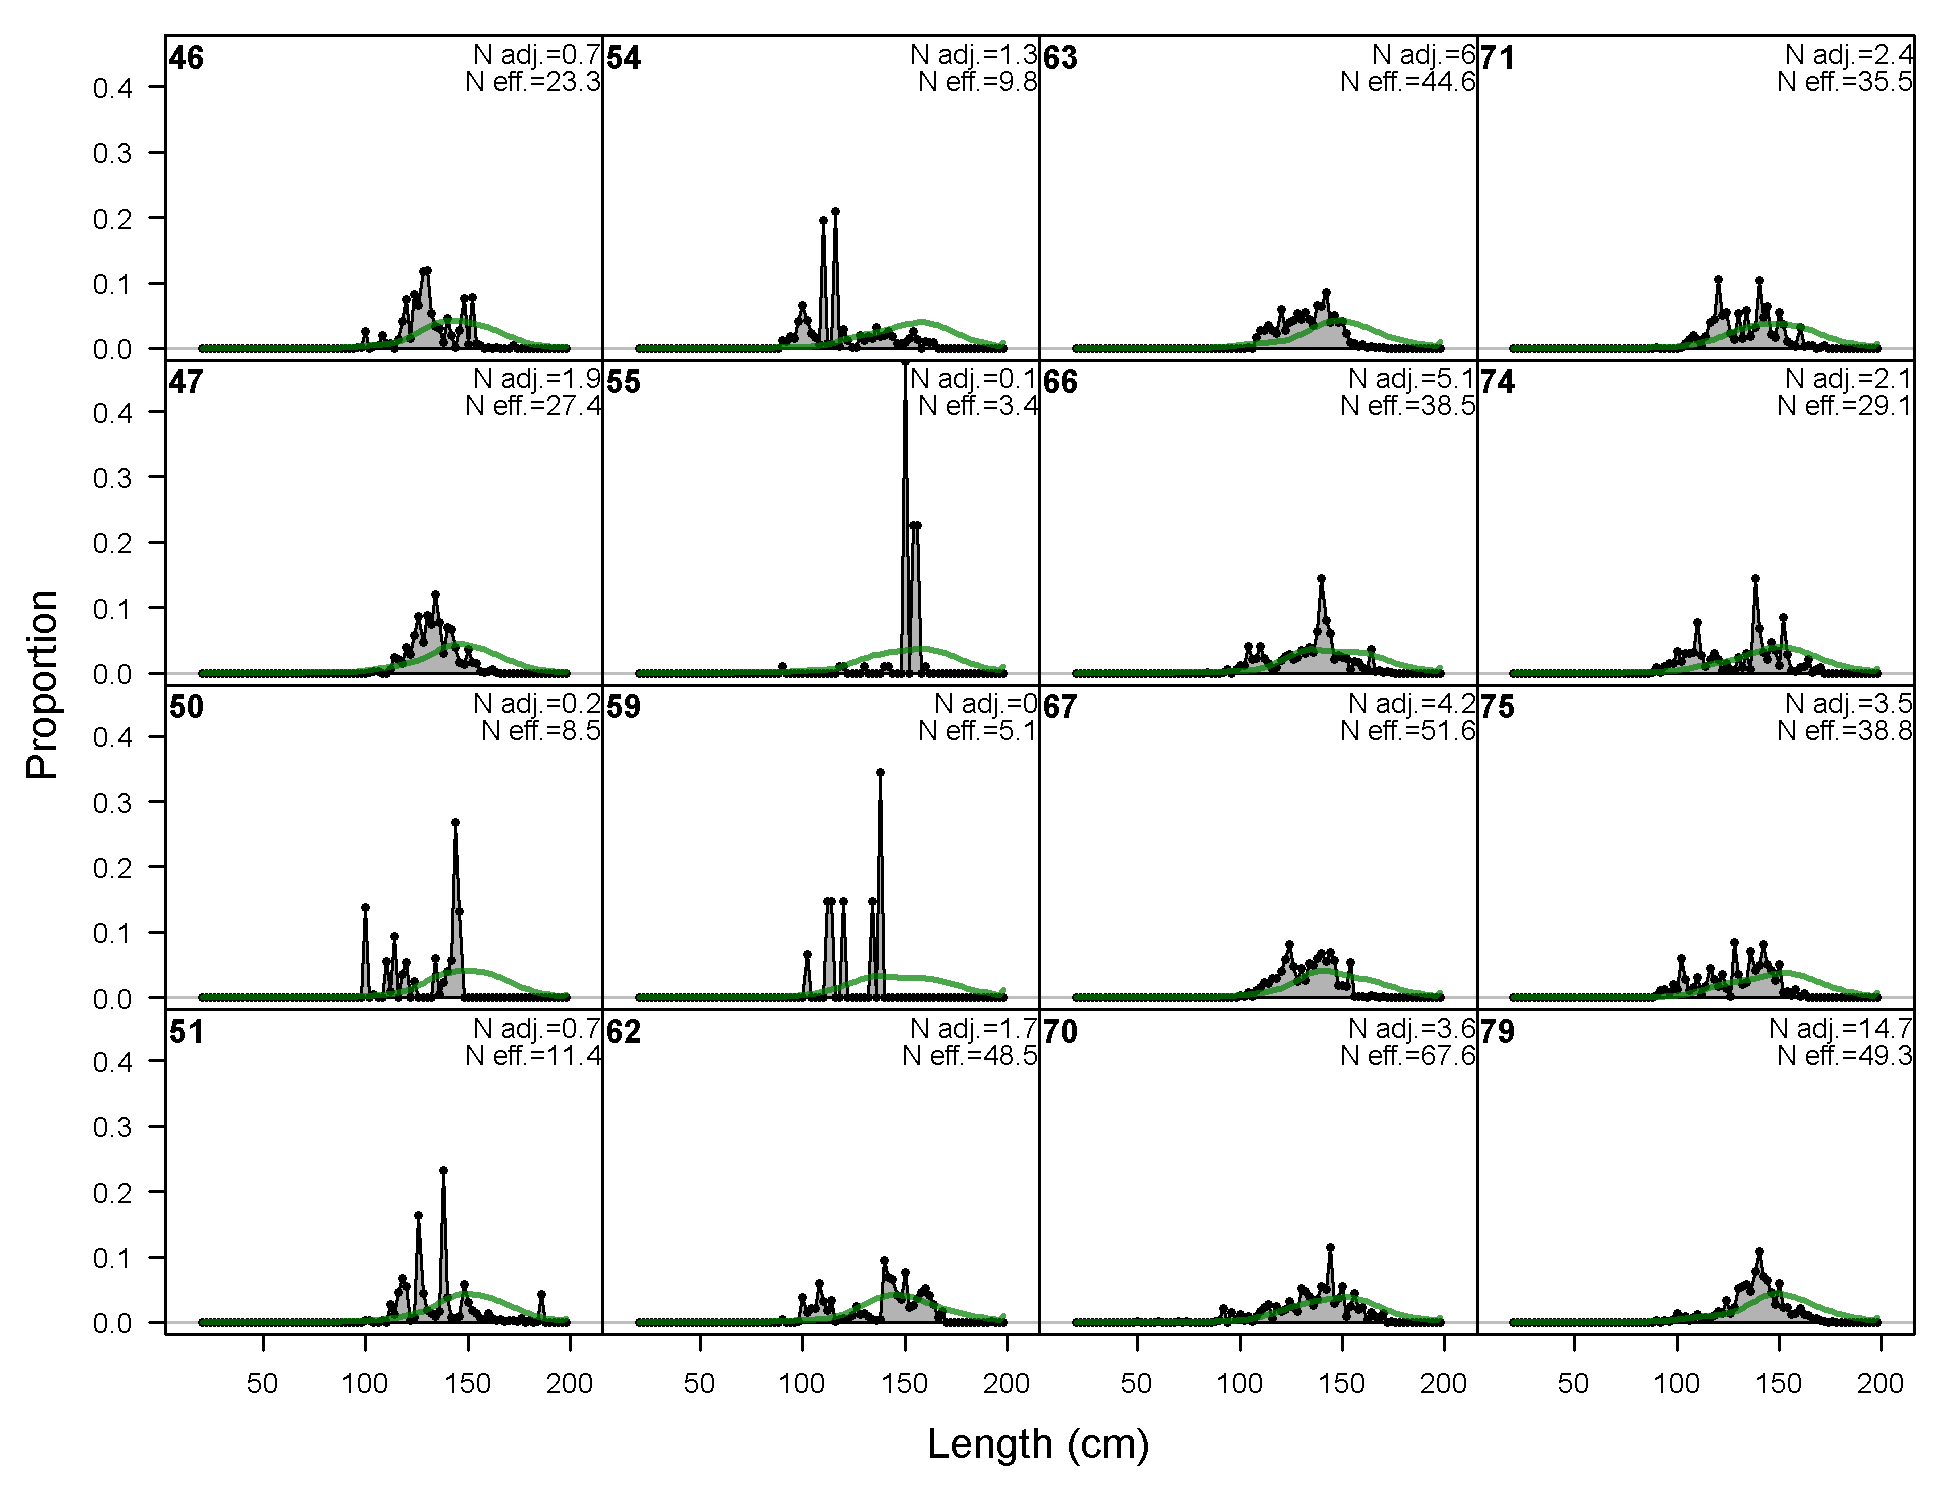
Length comps, whole catch, F29-LL_W_Q14n (plot 1 of 4).
'N adj.' is the input sample size after data-weighting adjustment. N eff. is the calculated effective sample size used in the McAllister-Iannelli tuning method.
file: comp_lenfit_flt29mkt0_page1.png
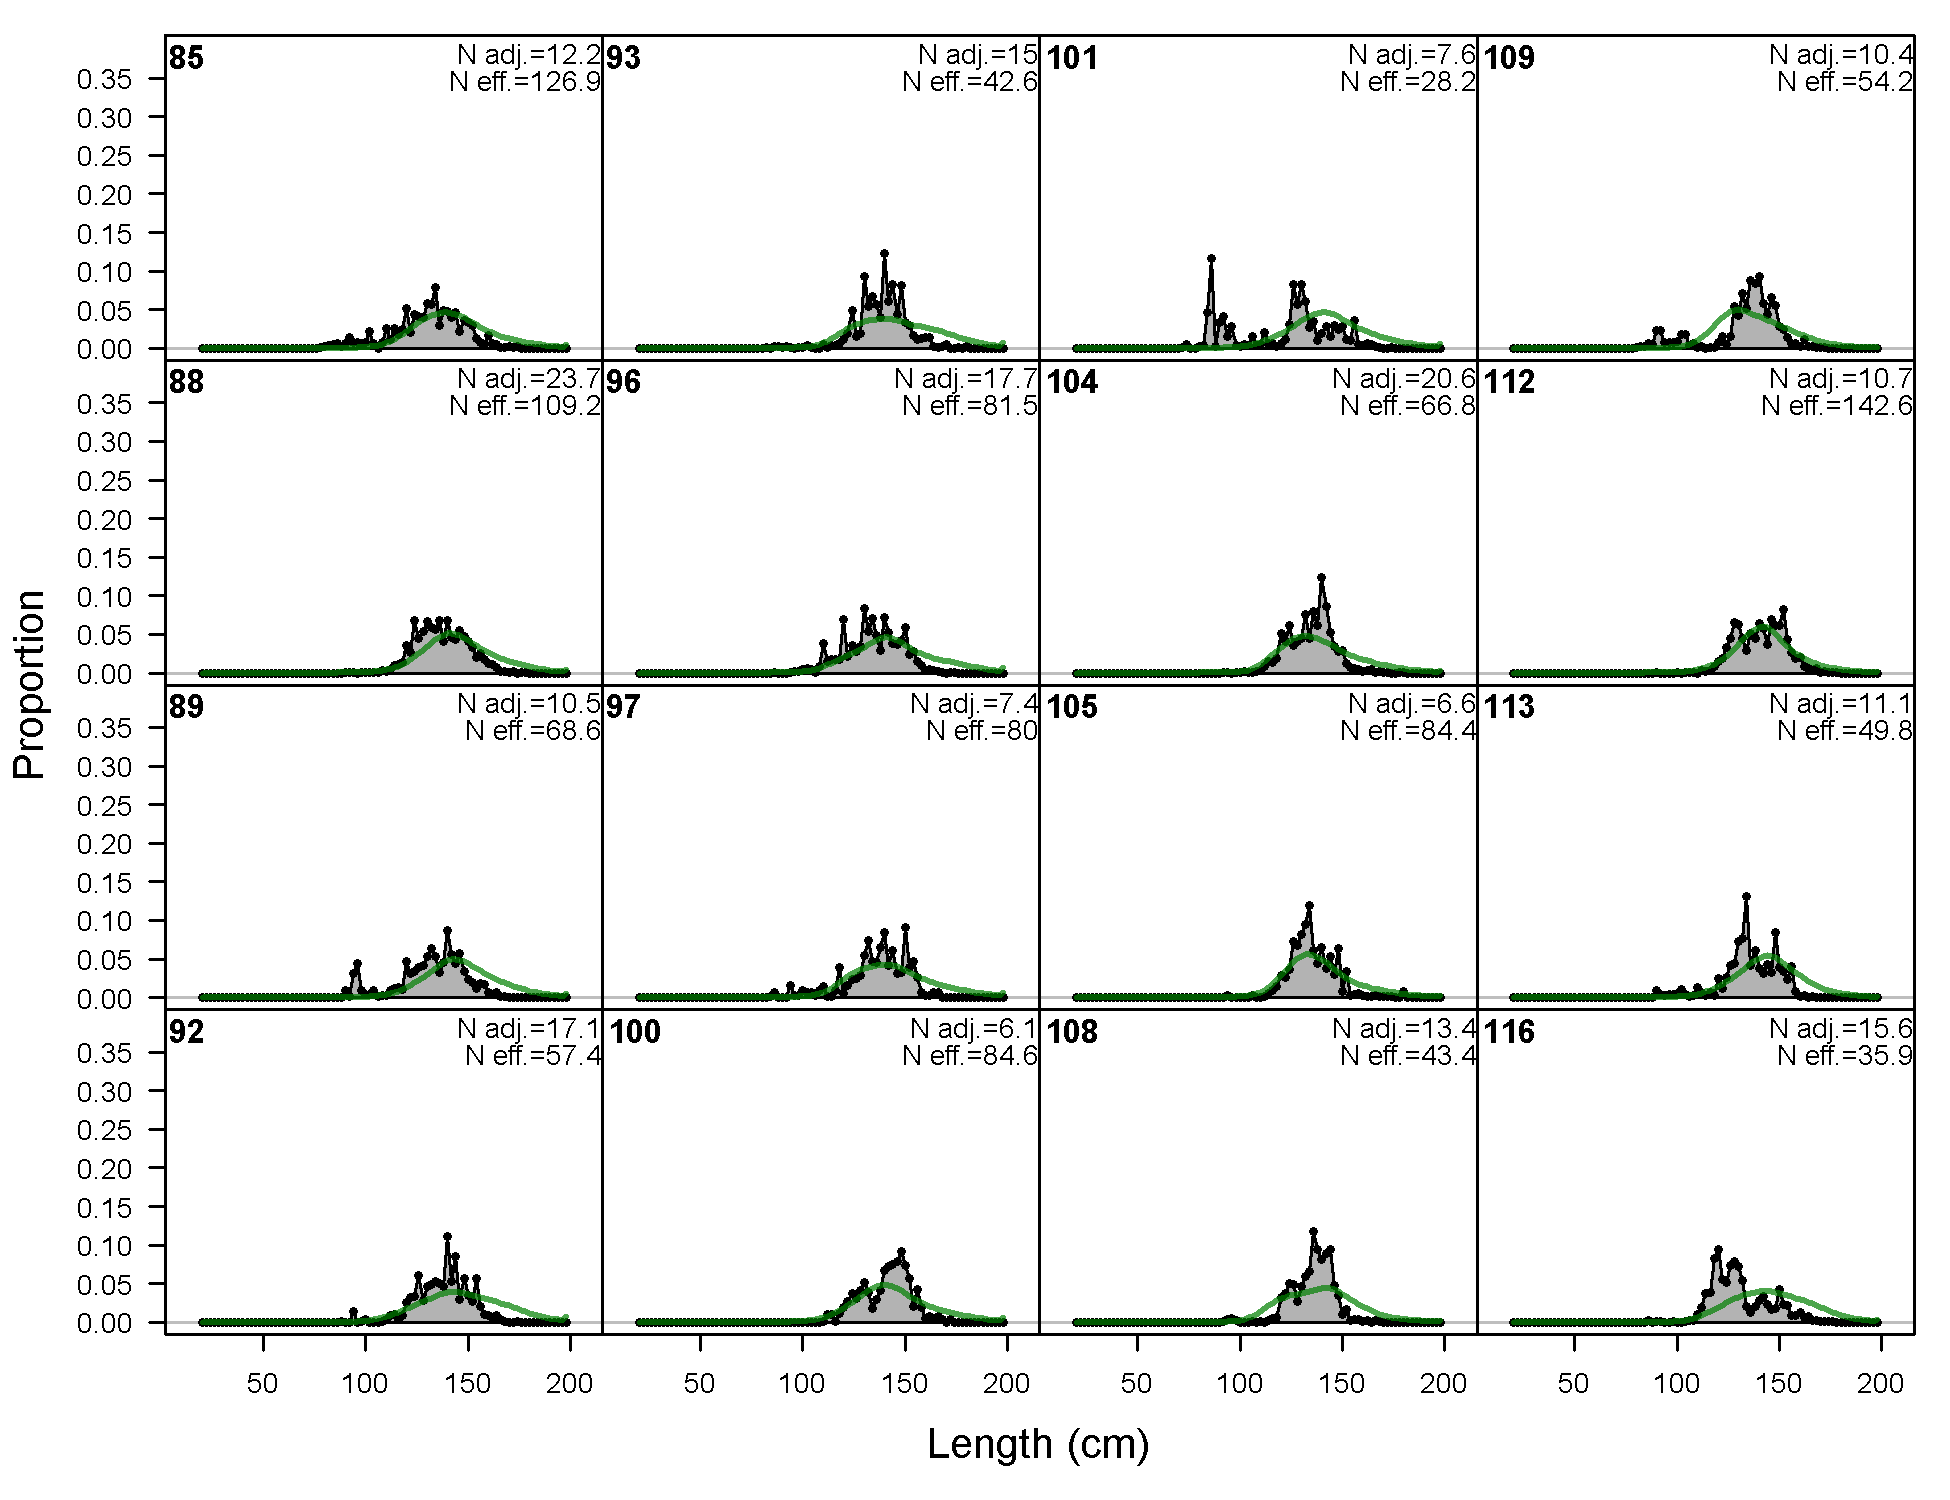
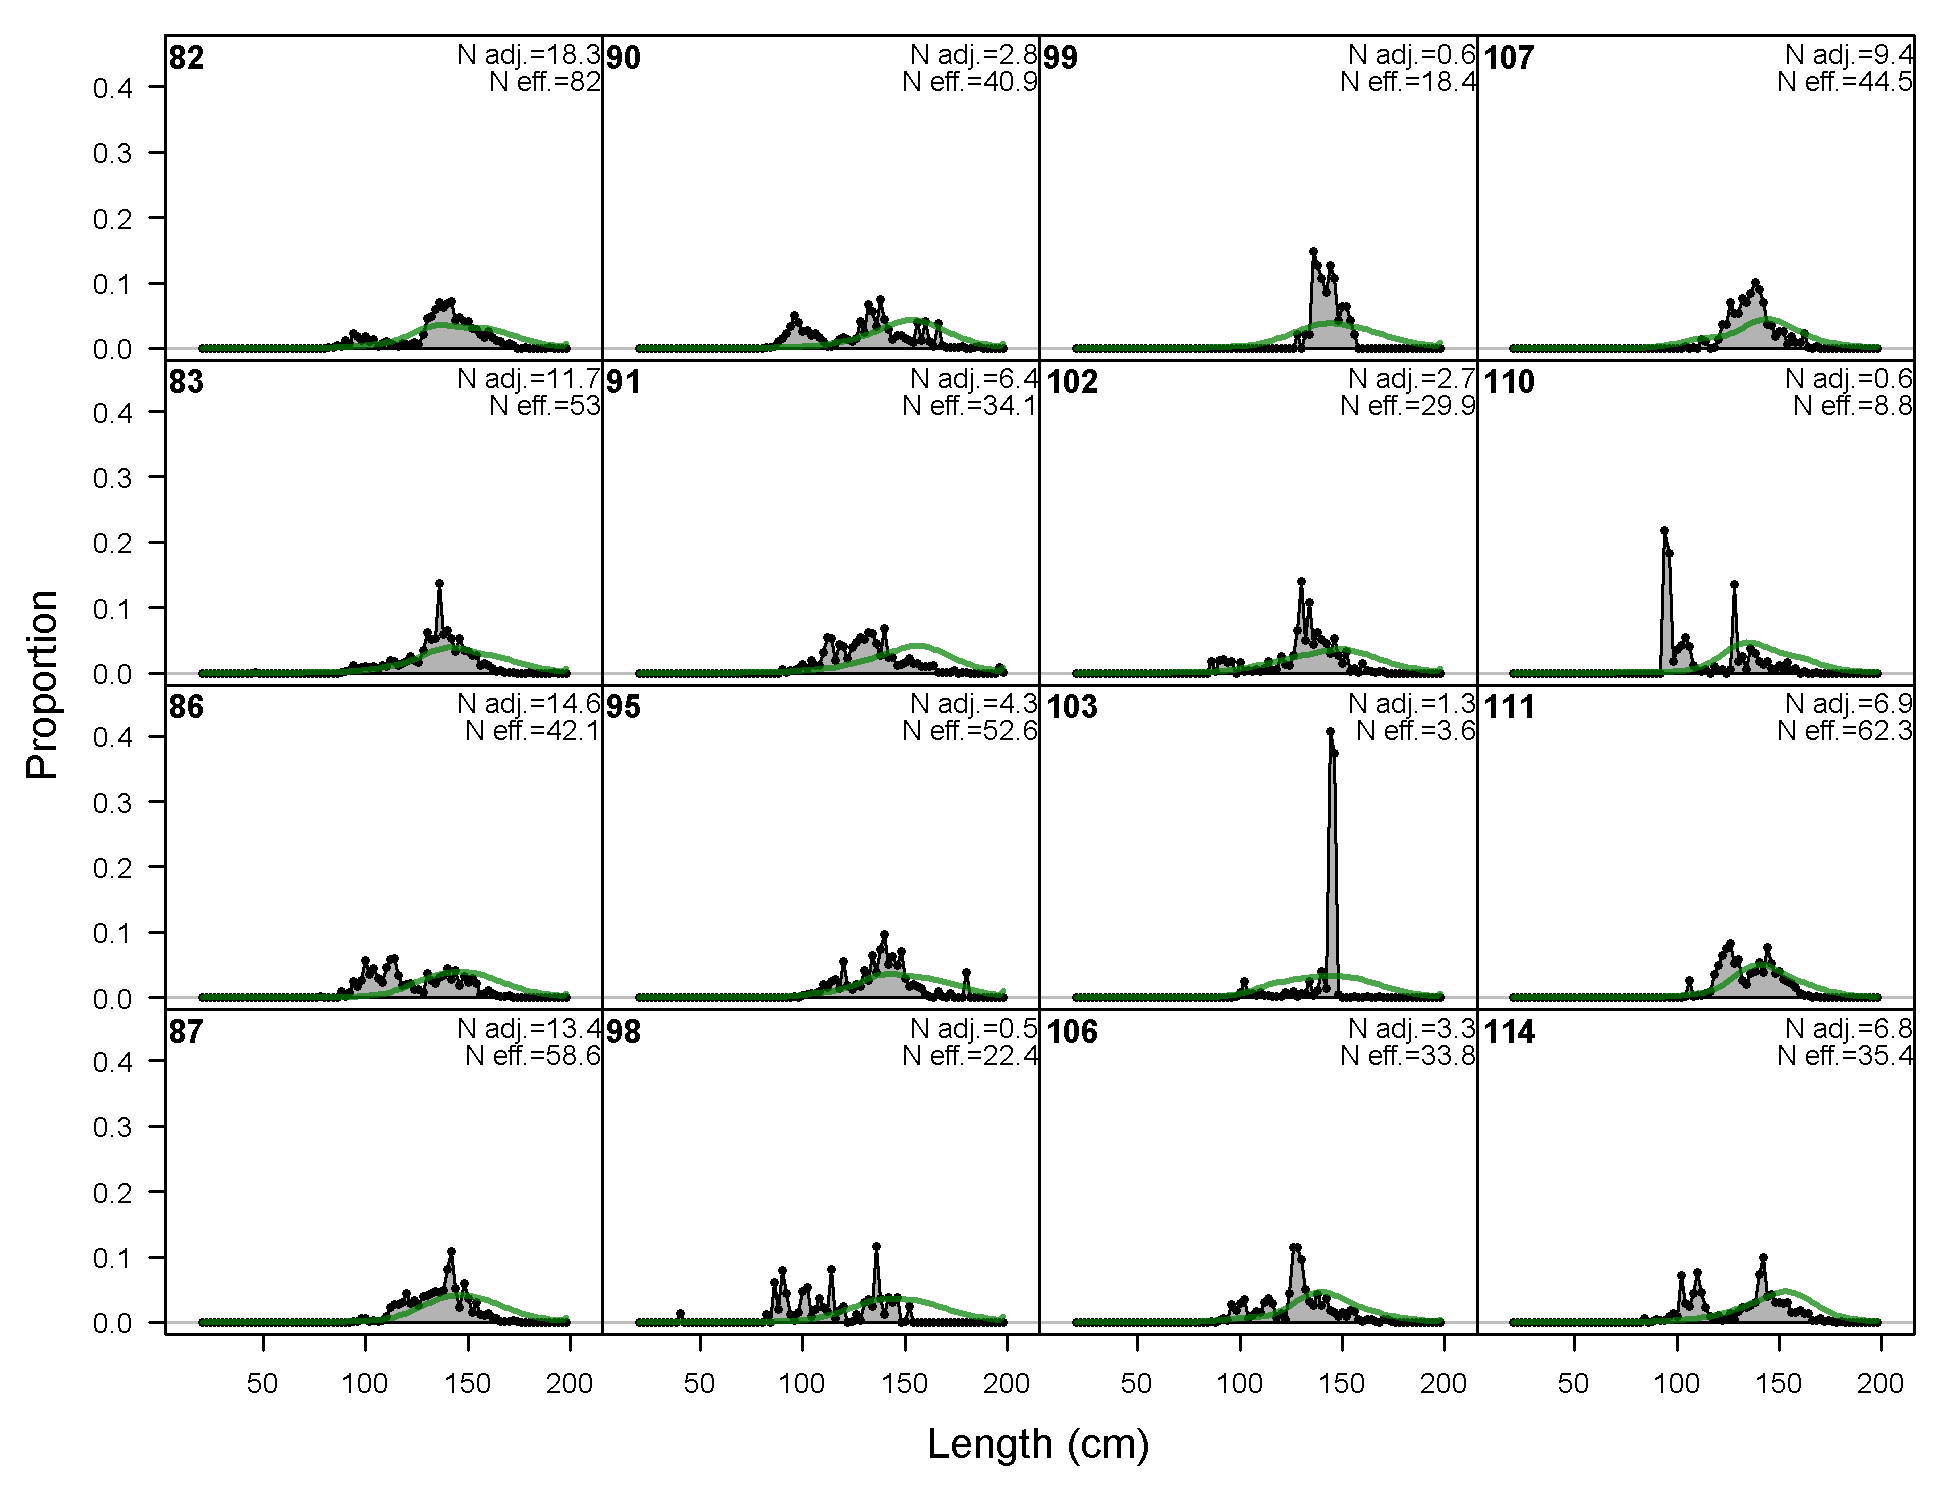
Length comps, whole catch, F29-LL_W_Q14n (plot 2 of 4)
file: comp_lenfit_flt29mkt0_page2.png
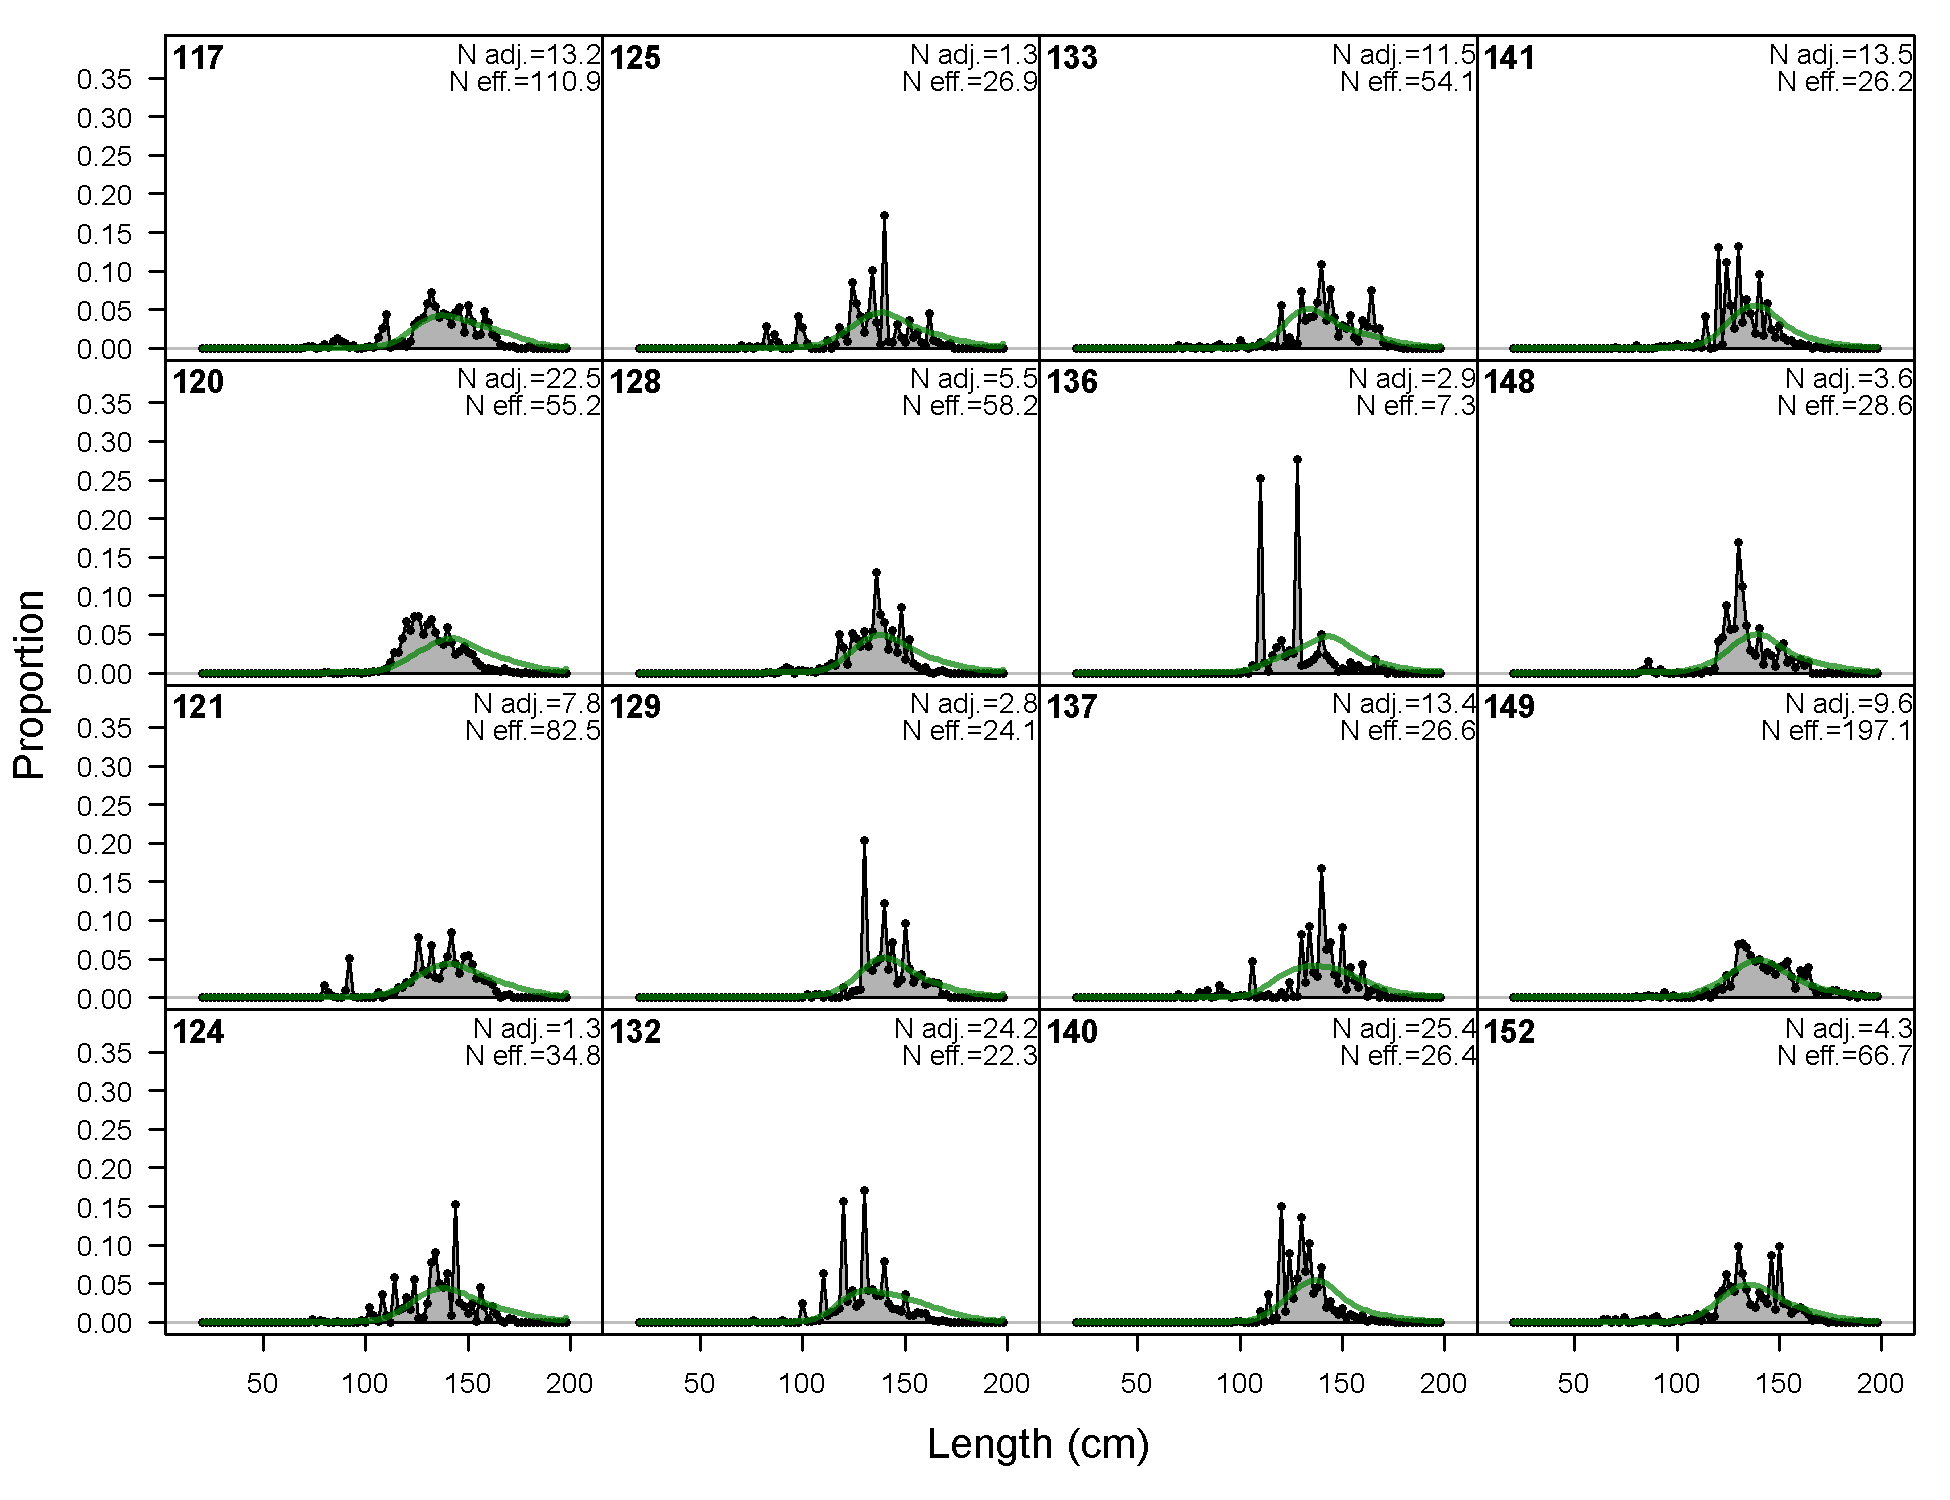
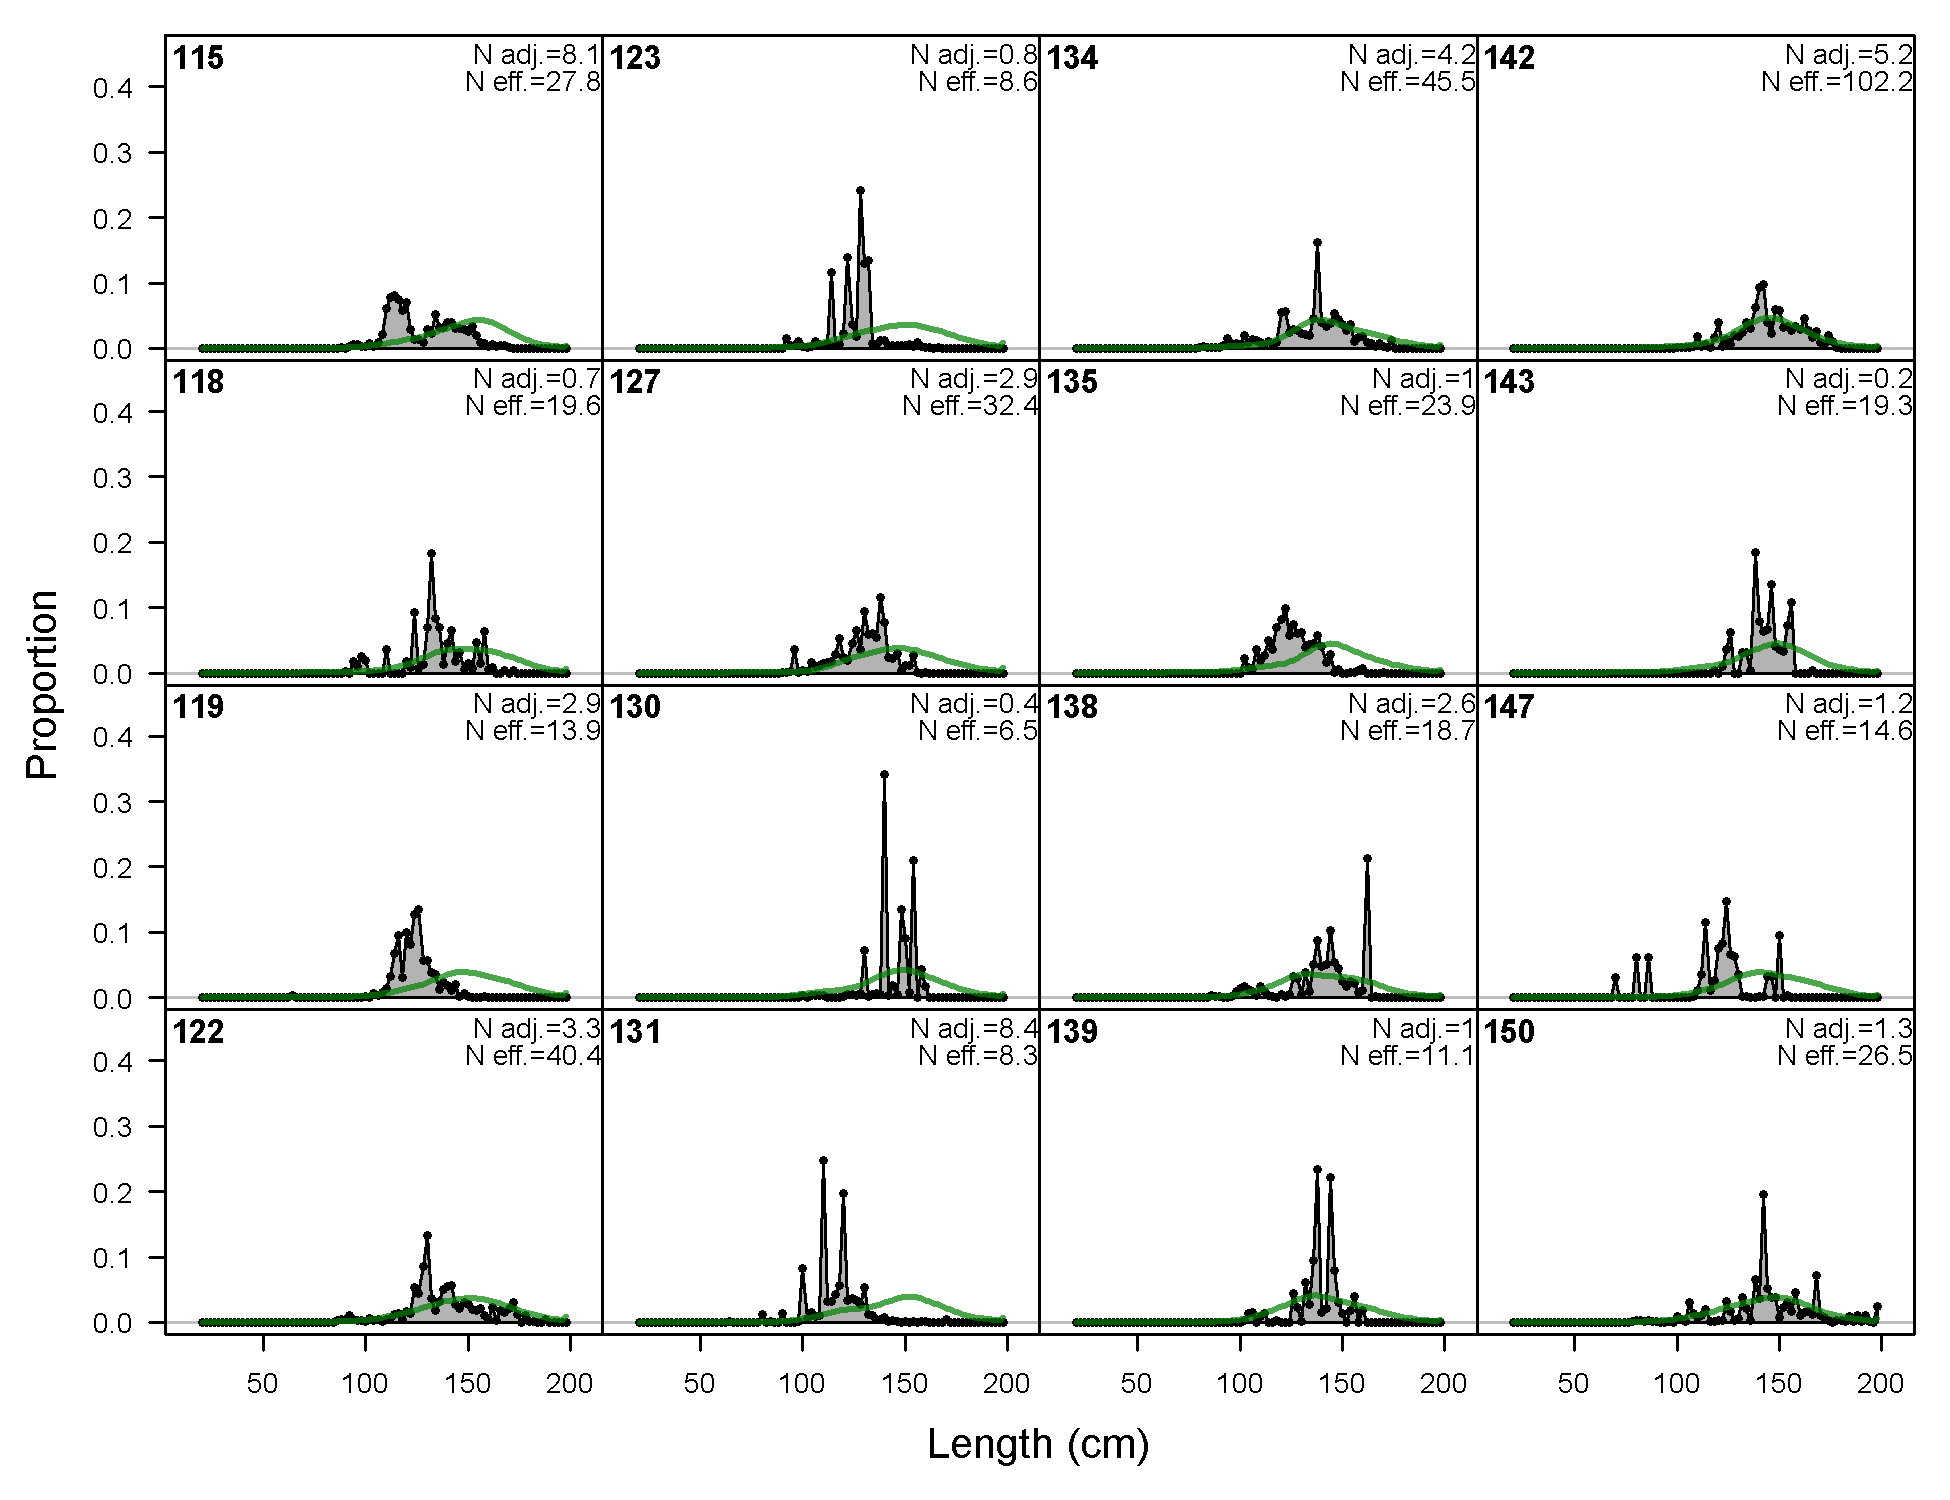
Length comps, whole catch, F29-LL_W_Q14n (plot 3 of 4)
file: comp_lenfit_flt29mkt0_page3.png
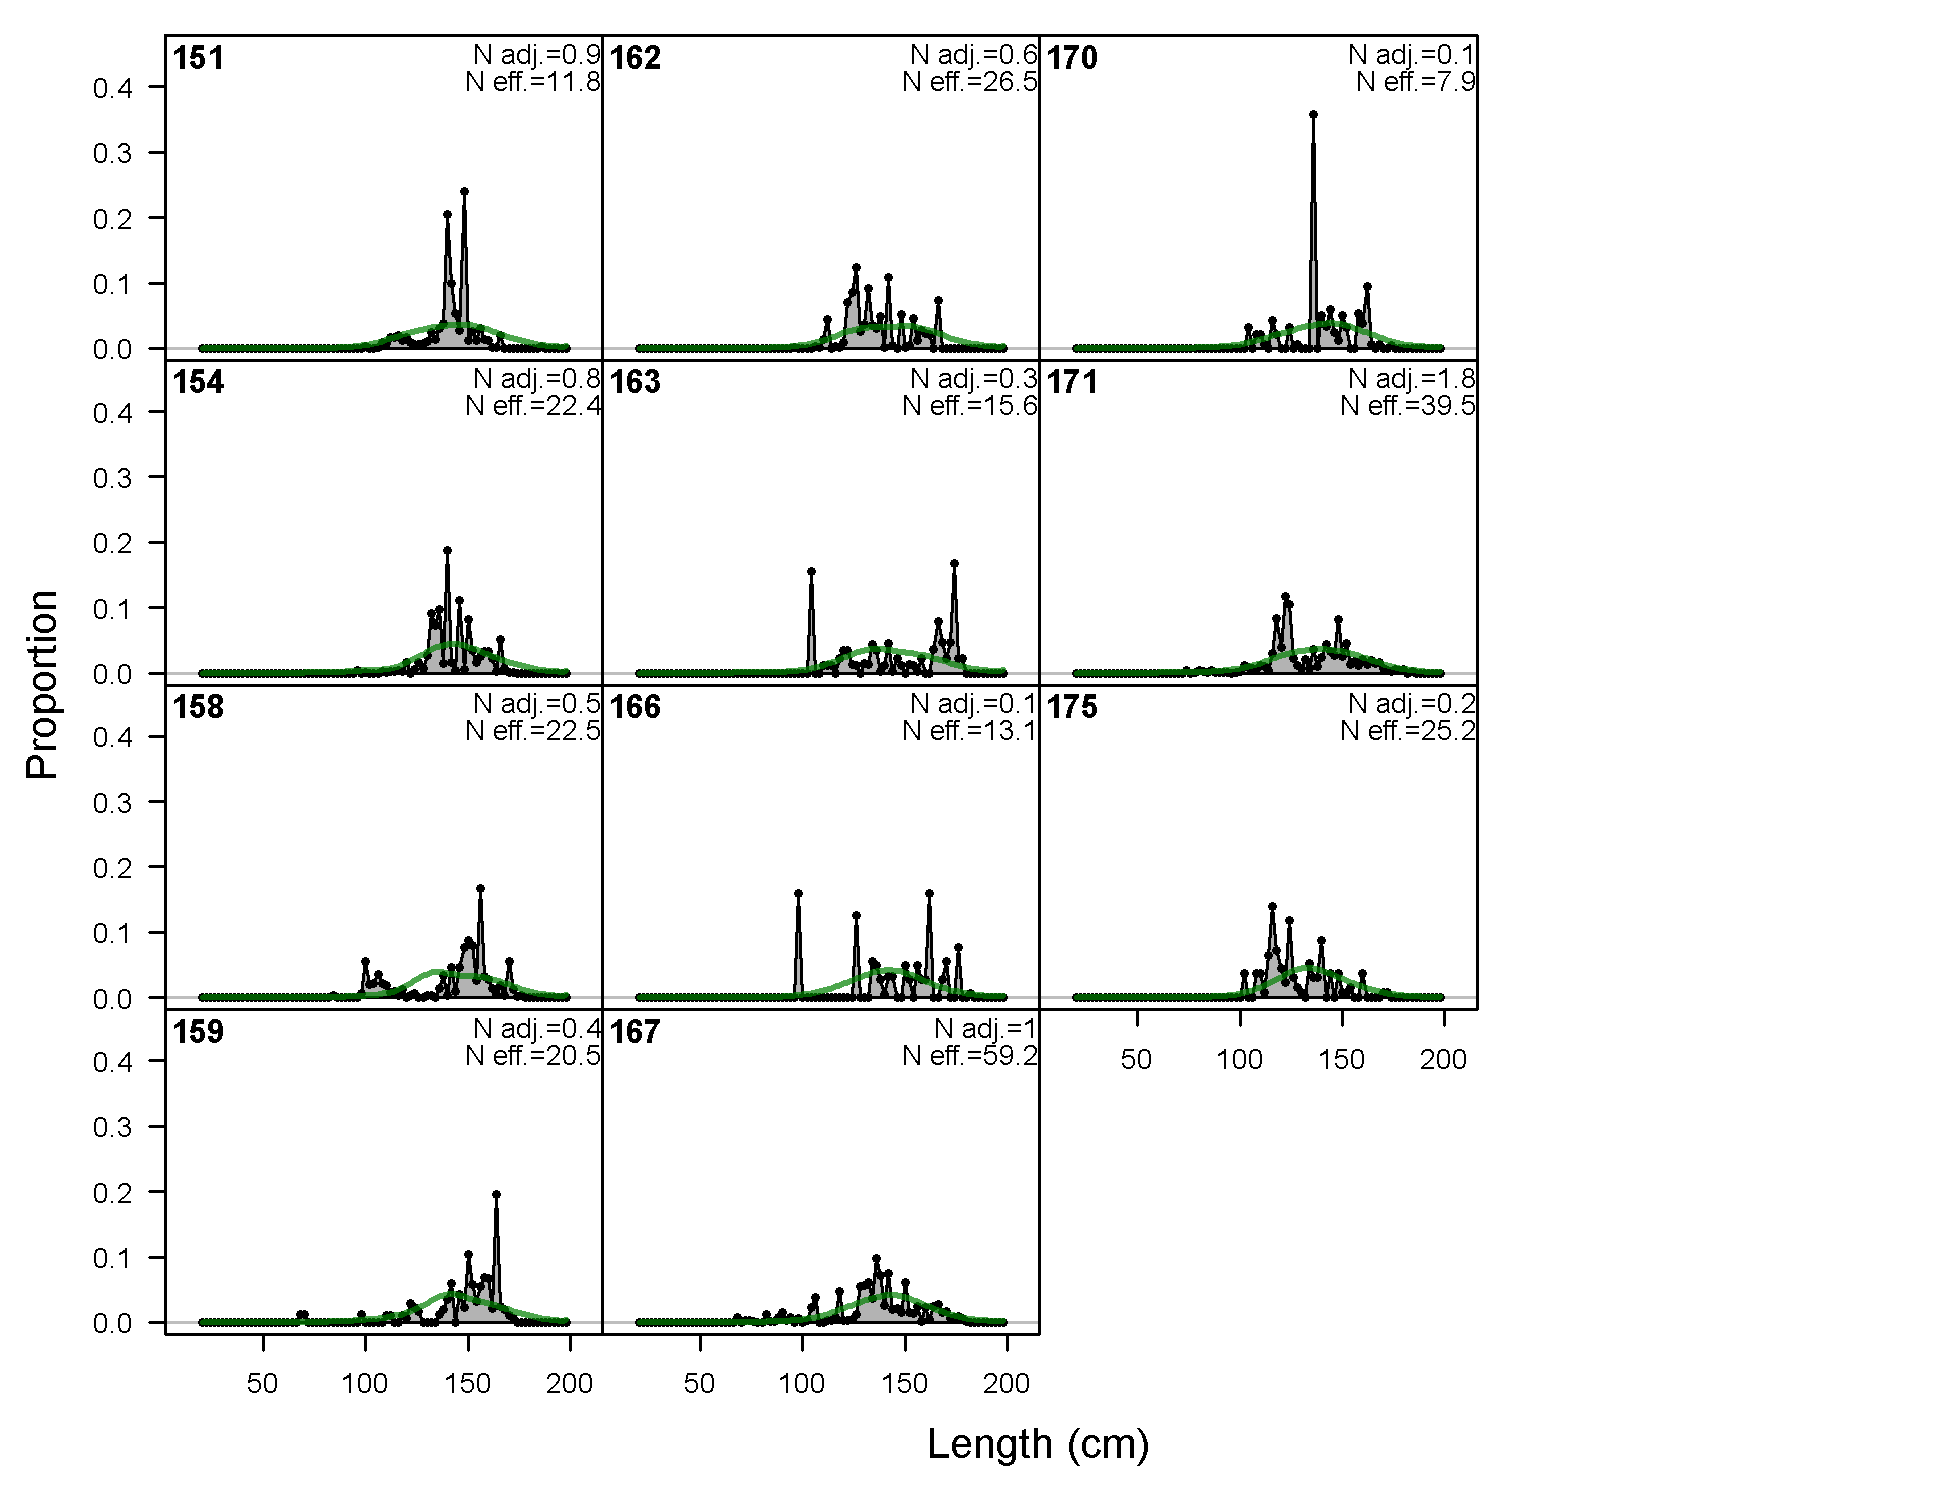
Length comps, whole catch, F29-LL_W_Q14n (plot 4 of 4)
file: comp_lenfit_flt29mkt0_page4.png
Pearson residuals, whole catch, F29-LL_W_Q14n (max=7.18) (plot 4 of 4)
Closed bubbles are positive residuals (observed > expected) and open bubbles are negative residuals (observed < expected).
file: comp_lenfit_residsflt29mkt0_page4.png
N-EffN comparison, Length comps, whole catch, F29-LL_W_Q14n
file: comp_lenfit_sampsize_flt29mkt0.png
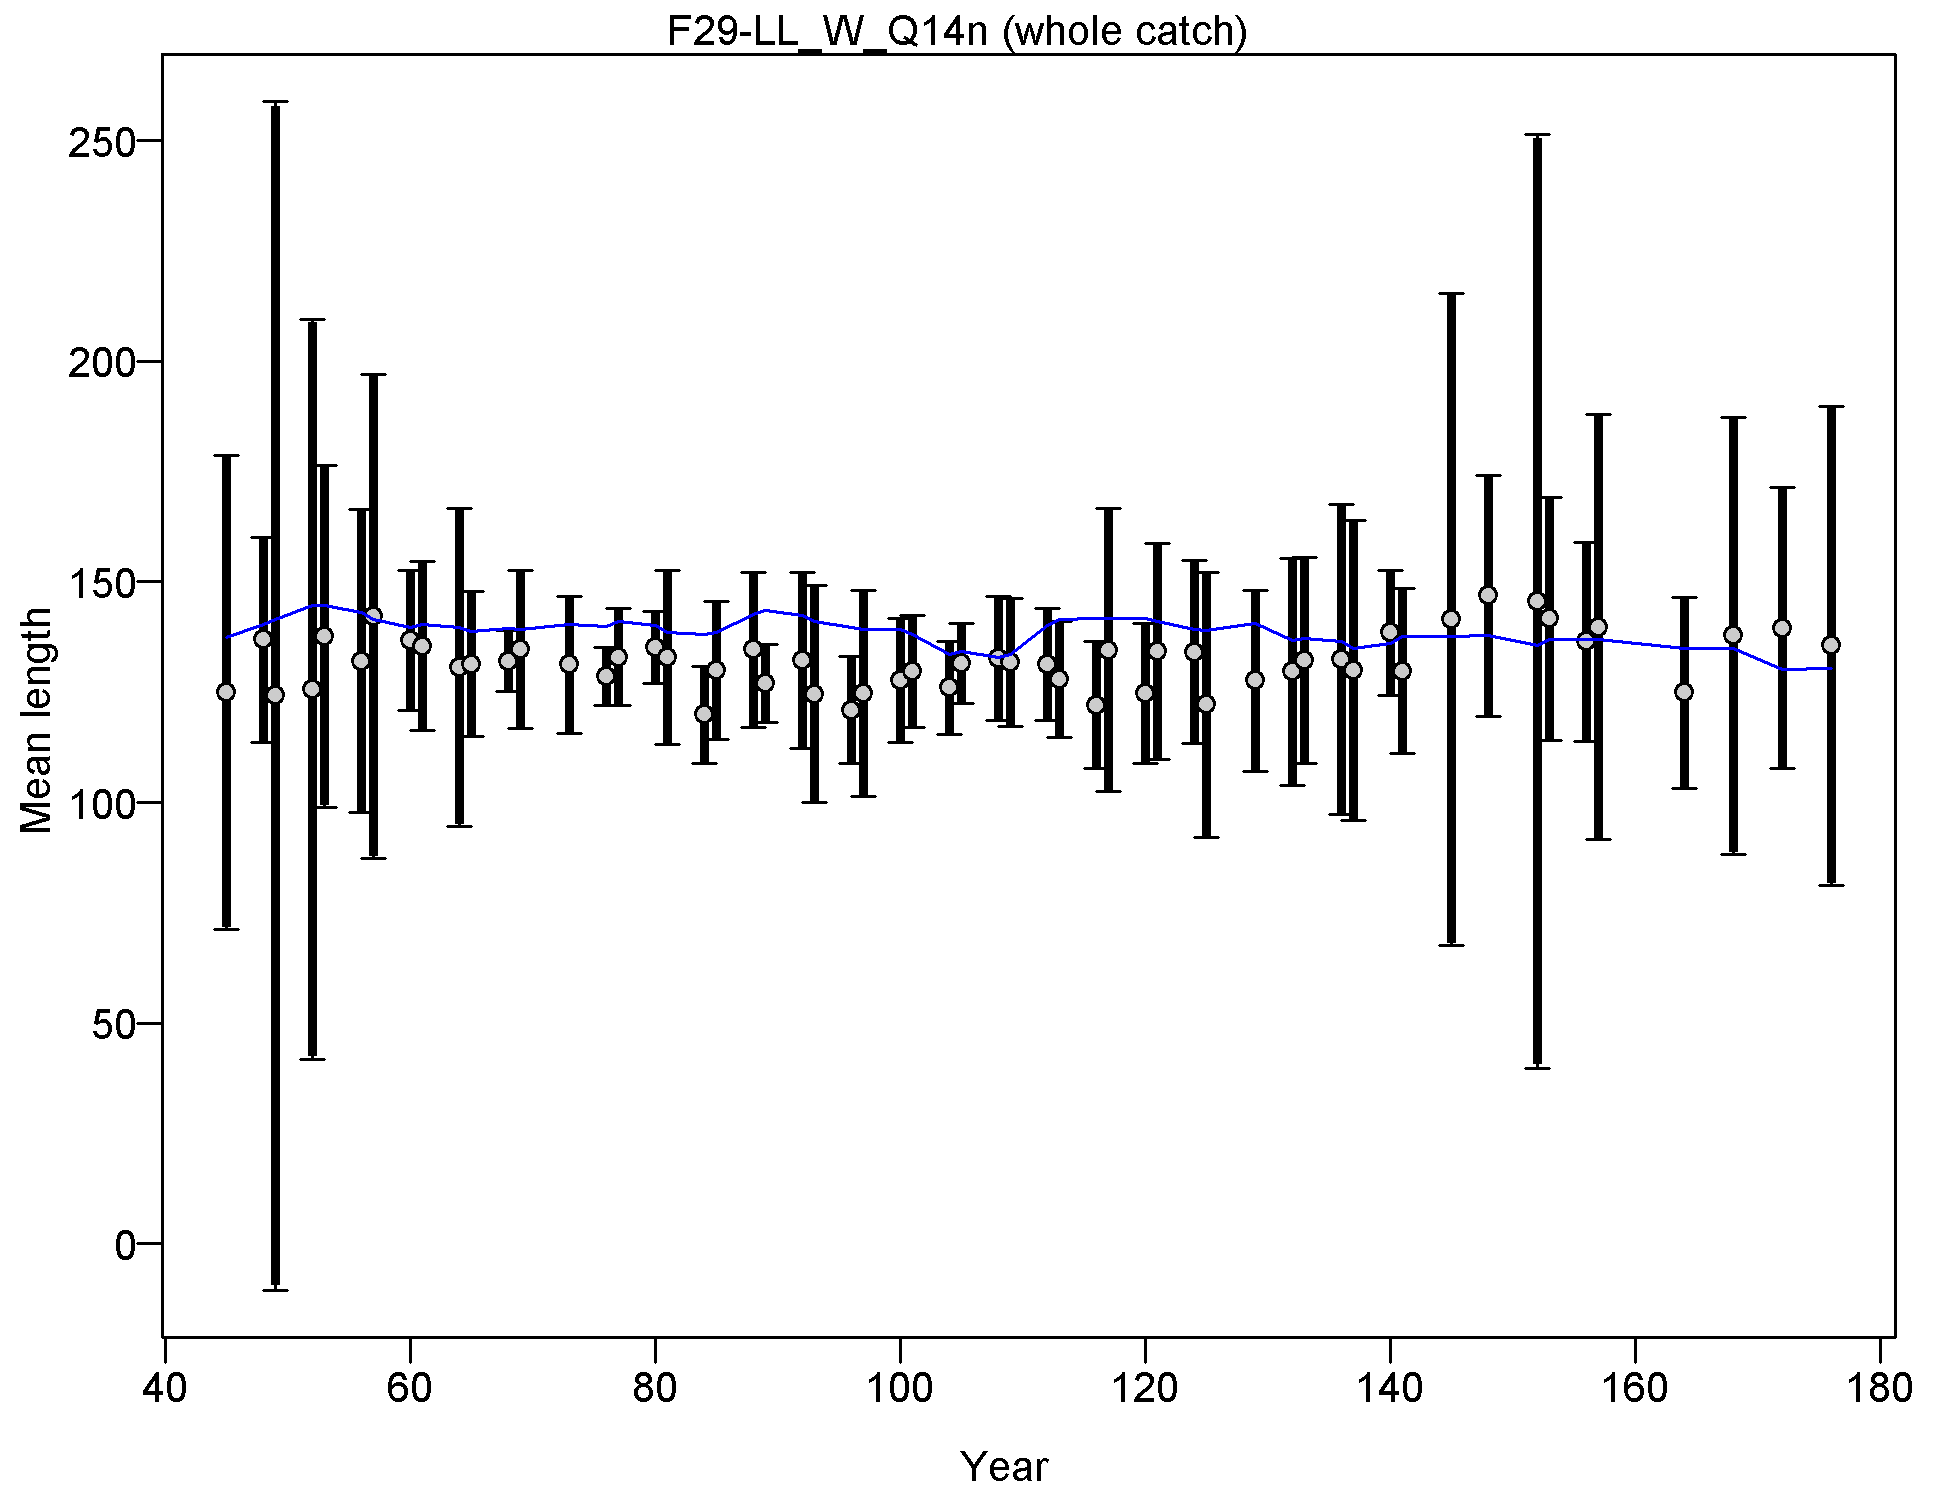
Mean length for F29-LL_W_Q14n with 95% confidence intervals based on current samples sizes.
Francis data weighting method TA1.8: thinner intervals (with capped ends) show result of further adjusting sample sizes based on suggested multiplier (with 95% interval) for len data from F29-LL_W_Q14n:
0.9845 (0.6809-1.7808)
For more info, see
Francis, R.I.C.C. (2011). Data weighting in statistical fisheries stock assessment models. Can. J. Fish. Aquat. Sci. 68: 1124-1138. https://doi.org/10.1139/f2011-025
file: comp_lenfit_data_weighting_TA1.8_F29-LL_W_Q14n.png
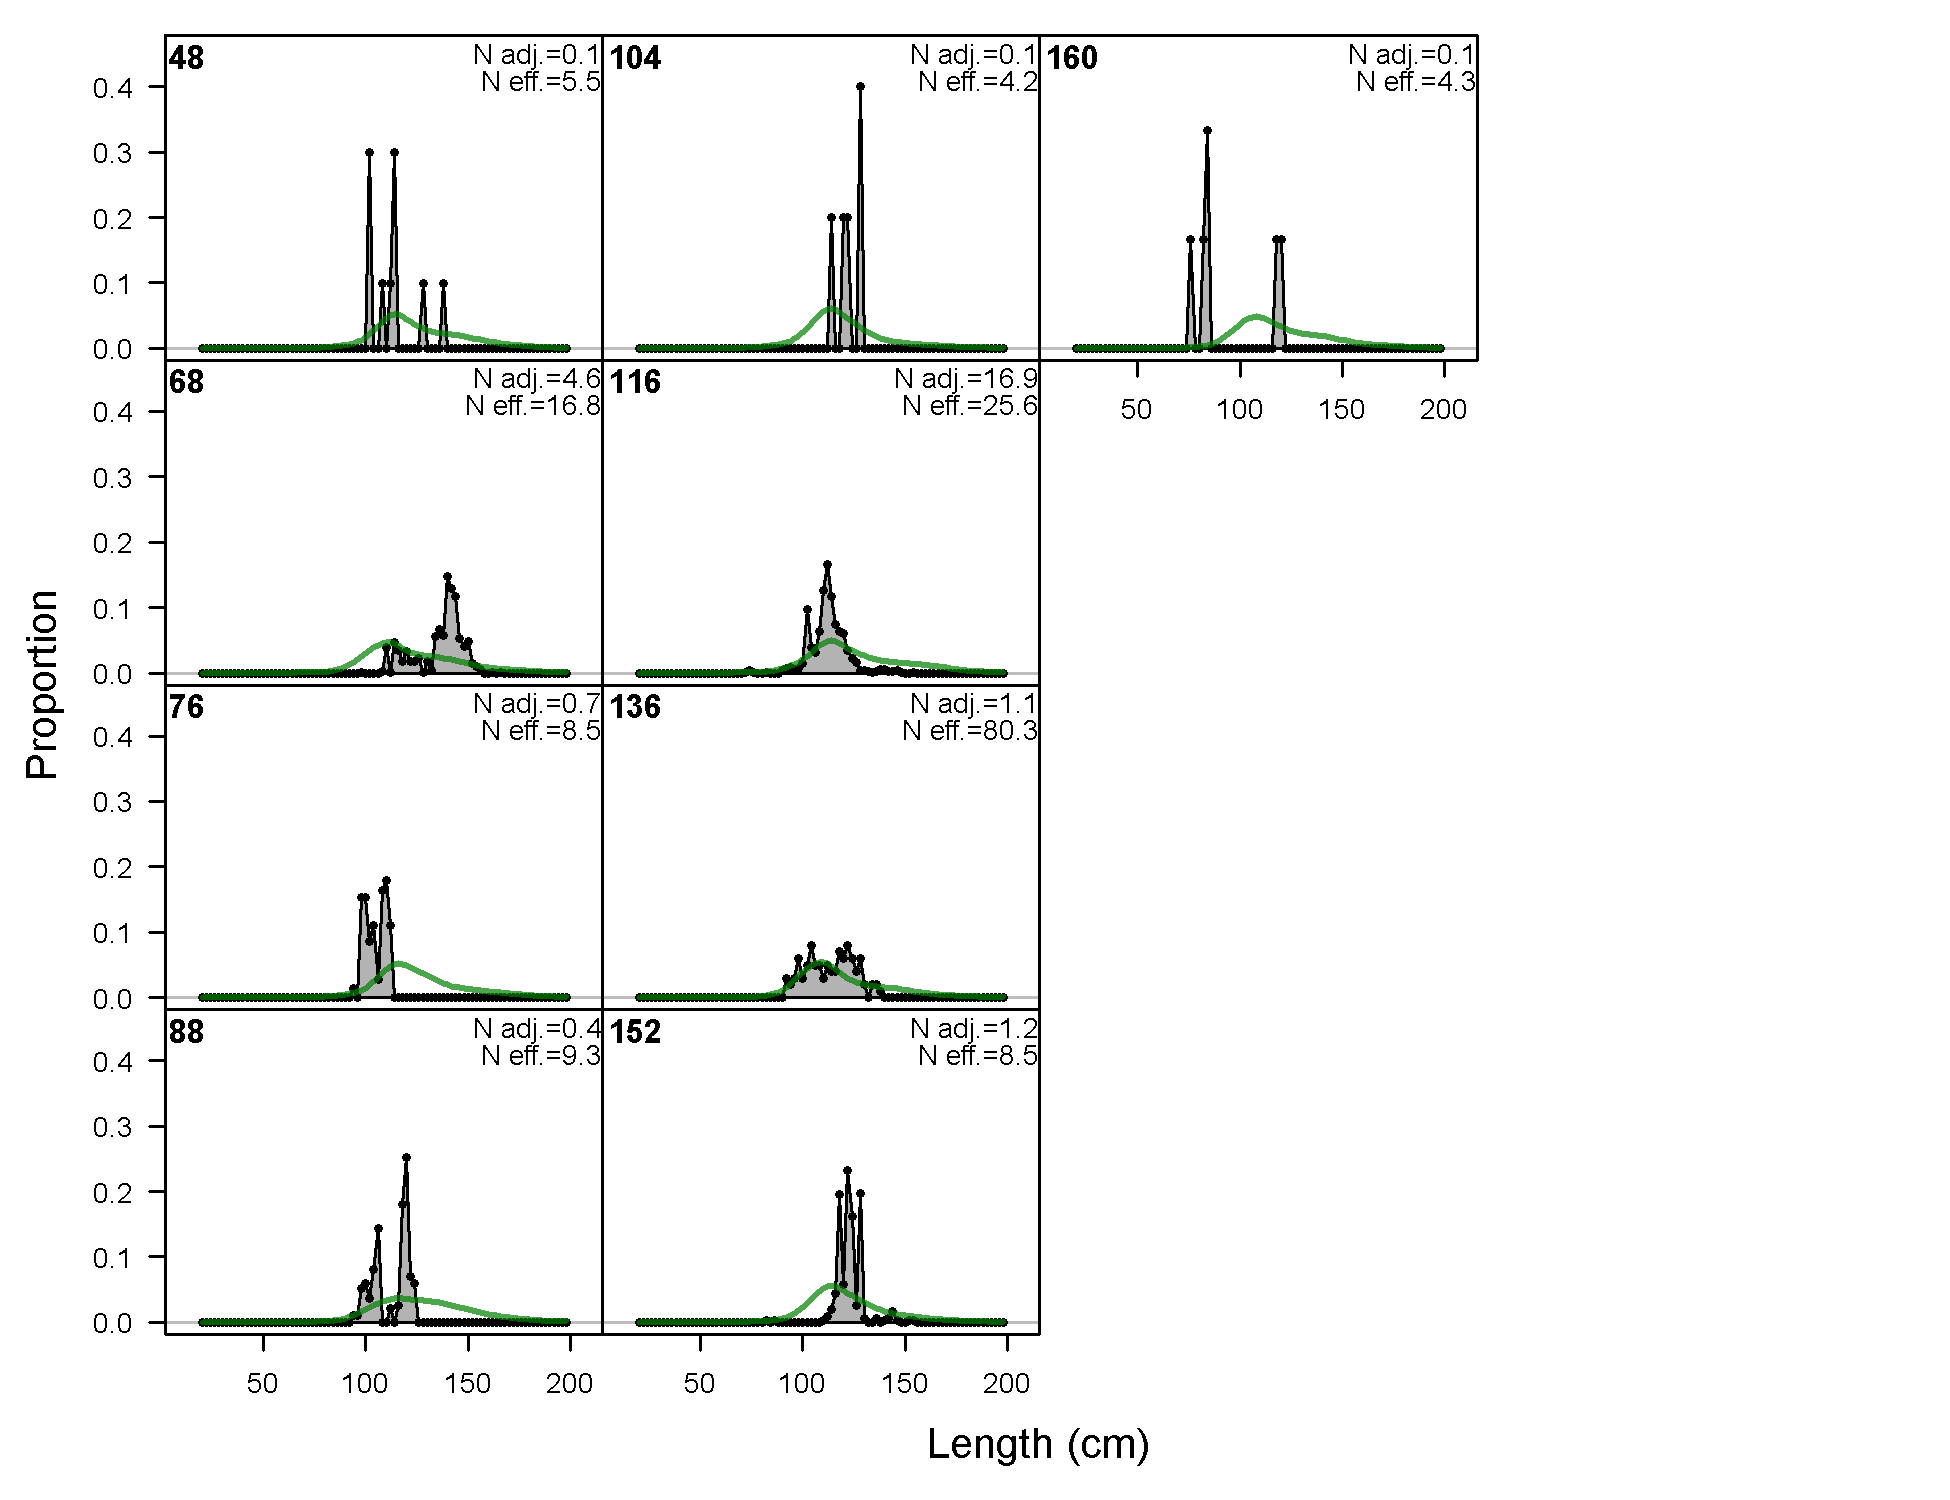
Length comps, whole catch, F30-LL_C_Q14n (plot 1 of 4).
'N adj.' is the input sample size after data-weighting adjustment. N eff. is the calculated effective sample size used in the McAllister-Iannelli tuning method.
file: comp_lenfit_flt30mkt0_page1.png
Length comps, whole catch, F30-LL_C_Q14n (plot 2 of 4)
file: comp_lenfit_flt30mkt0_page2.png
Length comps, whole catch, F30-LL_C_Q14n (plot 3 of 4)
file: comp_lenfit_flt30mkt0_page3.png

Length comps, whole catch, F30-LL_C_Q14n (plot 4 of 4)
file: comp_lenfit_flt30mkt0_page4.png

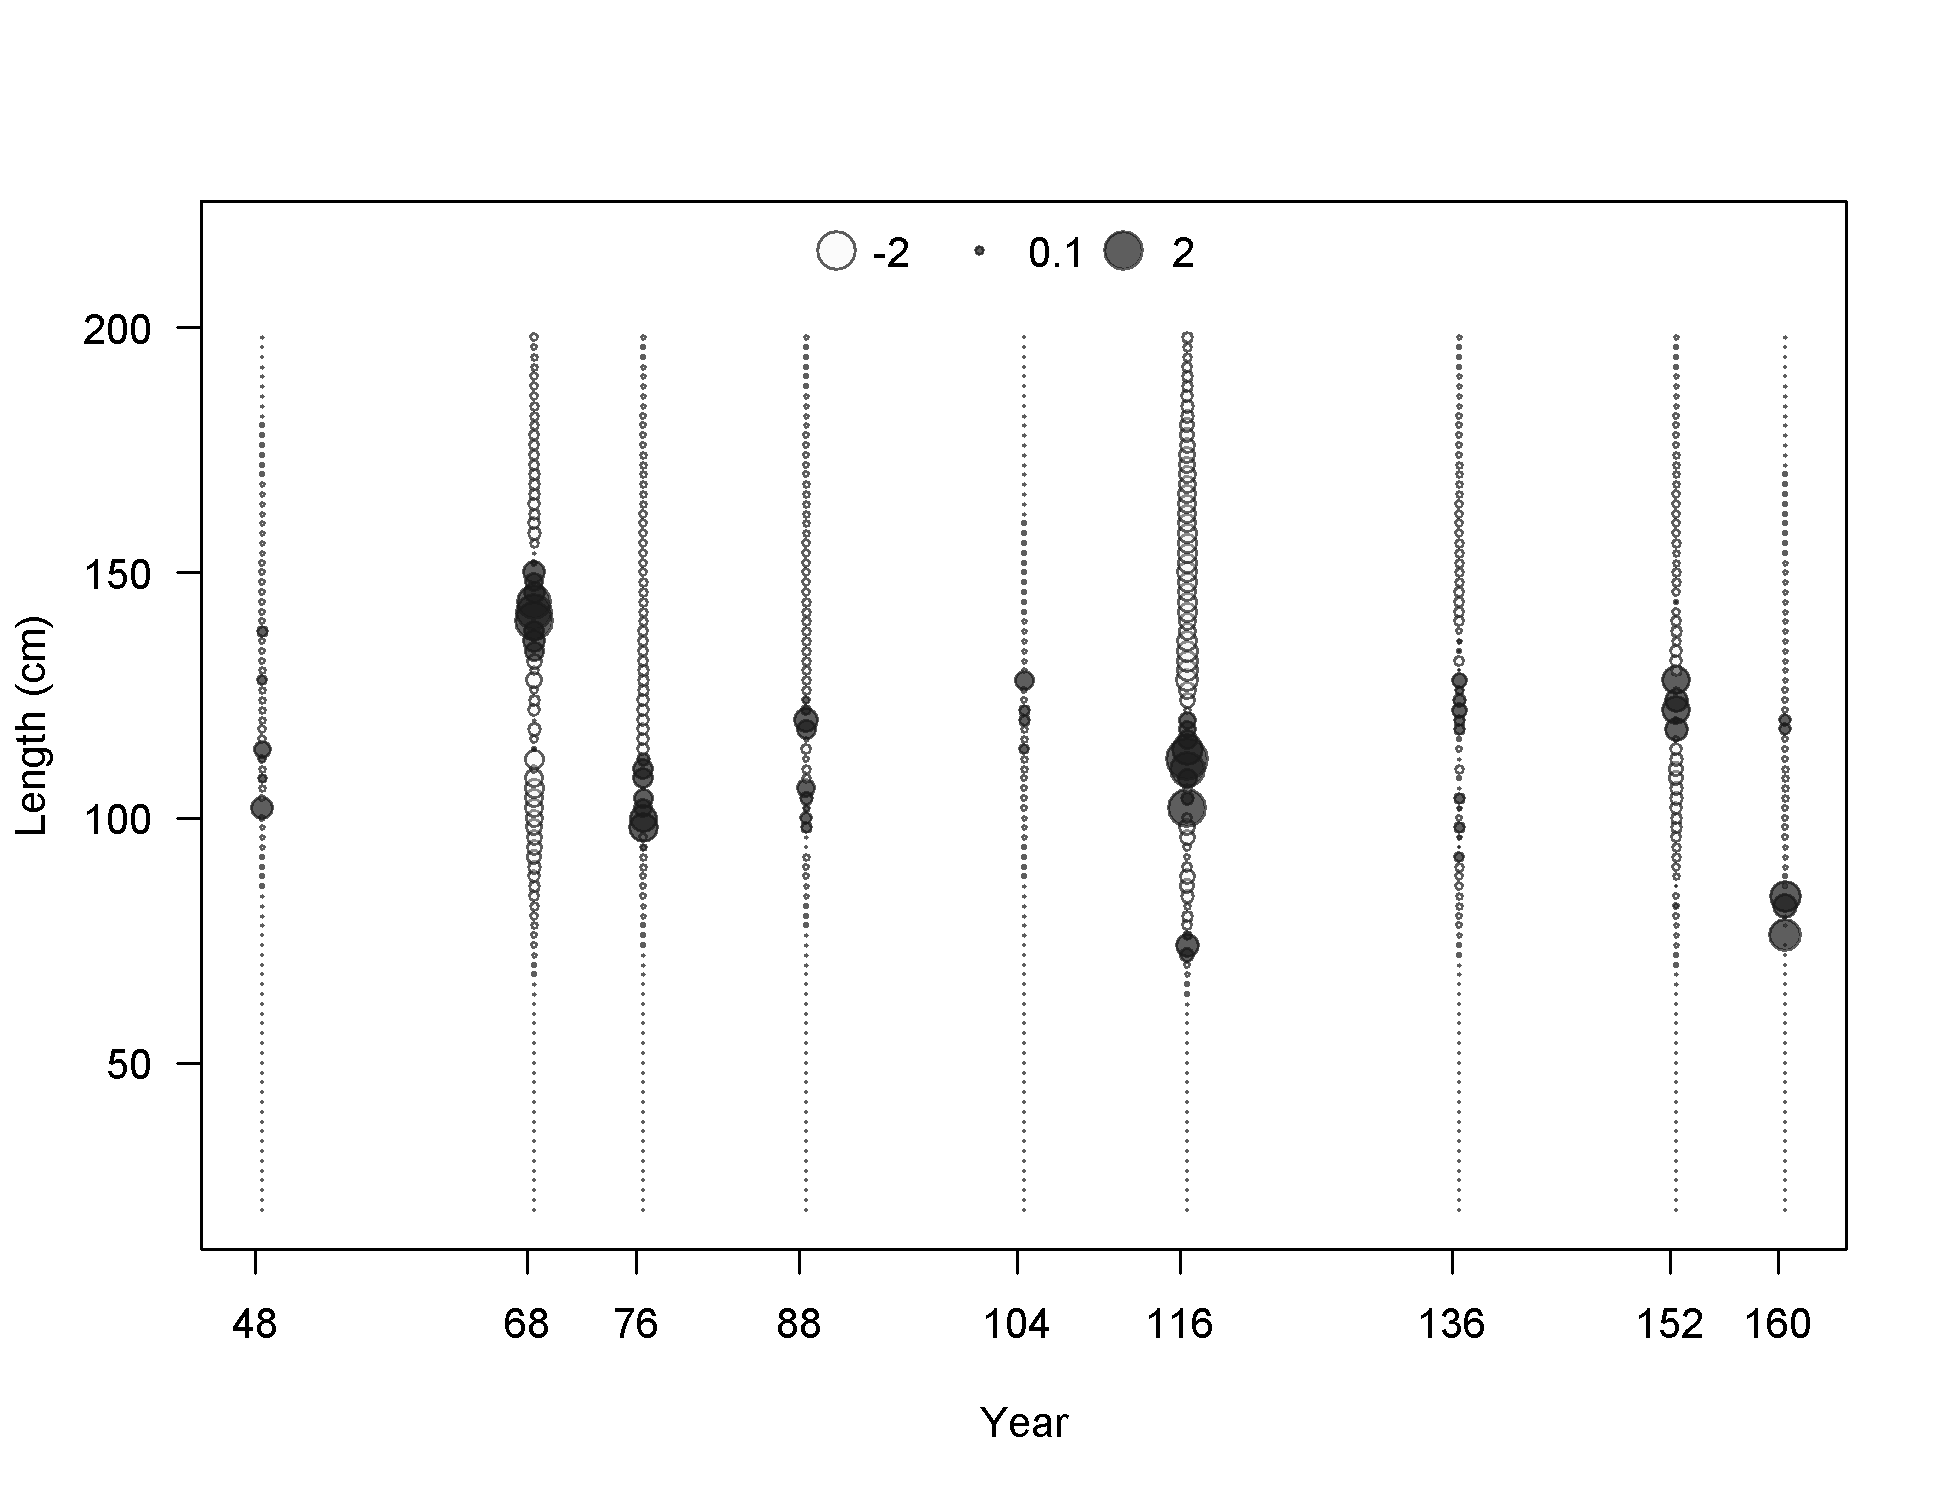
Pearson residuals, whole catch, F30-LL_C_Q14n (max=23.63) (plot 4 of 4)
Closed bubbles are positive residuals (observed > expected) and open bubbles are negative residuals (observed < expected).
file: comp_lenfit_residsflt30mkt0_page4.png
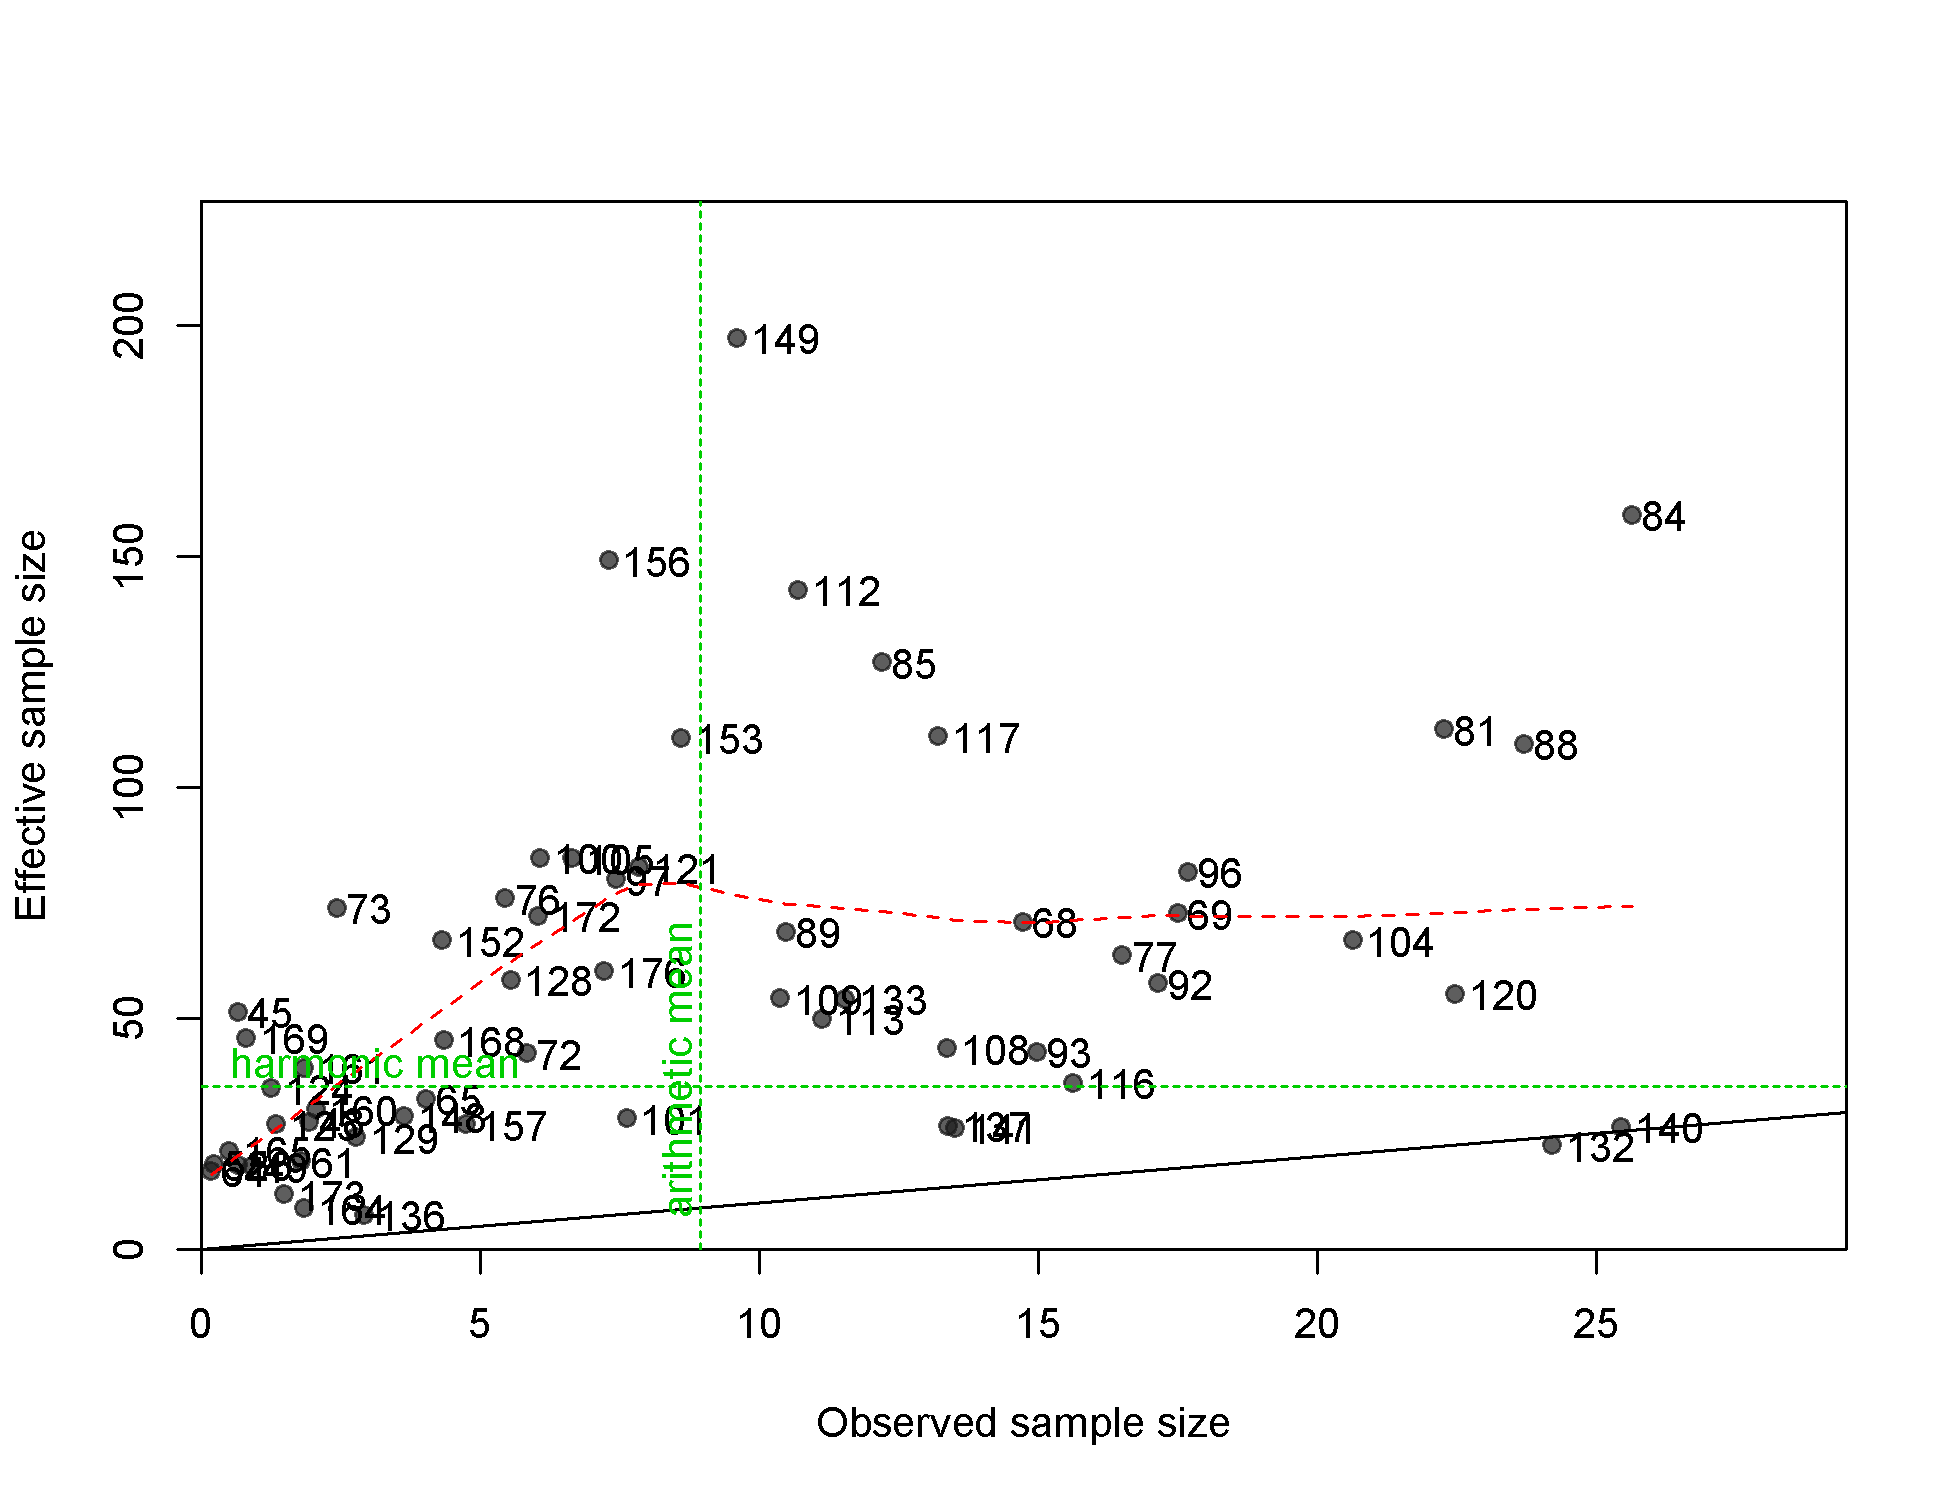
N-EffN comparison, Length comps, whole catch, F30-LL_C_Q14n
file: comp_lenfit_sampsize_flt30mkt0.png
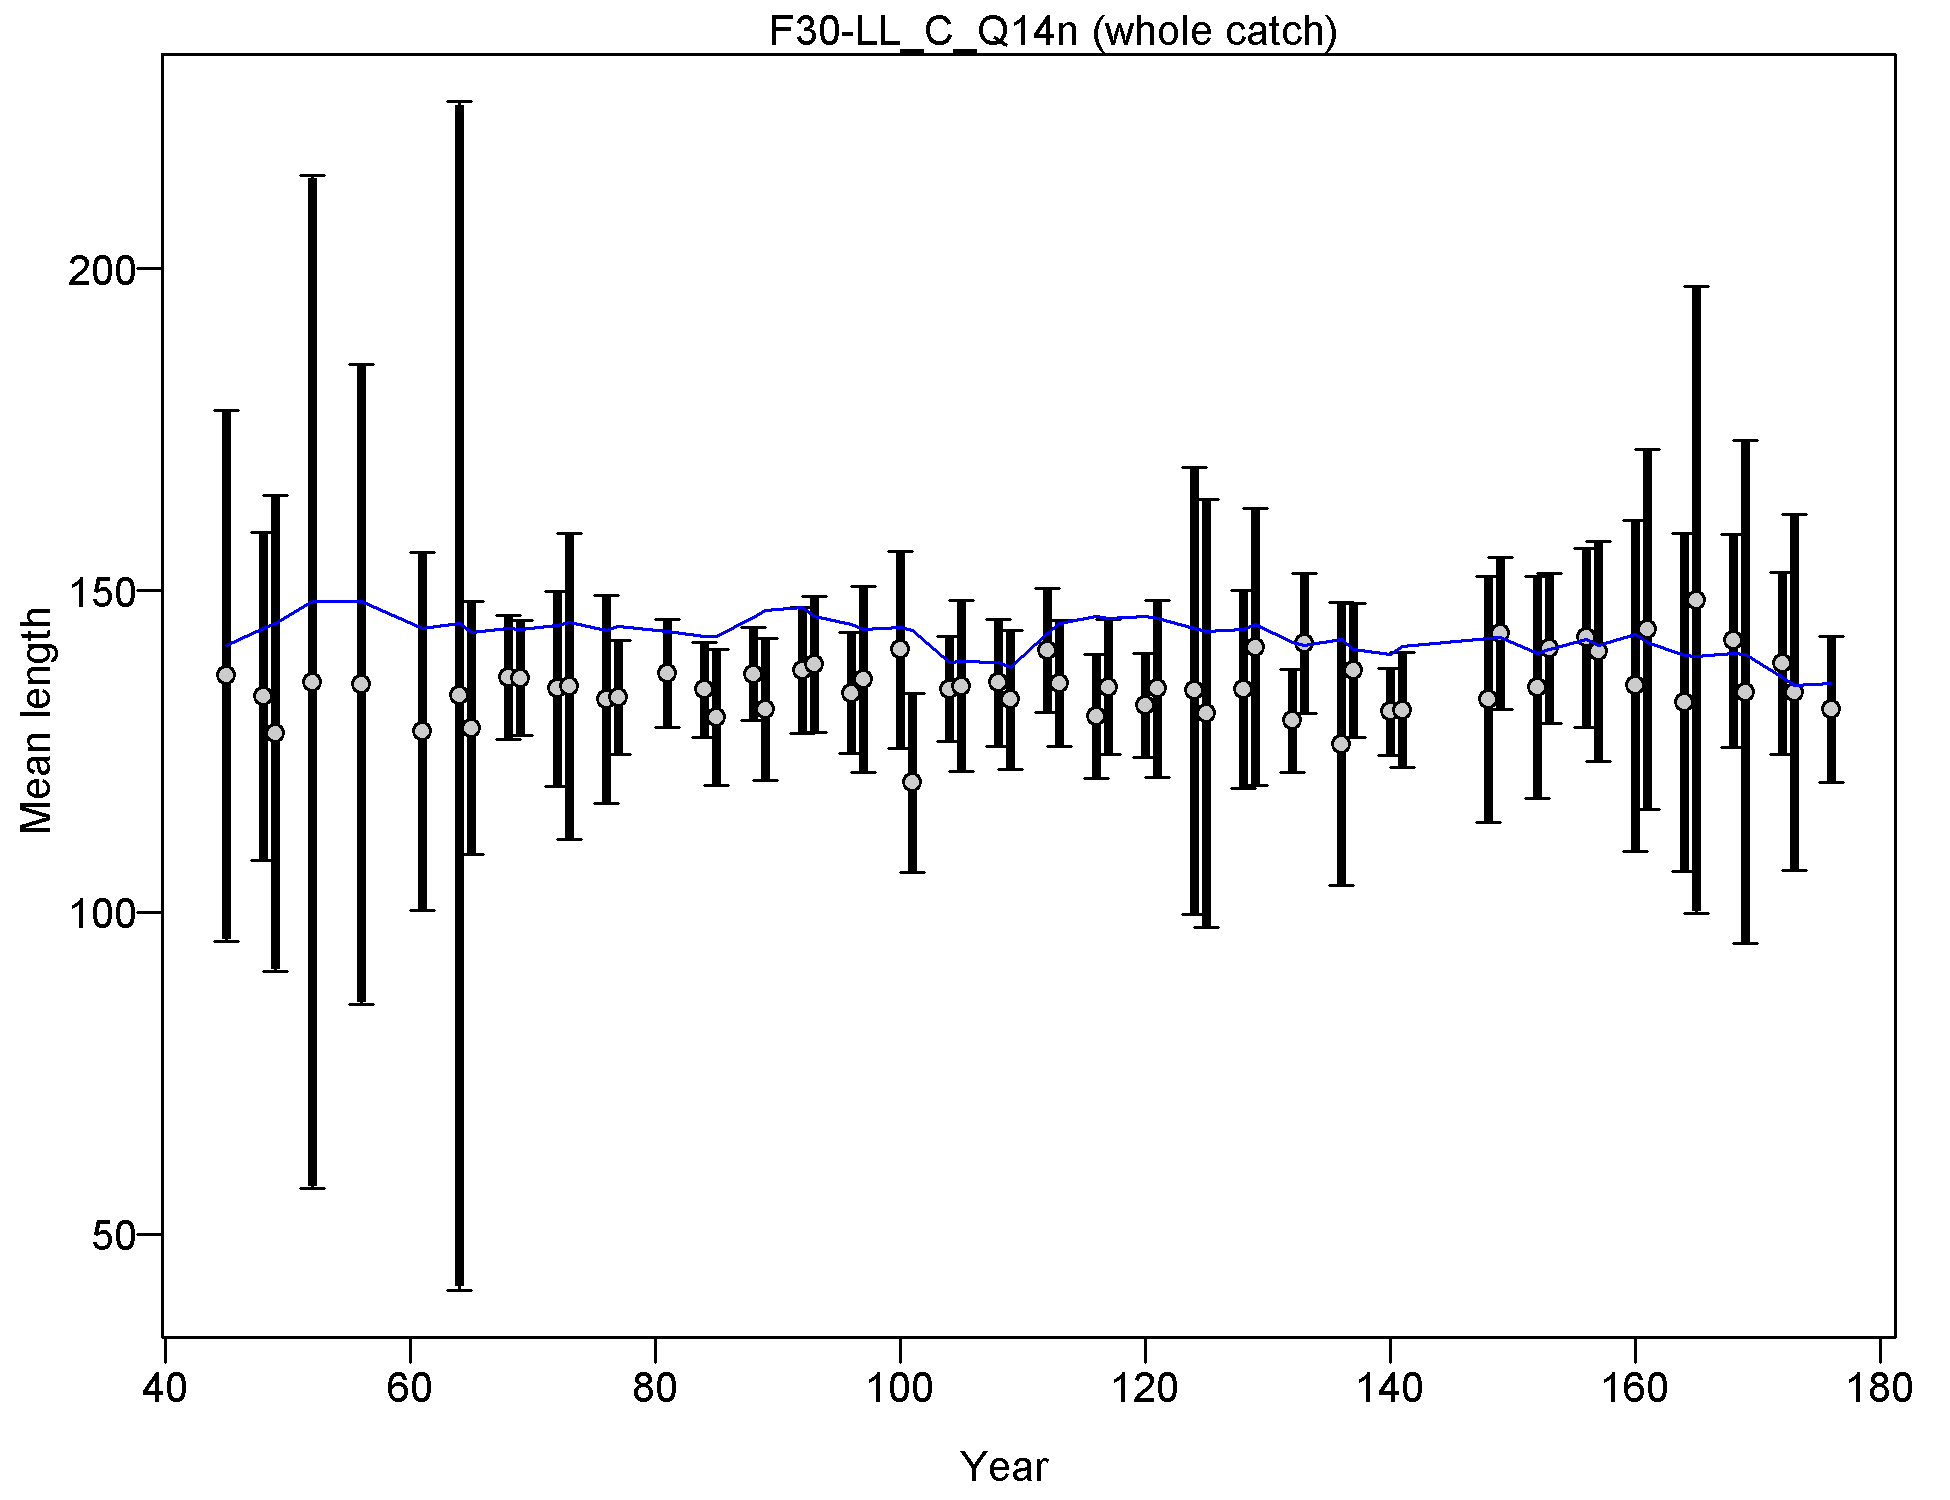
Mean length for F30-LL_C_Q14n with 95% confidence intervals based on current samples sizes.
Francis data weighting method TA1.8: thinner intervals (with capped ends) show result of further adjusting sample sizes based on suggested multiplier (with 95% interval) for len data from F30-LL_C_Q14n:
0.9884 (0.7566-1.4225)
For more info, see
Francis, R.I.C.C. (2011). Data weighting in statistical fisheries stock assessment models. Can. J. Fish. Aquat. Sci. 68: 1124-1138. https://doi.org/10.1139/f2011-025
file: comp_lenfit_data_weighting_TA1.8_F30-LL_C_Q14n.png
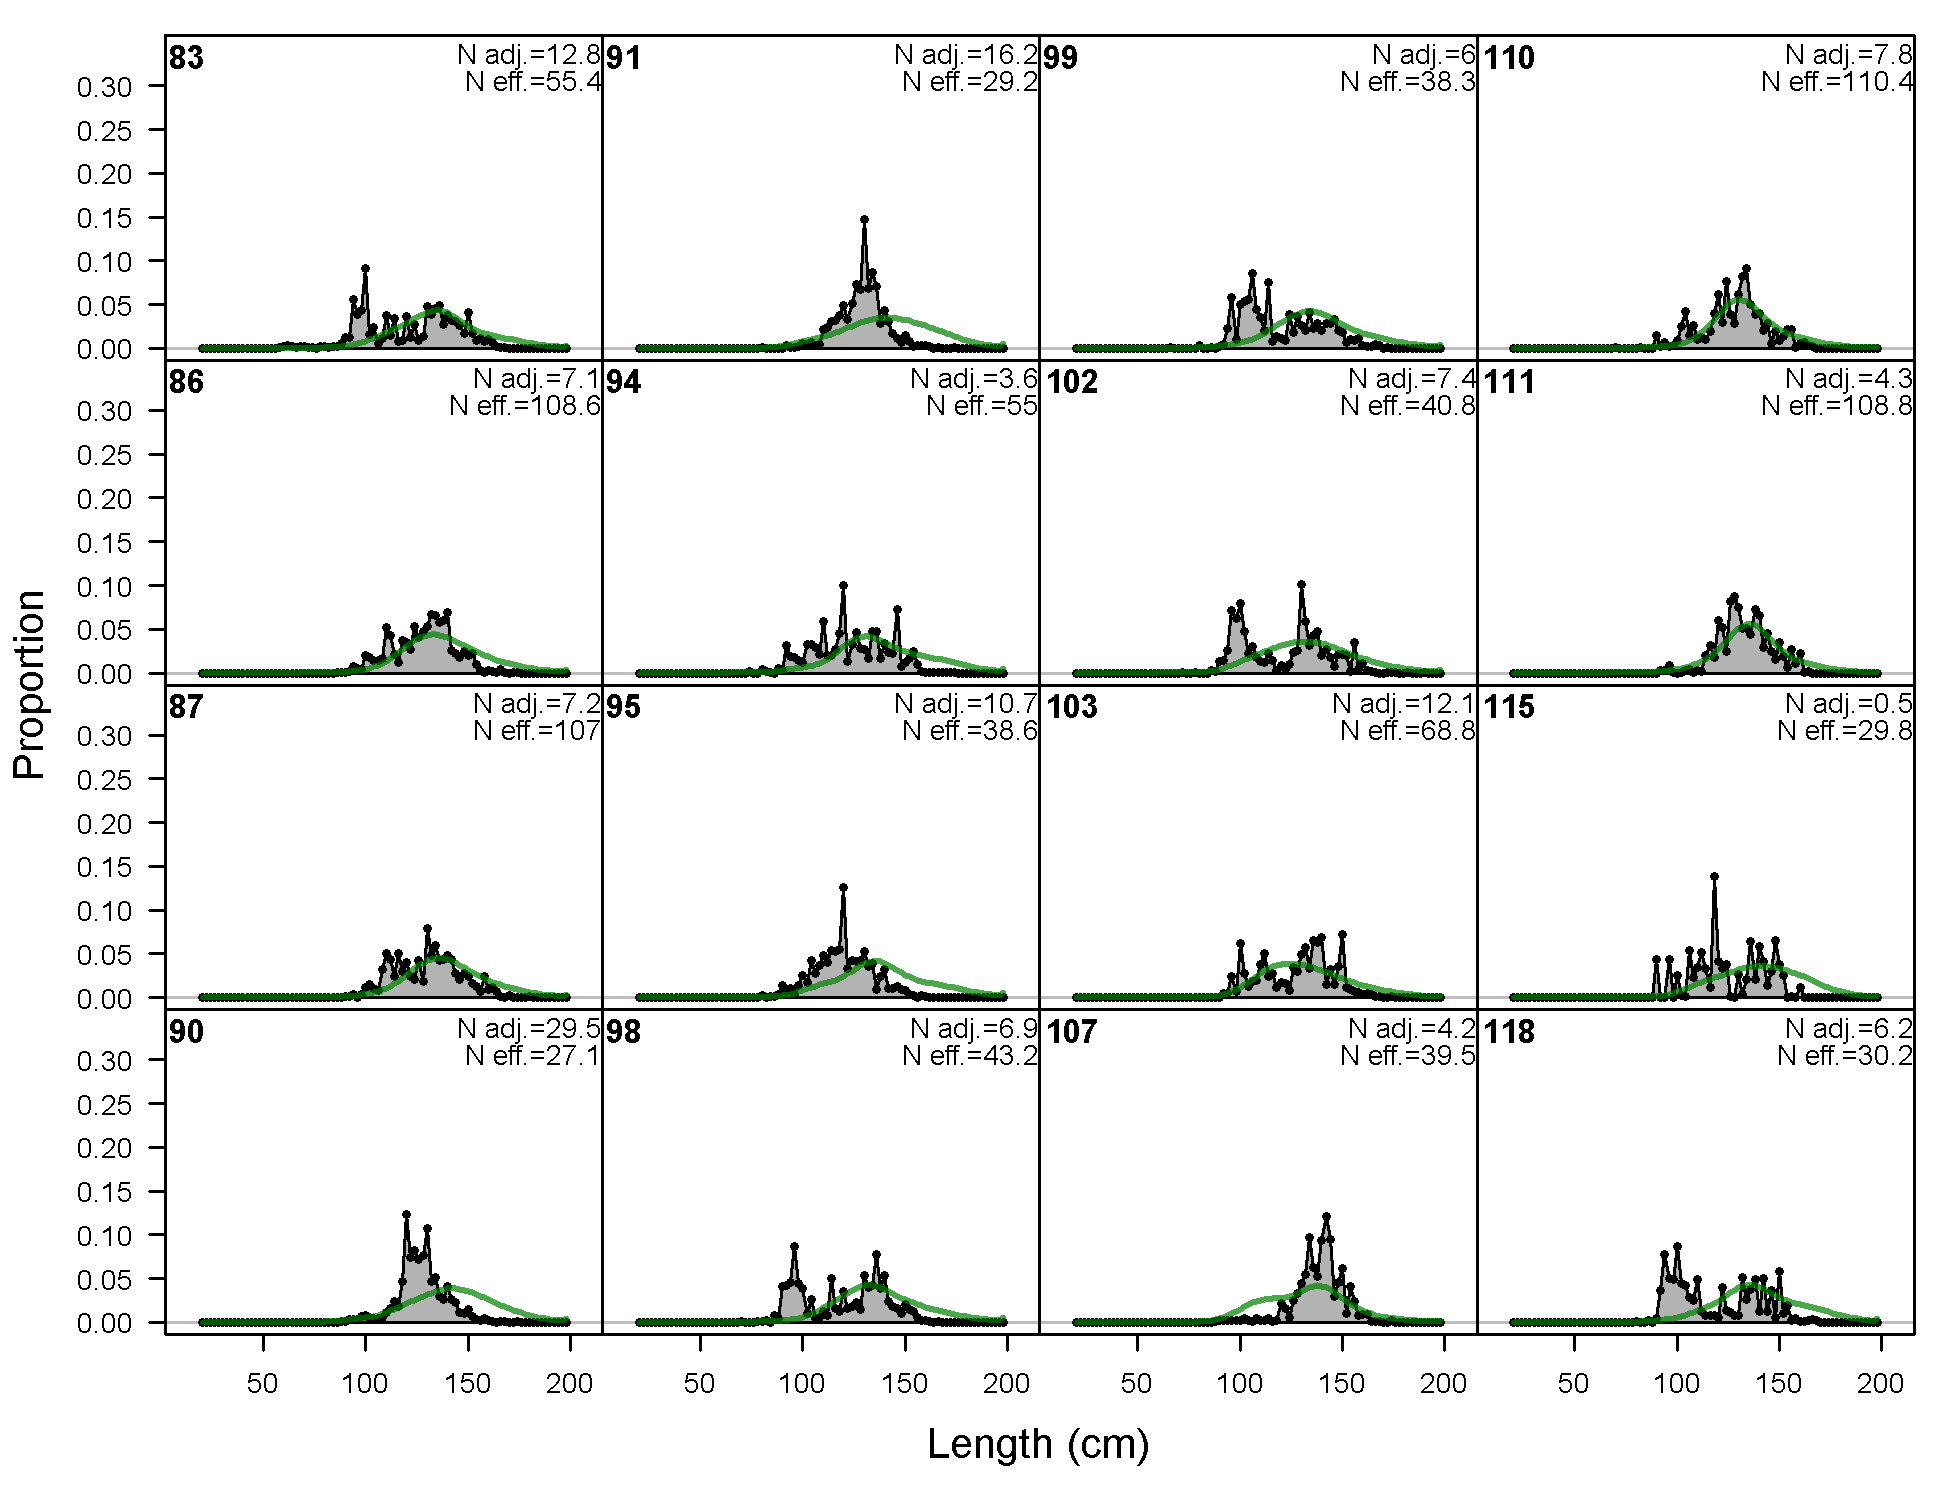
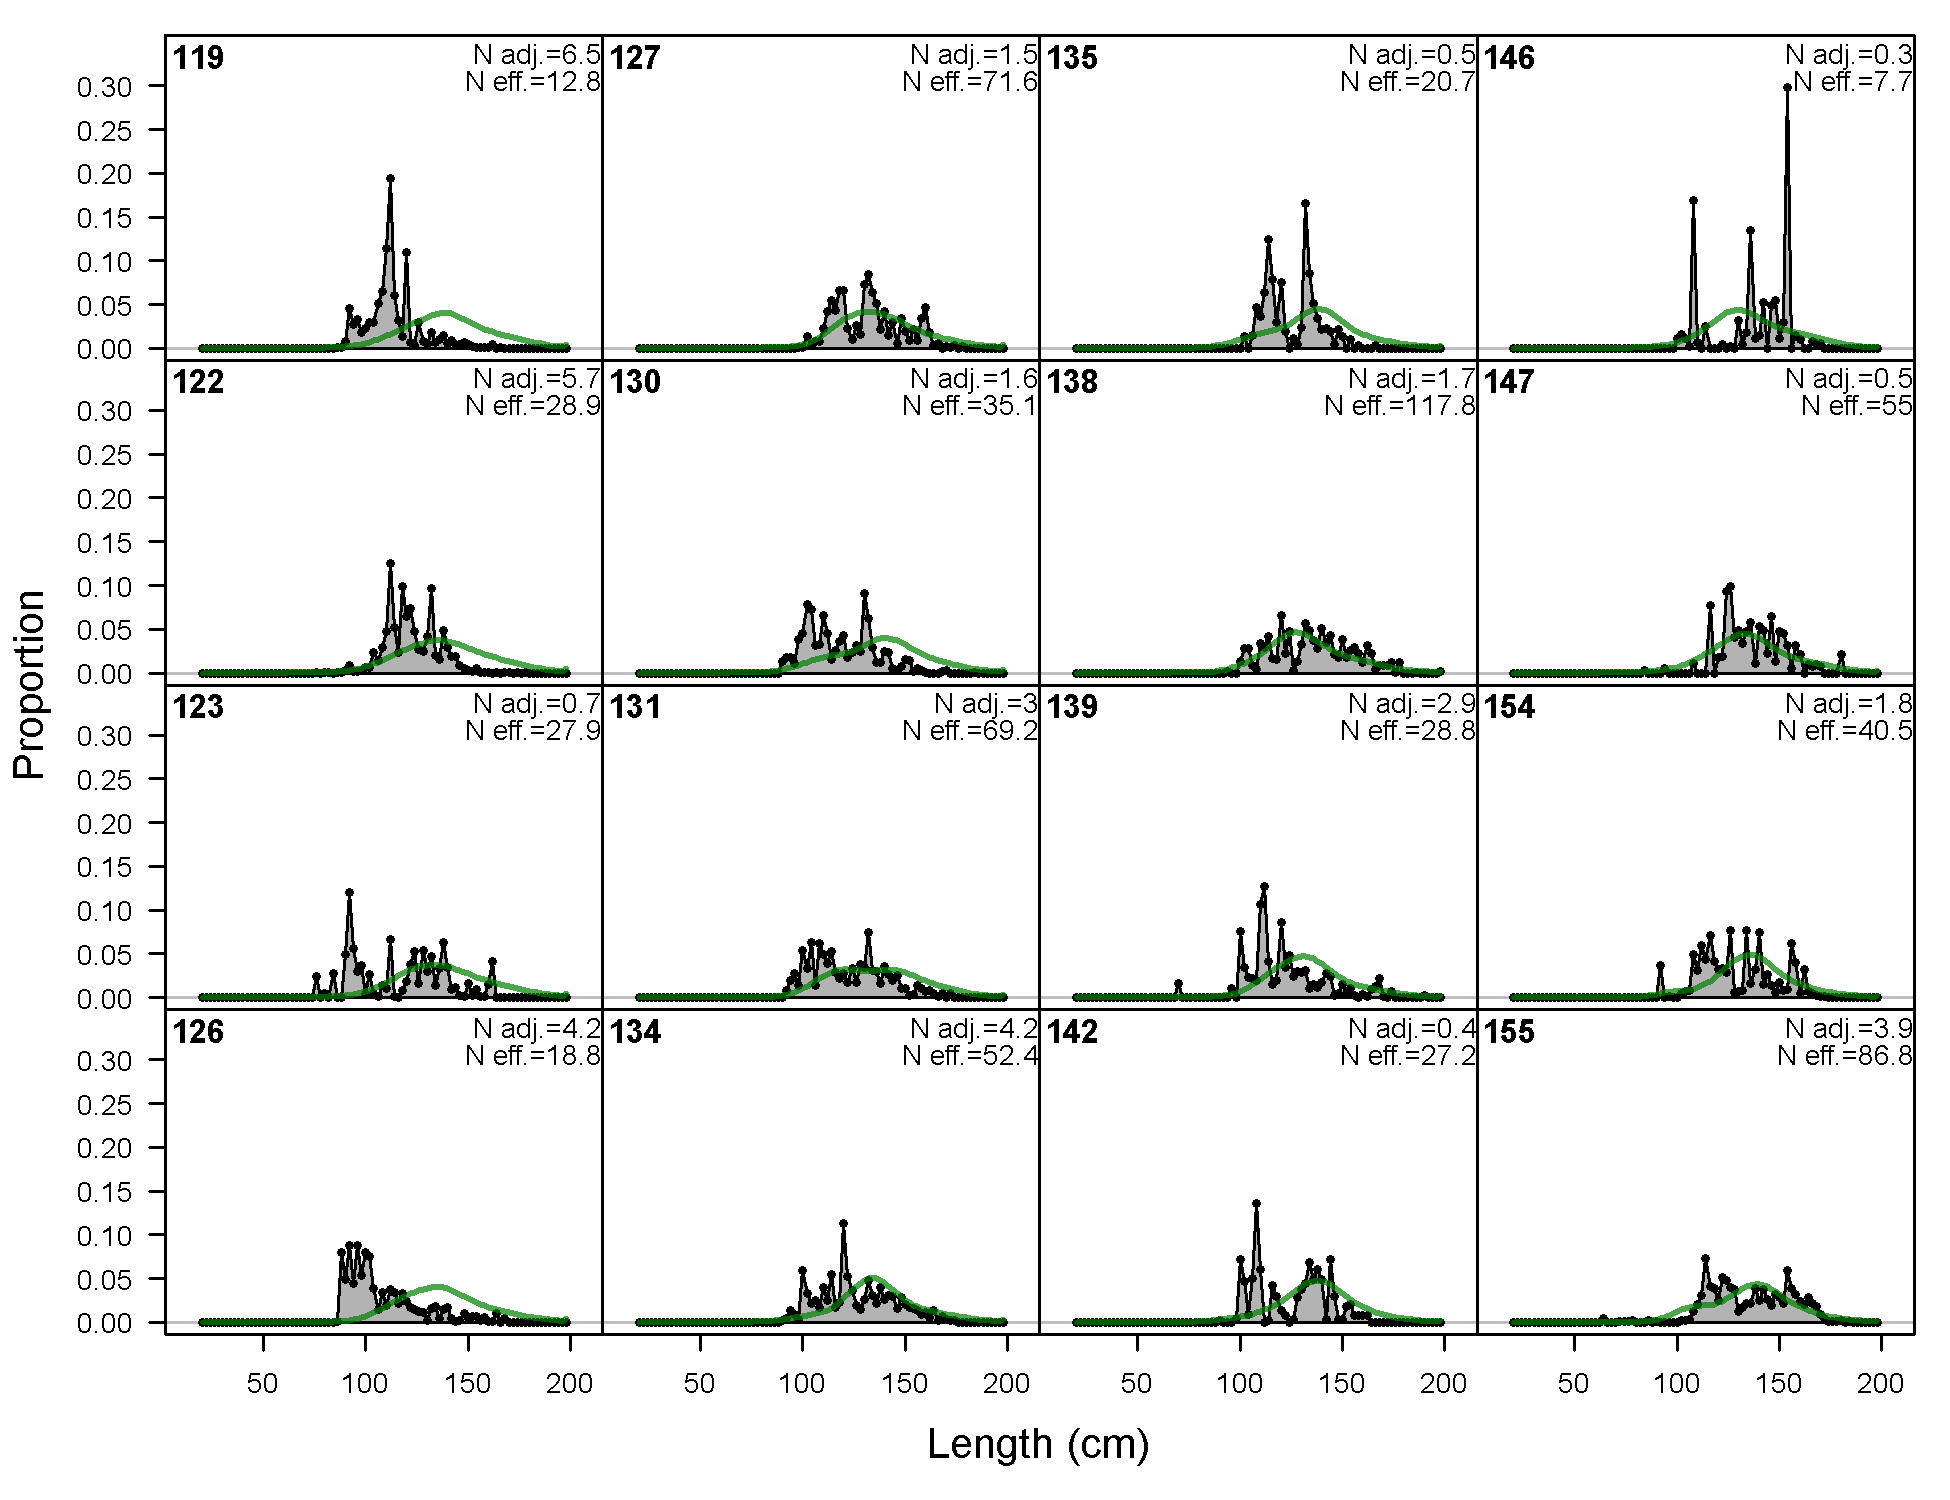
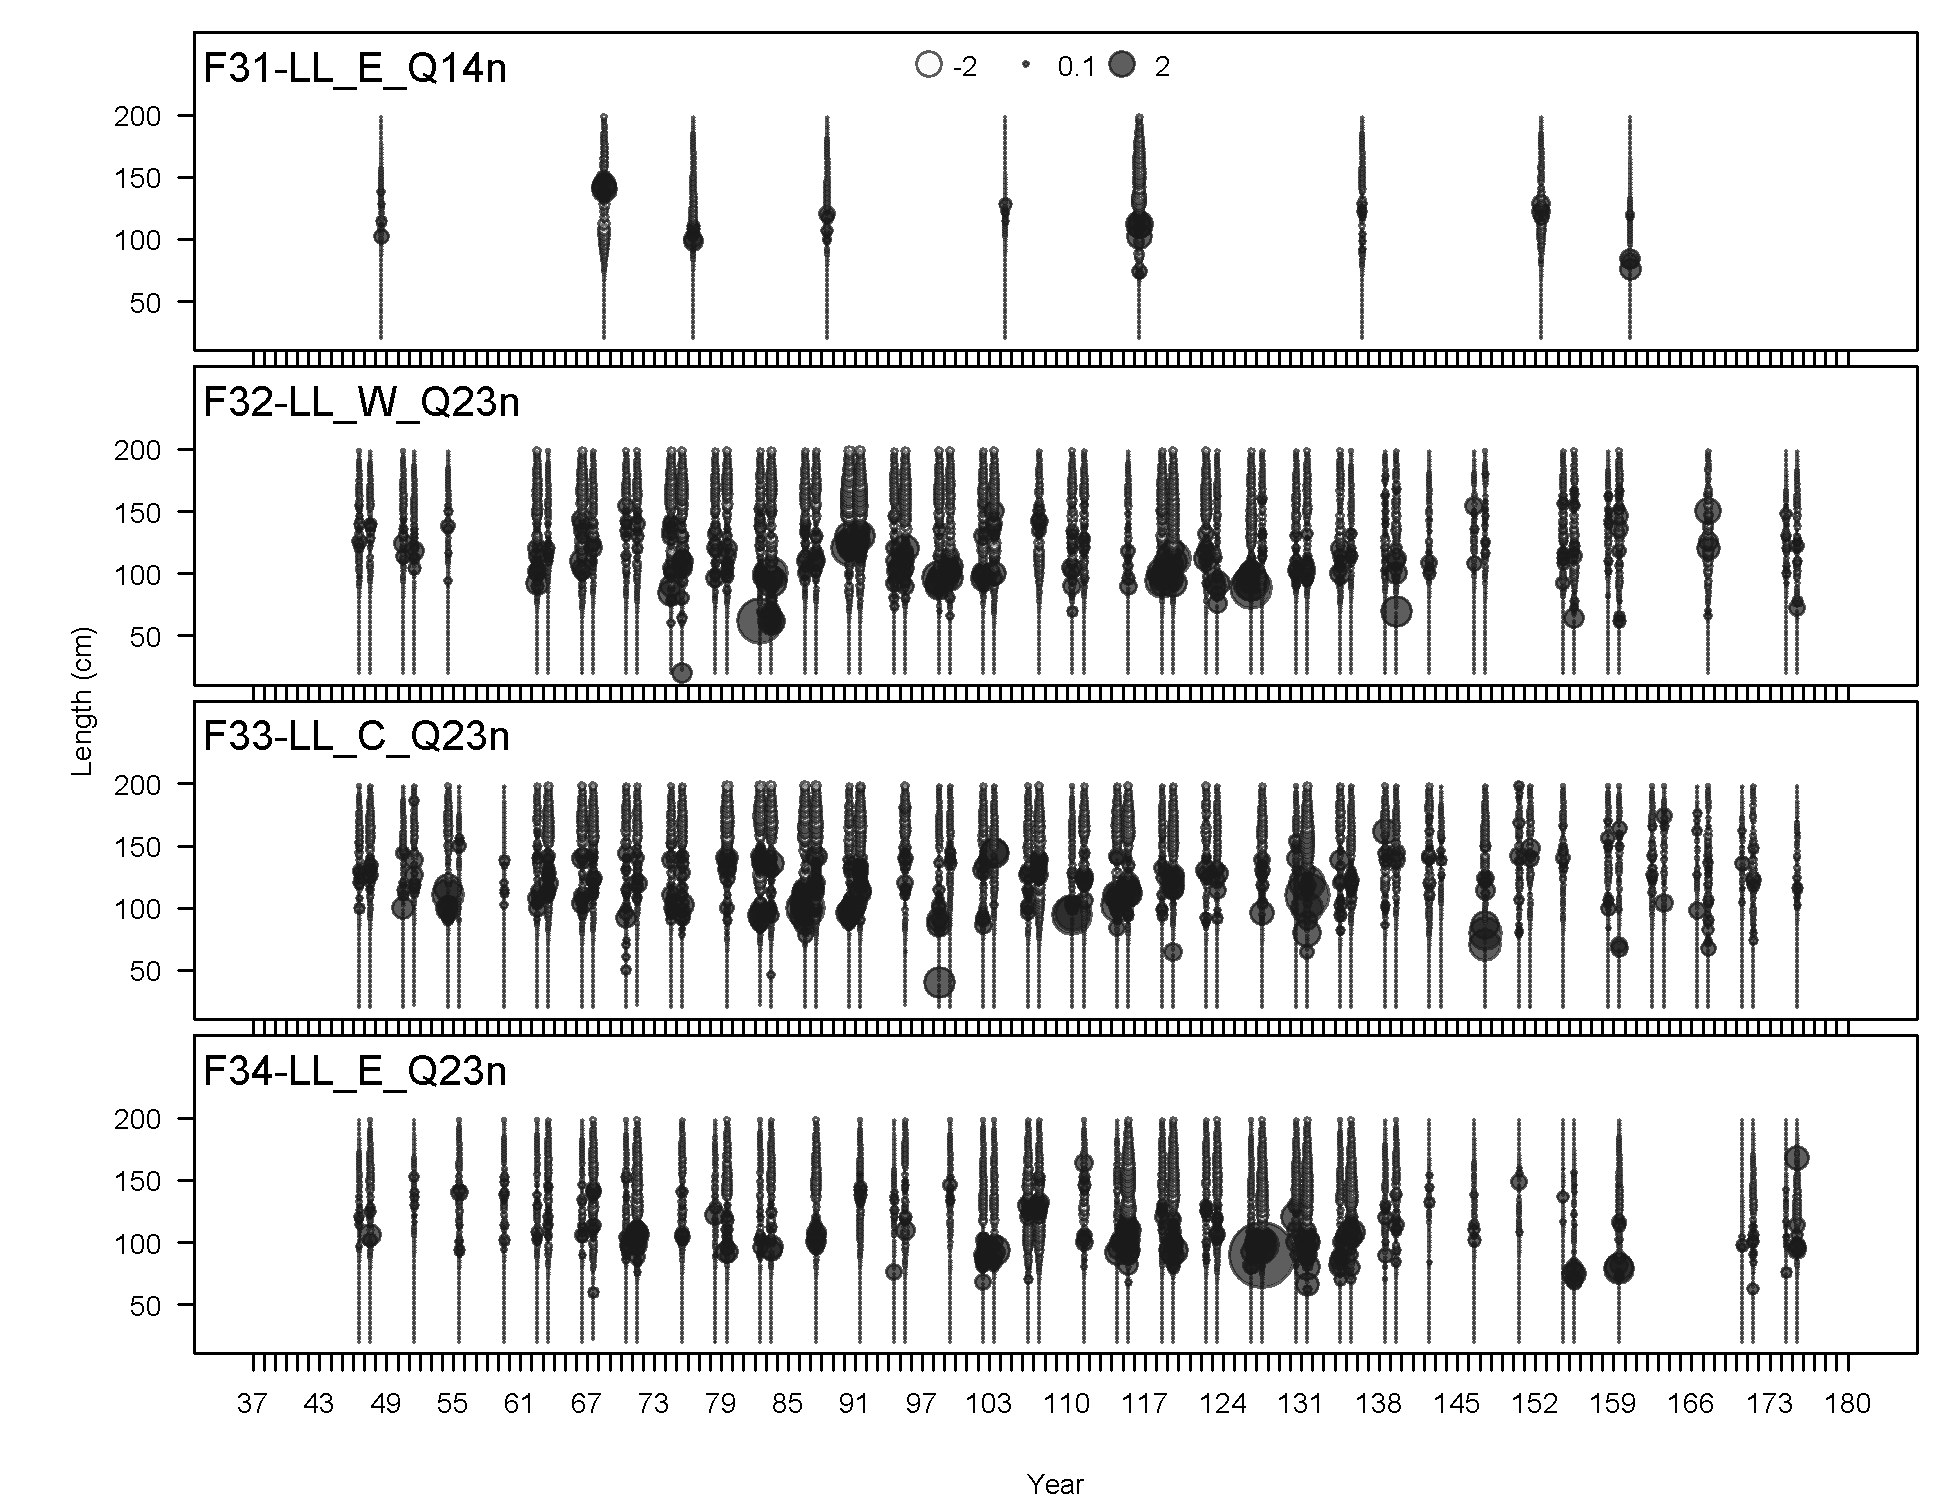
Length comps, whole catch, F31-LL_E_Q14n.
'N adj.' is the input sample size after data-weighting adjustment. N eff. is the calculated effective sample size used in the McAllister-Iannelli tuning method.
file: comp_lenfit_flt31mkt0.png
Pearson residuals, whole catch, F31-LL_E_Q14n (max=2.25)
Closed bubbles are positive residuals (observed > expected) and open bubbles are negative residuals (observed < expected).
file: comp_lenfit_residsflt31mkt0.png
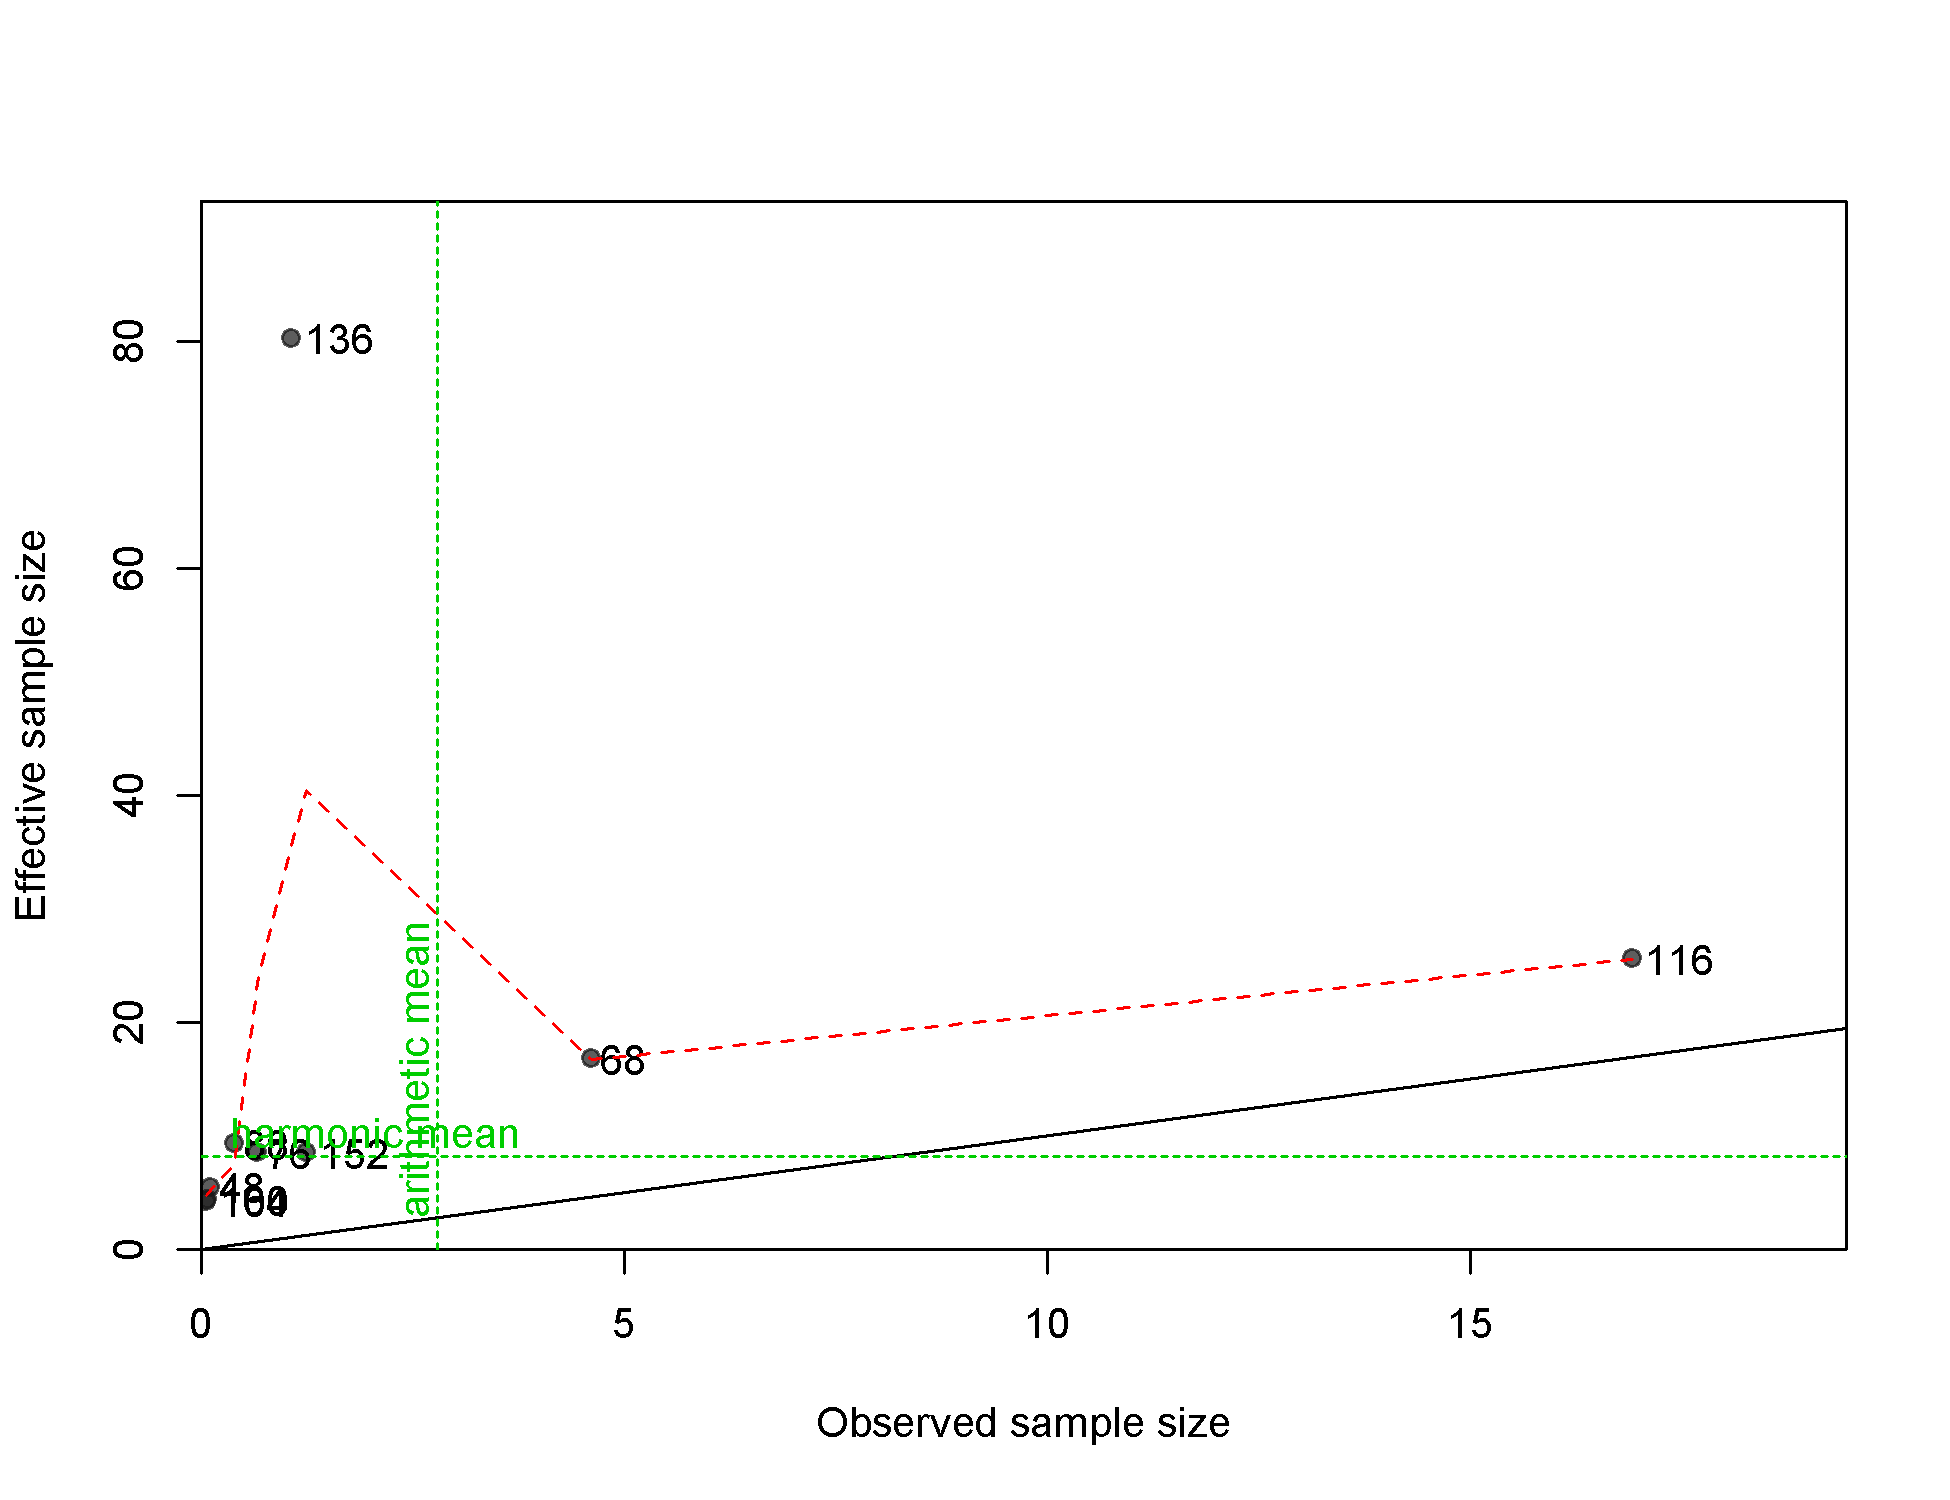
N-EffN comparison, Length comps, whole catch, F31-LL_E_Q14n
file: comp_lenfit_sampsize_flt31mkt0.png
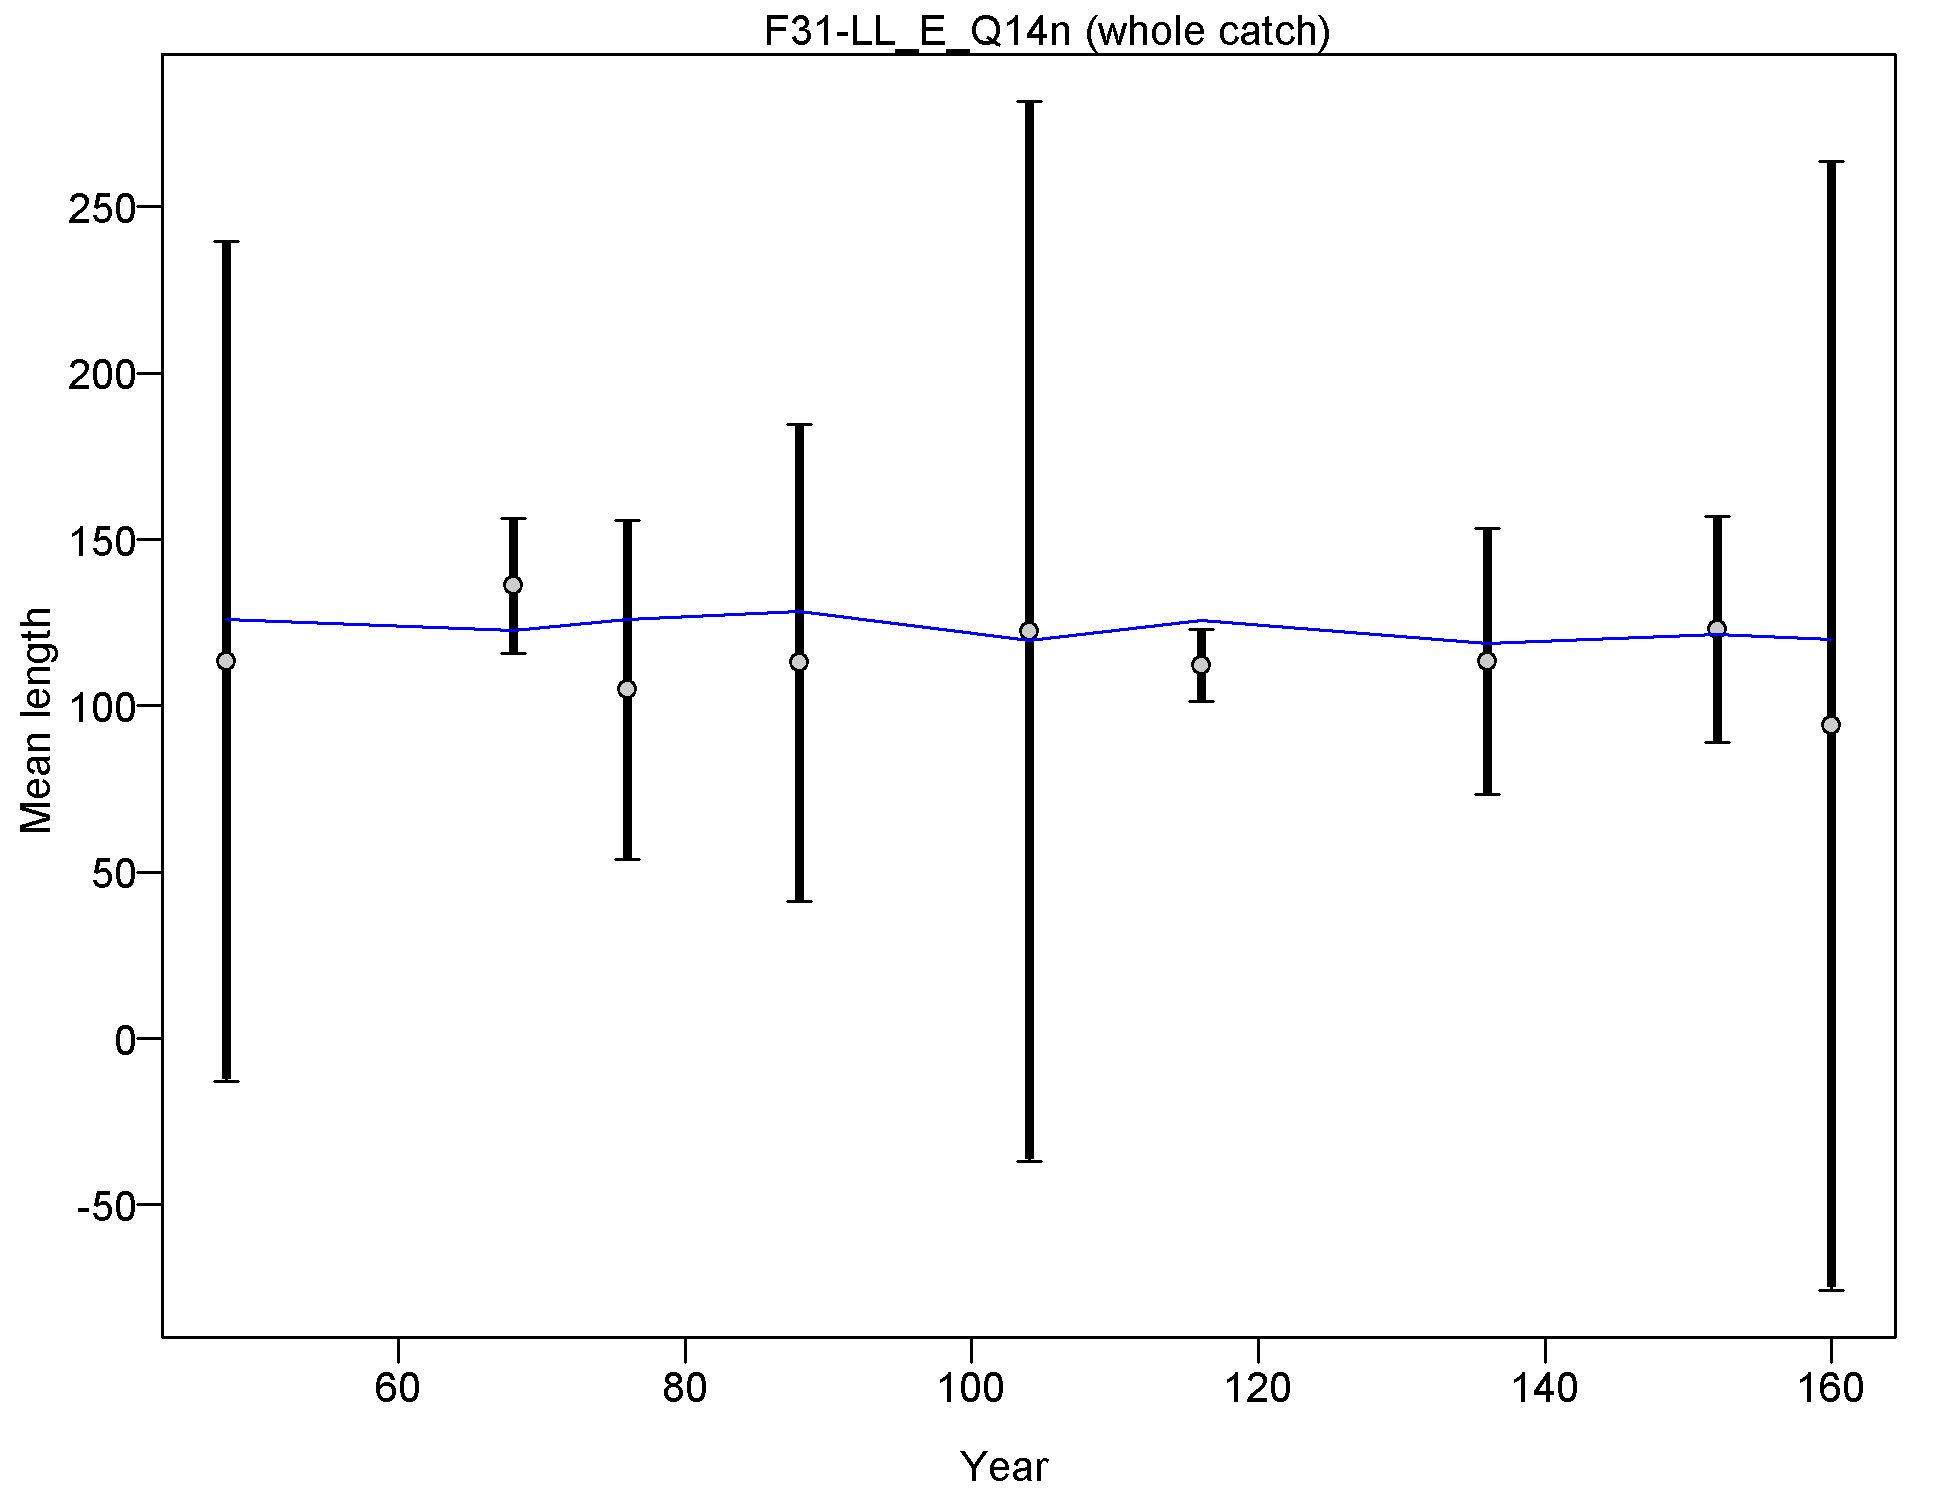
Mean length for F31-LL_E_Q14n with 95% confidence intervals based on current samples sizes.
Francis data weighting method TA1.8: thinner intervals (with capped ends) show result of further adjusting sample sizes based on suggested multiplier (with 95% interval) for len data from F31-LL_E_Q14n:
0.9923 (0.5069-18.3823)
For more info, see
Francis, R.I.C.C. (2011). Data weighting in statistical fisheries stock assessment models. Can. J. Fish. Aquat. Sci. 68: 1124-1138. https://doi.org/10.1139/f2011-025
file: comp_lenfit_data_weighting_TA1.8_F31-LL_E_Q14n.png

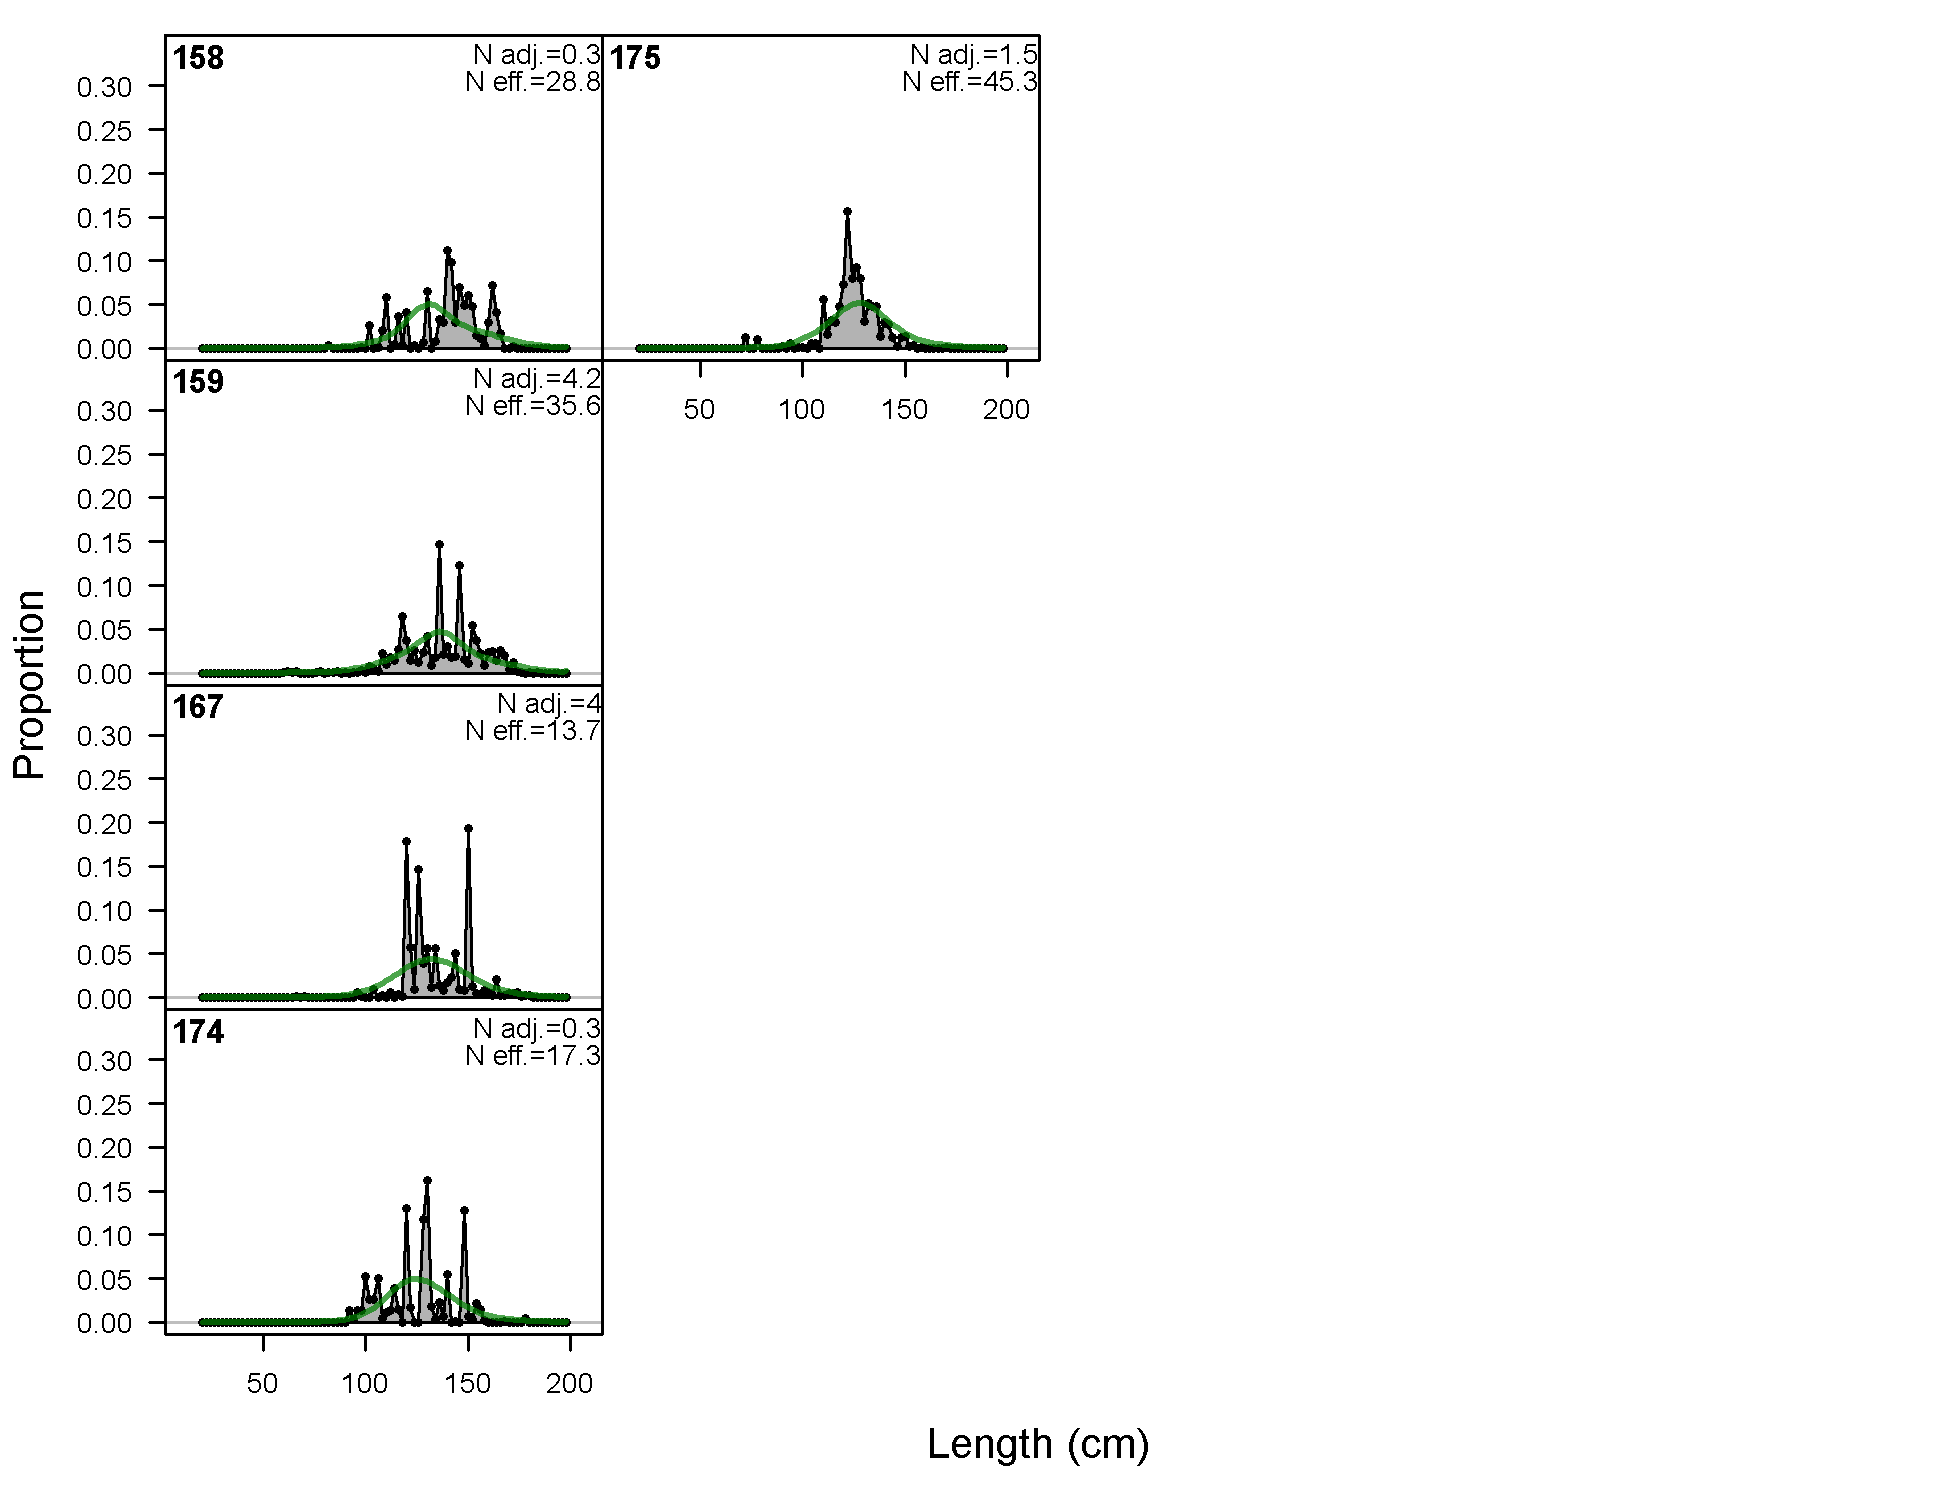
Length comps, whole catch, F32-LL_W_Q23n (plot 1 of 4).
'N adj.' is the input sample size after data-weighting adjustment. N eff. is the calculated effective sample size used in the McAllister-Iannelli tuning method.
file: comp_lenfit_flt32mkt0_page1.png
Length comps, whole catch, F32-LL_W_Q23n (plot 2 of 4)
file: comp_lenfit_flt32mkt0_page2.png
Length comps, whole catch, F32-LL_W_Q23n (plot 3 of 4)
file: comp_lenfit_flt32mkt0_page3.png
Length comps, whole catch, F32-LL_W_Q23n (plot 4 of 4)
file: comp_lenfit_flt32mkt0_page4.png
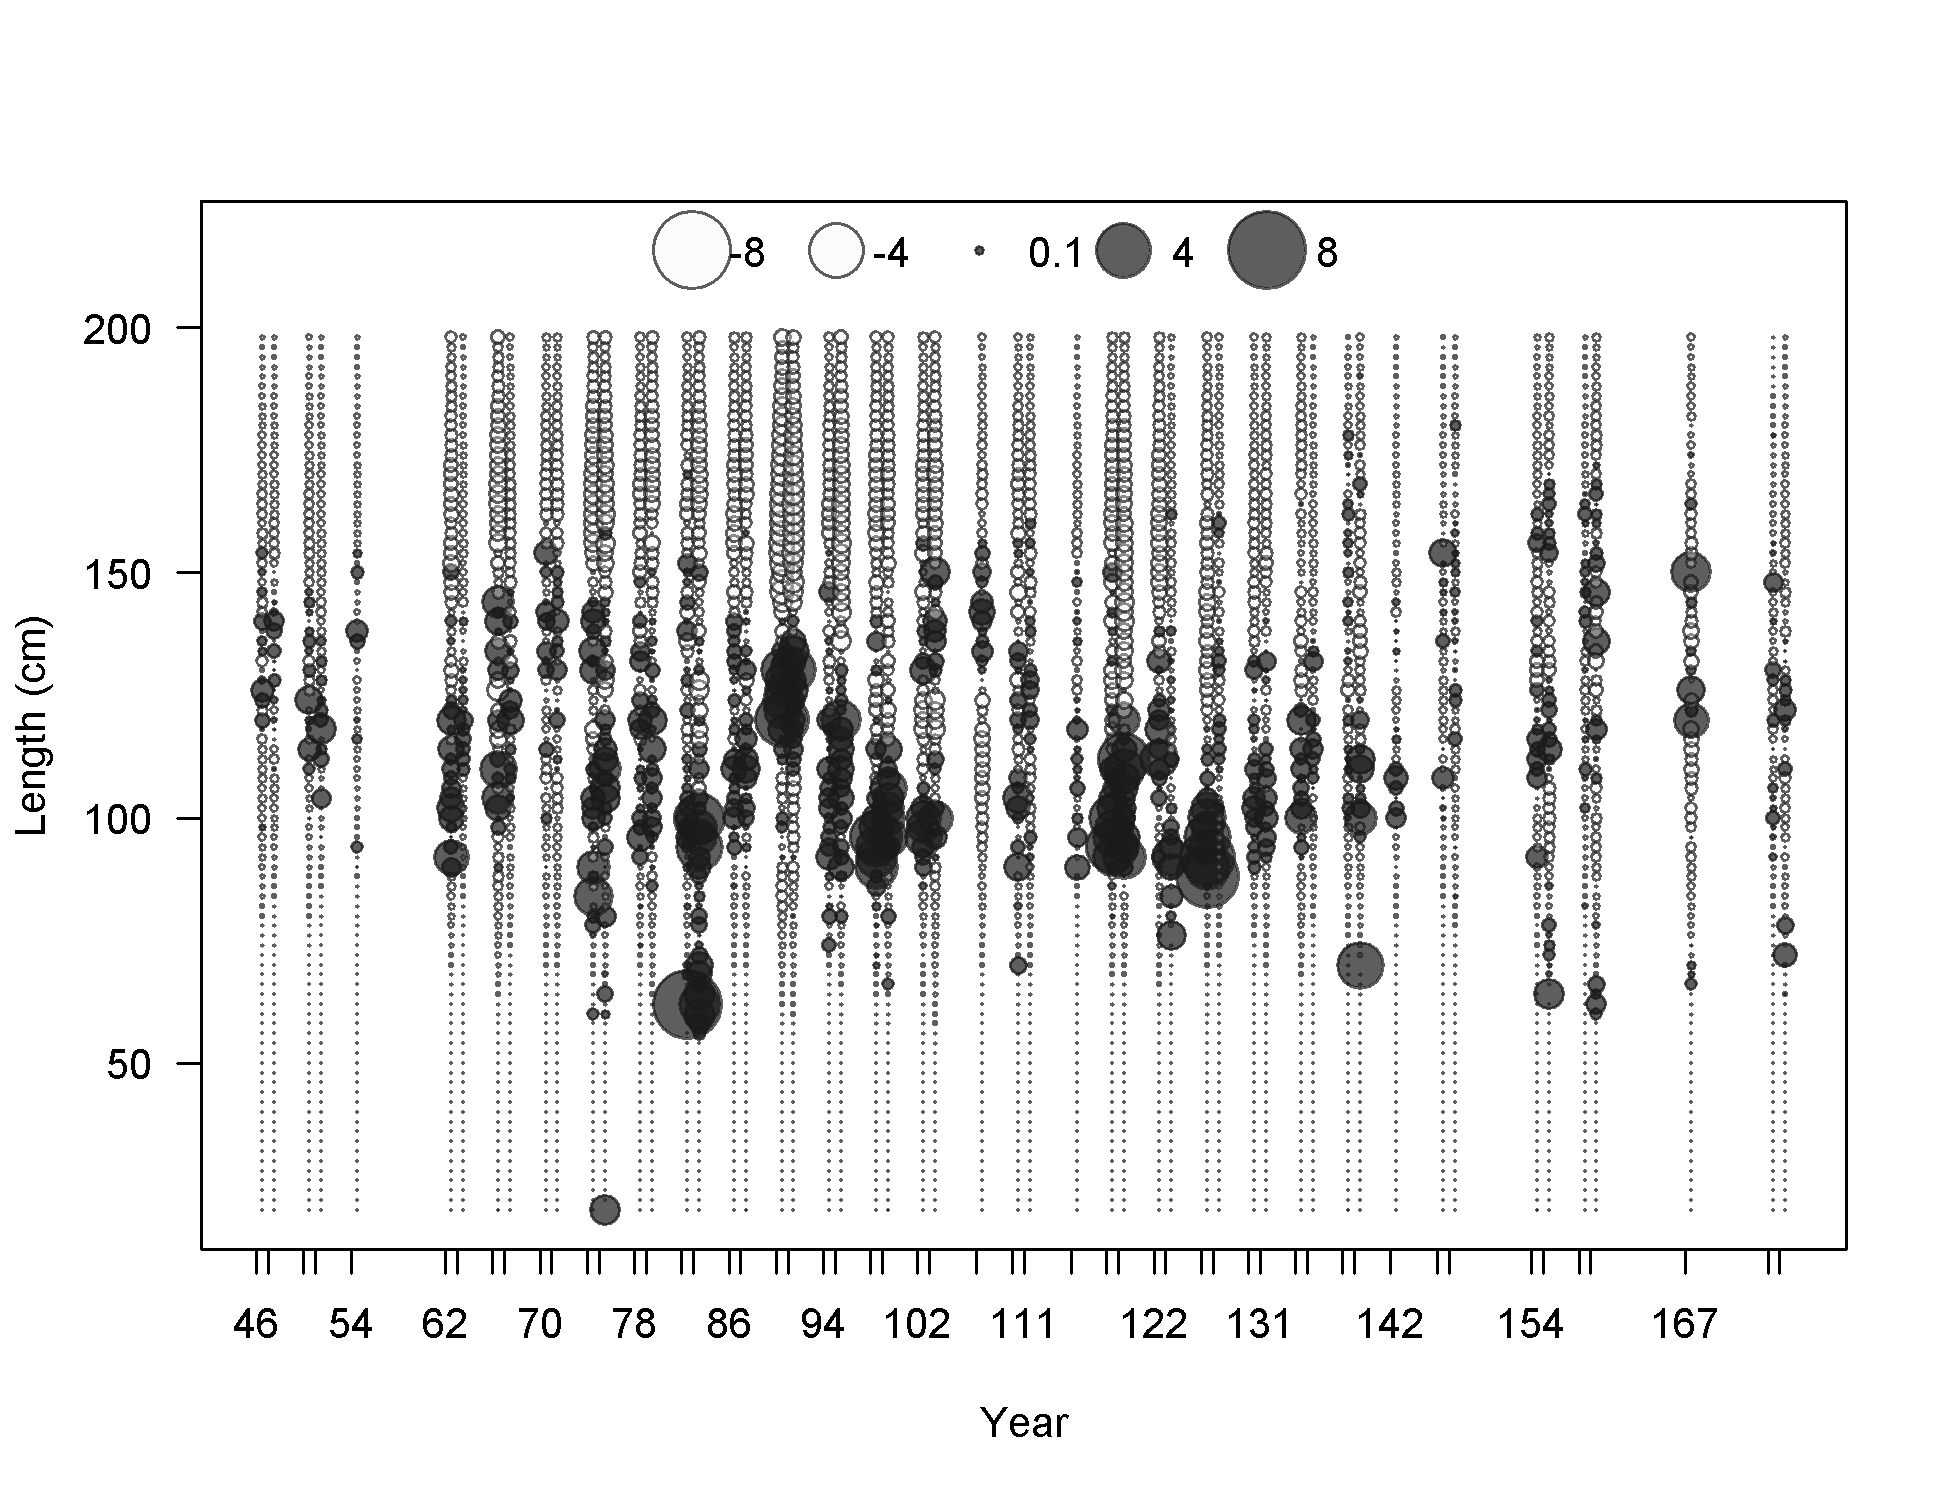
Pearson residuals, whole catch, F32-LL_W_Q23n (max=6.25) (plot 4 of 4)
Closed bubbles are positive residuals (observed > expected) and open bubbles are negative residuals (observed < expected).
file: comp_lenfit_residsflt32mkt0_page4.png
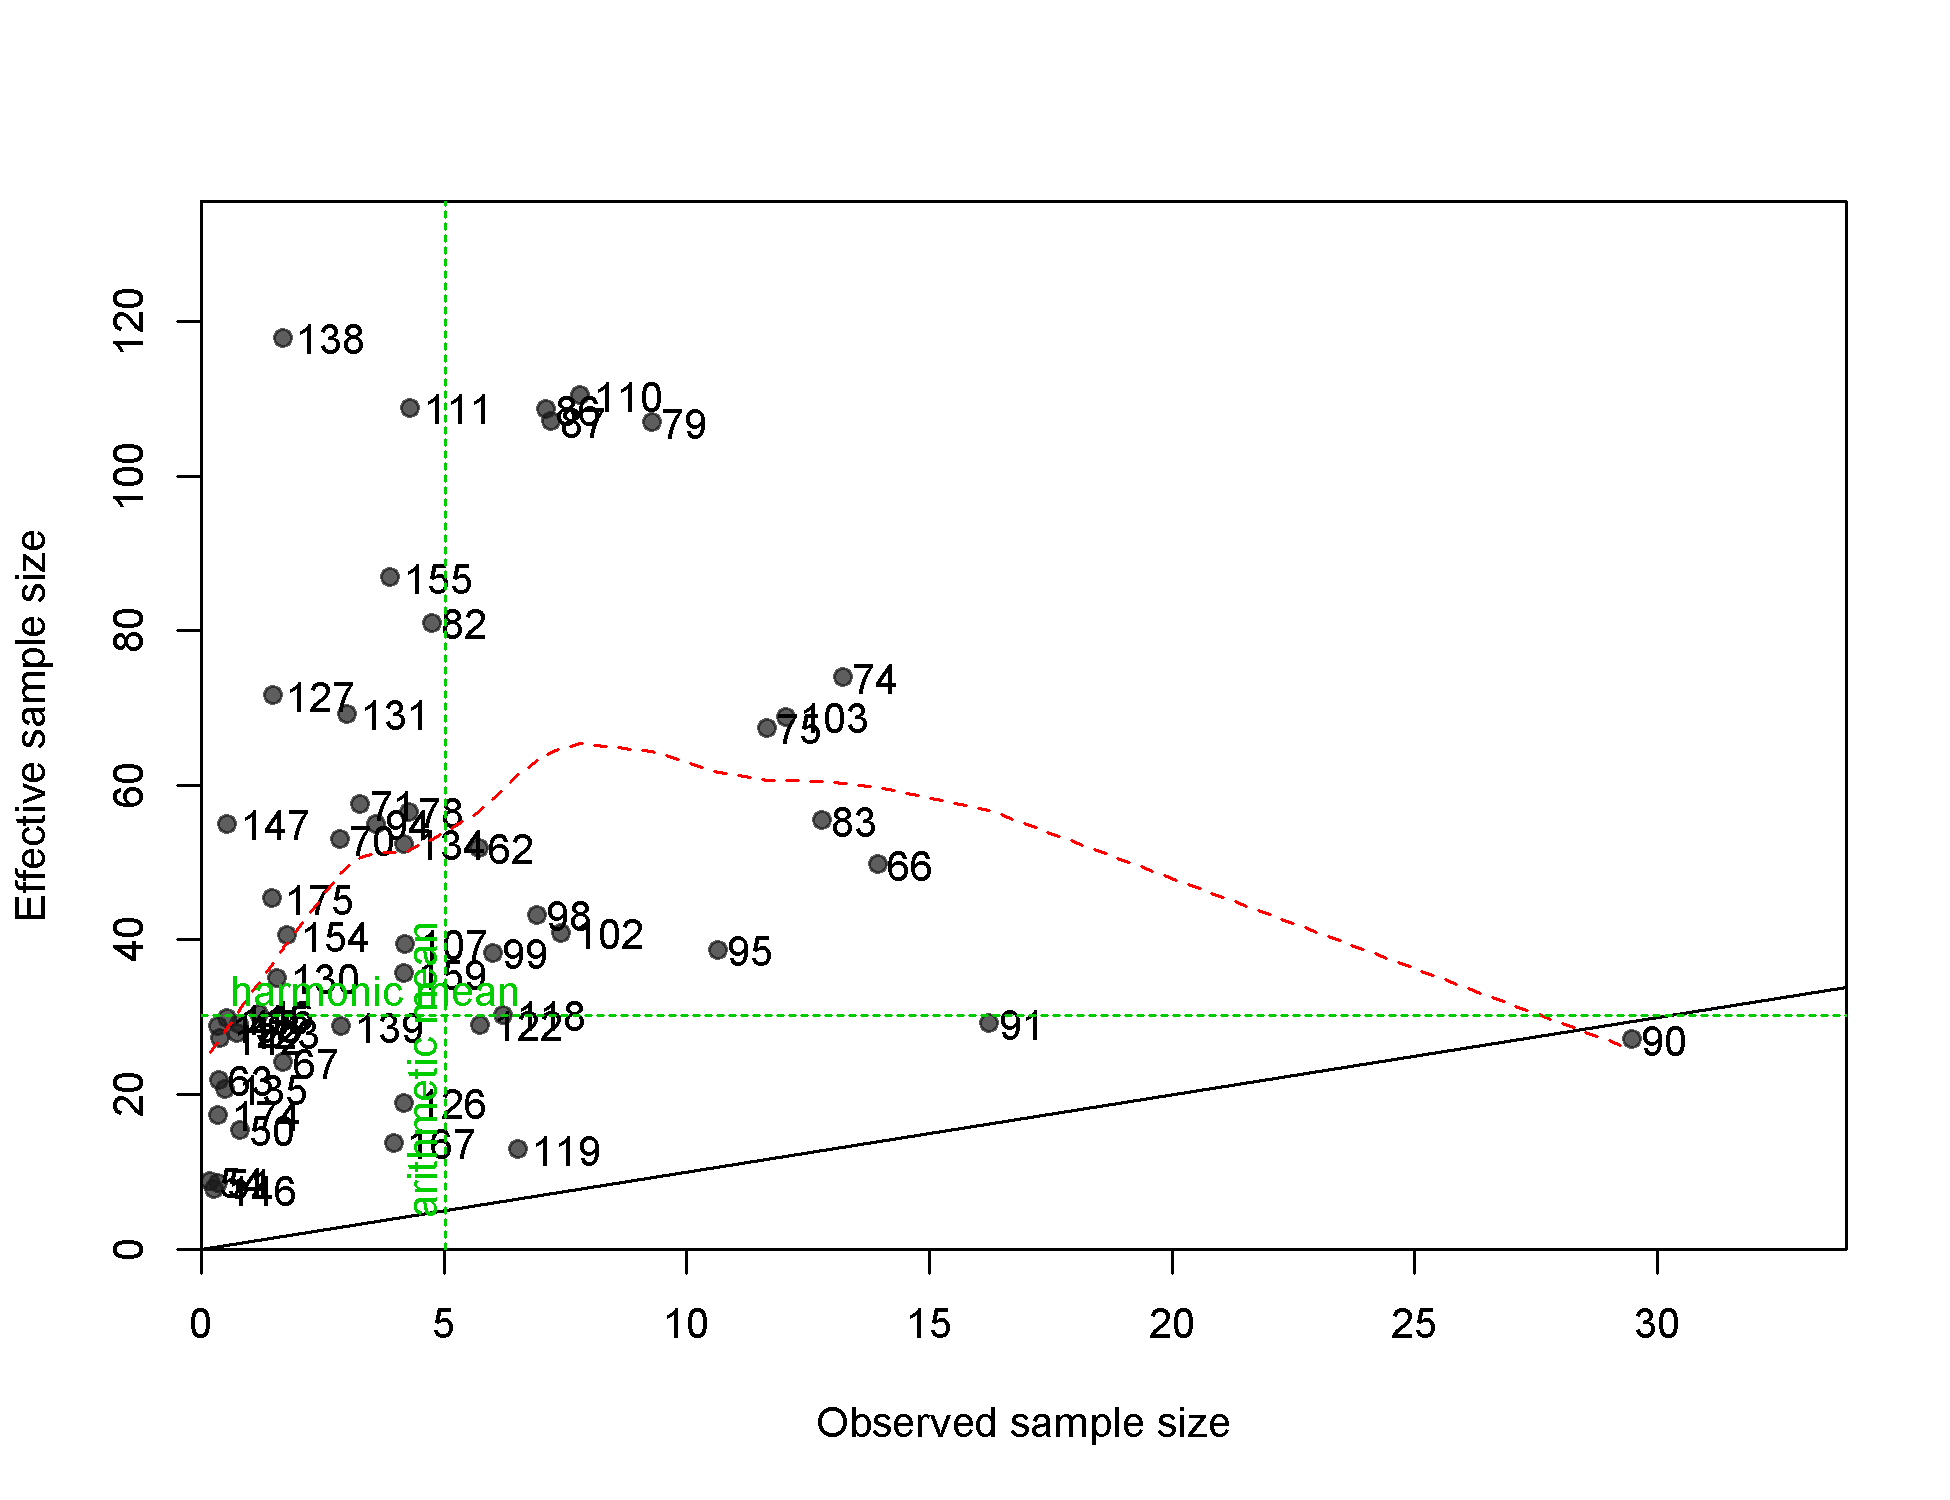
N-EffN comparison, Length comps, whole catch, F32-LL_W_Q23n
file: comp_lenfit_sampsize_flt32mkt0.png
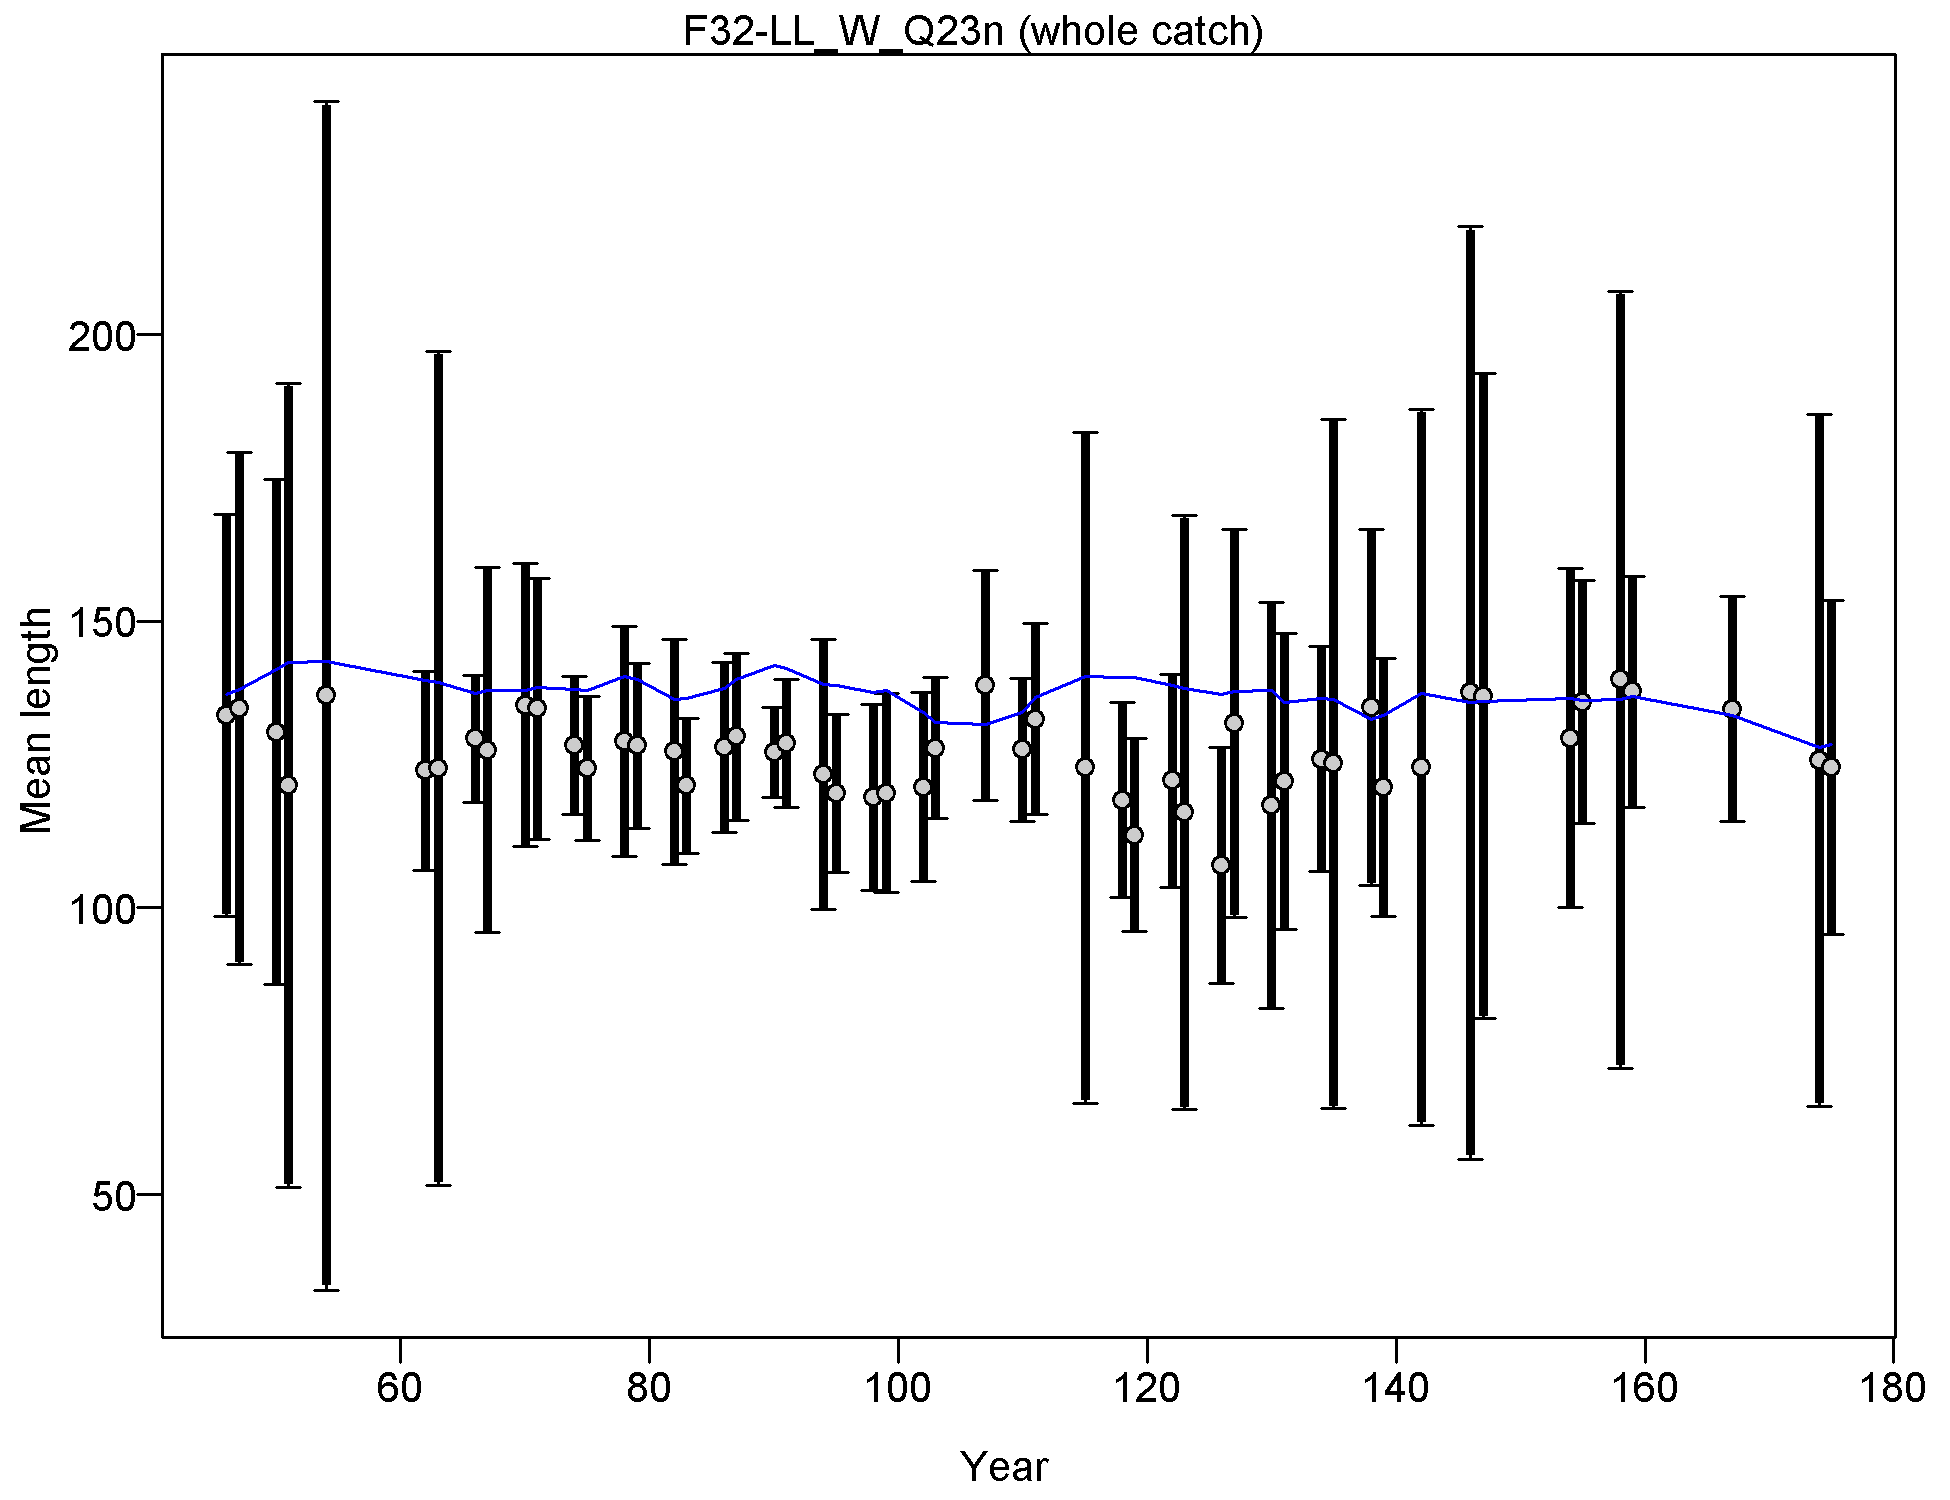
Mean length for F32-LL_W_Q23n with 95% confidence intervals based on current samples sizes.
Francis data weighting method TA1.8: thinner intervals (with capped ends) show result of further adjusting sample sizes based on suggested multiplier (with 95% interval) for len data from F32-LL_W_Q23n:
0.9857 (0.7166-1.5352)
For more info, see
Francis, R.I.C.C. (2011). Data weighting in statistical fisheries stock assessment models. Can. J. Fish. Aquat. Sci. 68: 1124-1138. https://doi.org/10.1139/f2011-025
file: comp_lenfit_data_weighting_TA1.8_F32-LL_W_Q23n.png
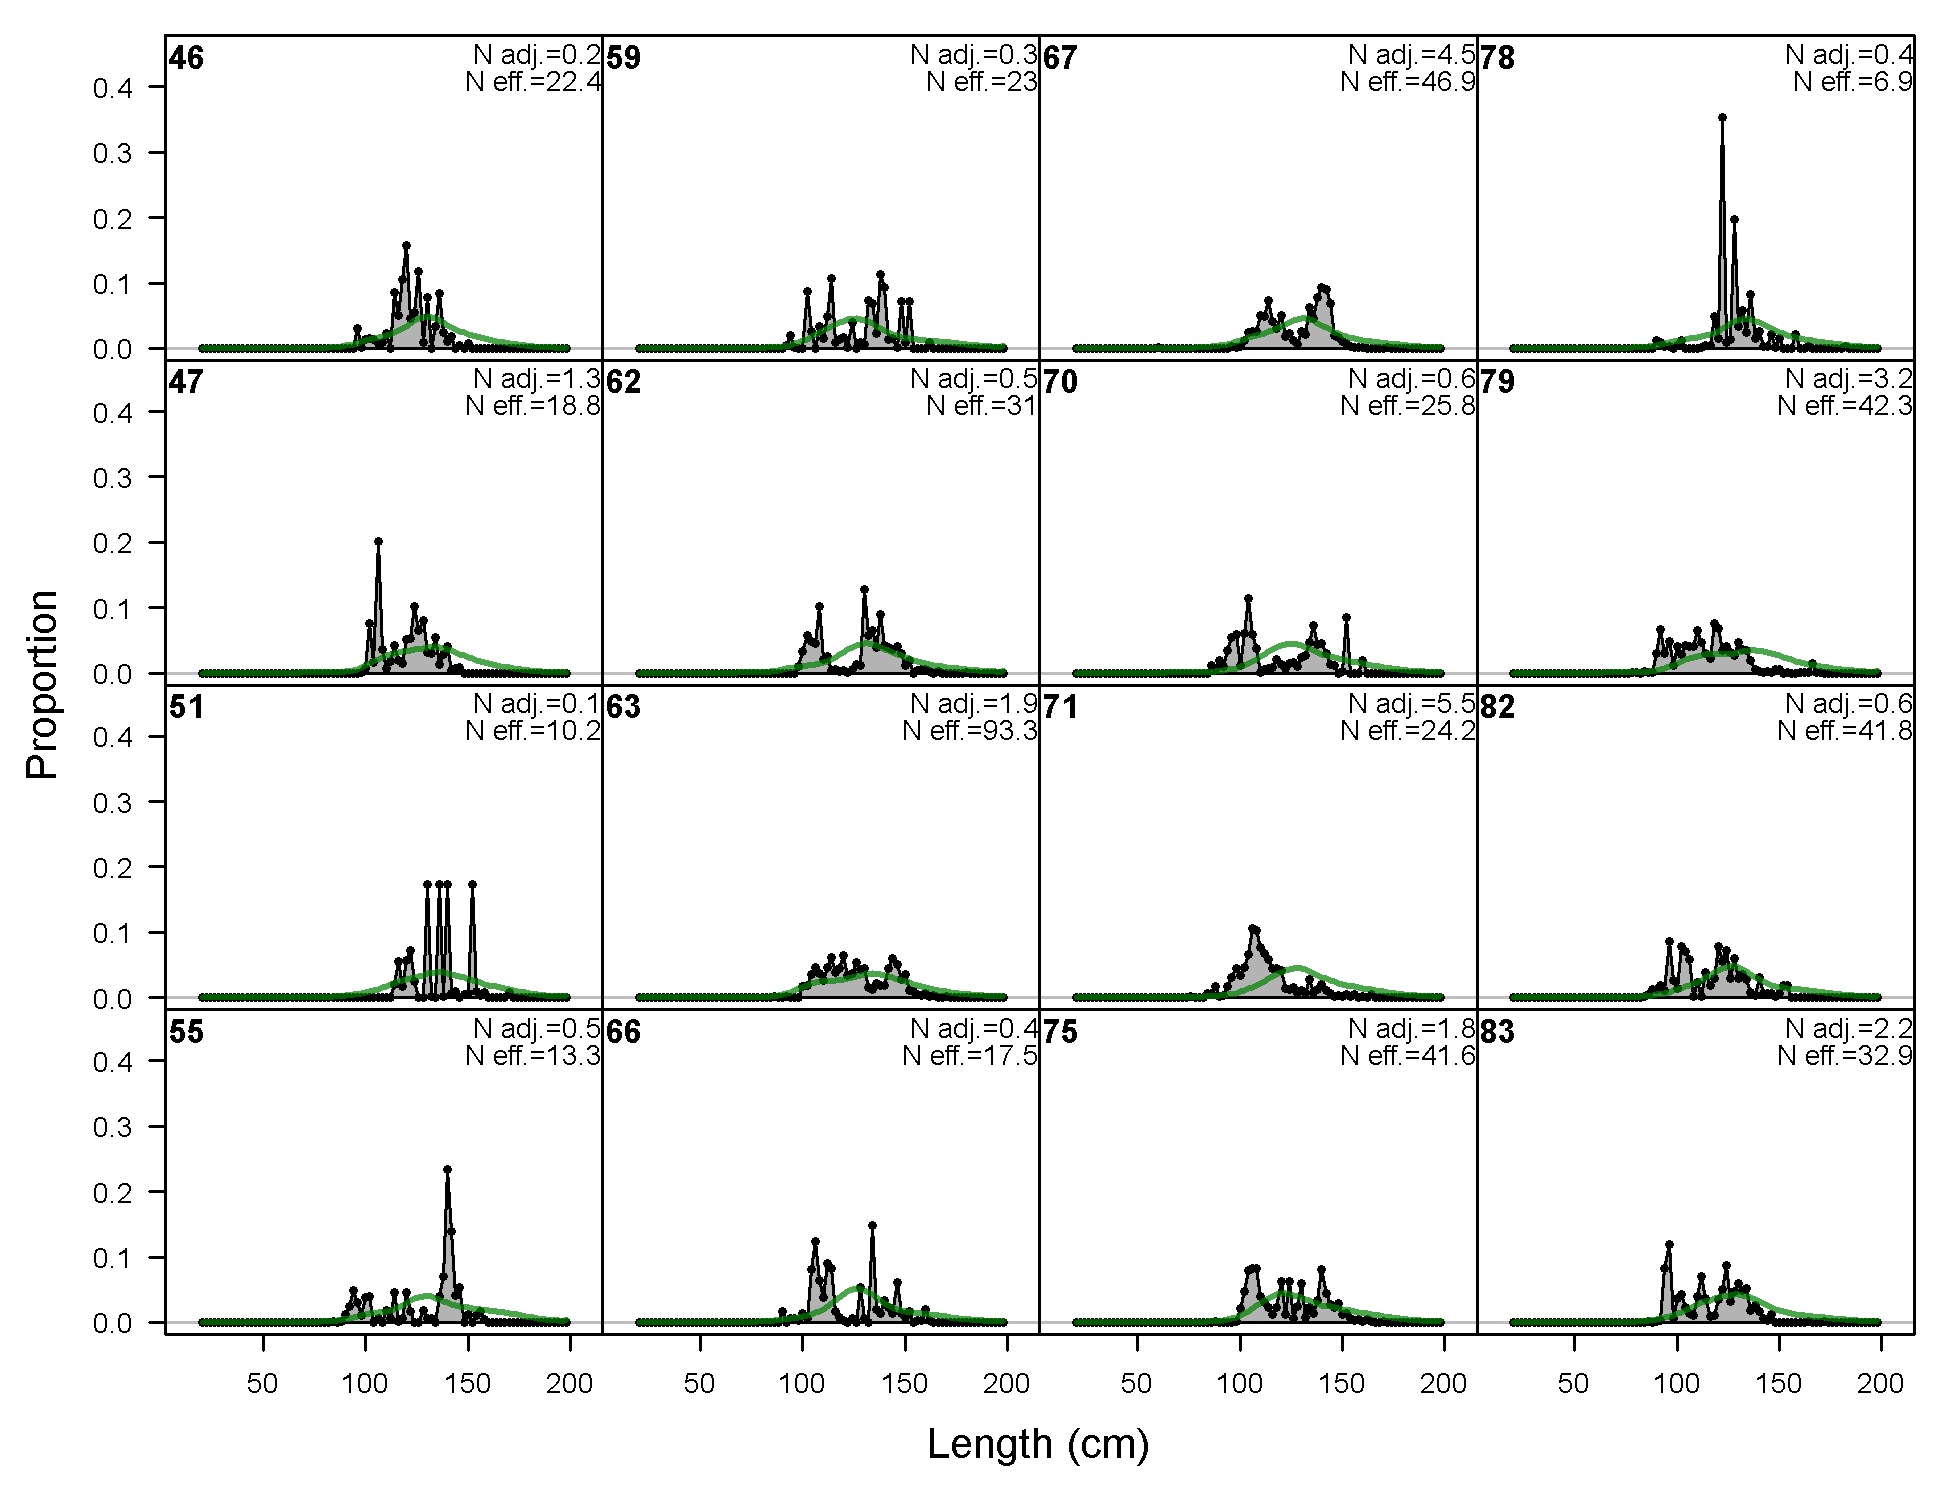
Length comps, whole catch, F33-LL_C_Q23n (plot 1 of 4).
'N adj.' is the input sample size after data-weighting adjustment. N eff. is the calculated effective sample size used in the McAllister-Iannelli tuning method.
file: comp_lenfit_flt33mkt0_page1.png
Length comps, whole catch, F33-LL_C_Q23n (plot 2 of 4)
file: comp_lenfit_flt33mkt0_page2.png
Length comps, whole catch, F33-LL_C_Q23n (plot 3 of 4)
file: comp_lenfit_flt33mkt0_page3.png
Length comps, whole catch, F33-LL_C_Q23n (plot 4 of 4)
file: comp_lenfit_flt33mkt0_page4.png
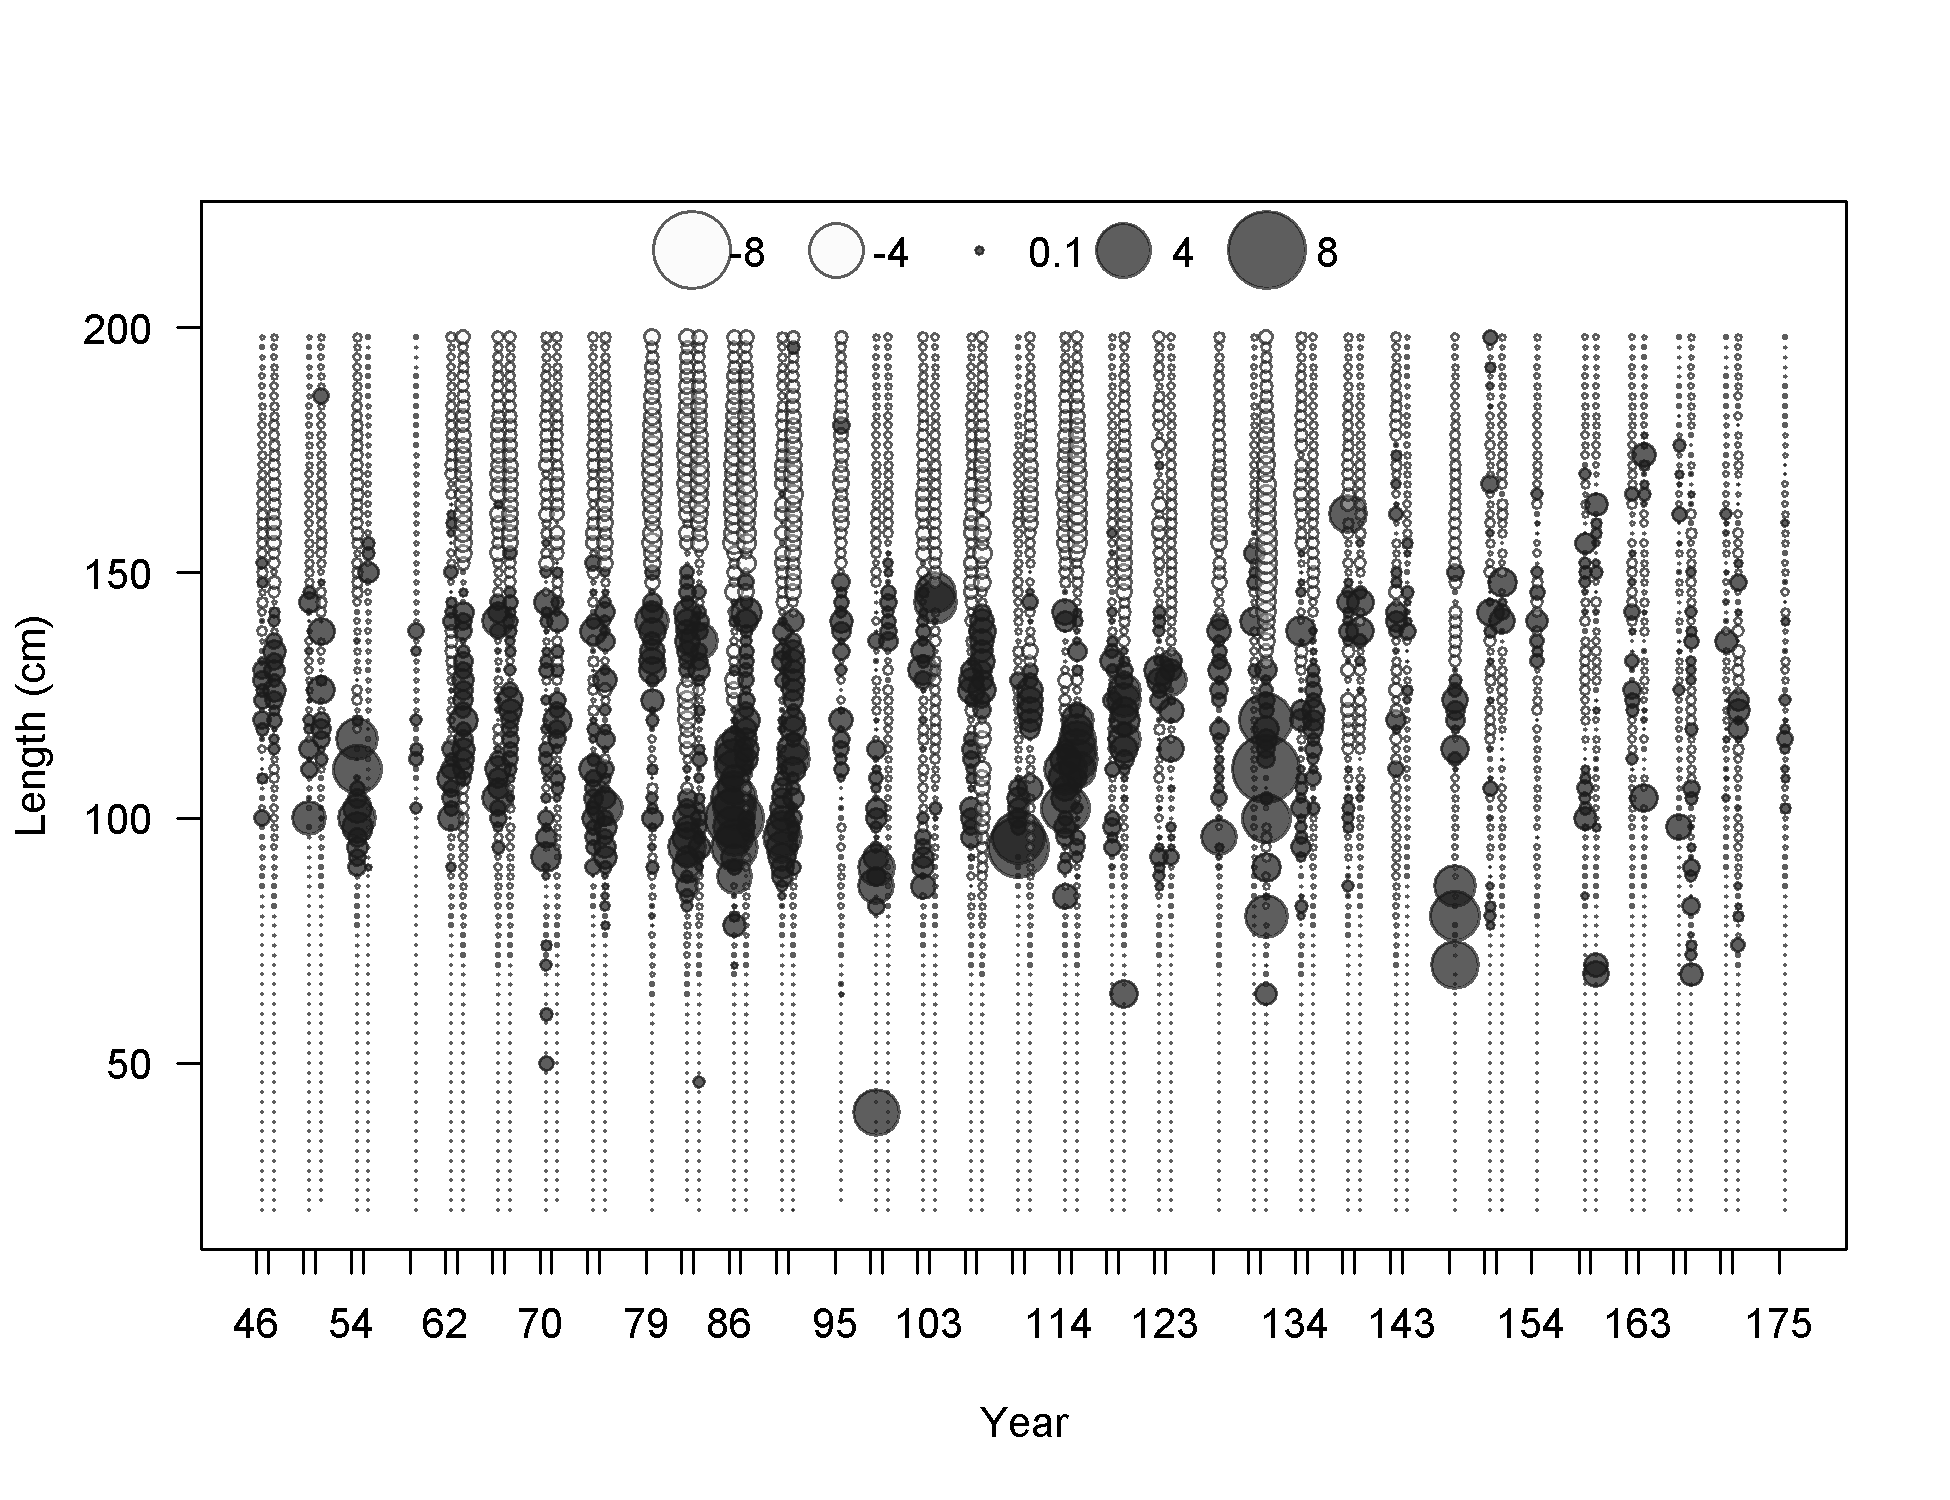
Pearson residuals, whole catch, F33-LL_C_Q23n (max=6.11) (plot 4 of 4)
Closed bubbles are positive residuals (observed > expected) and open bubbles are negative residuals (observed < expected).
file: comp_lenfit_residsflt33mkt0_page4.png
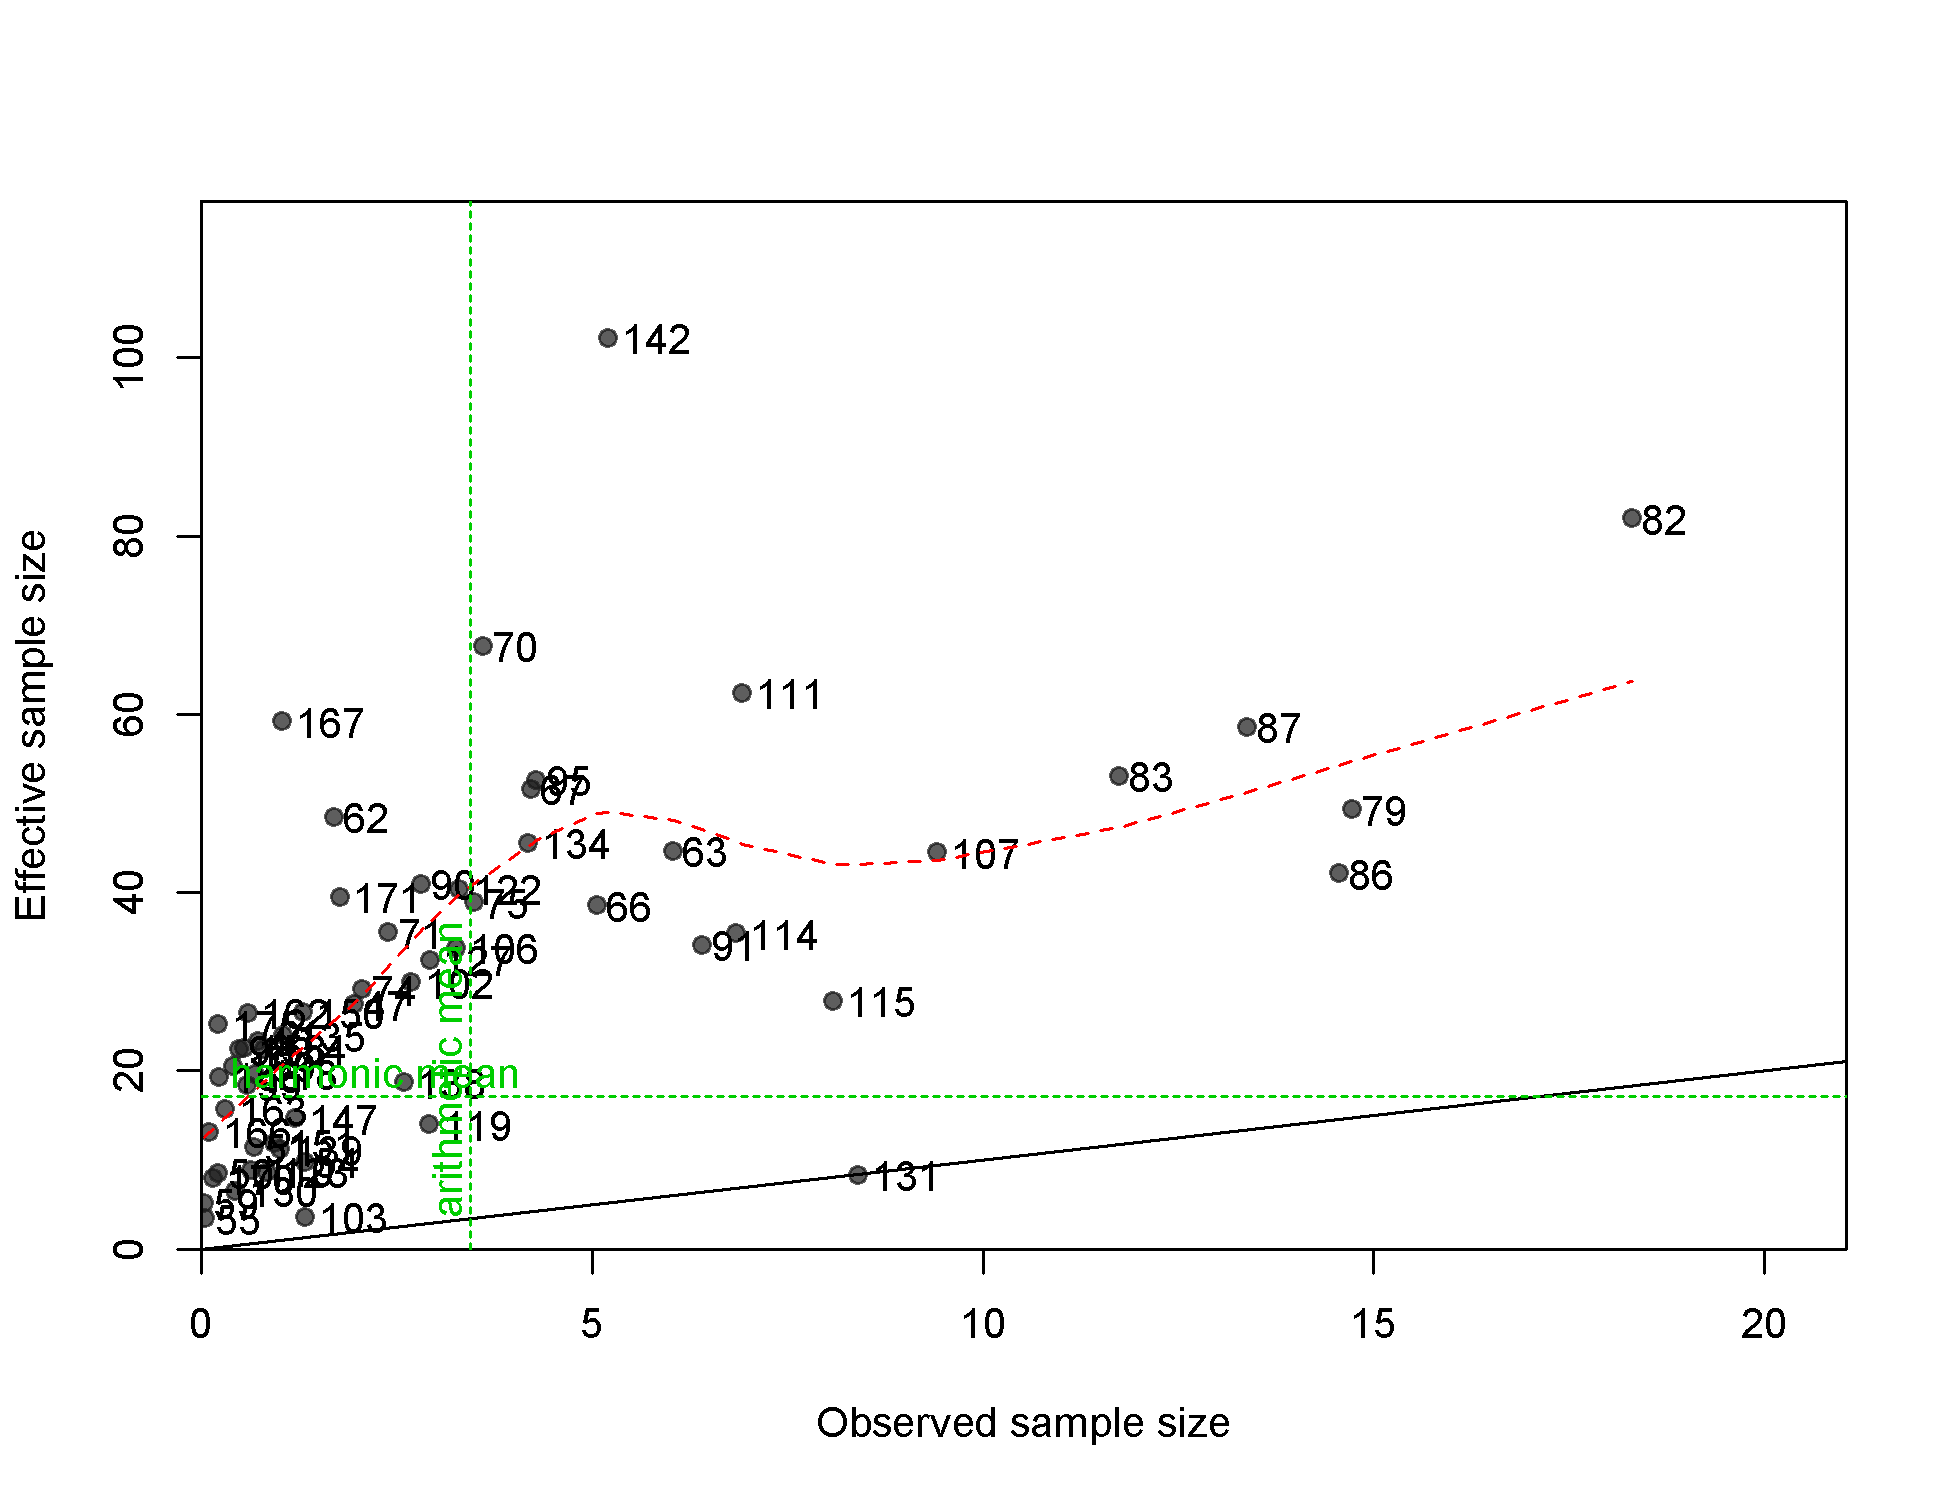
N-EffN comparison, Length comps, whole catch, F33-LL_C_Q23n
file: comp_lenfit_sampsize_flt33mkt0.png
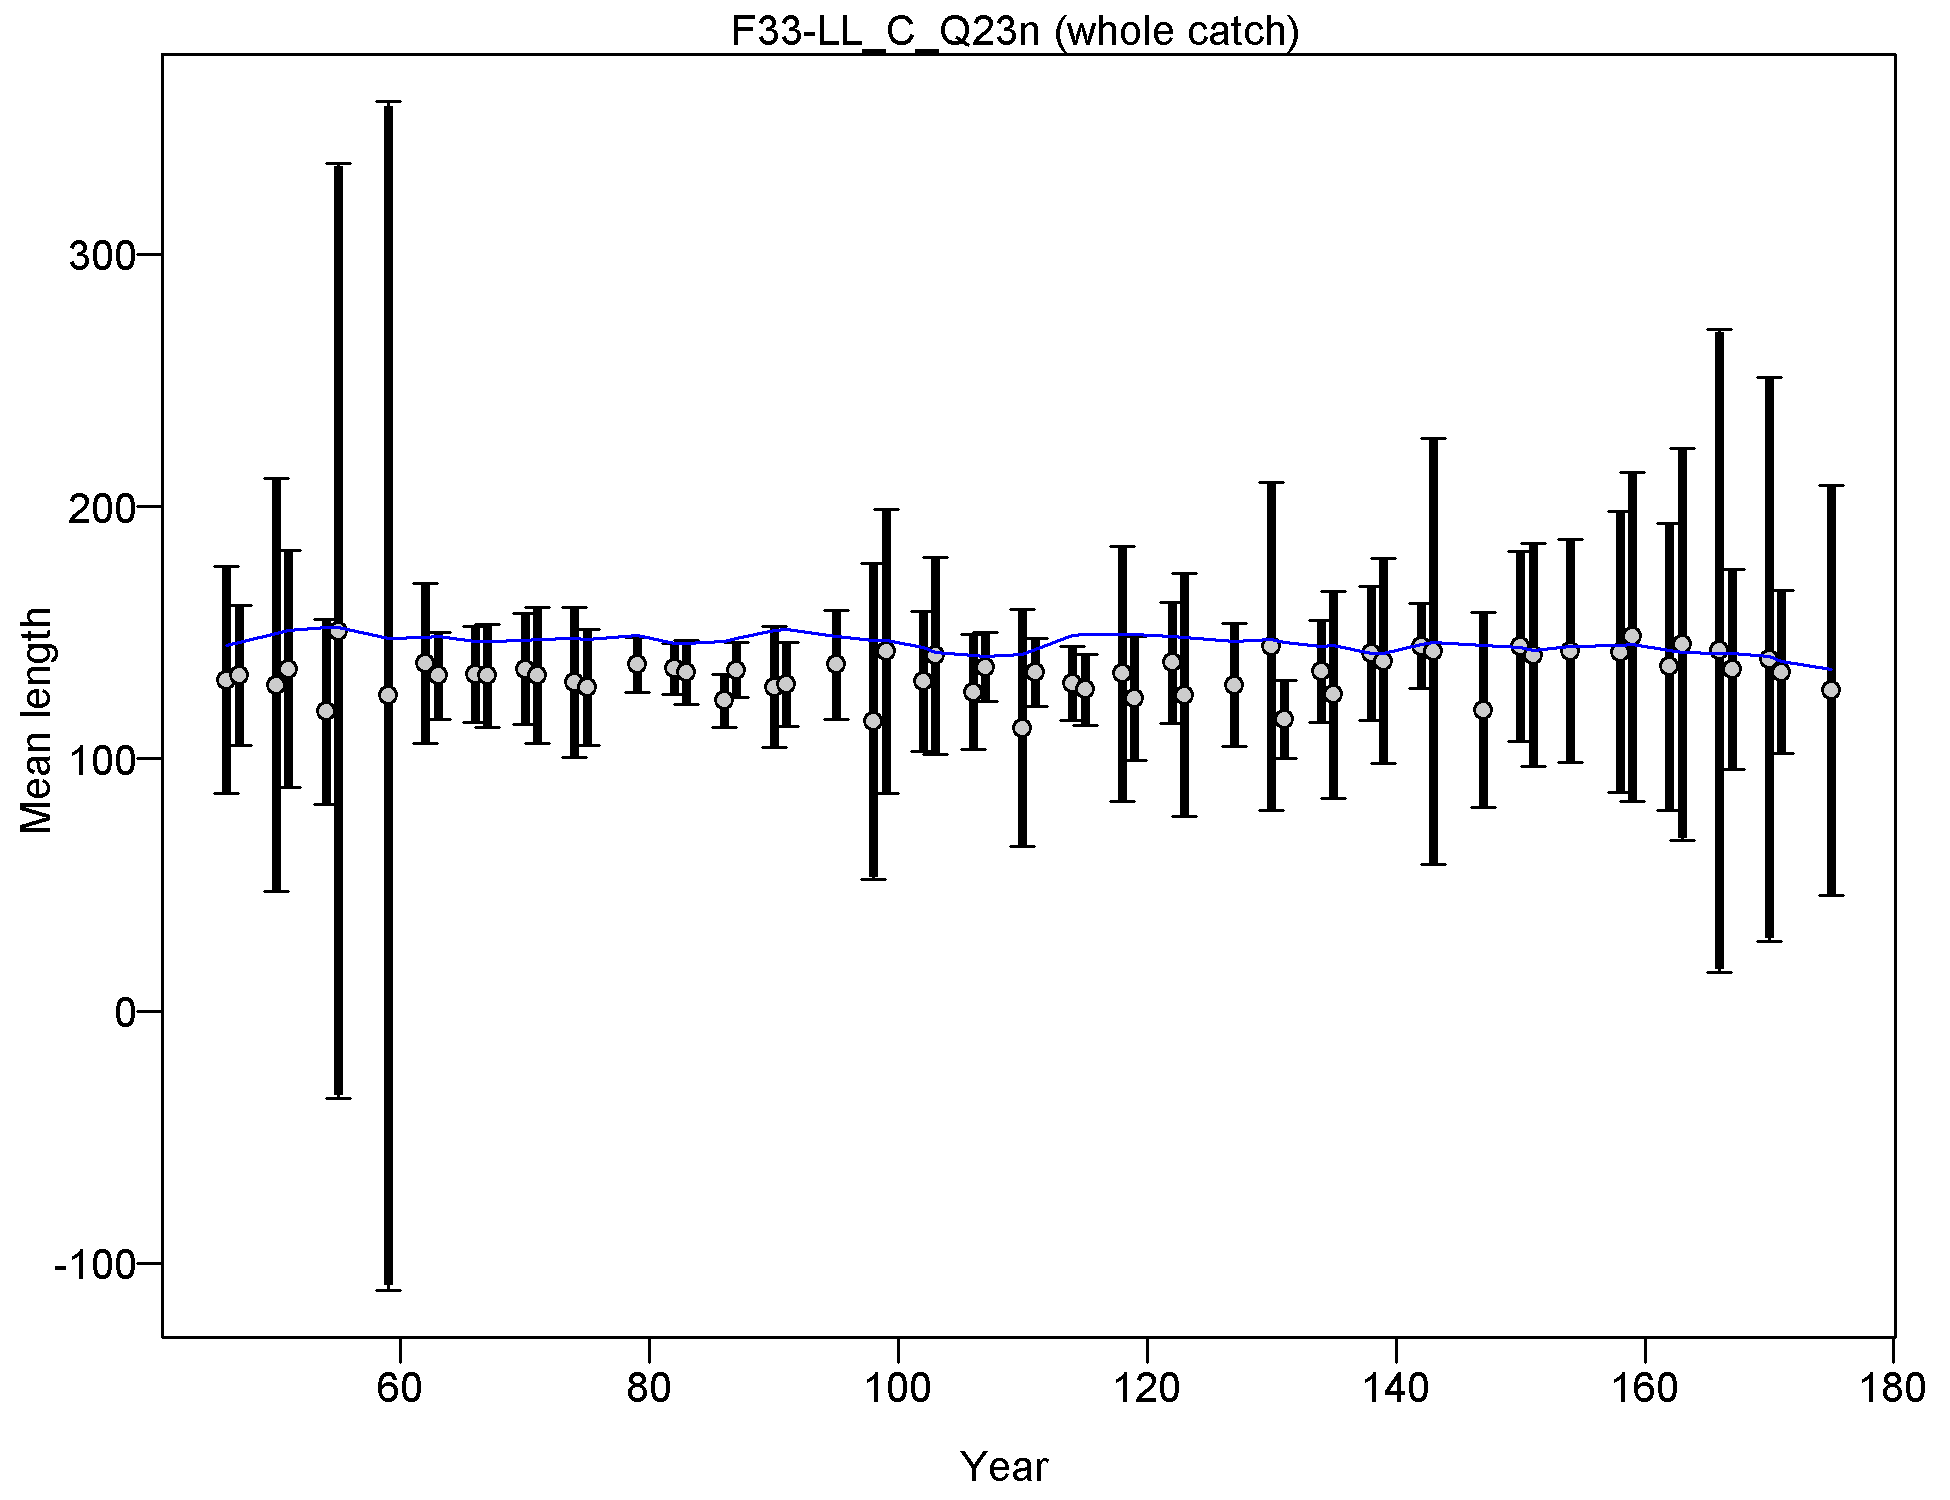
Mean length for F33-LL_C_Q23n with 95% confidence intervals based on current samples sizes.
Francis data weighting method TA1.8: thinner intervals (with capped ends) show result of further adjusting sample sizes based on suggested multiplier (with 95% interval) for len data from F33-LL_C_Q23n:
0.985 (0.6629-1.7772)
For more info, see
Francis, R.I.C.C. (2011). Data weighting in statistical fisheries stock assessment models. Can. J. Fish. Aquat. Sci. 68: 1124-1138. https://doi.org/10.1139/f2011-025
file: comp_lenfit_data_weighting_TA1.8_F33-LL_C_Q23n.png
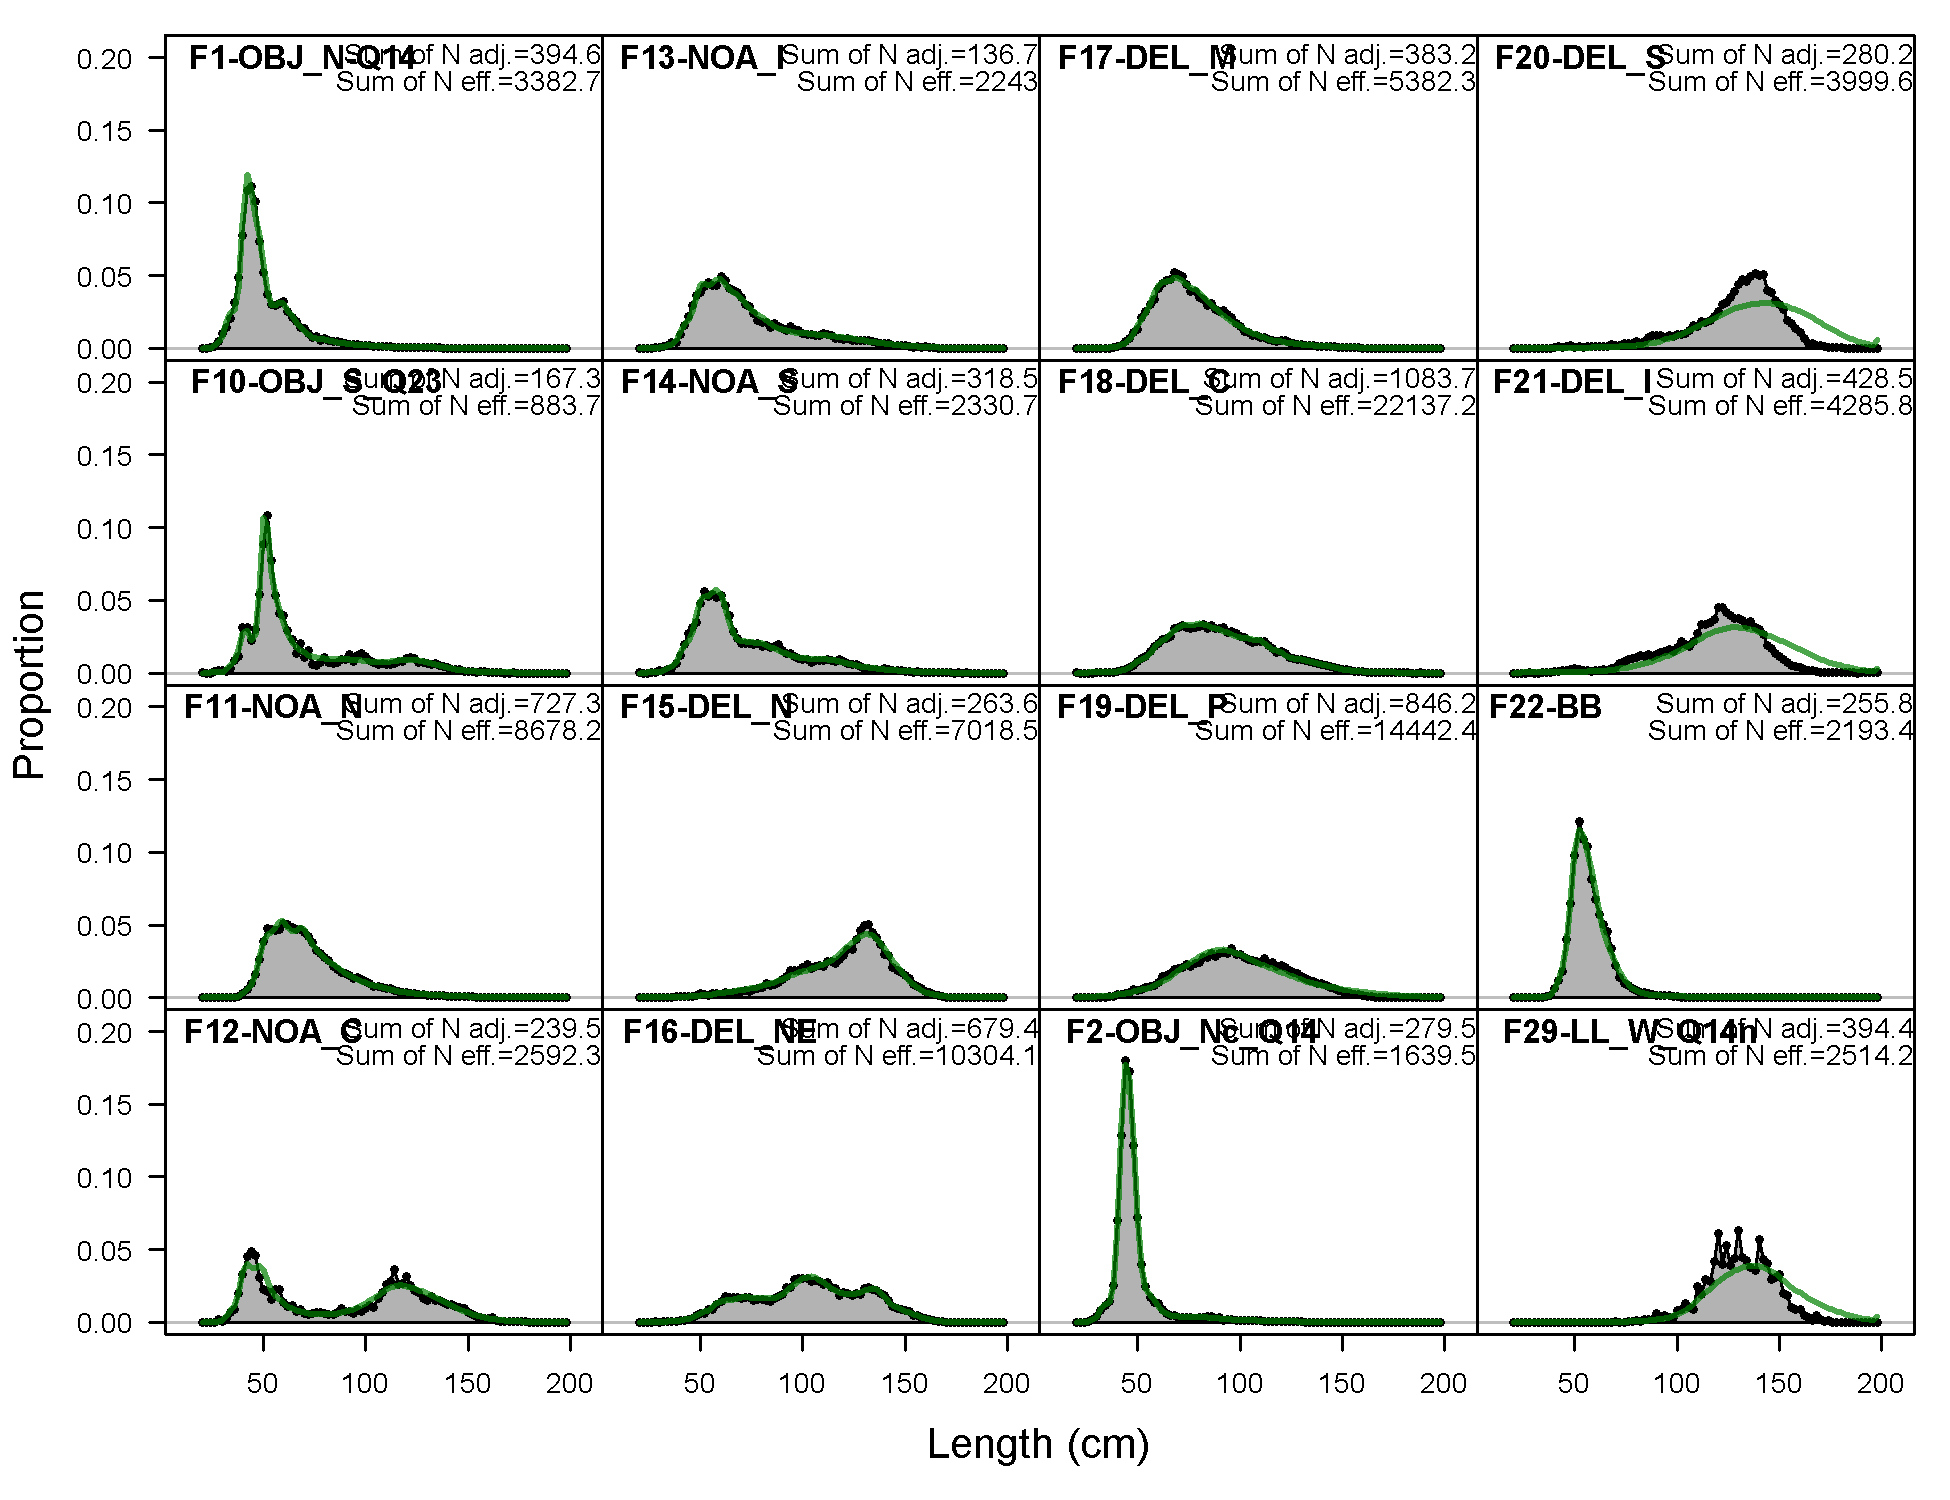
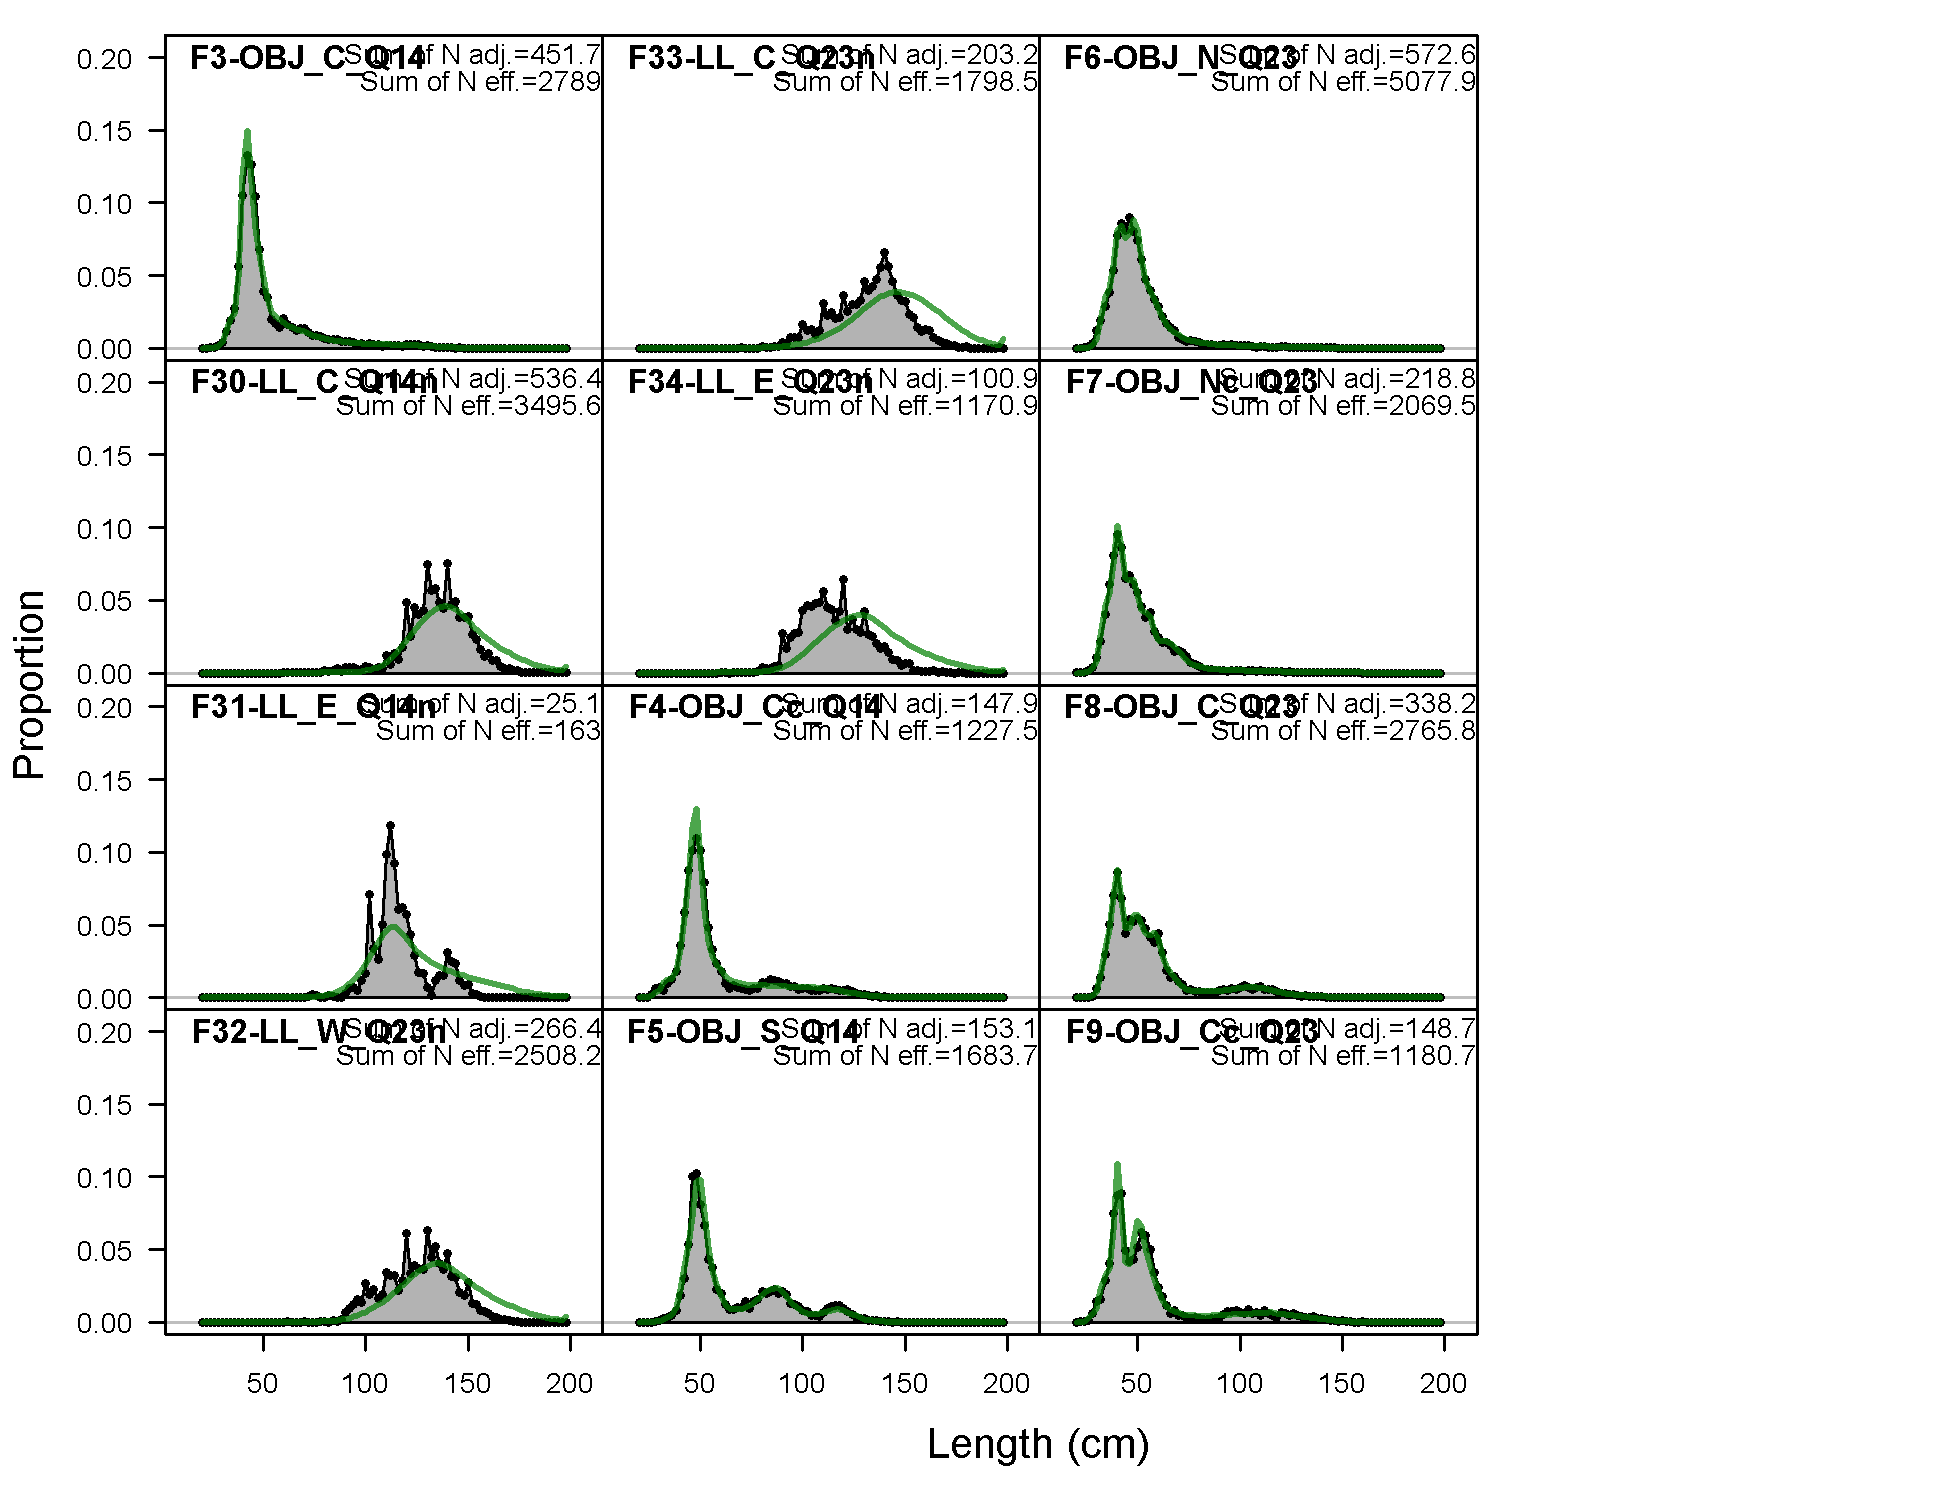
Length comps, whole catch, F34-LL_E_Q23n (plot 1 of 4).
'N adj.' is the input sample size after data-weighting adjustment. N eff. is the calculated effective sample size used in the McAllister-Iannelli tuning method.
file: comp_lenfit_flt34mkt0_page1.png
Length comps, whole catch, F34-LL_E_Q23n (plot 2 of 4)
file: comp_lenfit_flt34mkt0_page2.png
Length comps, whole catch, F34-LL_E_Q23n (plot 3 of 4)
file: comp_lenfit_flt34mkt0_page3.png
Length comps, whole catch, F34-LL_E_Q23n (plot 4 of 4)
file: comp_lenfit_flt34mkt0_page4.png
Pearson residuals, whole catch, F34-LL_E_Q23n (max=13.16) (plot 4 of 4)
Closed bubbles are positive residuals (observed > expected) and open bubbles are negative residuals (observed < expected).
file: comp_lenfit_residsflt34mkt0_page4.png
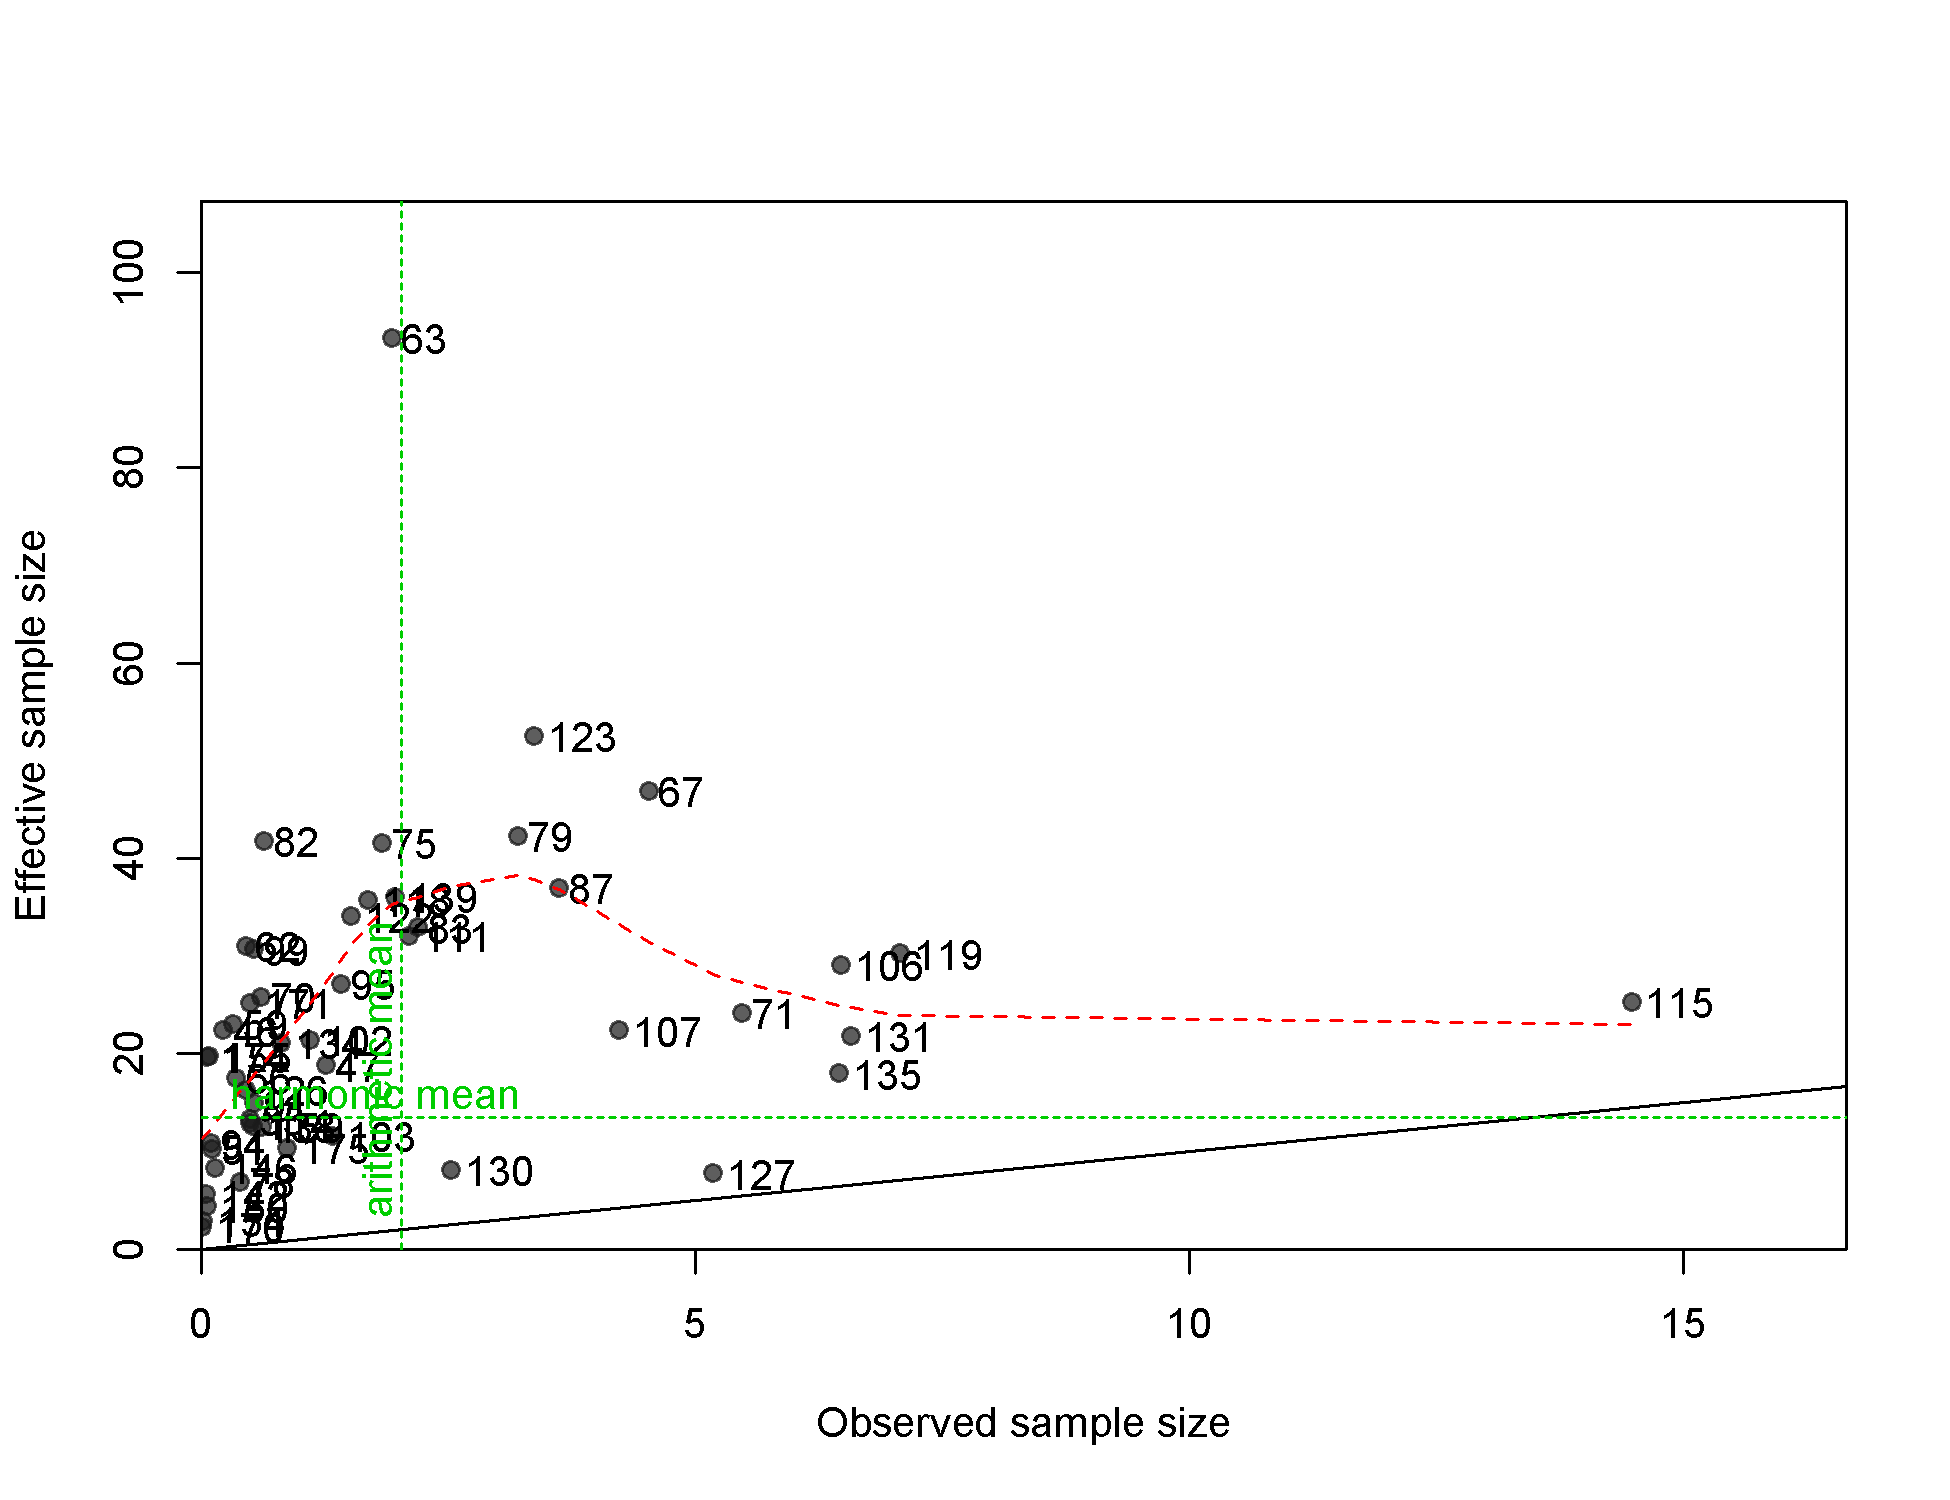
N-EffN comparison, Length comps, whole catch, F34-LL_E_Q23n
file: comp_lenfit_sampsize_flt34mkt0.png
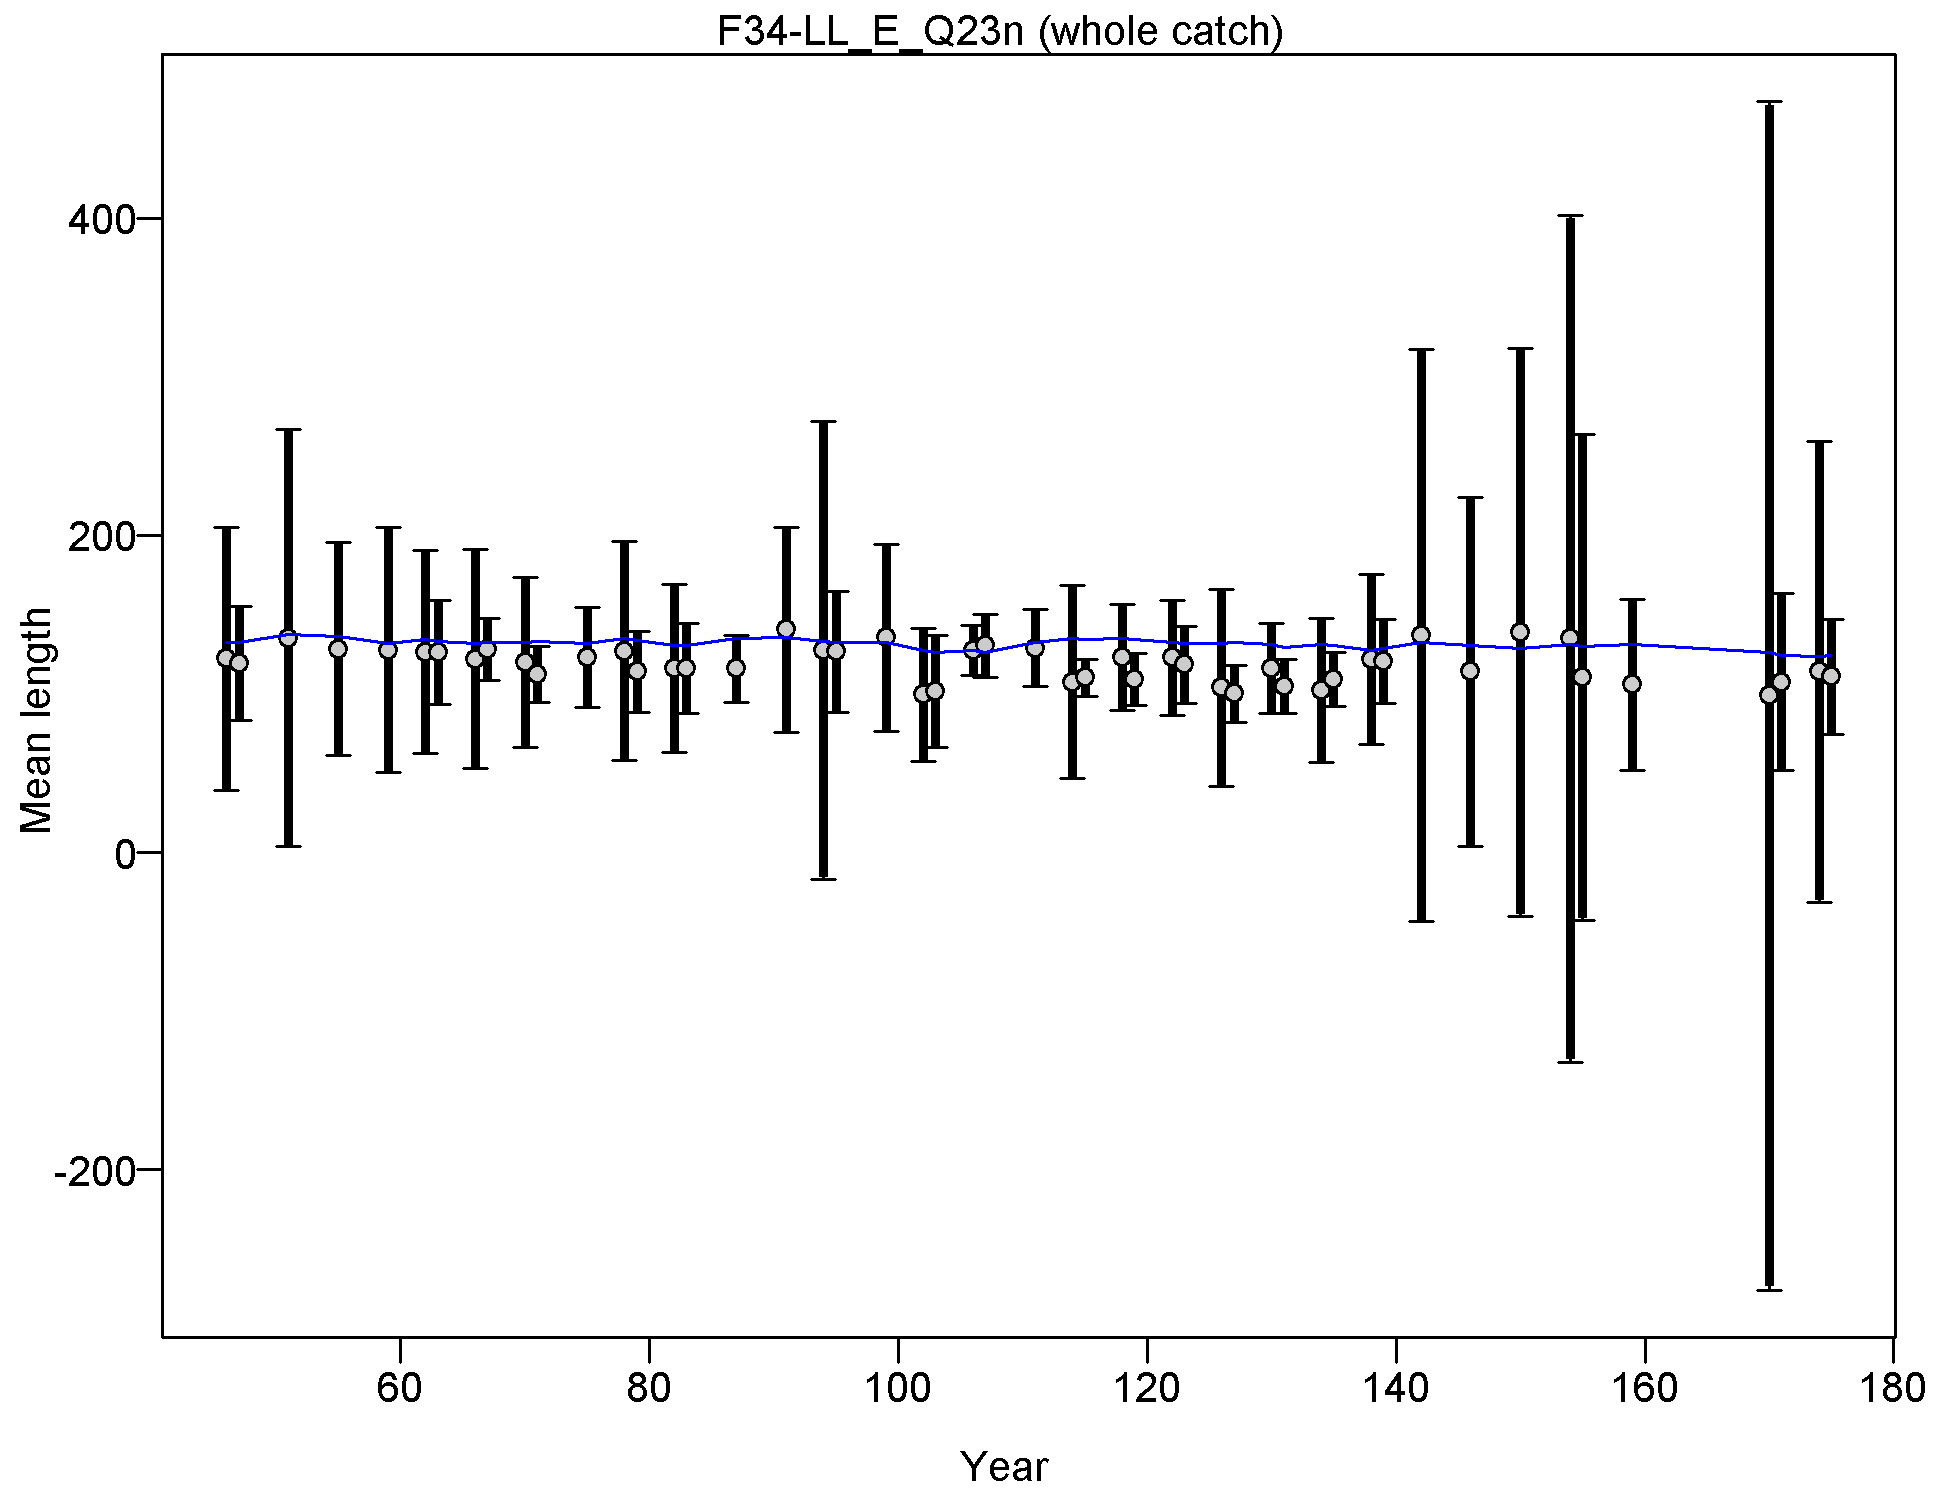
Mean length for F34-LL_E_Q23n with 95% confidence intervals based on current samples sizes.
Francis data weighting method TA1.8: thinner intervals (with capped ends) show result of further adjusting sample sizes based on suggested multiplier (with 95% interval) for len data from F34-LL_E_Q23n:
0.9886 (0.6306-2.3767)
For more info, see
Francis, R.I.C.C. (2011). Data weighting in statistical fisheries stock assessment models. Can. J. Fish. Aquat. Sci. 68: 1124-1138. https://doi.org/10.1139/f2011-025
file: comp_lenfit_data_weighting_TA1.8_F34-LL_E_Q23n.png
Length comps, aggregated across time by fleet.
Labels 'retained' and 'discard' indicate discarded or retained sampled for each fleet. Panels without this designation represent the whole catch.
(plot 1 of 2)
file: comp_lenfit__page1_aggregated_across_time.png
Length comps, aggregated across time by fleet.
Labels 'retained' and 'discard' indicate discarded or retained sampled for each fleet. Panels without this designation represent the whole catch.
(plot 1 of 2).
Labels 'retained' and 'discard' indicate discarded or retained sampled for each fleet. Panels without this designation represent the whole catch.
(plot 2 of 2)
file: comp_lenfit__page2_aggregated_across_time.png
Pearson residuals, comparing across fleets (plot 1 of 7)
Closed bubbles are positive residuals (observed > expected) and open bubbles are negative residuals (observed < expected).
file: comp_lenfit__page1_multi-fleet_comparison.png
Pearson residuals, comparing across fleets (plot 2 of 7)
file: comp_lenfit__page2_multi-fleet_comparison.png
Pearson residuals, comparing across fleets (plot 3 of 7)
file: comp_lenfit__page3_multi-fleet_comparison.png
Pearson residuals, comparing across fleets (plot 4 of 7)
file: comp_lenfit__page4_multi-fleet_comparison.png
Pearson residuals, comparing across fleets (plot 5 of 7)
file: comp_lenfit__page5_multi-fleet_comparison.png
Pearson residuals, comparing across fleets (plot 6 of 7)
file: comp_lenfit__page6_multi-fleet_comparison.png
Pearson residuals, comparing across fleets (plot 7 of 7)
file: comp_lenfit__page7_multi-fleet_comparison.png
Size comps, size method 1, whole catch, S1-PS_DEL_VAST (plot 1 of 9).
'N adj.' is the input sample size after data-weighting adjustment. N eff. is the calculated effective sample size used in the McAllister-Iannelli tuning method.
file: comp_sizefit_method1_flt41mkt0_page1.png
Size comps, size method 1, whole catch, S1-PS_DEL_VAST (plot 2 of 9)
file: comp_sizefit_method1_flt41mkt0_page2.png
Size comps, size method 1, whole catch, S1-PS_DEL_VAST (plot 3 of 9)
file: comp_sizefit_method1_flt41mkt0_page3.png
Size comps, size method 1, whole catch, S1-PS_DEL_VAST (plot 4 of 9)
file: comp_sizefit_method1_flt41mkt0_page4.png
Size comps, size method 1, whole catch, S1-PS_DEL_VAST (plot 5 of 9)
file: comp_sizefit_method1_flt41mkt0_page5.png
Size comps, size method 1, whole catch, S1-PS_DEL_VAST (plot 6 of 9)
file: comp_sizefit_method1_flt41mkt0_page6.png
Size comps, size method 1, whole catch, S1-PS_DEL_VAST (plot 7 of 9)
file: comp_sizefit_method1_flt41mkt0_page7.png
Size comps, size method 1, whole catch, S1-PS_DEL_VAST (plot 8 of 9)
file: comp_sizefit_method1_flt41mkt0_page8.png
Size comps, size method 1, whole catch, S1-PS_DEL_VAST (plot 9 of 9)
file: comp_sizefit_method1_flt41mkt0_page9.png

Pearson residuals, whole catch, S1-PS_DEL_VAST (max=5.81) (plot 9 of 9)
Closed bubbles are positive residuals (observed > expected) and open bubbles are negative residuals (observed < expected).
file: comp_sizefit_method1_residsflt41mkt0_page9.png
N-EffN comparison, Size comps, size method 1, whole catch, S1-PS_DEL_VAST
file: comp_sizefit_method1_sampsize_flt41mkt0.png

Mean size for S1-PS_DEL_VAST with 95% confidence intervals based on current samples sizes.
Francis data weighting method TA1.8: thinner intervals (with capped ends) show result of further adjusting sample sizes based on suggested multiplier (with 95% interval) for size data from S1-PS_DEL_VAST:
0.9029 (0.7322-1.1687)
For more info, see
Francis, R.I.C.C. (2011). Data weighting in statistical fisheries stock assessment models. Can. J. Fish. Aquat. Sci. 68: 1124-1138. https://doi.org/10.1139/f2011-025
file: comp_sizefit_method1_data_weighting_TA1.8_S1-PS_DEL_VAST.png

Size comps, size method 1, aggregated across time by fleet.
Labels 'retained' and 'discard' indicate discarded or retained sampled for each fleet. Panels without this designation represent the whole catch.
file: comp_sizefit_method1__aggregated_across_time.png