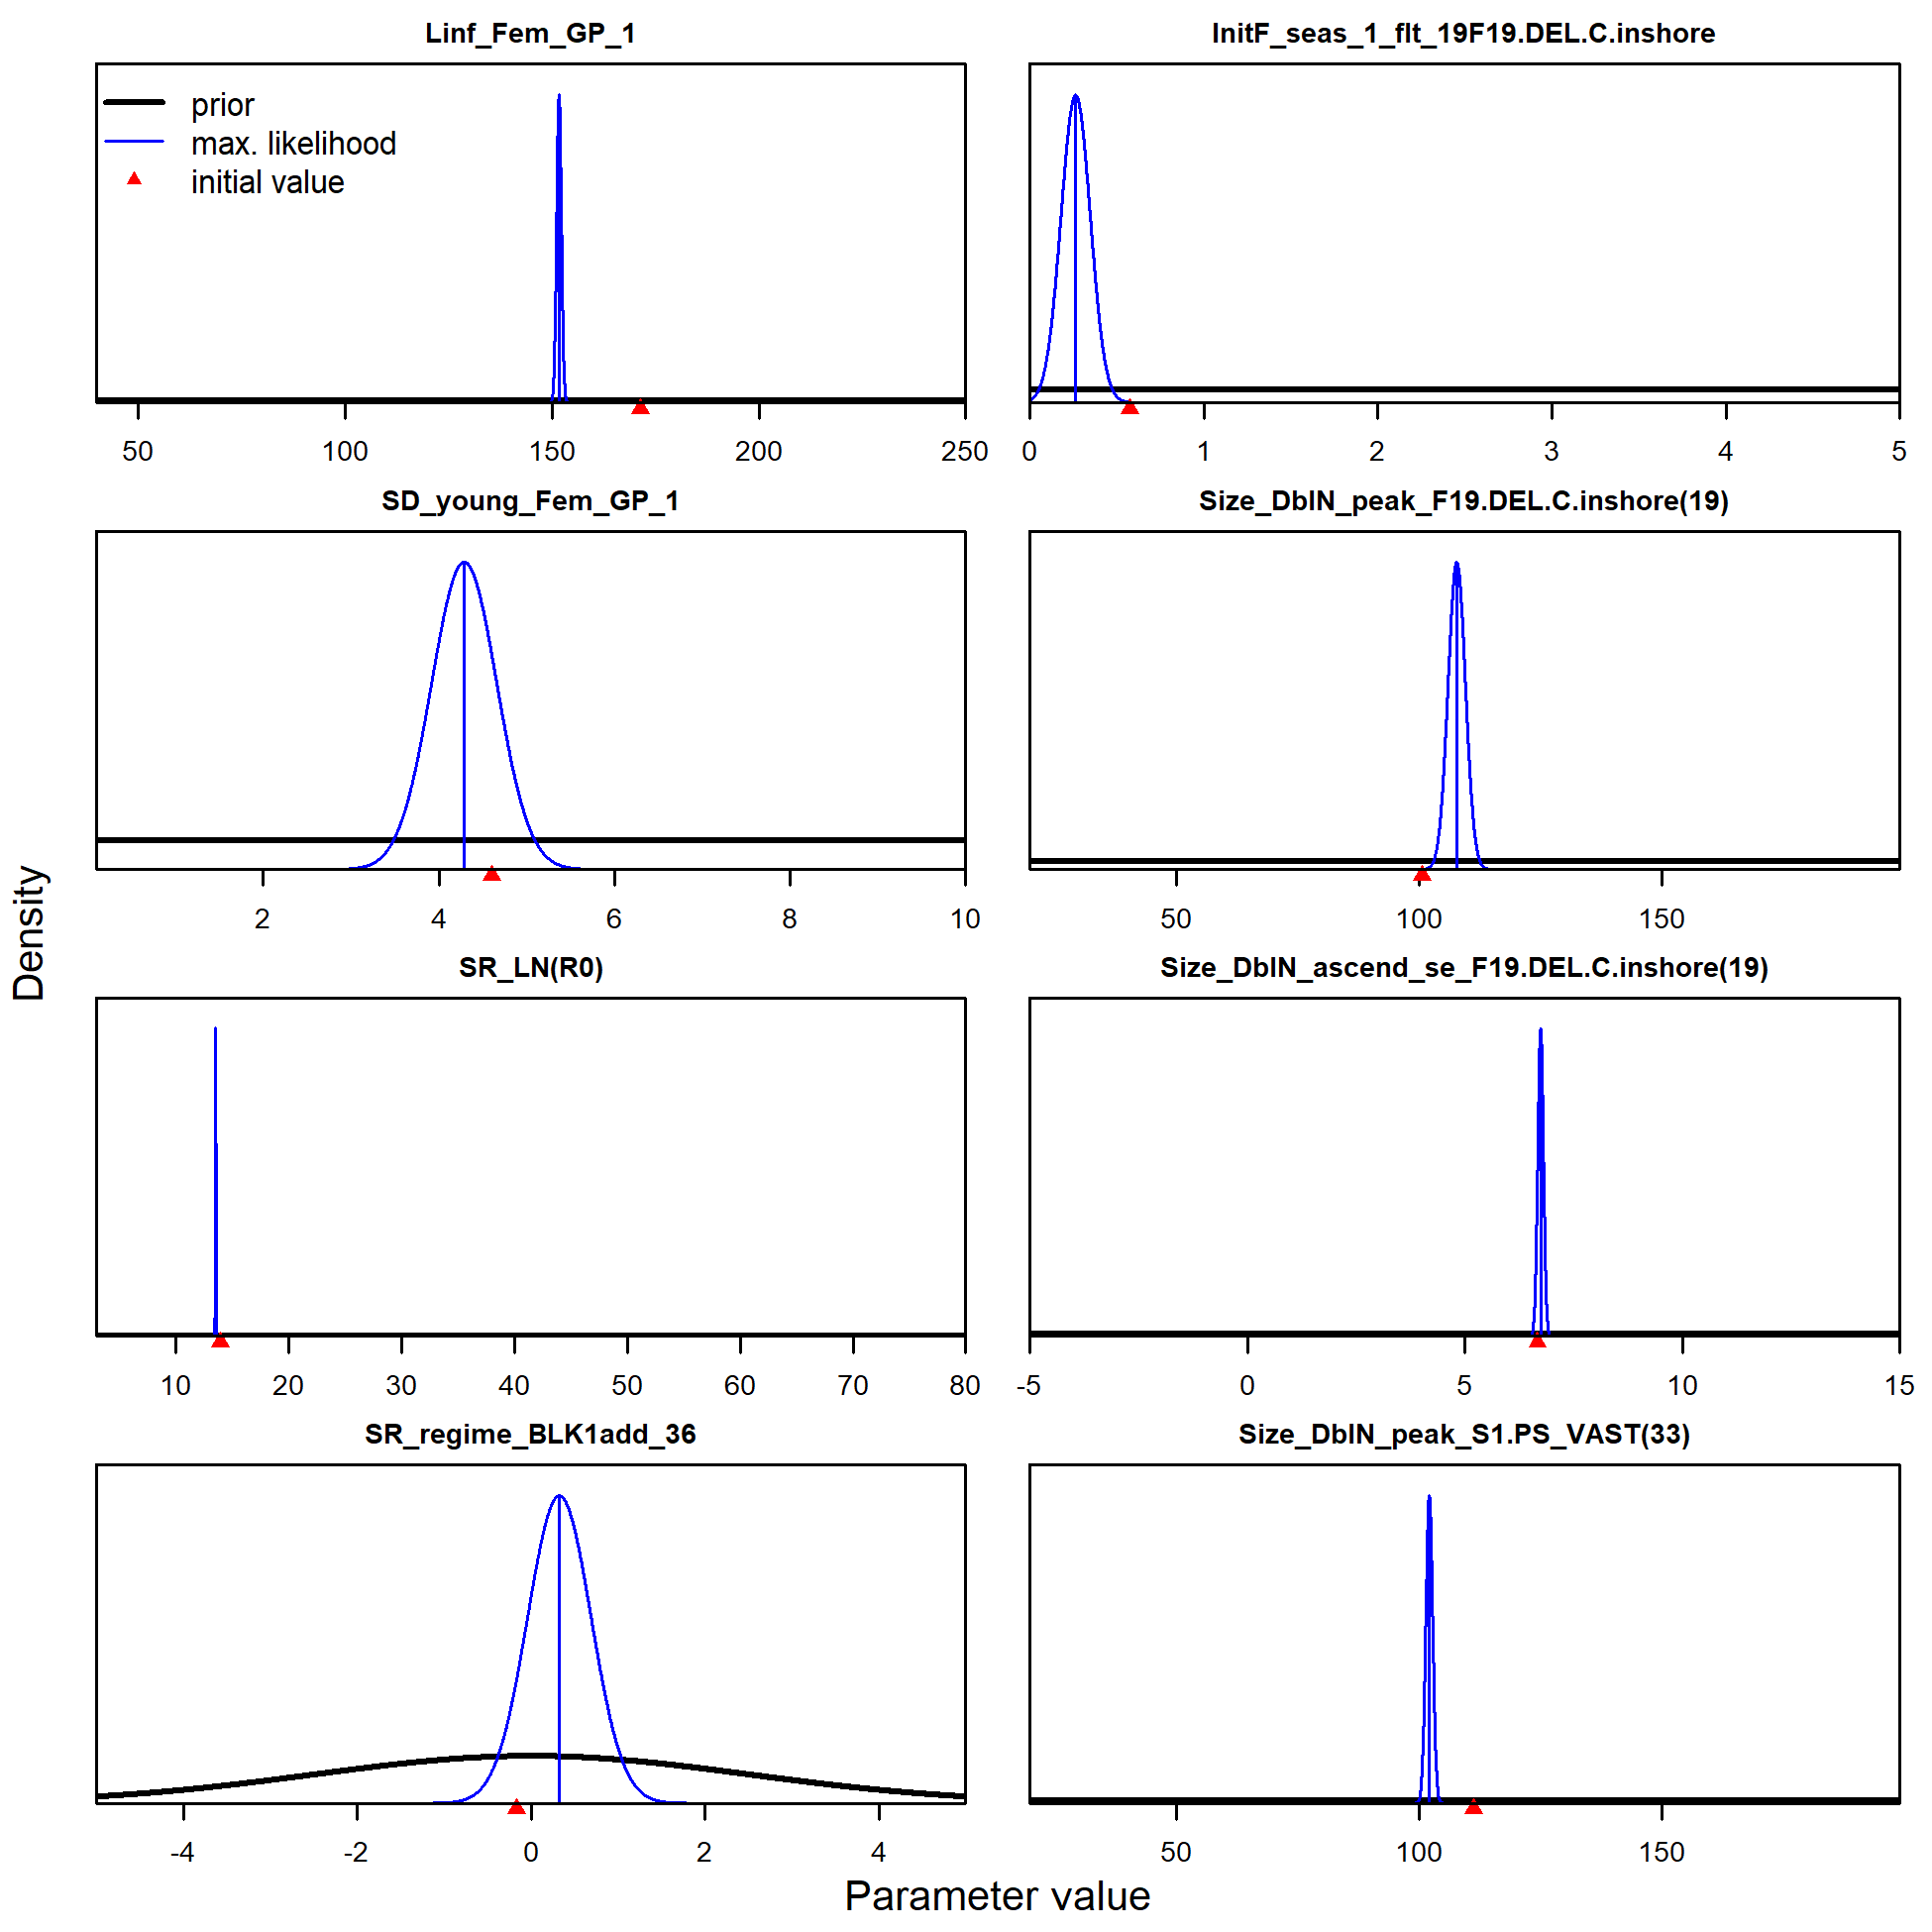
Parameter distribution plots (plot 1 of 3).
Deviation parameters are not included.
Plotting range is equal to input limits on parameters. Use fitrange = TRUE to scale the range to the estimates.
file: parameter_distributions_page1.png
Parameter distribution plots (plot 1 of 3).
Deviation parameters are not included.
Plotting range is equal to input limits on parameters. Use fitrange = TRUE to scale the range to the estimates.
file: parameter_distributions_page1.png
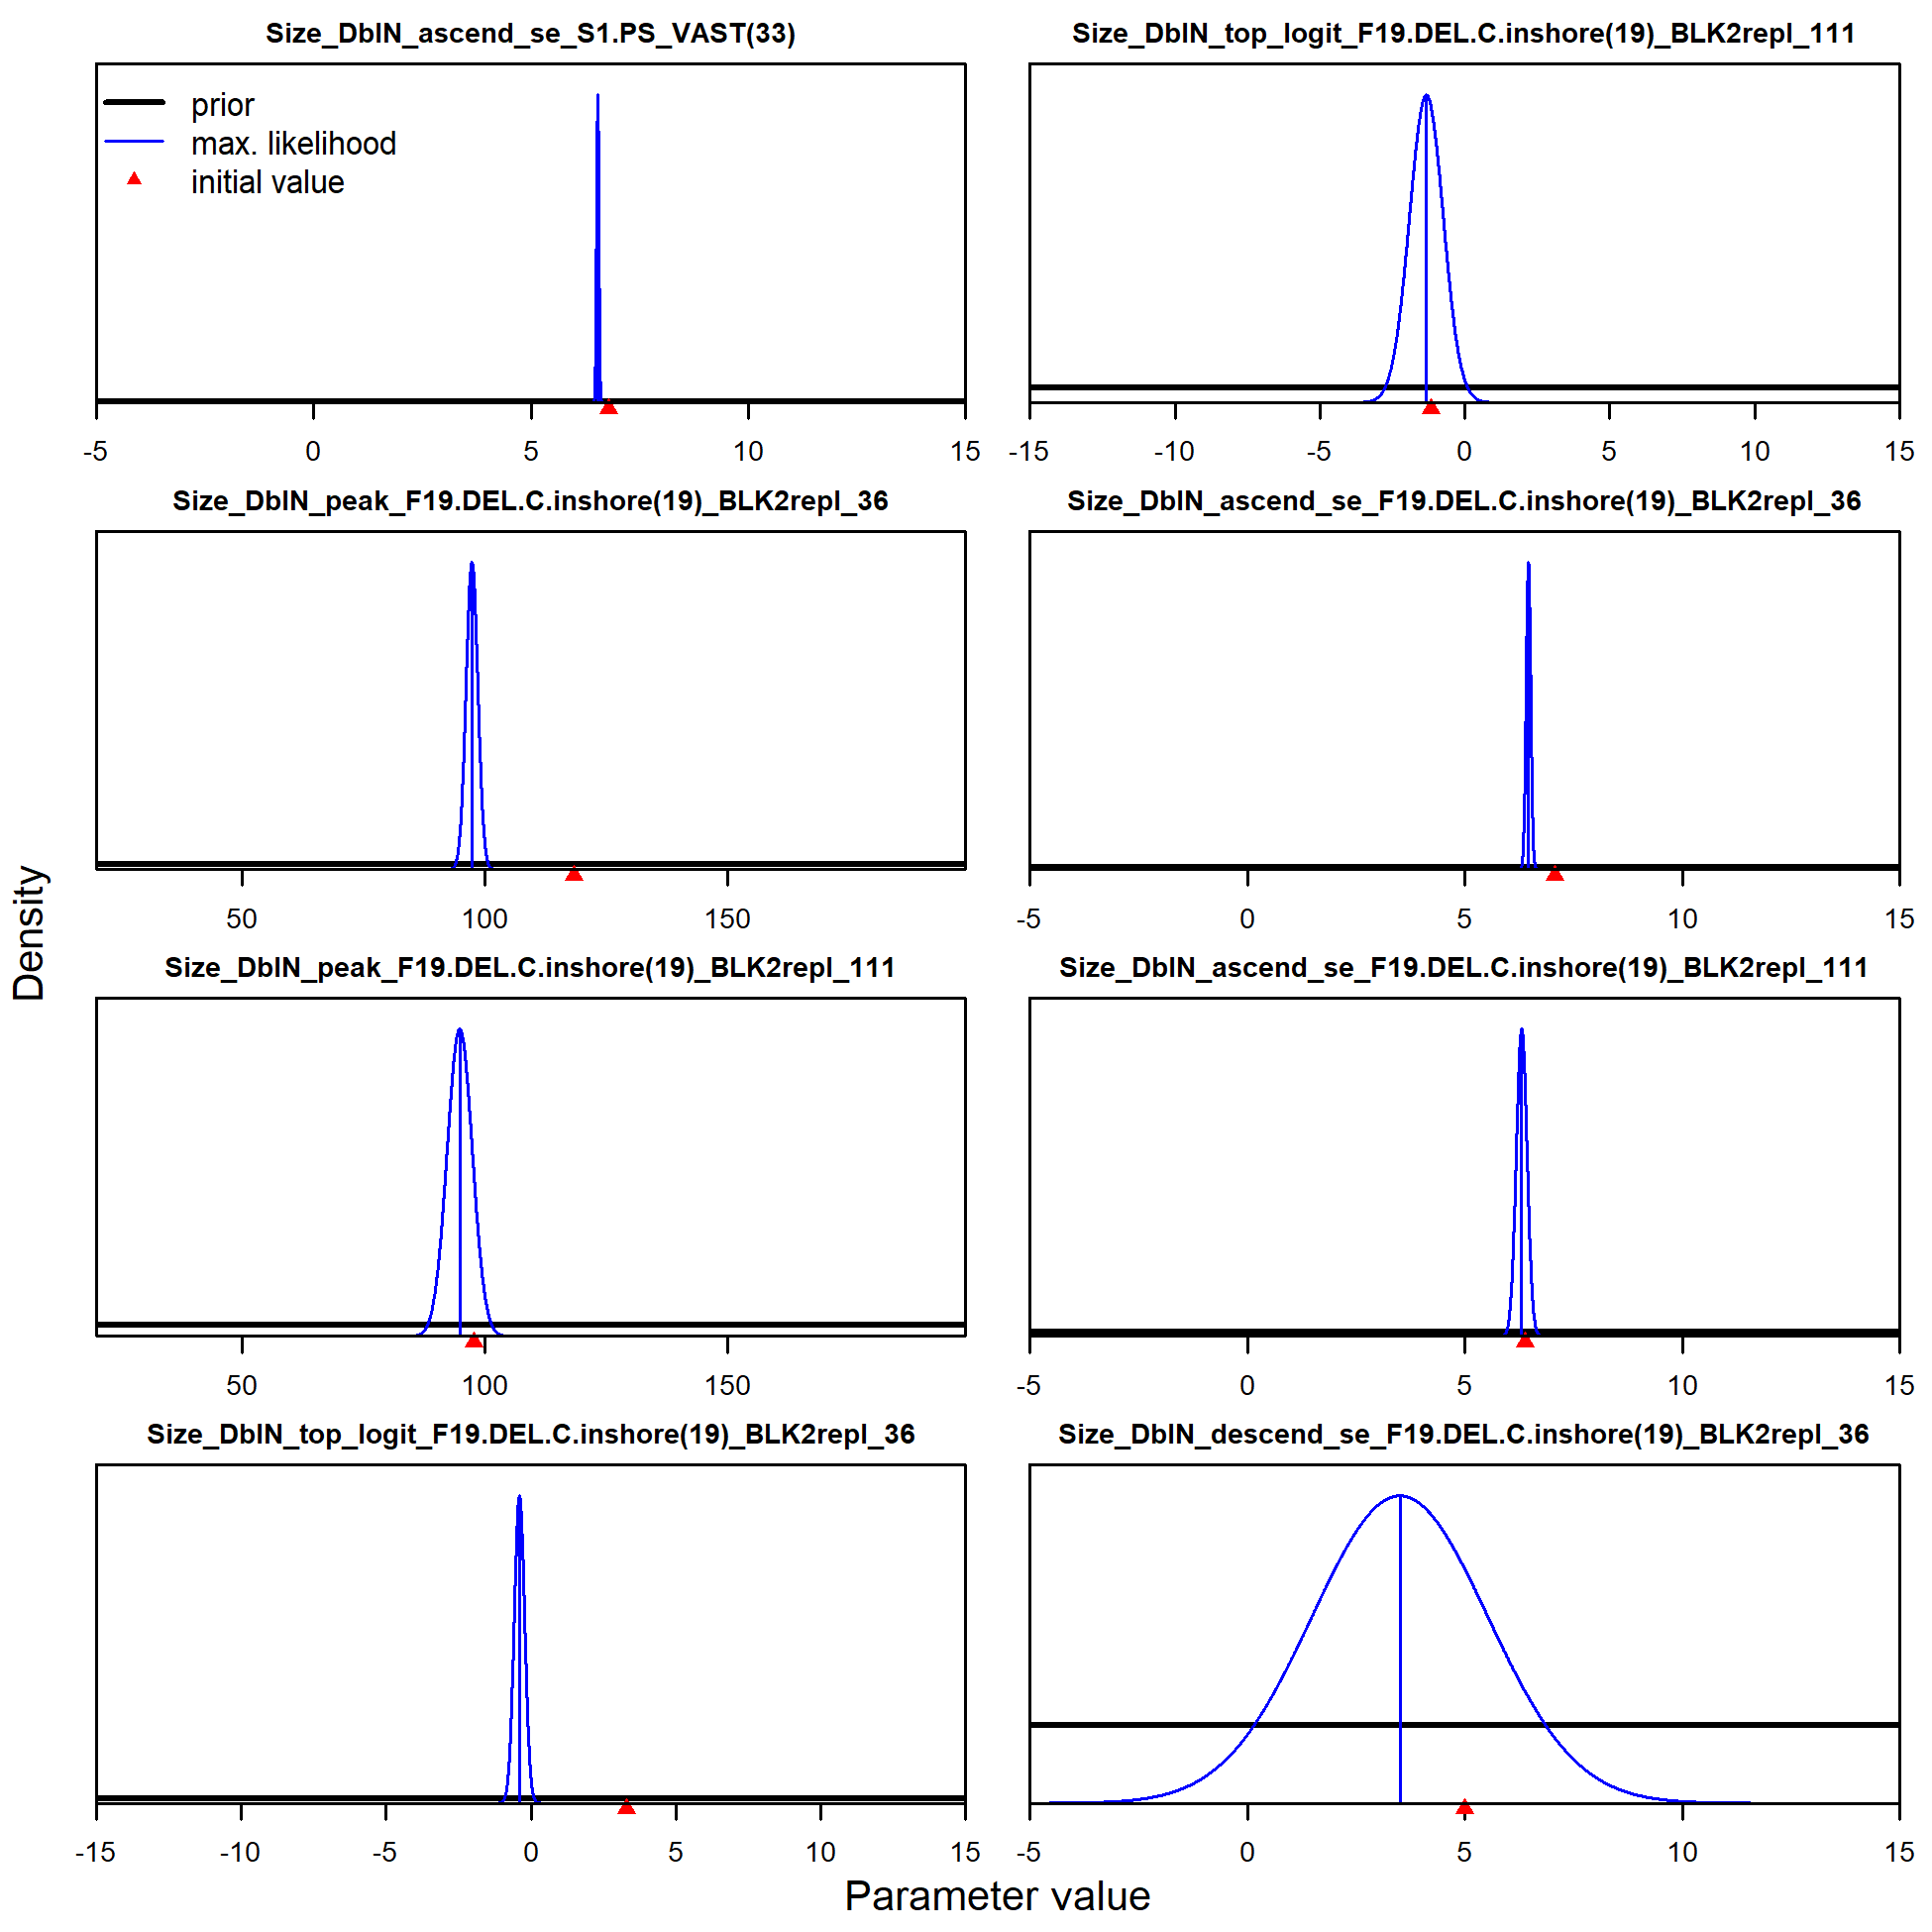
Parameter distribution plots (plot 2 of 3).
file: parameter_distributions_page2.png
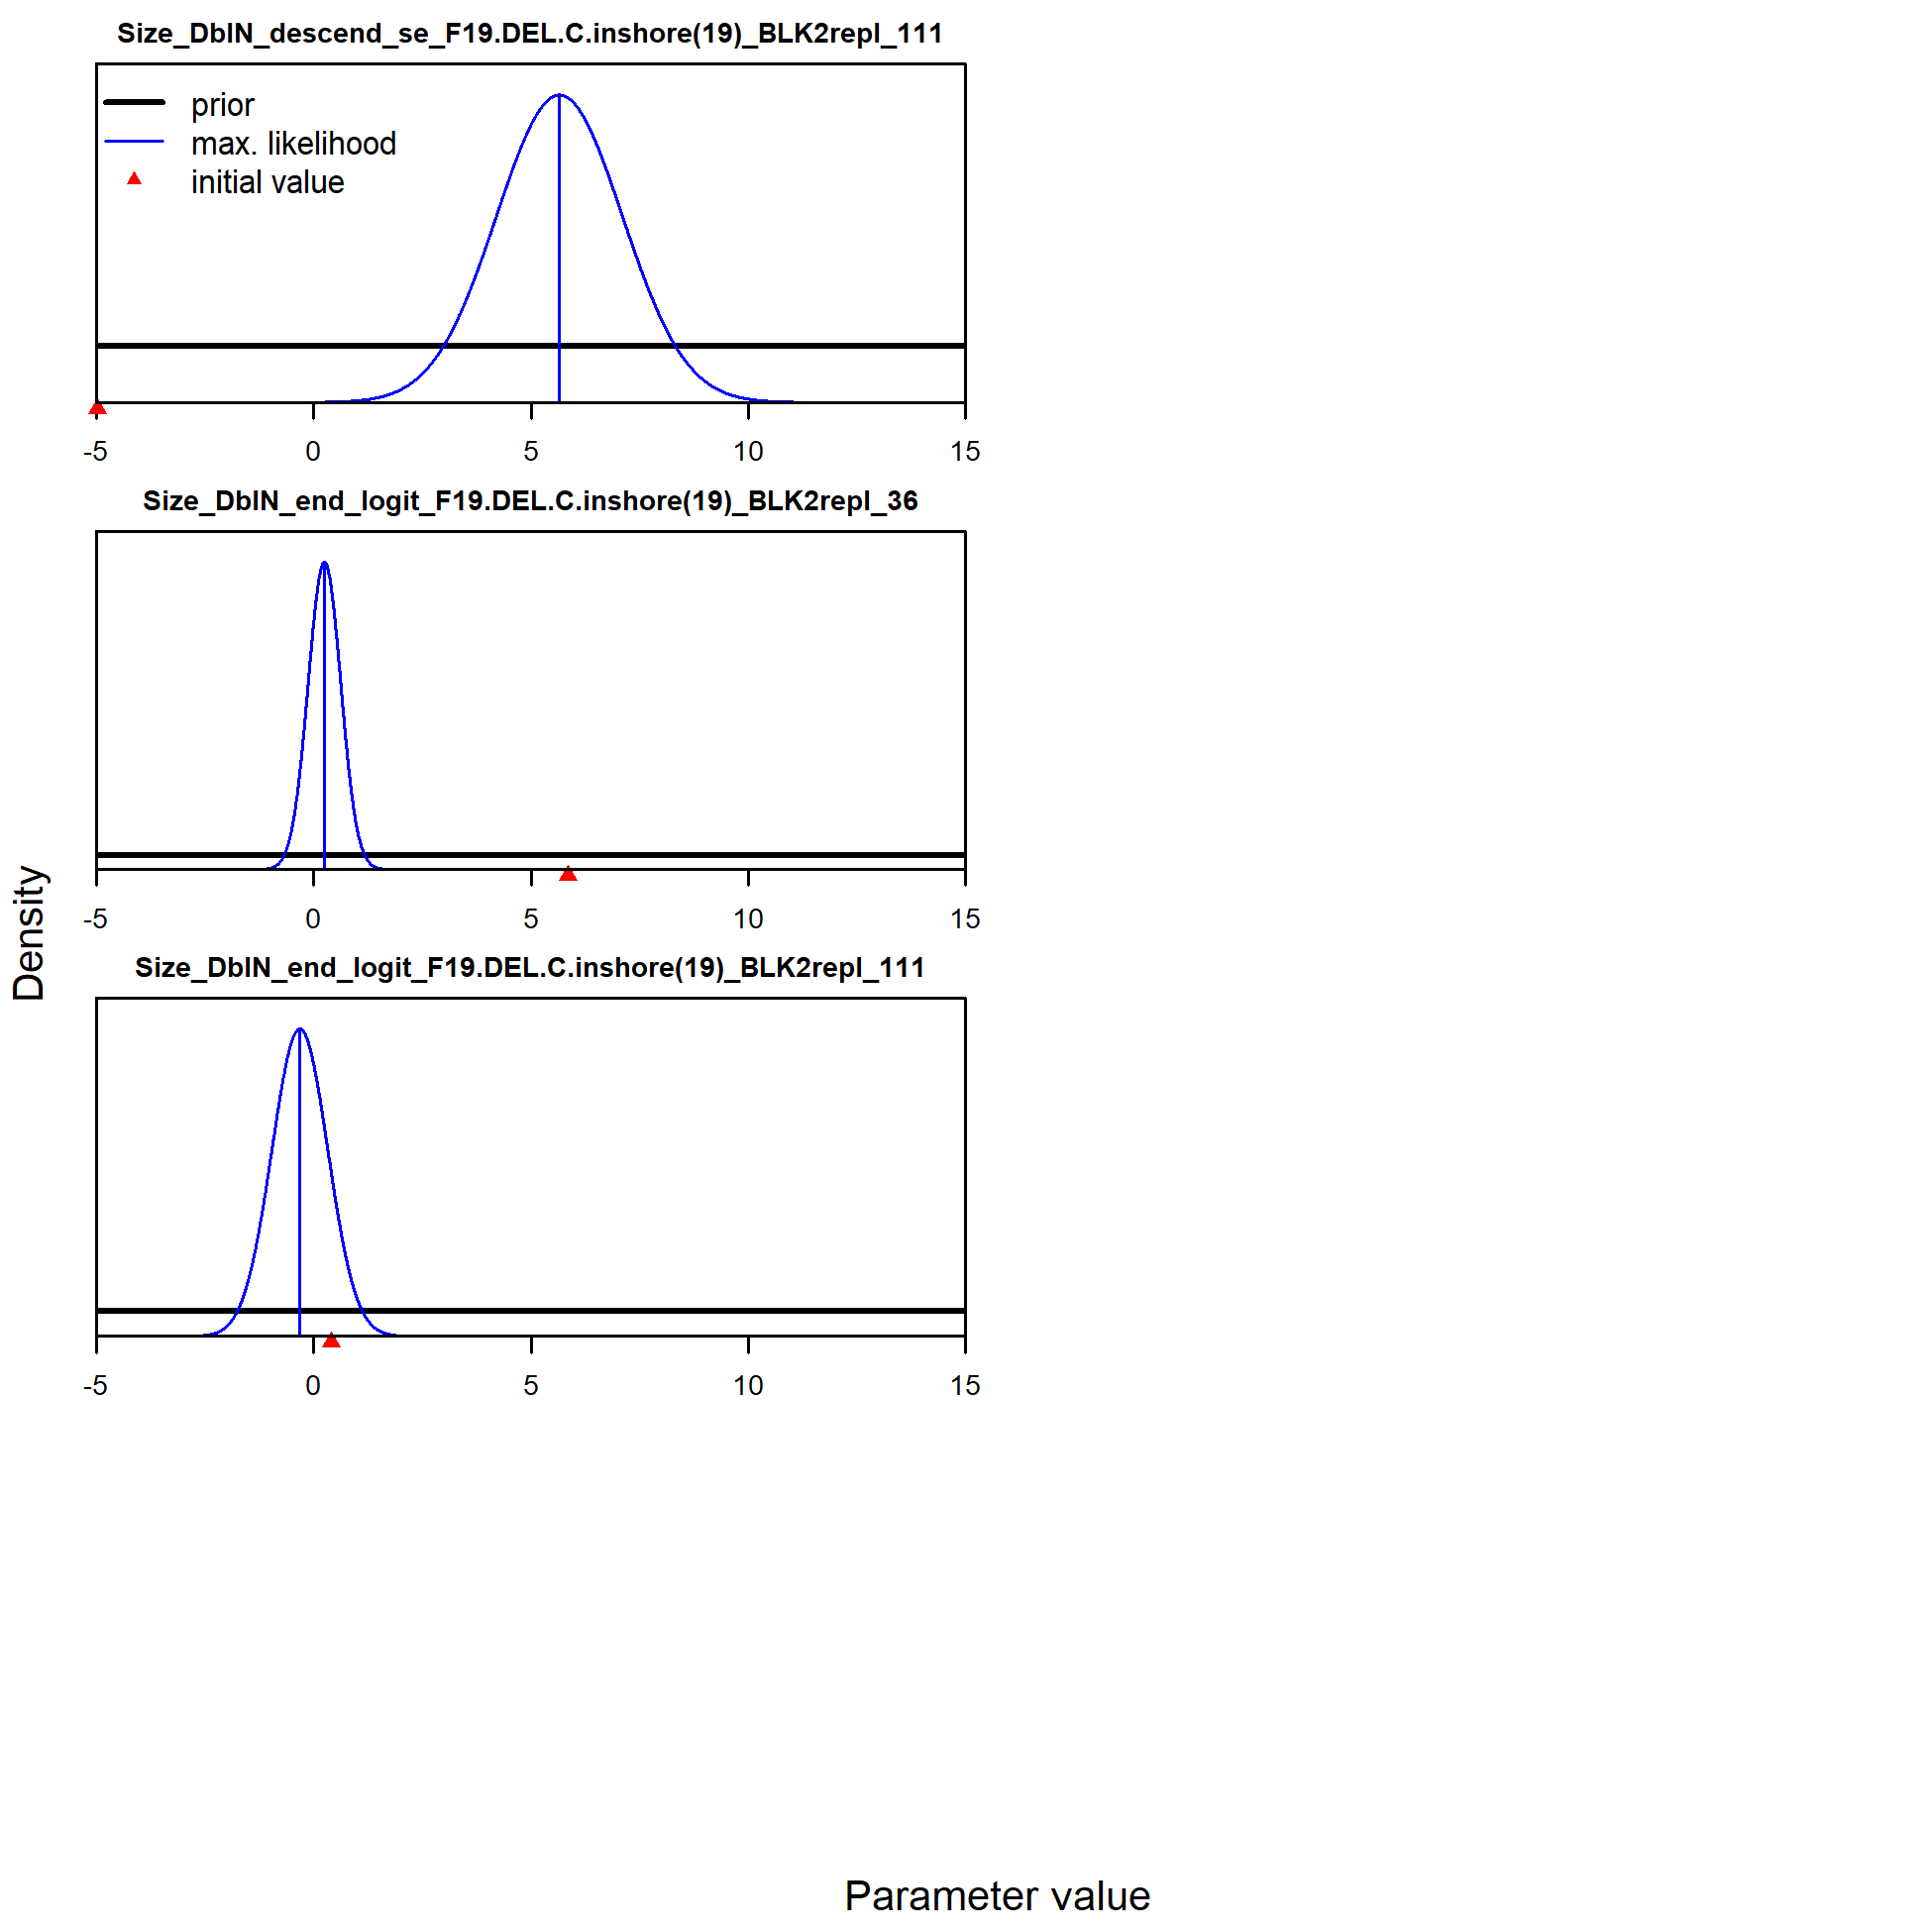
Parameter distribution plots (plot 3 of 3).
file: parameter_distributions_page3.png