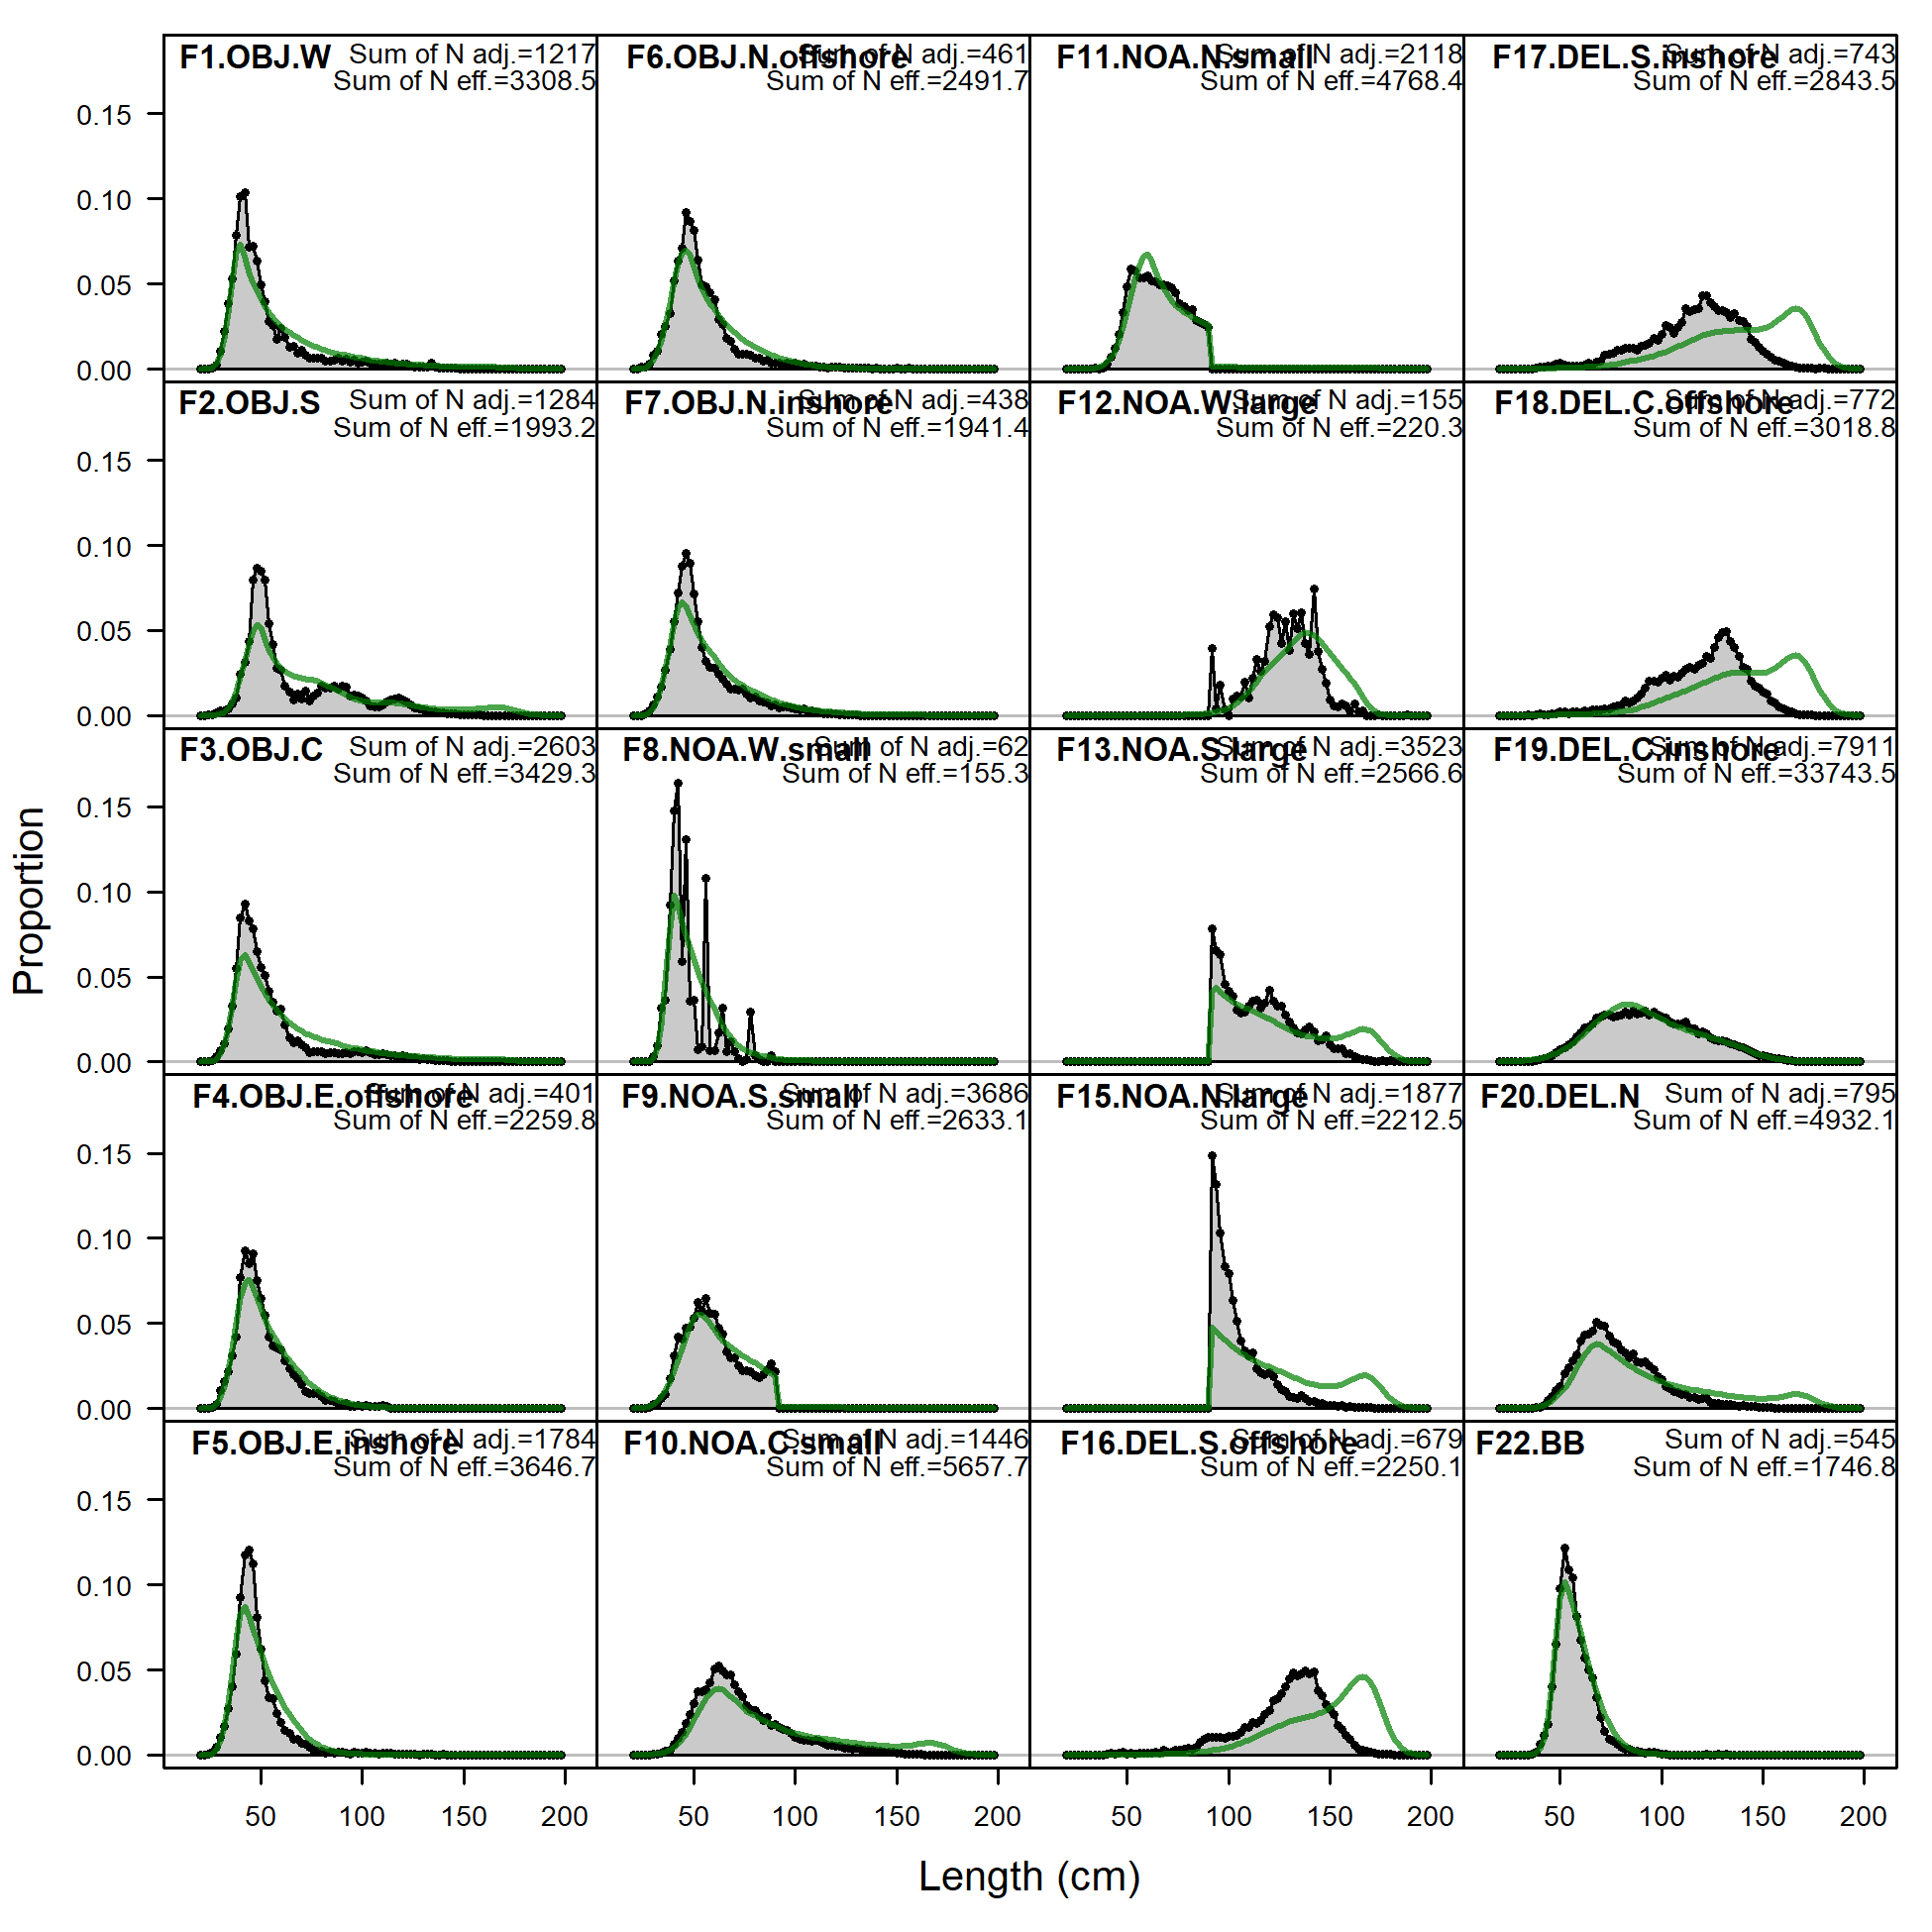
Length comps, aggregated across time by fleet.
Labels 'retained' and 'discard' indicate discarded or retained sampled for each fleet. Panels without this designation represent the whole catch.
file: comp_lenfit__aggregated_across_time.png
Length comps, aggregated across time by fleet.
Labels 'retained' and 'discard' indicate discarded or retained sampled for each fleet. Panels without this designation represent the whole catch.
file: comp_lenfit__aggregated_across_time.png
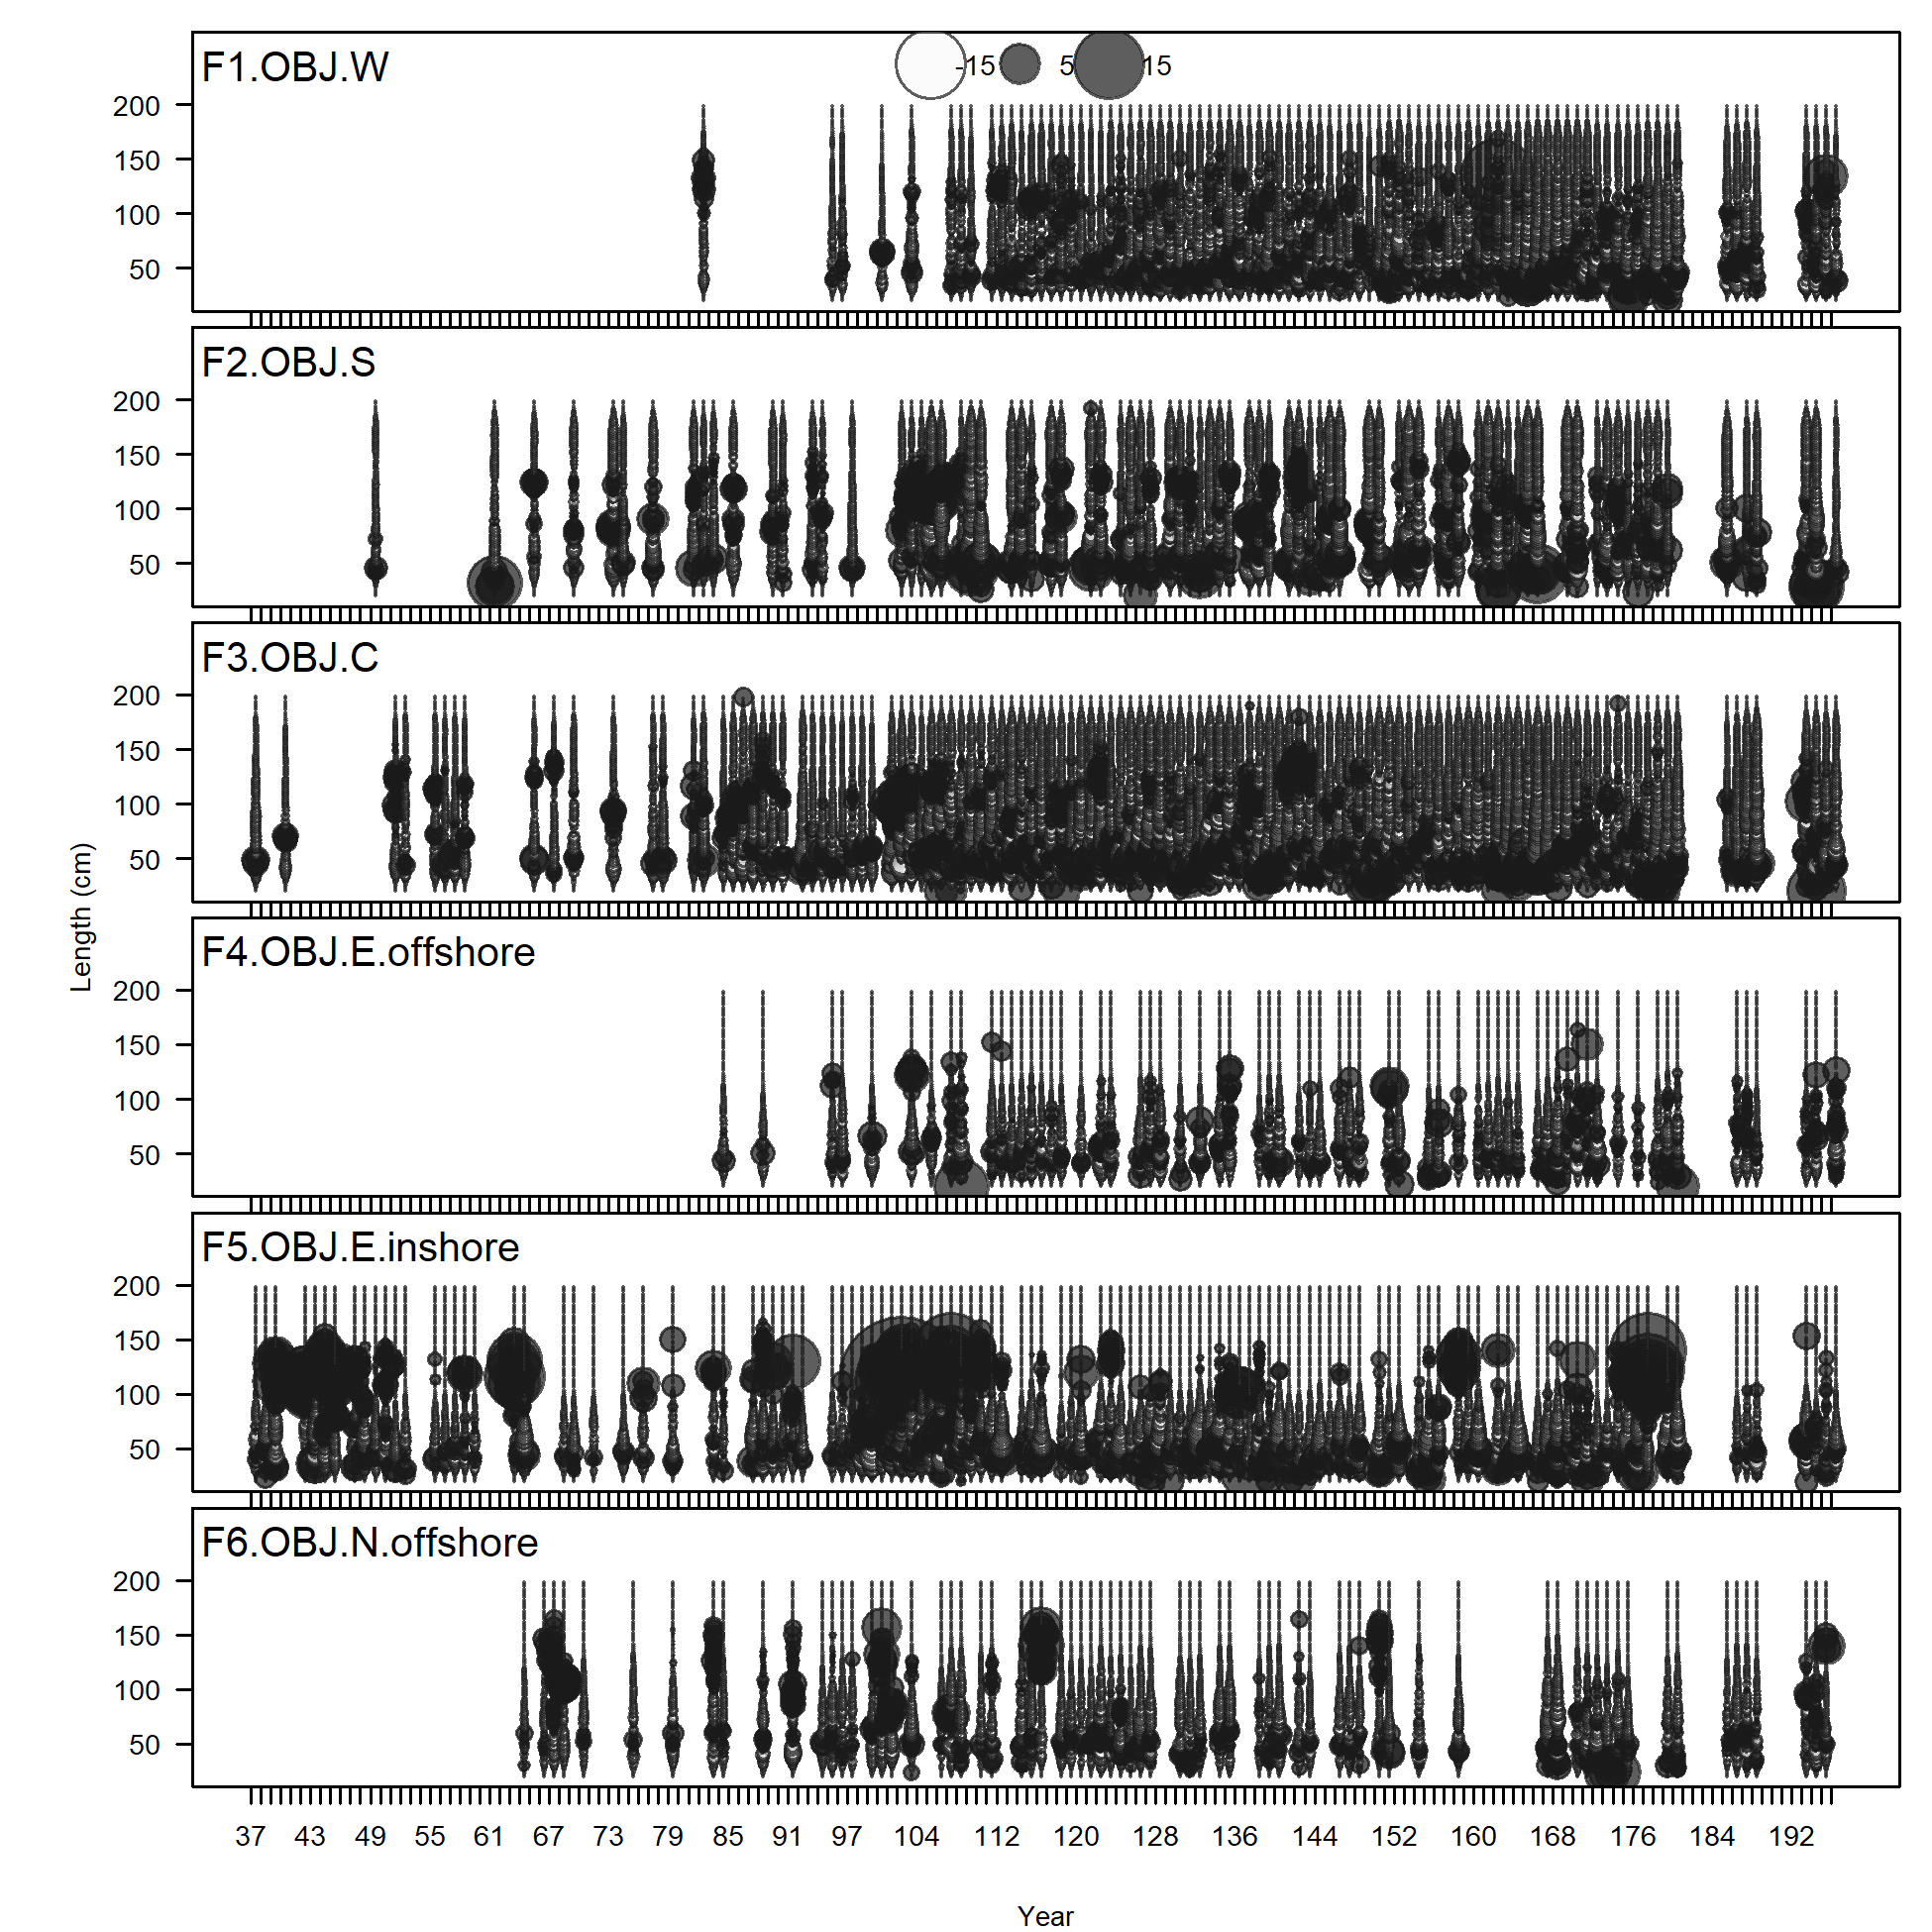
Pearson residuals, comparing across fleets (plot 1 of 4)
Closed bubbles are positive residuals (observed > expected) and open bubbles are negative residuals (observed < expected).
file: comp_lenfit__page1_multi-fleet_comparison.png
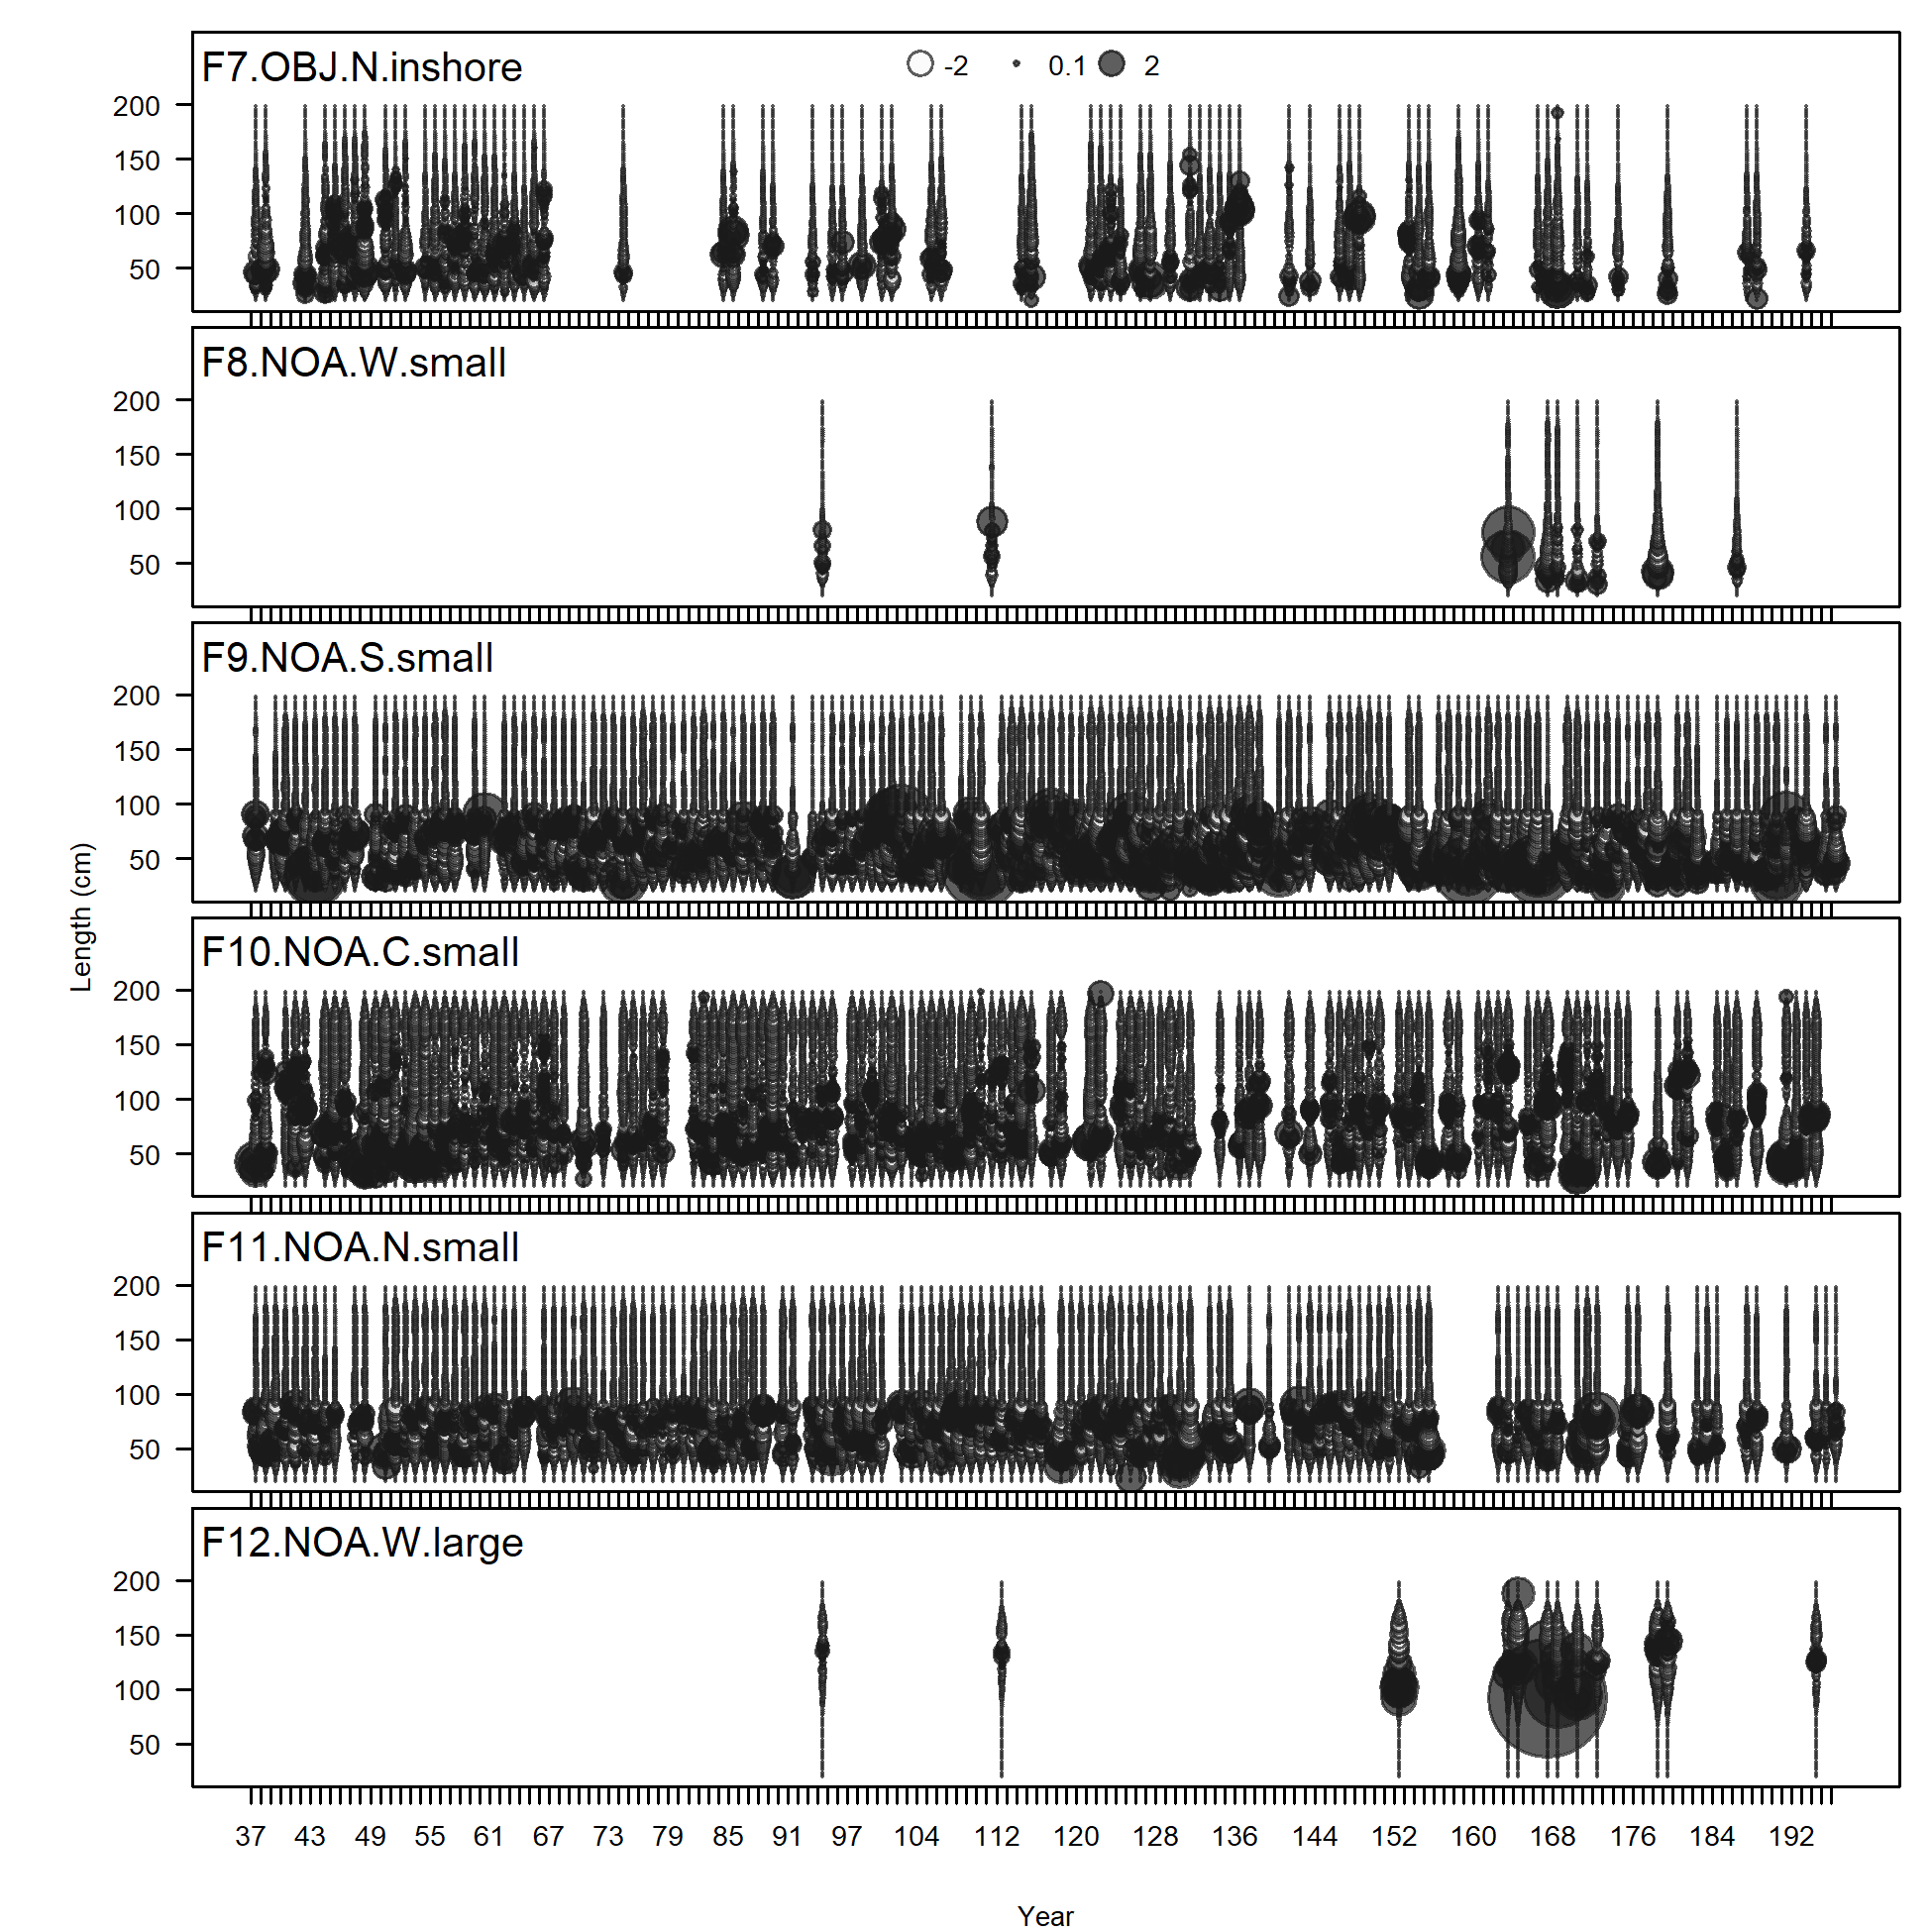
Pearson residuals, comparing across fleets (plot 2 of 4)
file: comp_lenfit__page2_multi-fleet_comparison.png
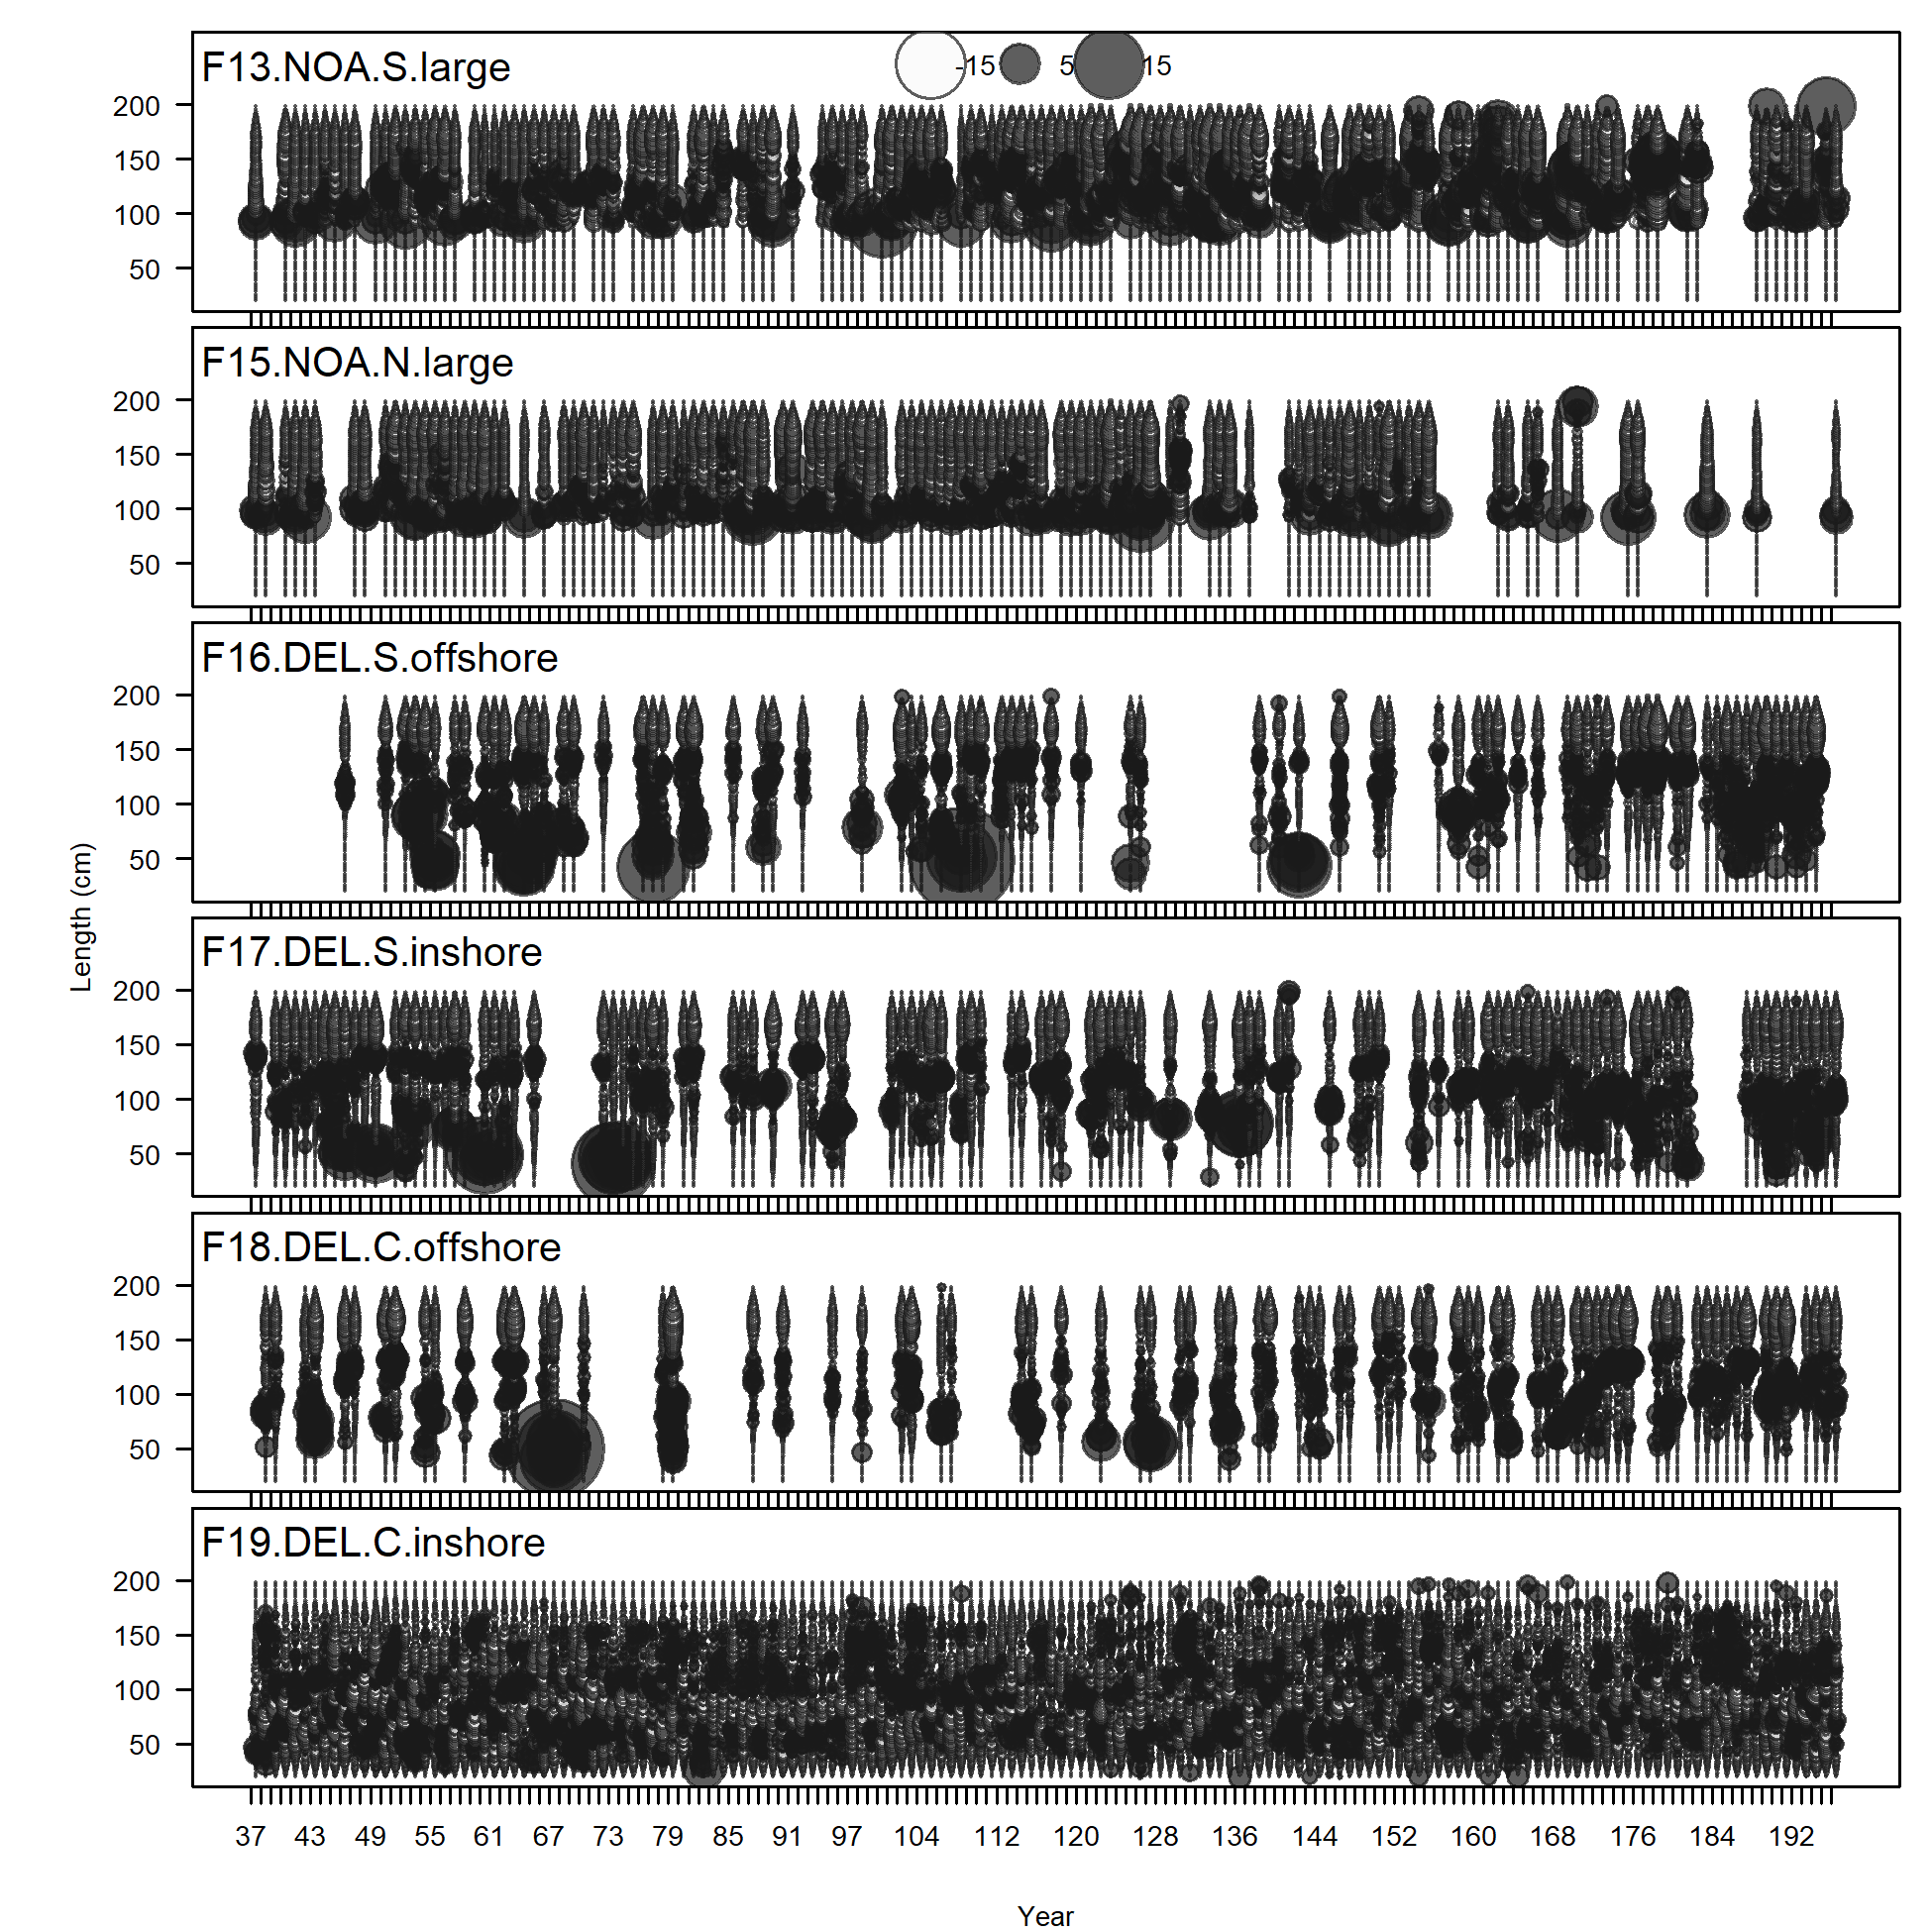
Pearson residuals, comparing across fleets (plot 3 of 4)
file: comp_lenfit__page3_multi-fleet_comparison.png
Pearson residuals, comparing across fleets (plot 4 of 4)
file: comp_lenfit__page4_multi-fleet_comparison.png
Length comps, whole catch, F1.OBJ.W (plot 1 of 4).
'N adj.' is the input sample size after data-weighting adjustment. N eff. is the calculated effective sample size used in the McAllister-Ianelli tuning method.
file: comp_lenfit_flt1mkt0_page1.png
Length comps, whole catch, F1.OBJ.W (plot 1 of 4).
'N adj.' is the input sample size after data-weighting adjustment. N eff. is the calculated effective sample size used in the McAllister-Ianelli tuning method. (plot 2 of 4)
file: comp_lenfit_flt1mkt0_page2.png
Length comps, whole catch, F1.OBJ.W (plot 1 of 4).
'N adj.' is the input sample size after data-weighting adjustment. N eff. is the calculated effective sample size used in the McAllister-Ianelli tuning method. (plot 2 of 4) (plot 3 of 4)
file: comp_lenfit_flt1mkt0_page3.png
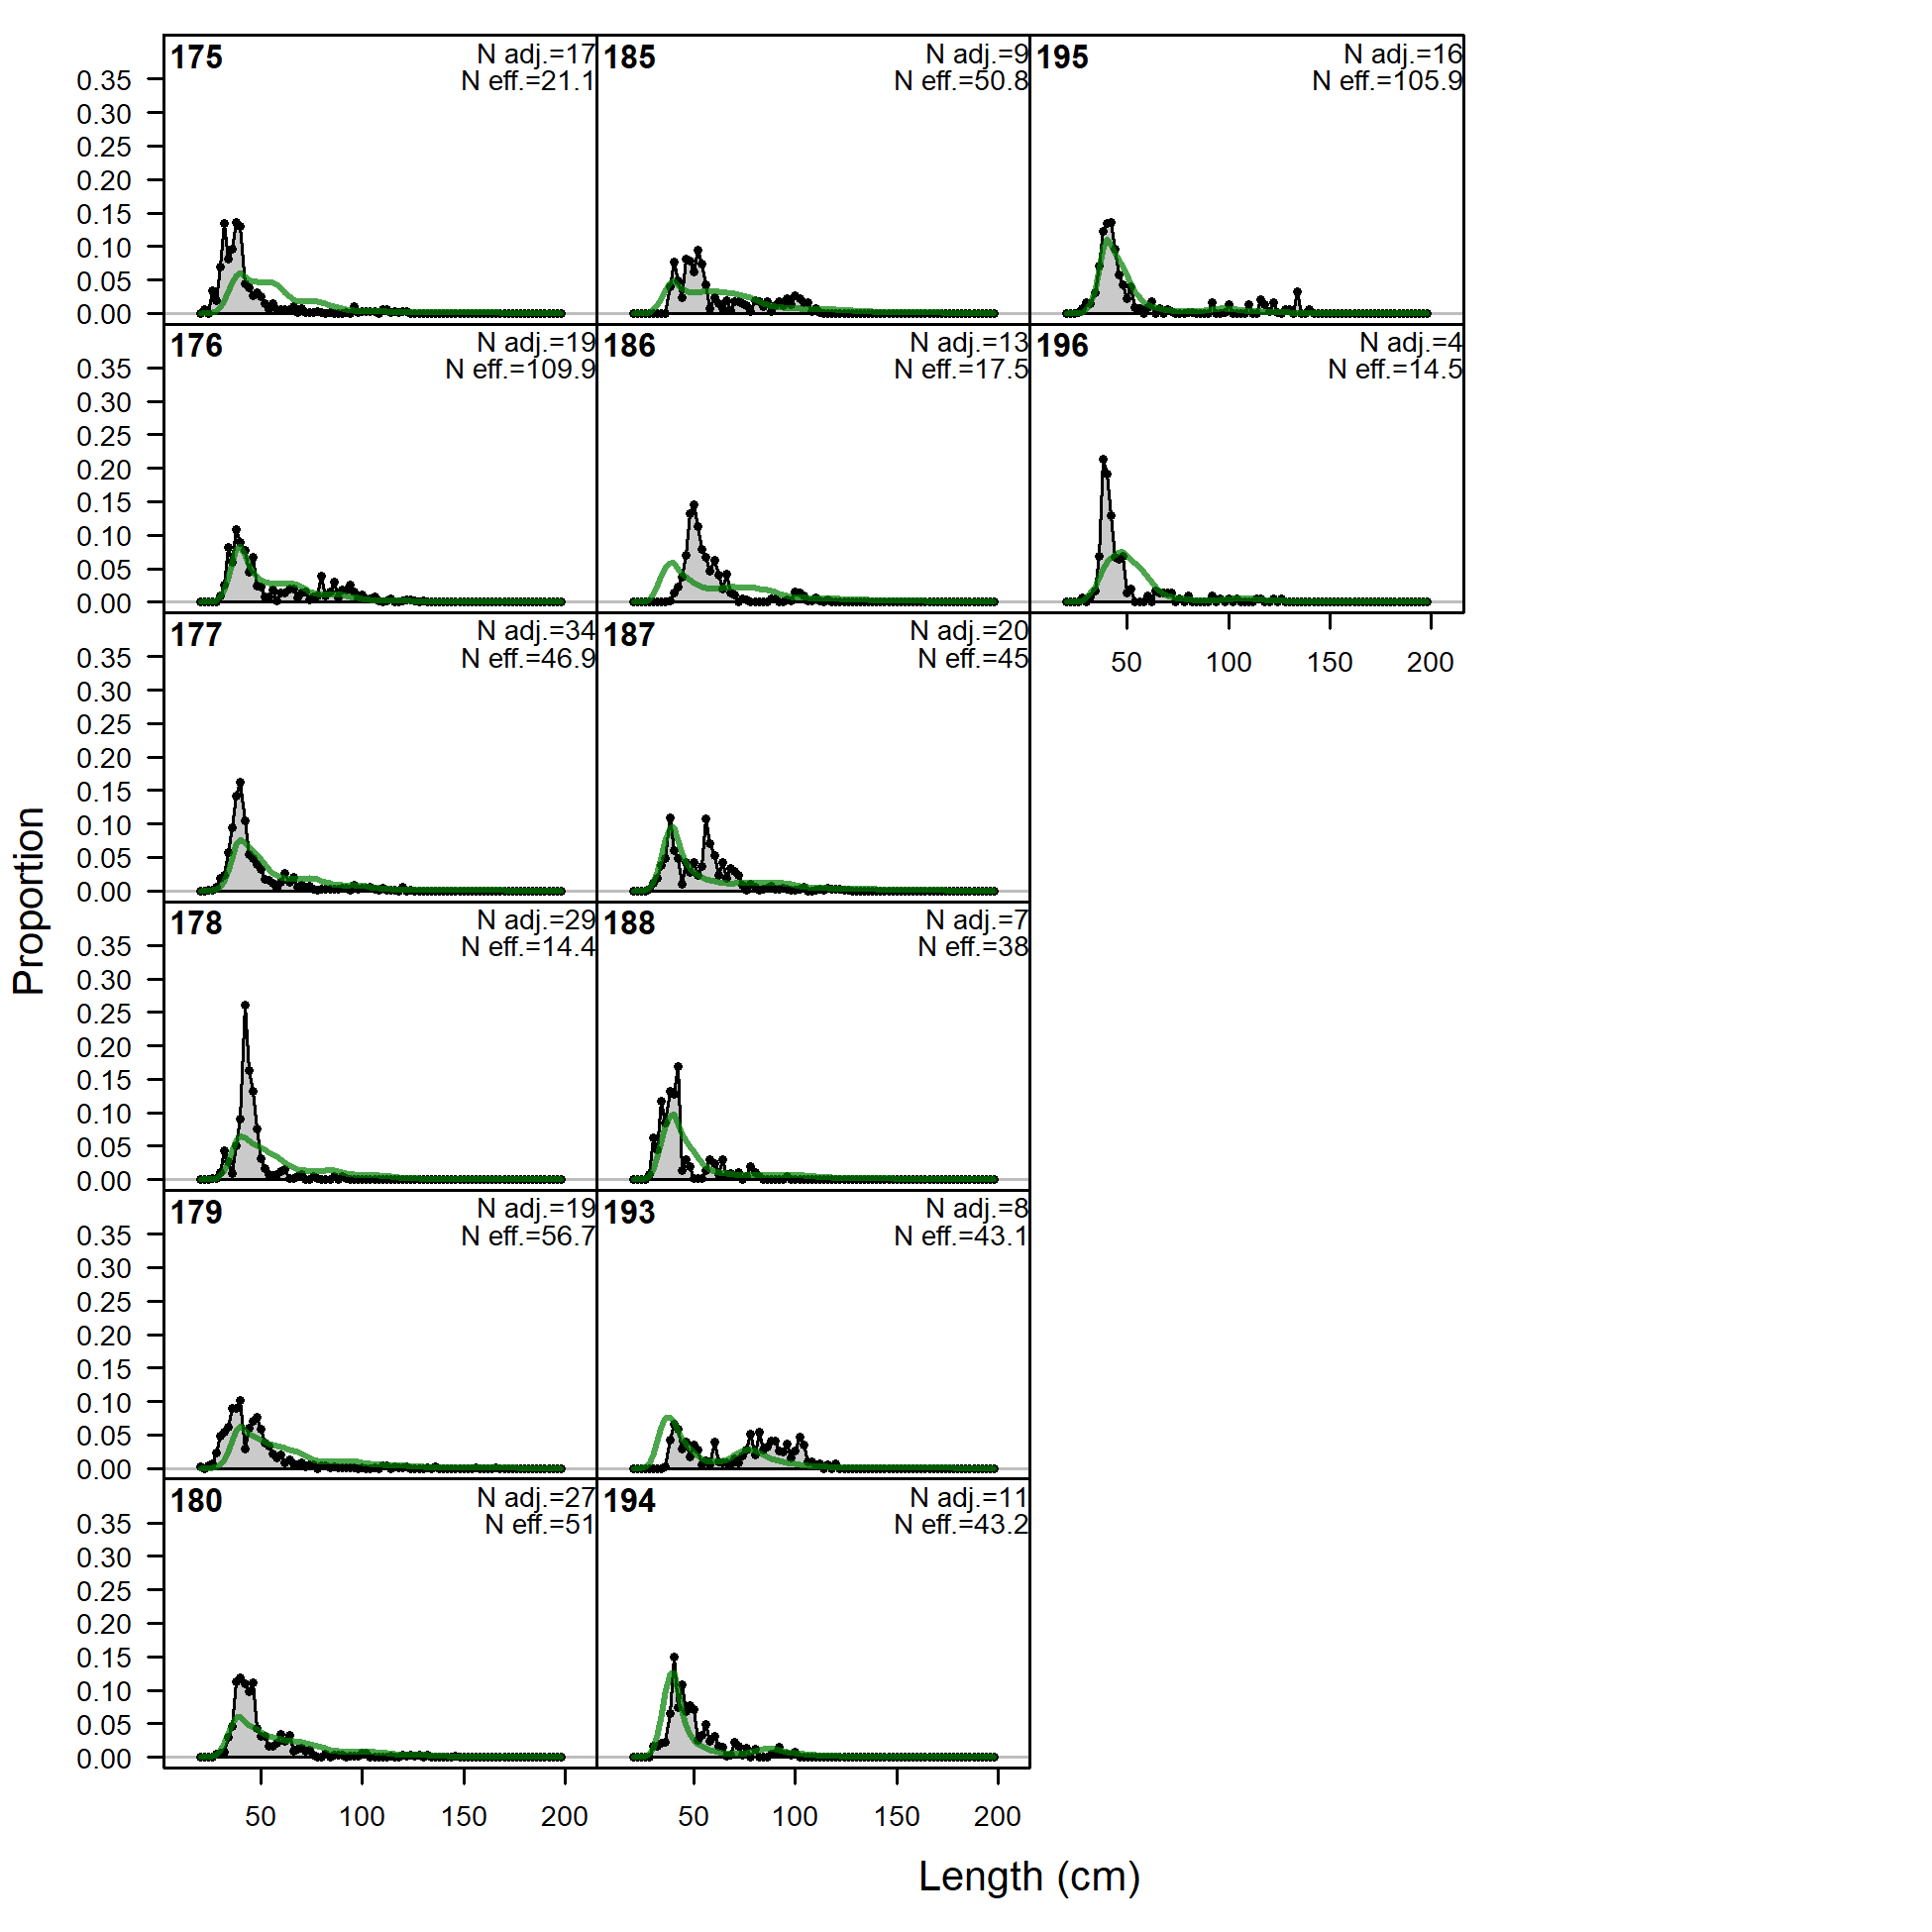
Length comps, whole catch, F1.OBJ.W (plot 1 of 4).
'N adj.' is the input sample size after data-weighting adjustment. N eff. is the calculated effective sample size used in the McAllister-Ianelli tuning method. (plot 2 of 4) (plot 3 of 4) (plot 4 of 4)
file: comp_lenfit_flt1mkt0_page4.png
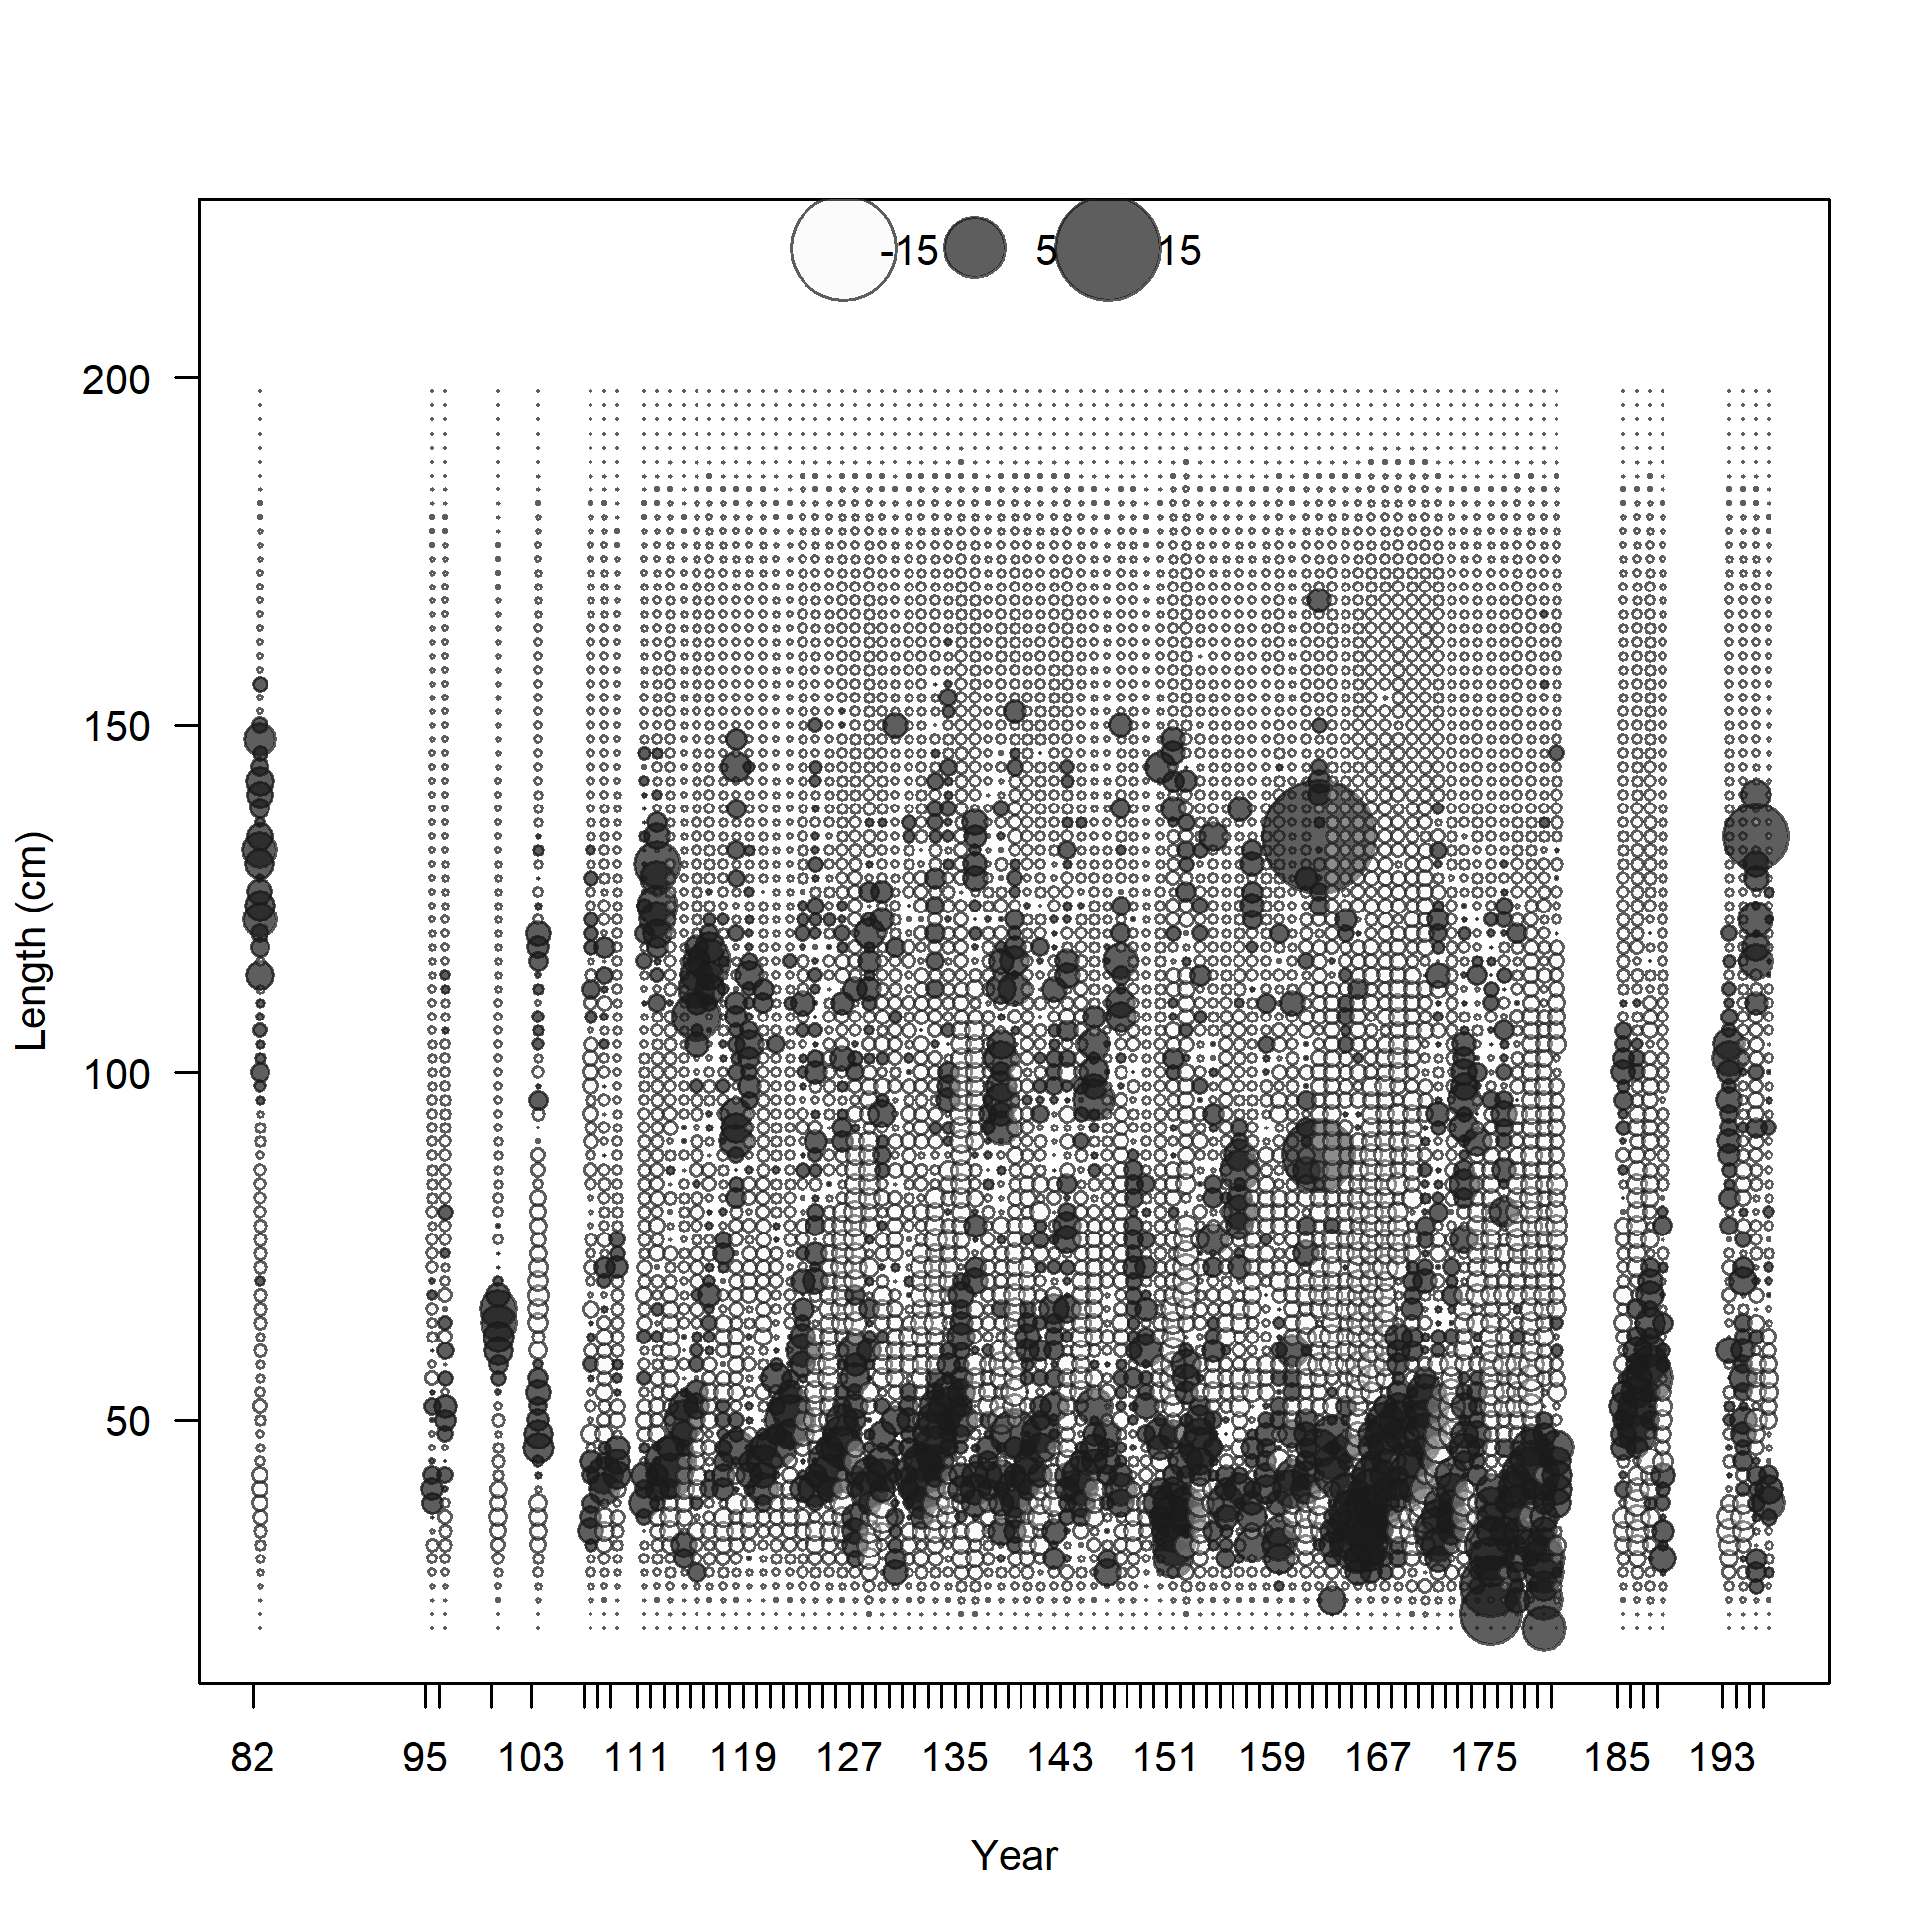
Pearson residuals, whole catch, F1.OBJ.W (max=17.4) (plot 4 of 4)
Closed bubbles are positive residuals (observed > expected) and open bubbles are negative residuals (observed < expected).
file: comp_lenfit_residsflt1mkt0_page4.png
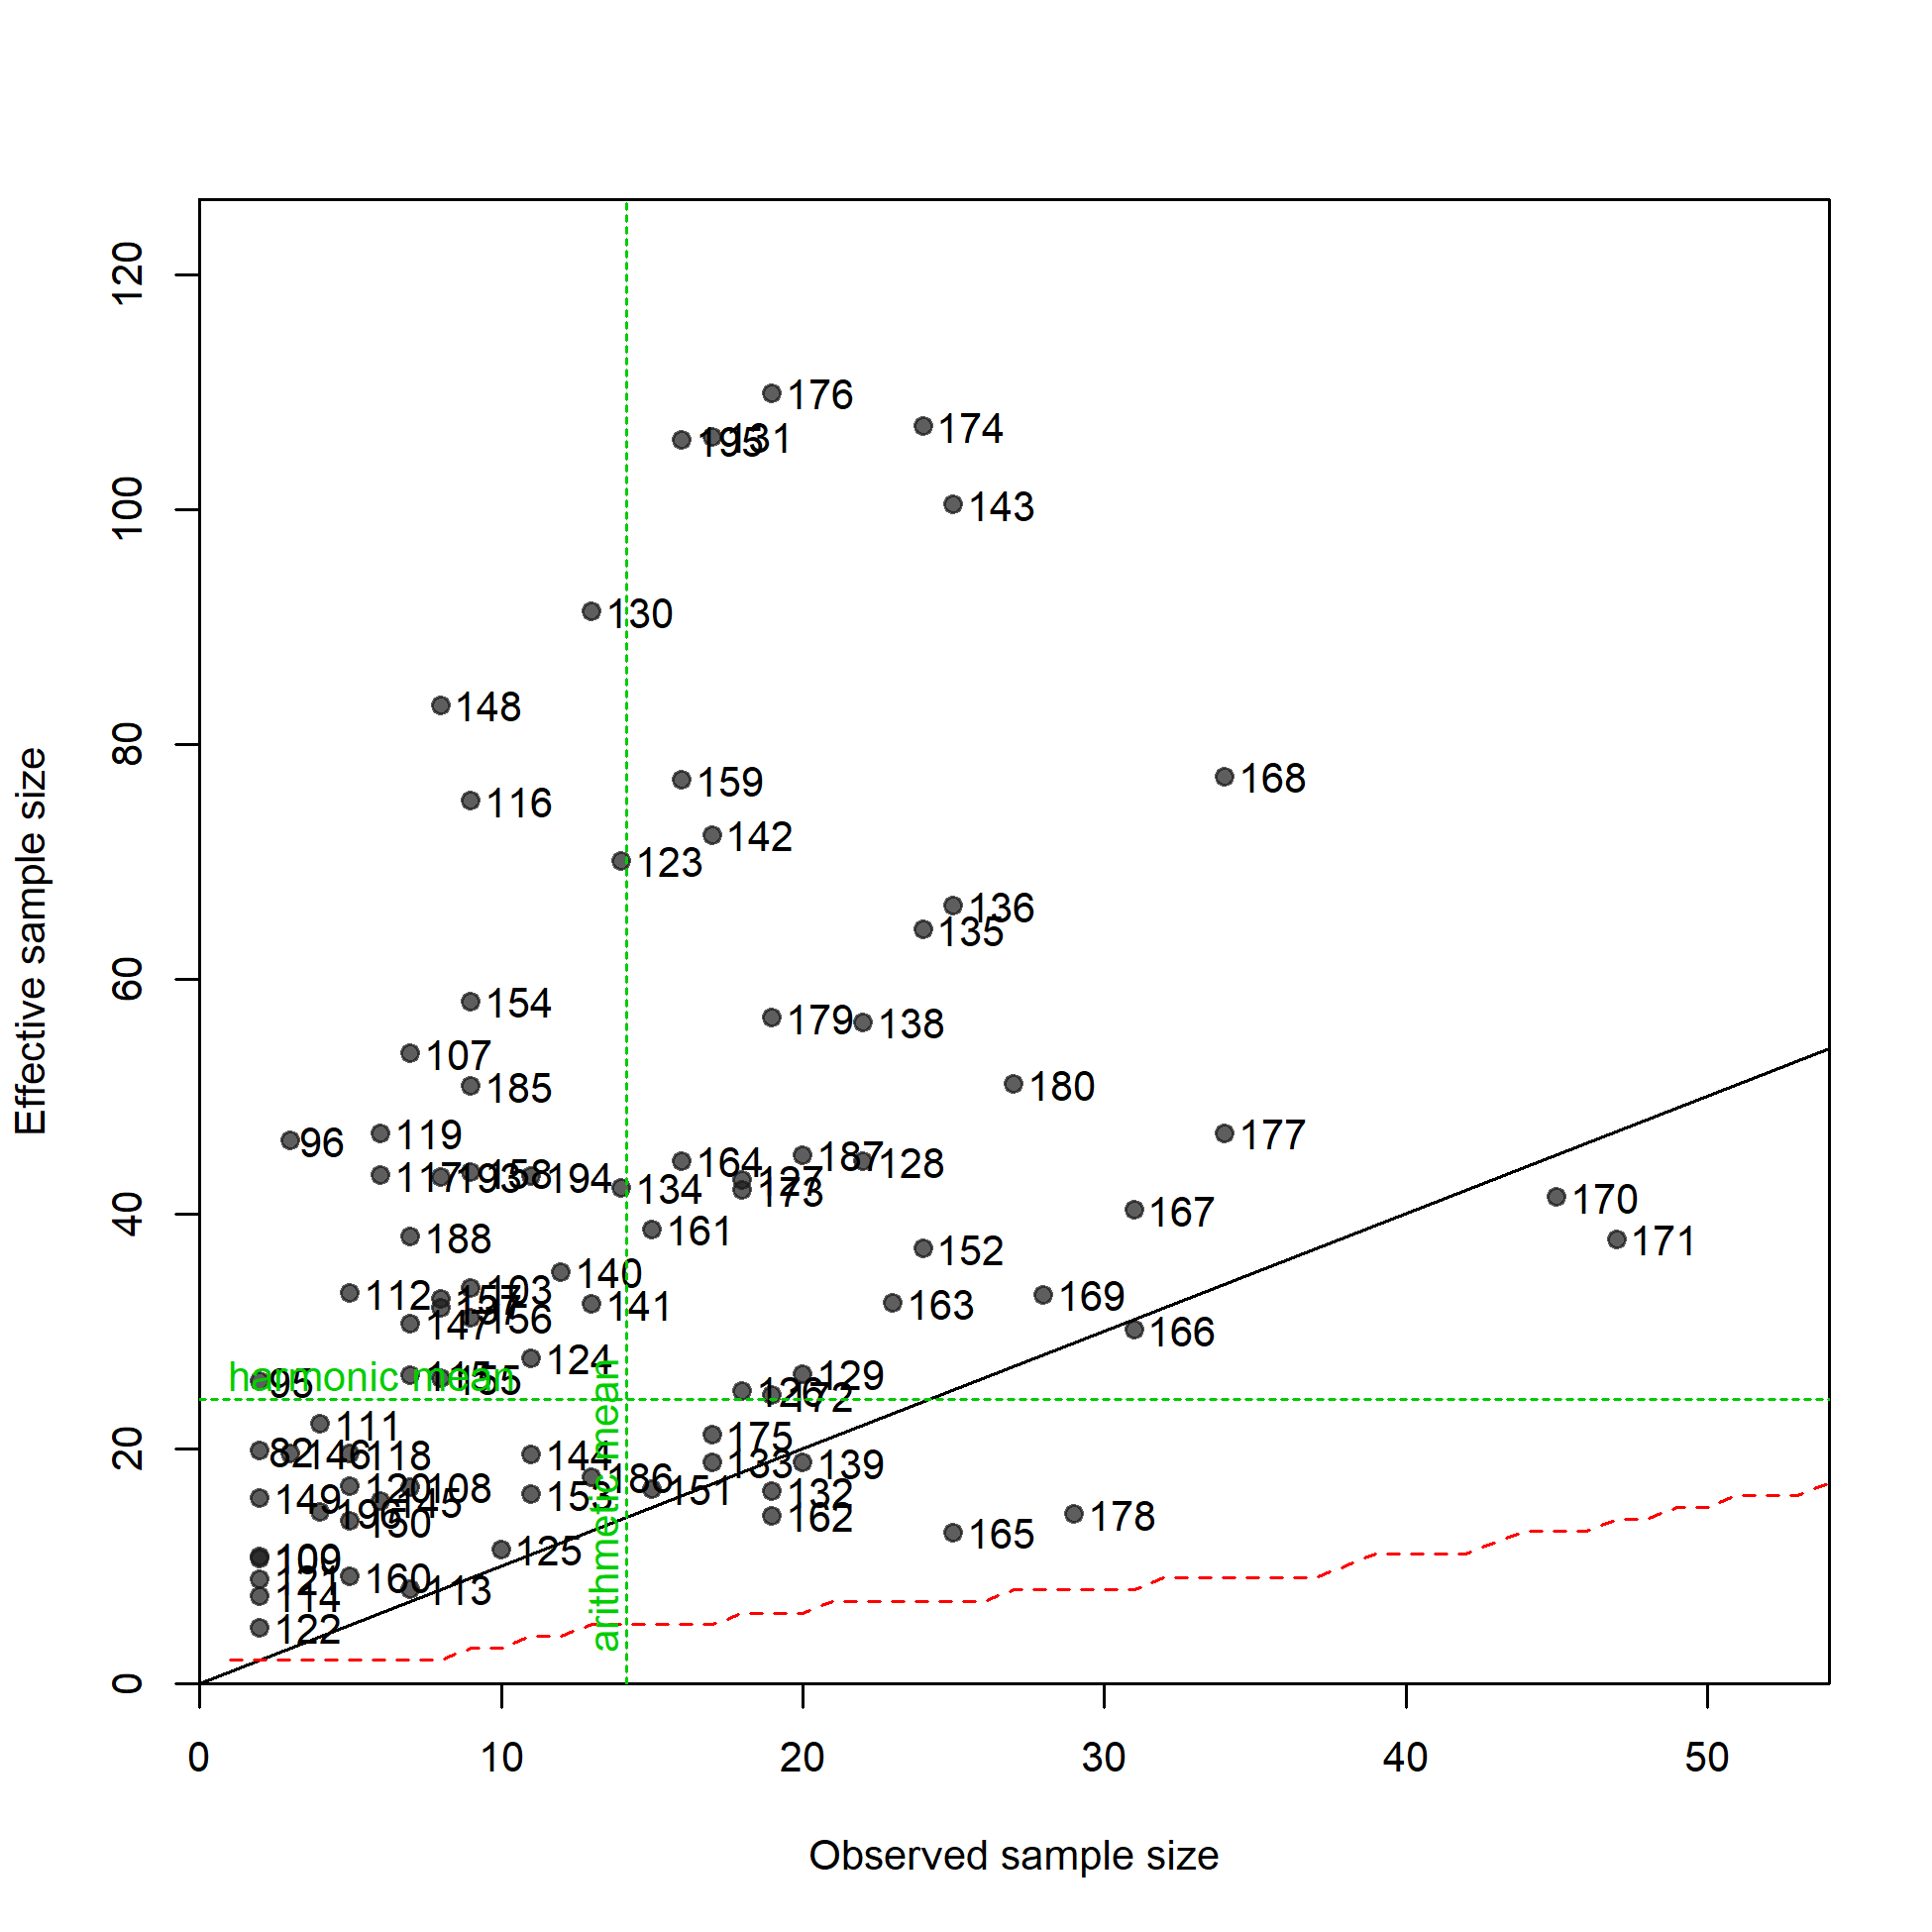
N-EffN comparison, Length comps, whole catch, F1.OBJ.W
file: comp_lenfit_sampsize_flt1mkt0.png
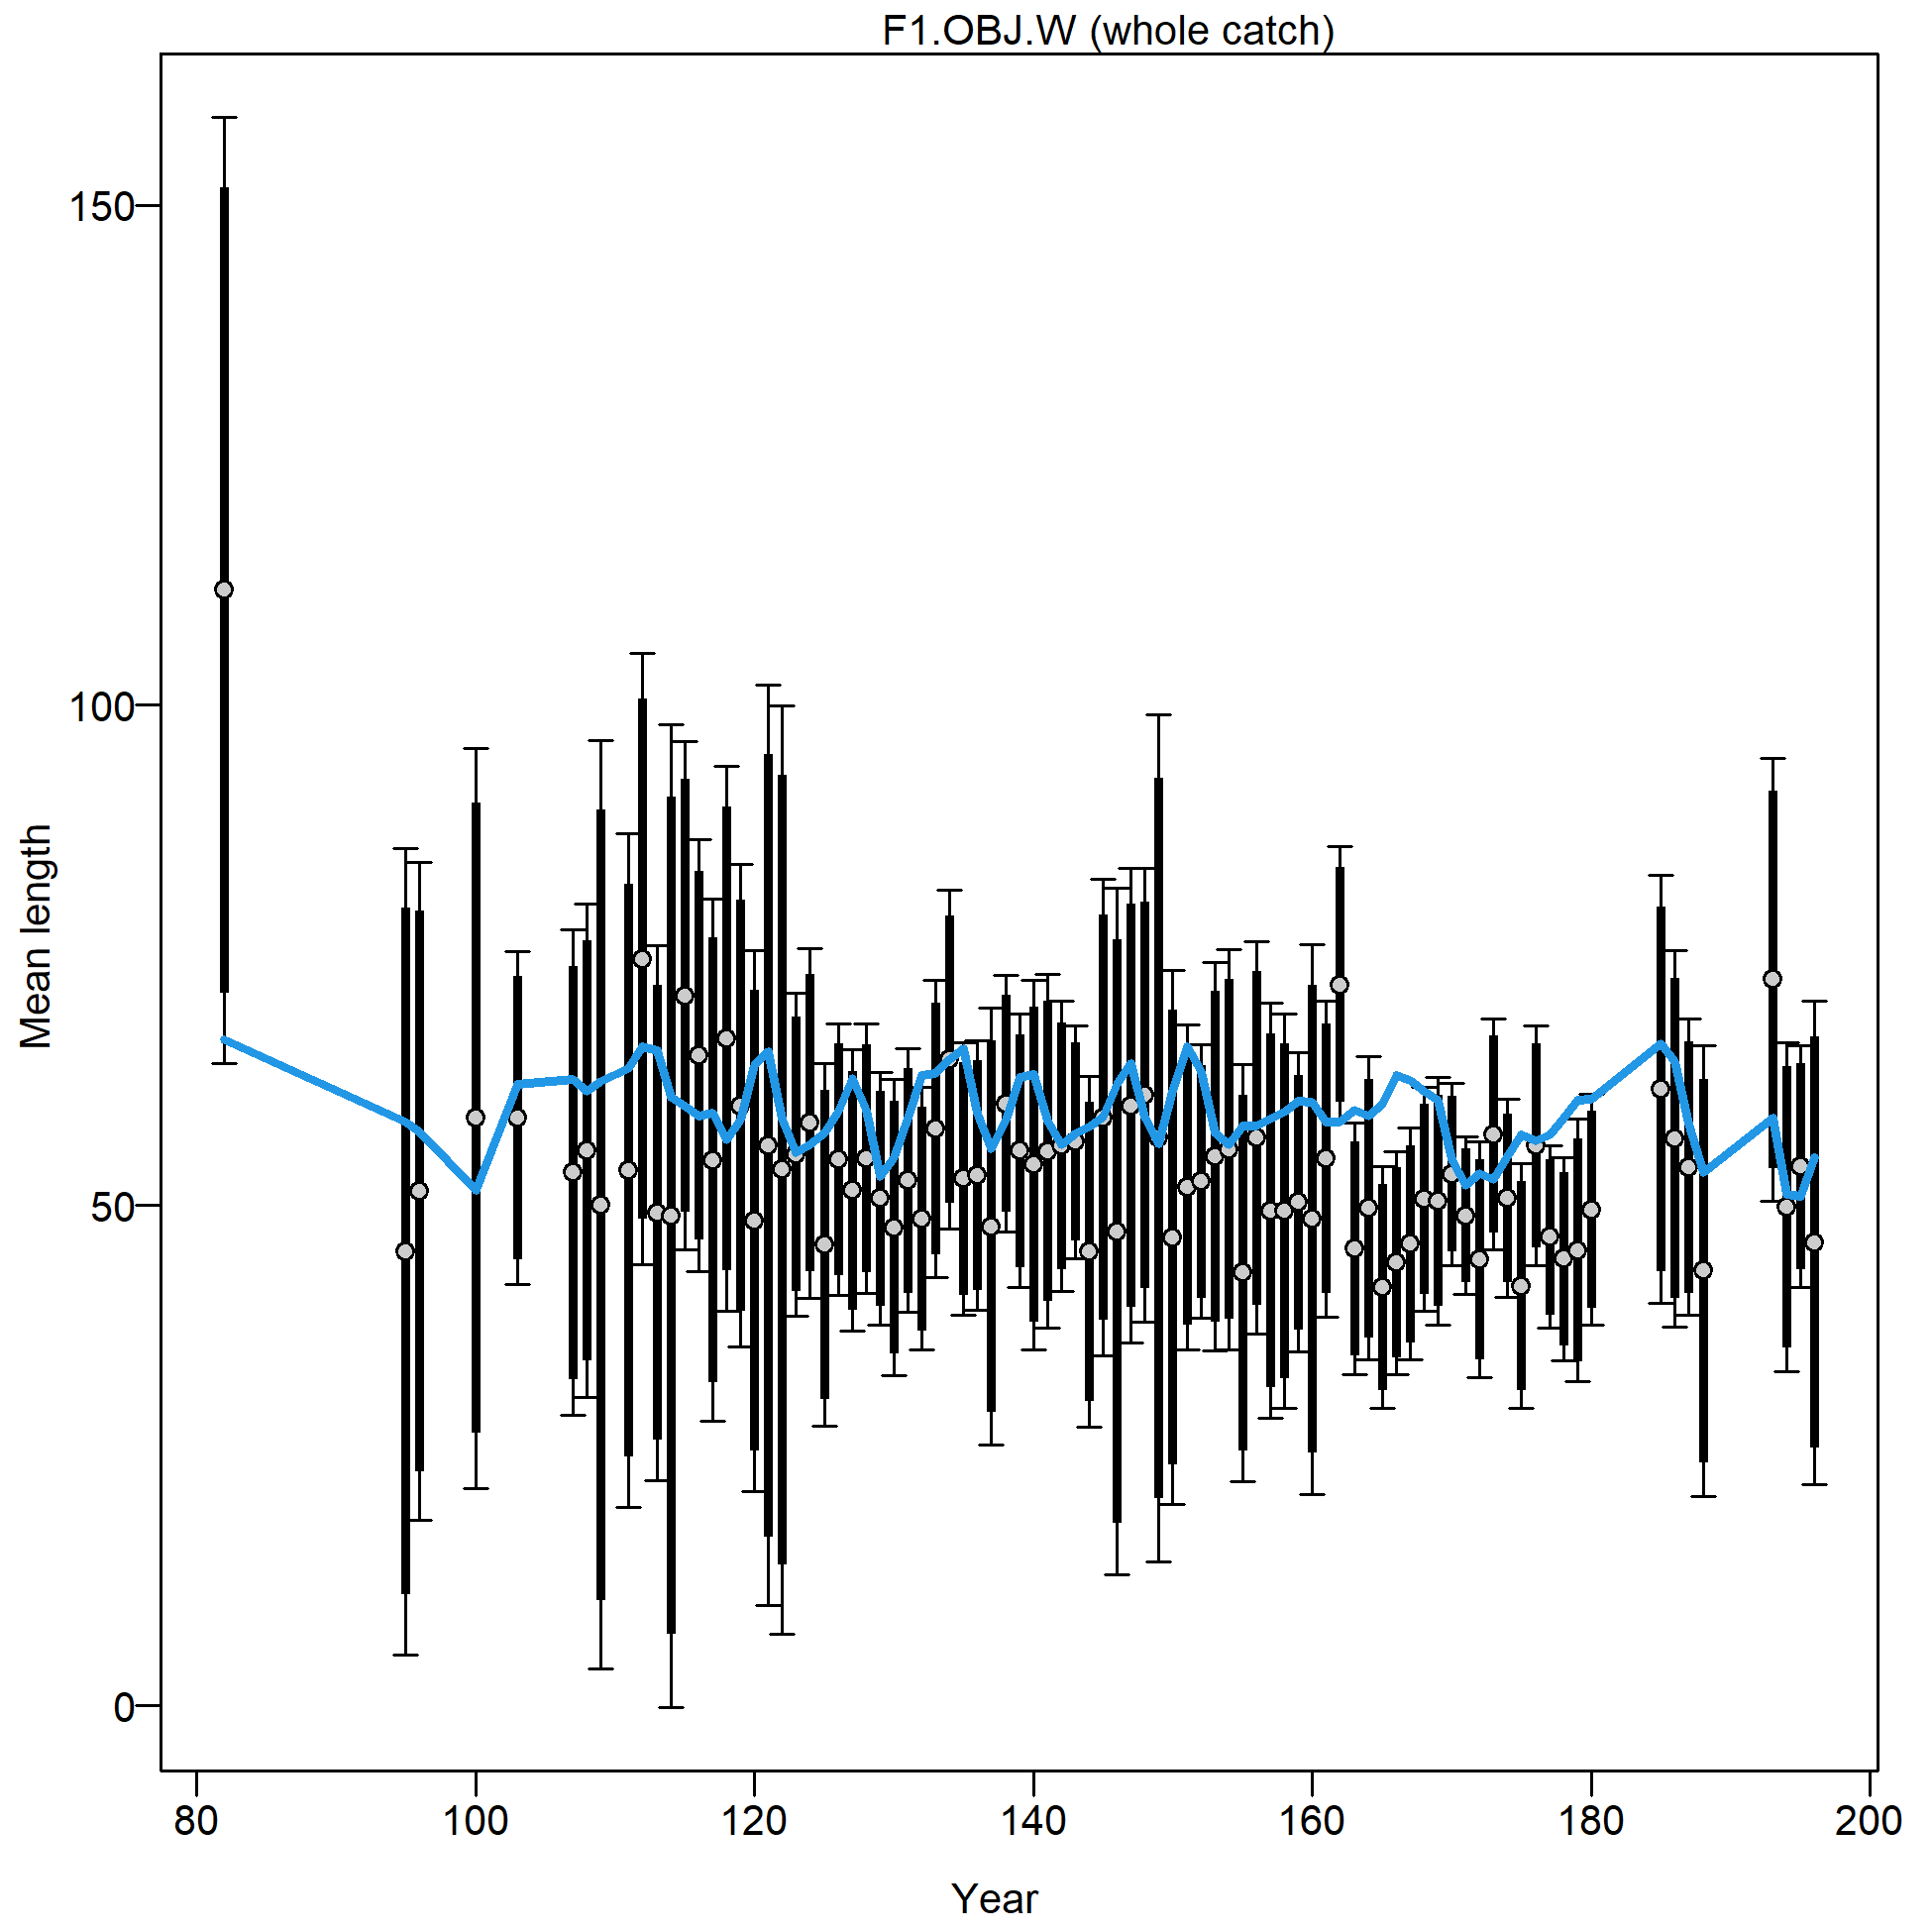
Mean length for F1.OBJ.W with 95% confidence intervals based on current sample sizes.
Francis data weighting method TA1.8: thinner intervals (with capped ends) show result of further adjusting sample sizes based on suggested multiplier (with 95% interval) for len data from F1.OBJ.W:
0.7241 (0.5413-1.0881)
For more info, see Francis (2011).
file: comp_lenfit_data_weighting_TA1.8_F1.OBJ.W.png
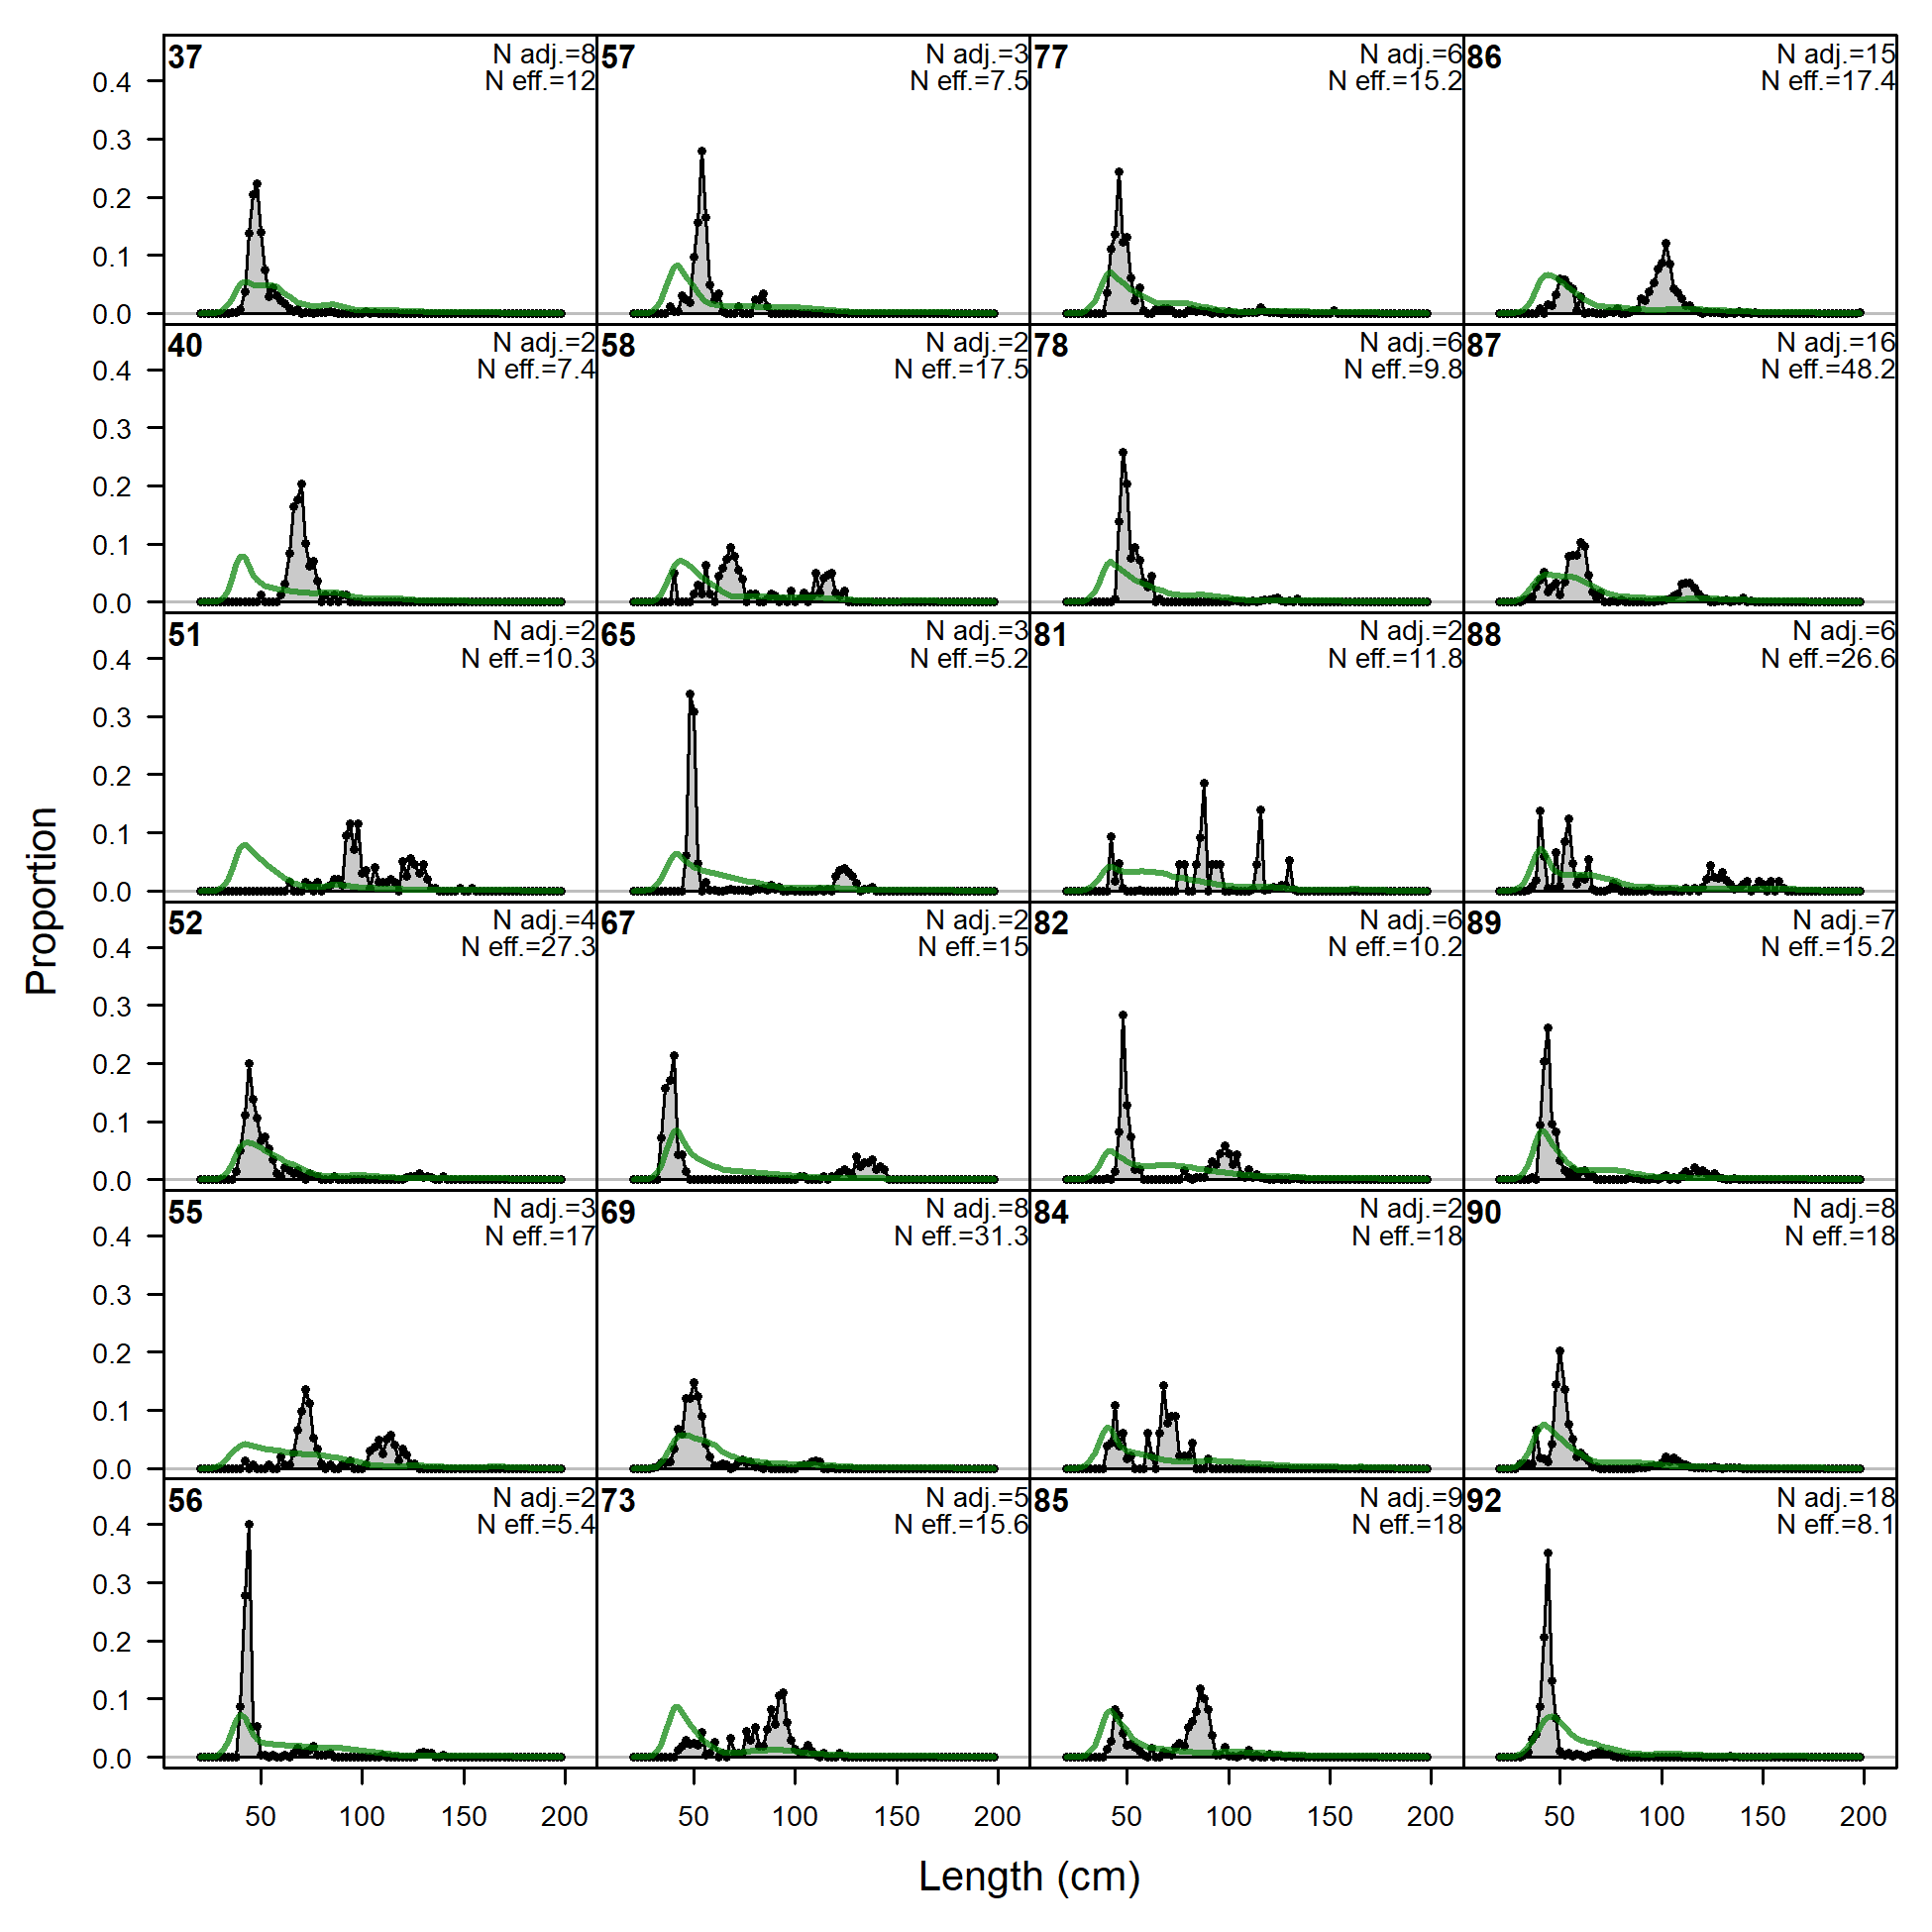
Length comps, whole catch, F2.OBJ.S (plot 1 of 4).
'N adj.' is the input sample size after data-weighting adjustment. N eff. is the calculated effective sample size used in the McAllister-Ianelli tuning method.
file: comp_lenfit_flt2mkt0_page1.png
Length comps, whole catch, F2.OBJ.S (plot 1 of 4).
'N adj.' is the input sample size after data-weighting adjustment. N eff. is the calculated effective sample size used in the McAllister-Ianelli tuning method. (plot 2 of 4)
file: comp_lenfit_flt2mkt0_page2.png
Length comps, whole catch, F2.OBJ.S (plot 1 of 4).
'N adj.' is the input sample size after data-weighting adjustment. N eff. is the calculated effective sample size used in the McAllister-Ianelli tuning method. (plot 2 of 4) (plot 3 of 4)
file: comp_lenfit_flt2mkt0_page3.png
Length comps, whole catch, F2.OBJ.S (plot 1 of 4).
'N adj.' is the input sample size after data-weighting adjustment. N eff. is the calculated effective sample size used in the McAllister-Ianelli tuning method. (plot 2 of 4) (plot 3 of 4) (plot 4 of 4)
file: comp_lenfit_flt2mkt0_page4.png
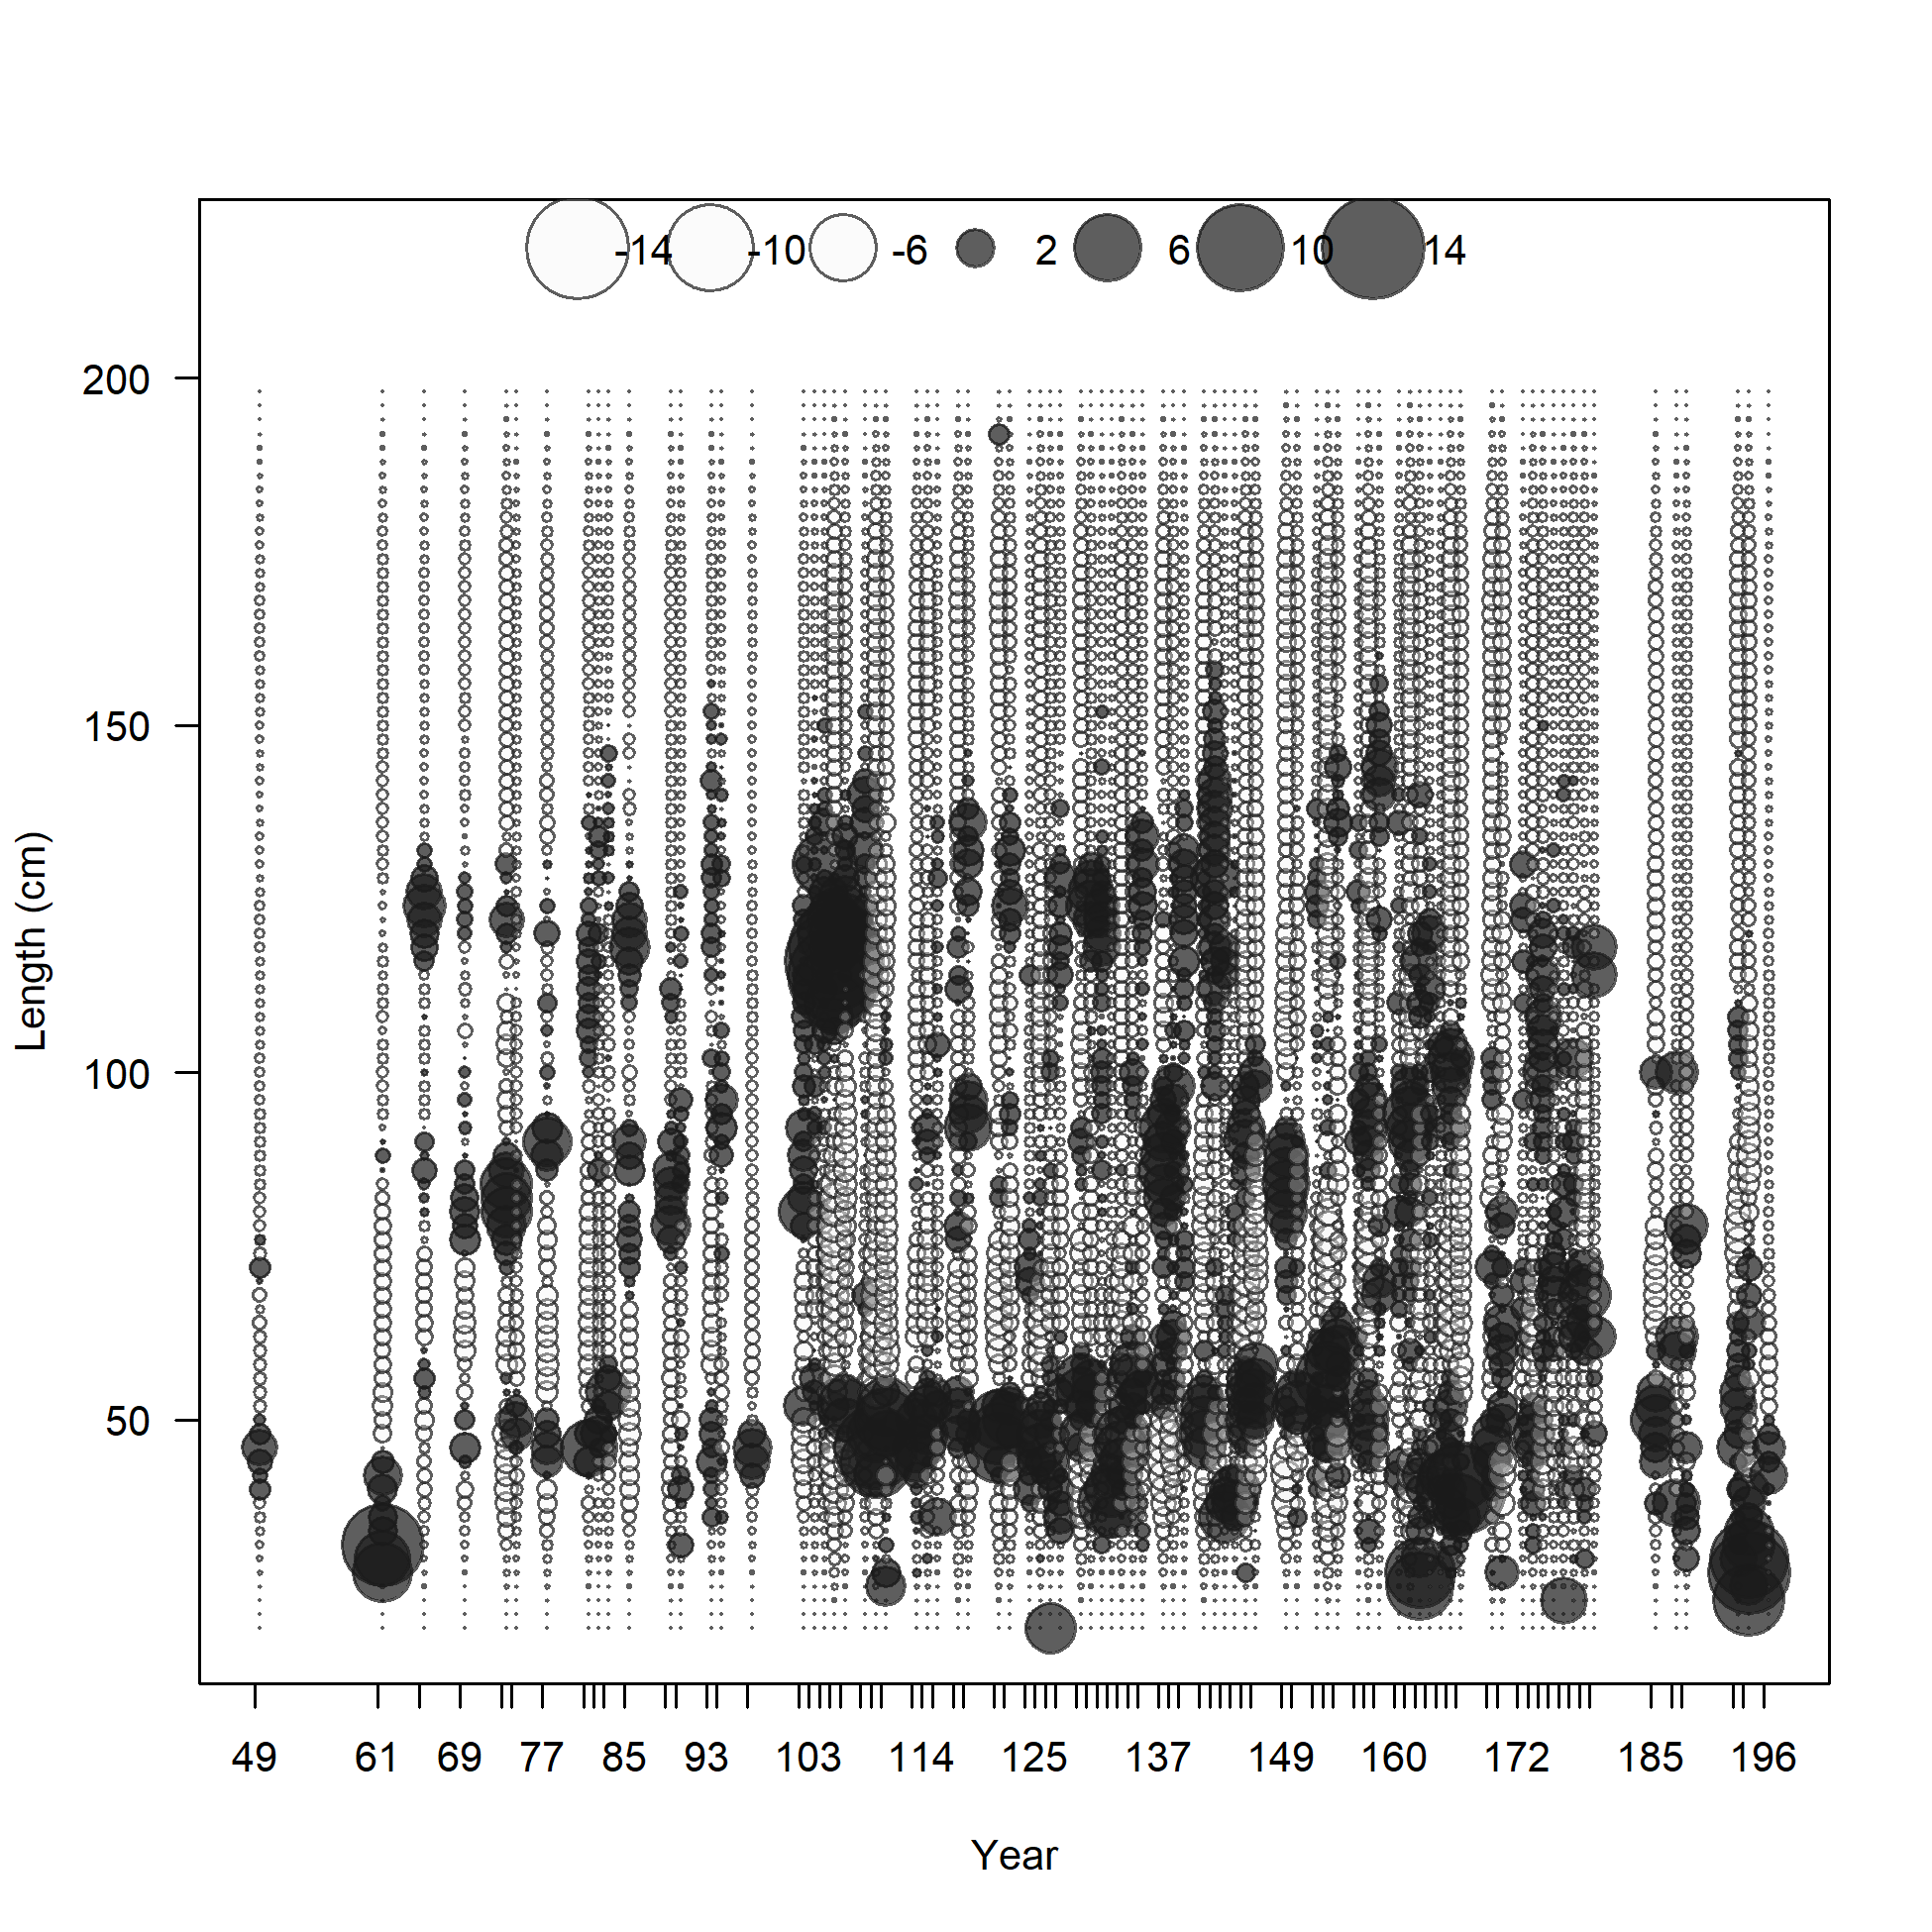
Pearson residuals, whole catch, F2.OBJ.S (max=13.07) (plot 4 of 4)
Closed bubbles are positive residuals (observed > expected) and open bubbles are negative residuals (observed < expected).
file: comp_lenfit_residsflt2mkt0_page4.png
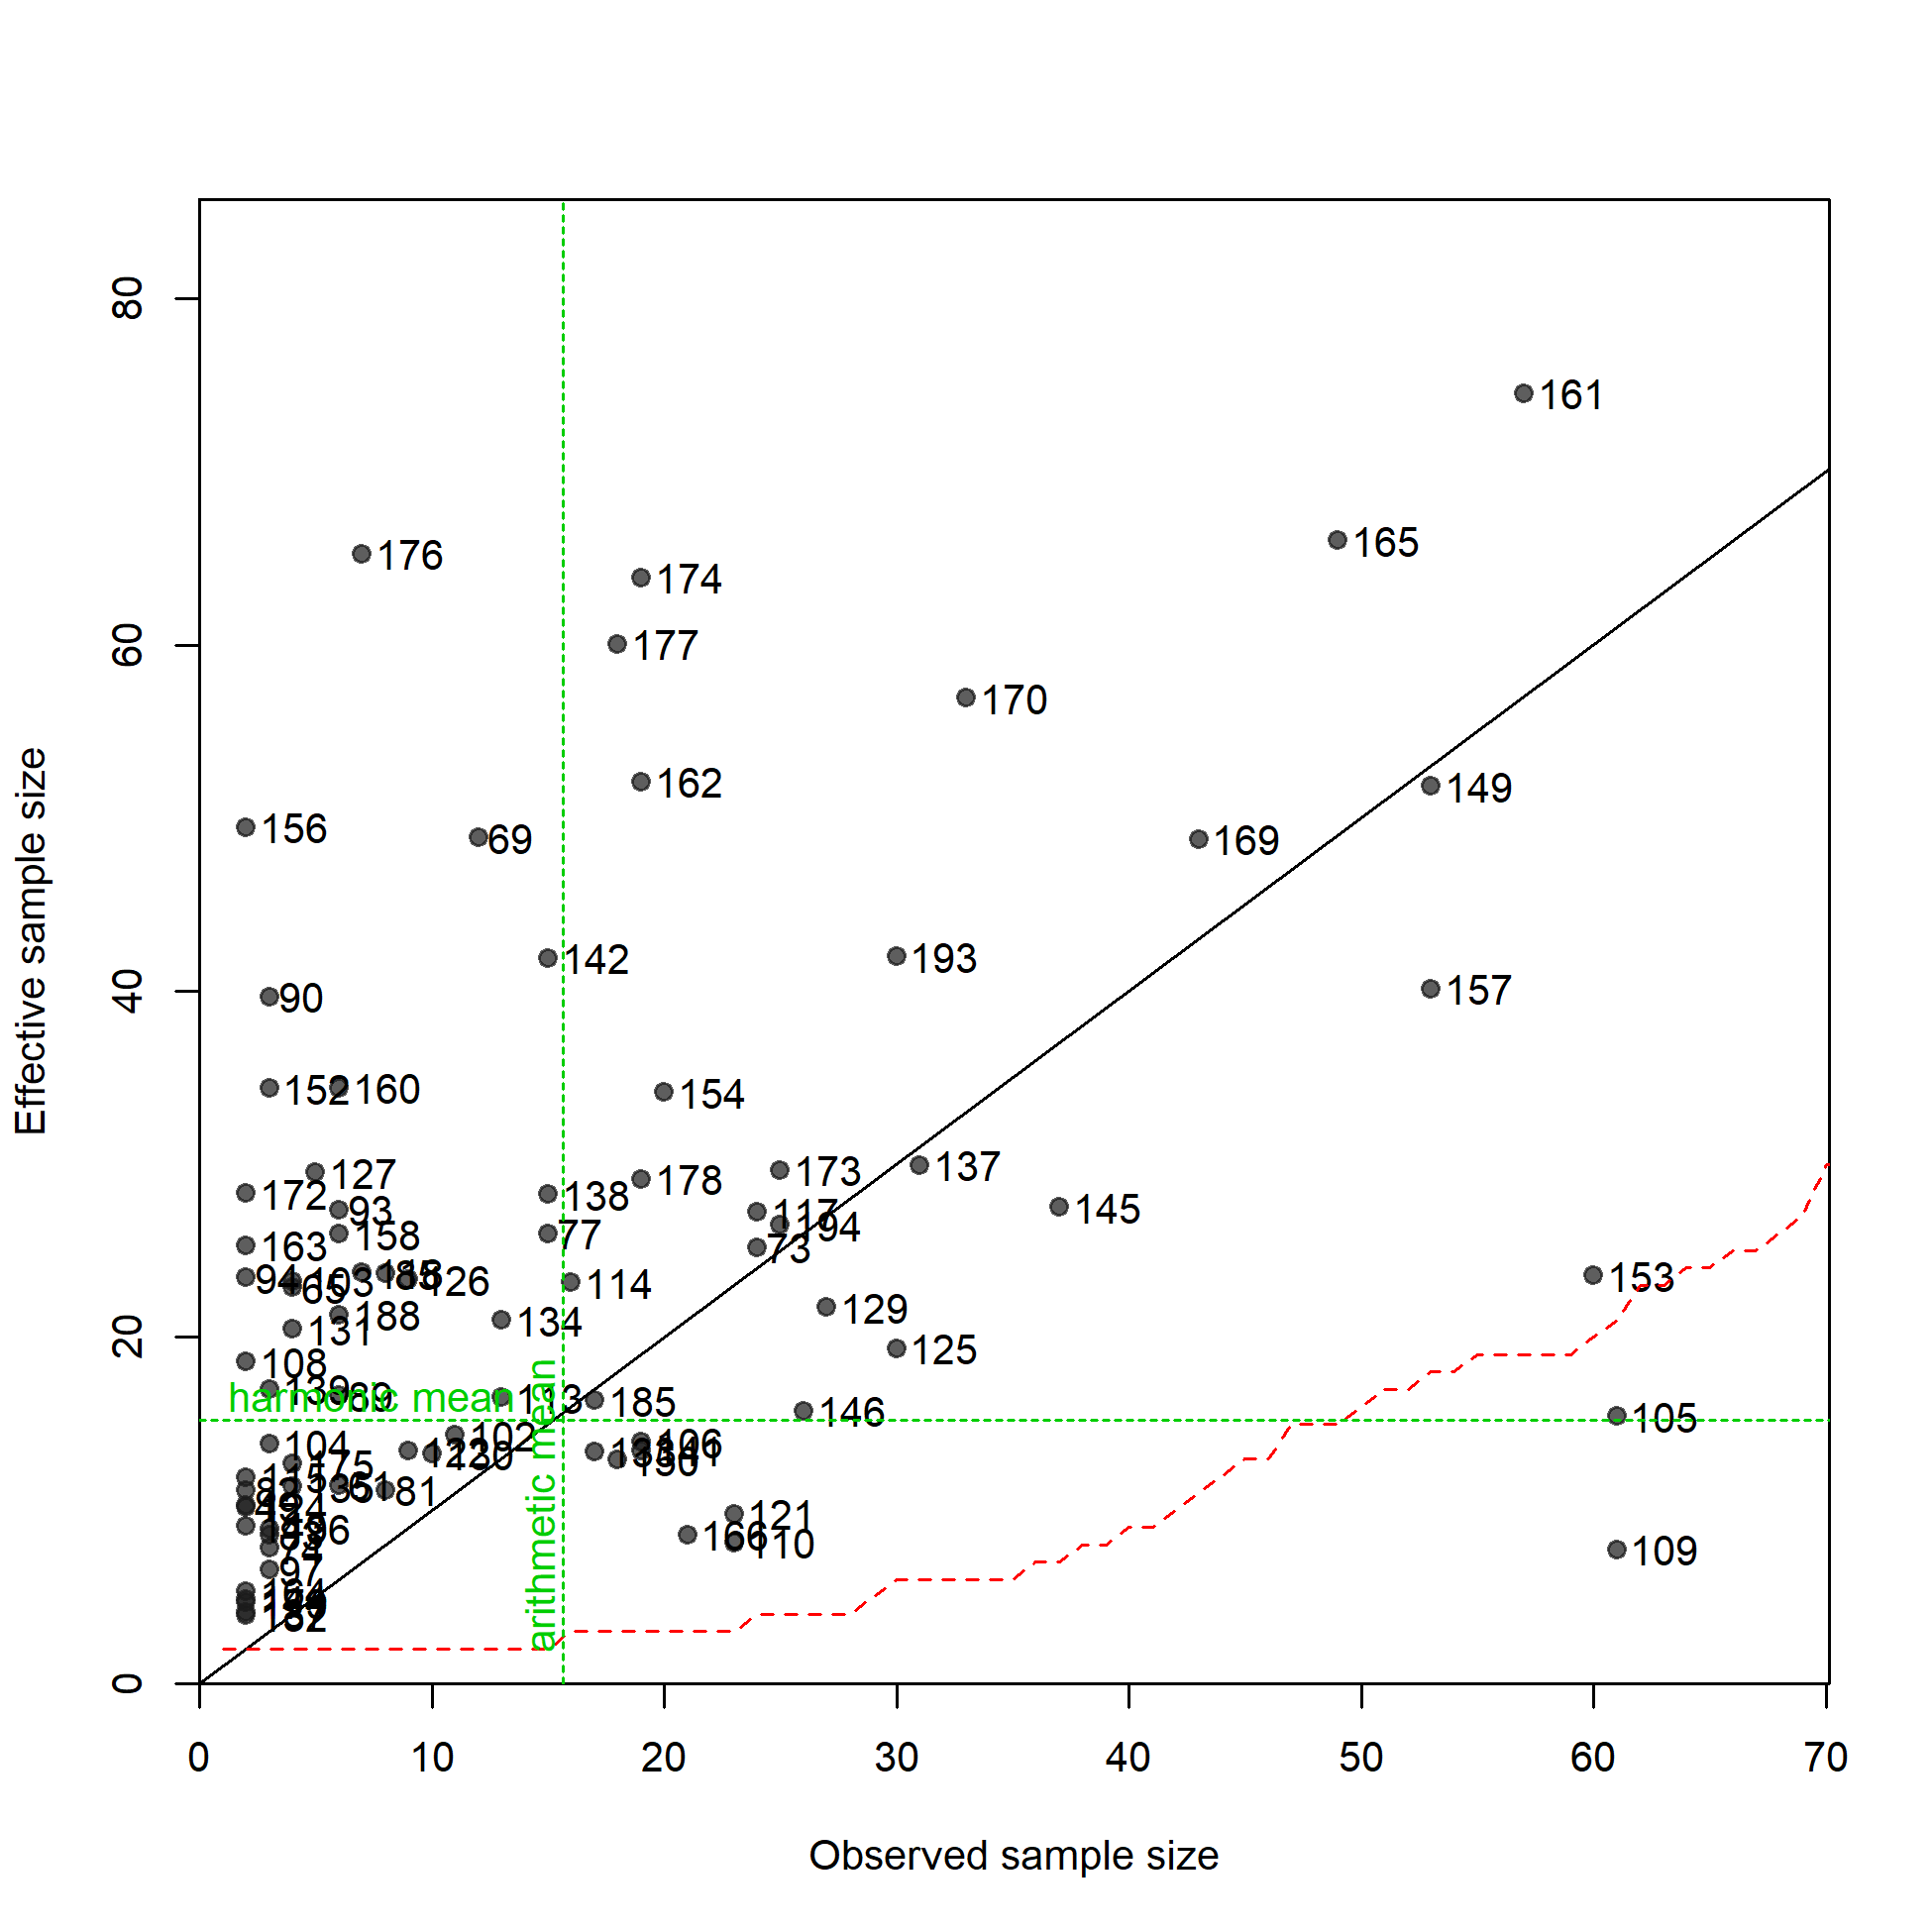
N-EffN comparison, Length comps, whole catch, F2.OBJ.S
file: comp_lenfit_sampsize_flt2mkt0.png
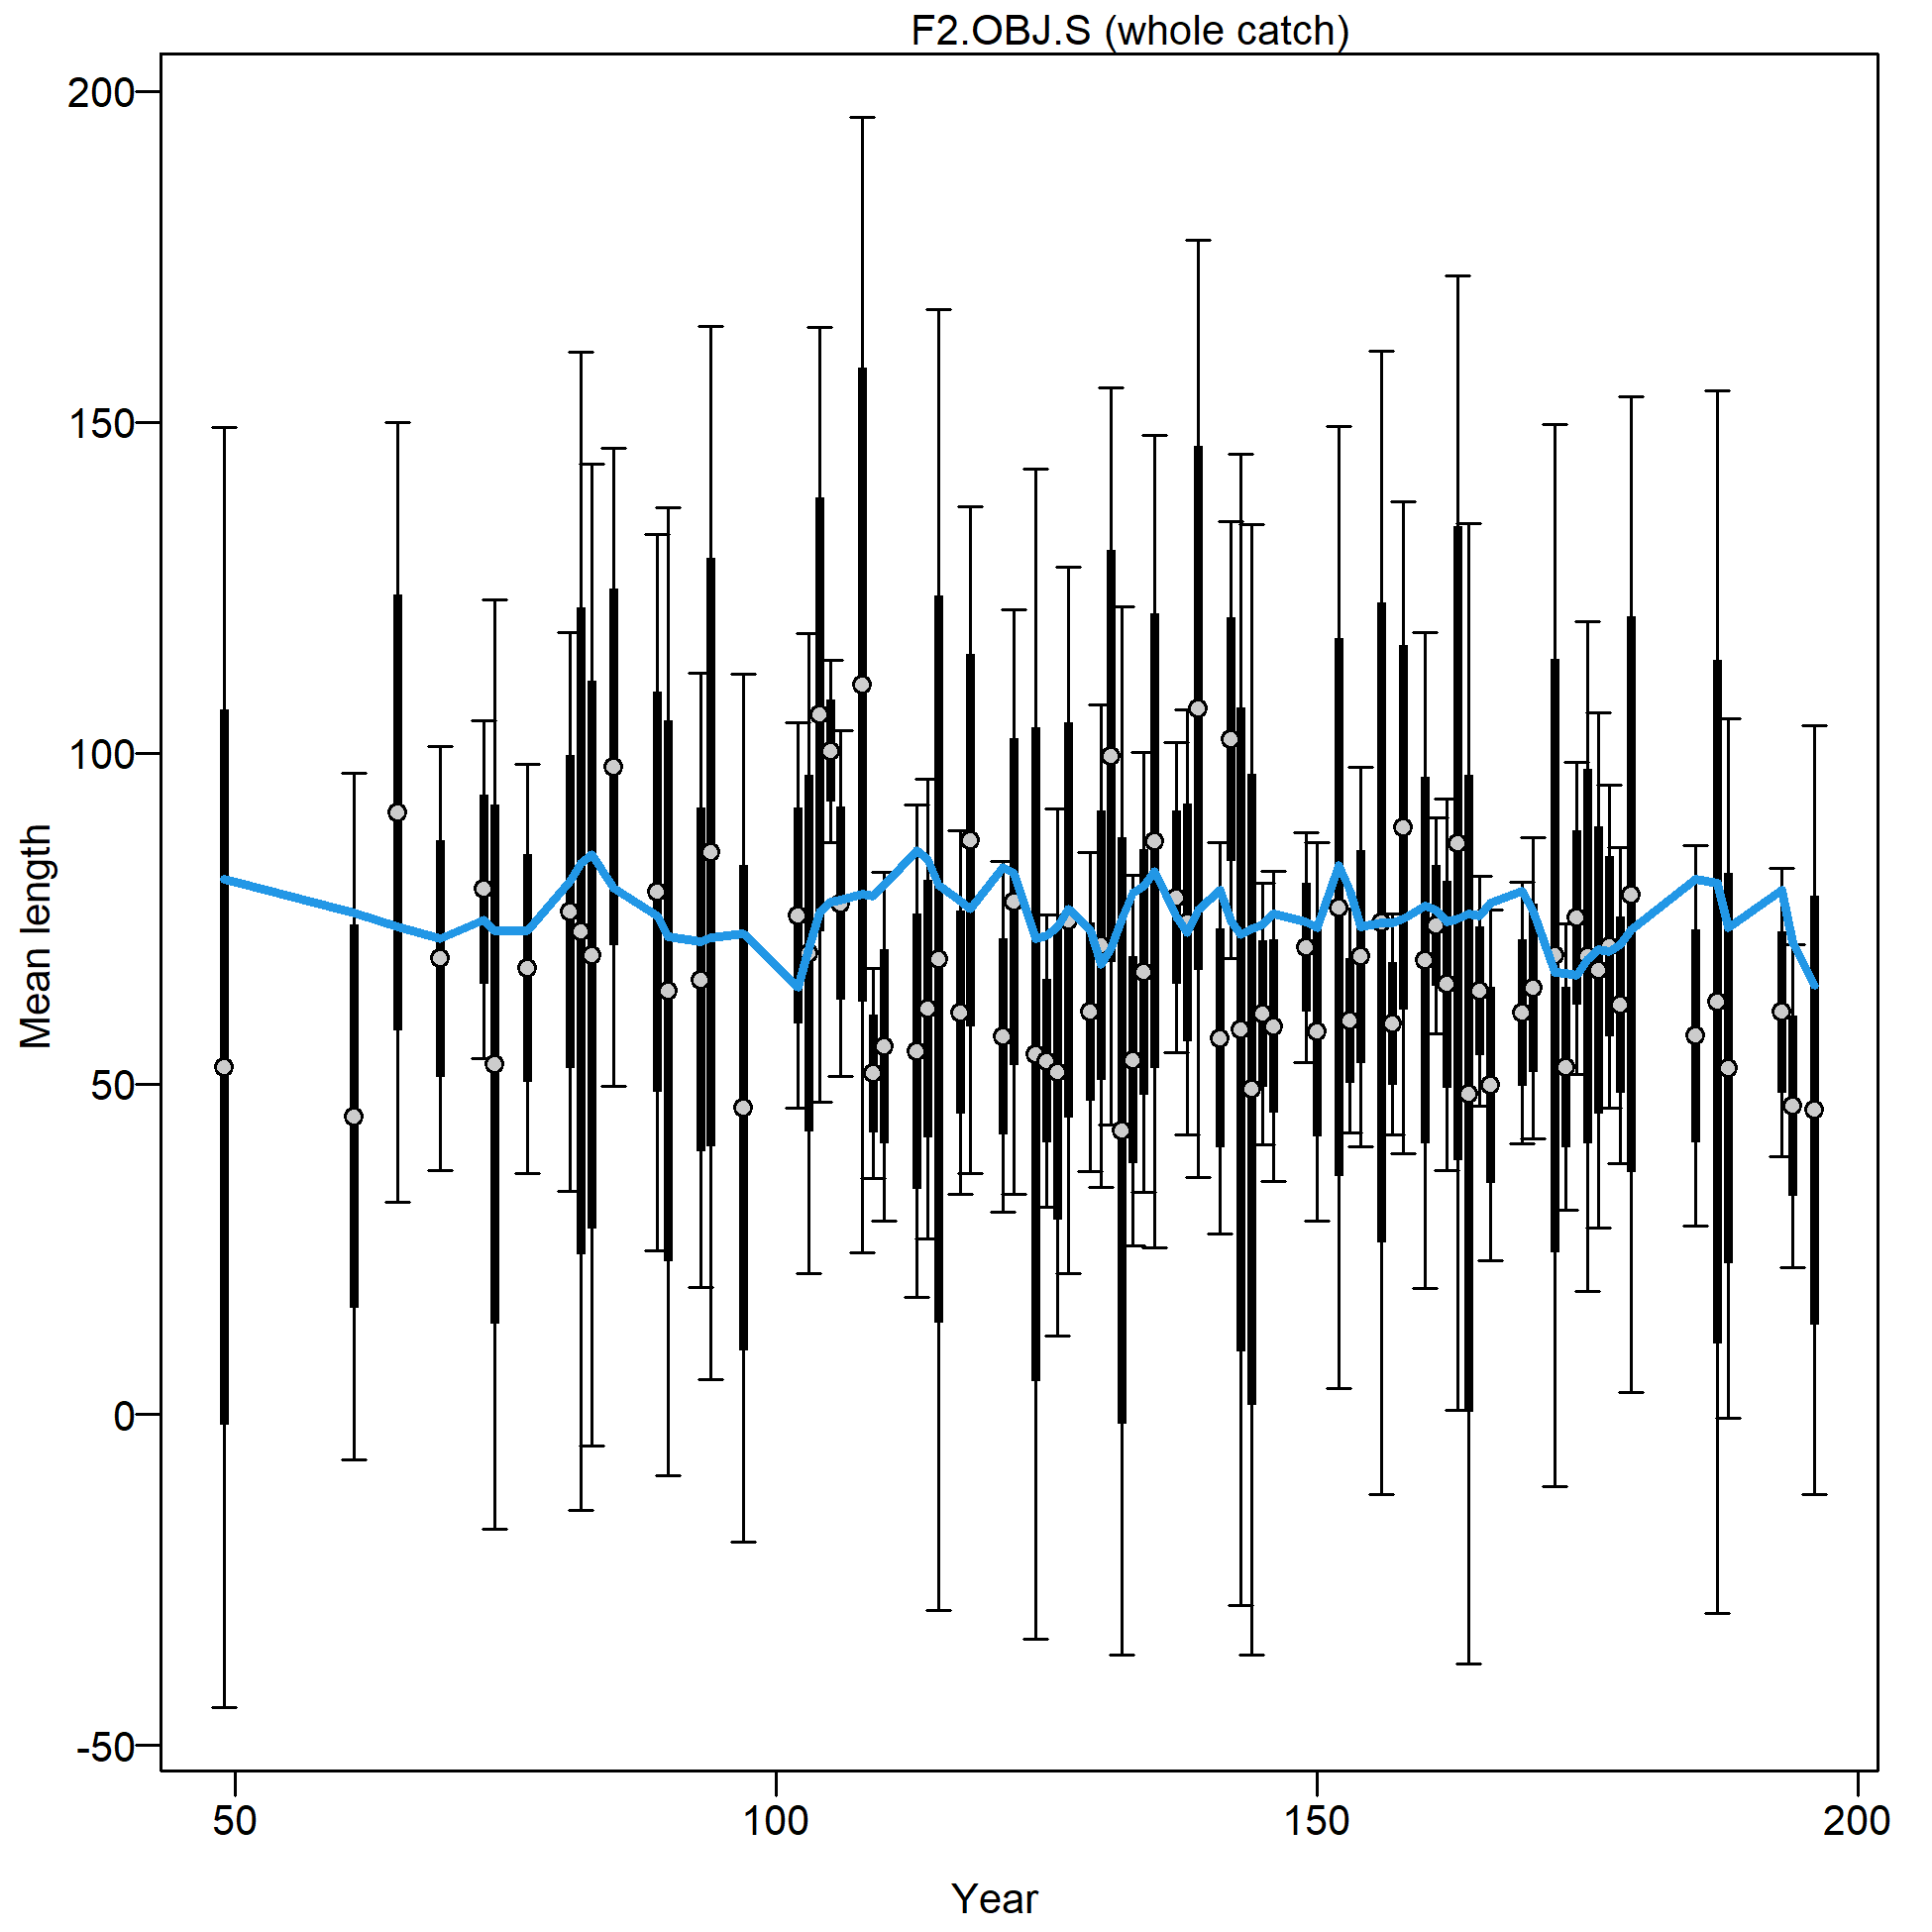
Mean length for F2.OBJ.S with 95% confidence intervals based on current sample sizes.
Francis data weighting method TA1.8: thinner intervals (with capped ends) show result of further adjusting sample sizes based on suggested multiplier (with 95% interval) for len data from F2.OBJ.S:
0.3124 (0.205-0.4916)
For more info, see Francis (2011).
file: comp_lenfit_data_weighting_TA1.8_F2.OBJ.S.png
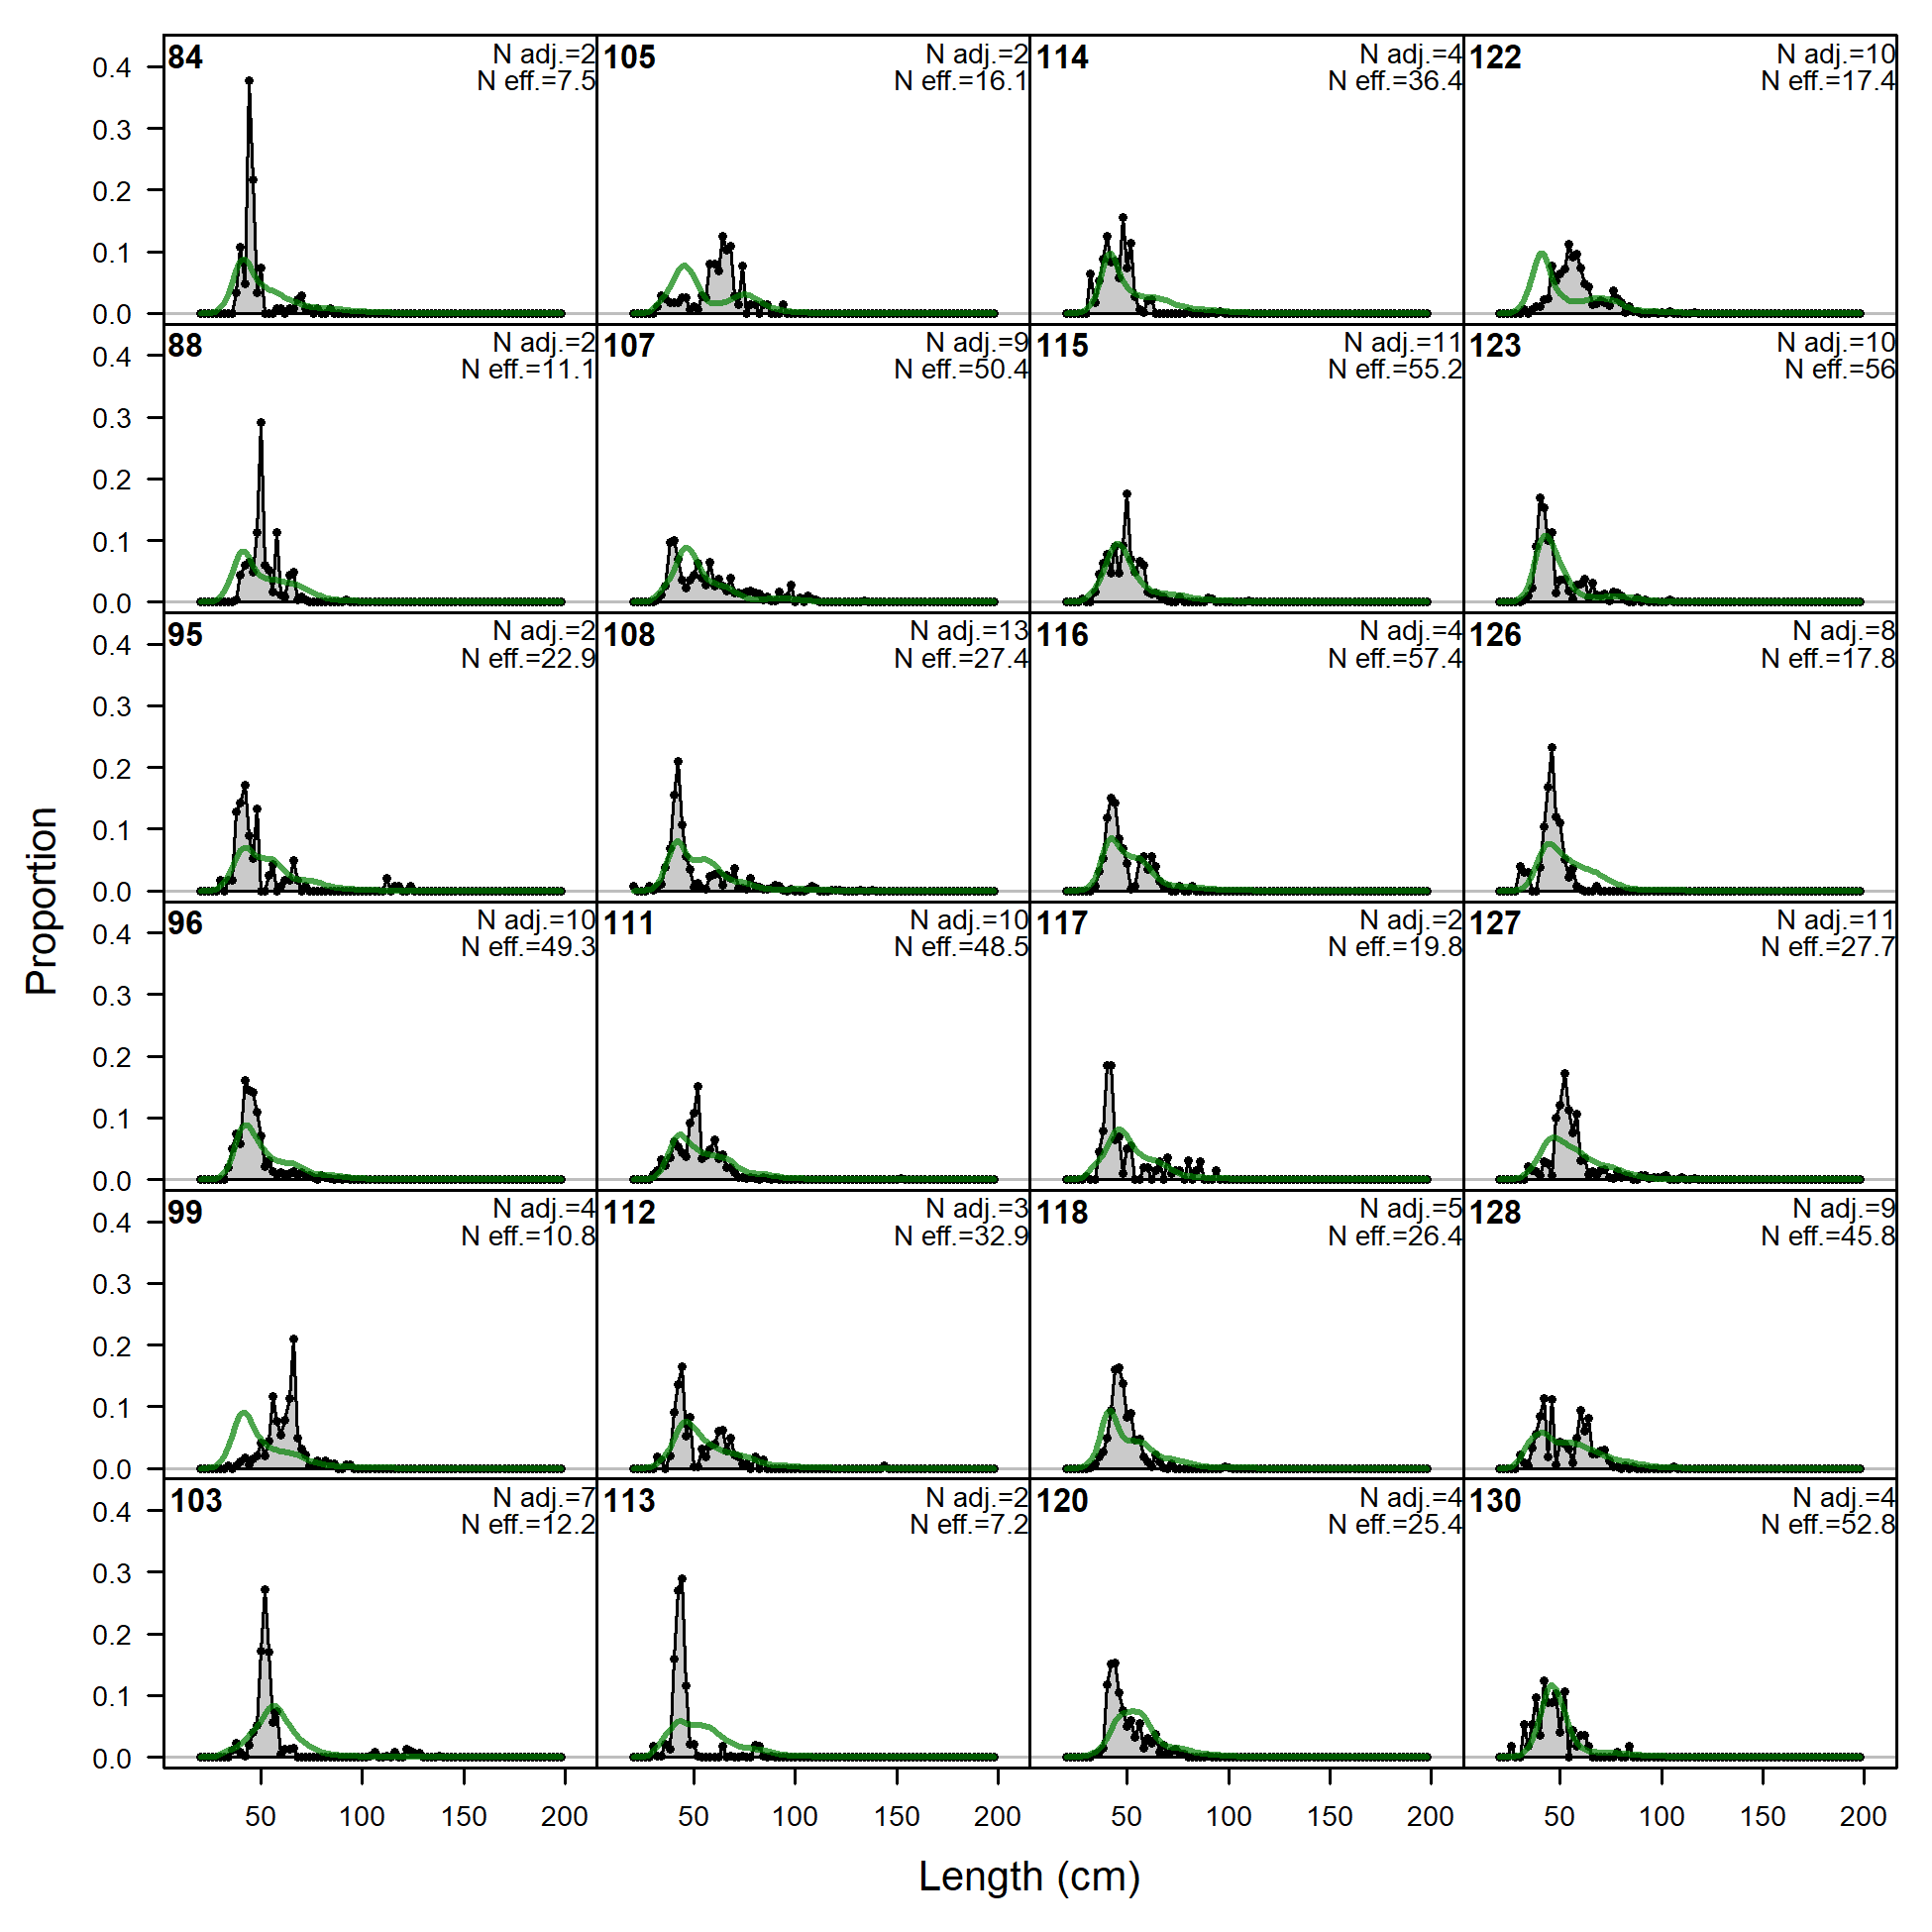
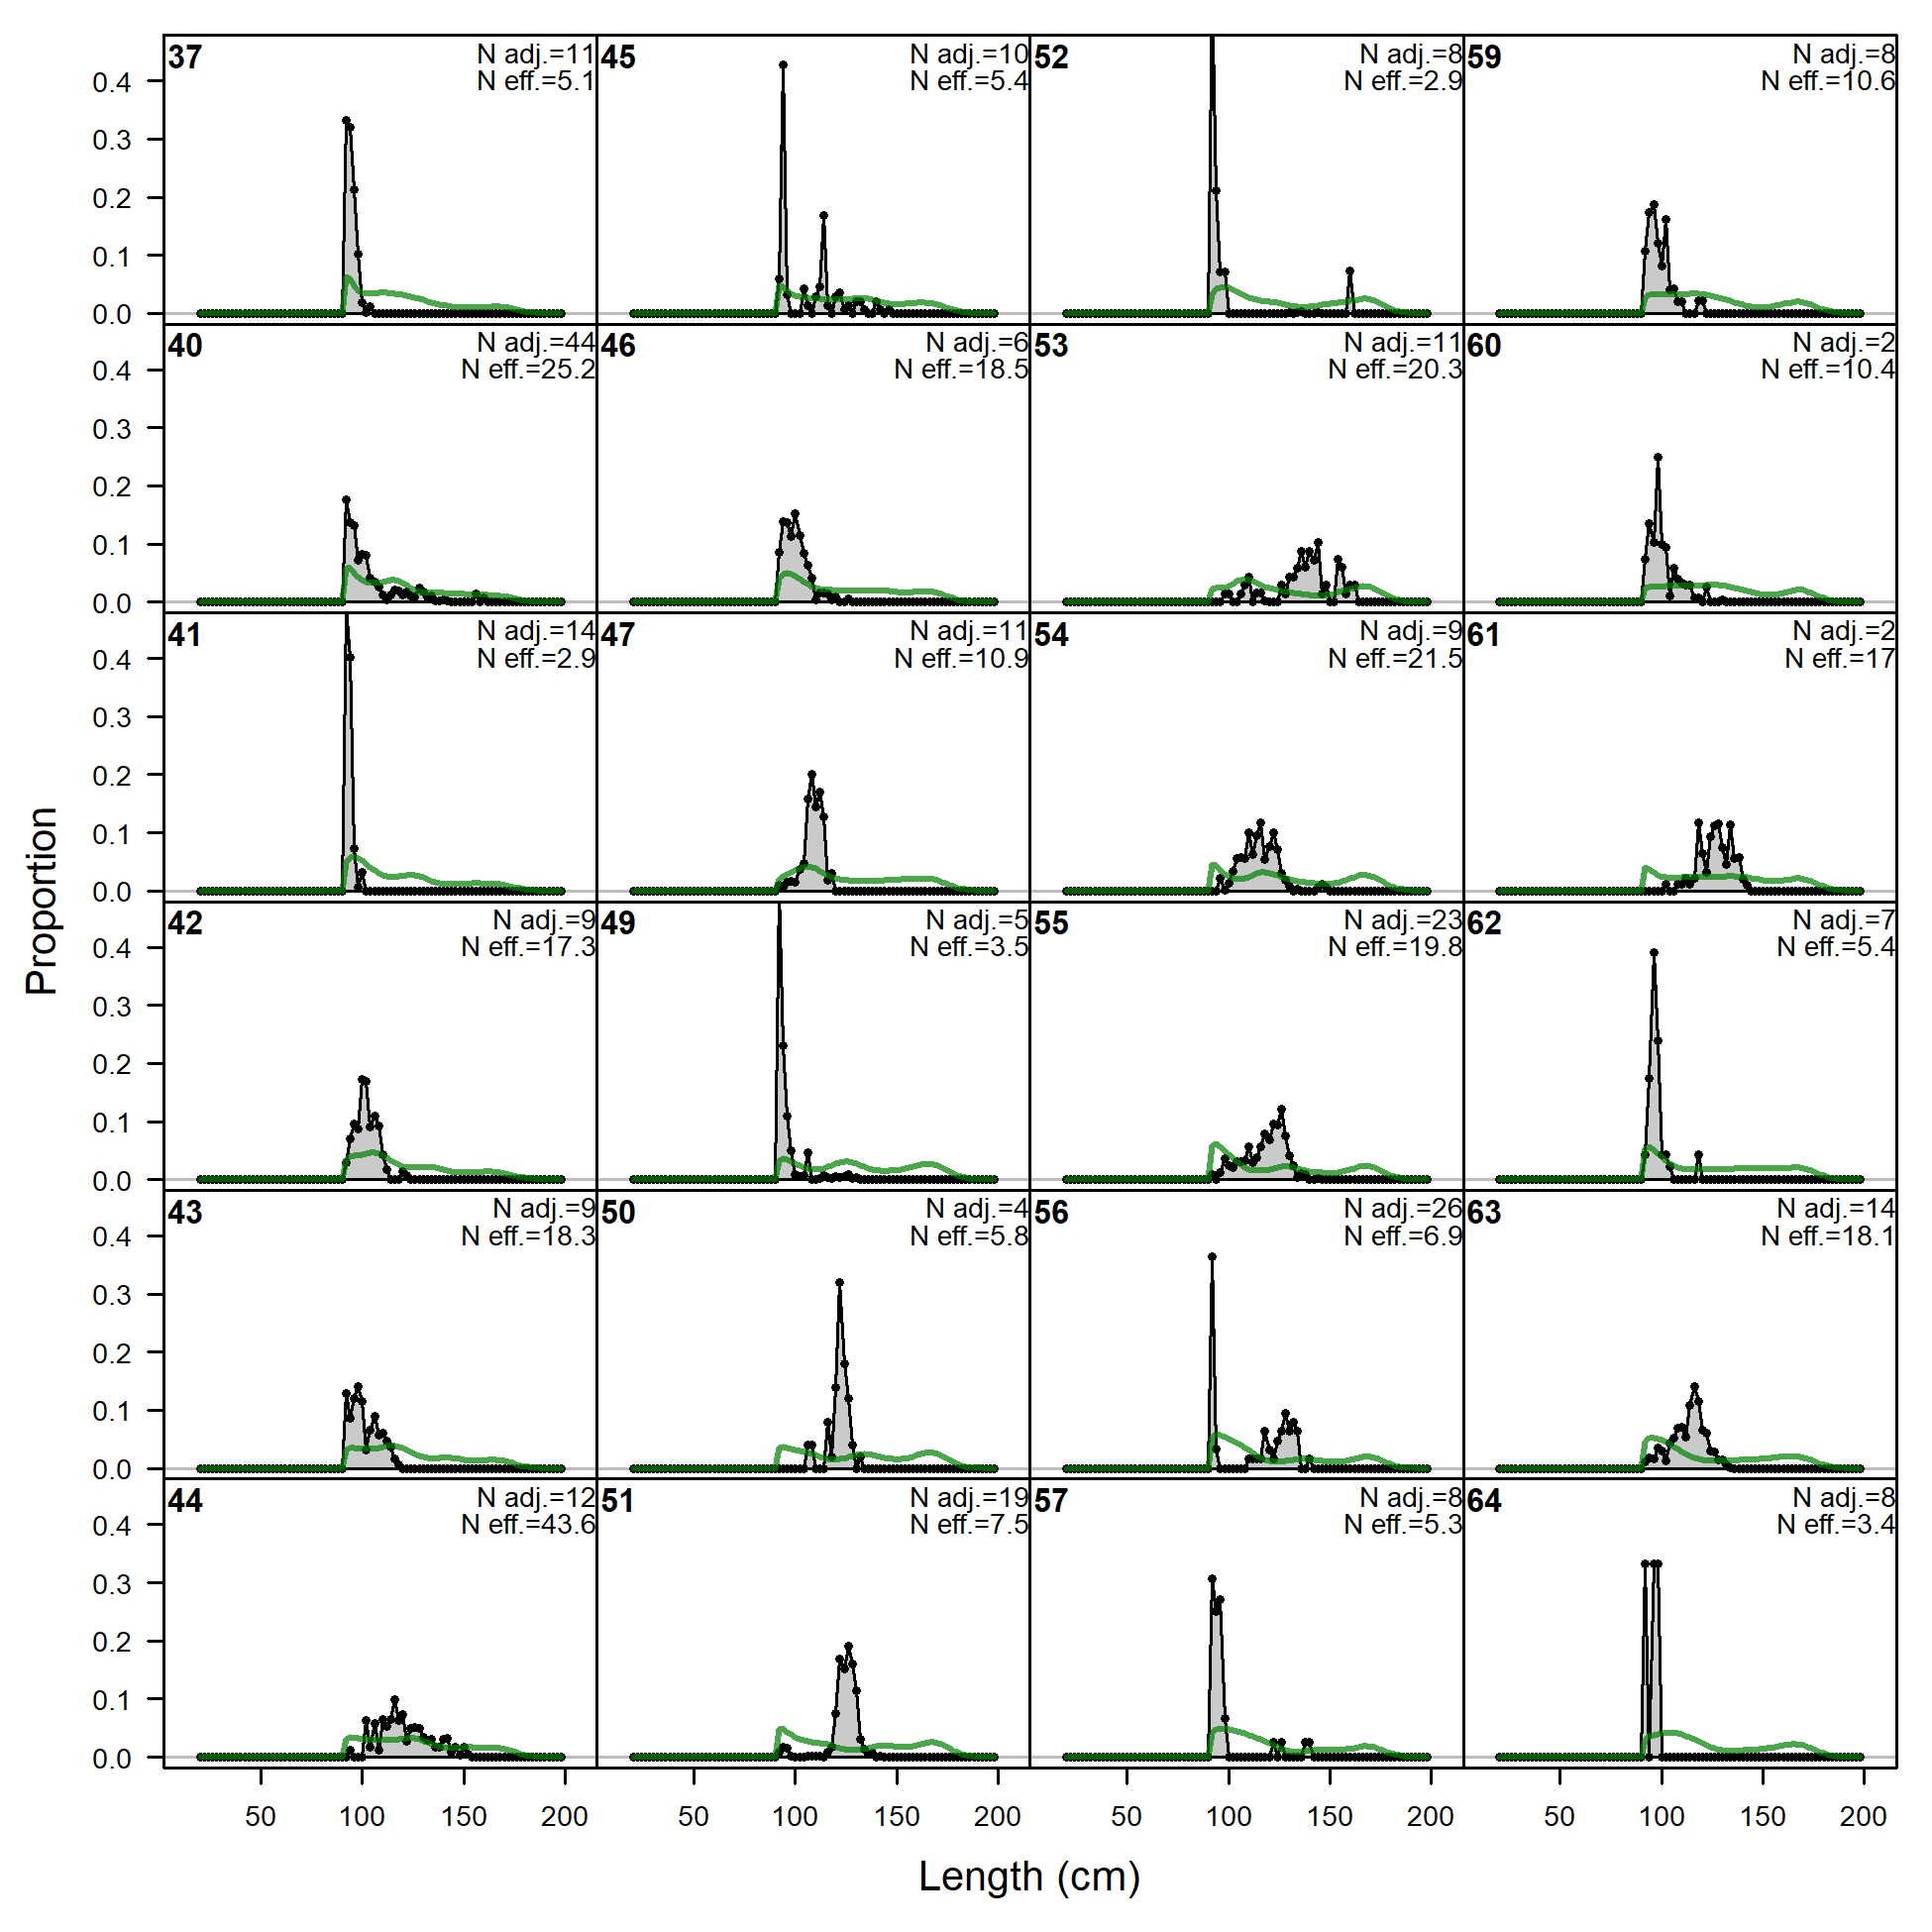
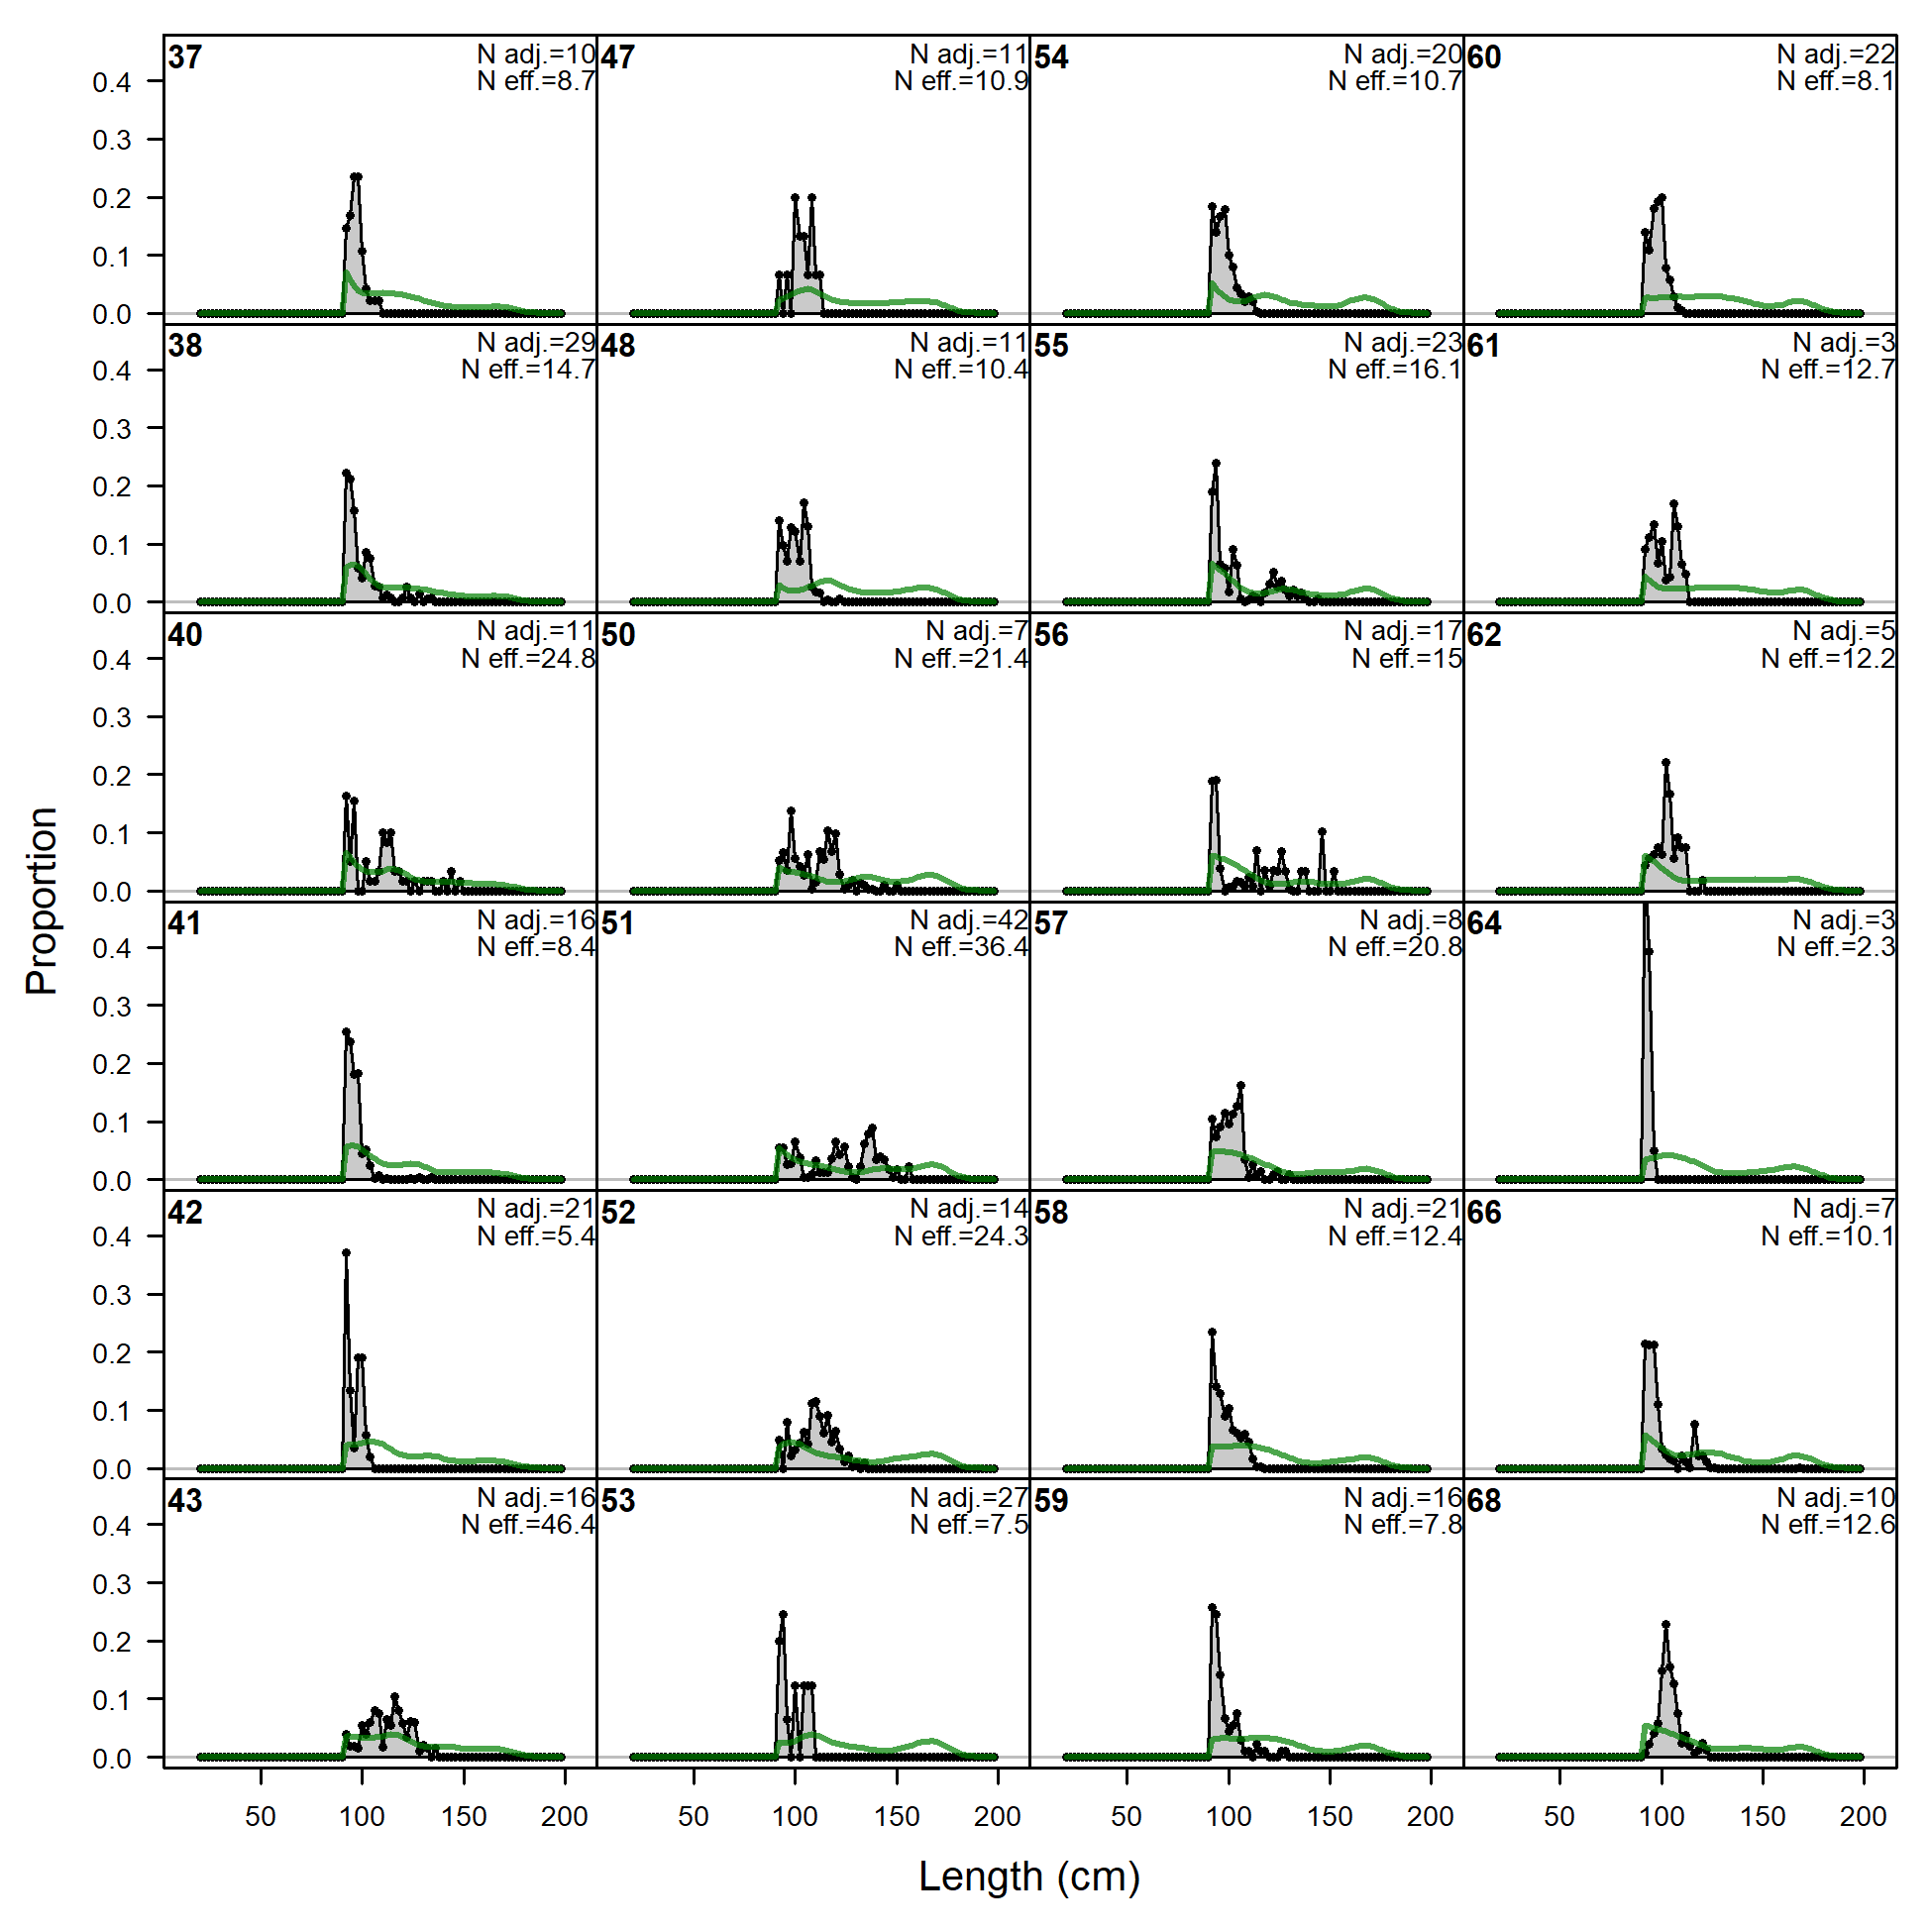
Length comps, whole catch, F3.OBJ.C (plot 1 of 5).
'N adj.' is the input sample size after data-weighting adjustment. N eff. is the calculated effective sample size used in the McAllister-Ianelli tuning method.
file: comp_lenfit_flt3mkt0_page1.png
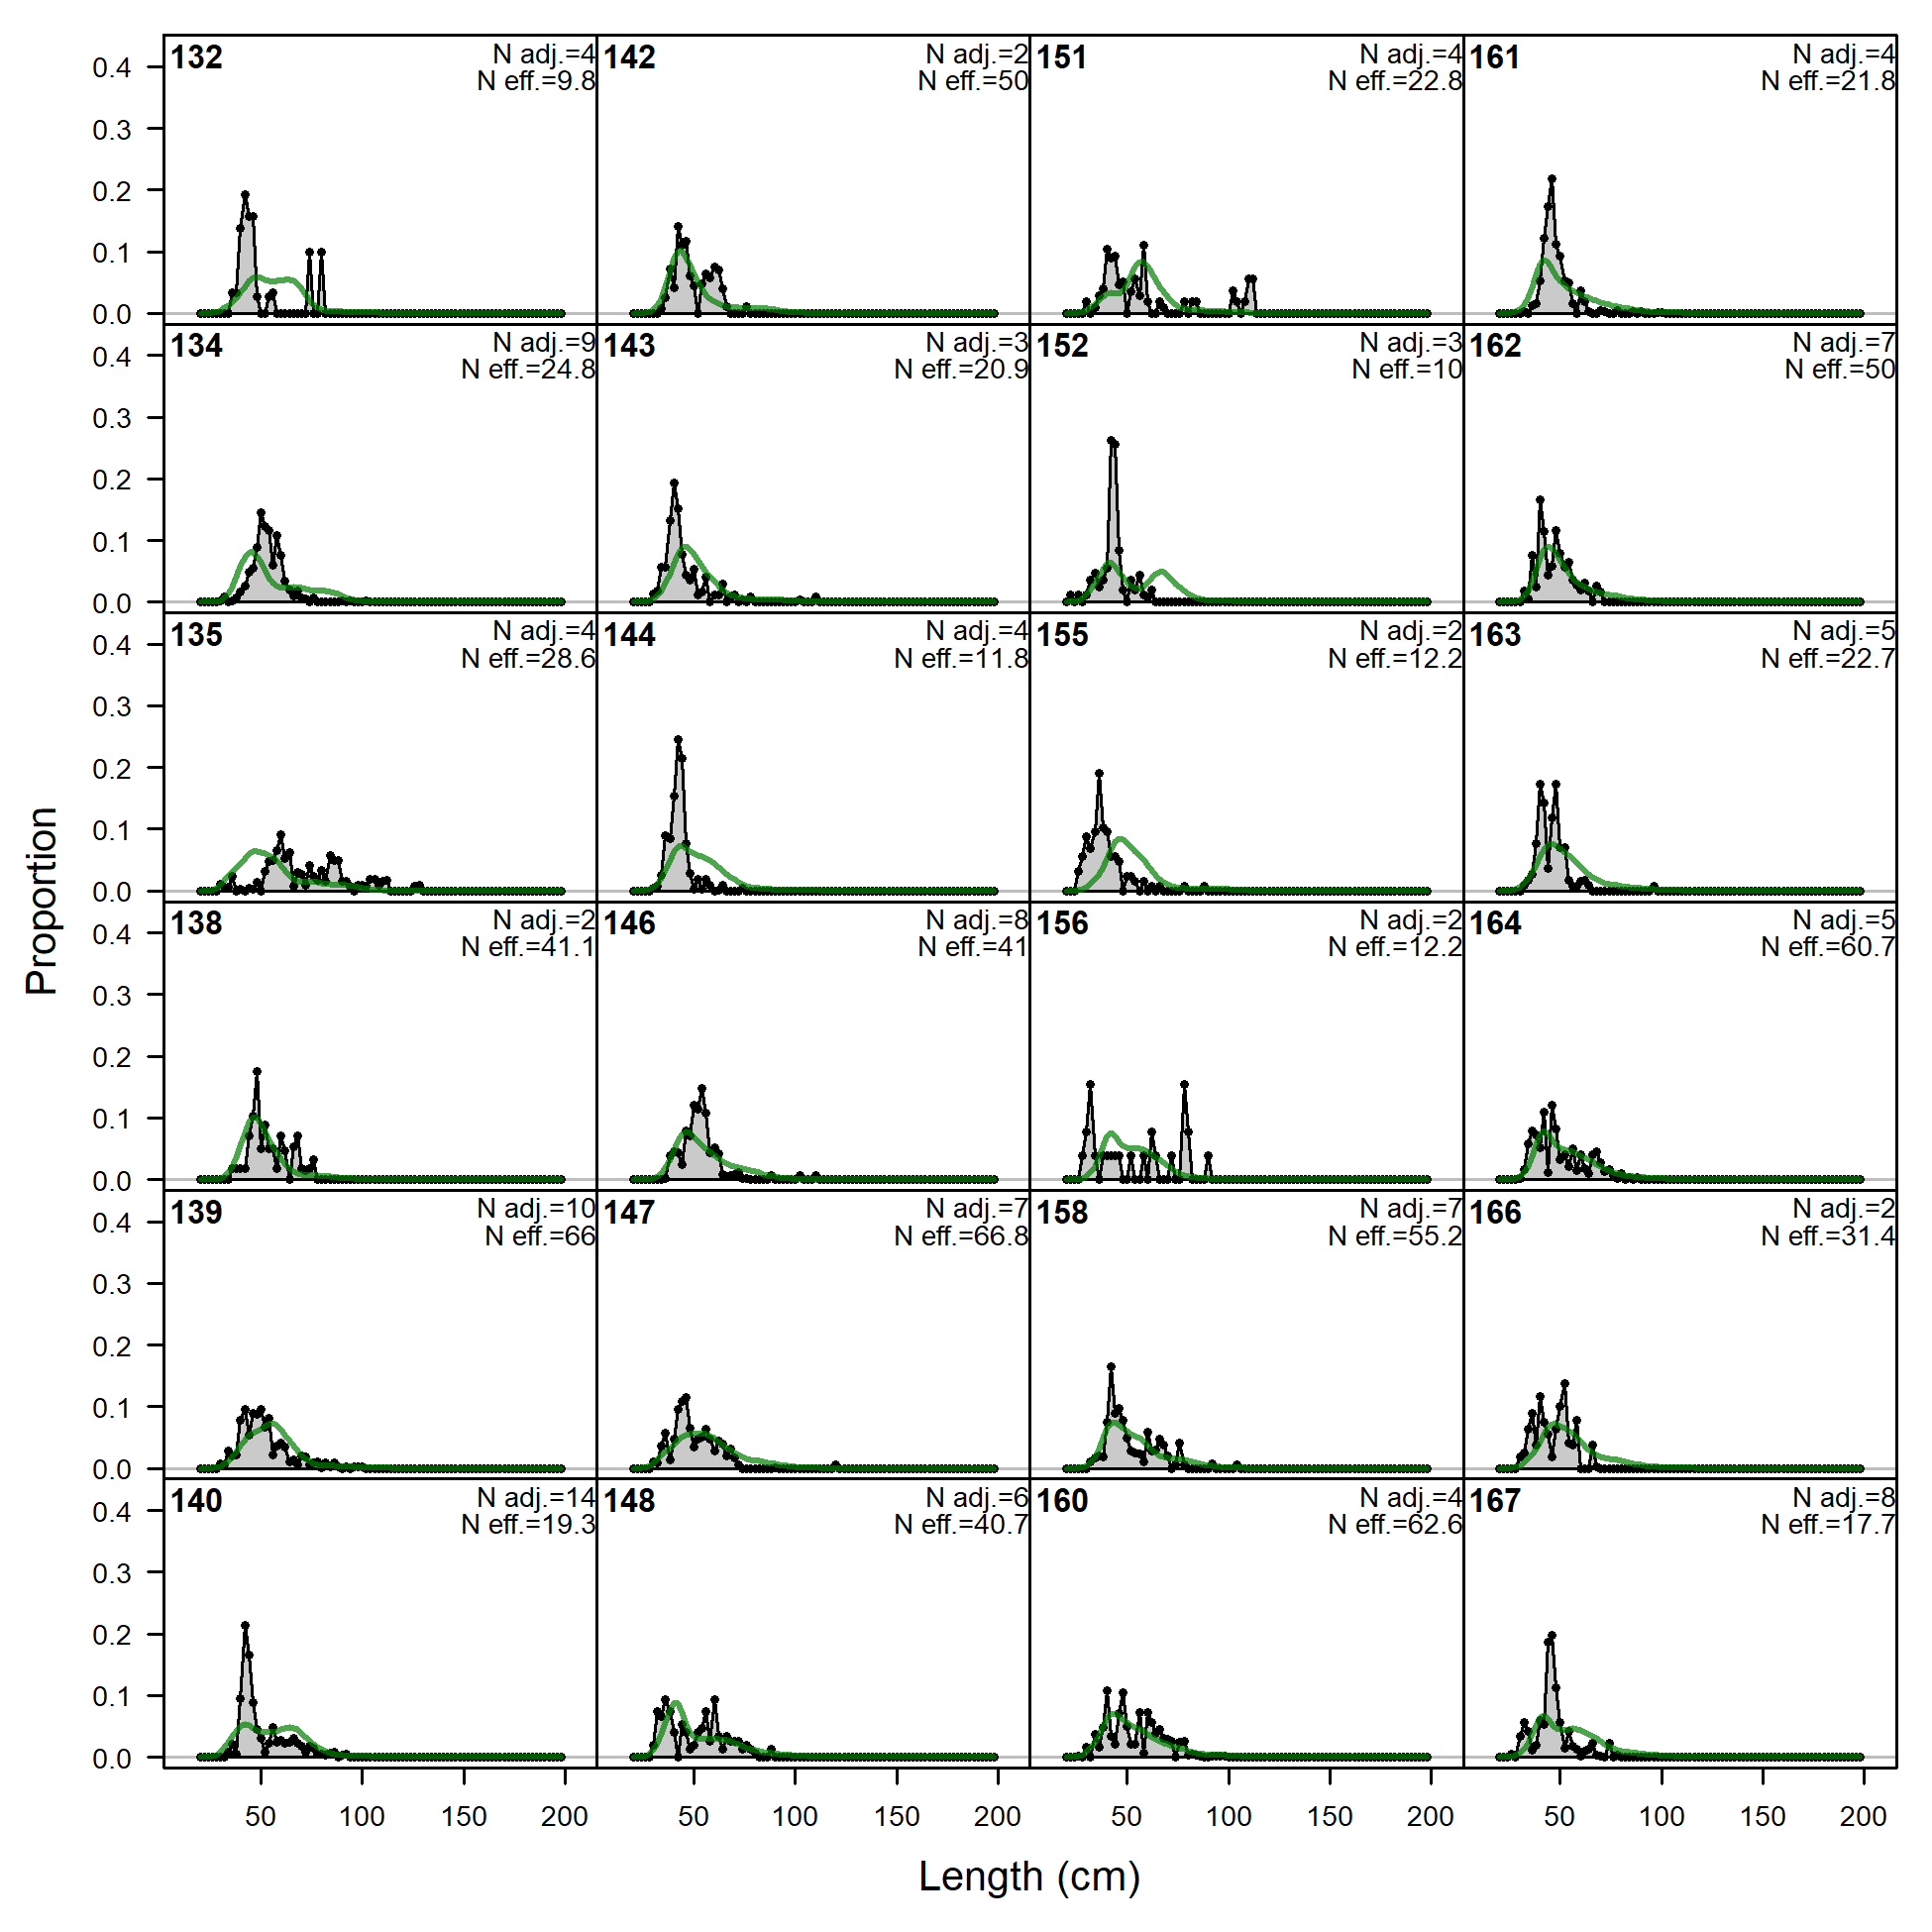
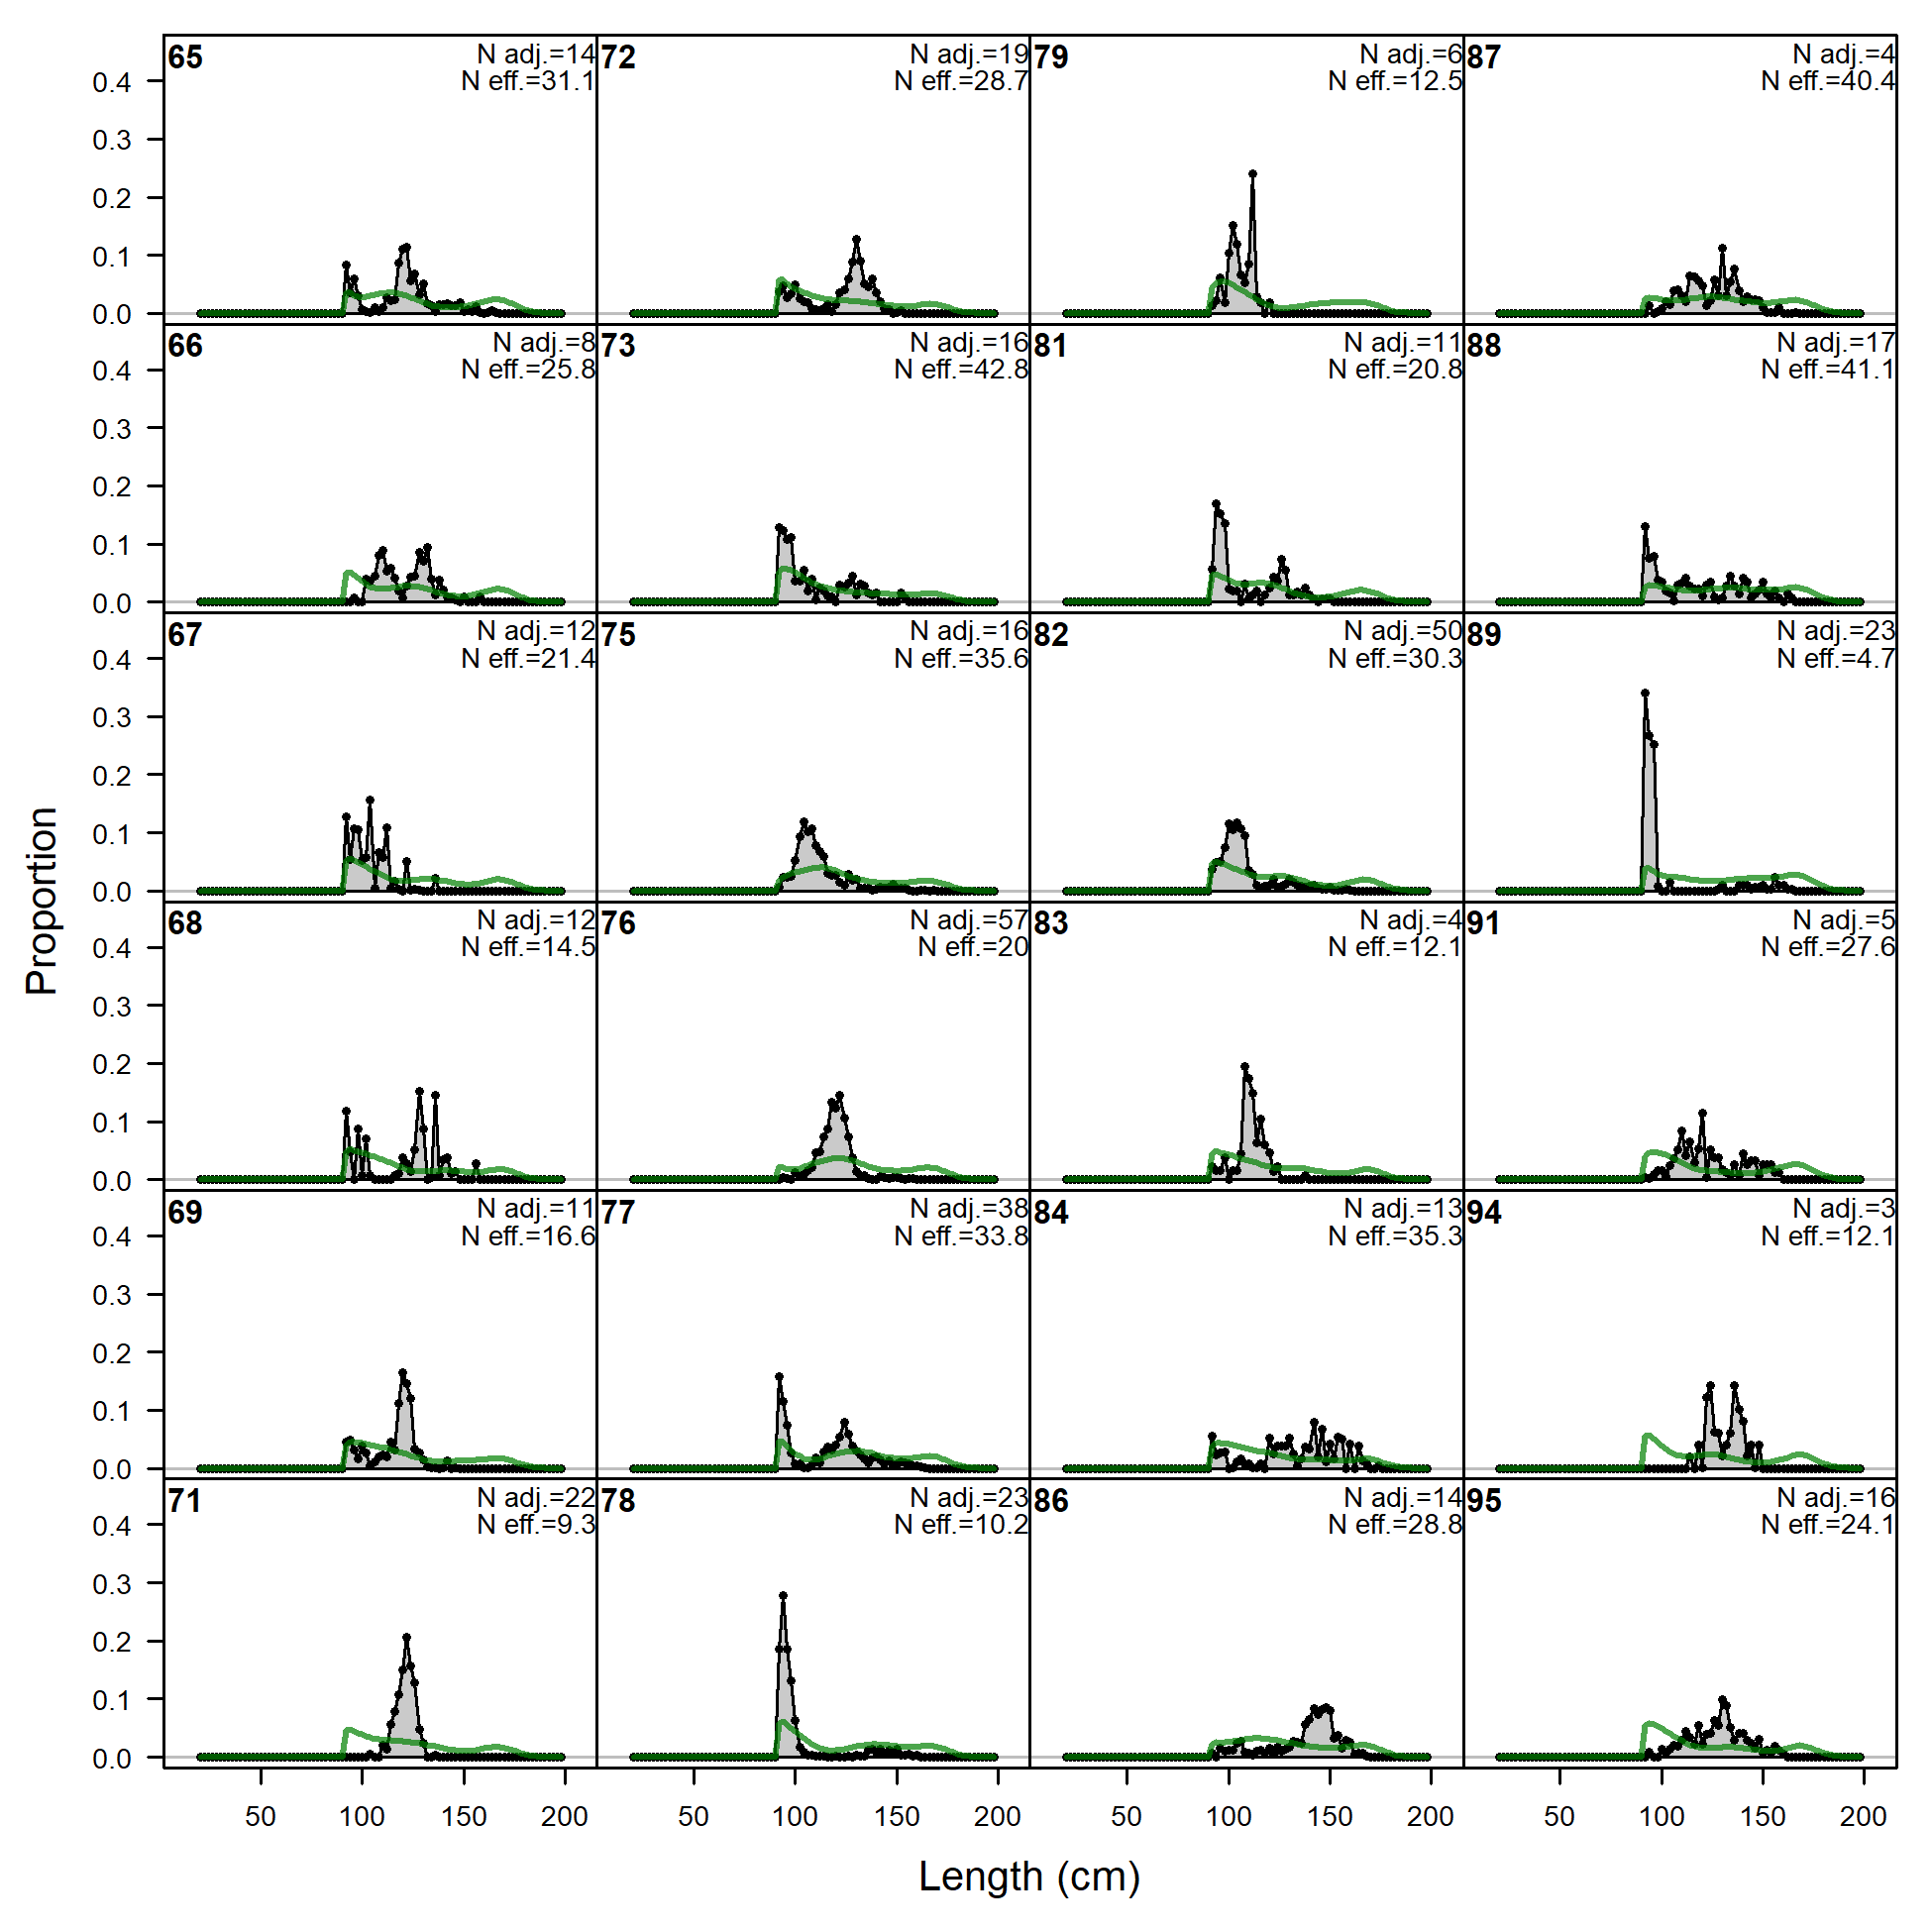
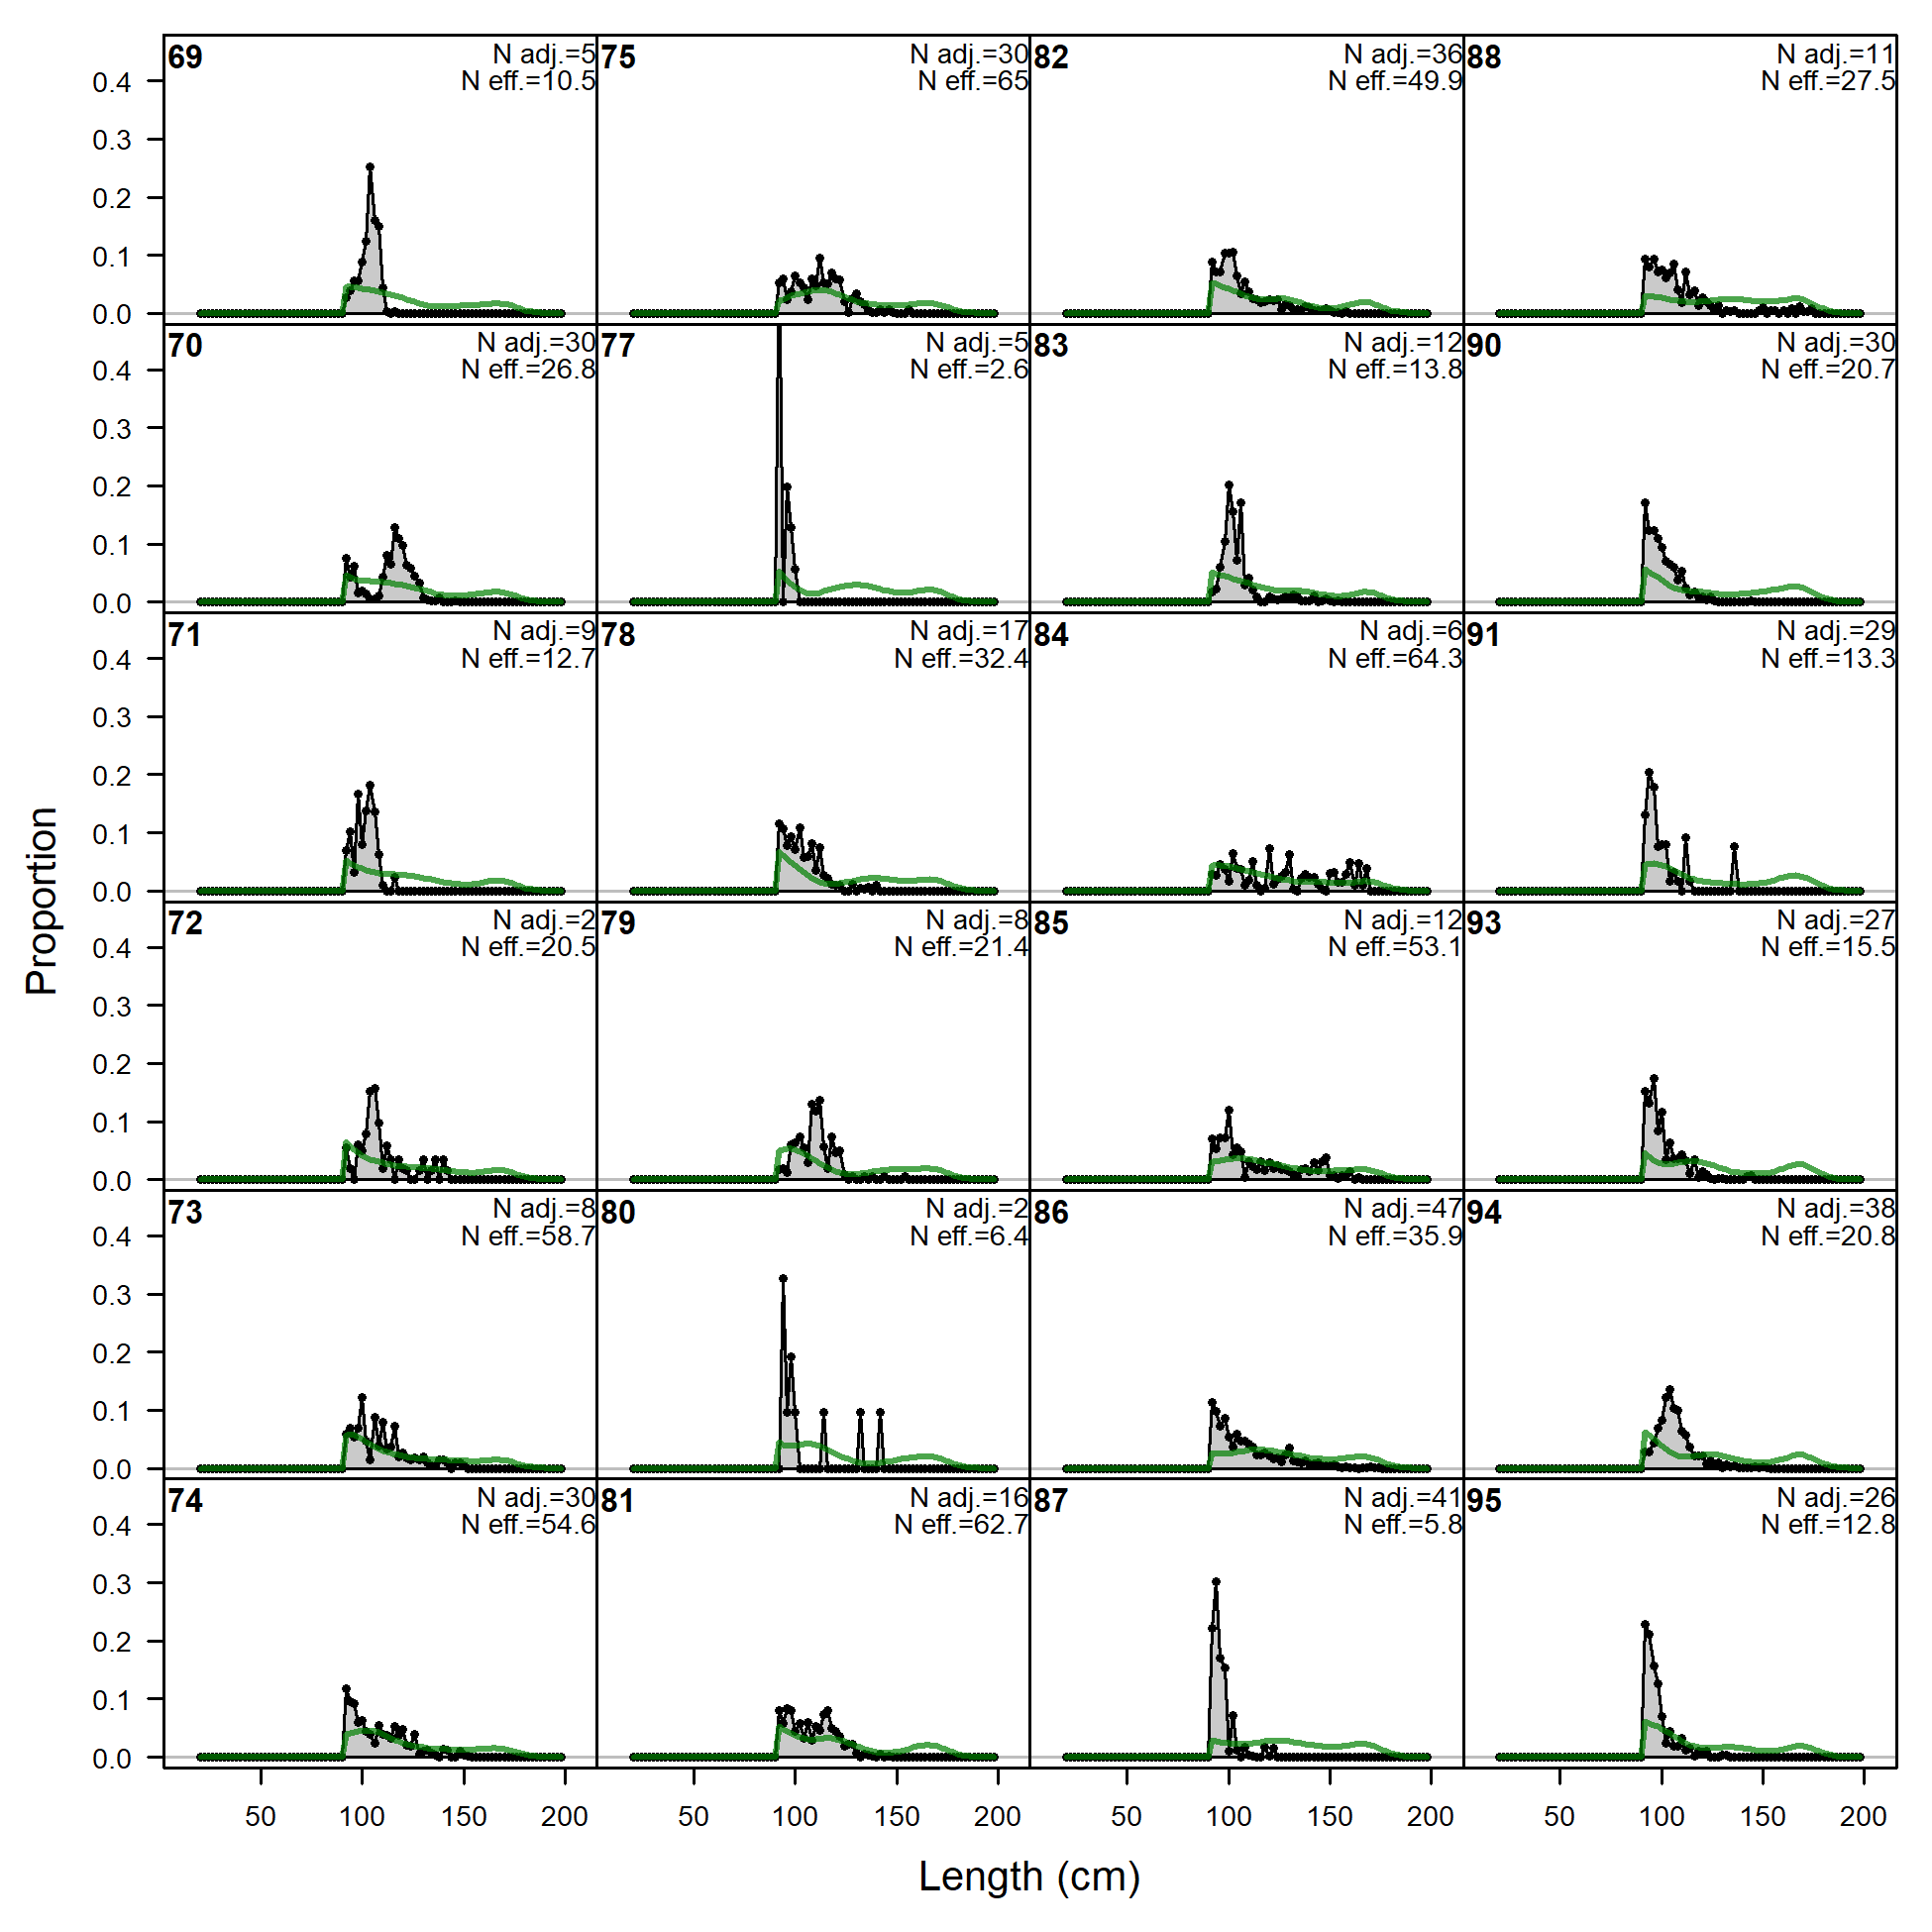
Length comps, whole catch, F3.OBJ.C (plot 1 of 5).
'N adj.' is the input sample size after data-weighting adjustment. N eff. is the calculated effective sample size used in the McAllister-Ianelli tuning method. (plot 2 of 5)
file: comp_lenfit_flt3mkt0_page2.png
Length comps, whole catch, F3.OBJ.C (plot 1 of 5).
'N adj.' is the input sample size after data-weighting adjustment. N eff. is the calculated effective sample size used in the McAllister-Ianelli tuning method. (plot 2 of 5) (plot 3 of 5)
file: comp_lenfit_flt3mkt0_page3.png
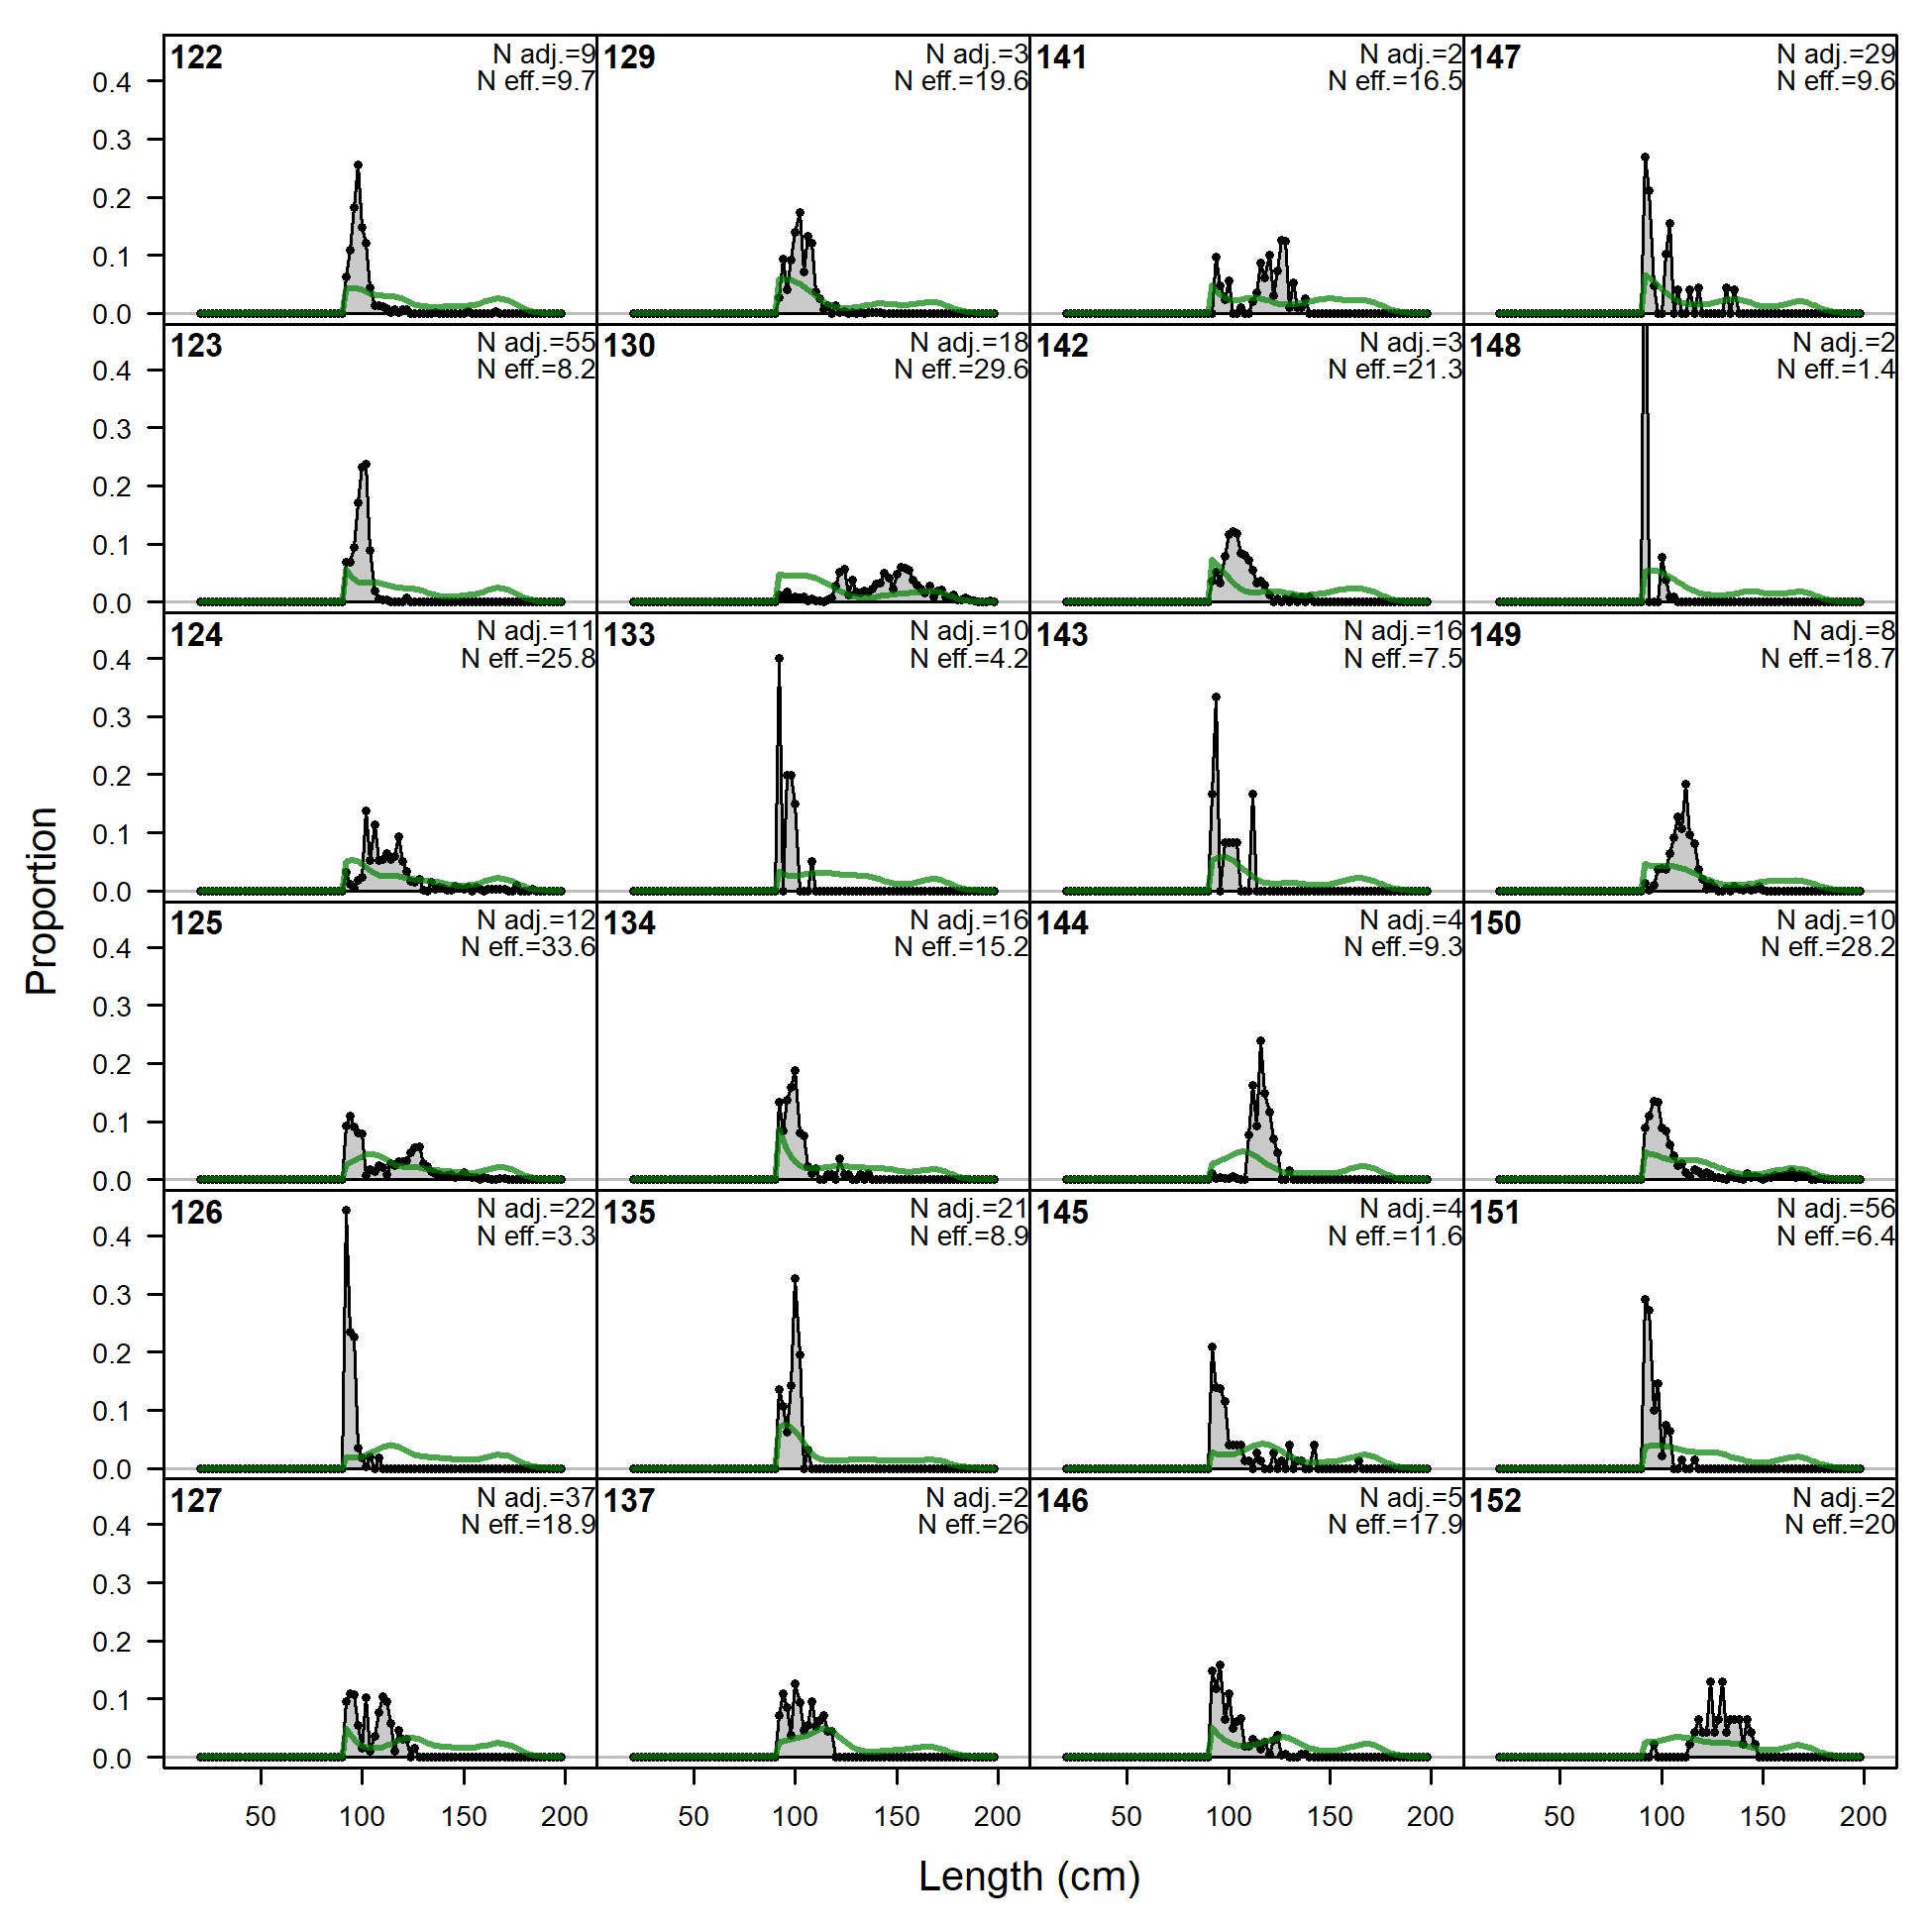
Length comps, whole catch, F3.OBJ.C (plot 1 of 5).
'N adj.' is the input sample size after data-weighting adjustment. N eff. is the calculated effective sample size used in the McAllister-Ianelli tuning method. (plot 2 of 5) (plot 3 of 5) (plot 4 of 5)
file: comp_lenfit_flt3mkt0_page4.png
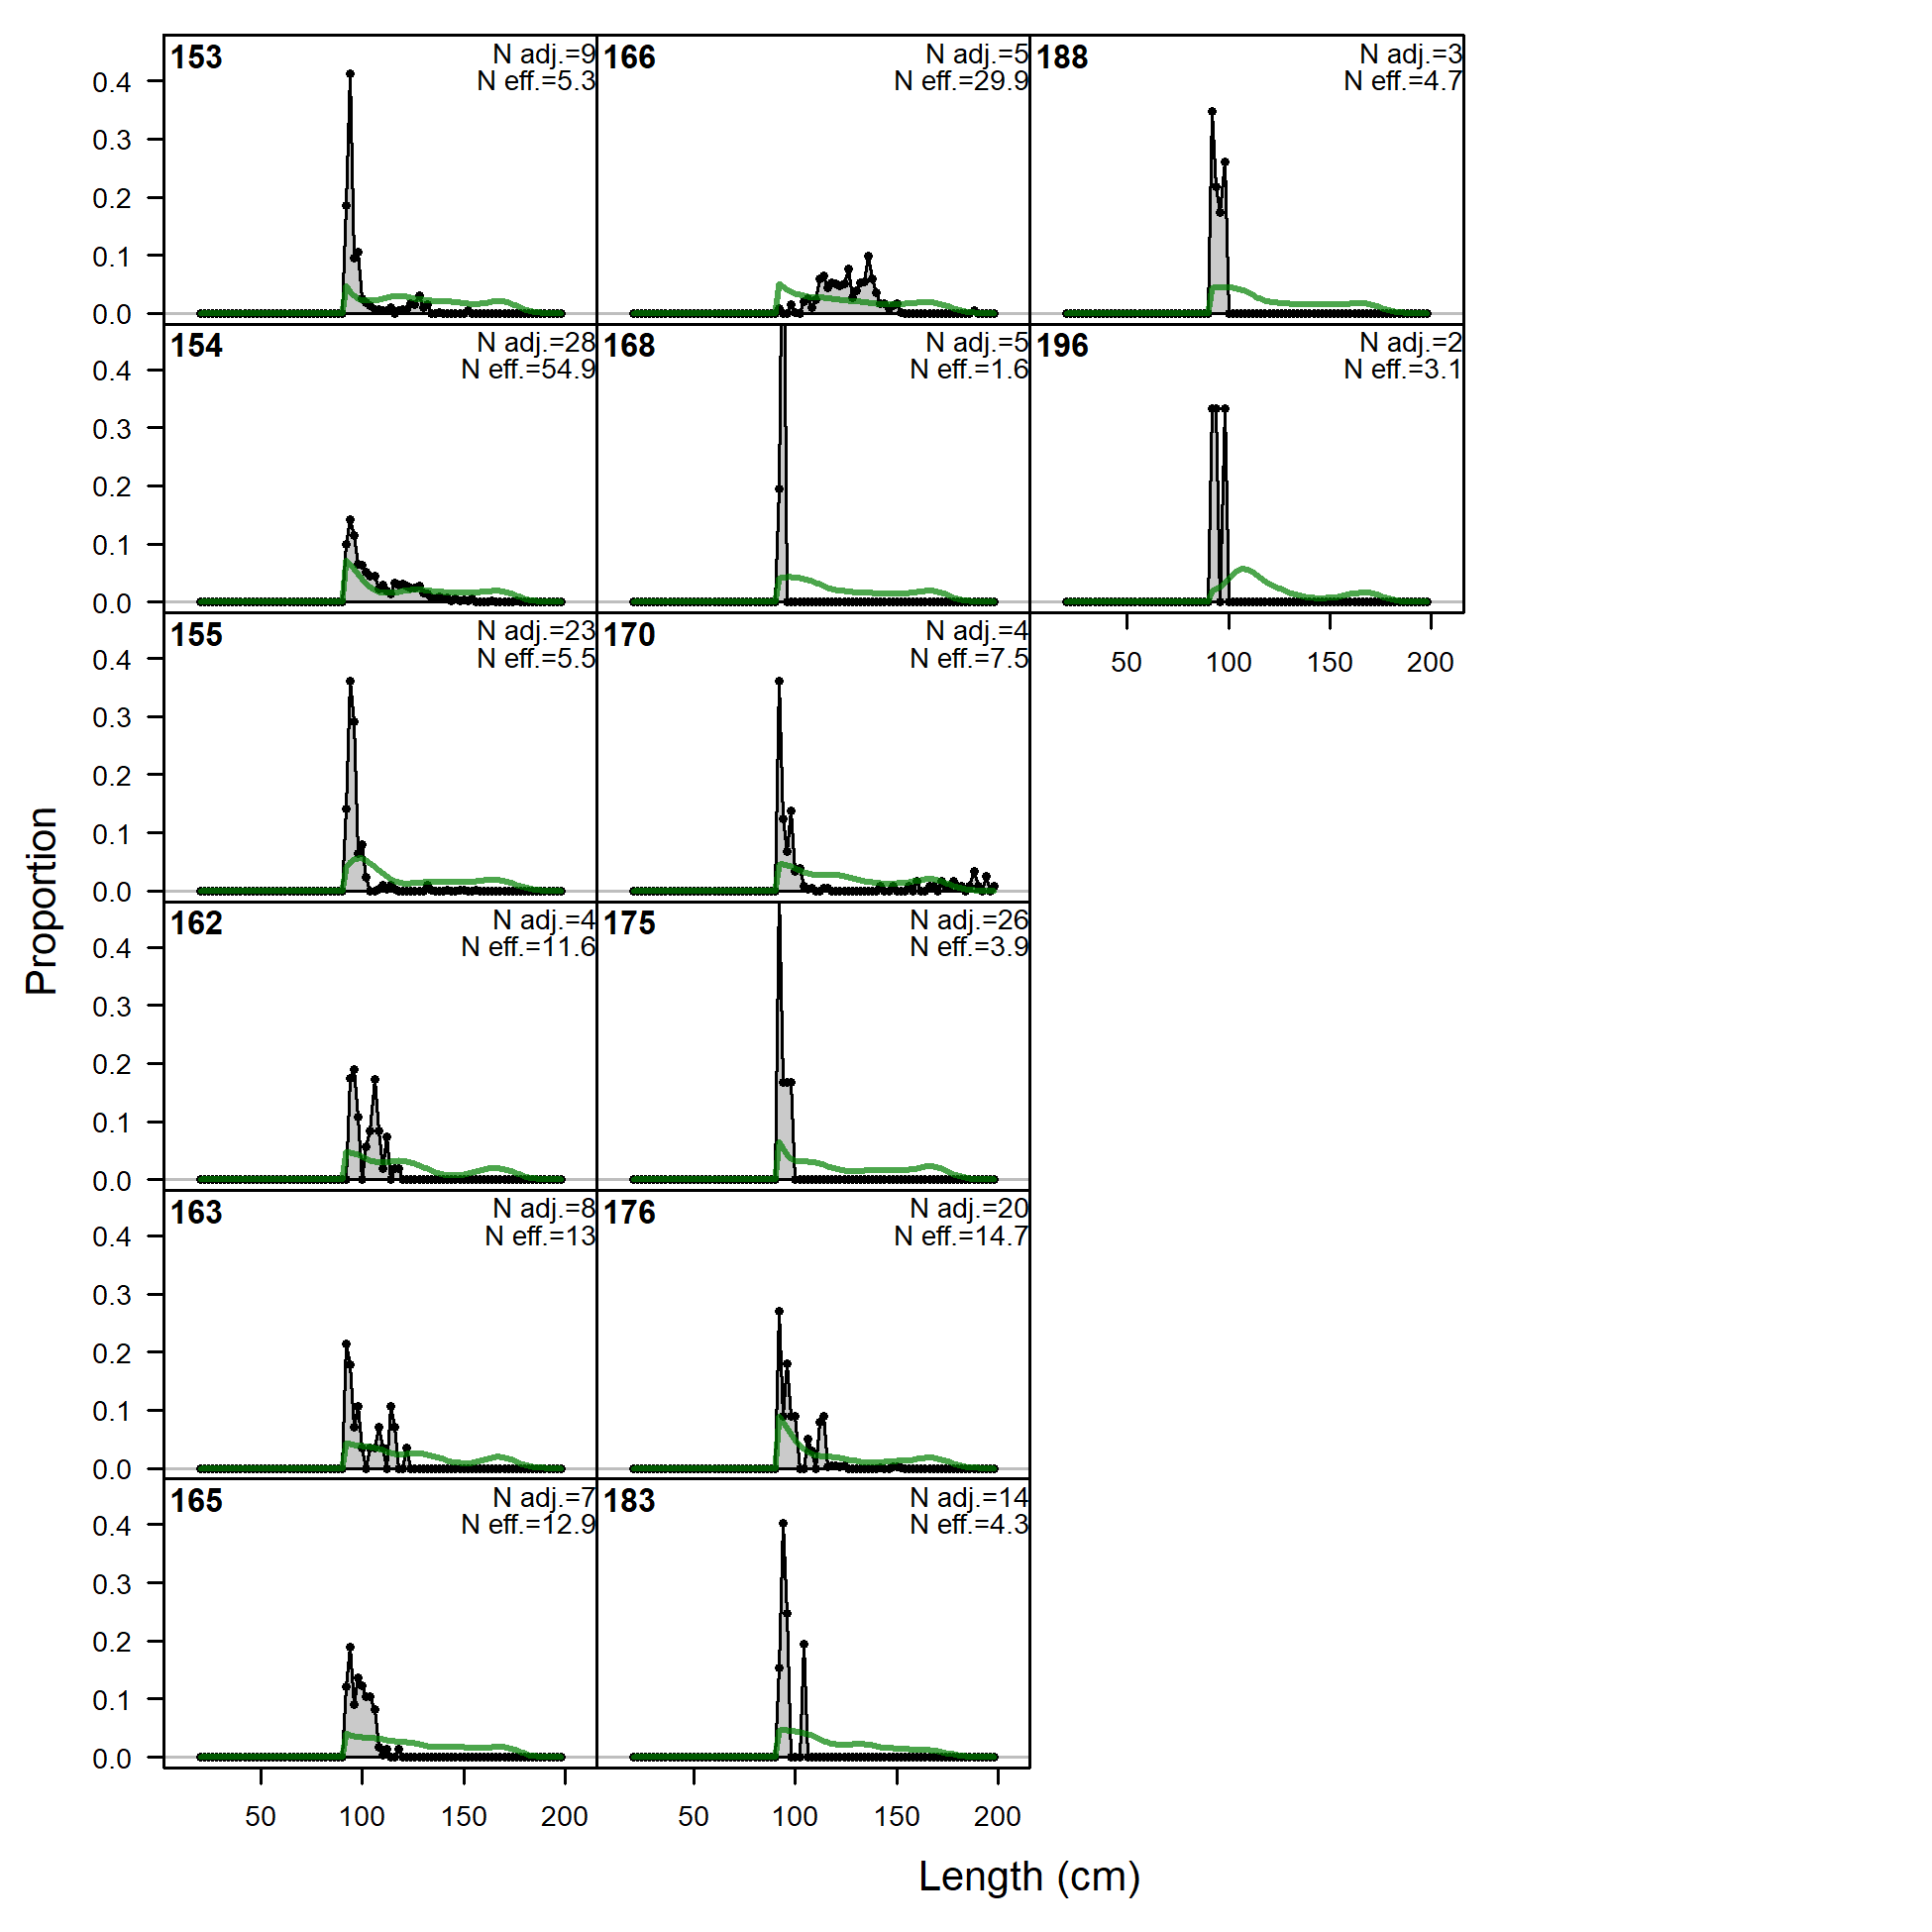
Length comps, whole catch, F3.OBJ.C (plot 1 of 5).
'N adj.' is the input sample size after data-weighting adjustment. N eff. is the calculated effective sample size used in the McAllister-Ianelli tuning method. (plot 2 of 5) (plot 3 of 5) (plot 4 of 5) (plot 5 of 5)
file: comp_lenfit_flt3mkt0_page5.png

Pearson residuals, whole catch, F3.OBJ.C (max=10.54) (plot 5 of 5)
Closed bubbles are positive residuals (observed > expected) and open bubbles are negative residuals (observed < expected).
file: comp_lenfit_residsflt3mkt0_page5.png
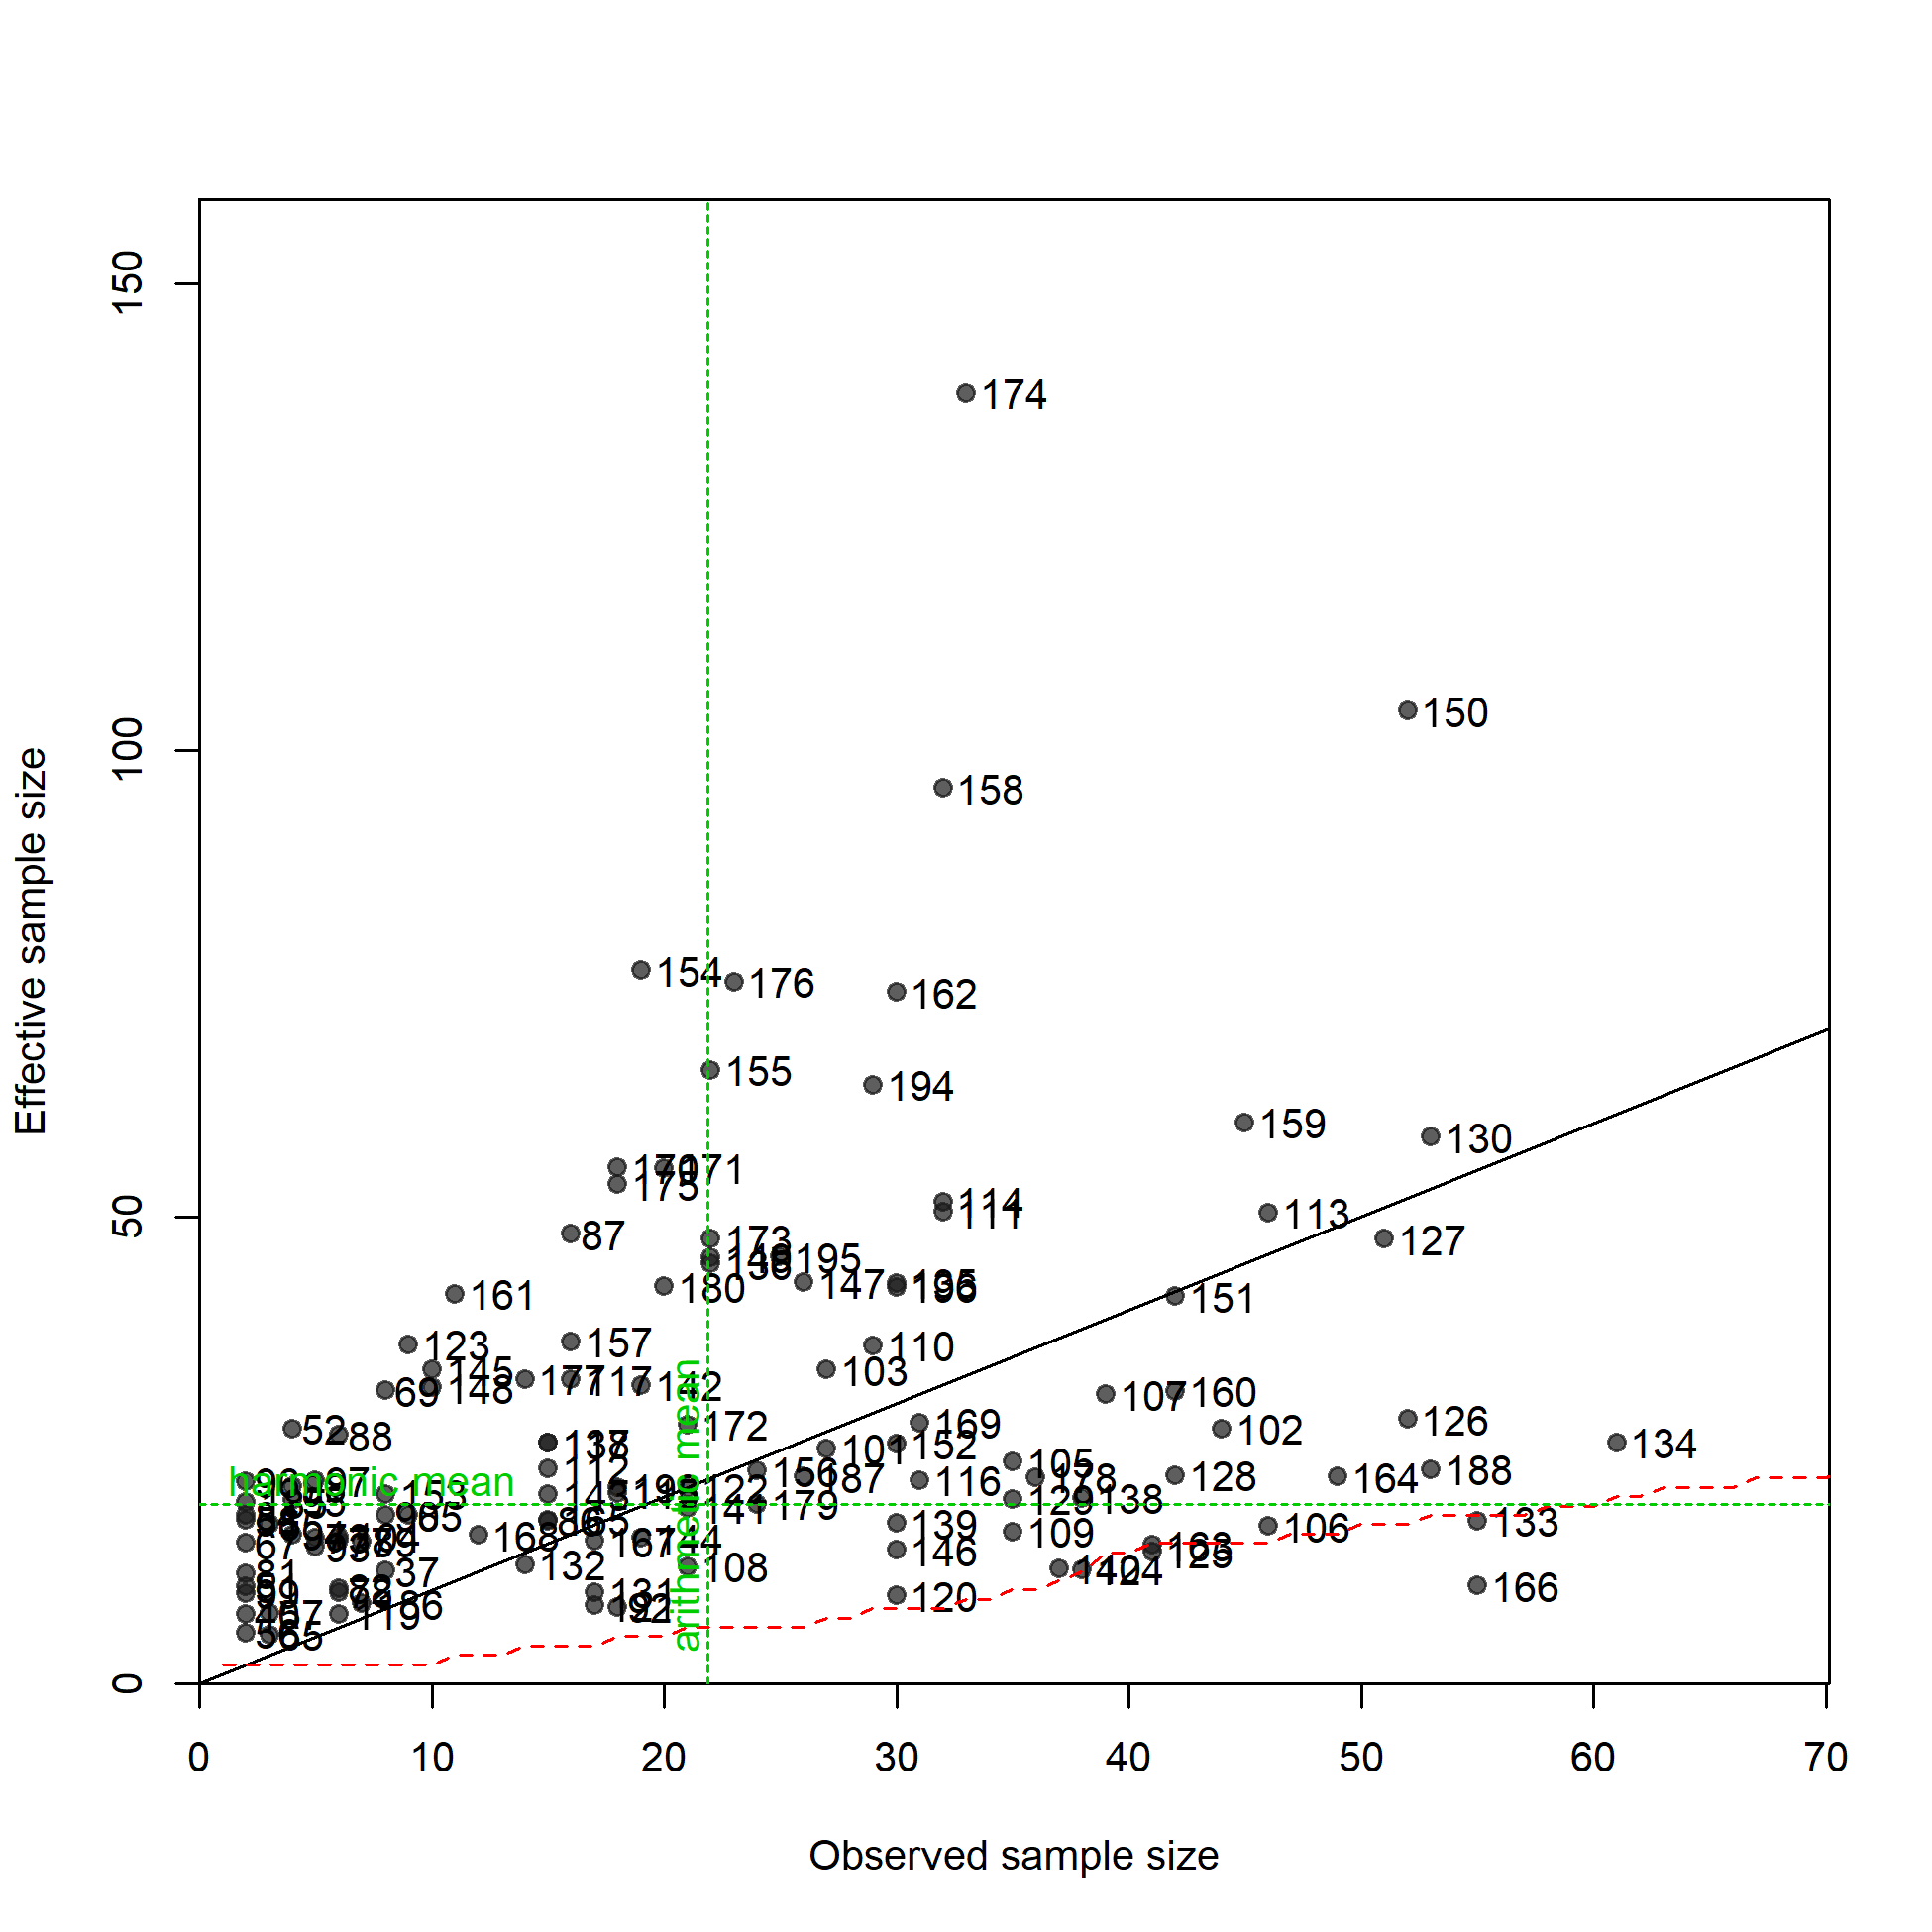
N-EffN comparison, Length comps, whole catch, F3.OBJ.C
file: comp_lenfit_sampsize_flt3mkt0.png
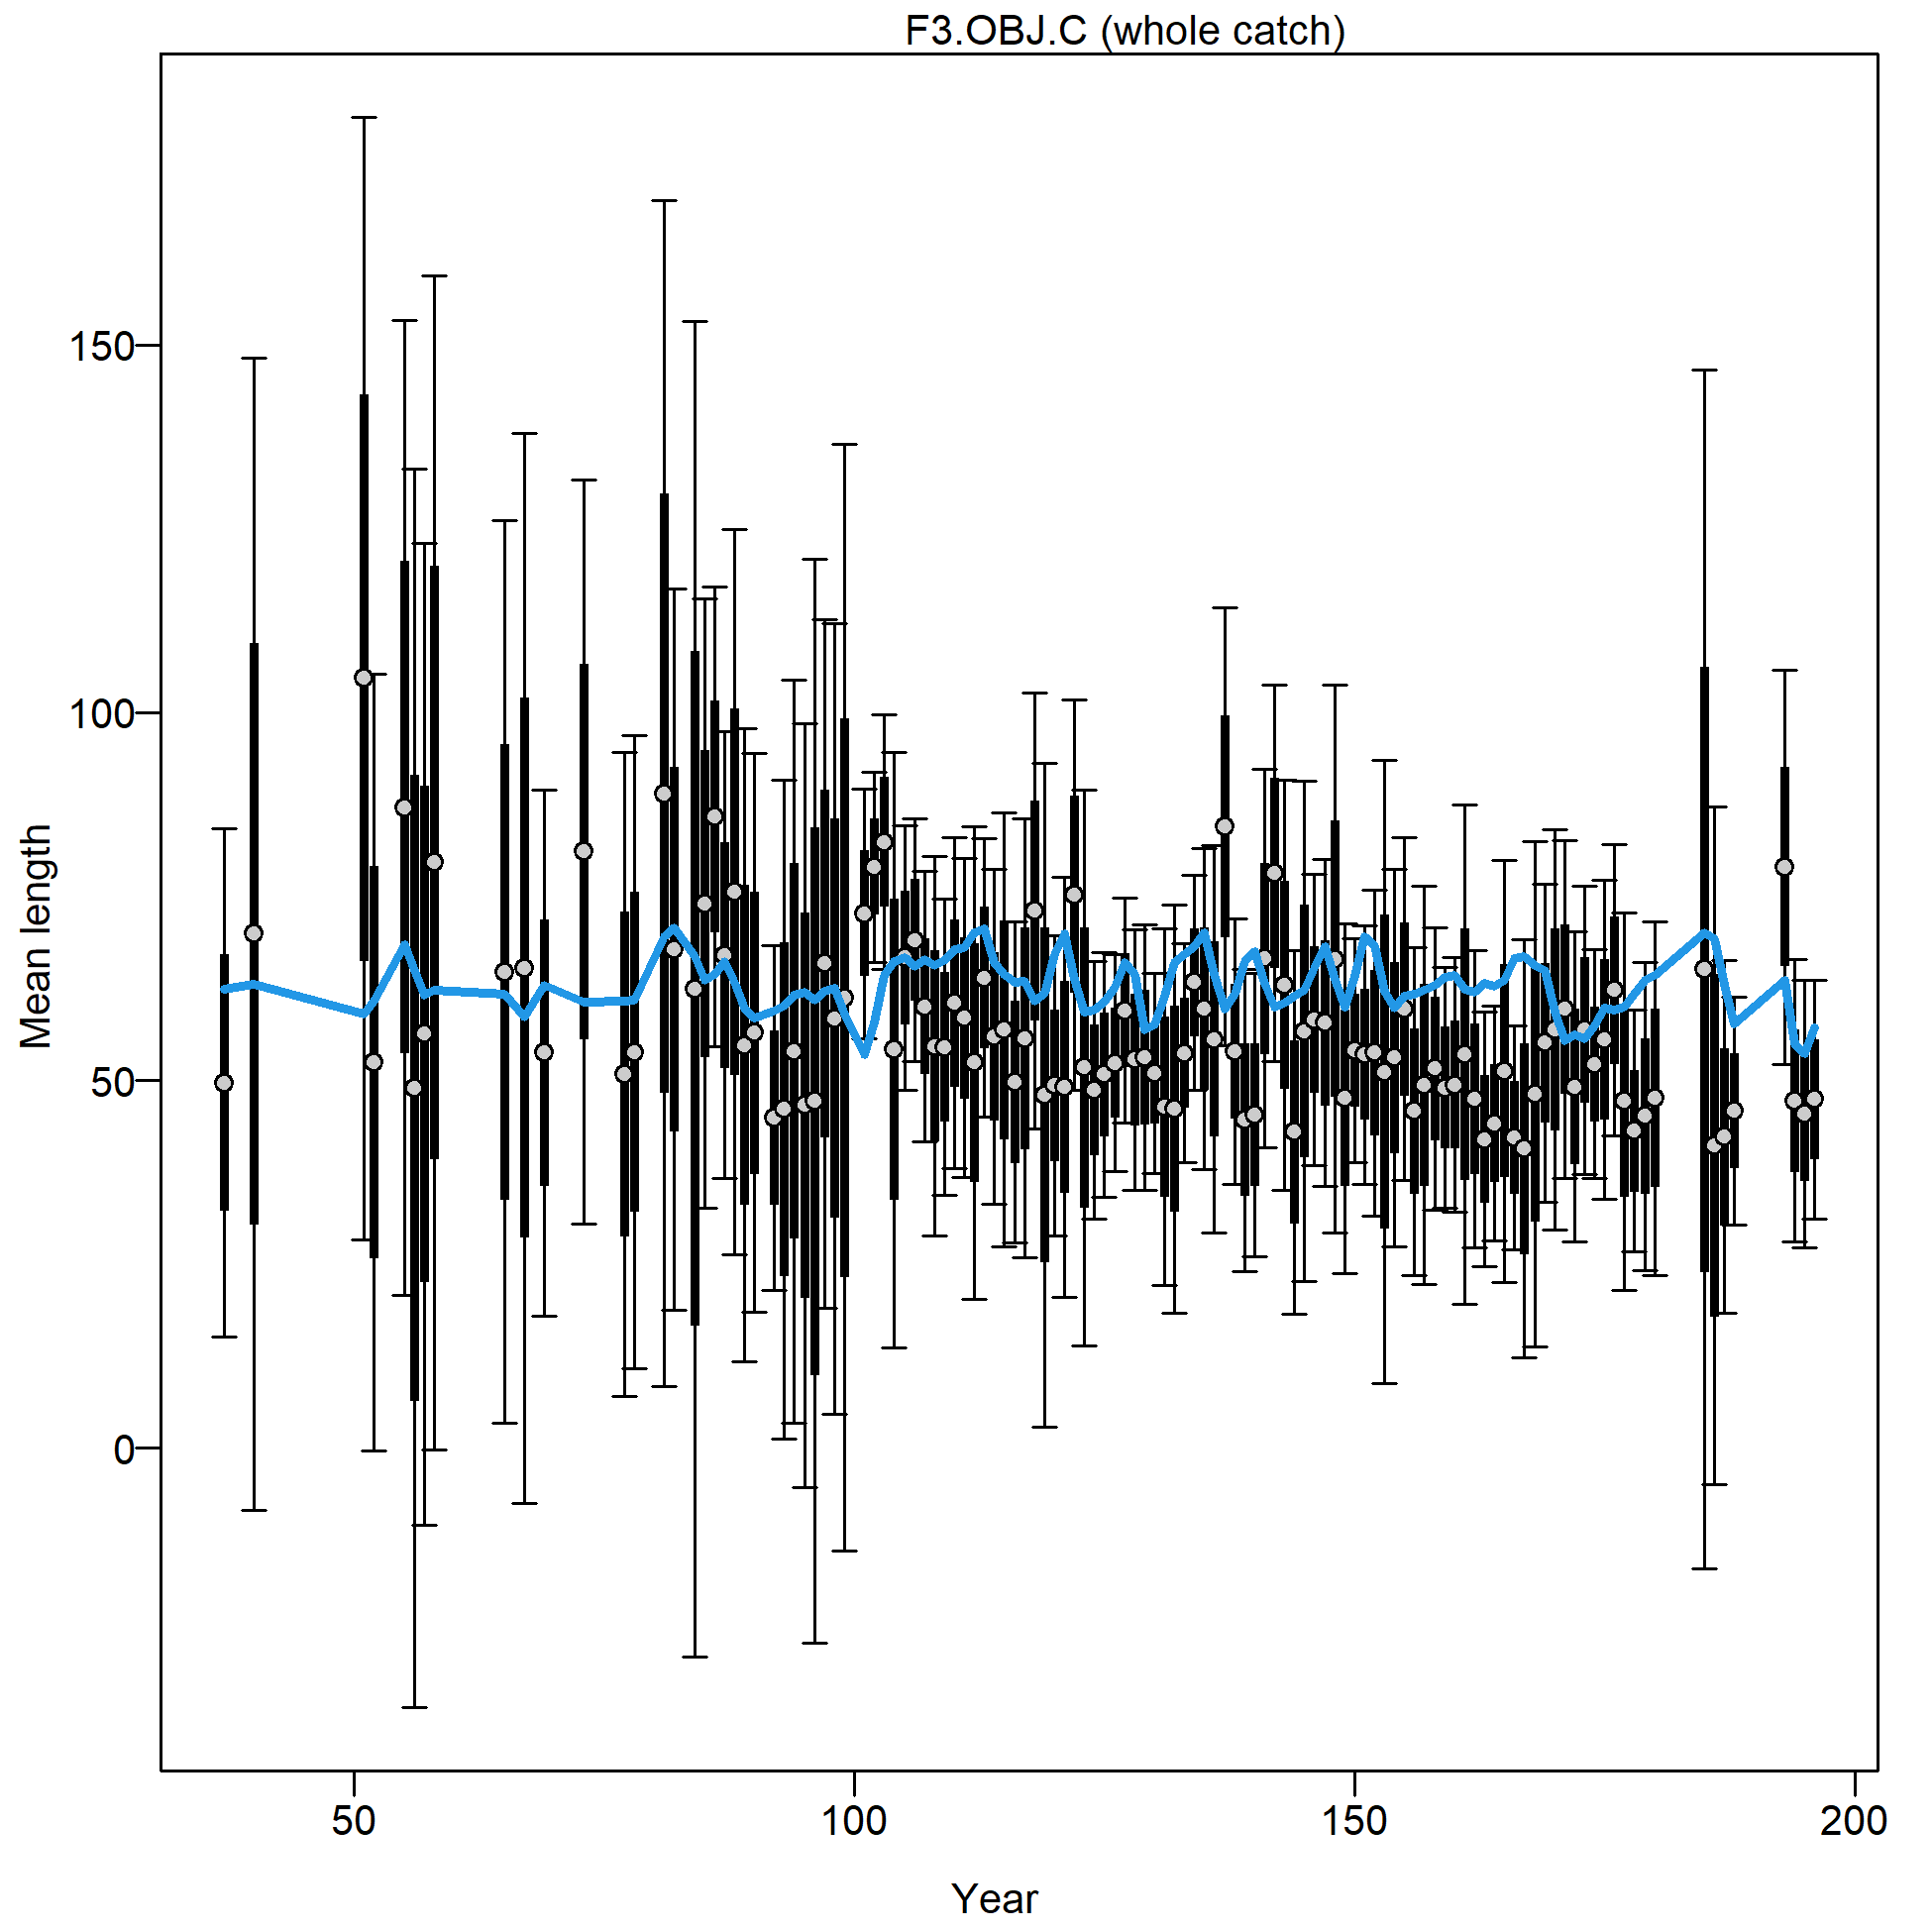
Mean length for F3.OBJ.C with 95% confidence intervals based on current sample sizes.
Francis data weighting method TA1.8: thinner intervals (with capped ends) show result of further adjusting sample sizes based on suggested multiplier (with 95% interval) for len data from F3.OBJ.C:
0.2551 (0.1889-0.3749)
For more info, see Francis (2011).
file: comp_lenfit_data_weighting_TA1.8_F3.OBJ.C.png
Length comps, whole catch, F4.OBJ.E.offshore (plot 1 of 3).
'N adj.' is the input sample size after data-weighting adjustment. N eff. is the calculated effective sample size used in the McAllister-Ianelli tuning method.
file: comp_lenfit_flt4mkt0_page1.png
Length comps, whole catch, F4.OBJ.E.offshore (plot 1 of 3).
'N adj.' is the input sample size after data-weighting adjustment. N eff. is the calculated effective sample size used in the McAllister-Ianelli tuning method. (plot 2 of 3)
file: comp_lenfit_flt4mkt0_page2.png
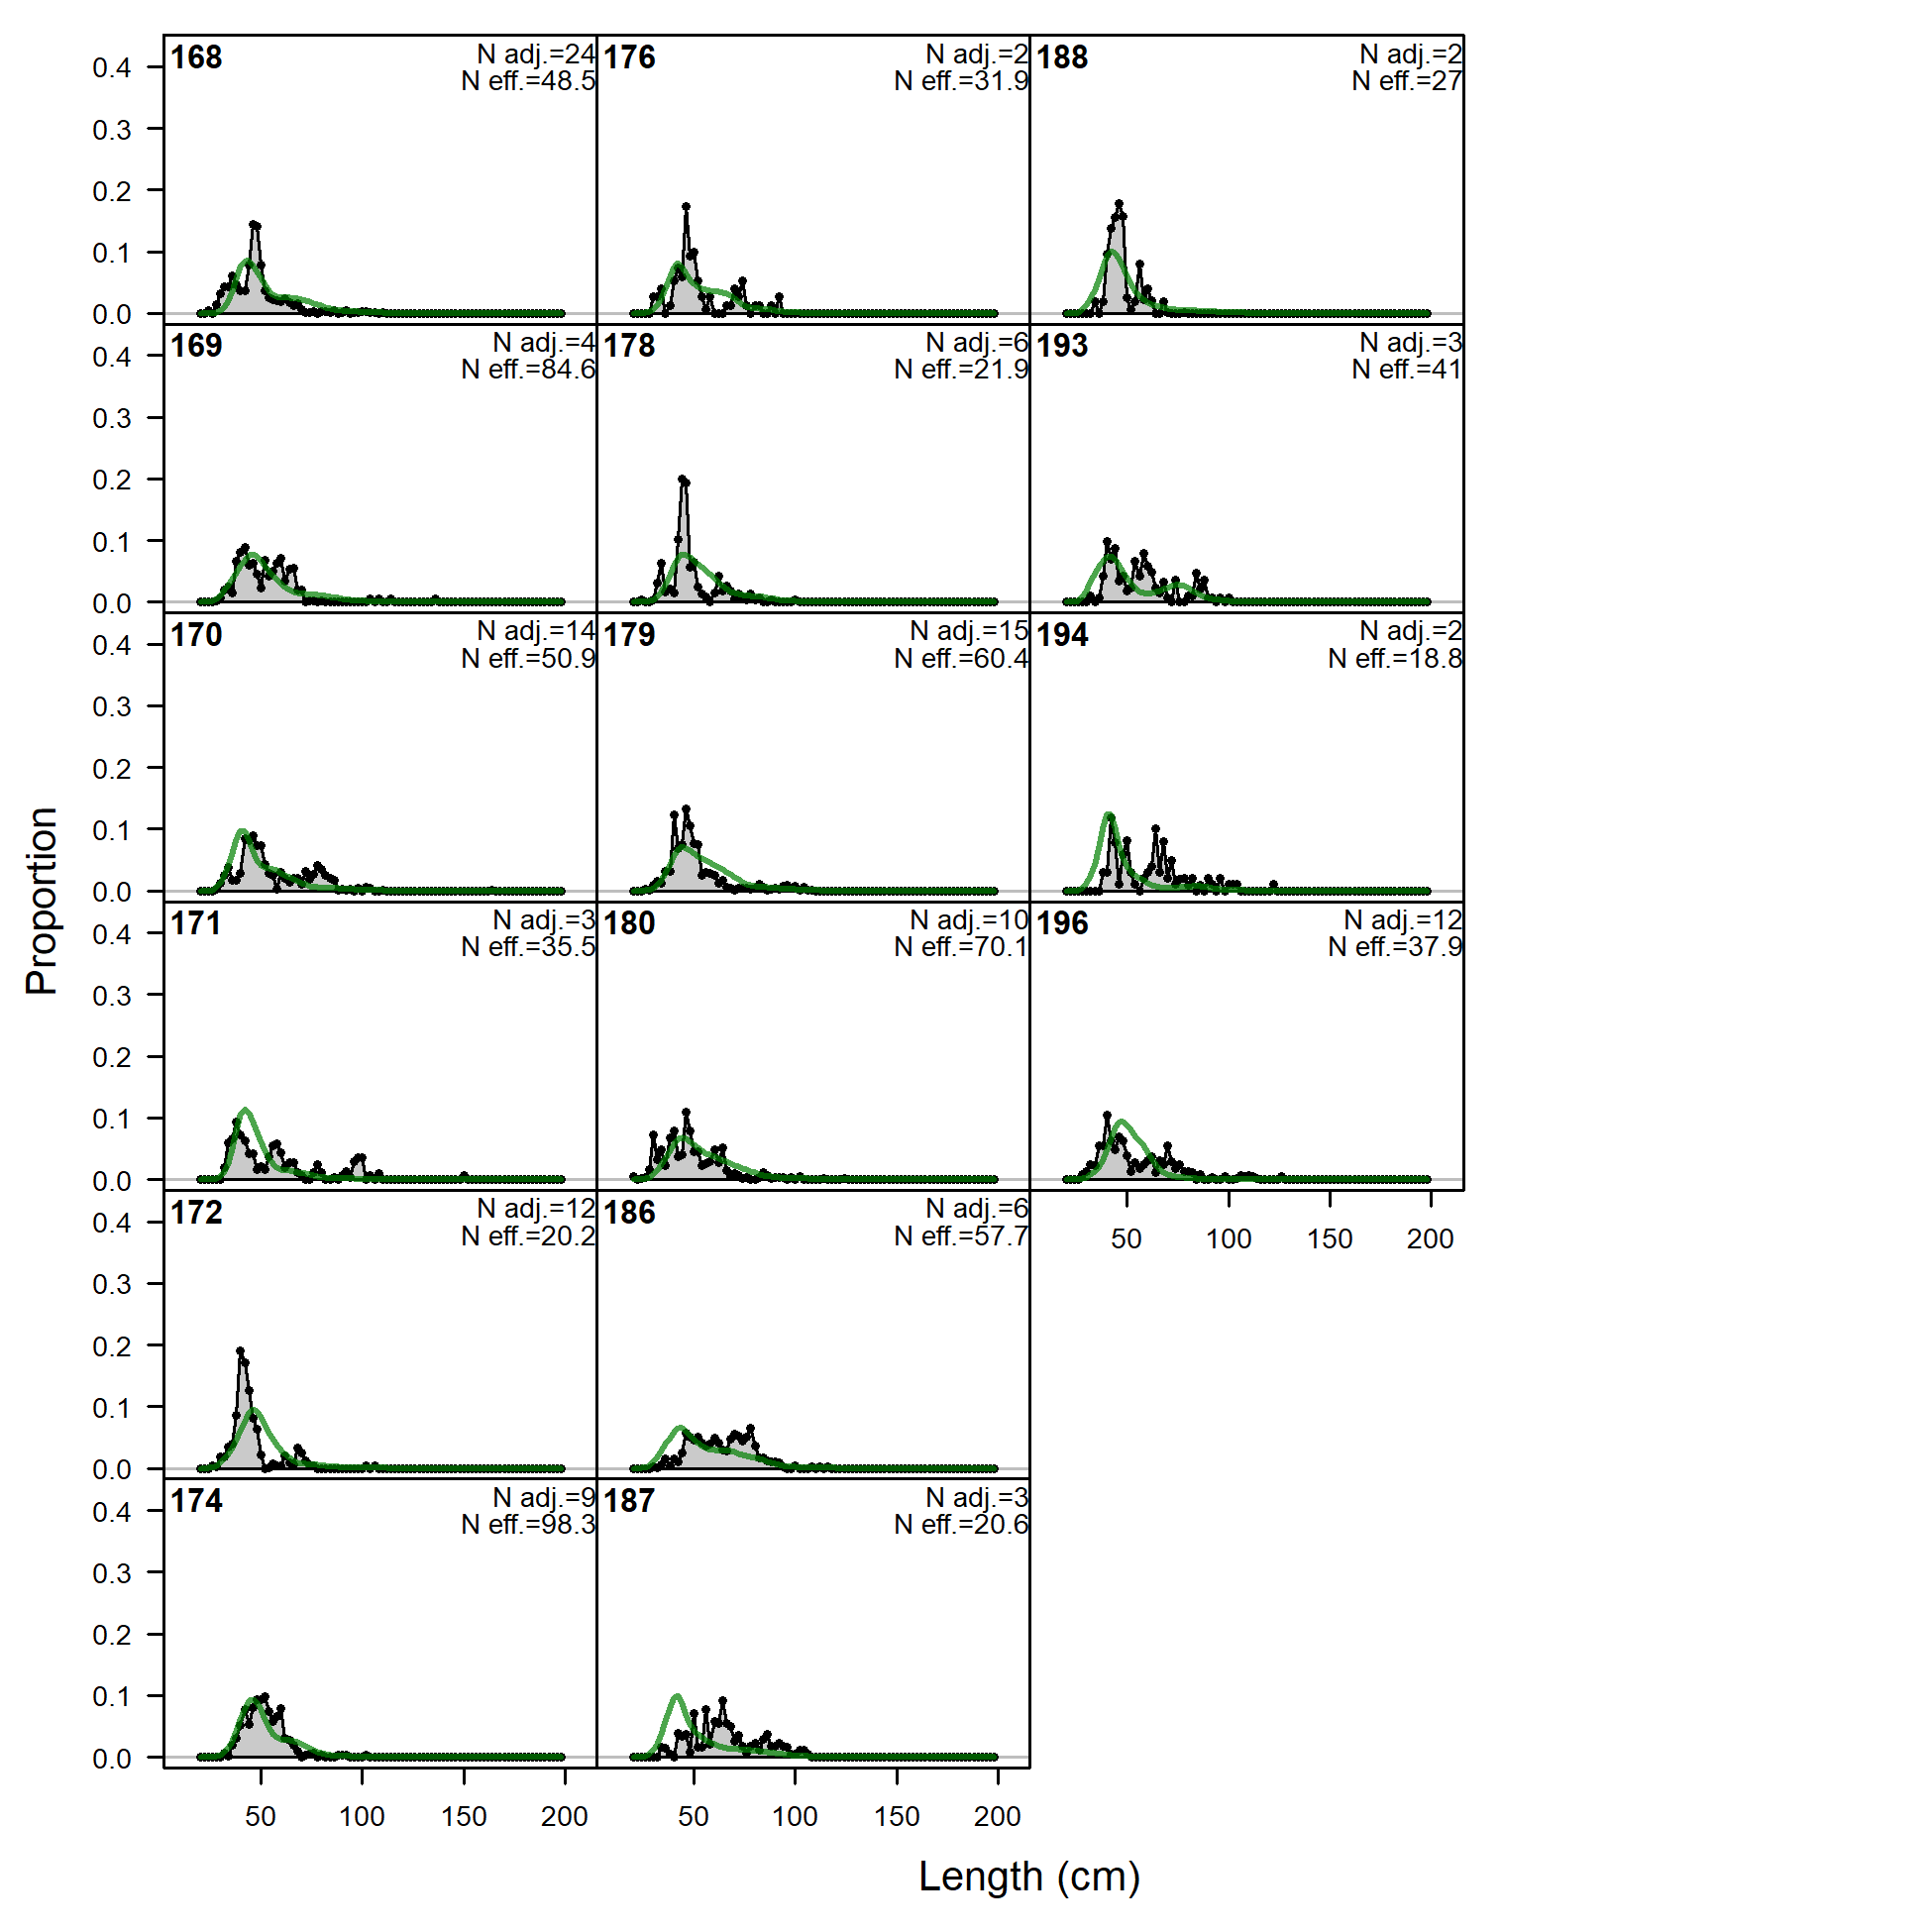
Length comps, whole catch, F4.OBJ.E.offshore (plot 1 of 3).
'N adj.' is the input sample size after data-weighting adjustment. N eff. is the calculated effective sample size used in the McAllister-Ianelli tuning method. (plot 2 of 3) (plot 3 of 3)
file: comp_lenfit_flt4mkt0_page3.png
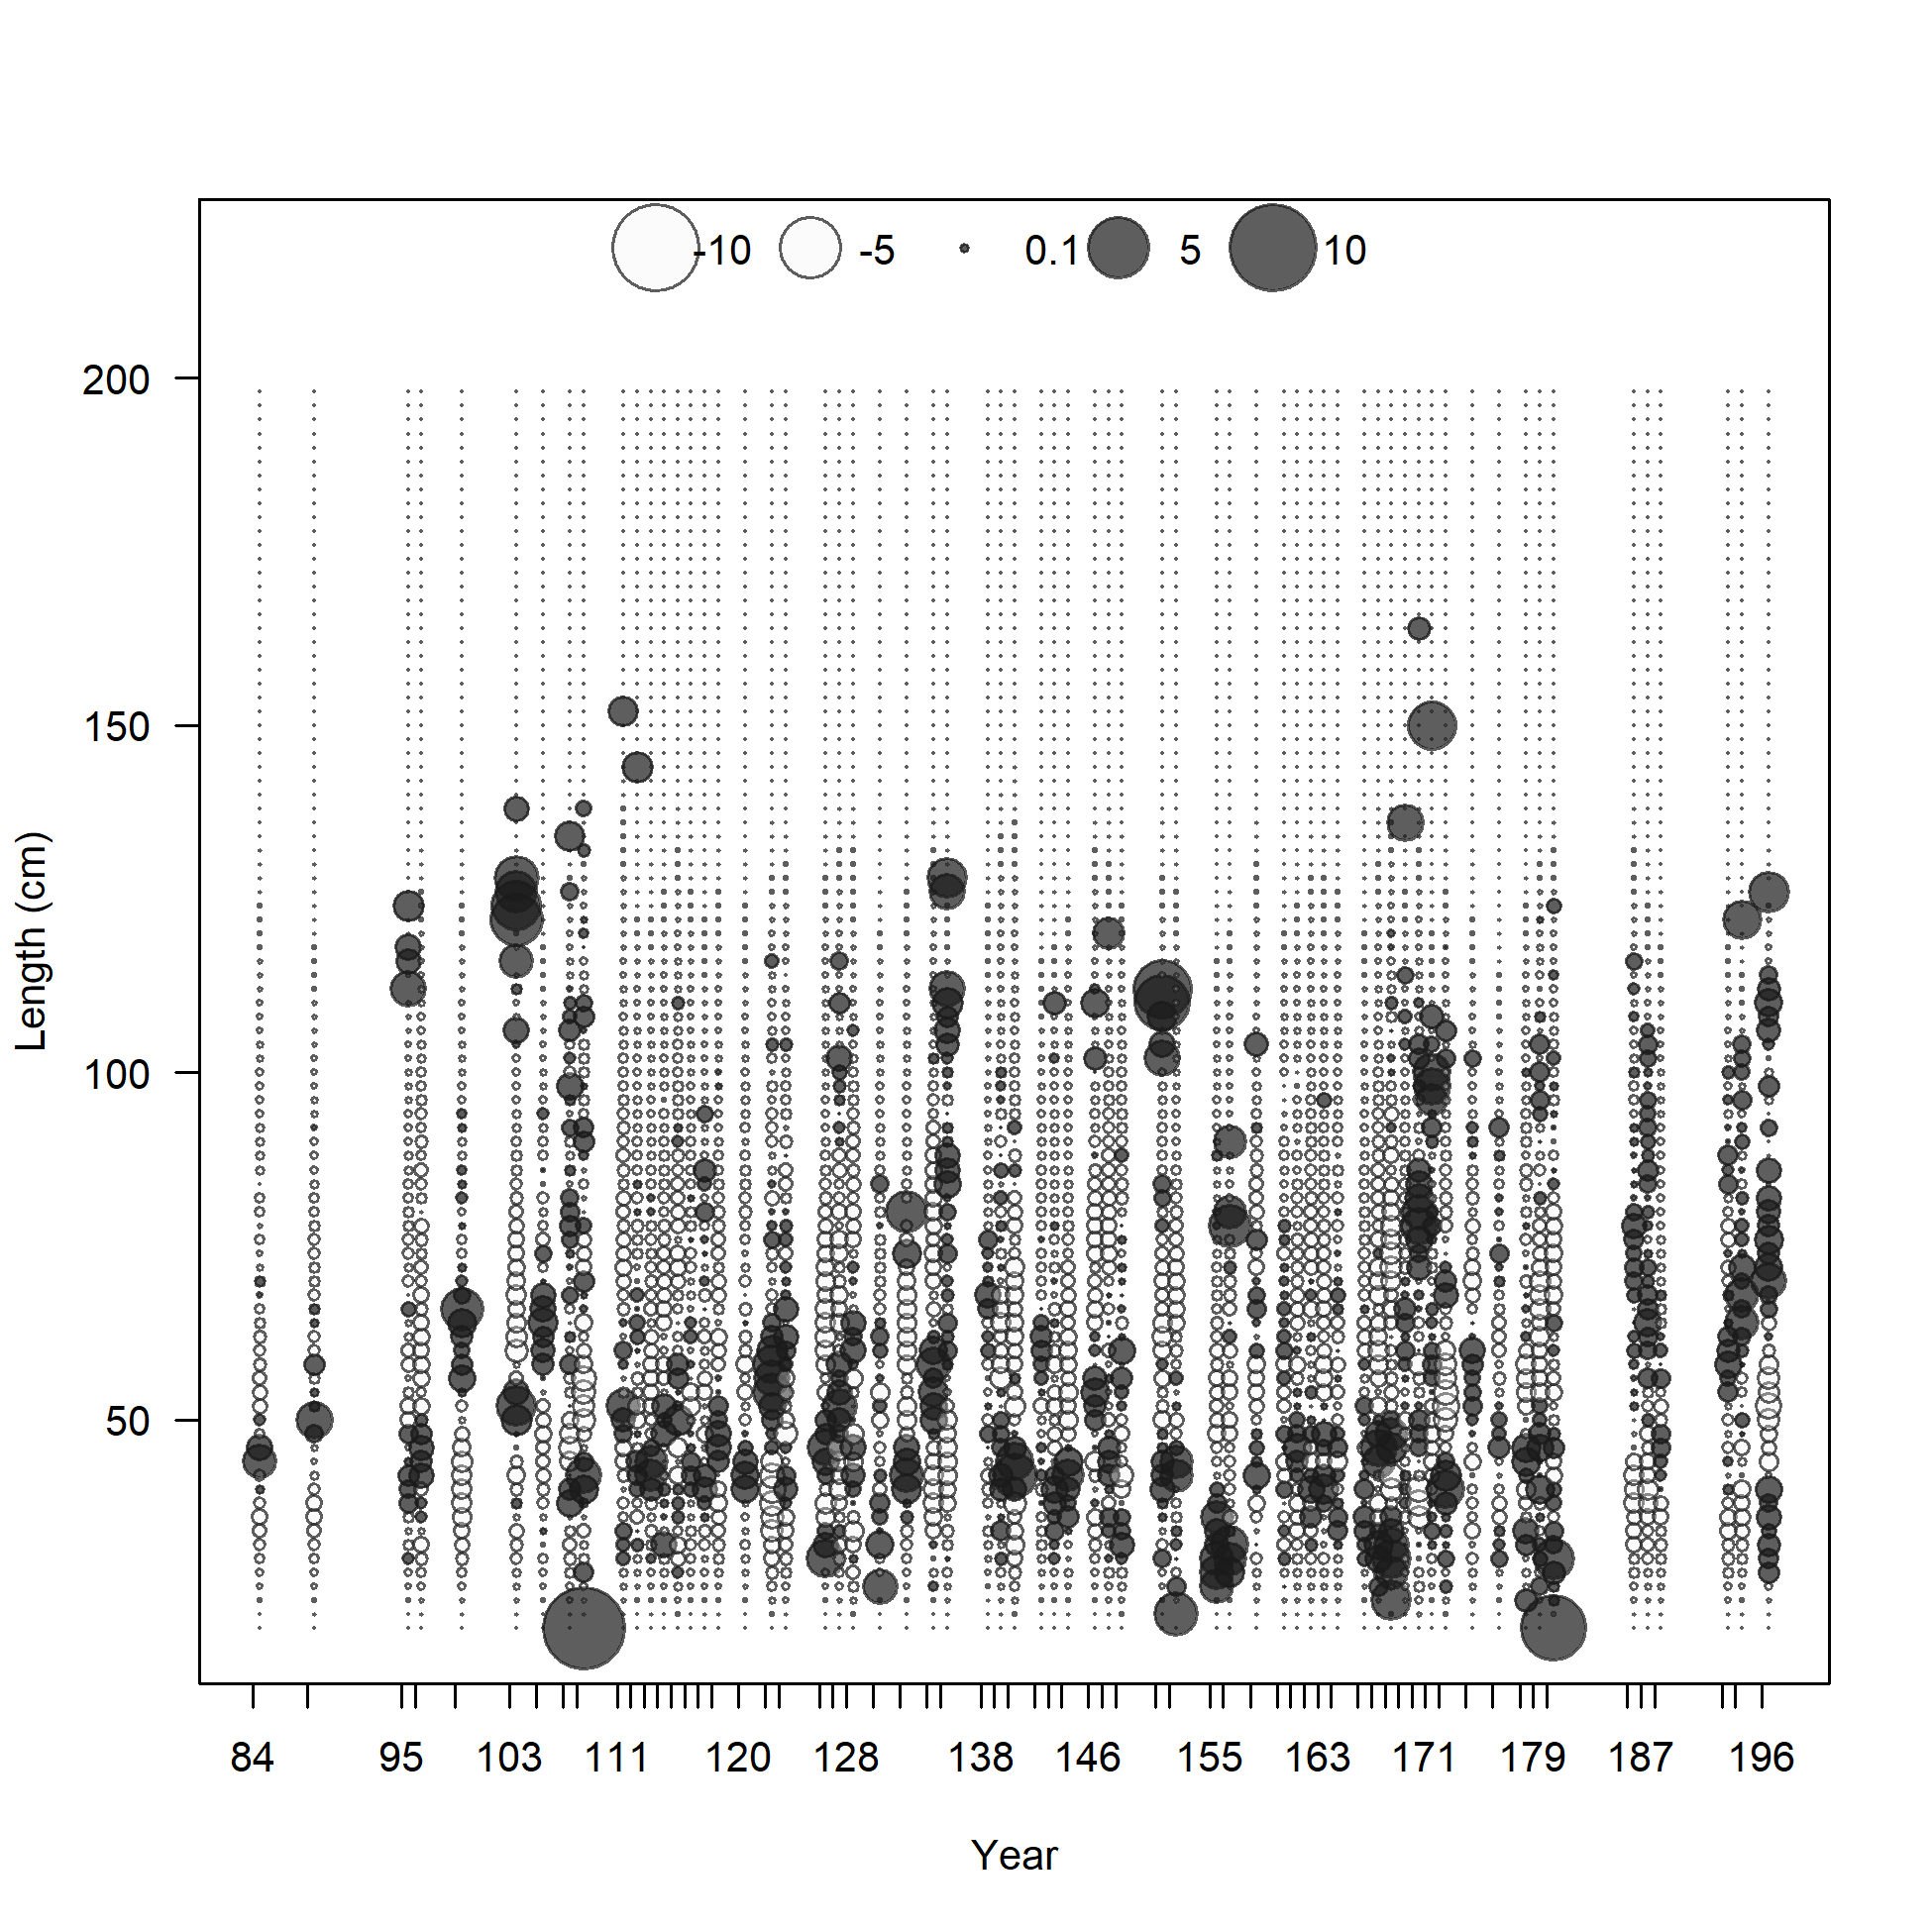
Pearson residuals, whole catch, F4.OBJ.E.offshore (max=9.06) (plot 3 of 3)
Closed bubbles are positive residuals (observed > expected) and open bubbles are negative residuals (observed < expected).
file: comp_lenfit_residsflt4mkt0_page3.png
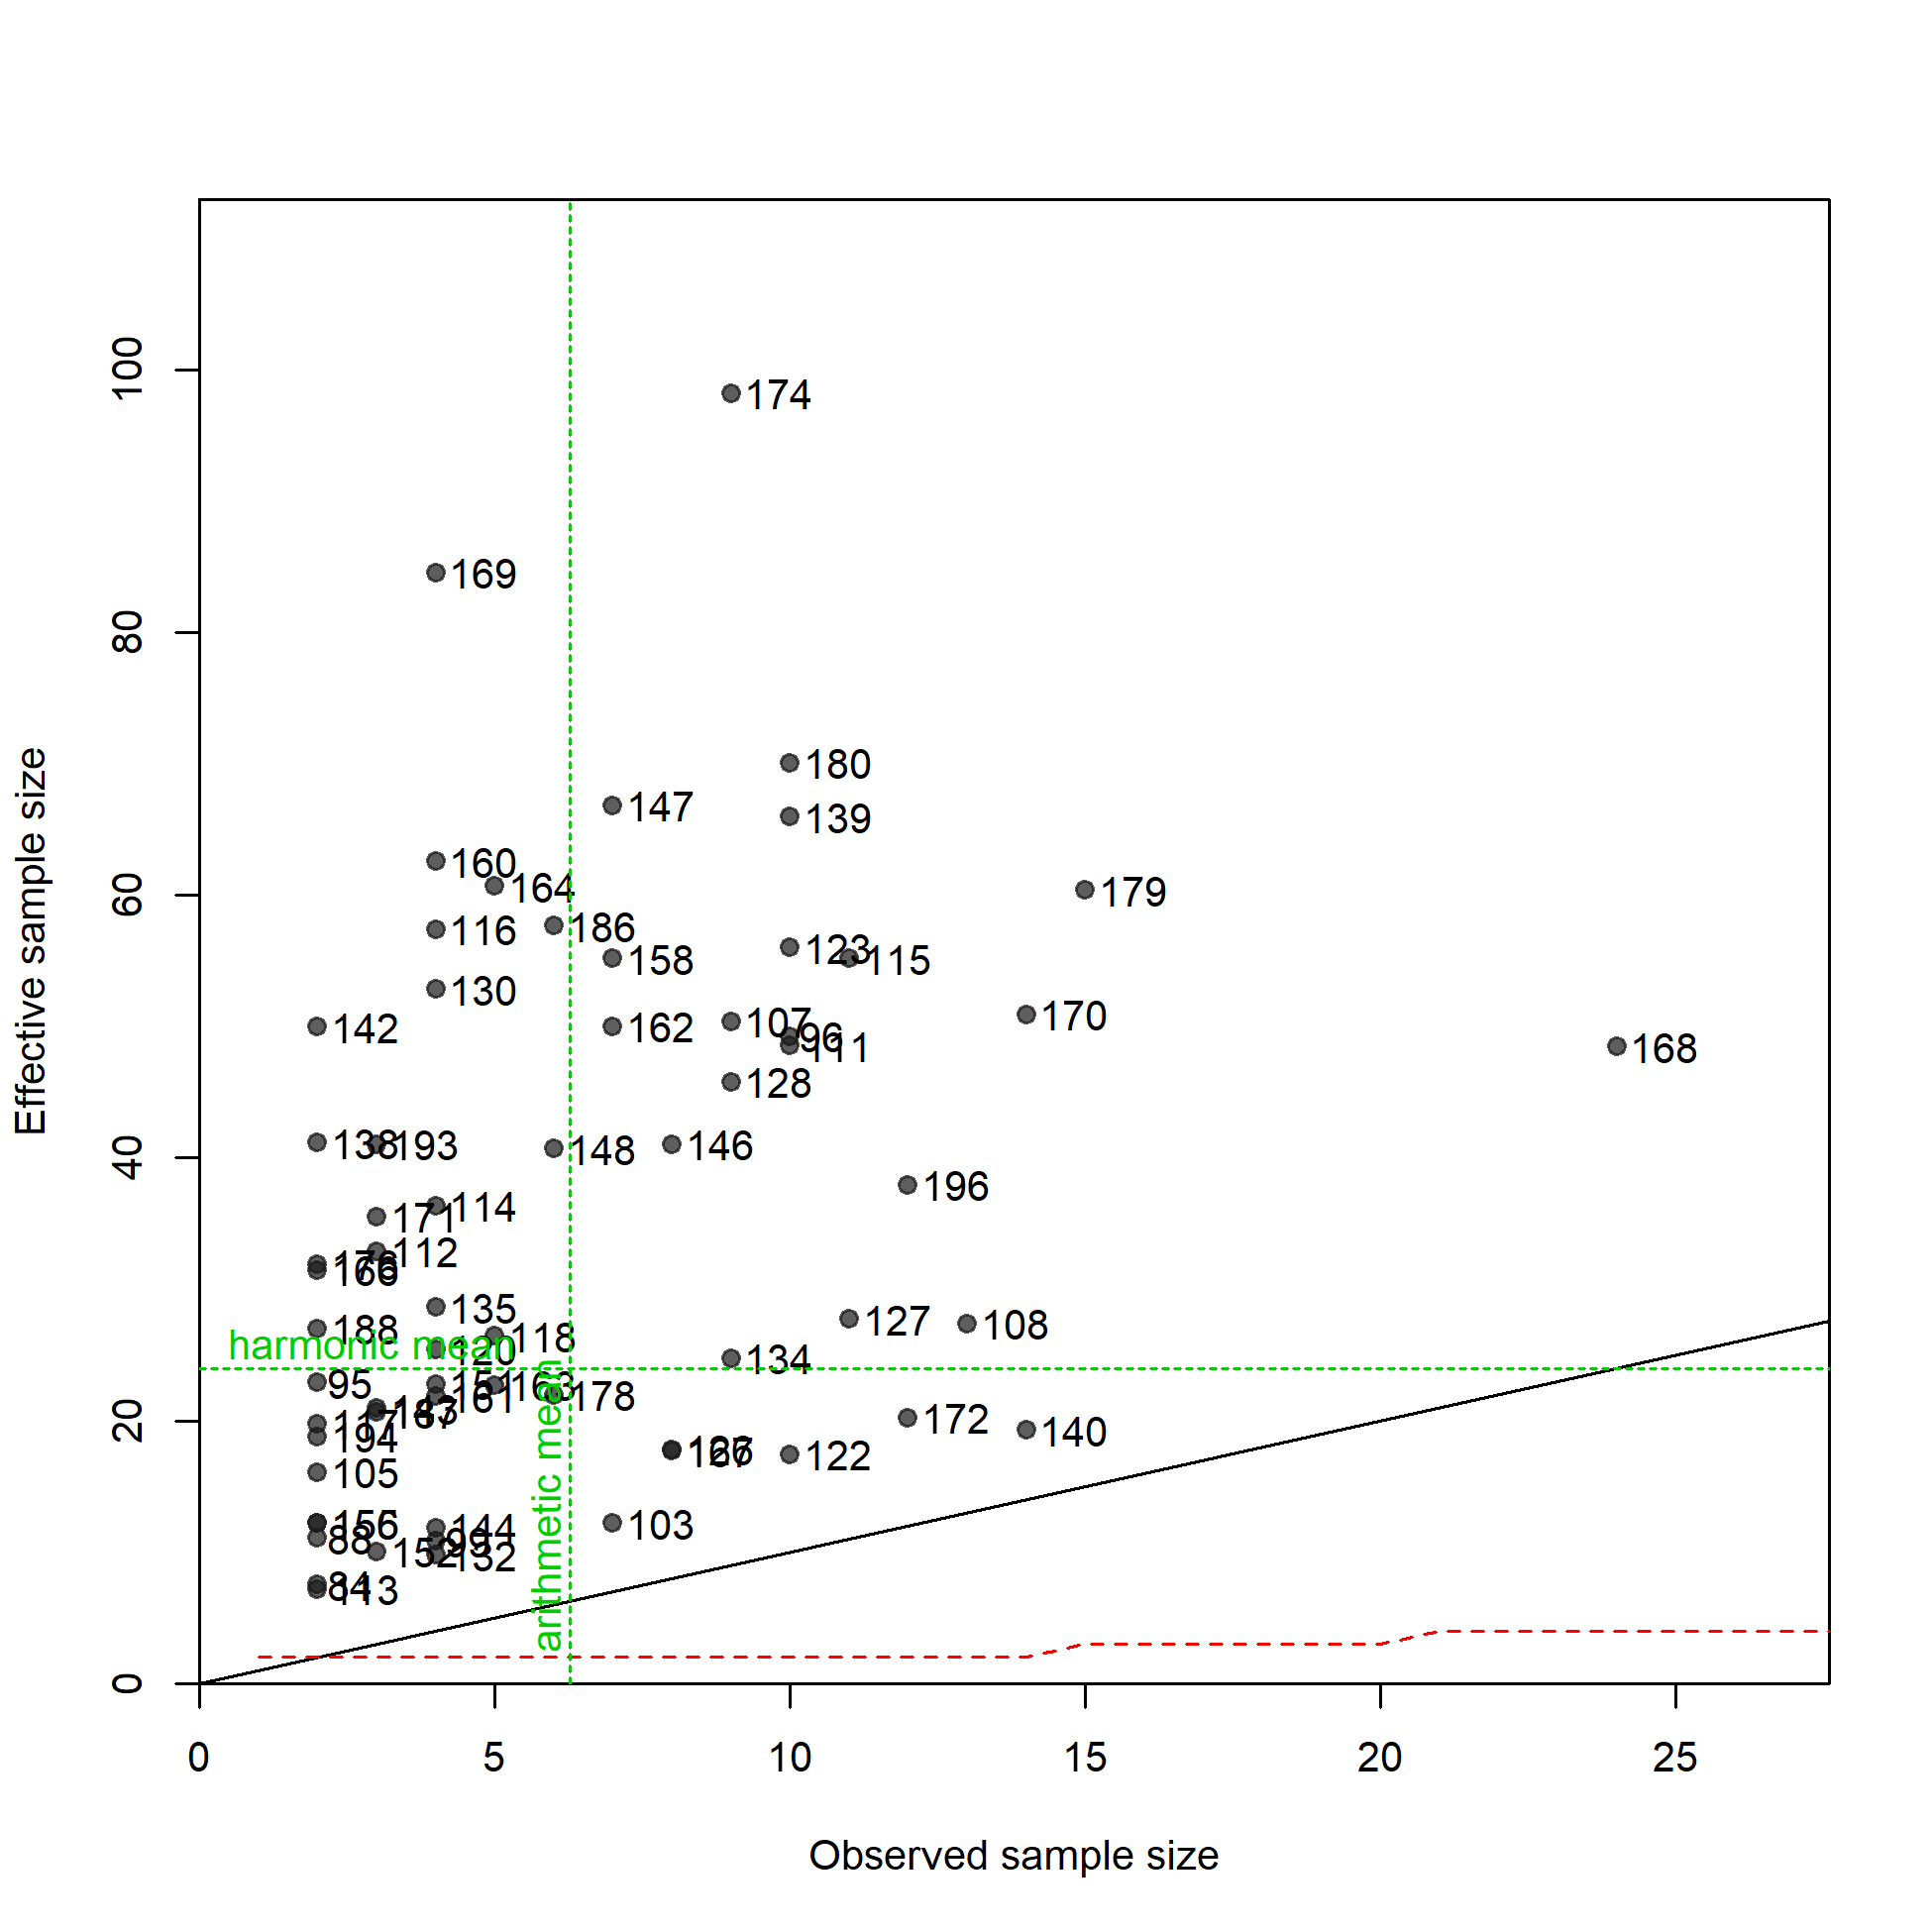
N-EffN comparison, Length comps, whole catch, F4.OBJ.E.offshore
file: comp_lenfit_sampsize_flt4mkt0.png
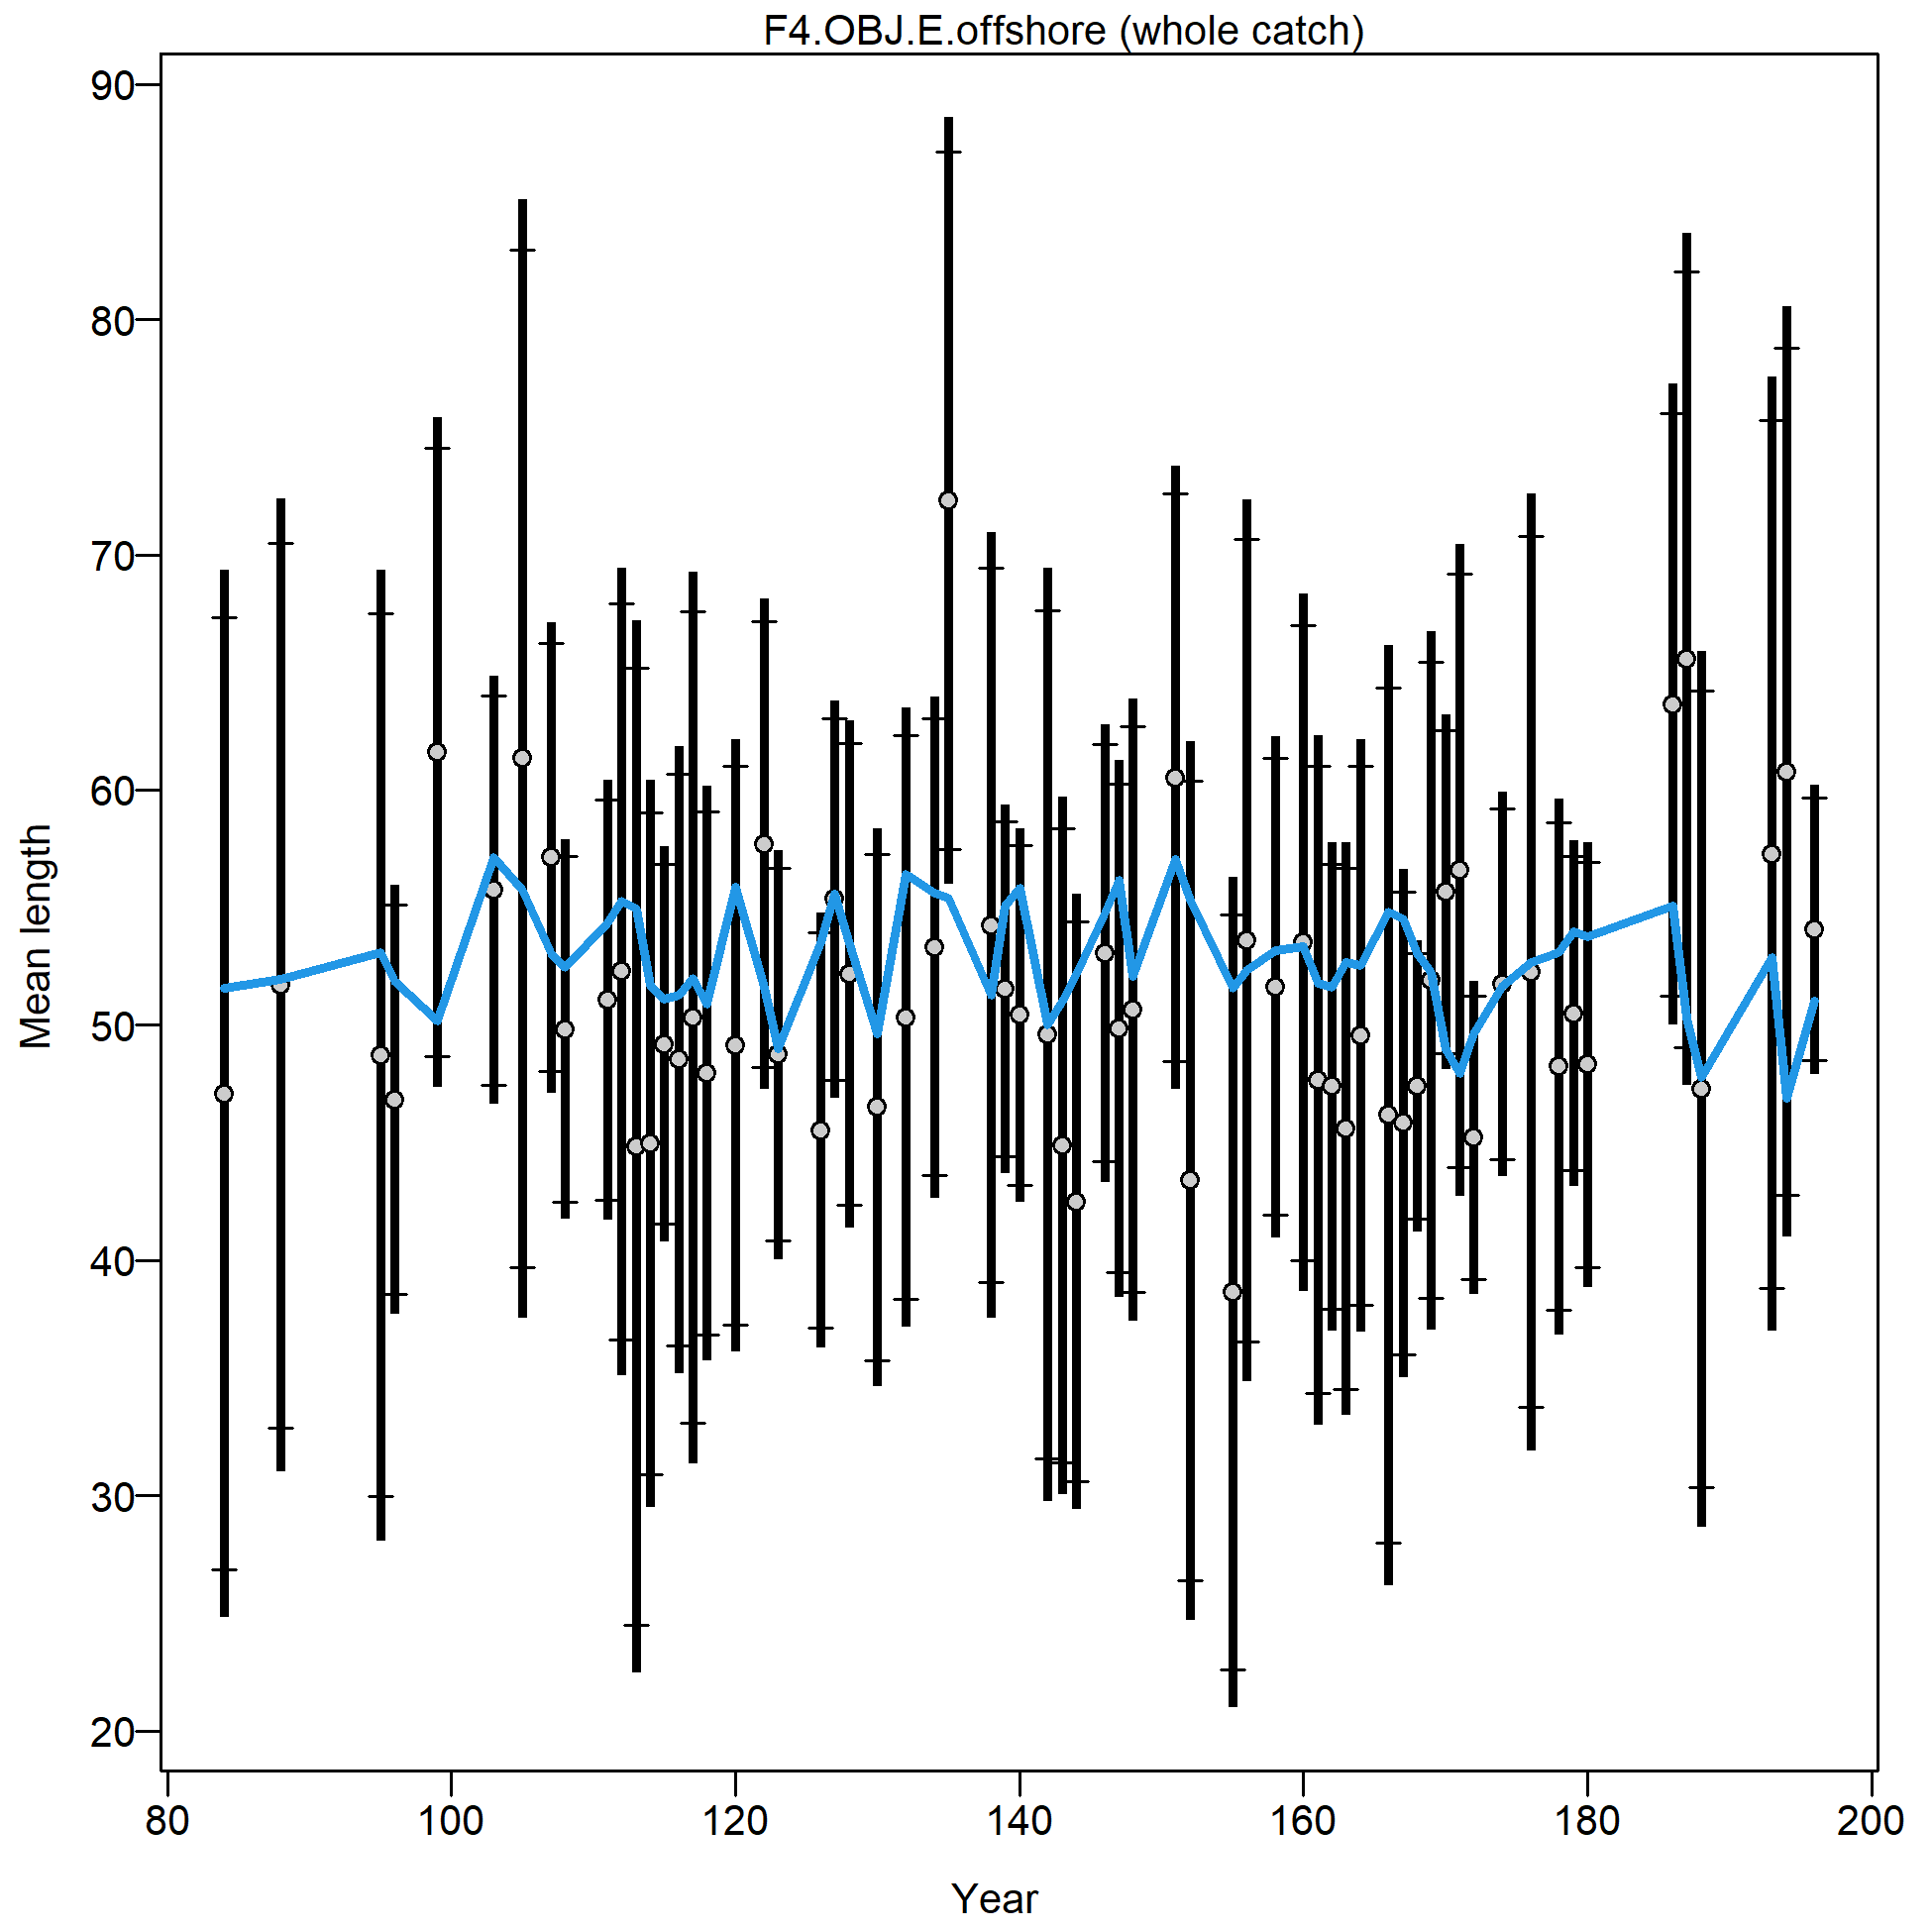
Mean length for F4.OBJ.E.offshore with 95% confidence intervals based on current sample sizes.
Francis data weighting method TA1.8: thinner intervals (with capped ends) show result of further adjusting sample sizes based on suggested multiplier (with 95% interval) for len data from F4.OBJ.E.offshore:
1.2079 (0.9019-1.8376)
For more info, see Francis (2011).
file: comp_lenfit_data_weighting_TA1.8_F4.OBJ.E.offshore.png
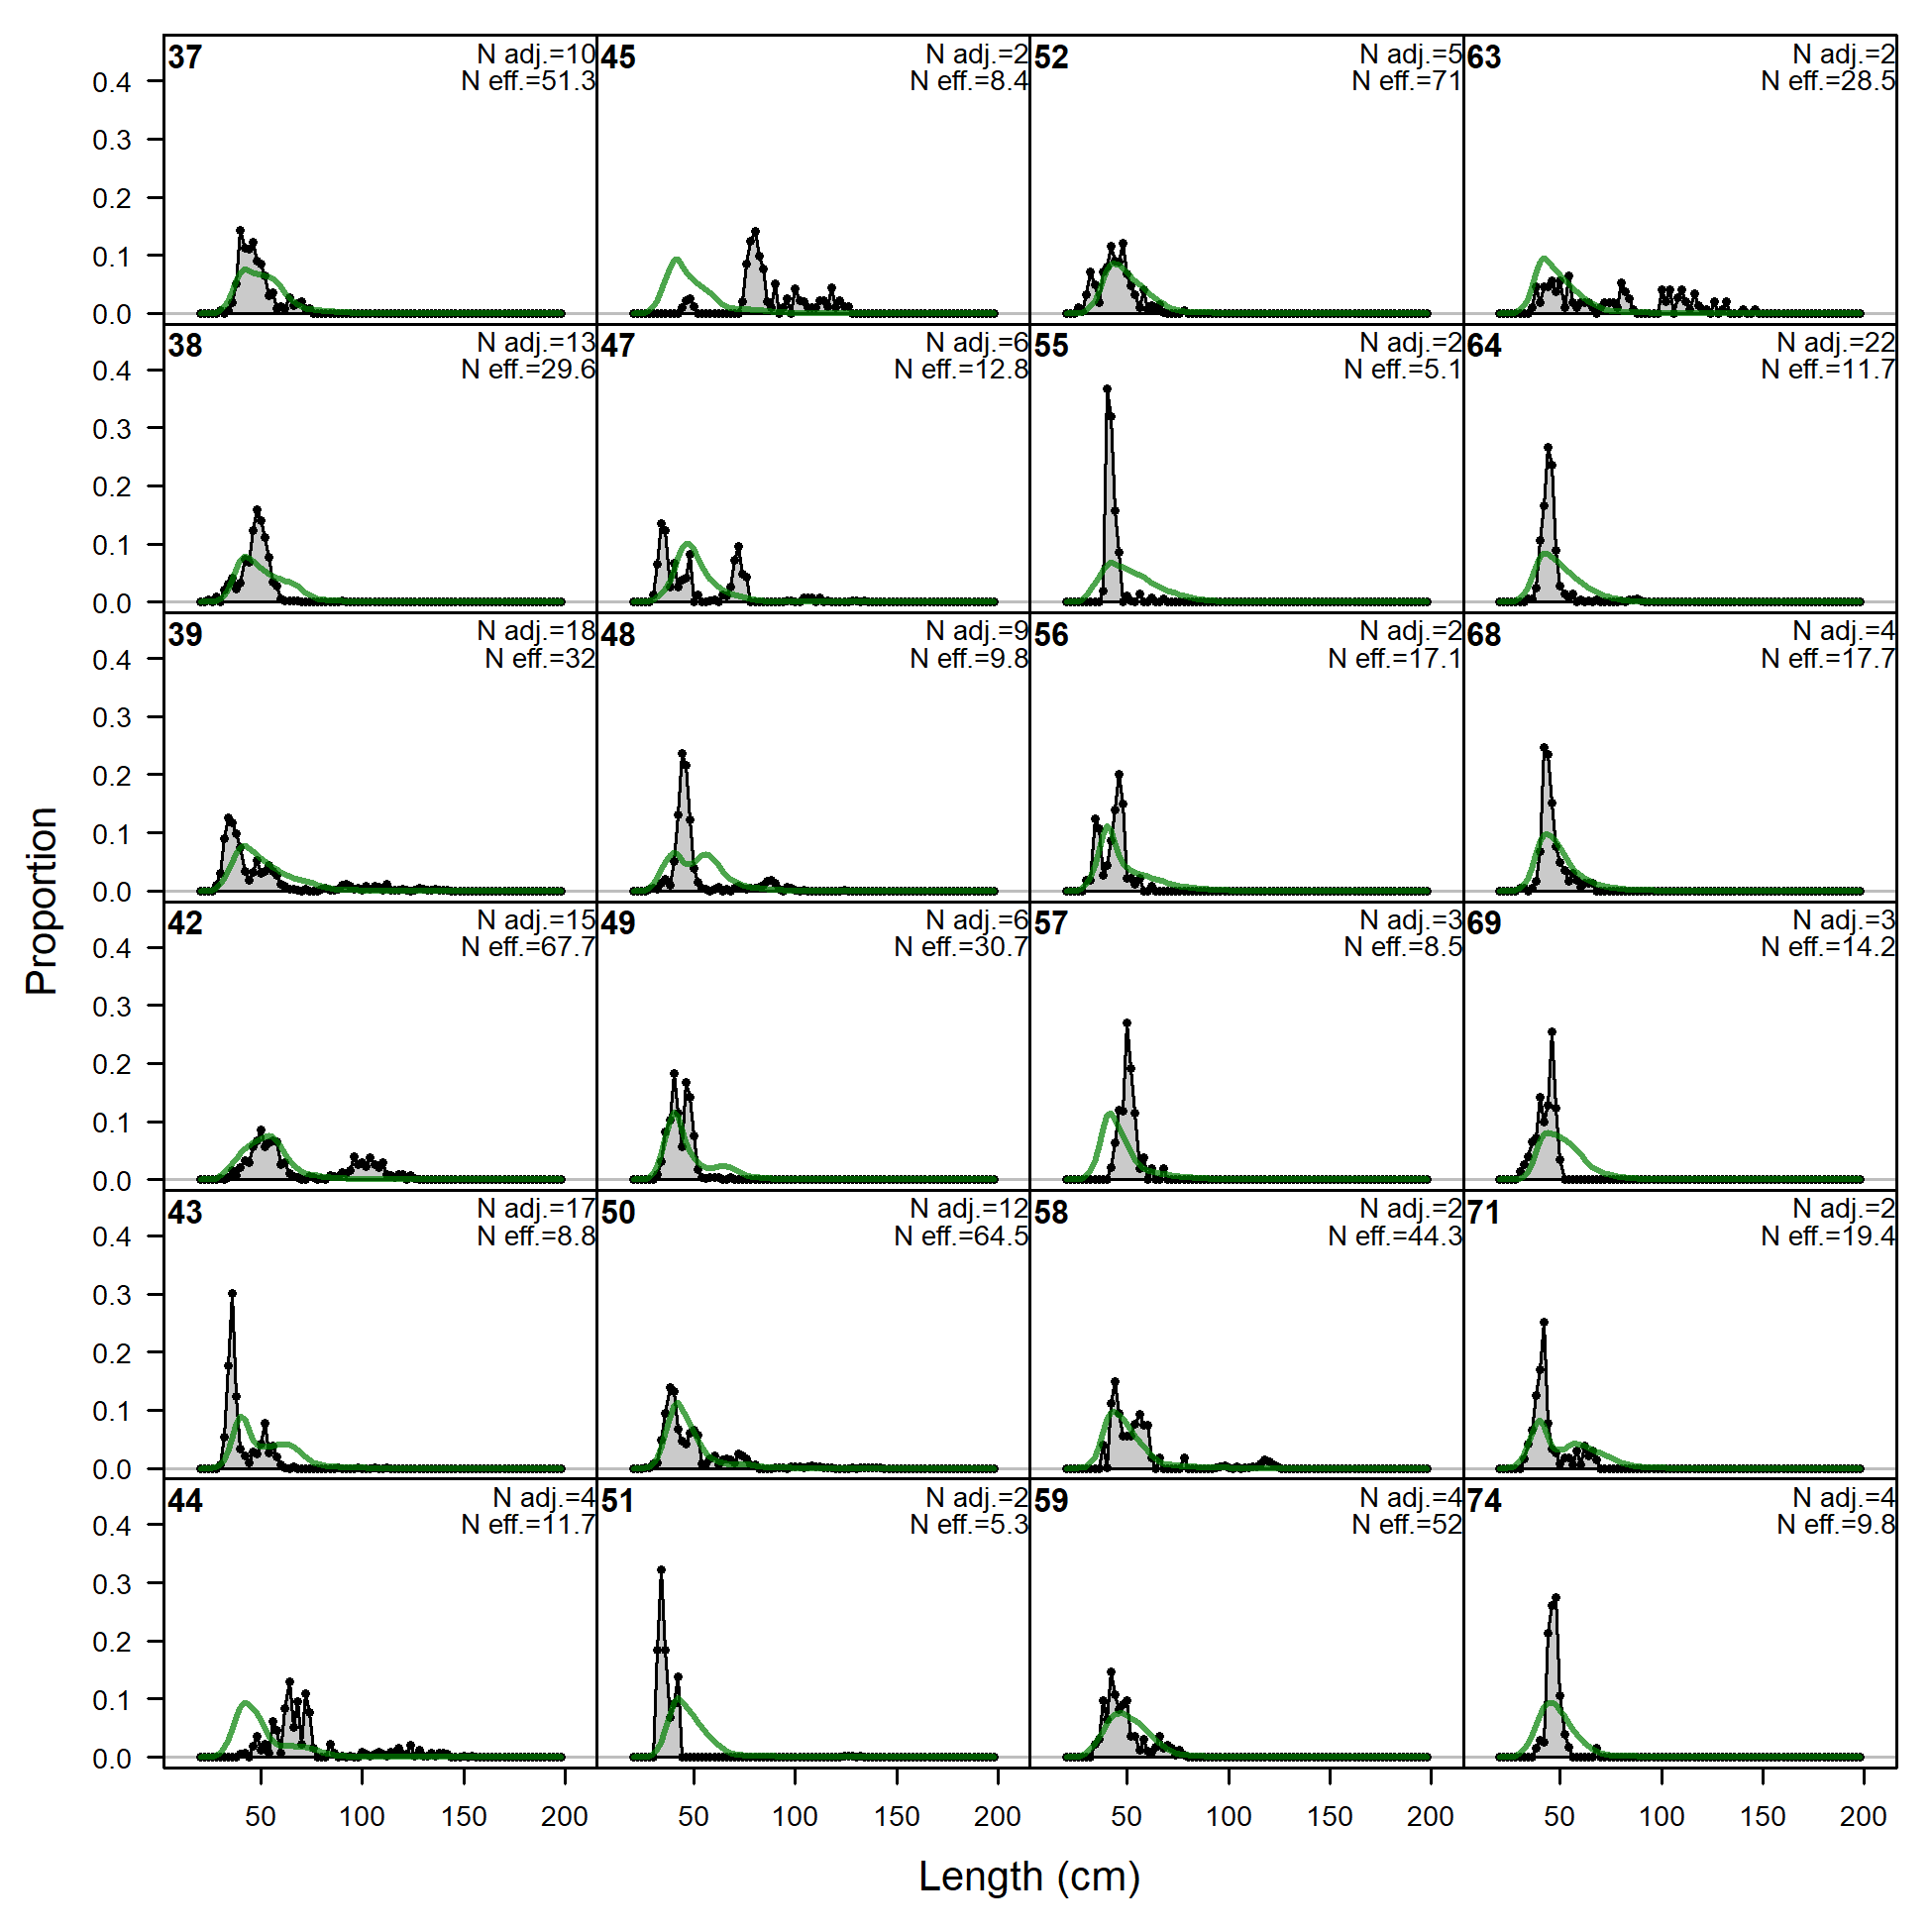
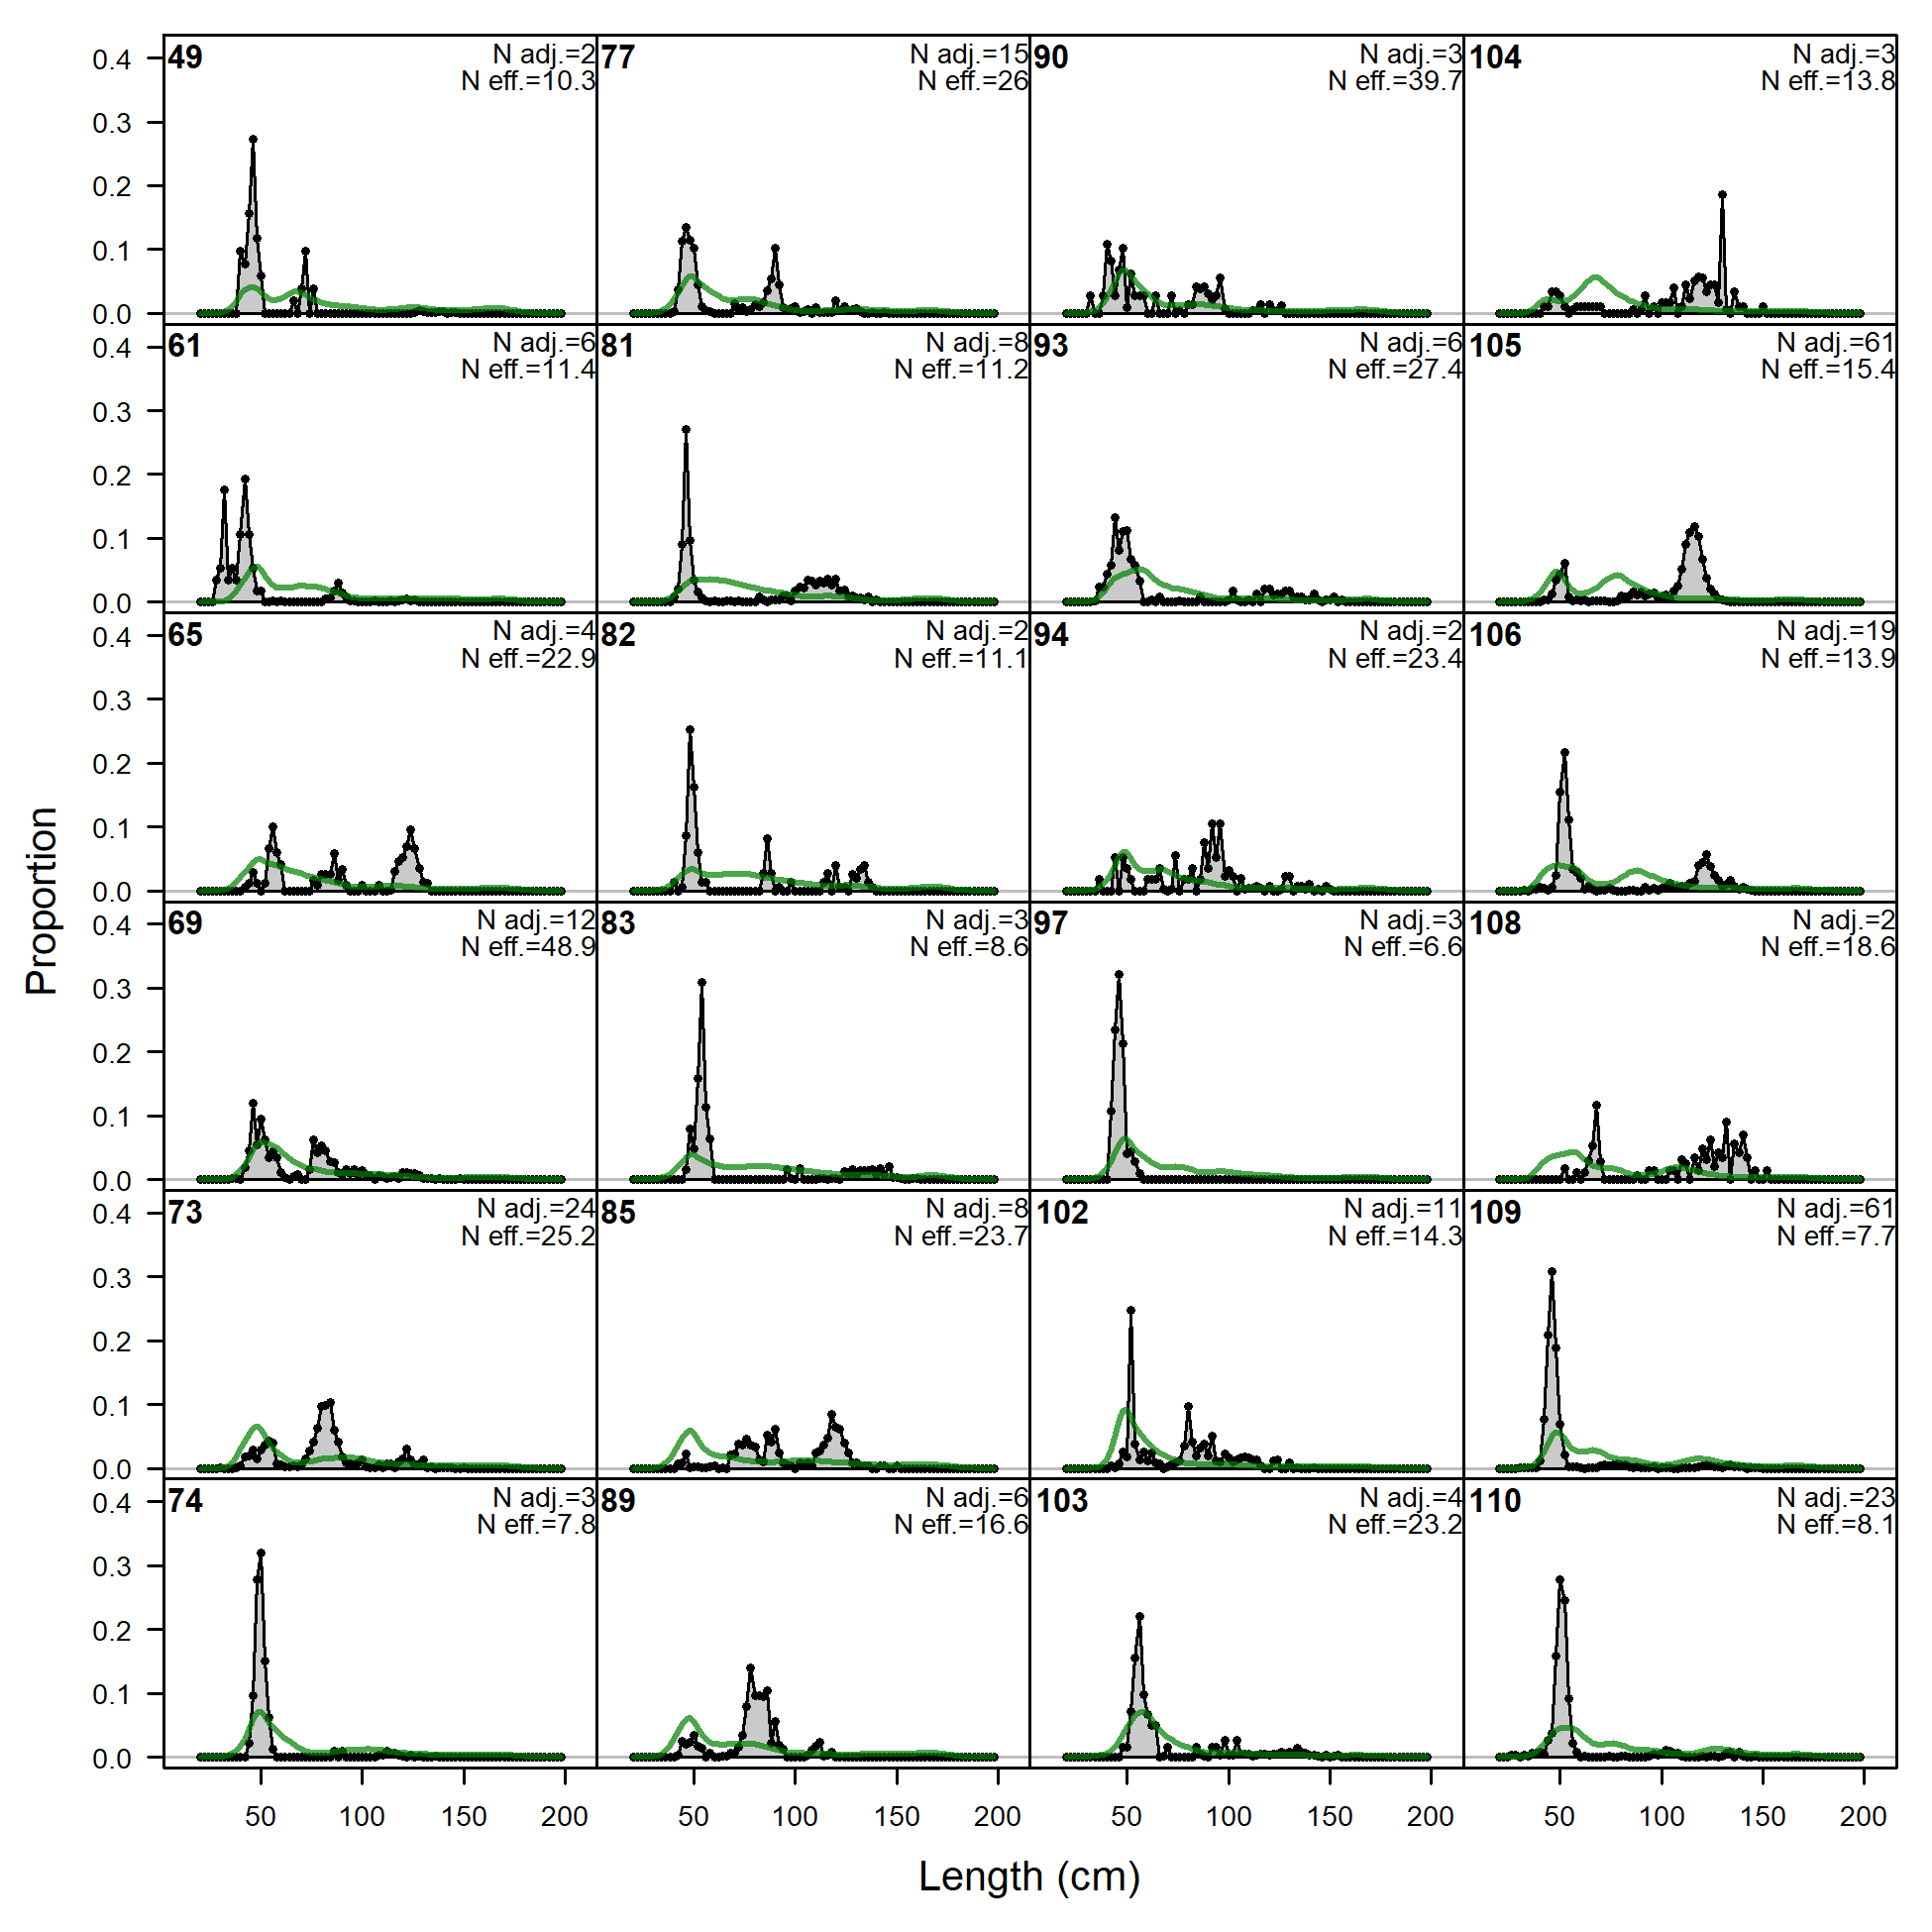
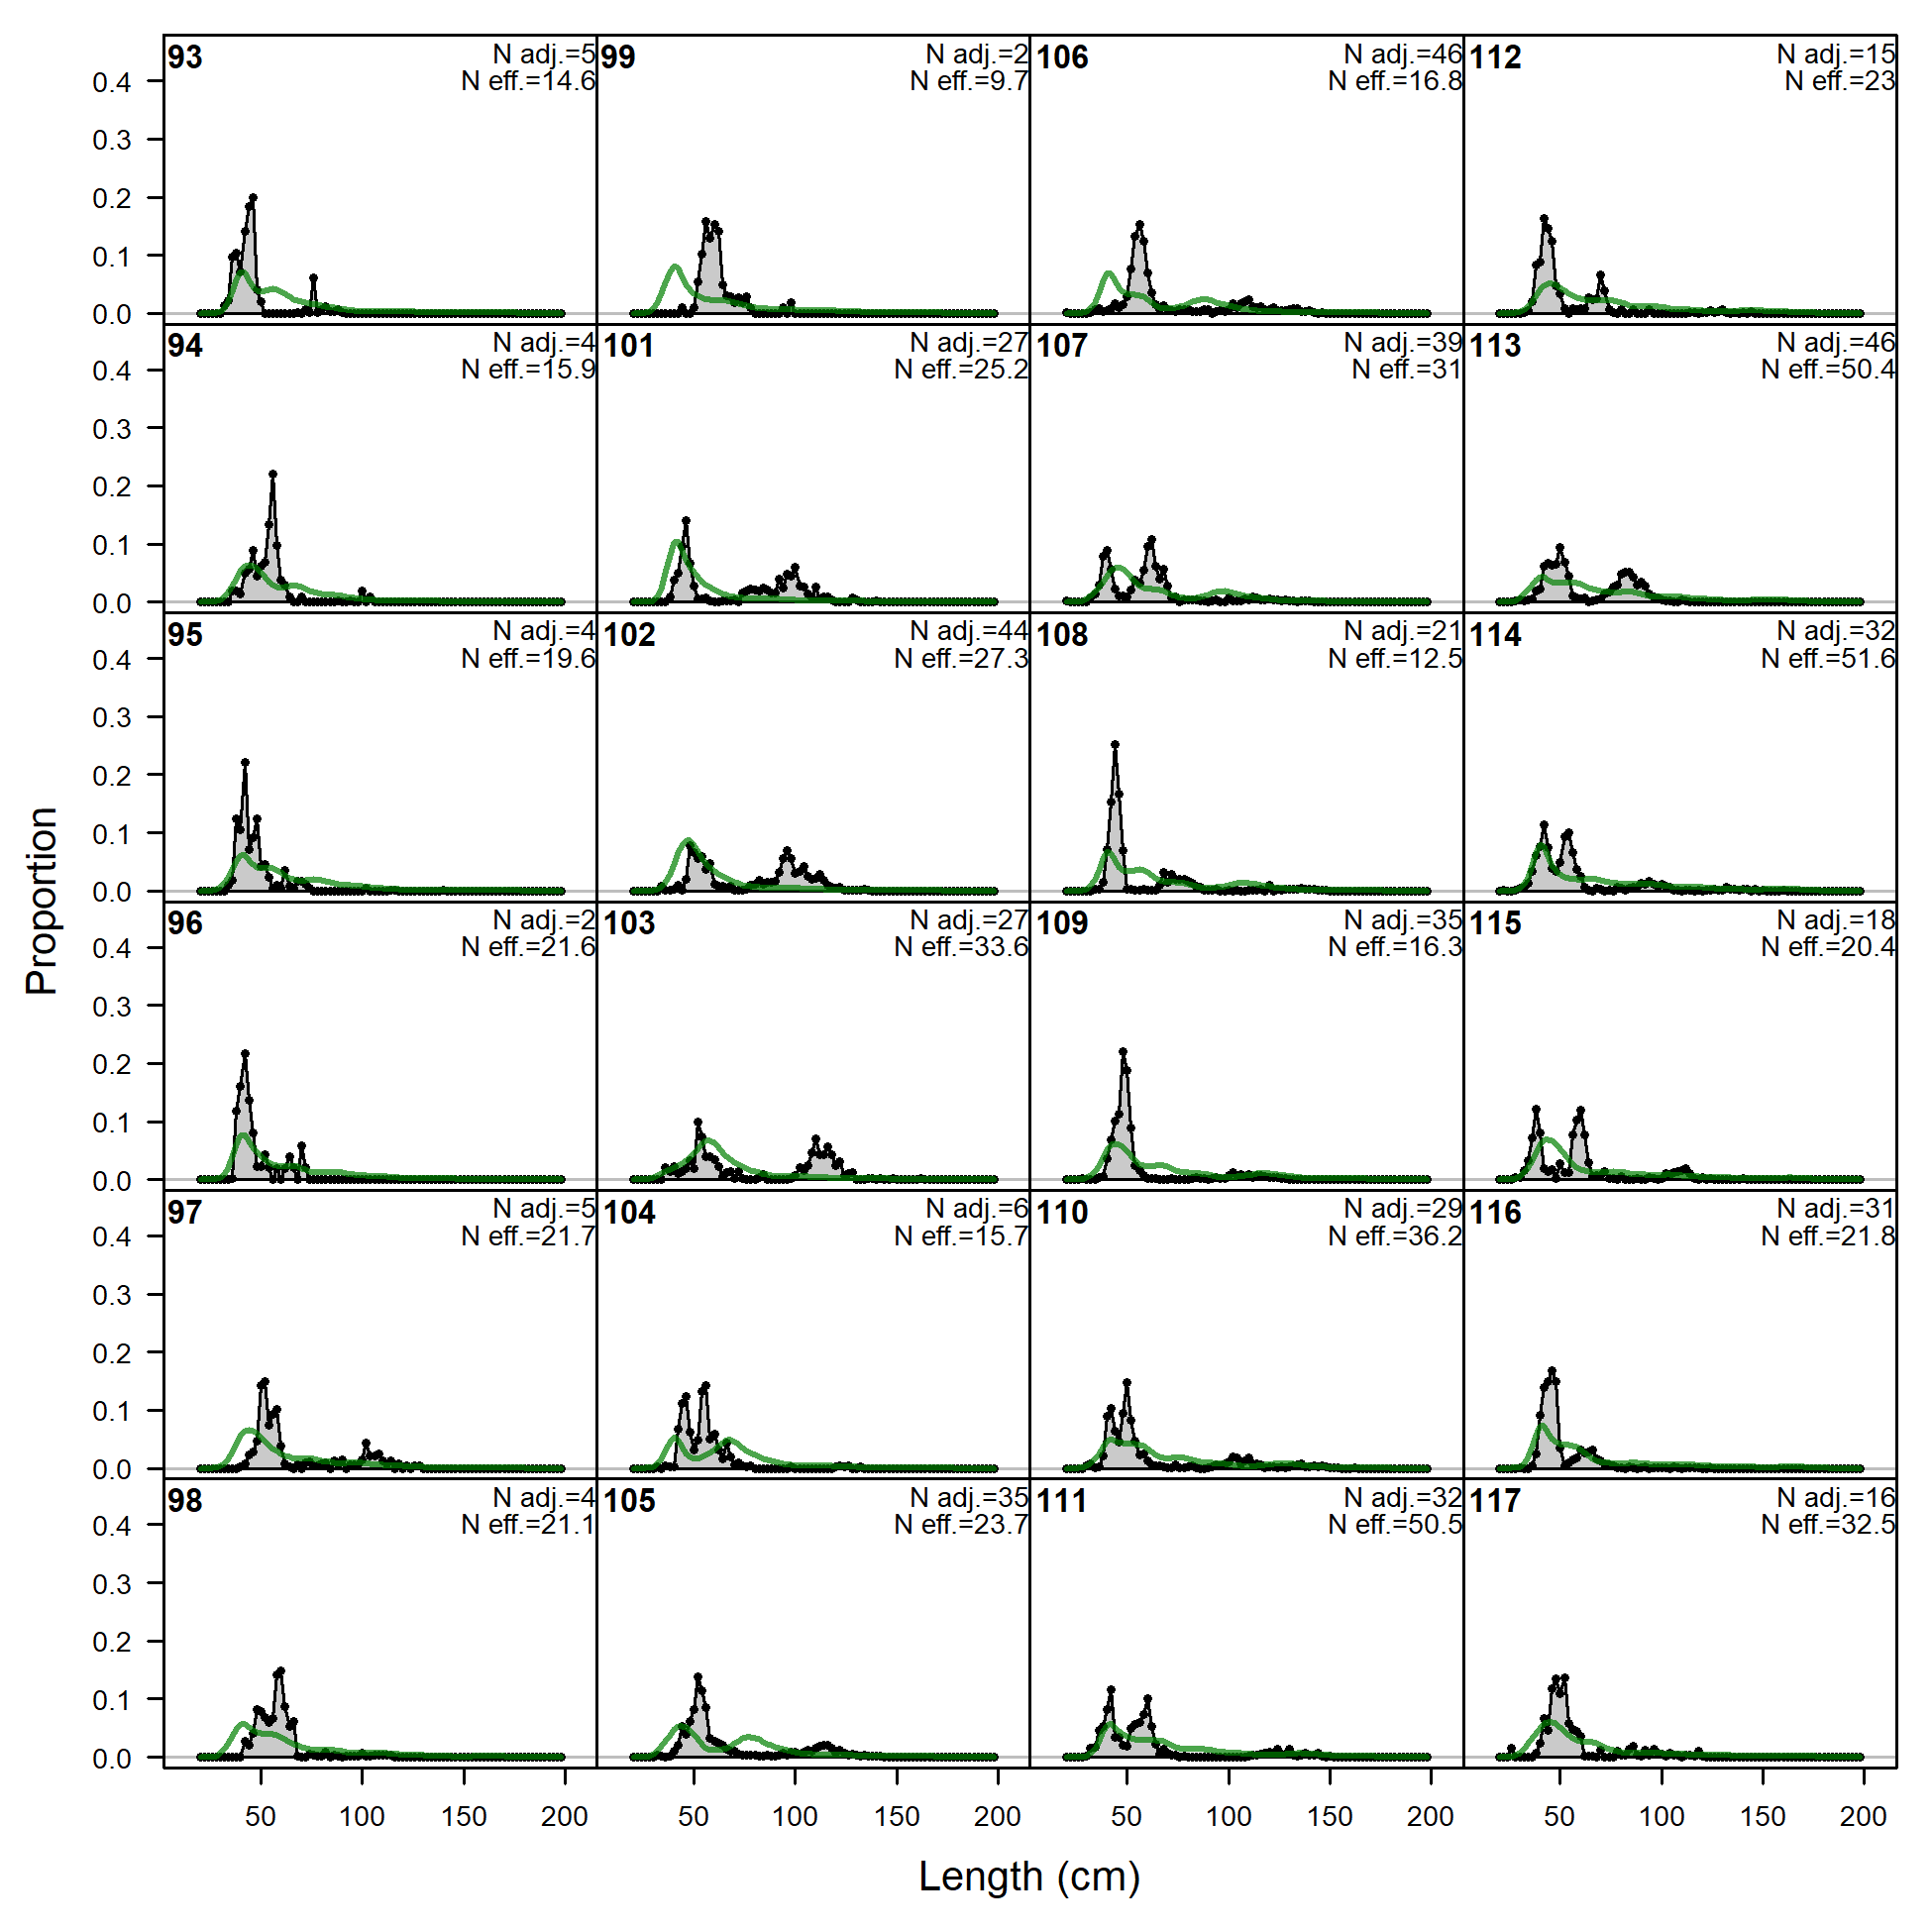
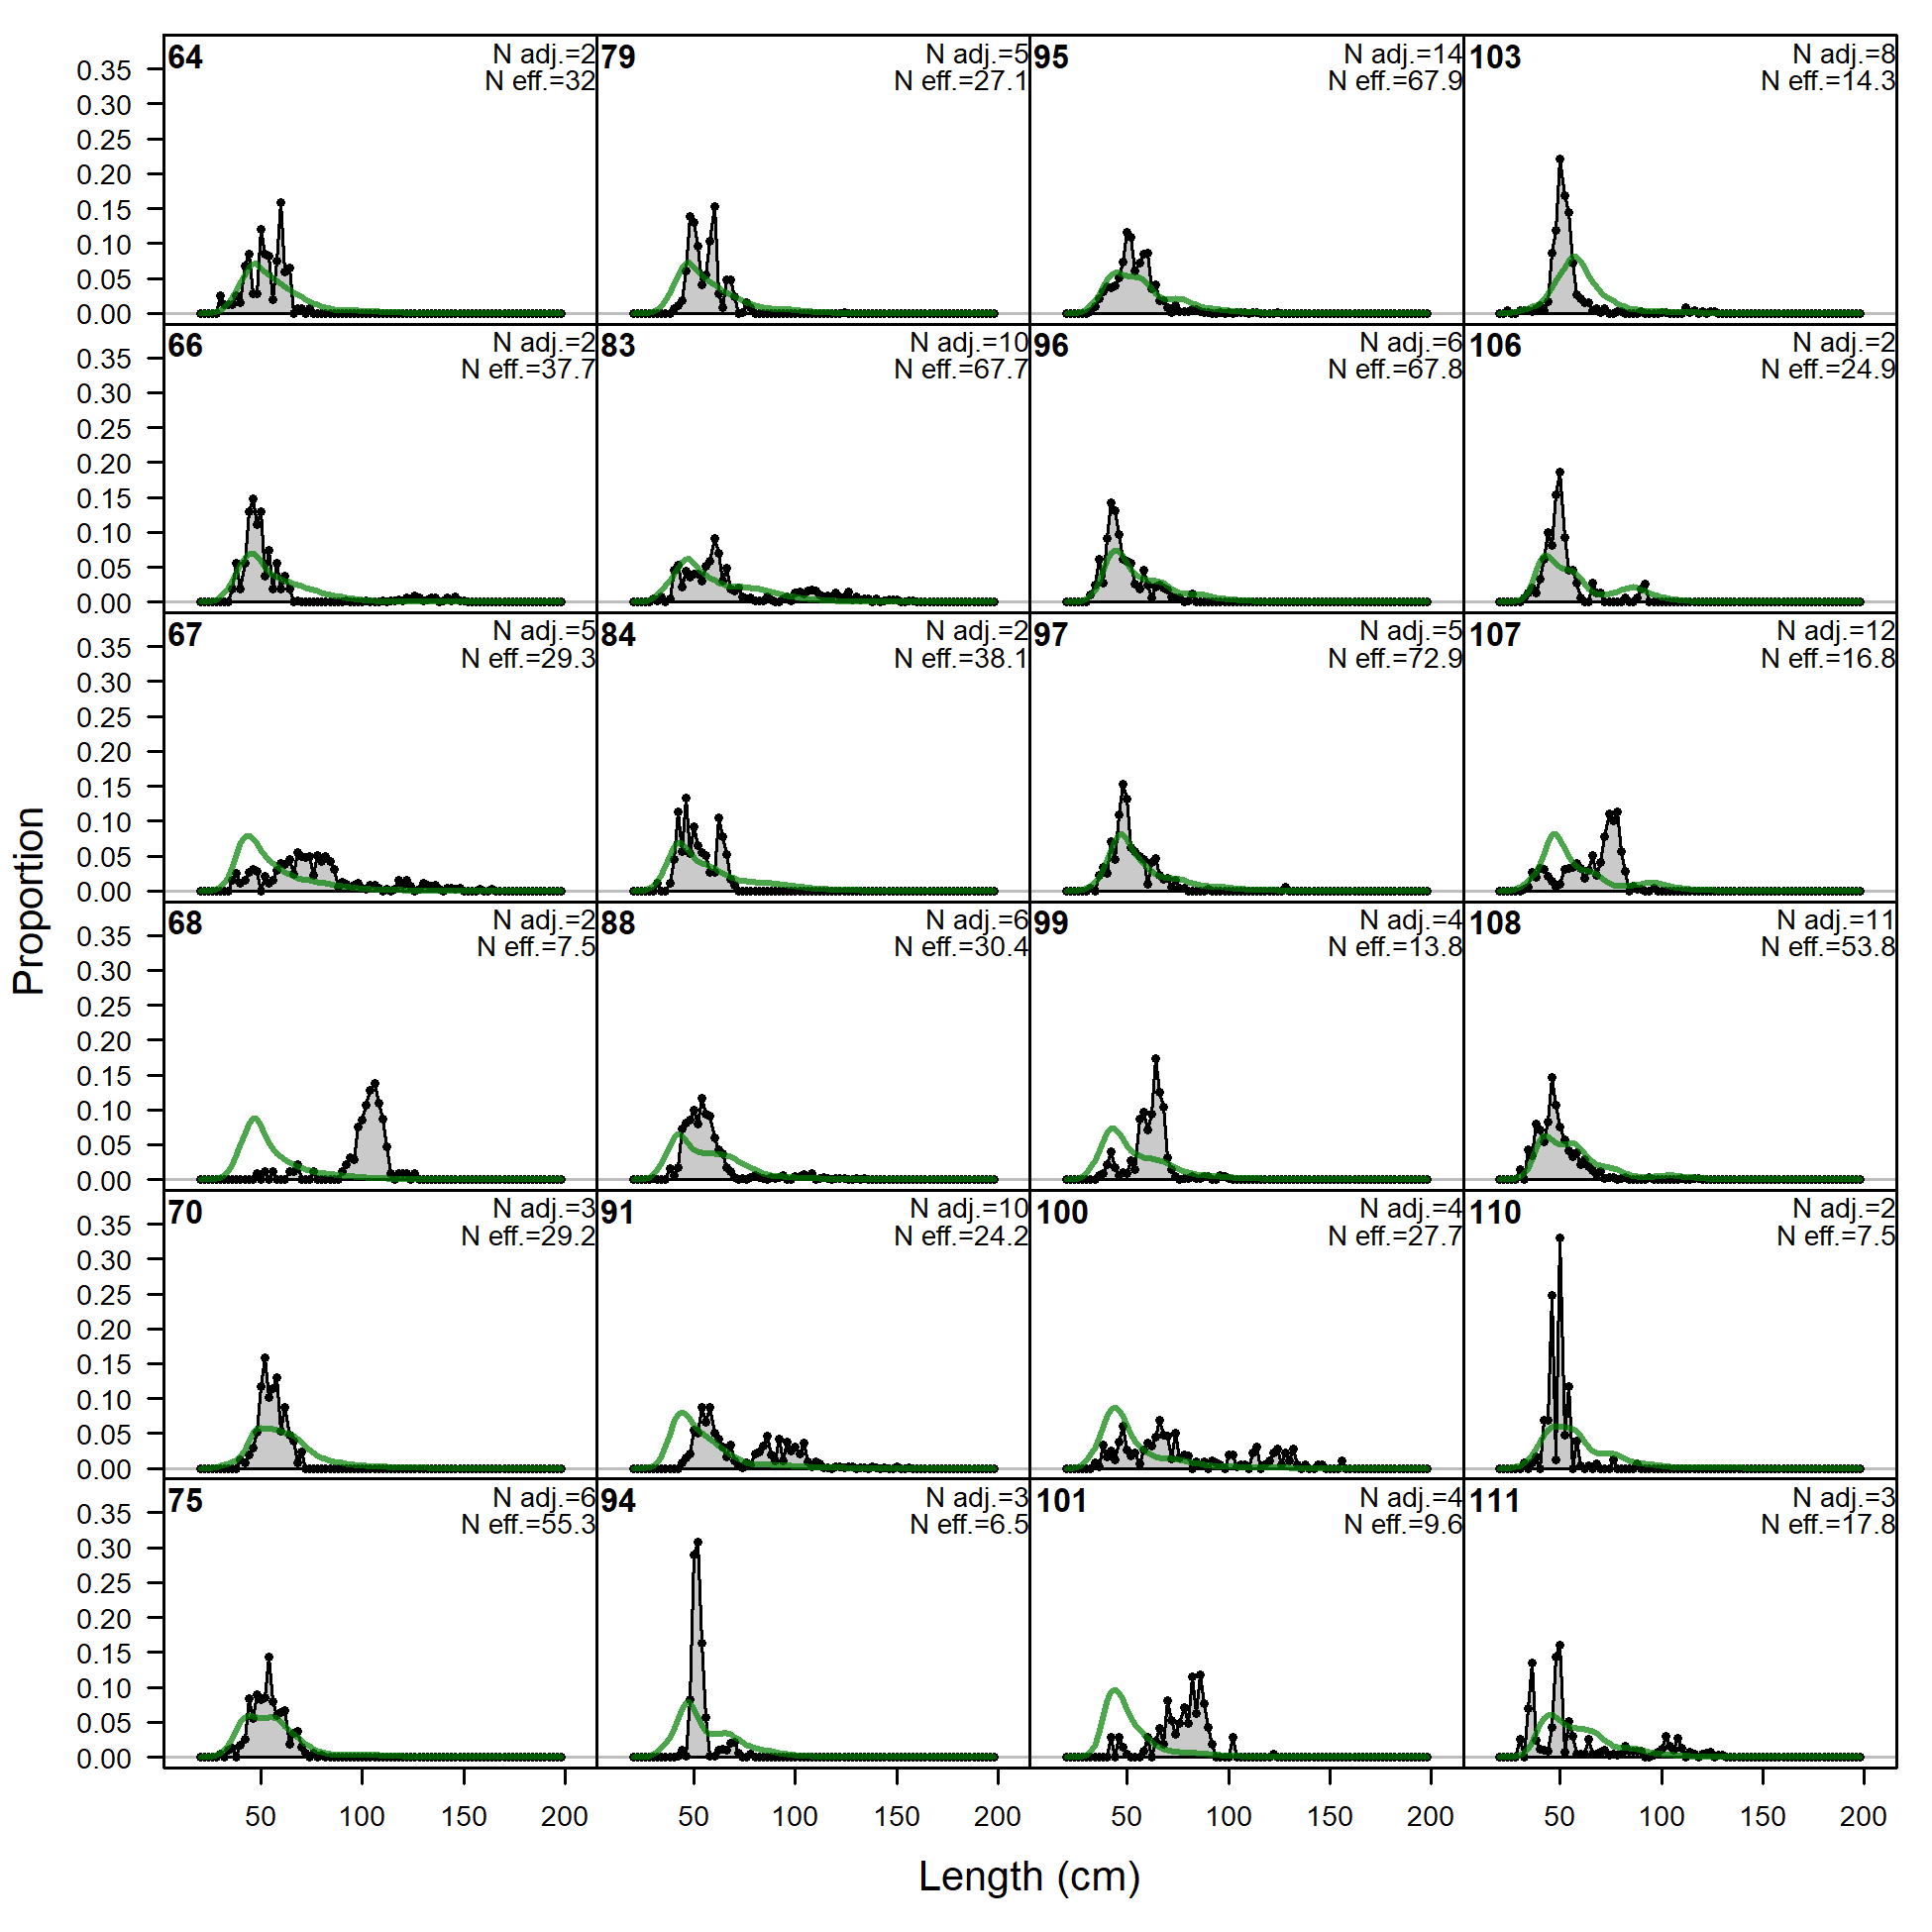
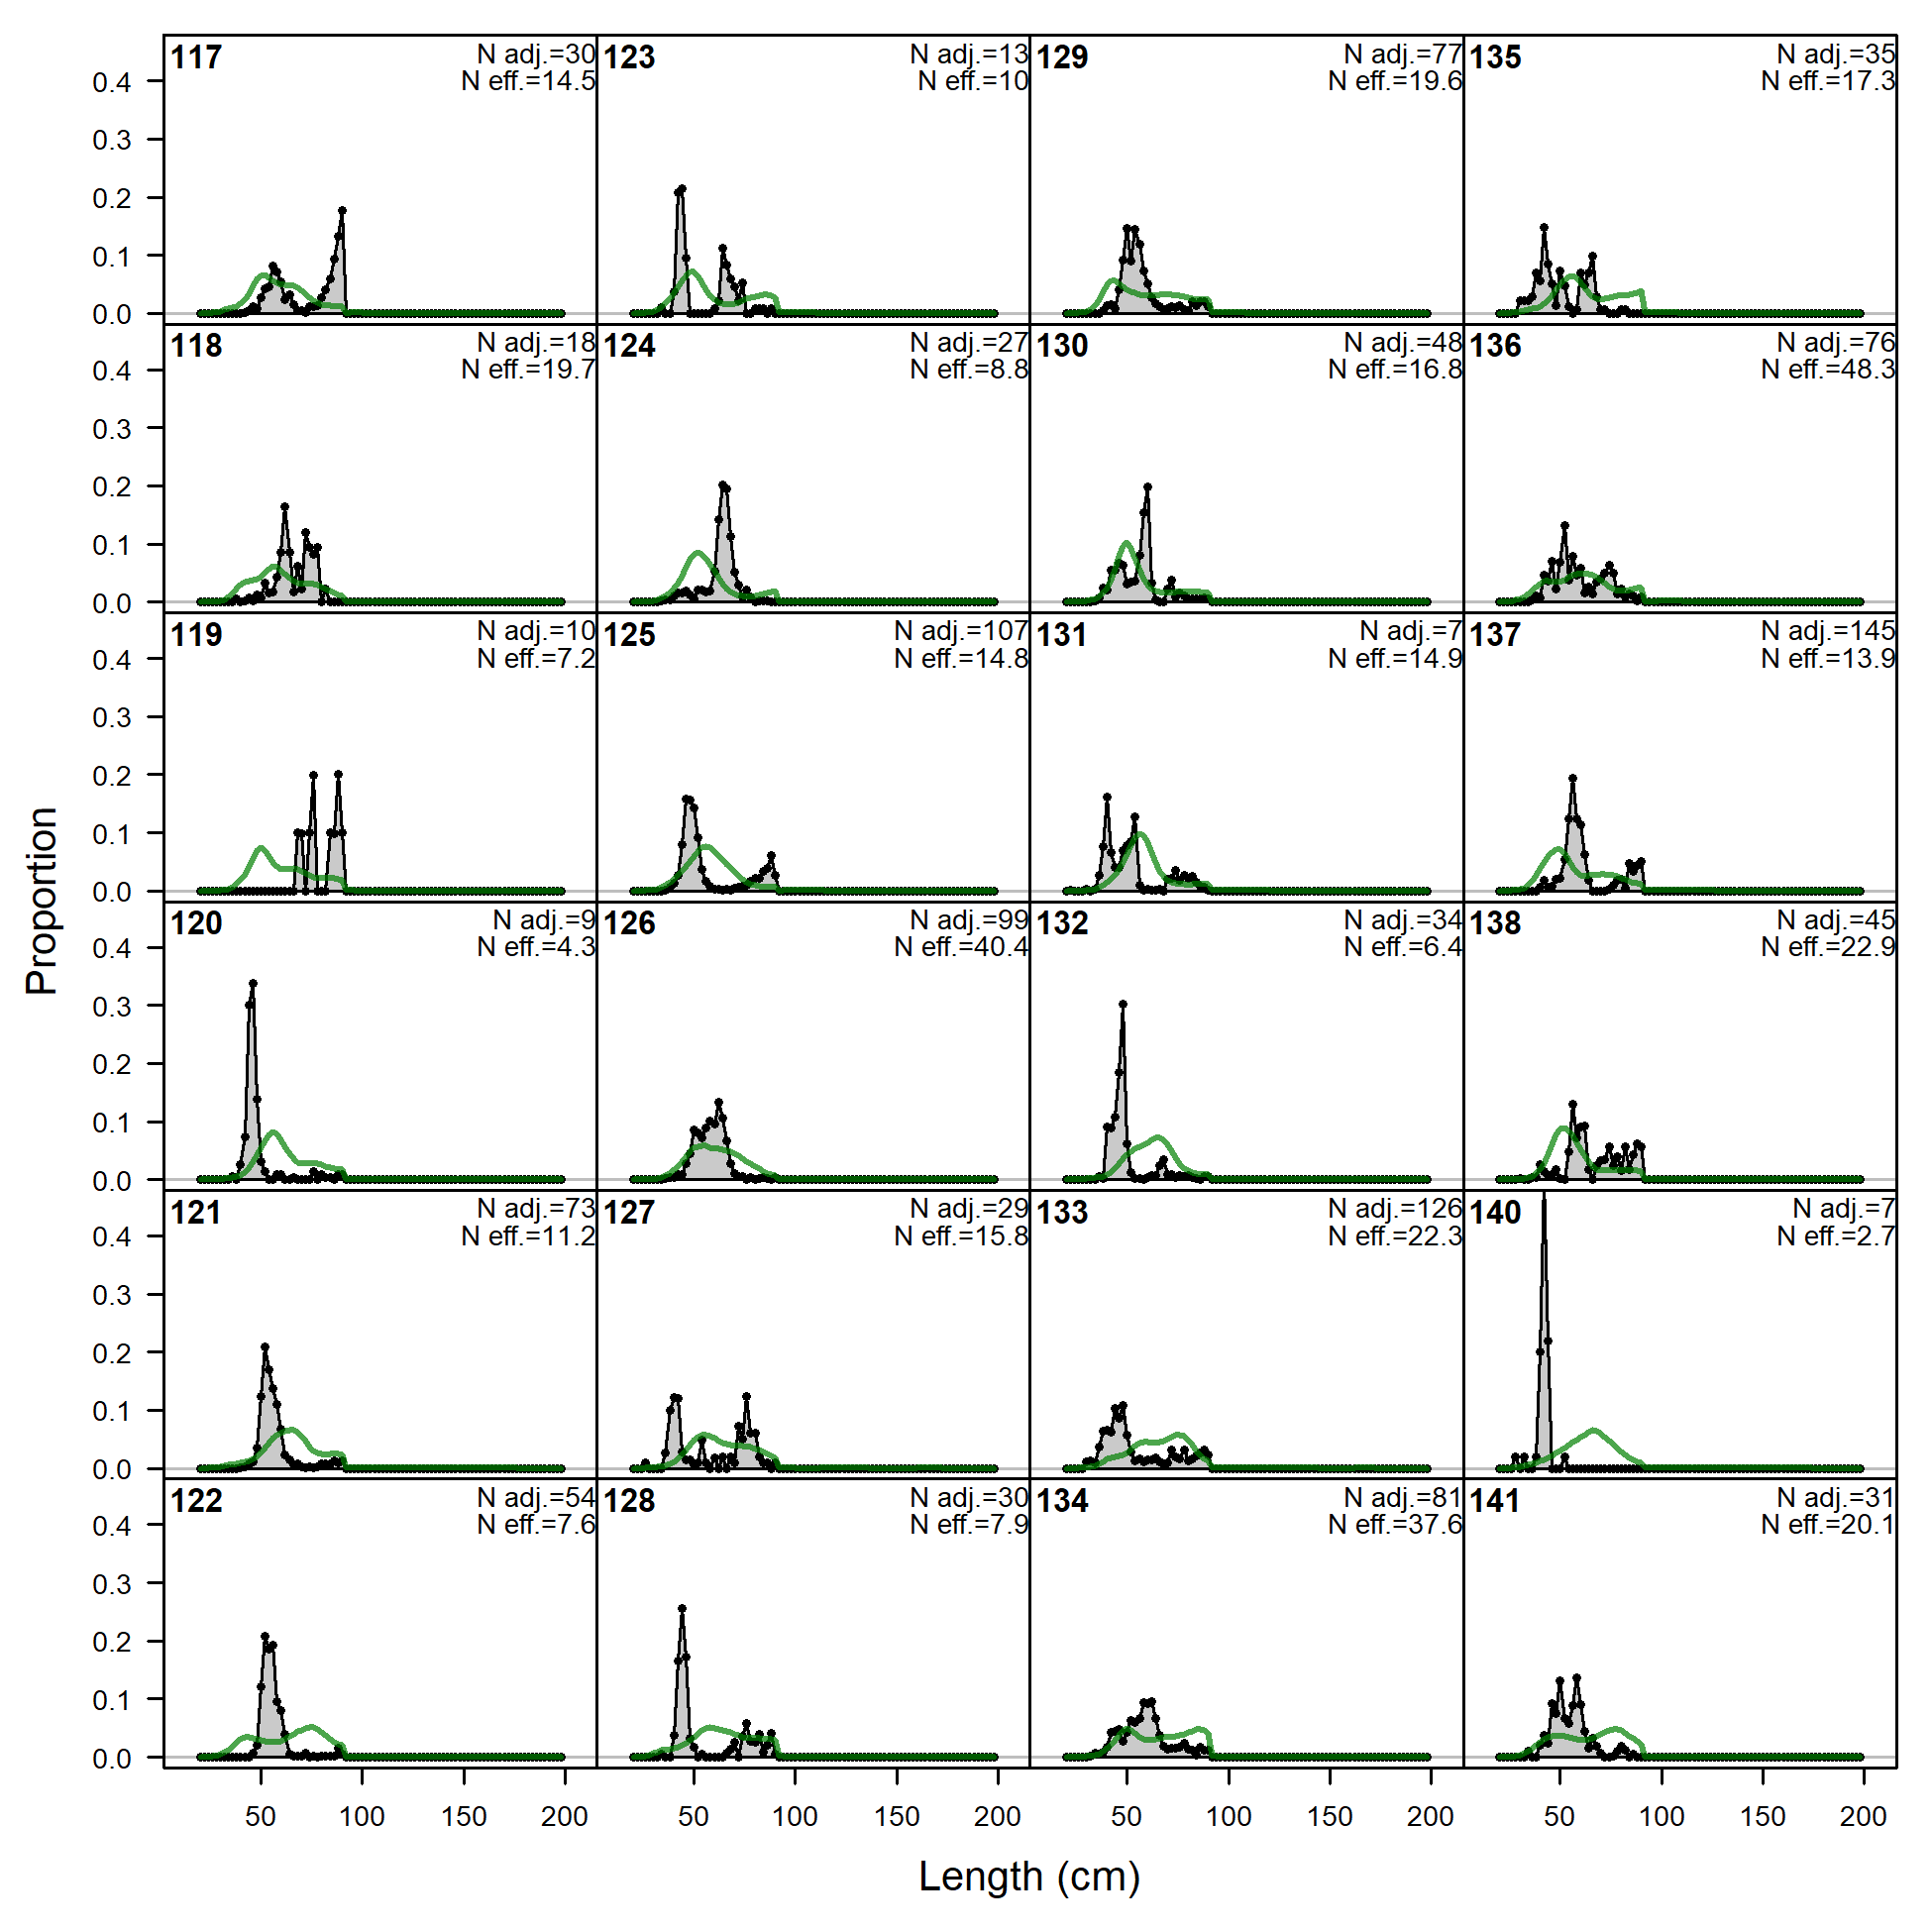
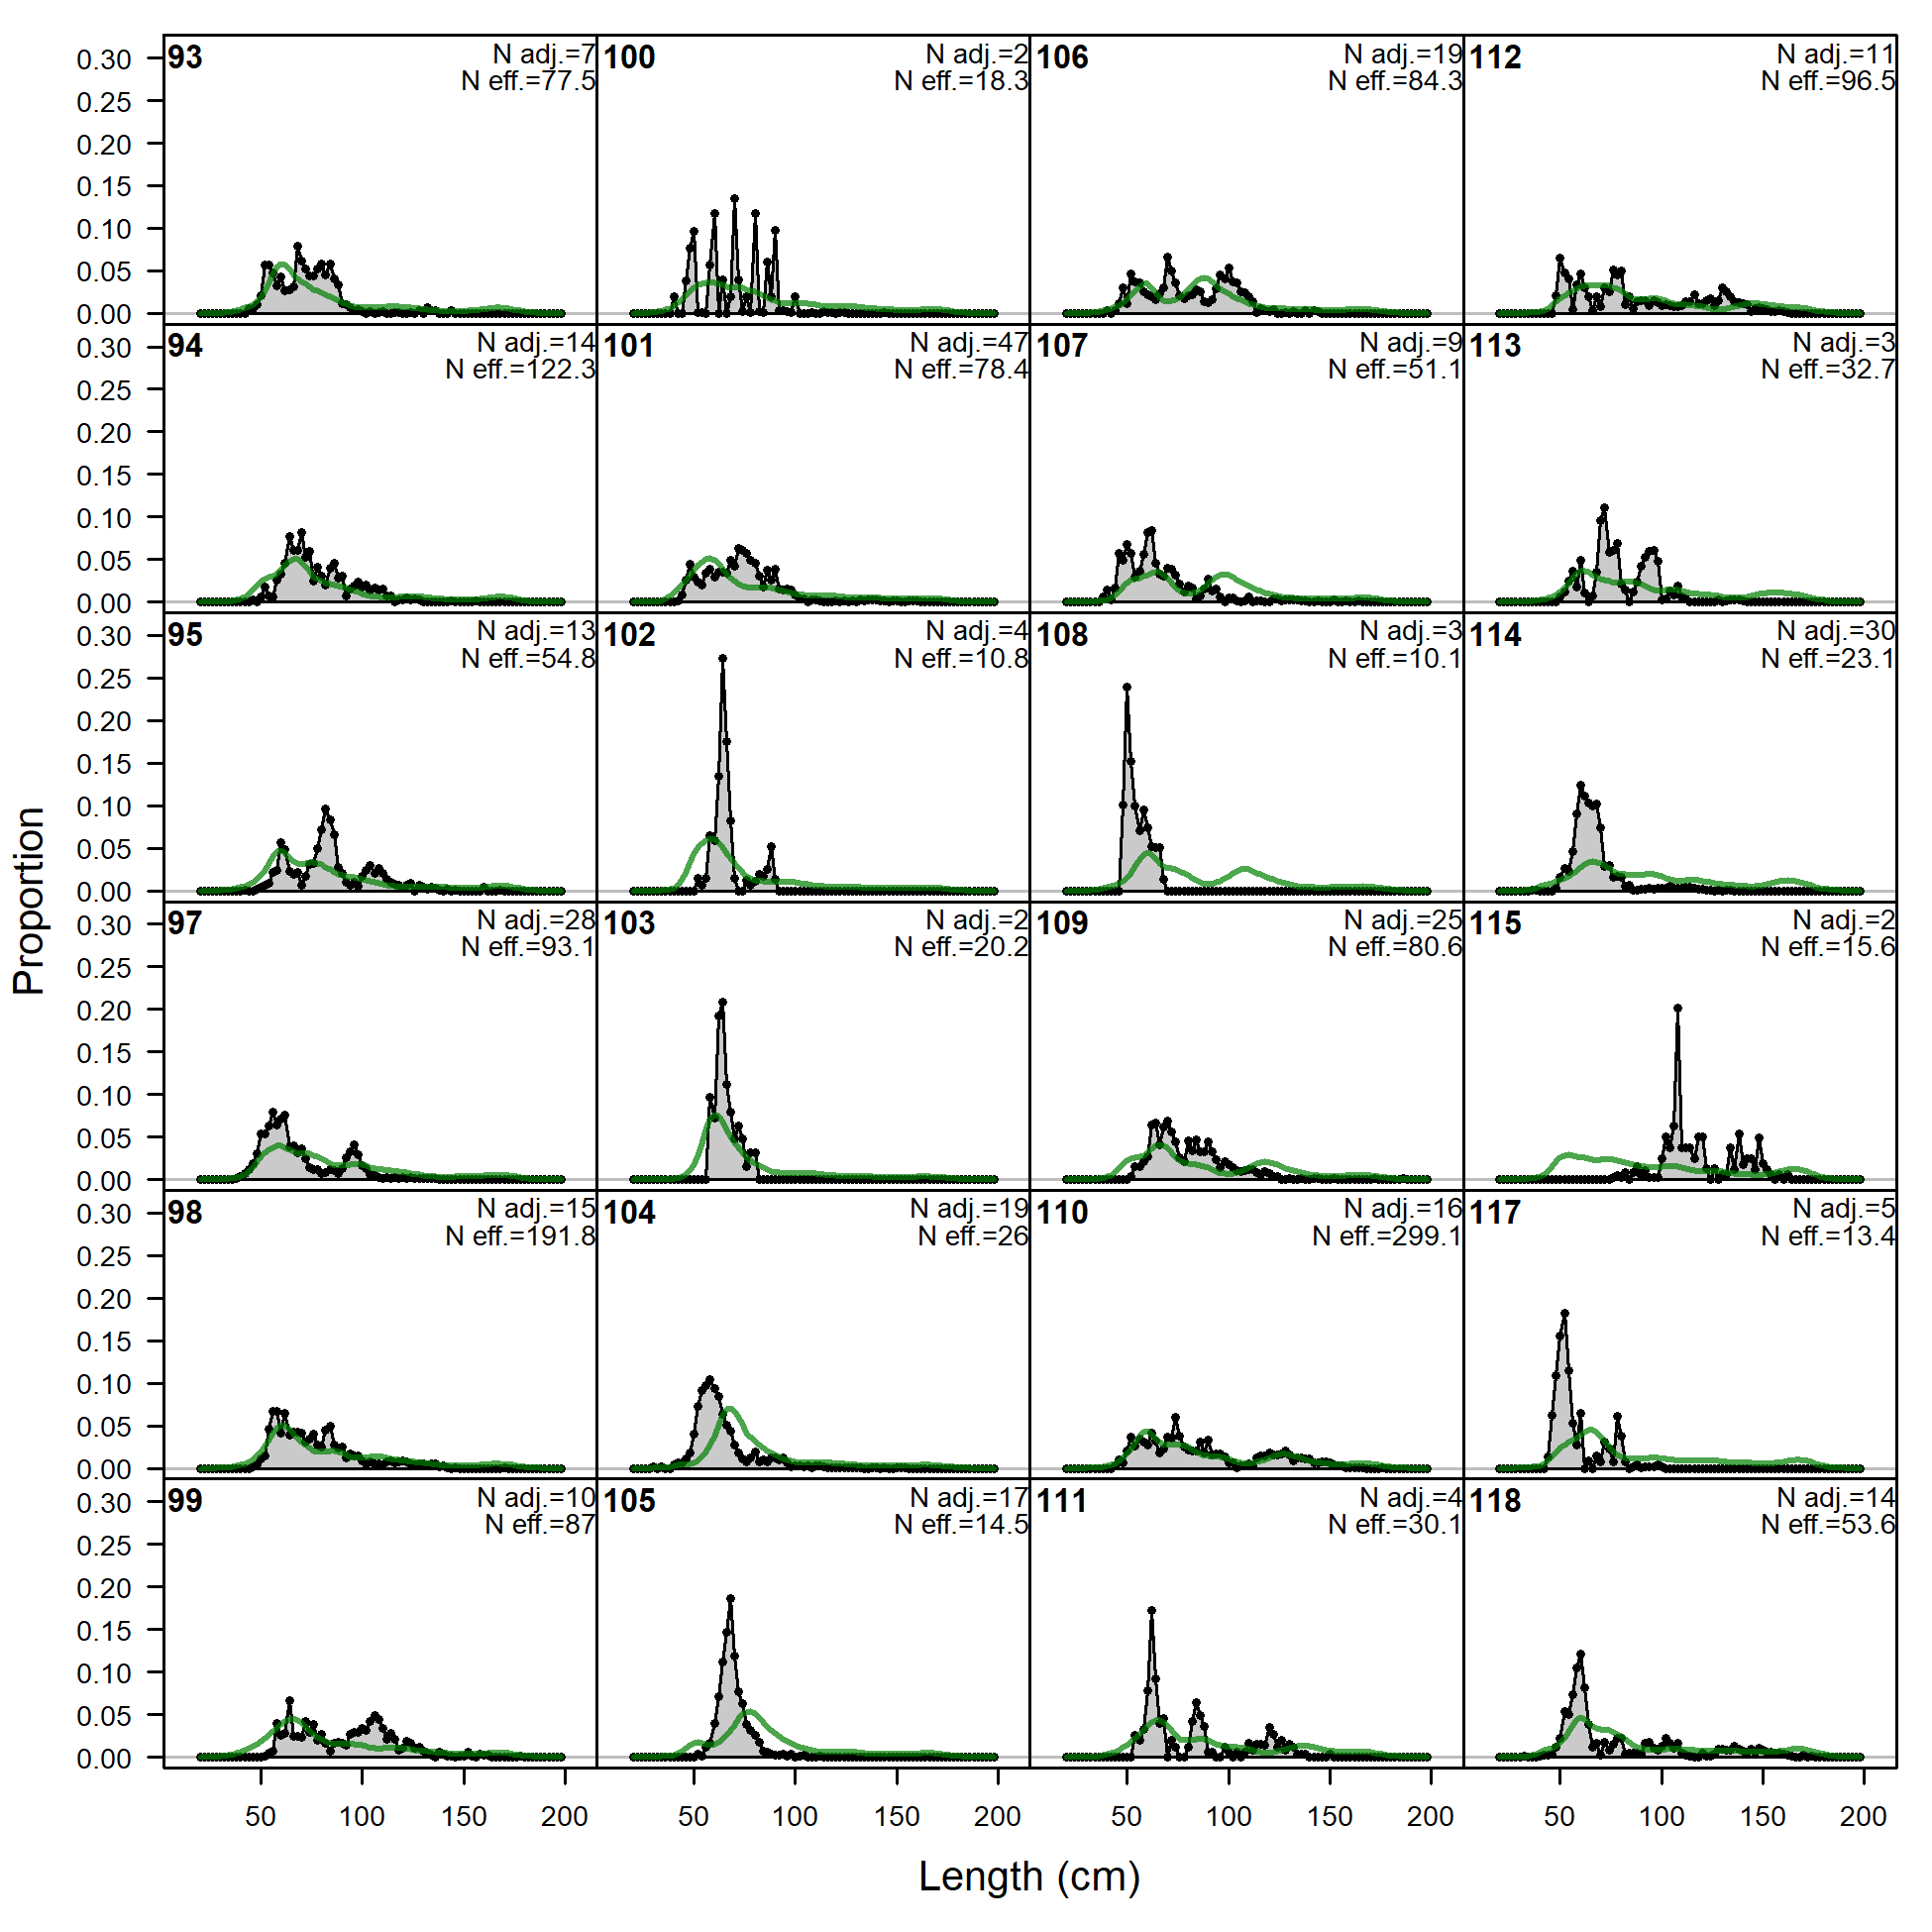
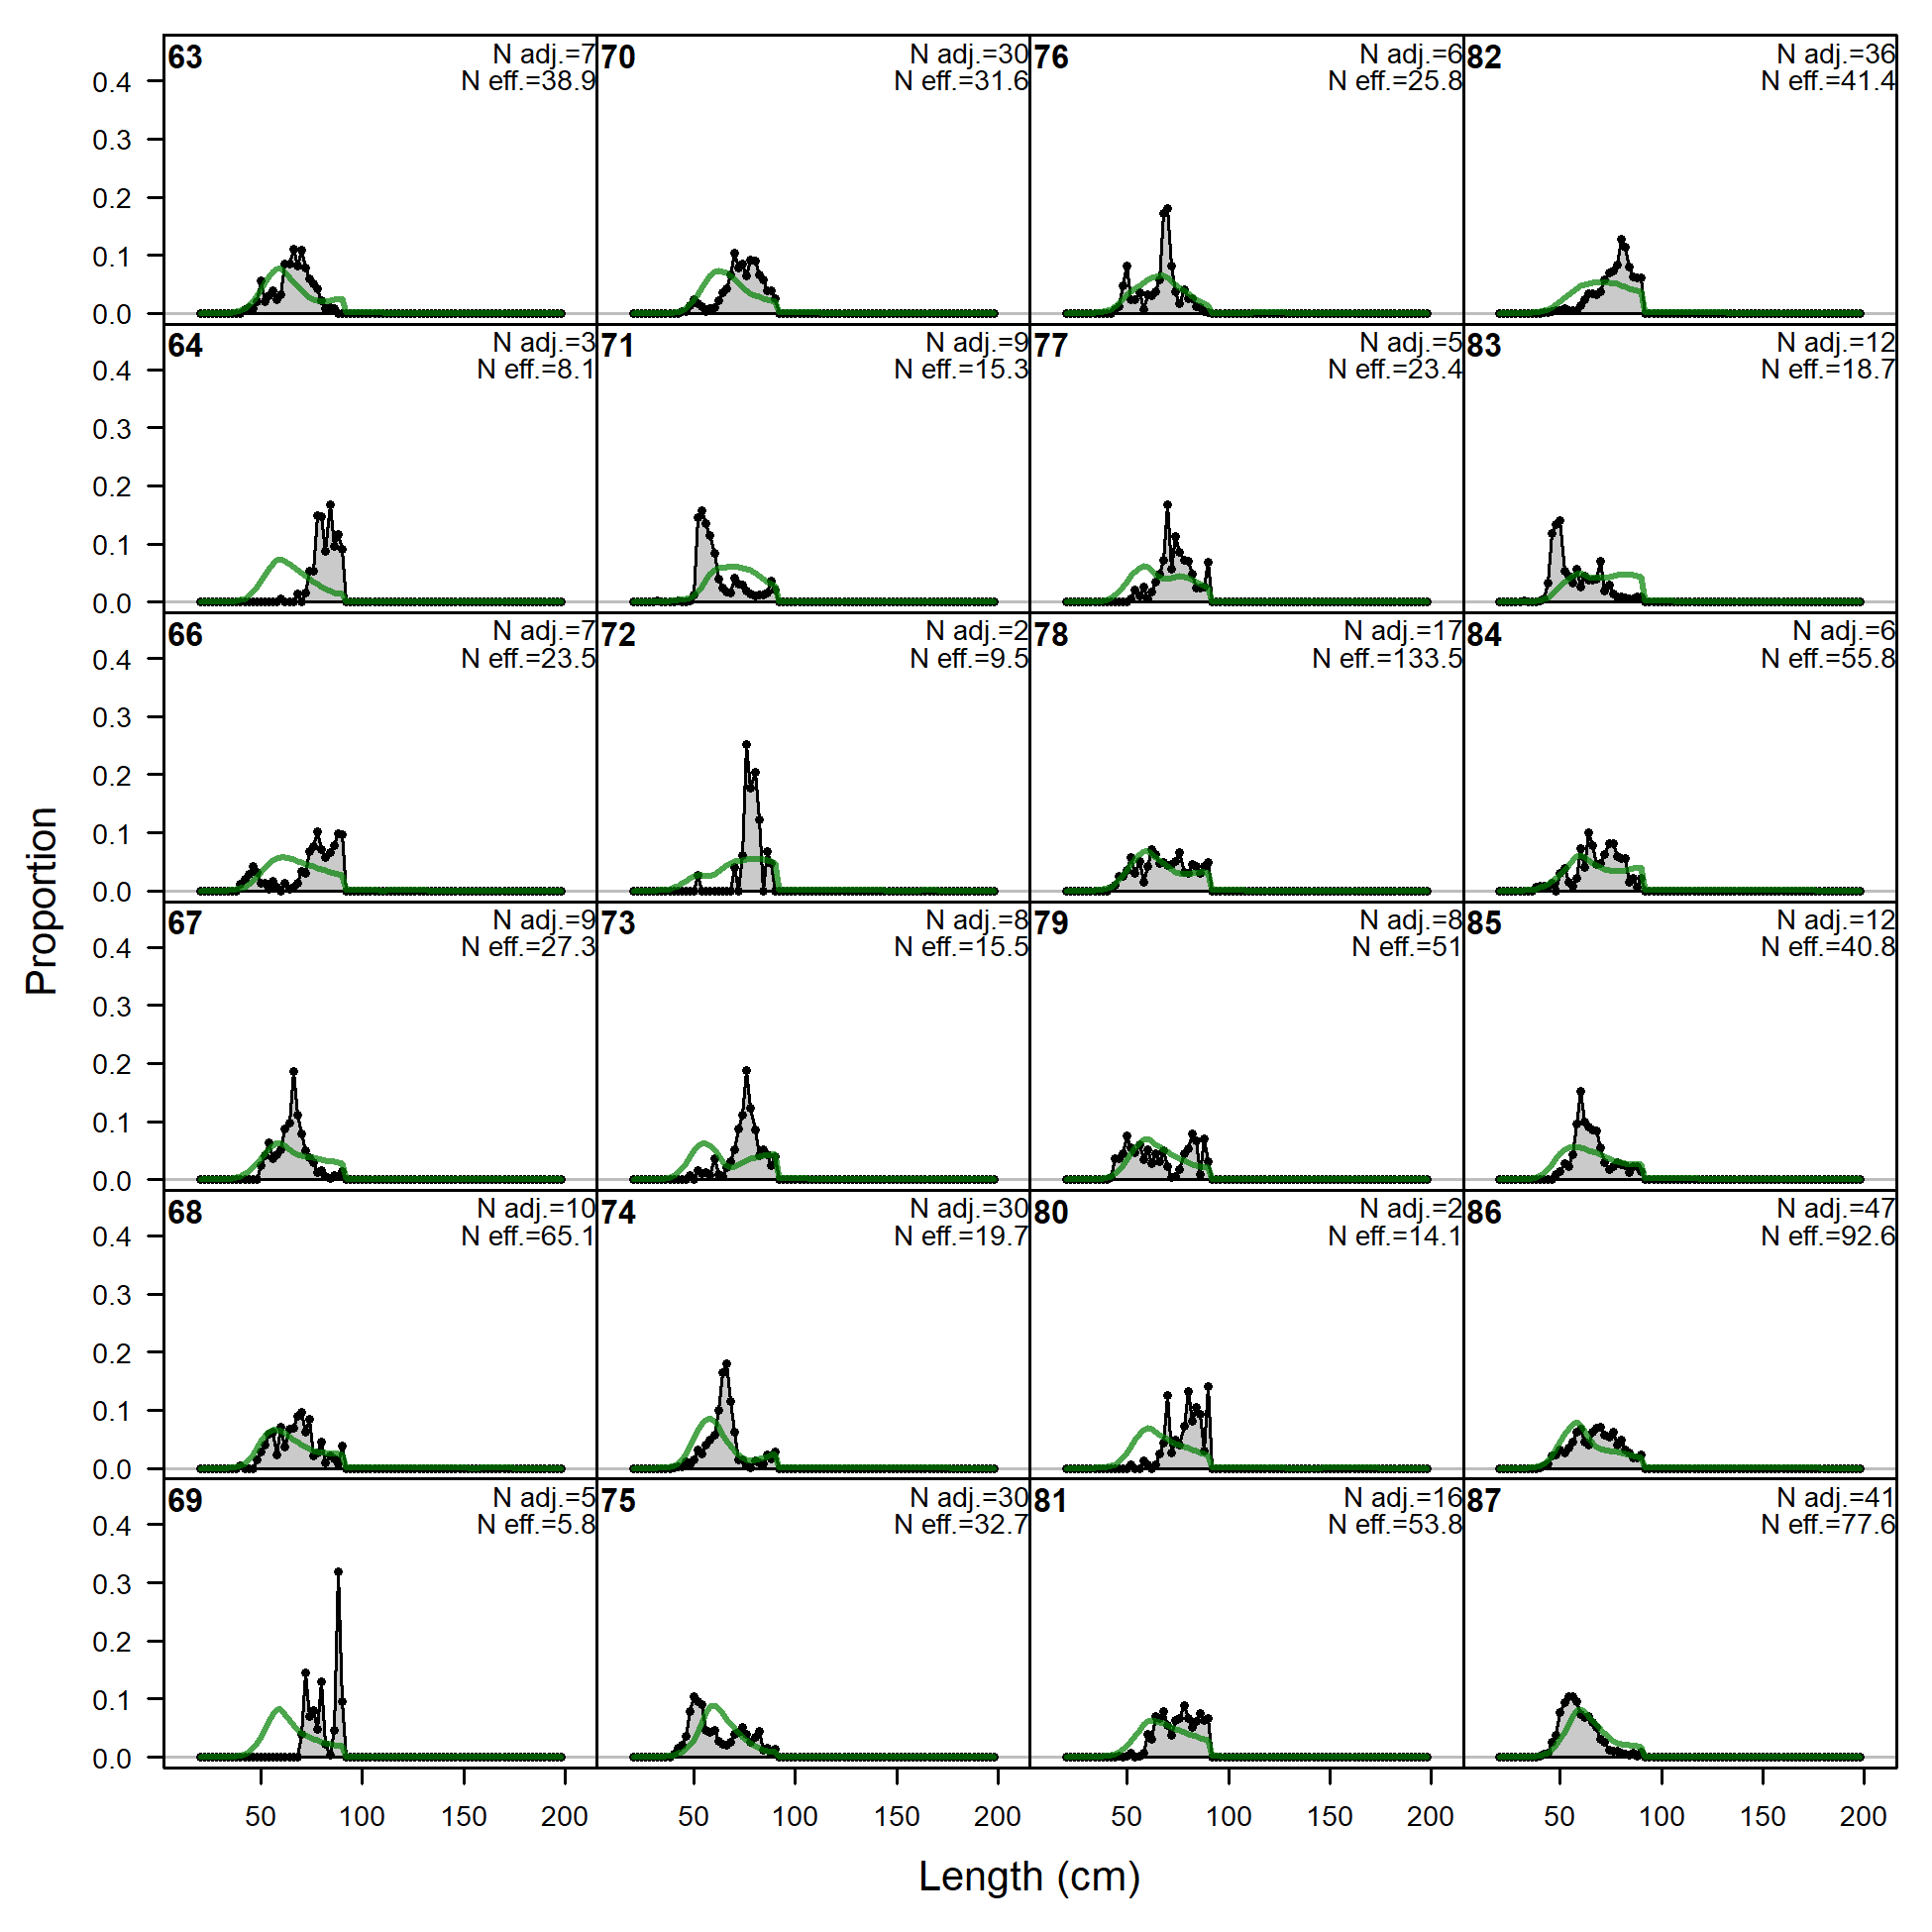
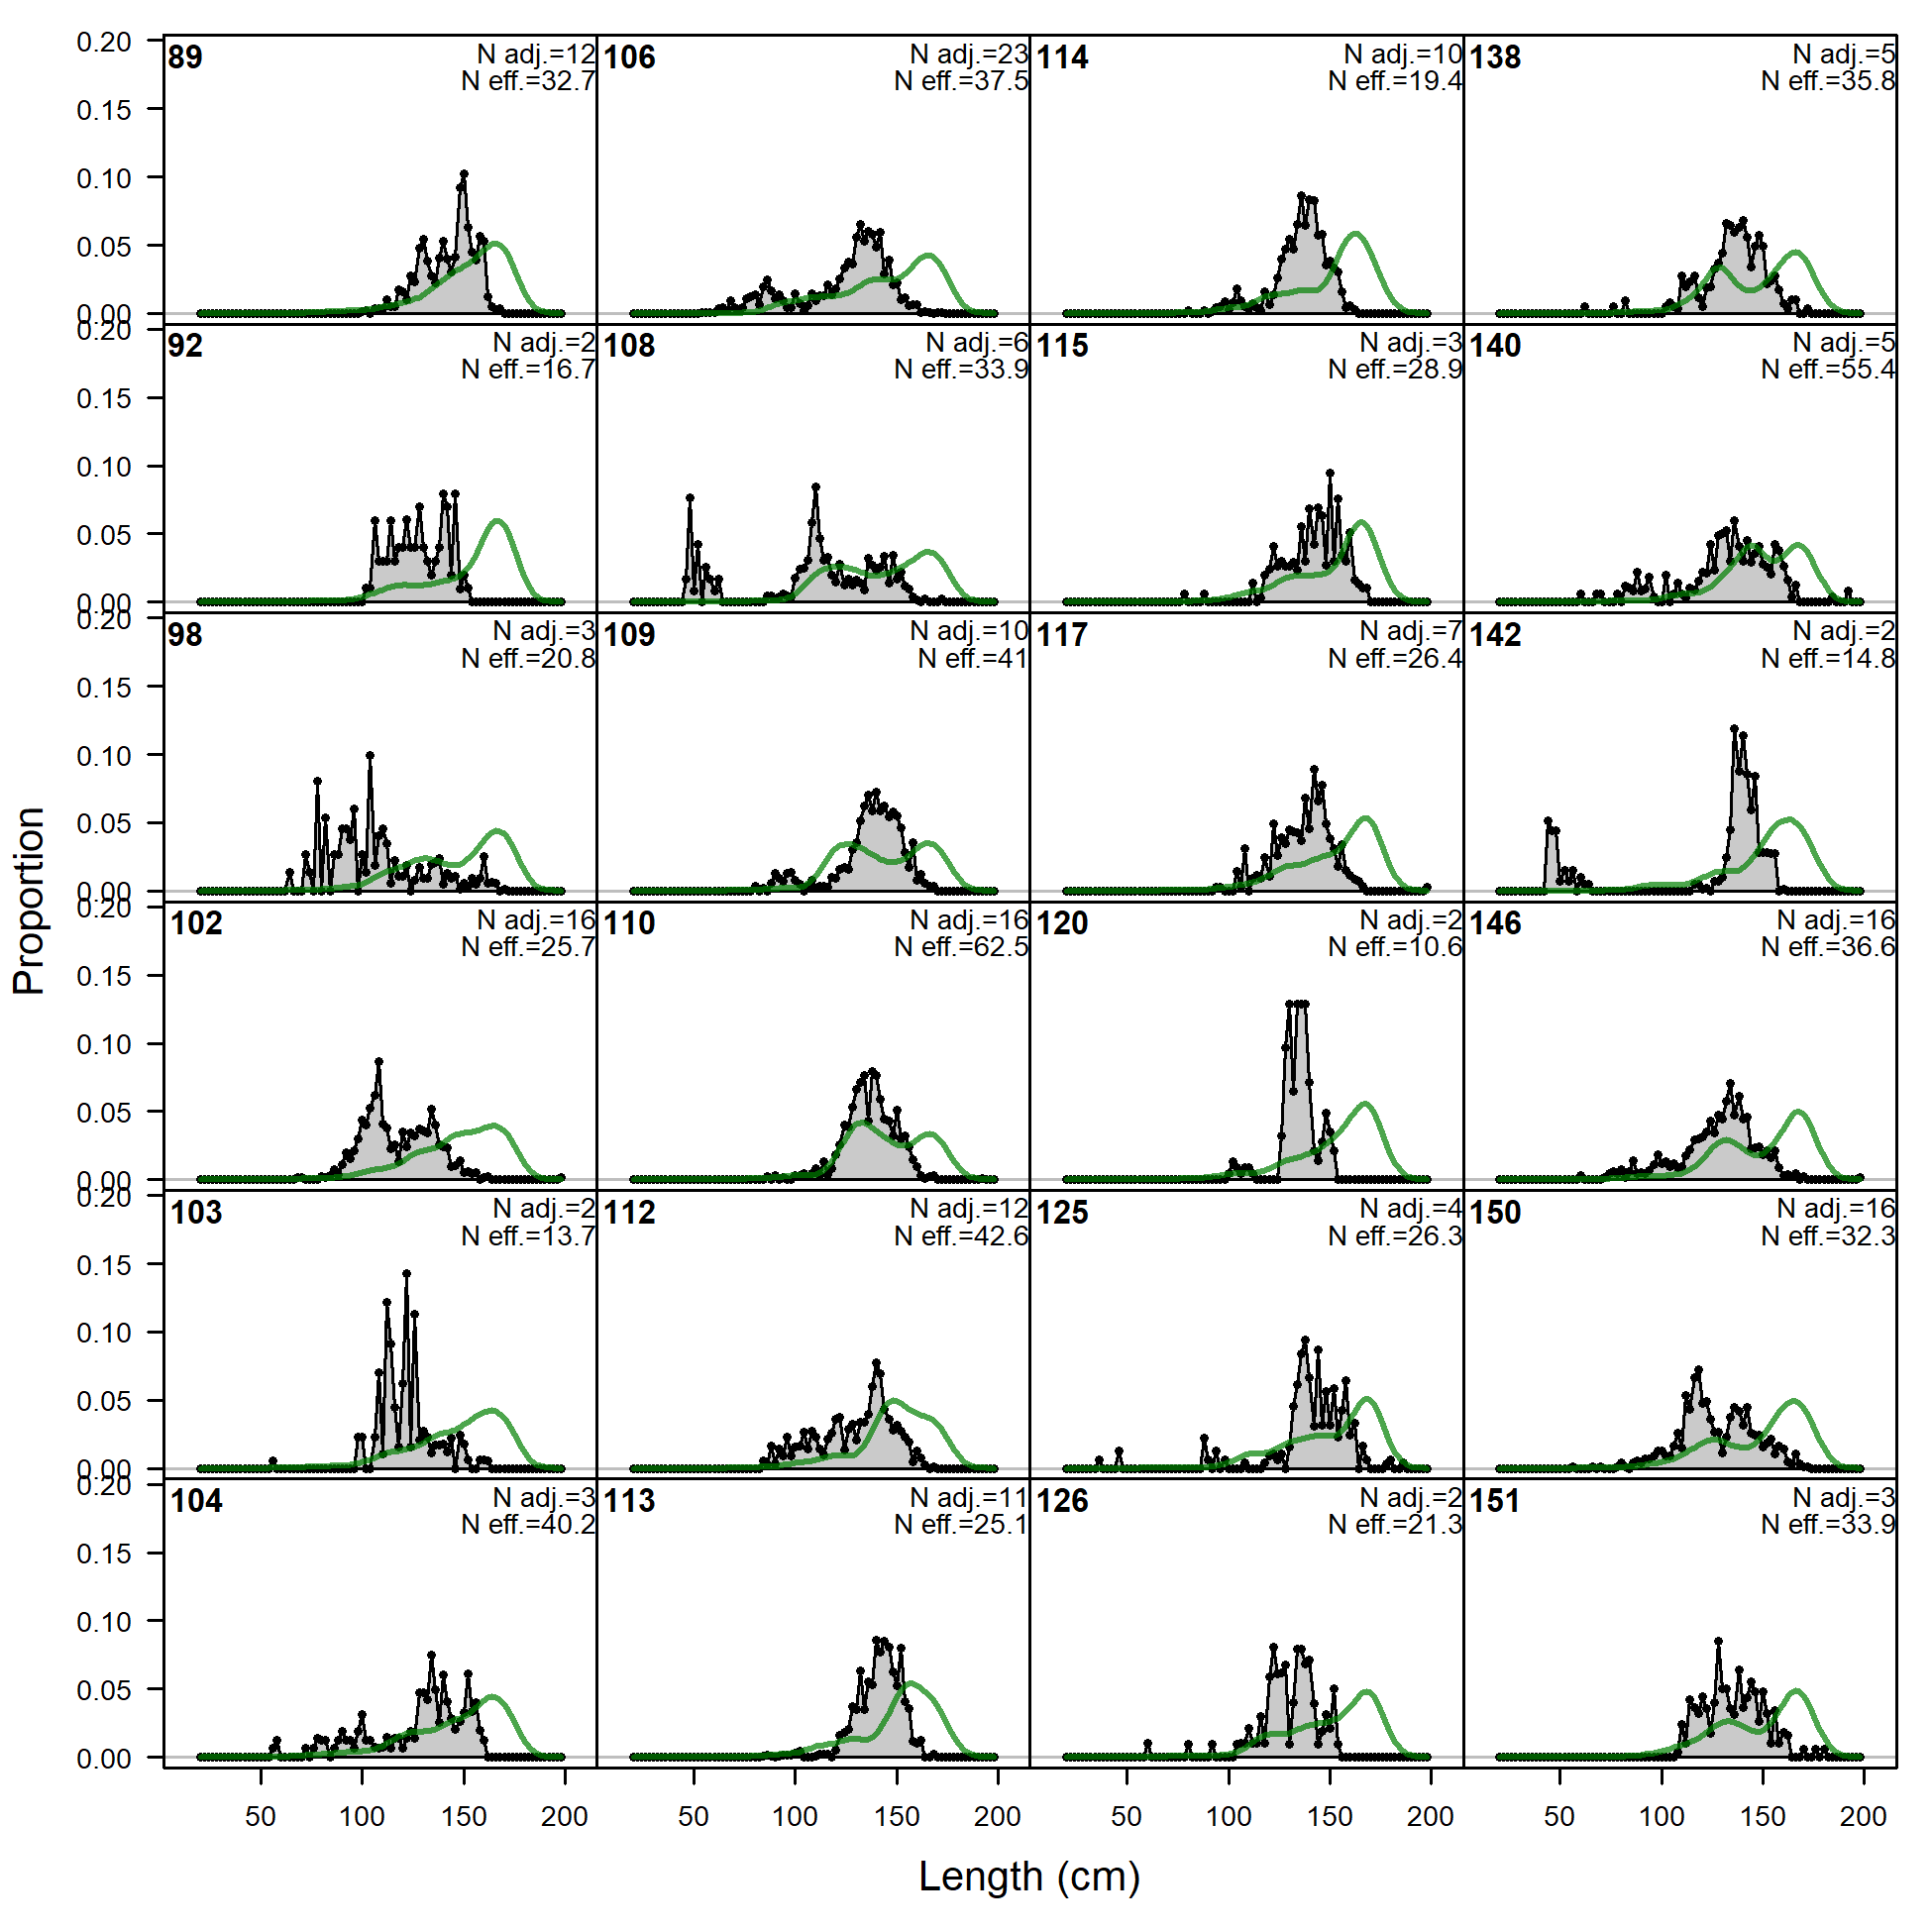
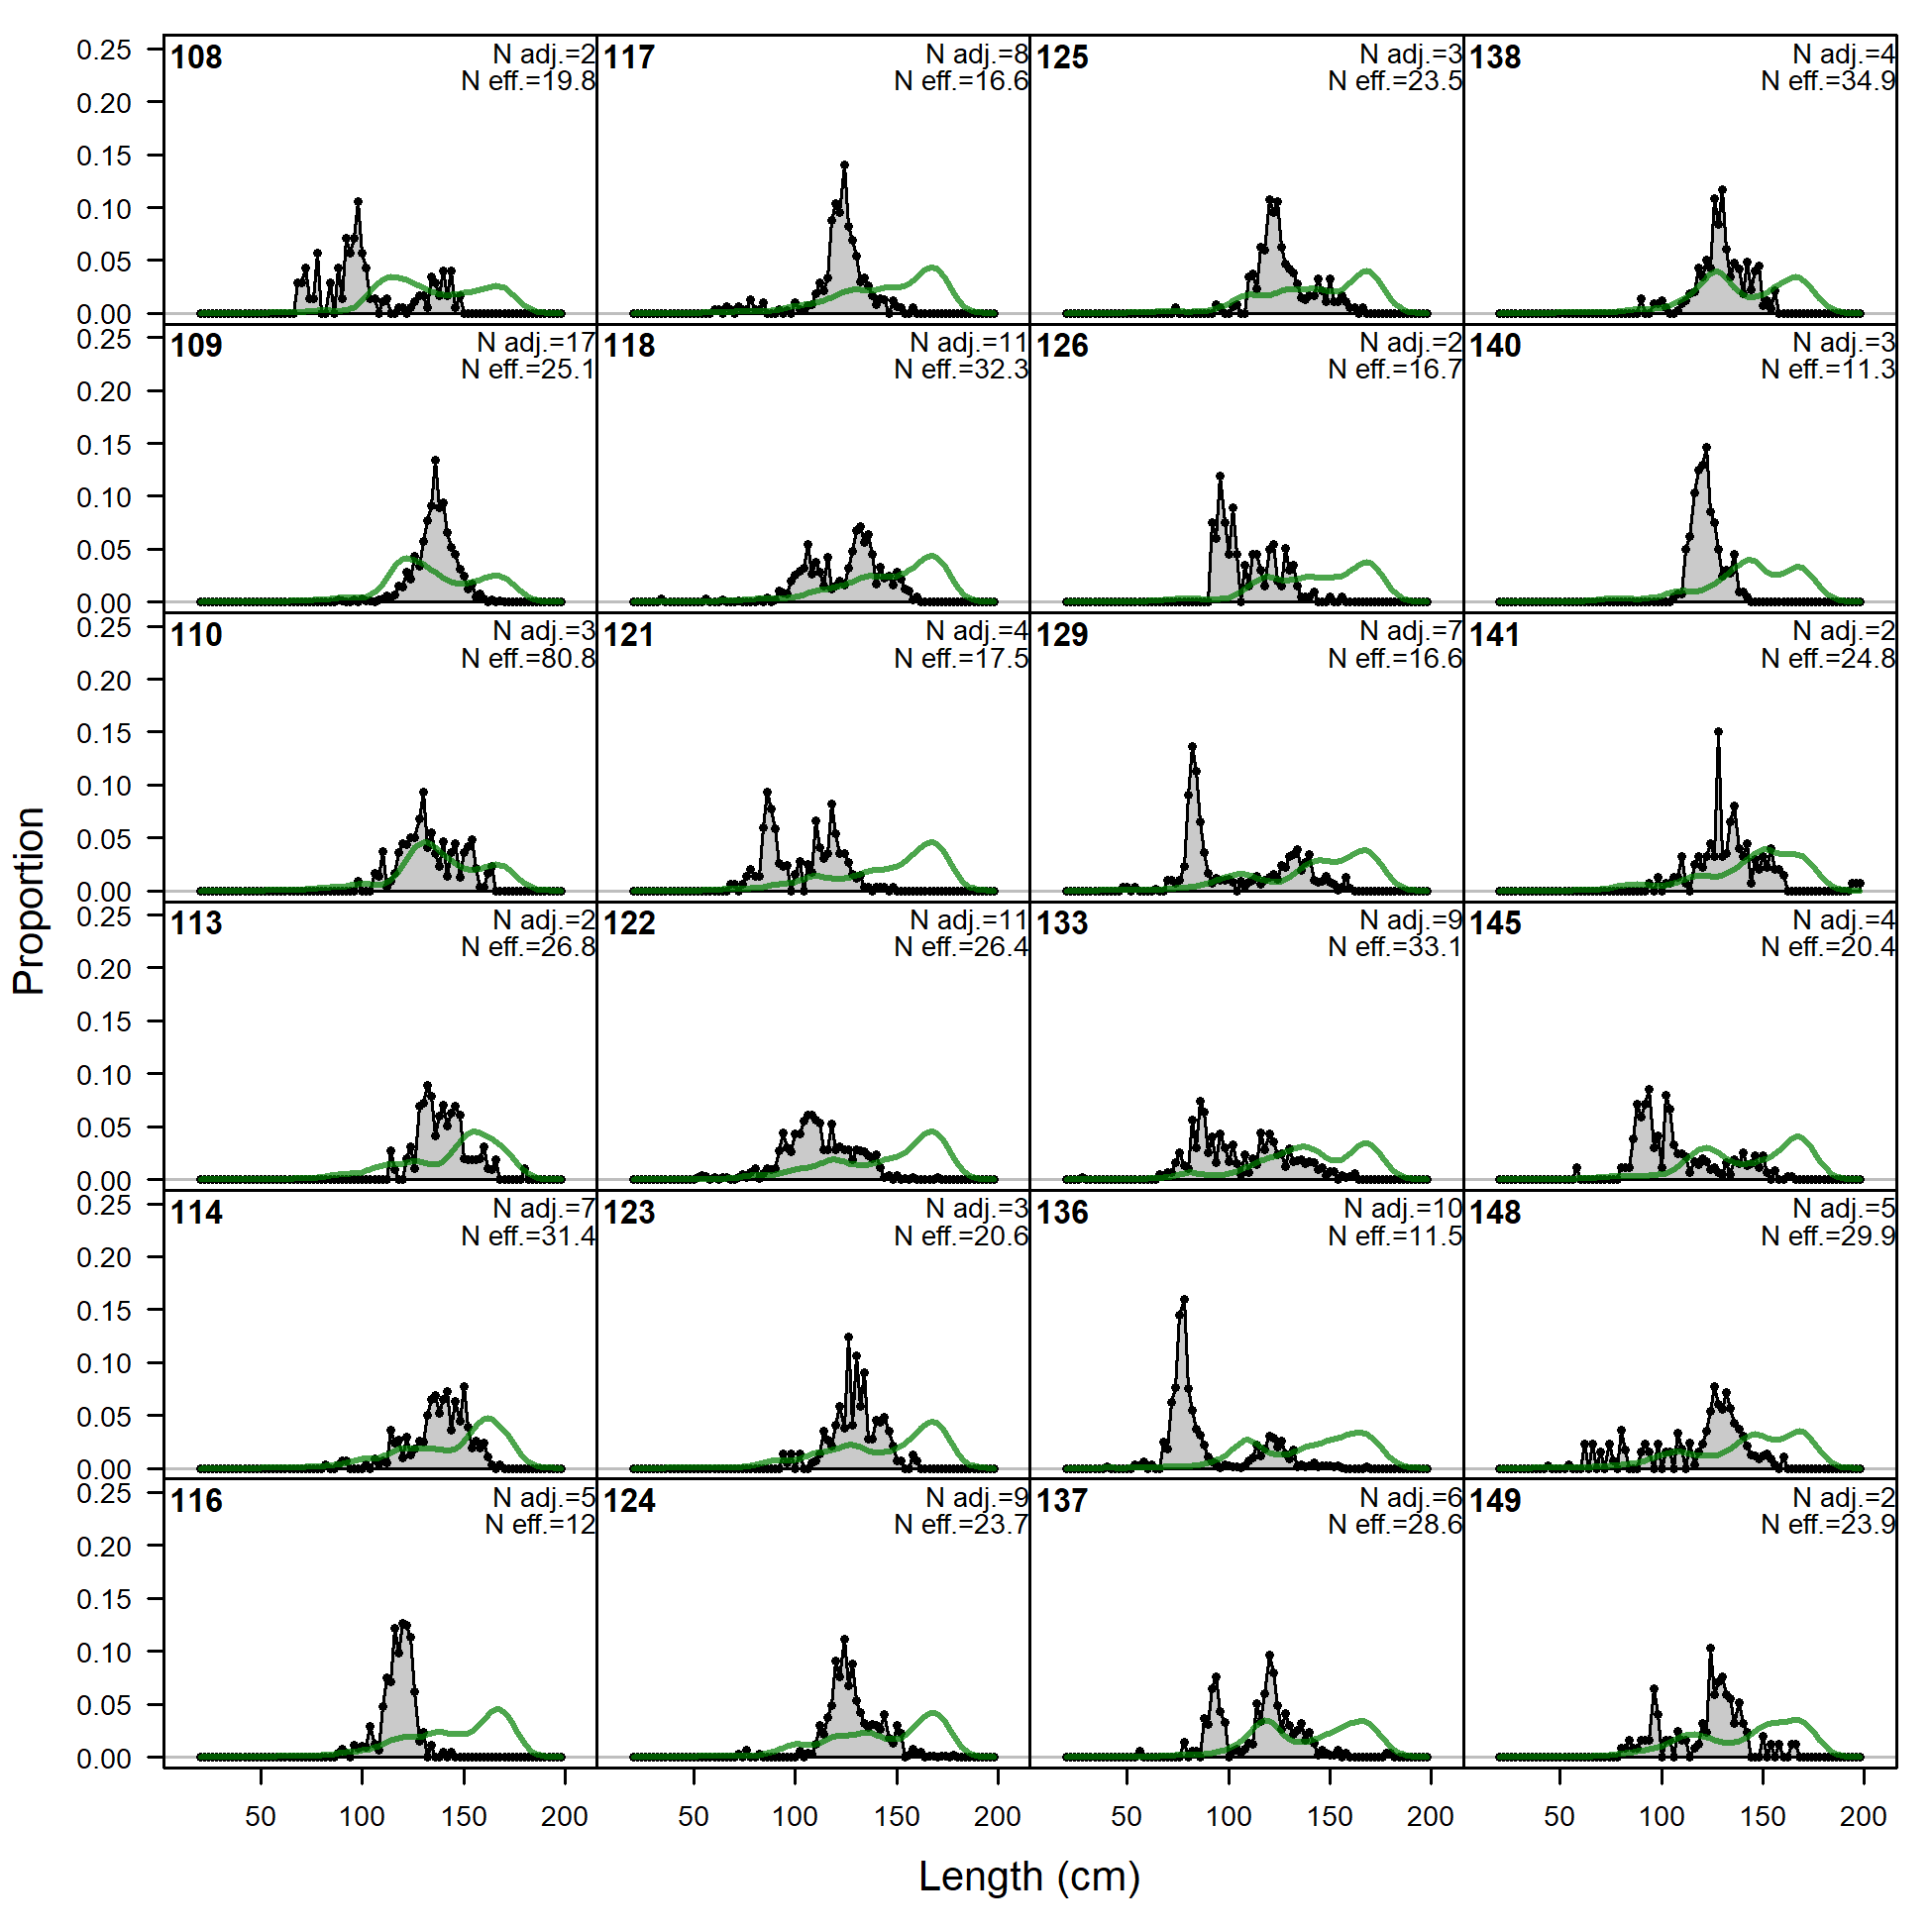
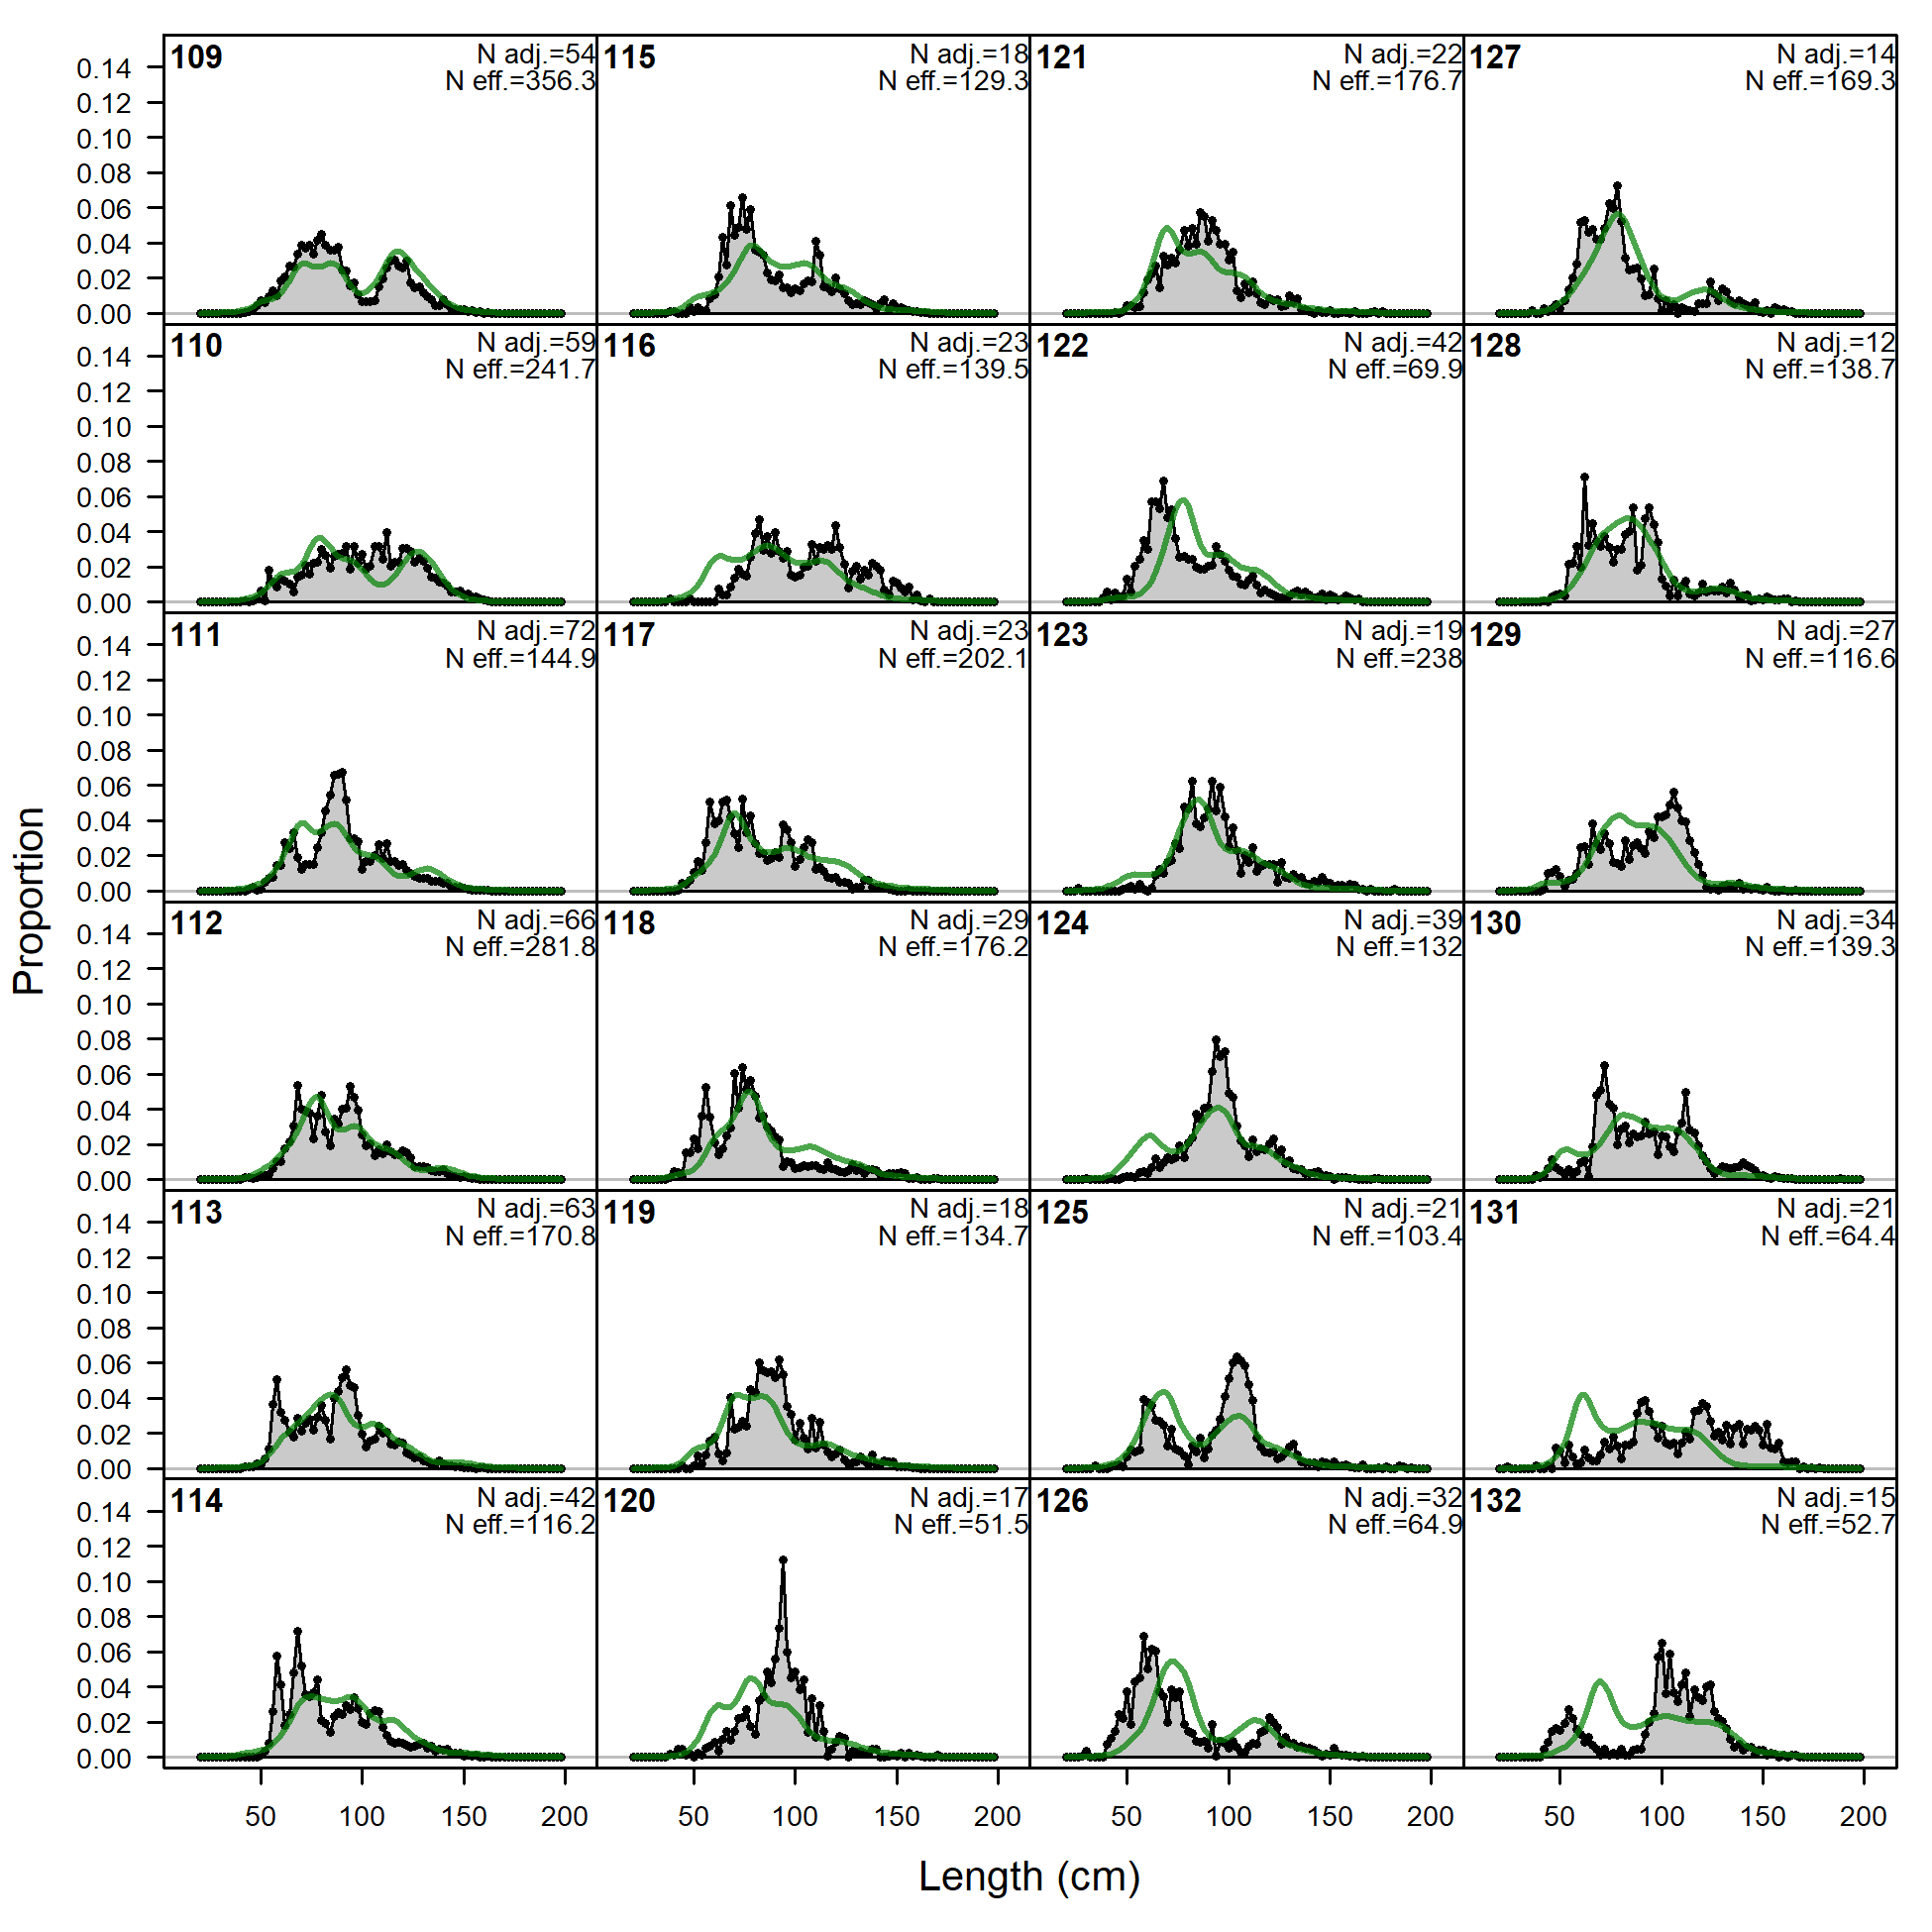
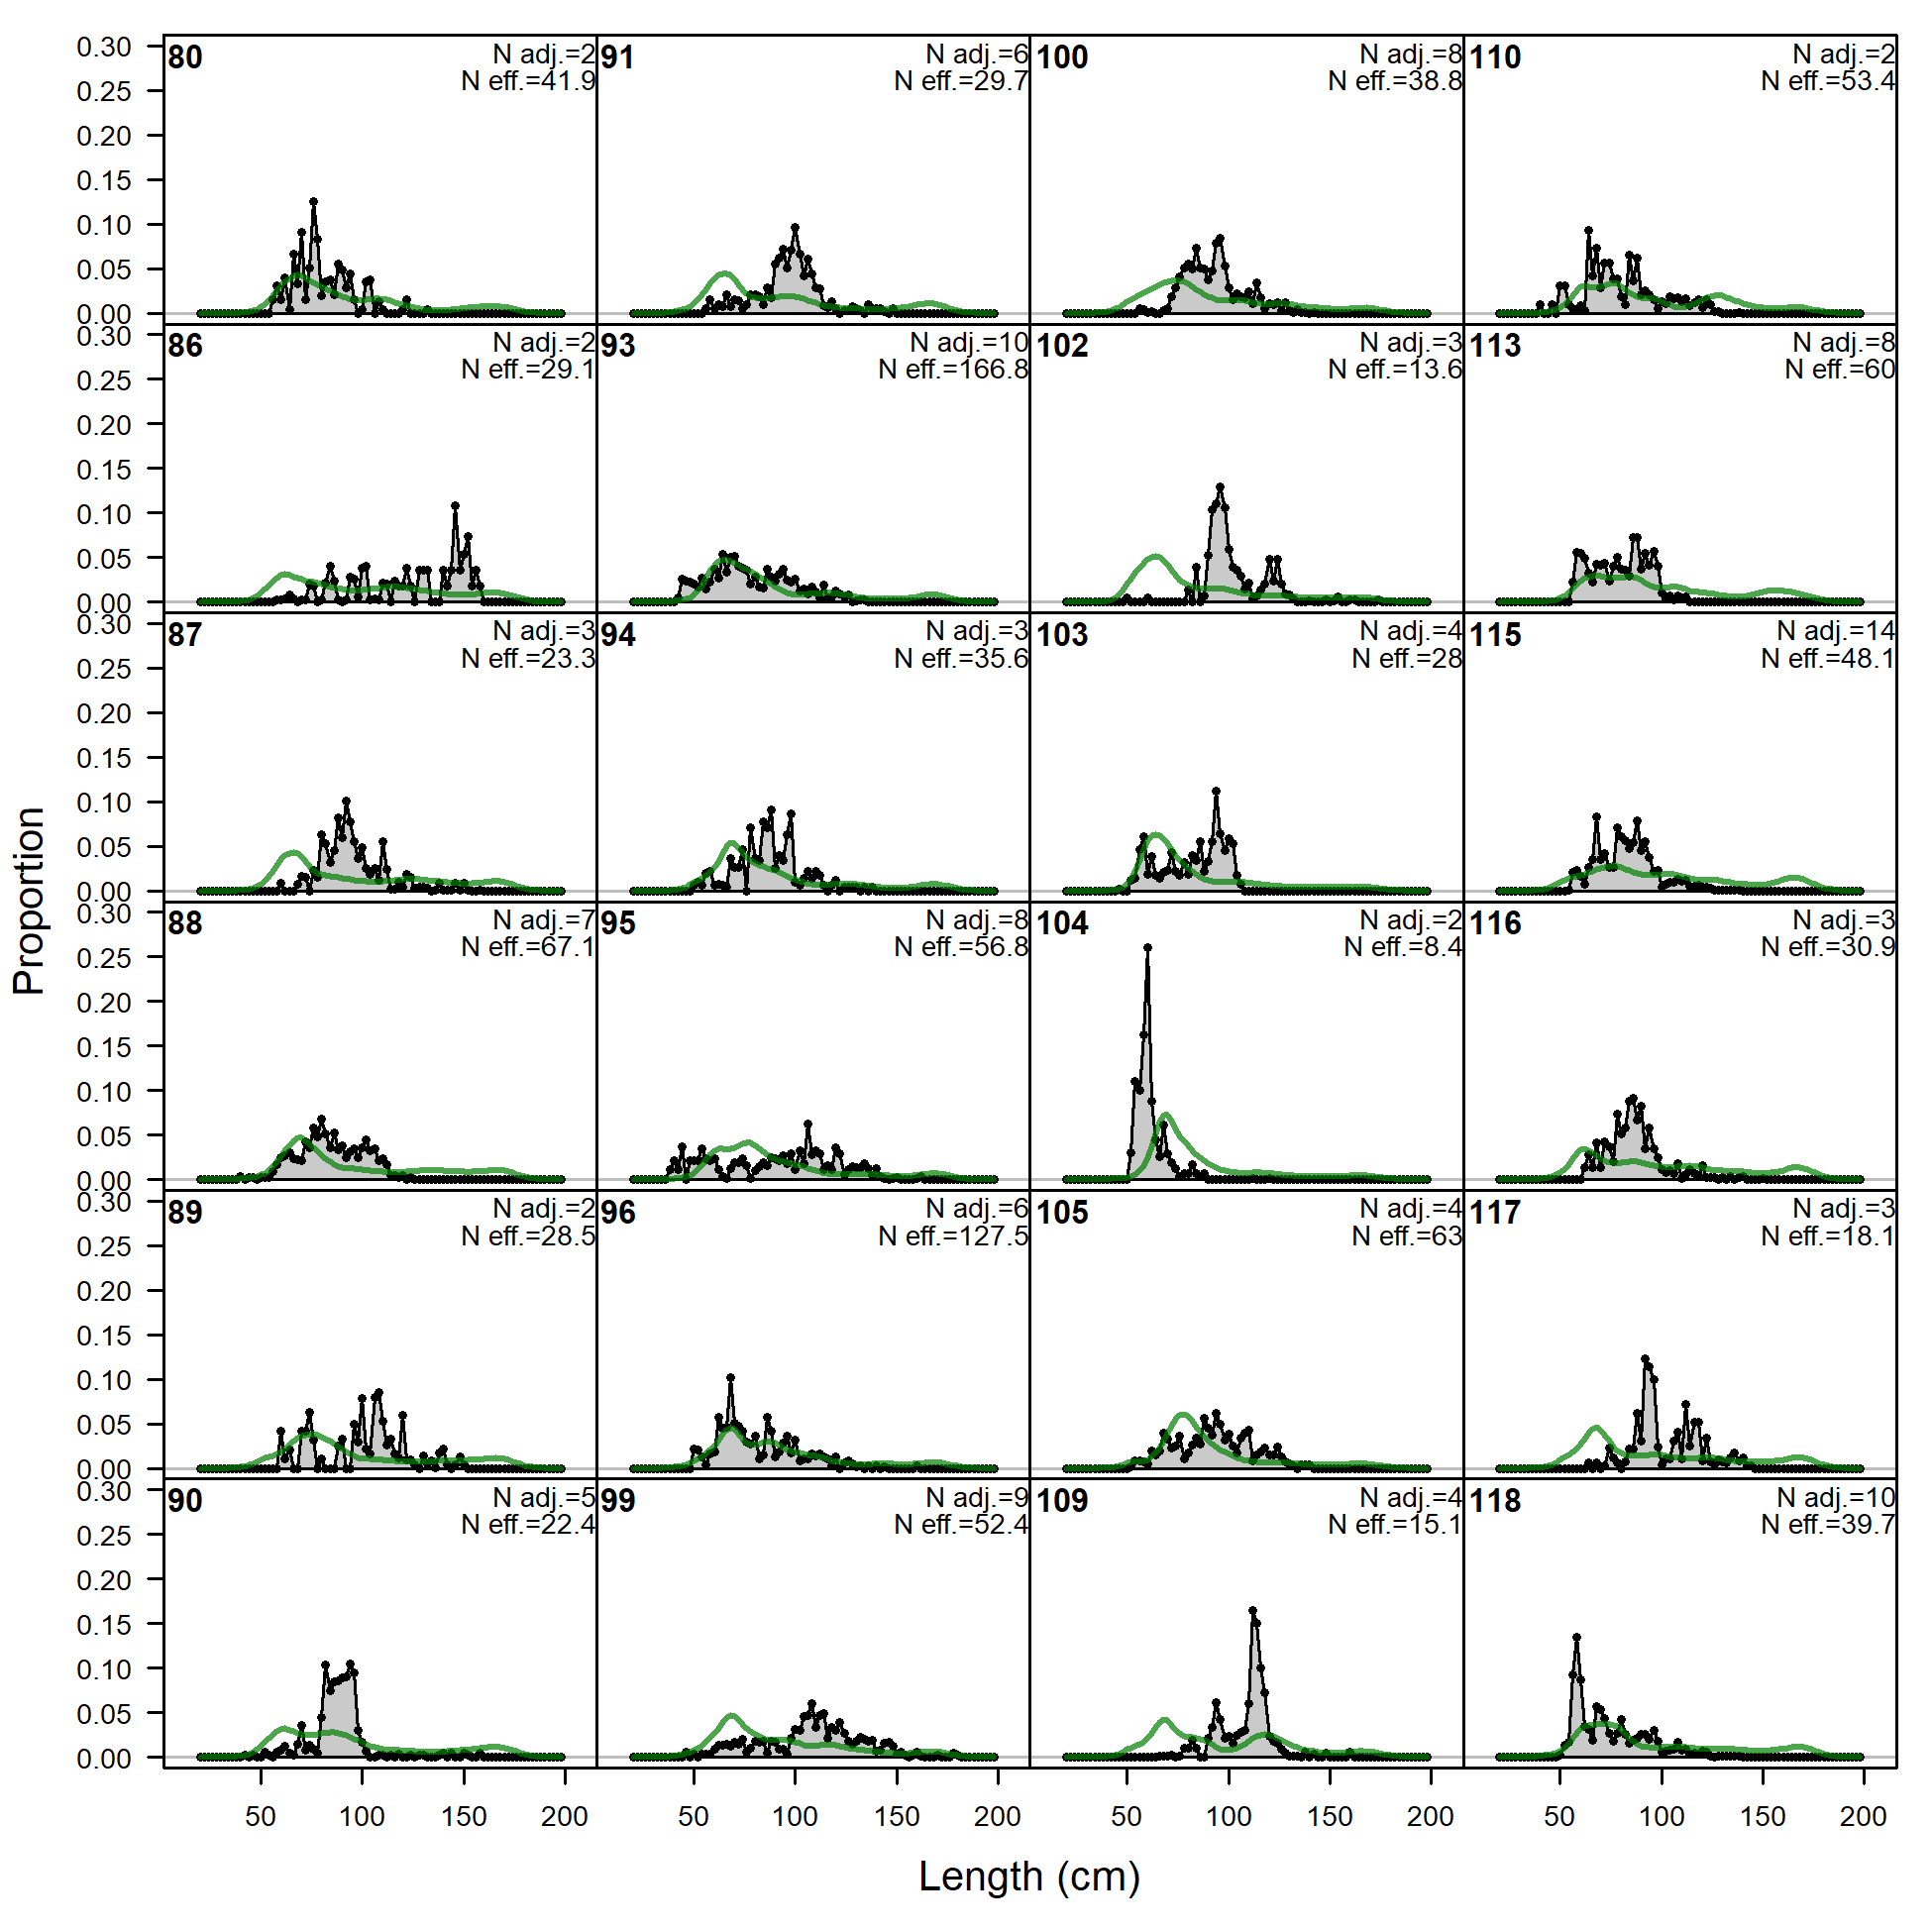
Length comps, whole catch, F5.OBJ.E.inshore (plot 1 of 5).
'N adj.' is the input sample size after data-weighting adjustment. N eff. is the calculated effective sample size used in the McAllister-Ianelli tuning method.
file: comp_lenfit_flt5mkt0_page1.png
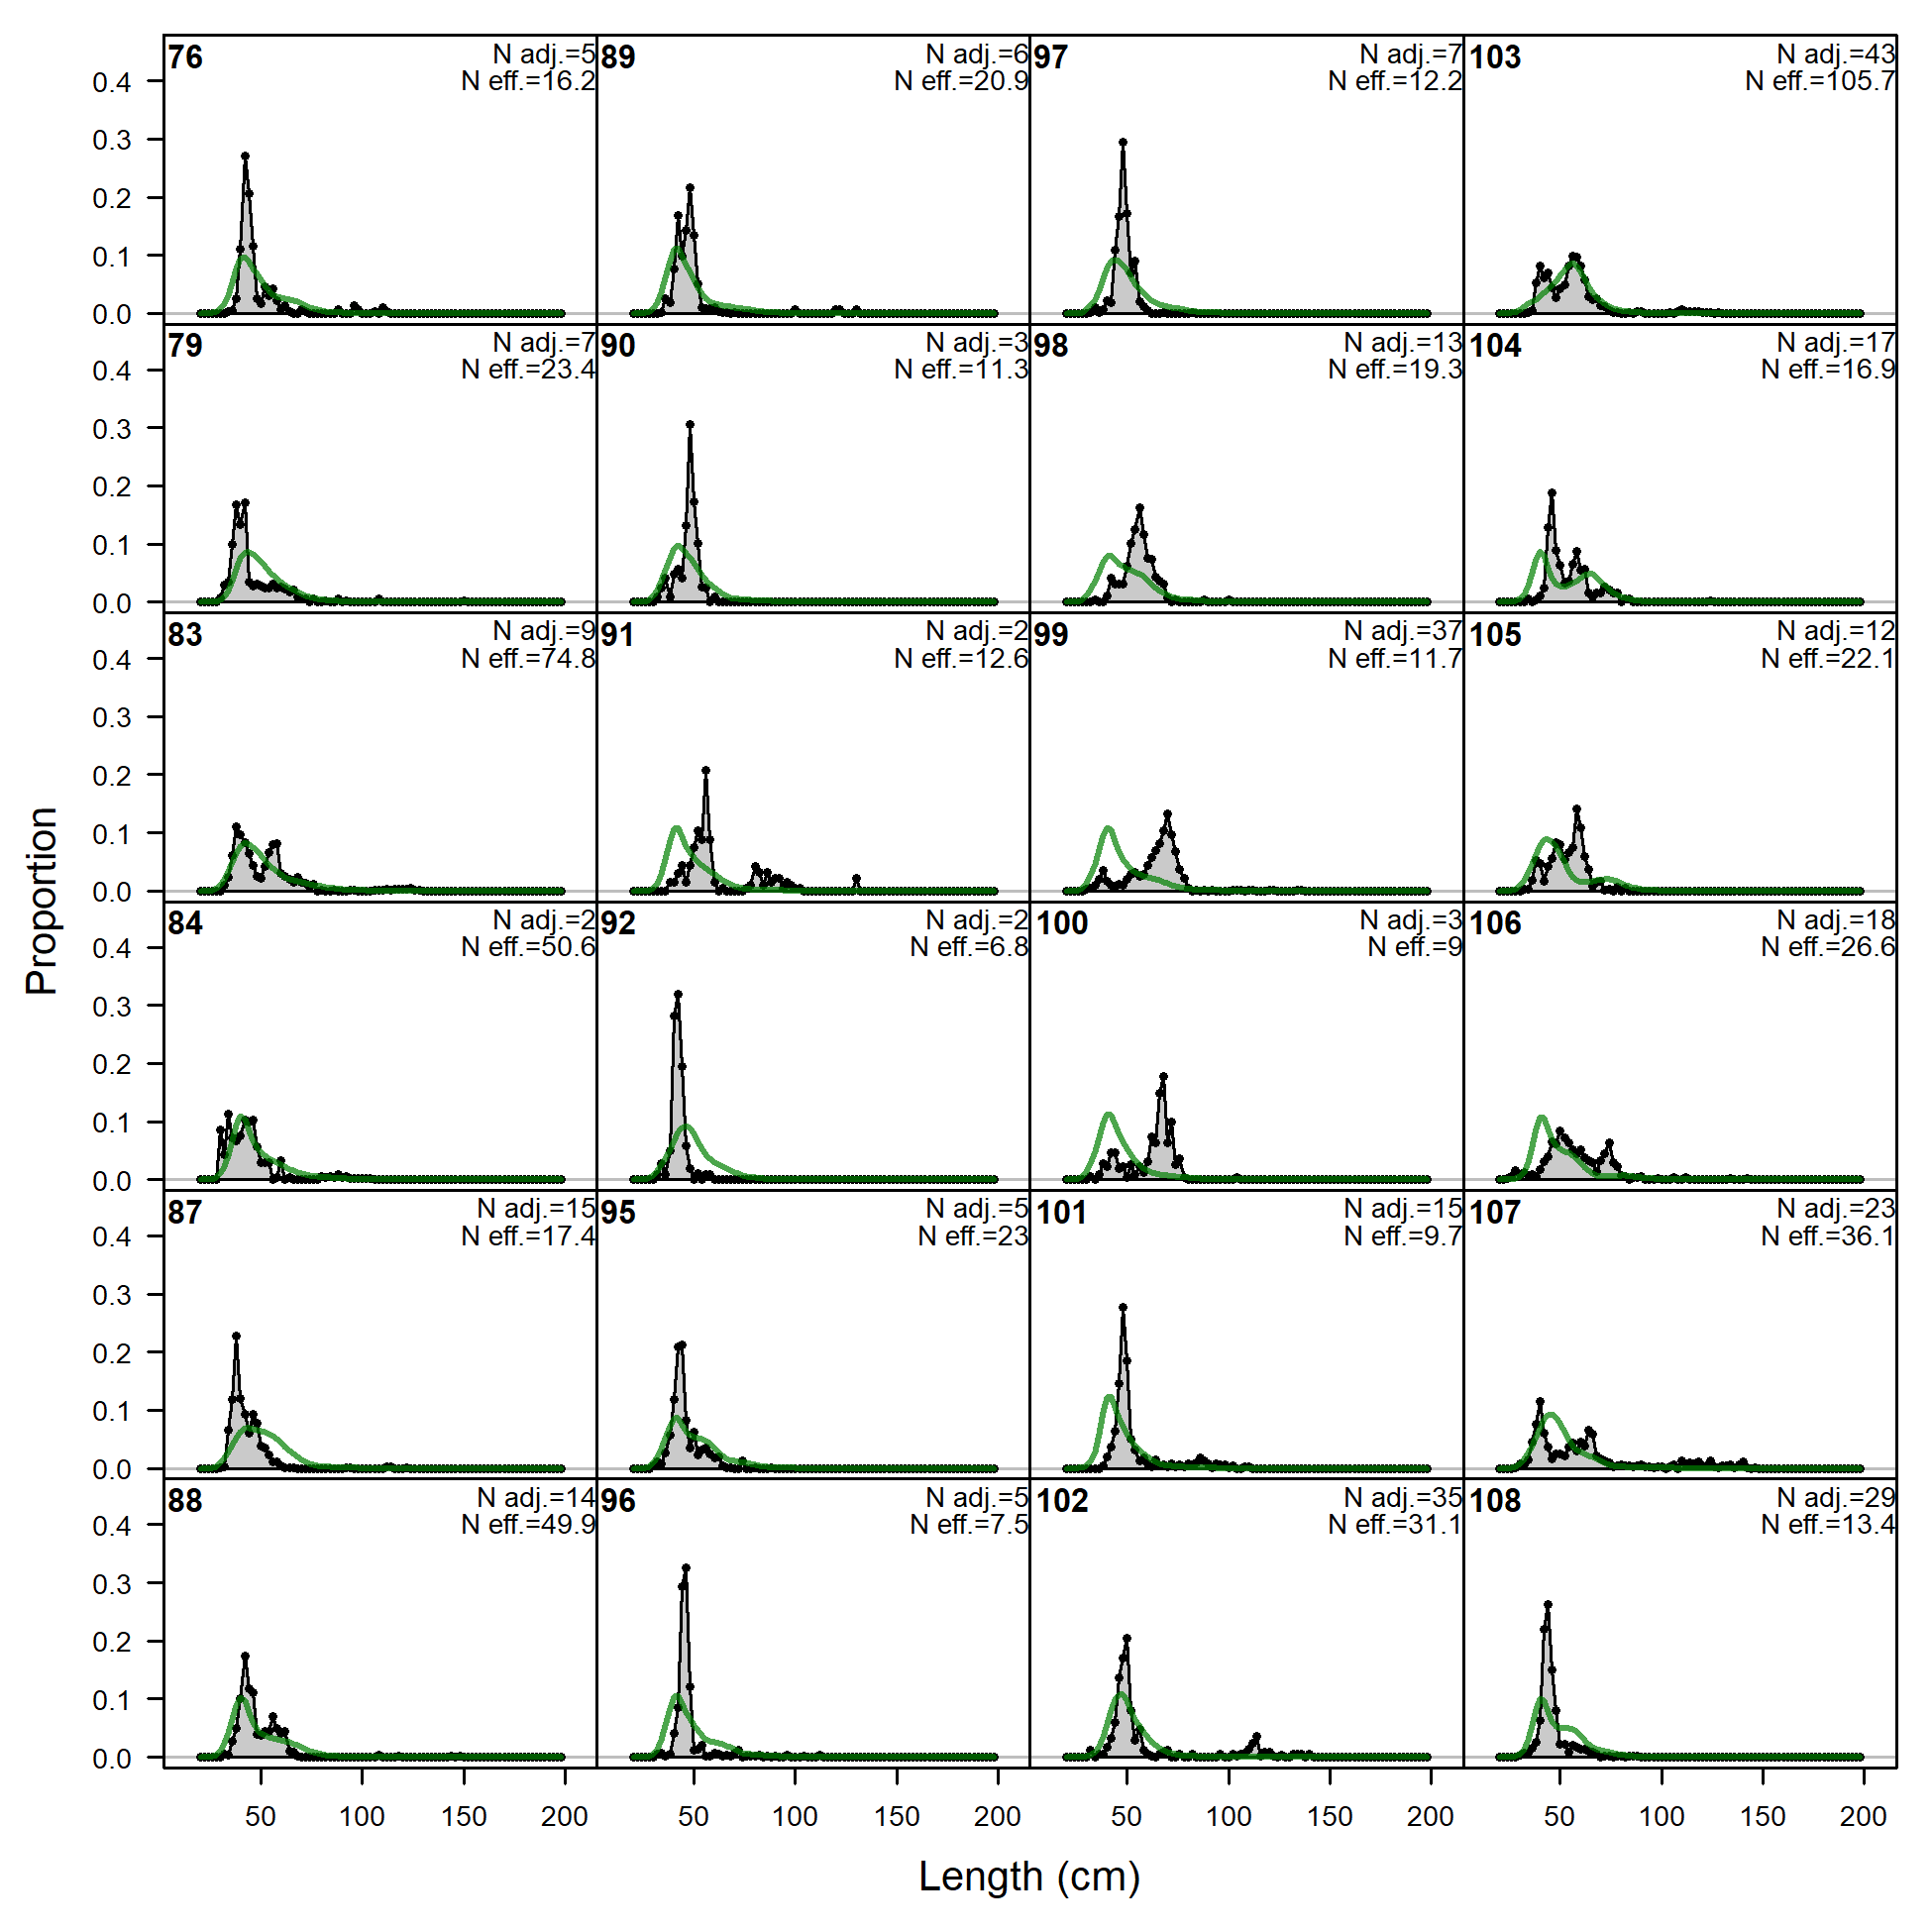
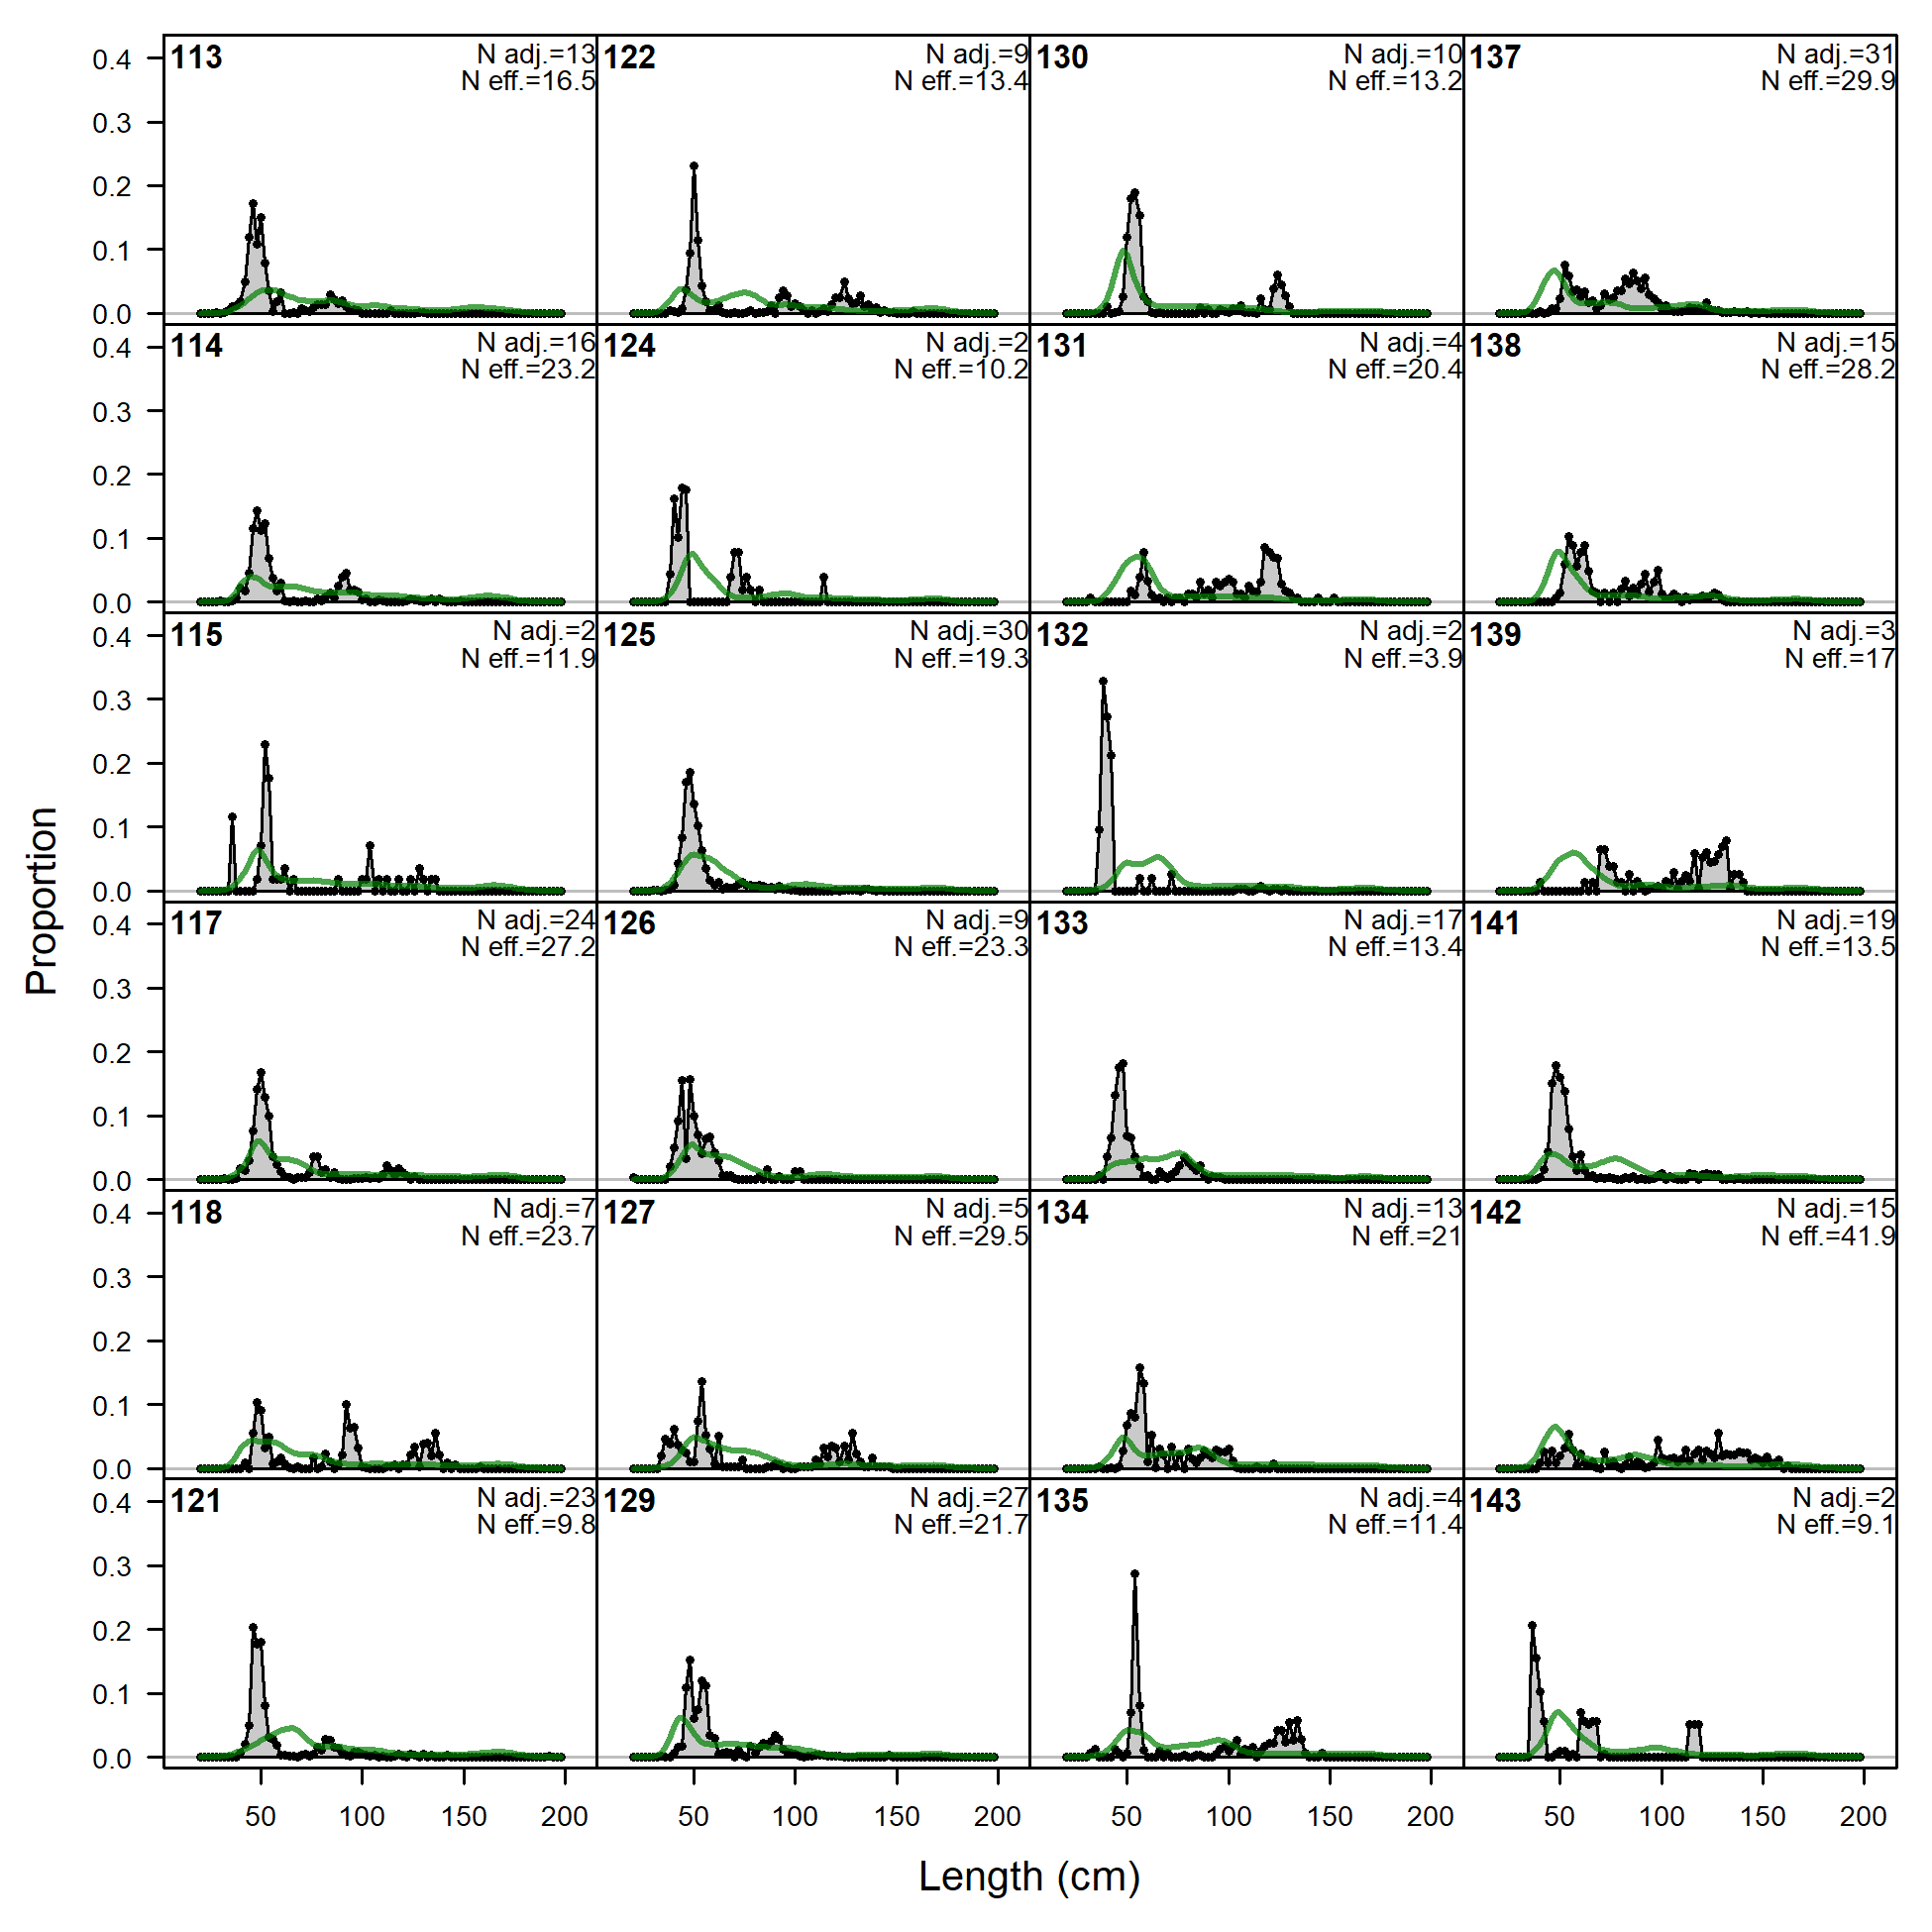
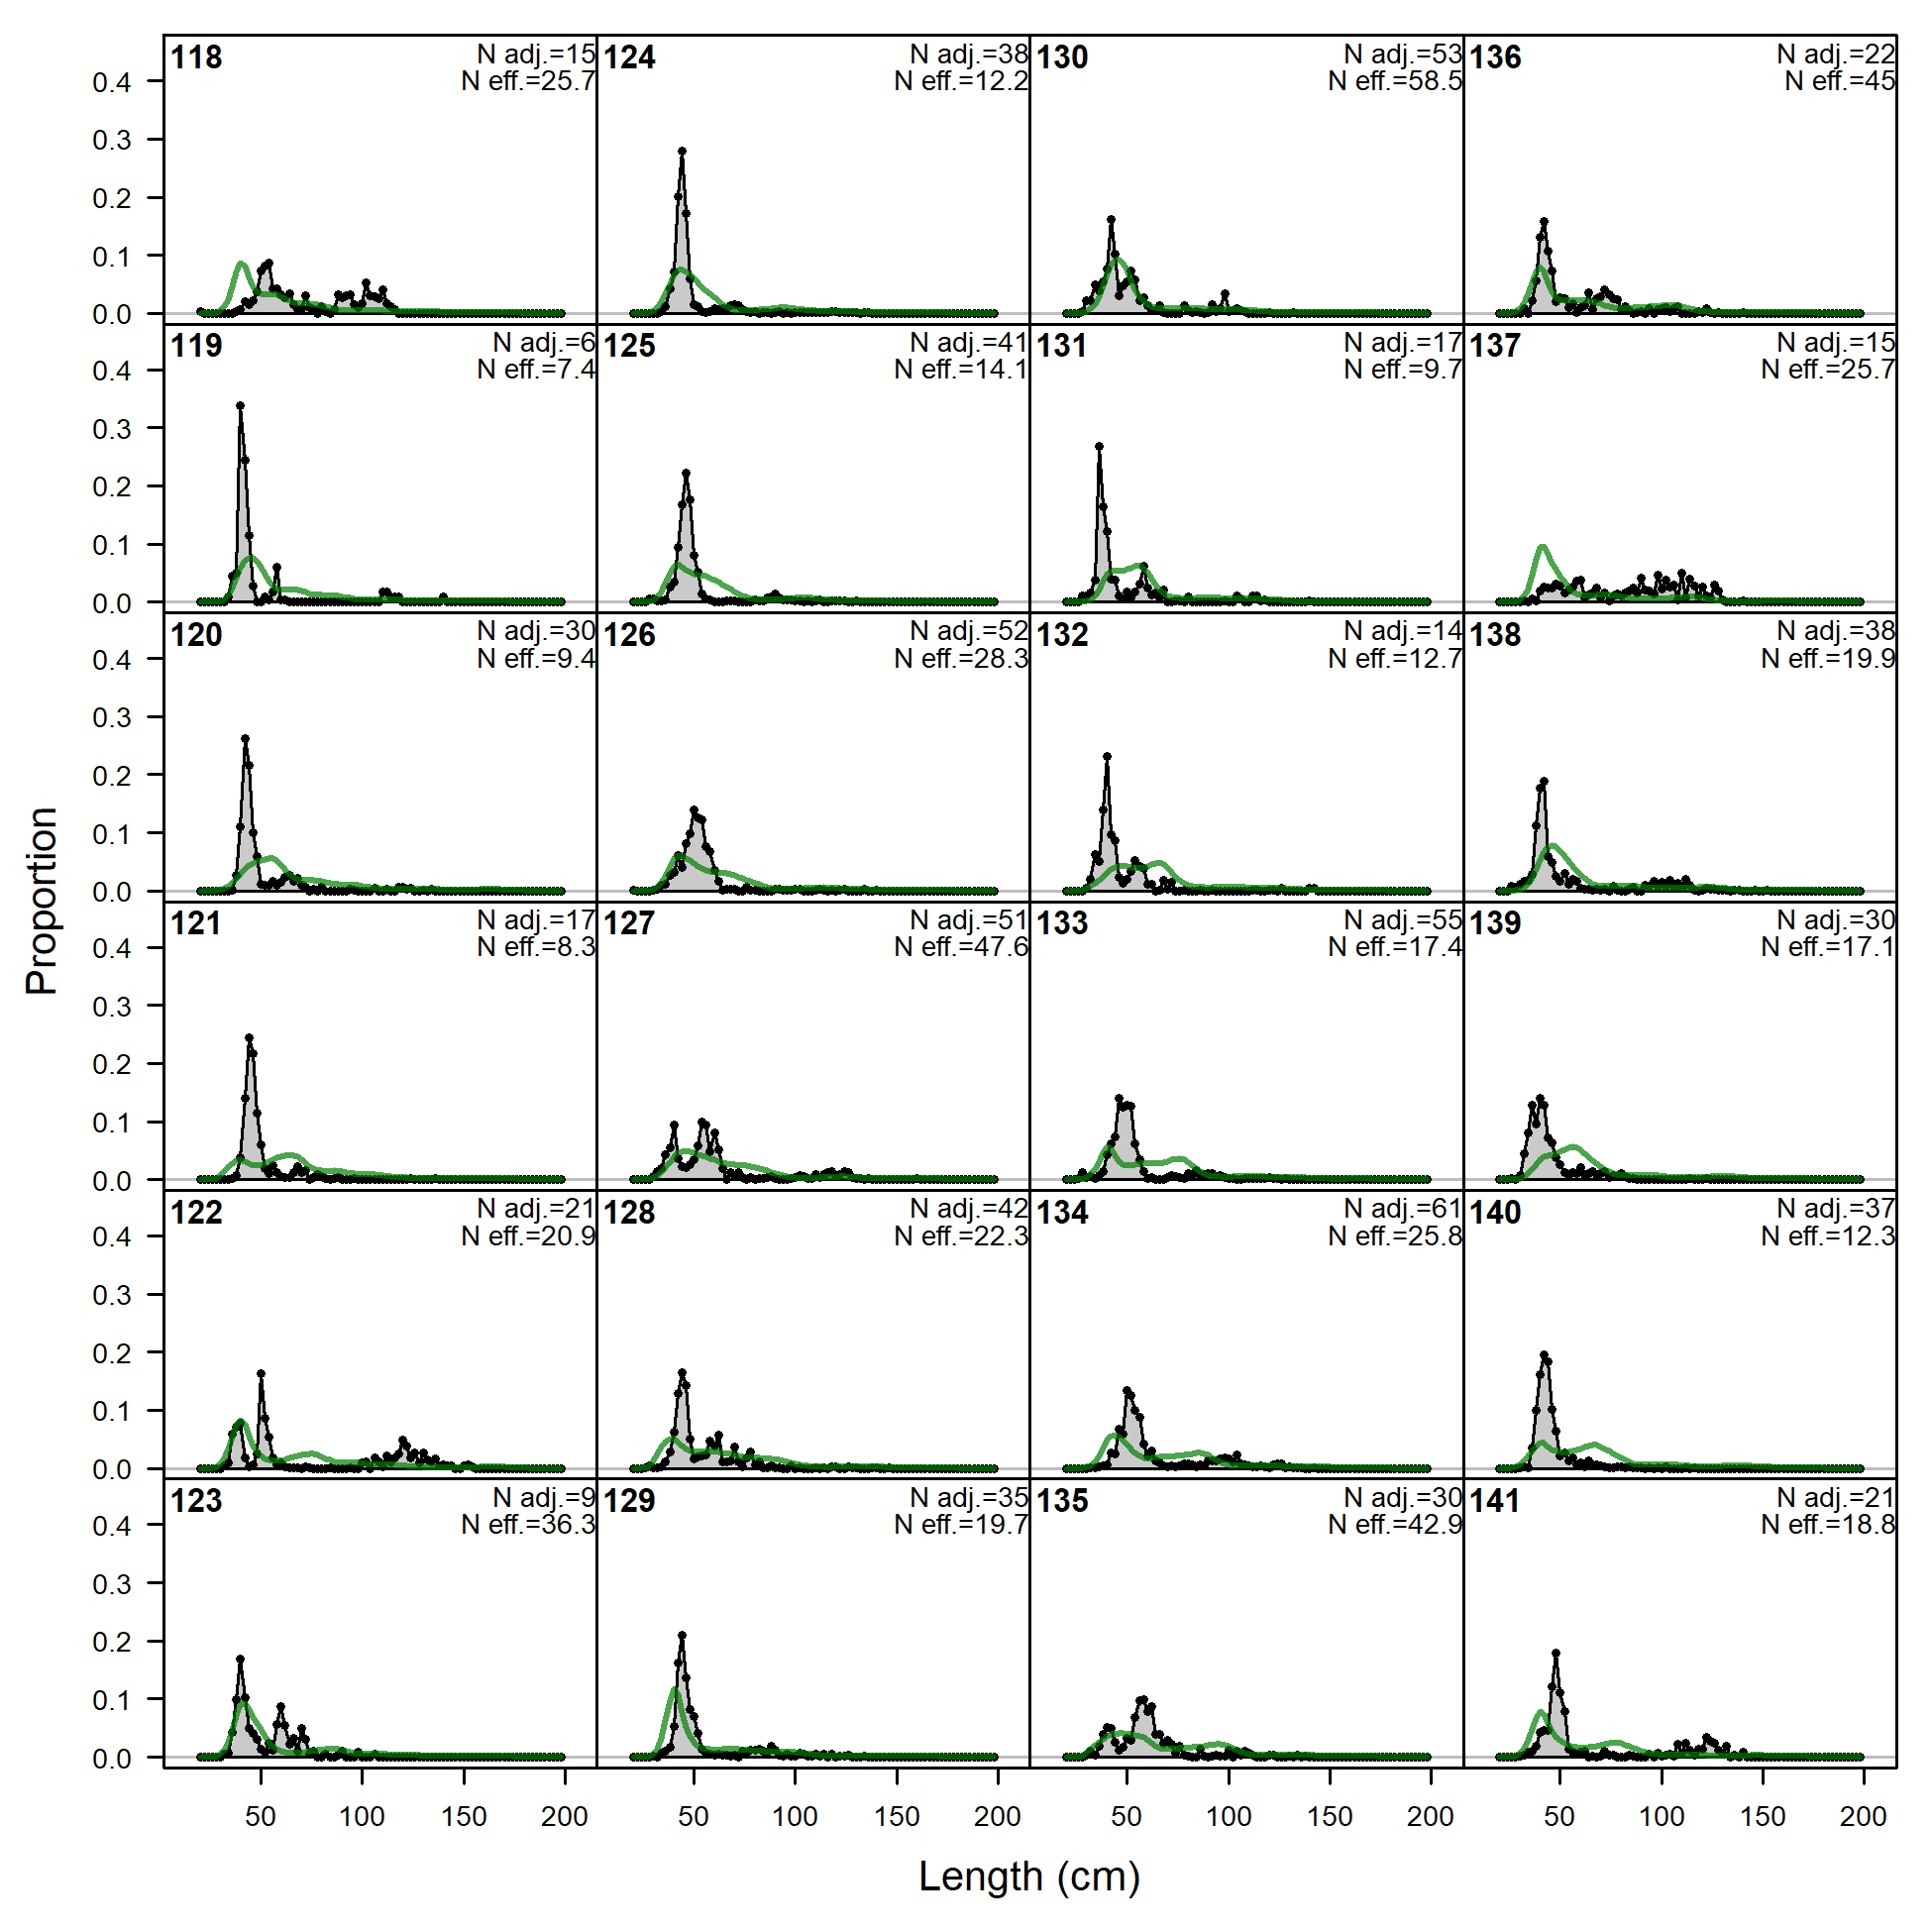
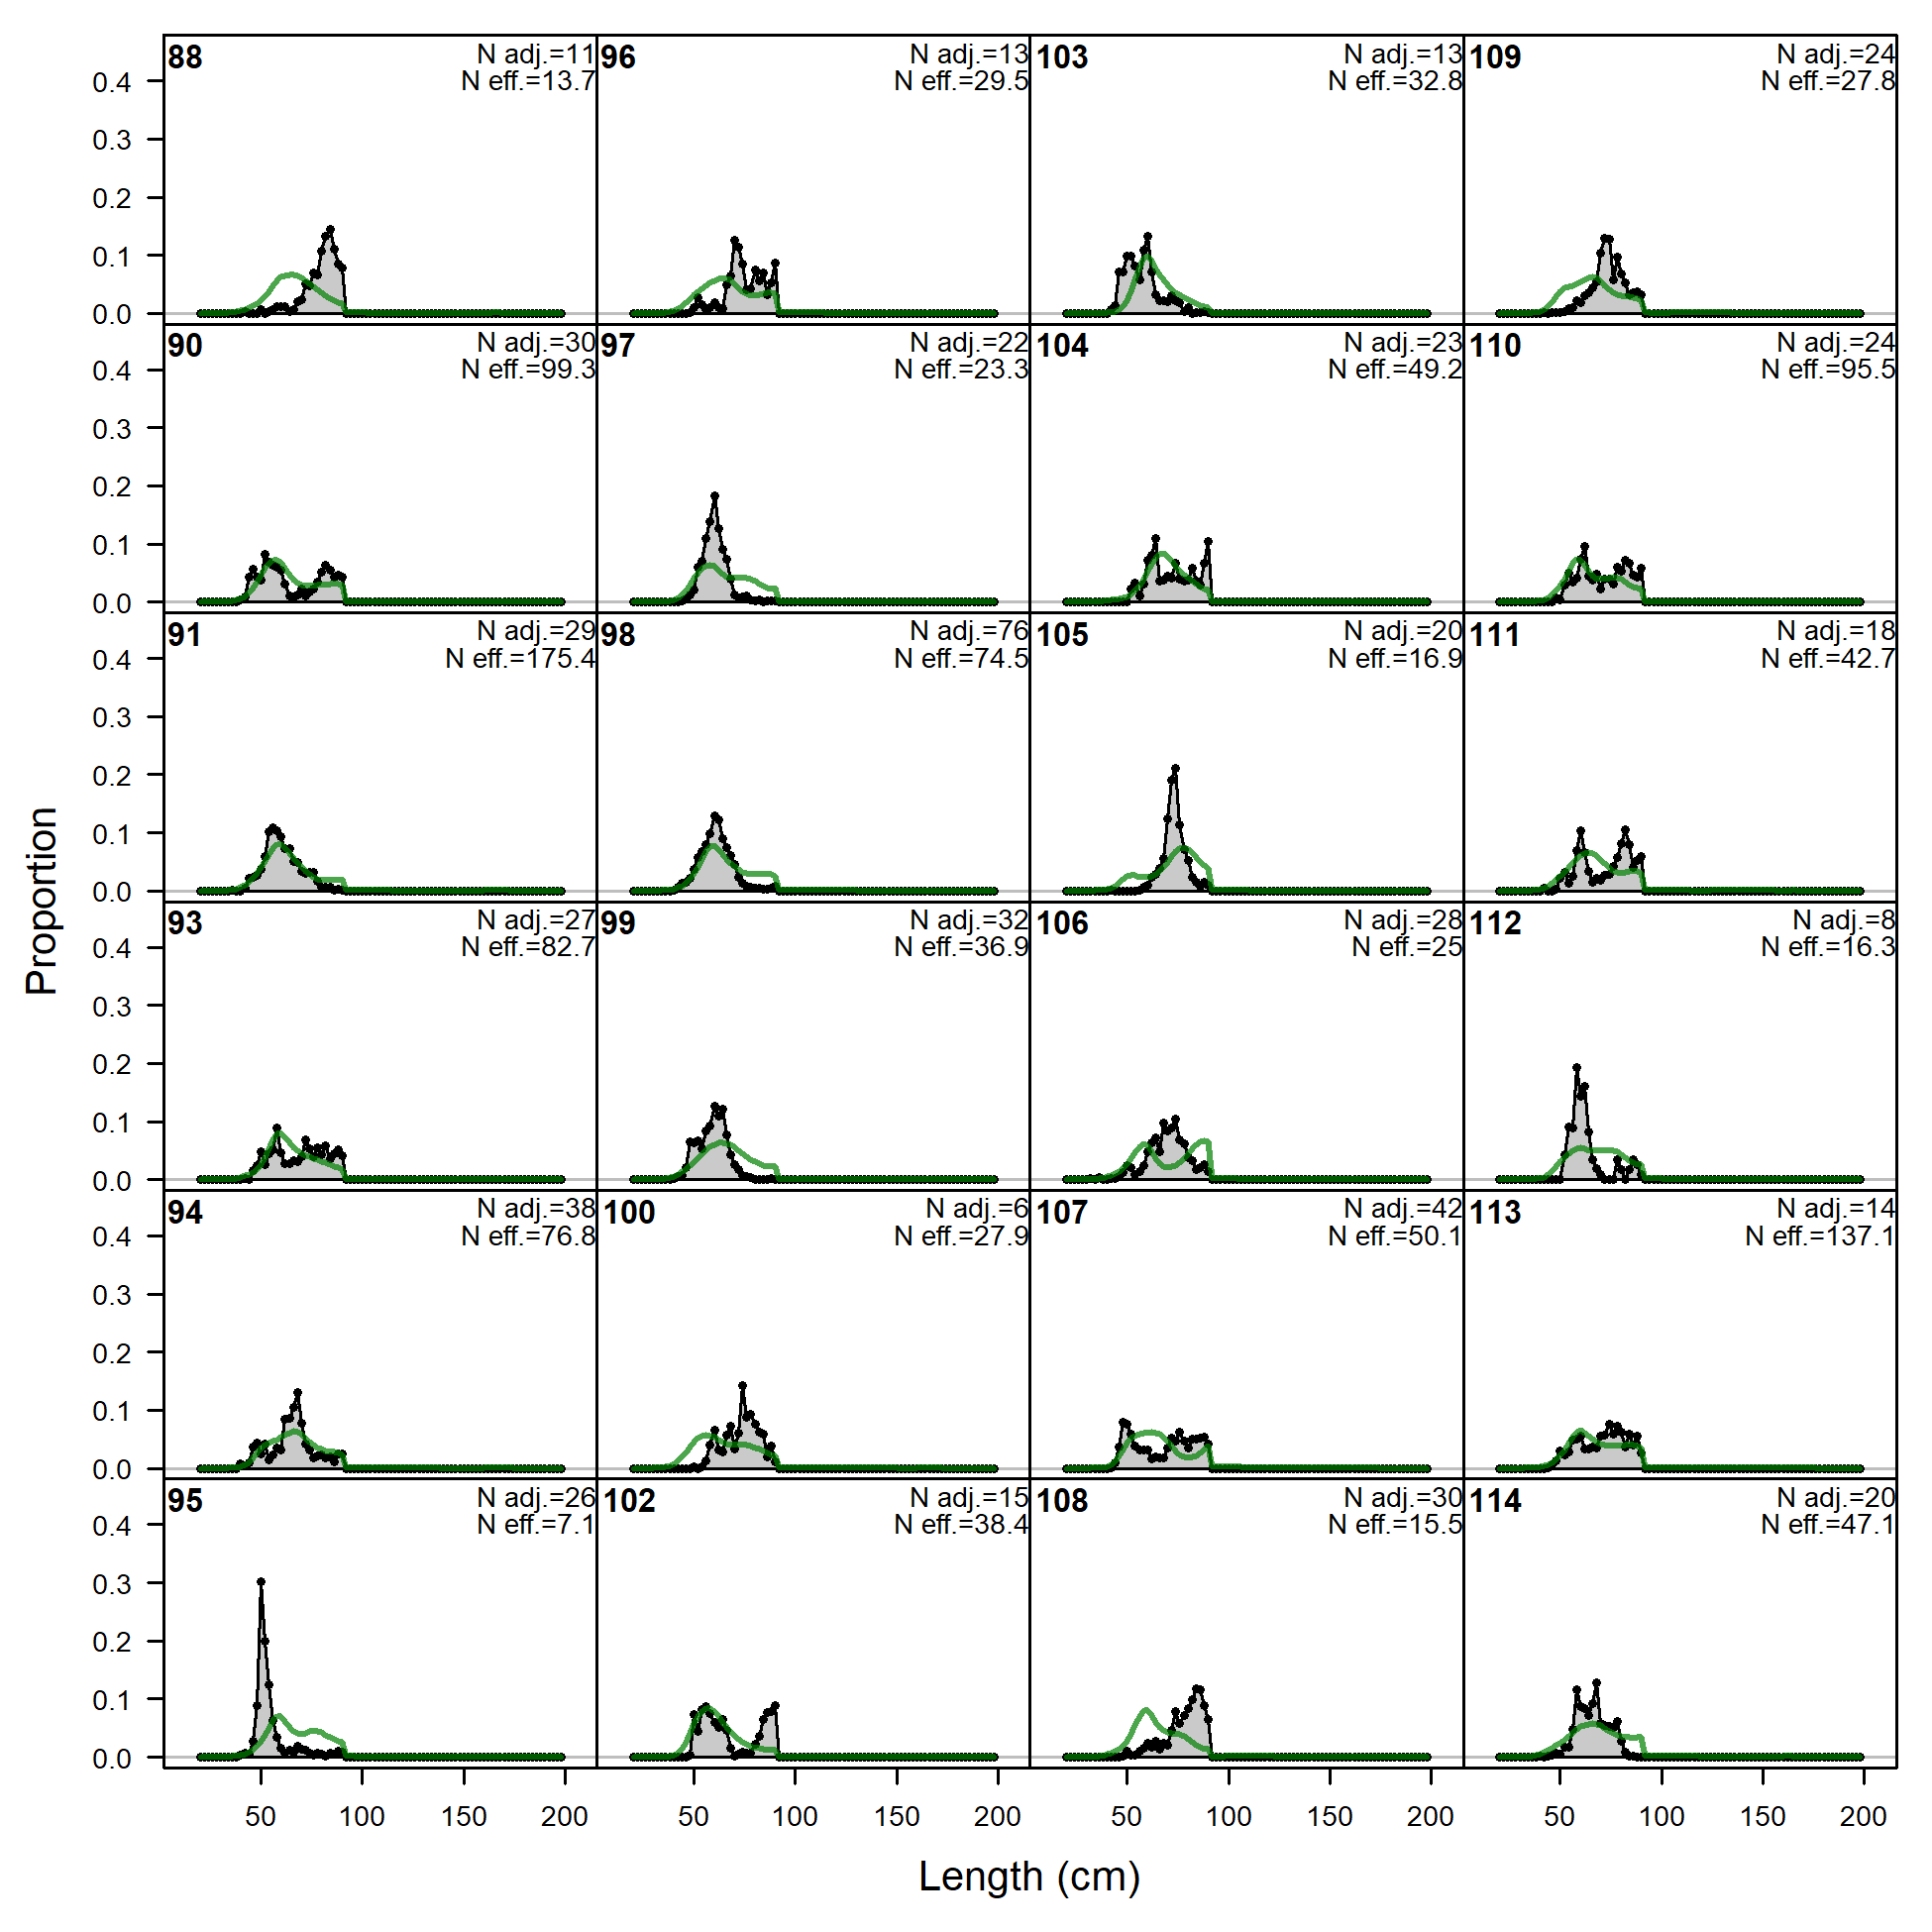
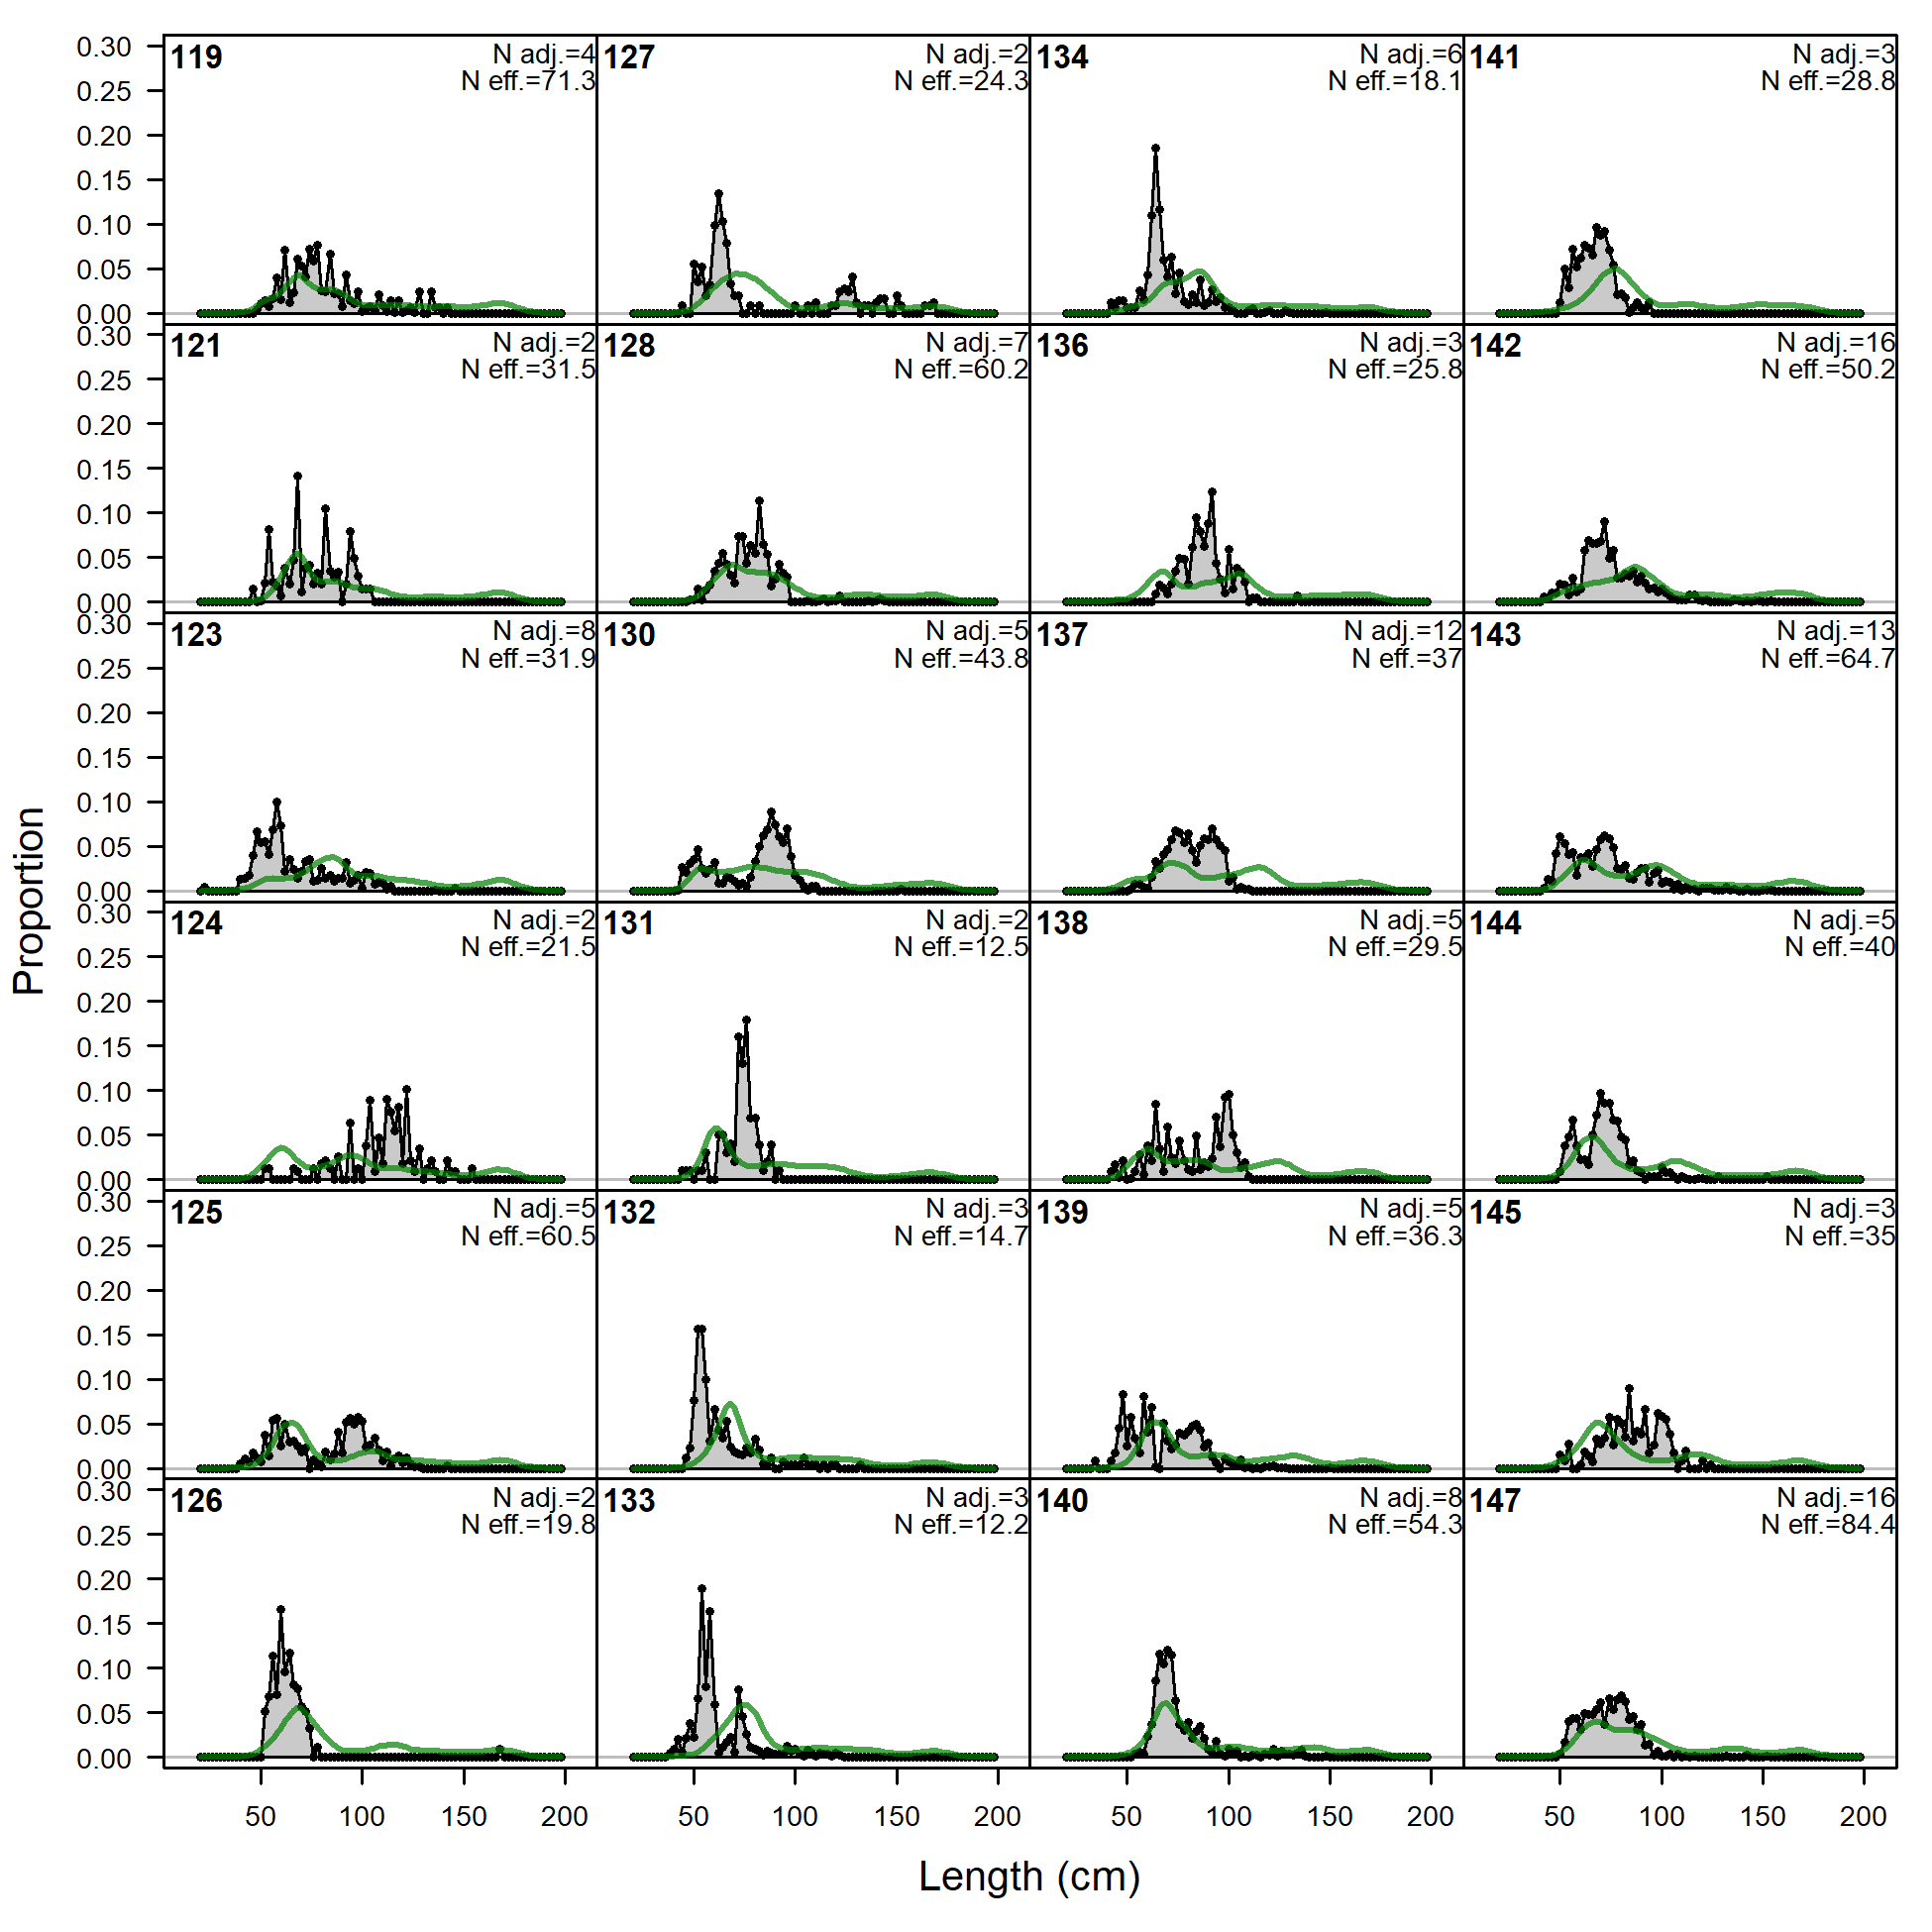
Length comps, whole catch, F5.OBJ.E.inshore (plot 1 of 5).
'N adj.' is the input sample size after data-weighting adjustment. N eff. is the calculated effective sample size used in the McAllister-Ianelli tuning method. (plot 2 of 5)
file: comp_lenfit_flt5mkt0_page2.png
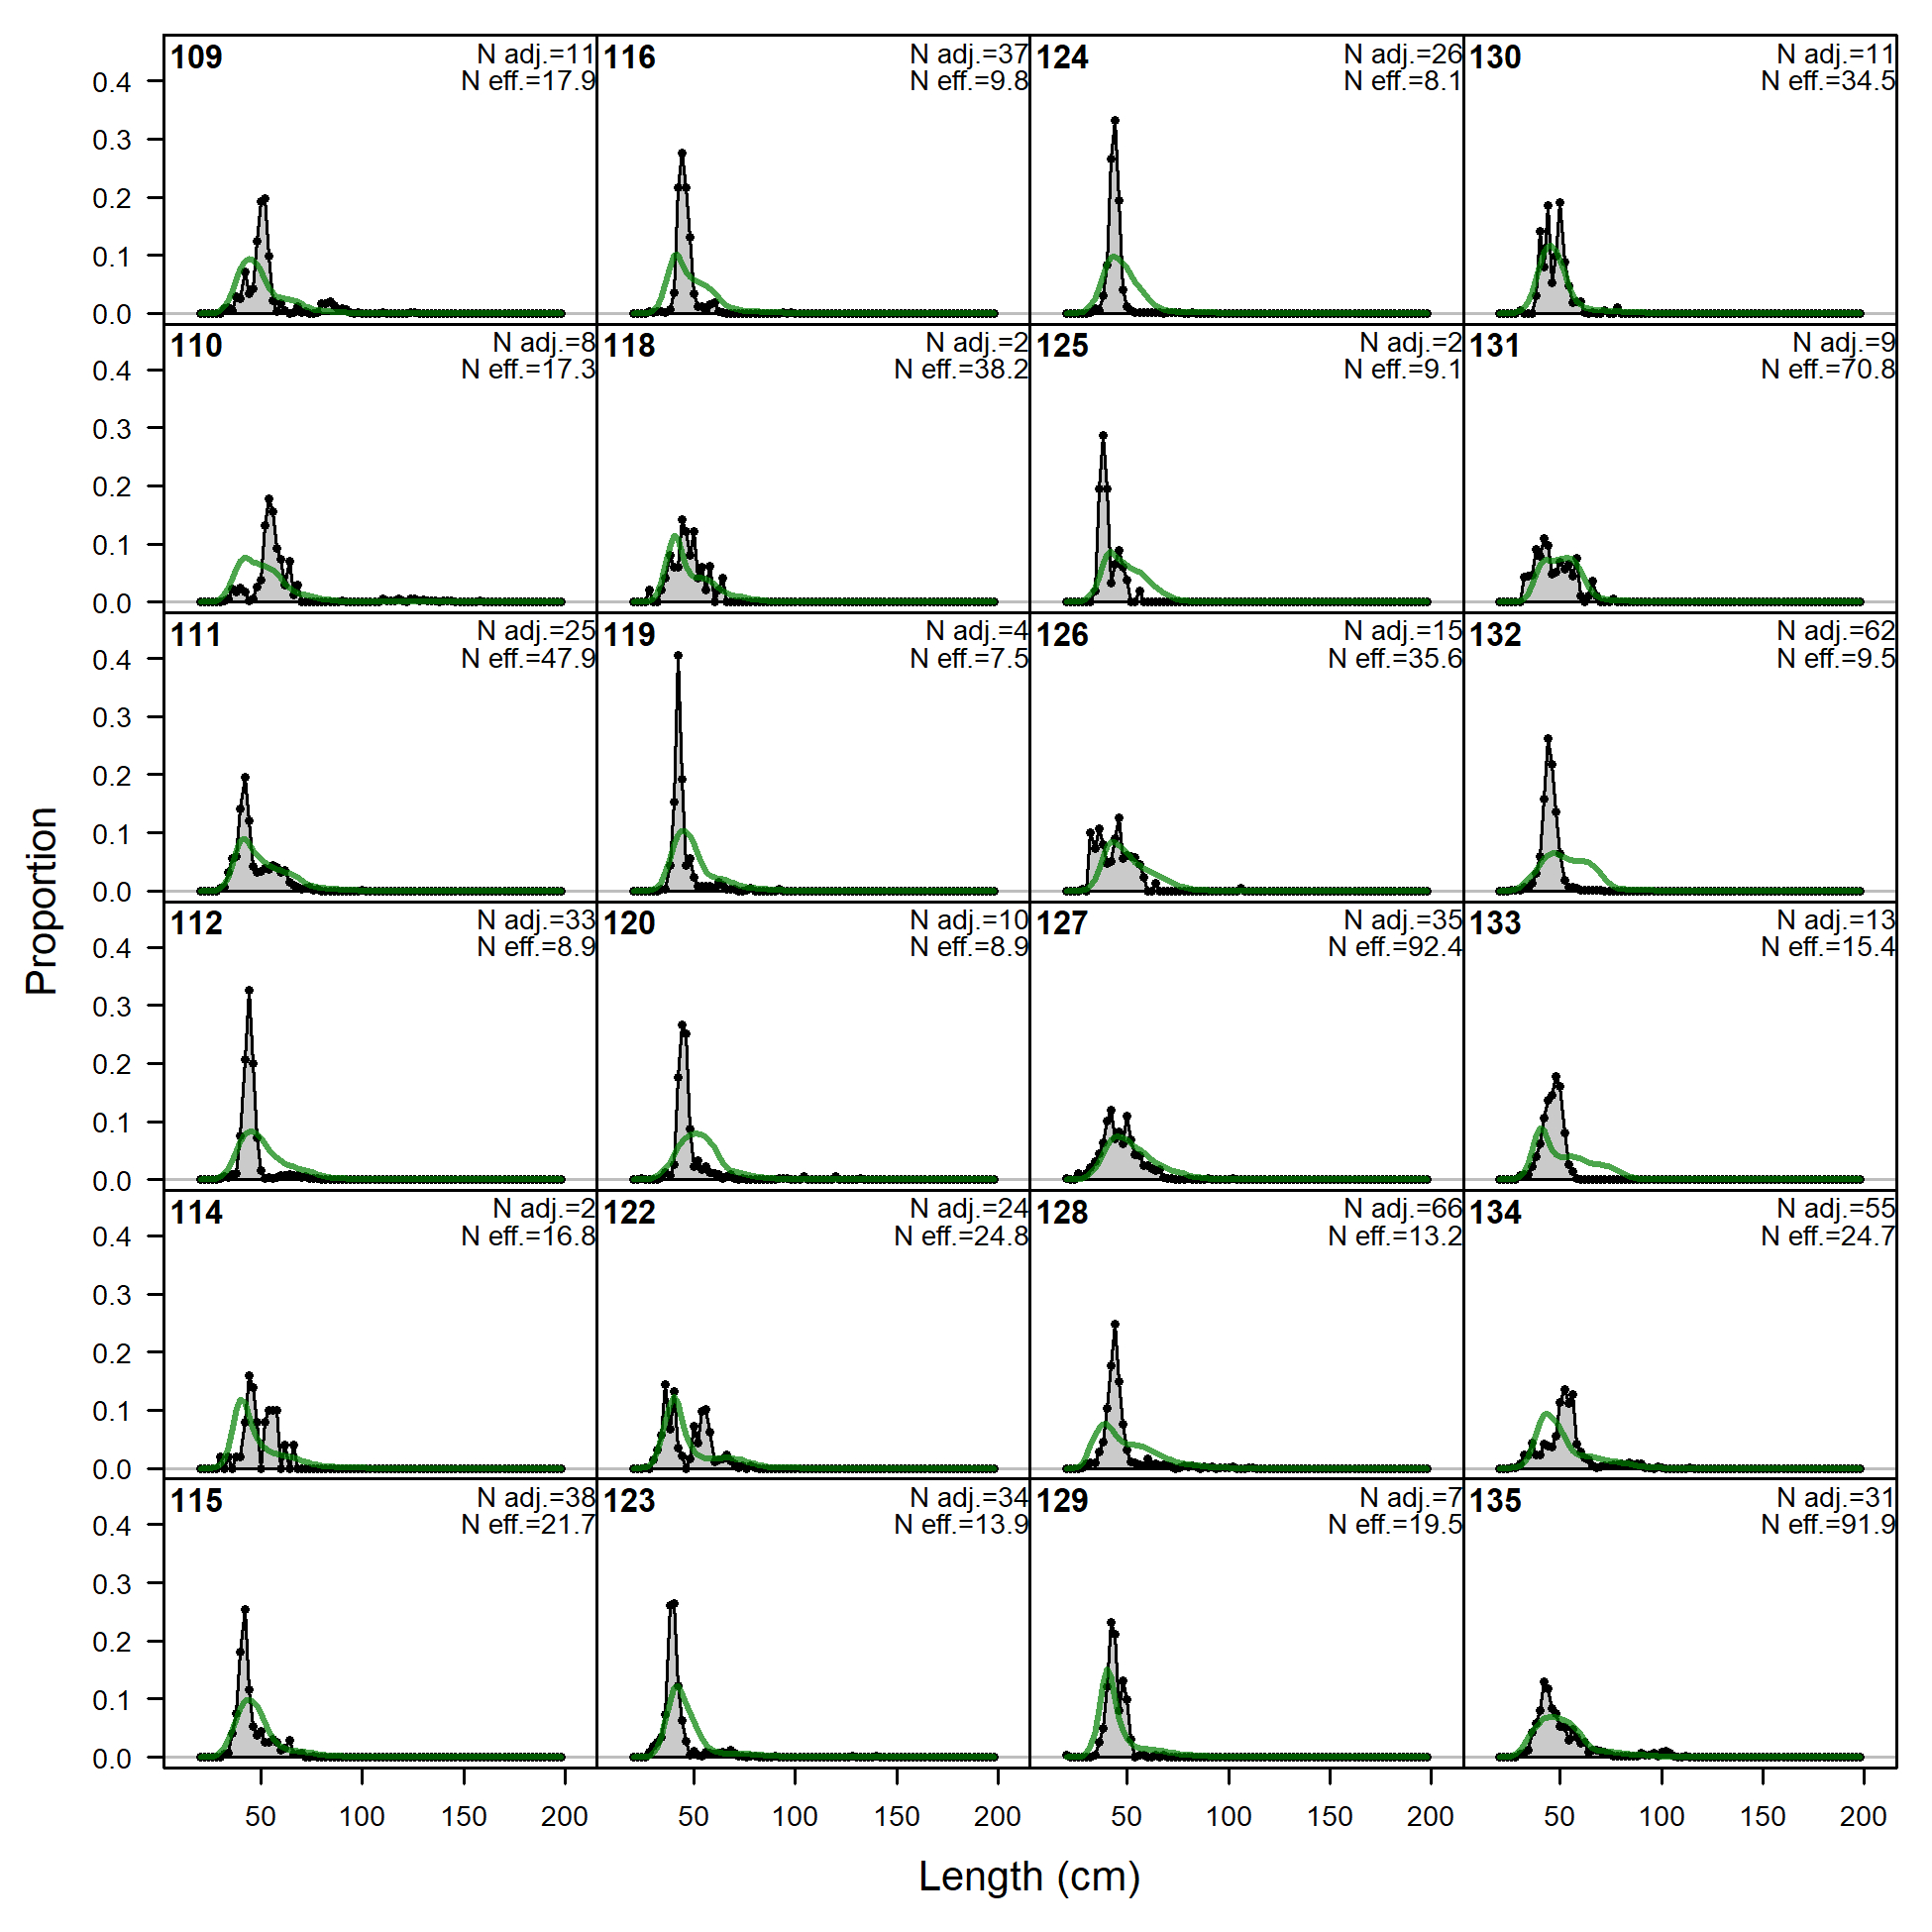
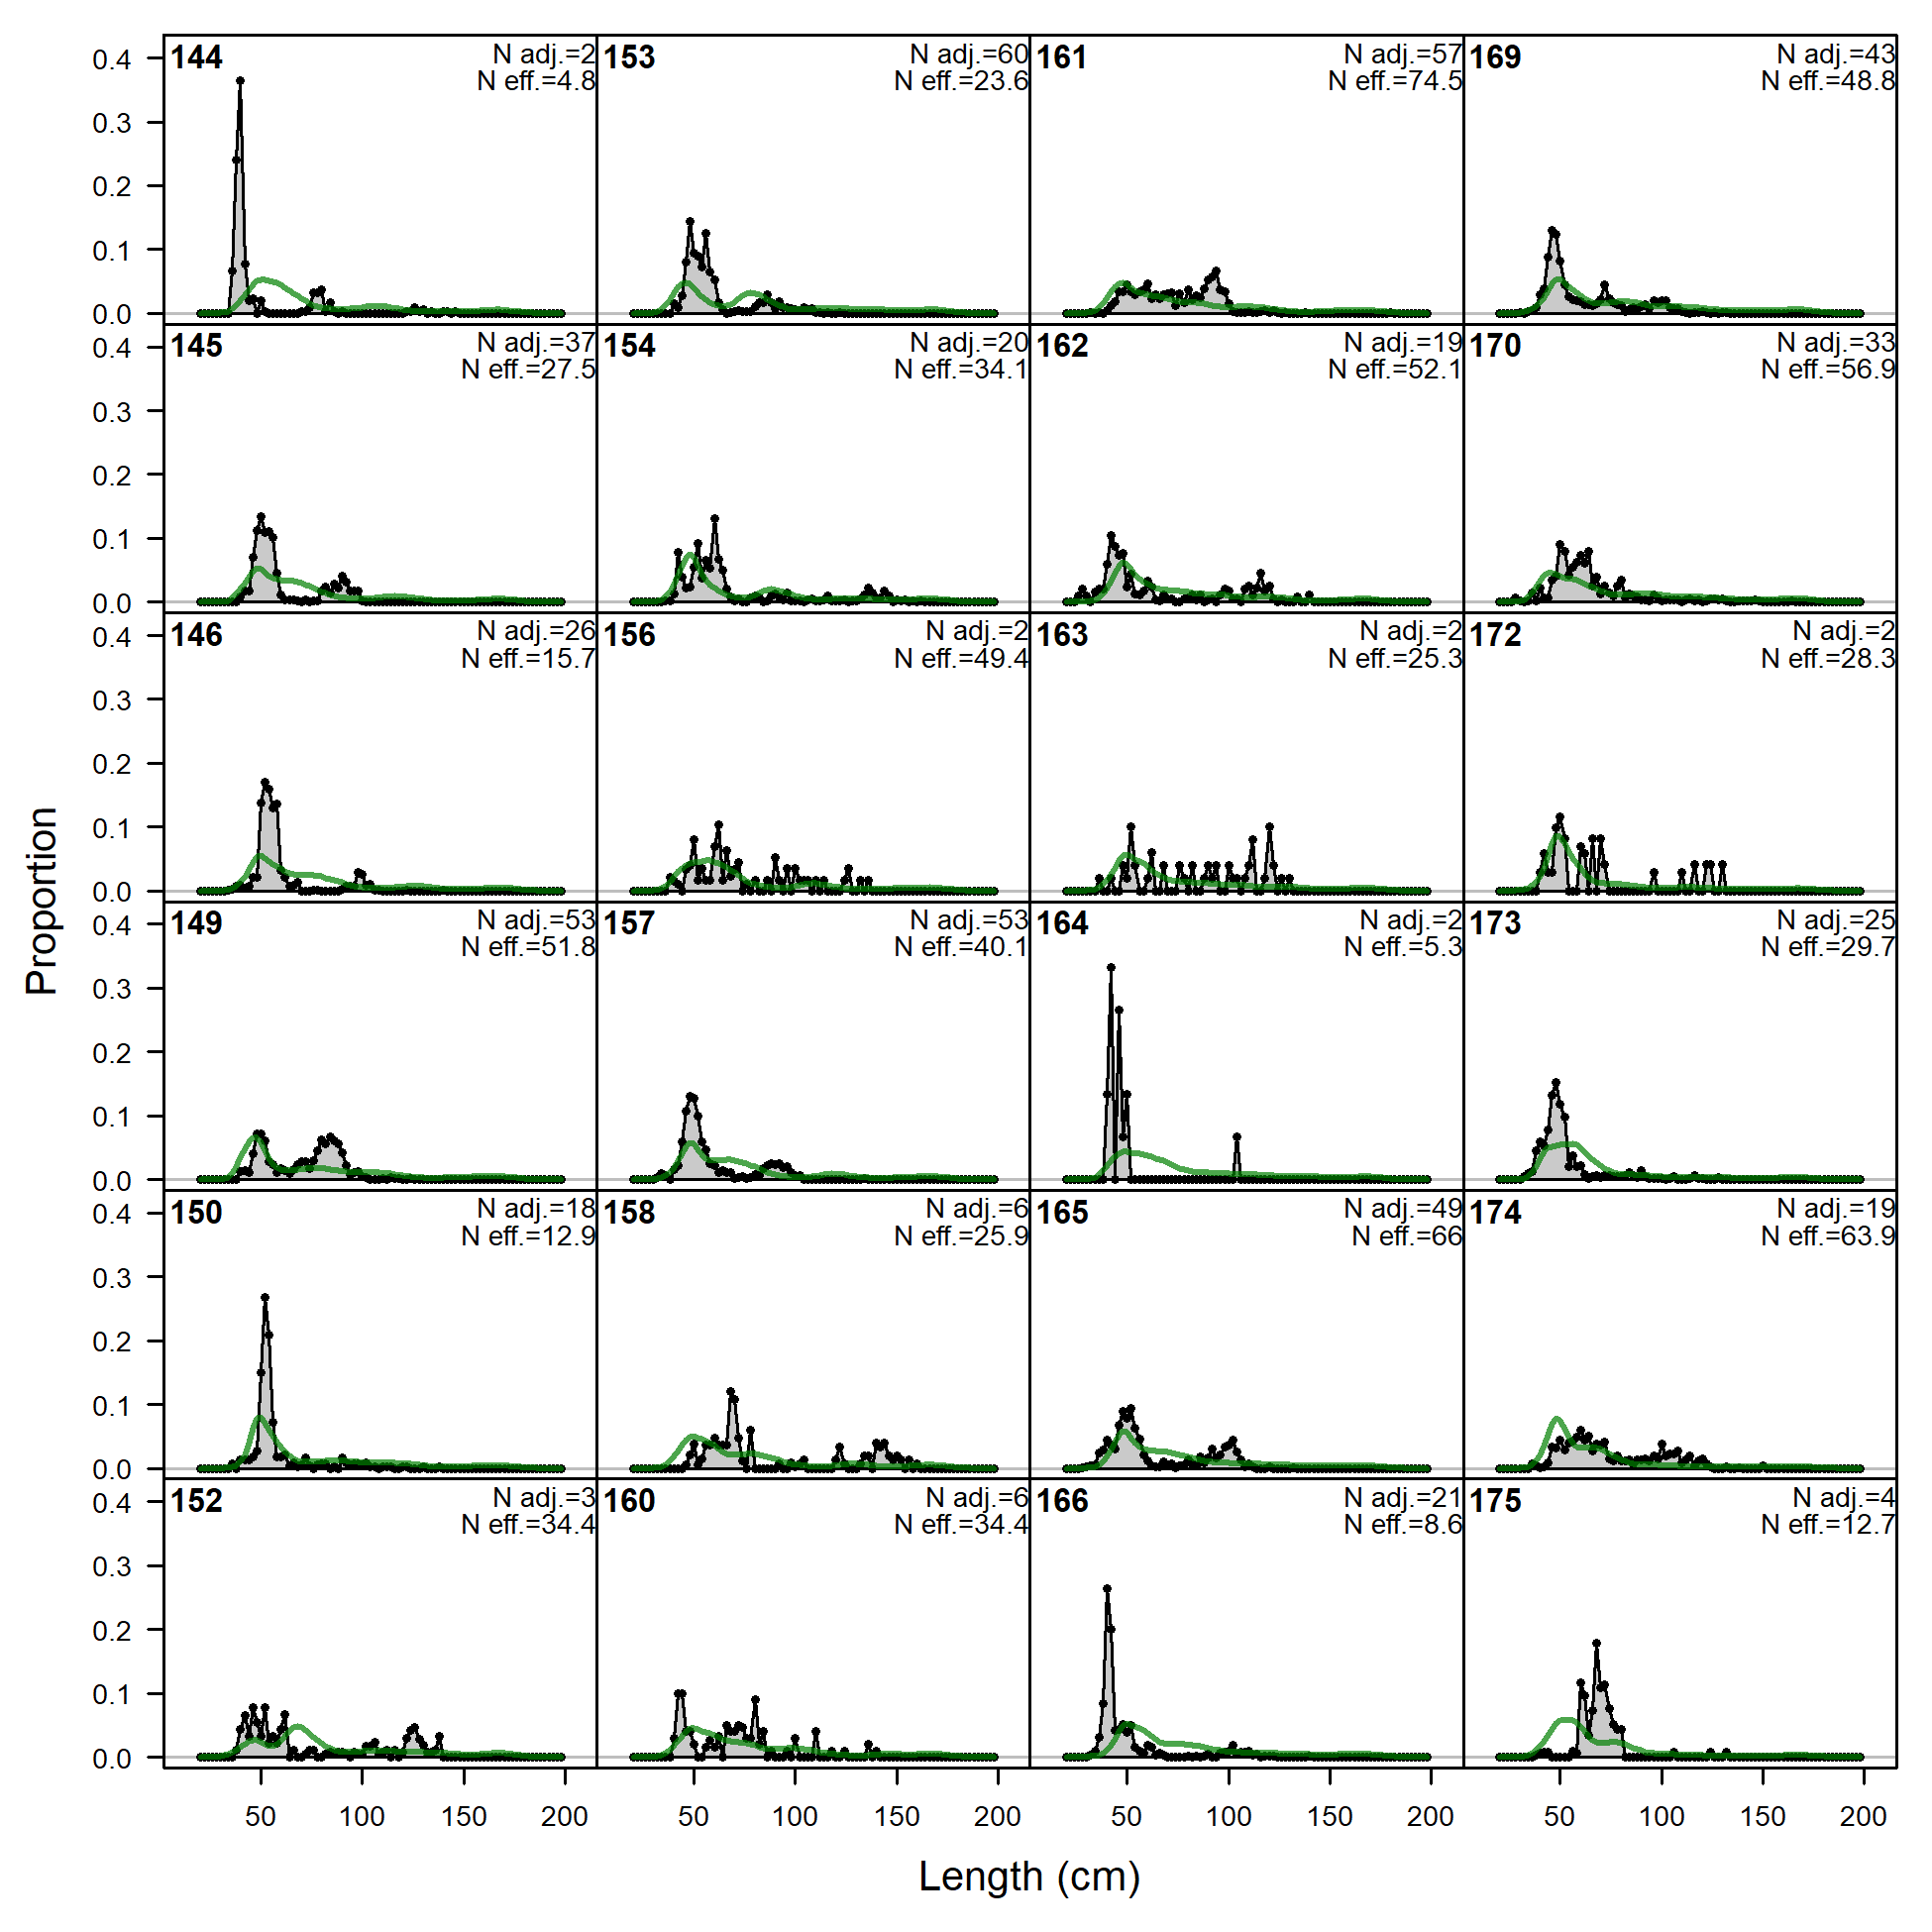
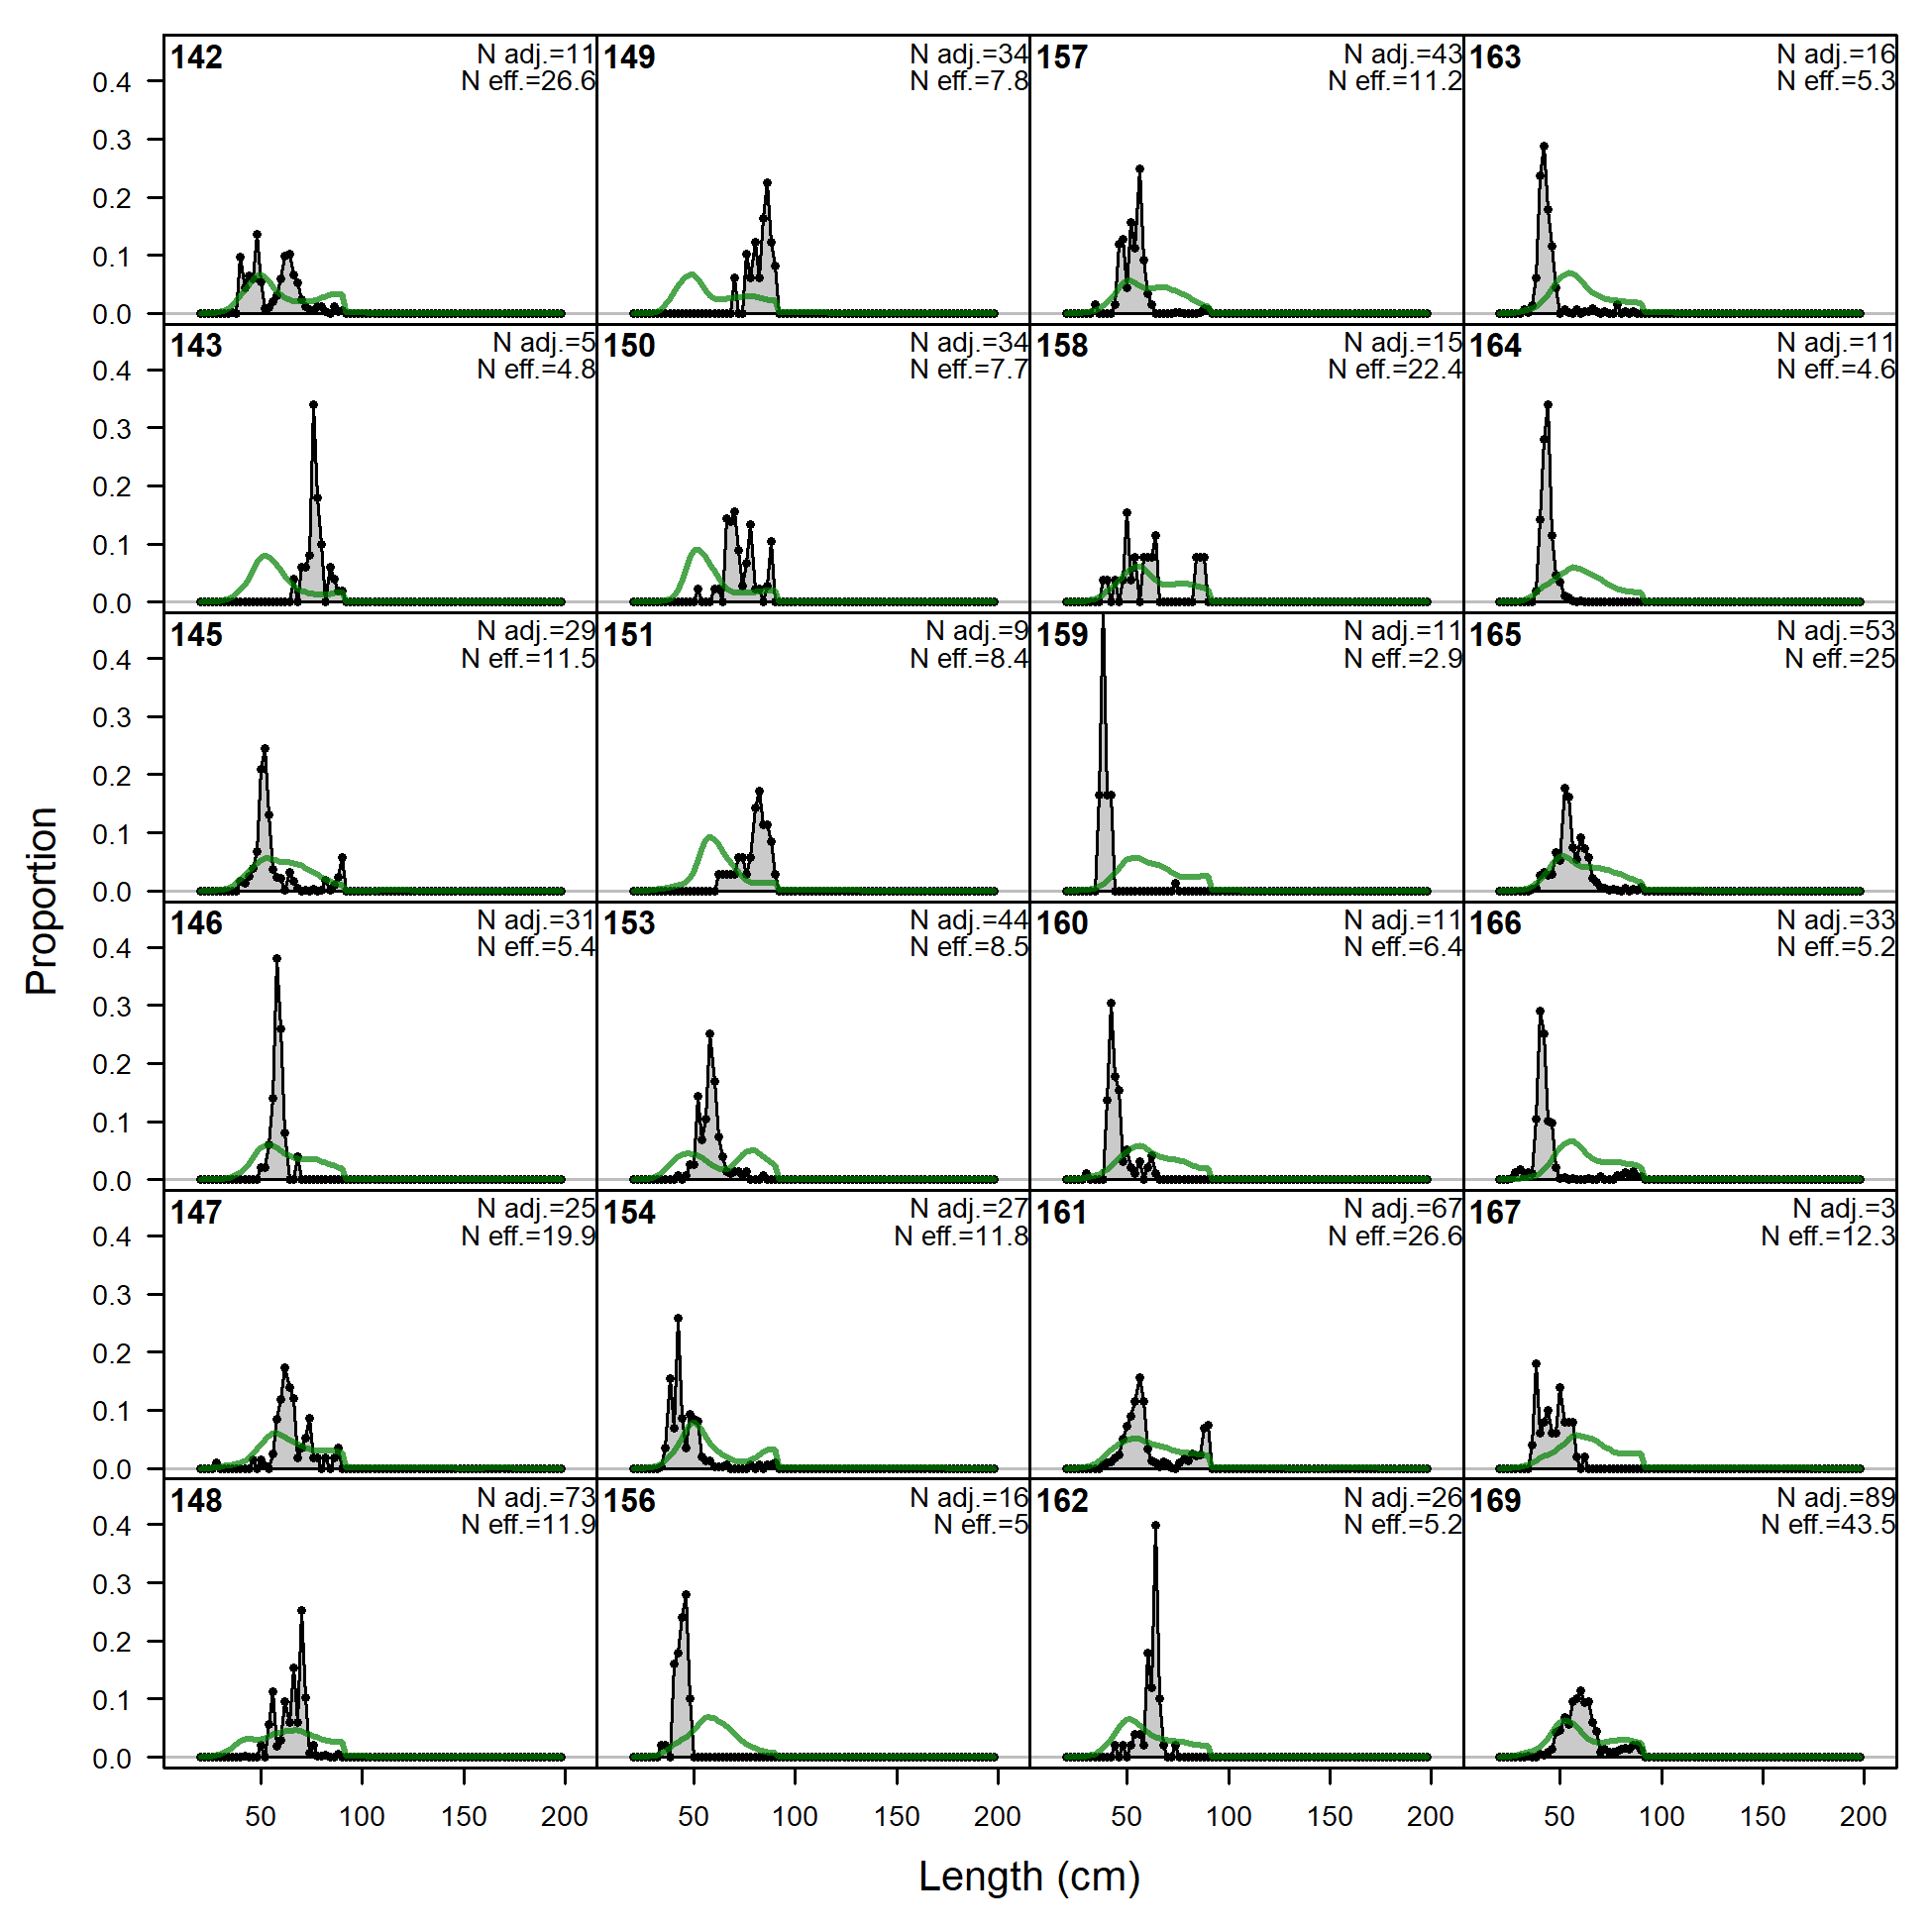
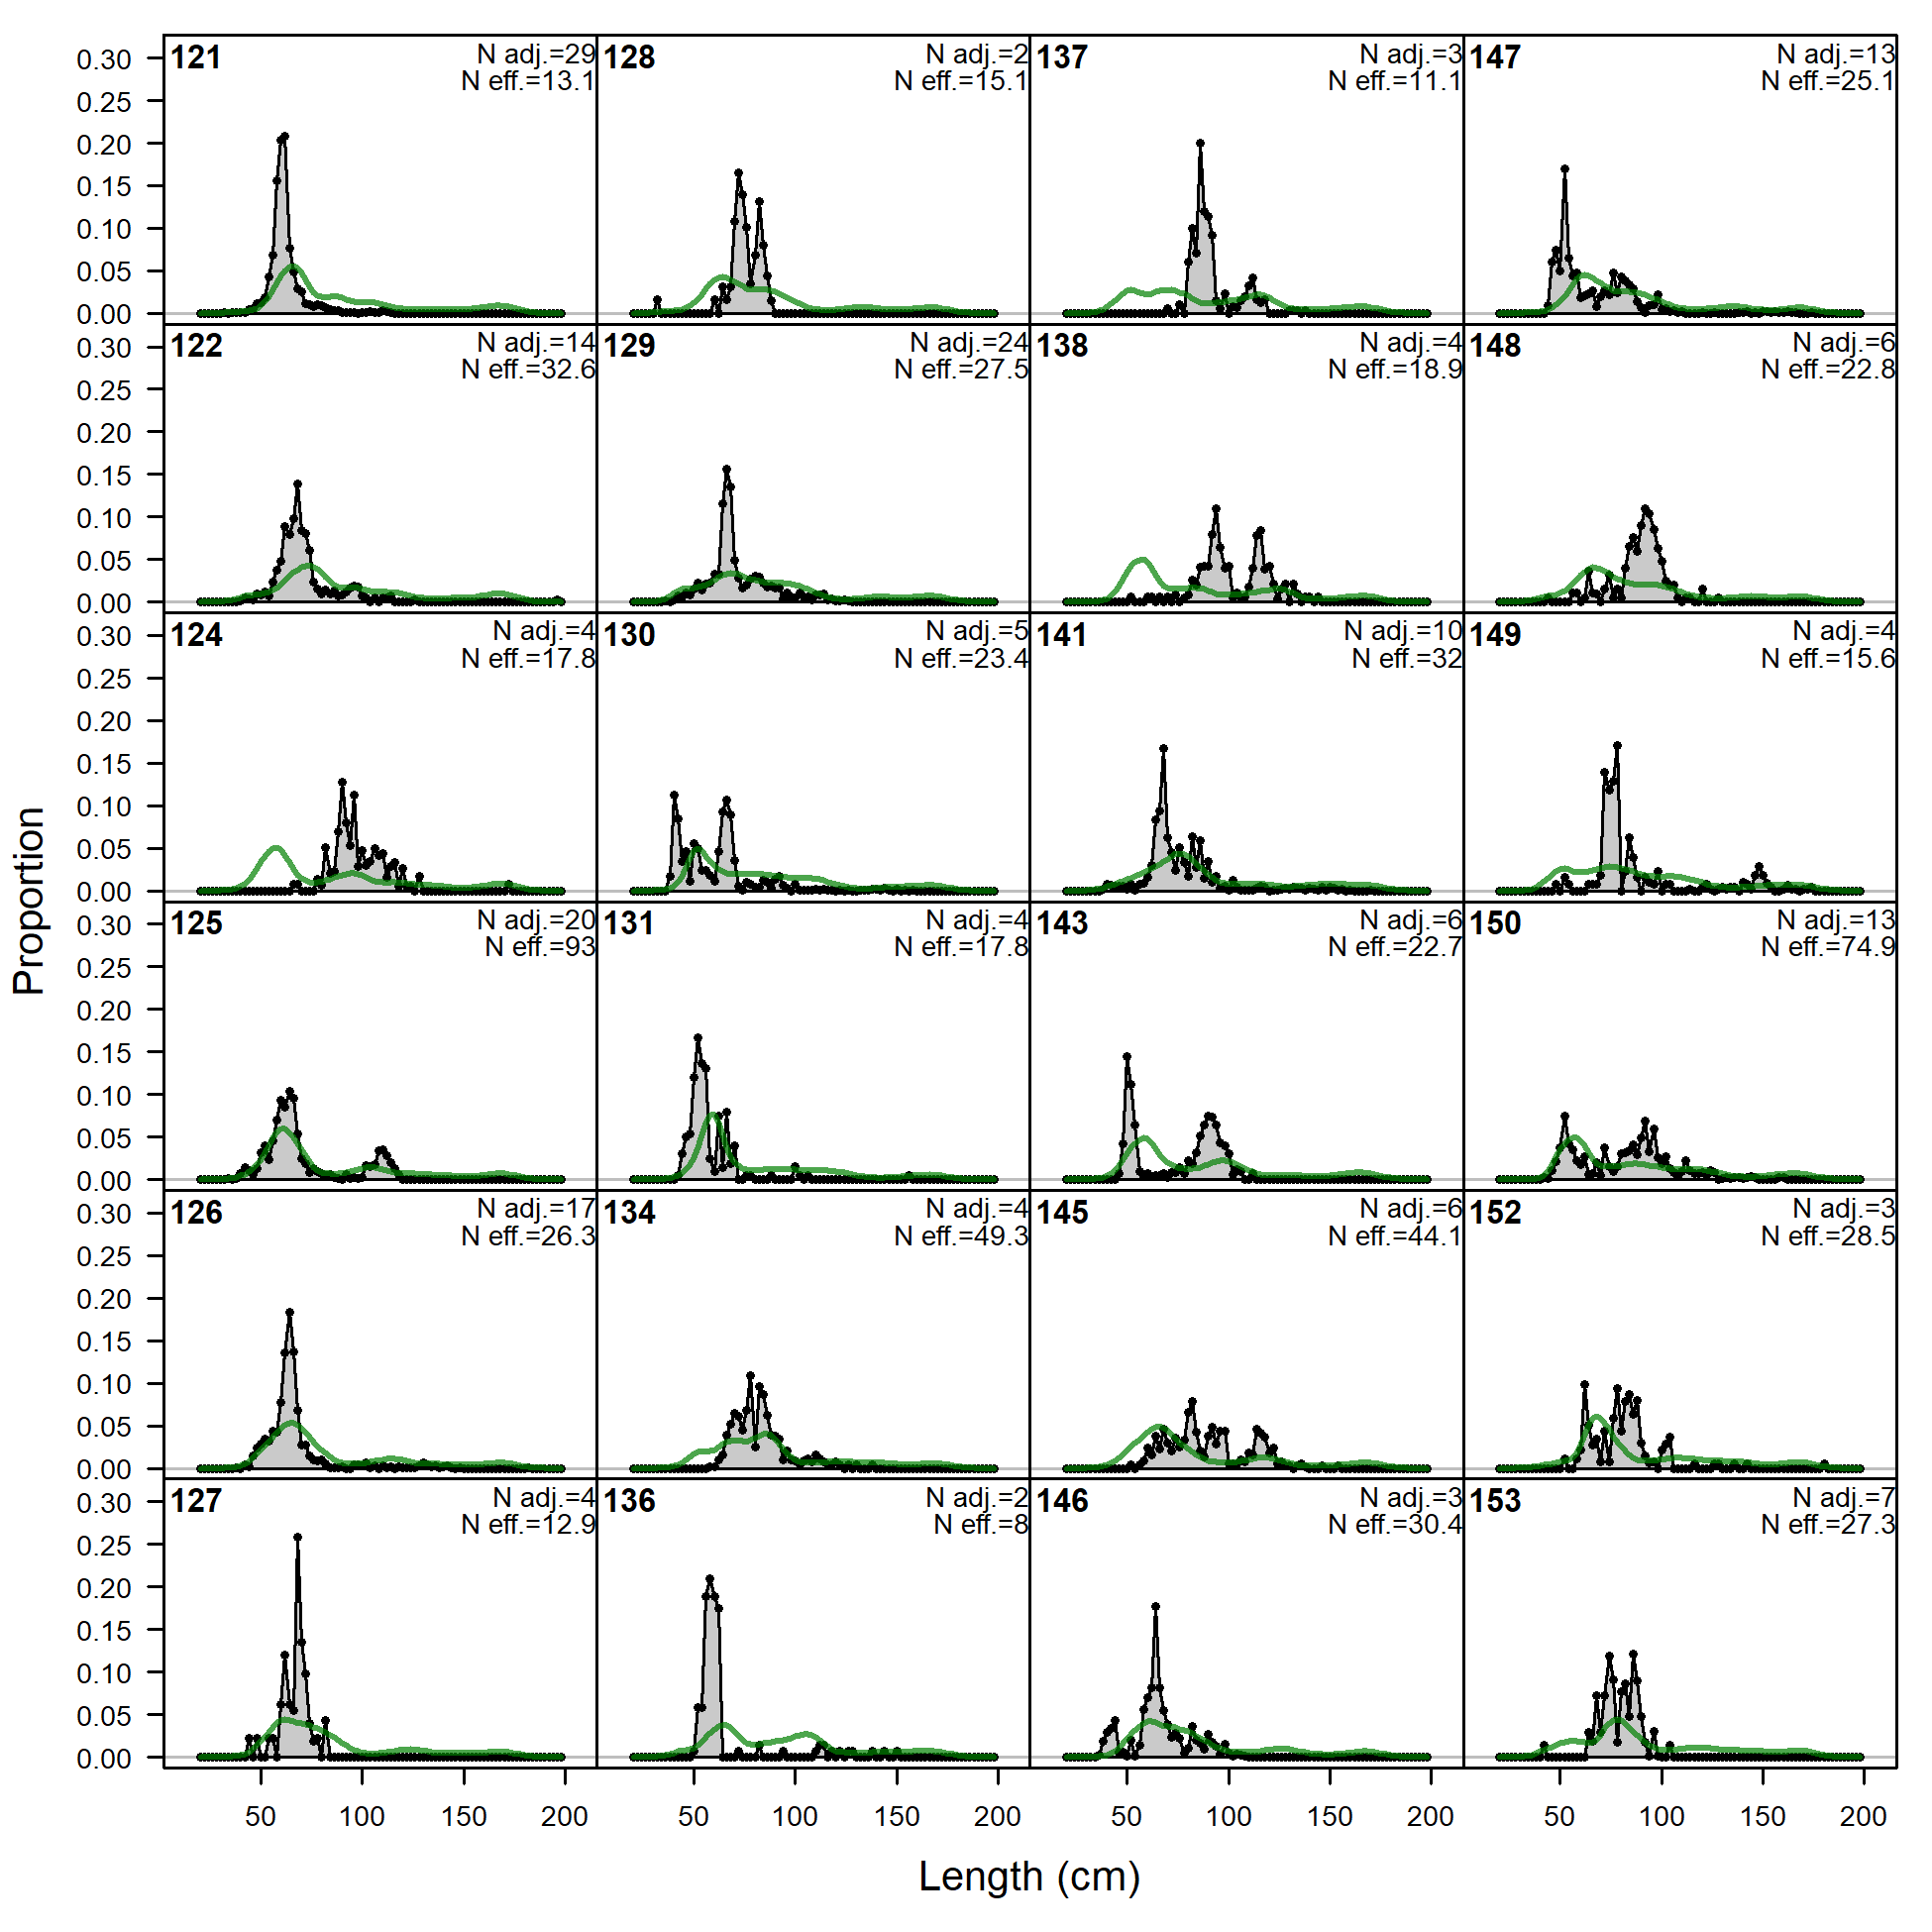
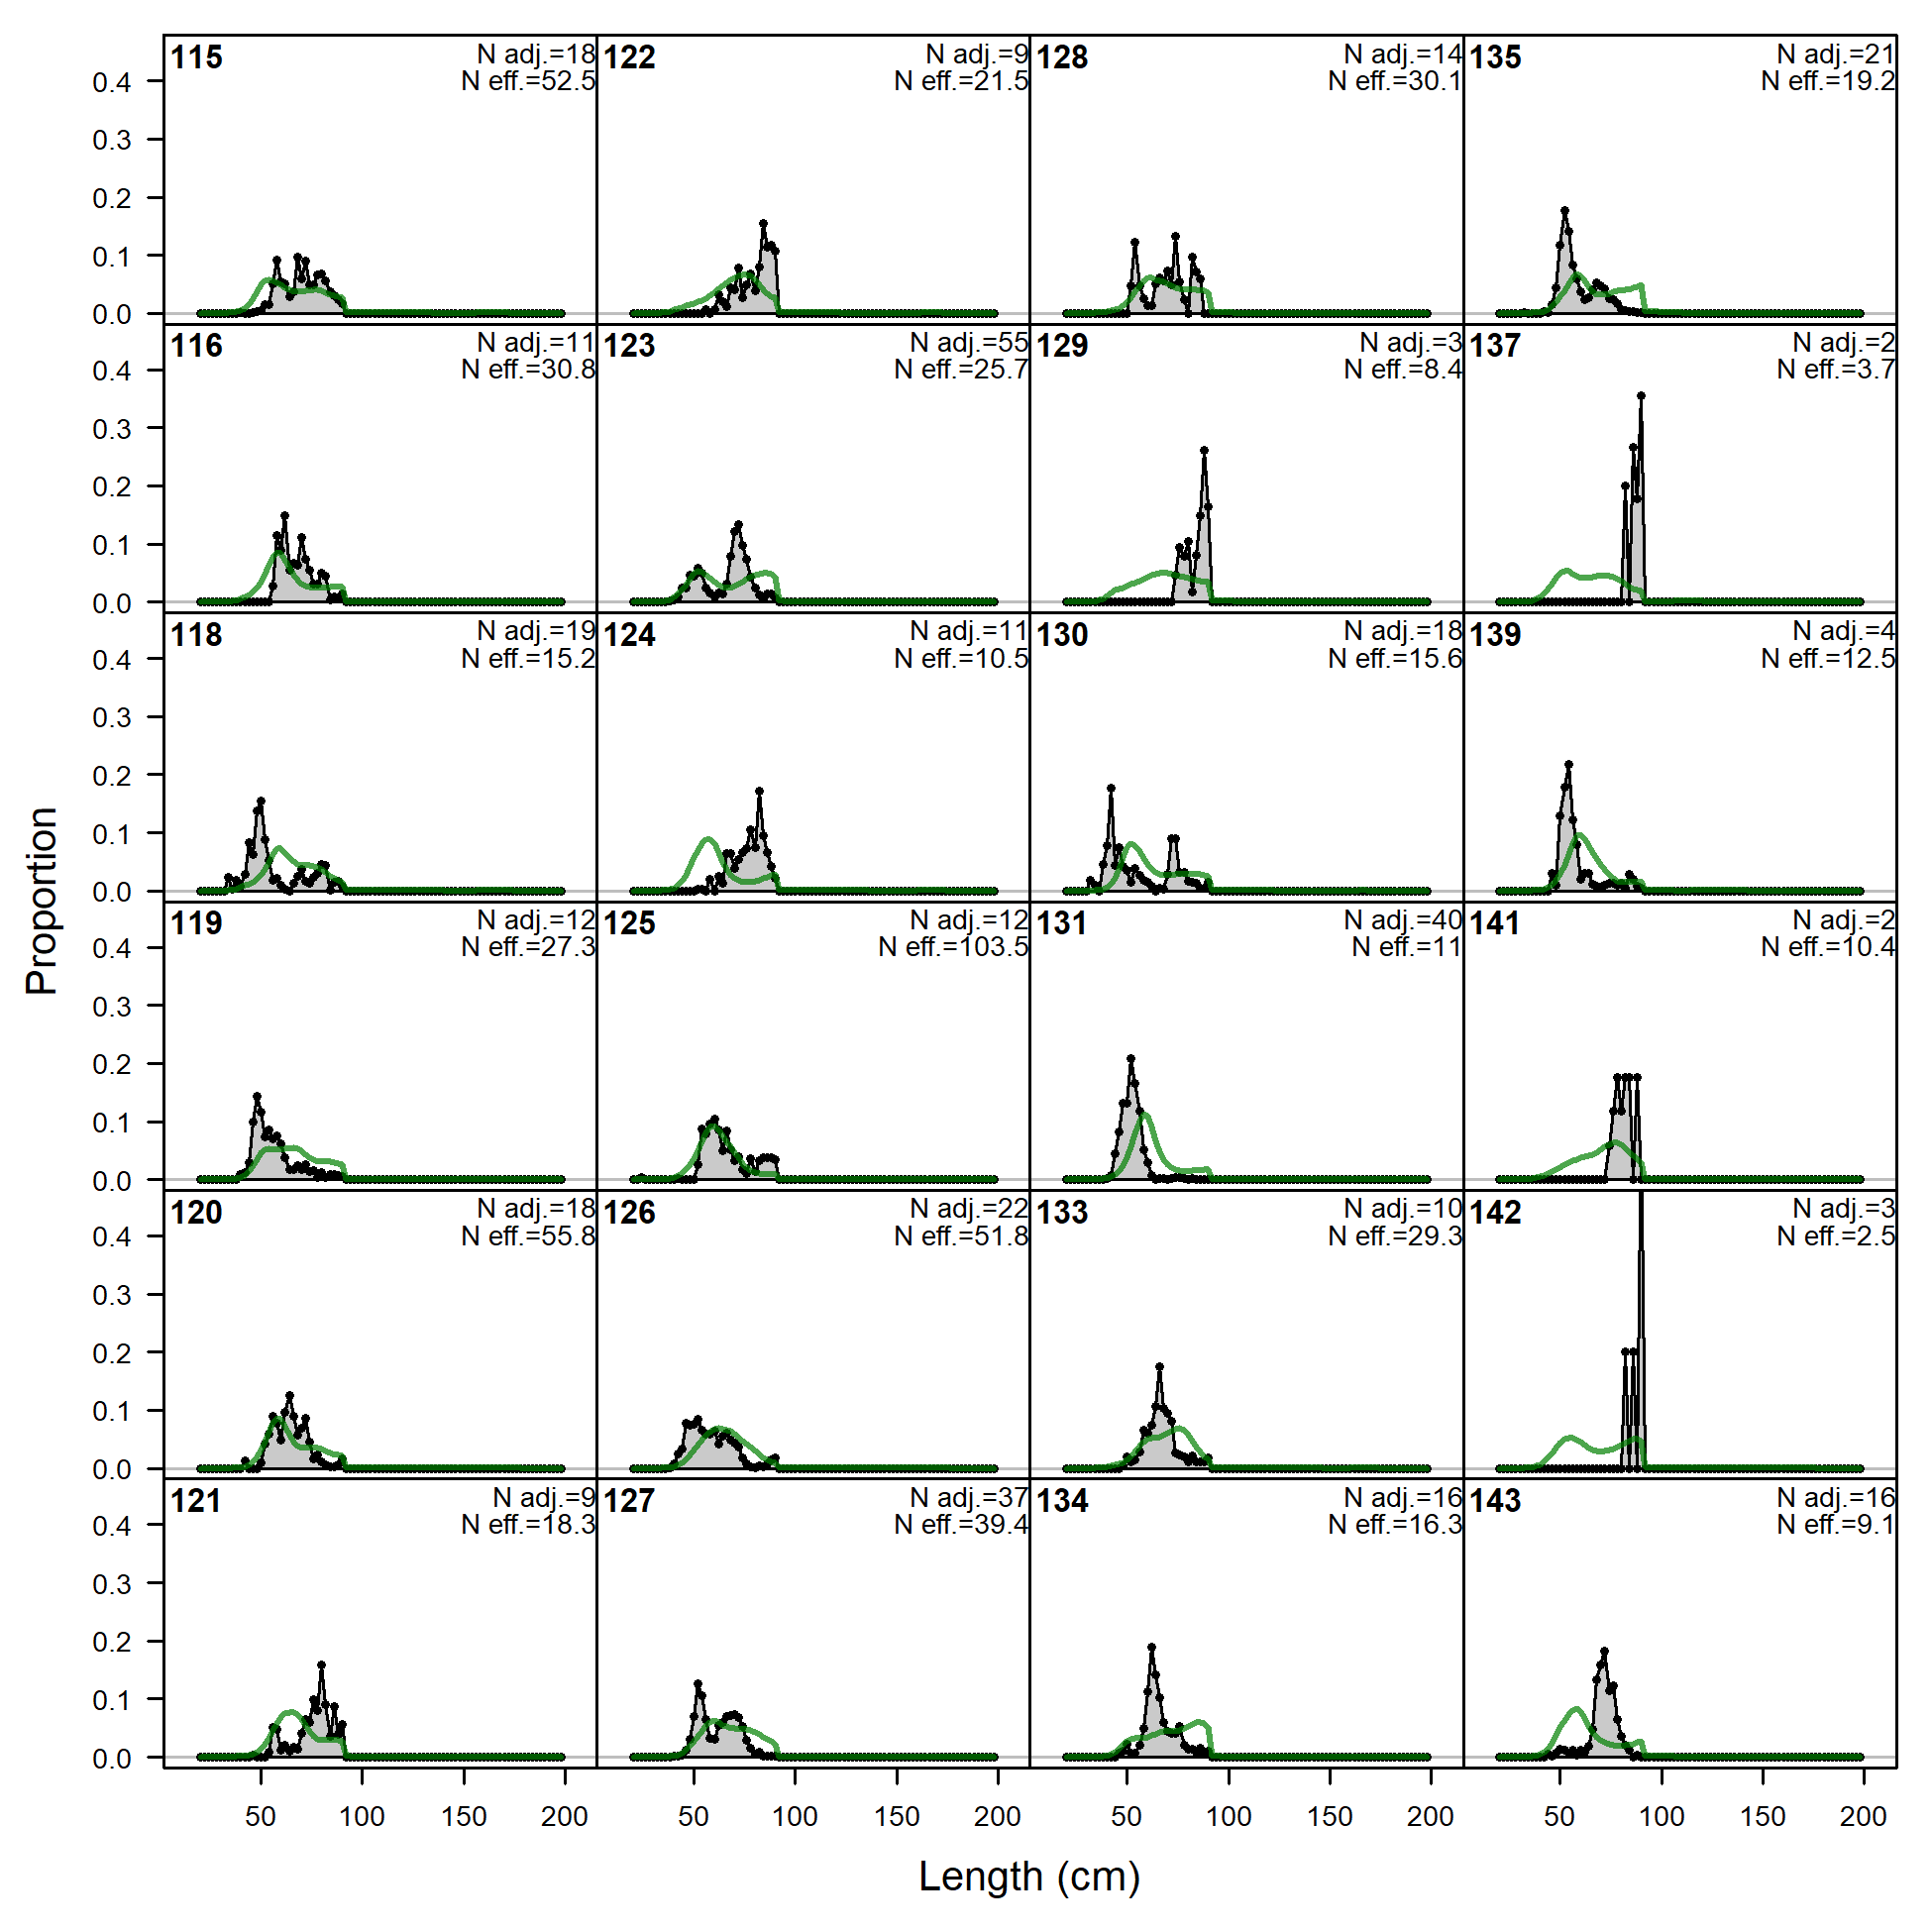
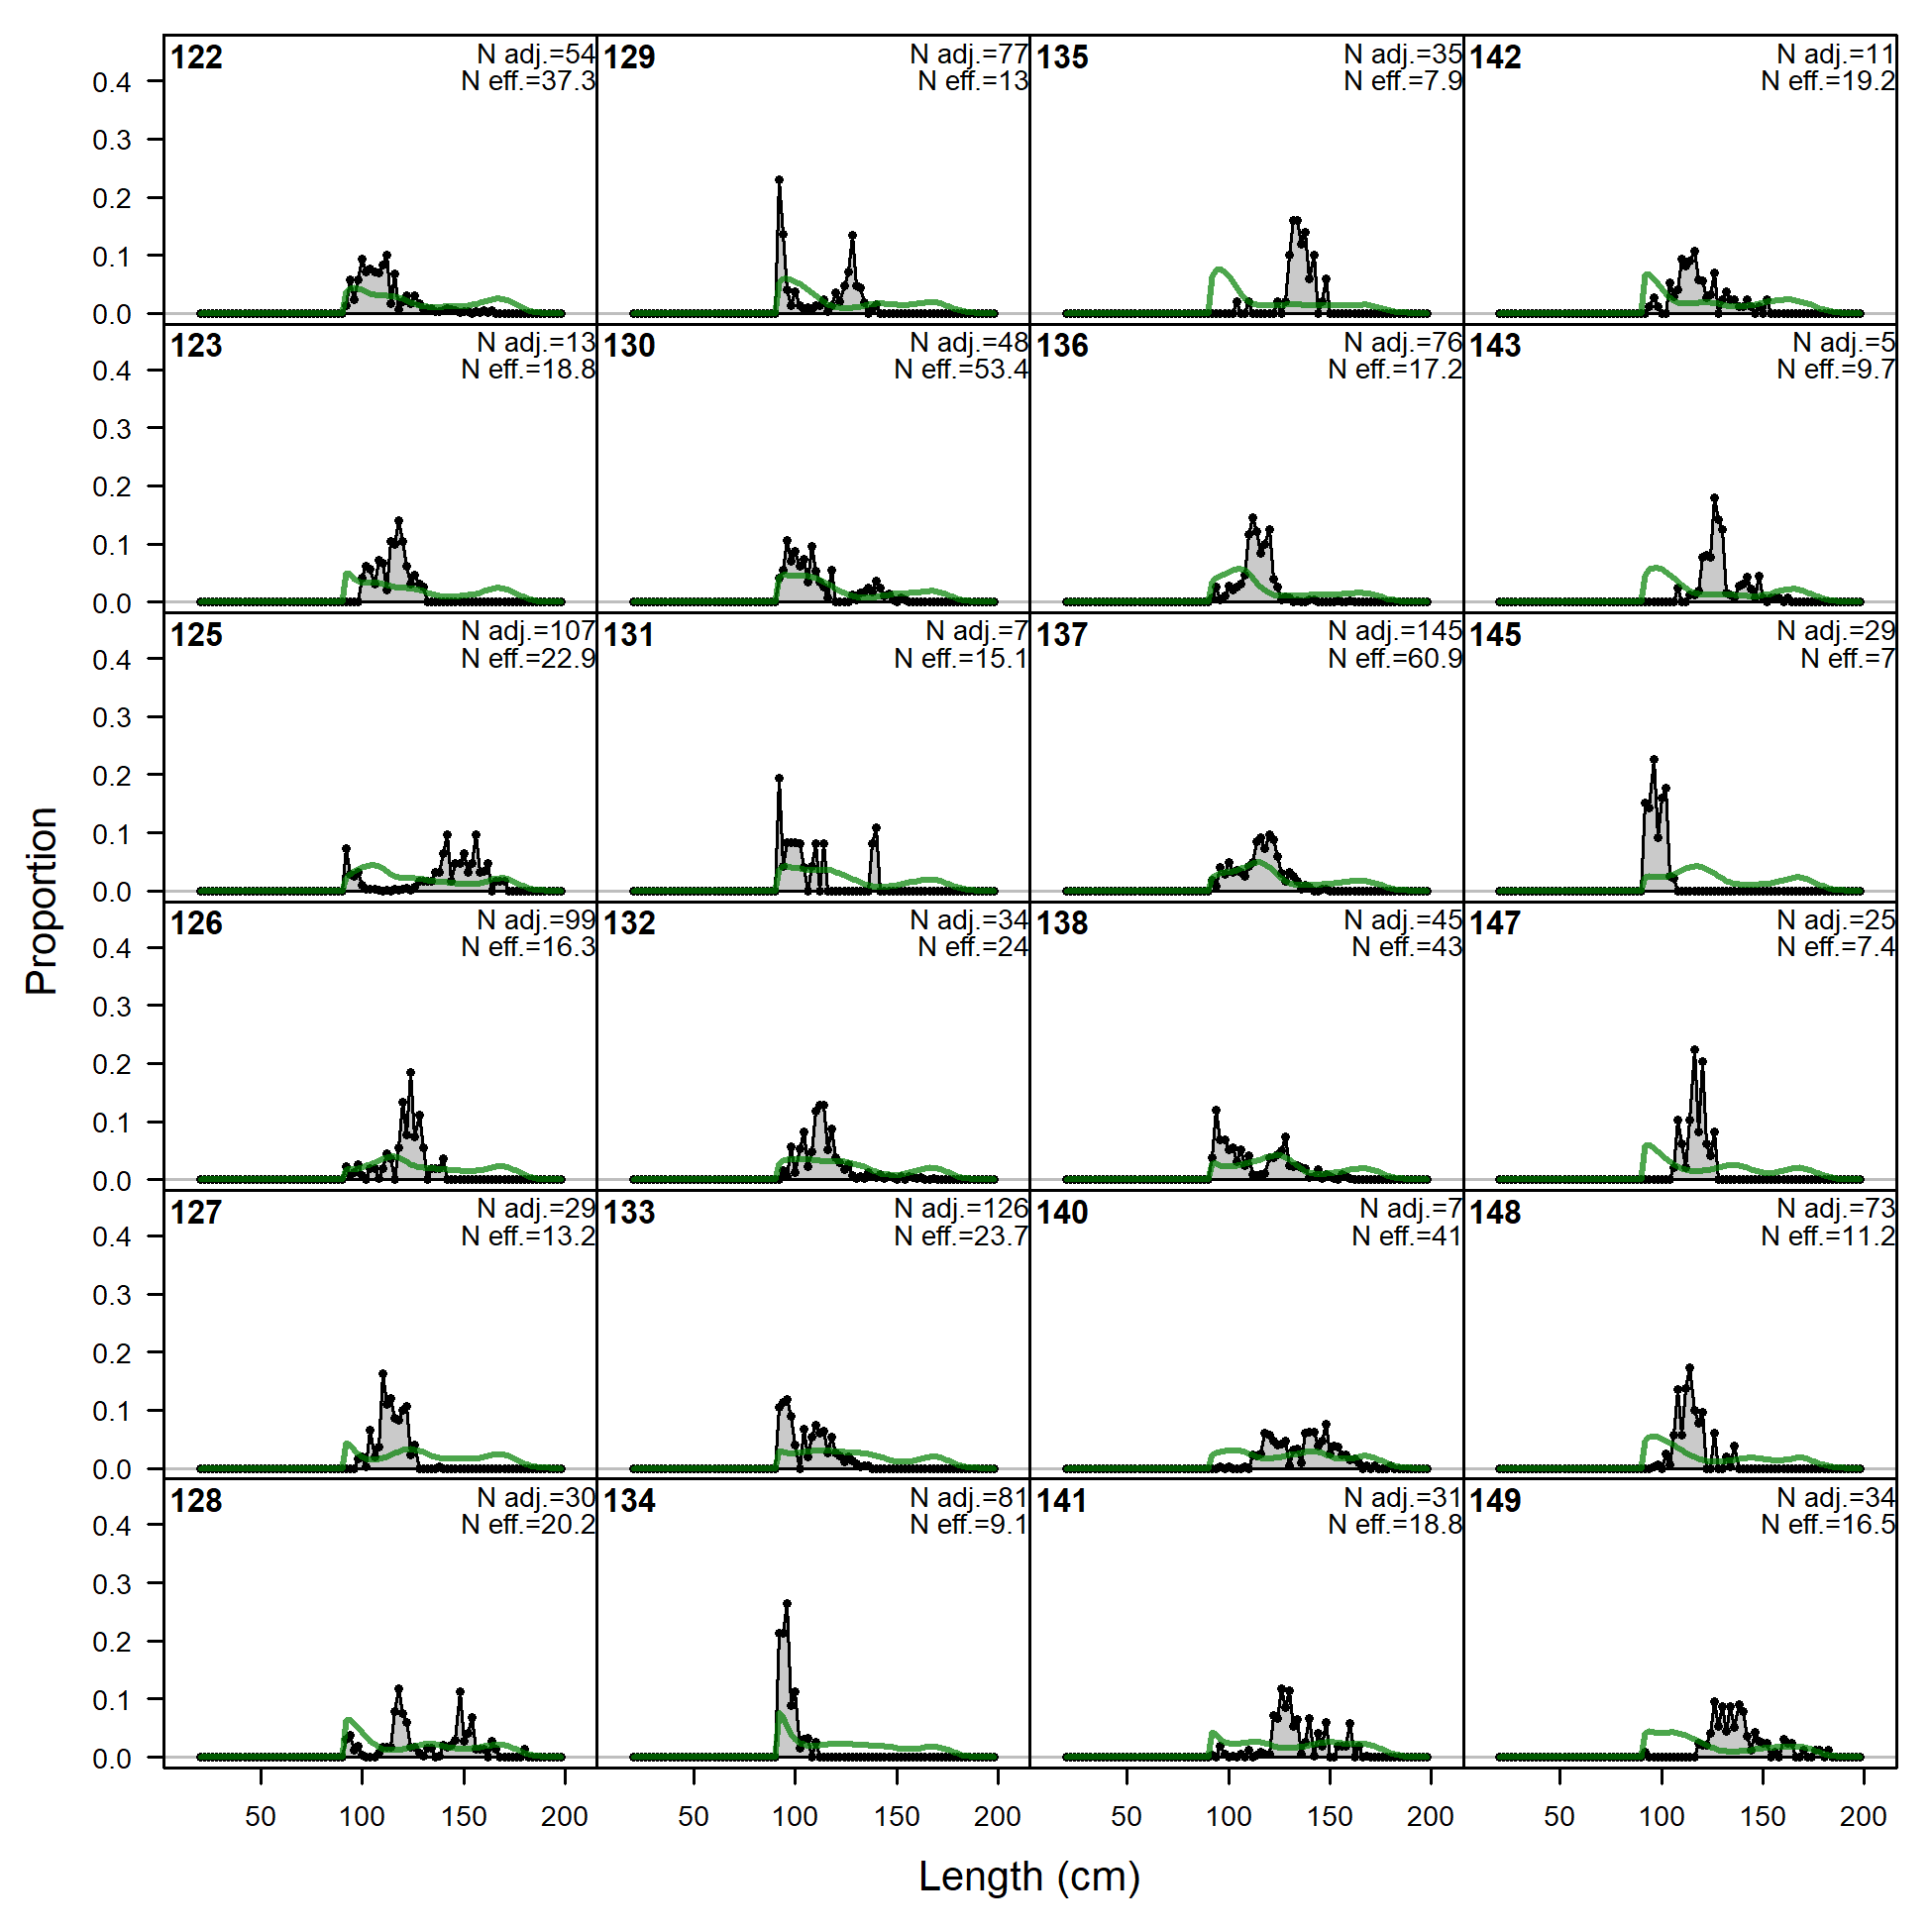
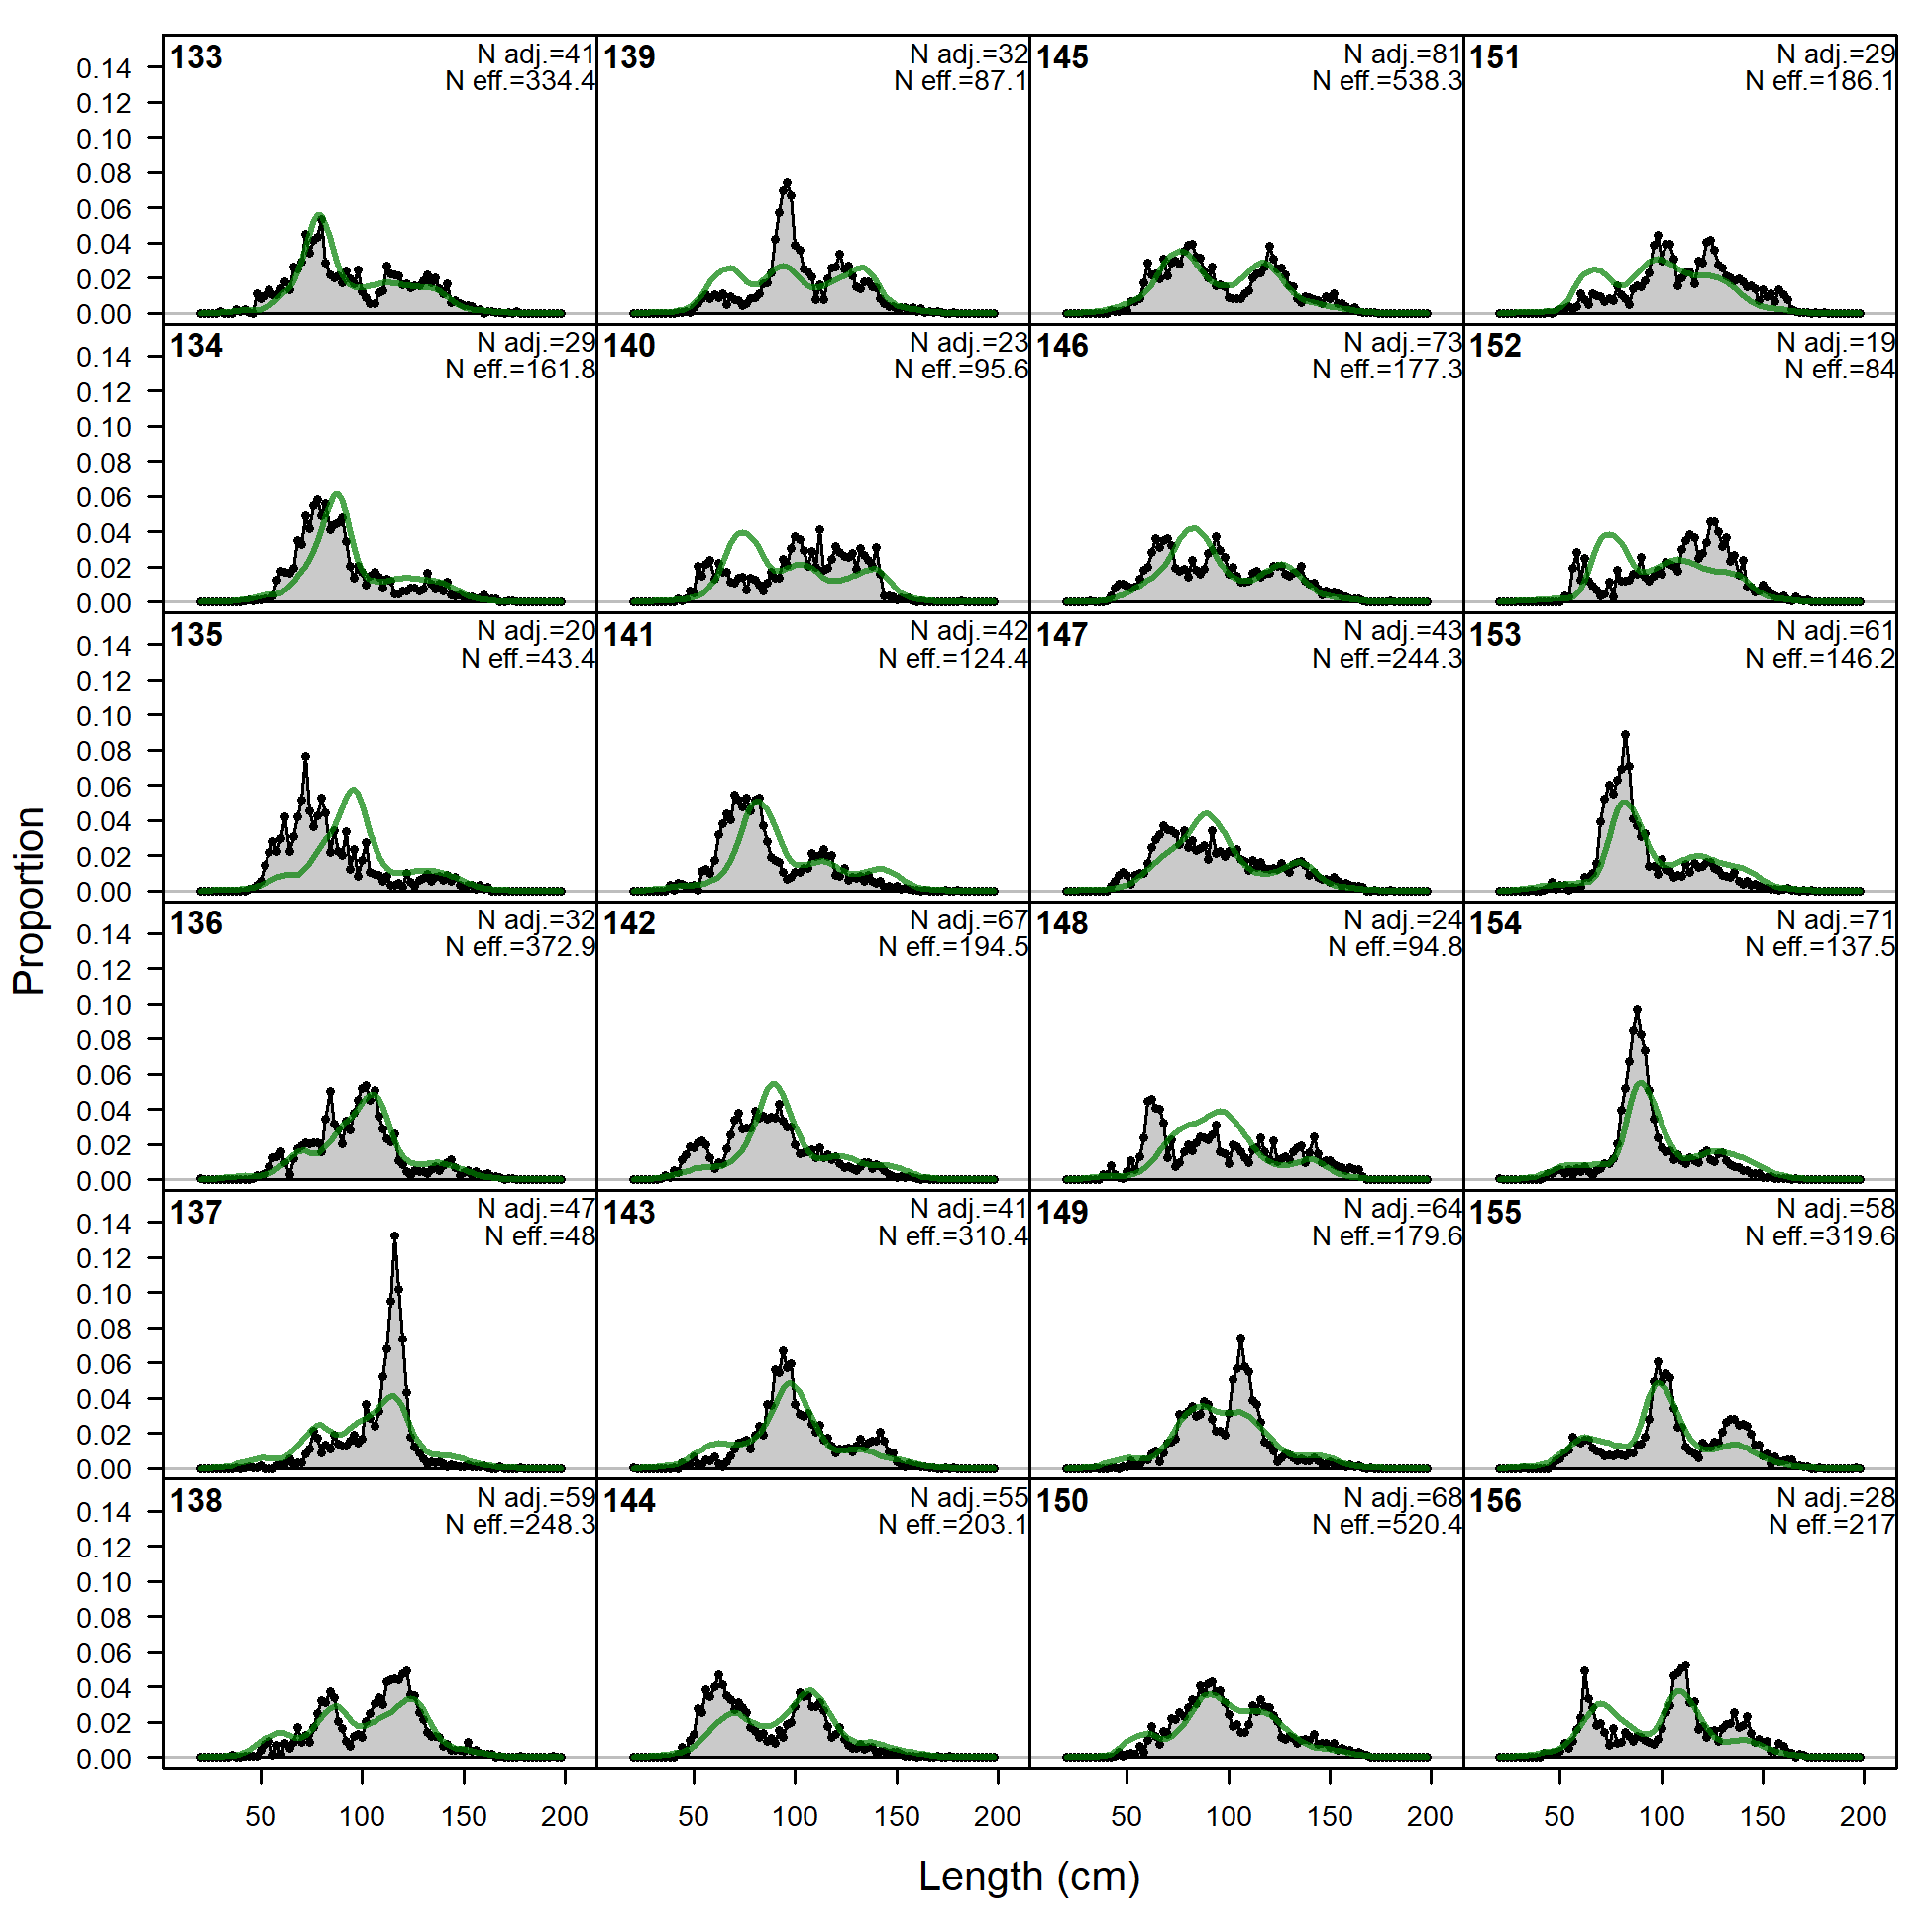
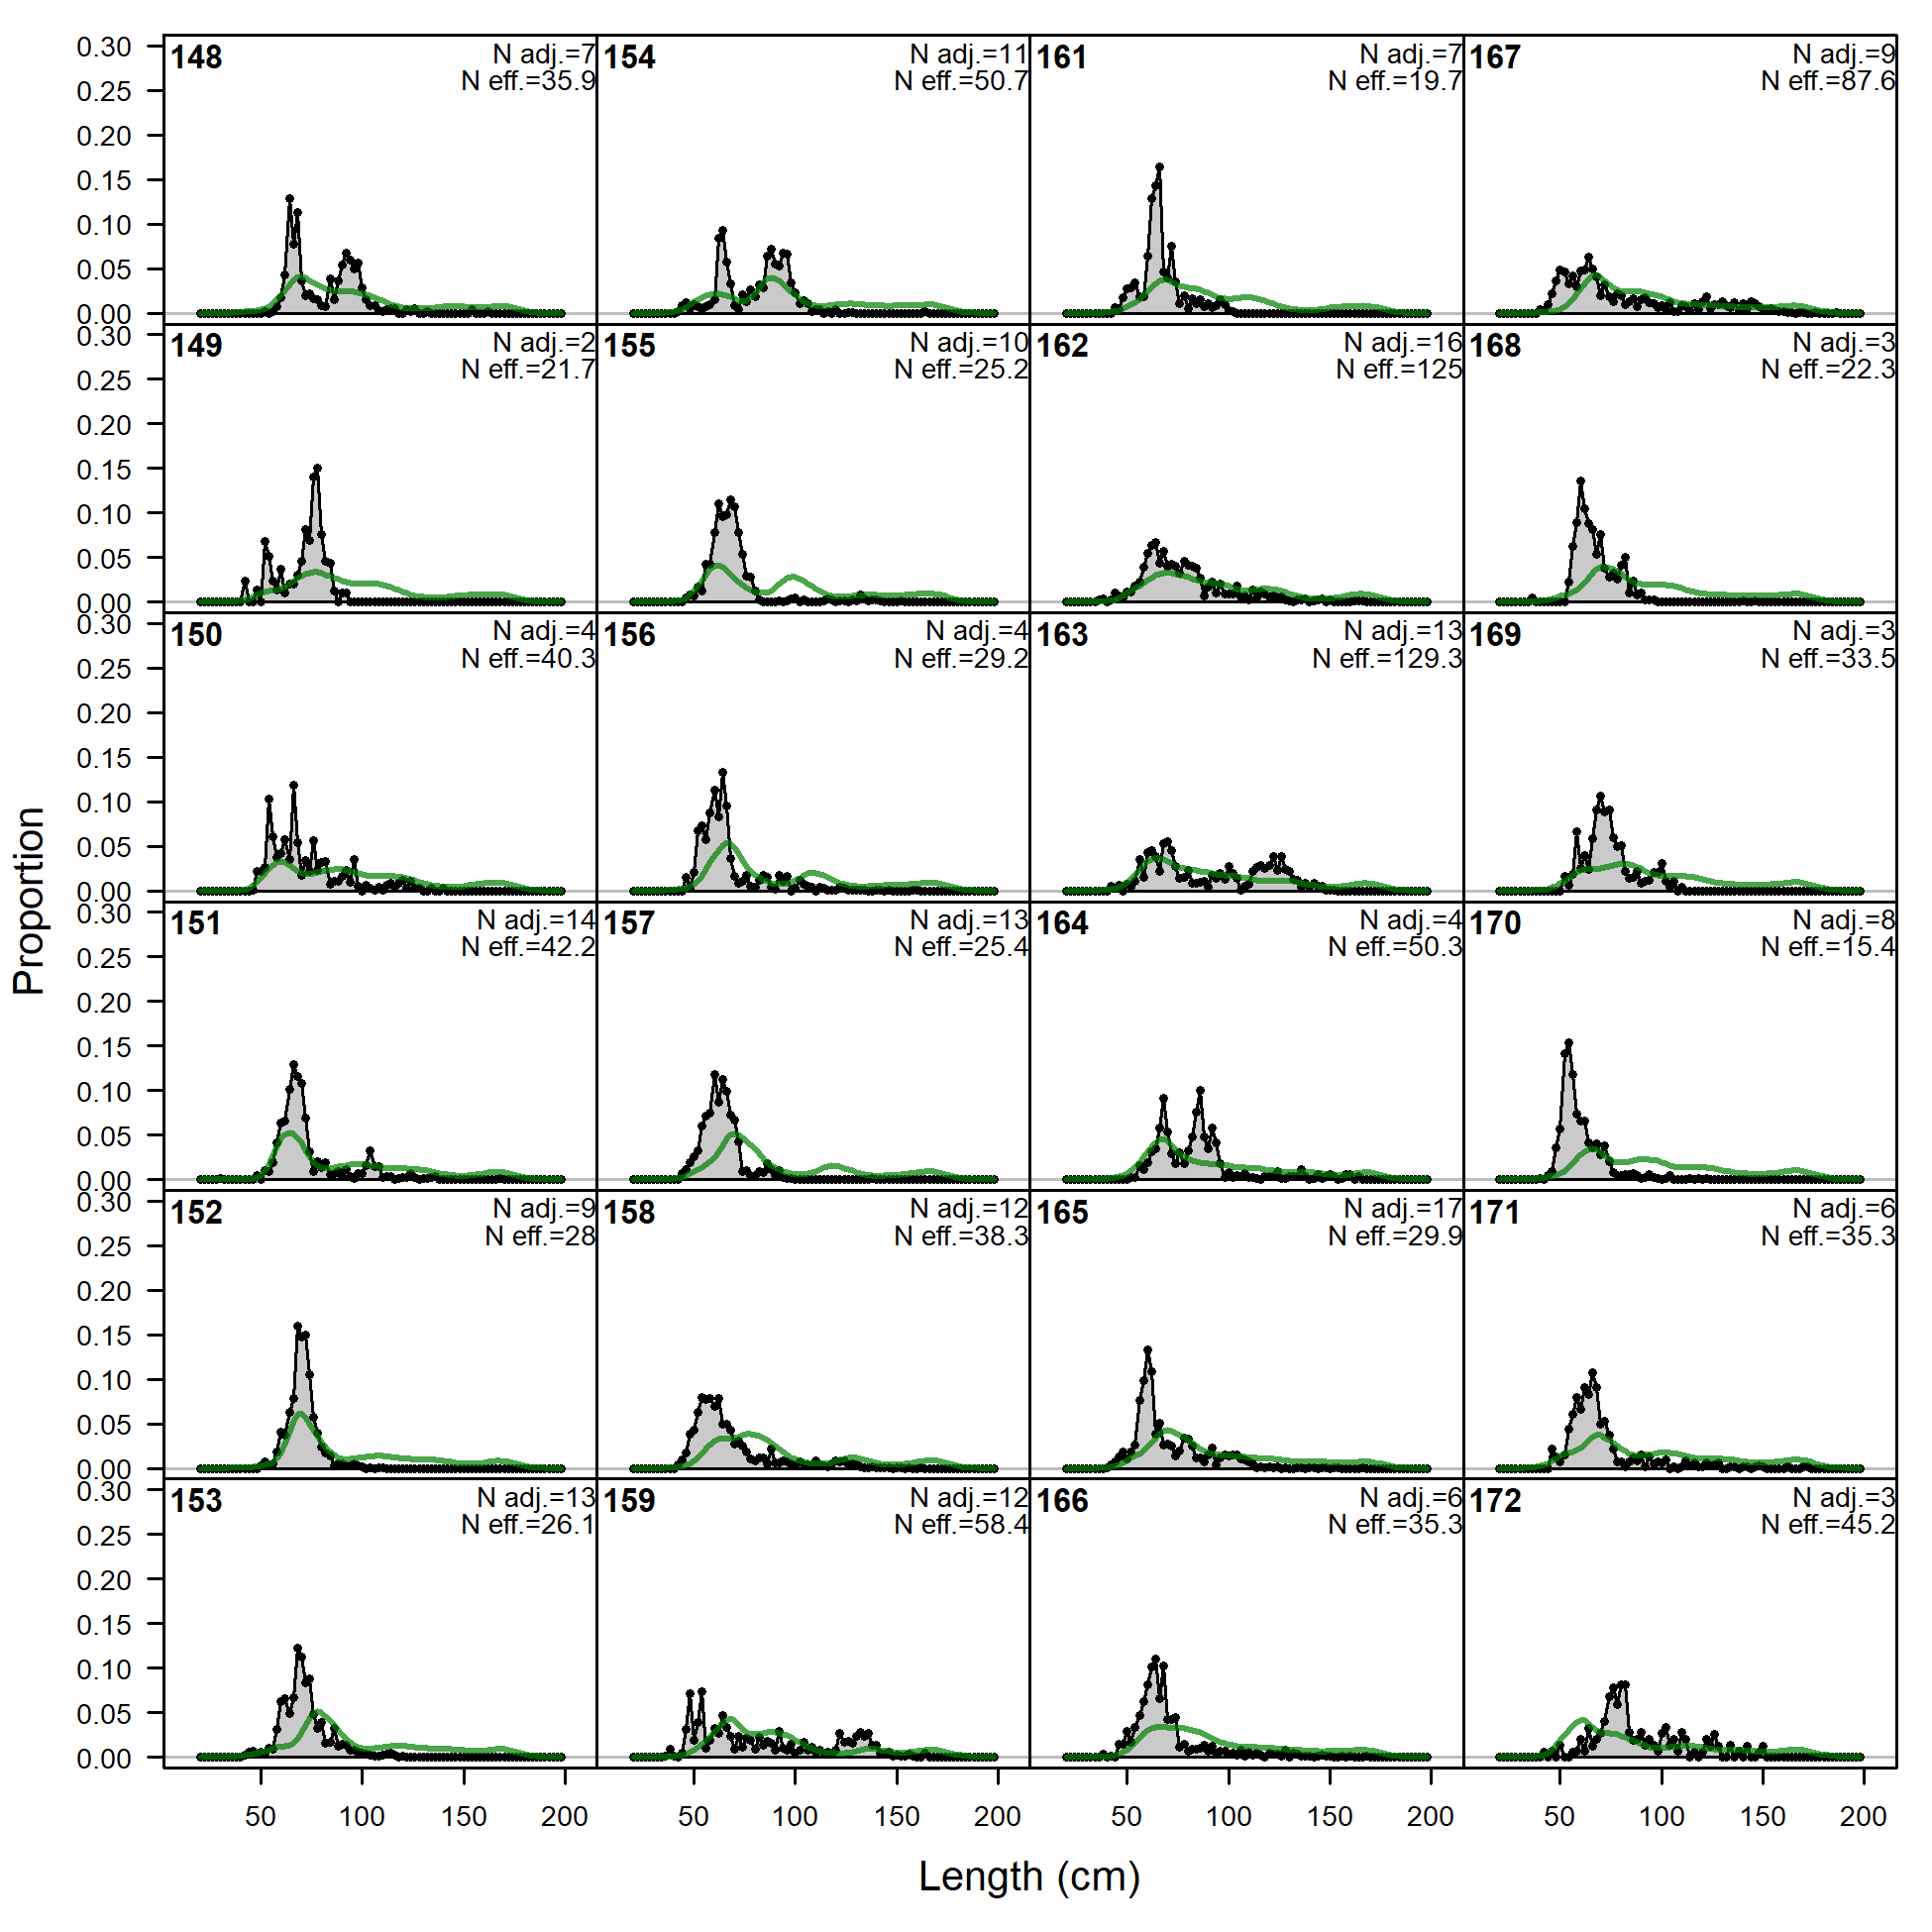
Length comps, whole catch, F5.OBJ.E.inshore (plot 1 of 5).
'N adj.' is the input sample size after data-weighting adjustment. N eff. is the calculated effective sample size used in the McAllister-Ianelli tuning method. (plot 2 of 5) (plot 3 of 5)
file: comp_lenfit_flt5mkt0_page3.png
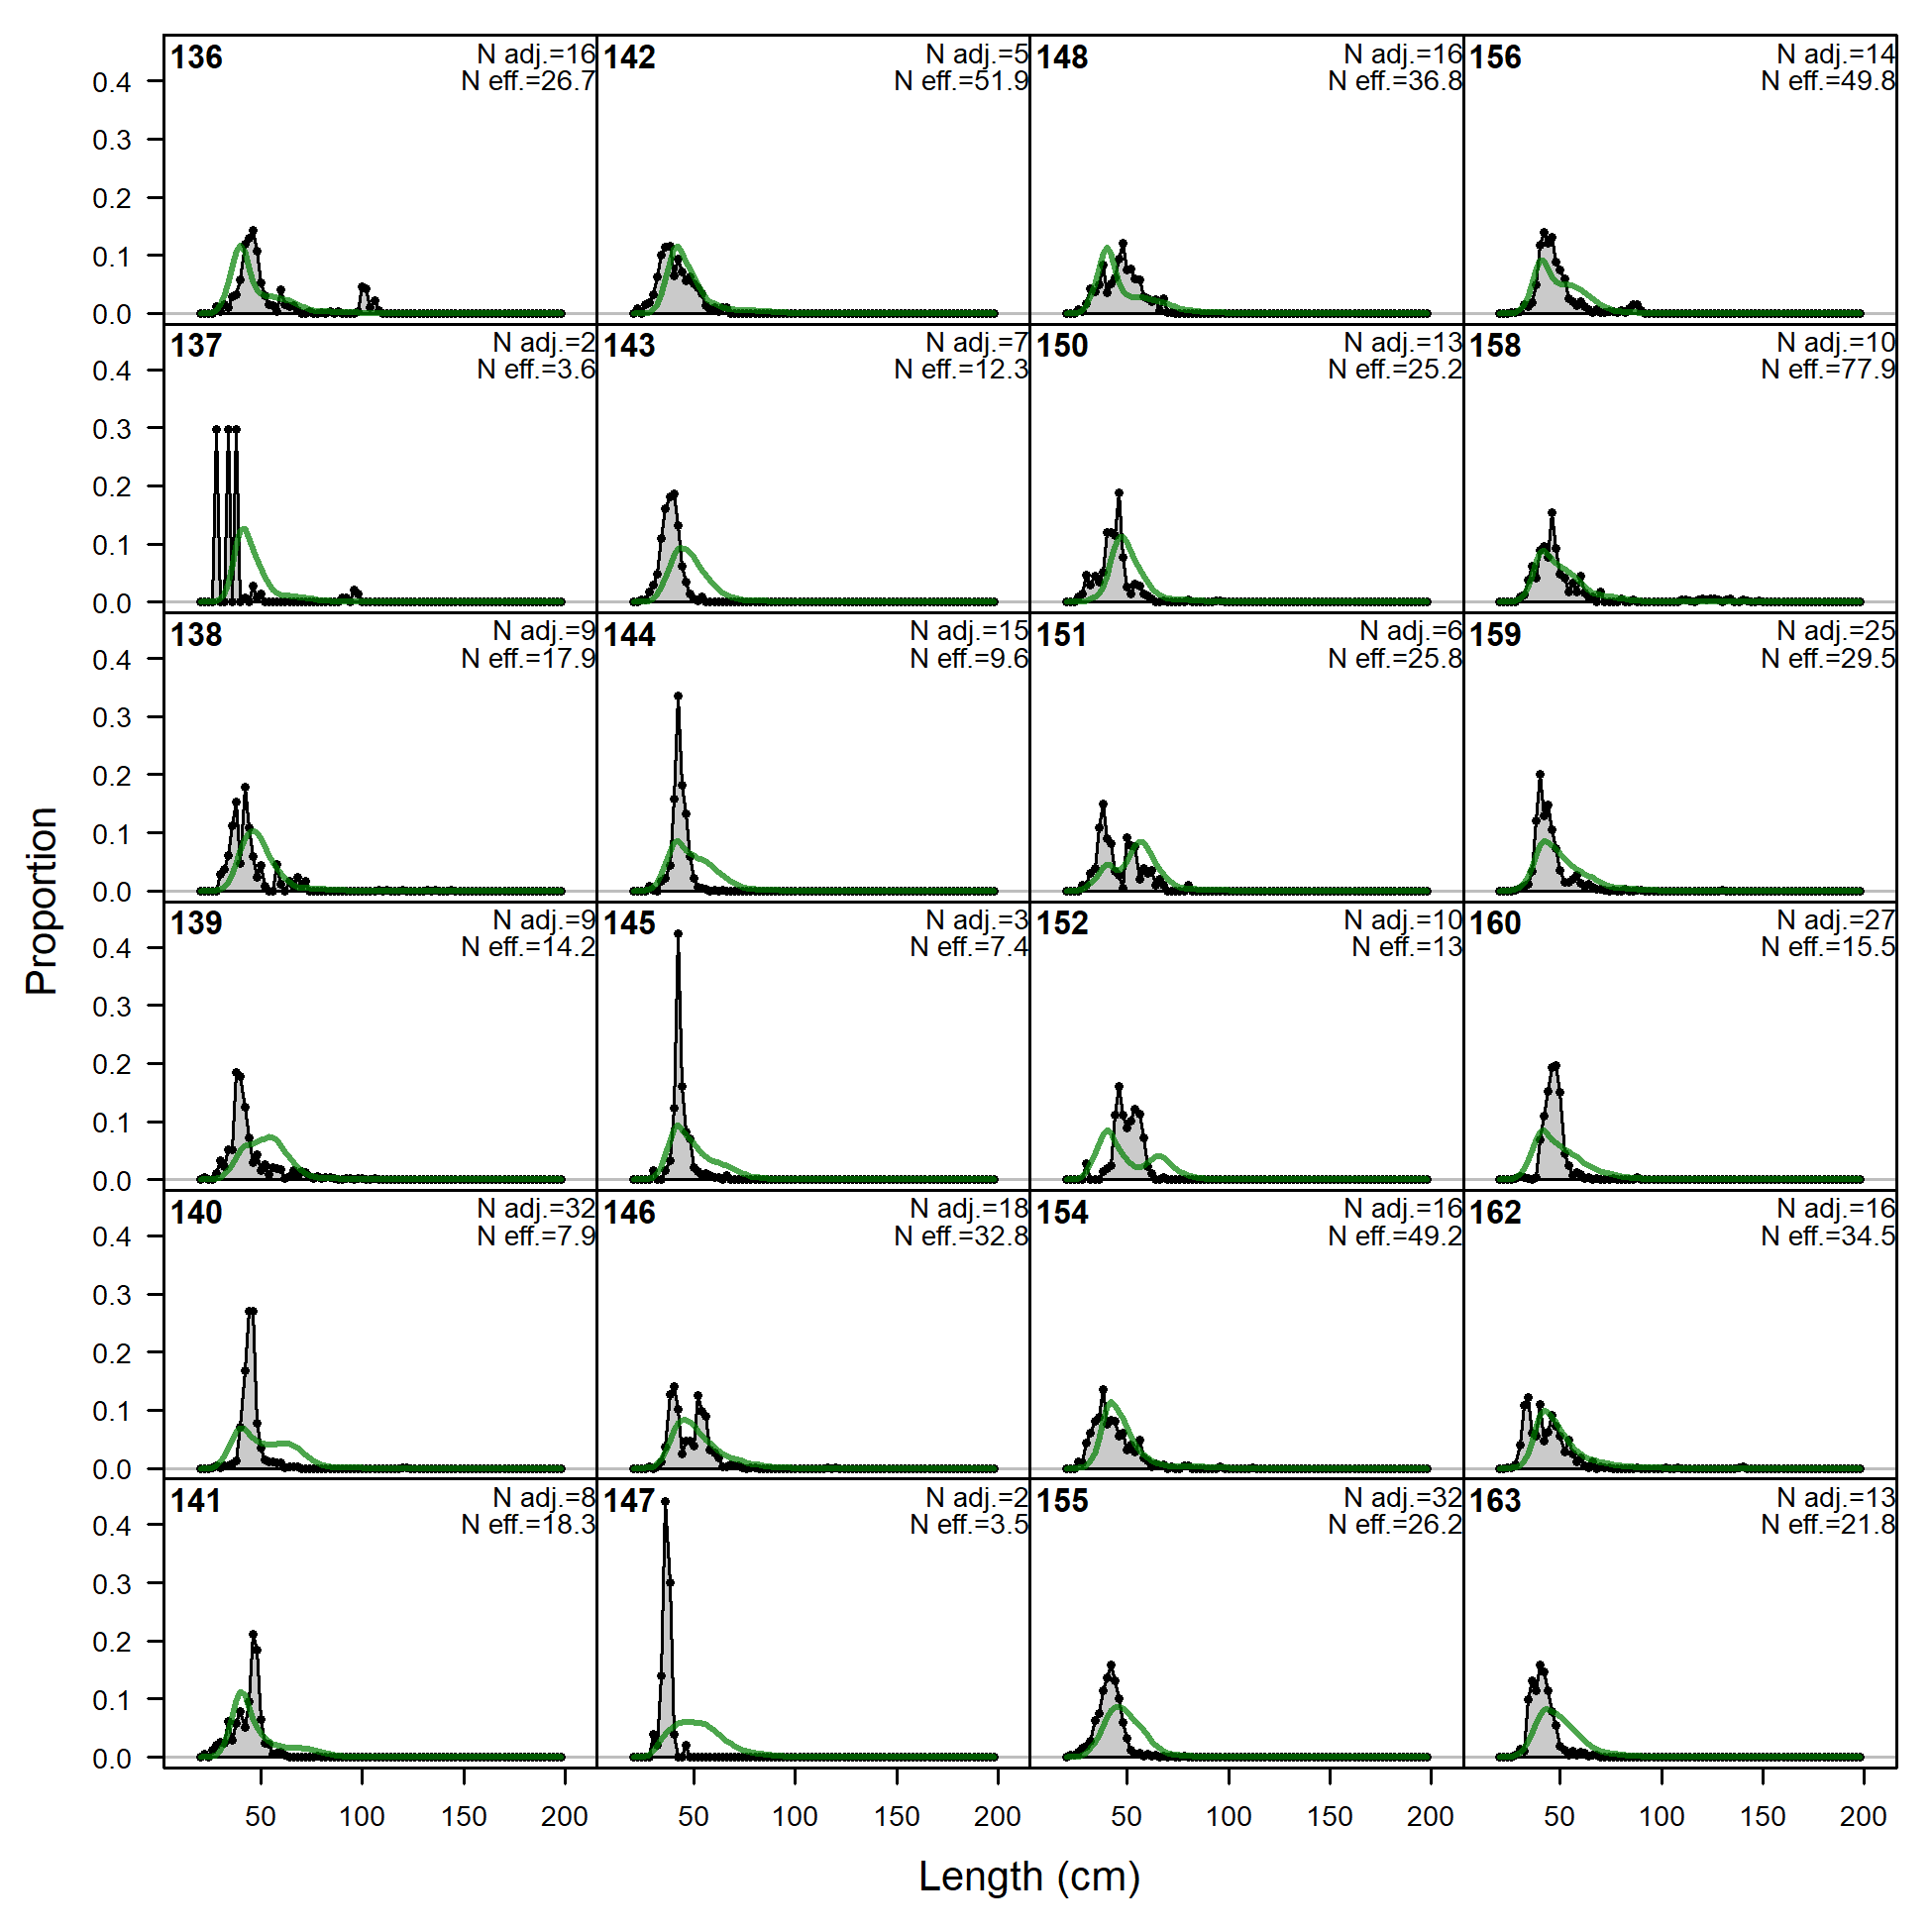
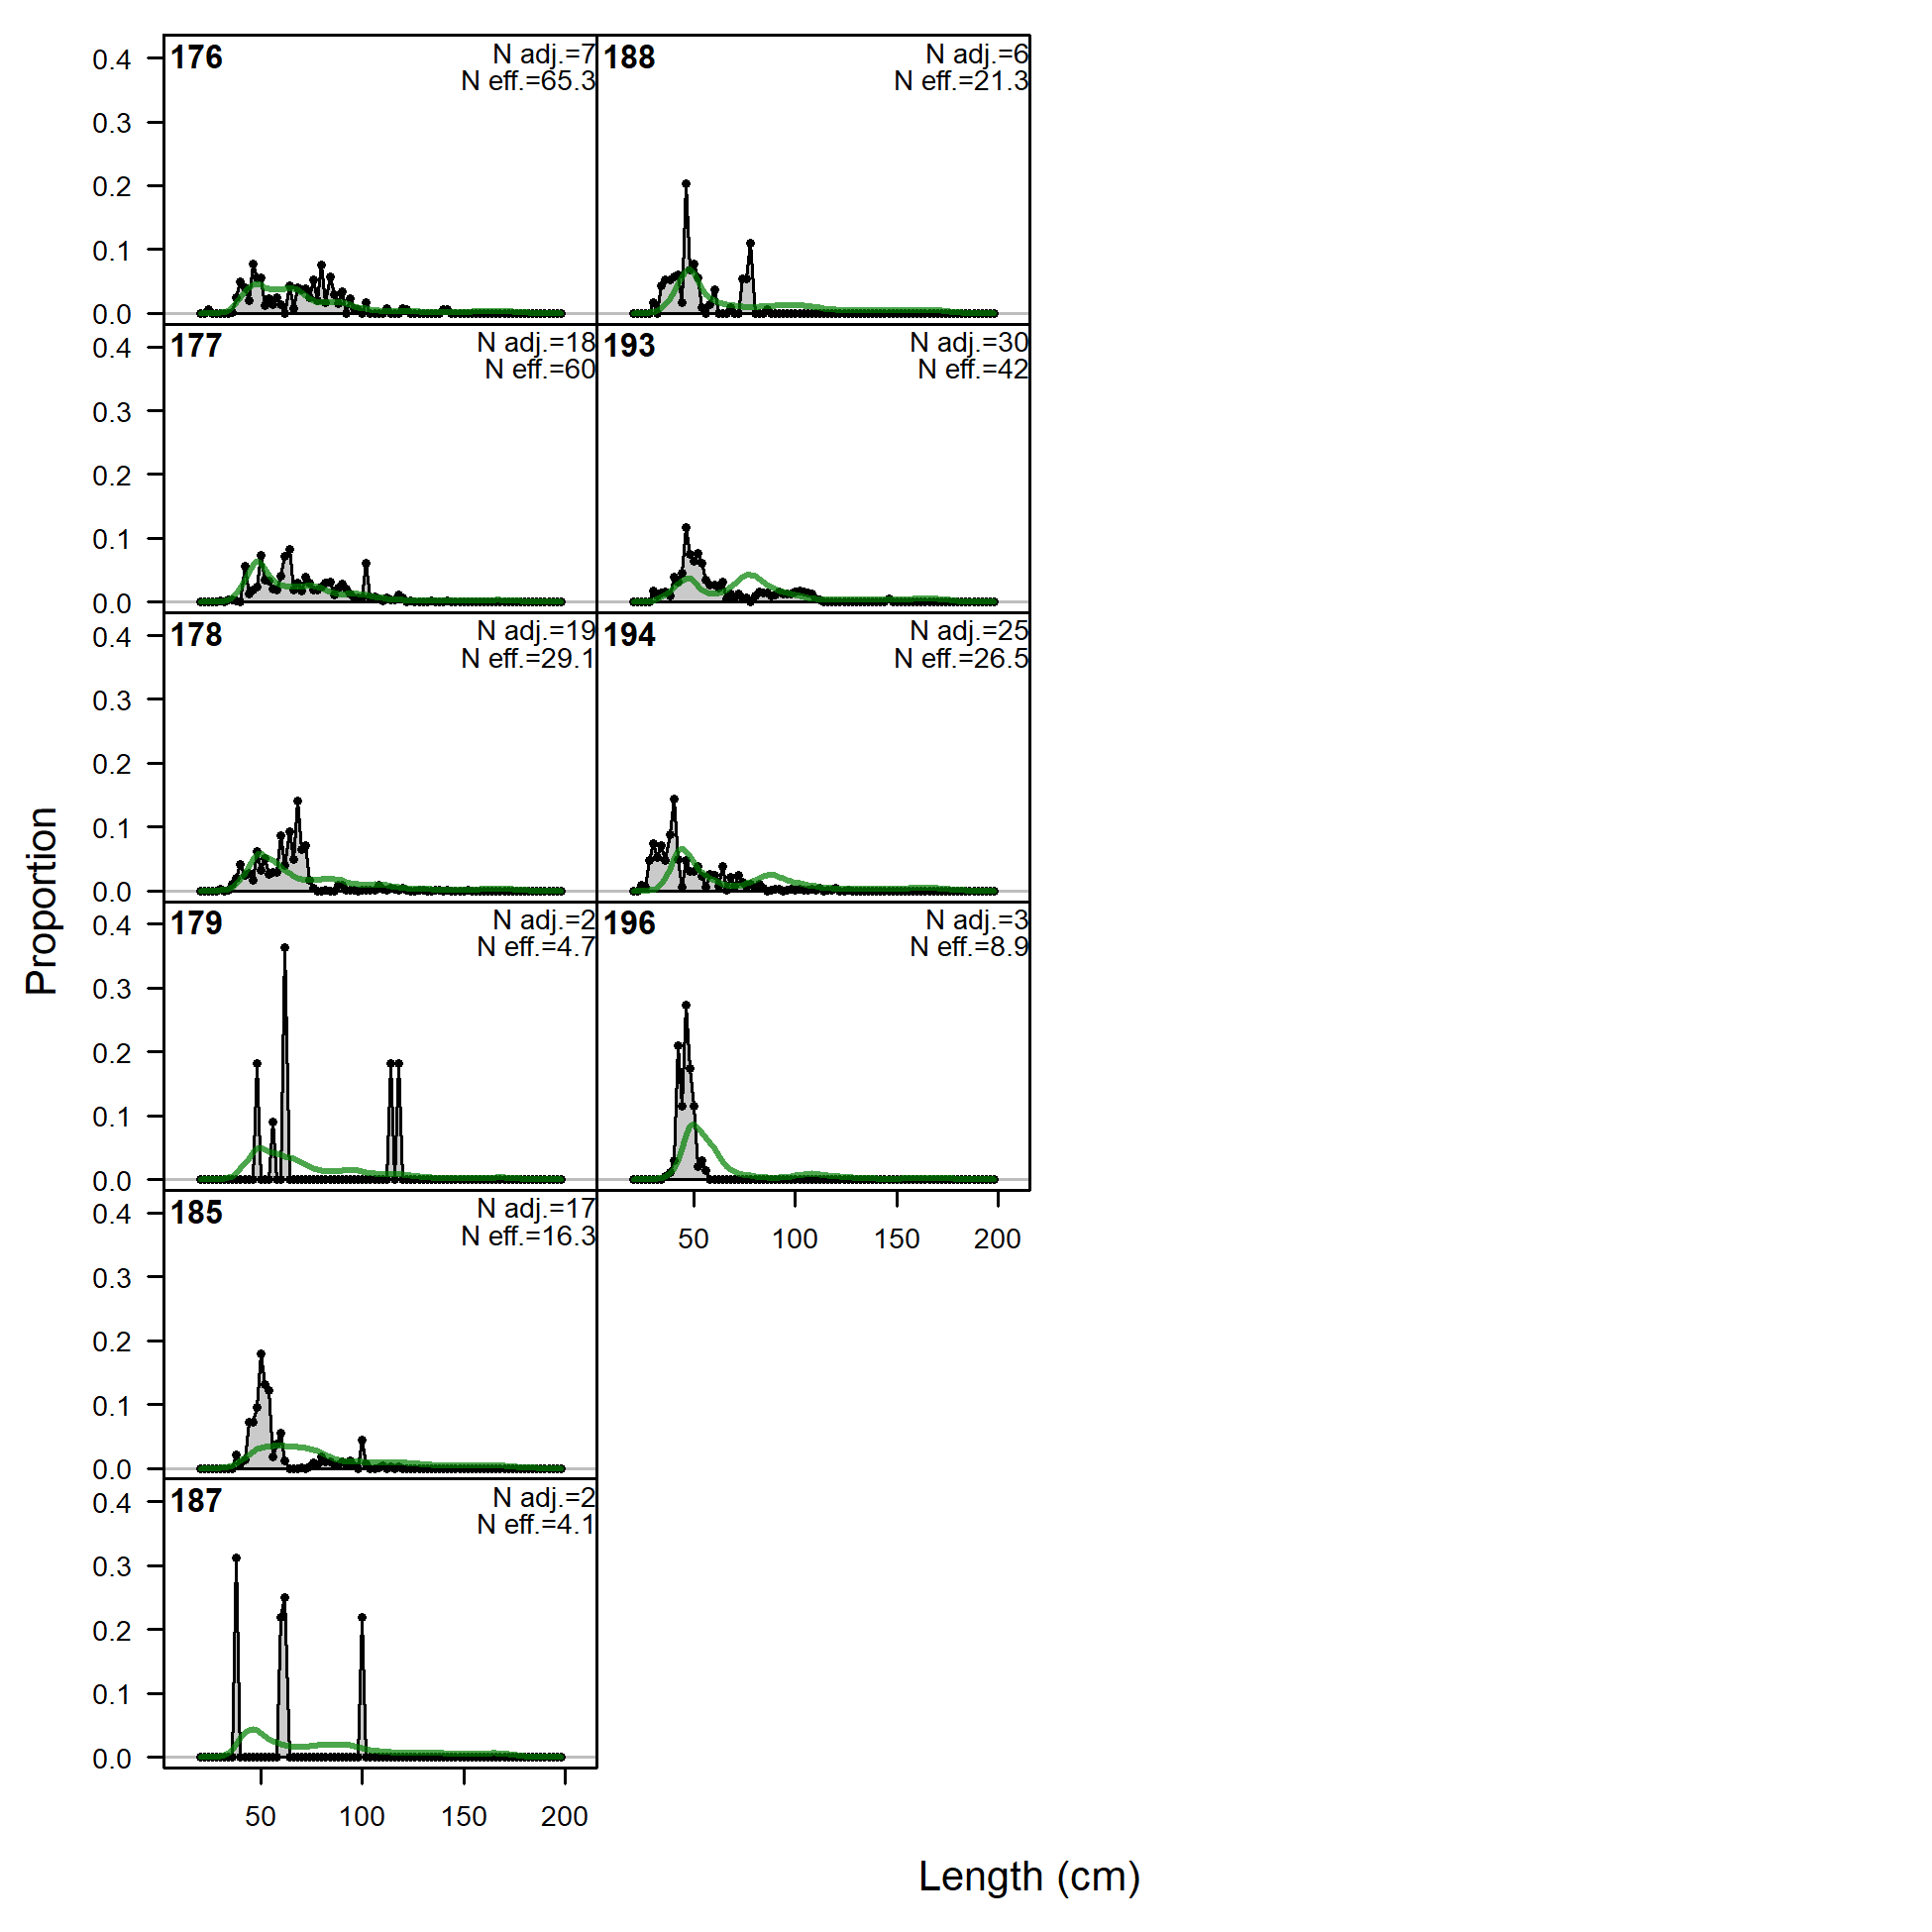
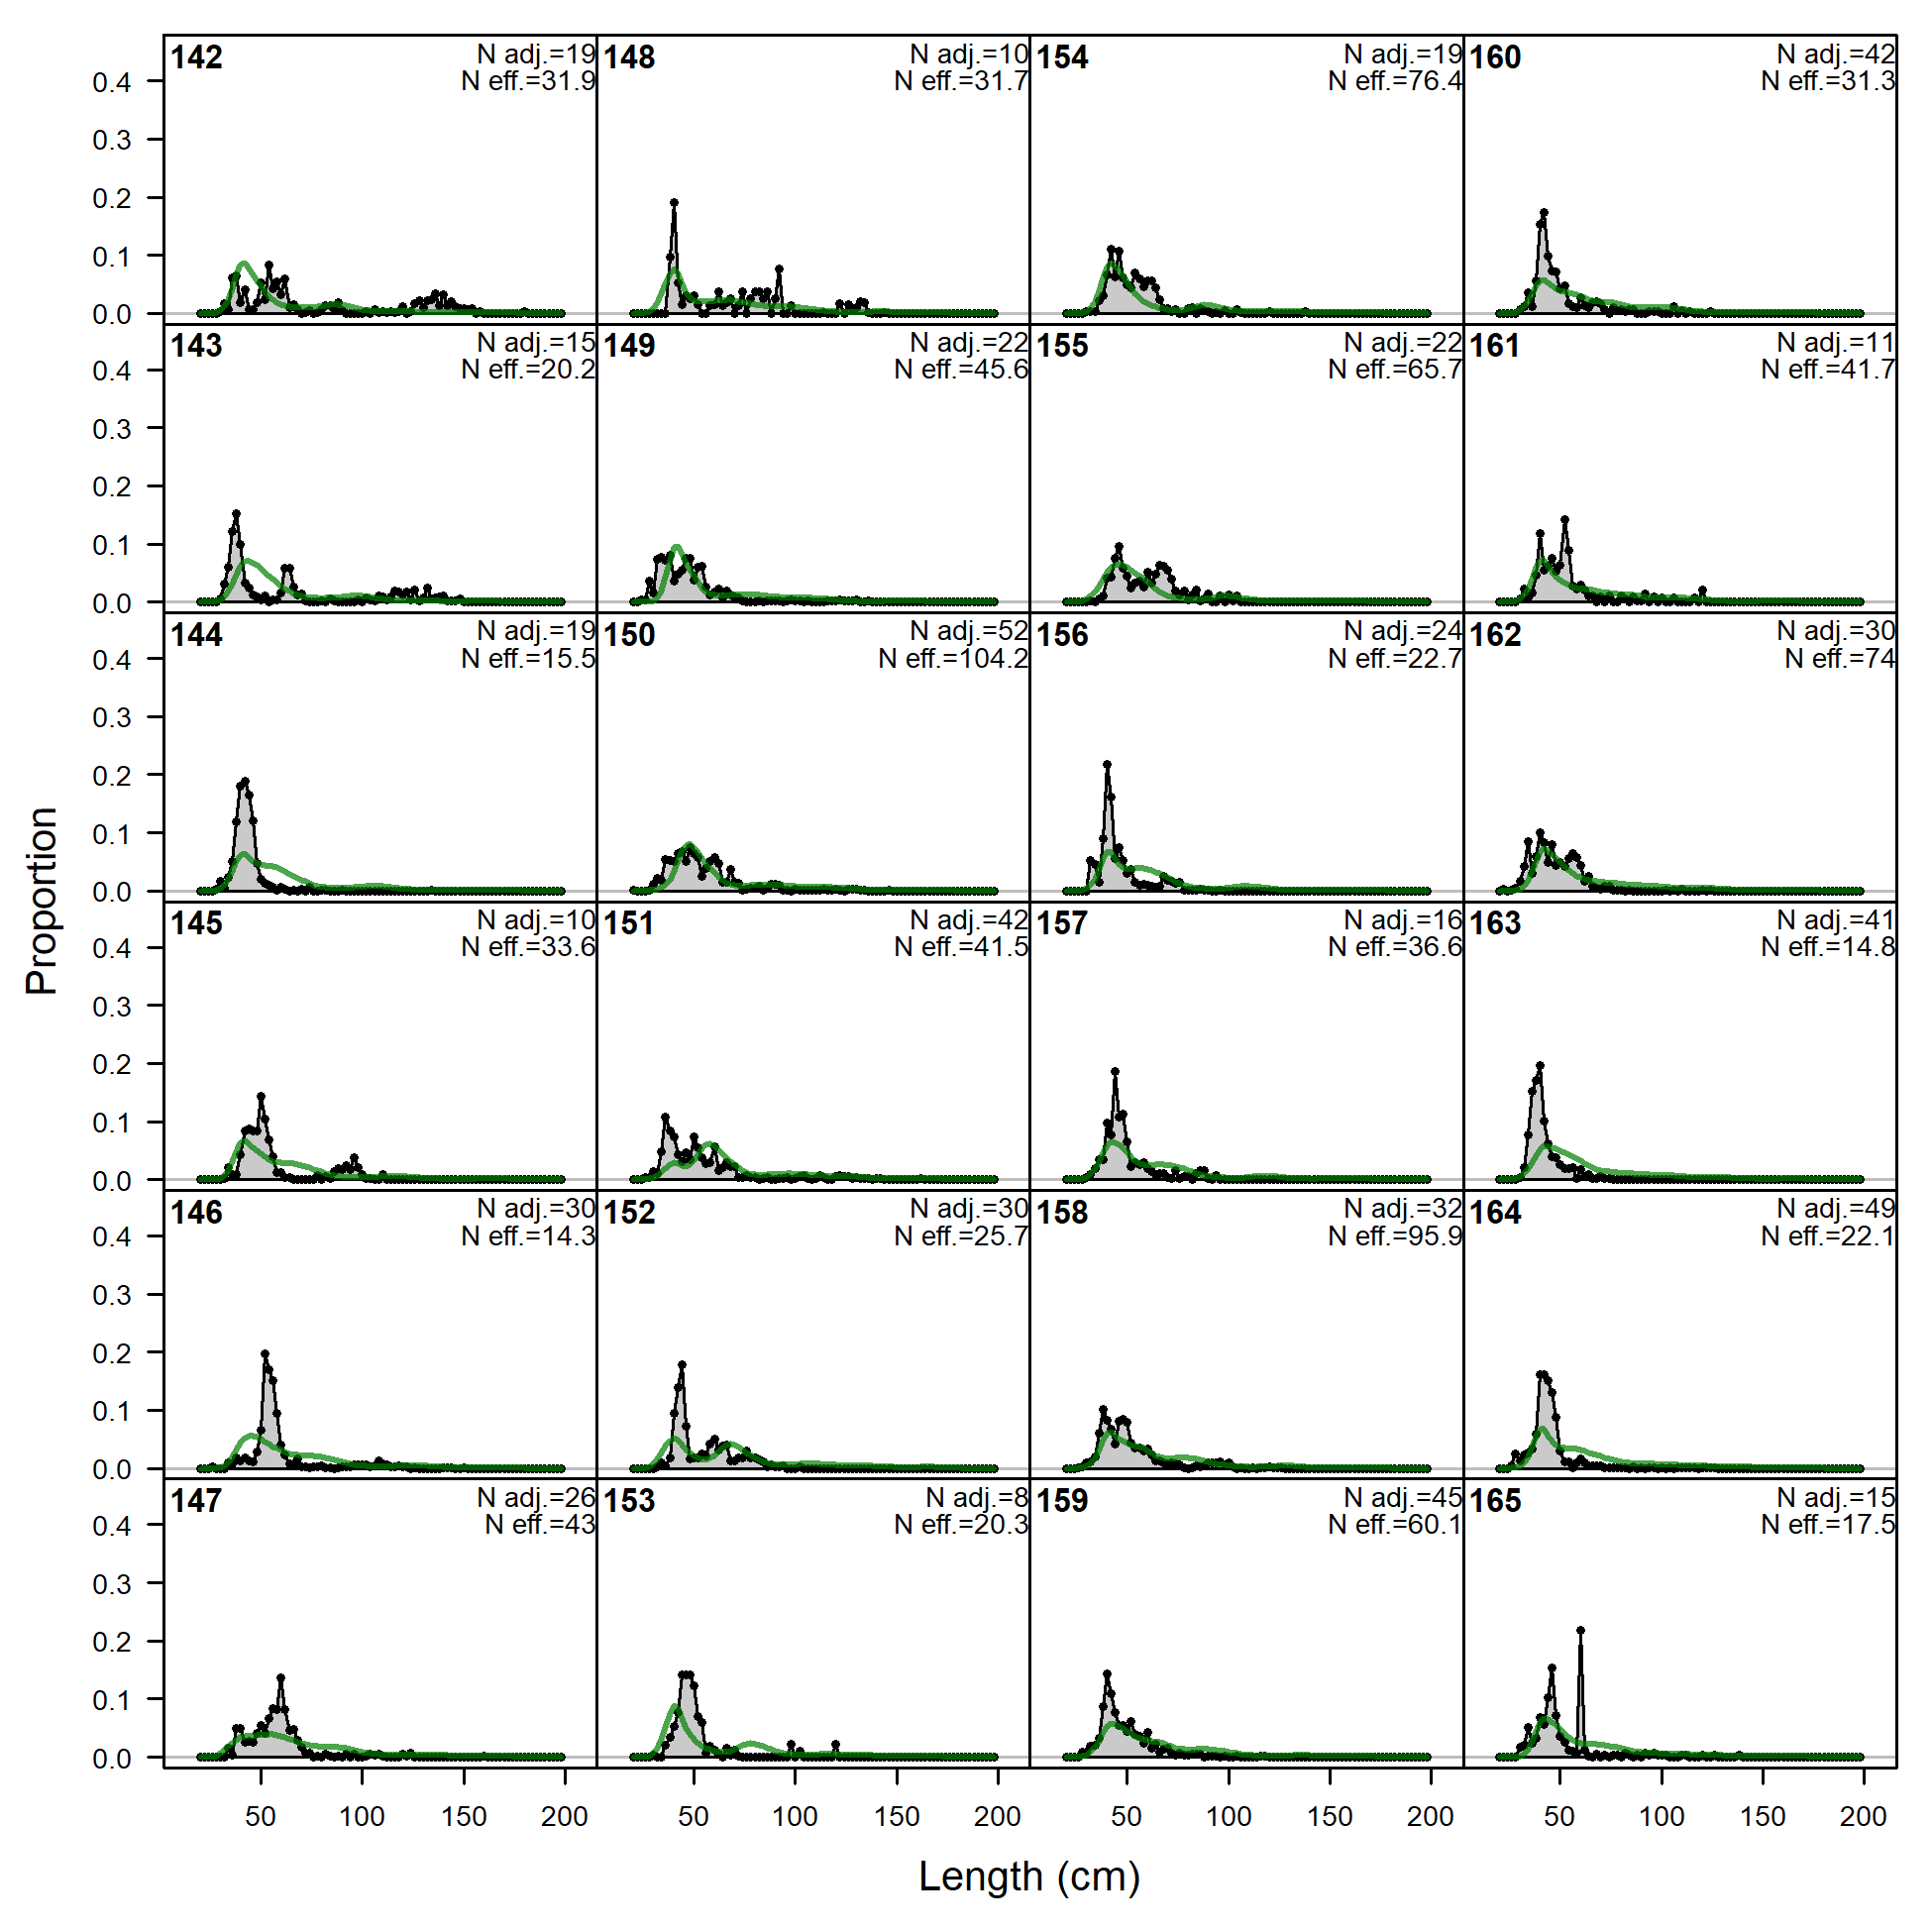
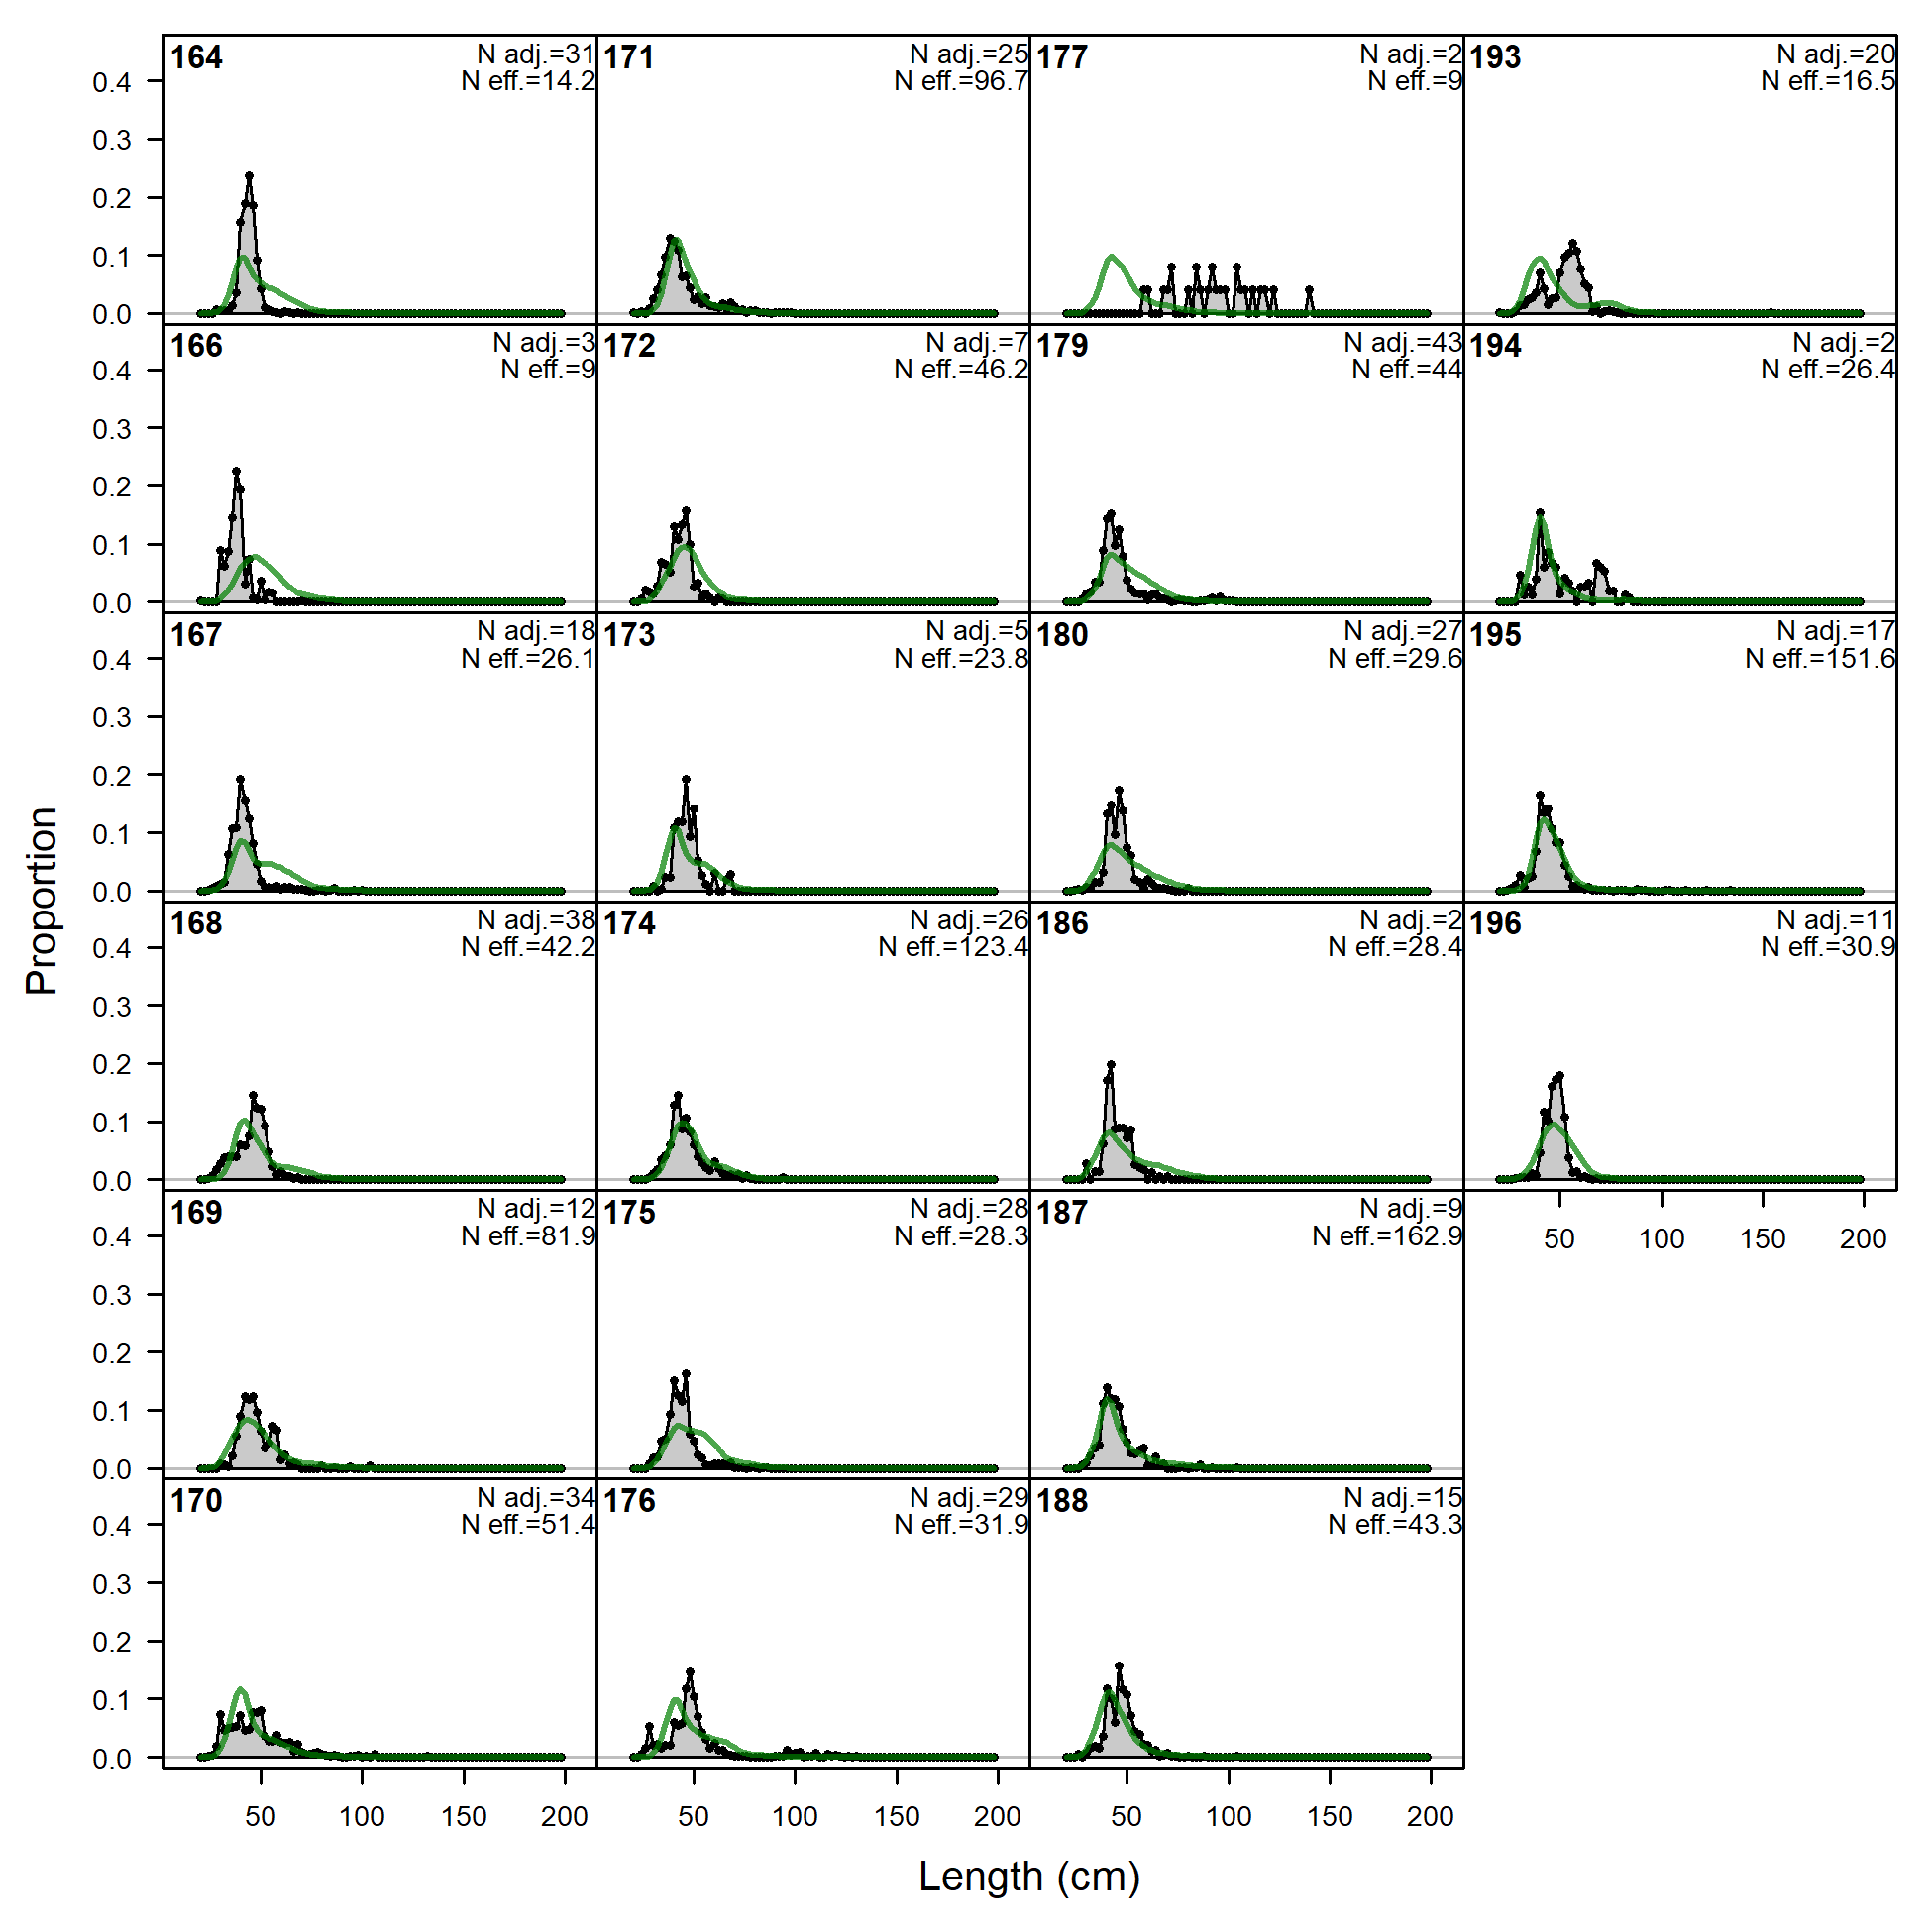
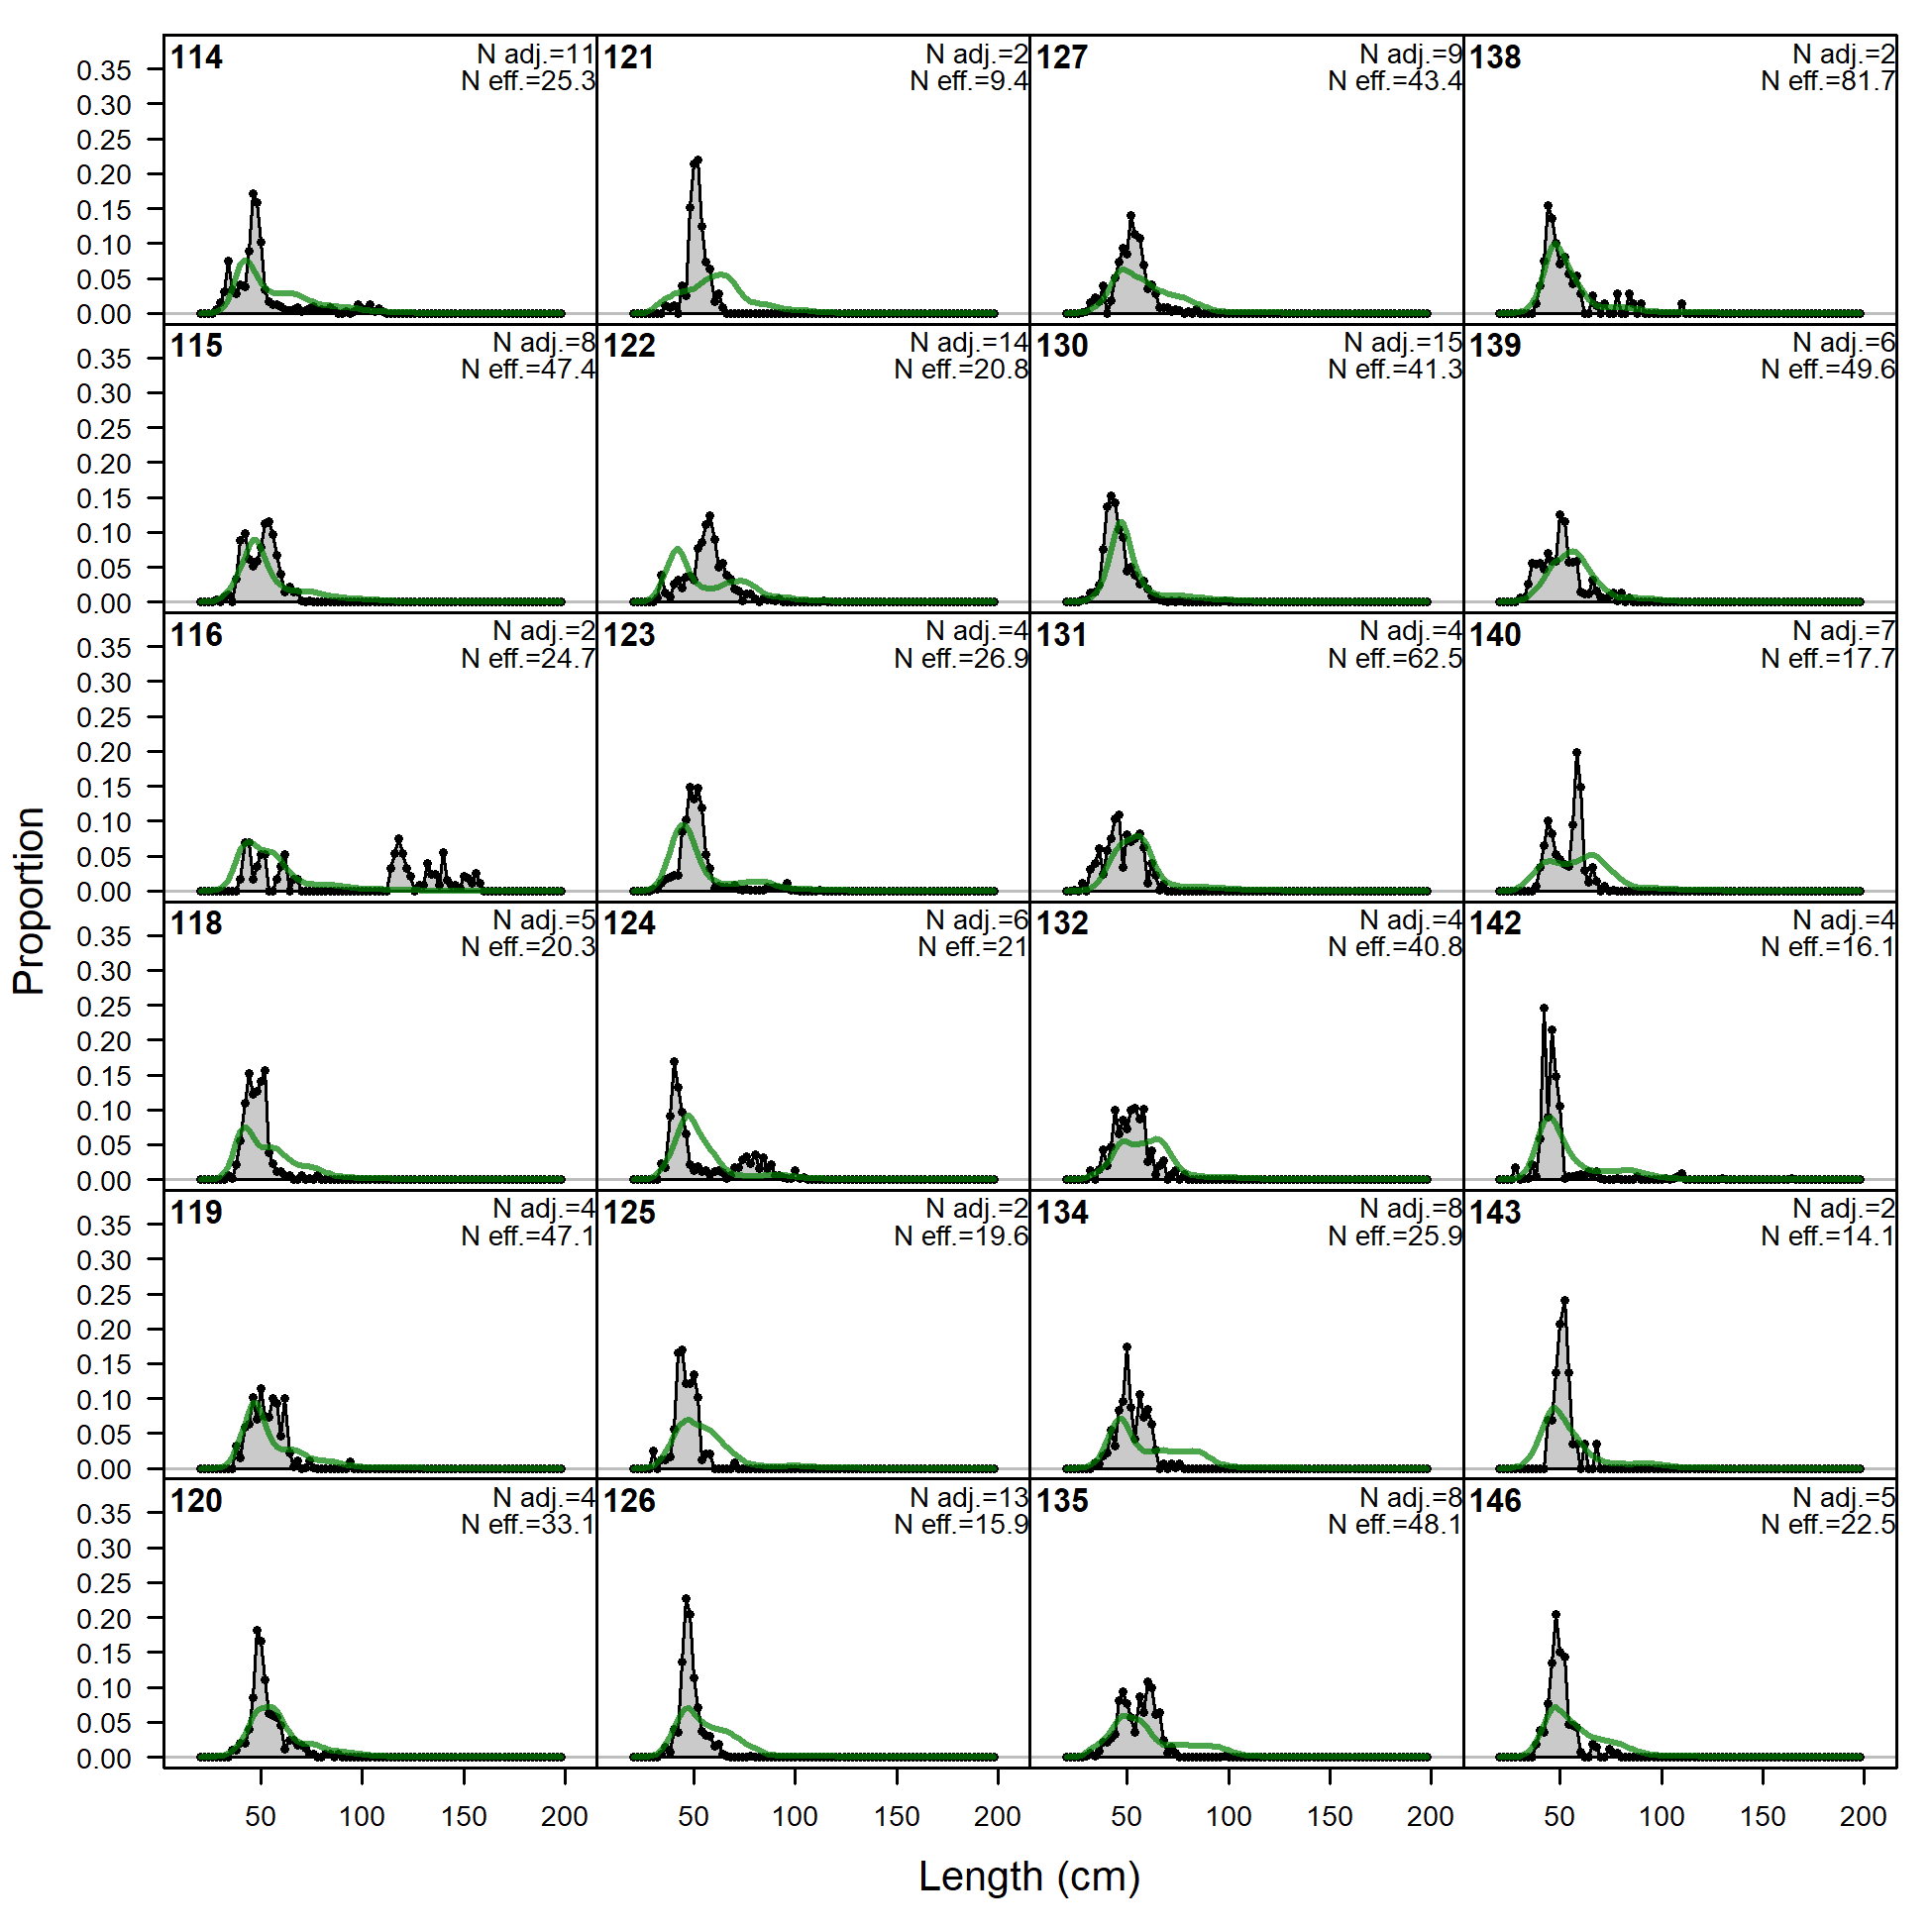
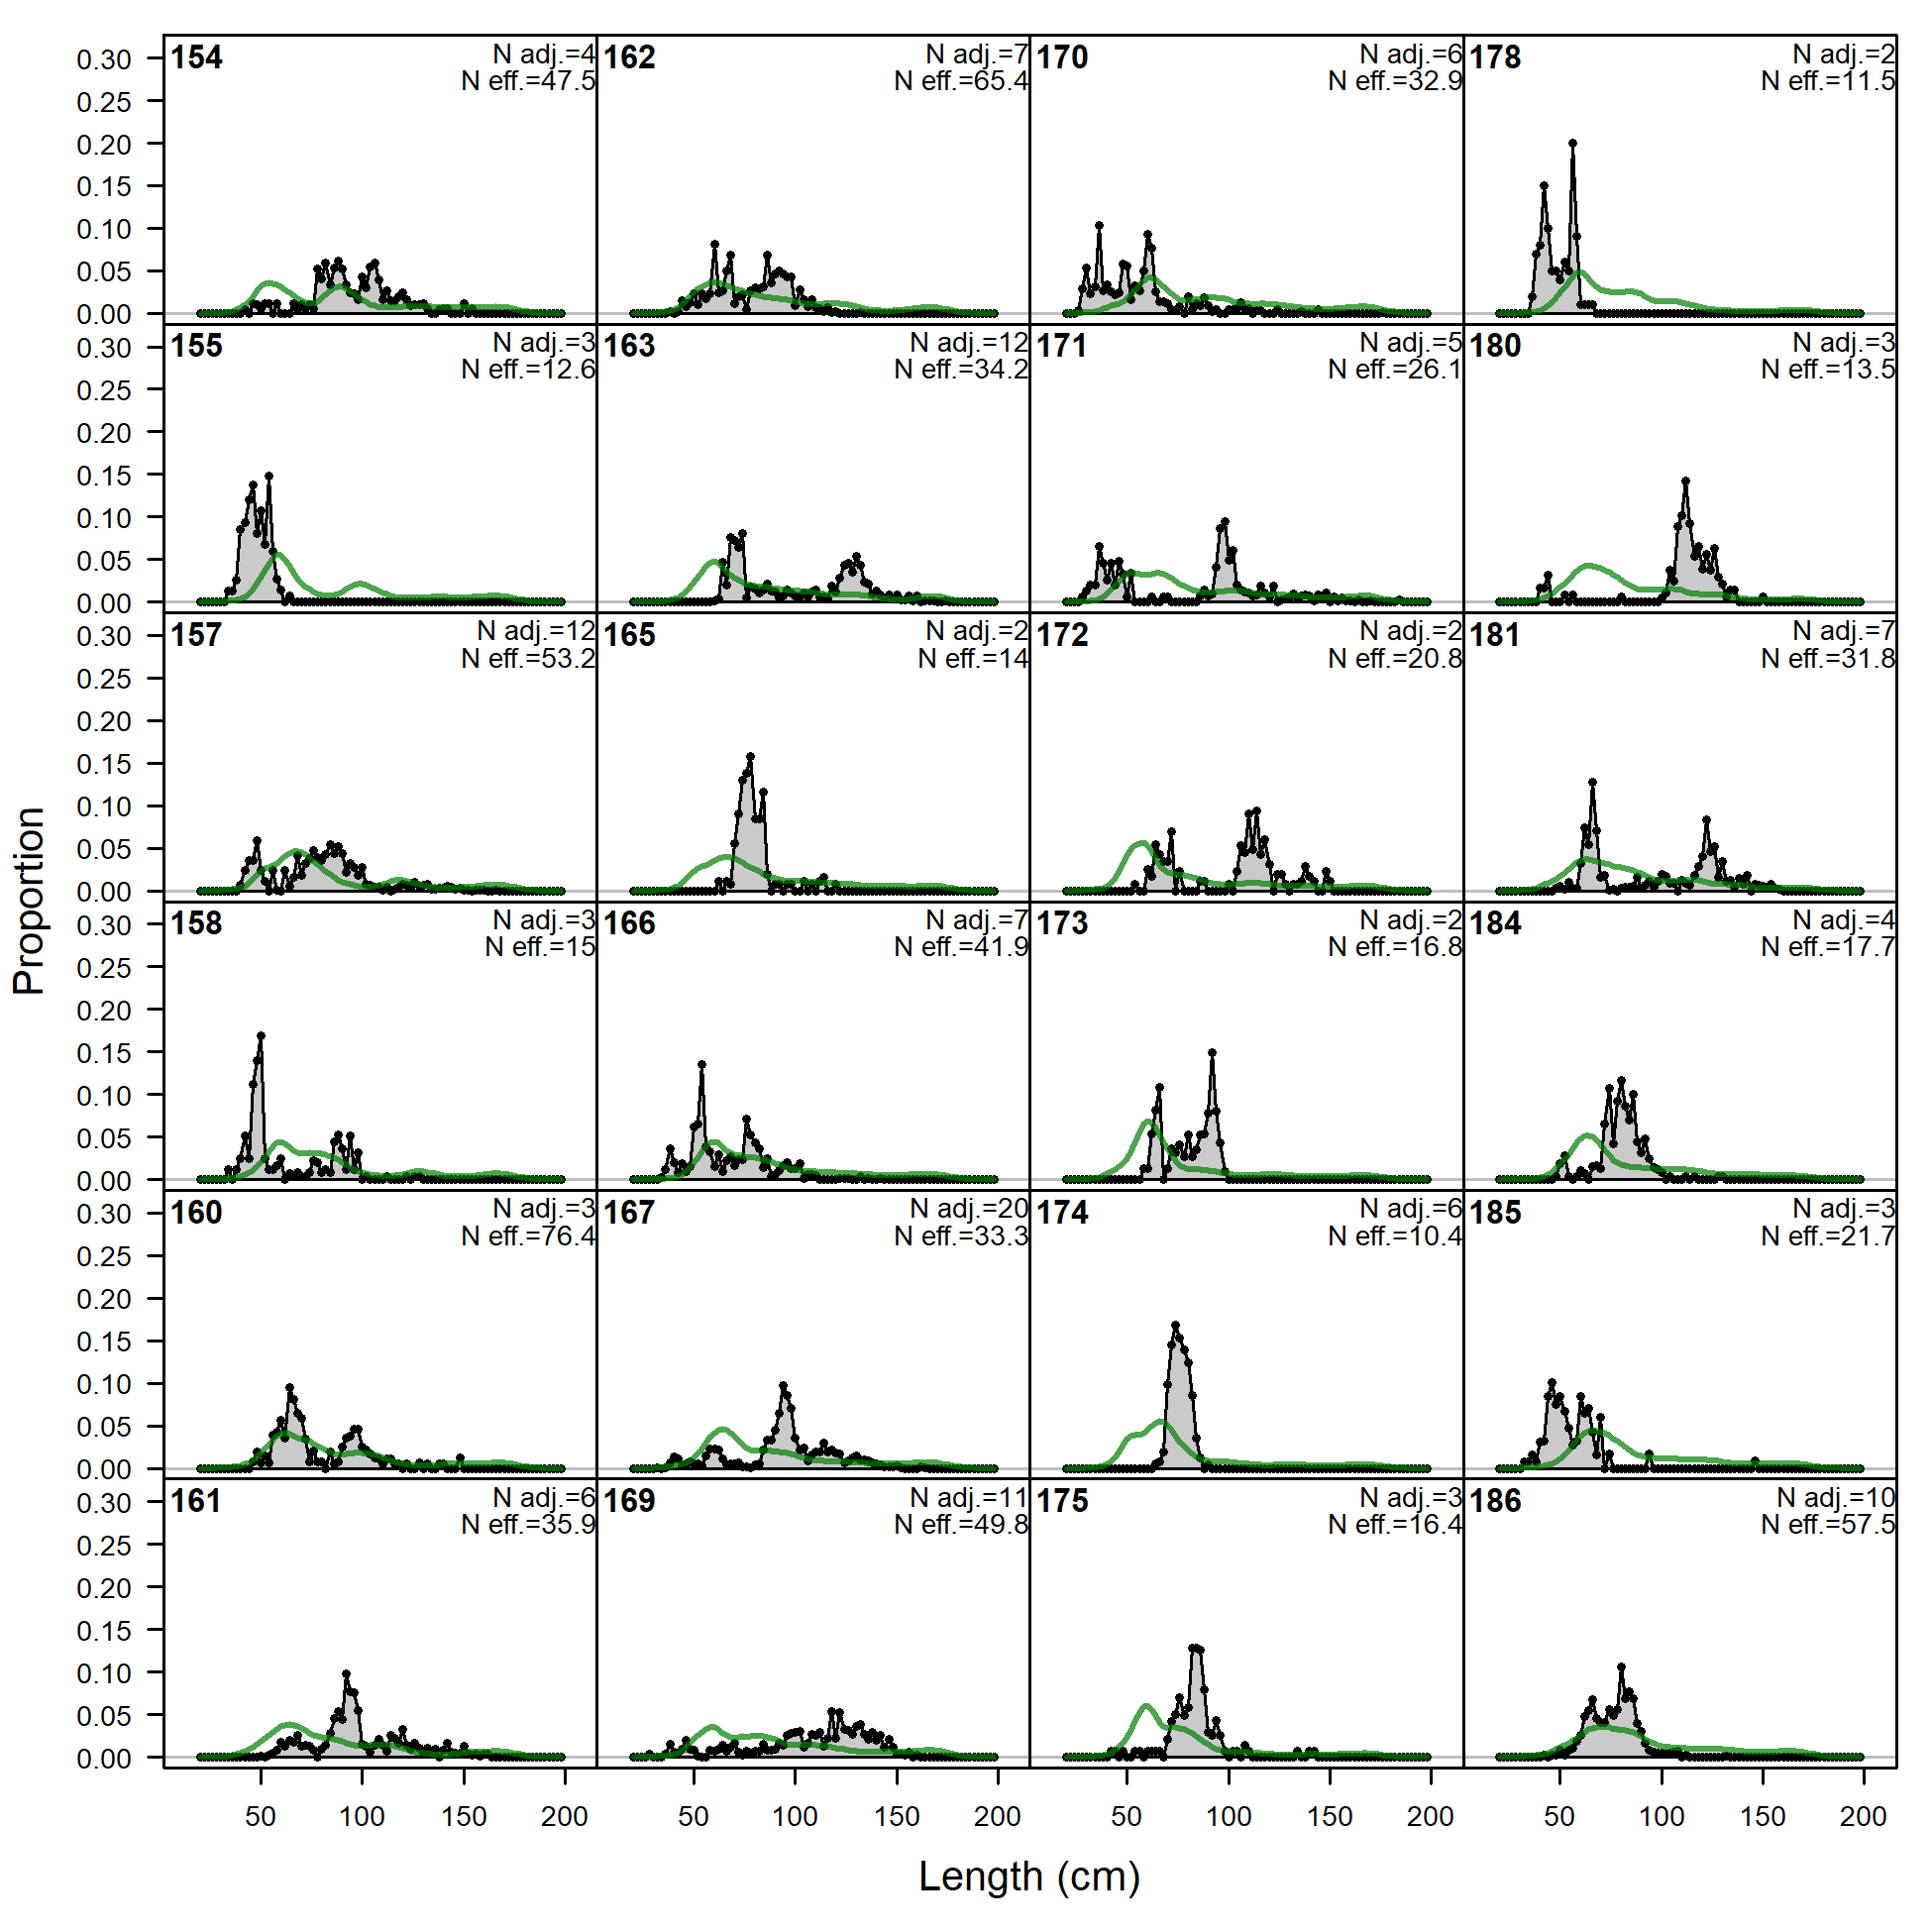
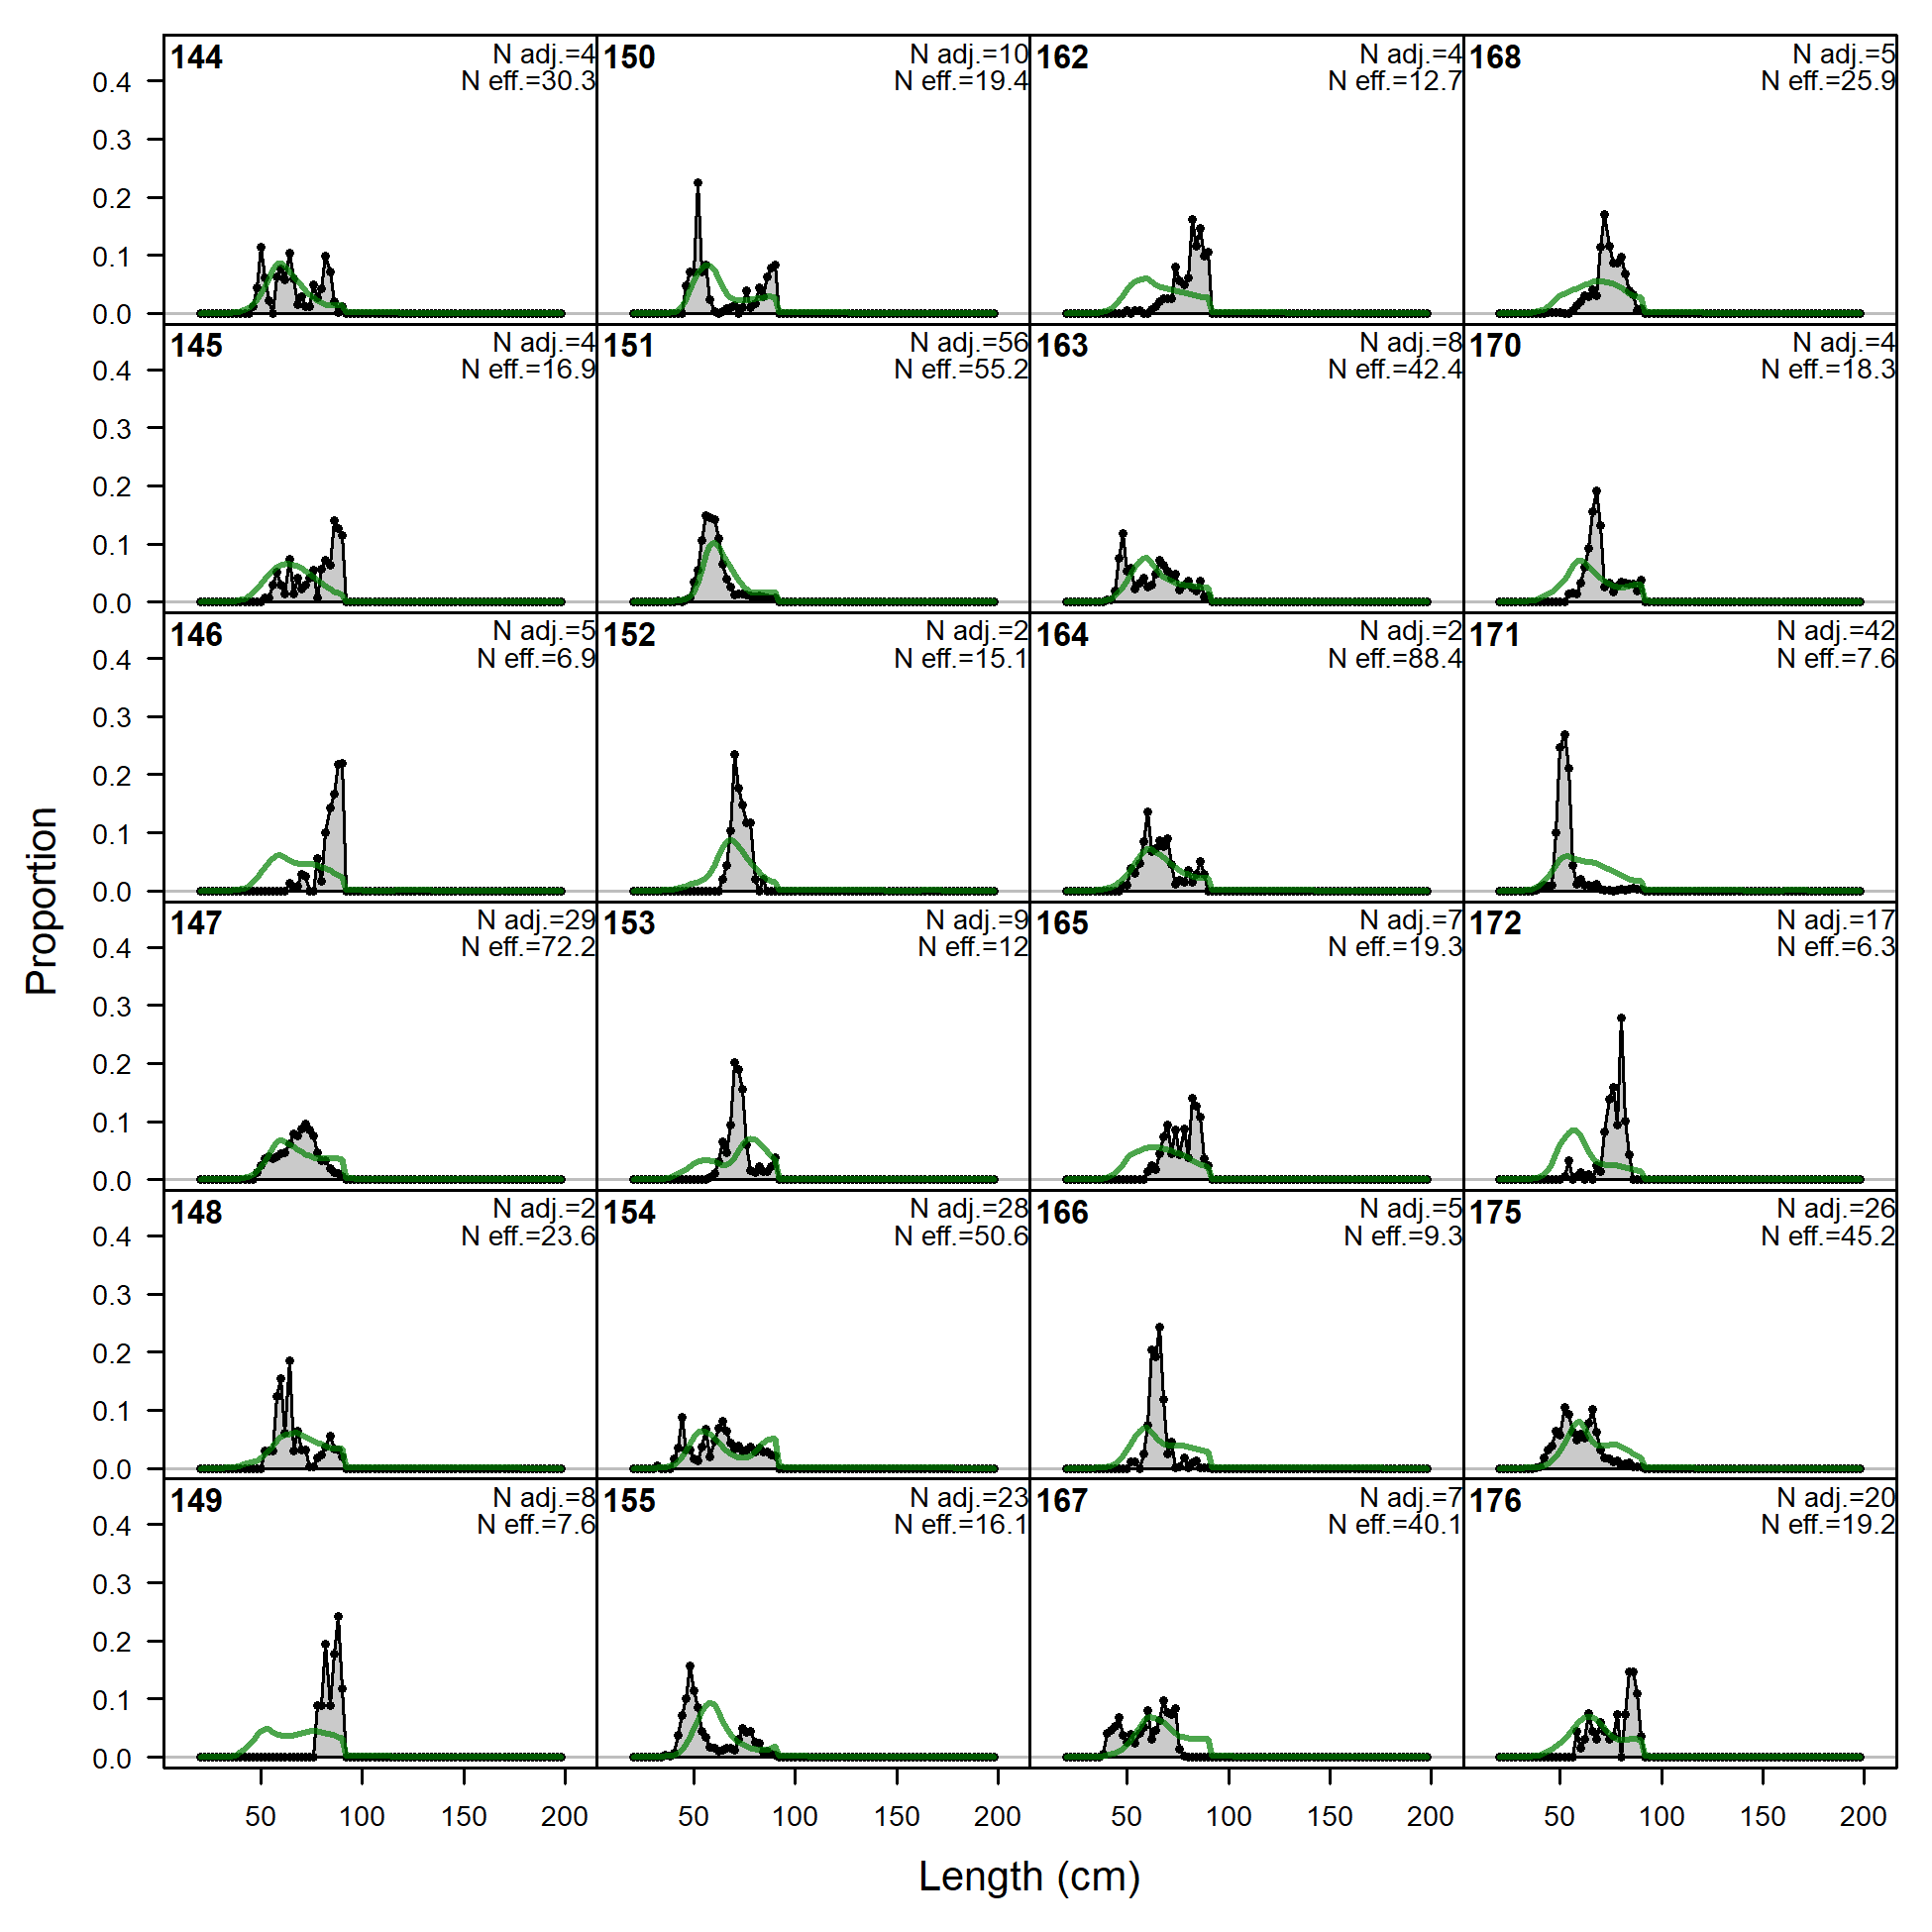
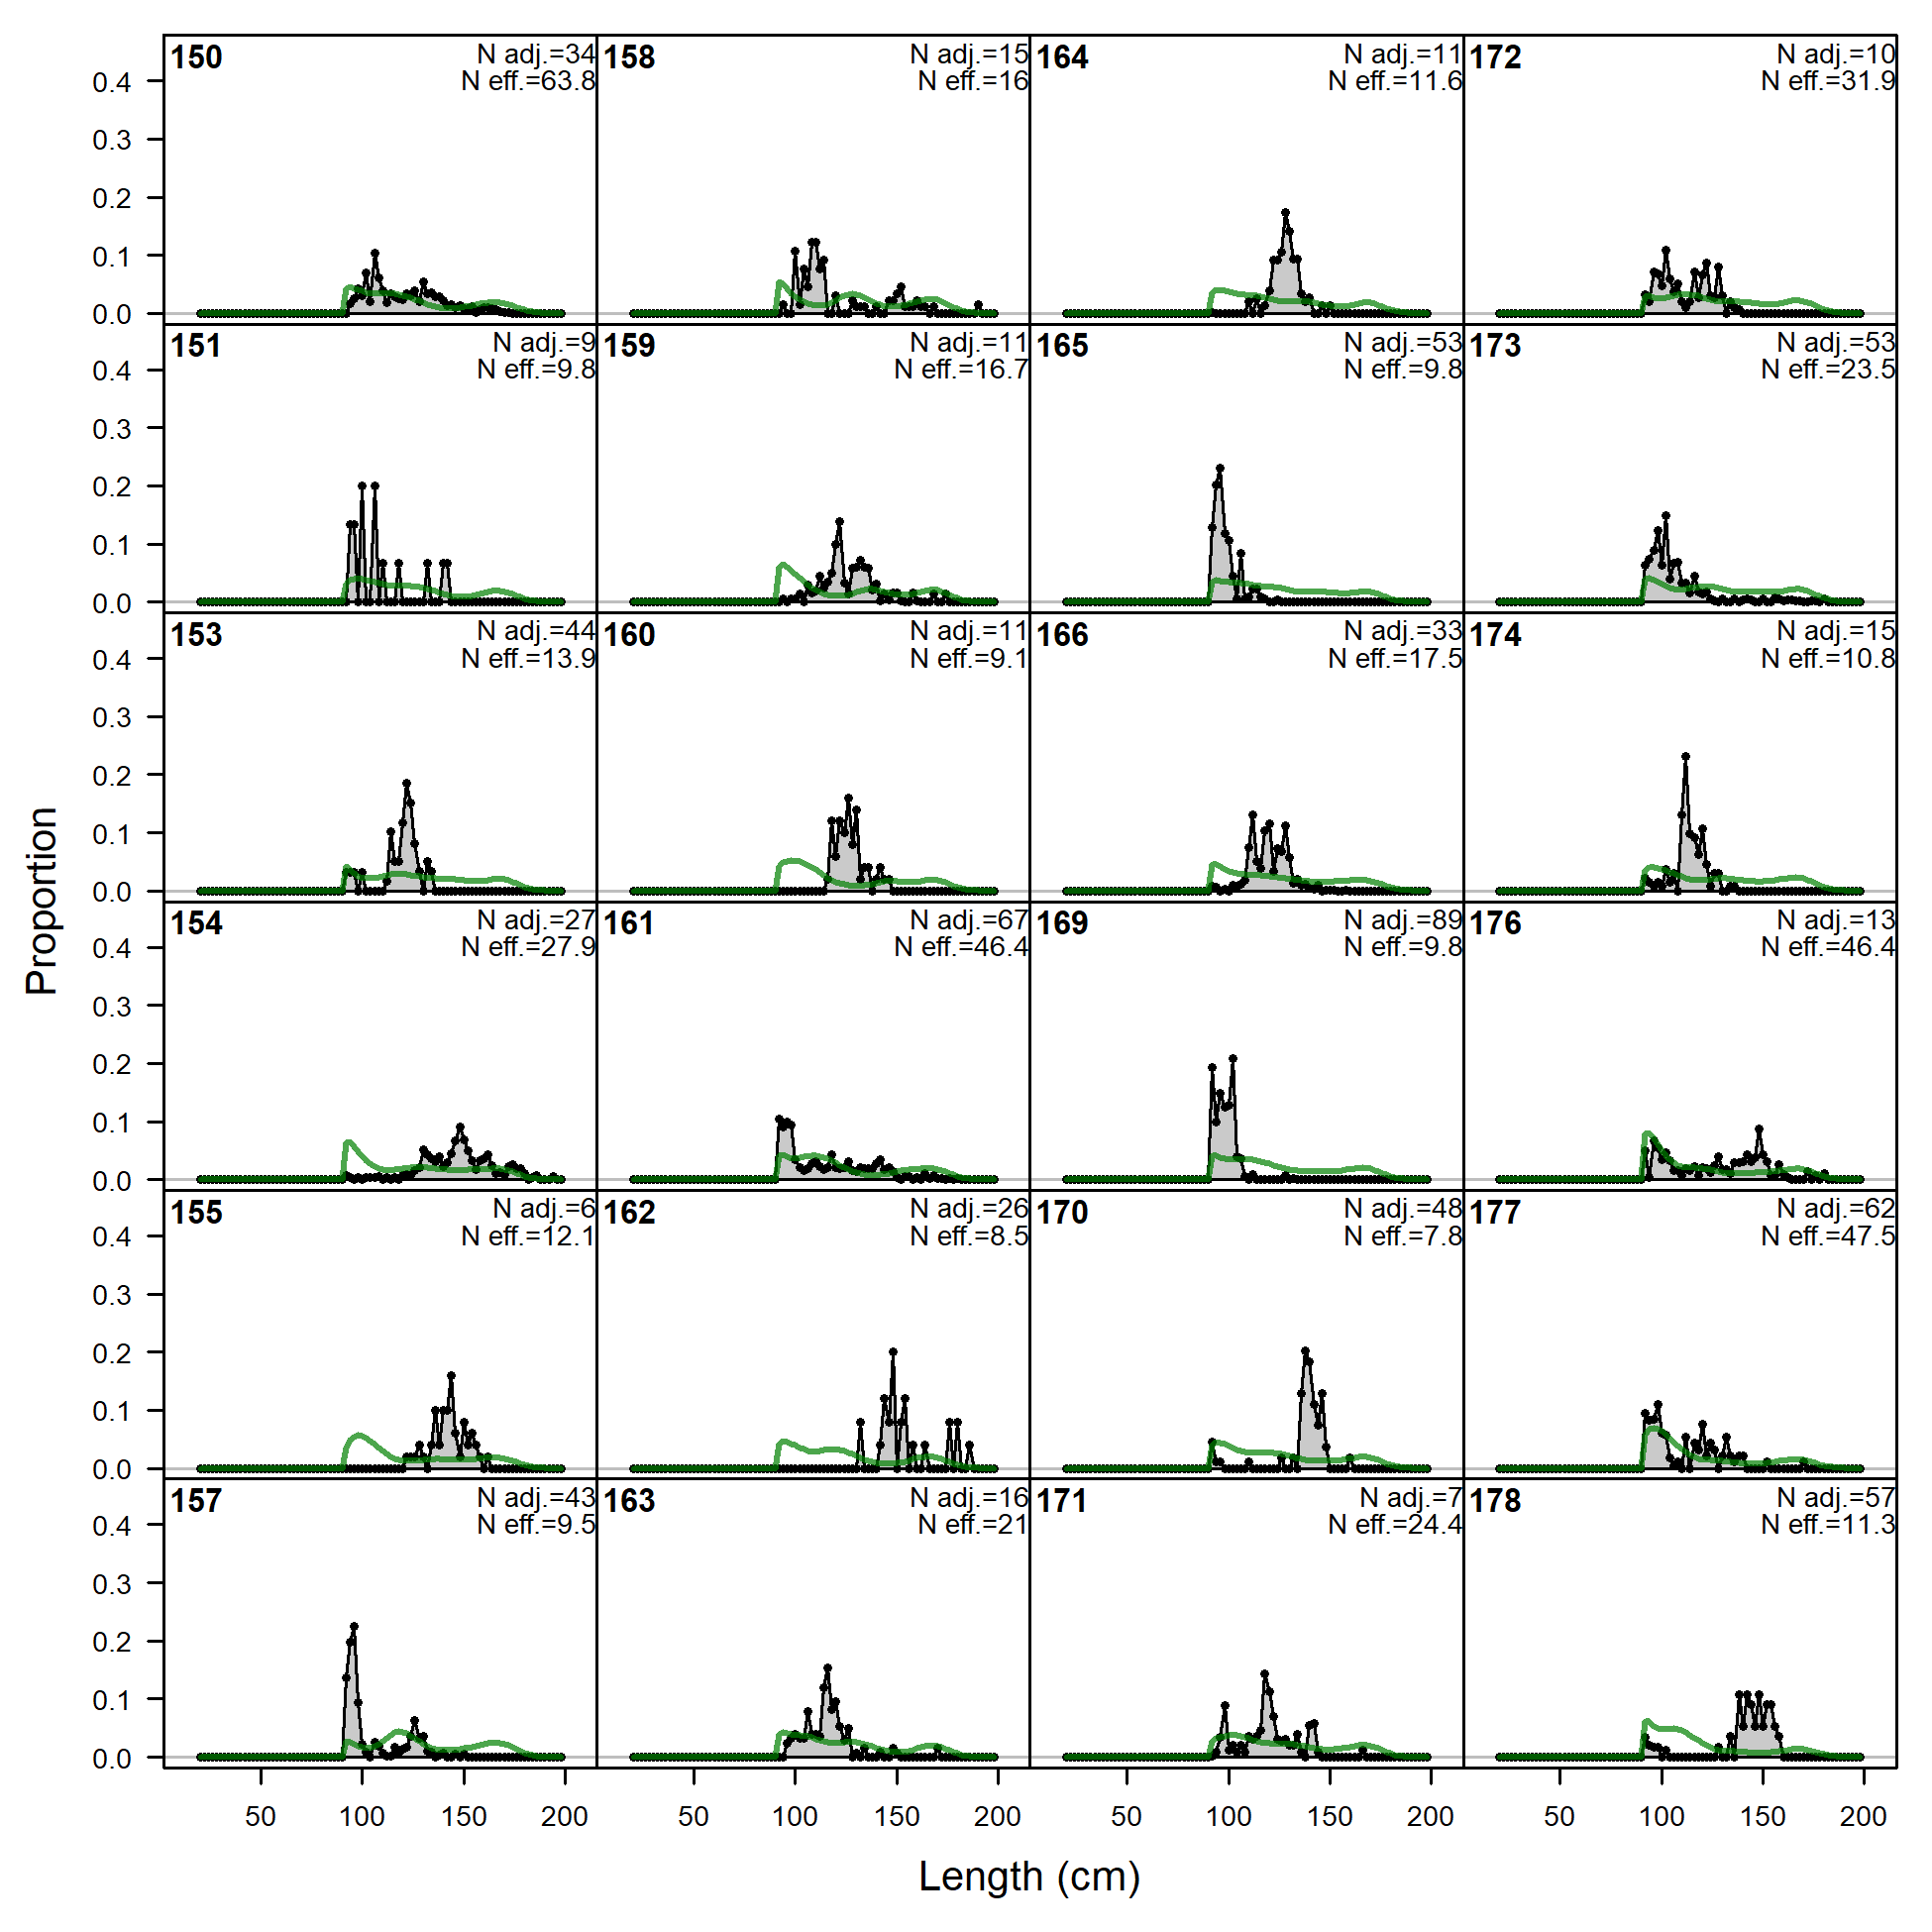
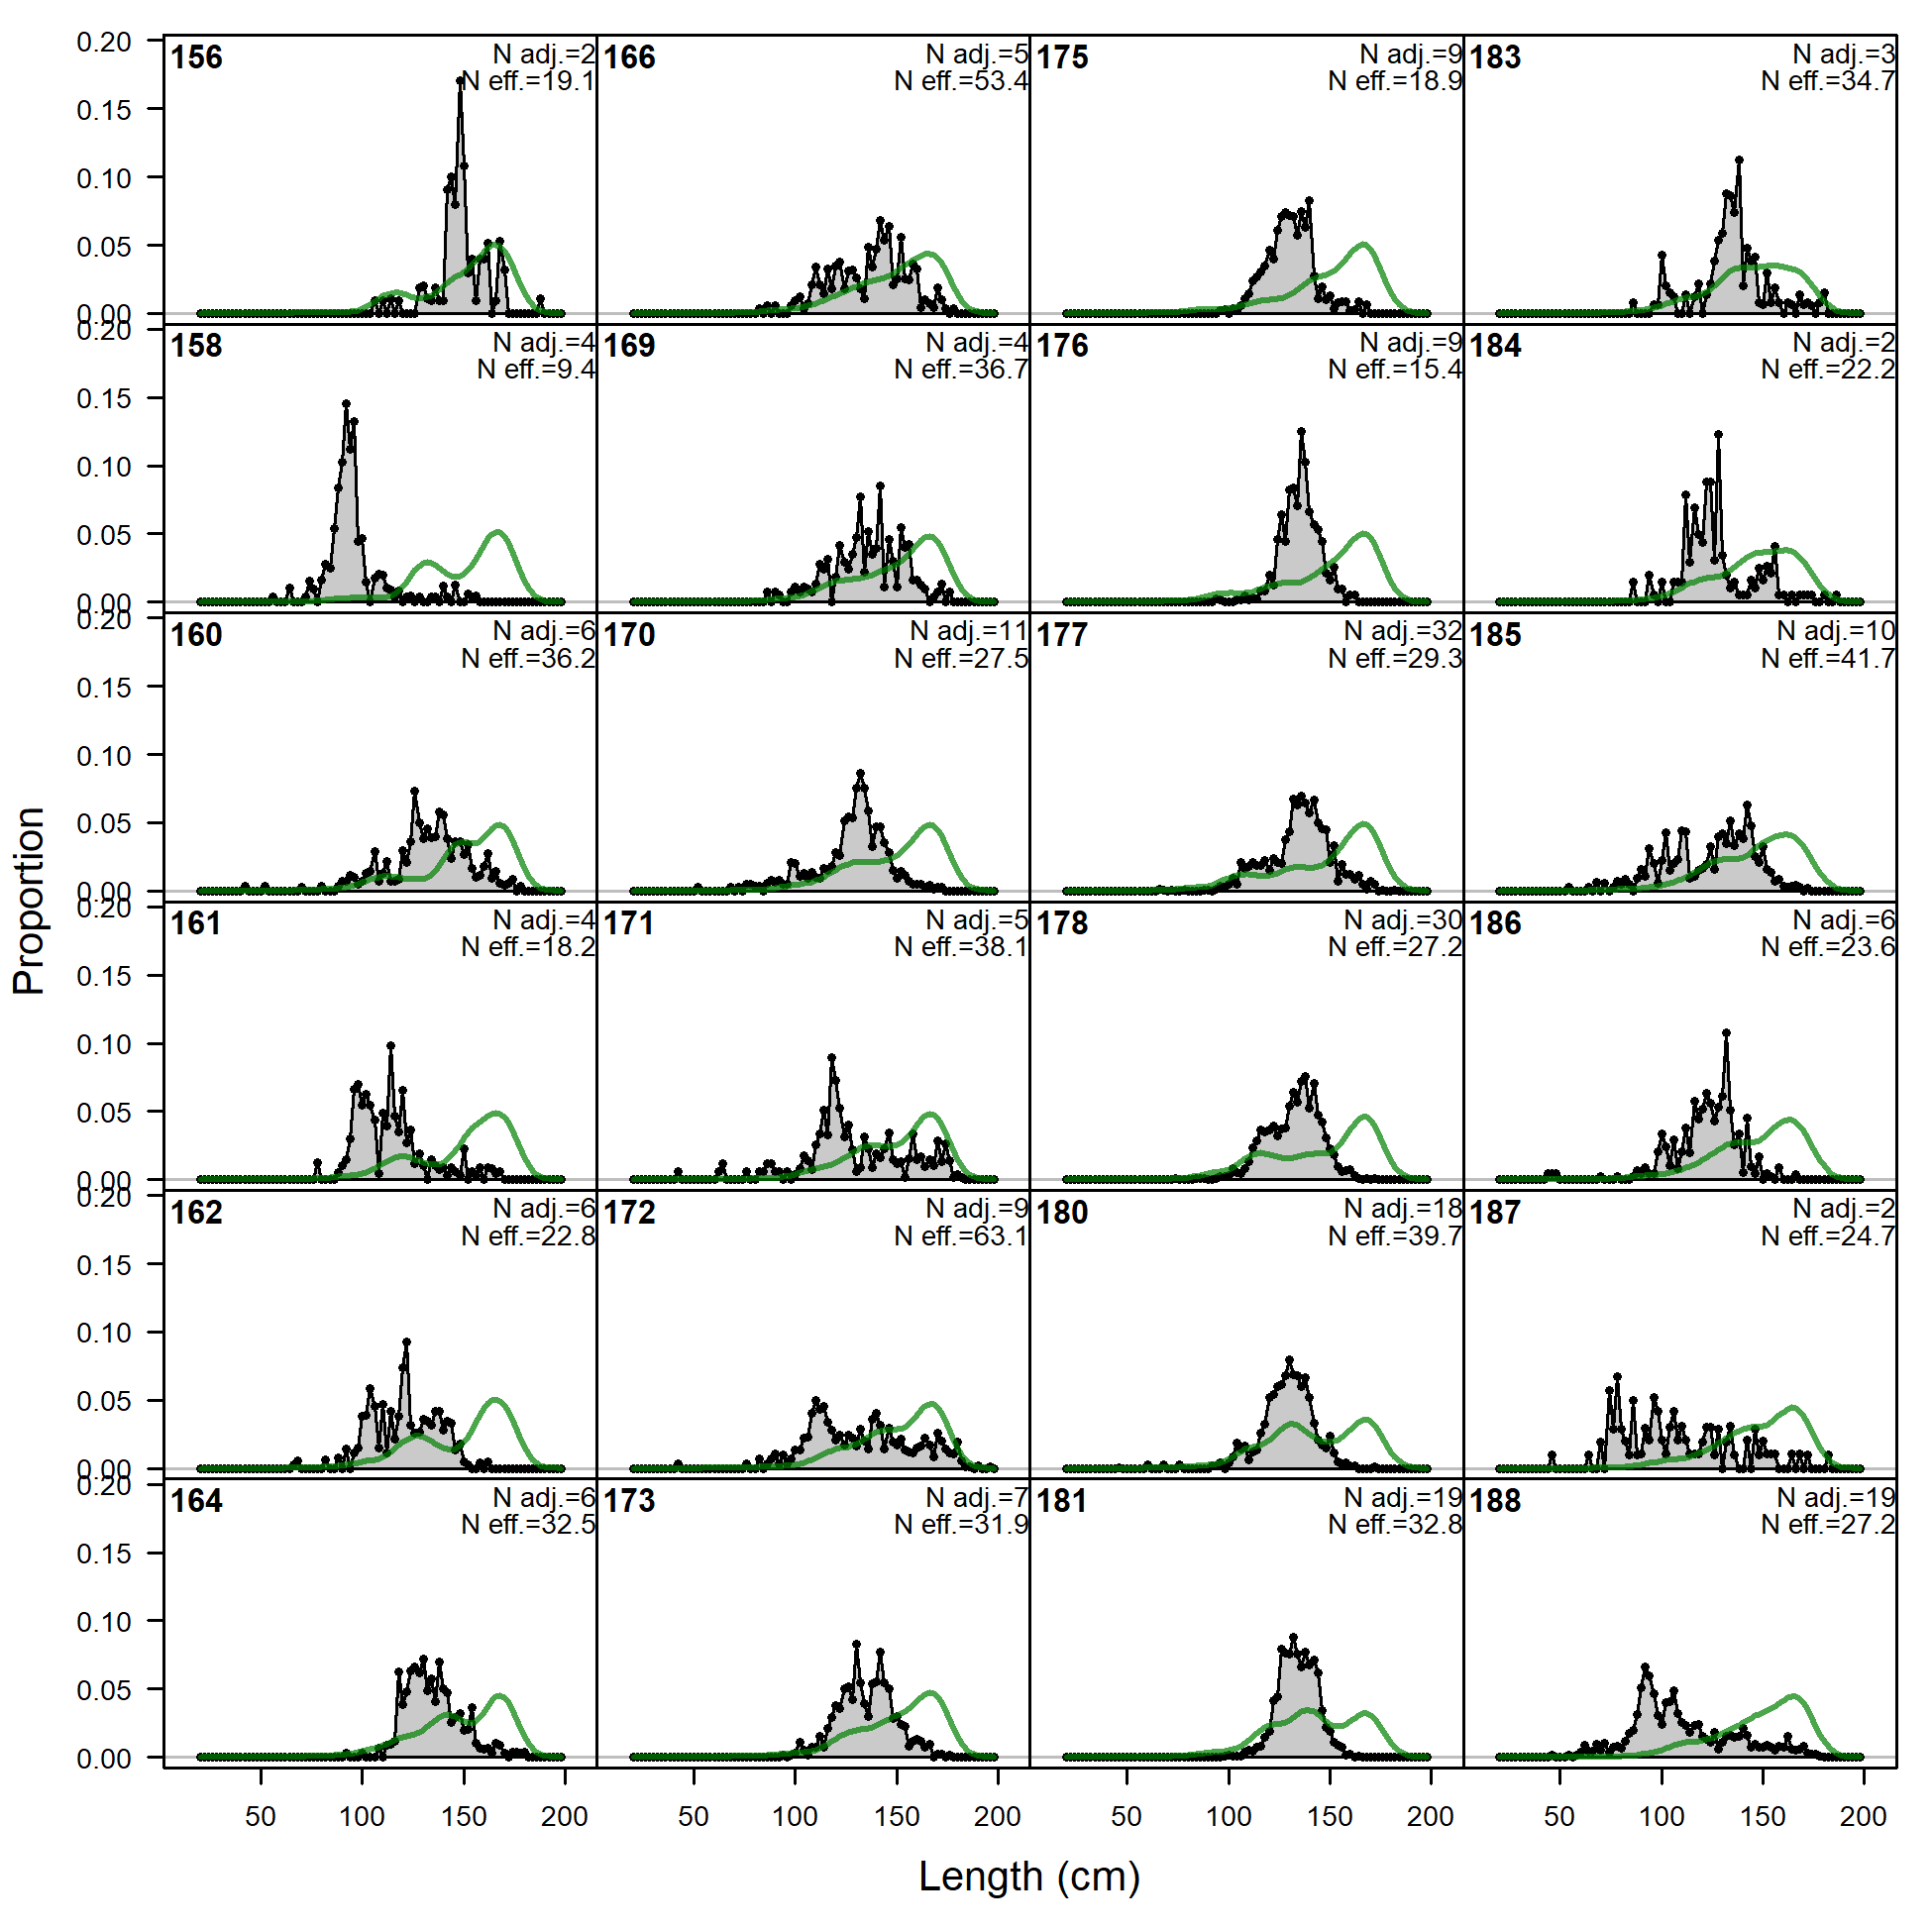
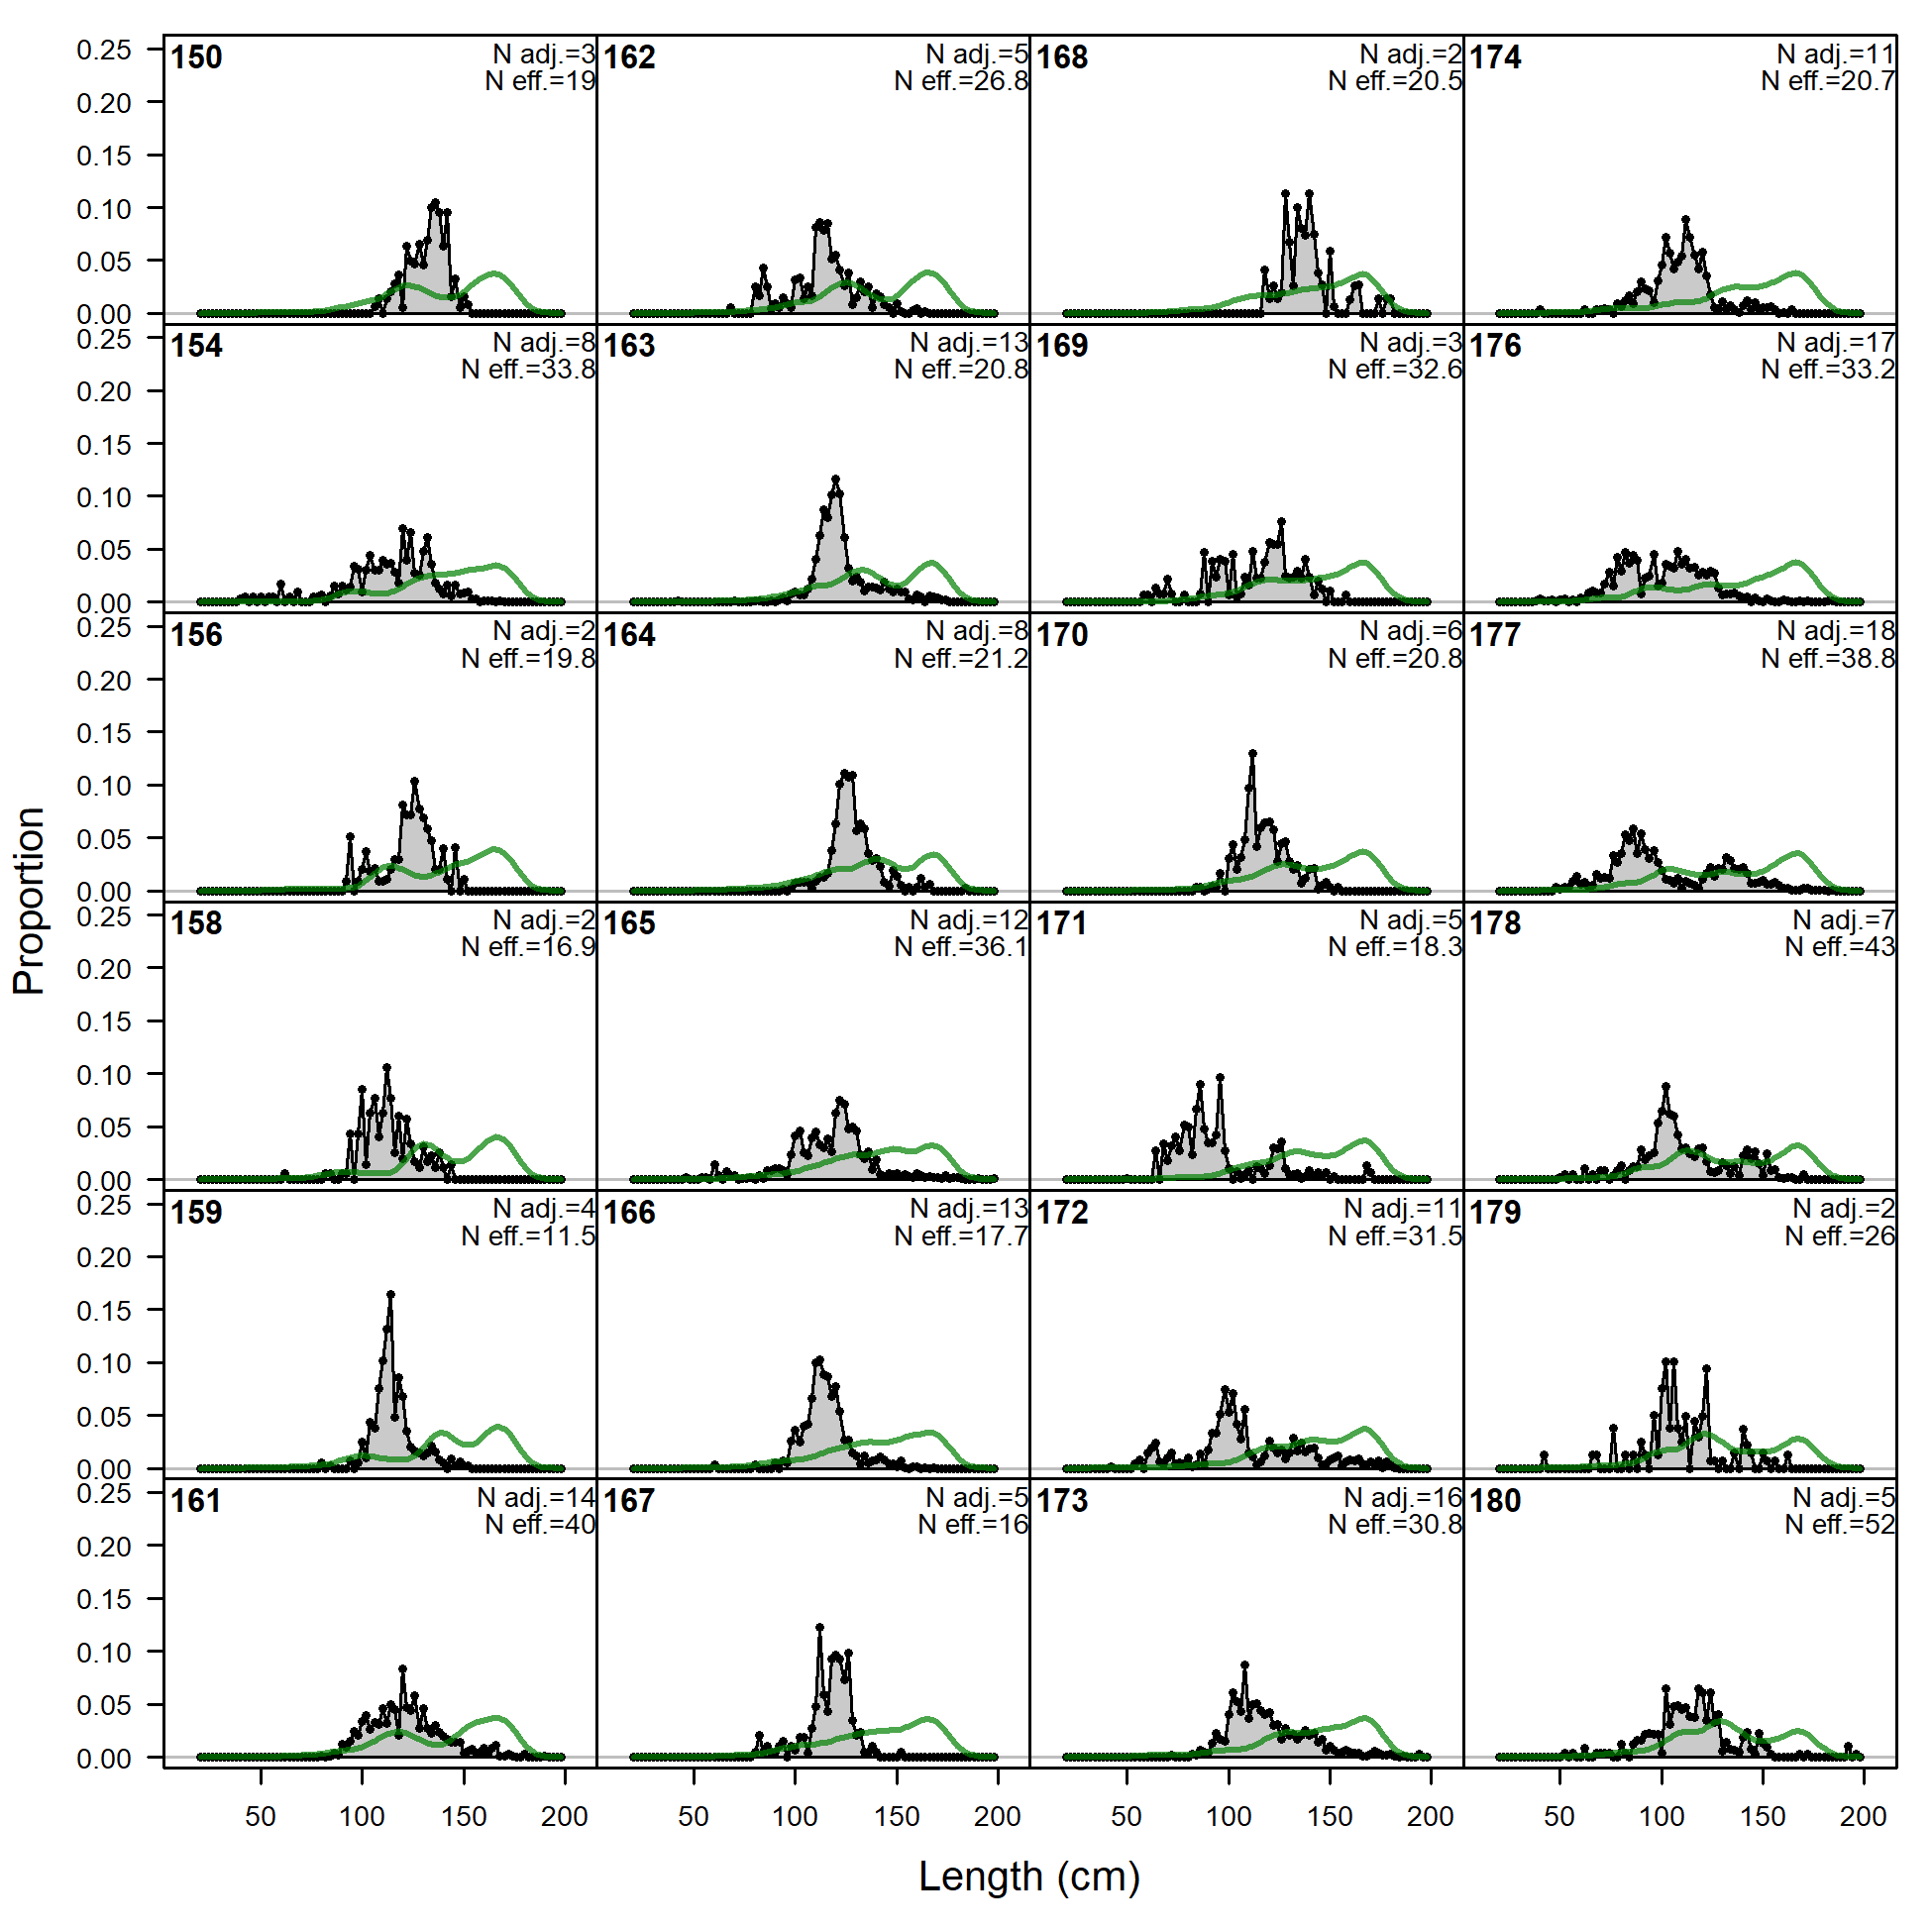
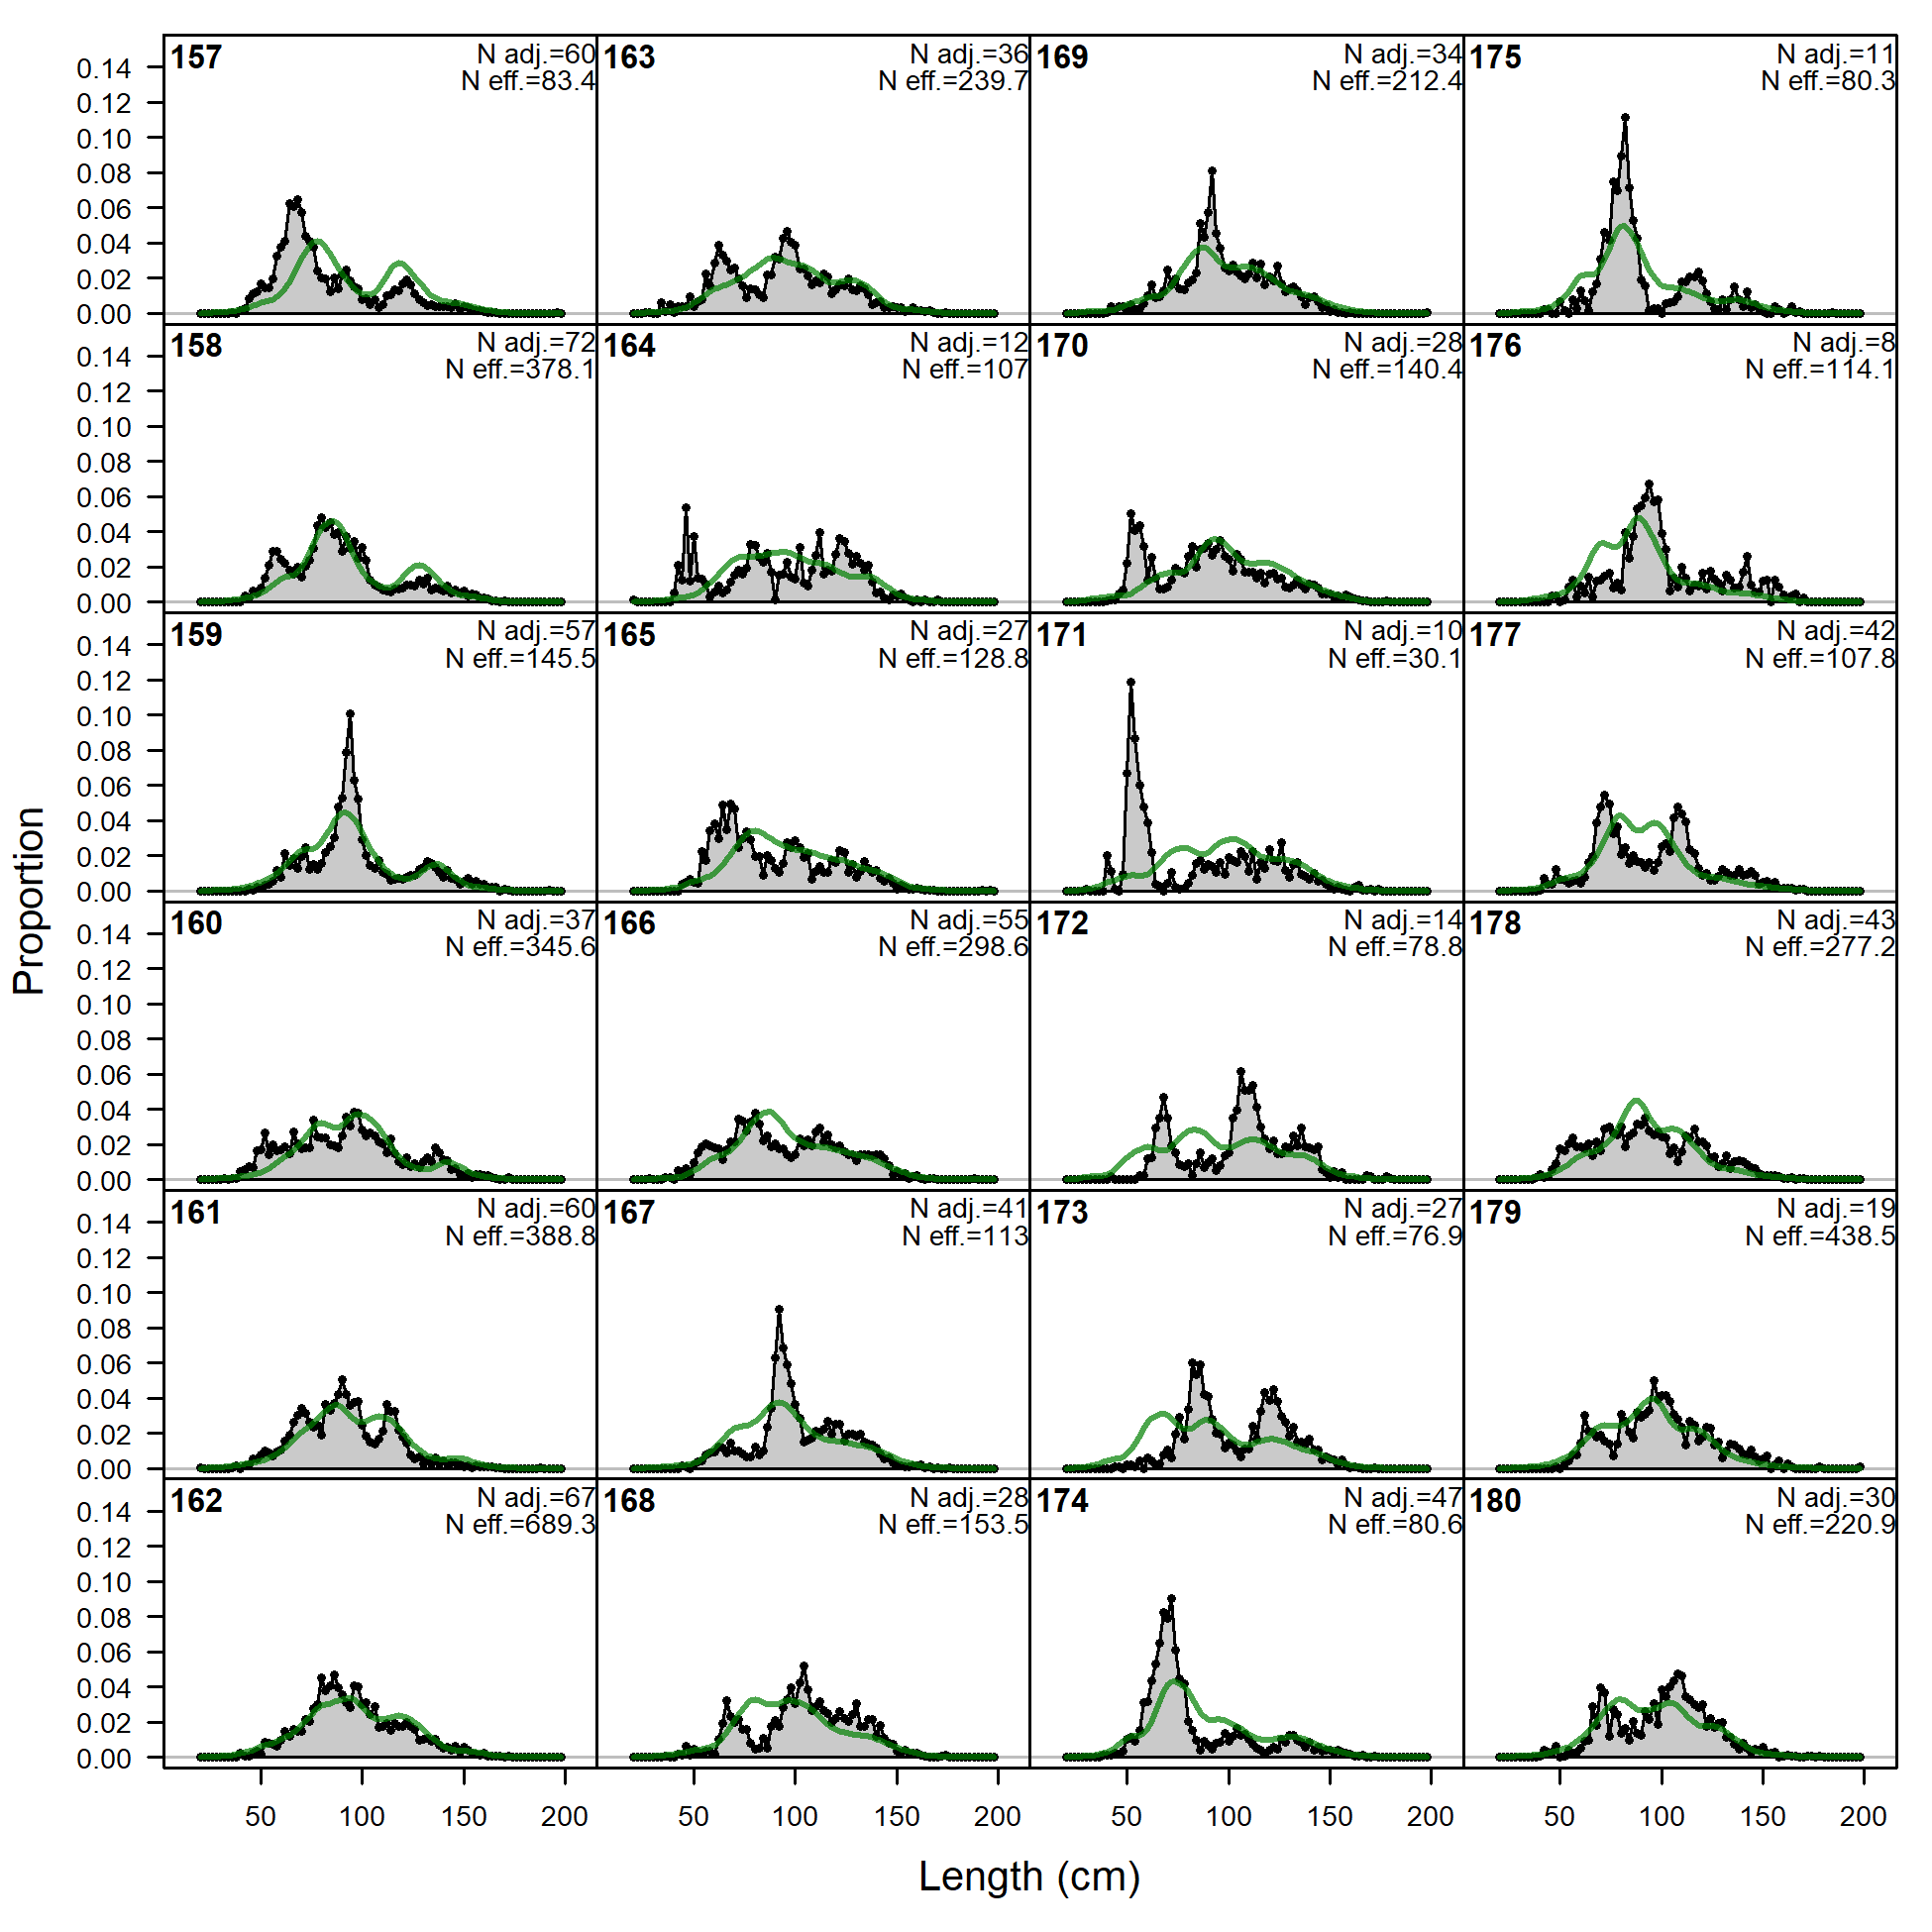
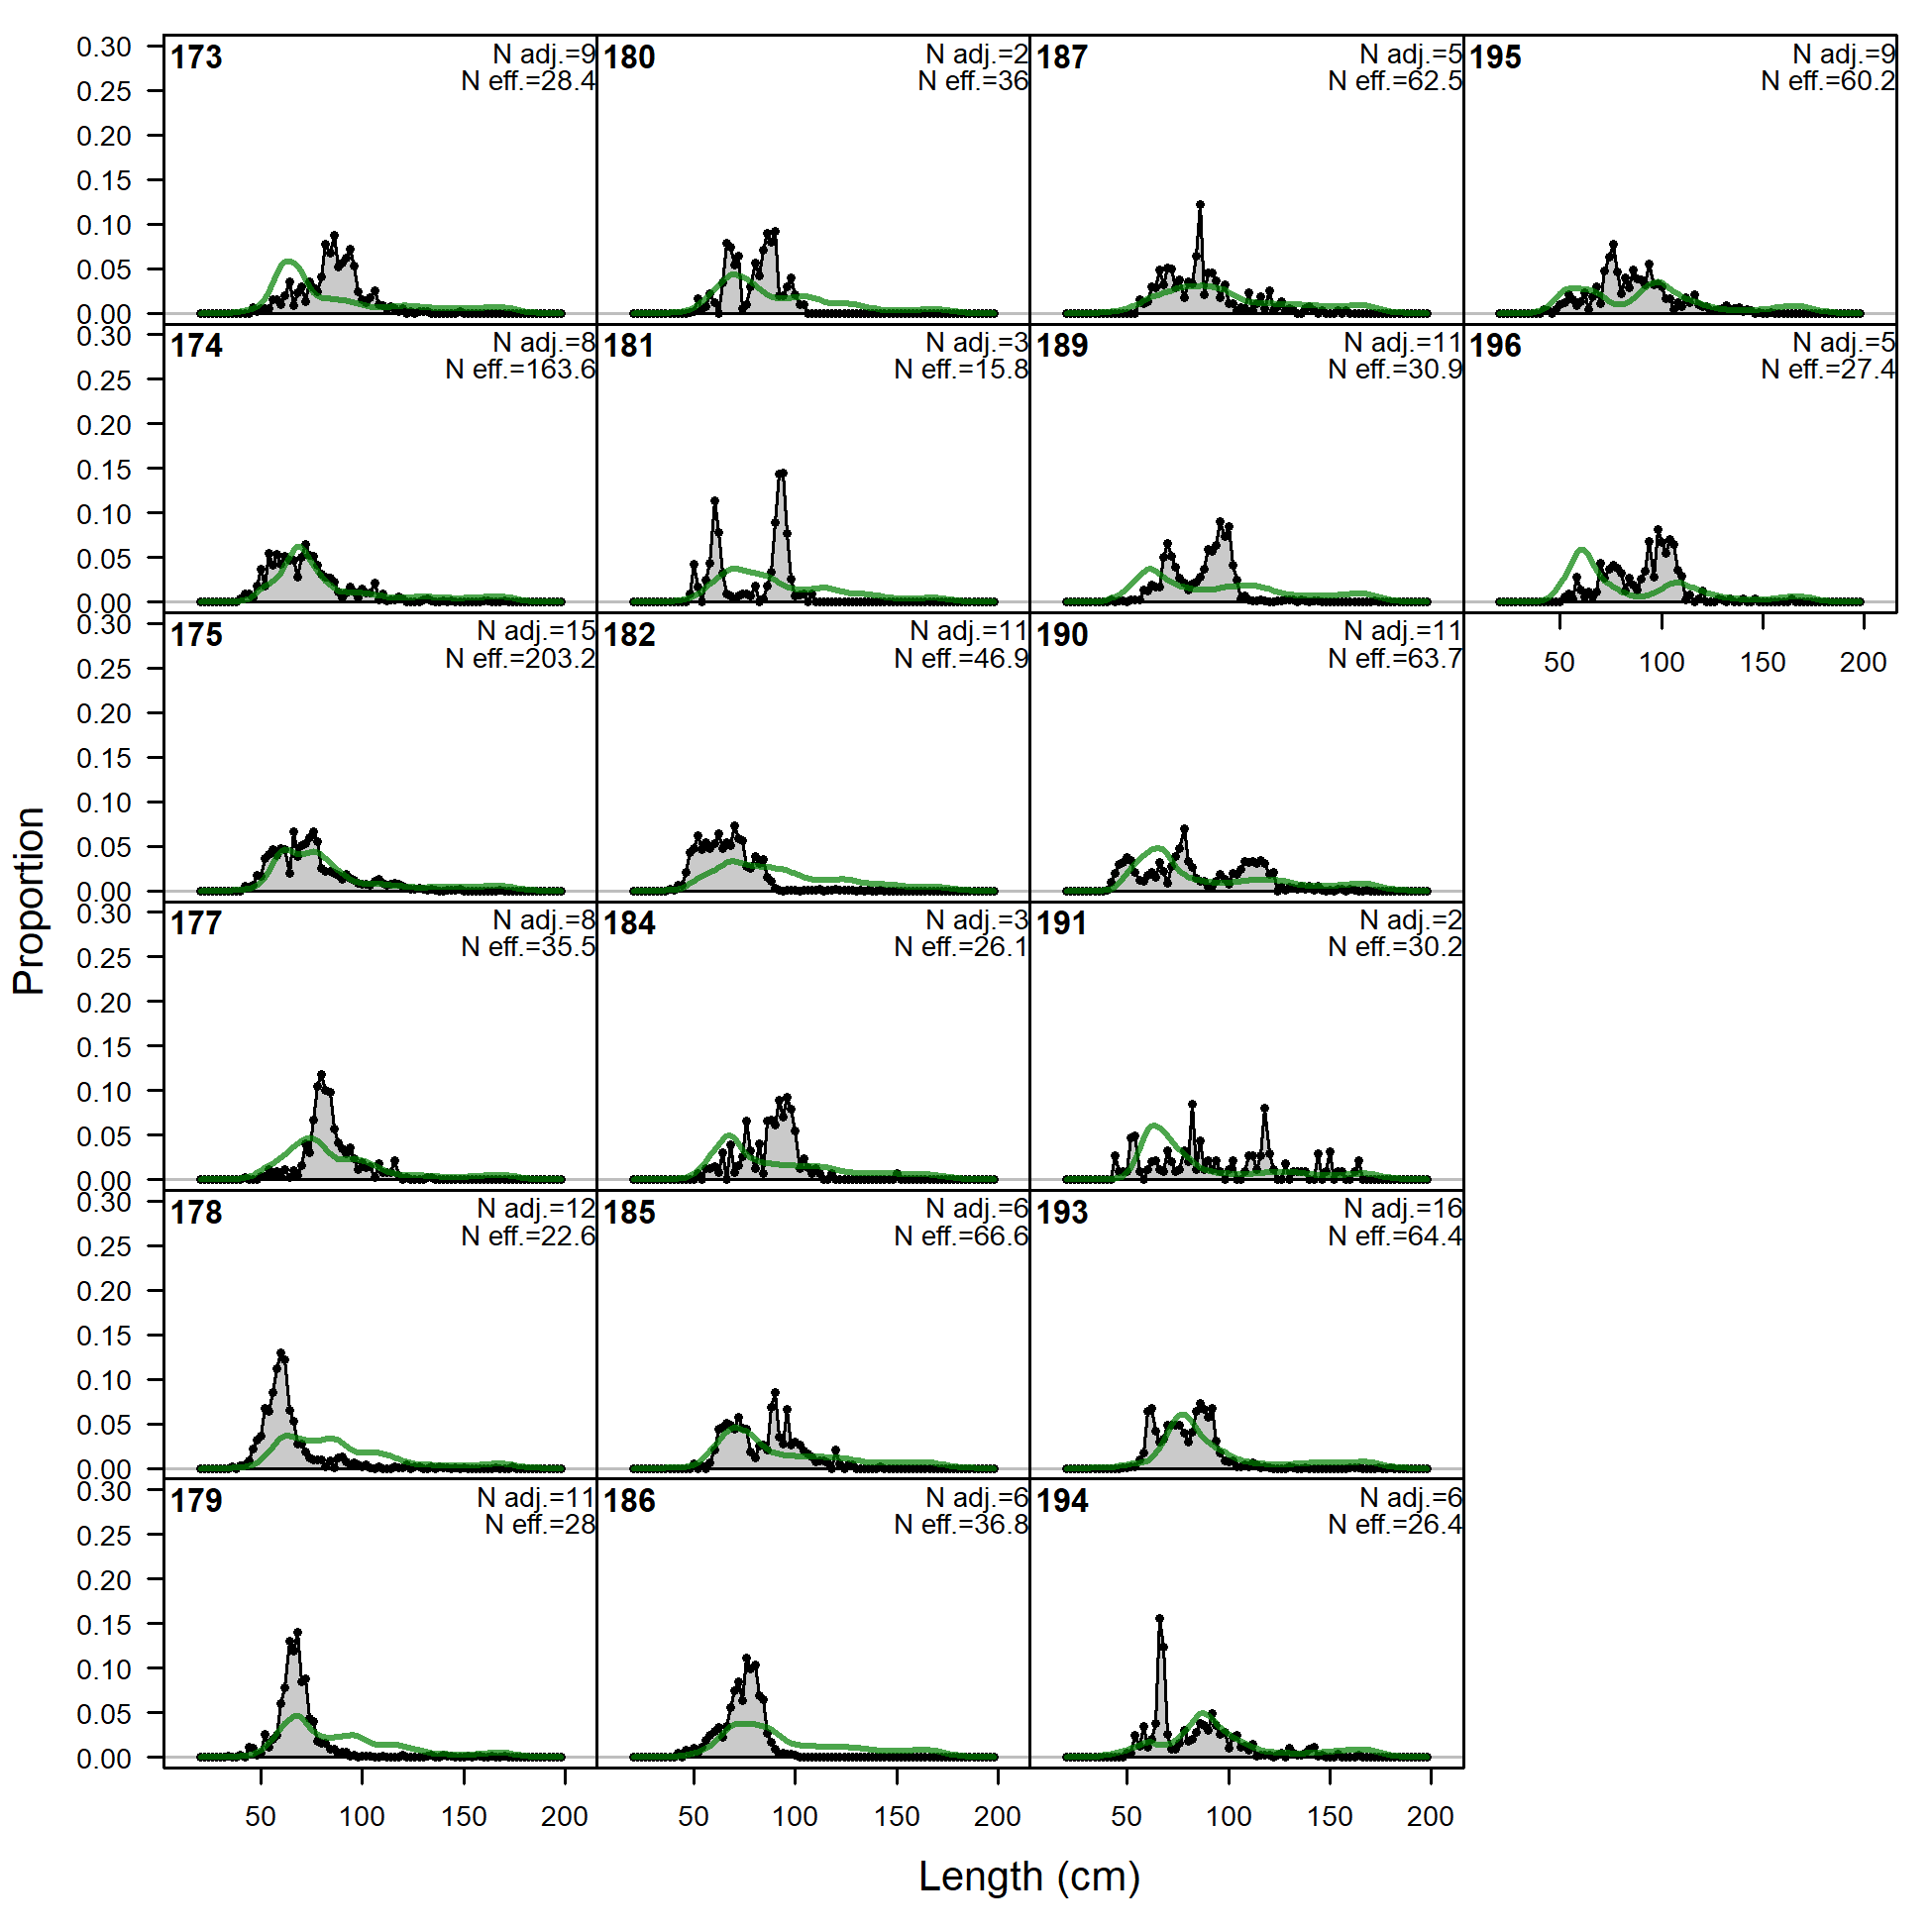
Length comps, whole catch, F5.OBJ.E.inshore (plot 1 of 5).
'N adj.' is the input sample size after data-weighting adjustment. N eff. is the calculated effective sample size used in the McAllister-Ianelli tuning method. (plot 2 of 5) (plot 3 of 5) (plot 4 of 5)
file: comp_lenfit_flt5mkt0_page4.png
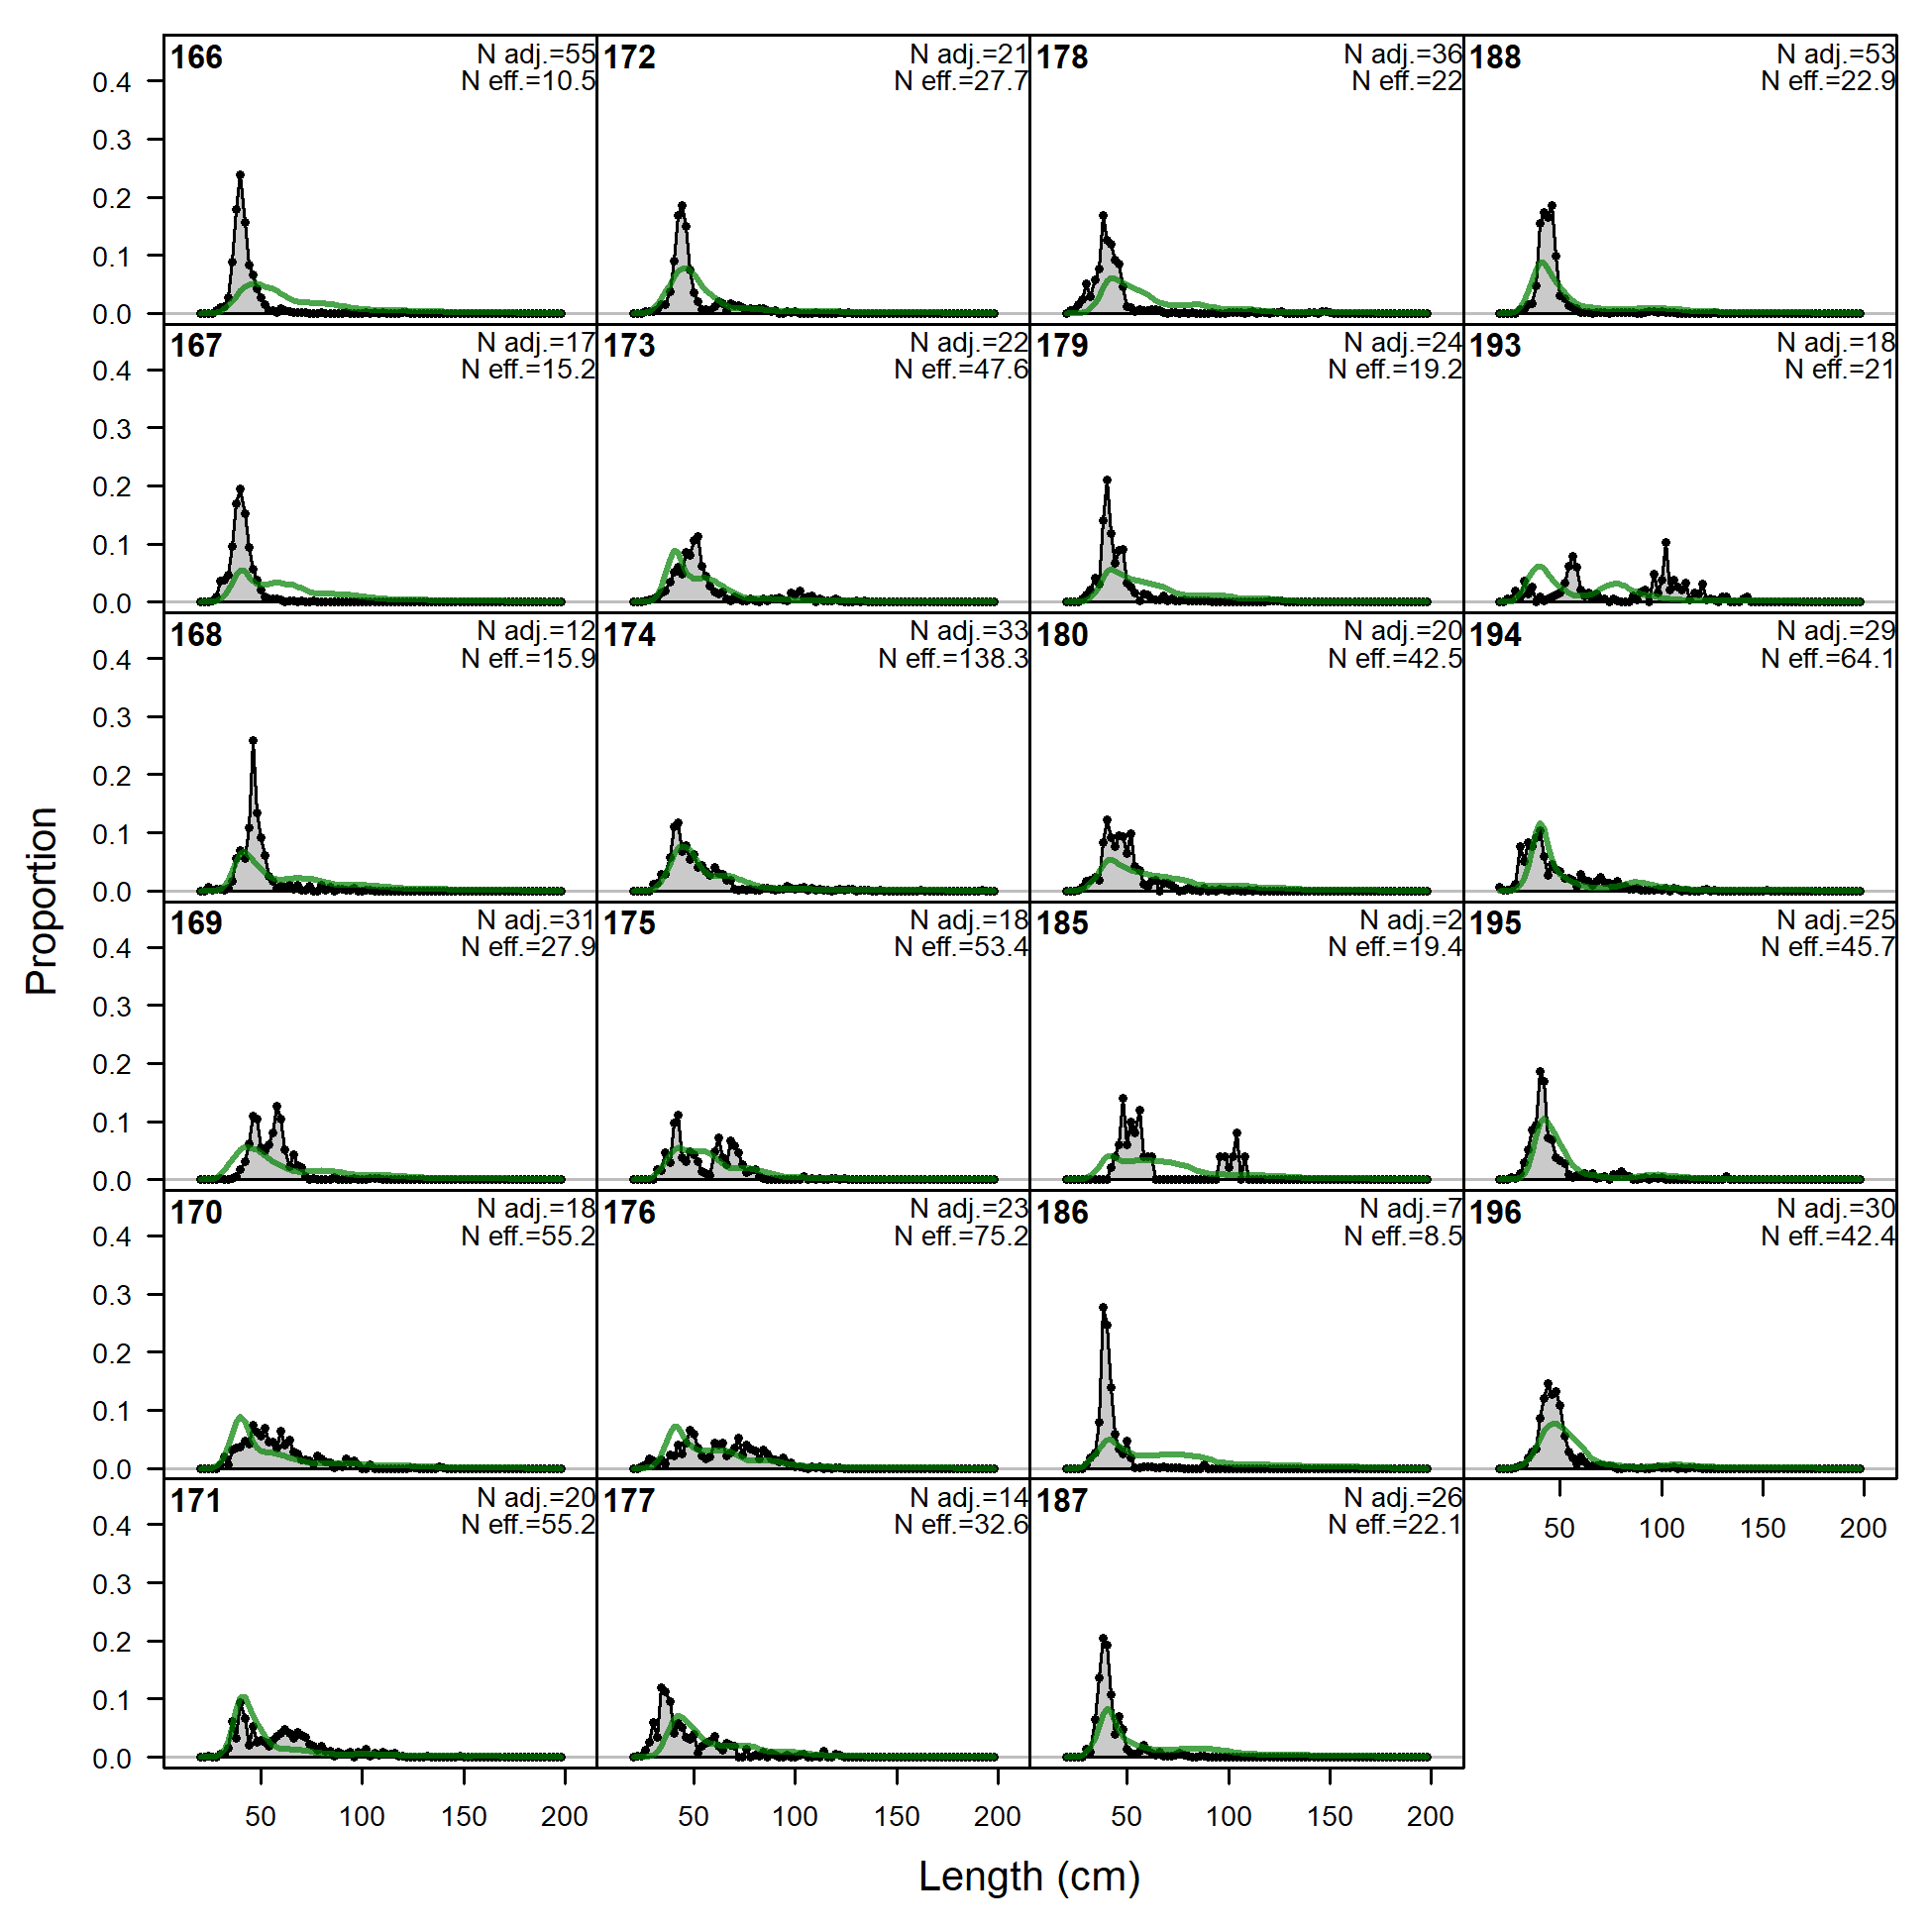
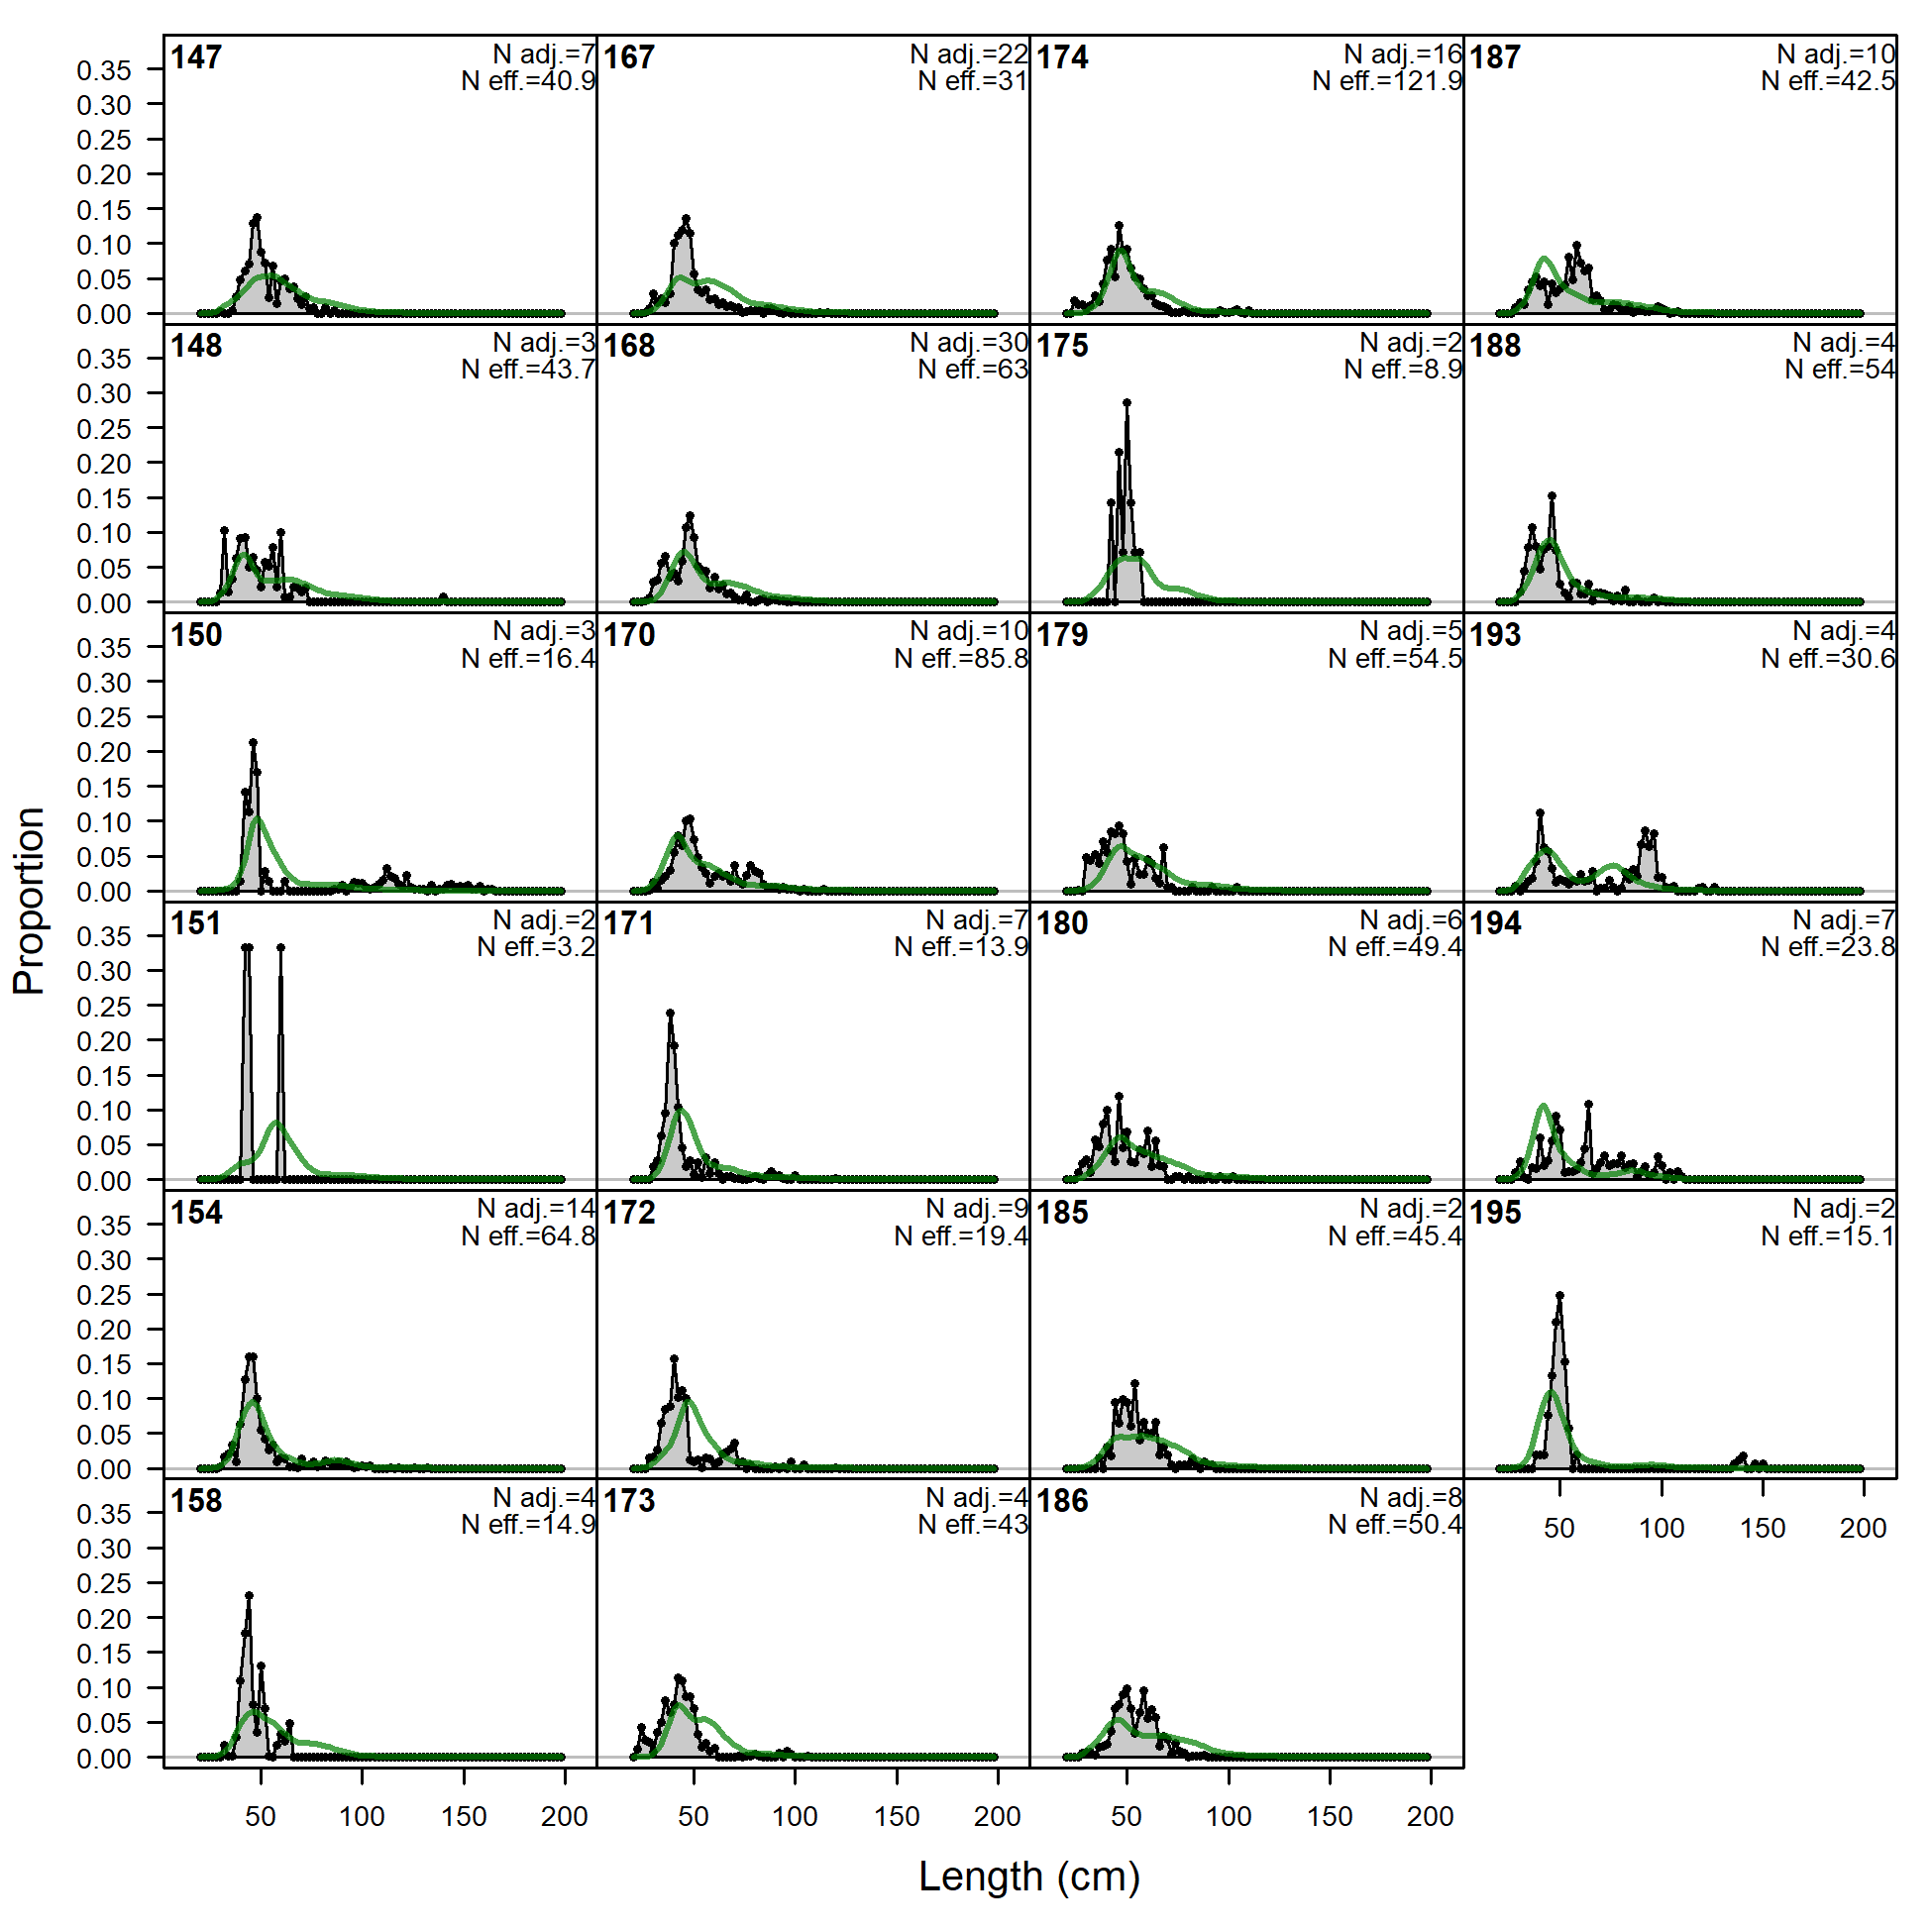
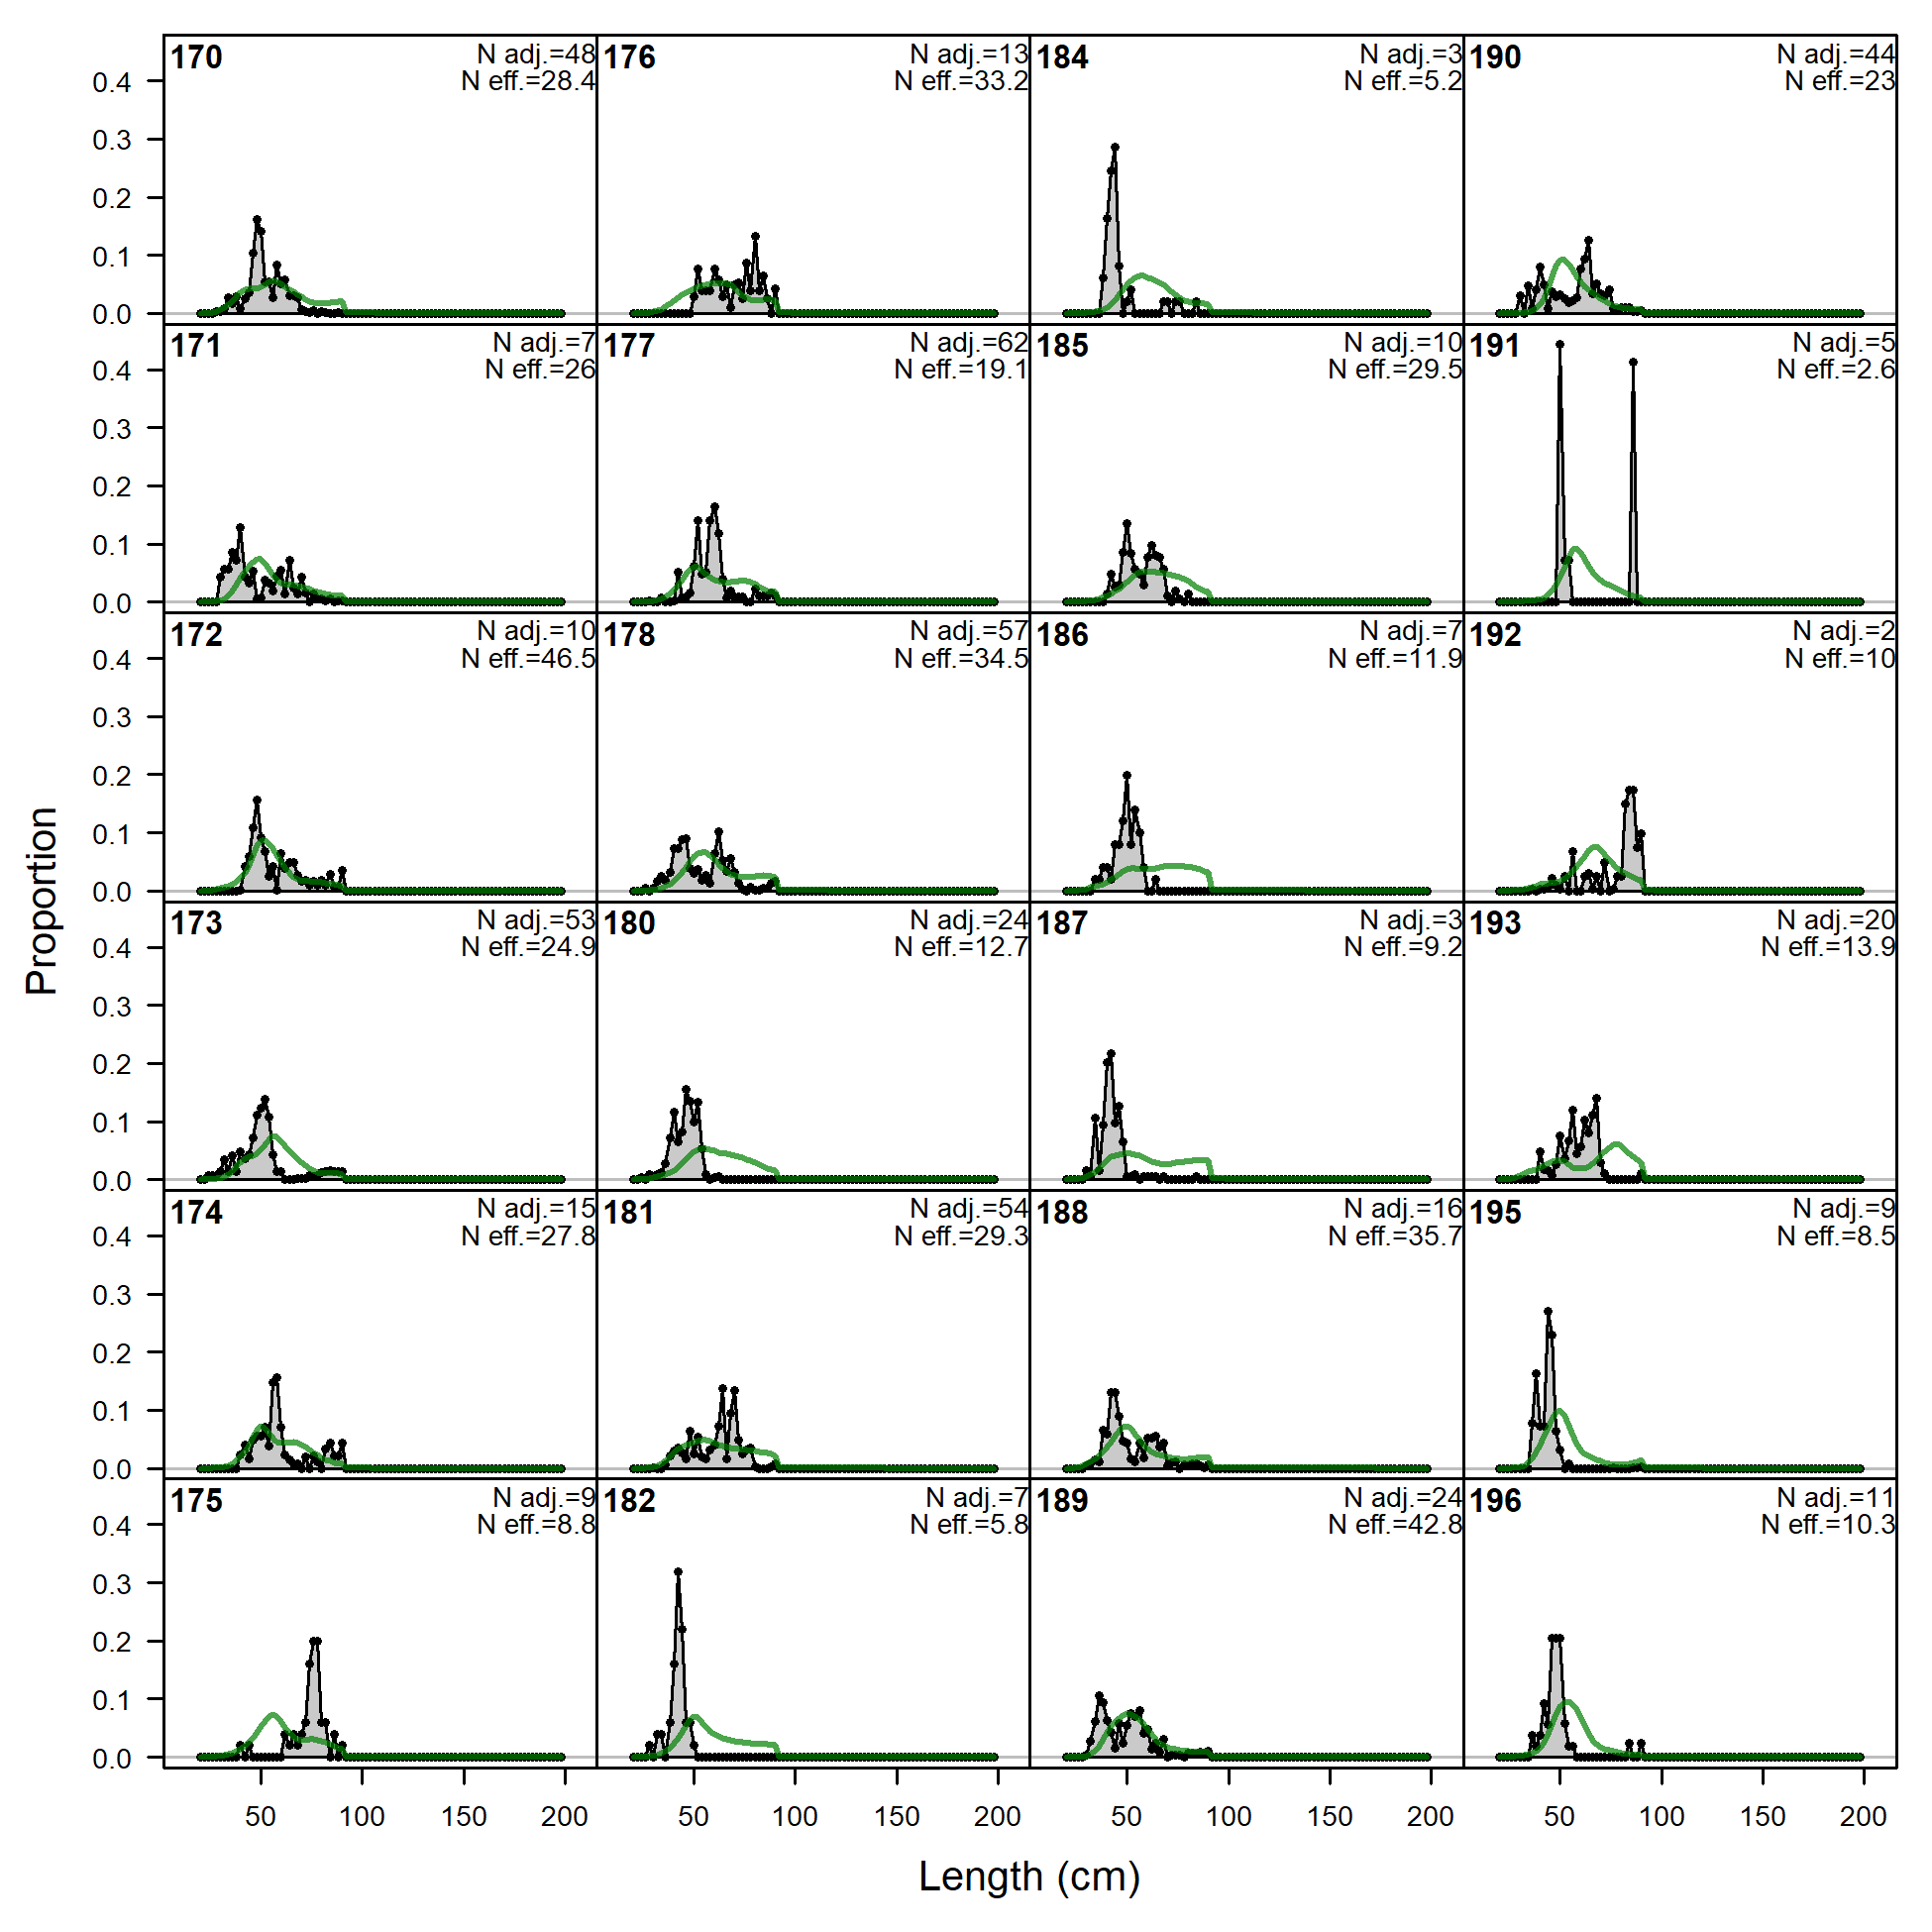
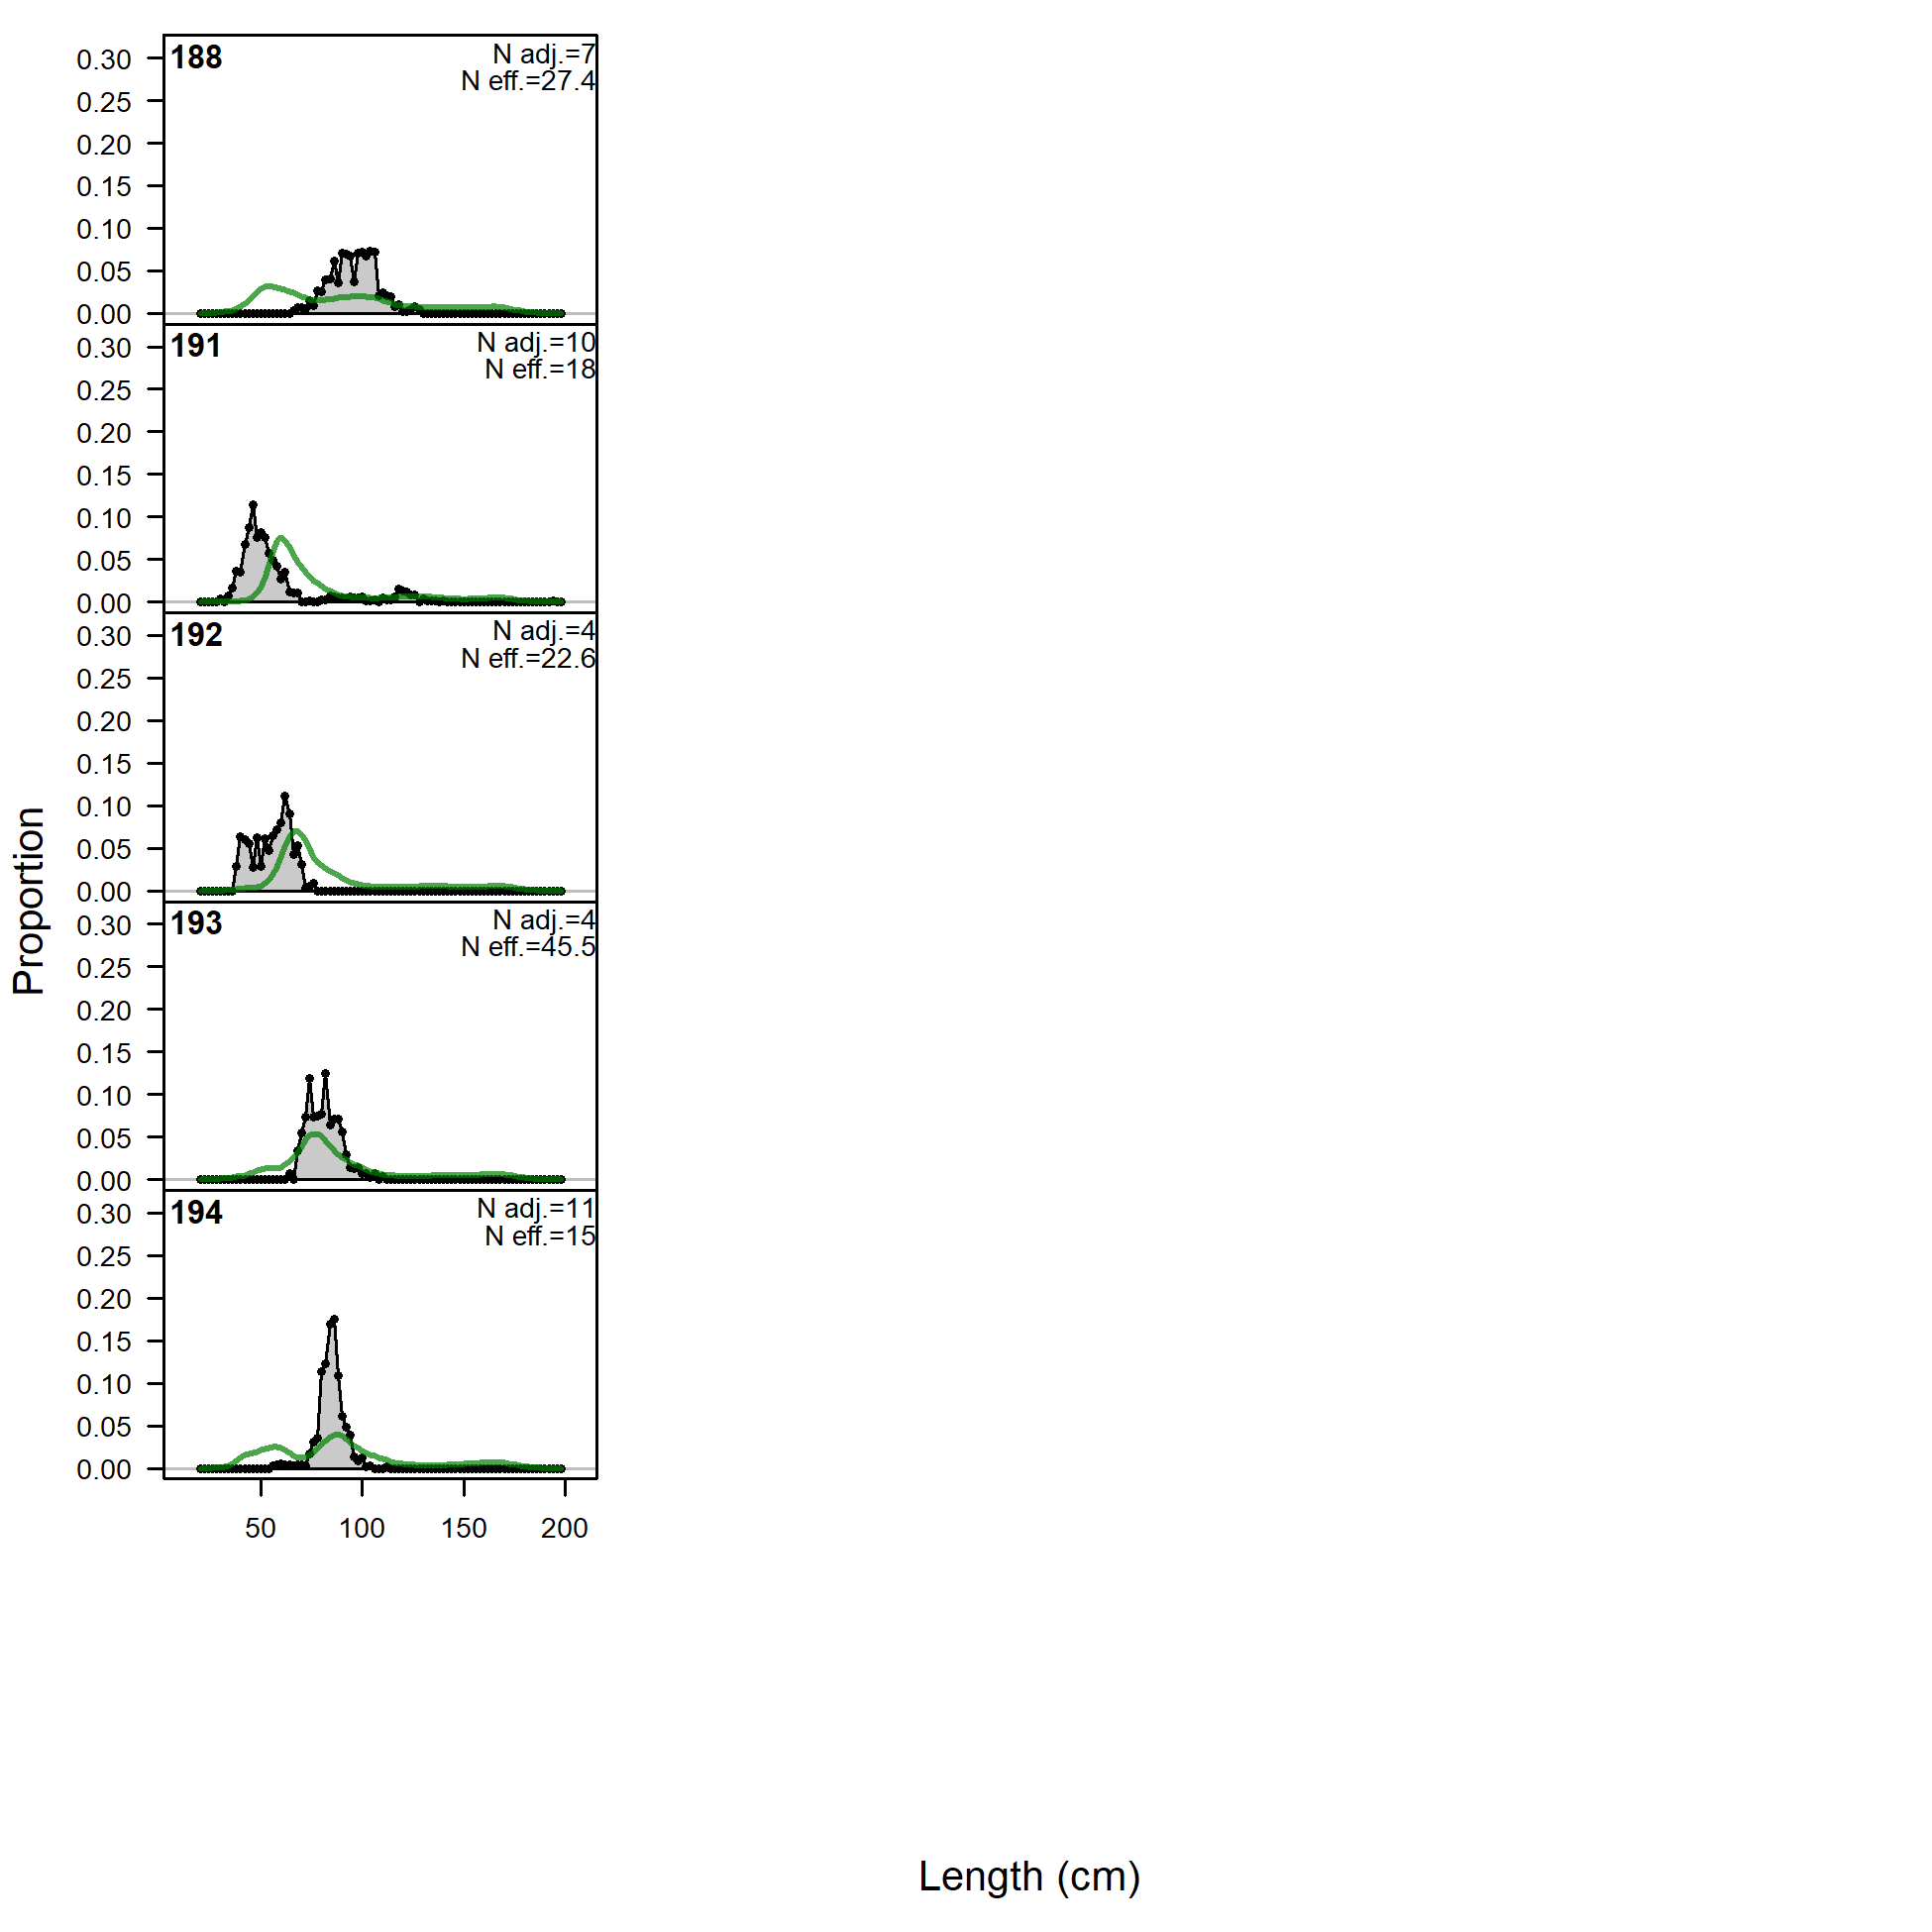
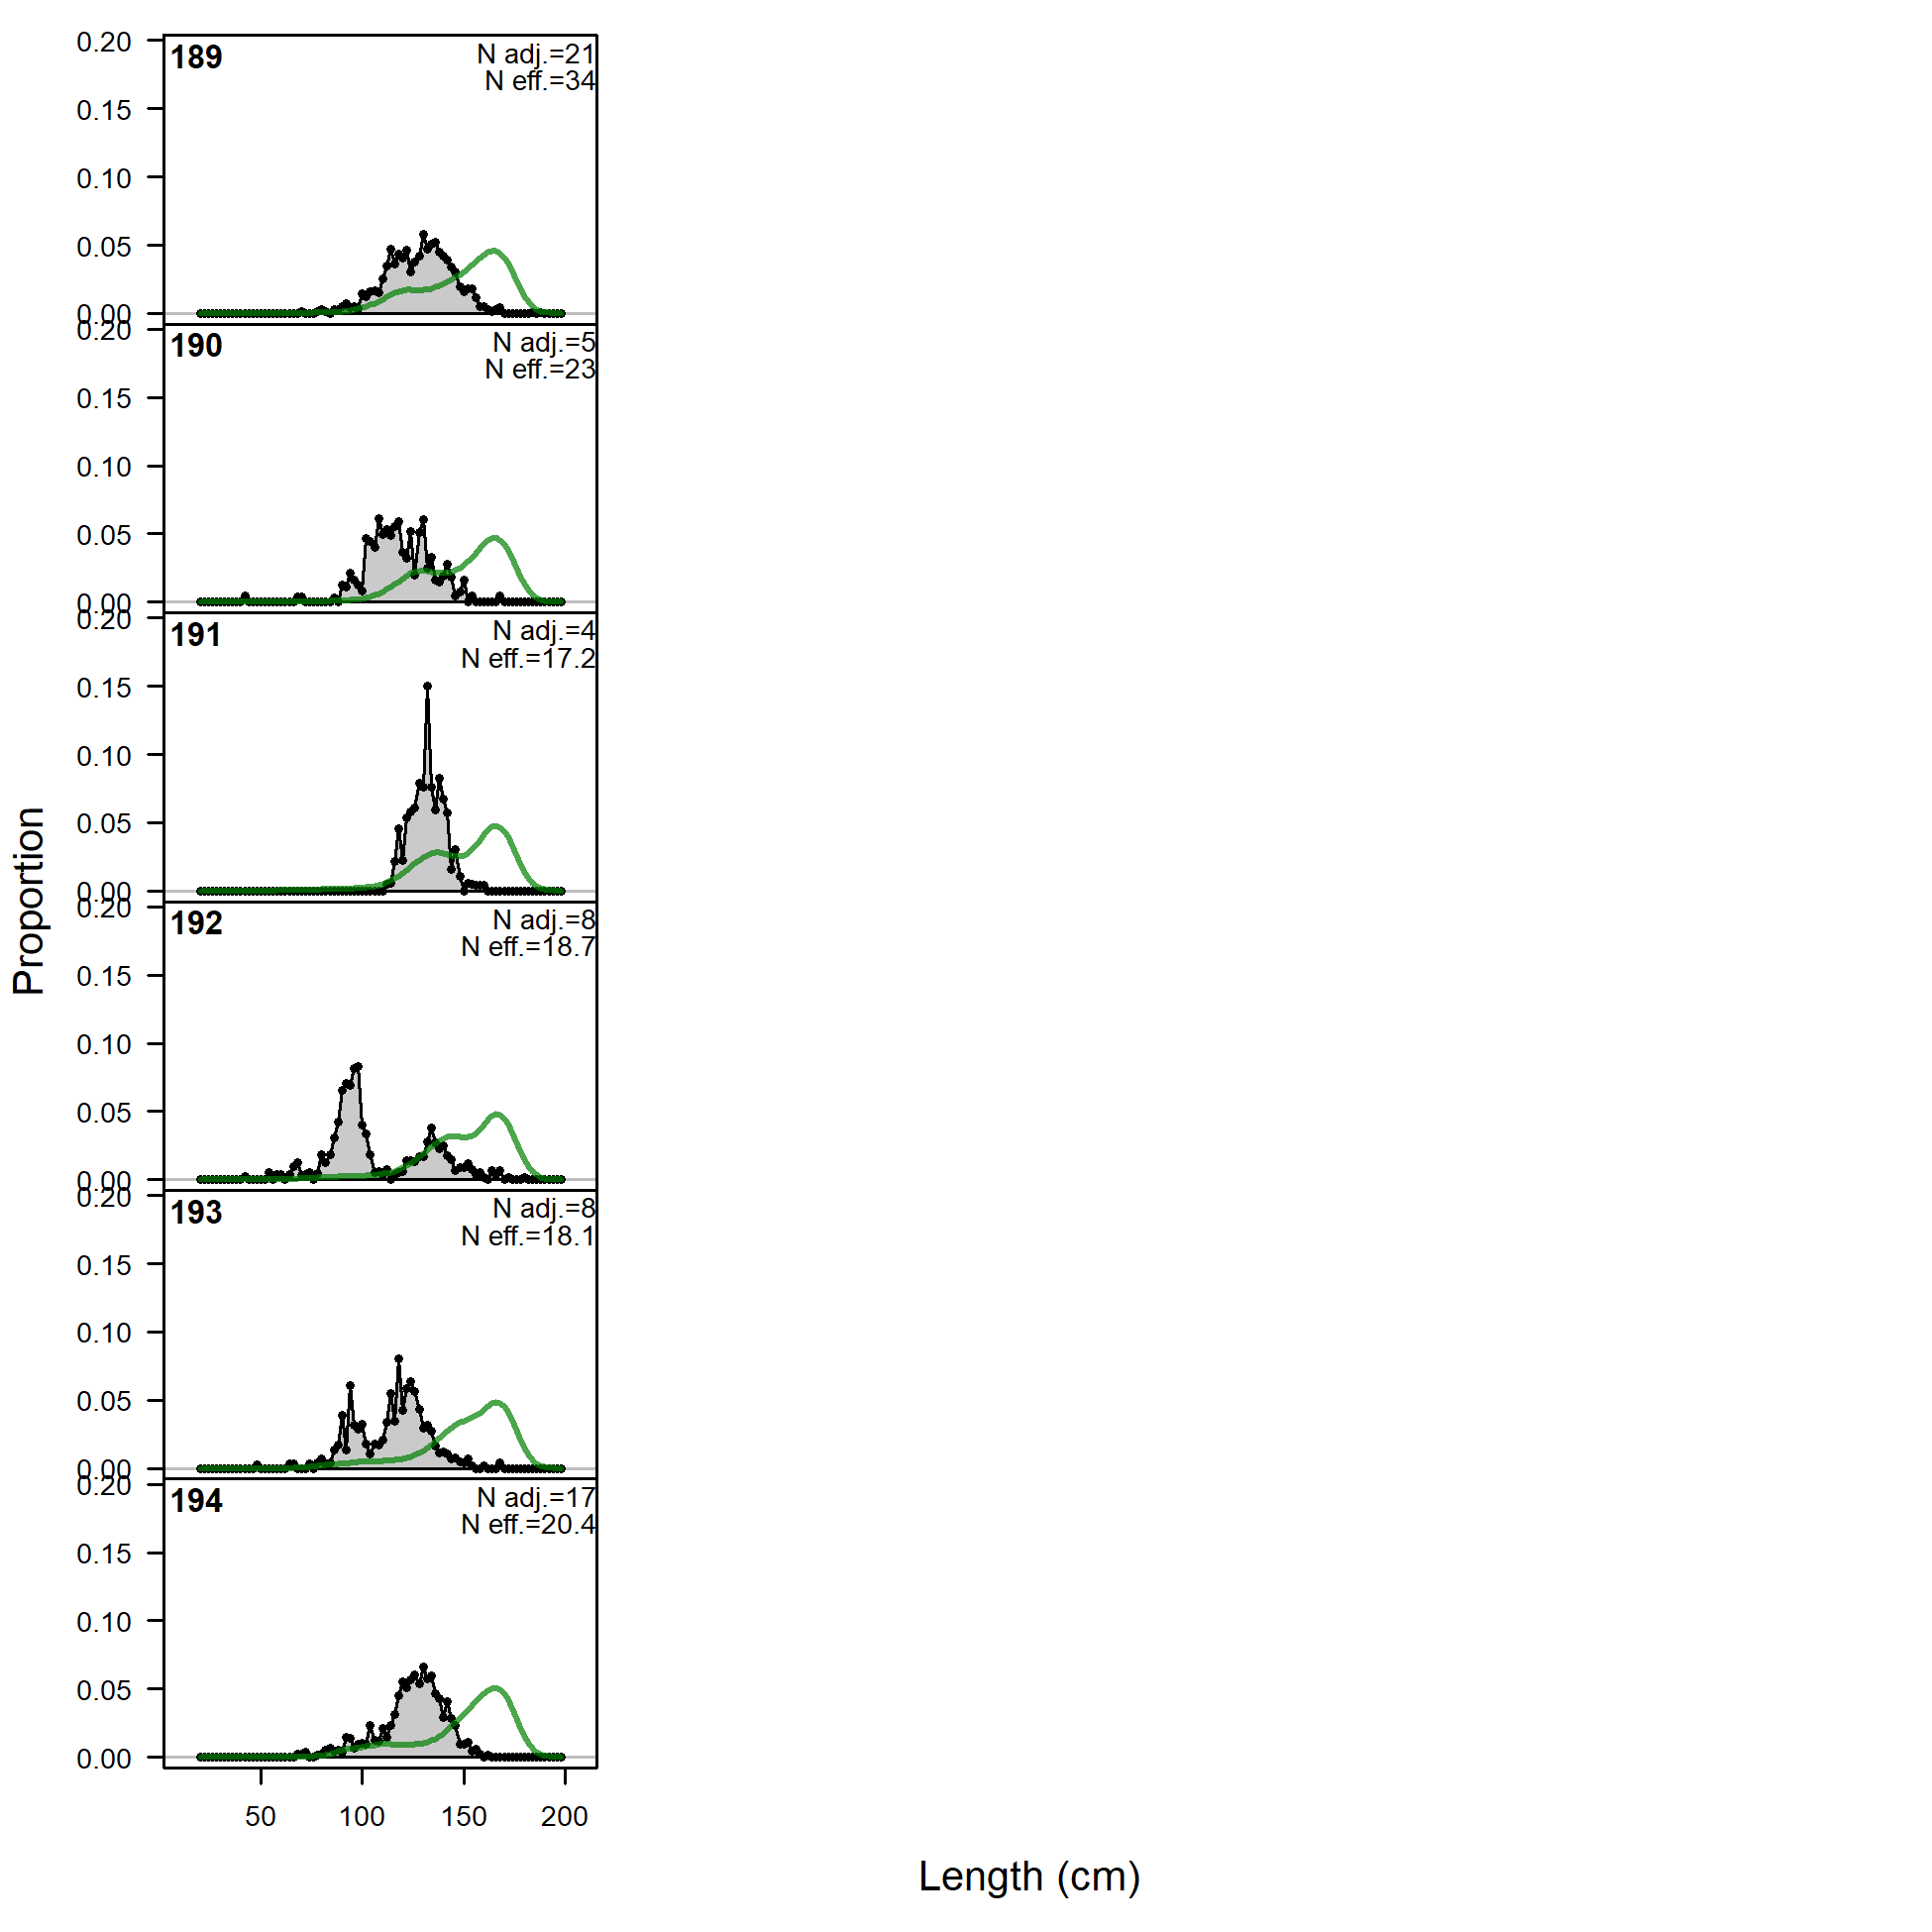
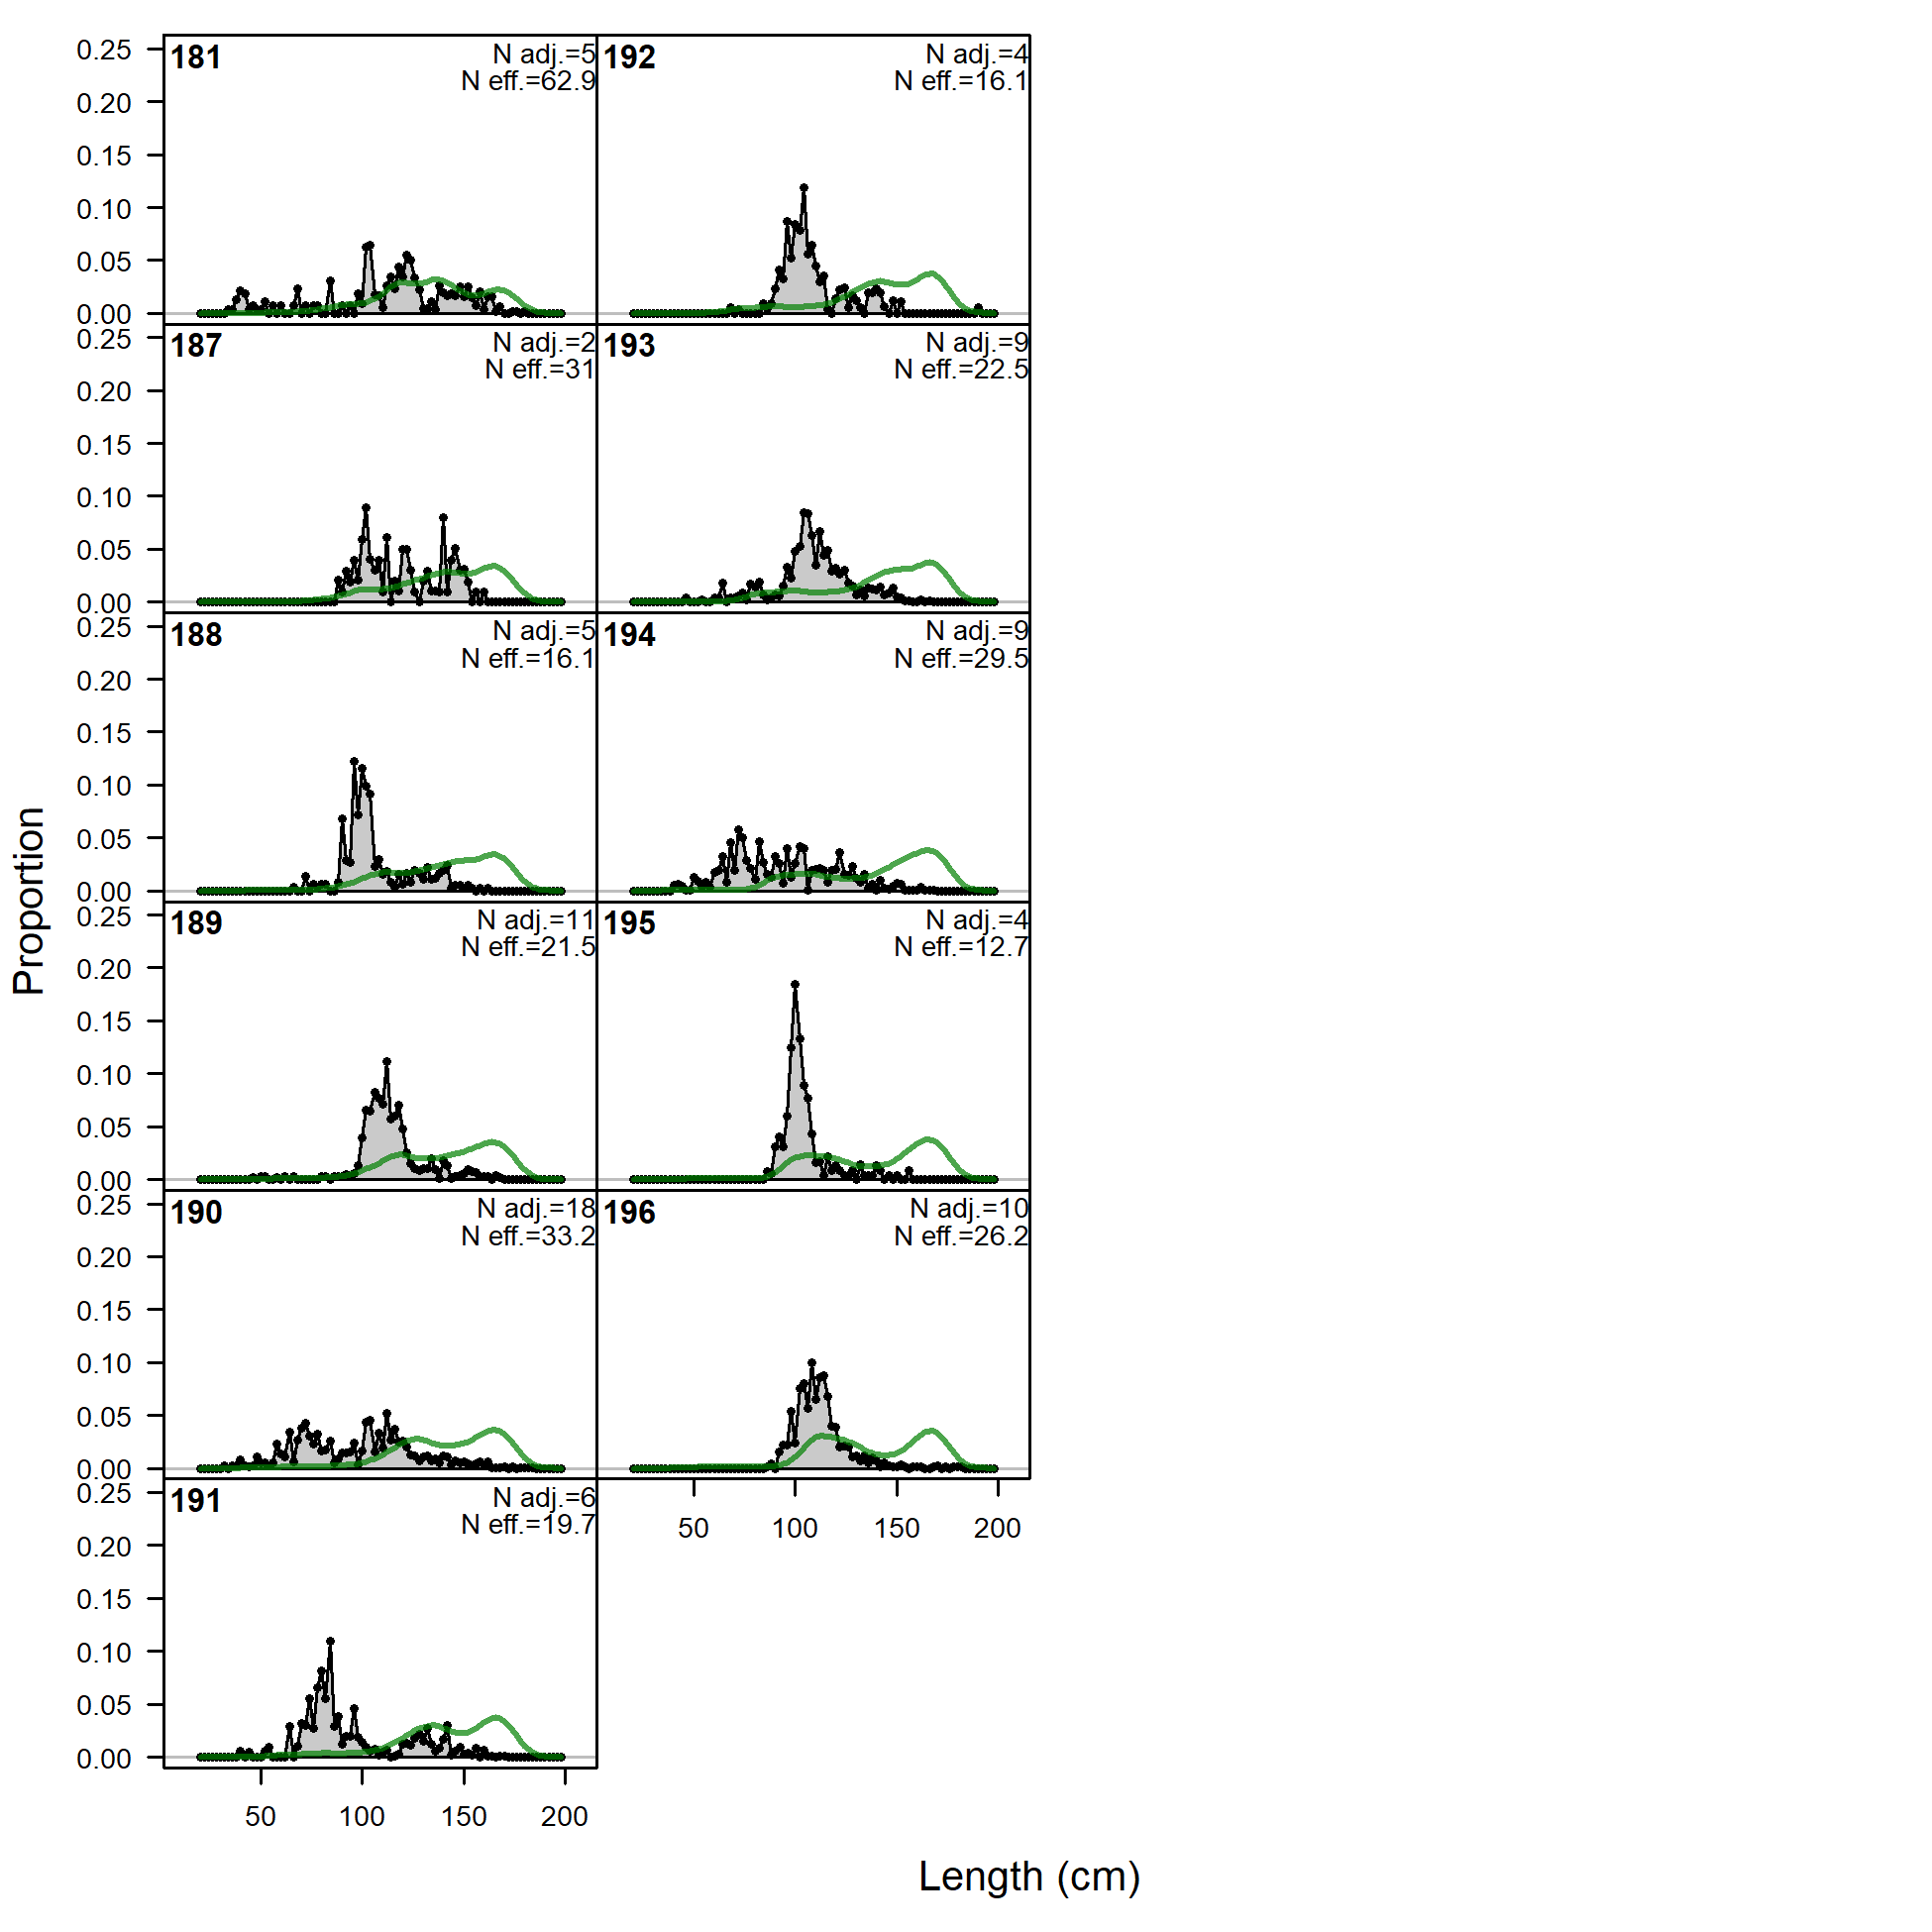
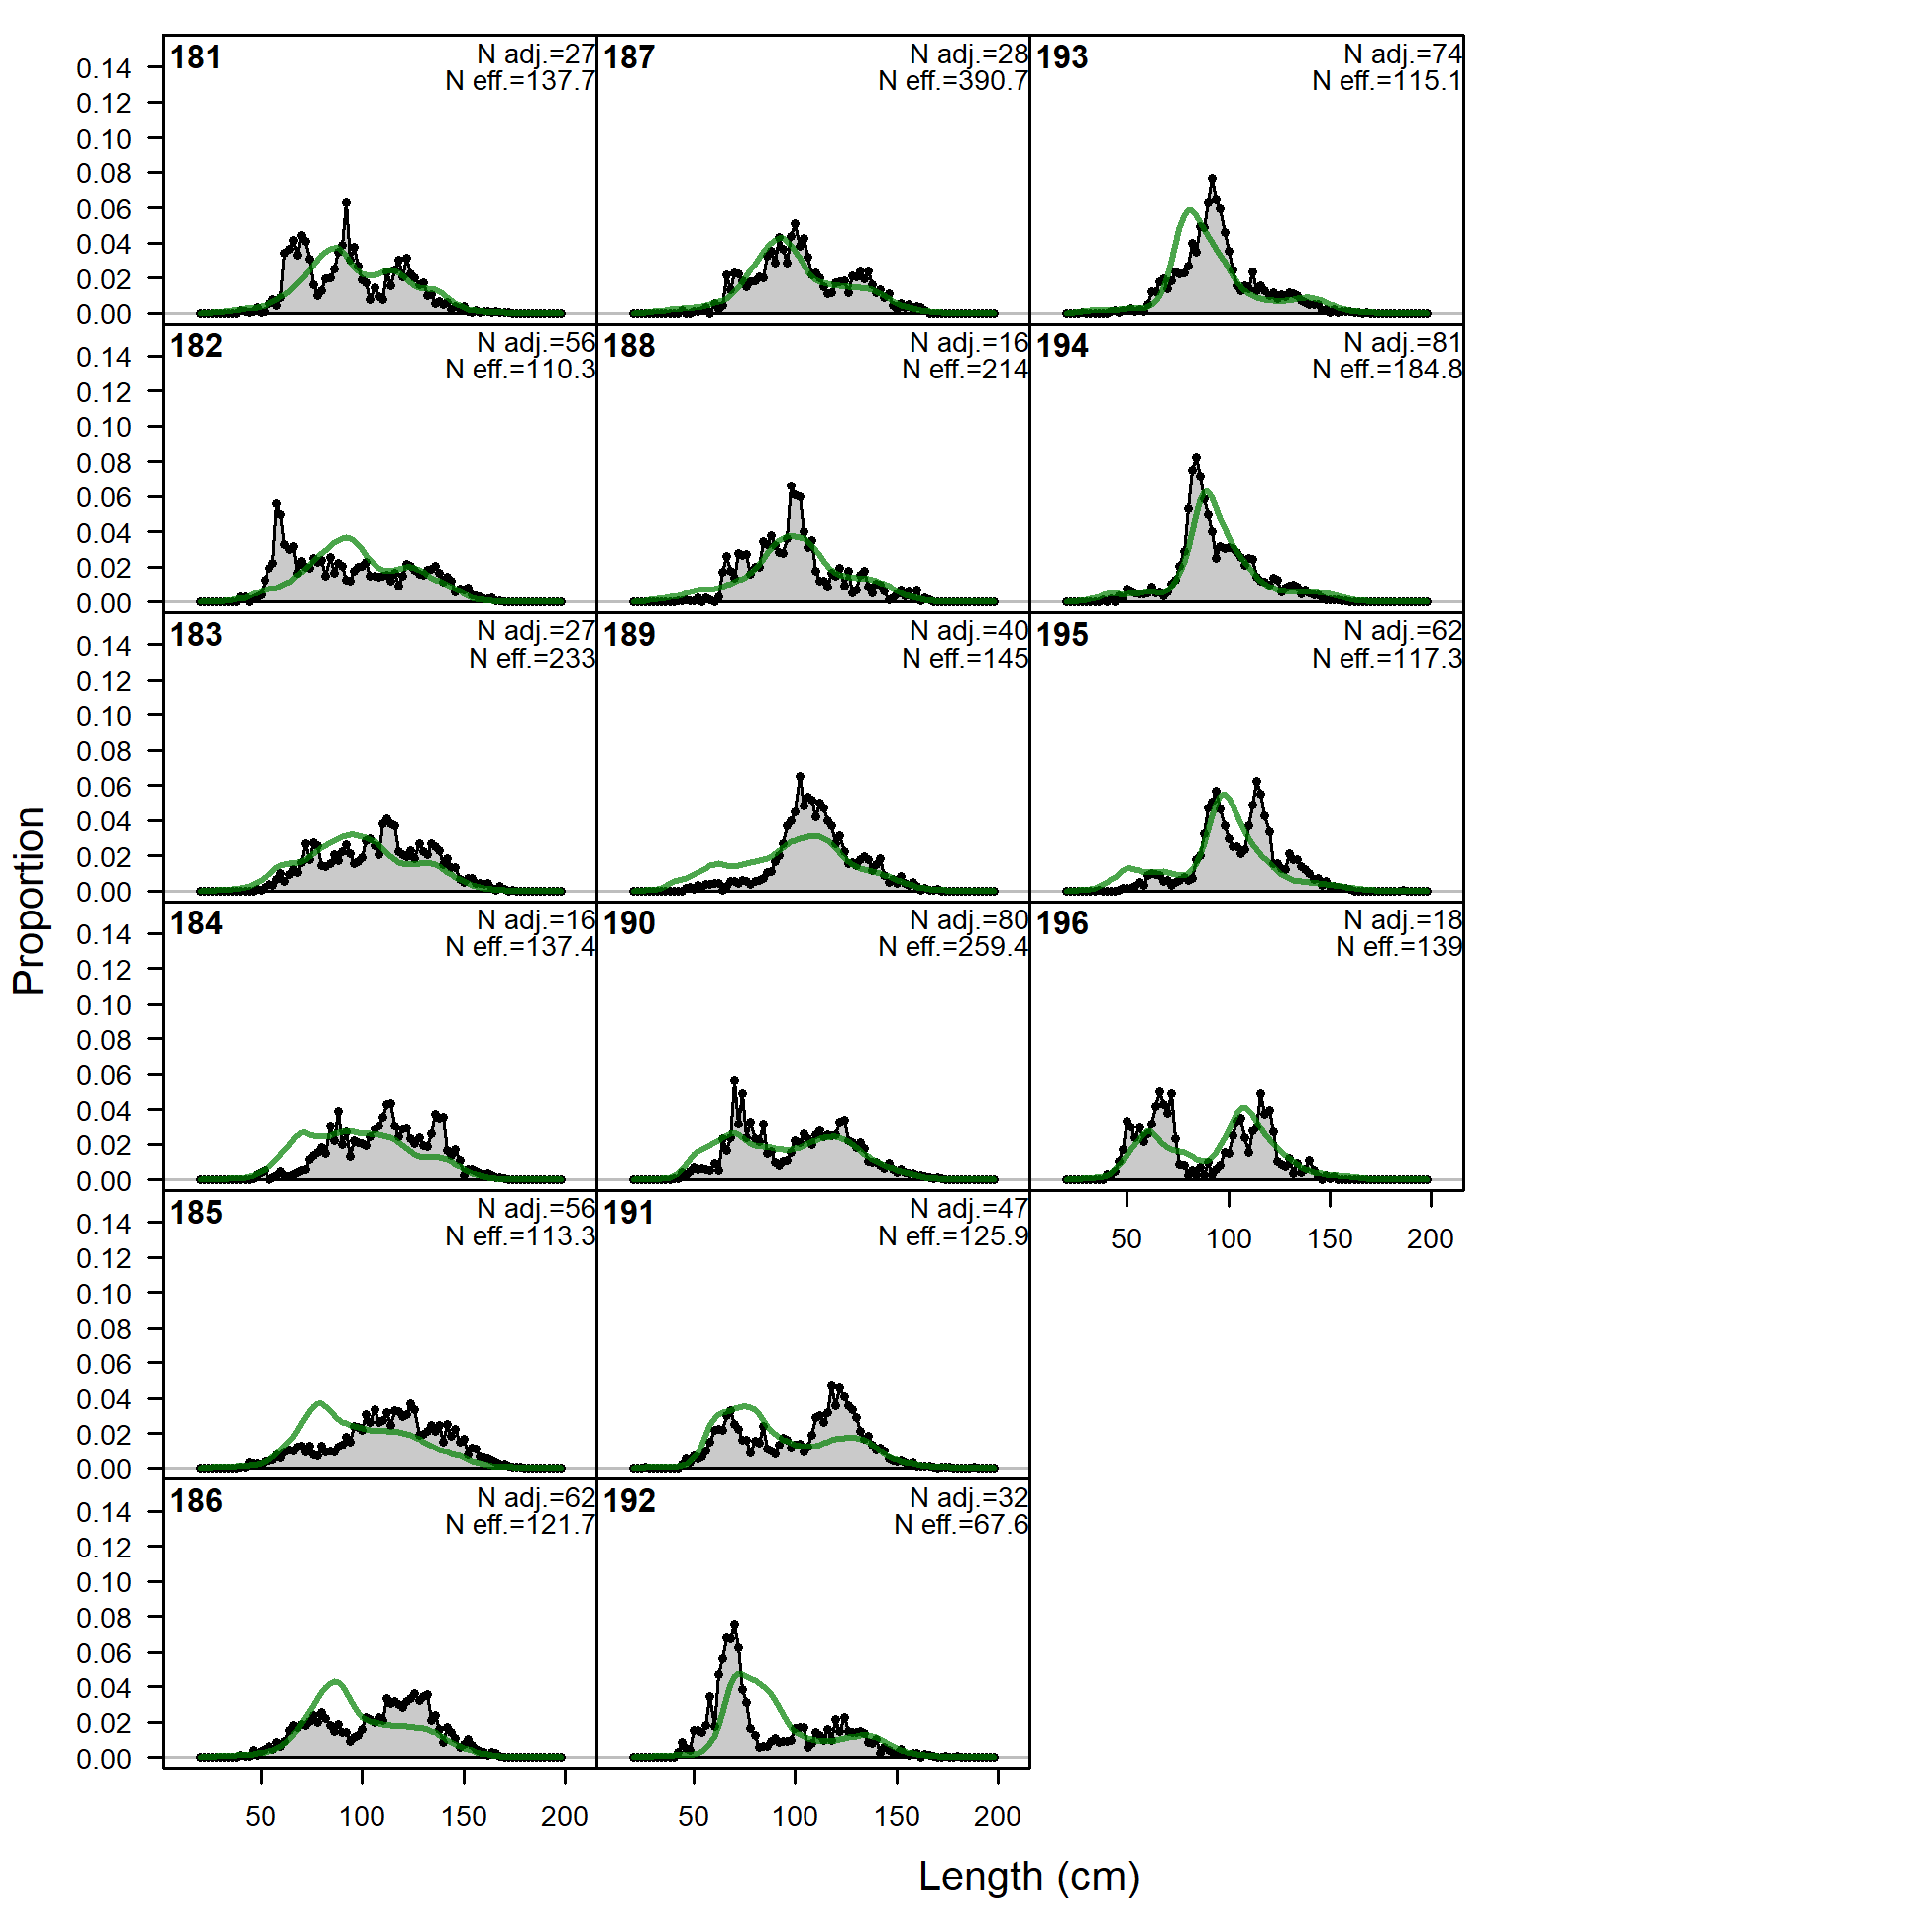
Length comps, whole catch, F5.OBJ.E.inshore (plot 1 of 5).
'N adj.' is the input sample size after data-weighting adjustment. N eff. is the calculated effective sample size used in the McAllister-Ianelli tuning method. (plot 2 of 5) (plot 3 of 5) (plot 4 of 5) (plot 5 of 5)
file: comp_lenfit_flt5mkt0_page5.png
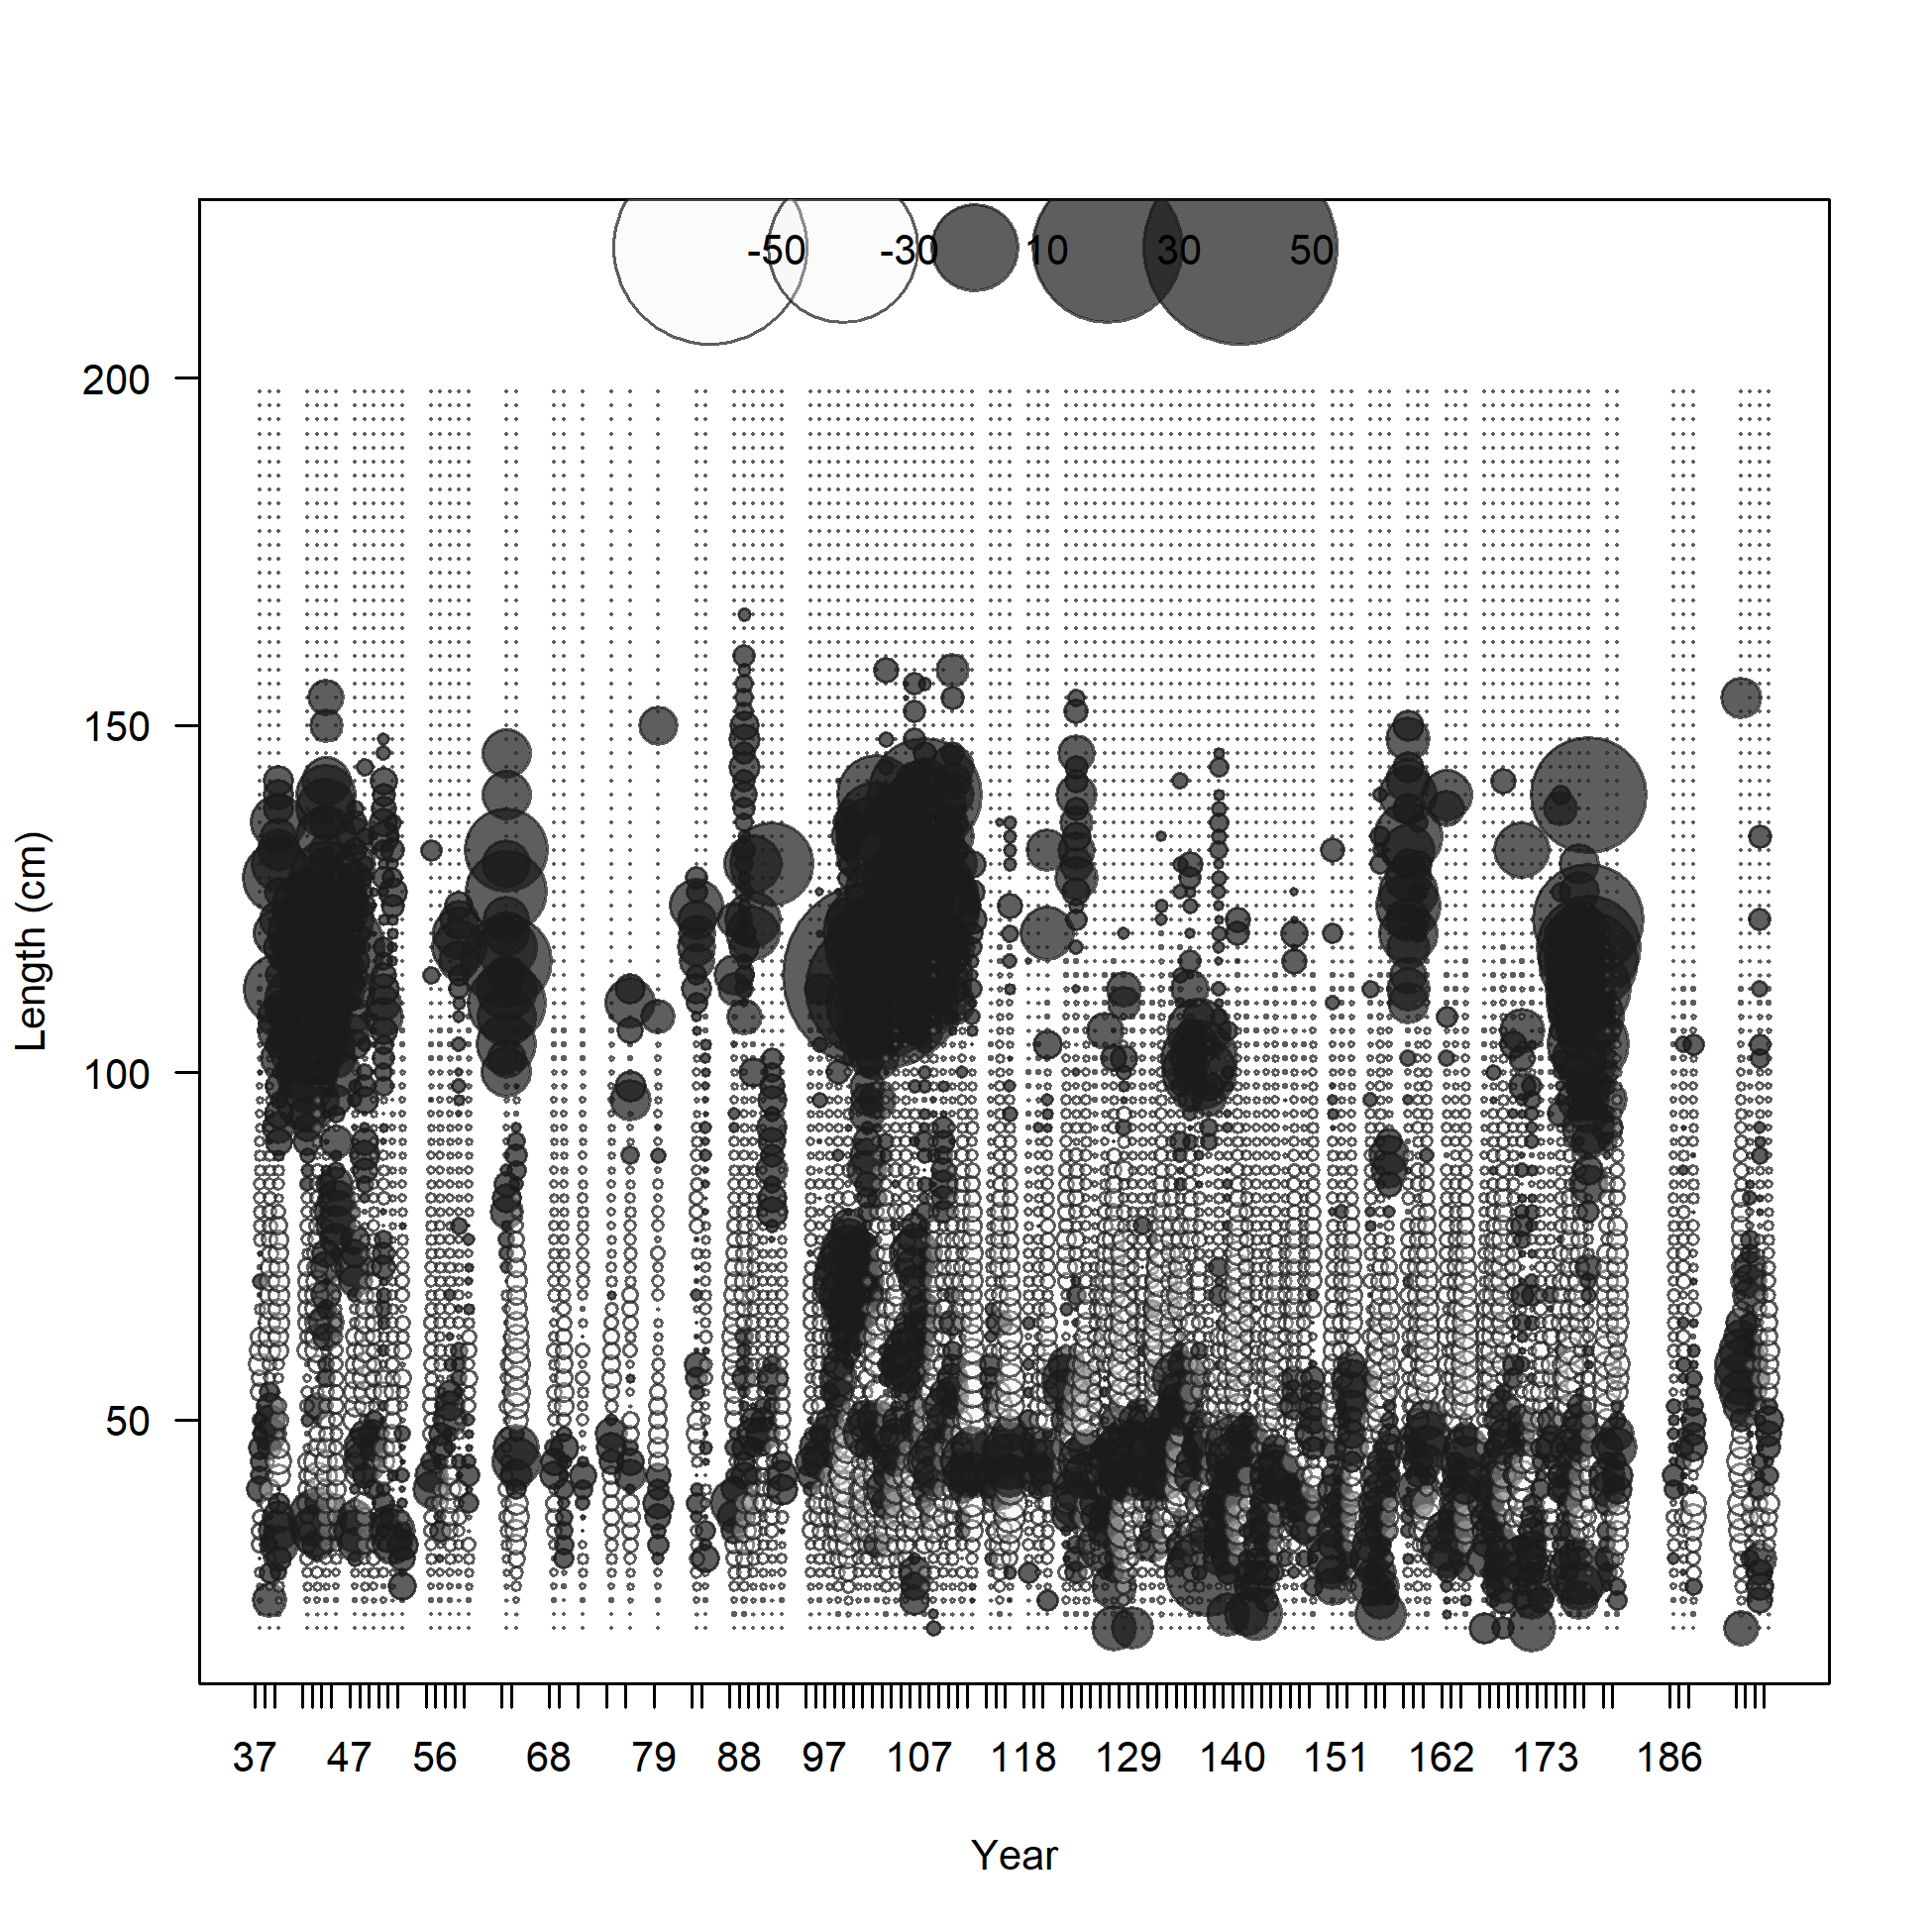
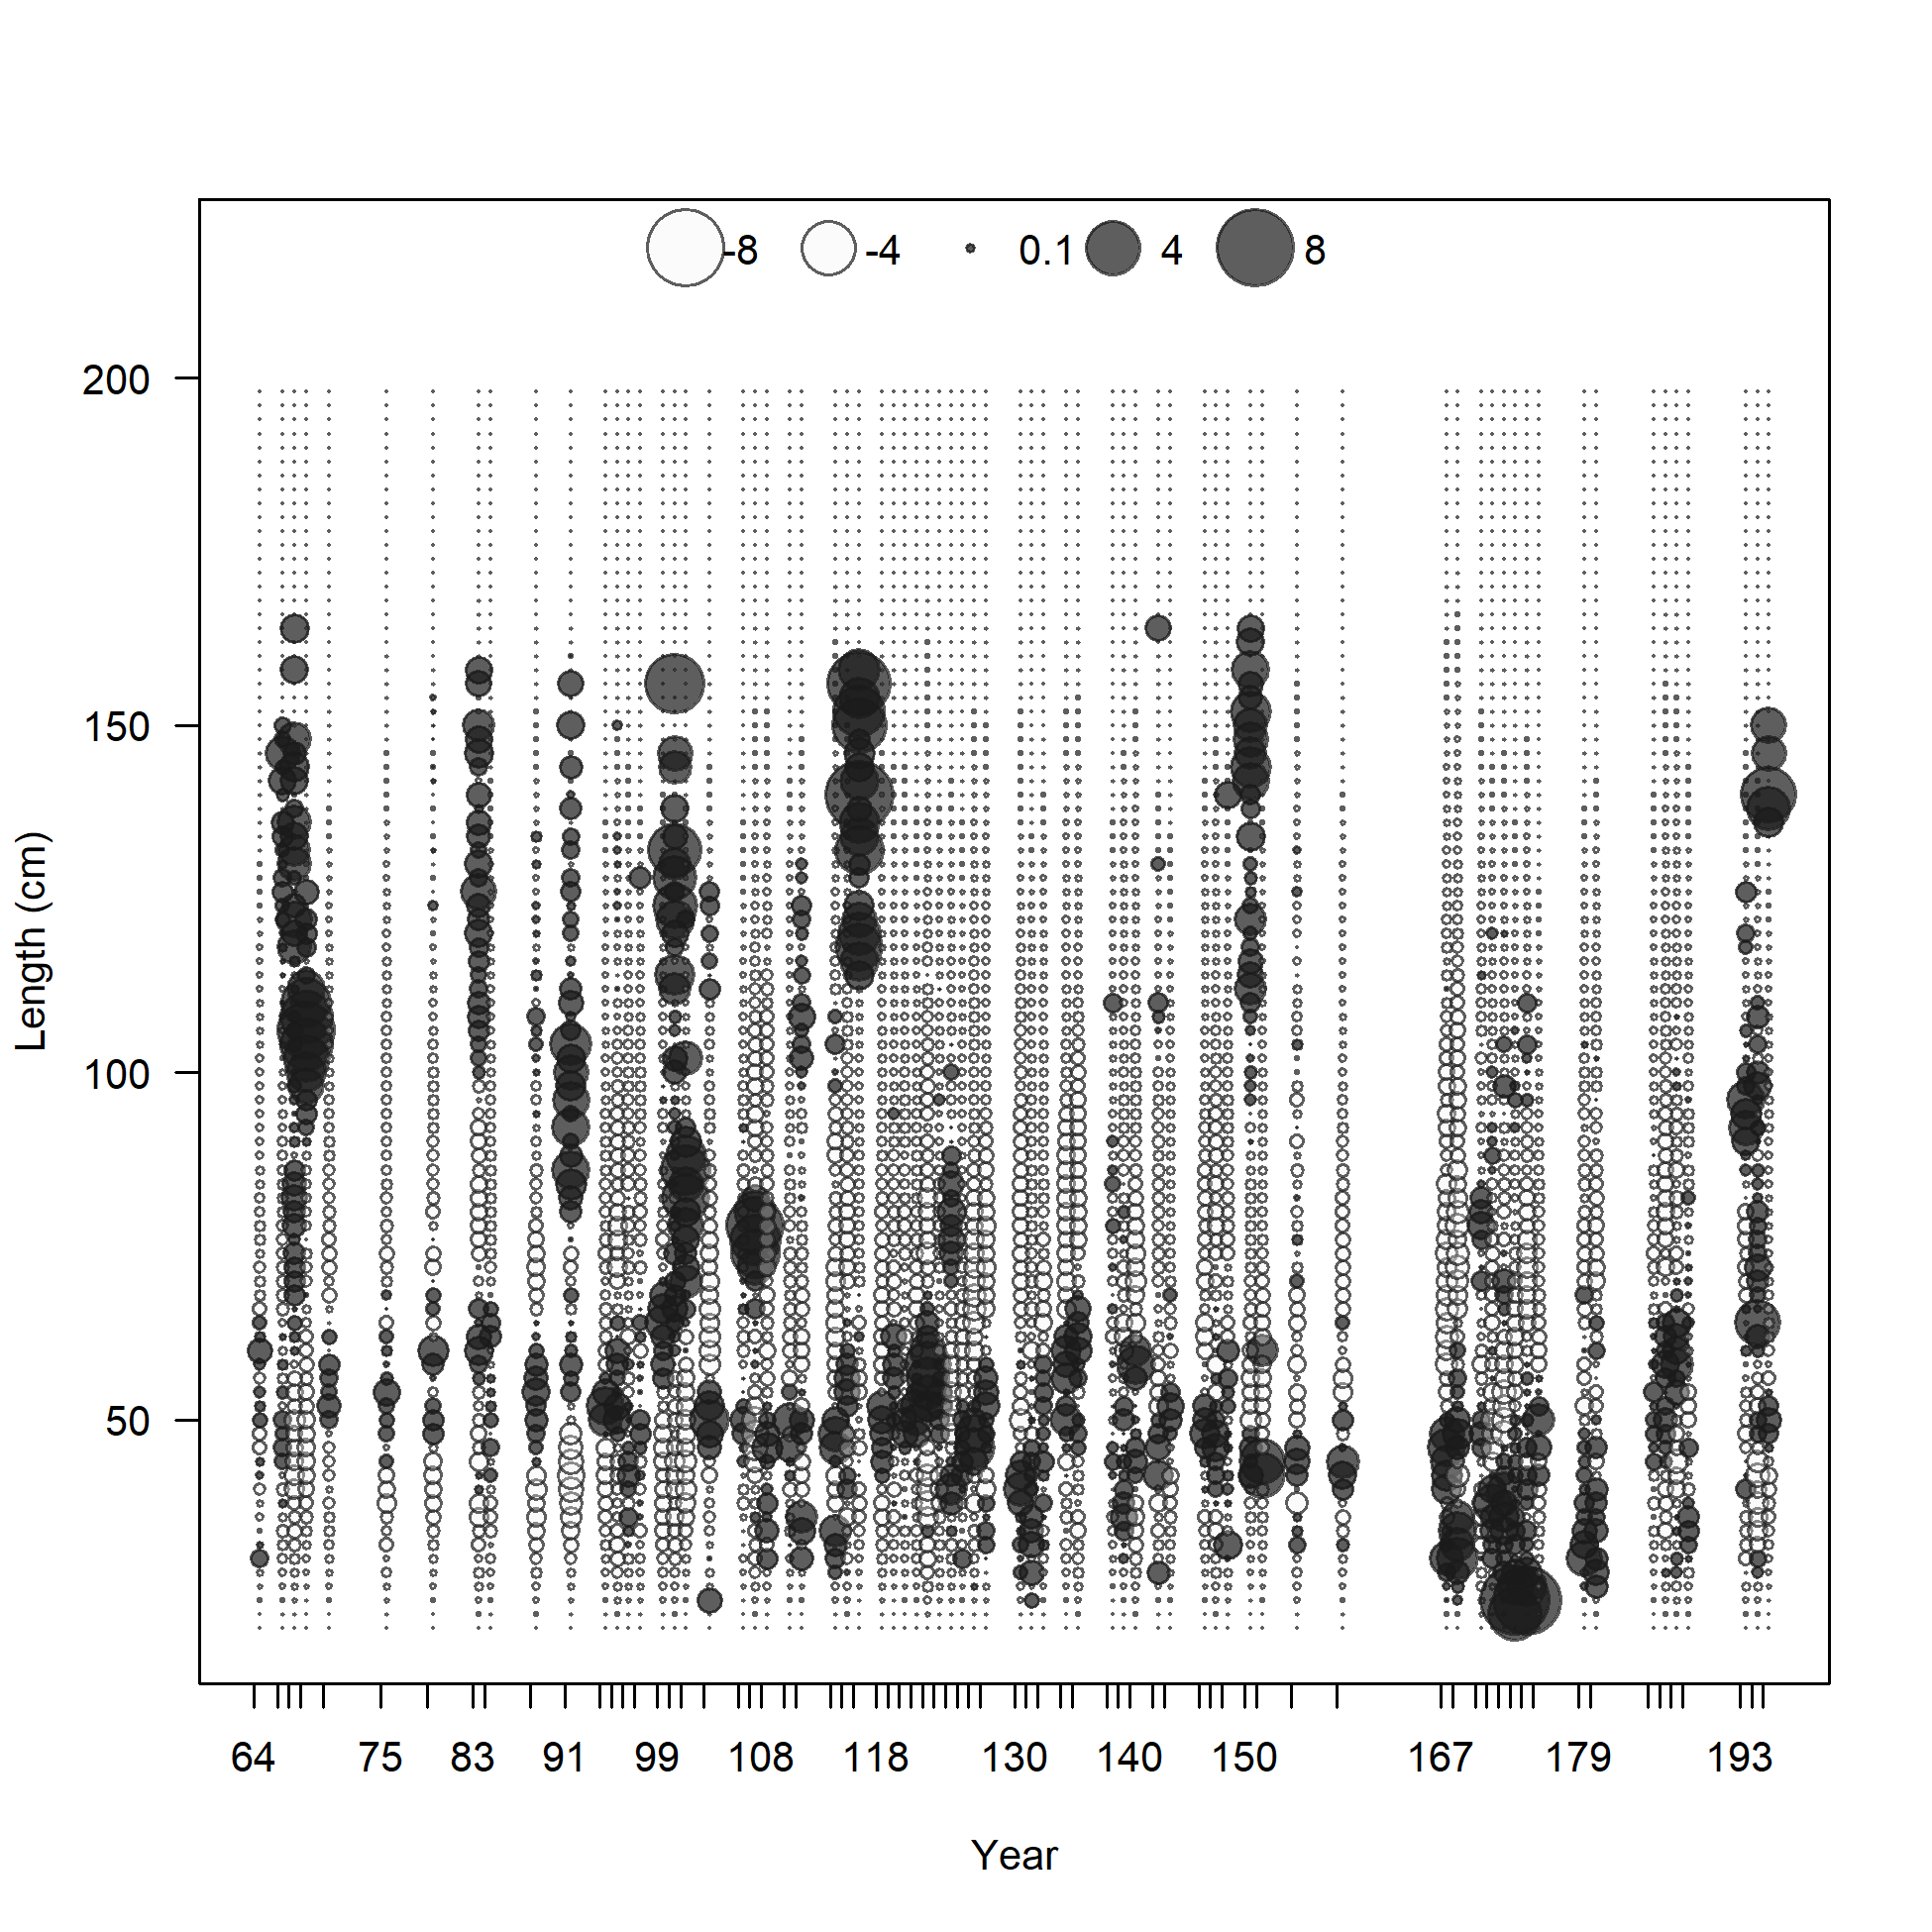
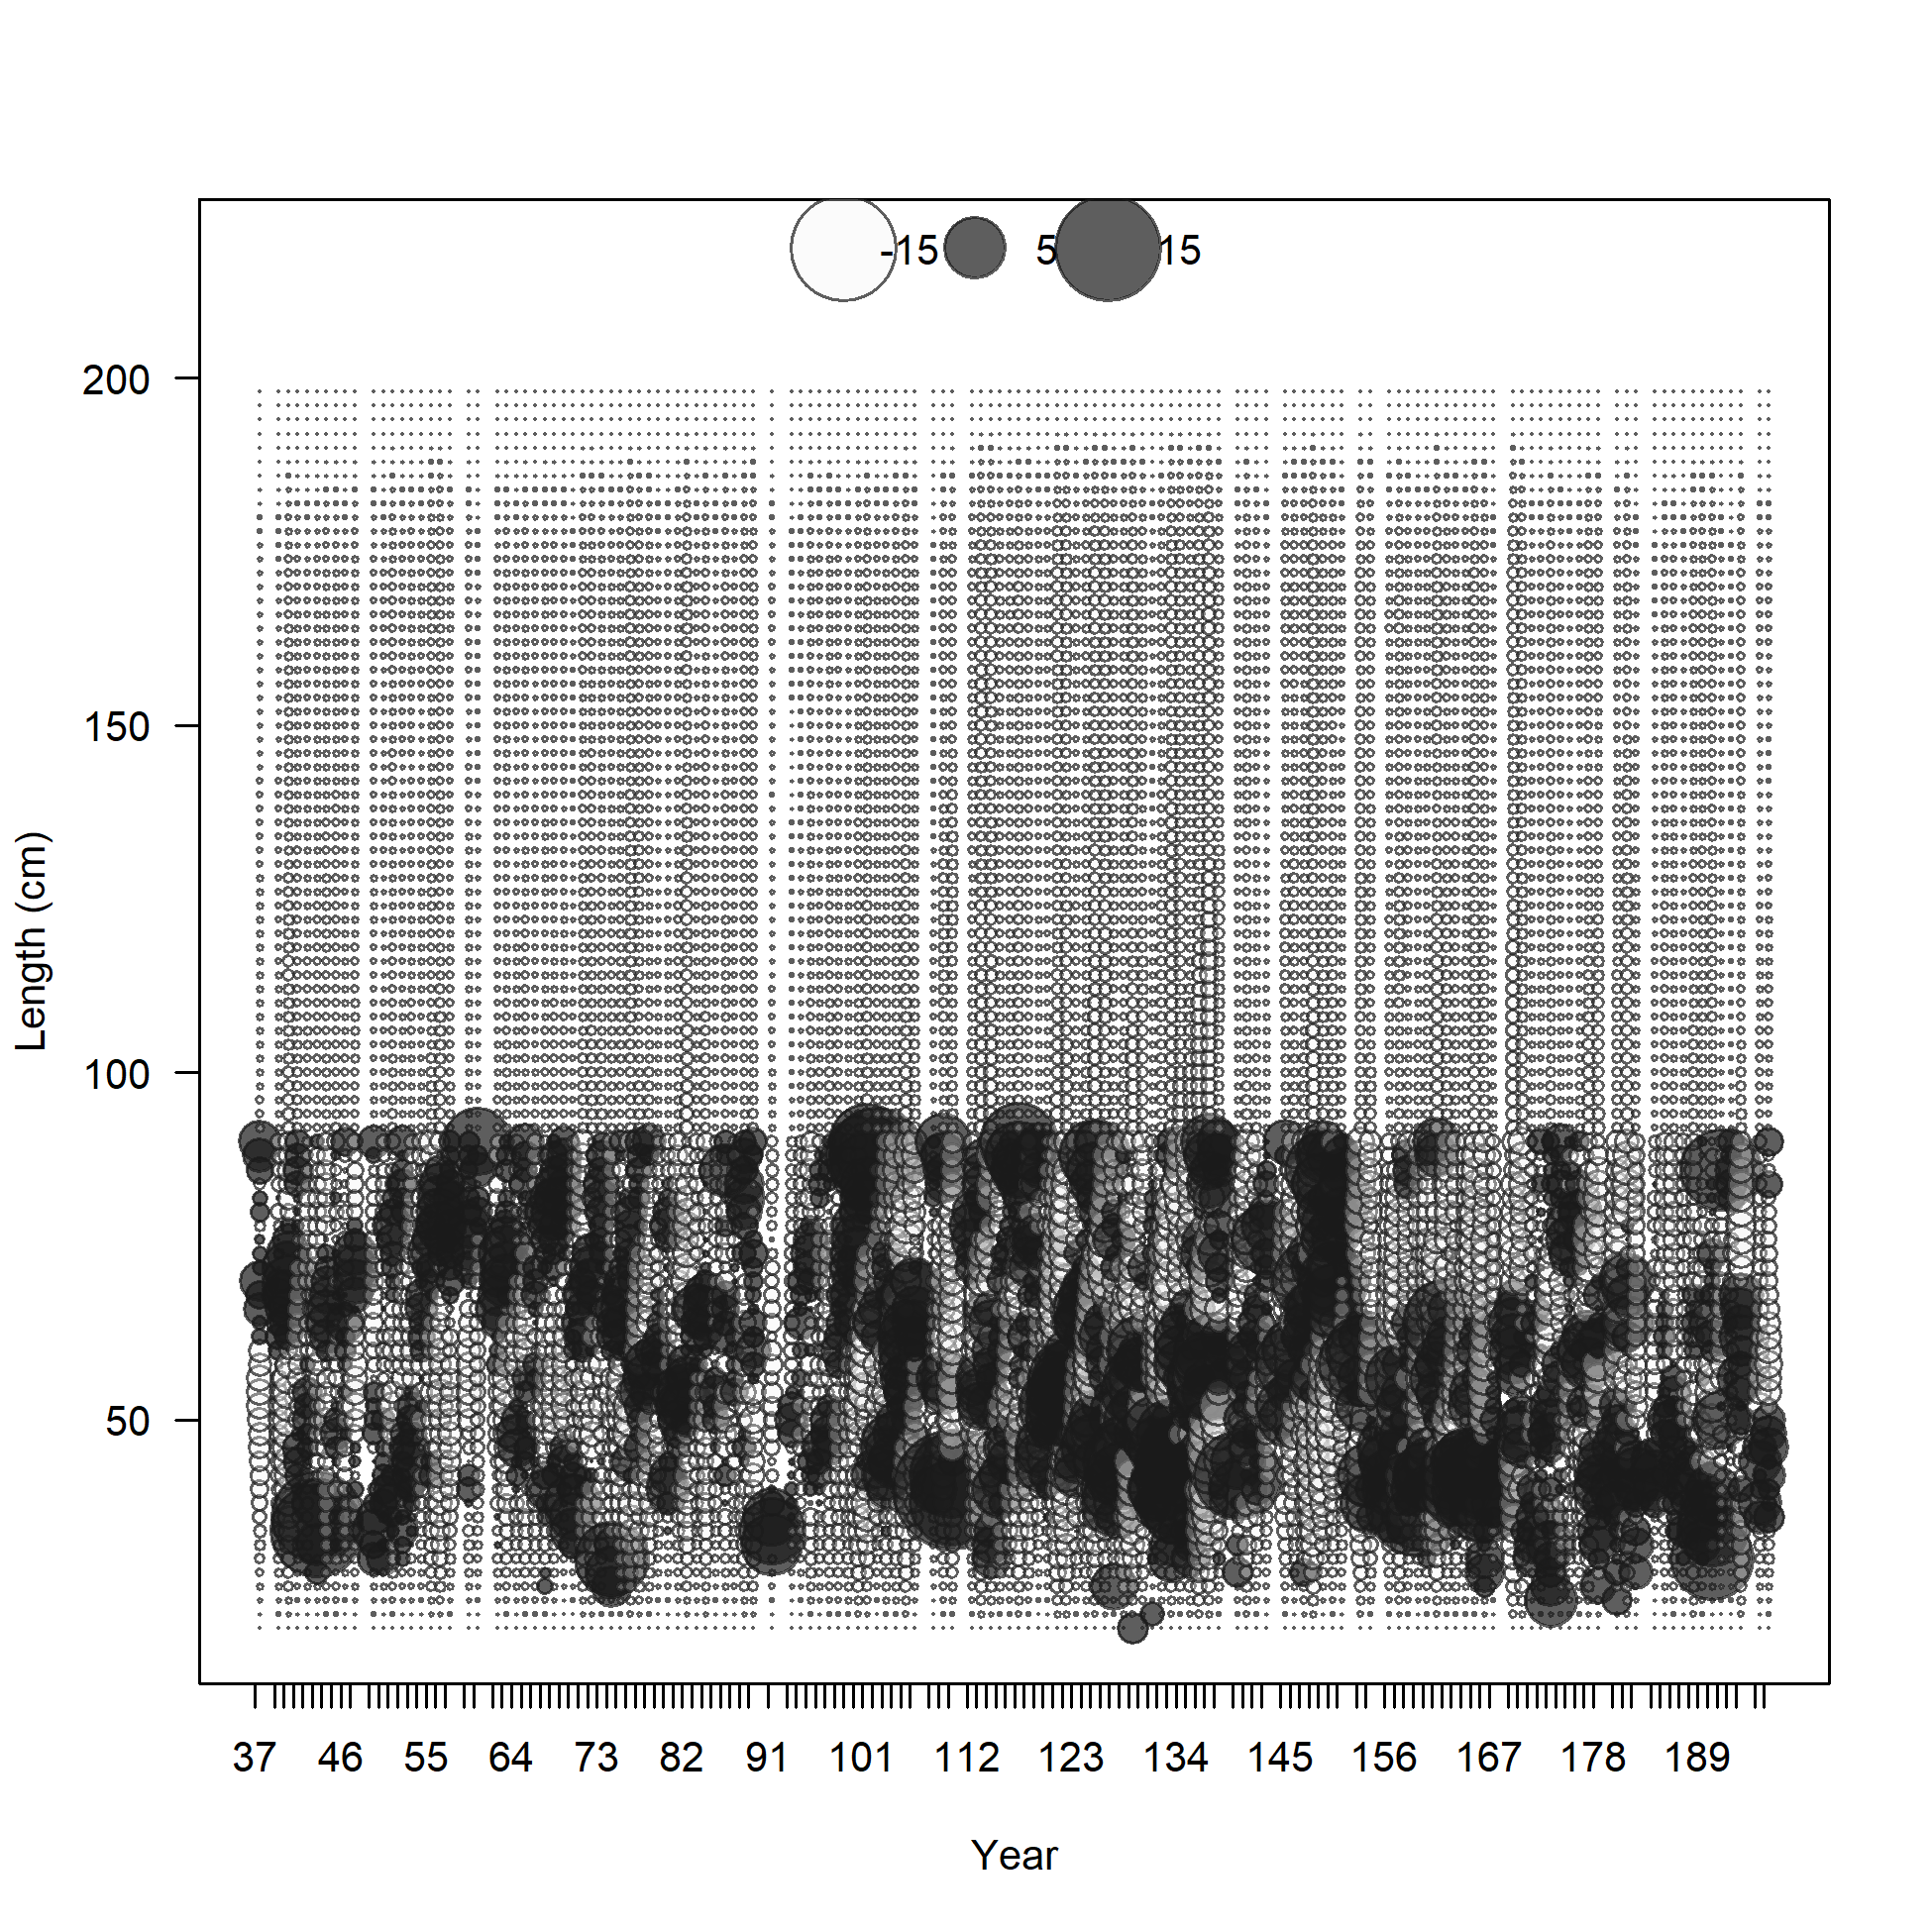
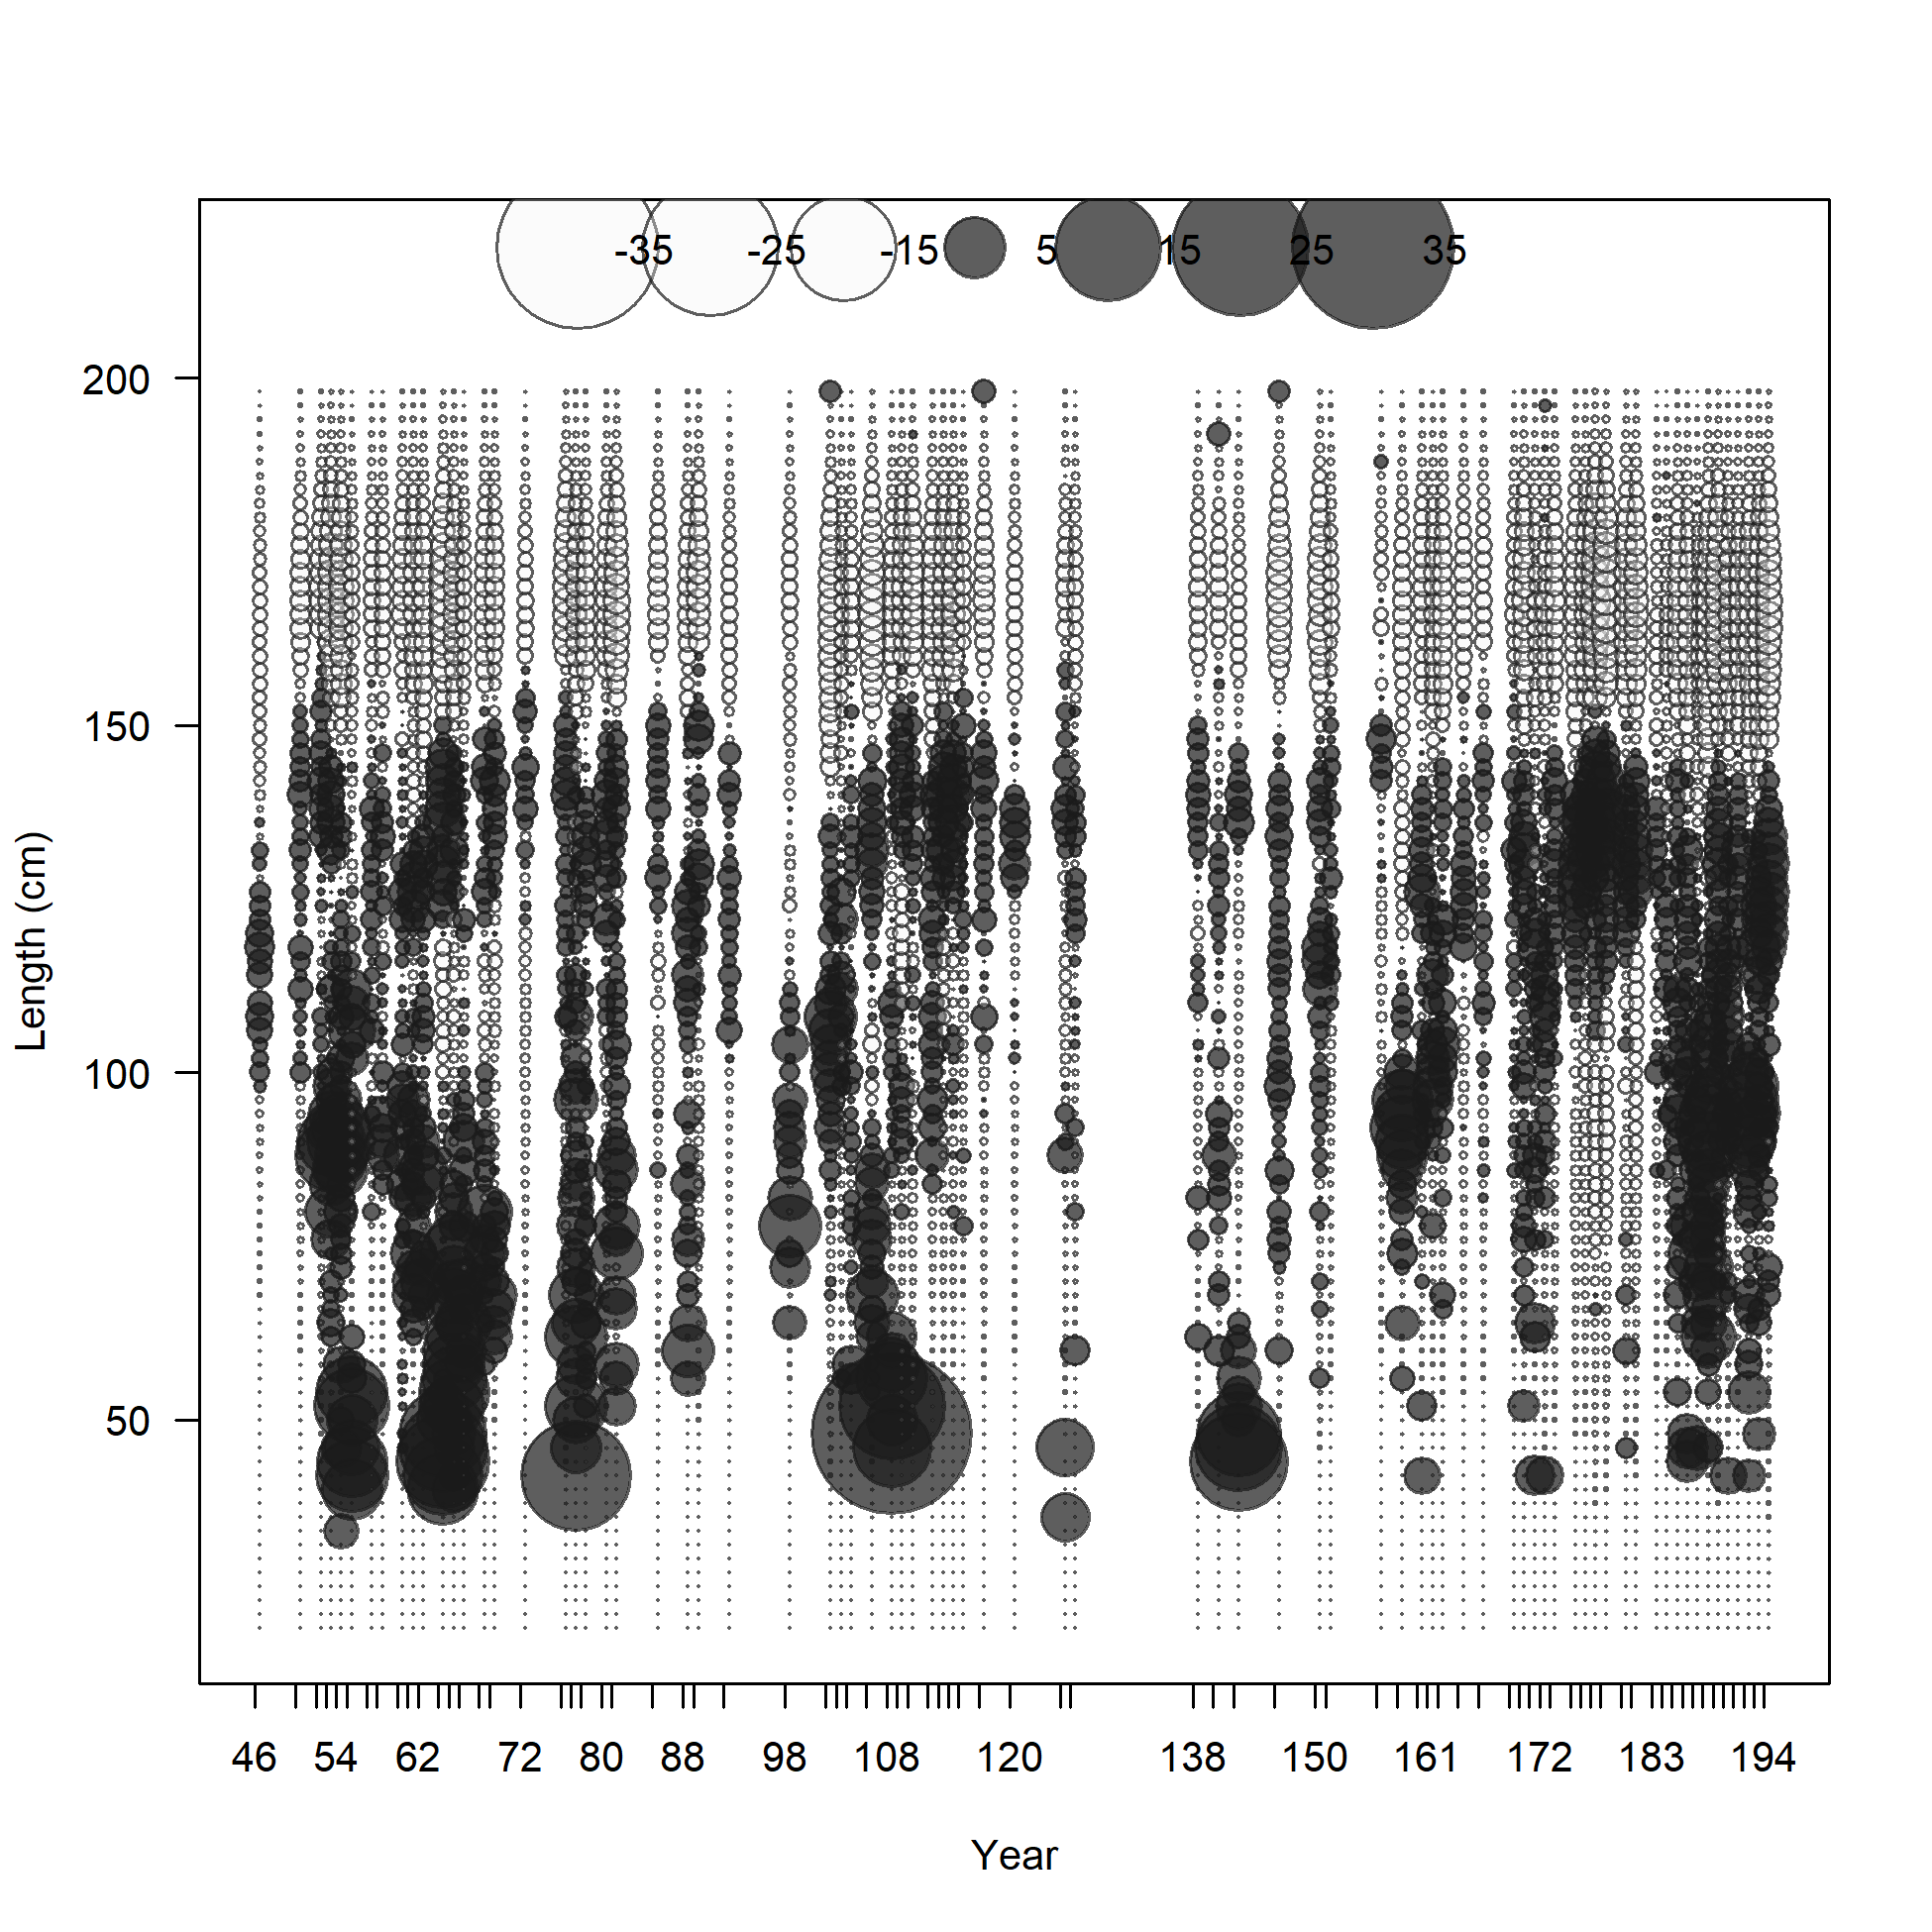
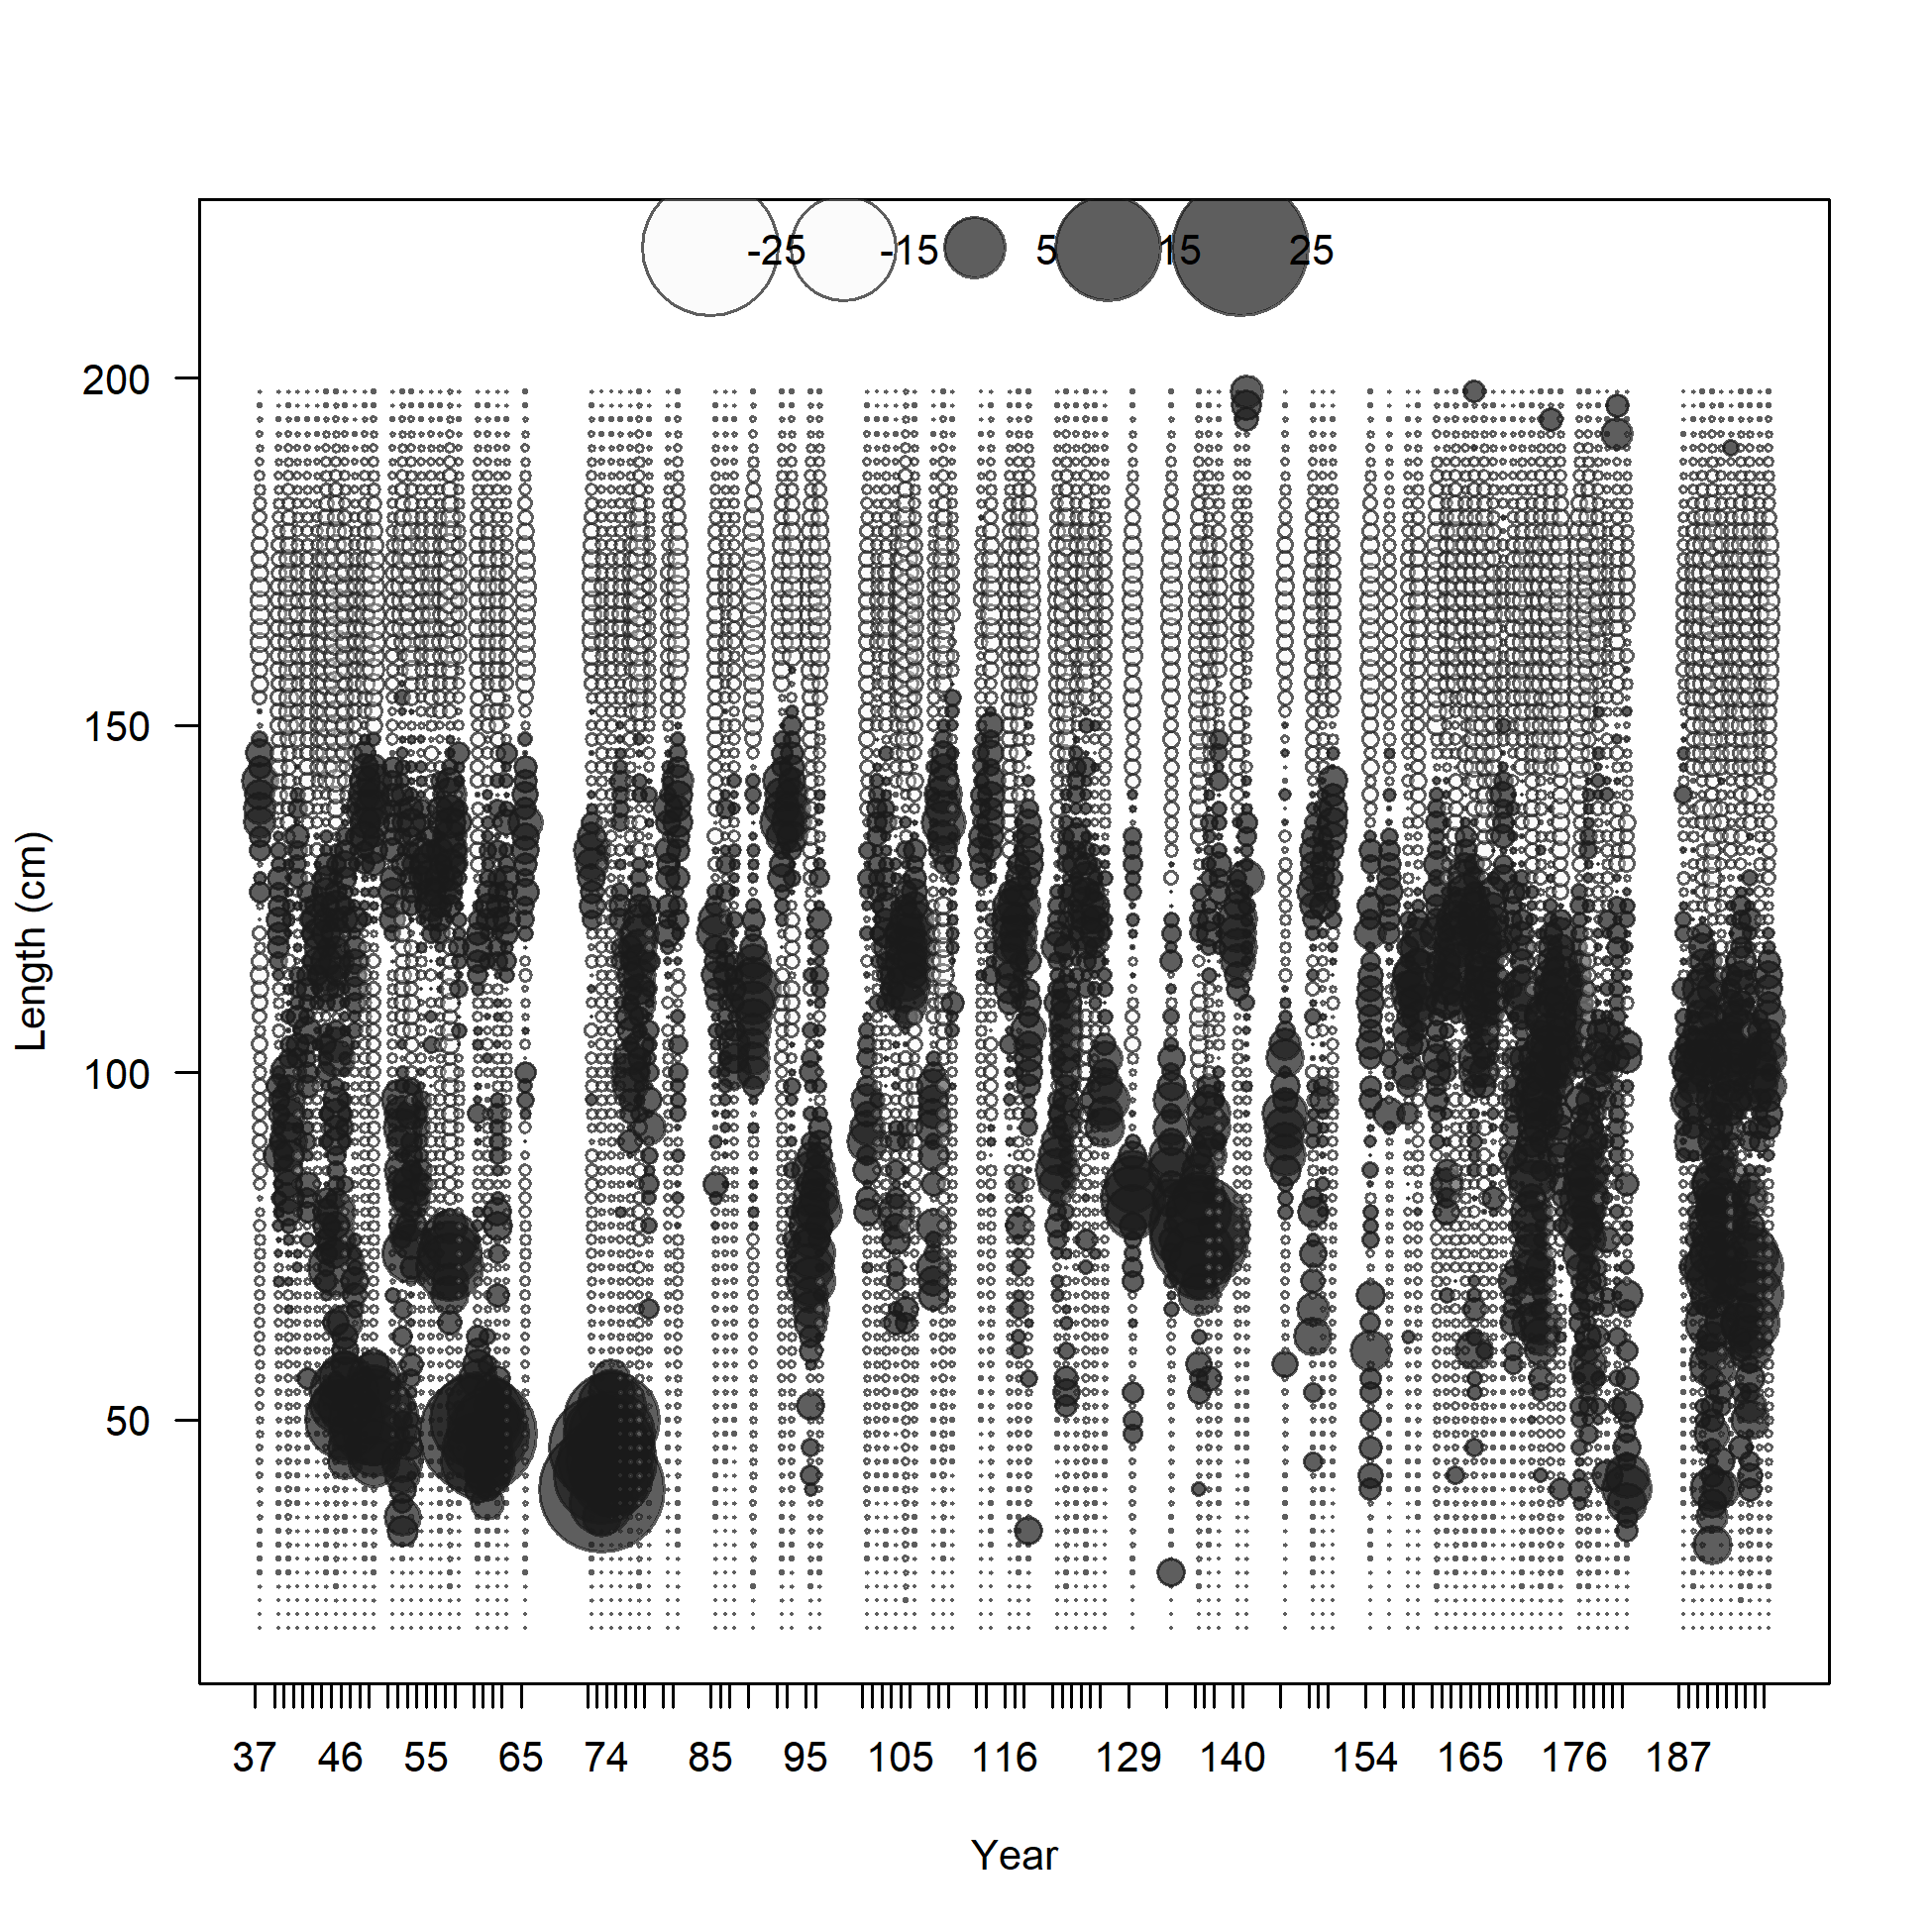
Pearson residuals, whole catch, F5.OBJ.E.inshore (max=47.63) (plot 5 of 5)
Closed bubbles are positive residuals (observed > expected) and open bubbles are negative residuals (observed < expected).
file: comp_lenfit_residsflt5mkt0_page5.png
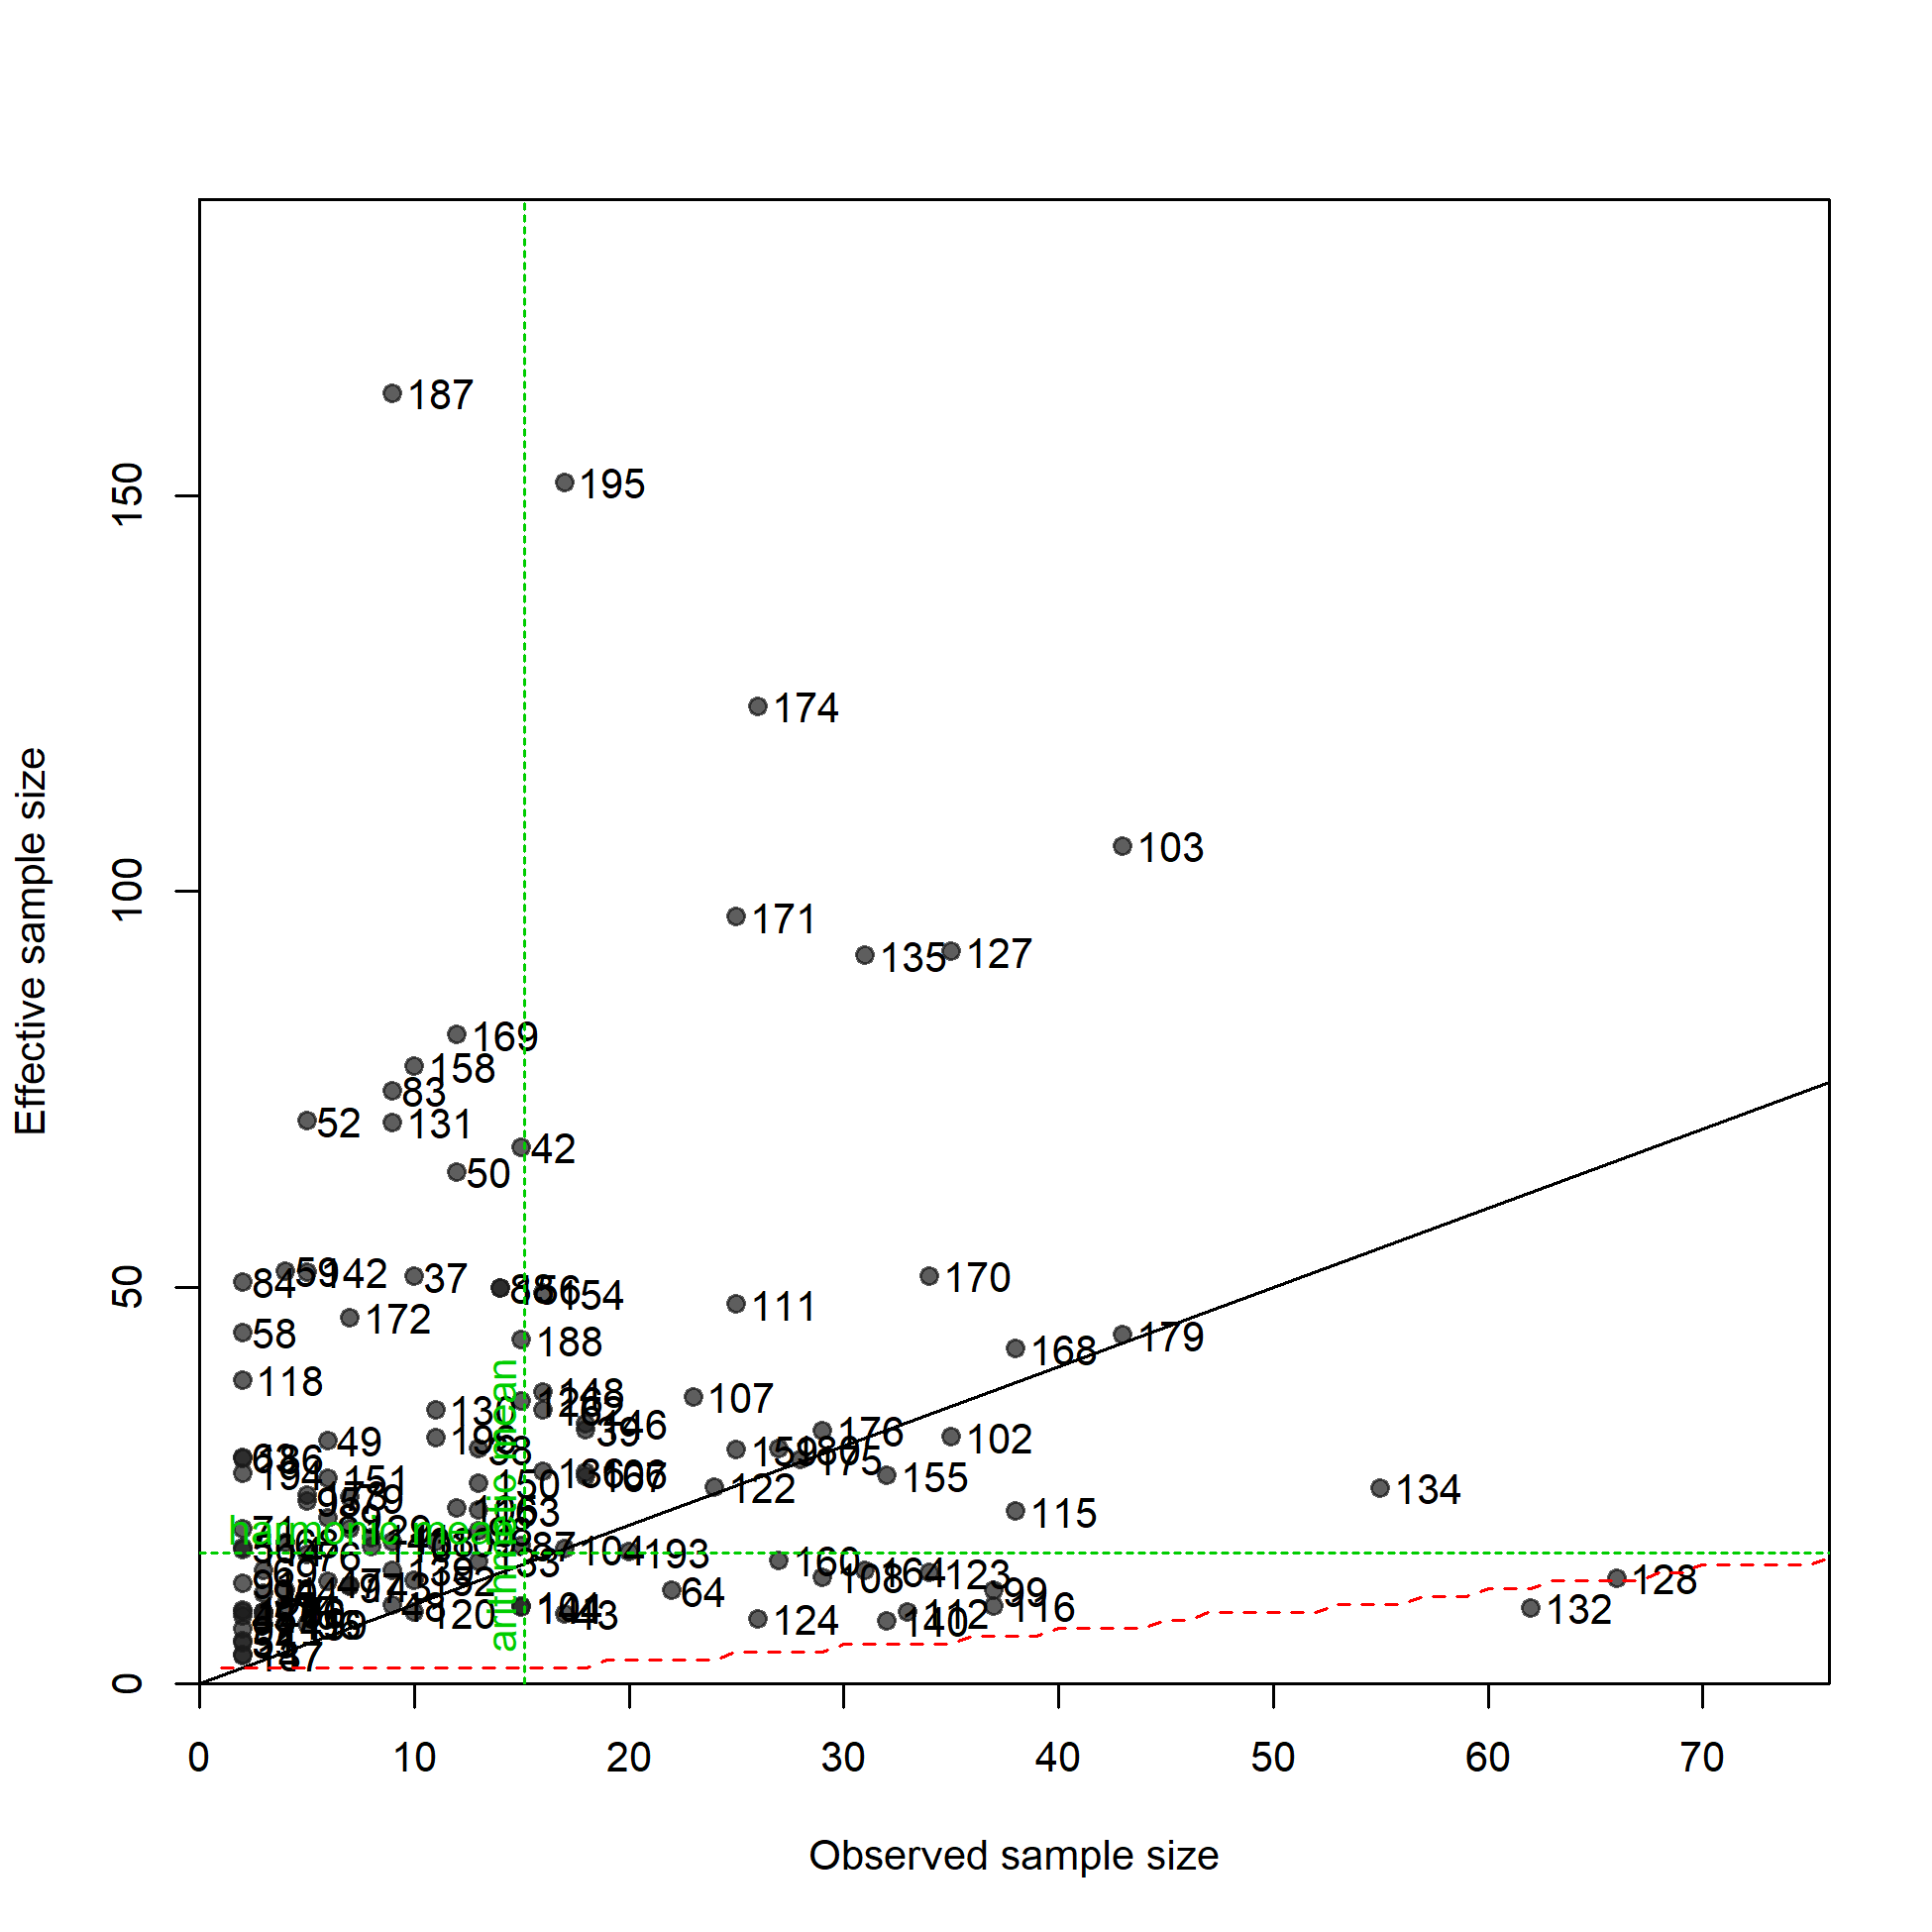
N-EffN comparison, Length comps, whole catch, F5.OBJ.E.inshore
file: comp_lenfit_sampsize_flt5mkt0.png
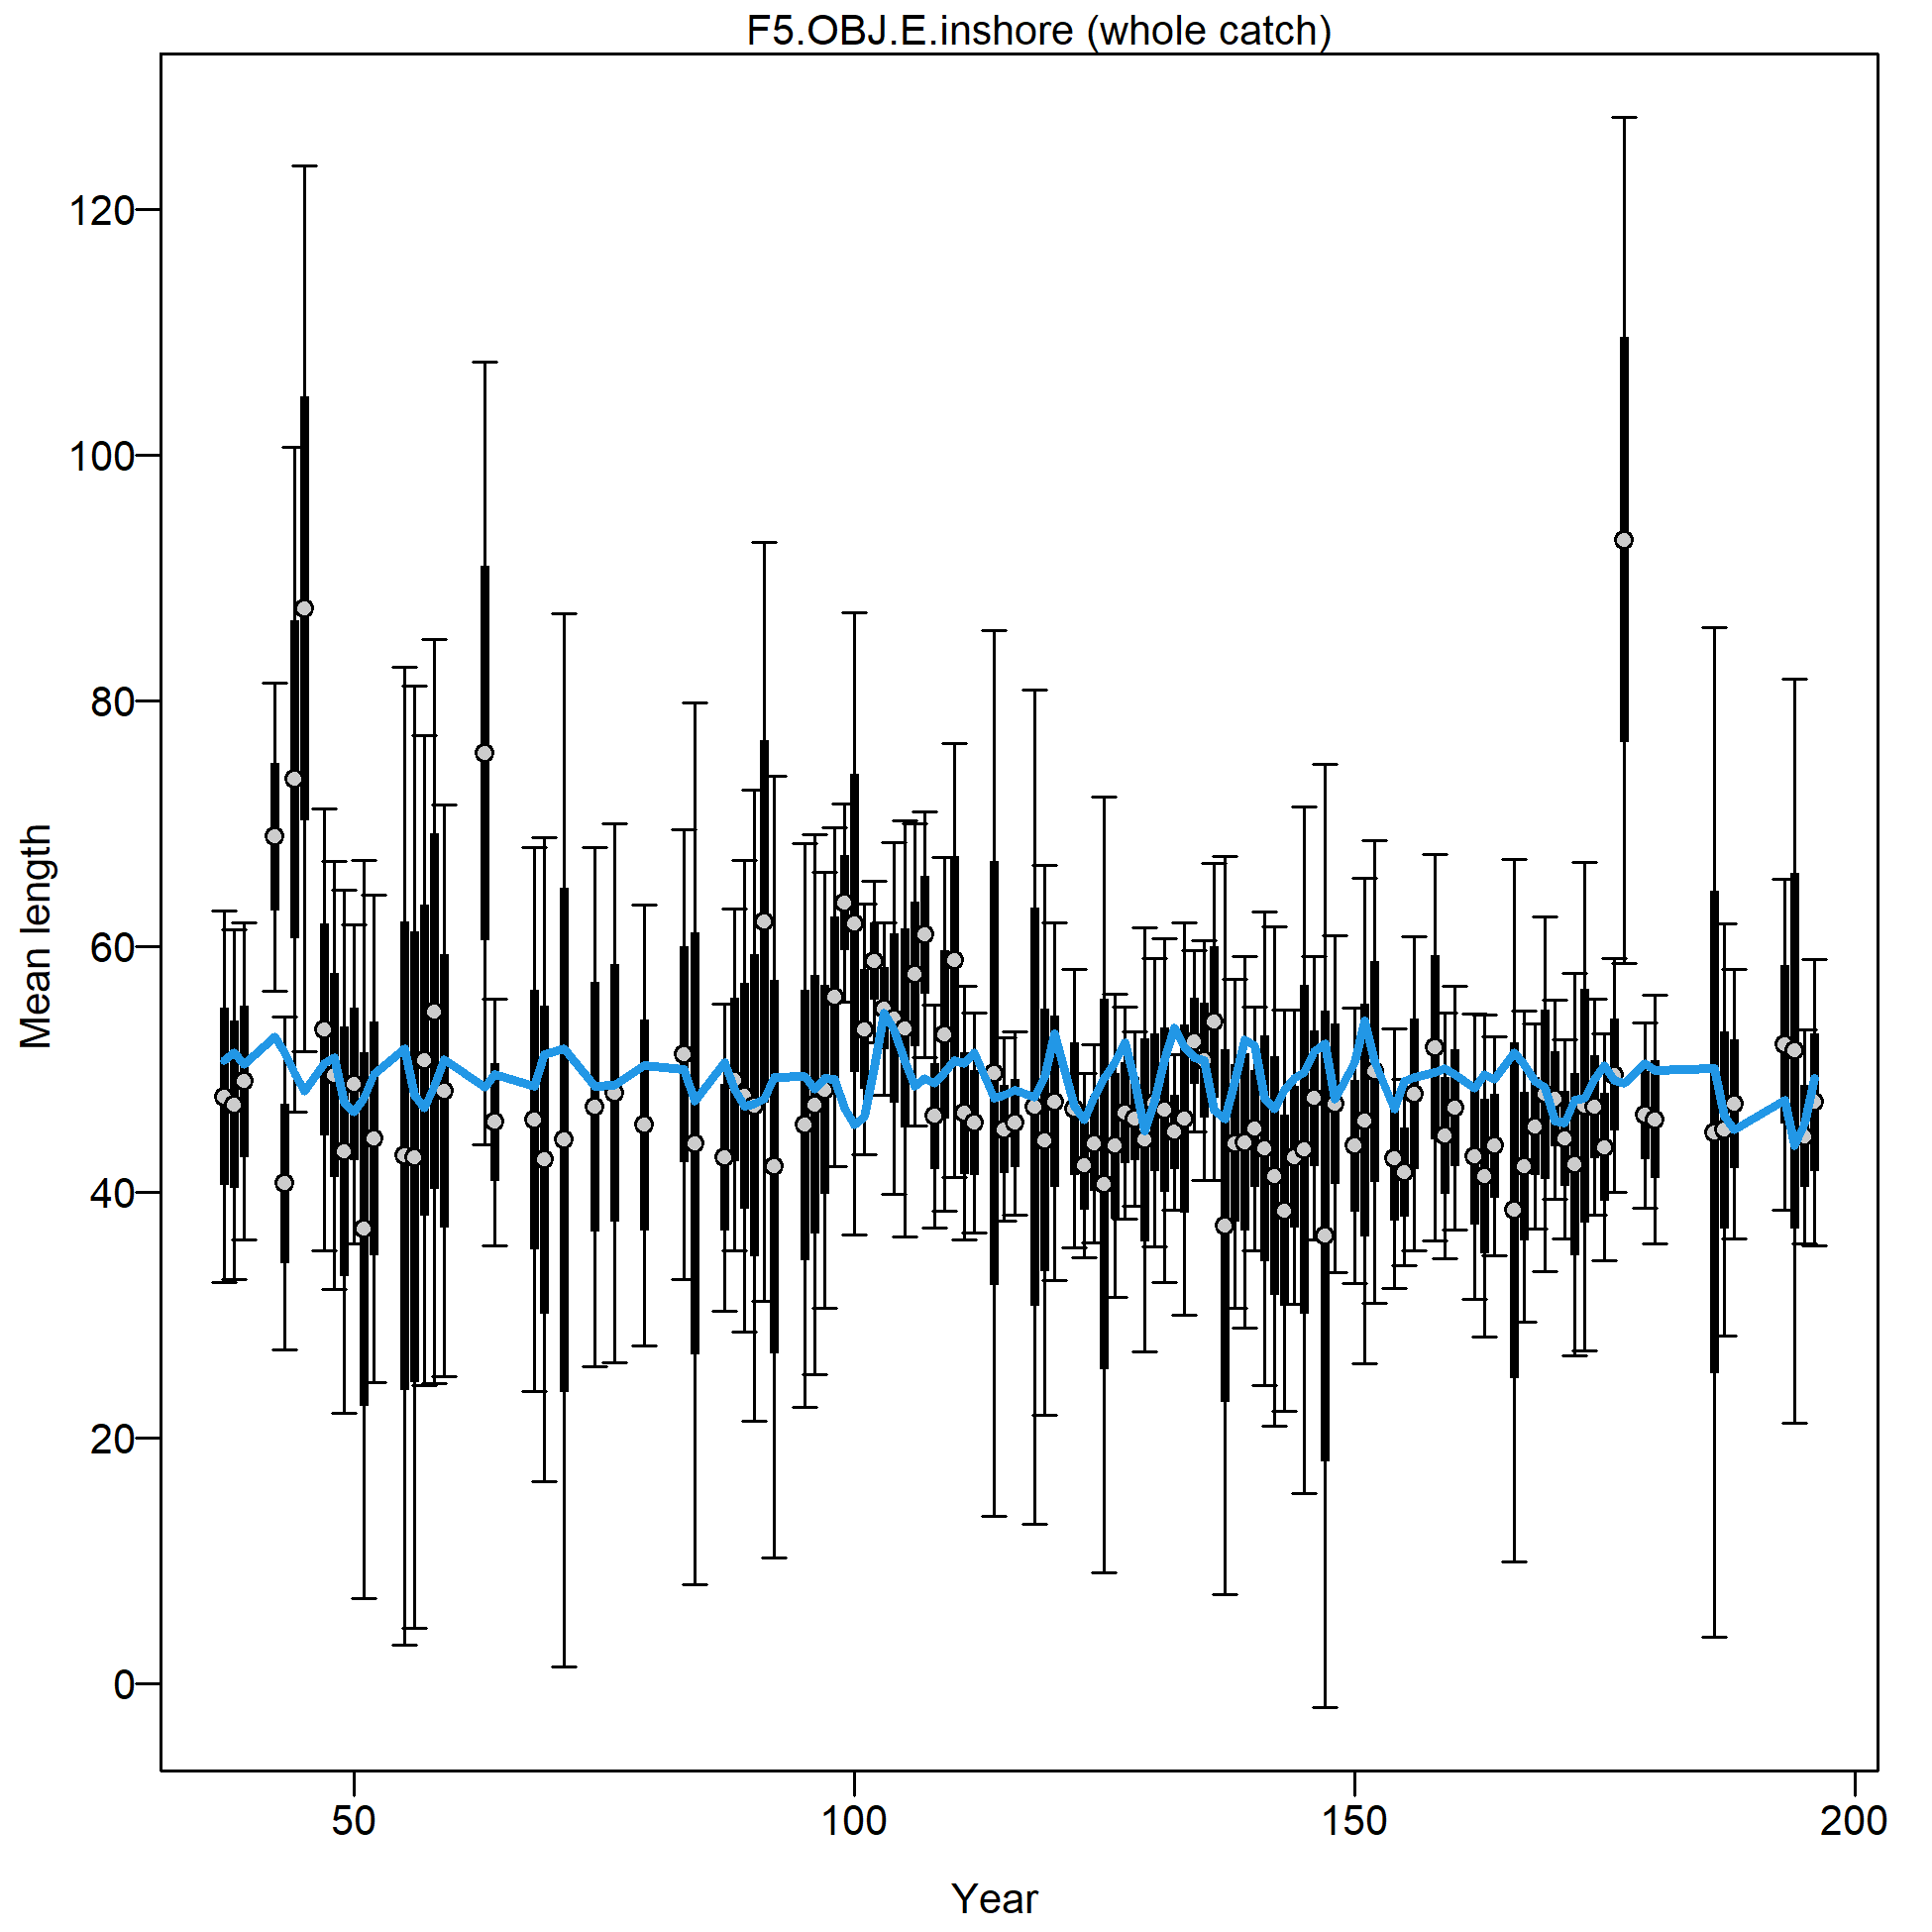
Mean length for F5.OBJ.E.inshore with 95% confidence intervals based on current sample sizes.
Francis data weighting method TA1.8: thinner intervals (with capped ends) show result of further adjusting sample sizes based on suggested multiplier (with 95% interval) for len data from F5.OBJ.E.inshore:
0.2289 (0.1598-0.3726)
For more info, see Francis (2011).
file: comp_lenfit_data_weighting_TA1.8_F5.OBJ.E.inshore.png
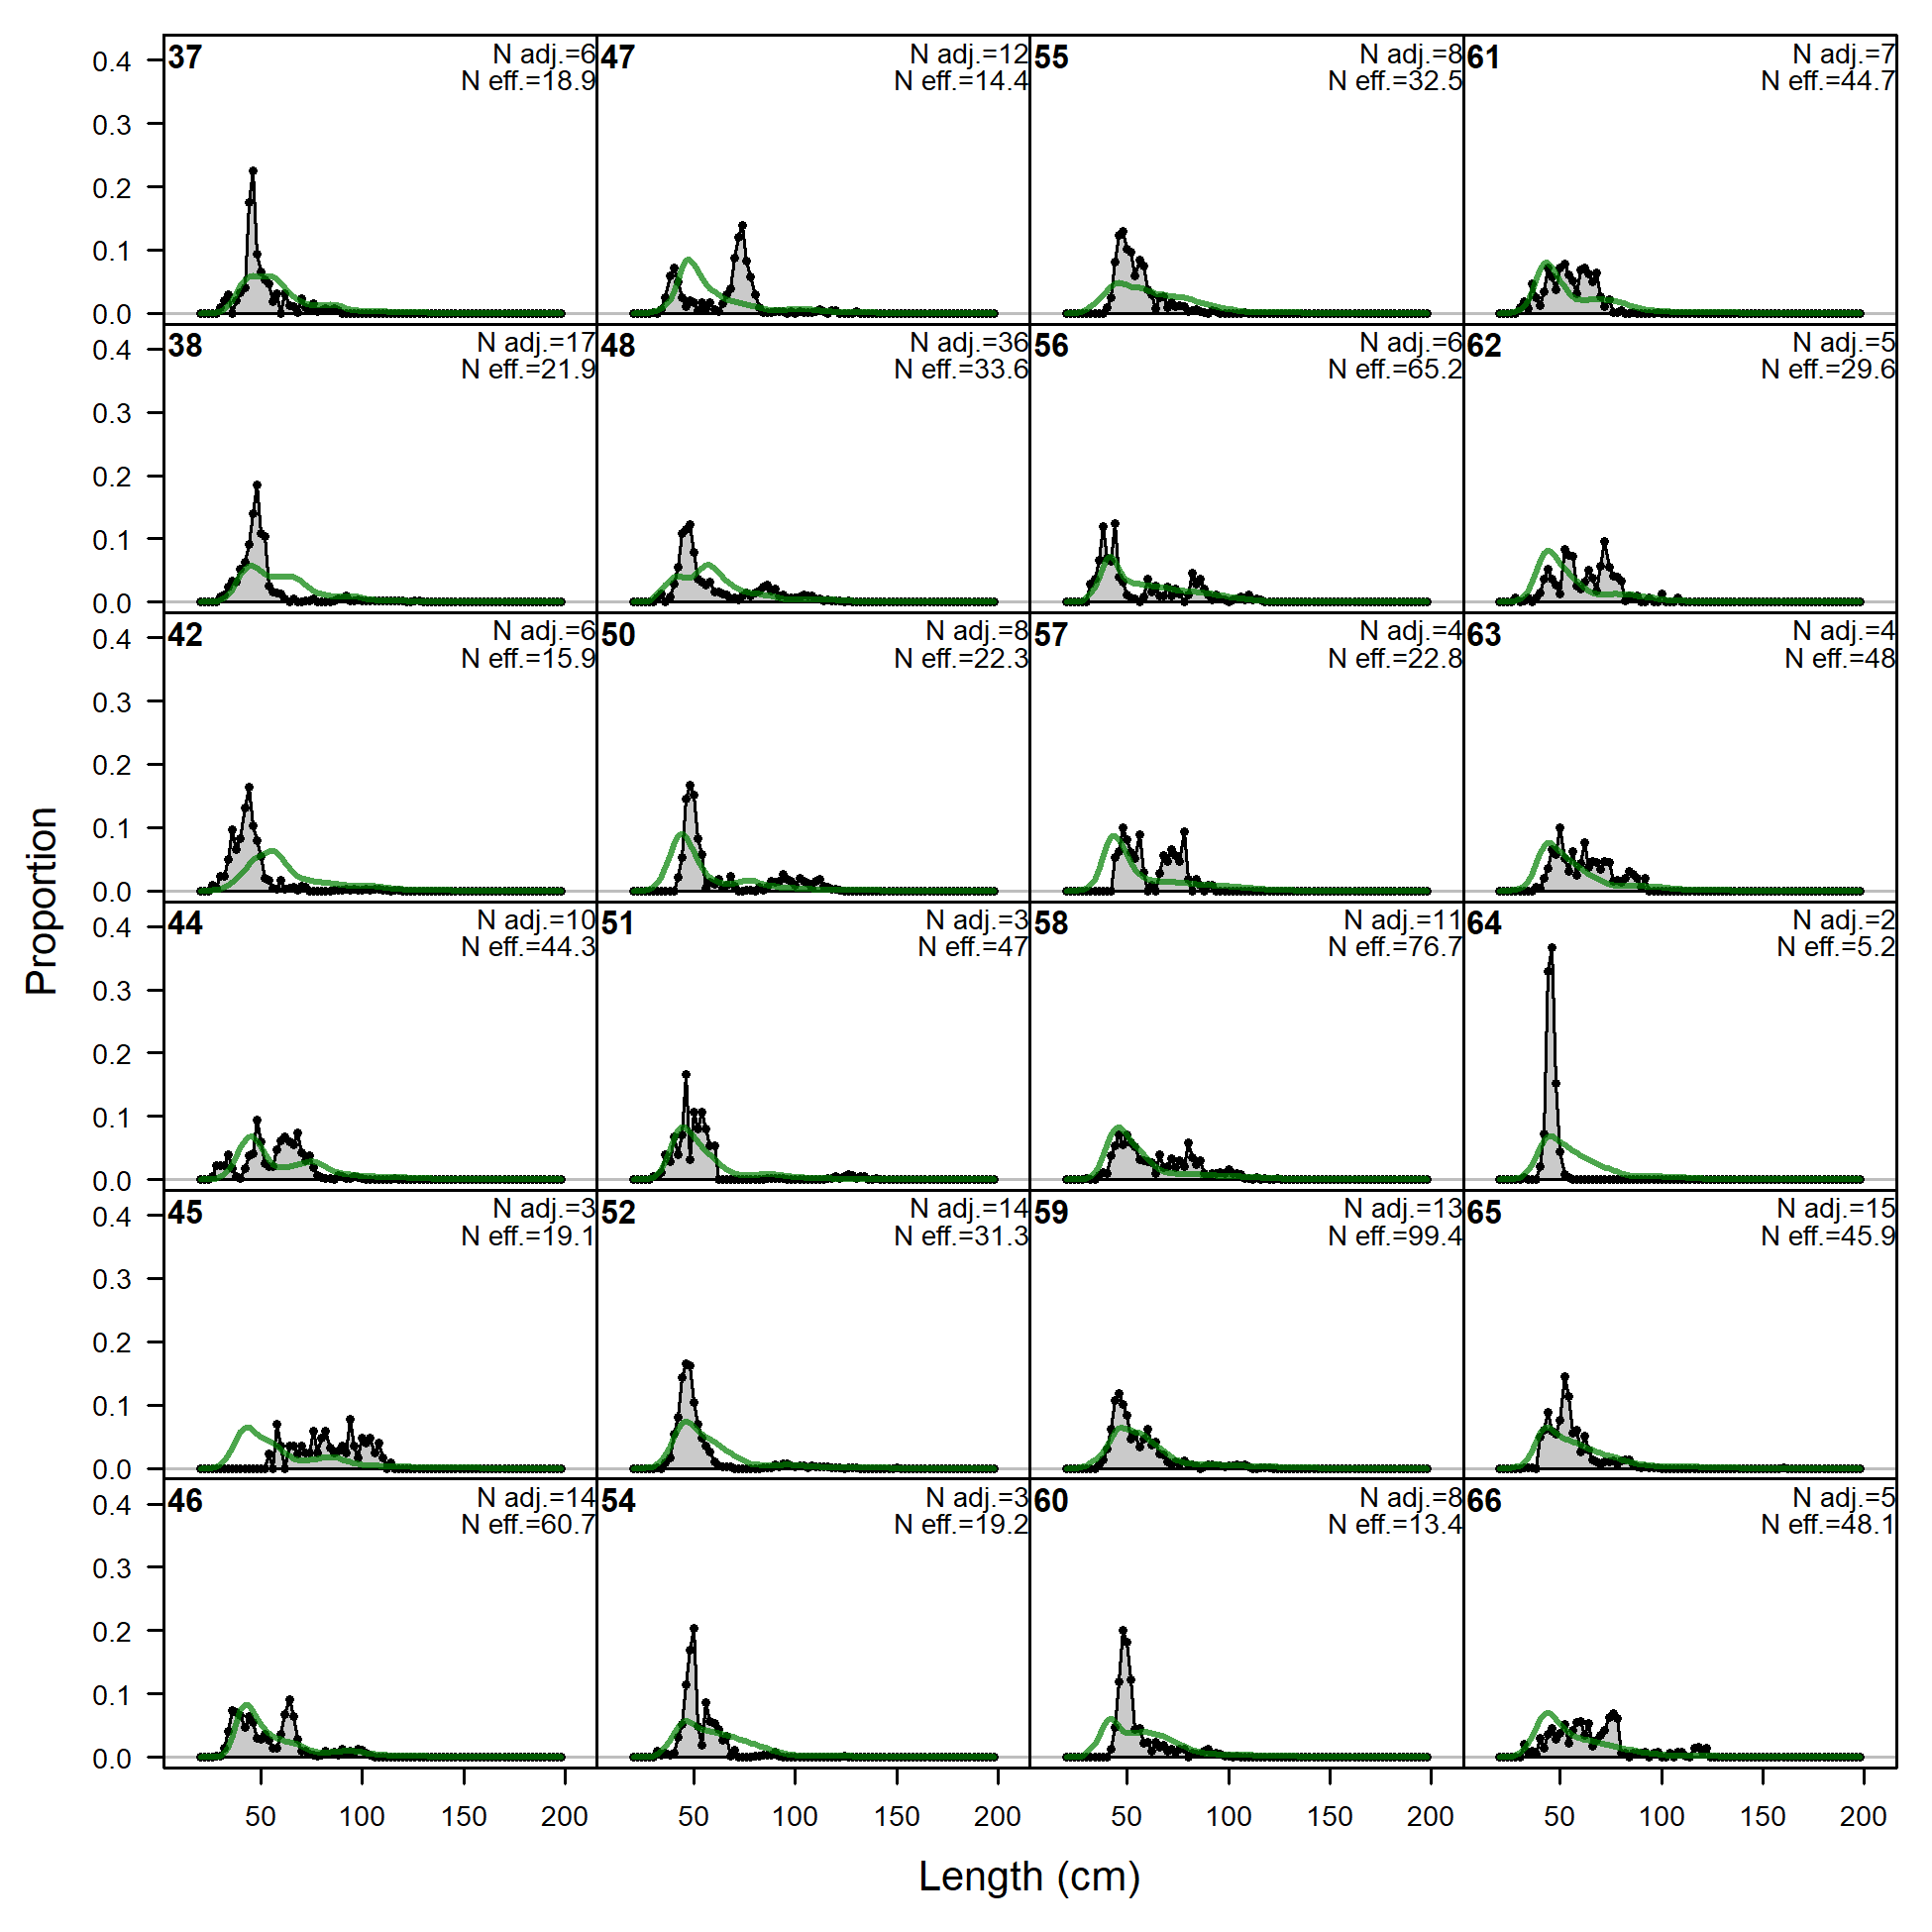
Length comps, whole catch, F6.OBJ.N.offshore (plot 1 of 3).
'N adj.' is the input sample size after data-weighting adjustment. N eff. is the calculated effective sample size used in the McAllister-Ianelli tuning method.
file: comp_lenfit_flt6mkt0_page1.png
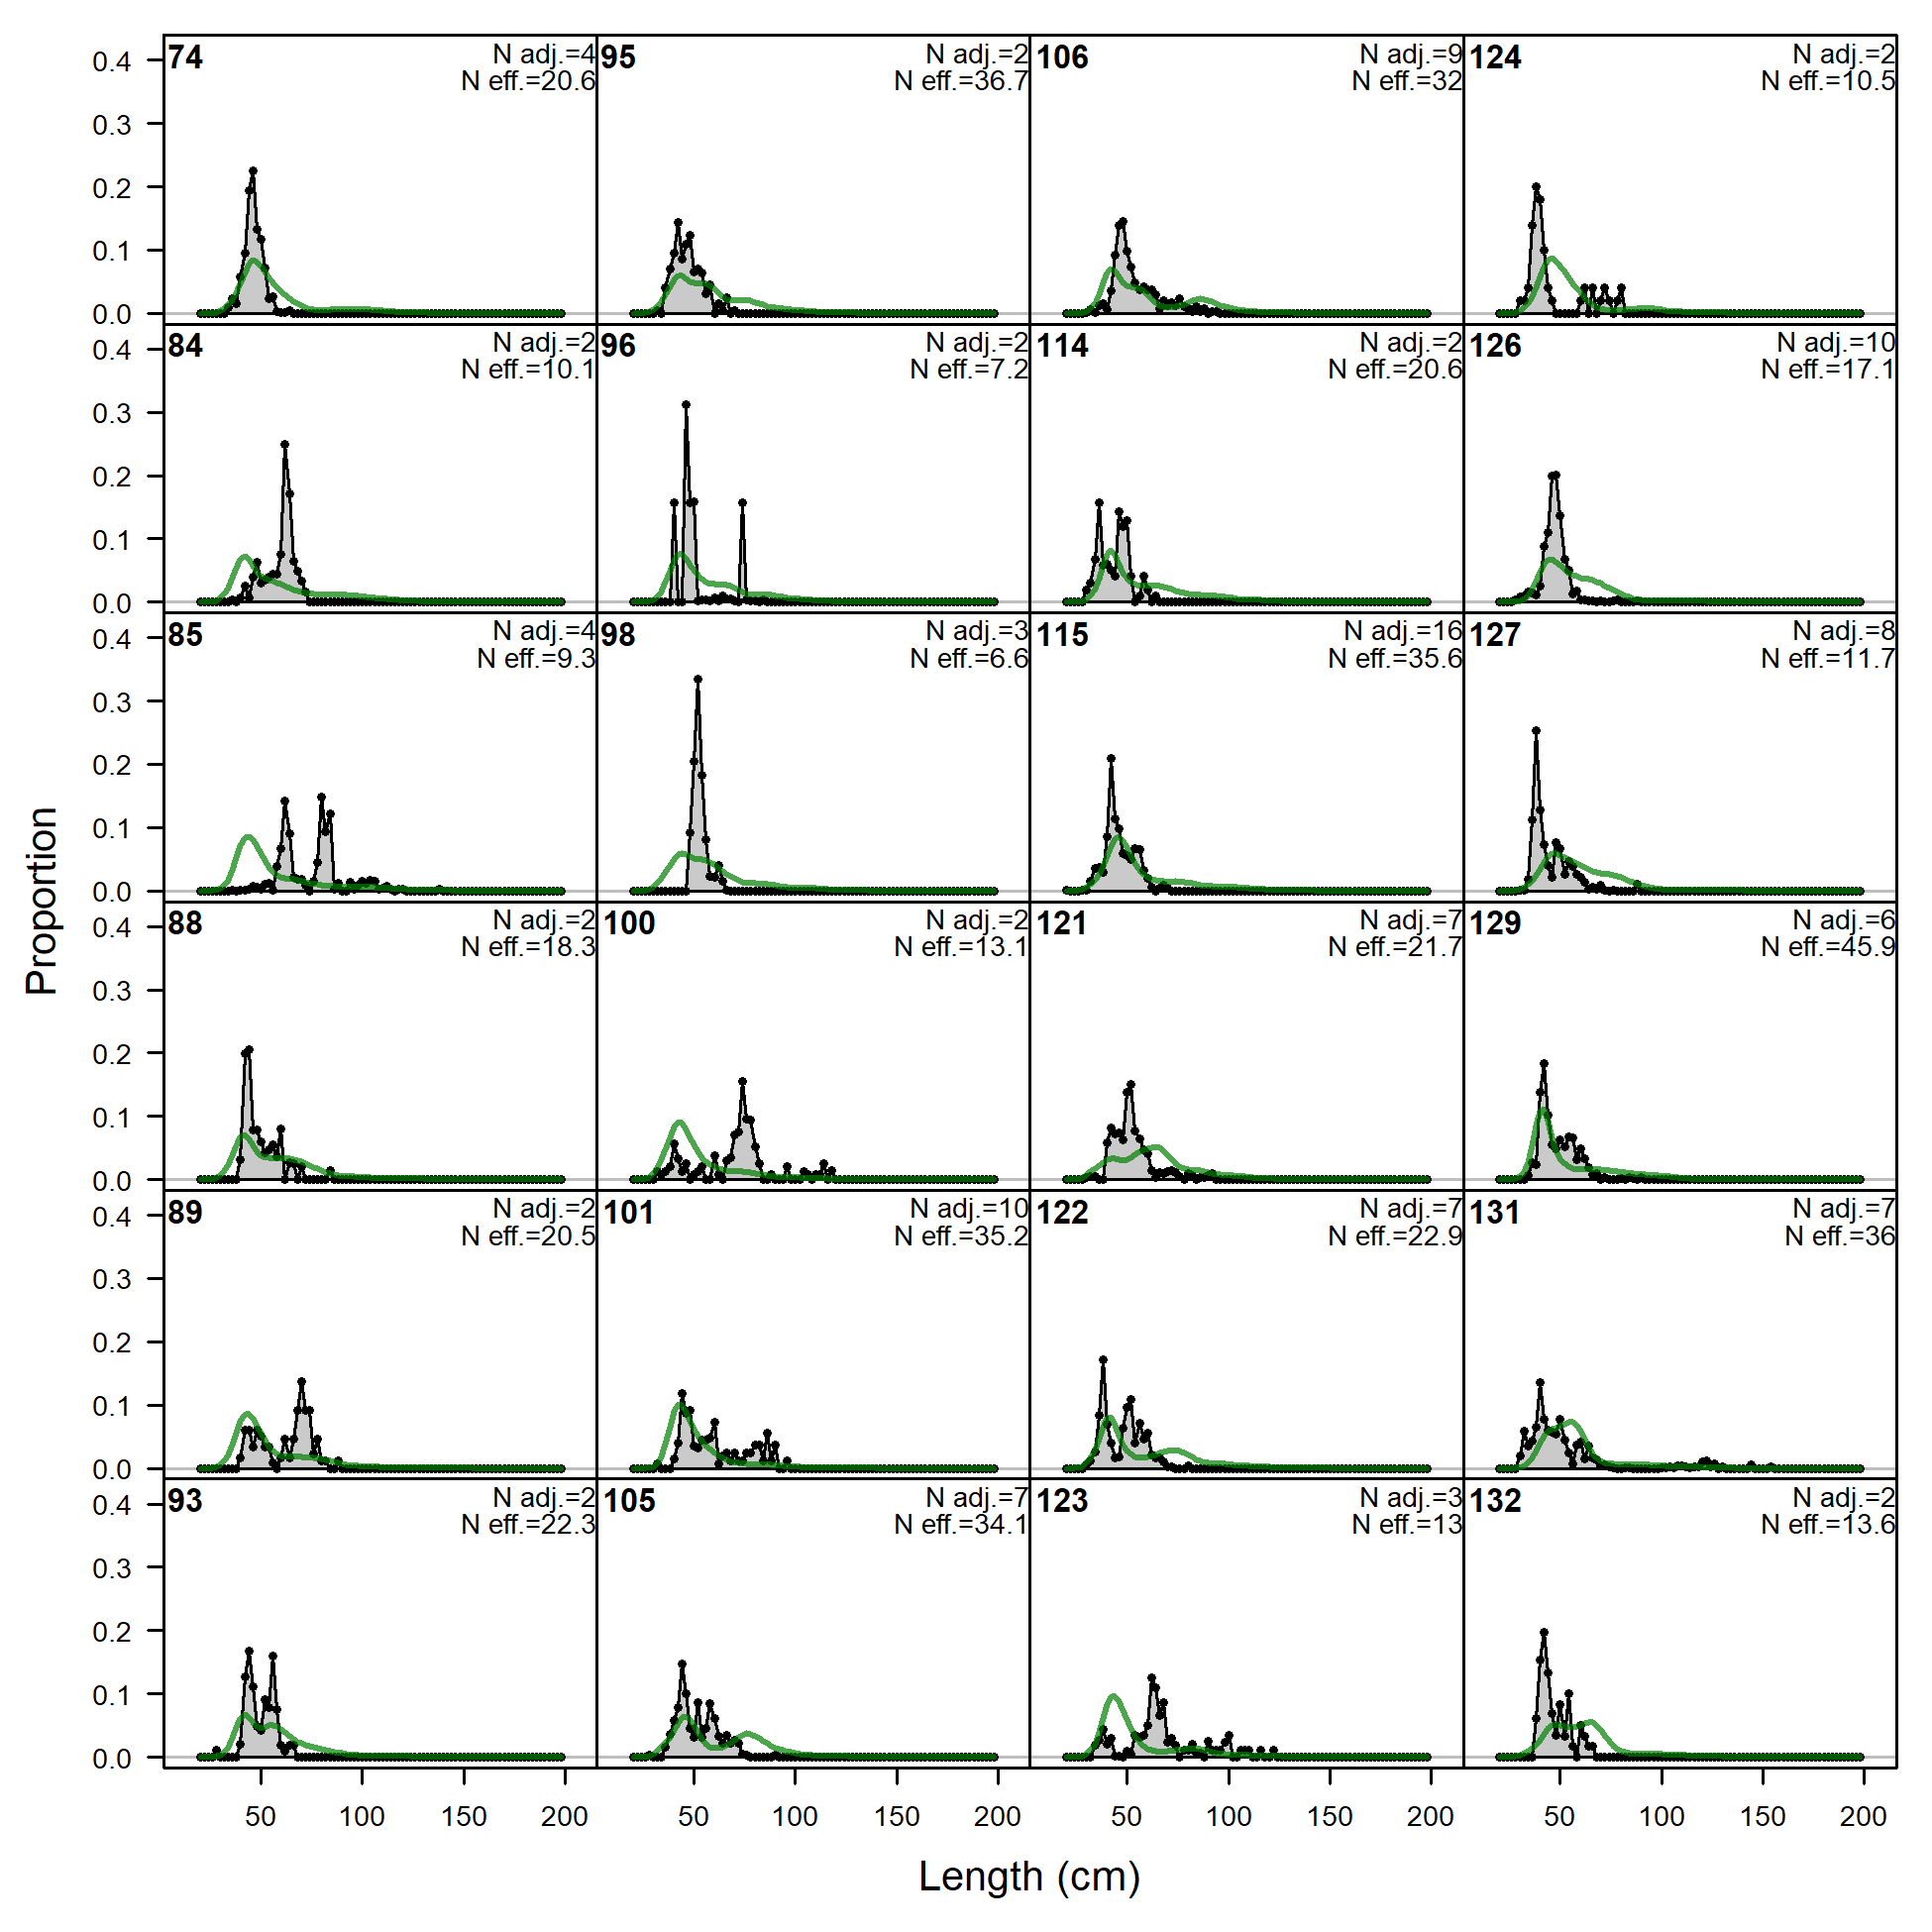
Length comps, whole catch, F6.OBJ.N.offshore (plot 1 of 3).
'N adj.' is the input sample size after data-weighting adjustment. N eff. is the calculated effective sample size used in the McAllister-Ianelli tuning method. (plot 2 of 3)
file: comp_lenfit_flt6mkt0_page2.png
Length comps, whole catch, F6.OBJ.N.offshore (plot 1 of 3).
'N adj.' is the input sample size after data-weighting adjustment. N eff. is the calculated effective sample size used in the McAllister-Ianelli tuning method. (plot 2 of 3) (plot 3 of 3)
file: comp_lenfit_flt6mkt0_page3.png
Pearson residuals, whole catch, F6.OBJ.N.offshore (max=6.37) (plot 3 of 3)
Closed bubbles are positive residuals (observed > expected) and open bubbles are negative residuals (observed < expected).
file: comp_lenfit_residsflt6mkt0_page3.png
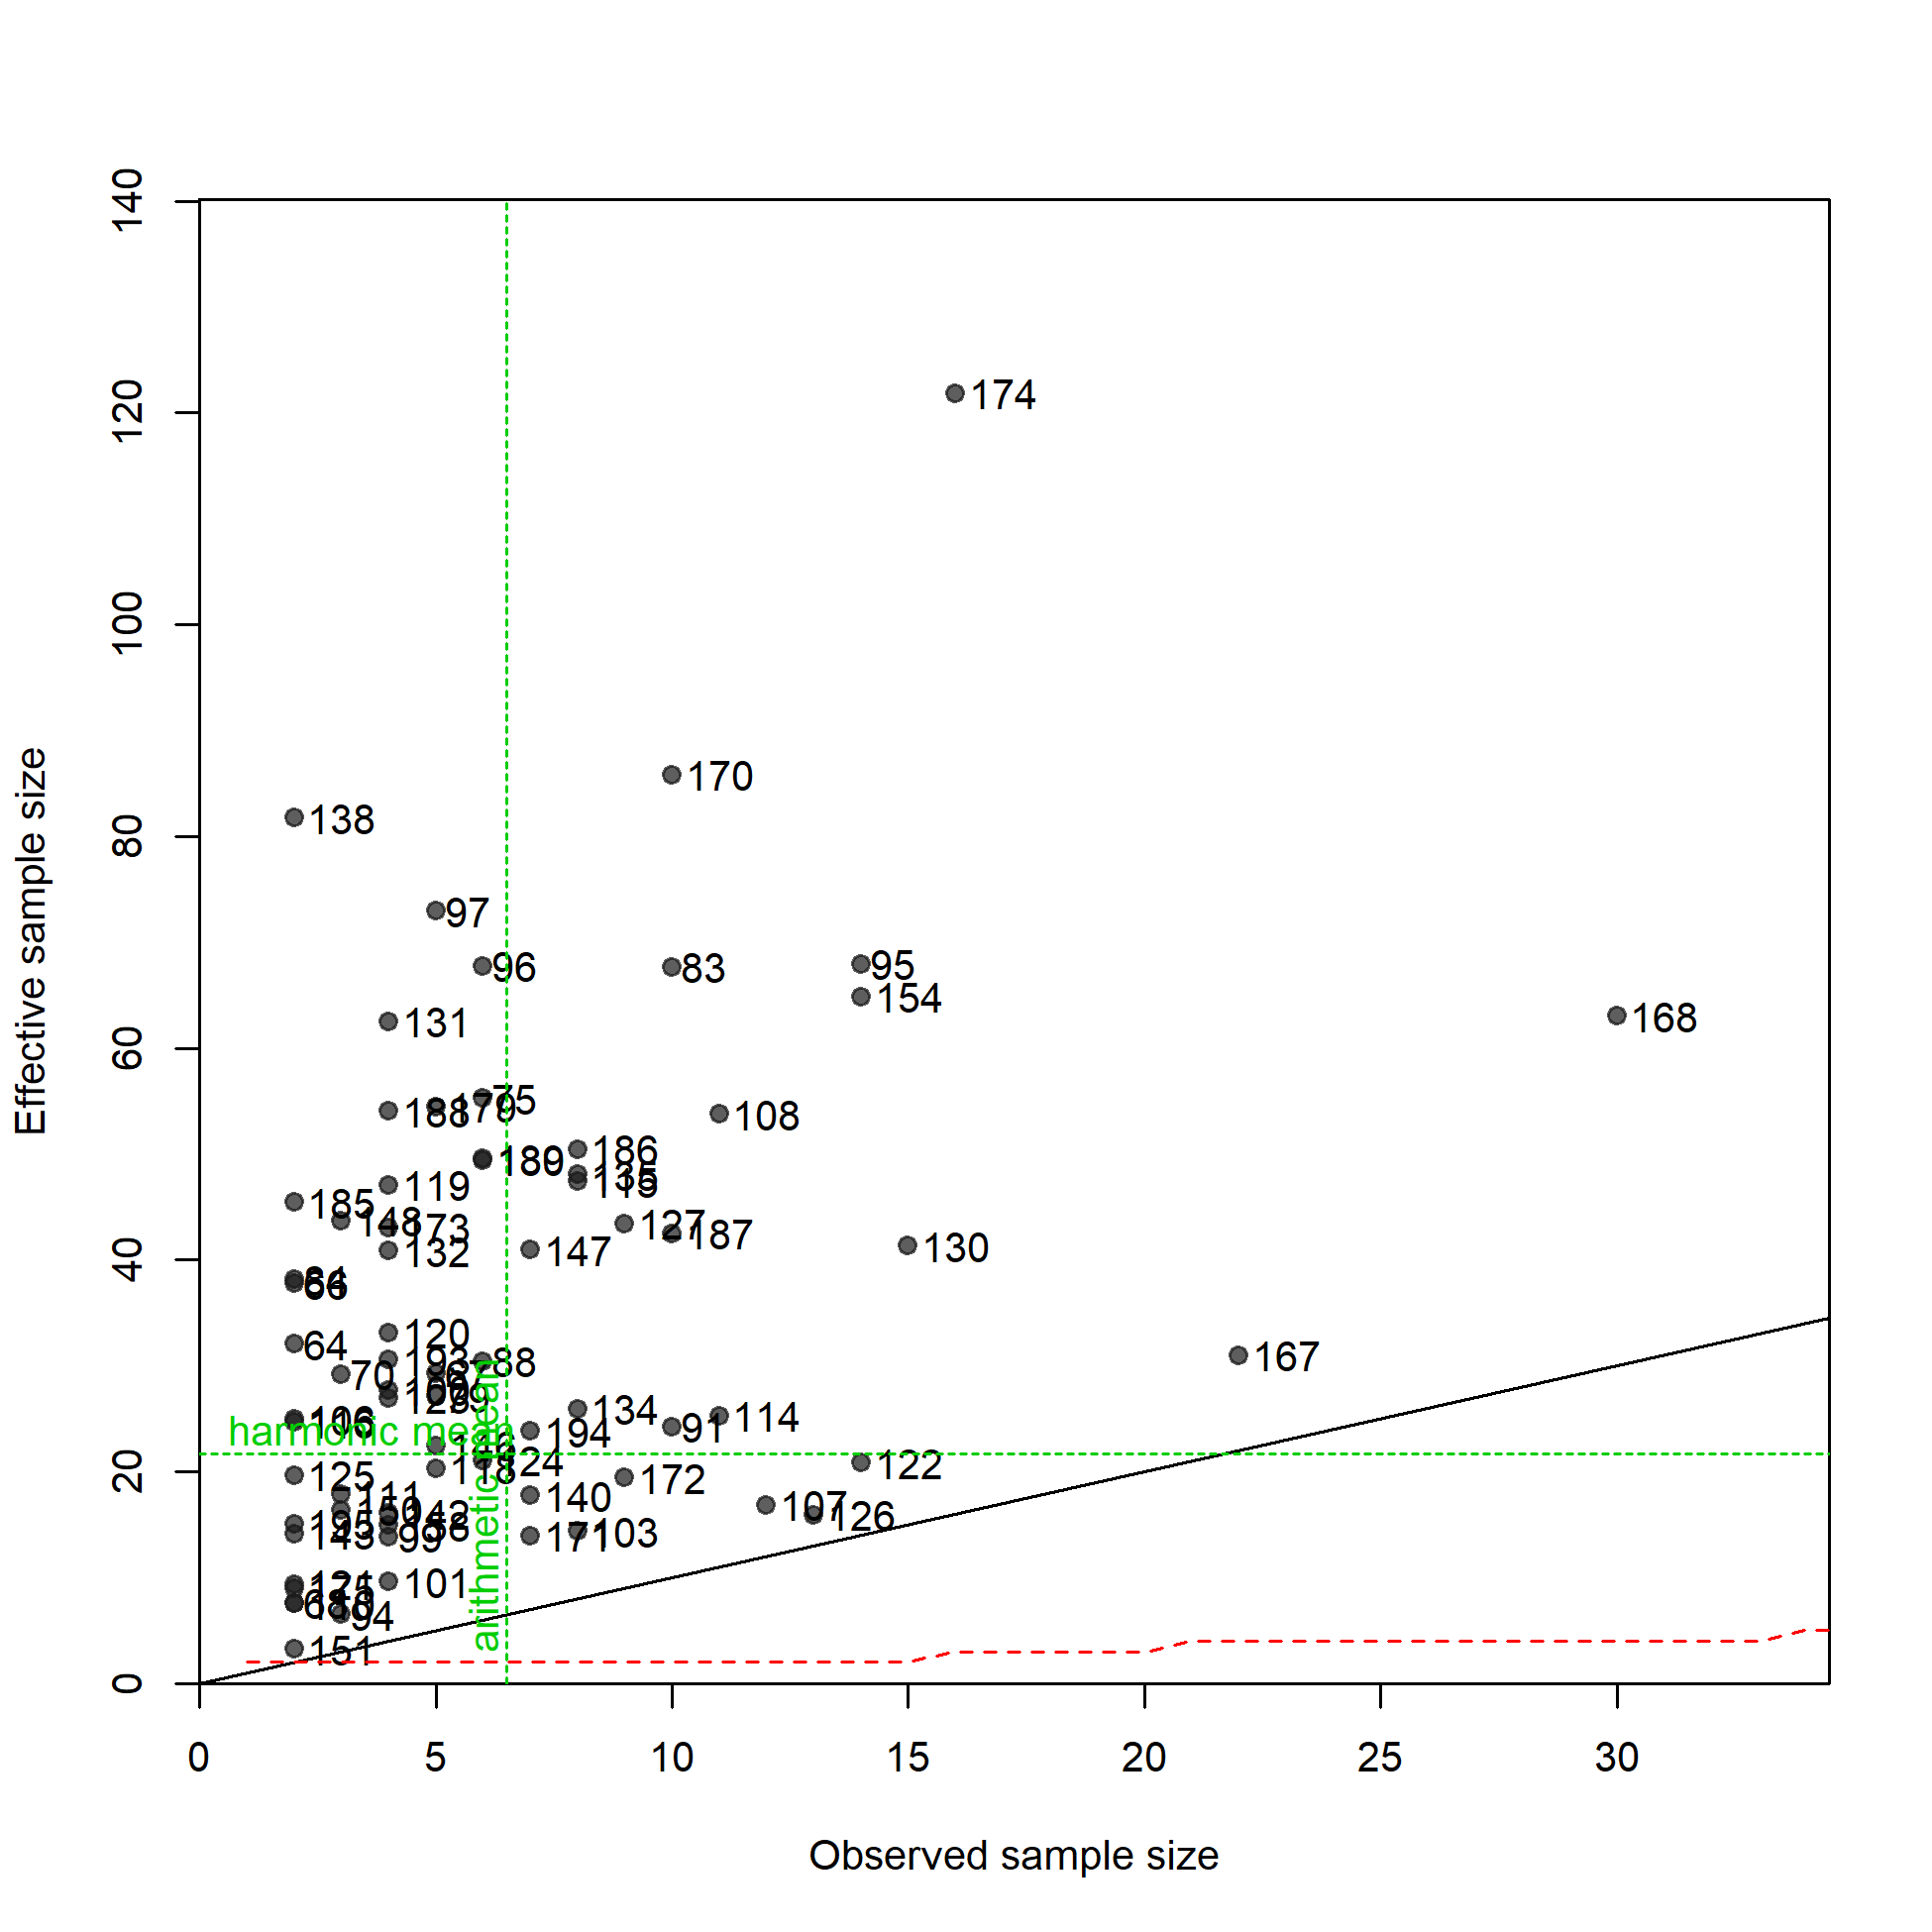
N-EffN comparison, Length comps, whole catch, F6.OBJ.N.offshore
file: comp_lenfit_sampsize_flt6mkt0.png
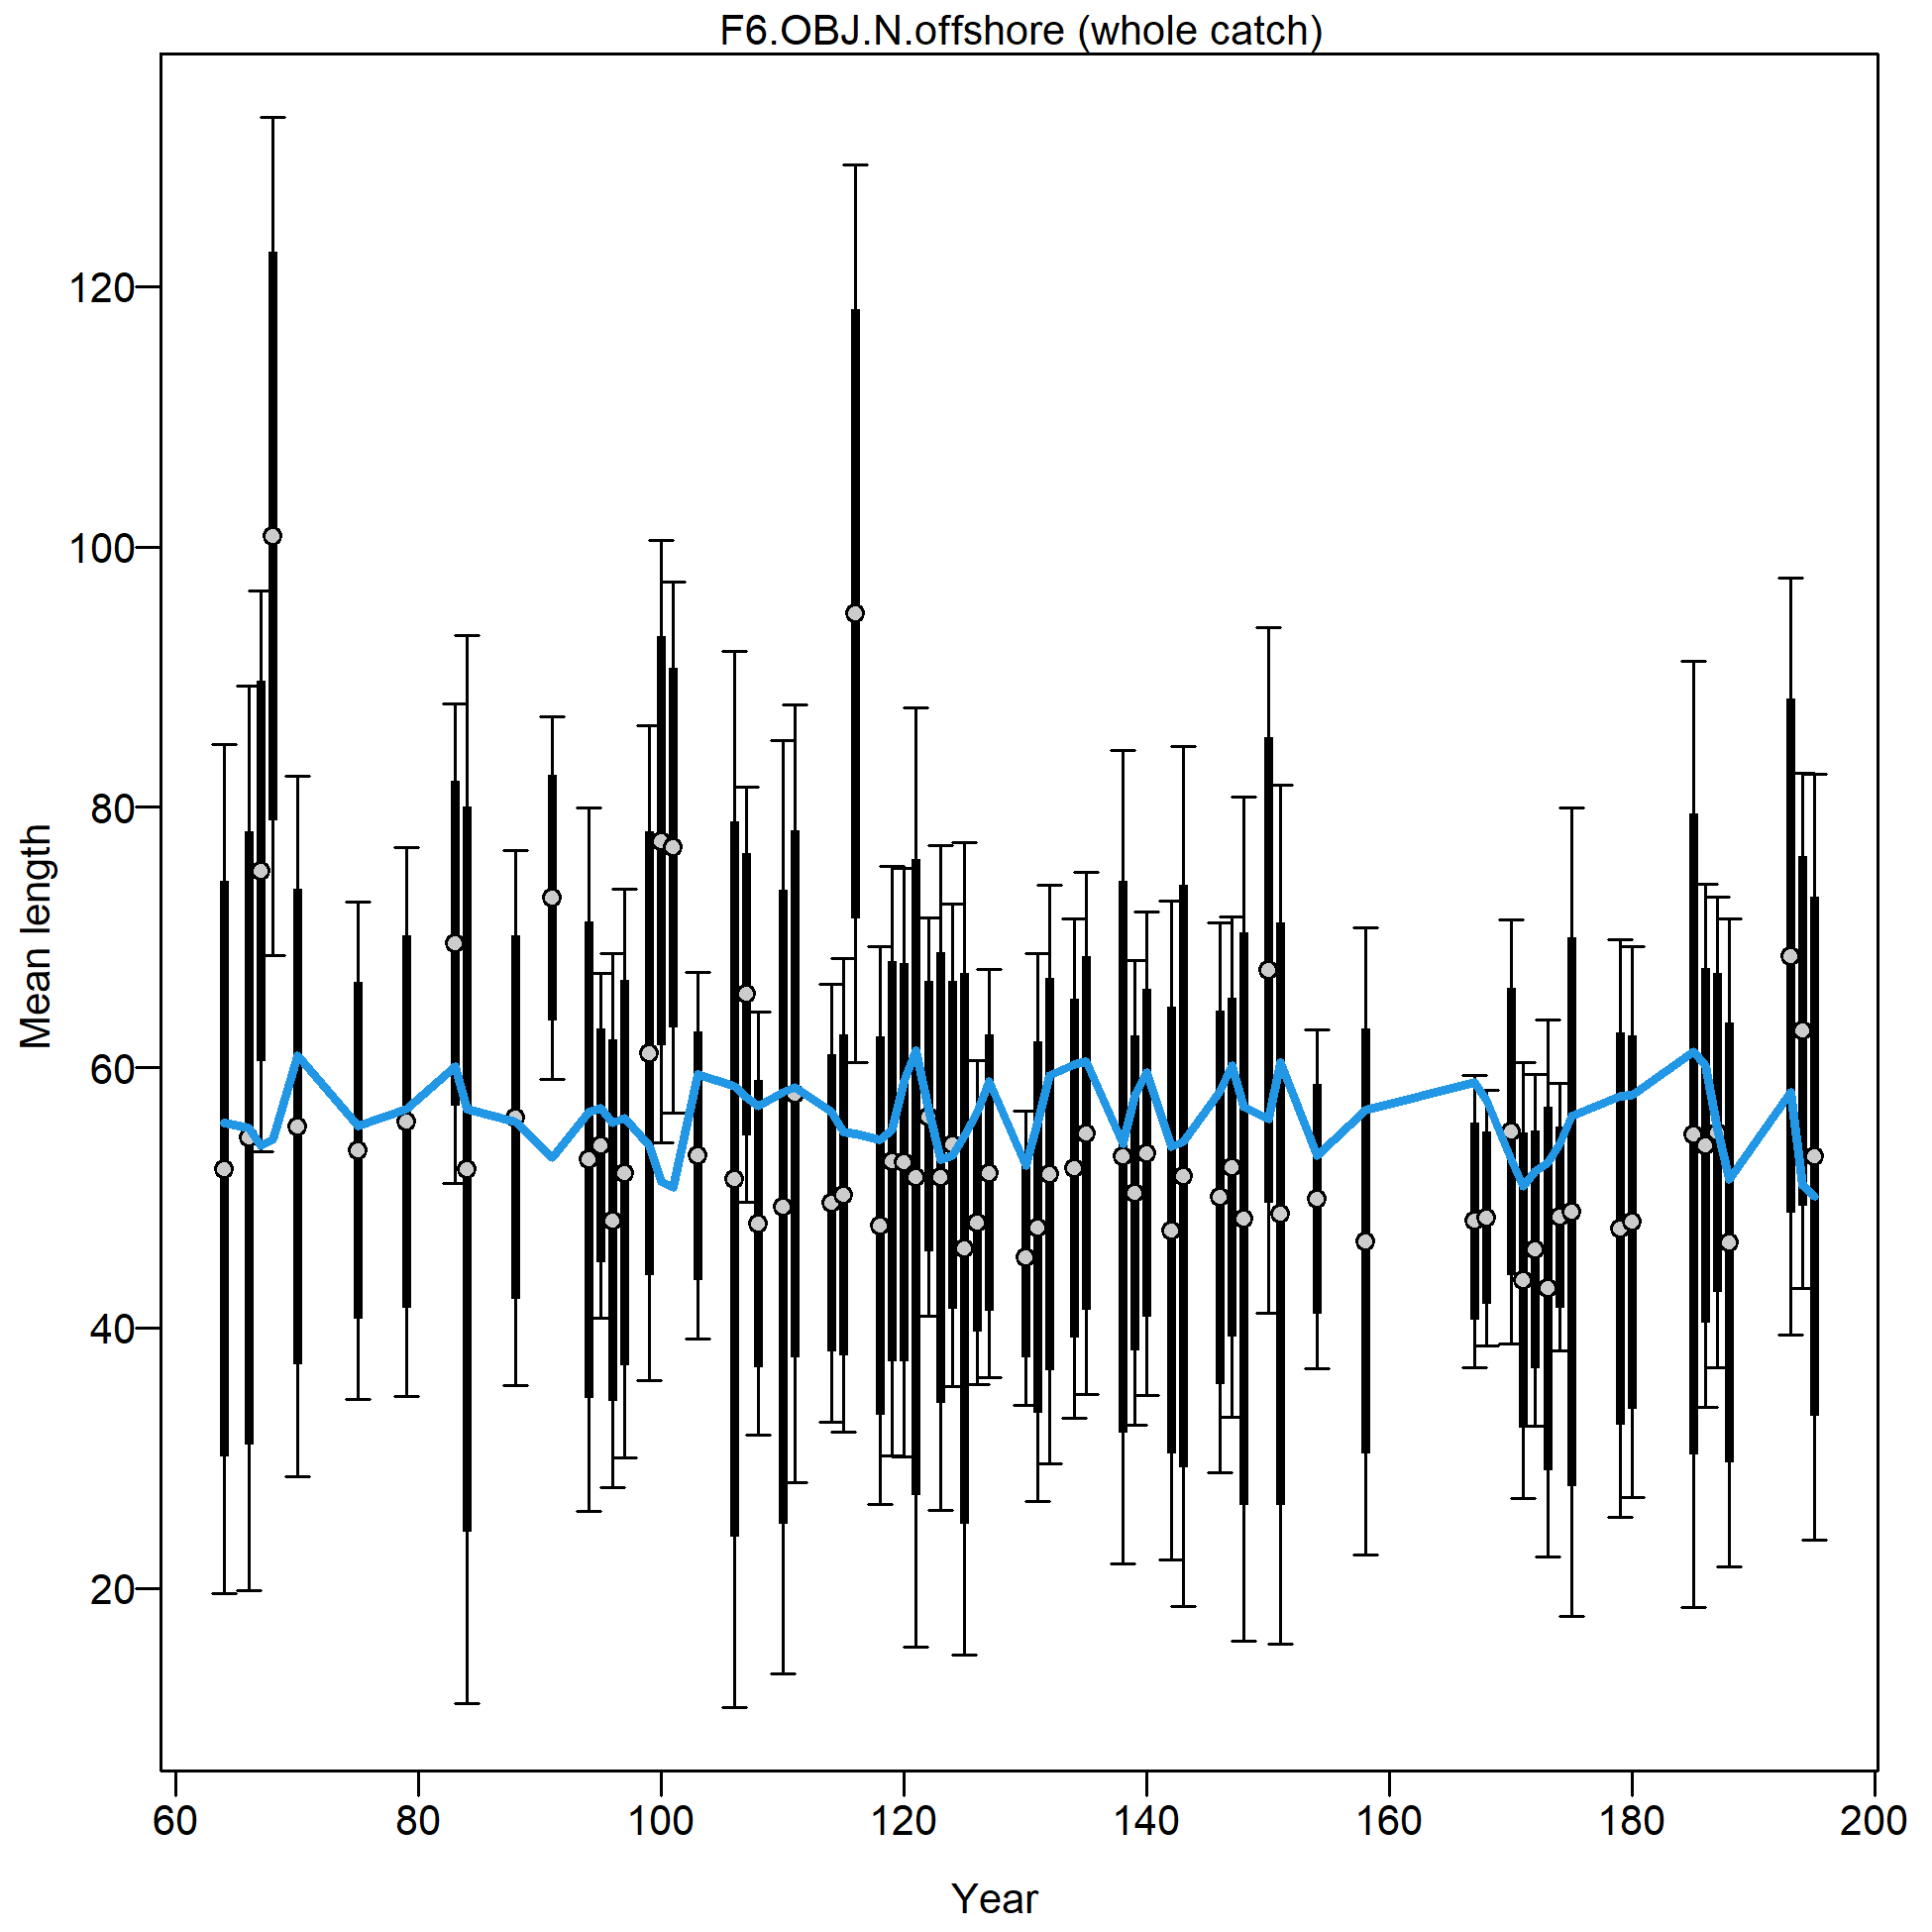
Mean length for F6.OBJ.N.offshore with 95% confidence intervals based on current sample sizes.
Francis data weighting method TA1.8: thinner intervals (with capped ends) show result of further adjusting sample sizes based on suggested multiplier (with 95% interval) for len data from F6.OBJ.N.offshore:
0.46 (0.3132-0.8565)
For more info, see Francis (2011).
file: comp_lenfit_data_weighting_TA1.8_F6.OBJ.N.offshore.png
Length comps, whole catch, F7.OBJ.N.inshore (plot 1 of 4).
'N adj.' is the input sample size after data-weighting adjustment. N eff. is the calculated effective sample size used in the McAllister-Ianelli tuning method.
file: comp_lenfit_flt7mkt0_page1.png
Length comps, whole catch, F7.OBJ.N.inshore (plot 1 of 4).
'N adj.' is the input sample size after data-weighting adjustment. N eff. is the calculated effective sample size used in the McAllister-Ianelli tuning method. (plot 2 of 4)
file: comp_lenfit_flt7mkt0_page2.png
Length comps, whole catch, F7.OBJ.N.inshore (plot 1 of 4).
'N adj.' is the input sample size after data-weighting adjustment. N eff. is the calculated effective sample size used in the McAllister-Ianelli tuning method. (plot 2 of 4) (plot 3 of 4)
file: comp_lenfit_flt7mkt0_page3.png
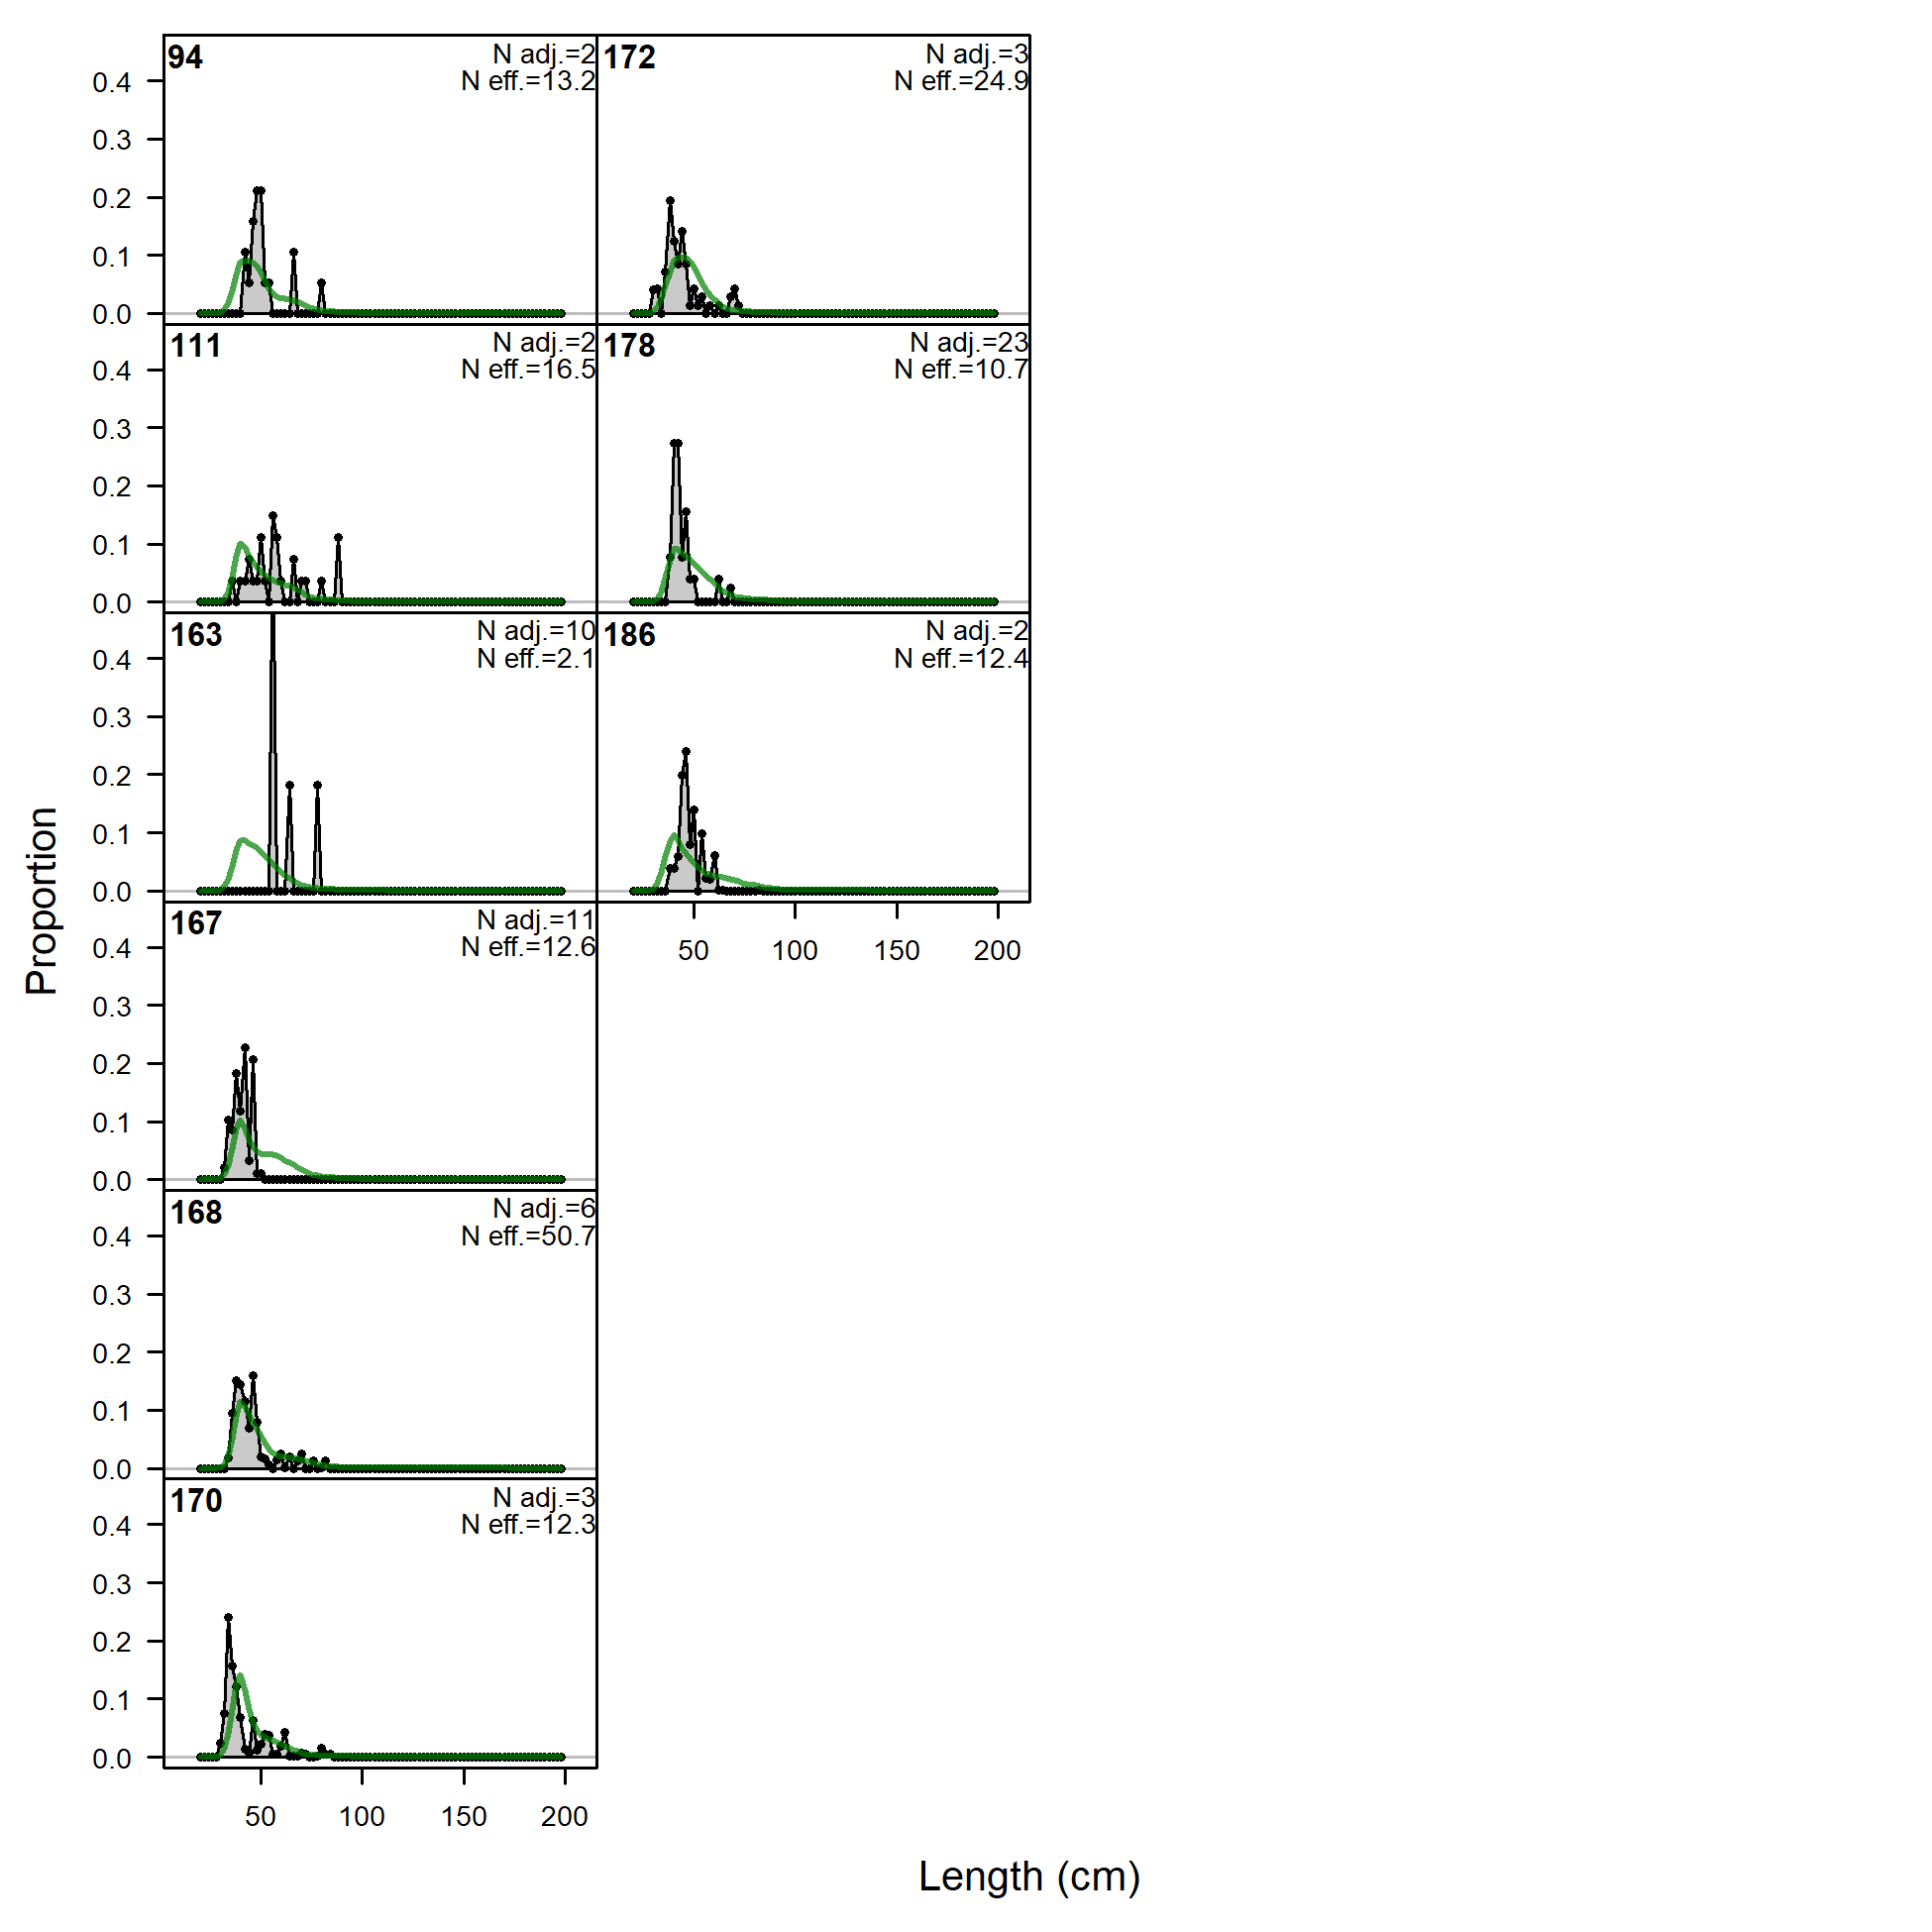
Length comps, whole catch, F7.OBJ.N.inshore (plot 1 of 4).
'N adj.' is the input sample size after data-weighting adjustment. N eff. is the calculated effective sample size used in the McAllister-Ianelli tuning method. (plot 2 of 4) (plot 3 of 4) (plot 4 of 4)
file: comp_lenfit_flt7mkt0_page4.png
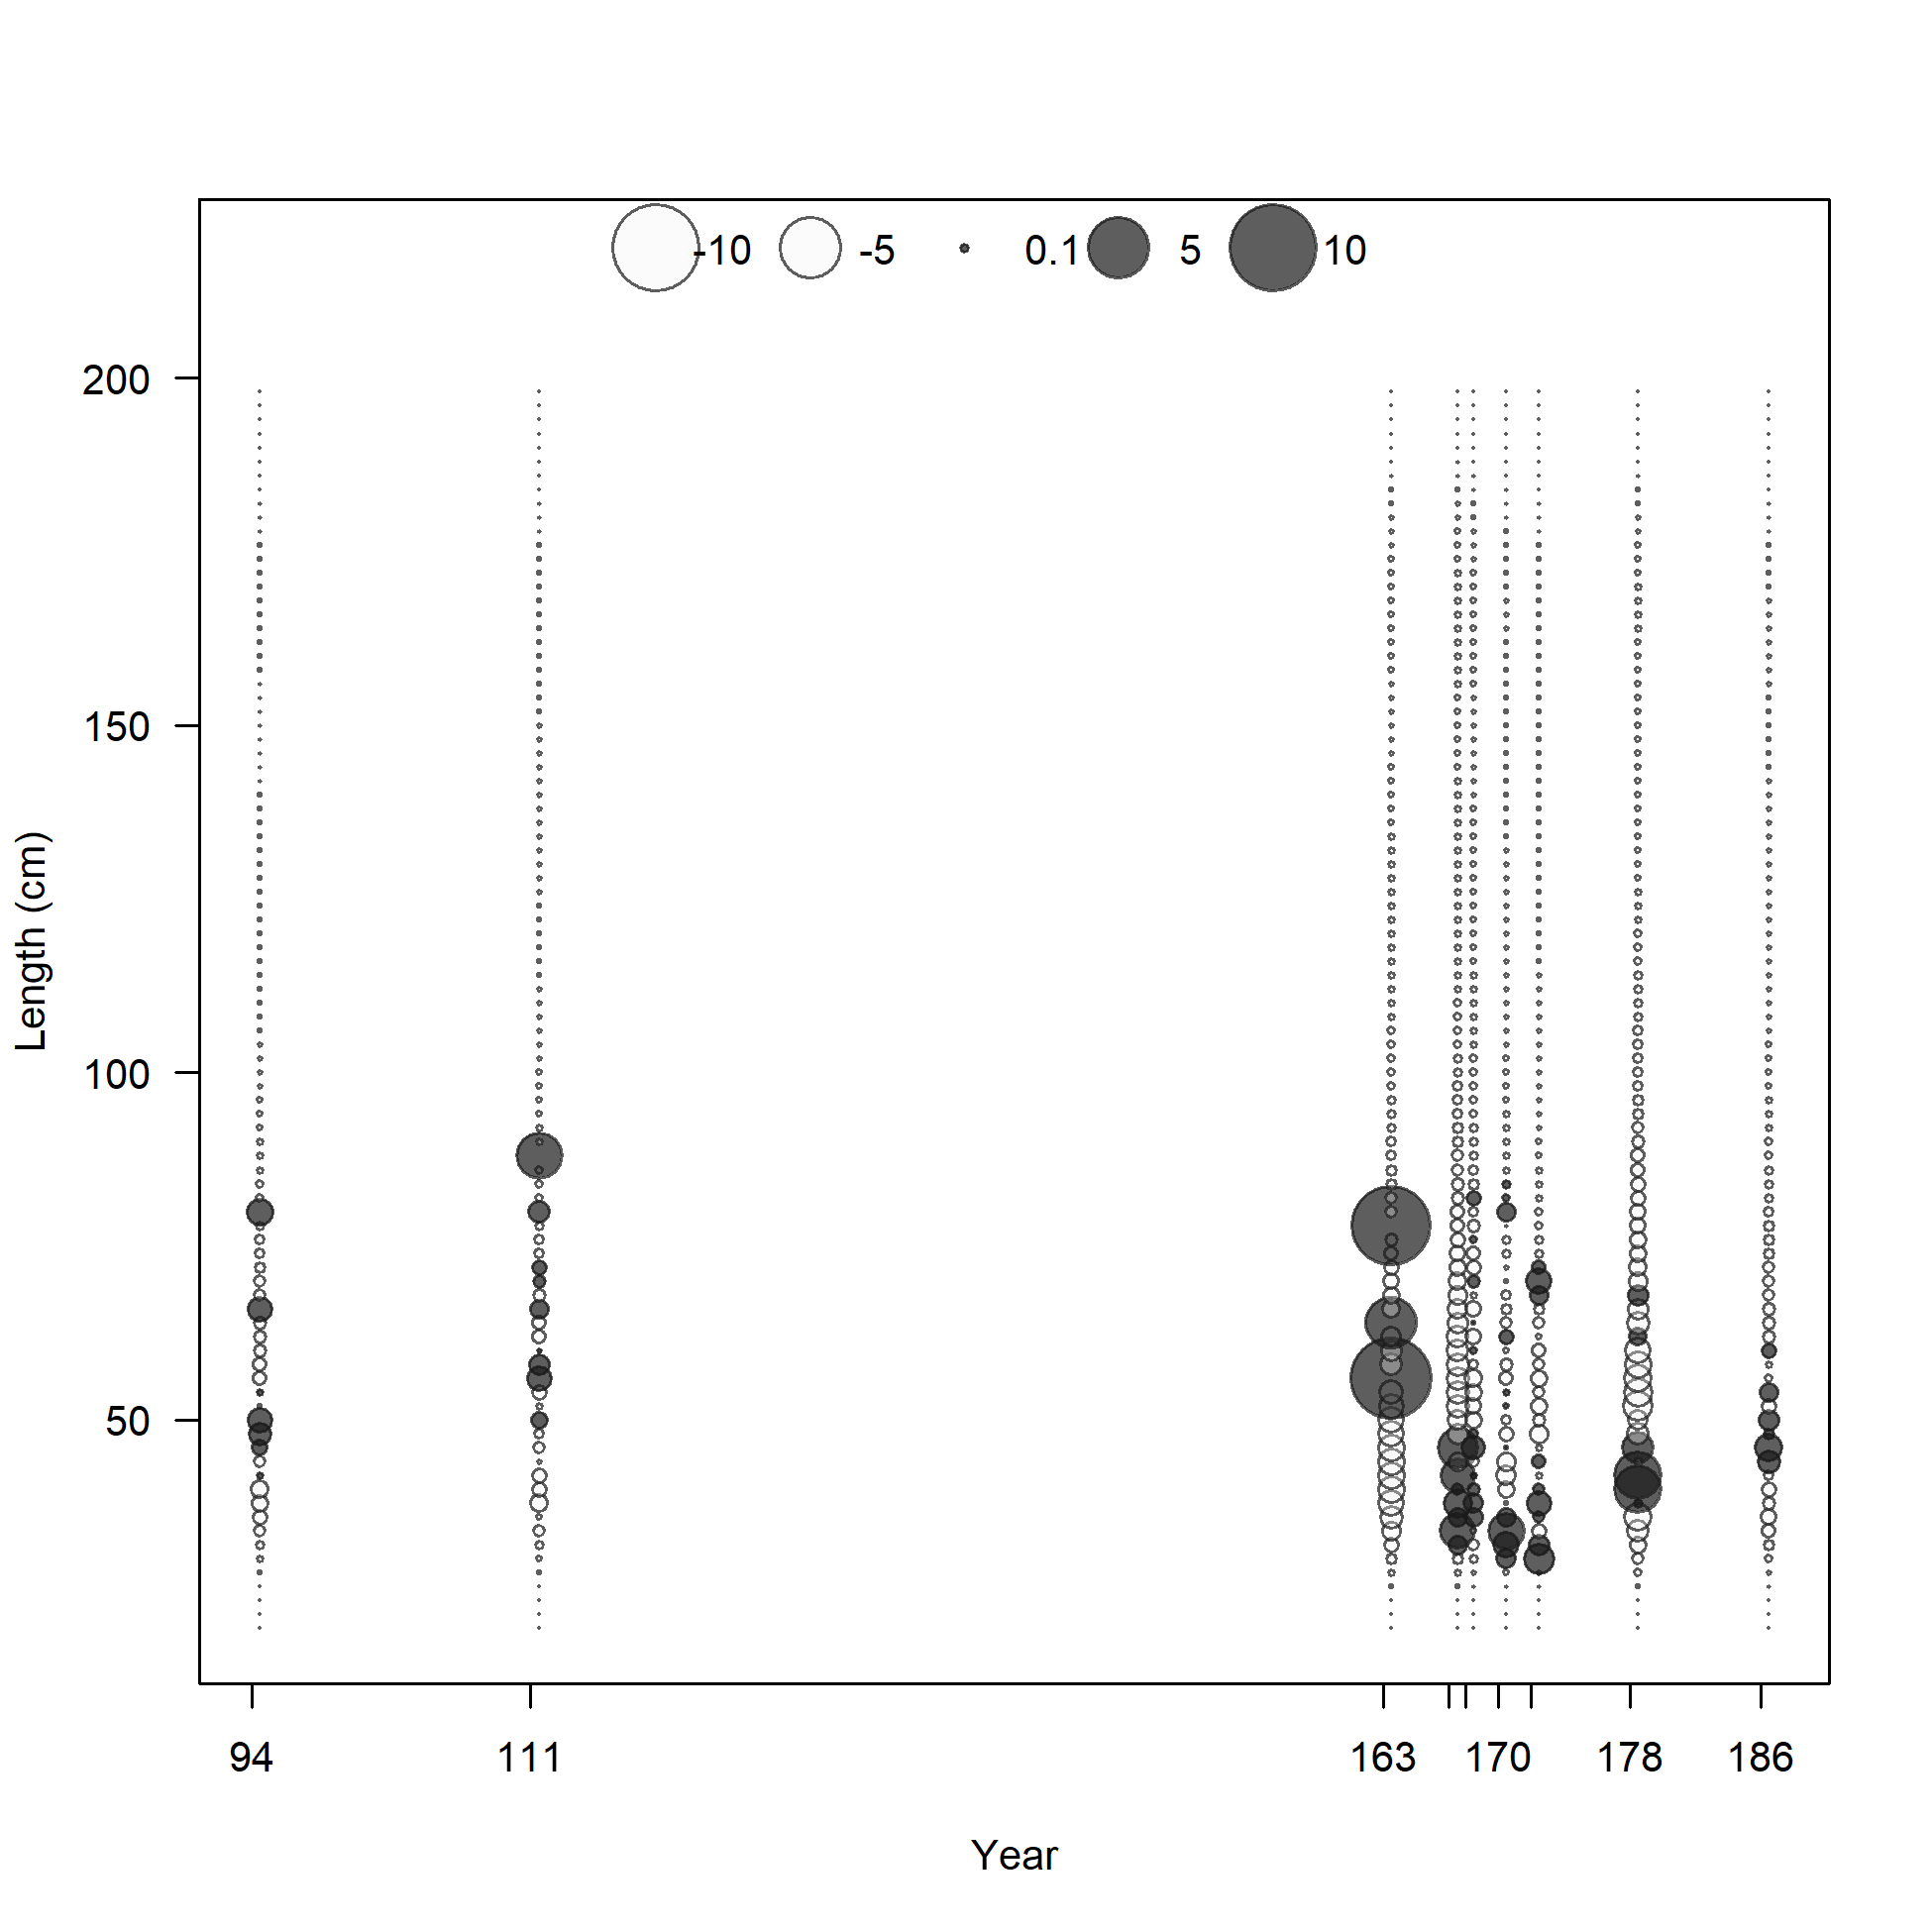
Pearson residuals, whole catch, F7.OBJ.N.inshore (max=4.24) (plot 4 of 4)
Closed bubbles are positive residuals (observed > expected) and open bubbles are negative residuals (observed < expected).
file: comp_lenfit_residsflt7mkt0_page4.png
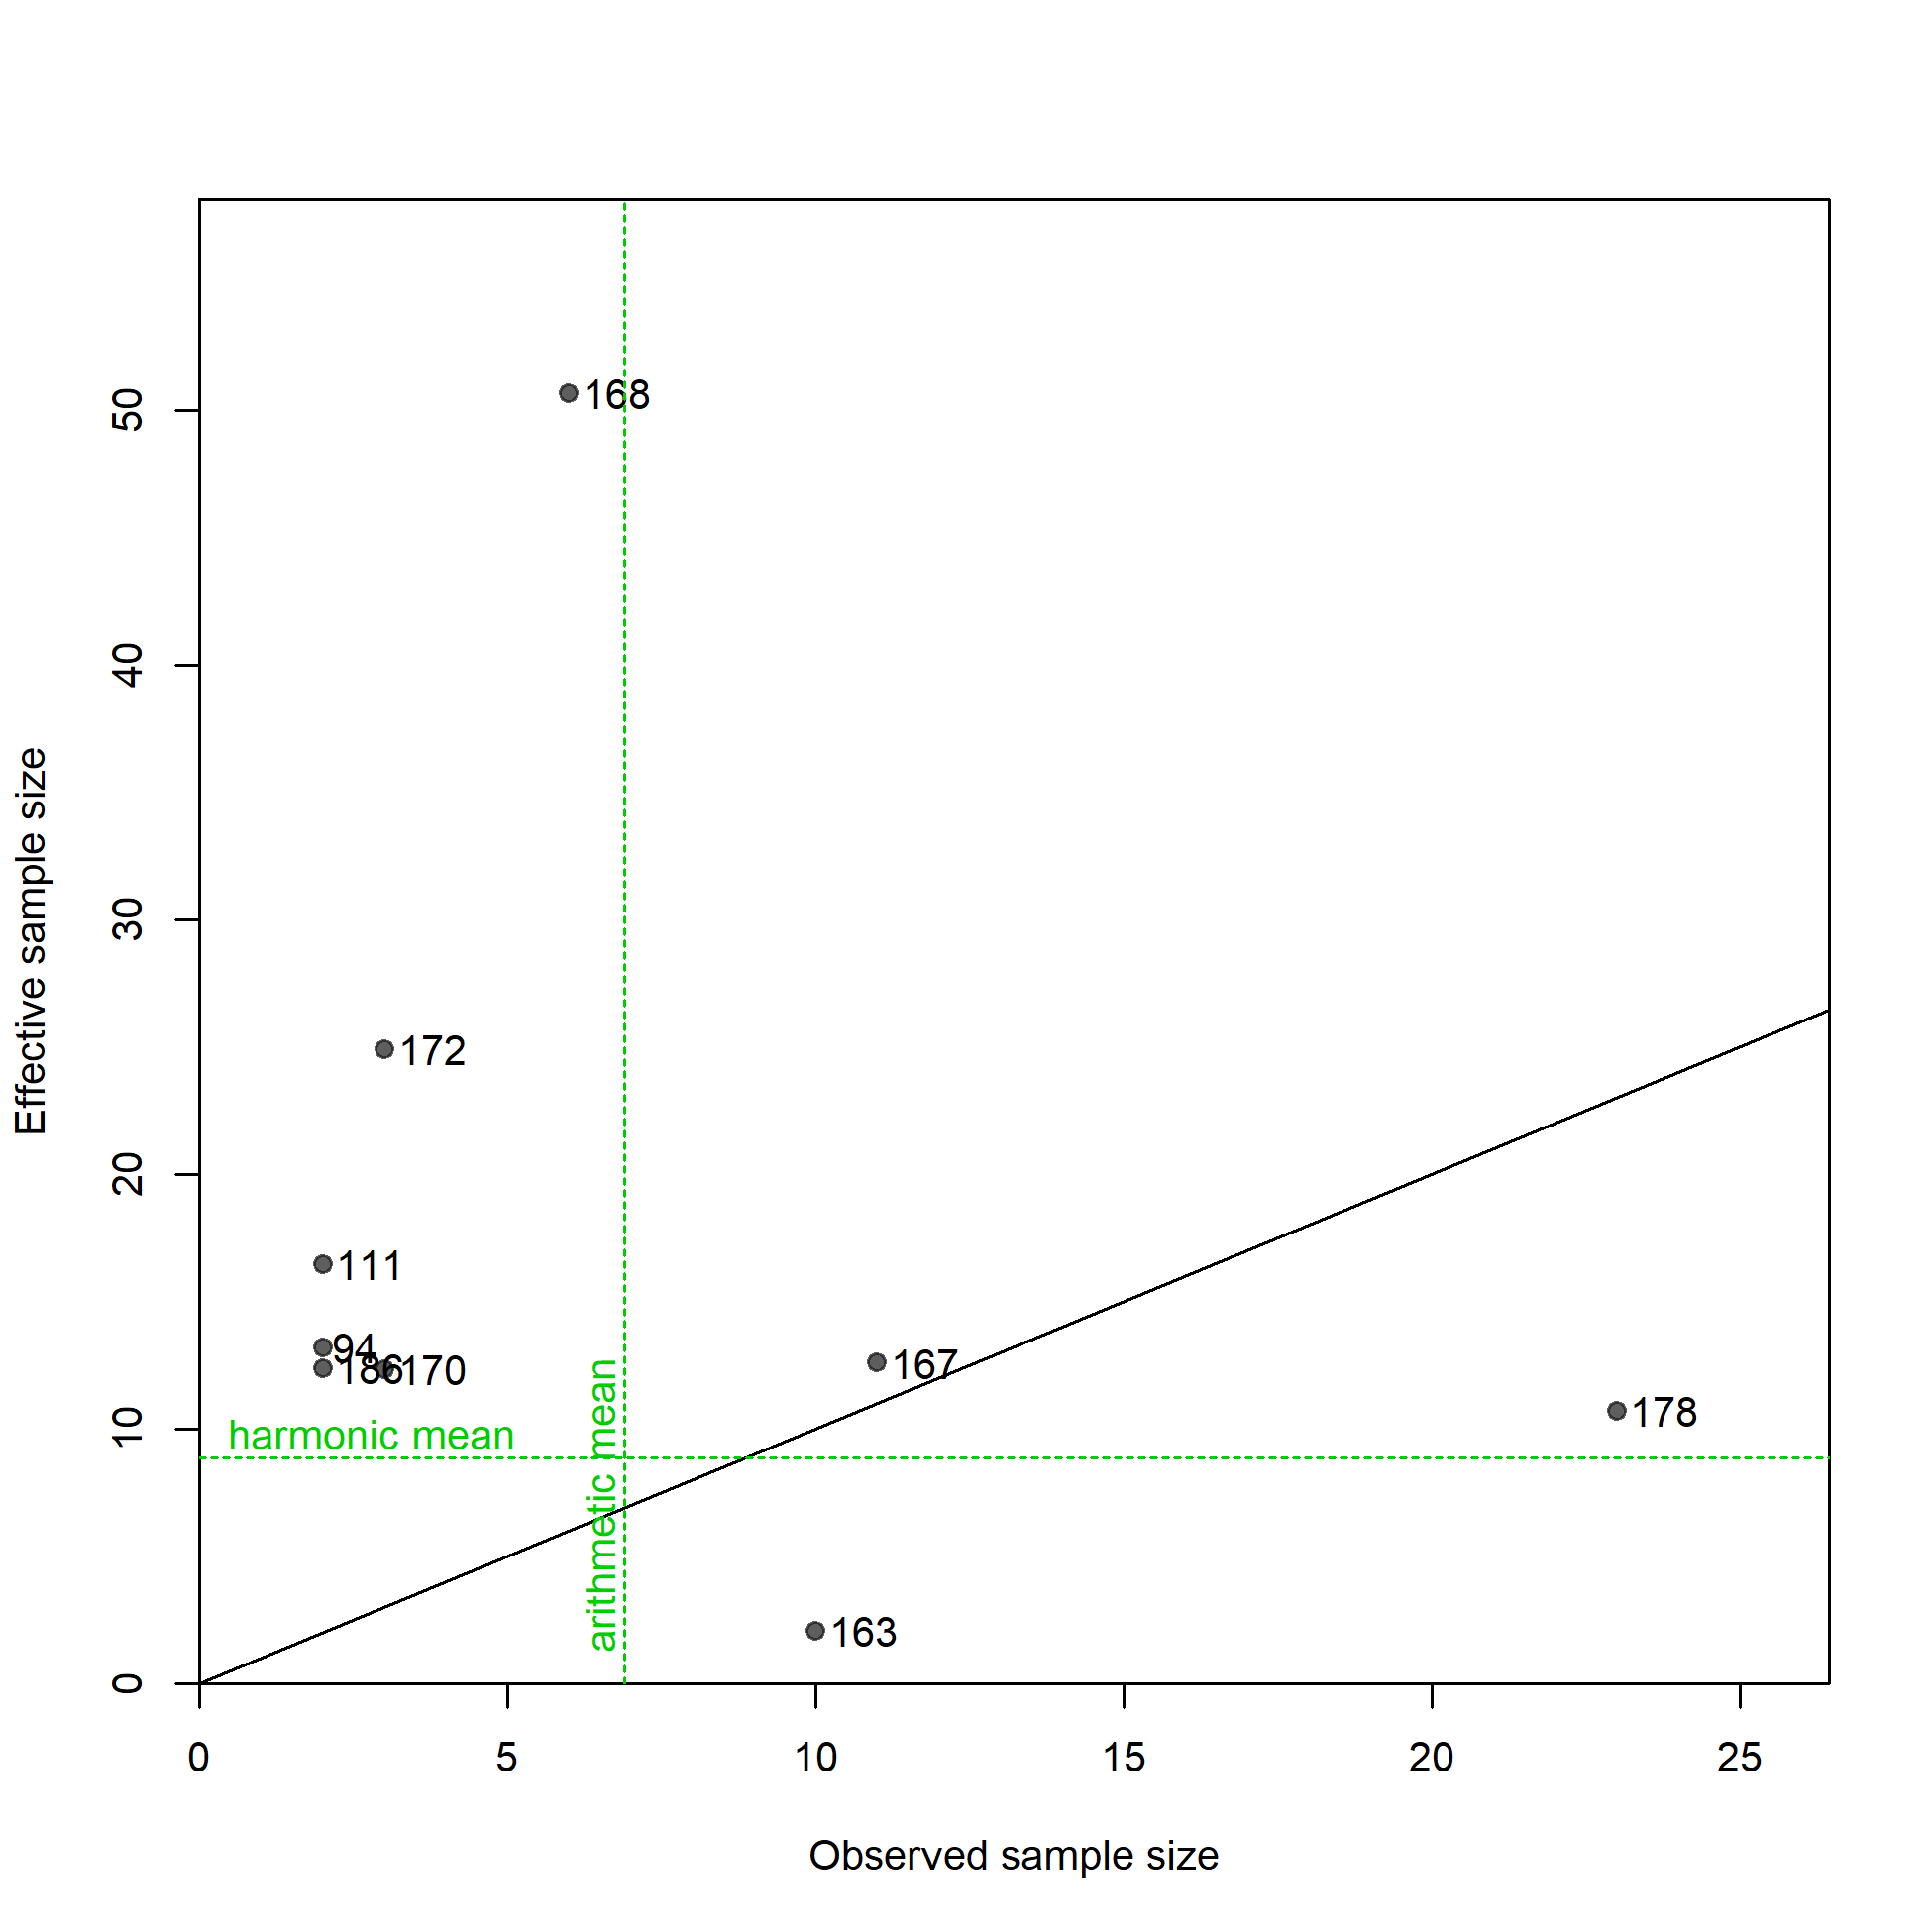
N-EffN comparison, Length comps, whole catch, F7.OBJ.N.inshore
file: comp_lenfit_sampsize_flt7mkt0.png
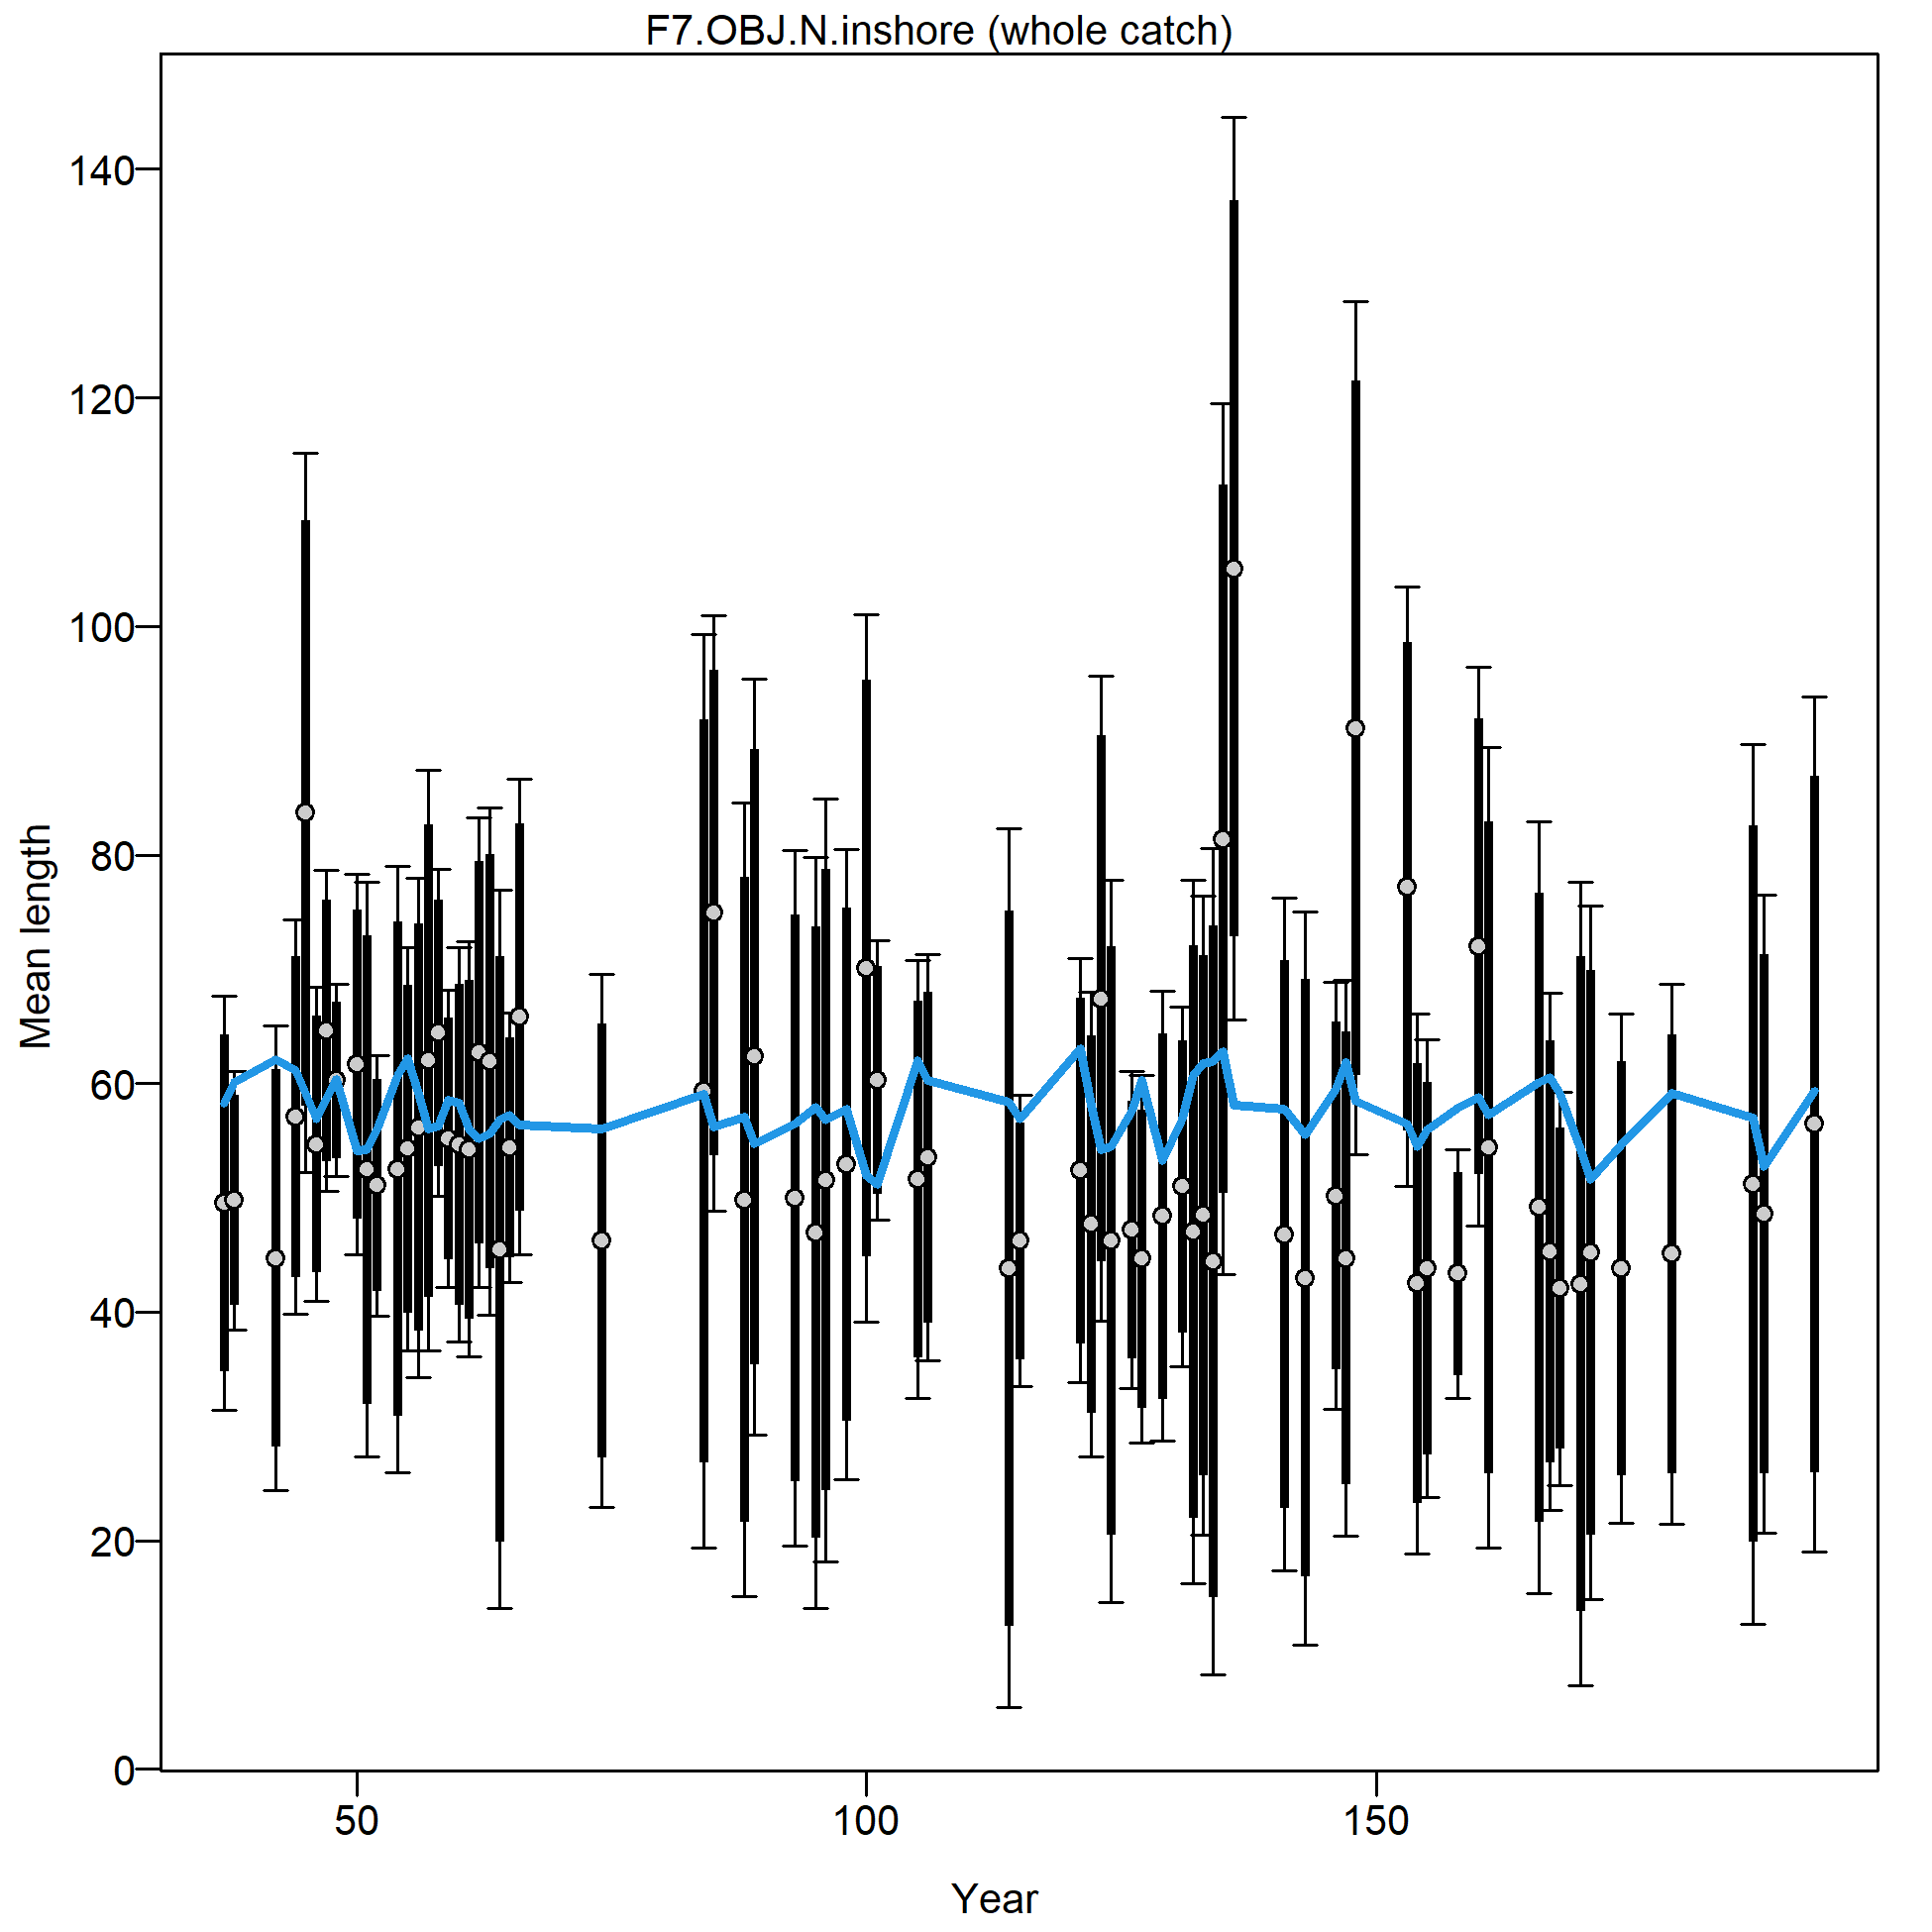
Mean length for F7.OBJ.N.inshore with 95% confidence intervals based on current sample sizes.
Francis data weighting method TA1.8: thinner intervals (with capped ends) show result of further adjusting sample sizes based on suggested multiplier (with 95% interval) for len data from F7.OBJ.N.inshore:
0.663 (0.4919-0.994)
For more info, see Francis (2011).
file: comp_lenfit_data_weighting_TA1.8_F7.OBJ.N.inshore.png
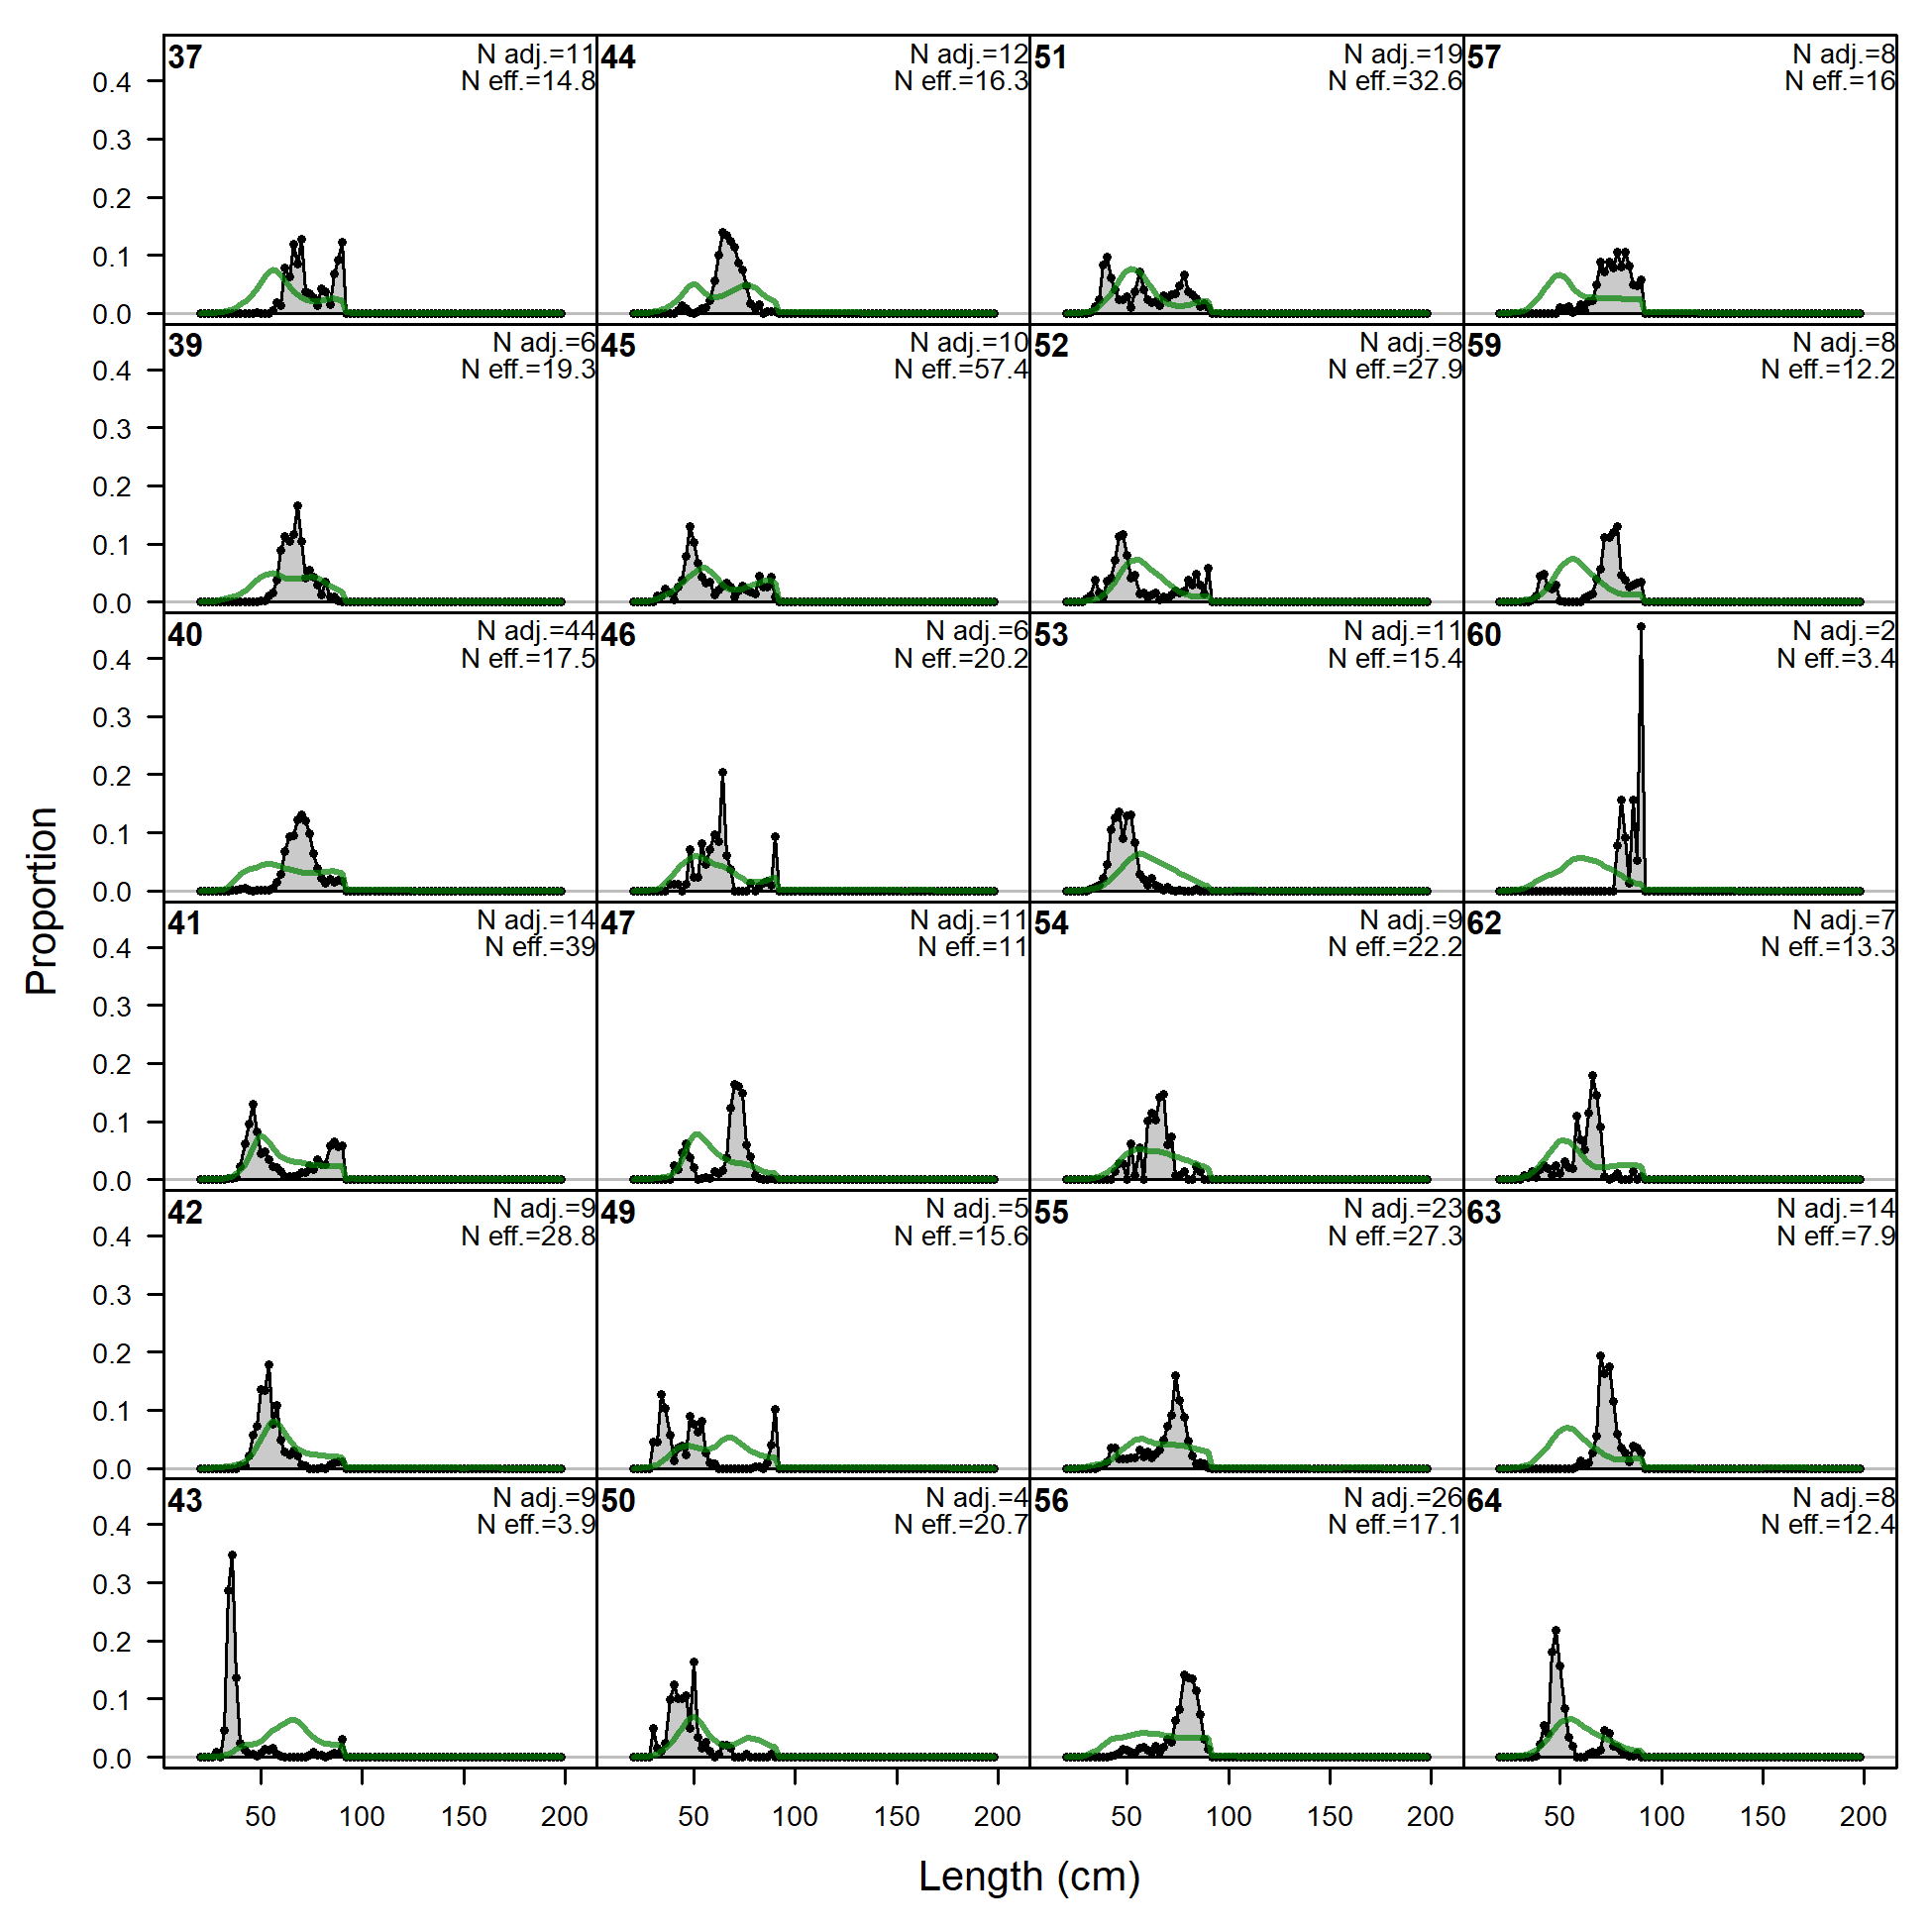
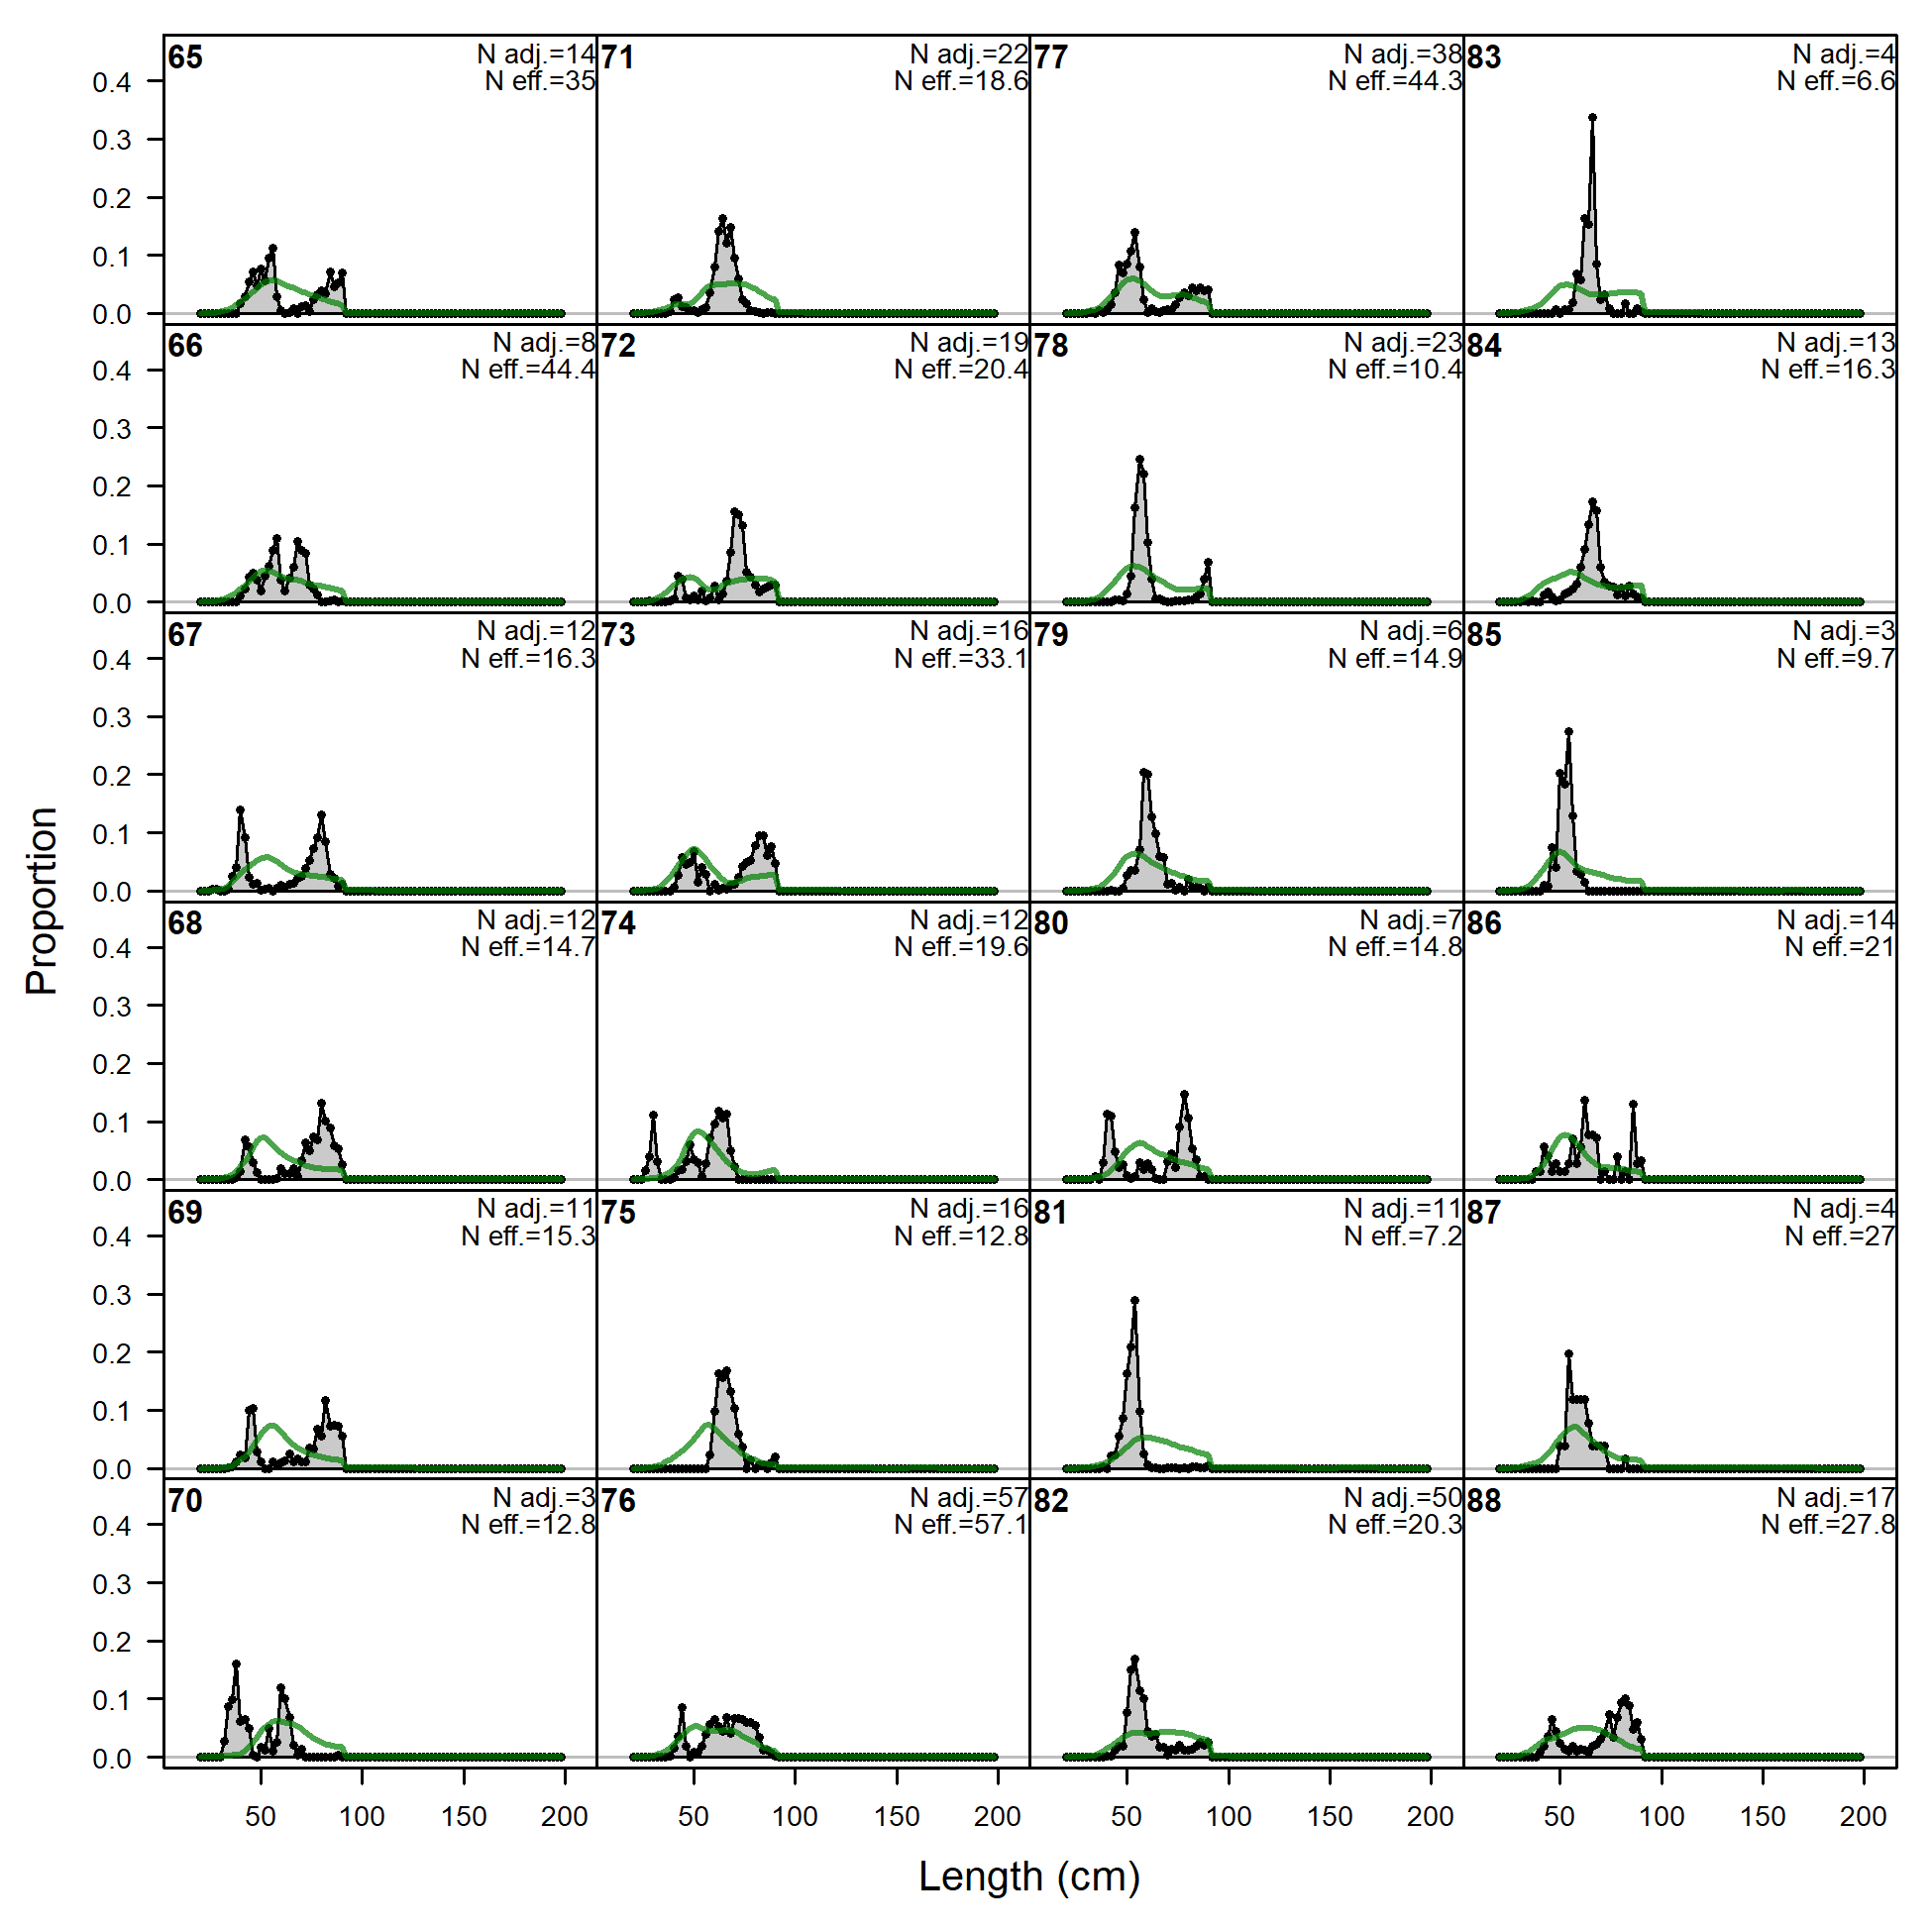
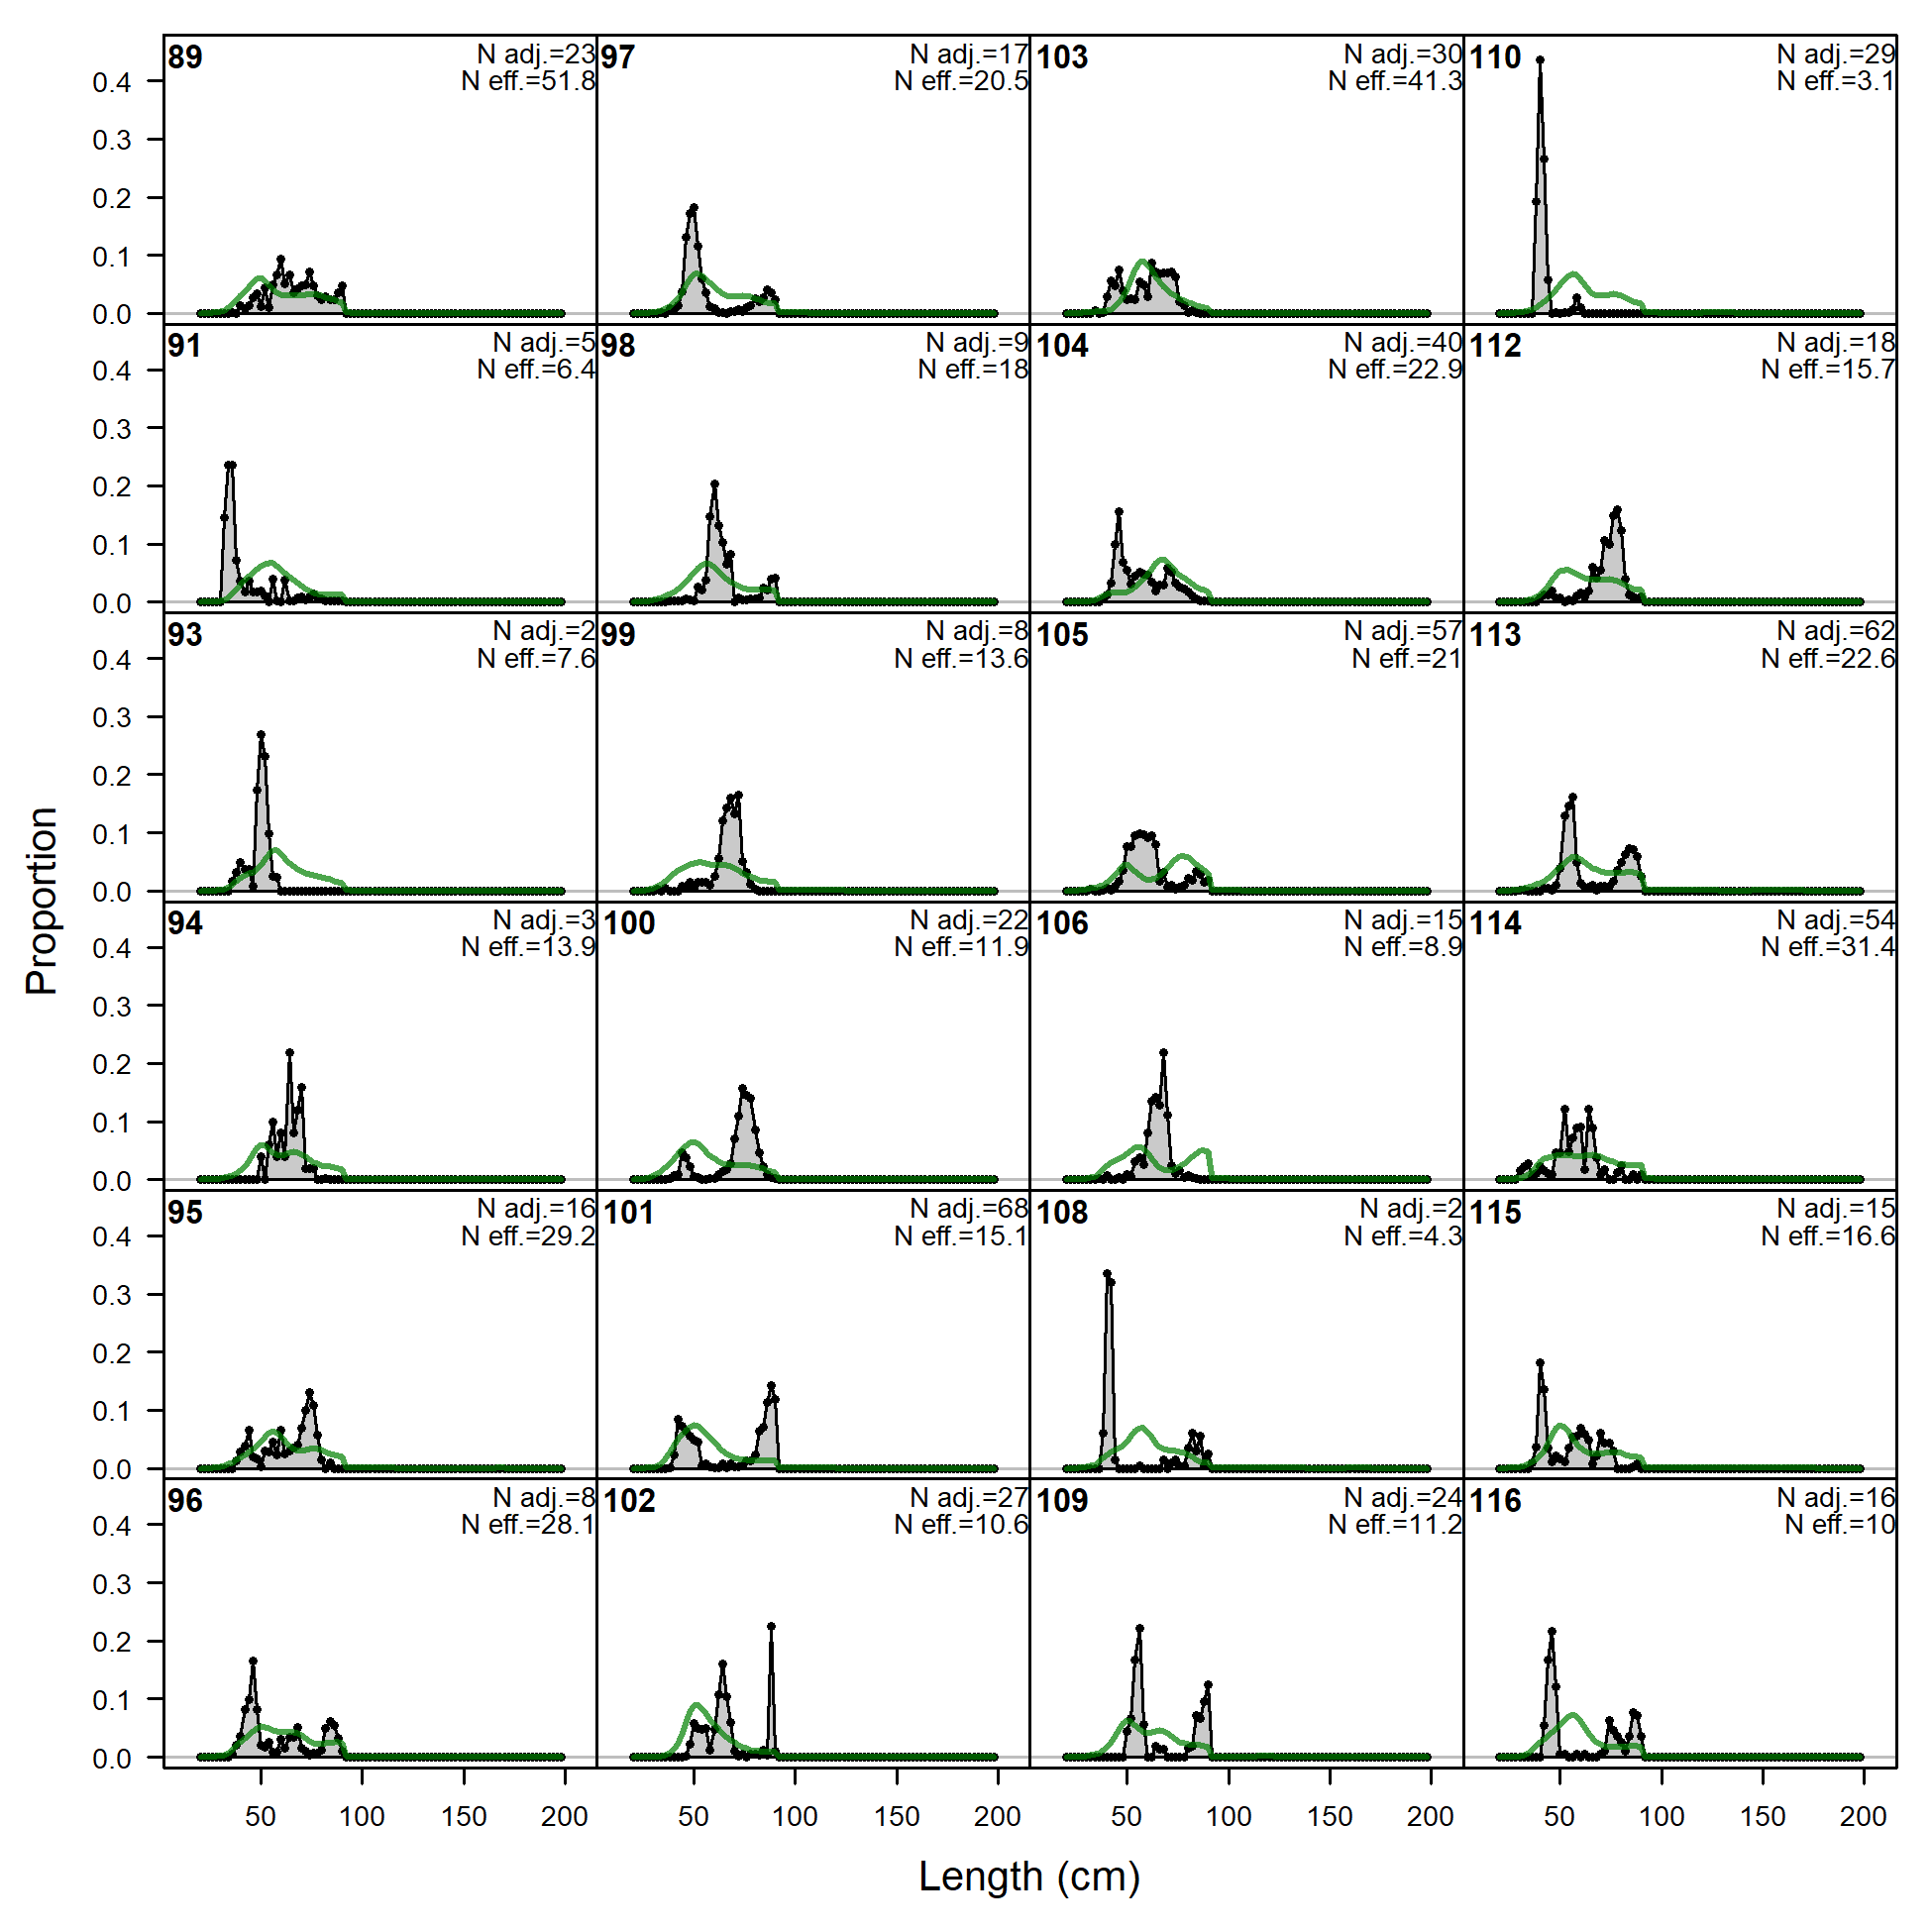
Length comps, whole catch, F8.NOA.W.small.
'N adj.' is the input sample size after data-weighting adjustment. N eff. is the calculated effective sample size used in the McAllister-Ianelli tuning method.
file: comp_lenfit_flt8mkt0.png
Pearson residuals, whole catch, F8.NOA.W.small (max=8.74)
Closed bubbles are positive residuals (observed > expected) and open bubbles are negative residuals (observed < expected).
file: comp_lenfit_residsflt8mkt0.png
N-EffN comparison, Length comps, whole catch, F8.NOA.W.small
file: comp_lenfit_sampsize_flt8mkt0.png
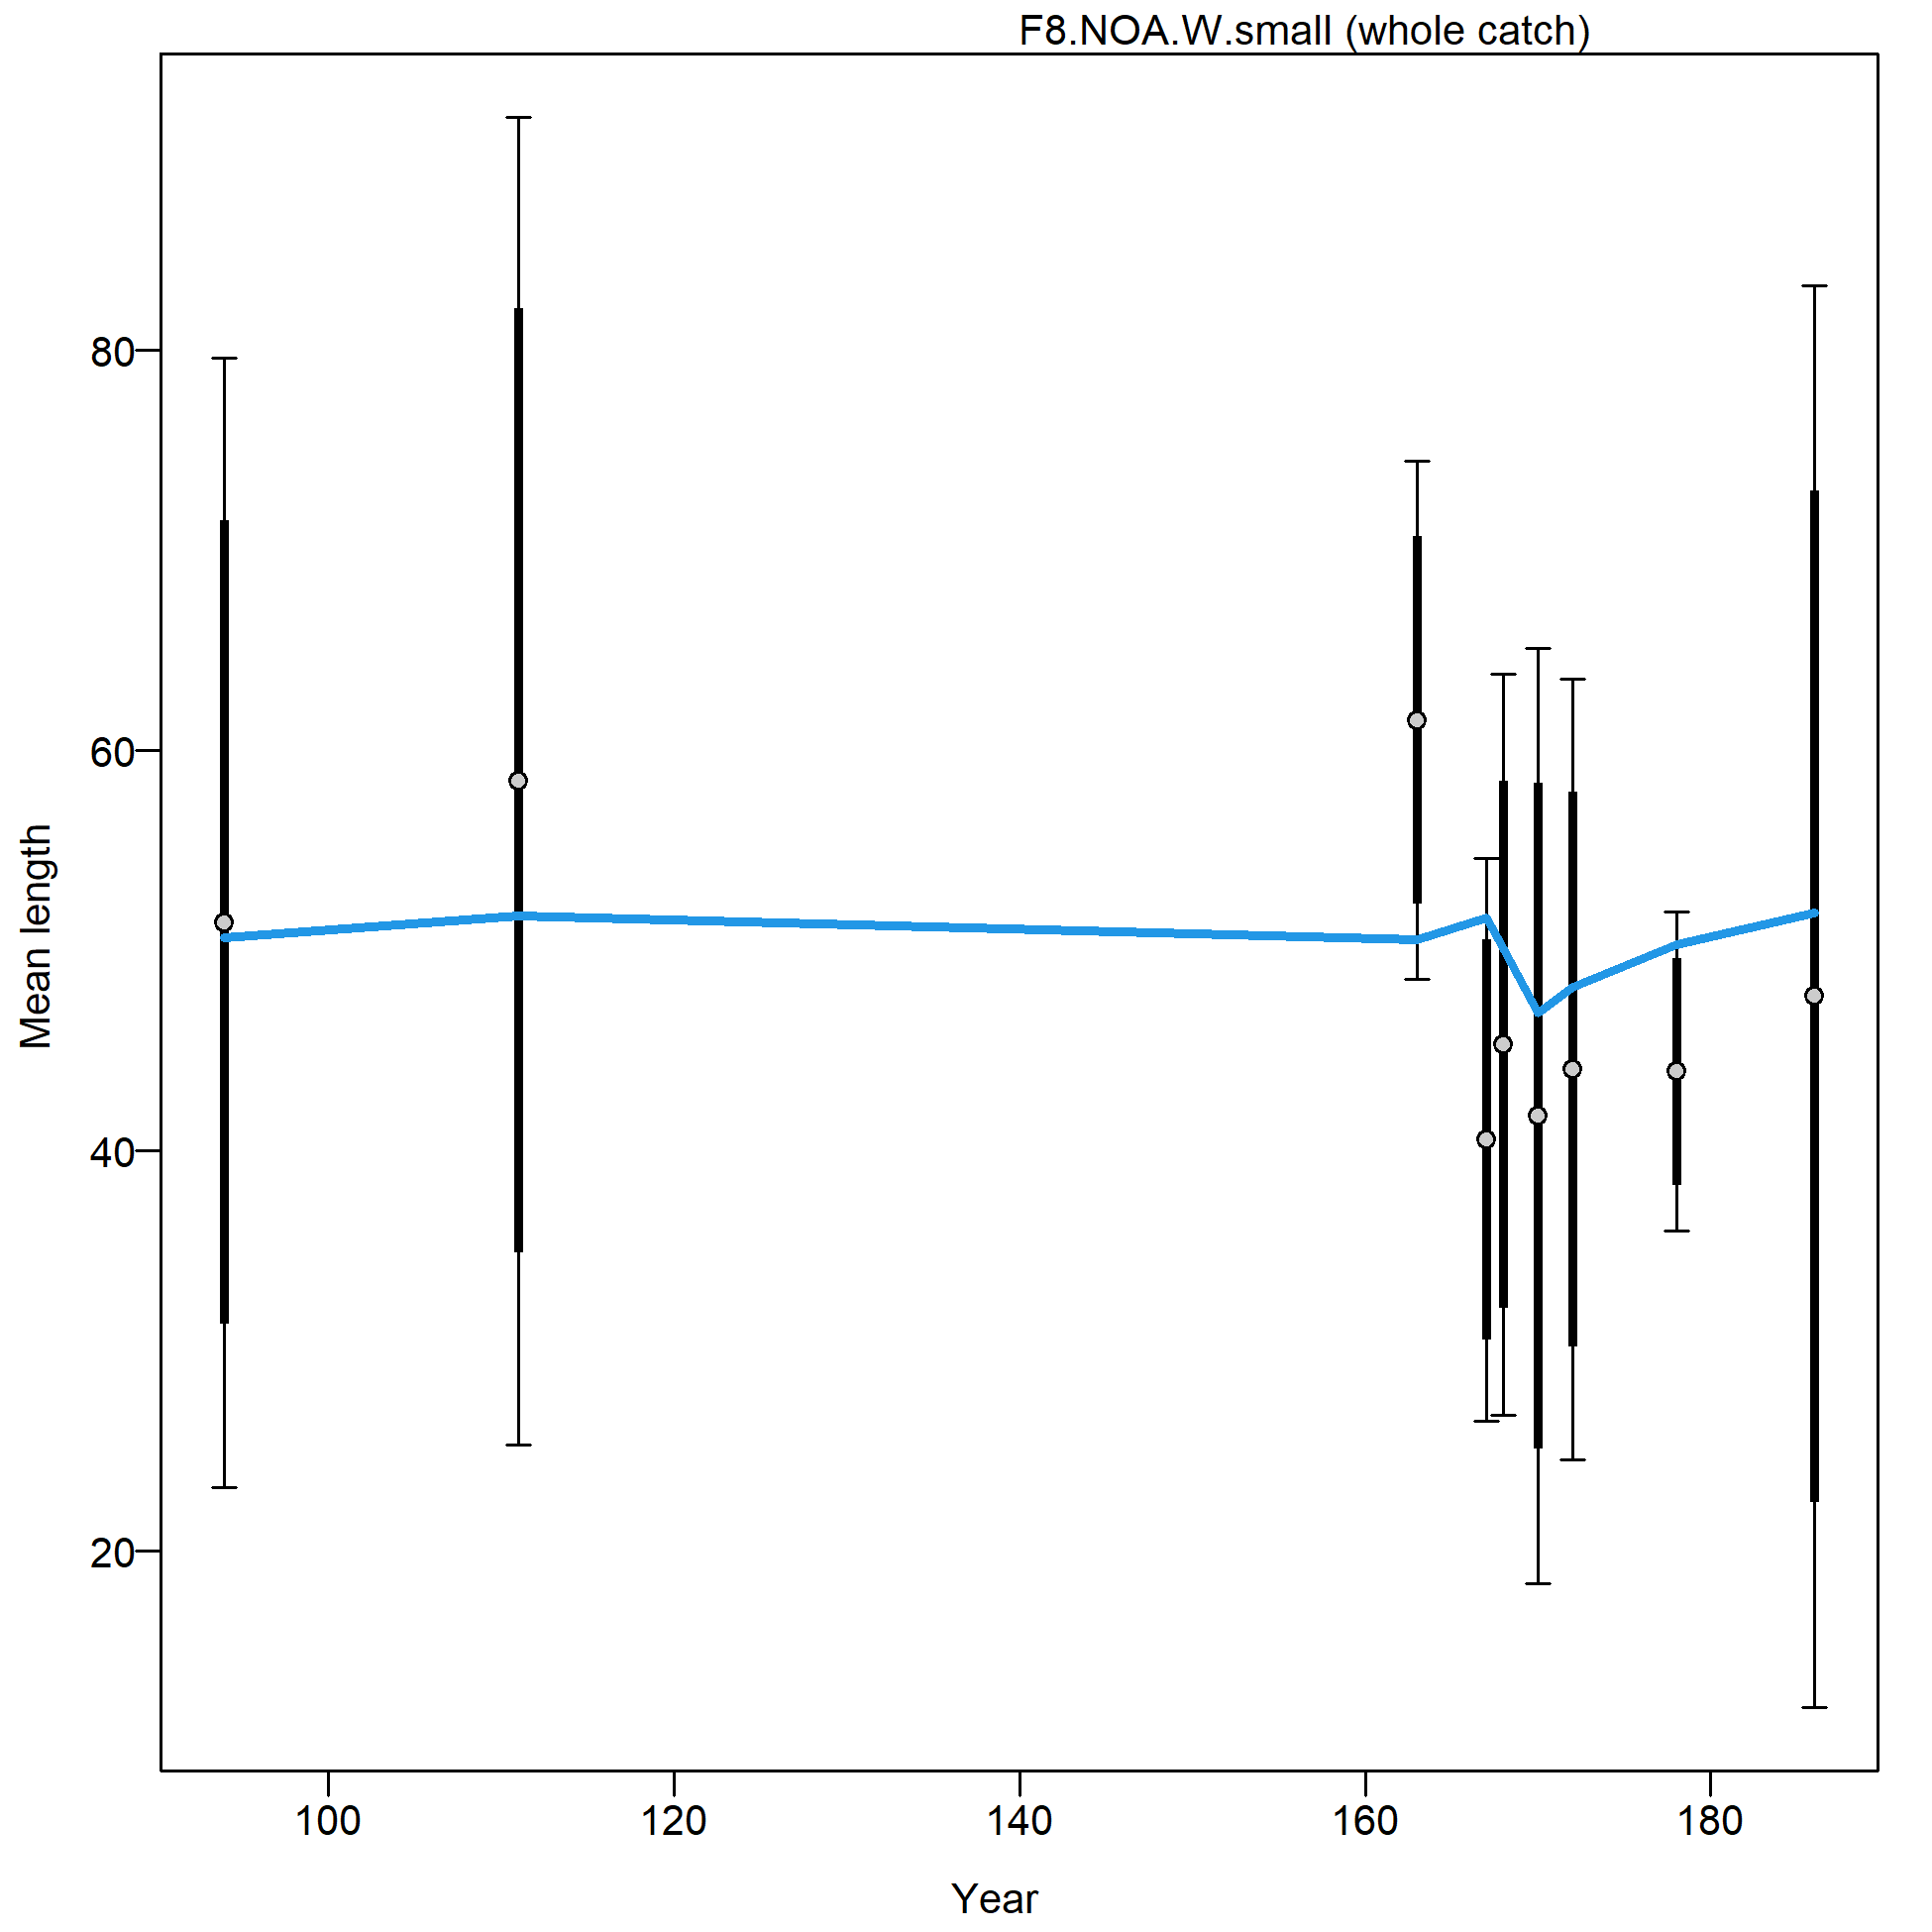
Mean length for F8.NOA.W.small with 95% confidence intervals based on current sample sizes.
Francis data weighting method TA1.8: thinner intervals (with capped ends) show result of further adjusting sample sizes based on suggested multiplier (with 95% interval) for len data from F8.NOA.W.small:
0.5061 (0.2772-3.1182)
For more info, see Francis (2011).
file: comp_lenfit_data_weighting_TA1.8_F8.NOA.W.small.png
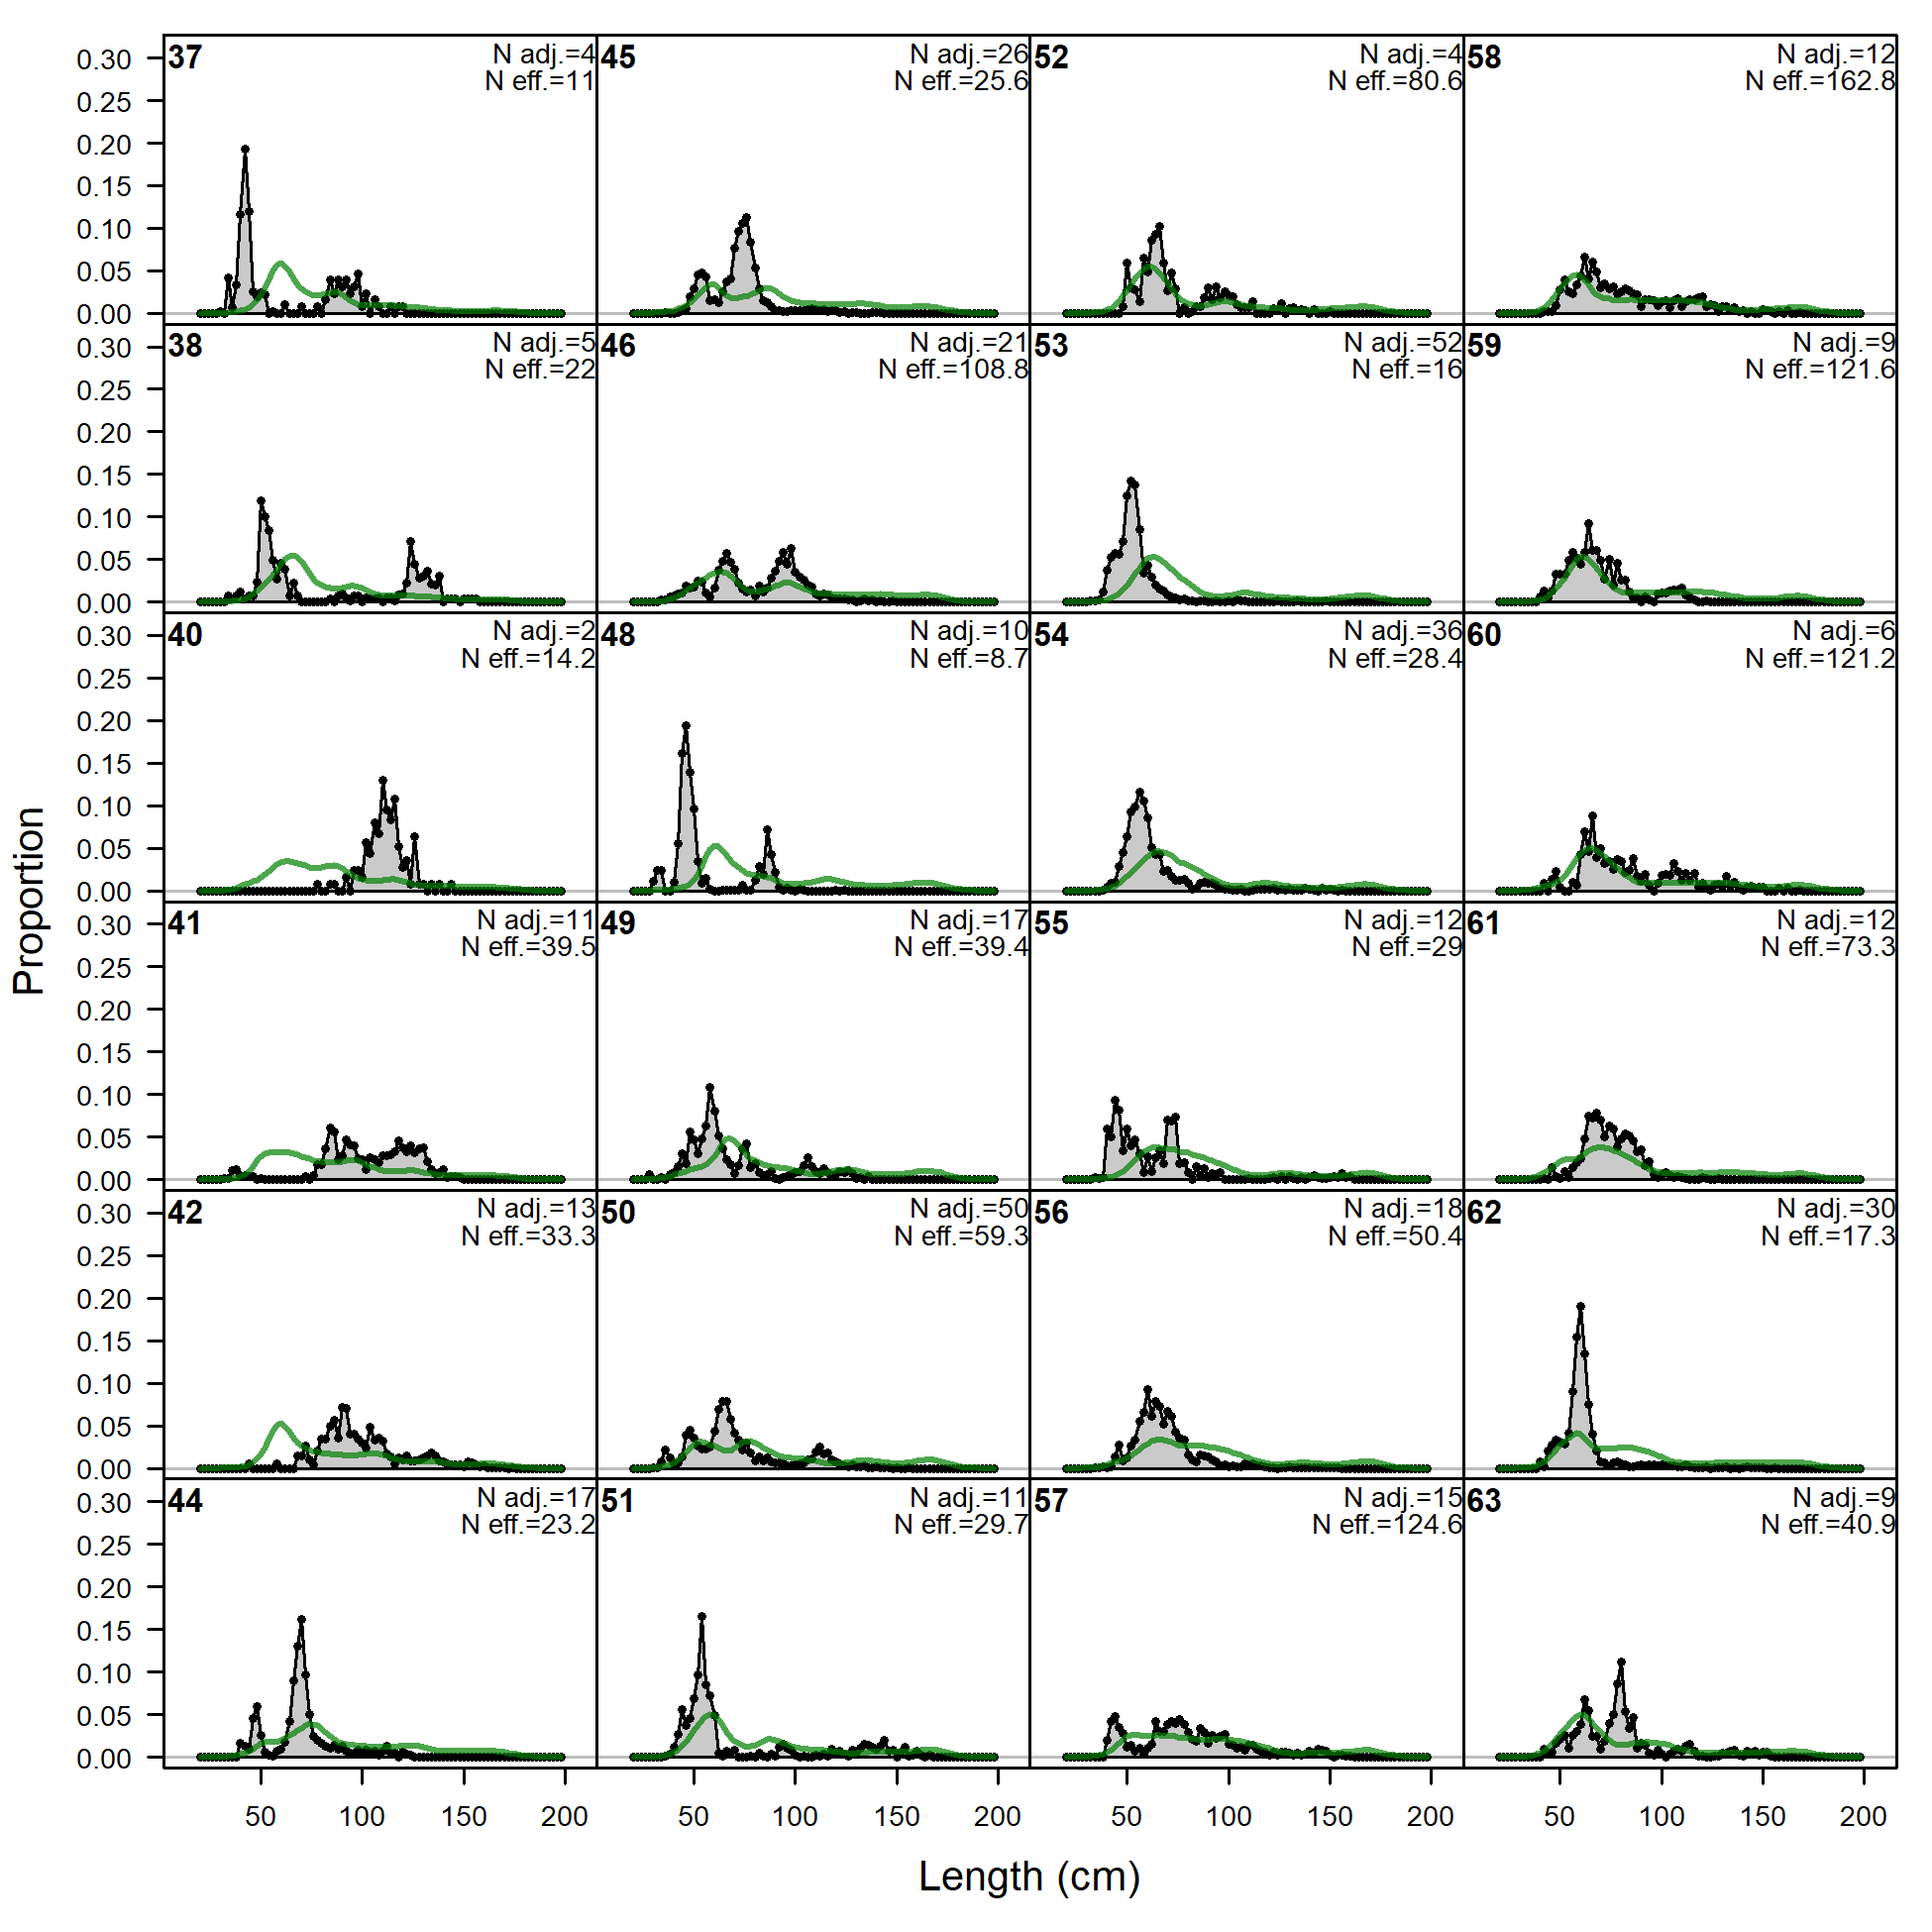
Length comps, whole catch, F9.NOA.S.small (plot 1 of 6).
'N adj.' is the input sample size after data-weighting adjustment. N eff. is the calculated effective sample size used in the McAllister-Ianelli tuning method.
file: comp_lenfit_flt9mkt0_page1.png
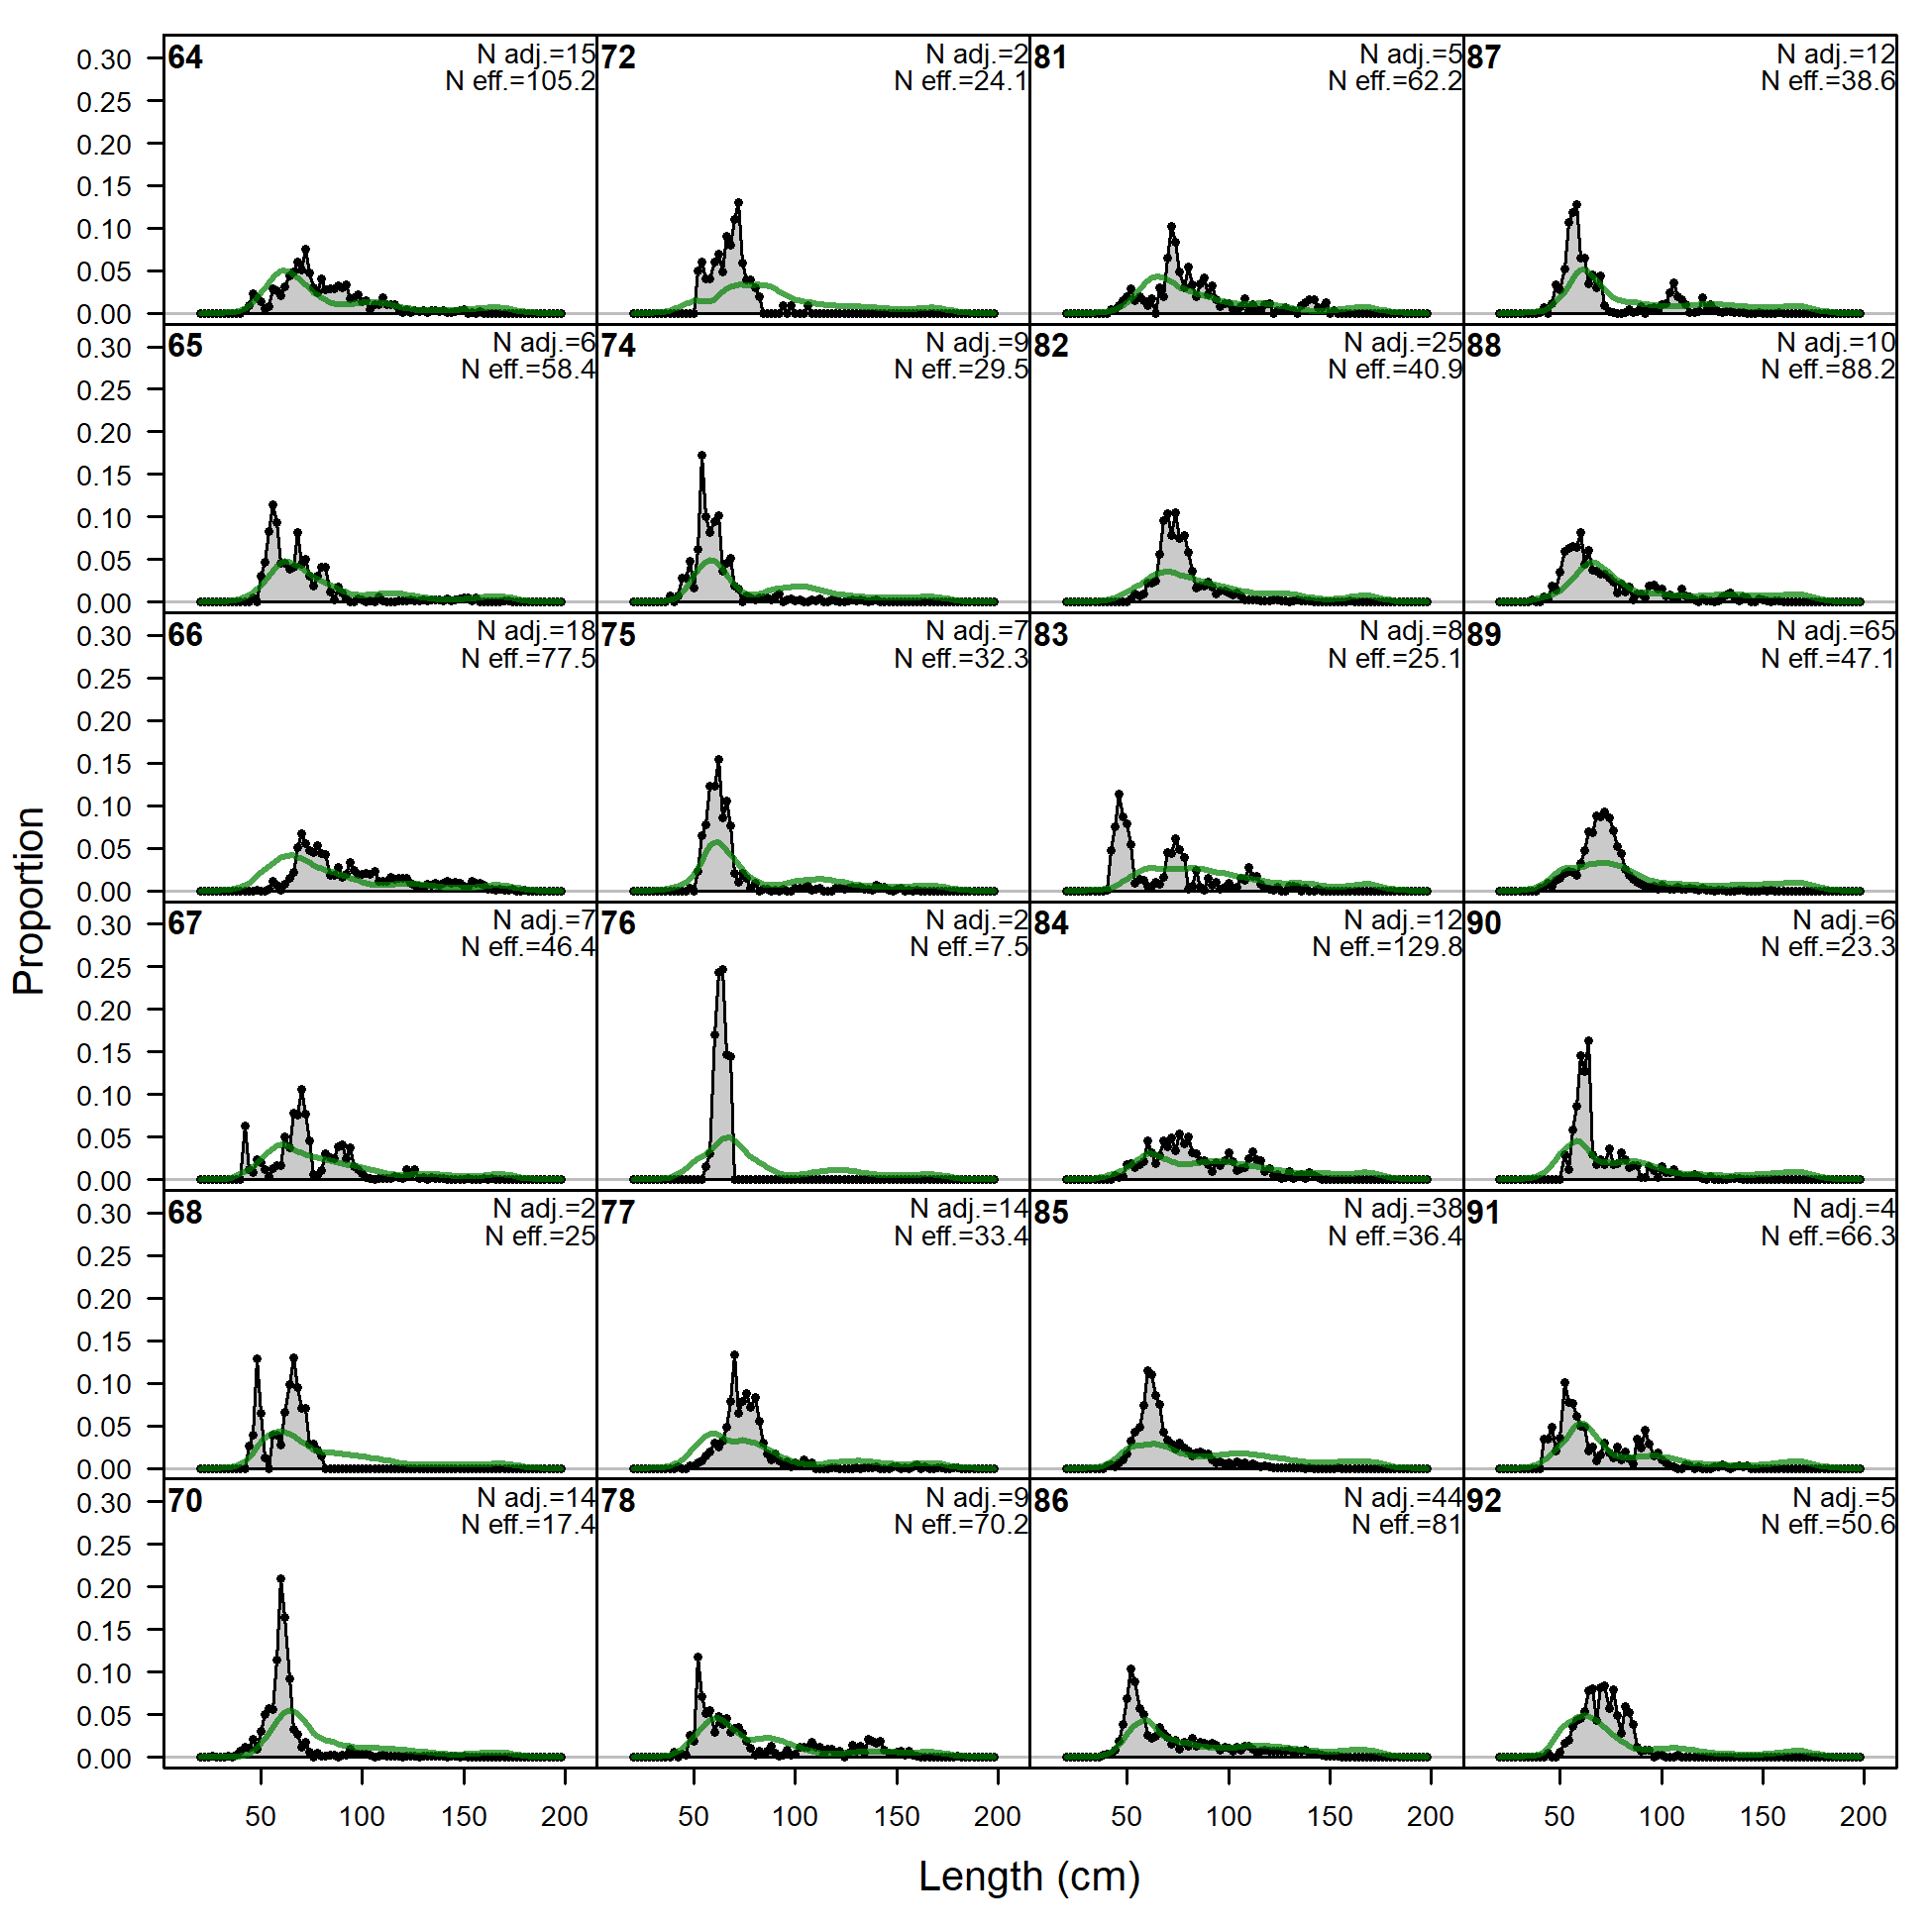
Length comps, whole catch, F9.NOA.S.small (plot 1 of 6).
'N adj.' is the input sample size after data-weighting adjustment. N eff. is the calculated effective sample size used in the McAllister-Ianelli tuning method. (plot 2 of 6)
file: comp_lenfit_flt9mkt0_page2.png
Length comps, whole catch, F9.NOA.S.small (plot 1 of 6).
'N adj.' is the input sample size after data-weighting adjustment. N eff. is the calculated effective sample size used in the McAllister-Ianelli tuning method. (plot 2 of 6) (plot 3 of 6)
file: comp_lenfit_flt9mkt0_page3.png
Length comps, whole catch, F9.NOA.S.small (plot 1 of 6).
'N adj.' is the input sample size after data-weighting adjustment. N eff. is the calculated effective sample size used in the McAllister-Ianelli tuning method. (plot 2 of 6) (plot 3 of 6) (plot 4 of 6)
file: comp_lenfit_flt9mkt0_page4.png
Length comps, whole catch, F9.NOA.S.small (plot 1 of 6).
'N adj.' is the input sample size after data-weighting adjustment. N eff. is the calculated effective sample size used in the McAllister-Ianelli tuning method. (plot 2 of 6) (plot 3 of 6) (plot 4 of 6) (plot 5 of 6)
file: comp_lenfit_flt9mkt0_page5.png
Length comps, whole catch, F9.NOA.S.small (plot 1 of 6).
'N adj.' is the input sample size after data-weighting adjustment. N eff. is the calculated effective sample size used in the McAllister-Ianelli tuning method. (plot 2 of 6) (plot 3 of 6) (plot 4 of 6) (plot 5 of 6) (plot 6 of 6)
file: comp_lenfit_flt9mkt0_page6.png
Pearson residuals, whole catch, F9.NOA.S.small (max=18.97) (plot 6 of 6)
Closed bubbles are positive residuals (observed > expected) and open bubbles are negative residuals (observed < expected).
file: comp_lenfit_residsflt9mkt0_page6.png
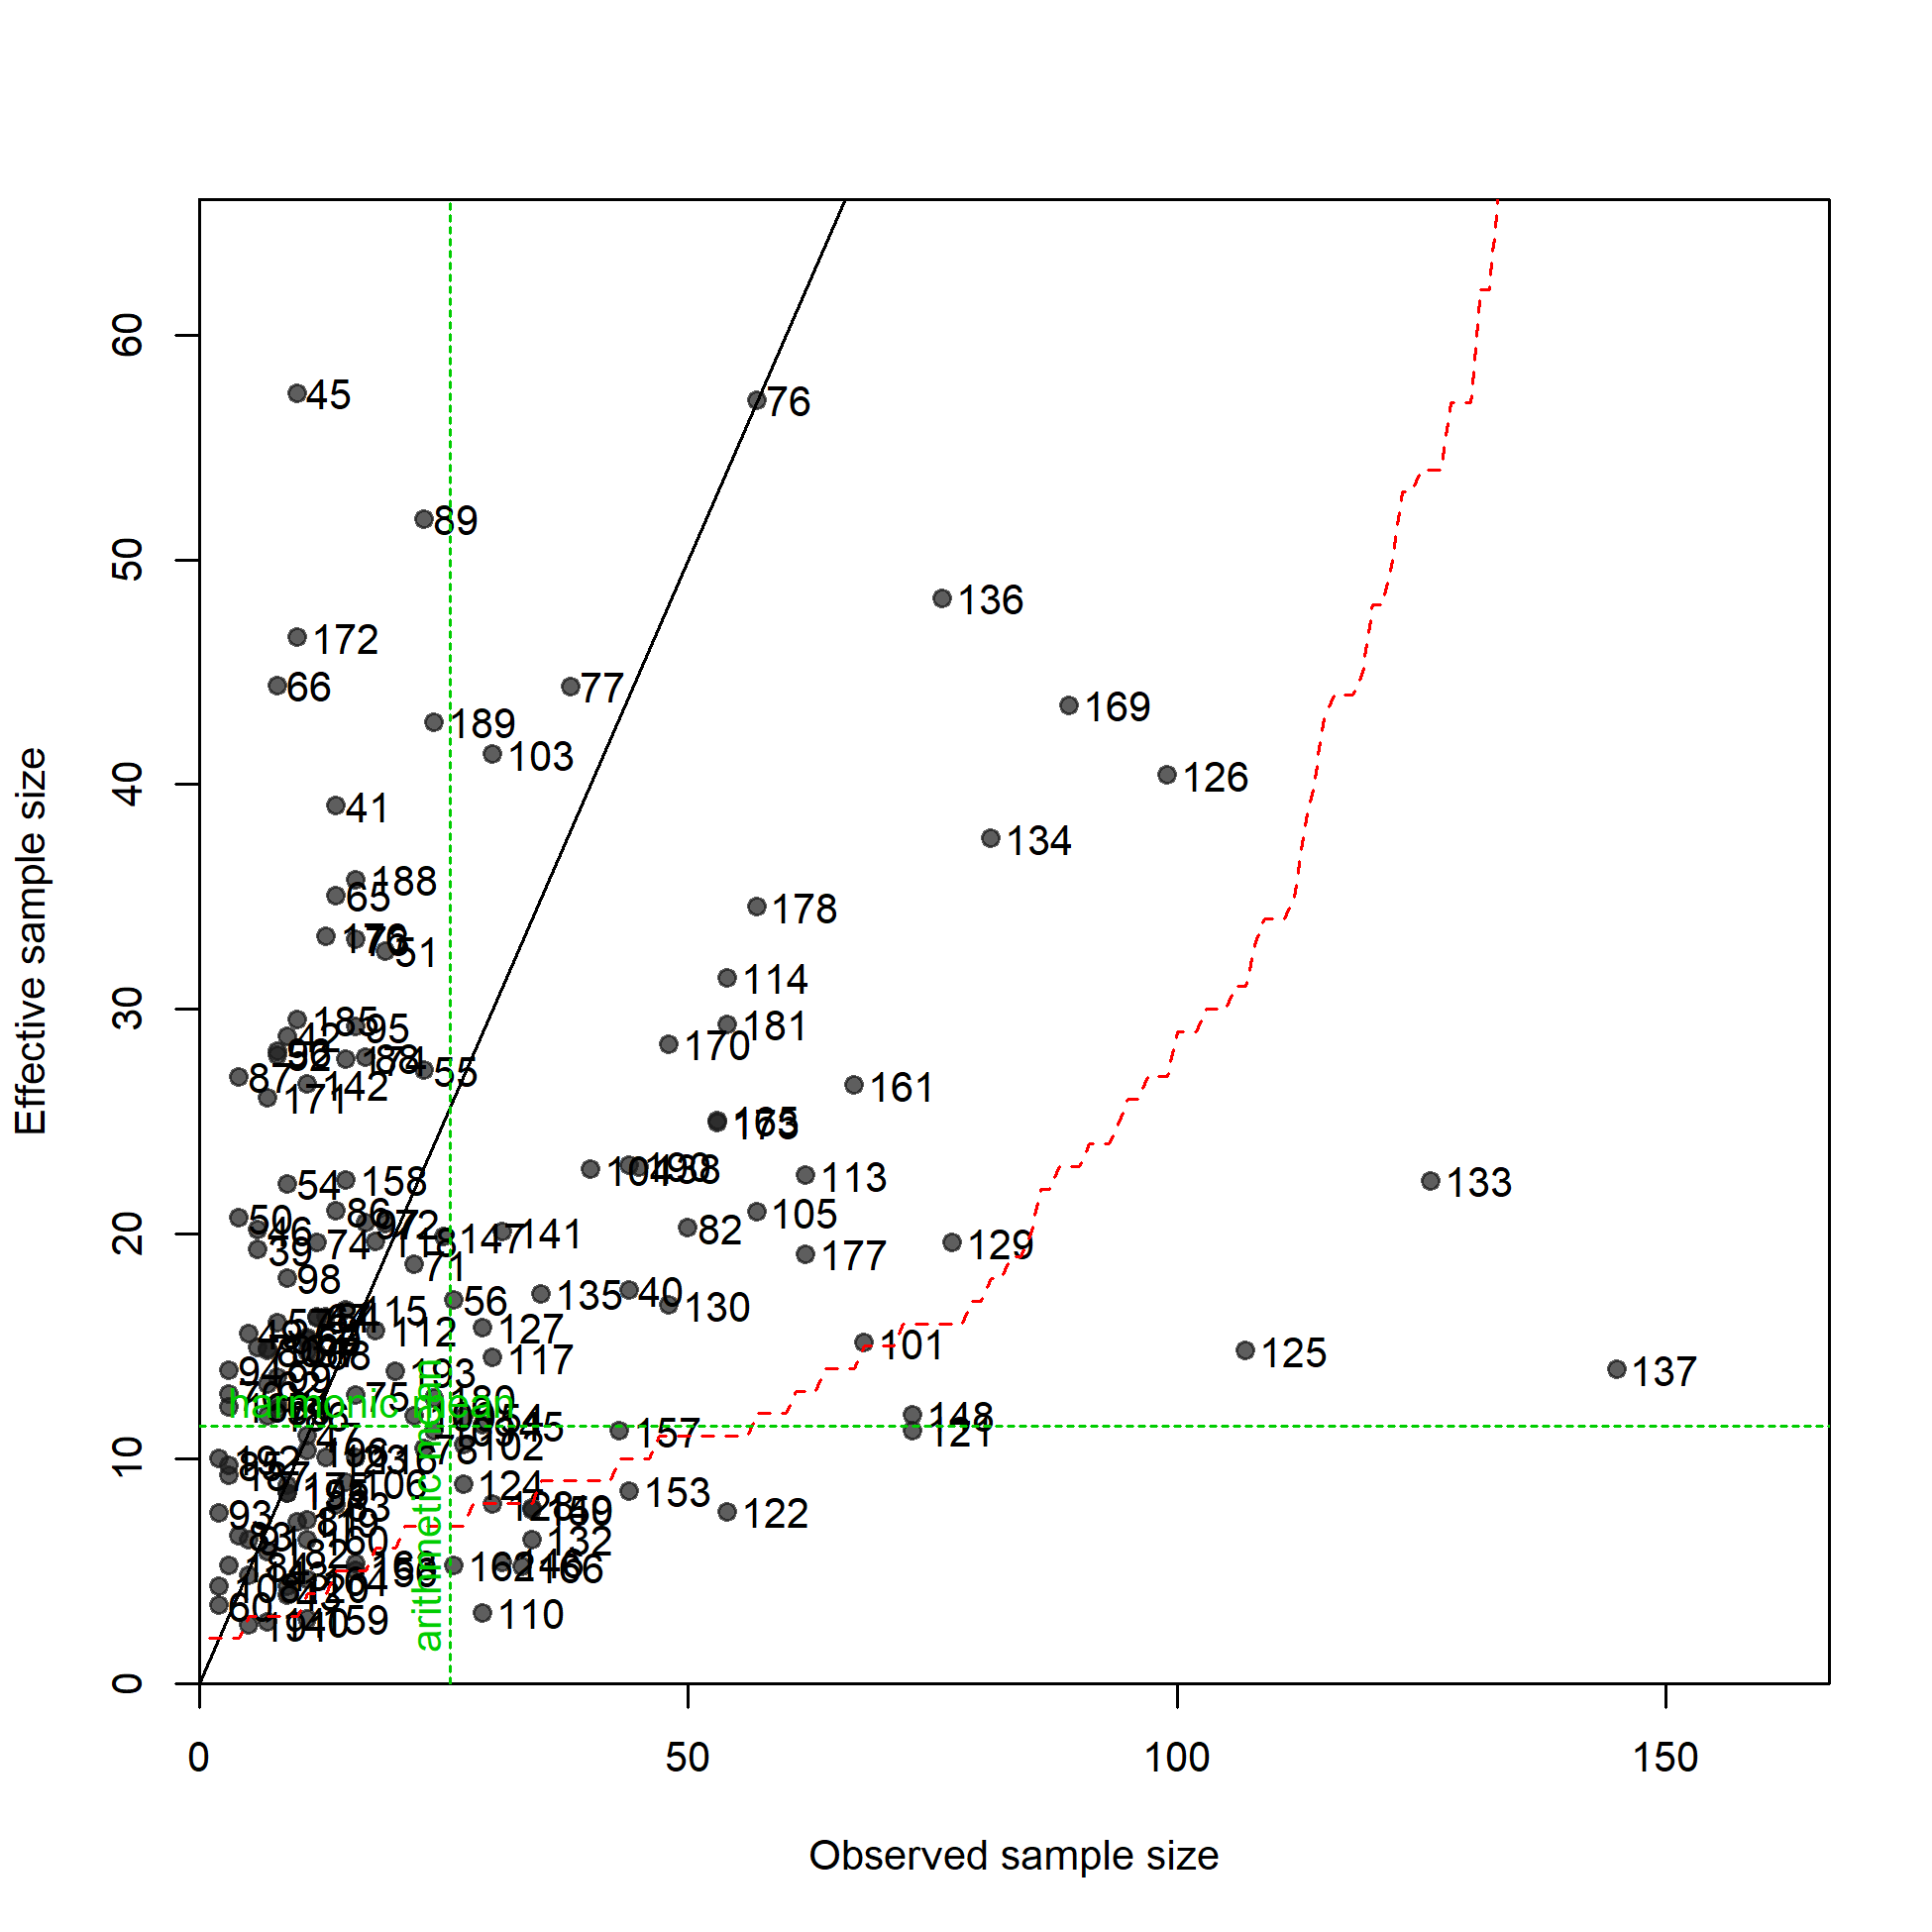
N-EffN comparison, Length comps, whole catch, F9.NOA.S.small
file: comp_lenfit_sampsize_flt9mkt0.png
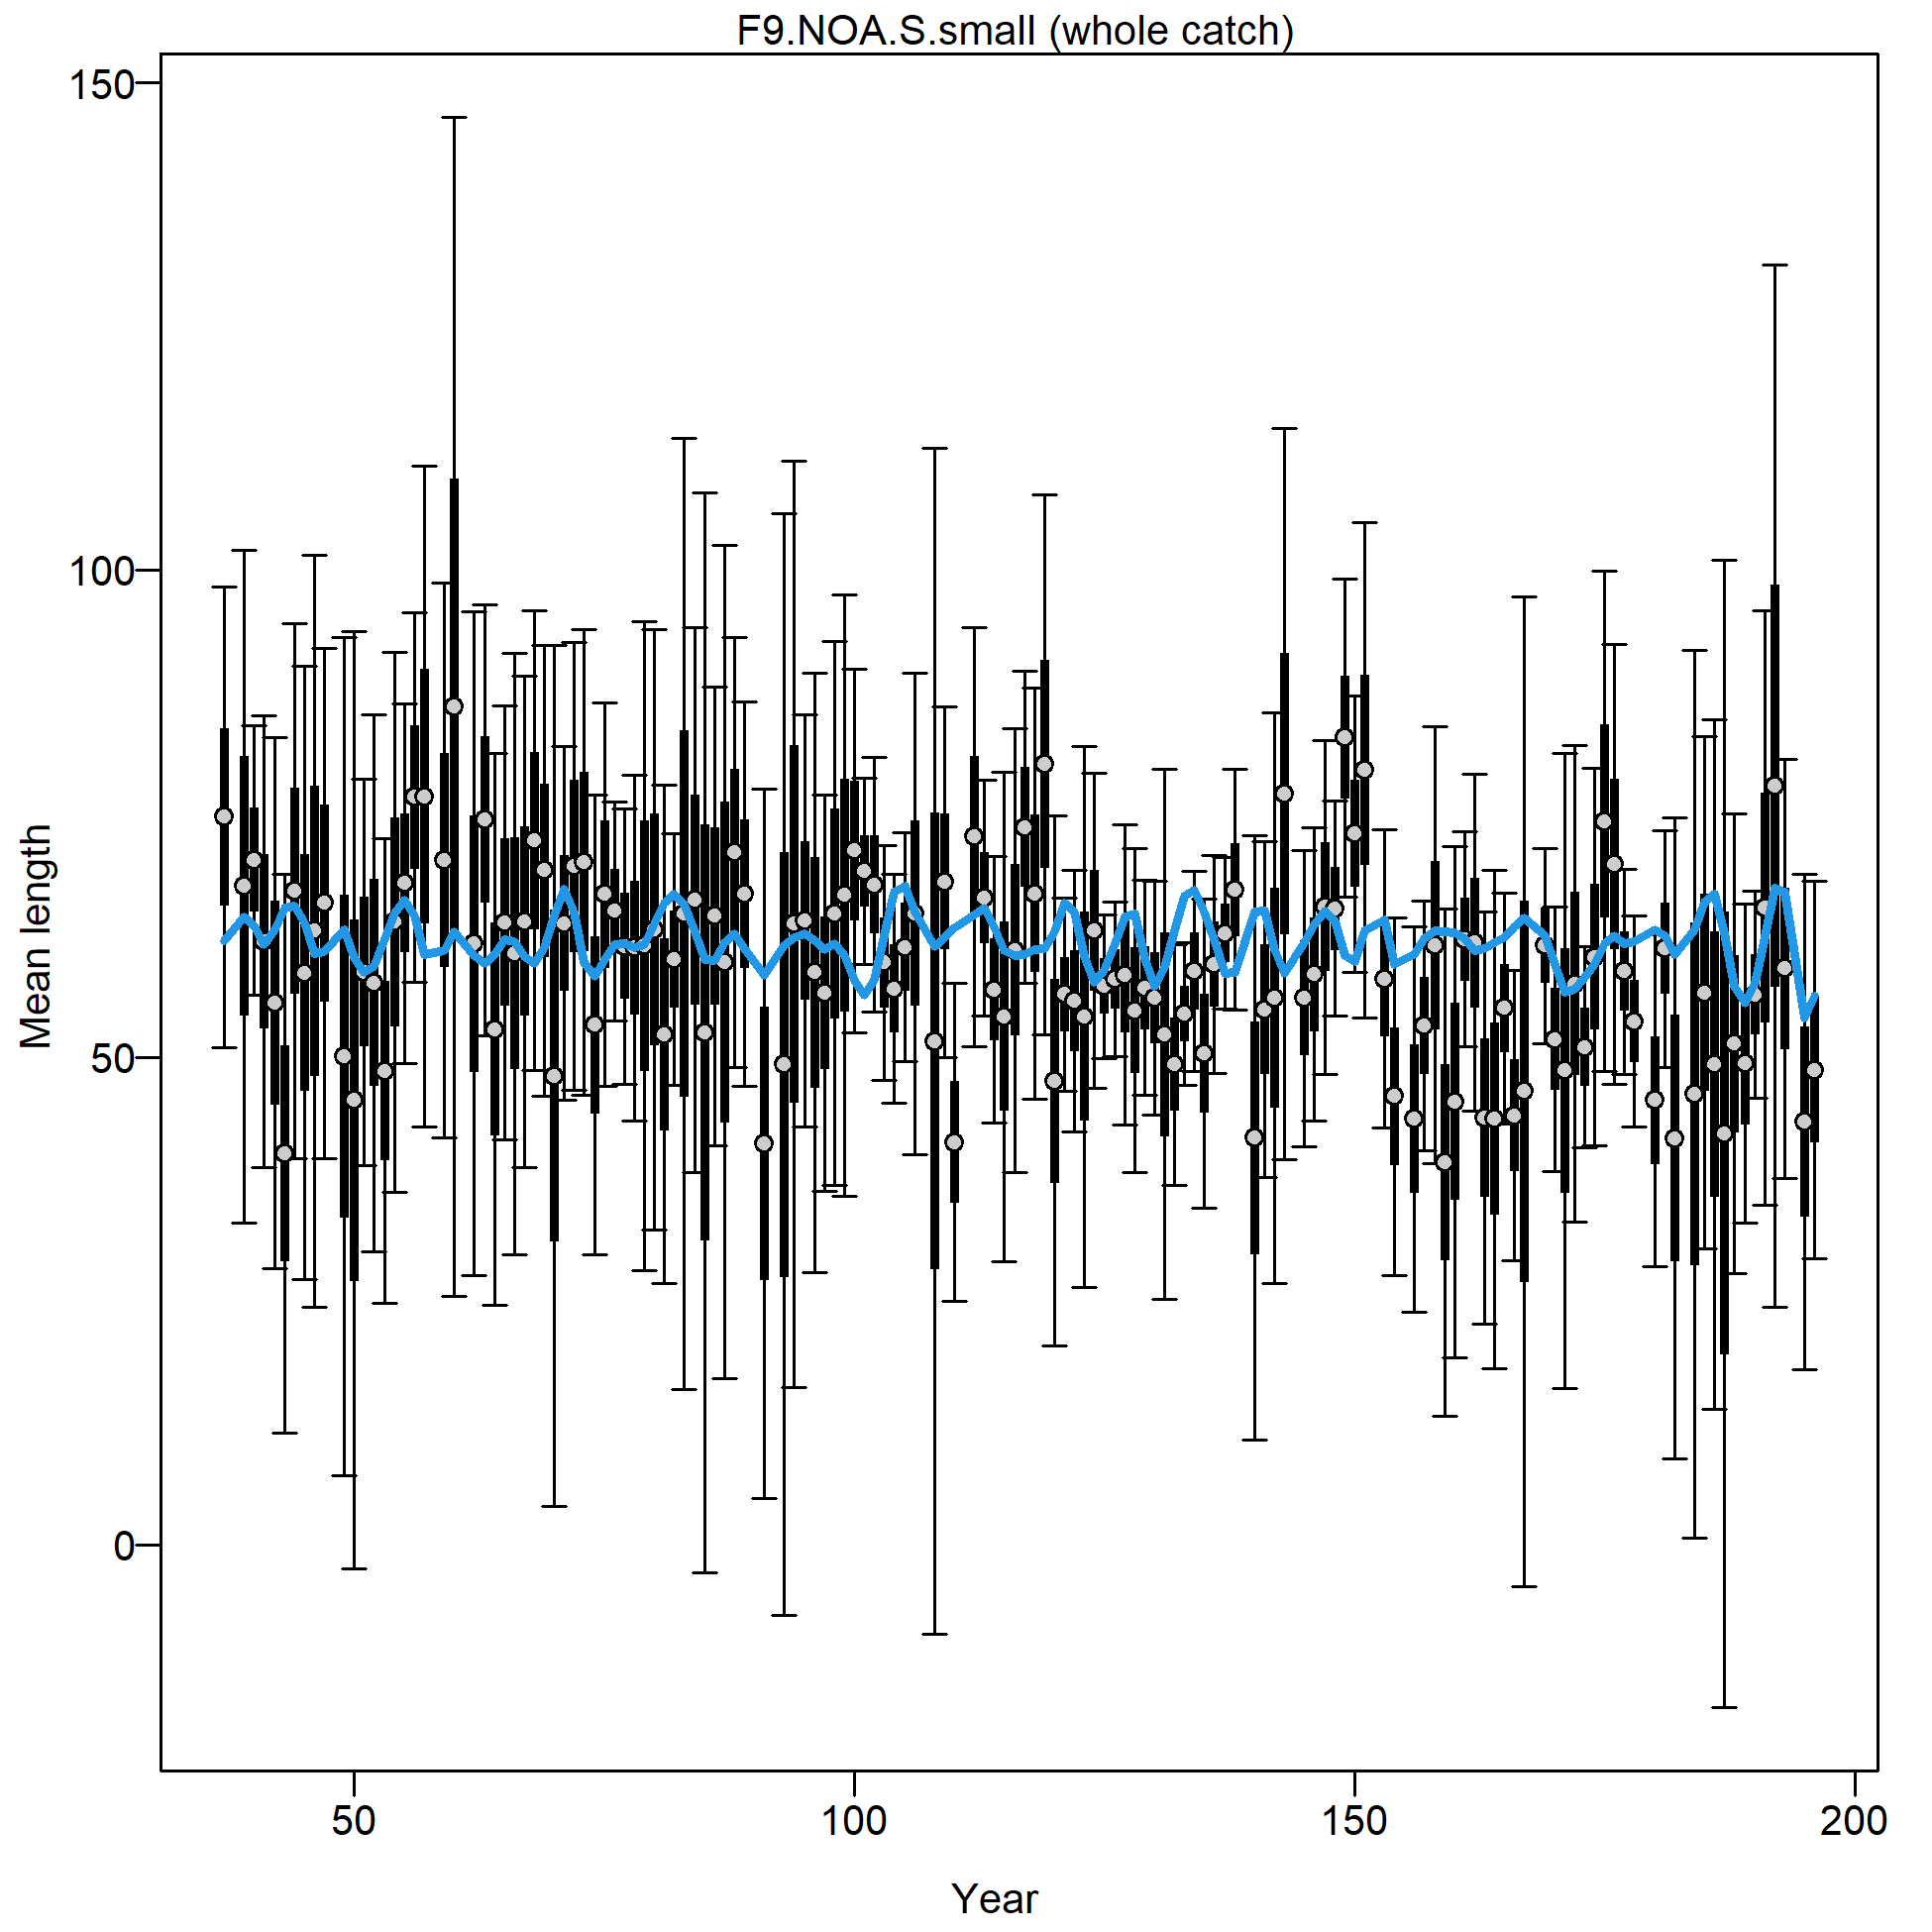
Mean length for F9.NOA.S.small with 95% confidence intervals based on current sample sizes.
Francis data weighting method TA1.8: thinner intervals (with capped ends) show result of further adjusting sample sizes based on suggested multiplier (with 95% interval) for len data from F9.NOA.S.small:
0.1488 (0.1197-0.1969)
For more info, see Francis (2011).
file: comp_lenfit_data_weighting_TA1.8_F9.NOA.S.small.png
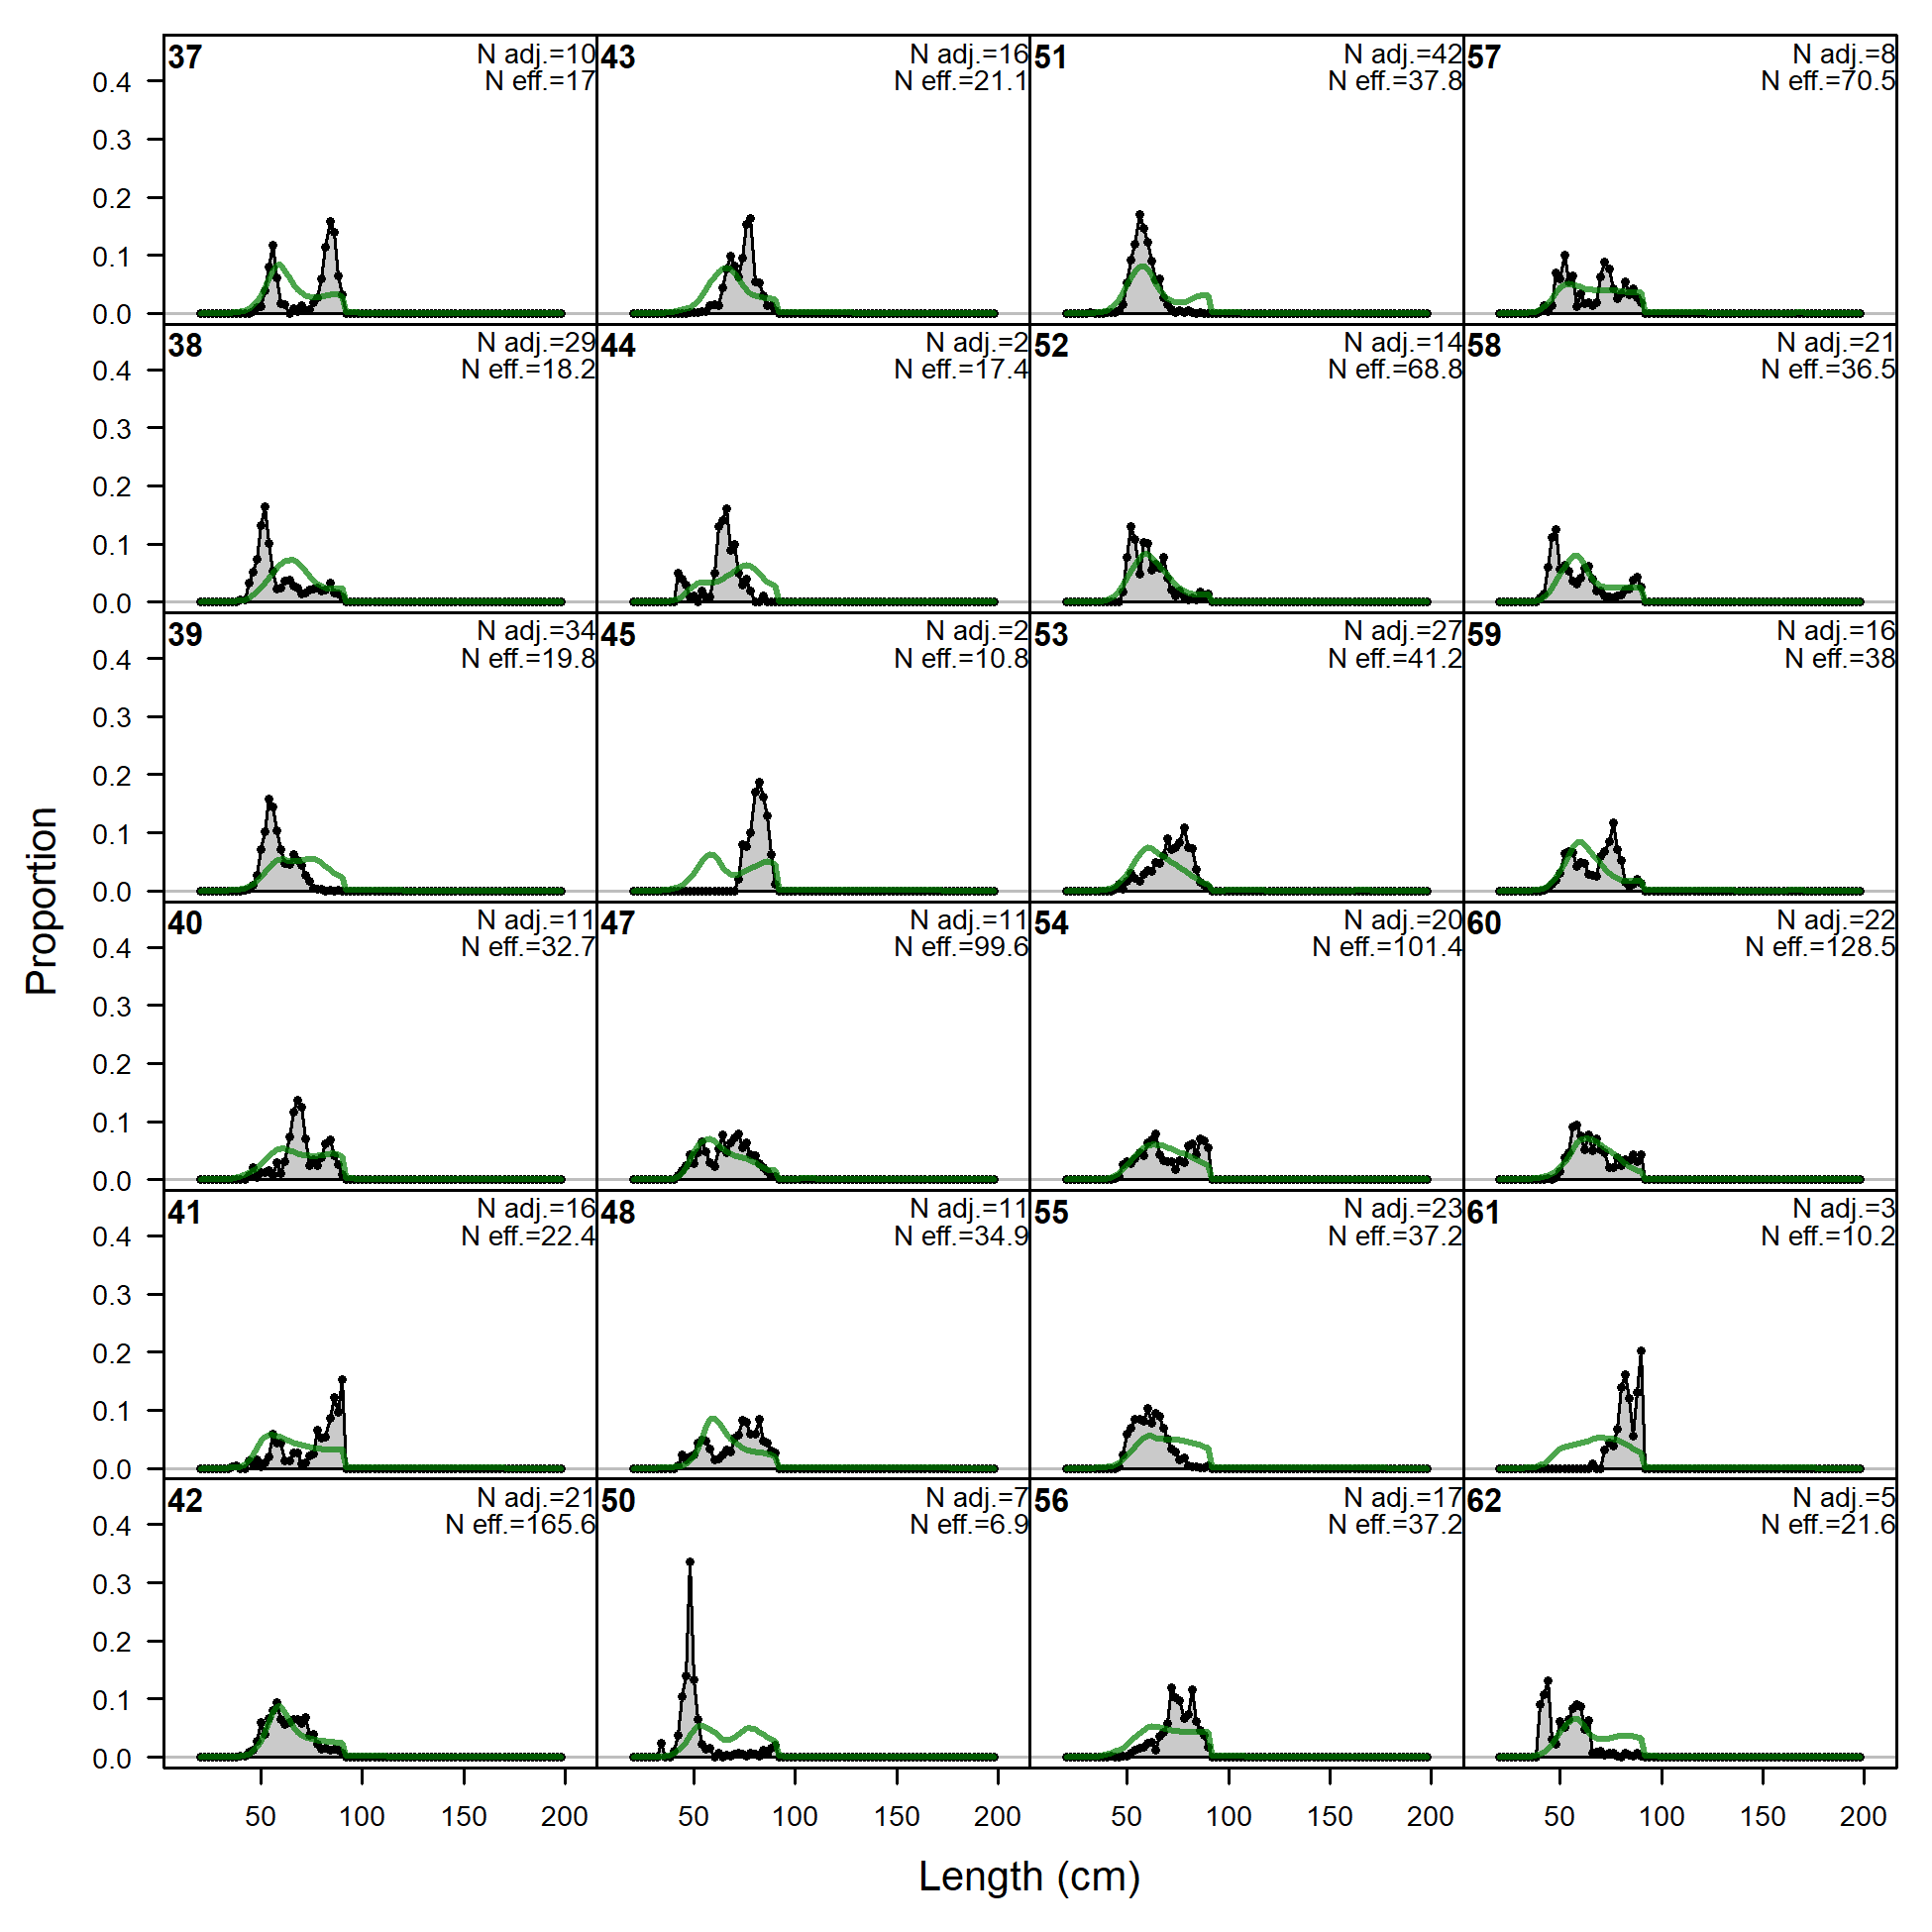
Length comps, whole catch, F10.NOA.C.small (plot 1 of 6).
'N adj.' is the input sample size after data-weighting adjustment. N eff. is the calculated effective sample size used in the McAllister-Ianelli tuning method.
file: comp_lenfit_flt10mkt0_page1.png
Length comps, whole catch, F10.NOA.C.small (plot 1 of 6).
'N adj.' is the input sample size after data-weighting adjustment. N eff. is the calculated effective sample size used in the McAllister-Ianelli tuning method. (plot 2 of 6)
file: comp_lenfit_flt10mkt0_page2.png
Length comps, whole catch, F10.NOA.C.small (plot 1 of 6).
'N adj.' is the input sample size after data-weighting adjustment. N eff. is the calculated effective sample size used in the McAllister-Ianelli tuning method. (plot 2 of 6) (plot 3 of 6)
file: comp_lenfit_flt10mkt0_page3.png
Length comps, whole catch, F10.NOA.C.small (plot 1 of 6).
'N adj.' is the input sample size after data-weighting adjustment. N eff. is the calculated effective sample size used in the McAllister-Ianelli tuning method. (plot 2 of 6) (plot 3 of 6) (plot 4 of 6)
file: comp_lenfit_flt10mkt0_page4.png
Length comps, whole catch, F10.NOA.C.small (plot 1 of 6).
'N adj.' is the input sample size after data-weighting adjustment. N eff. is the calculated effective sample size used in the McAllister-Ianelli tuning method. (plot 2 of 6) (plot 3 of 6) (plot 4 of 6) (plot 5 of 6)
file: comp_lenfit_flt10mkt0_page5.png
Length comps, whole catch, F10.NOA.C.small (plot 1 of 6).
'N adj.' is the input sample size after data-weighting adjustment. N eff. is the calculated effective sample size used in the McAllister-Ianelli tuning method. (plot 2 of 6) (plot 3 of 6) (plot 4 of 6) (plot 5 of 6) (plot 6 of 6)
file: comp_lenfit_flt10mkt0_page6.png
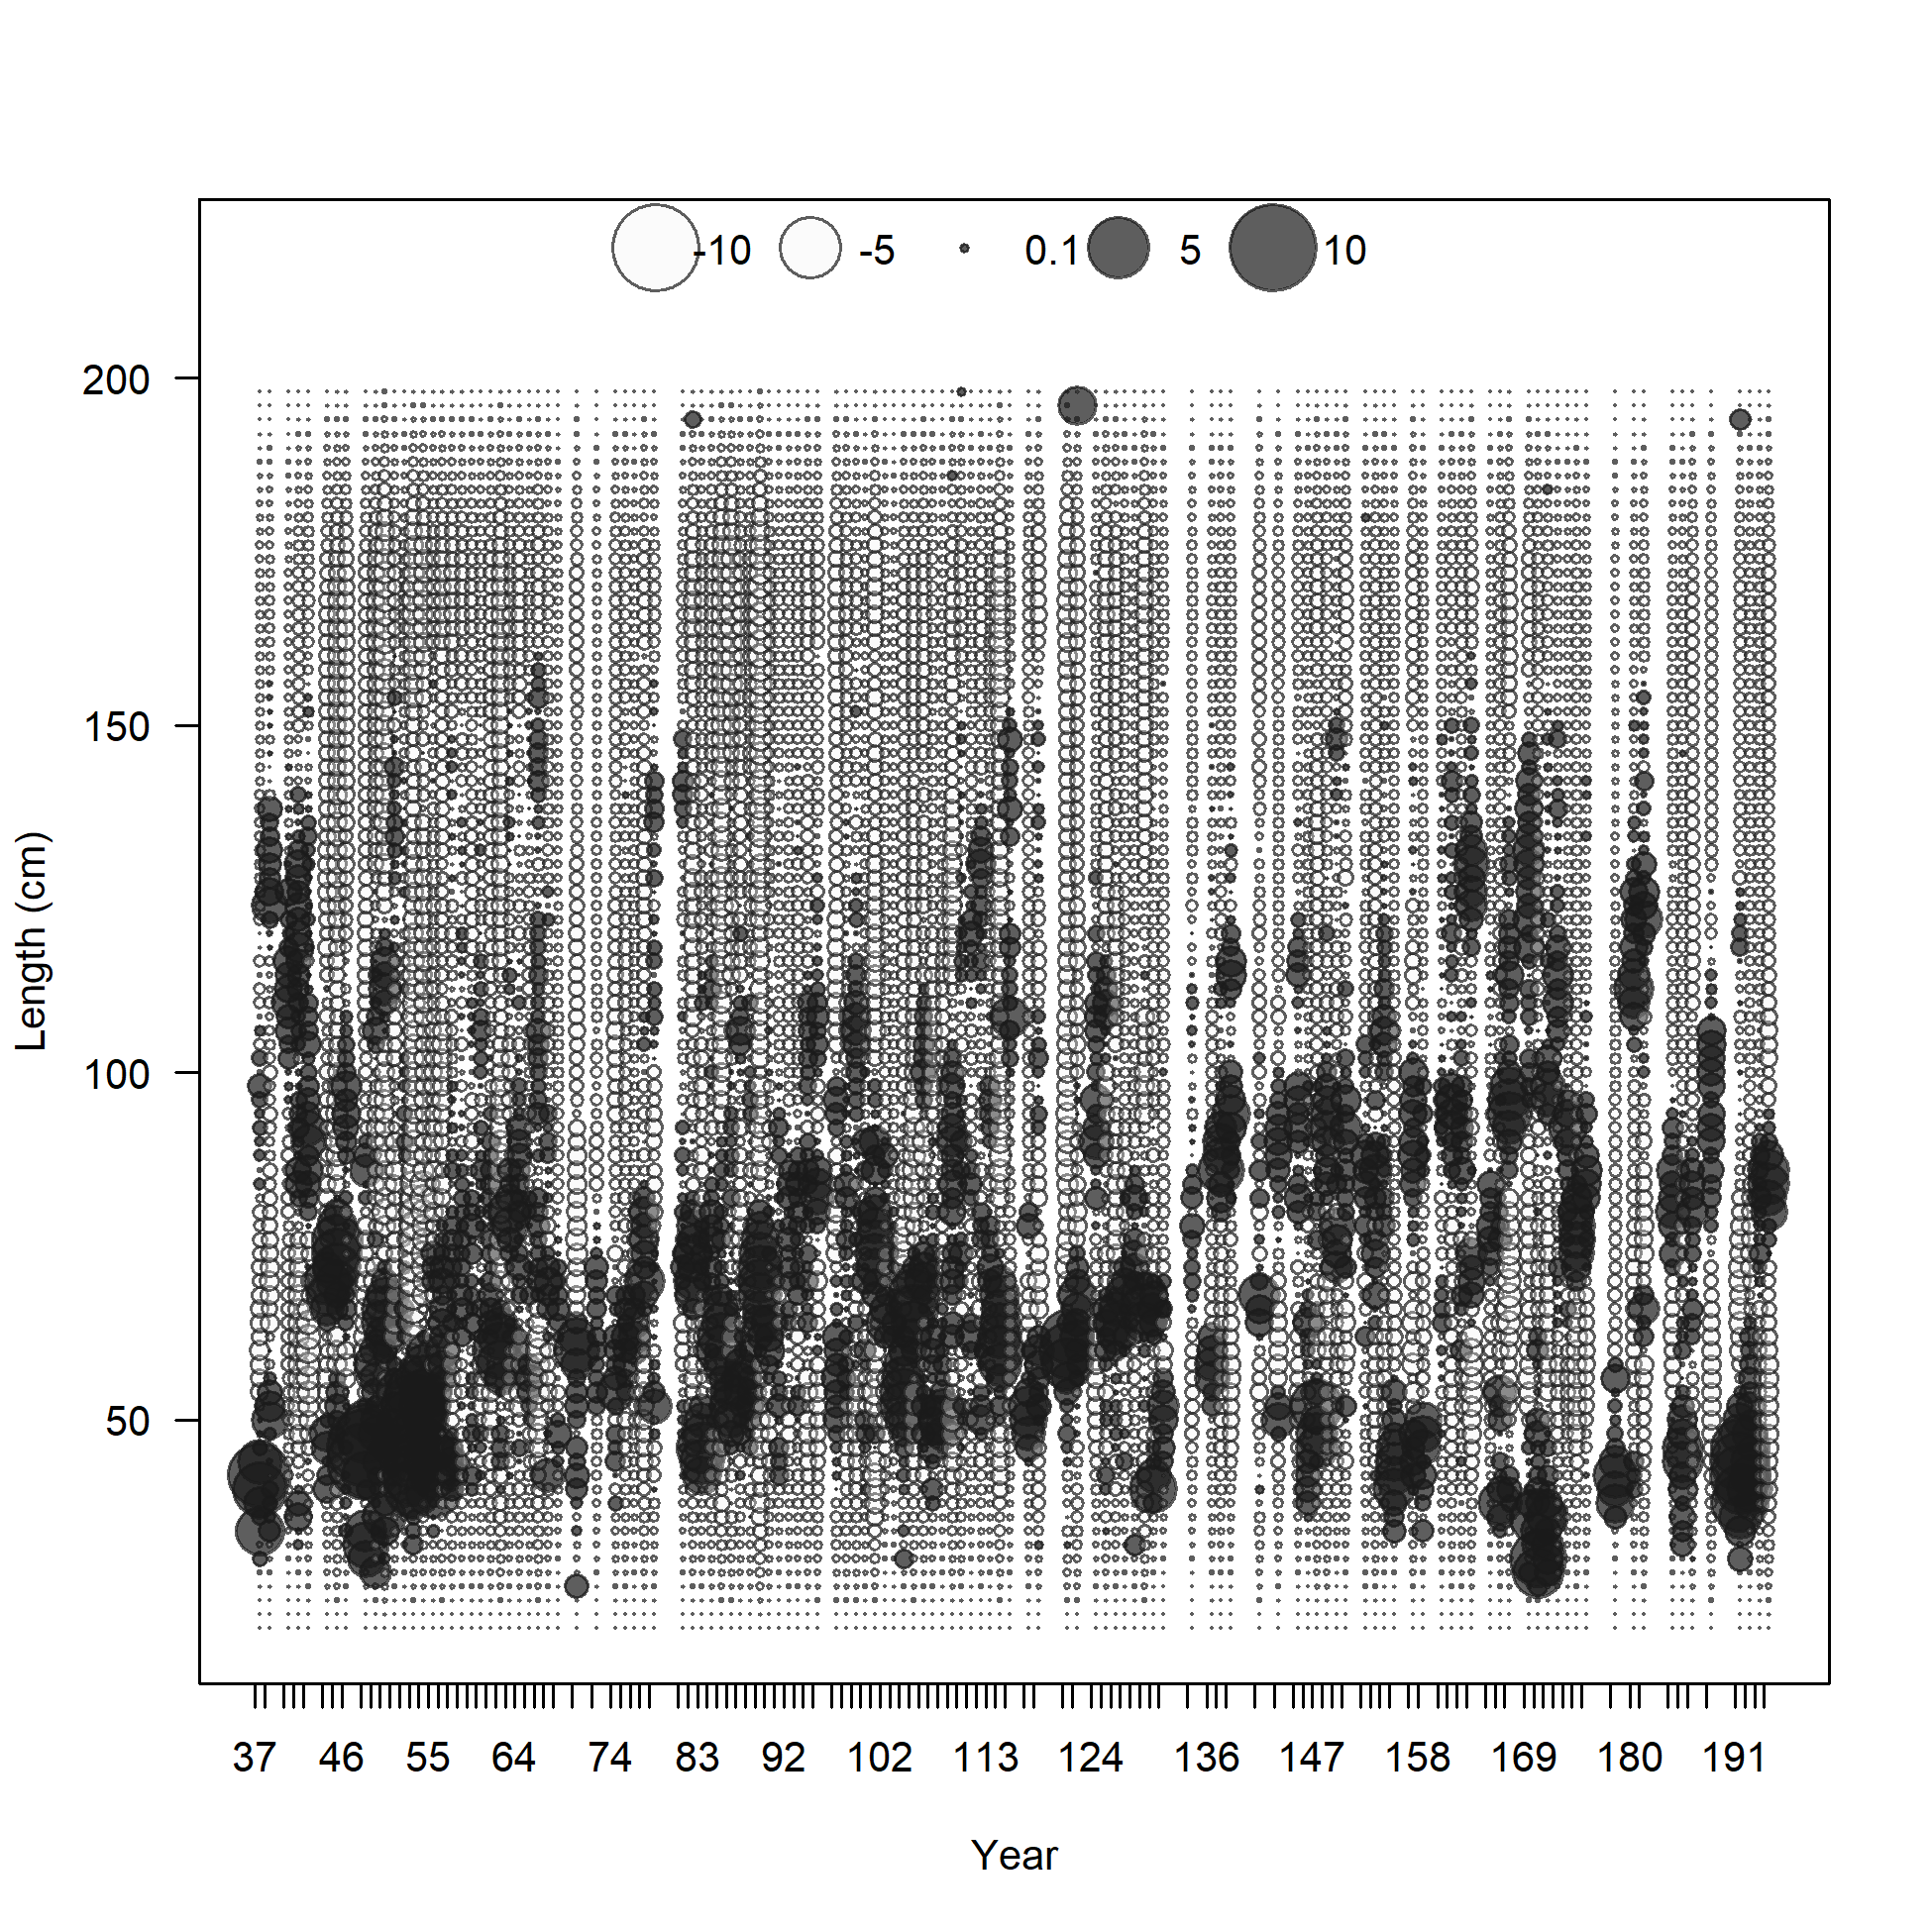
Pearson residuals, whole catch, F10.NOA.C.small (max=8.16) (plot 6 of 6)
Closed bubbles are positive residuals (observed > expected) and open bubbles are negative residuals (observed < expected).
file: comp_lenfit_residsflt10mkt0_page6.png
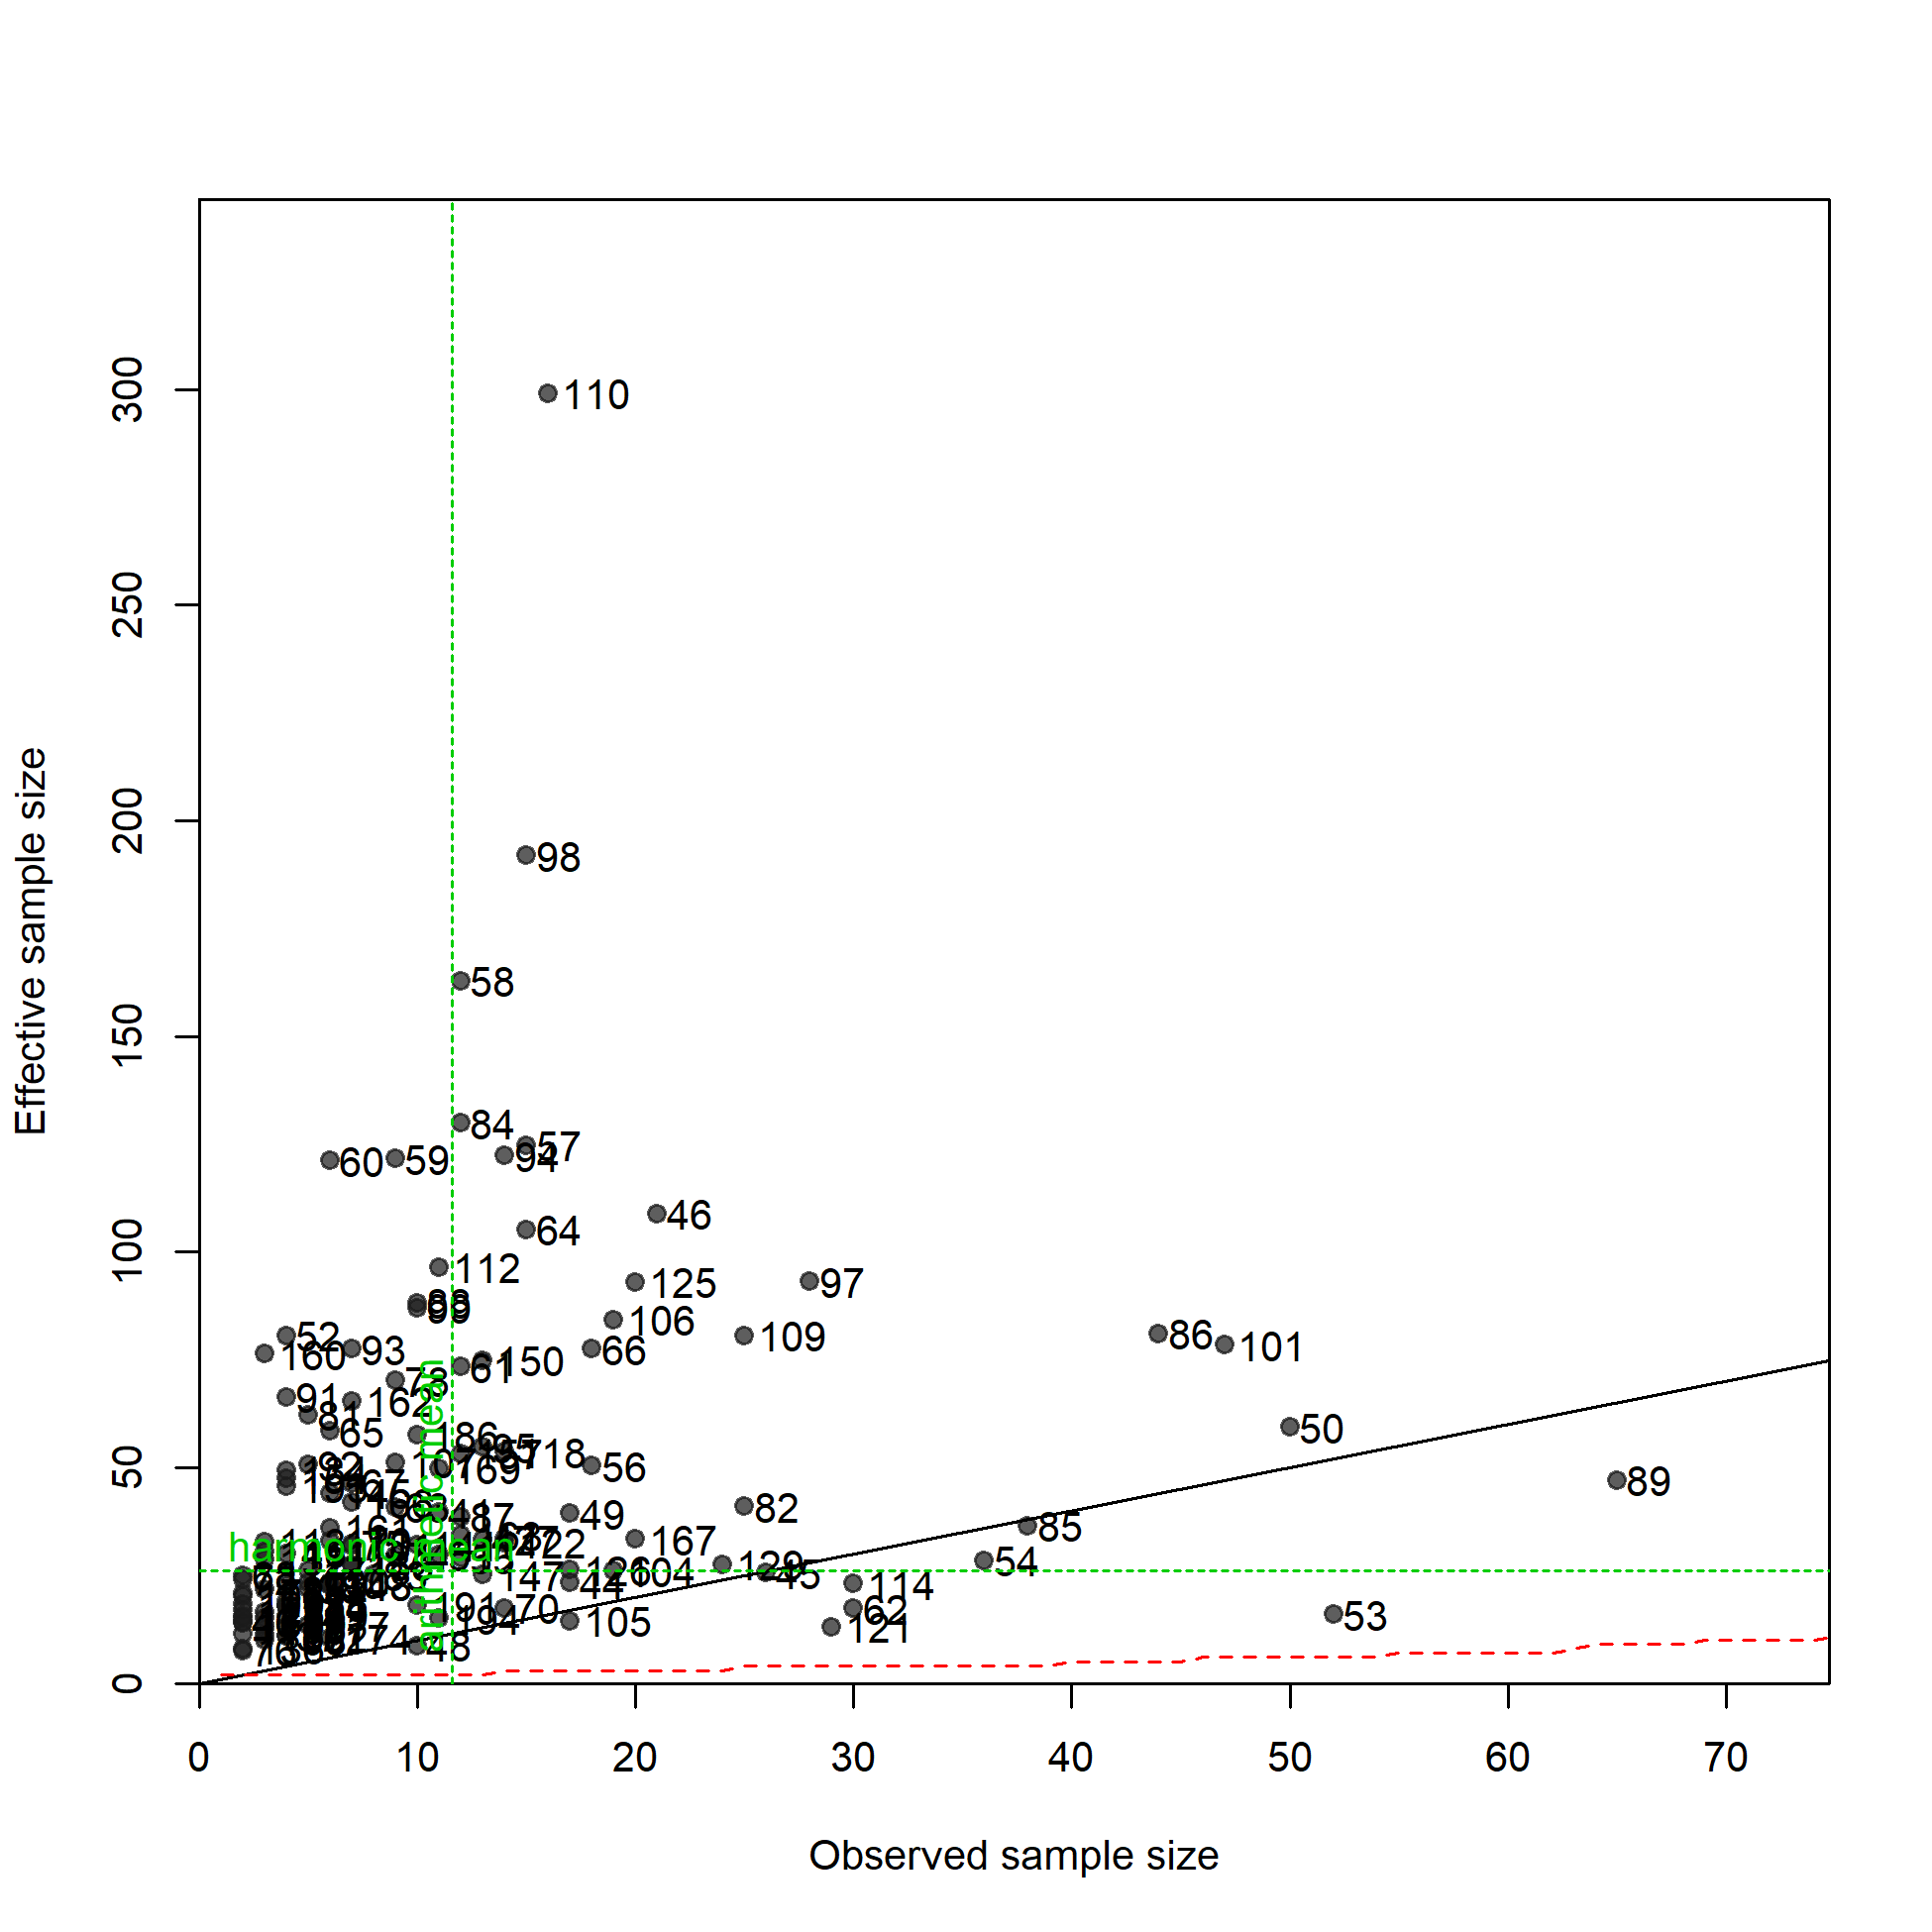
N-EffN comparison, Length comps, whole catch, F10.NOA.C.small
file: comp_lenfit_sampsize_flt10mkt0.png
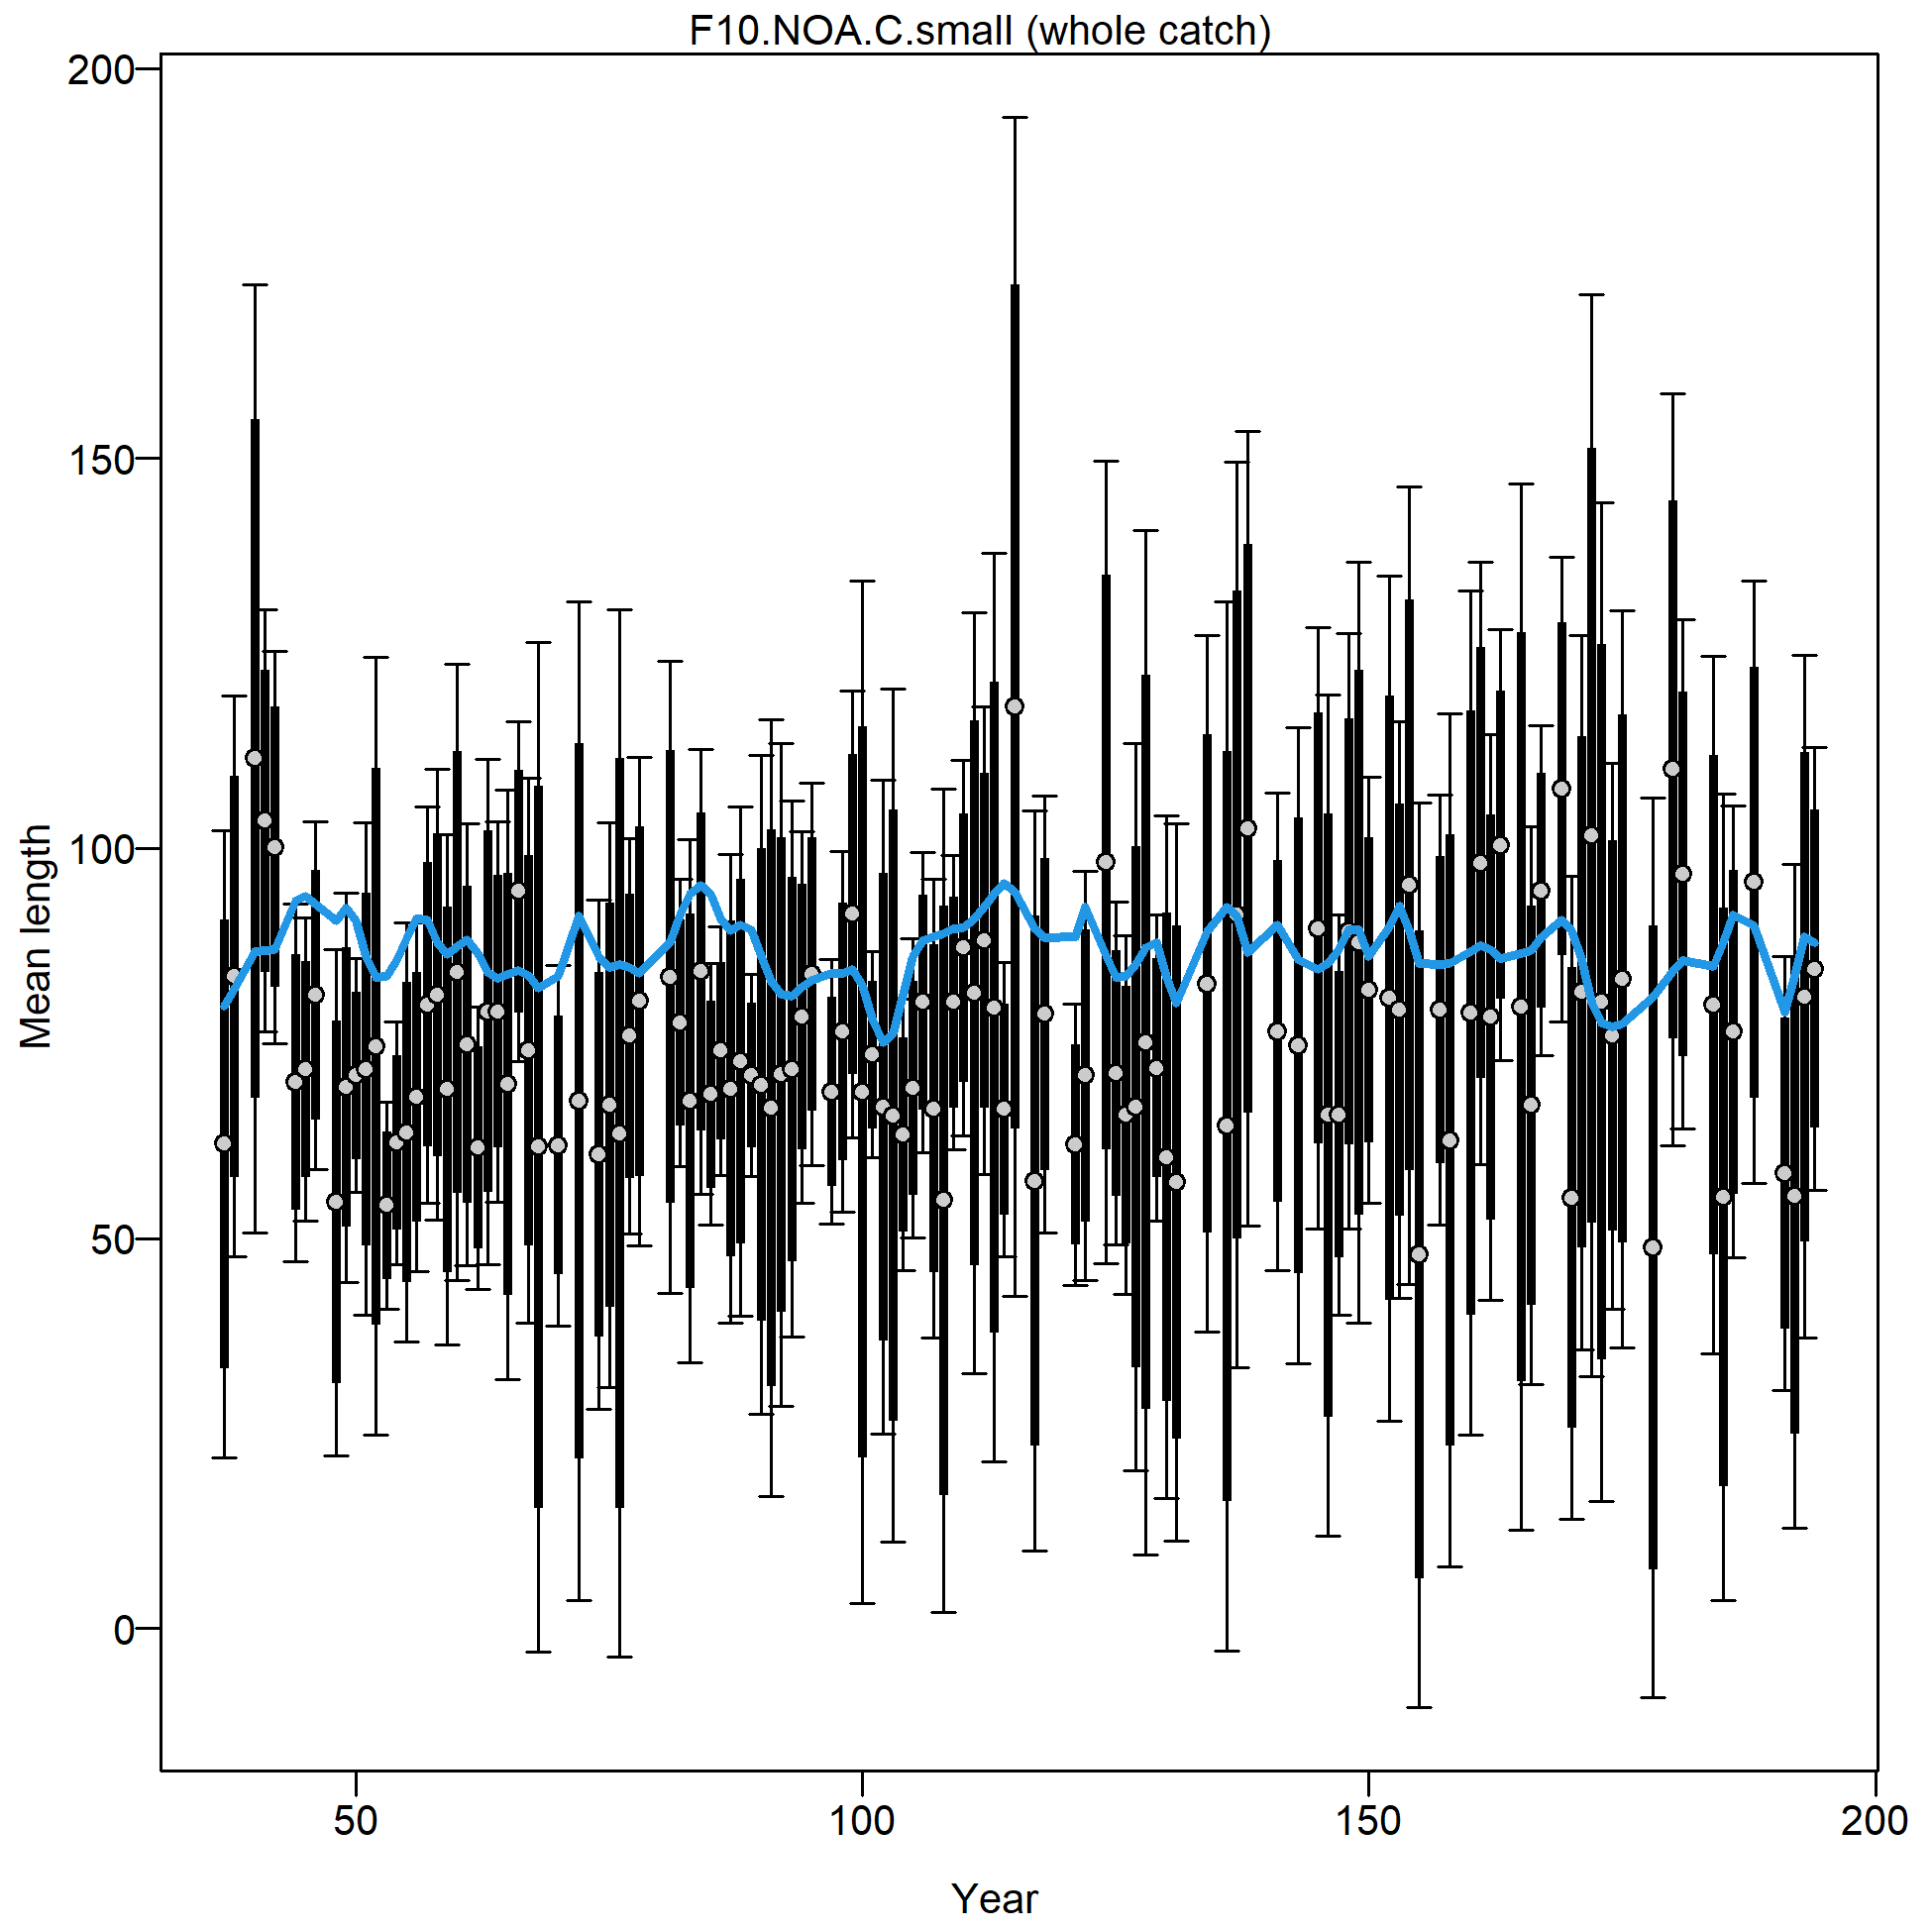
Mean length for F10.NOA.C.small with 95% confidence intervals based on current sample sizes.
Francis data weighting method TA1.8: thinner intervals (with capped ends) show result of further adjusting sample sizes based on suggested multiplier (with 95% interval) for len data from F10.NOA.C.small:
0.5128 (0.3915-0.723)
For more info, see Francis (2011).
file: comp_lenfit_data_weighting_TA1.8_F10.NOA.C.small.png
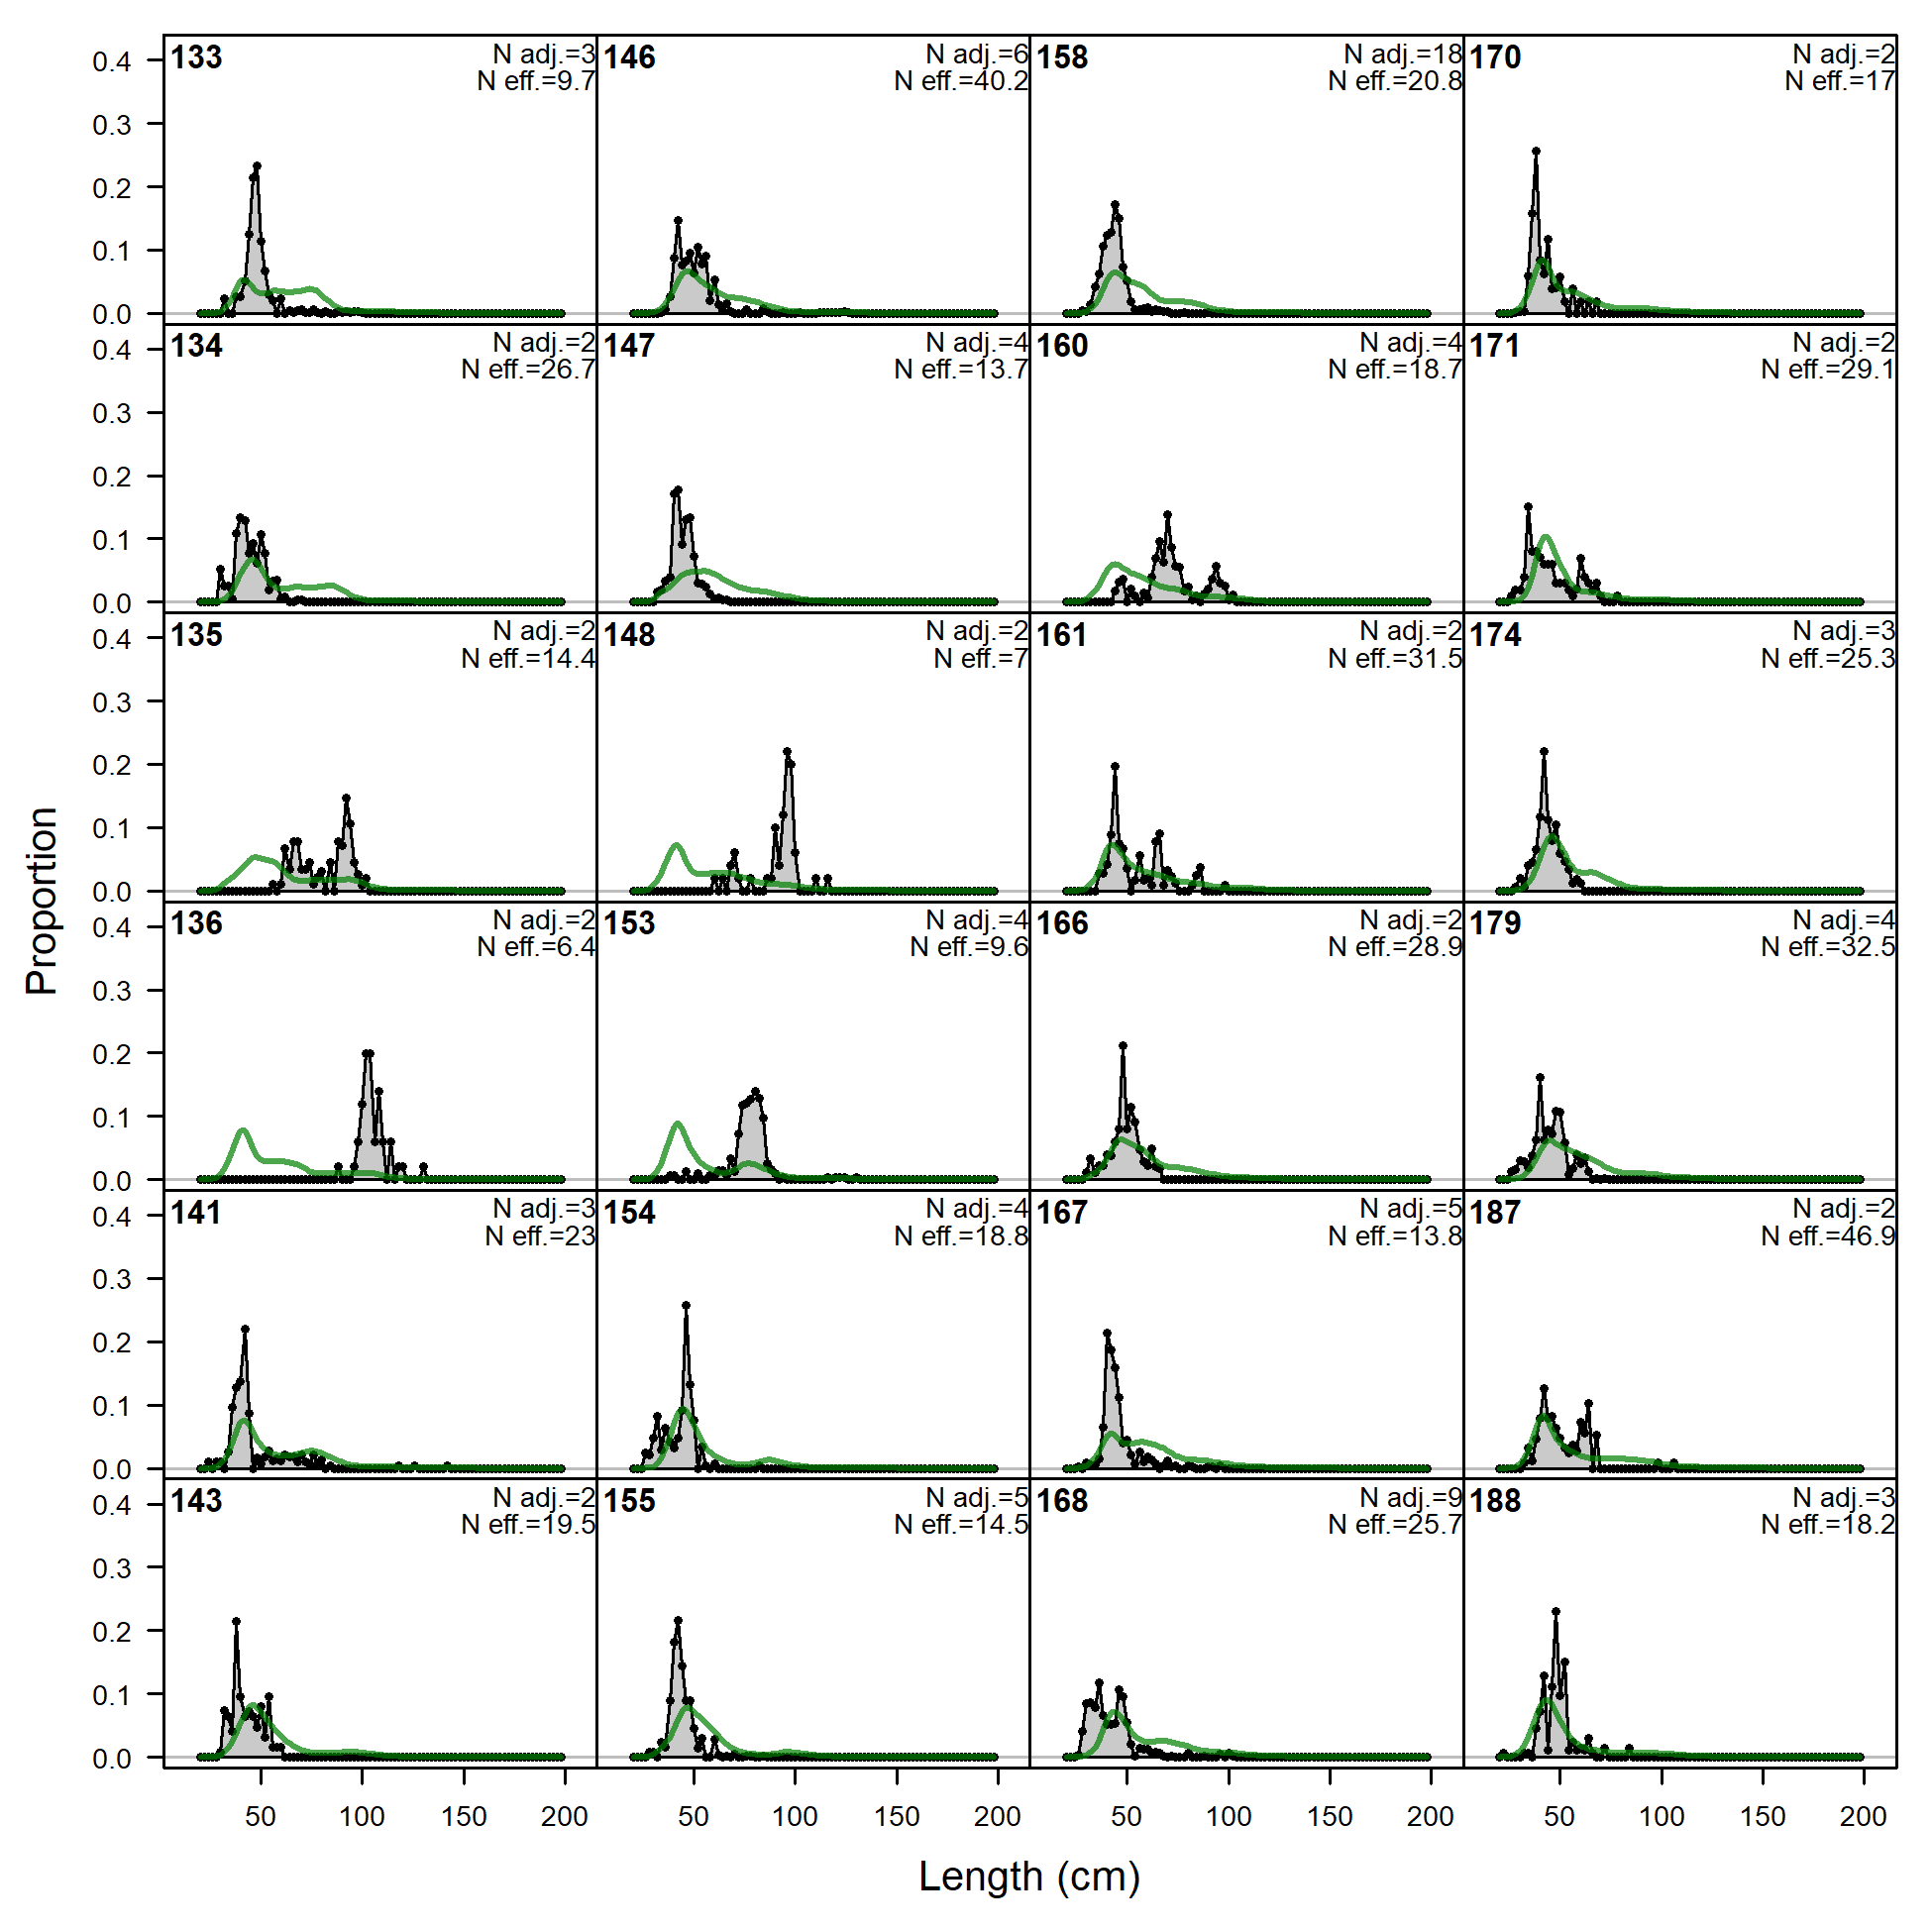
Length comps, whole catch, F11.NOA.N.small (plot 1 of 6).
'N adj.' is the input sample size after data-weighting adjustment. N eff. is the calculated effective sample size used in the McAllister-Ianelli tuning method.
file: comp_lenfit_flt11mkt0_page1.png
Length comps, whole catch, F11.NOA.N.small (plot 1 of 6).
'N adj.' is the input sample size after data-weighting adjustment. N eff. is the calculated effective sample size used in the McAllister-Ianelli tuning method. (plot 2 of 6)
file: comp_lenfit_flt11mkt0_page2.png
Length comps, whole catch, F11.NOA.N.small (plot 1 of 6).
'N adj.' is the input sample size after data-weighting adjustment. N eff. is the calculated effective sample size used in the McAllister-Ianelli tuning method. (plot 2 of 6) (plot 3 of 6)
file: comp_lenfit_flt11mkt0_page3.png
Length comps, whole catch, F11.NOA.N.small (plot 1 of 6).
'N adj.' is the input sample size after data-weighting adjustment. N eff. is the calculated effective sample size used in the McAllister-Ianelli tuning method. (plot 2 of 6) (plot 3 of 6) (plot 4 of 6)
file: comp_lenfit_flt11mkt0_page4.png
Length comps, whole catch, F11.NOA.N.small (plot 1 of 6).
'N adj.' is the input sample size after data-weighting adjustment. N eff. is the calculated effective sample size used in the McAllister-Ianelli tuning method. (plot 2 of 6) (plot 3 of 6) (plot 4 of 6) (plot 5 of 6)
file: comp_lenfit_flt11mkt0_page5.png
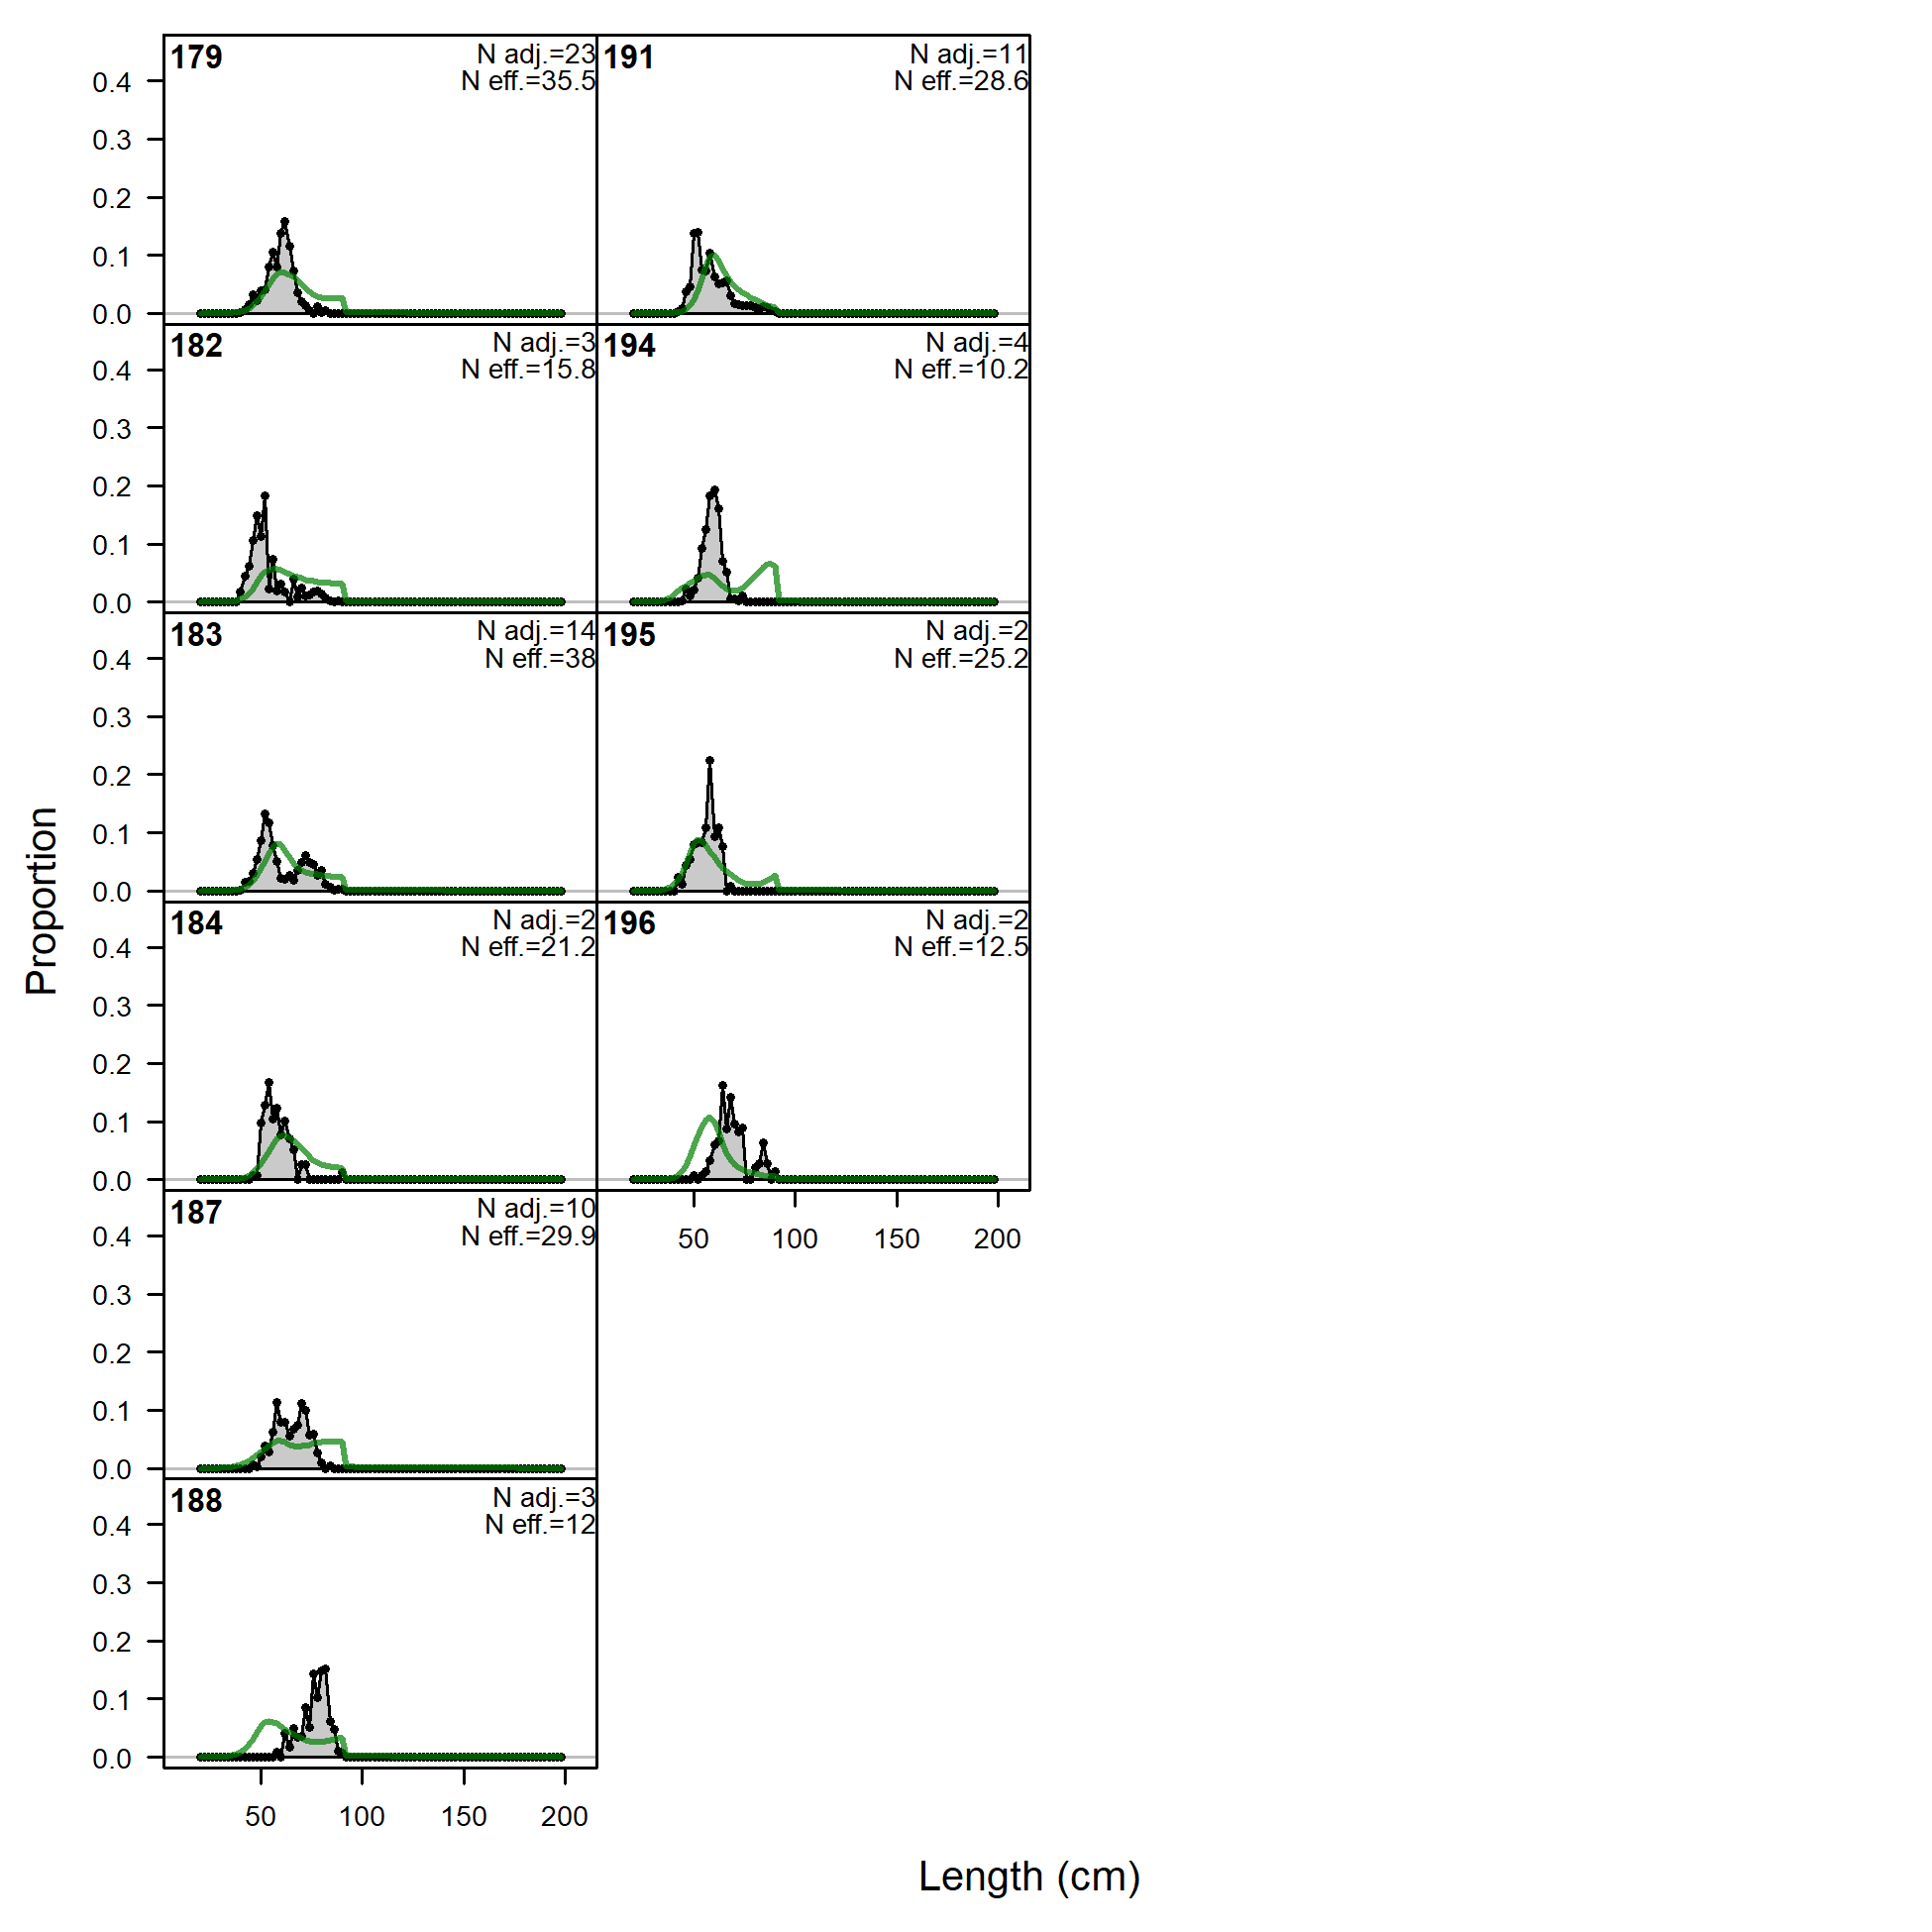
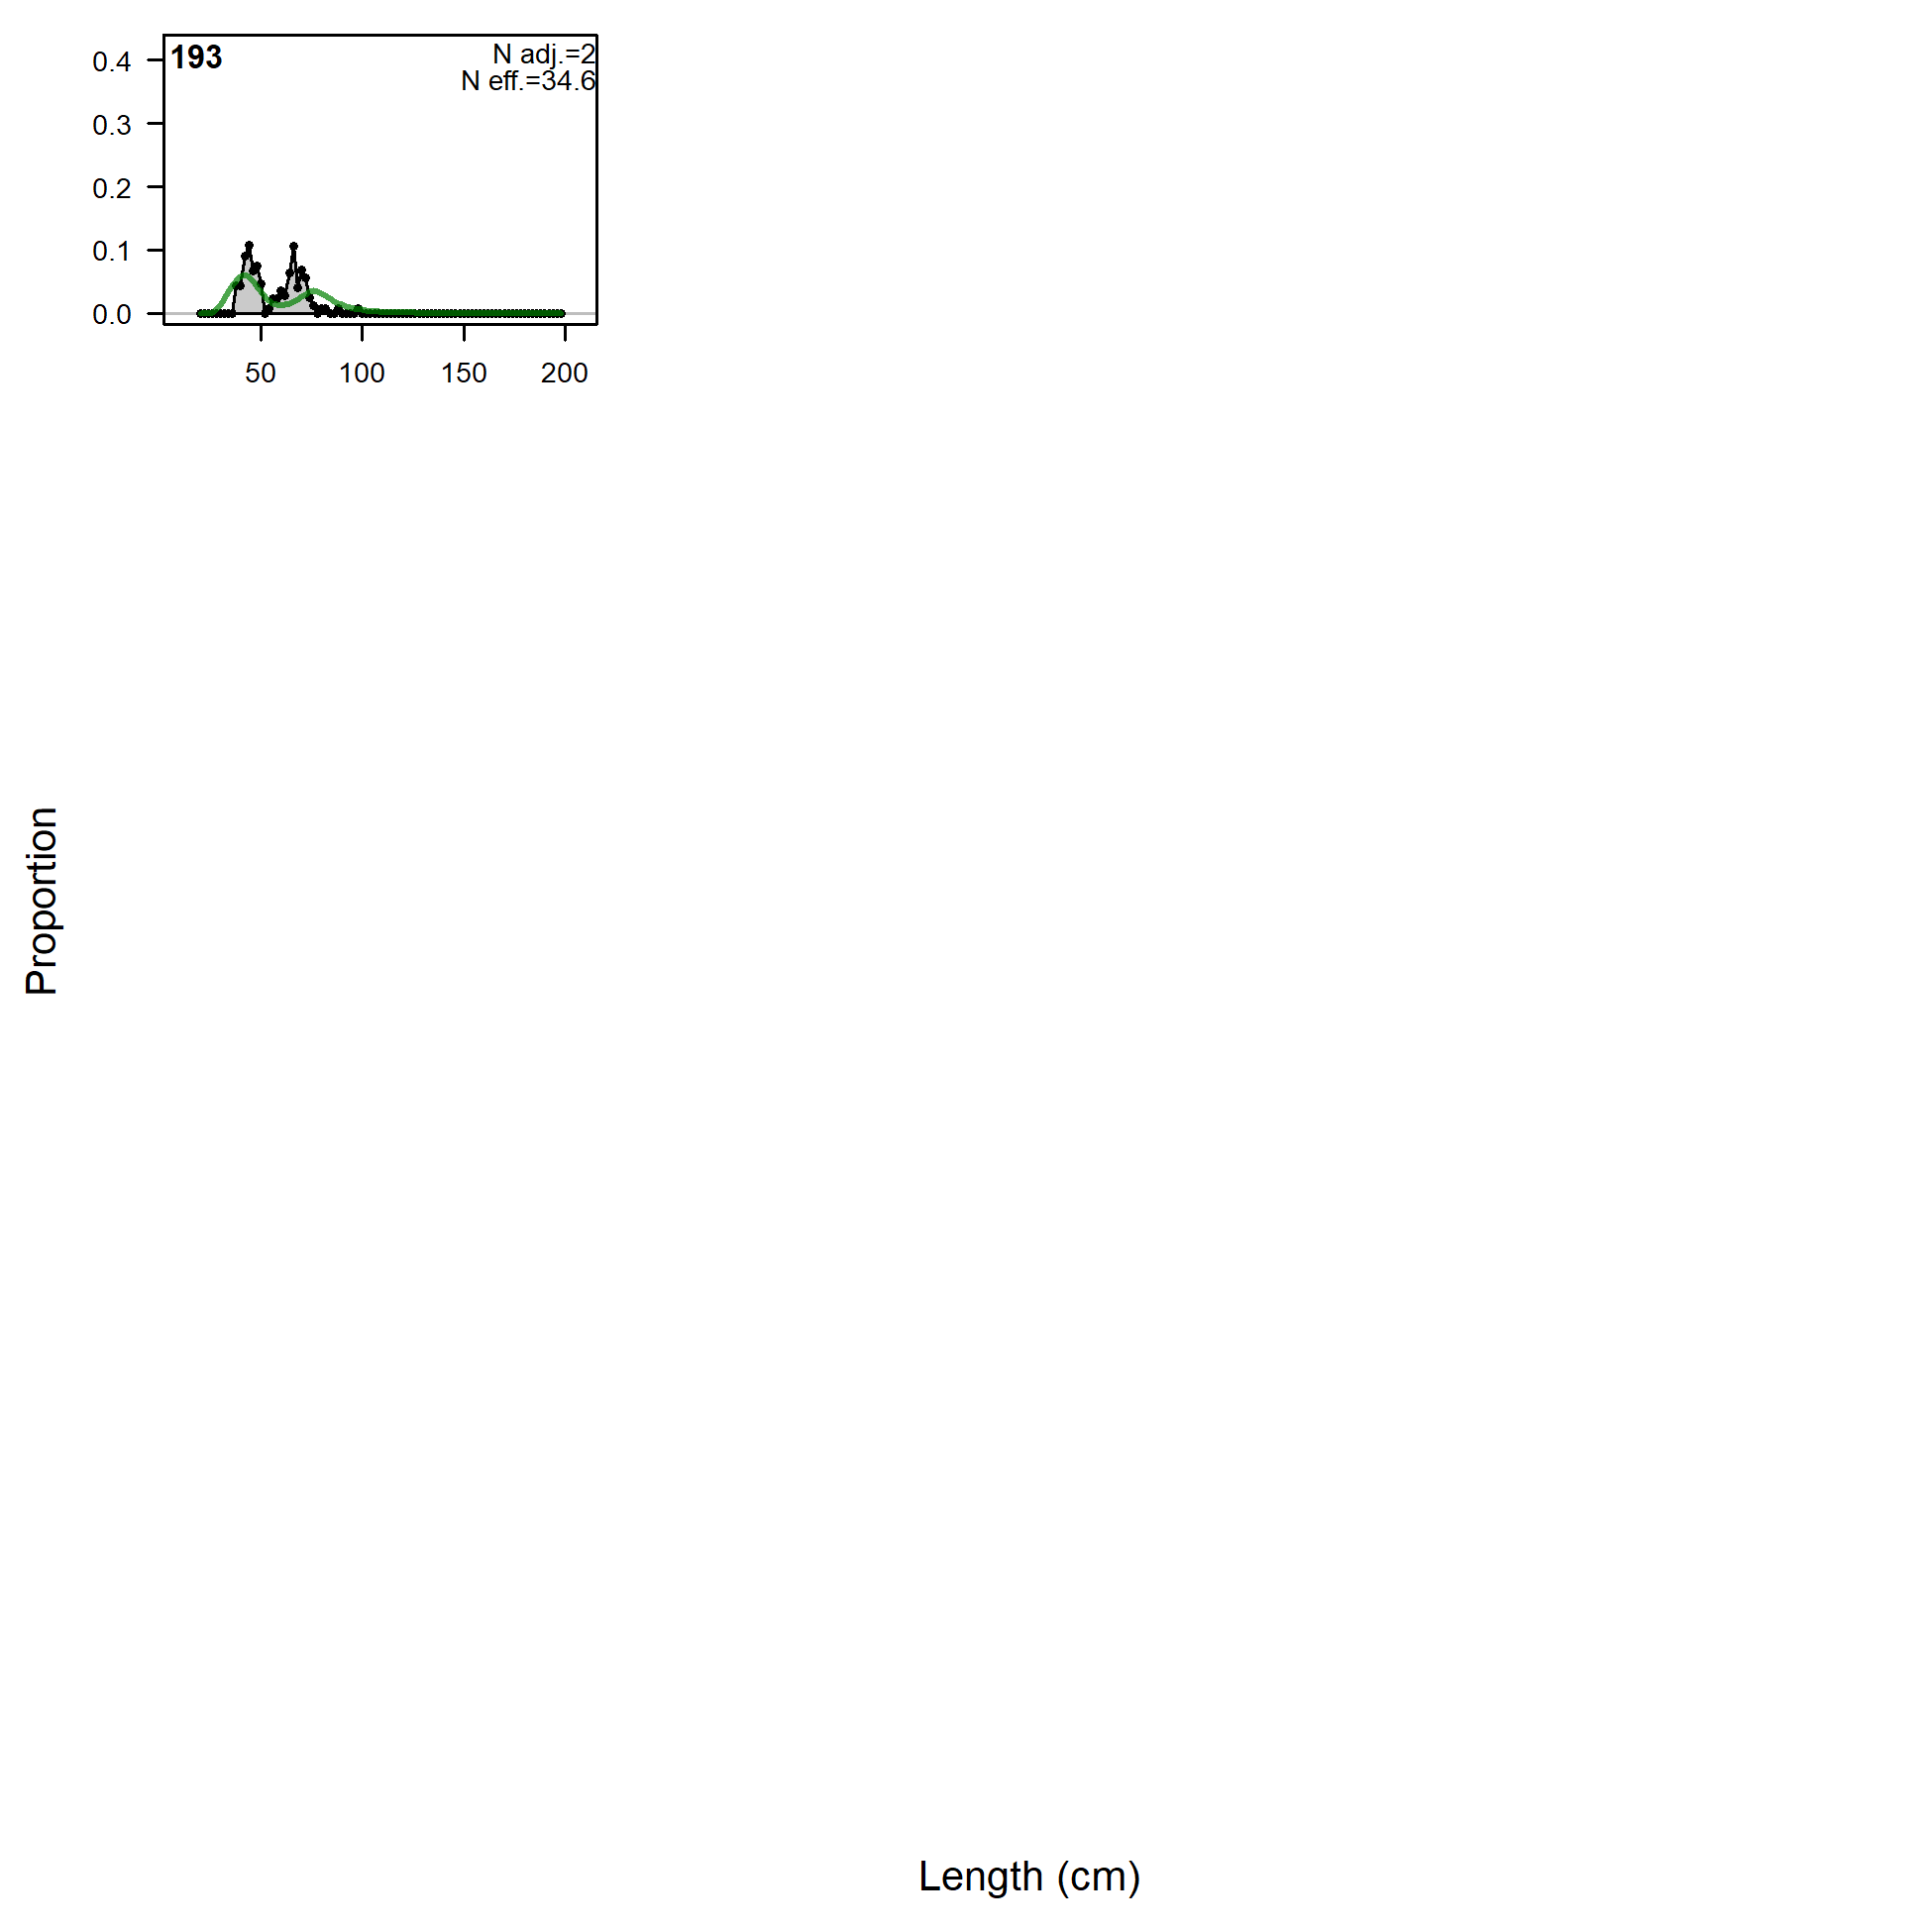
Length comps, whole catch, F11.NOA.N.small (plot 1 of 6).
'N adj.' is the input sample size after data-weighting adjustment. N eff. is the calculated effective sample size used in the McAllister-Ianelli tuning method. (plot 2 of 6) (plot 3 of 6) (plot 4 of 6) (plot 5 of 6) (plot 6 of 6)
file: comp_lenfit_flt11mkt0_page6.png
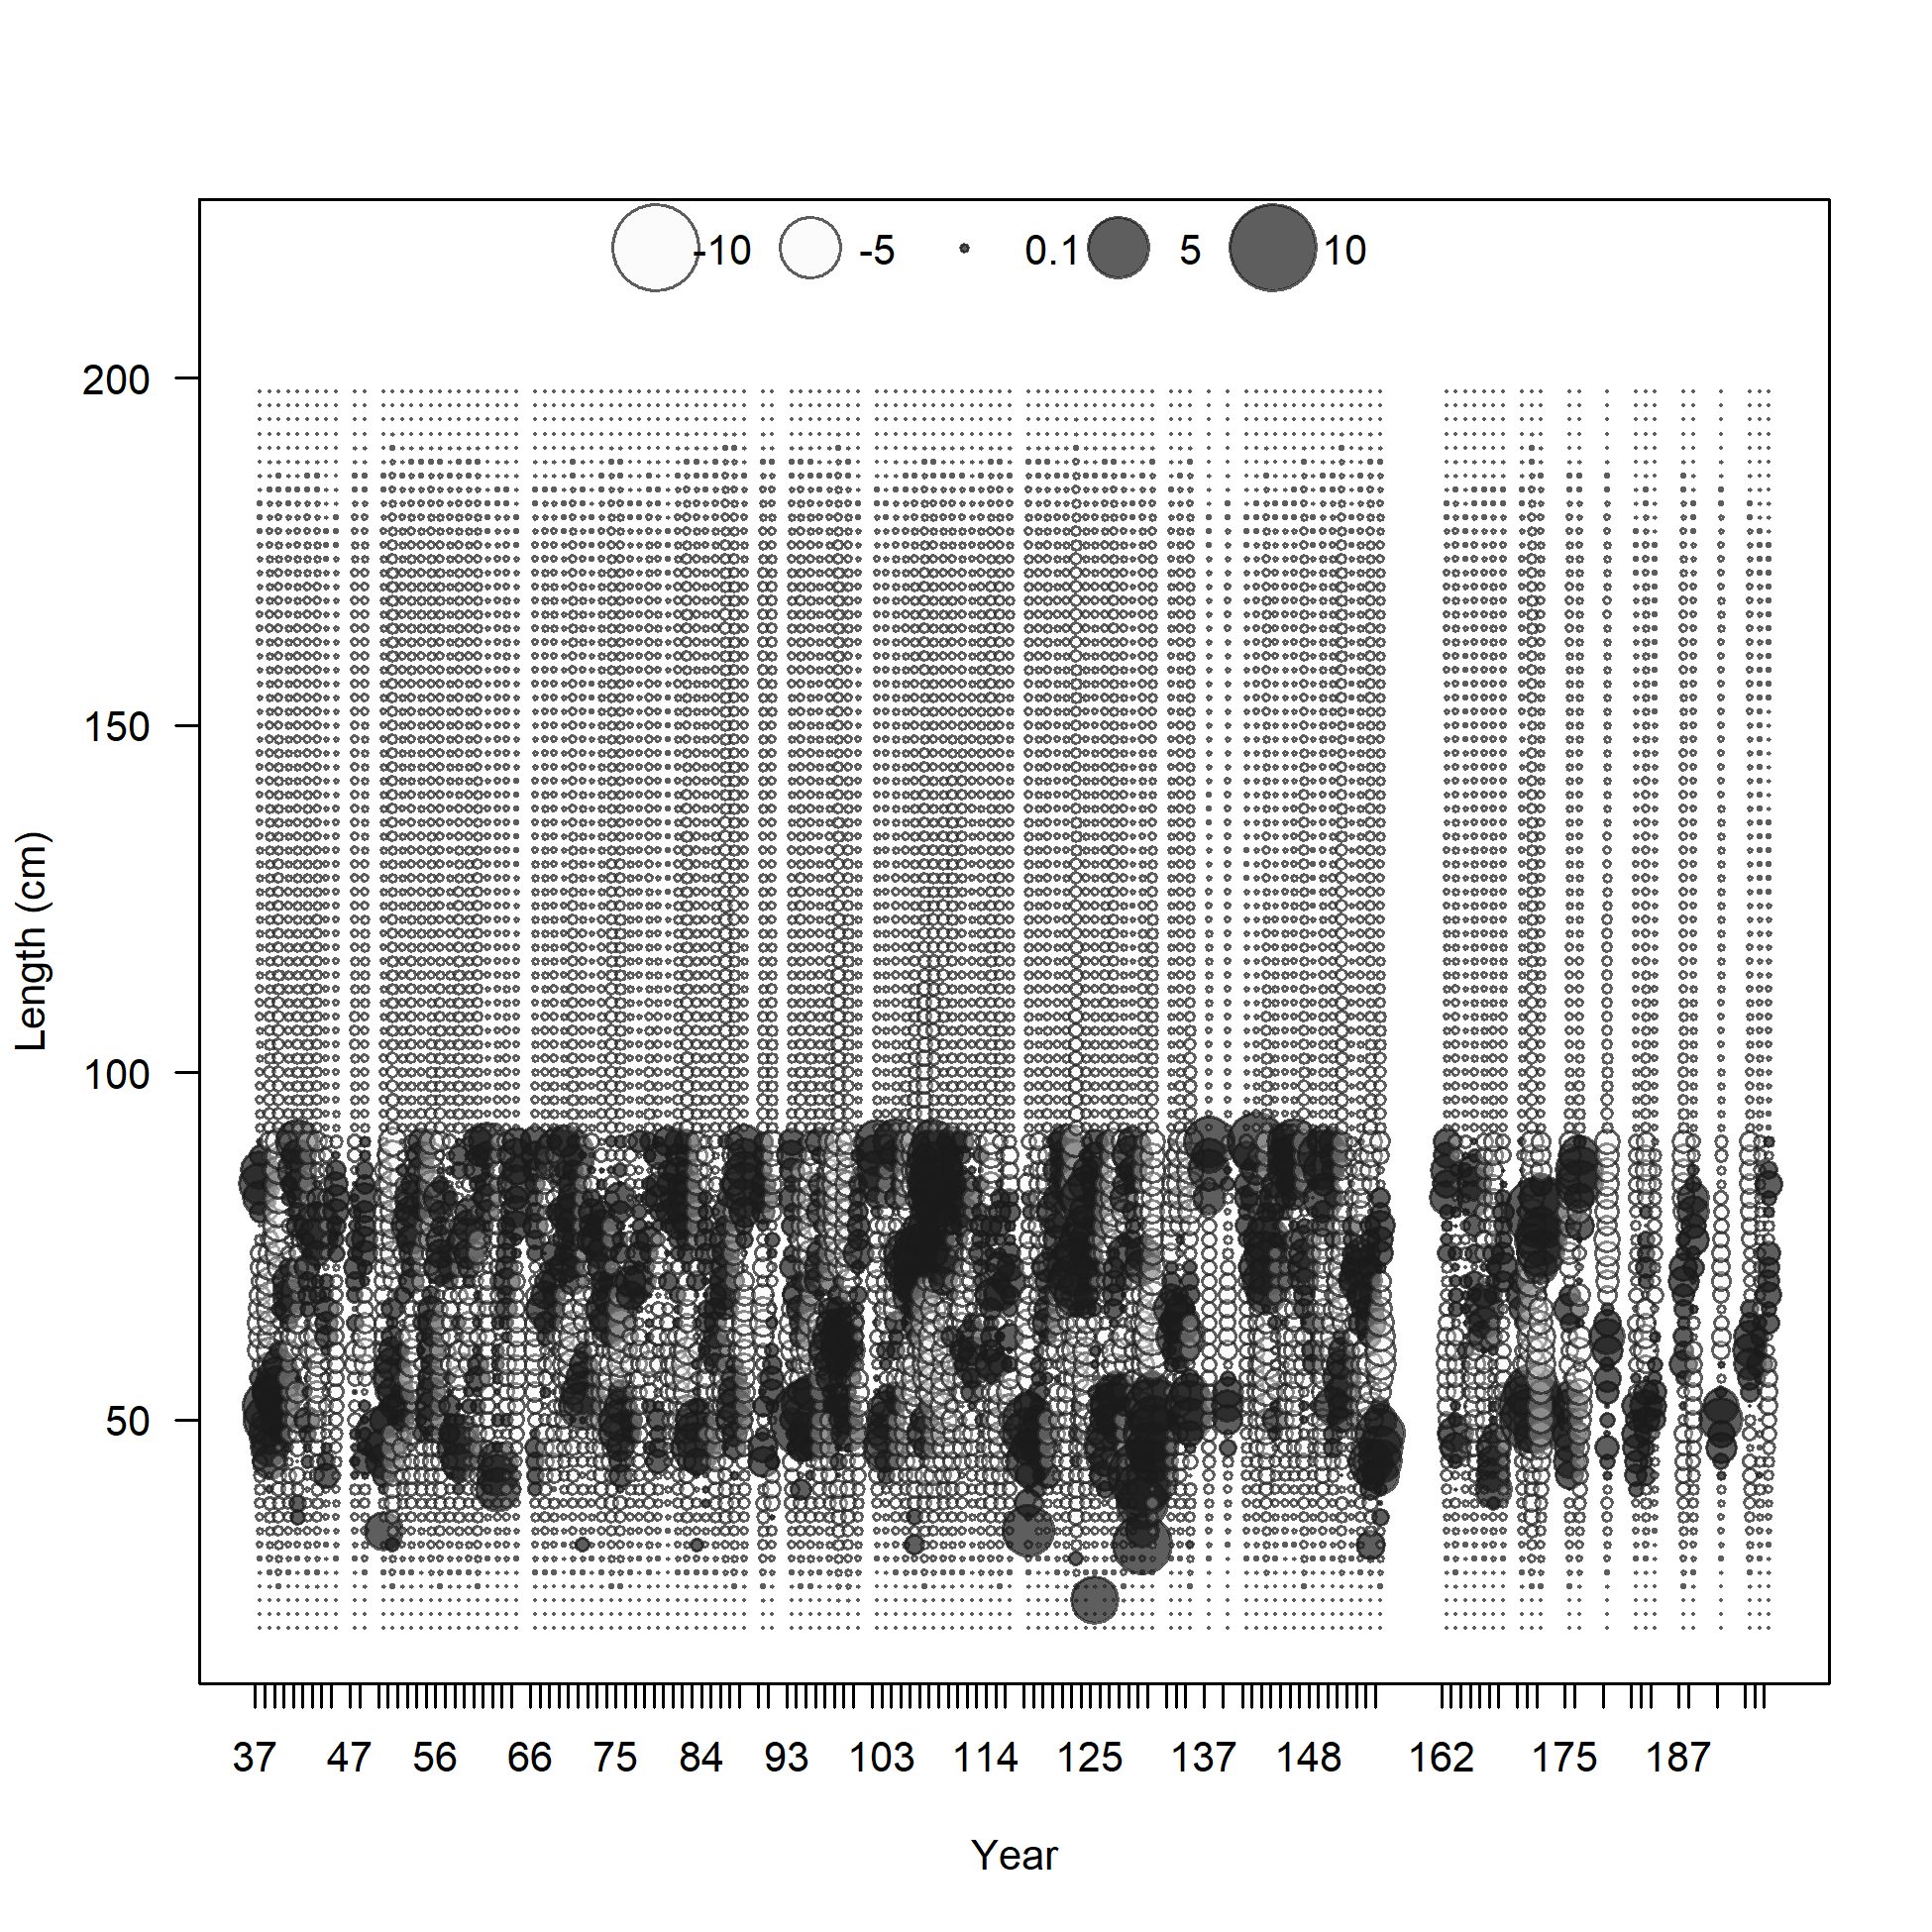
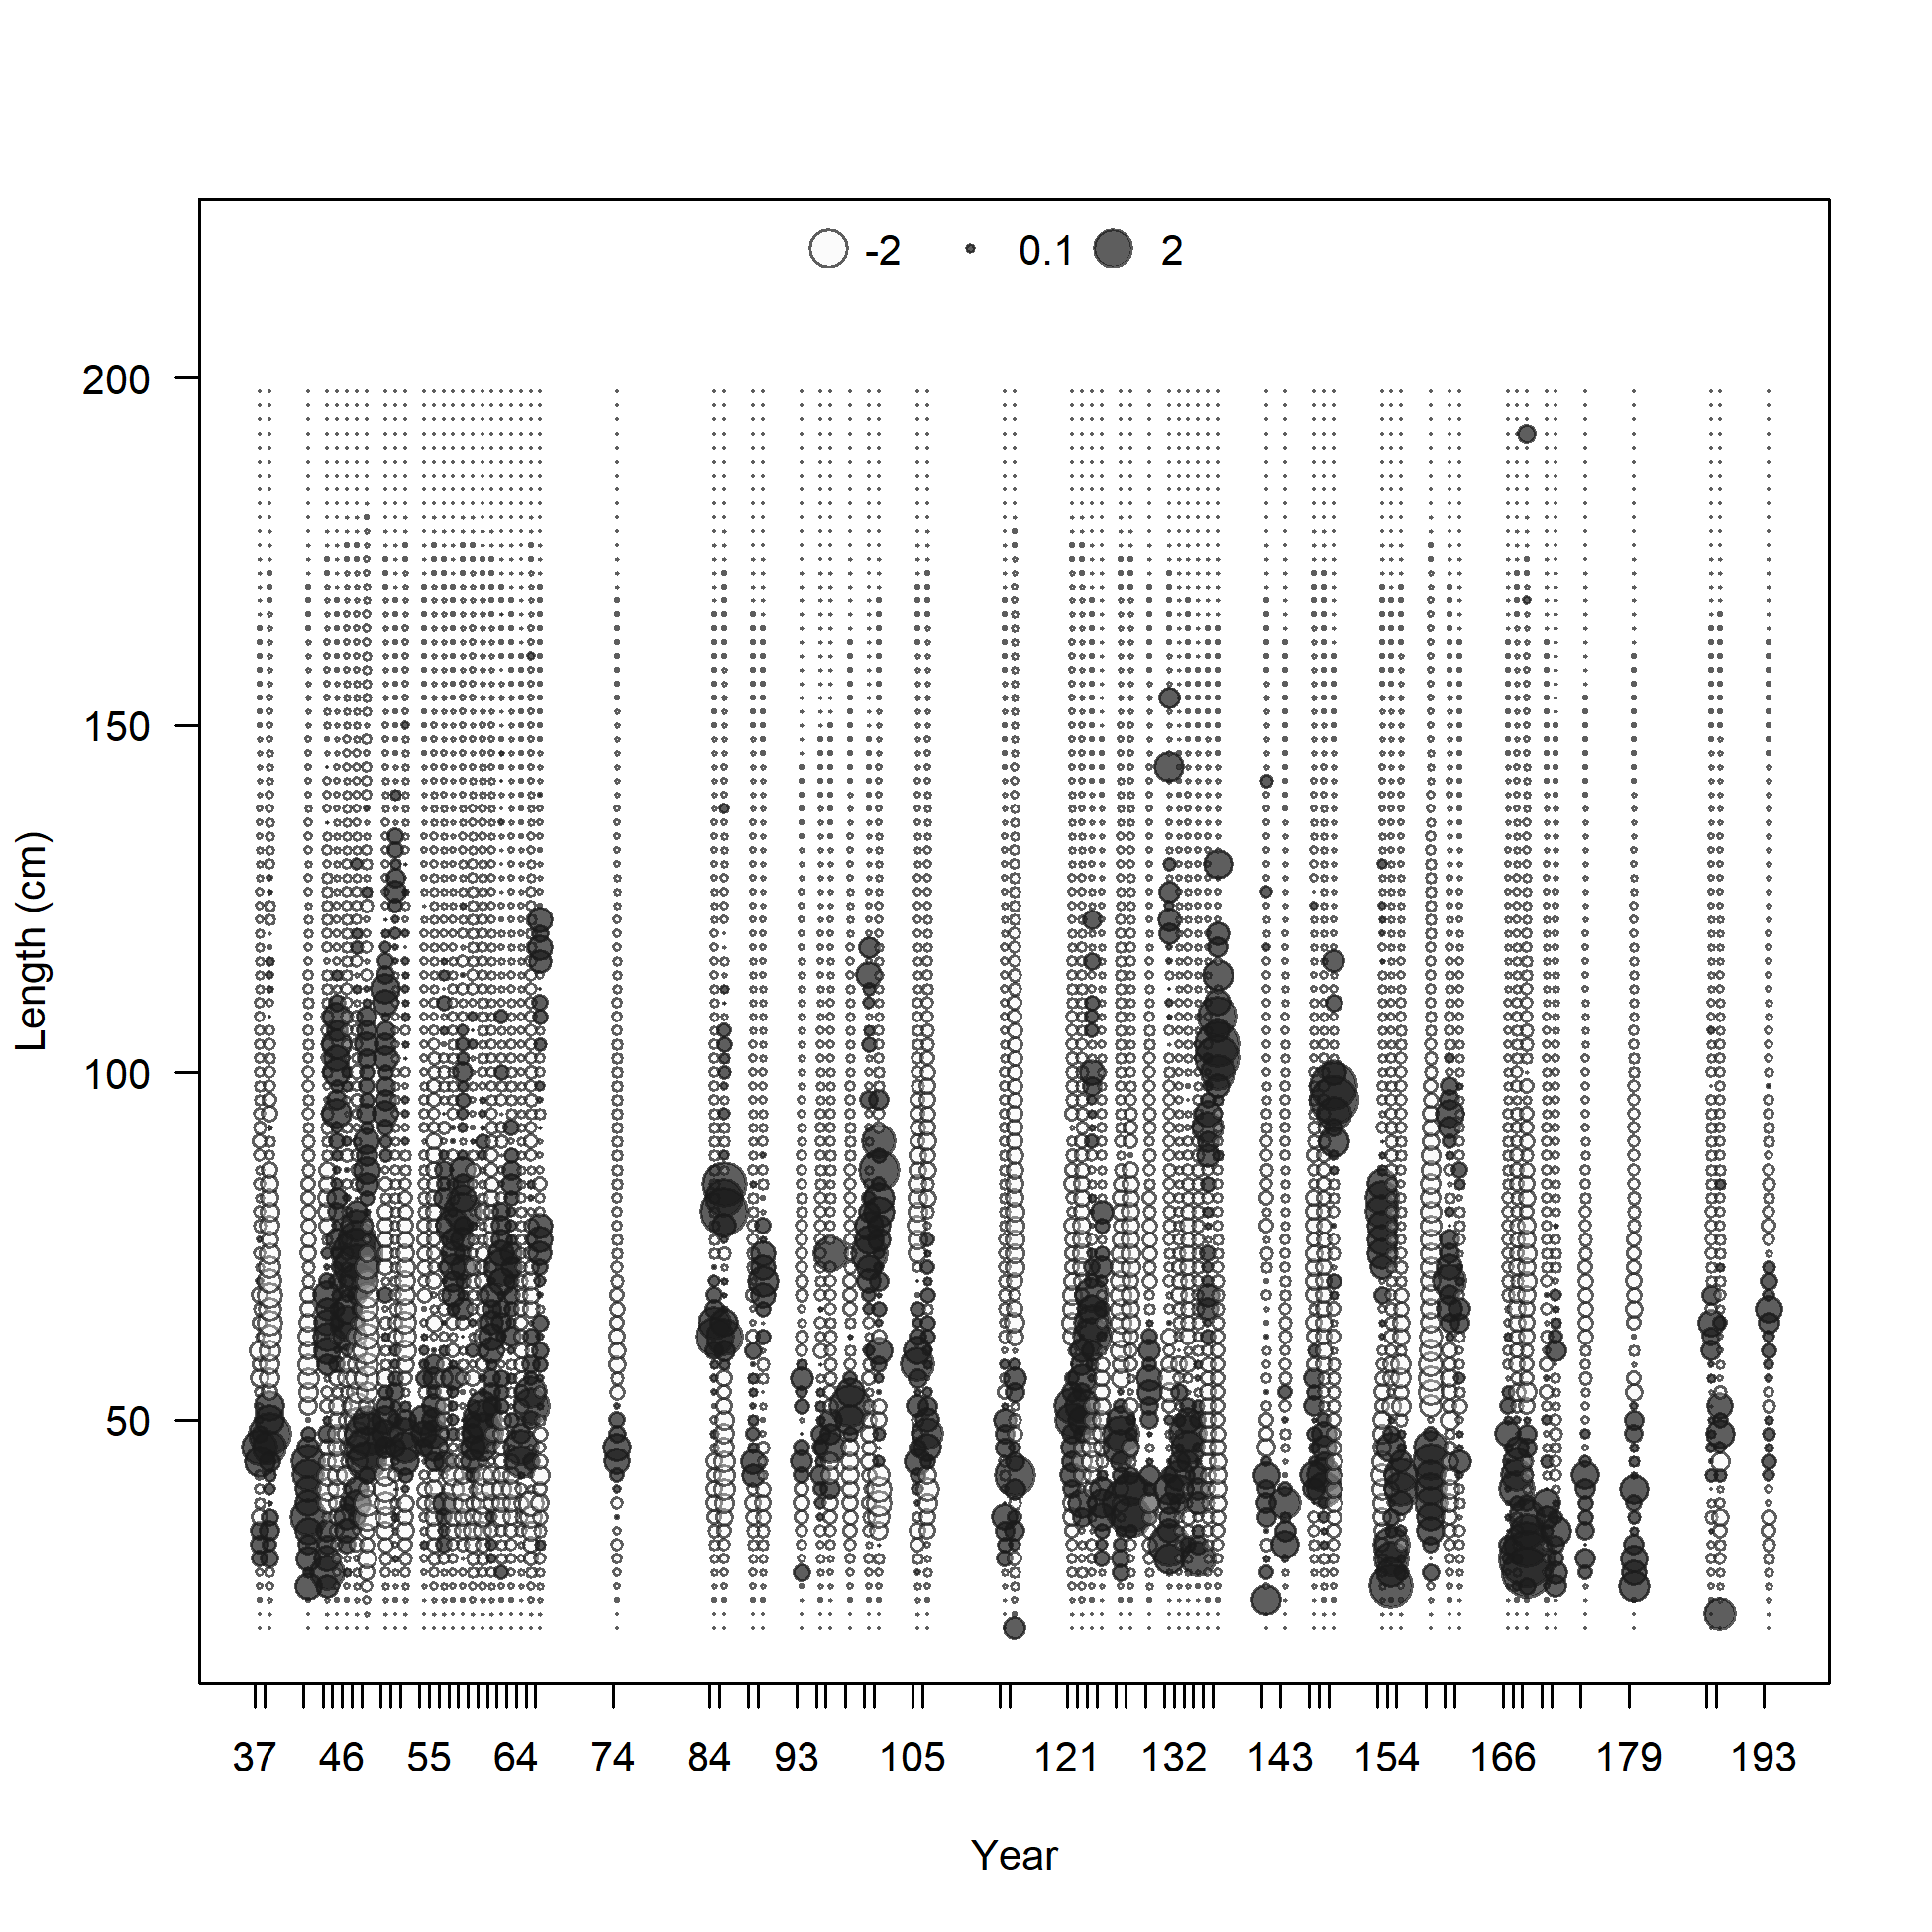
Pearson residuals, whole catch, F11.NOA.N.small (max=8.68) (plot 6 of 6)
Closed bubbles are positive residuals (observed > expected) and open bubbles are negative residuals (observed < expected).
file: comp_lenfit_residsflt11mkt0_page6.png
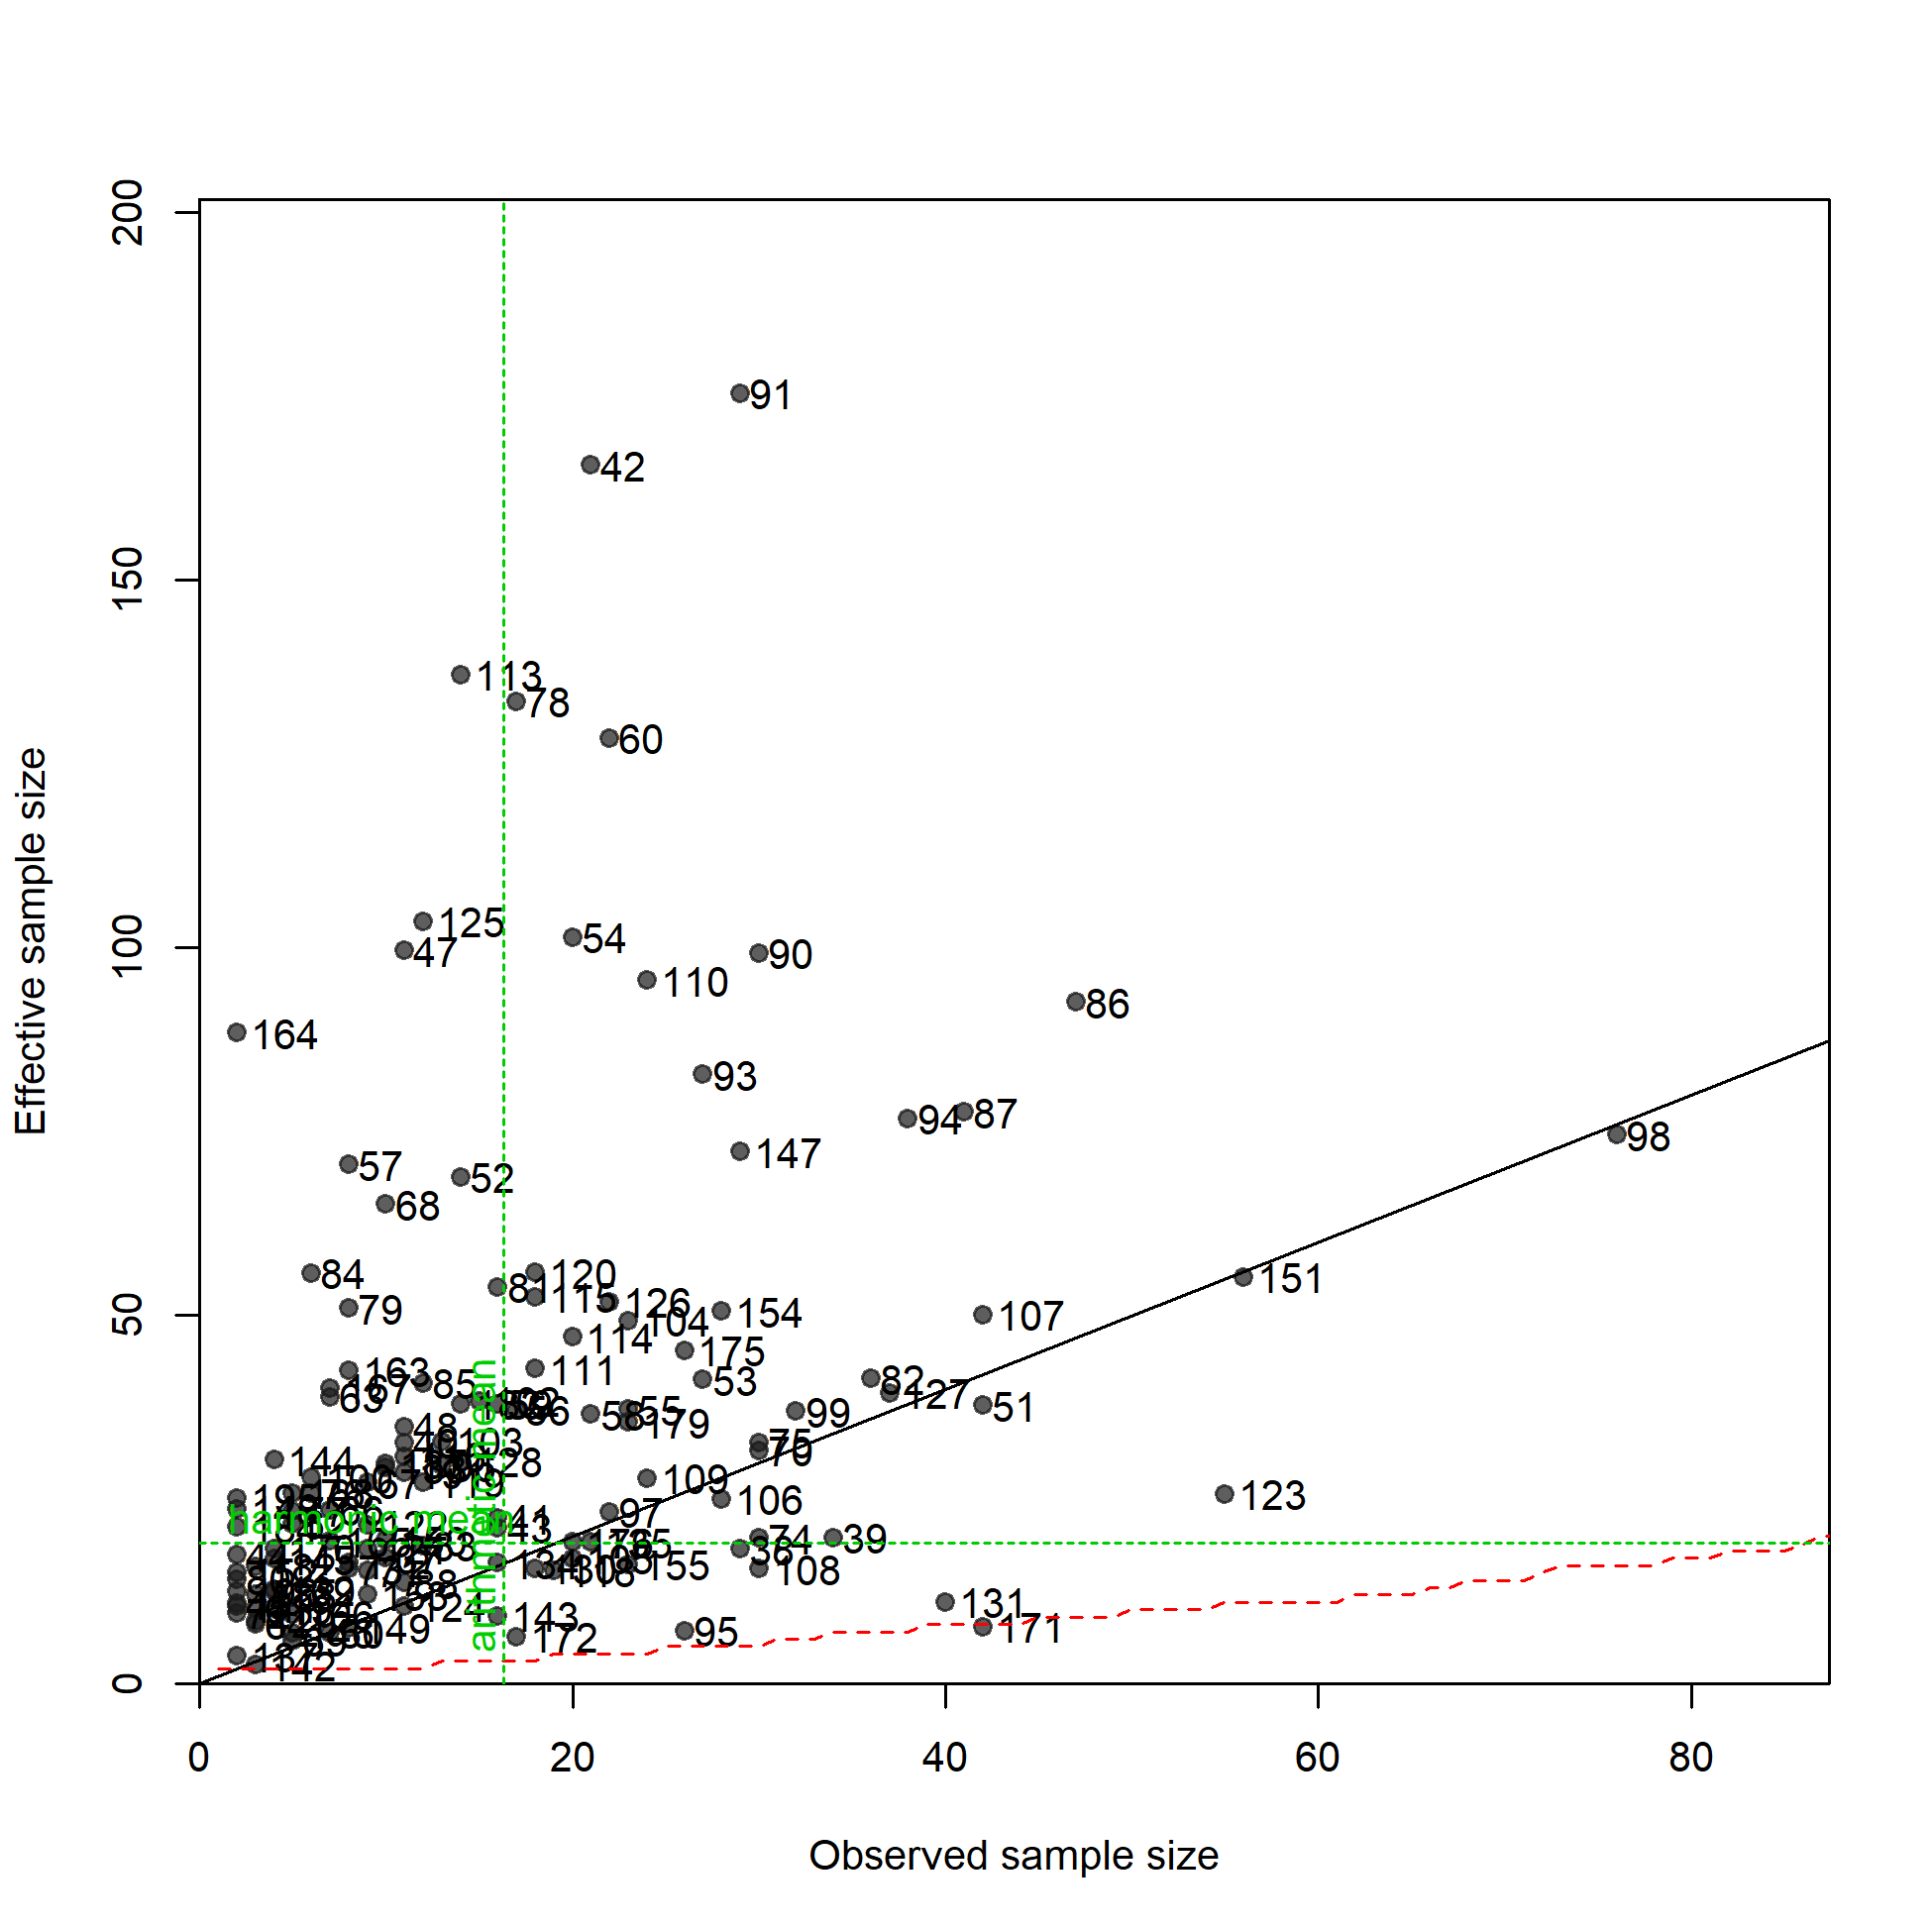
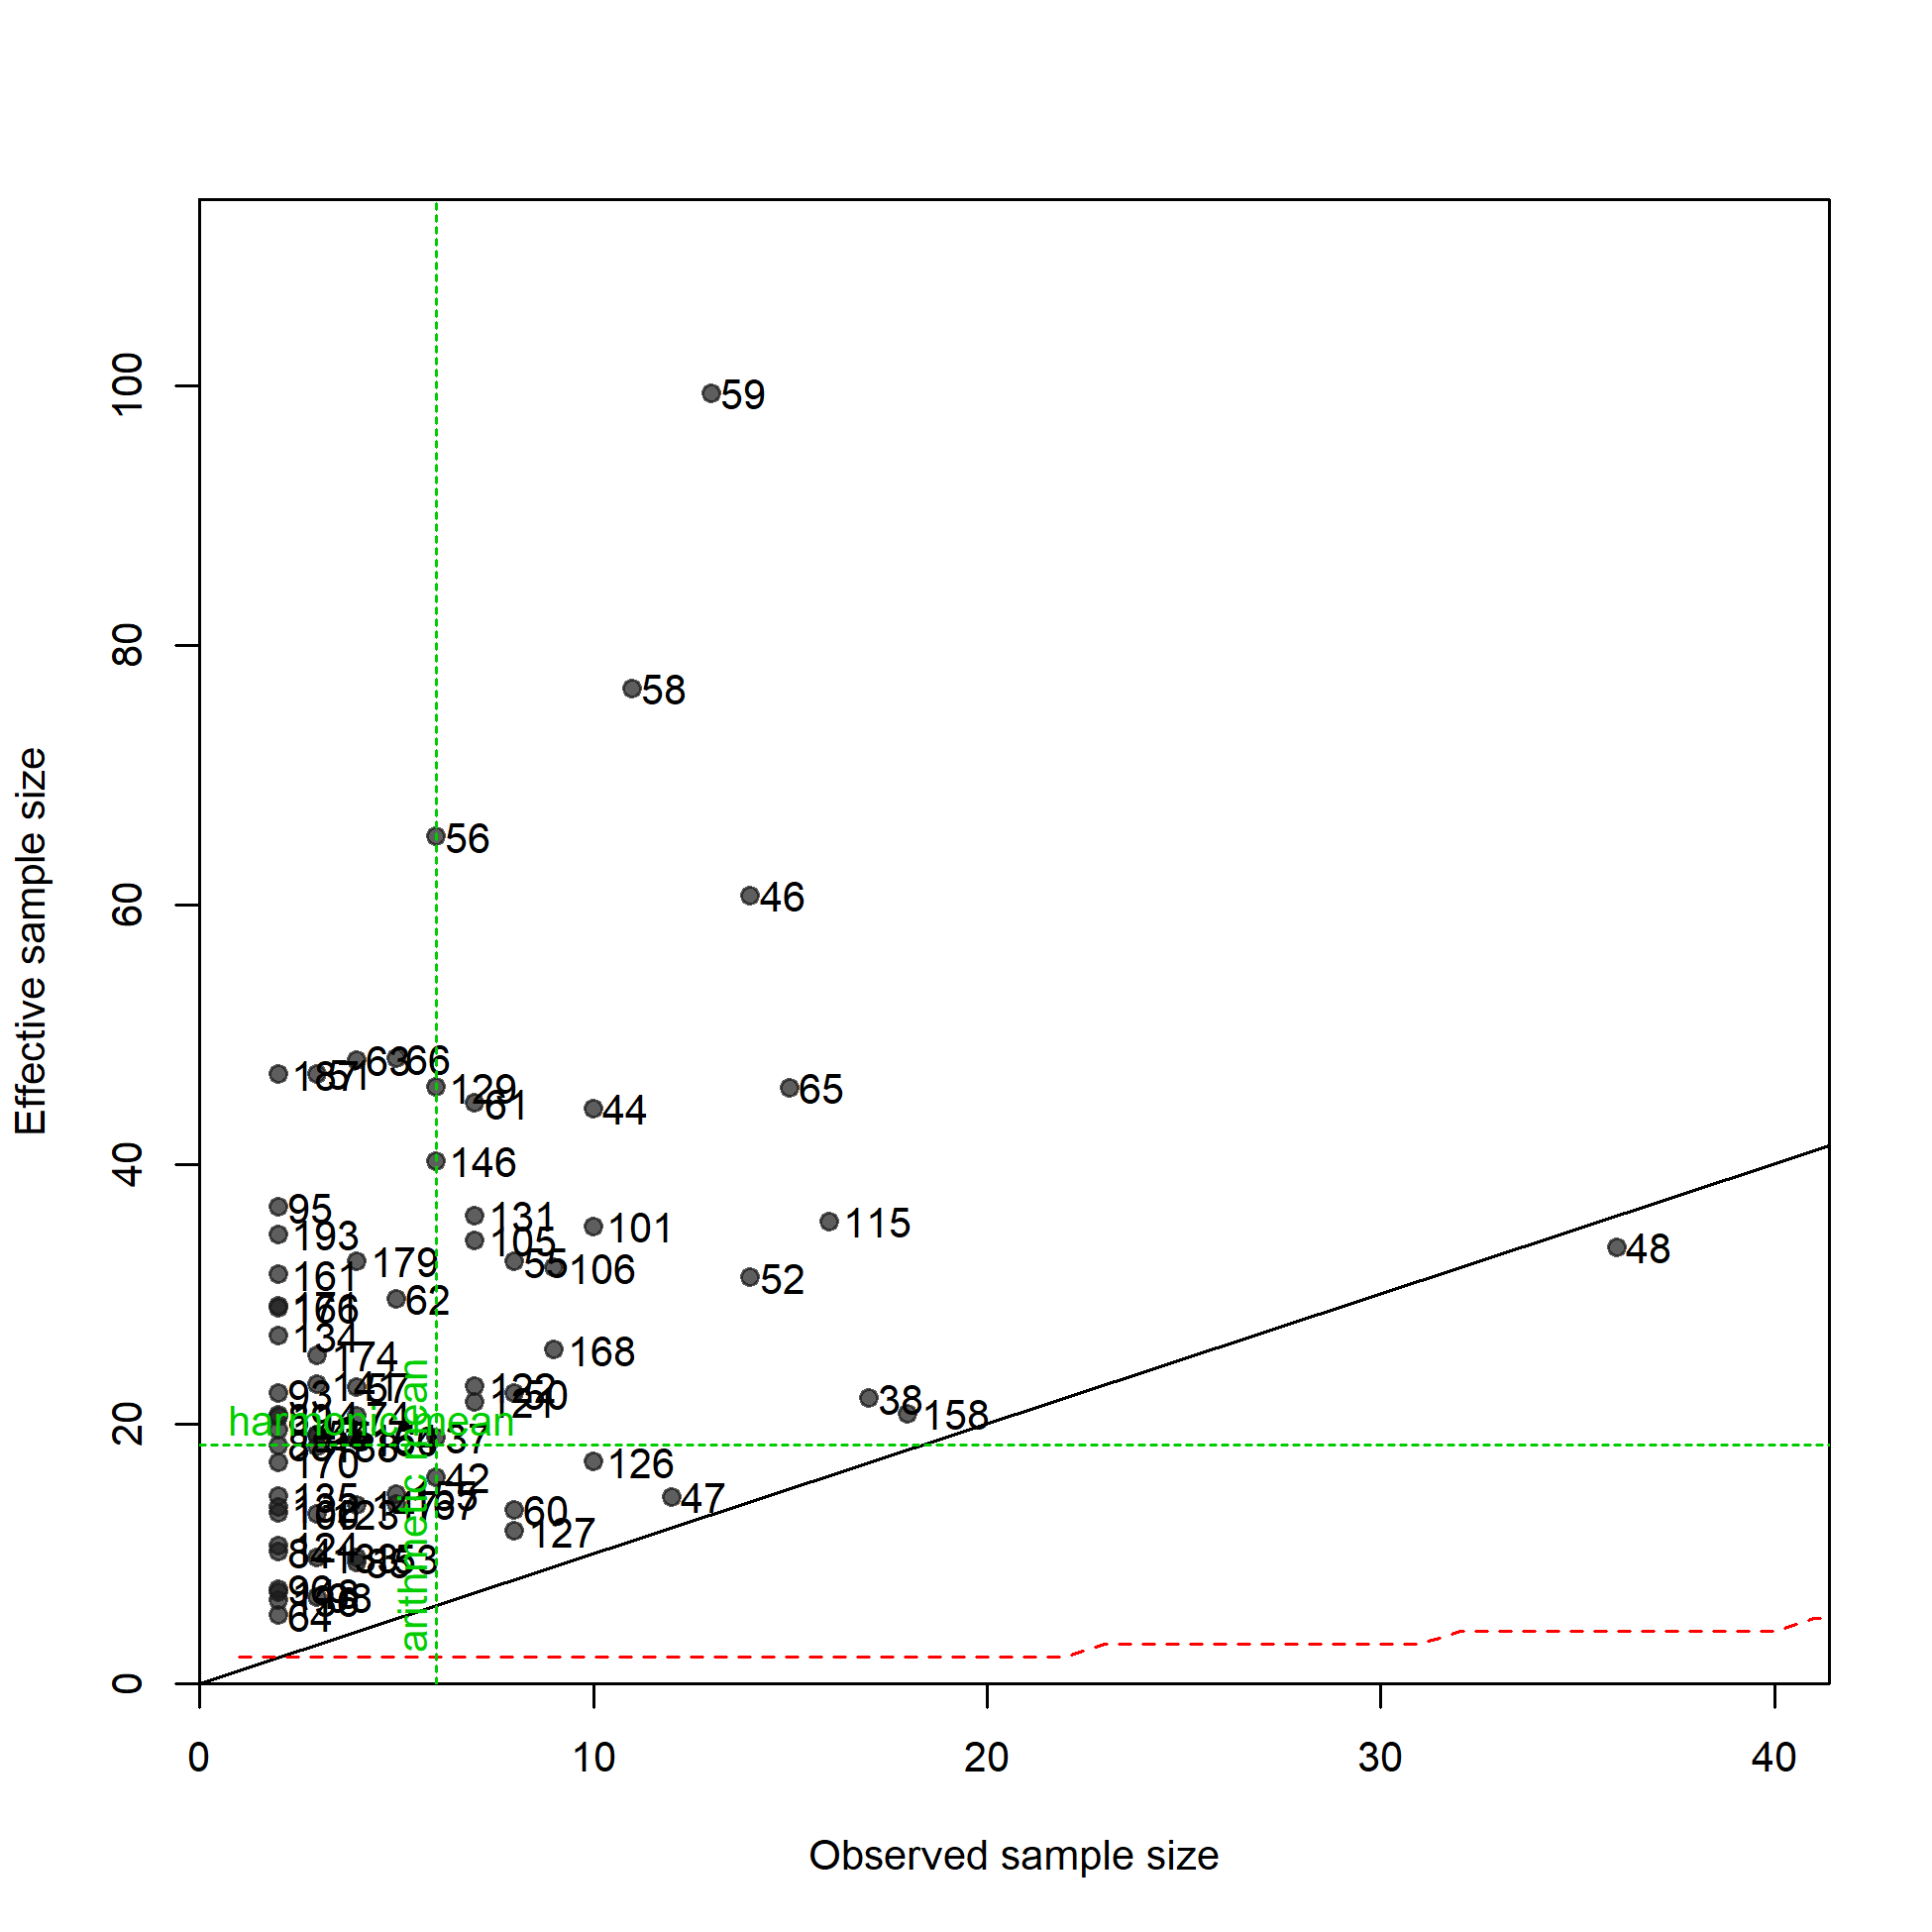
N-EffN comparison, Length comps, whole catch, F11.NOA.N.small
file: comp_lenfit_sampsize_flt11mkt0.png
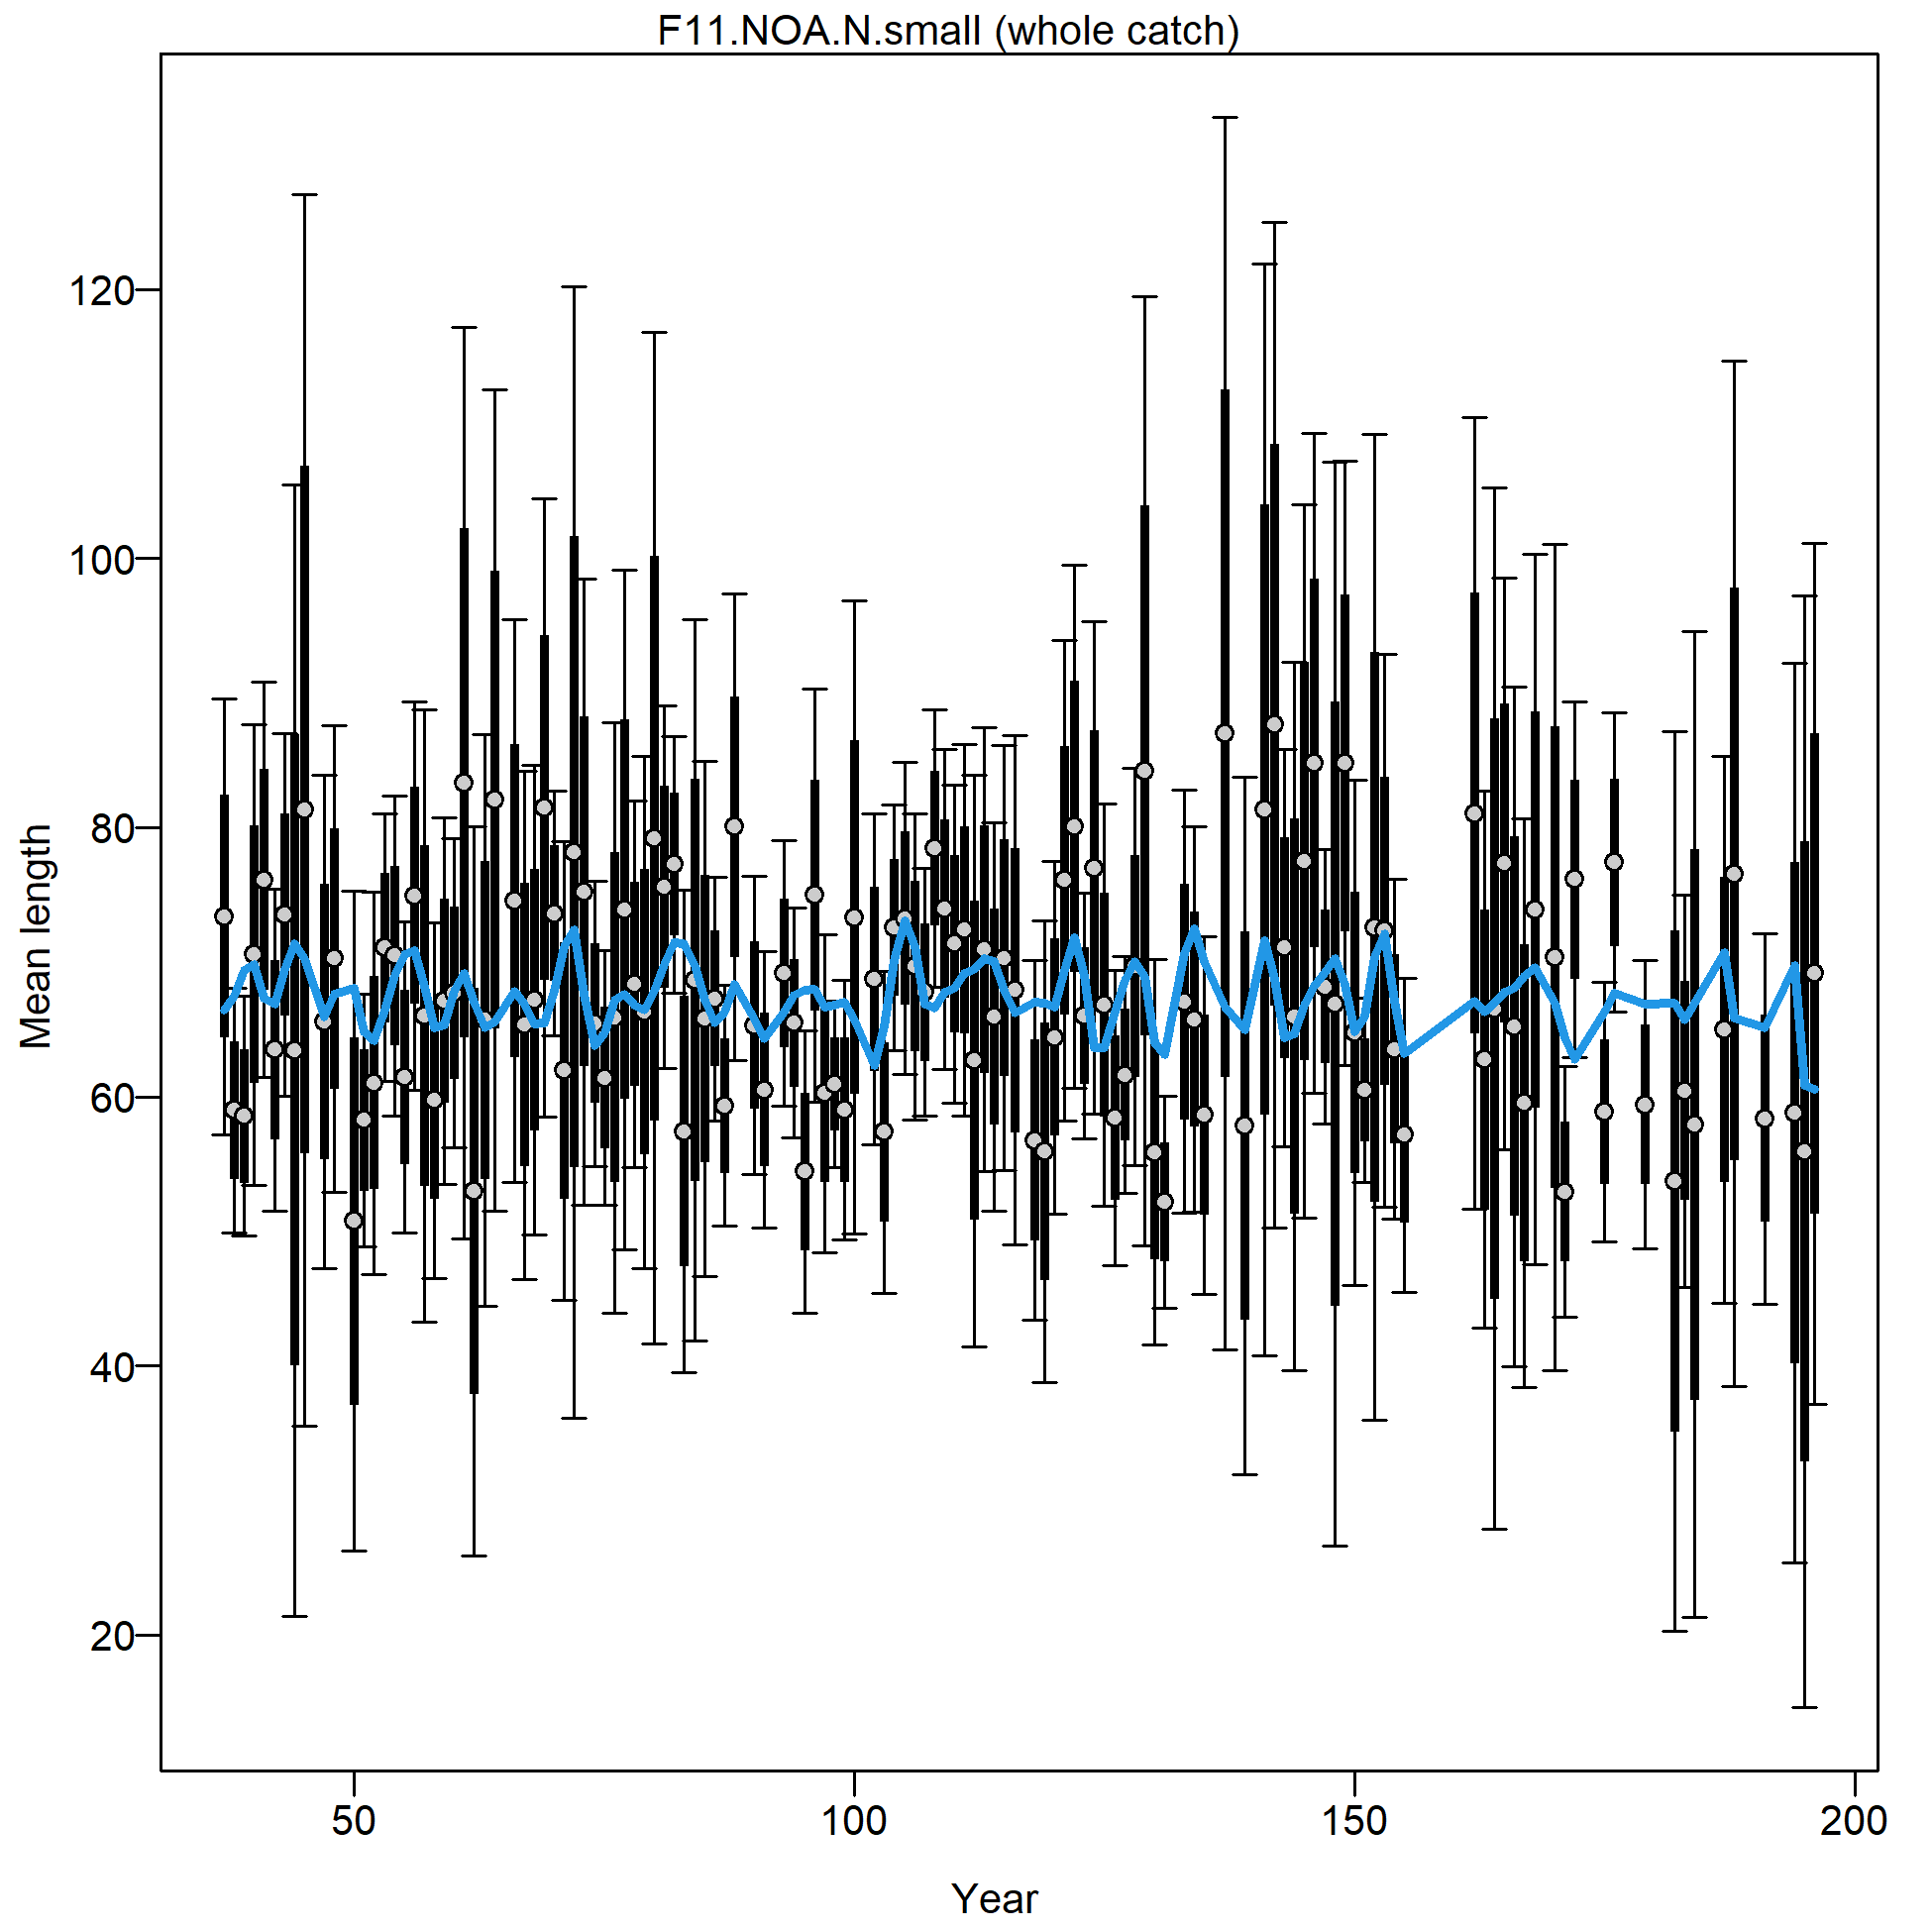
Mean length for F11.NOA.N.small with 95% confidence intervals based on current sample sizes.
Francis data weighting method TA1.8: thinner intervals (with capped ends) show result of further adjusting sample sizes based on suggested multiplier (with 95% interval) for len data from F11.NOA.N.small:
0.3113 (0.2508-0.4044)
For more info, see Francis (2011).
file: comp_lenfit_data_weighting_TA1.8_F11.NOA.N.small.png
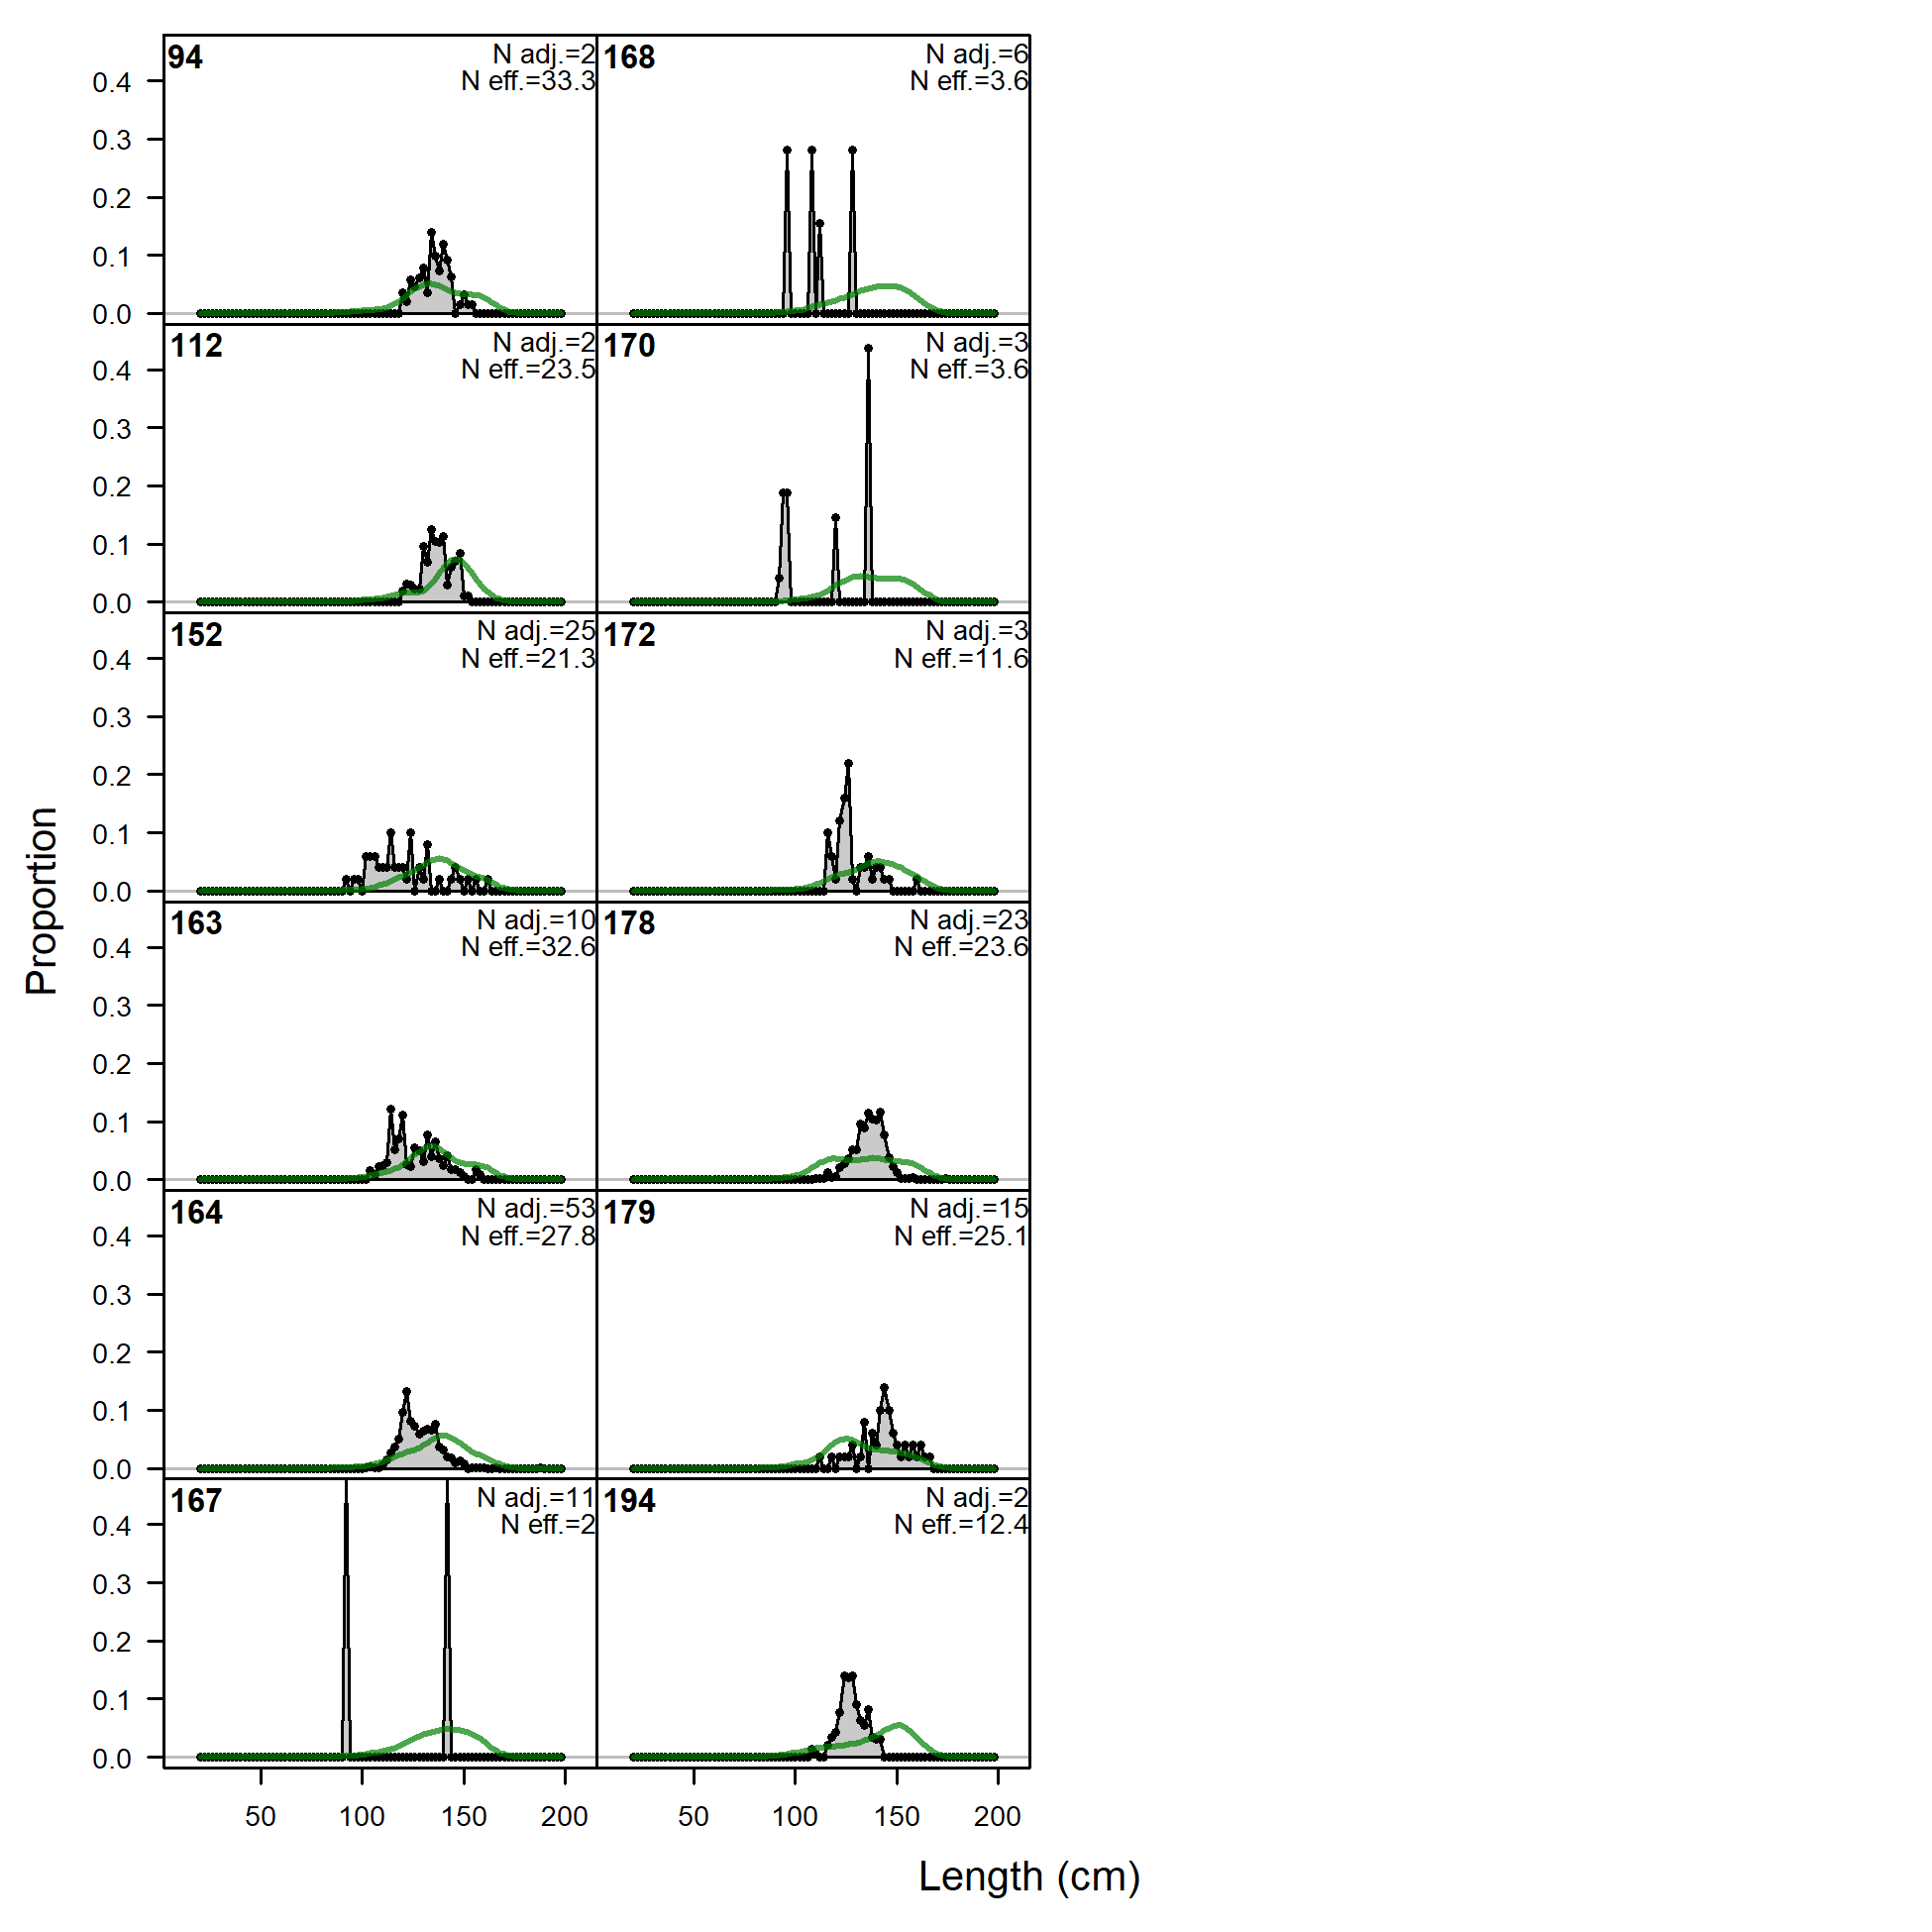
Length comps, whole catch, F12.NOA.W.large.
'N adj.' is the input sample size after data-weighting adjustment. N eff. is the calculated effective sample size used in the McAllister-Ianelli tuning method.
file: comp_lenfit_flt12mkt0.png
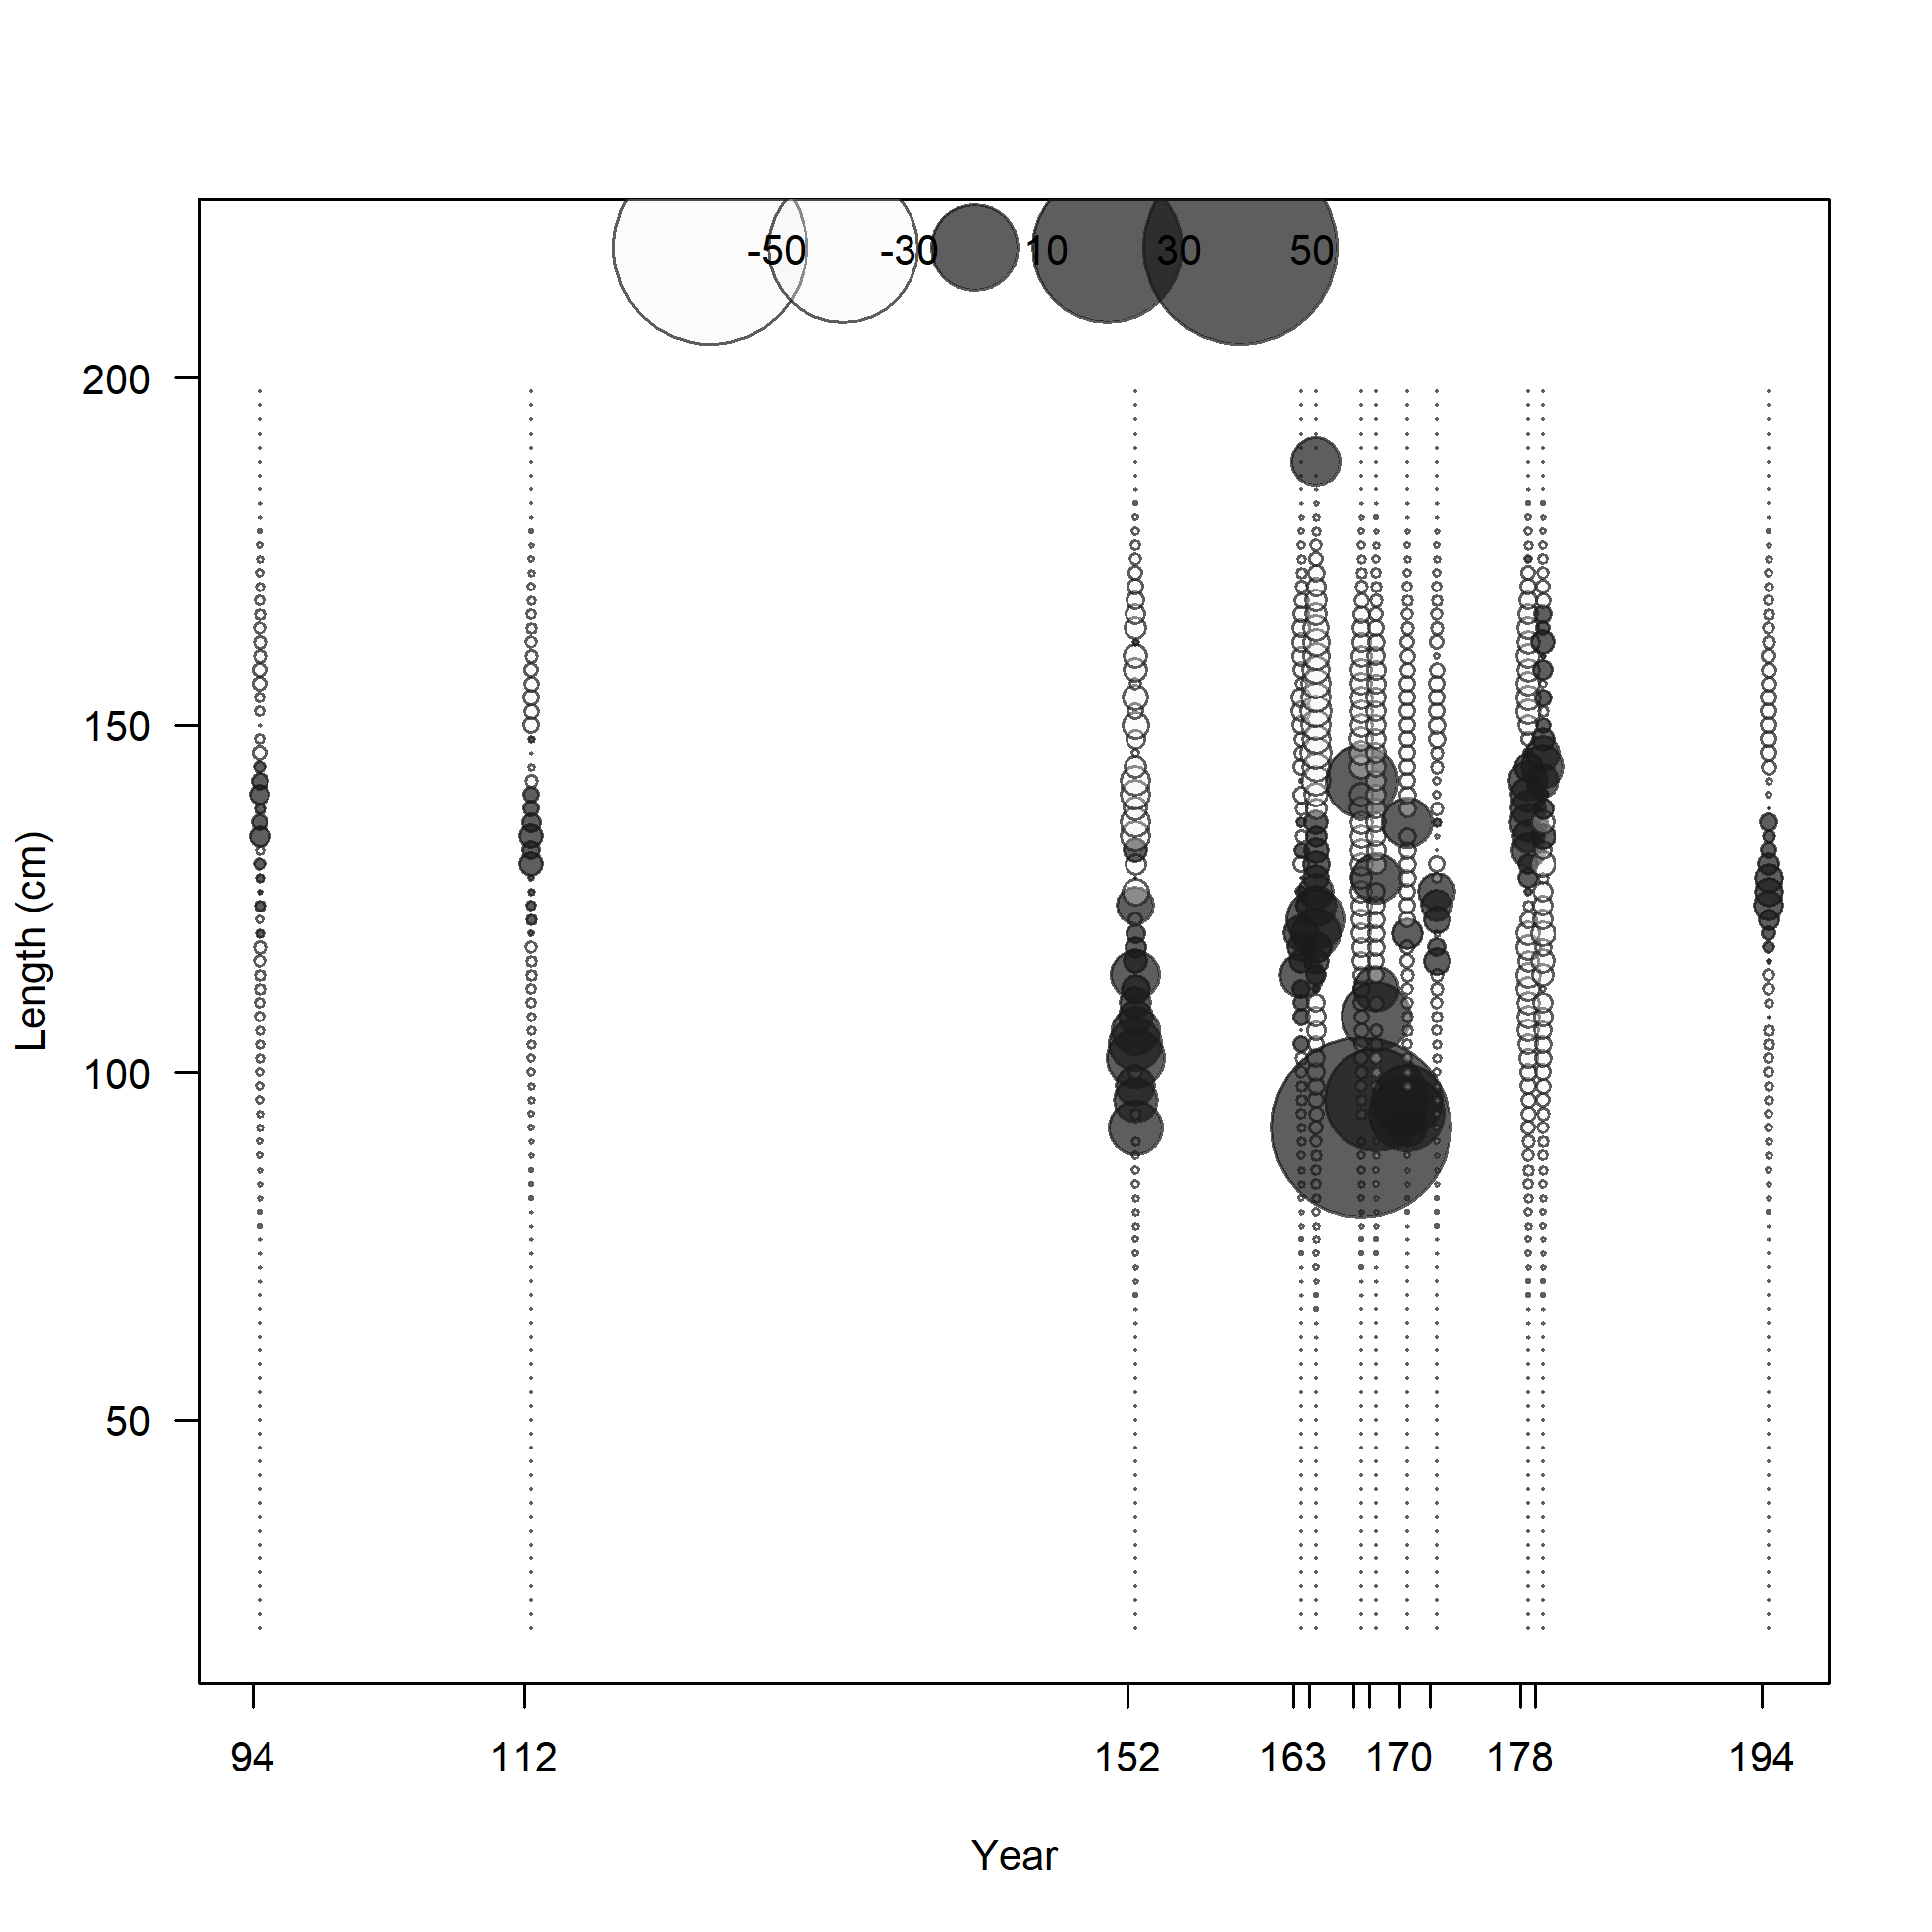
Pearson residuals, whole catch, F12.NOA.W.large (max=43.04)
Closed bubbles are positive residuals (observed > expected) and open bubbles are negative residuals (observed < expected).
file: comp_lenfit_residsflt12mkt0.png
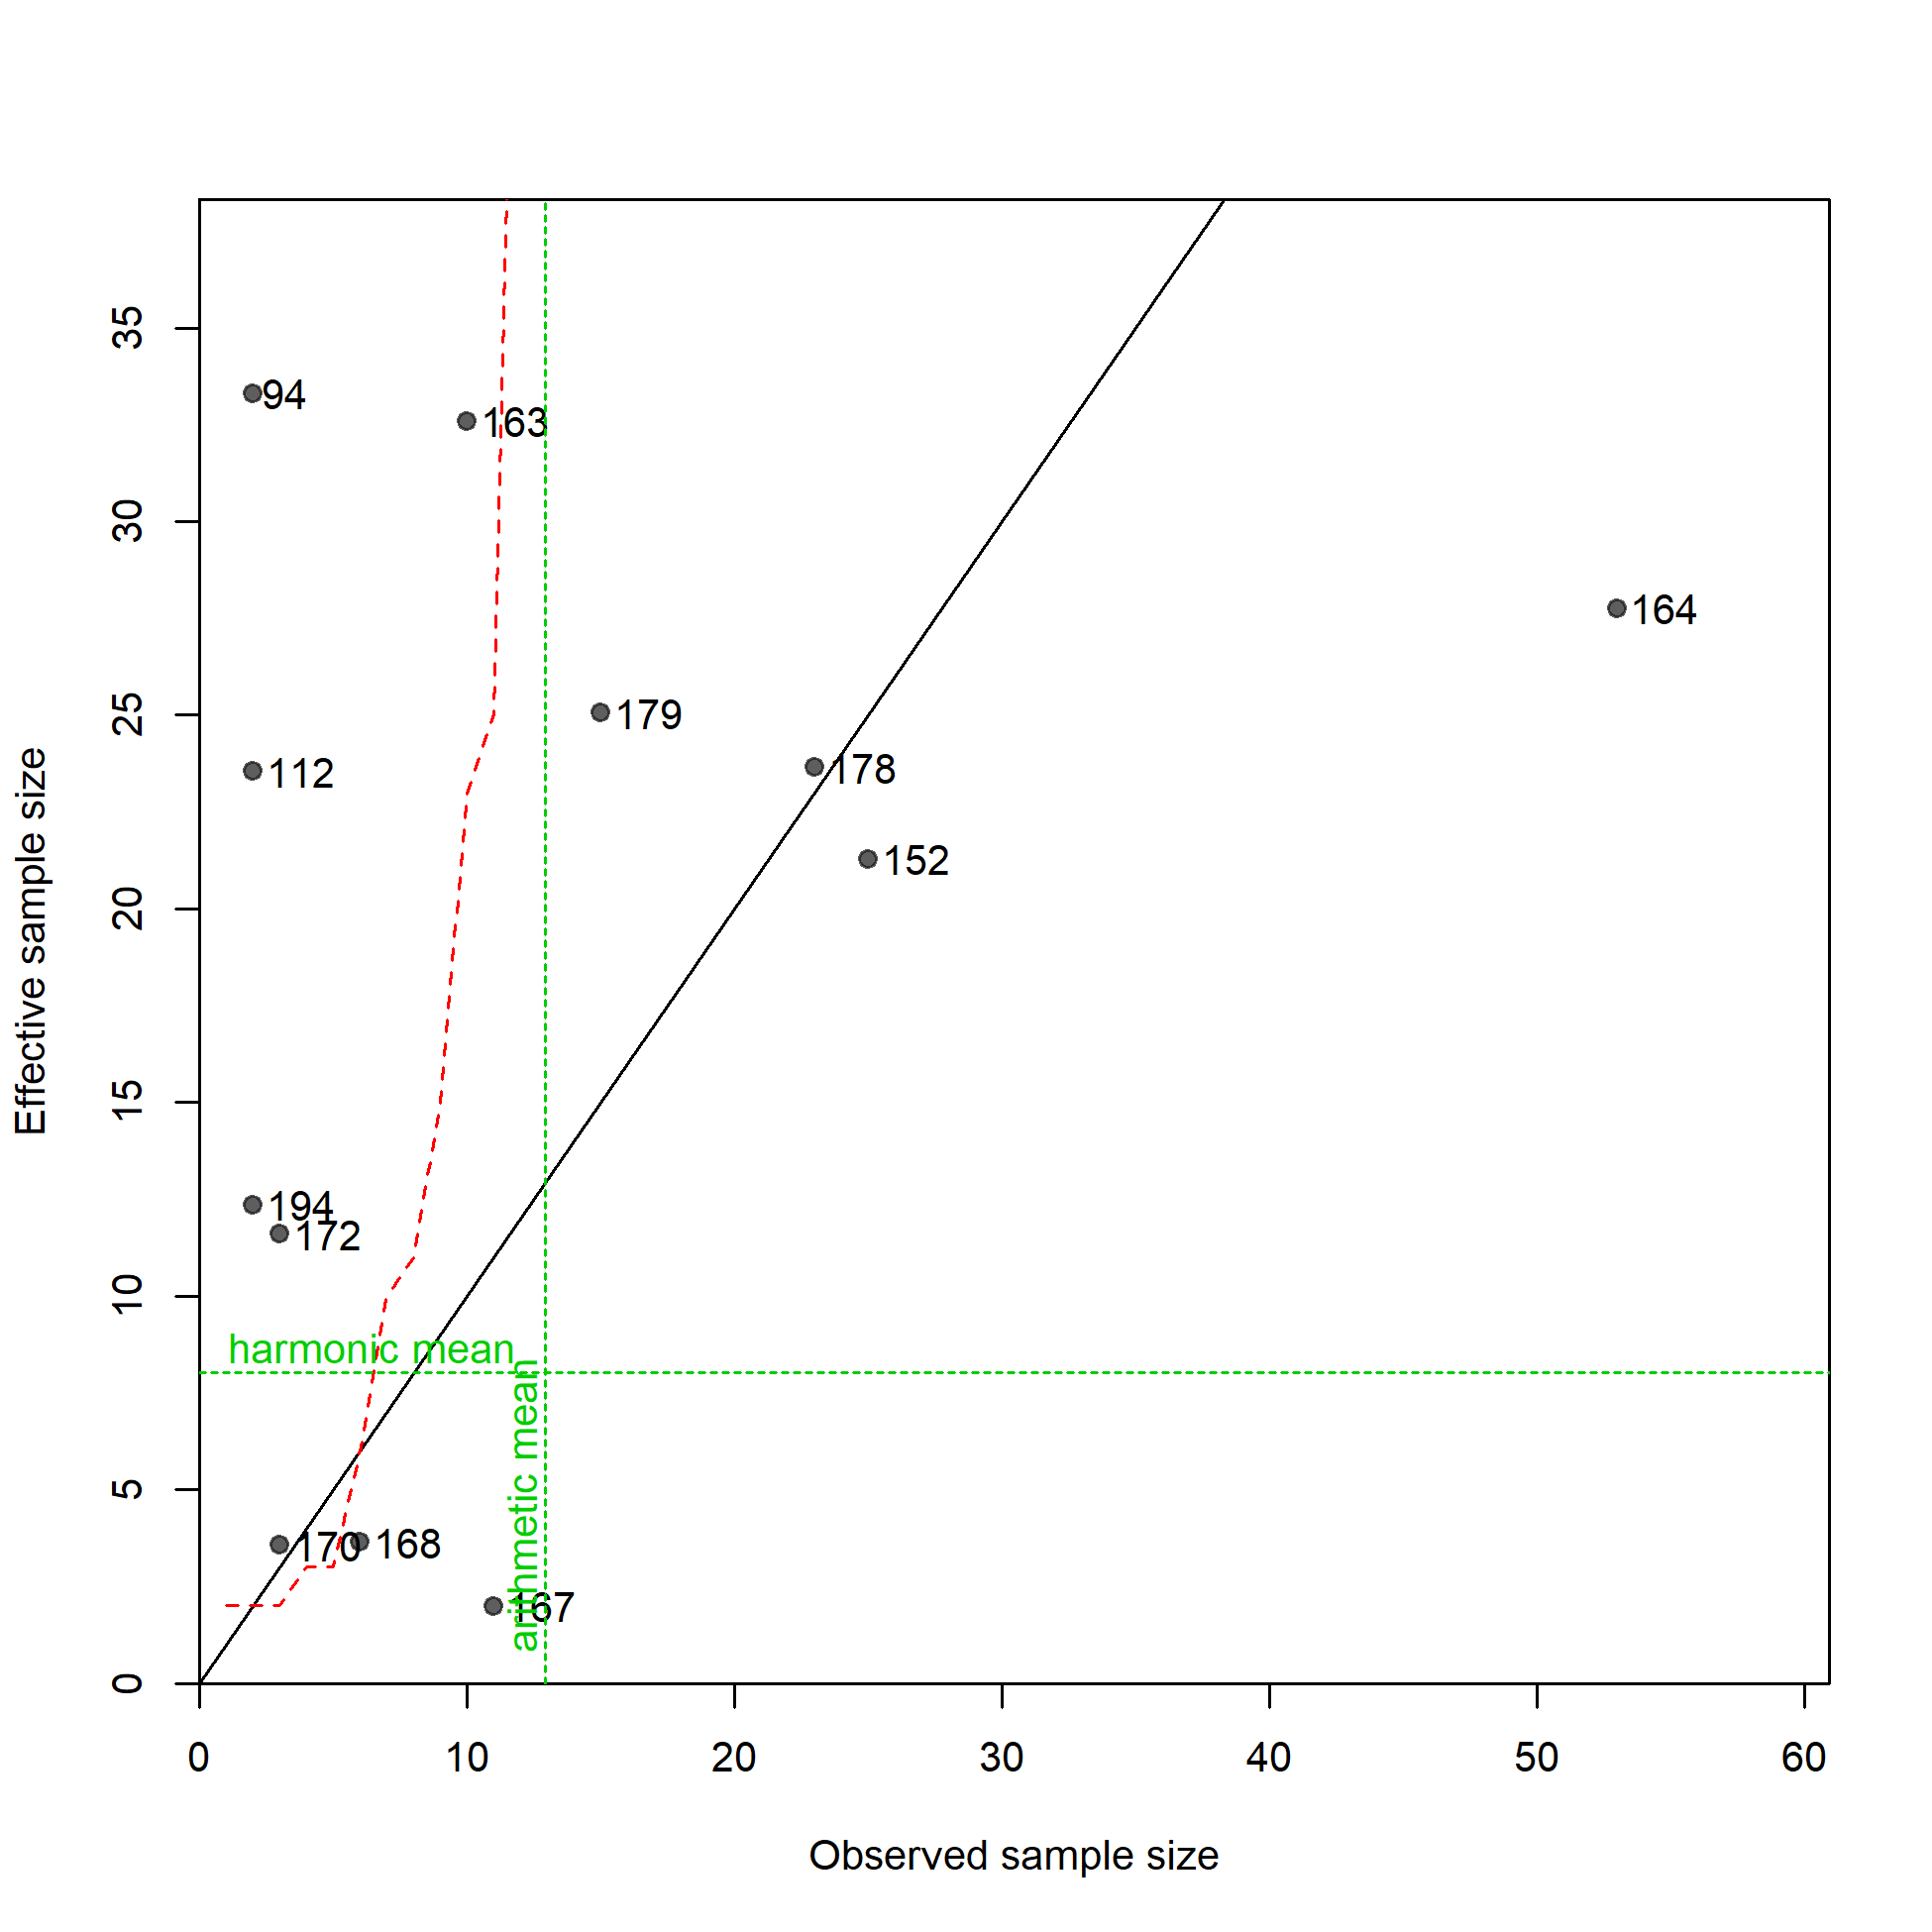
N-EffN comparison, Length comps, whole catch, F12.NOA.W.large
file: comp_lenfit_sampsize_flt12mkt0.png
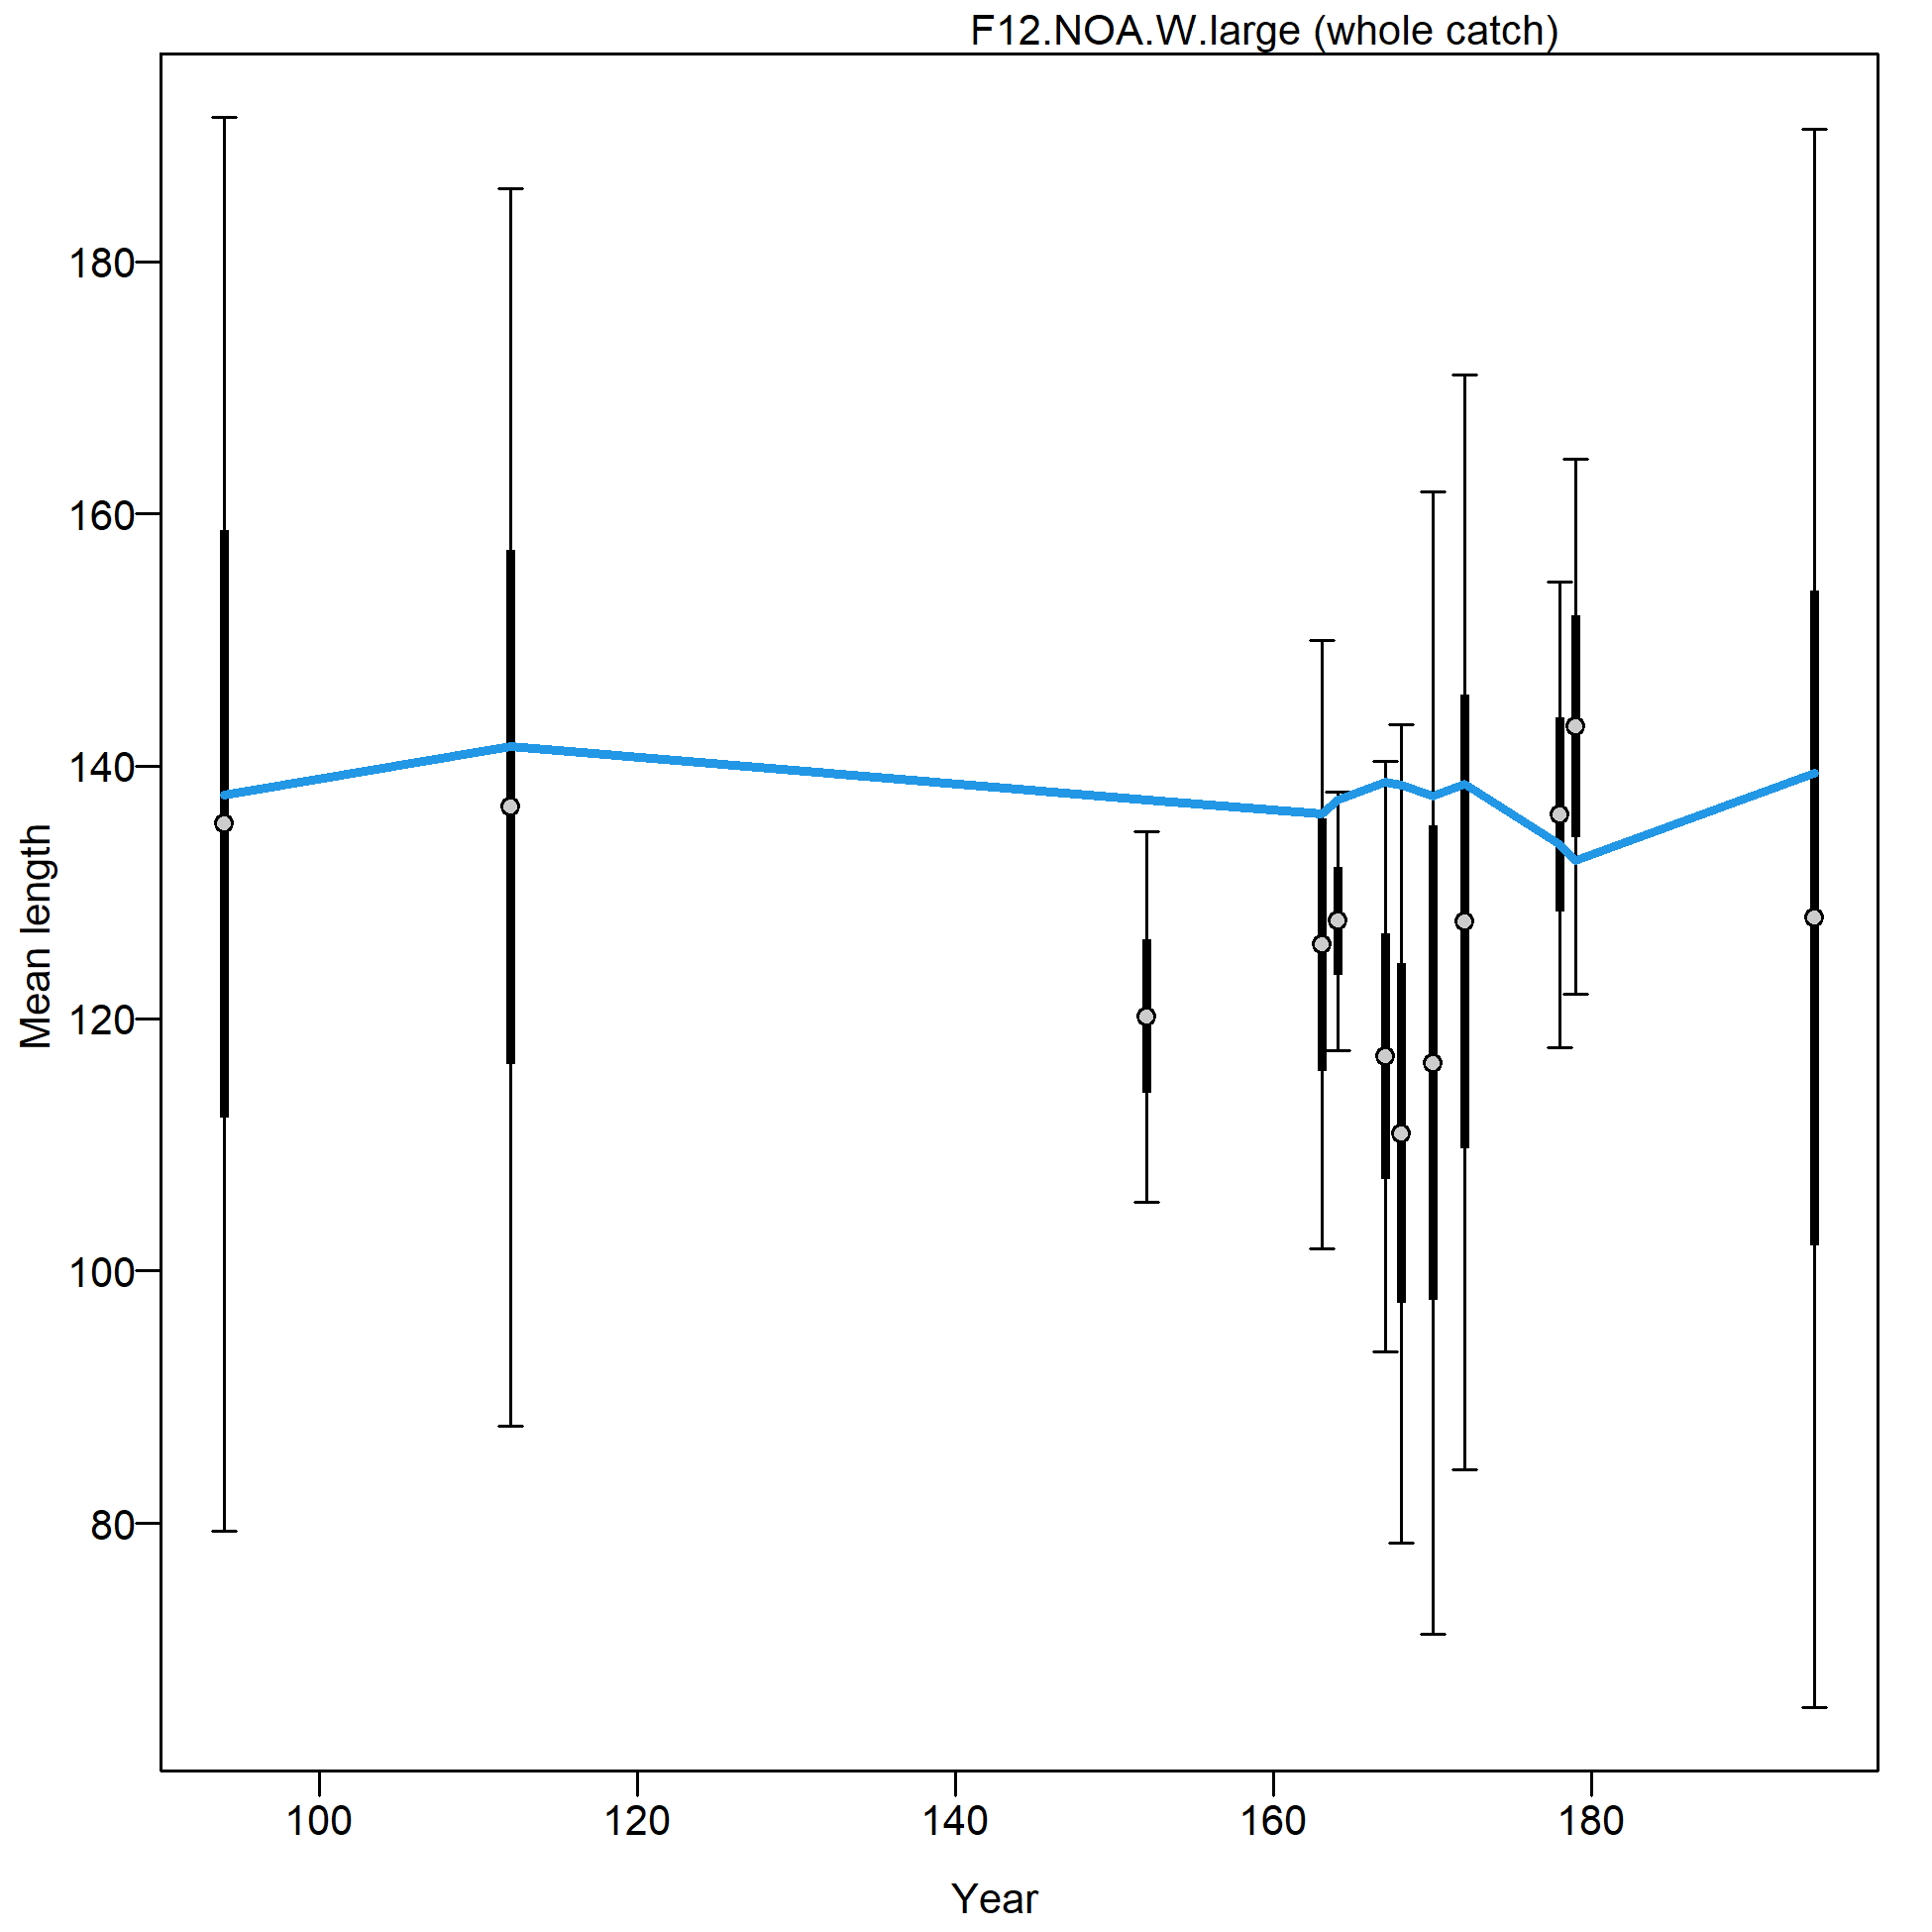
Mean length for F12.NOA.W.large with 95% confidence intervals based on current sample sizes.
Francis data weighting method TA1.8: thinner intervals (with capped ends) show result of further adjusting sample sizes based on suggested multiplier (with 95% interval) for len data from F12.NOA.W.large:
0.1724 (0.1123-0.4524)
For more info, see Francis (2011).
file: comp_lenfit_data_weighting_TA1.8_F12.NOA.W.large.png
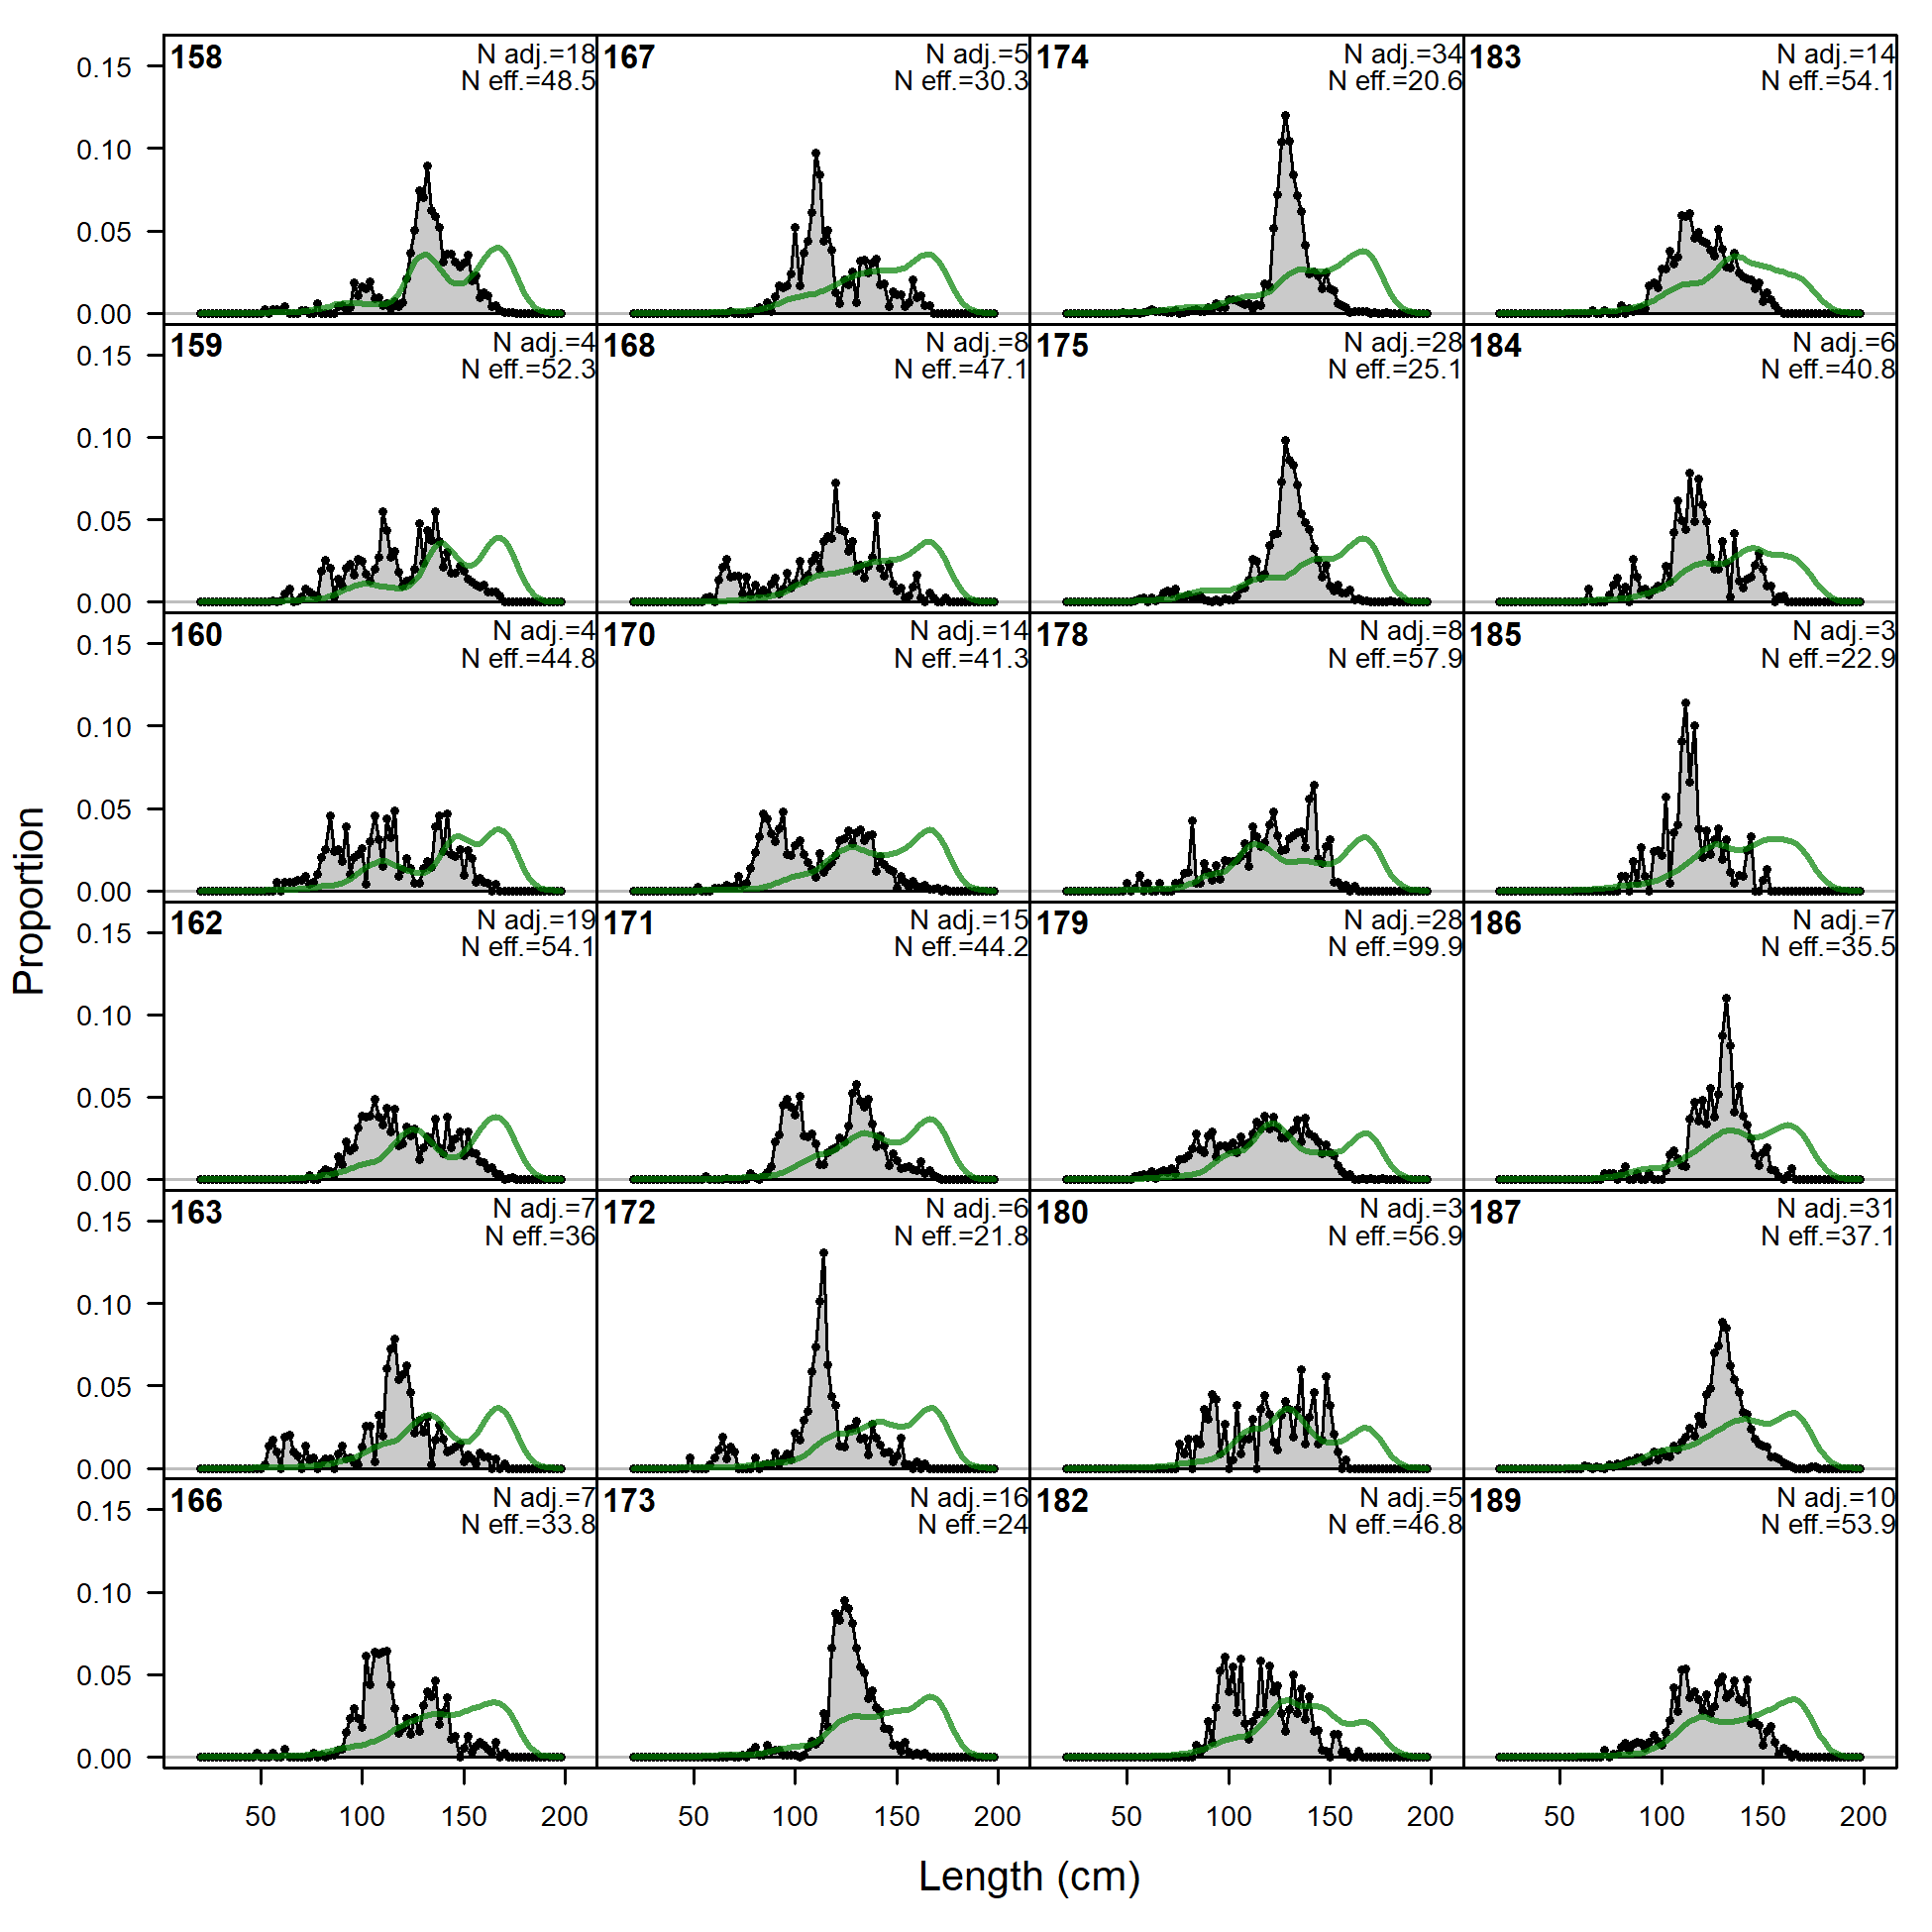
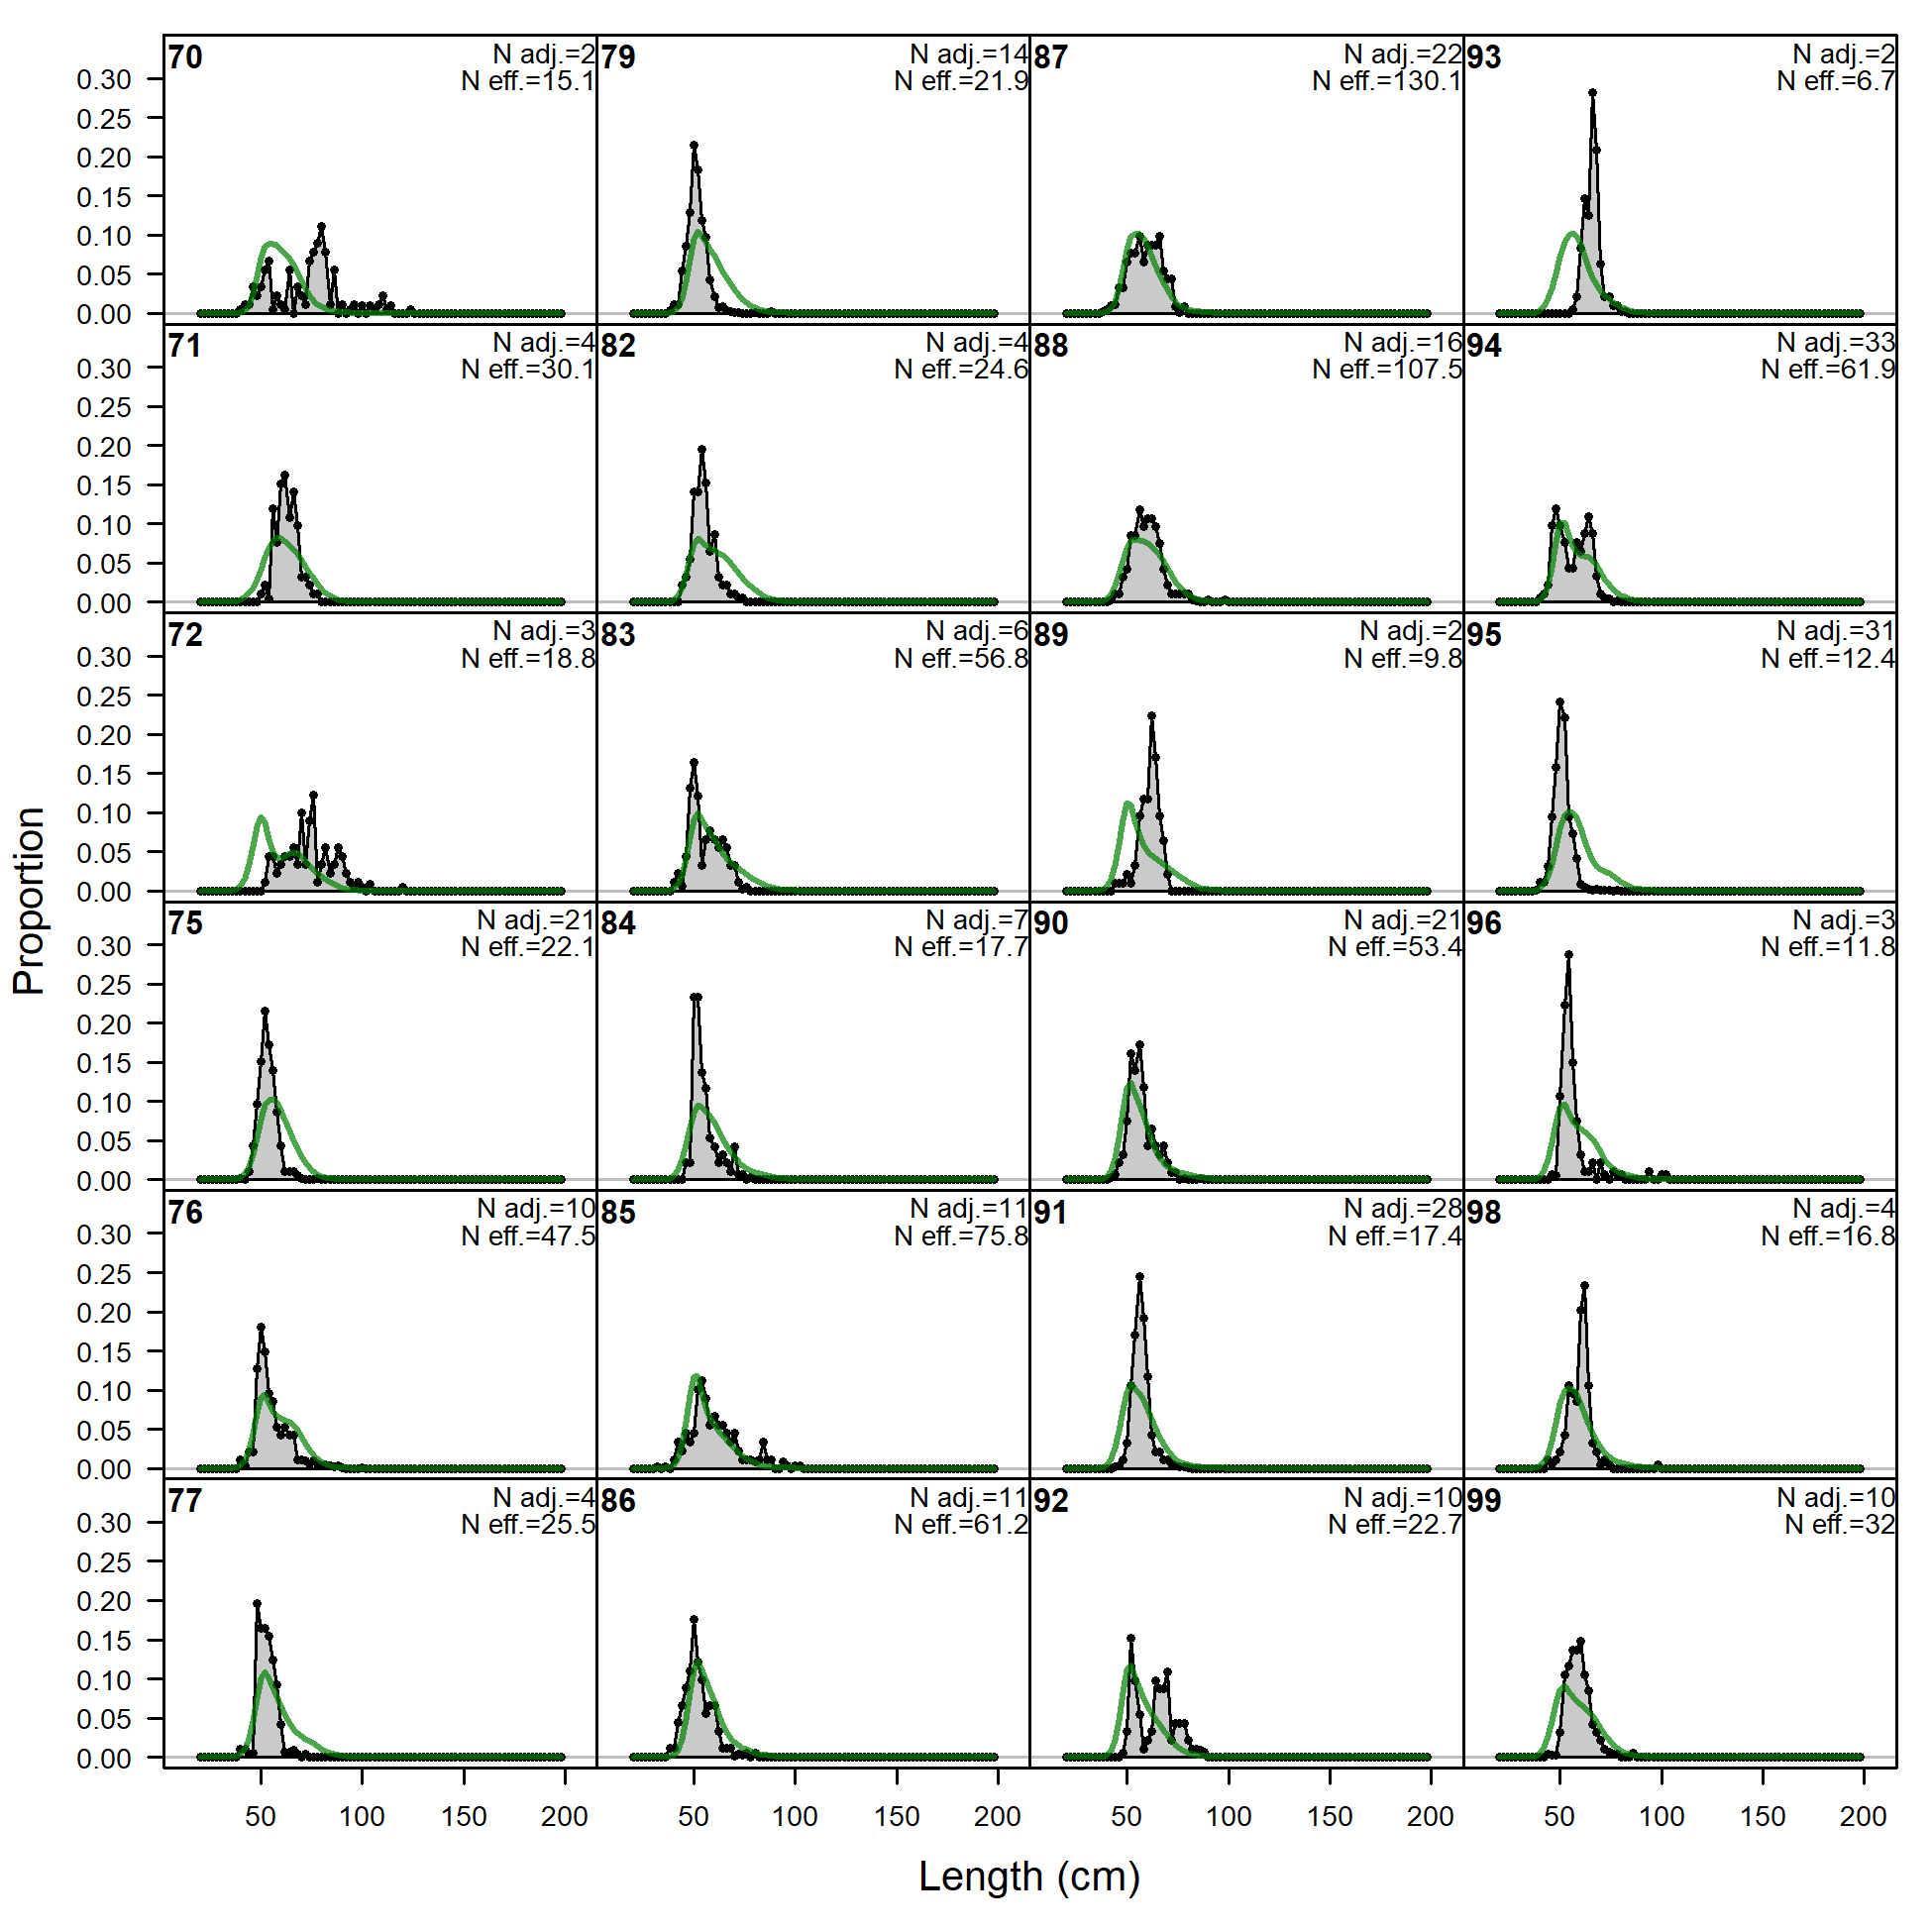
Length comps, whole catch, F13.NOA.S.large (plot 1 of 6).
'N adj.' is the input sample size after data-weighting adjustment. N eff. is the calculated effective sample size used in the McAllister-Ianelli tuning method.
file: comp_lenfit_flt13mkt0_page1.png
Length comps, whole catch, F13.NOA.S.large (plot 1 of 6).
'N adj.' is the input sample size after data-weighting adjustment. N eff. is the calculated effective sample size used in the McAllister-Ianelli tuning method. (plot 2 of 6)
file: comp_lenfit_flt13mkt0_page2.png

Length comps, whole catch, F13.NOA.S.large (plot 1 of 6).
'N adj.' is the input sample size after data-weighting adjustment. N eff. is the calculated effective sample size used in the McAllister-Ianelli tuning method. (plot 2 of 6) (plot 3 of 6)
file: comp_lenfit_flt13mkt0_page3.png
Length comps, whole catch, F13.NOA.S.large (plot 1 of 6).
'N adj.' is the input sample size after data-weighting adjustment. N eff. is the calculated effective sample size used in the McAllister-Ianelli tuning method. (plot 2 of 6) (plot 3 of 6) (plot 4 of 6)
file: comp_lenfit_flt13mkt0_page4.png
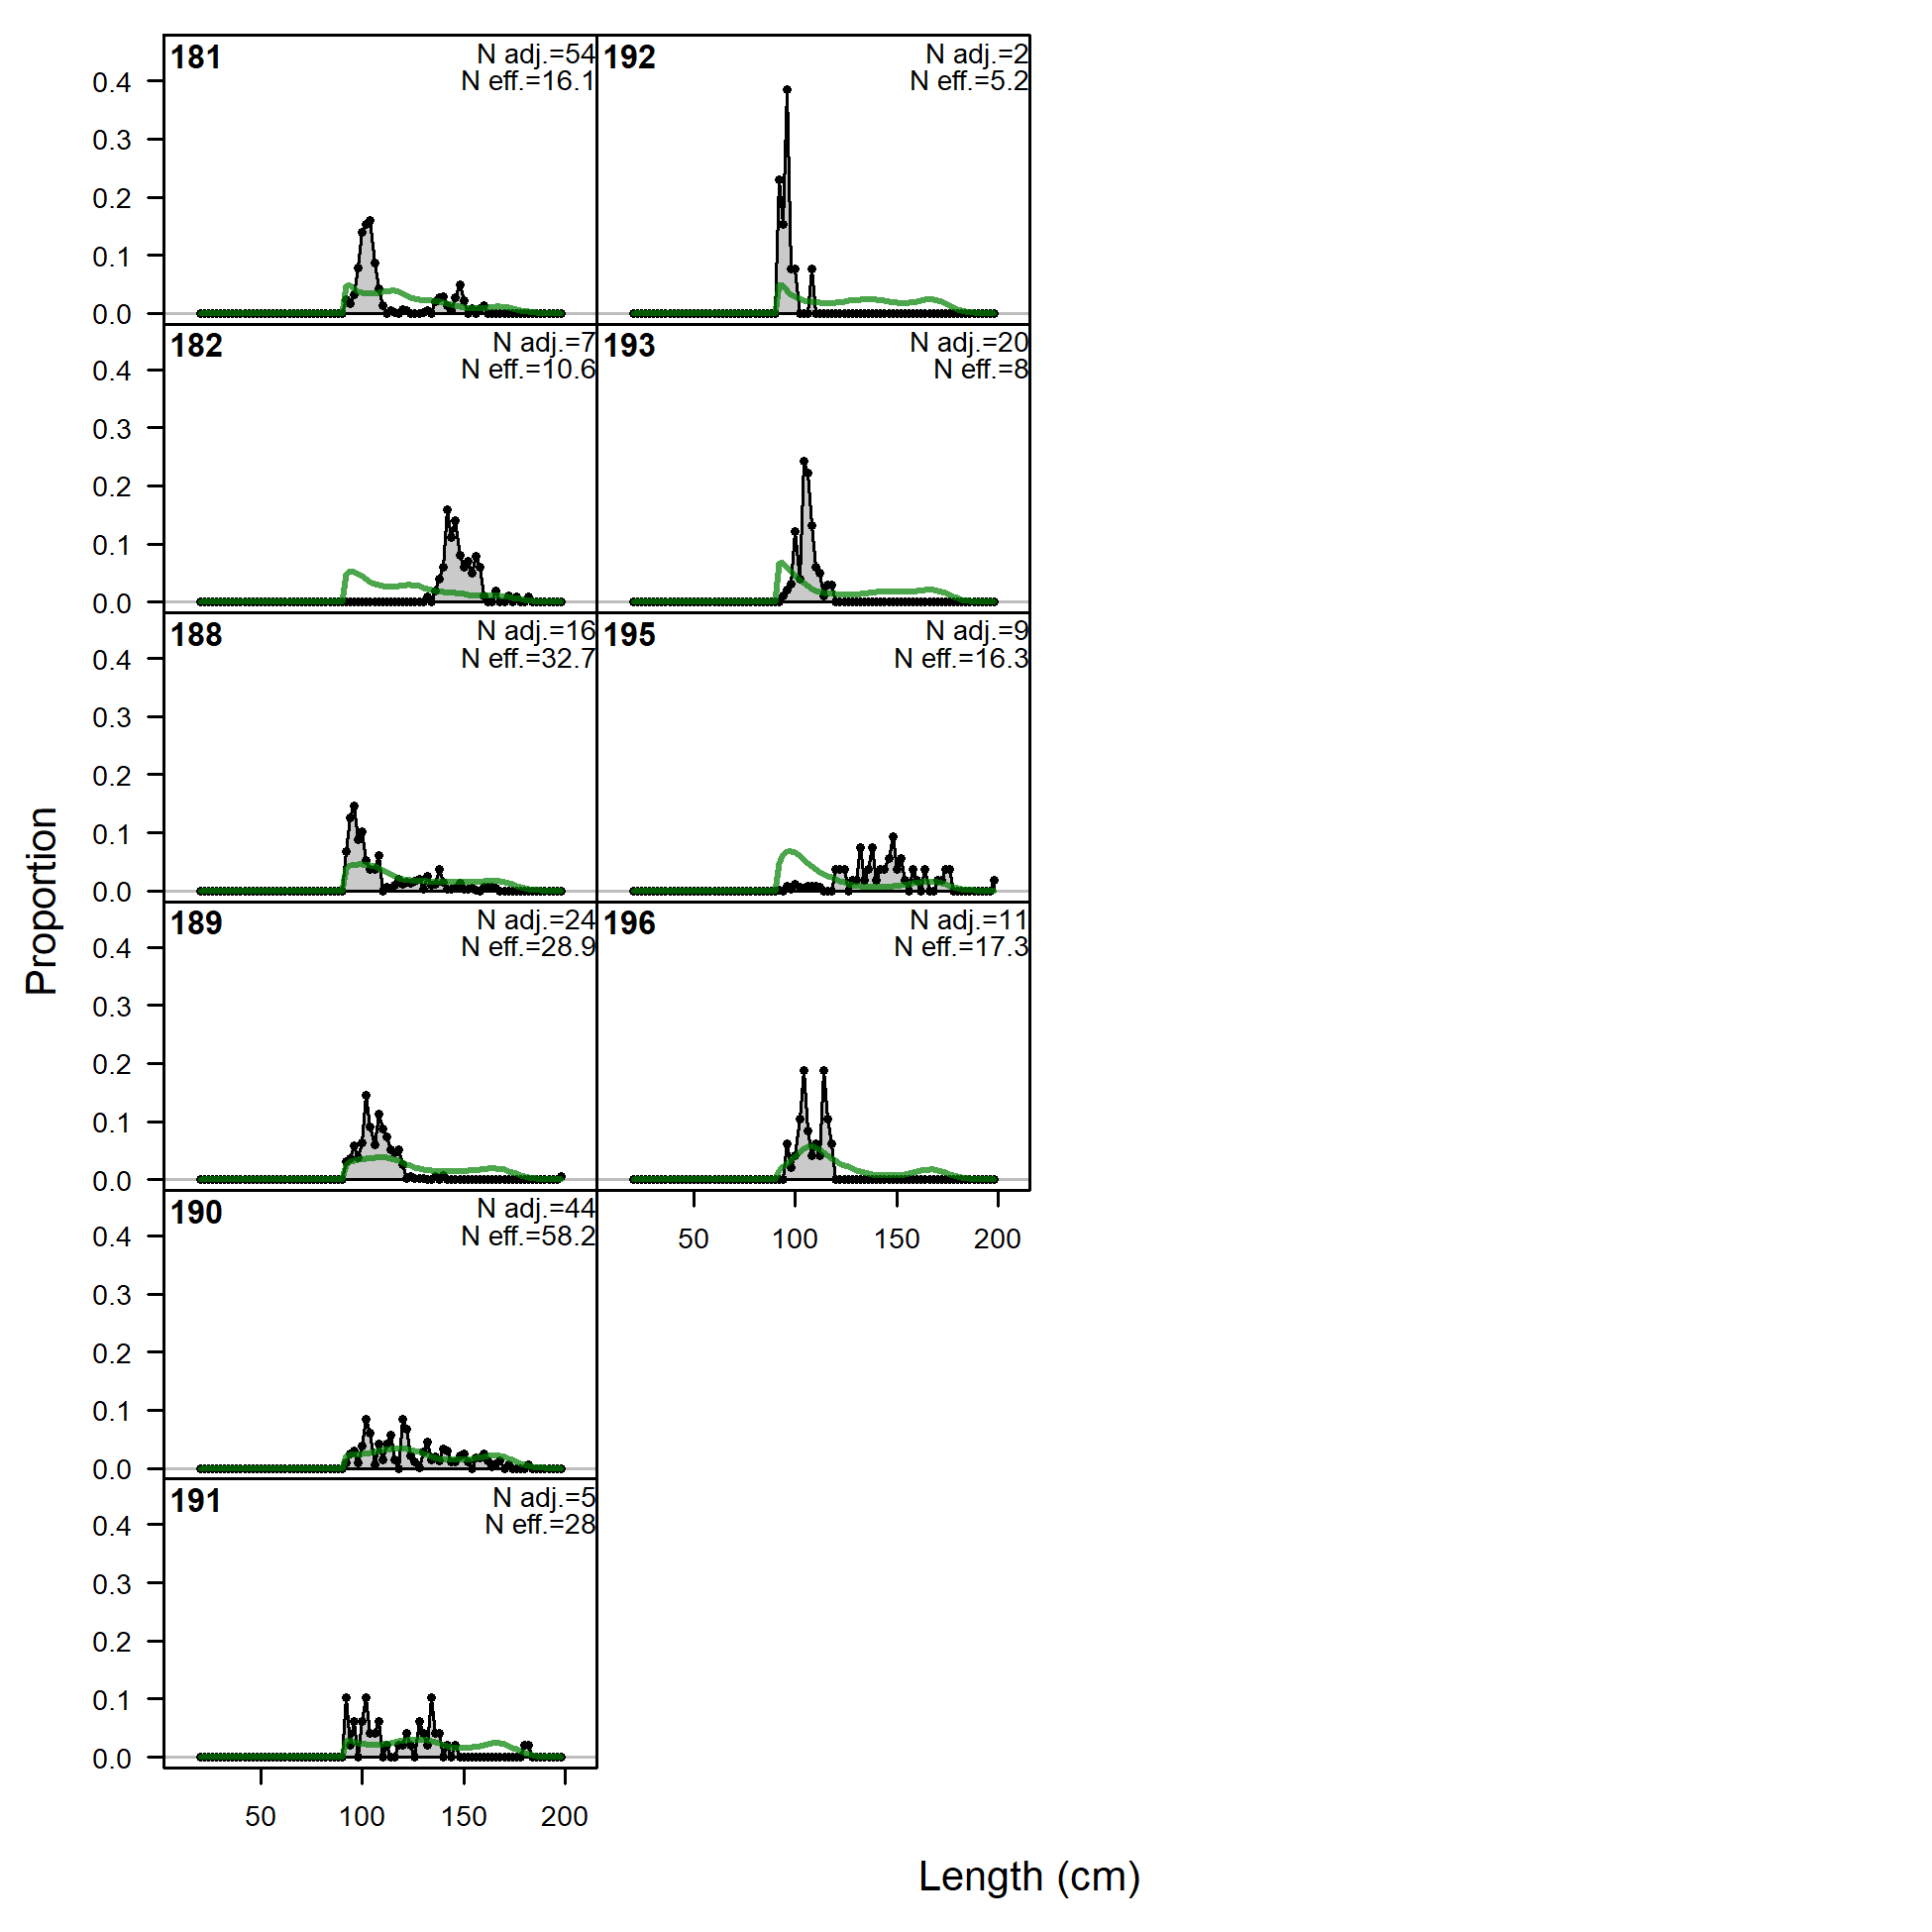
Length comps, whole catch, F13.NOA.S.large (plot 1 of 6).
'N adj.' is the input sample size after data-weighting adjustment. N eff. is the calculated effective sample size used in the McAllister-Ianelli tuning method. (plot 2 of 6) (plot 3 of 6) (plot 4 of 6) (plot 5 of 6)
file: comp_lenfit_flt13mkt0_page5.png
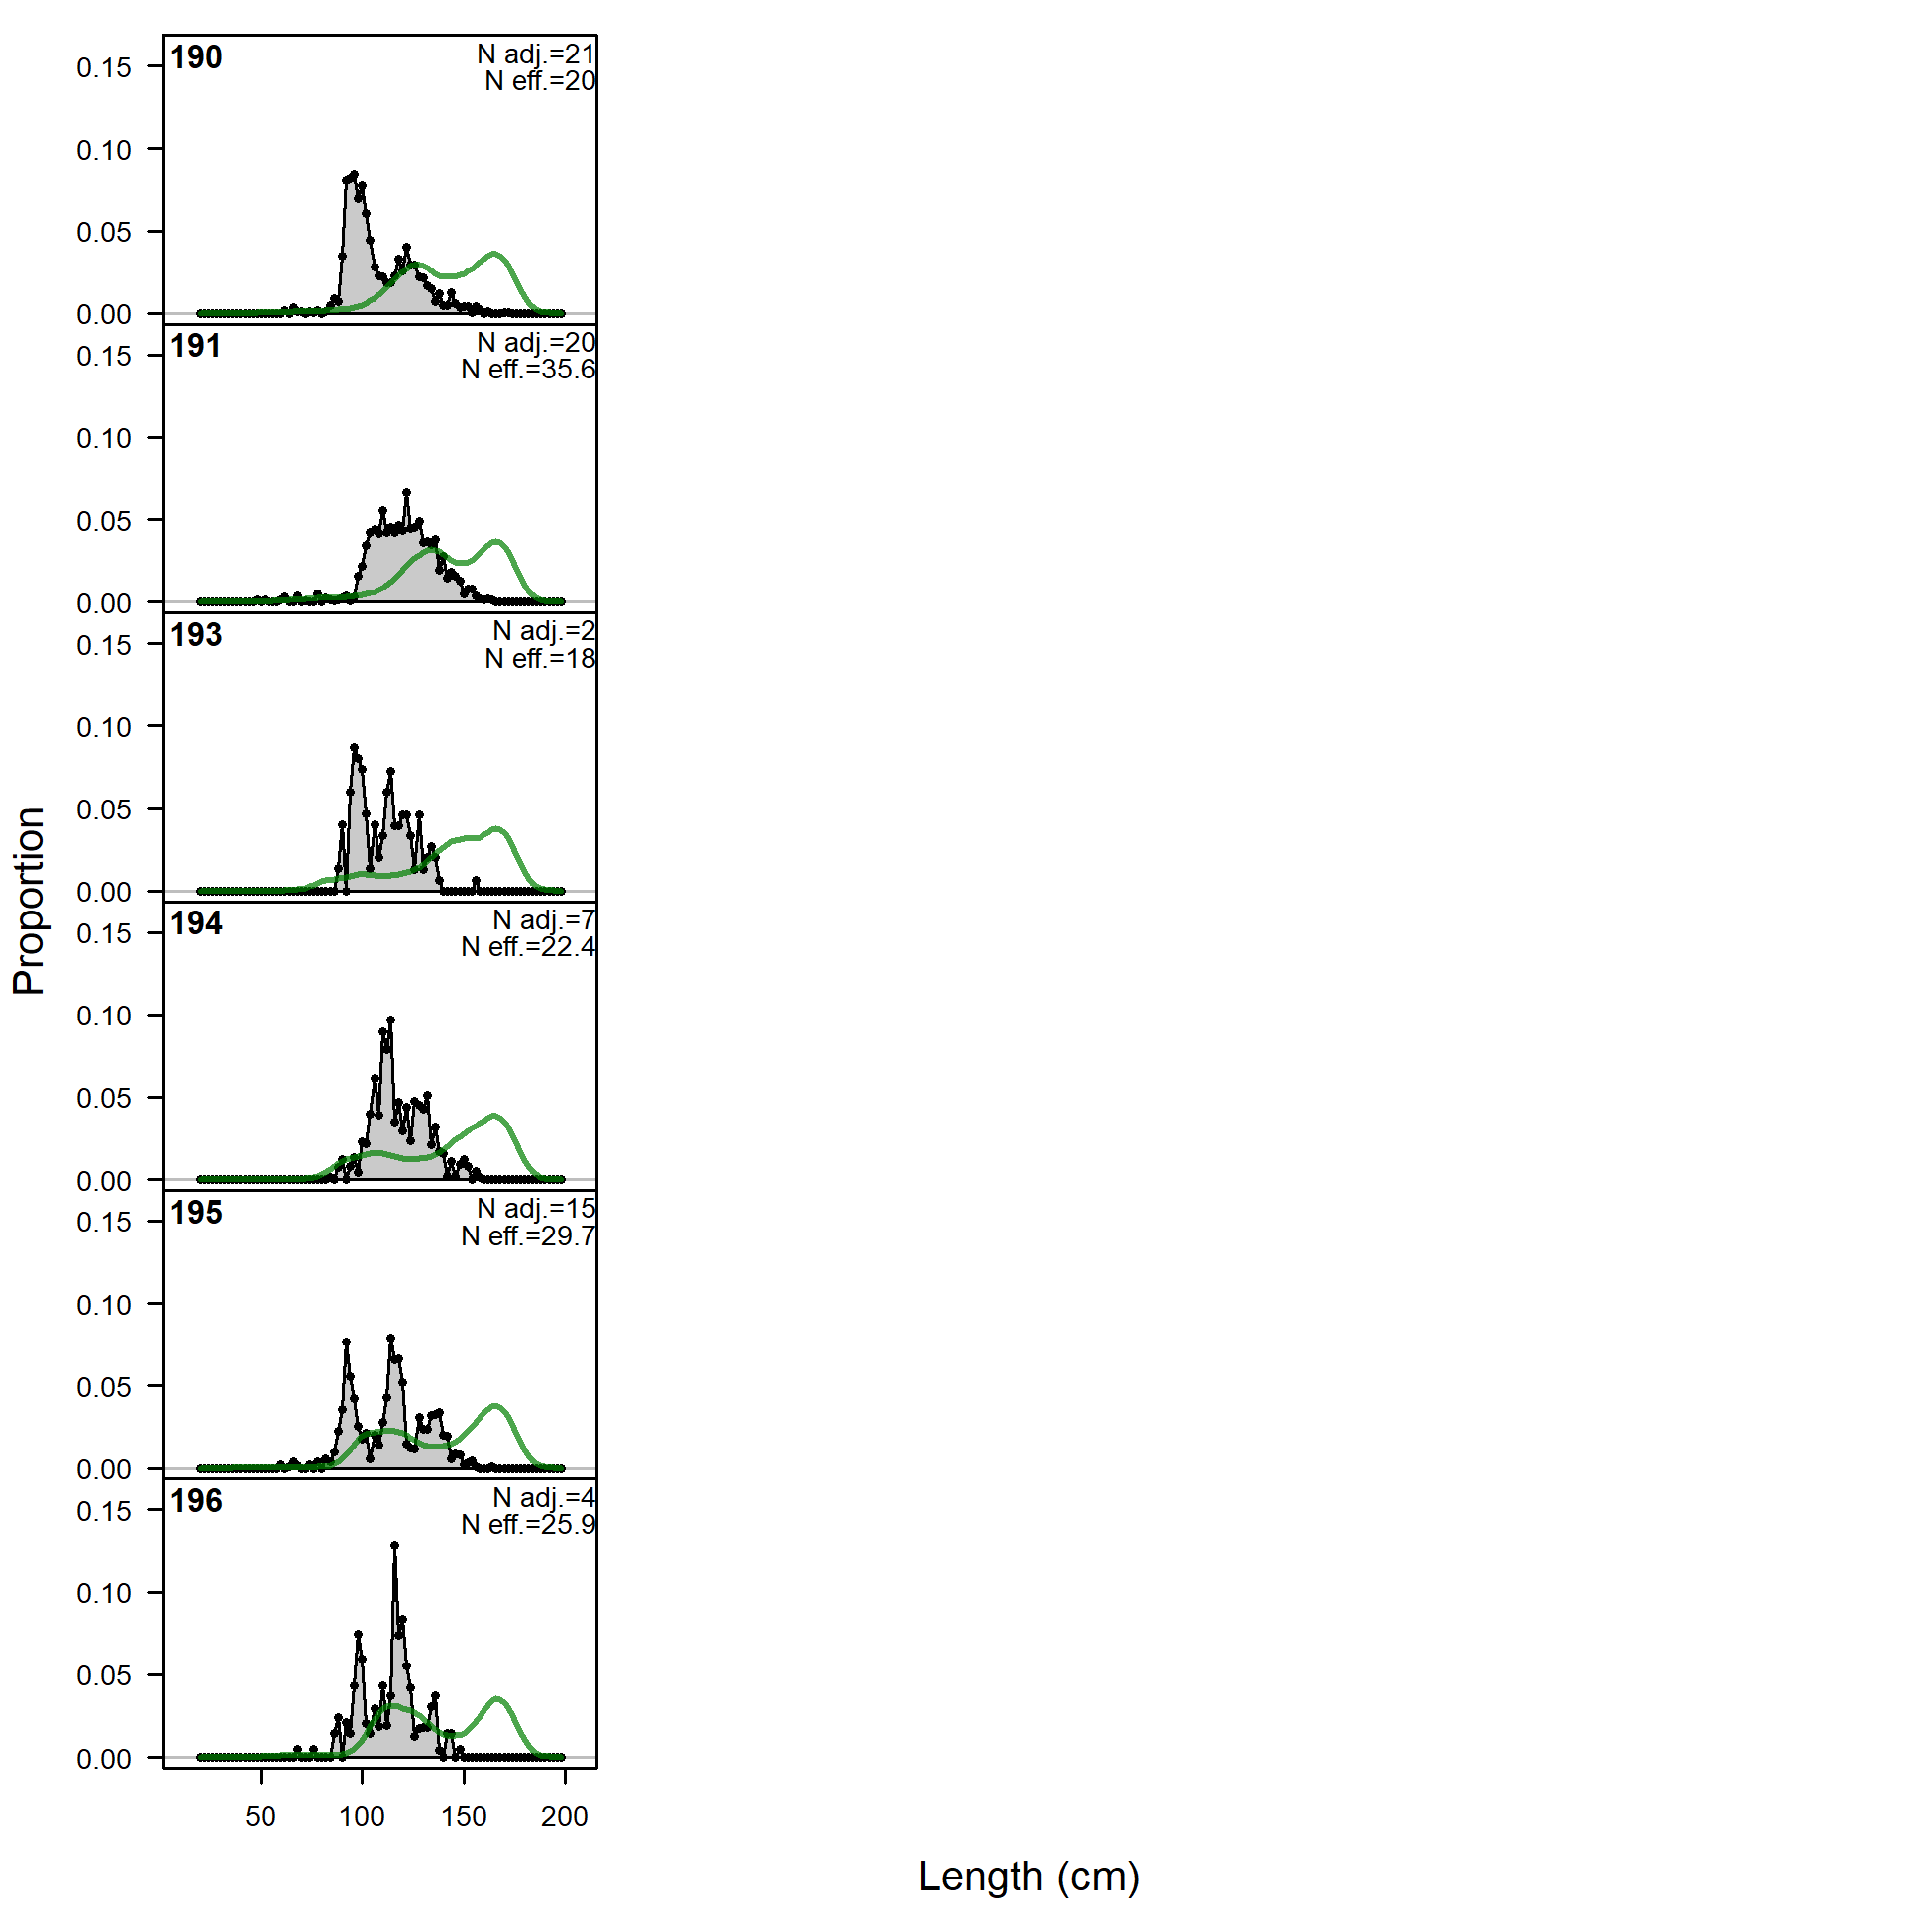
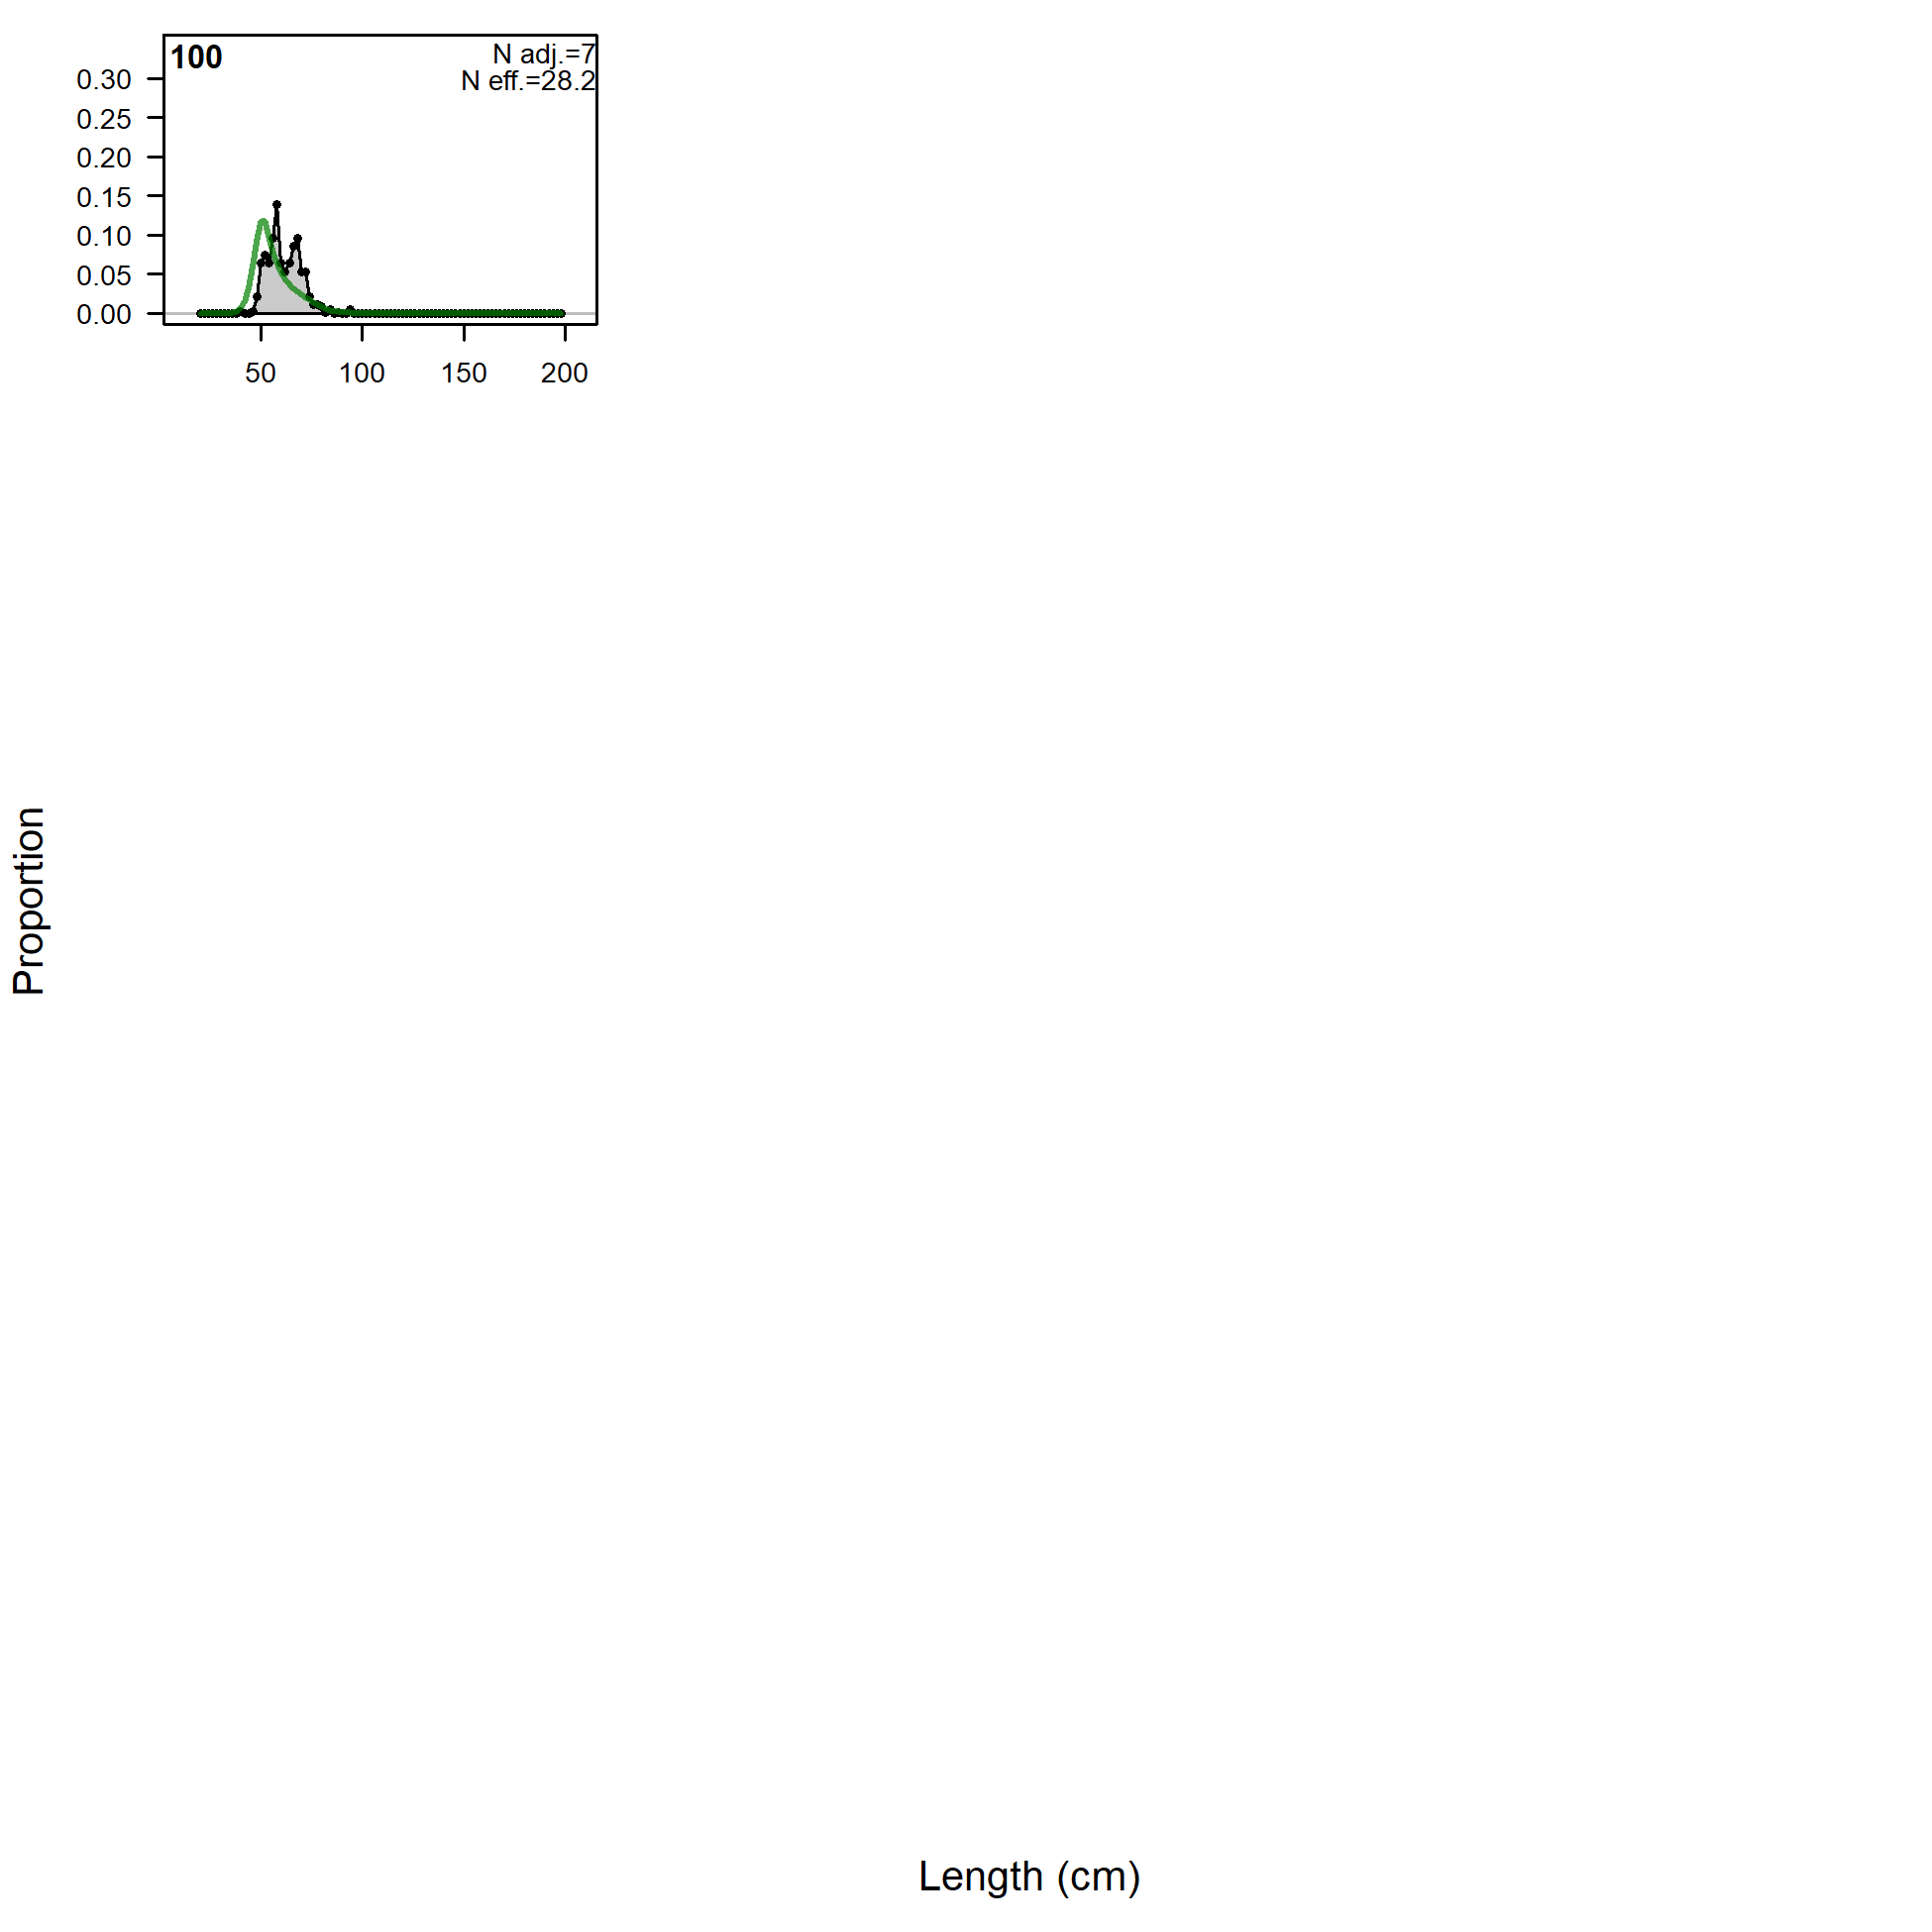
Length comps, whole catch, F13.NOA.S.large (plot 1 of 6).
'N adj.' is the input sample size after data-weighting adjustment. N eff. is the calculated effective sample size used in the McAllister-Ianelli tuning method. (plot 2 of 6) (plot 3 of 6) (plot 4 of 6) (plot 5 of 6) (plot 6 of 6)
file: comp_lenfit_flt13mkt0_page6.png
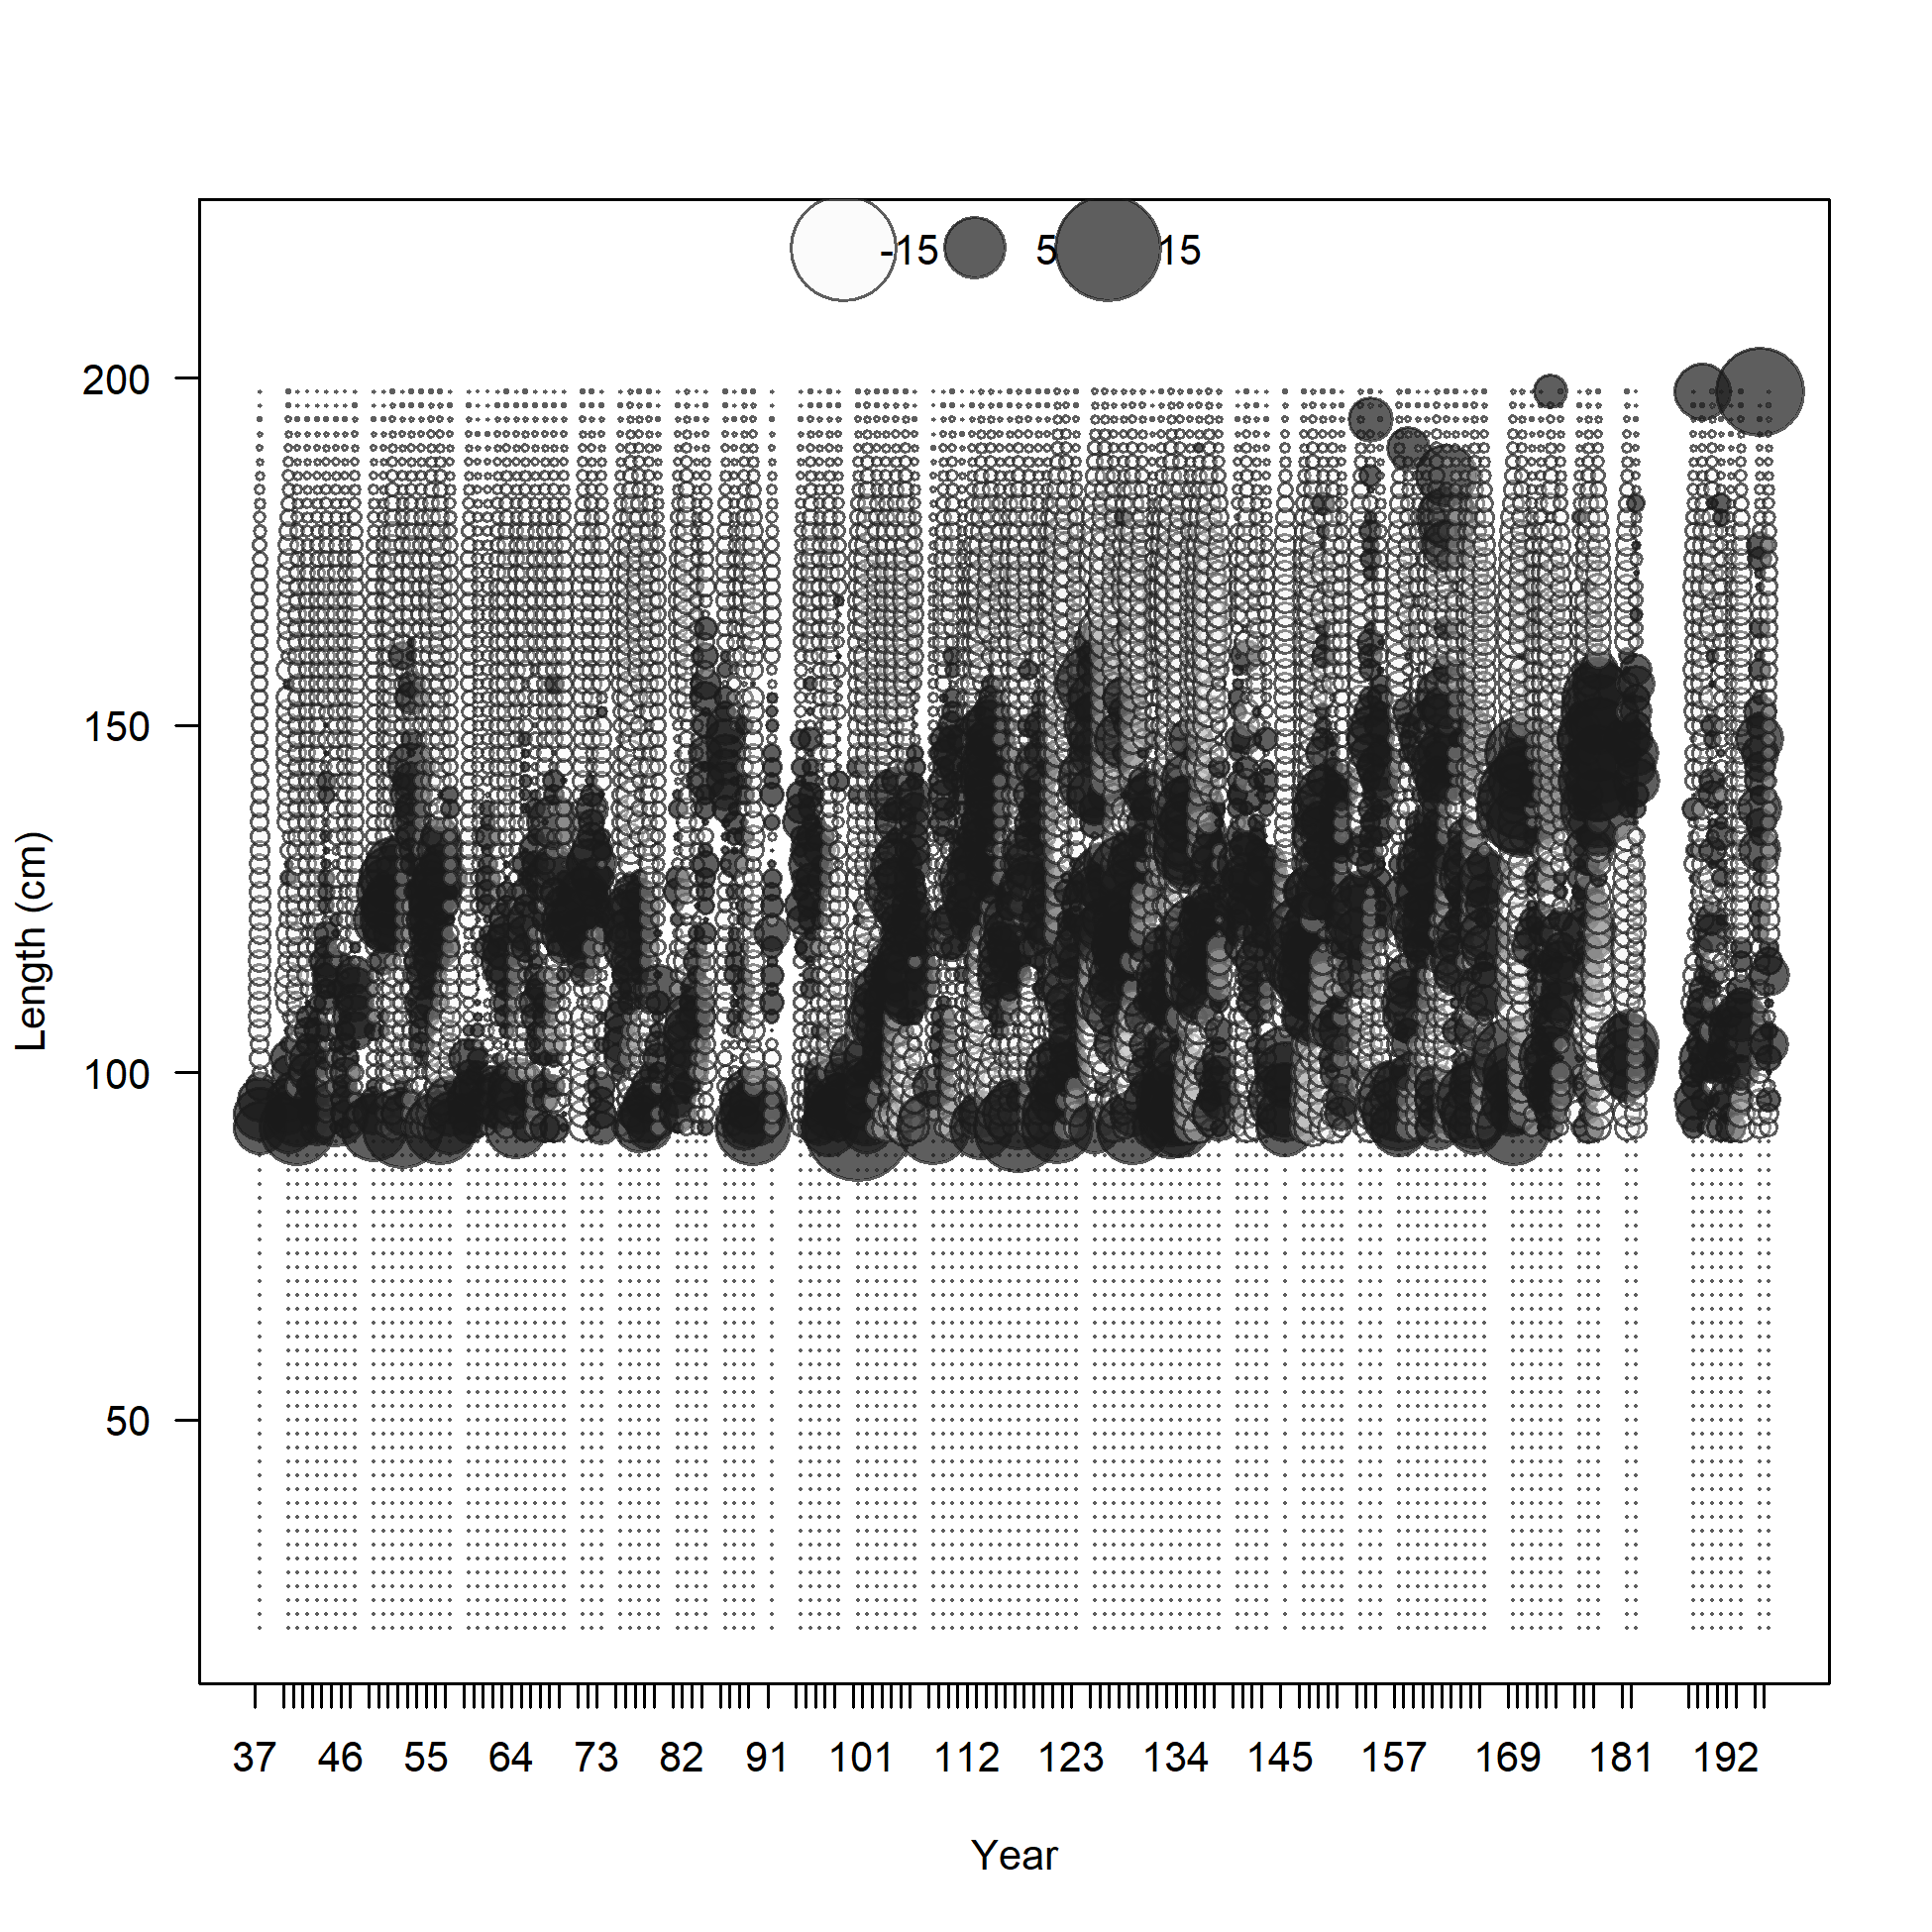
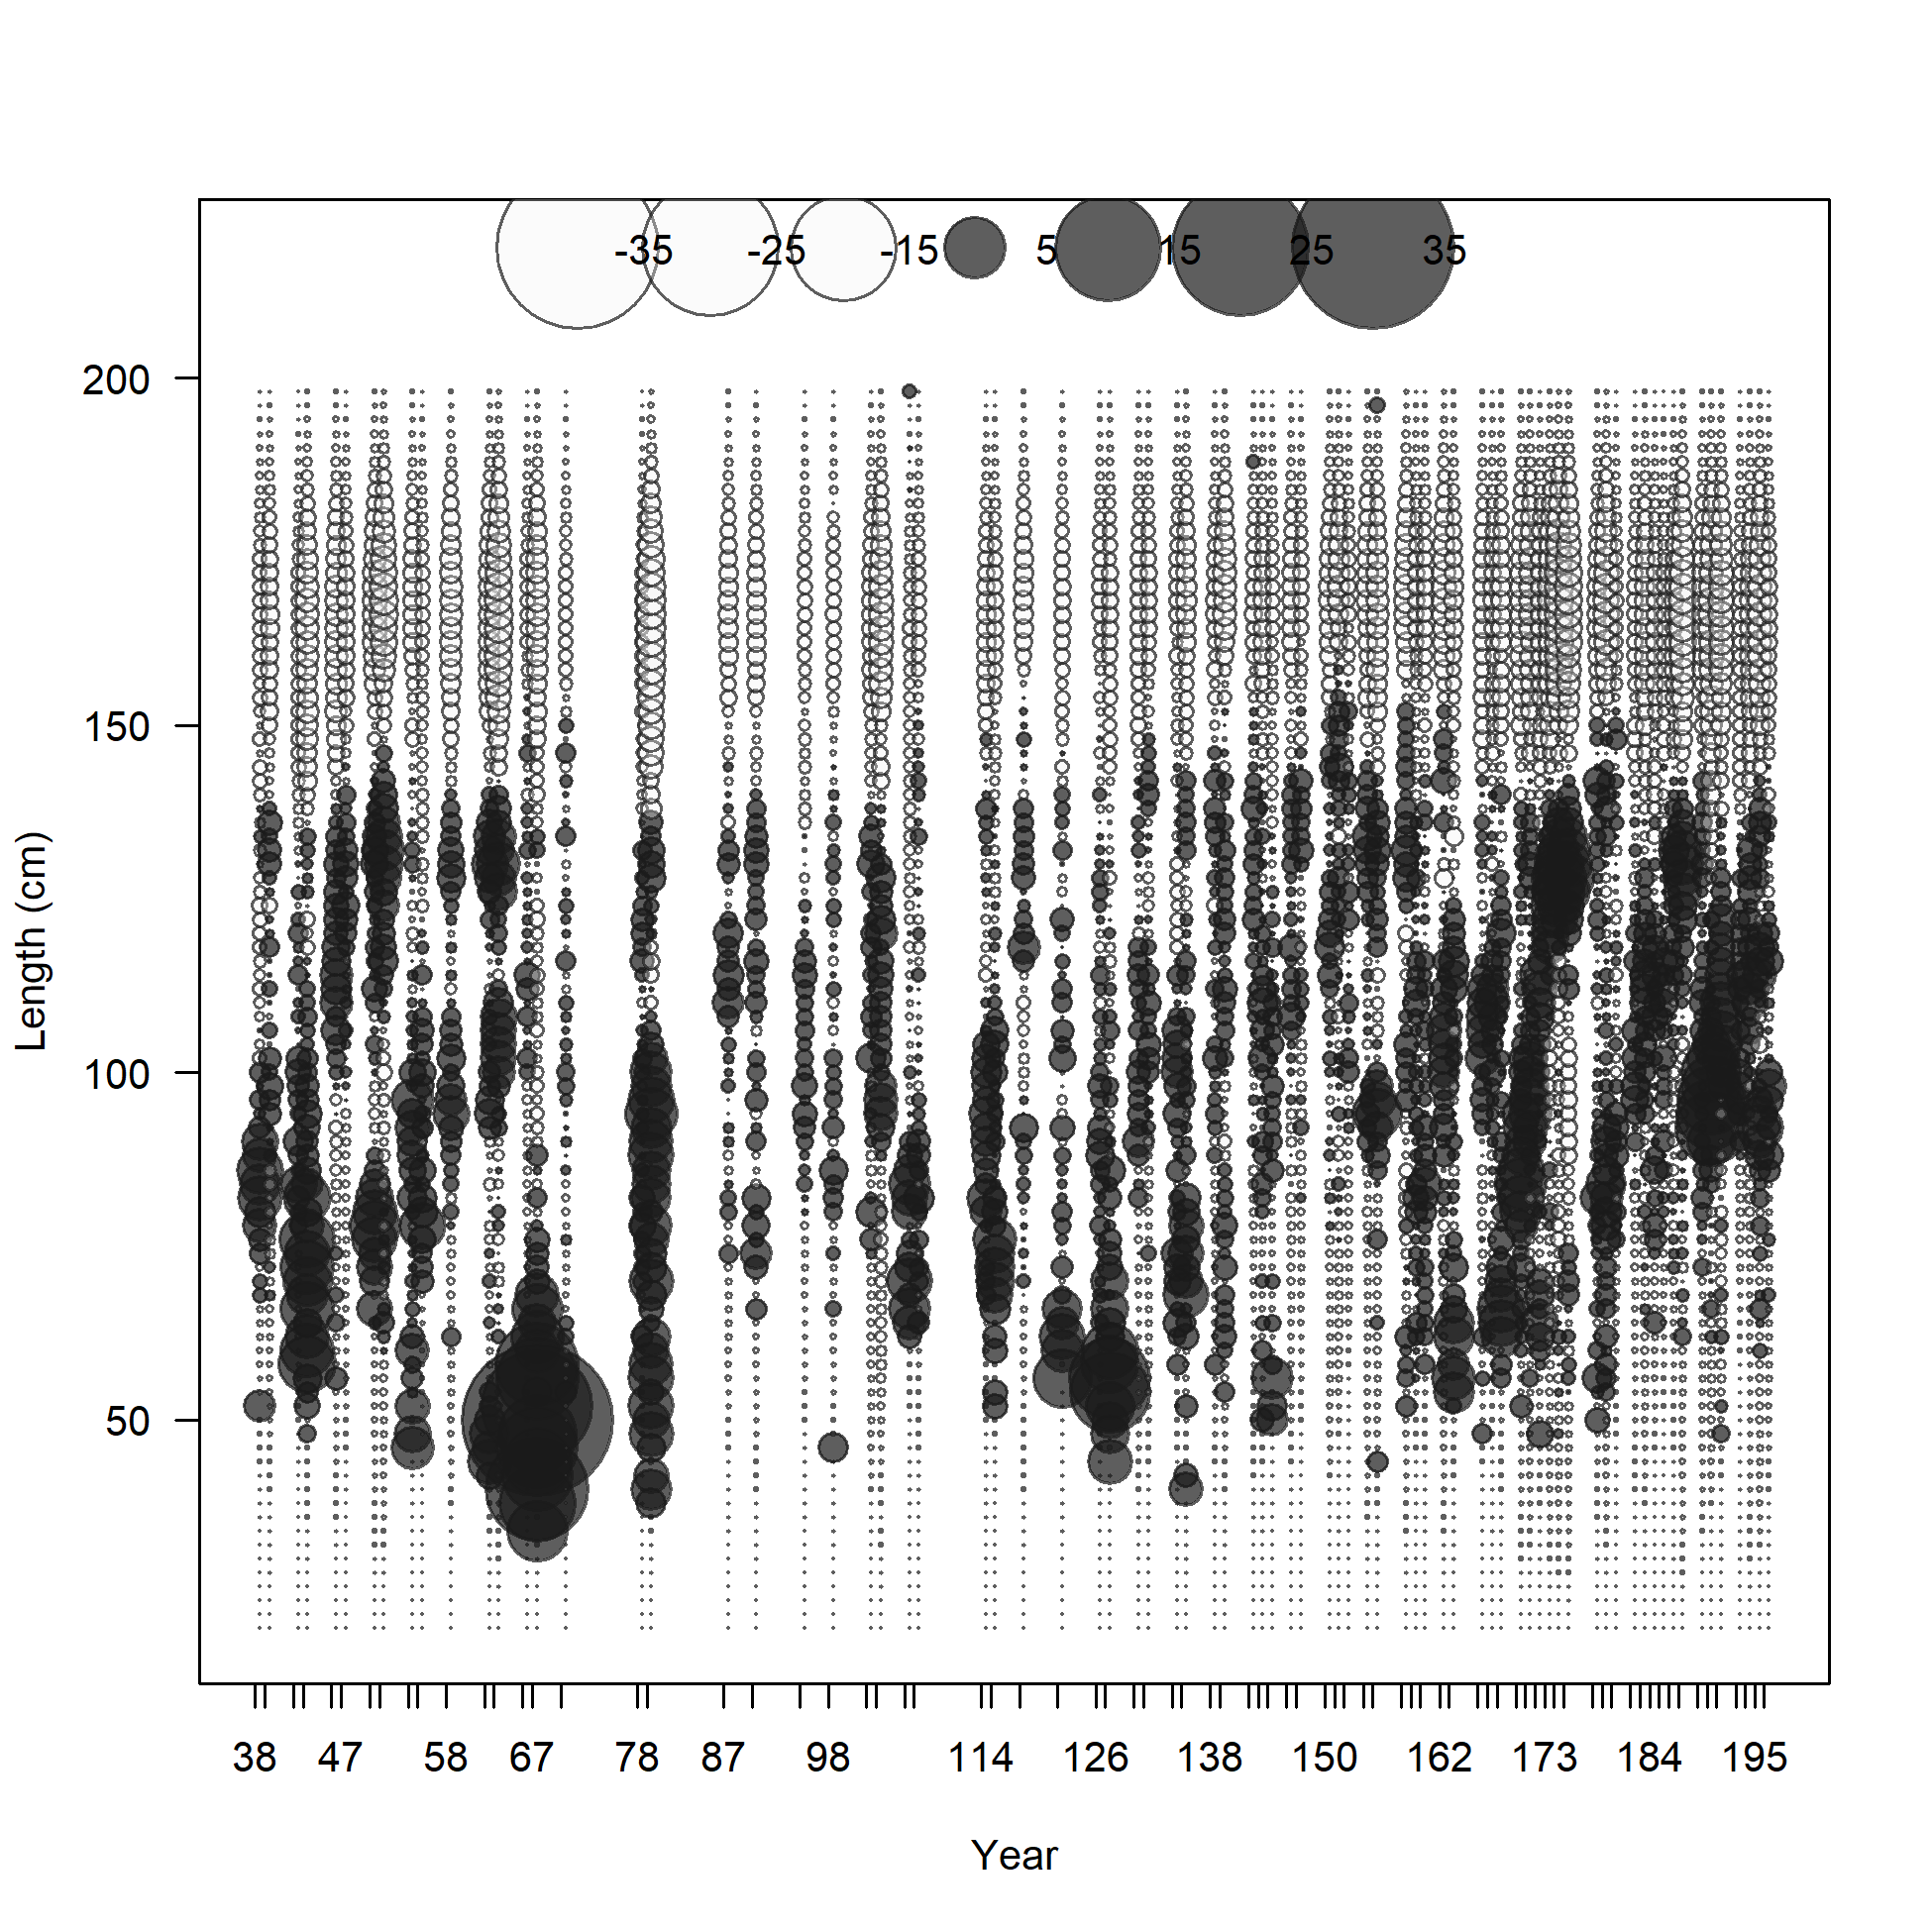
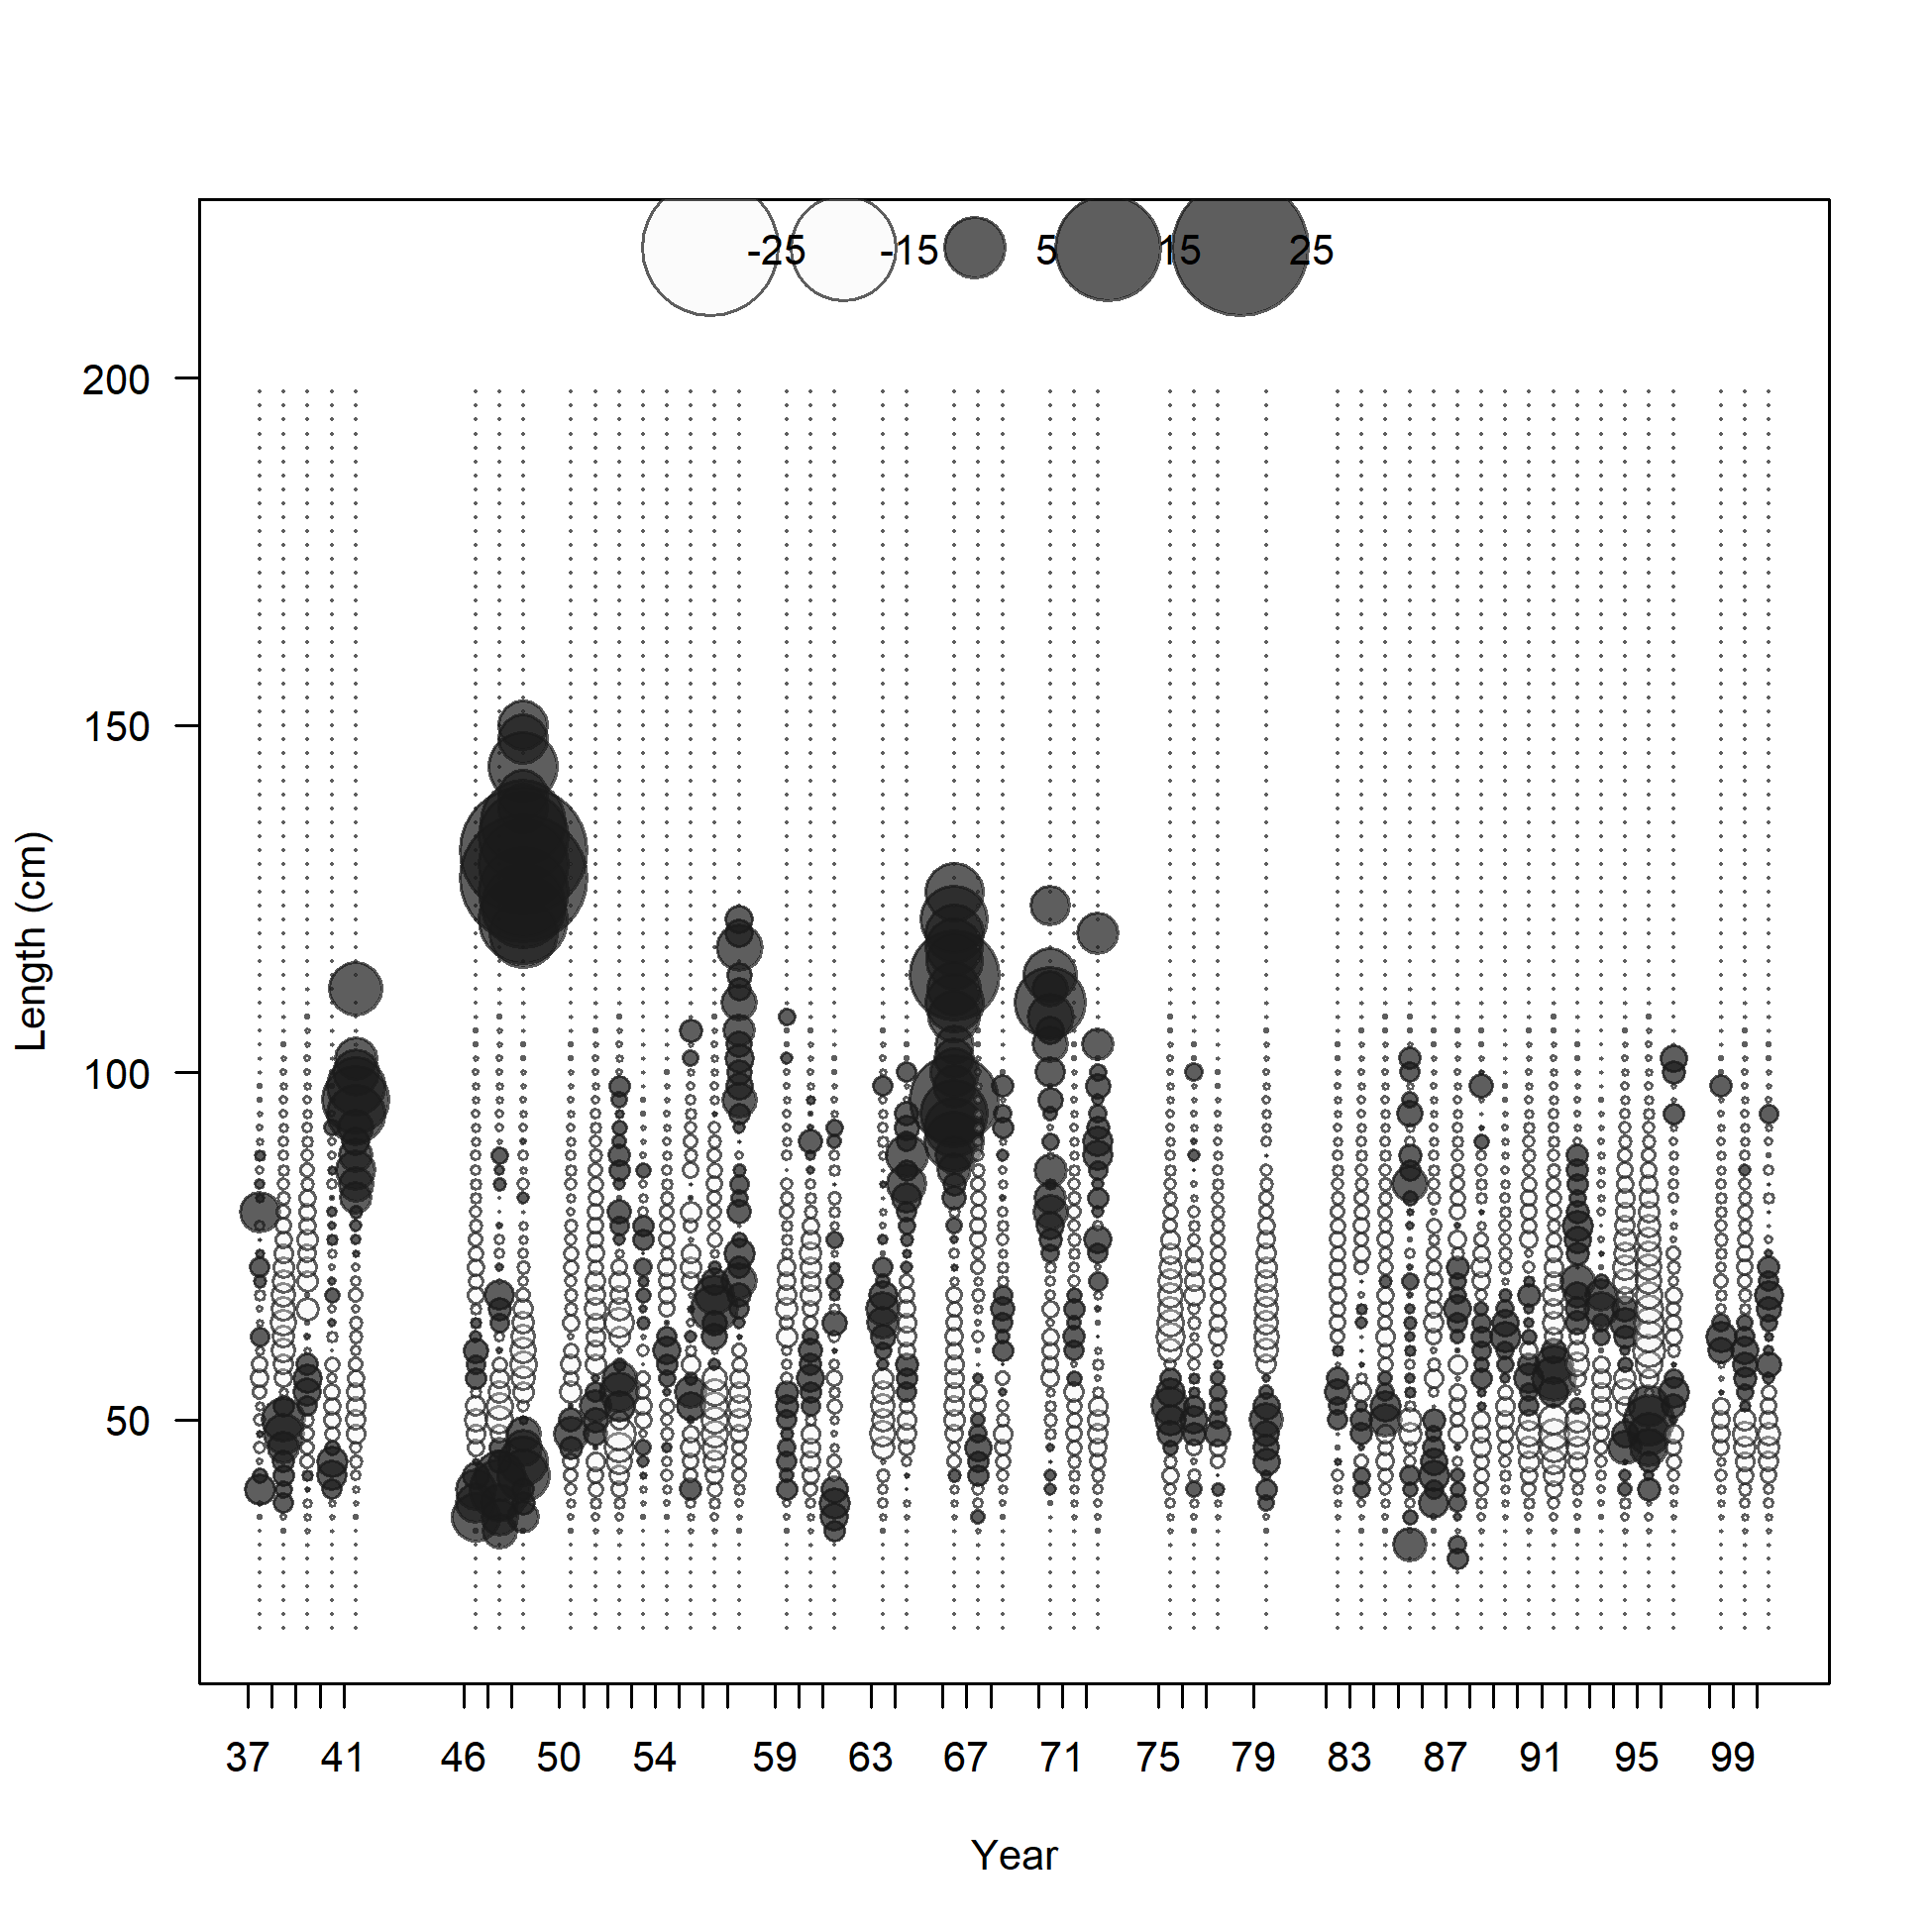
Pearson residuals, whole catch, F13.NOA.S.large (max=15.3) (plot 6 of 6)
Closed bubbles are positive residuals (observed > expected) and open bubbles are negative residuals (observed < expected).
file: comp_lenfit_residsflt13mkt0_page6.png
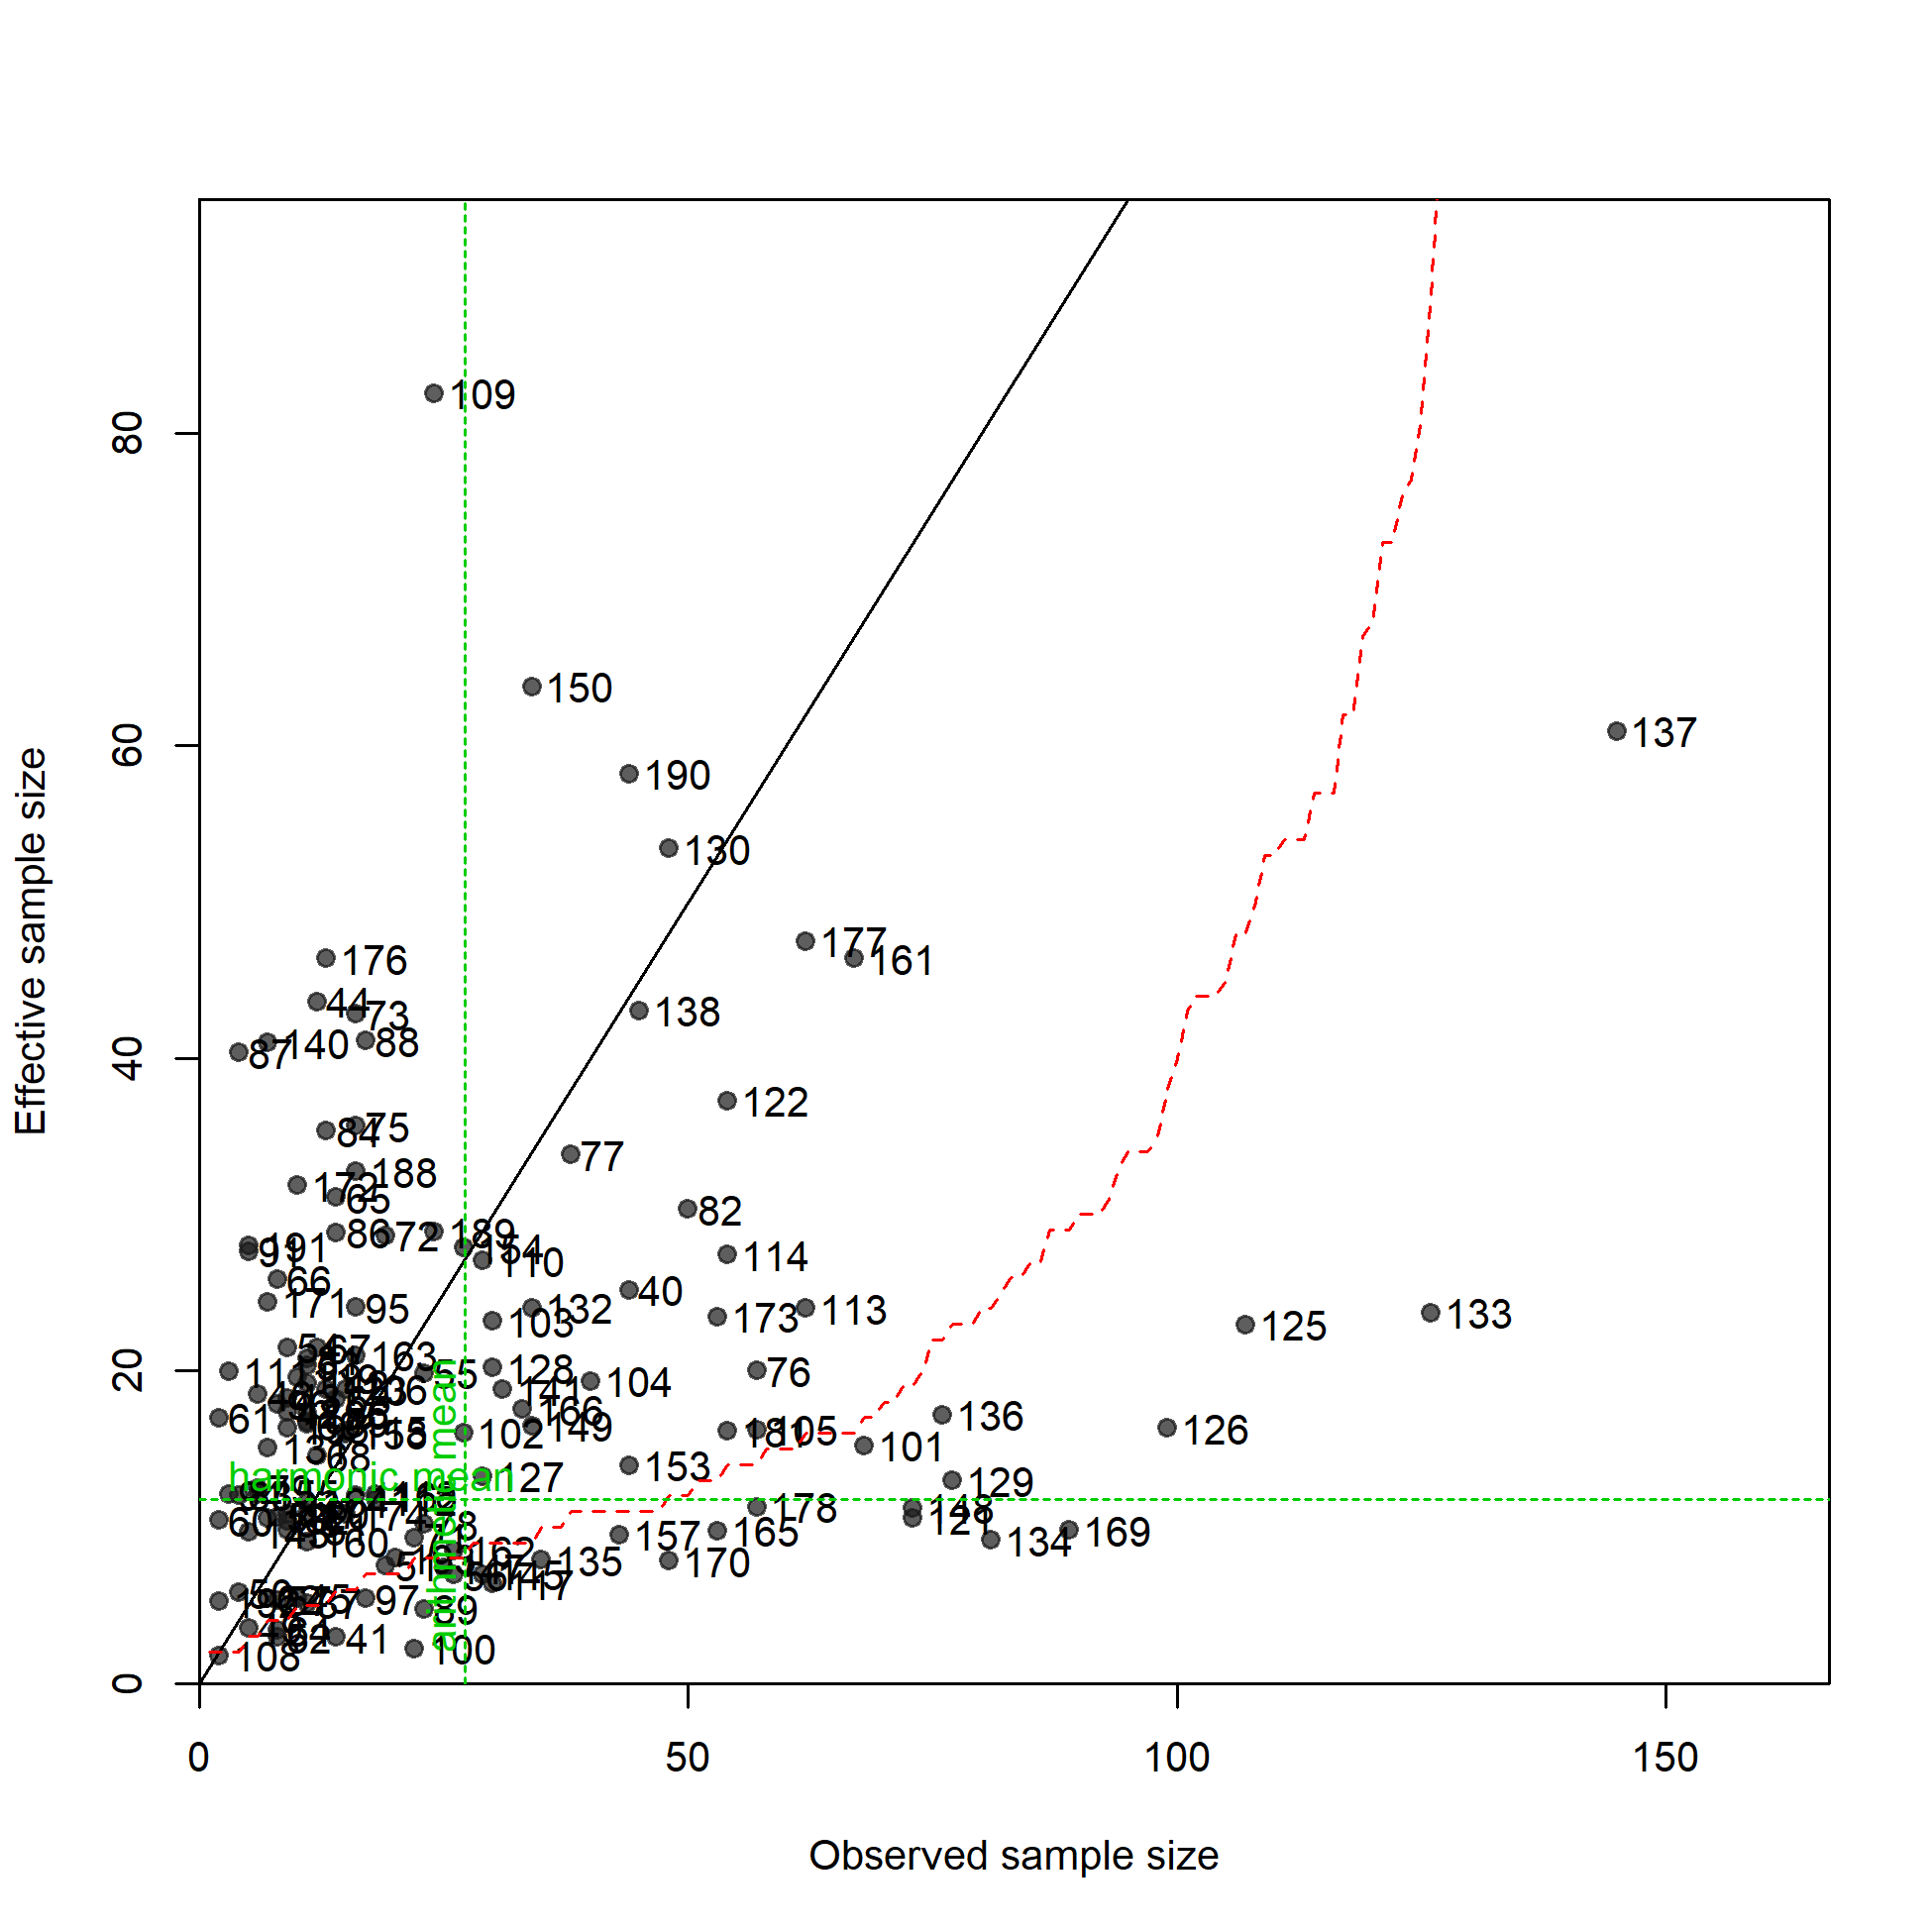
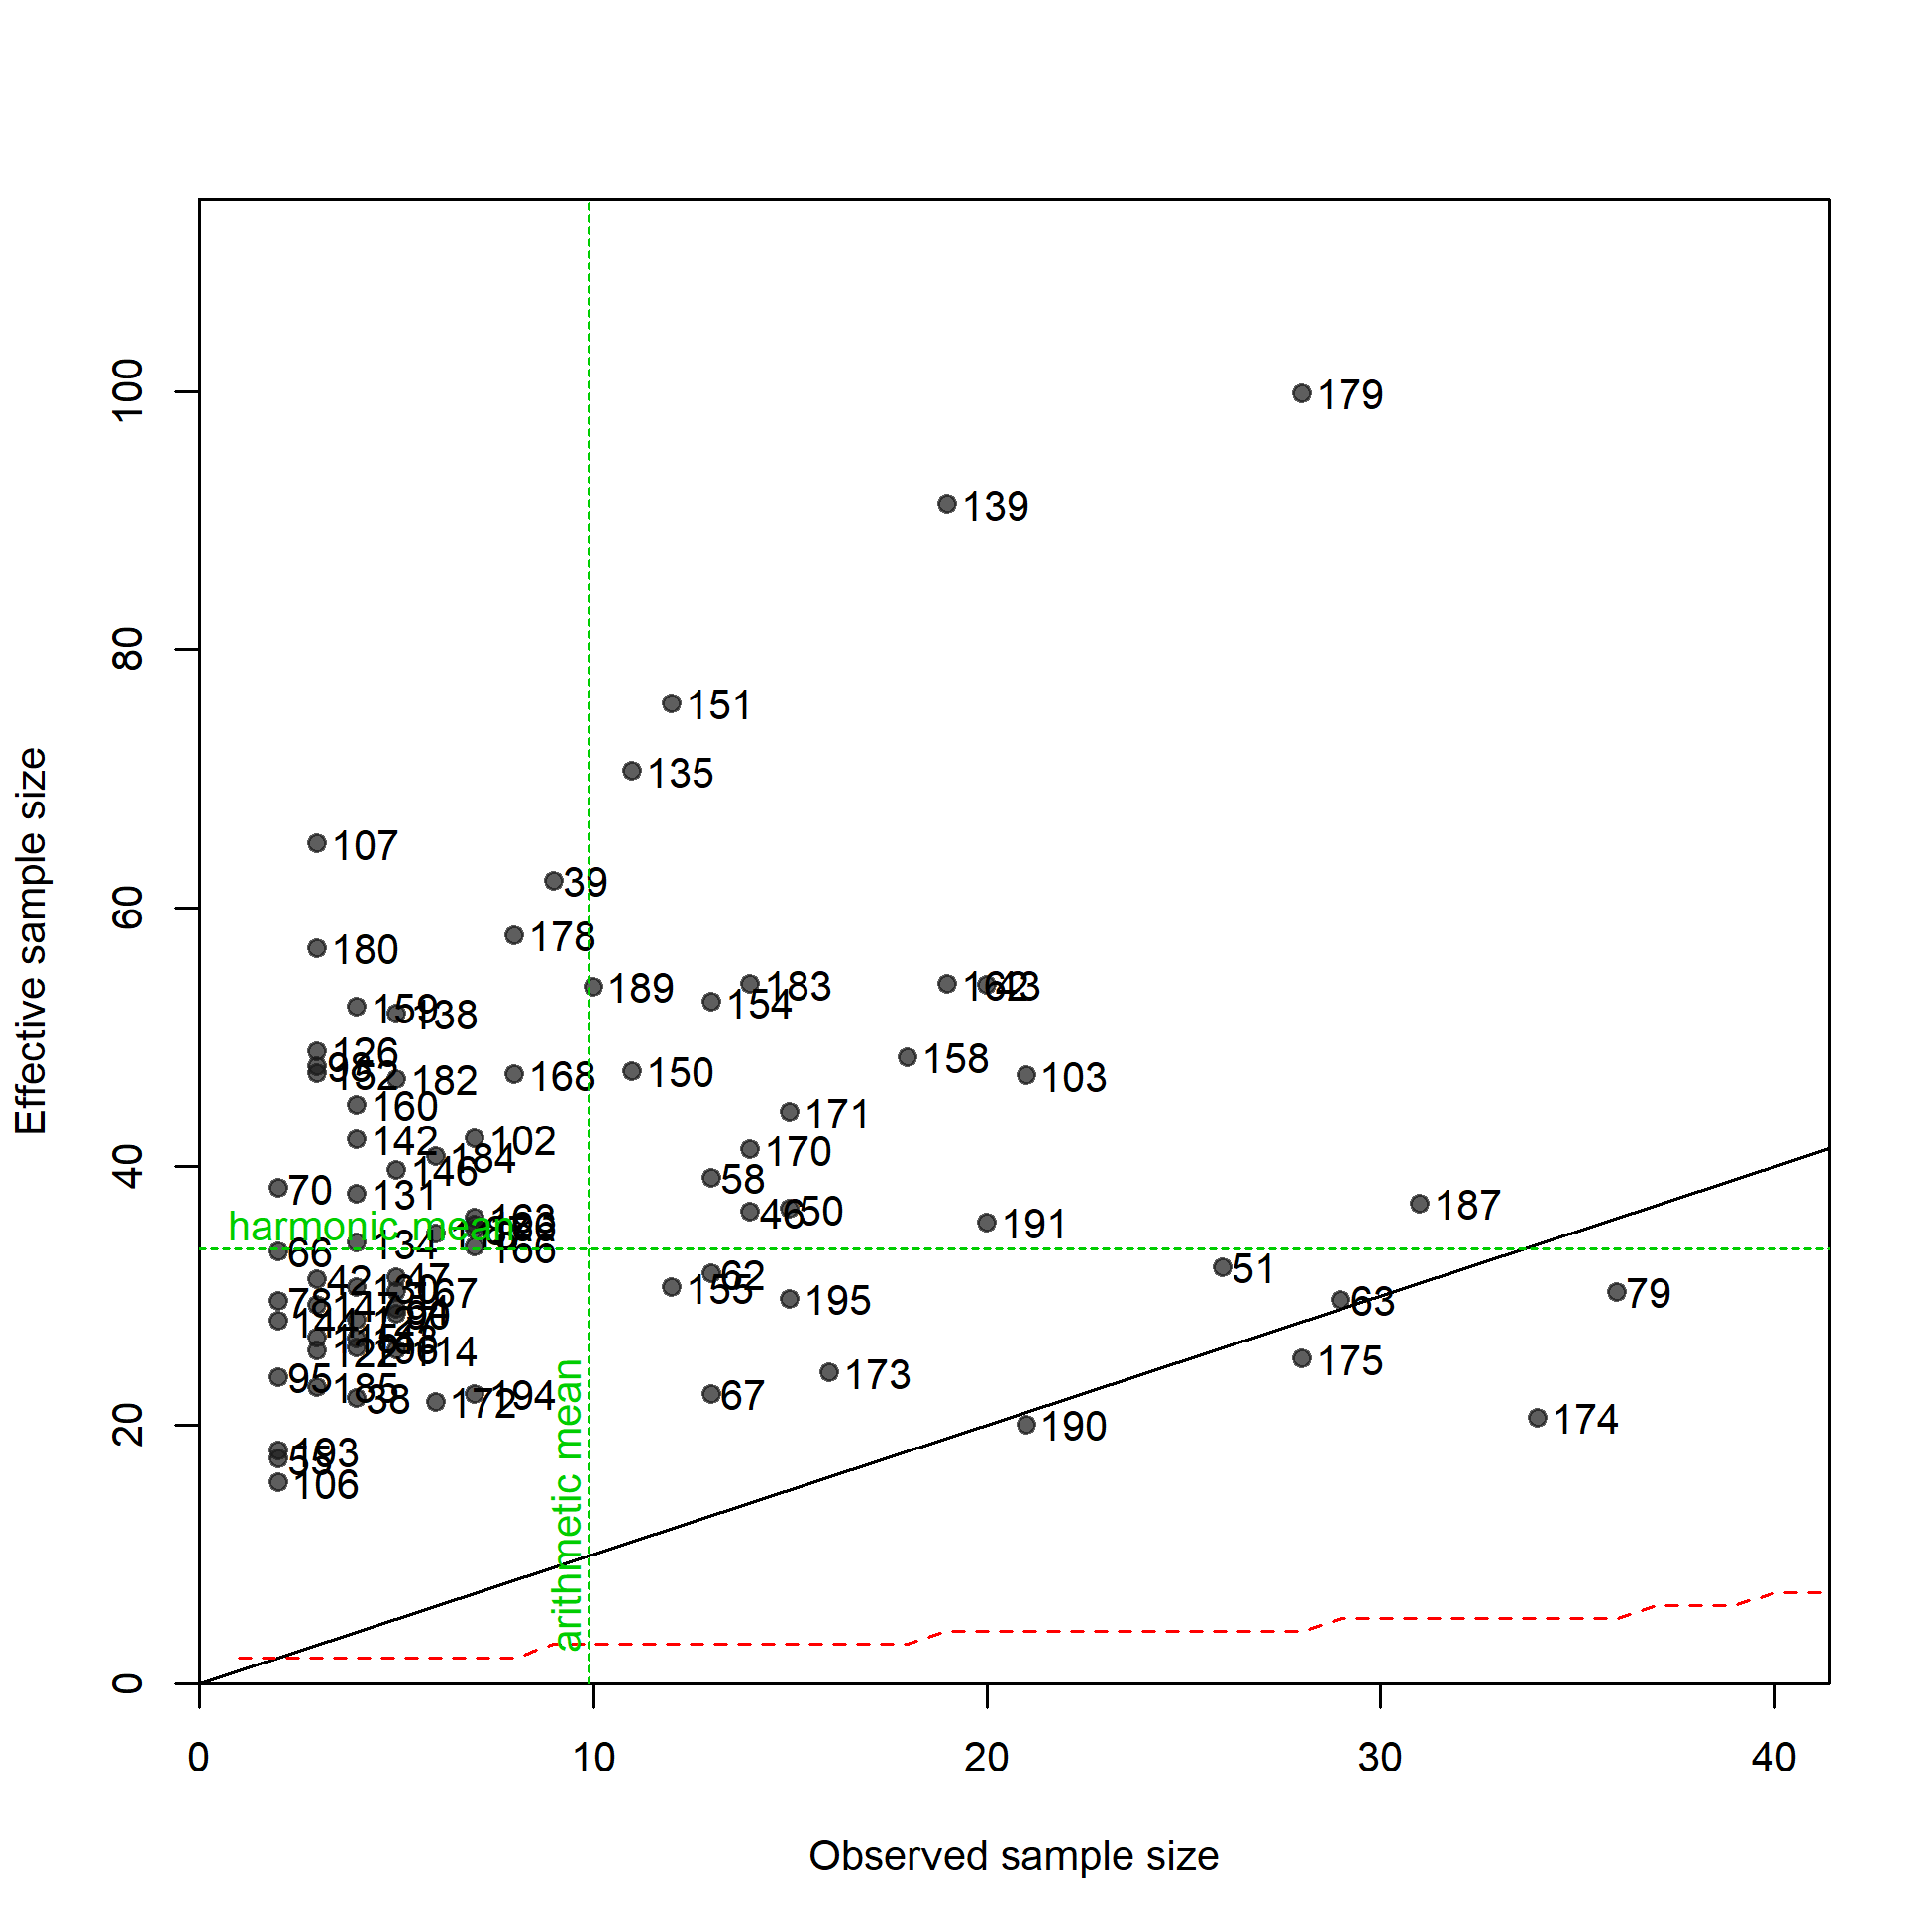
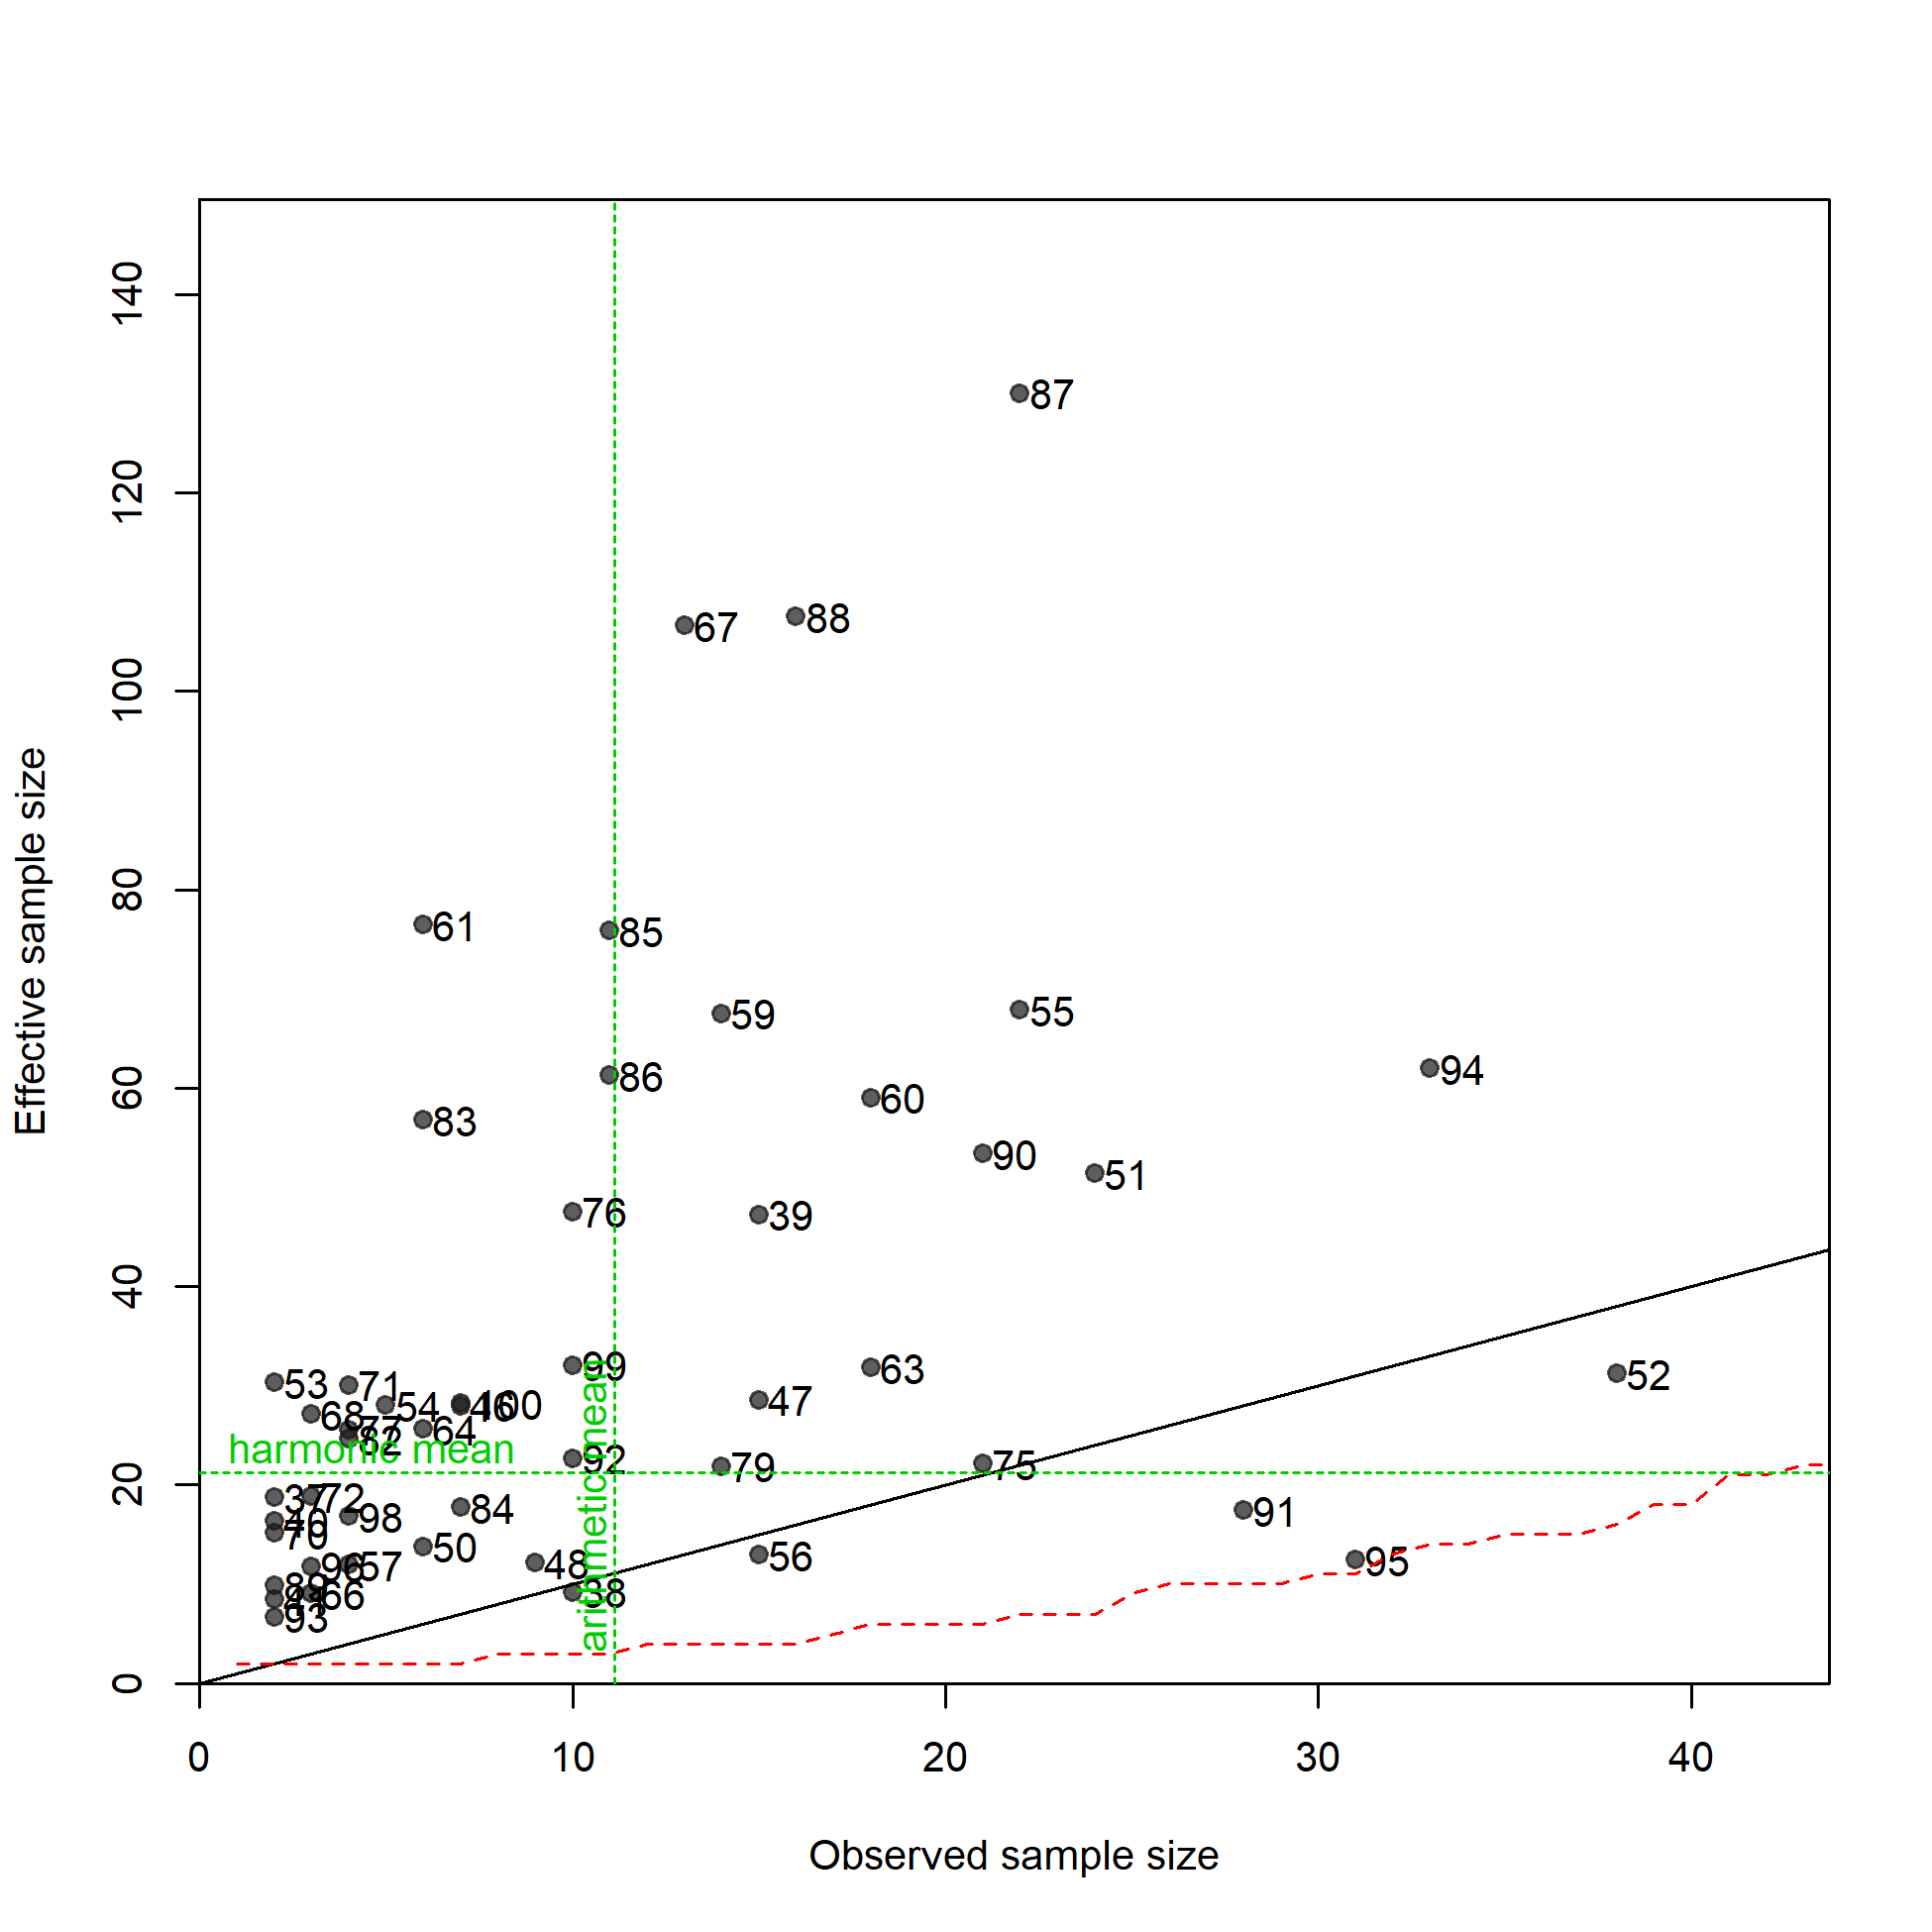
N-EffN comparison, Length comps, whole catch, F13.NOA.S.large
file: comp_lenfit_sampsize_flt13mkt0.png
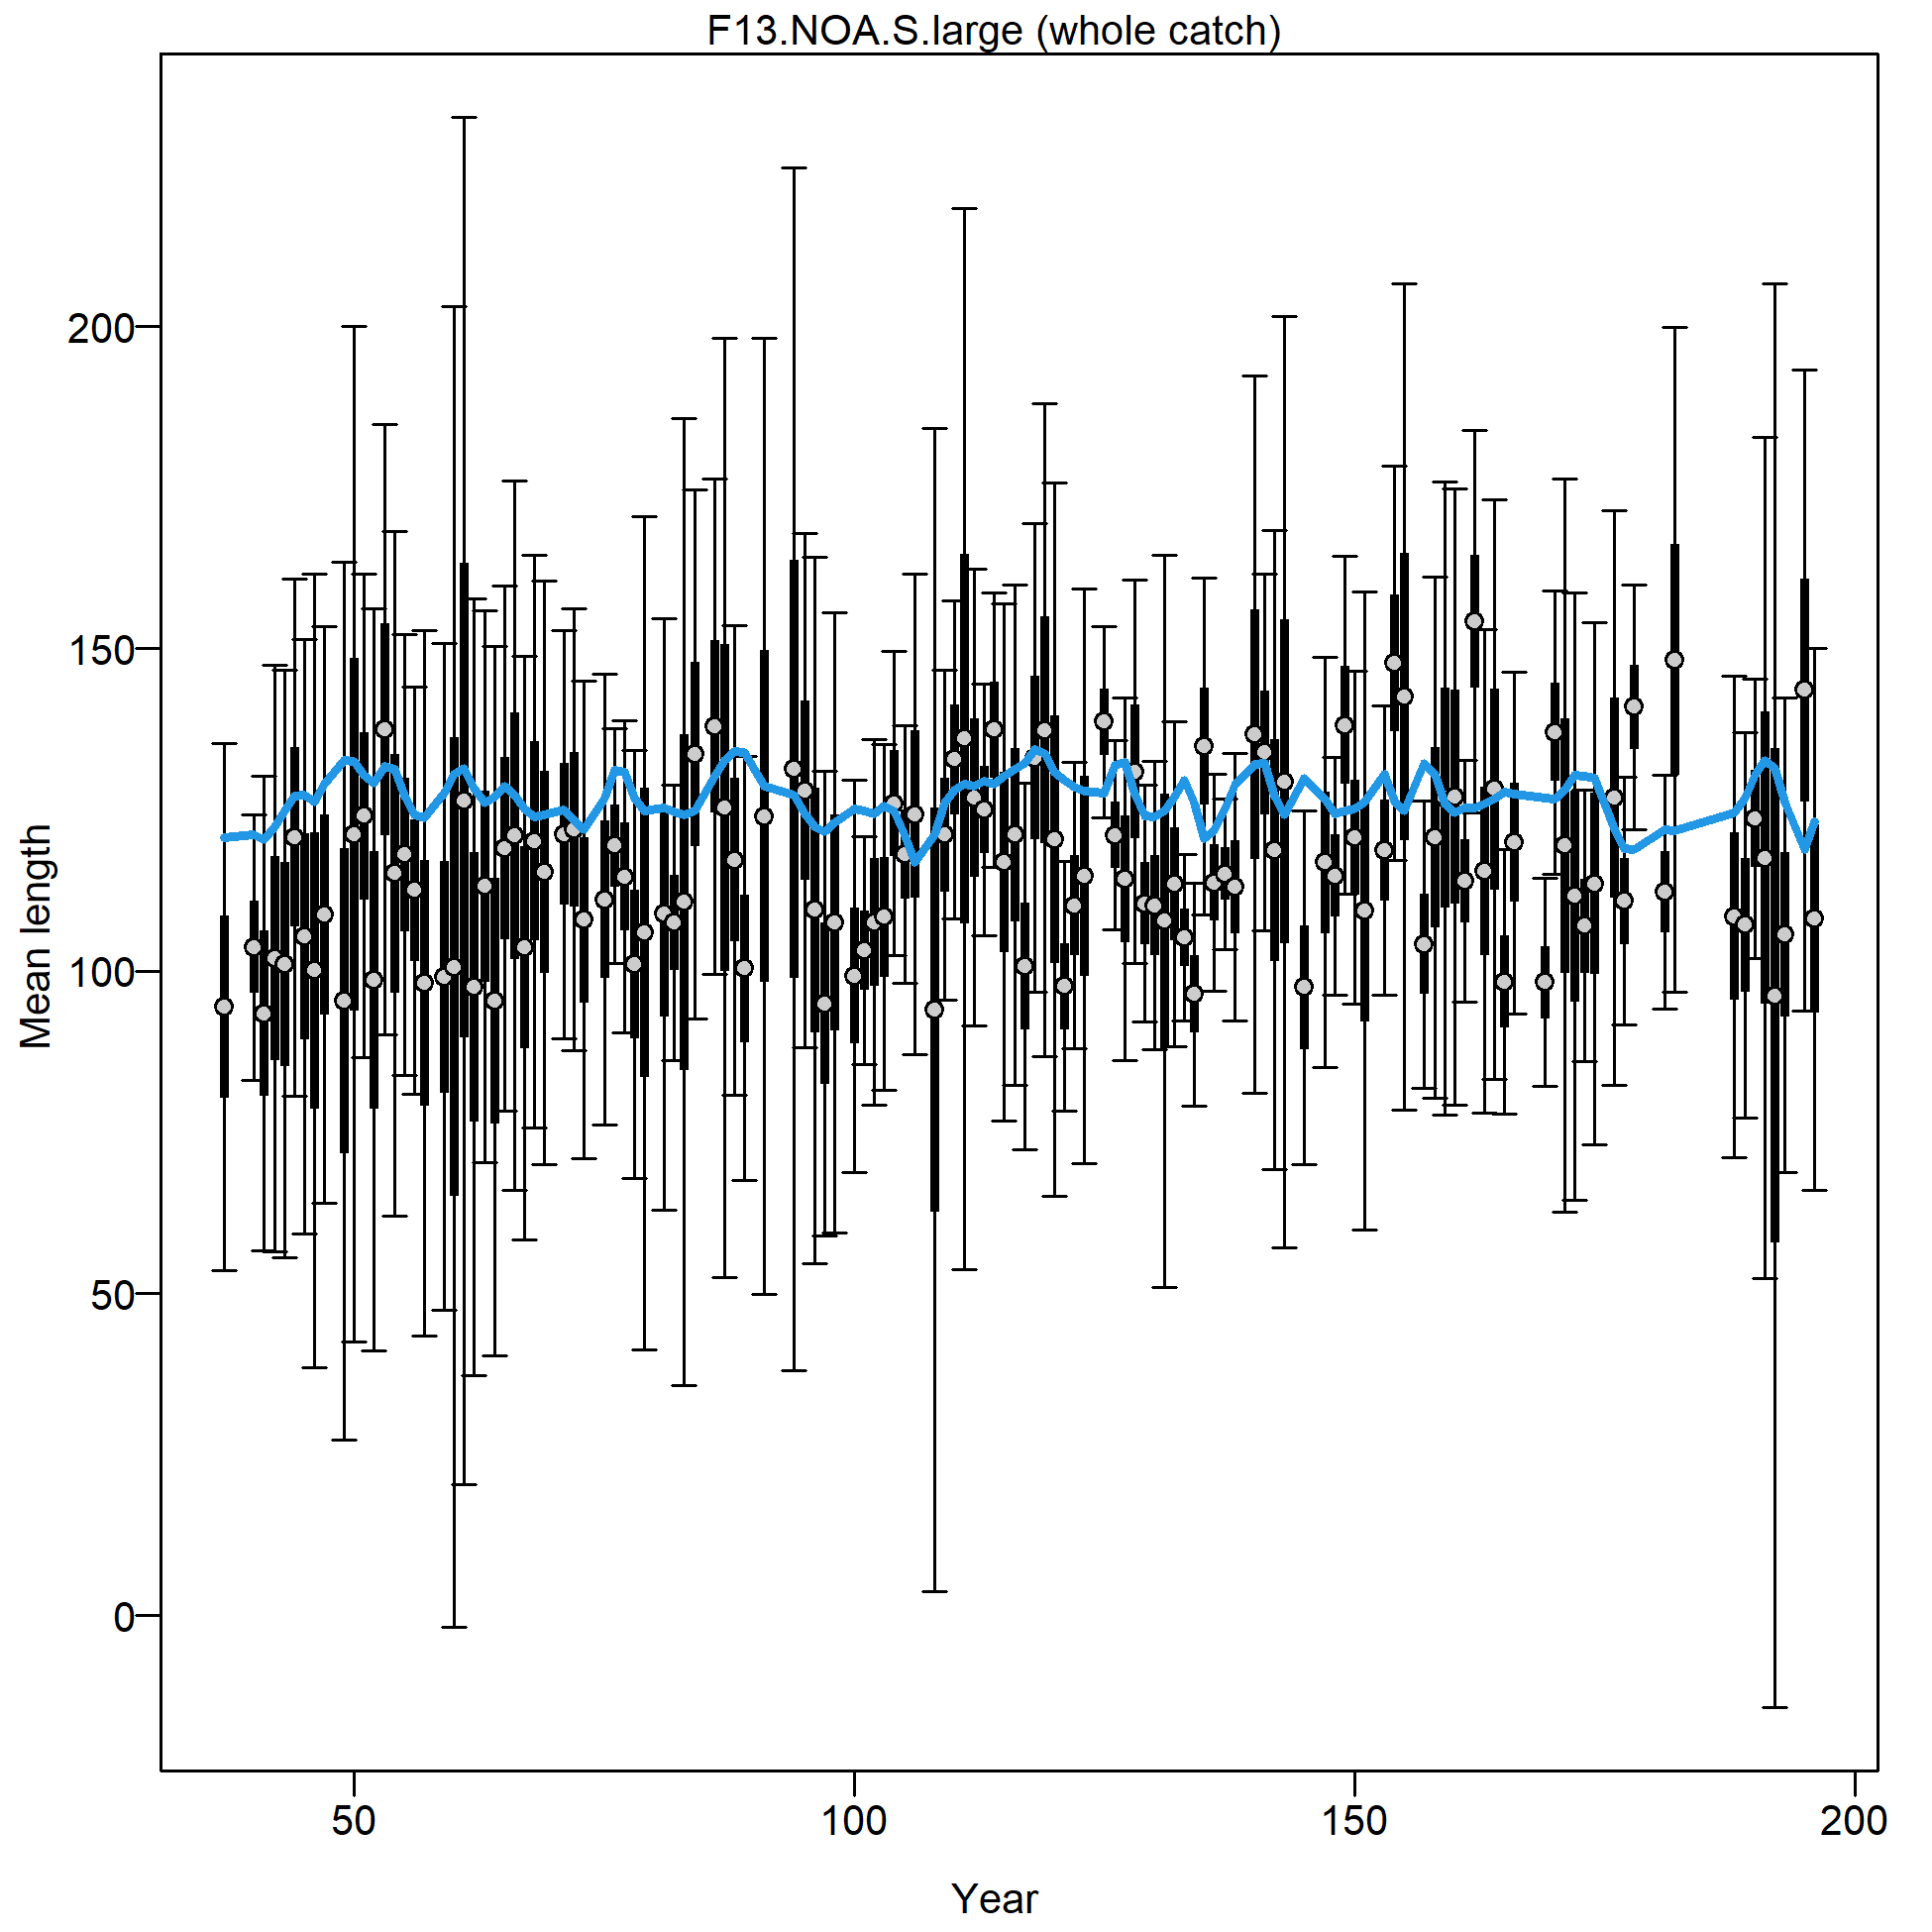
Mean length for F13.NOA.S.large with 95% confidence intervals based on current sample sizes.
Francis data weighting method TA1.8: thinner intervals (with capped ends) show result of further adjusting sample sizes based on suggested multiplier (with 95% interval) for len data from F13.NOA.S.large:
0.1206 (0.0894-0.1736)
For more info, see Francis (2011).
file: comp_lenfit_data_weighting_TA1.8_F13.NOA.S.large.png
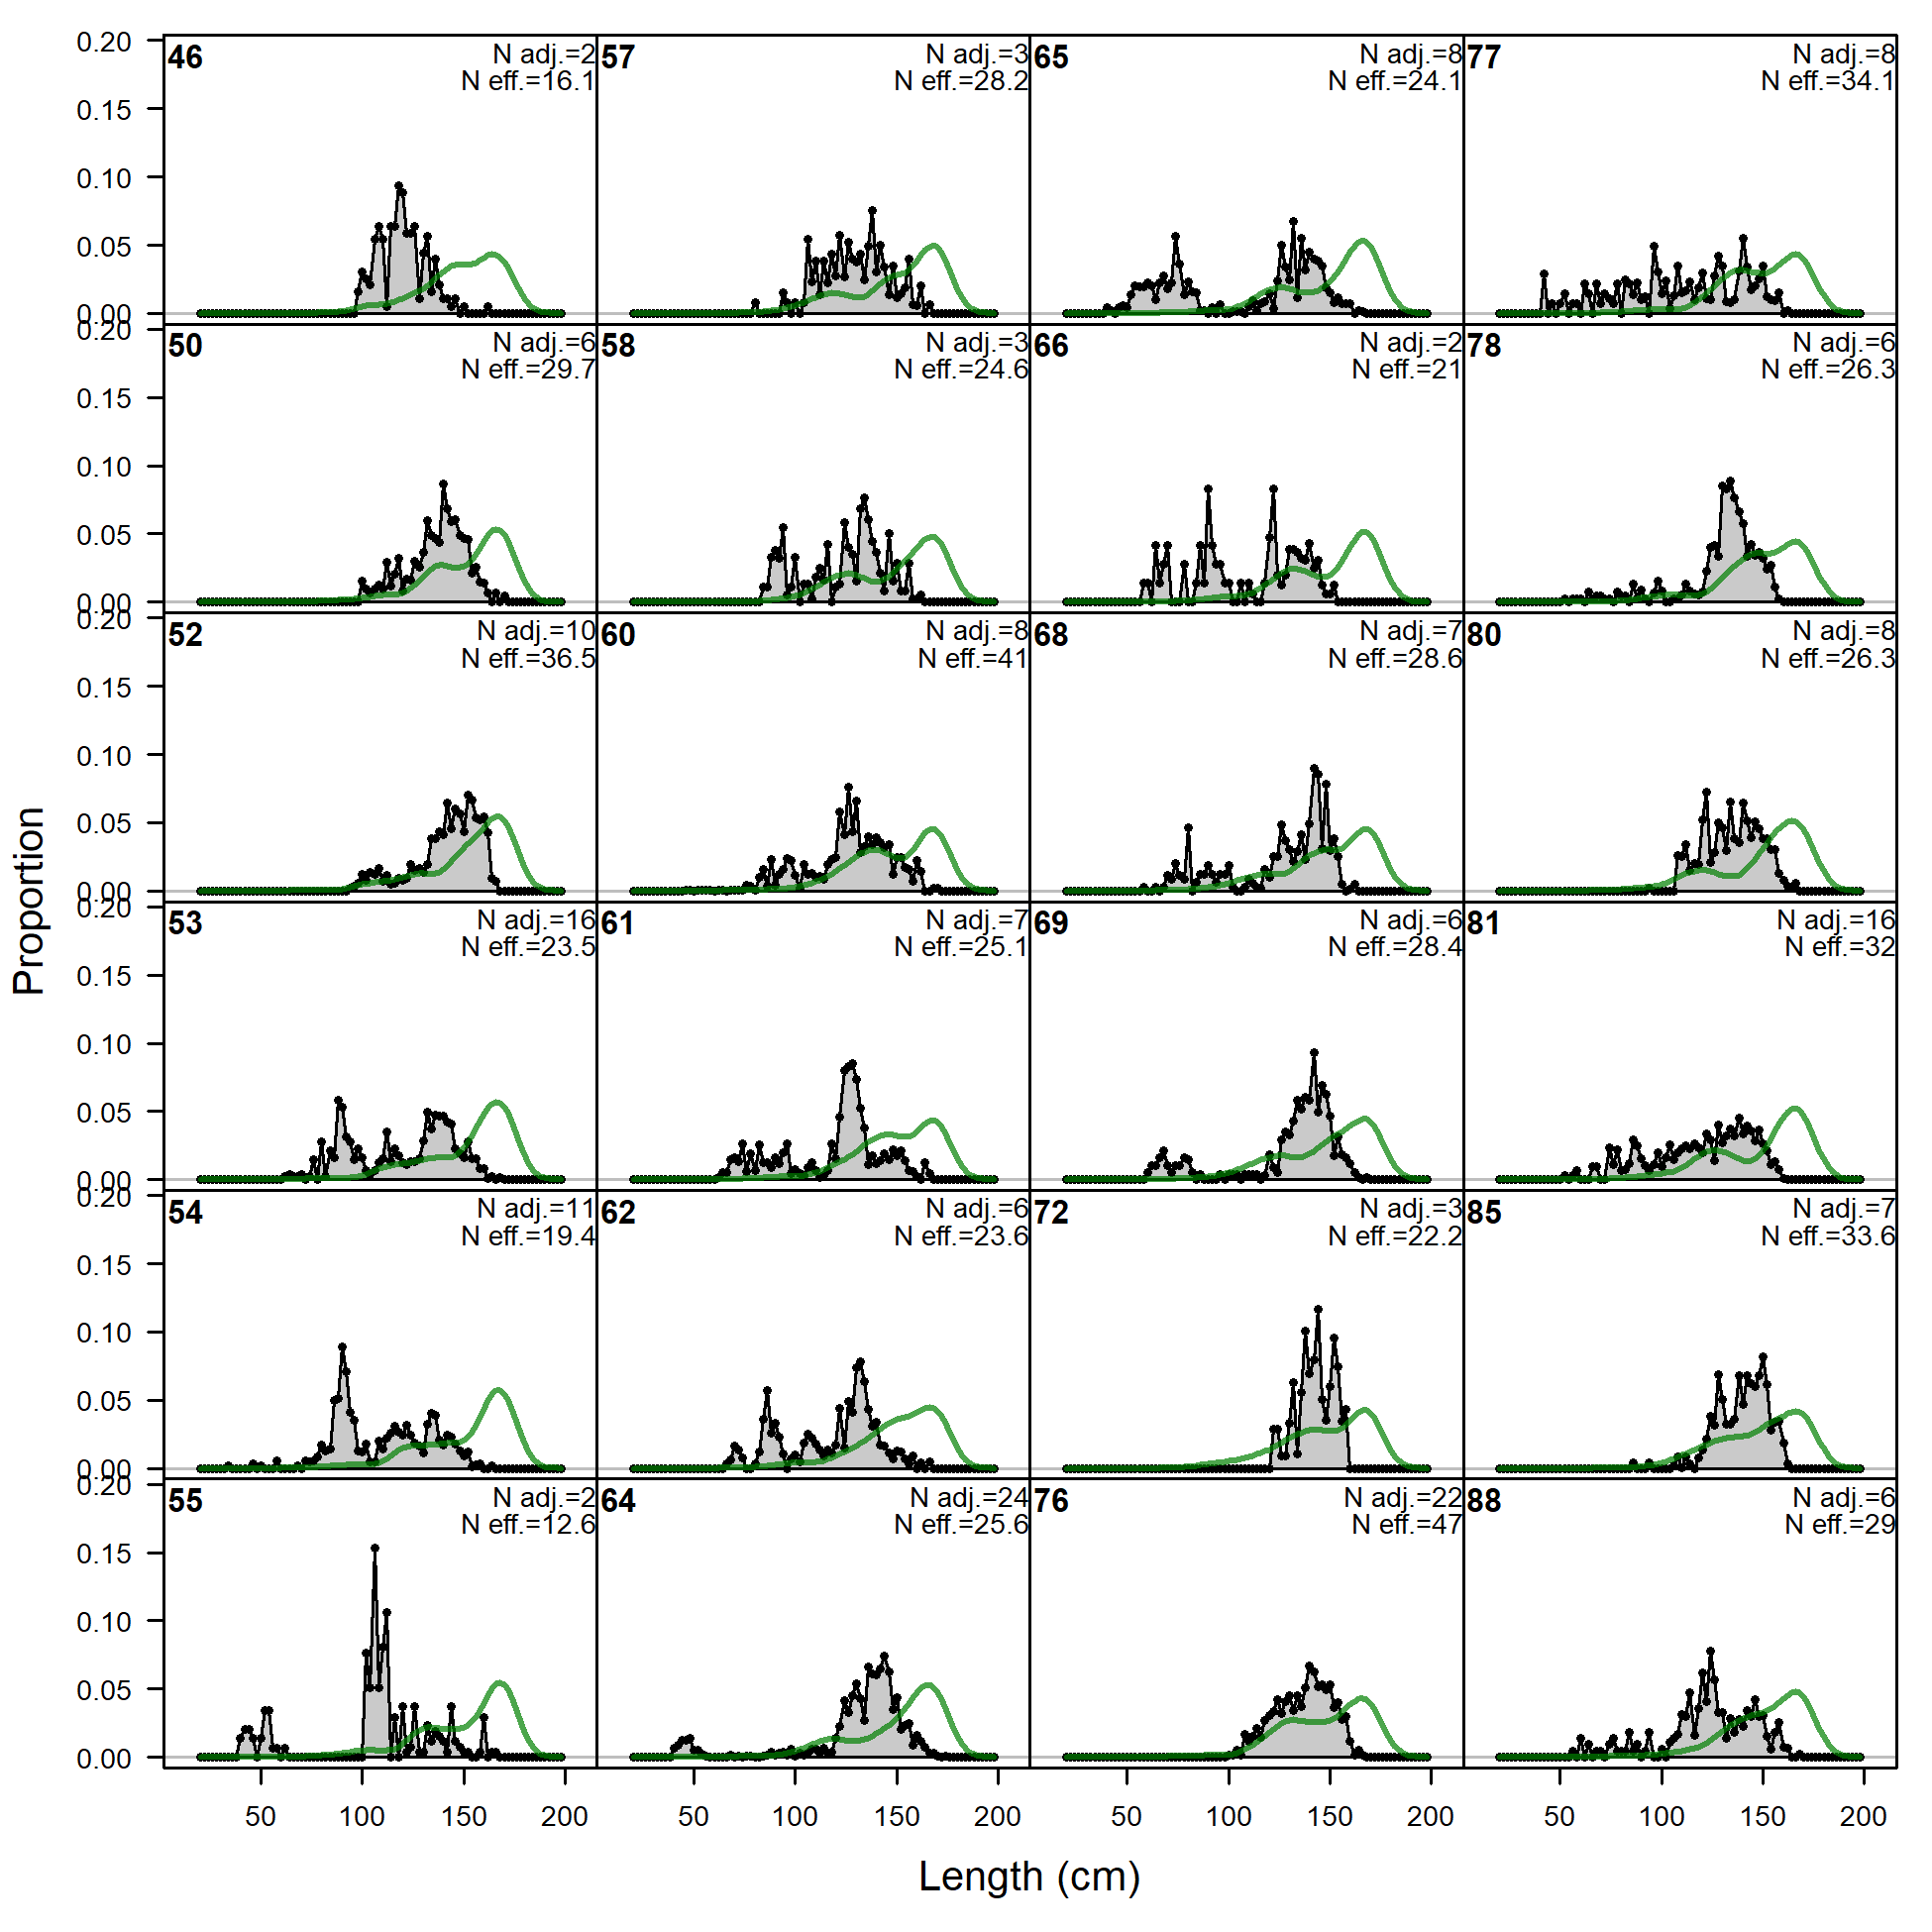
Length comps, whole catch, F15.NOA.N.large (plot 1 of 5).
'N adj.' is the input sample size after data-weighting adjustment. N eff. is the calculated effective sample size used in the McAllister-Ianelli tuning method.
file: comp_lenfit_flt15mkt0_page1.png
Length comps, whole catch, F15.NOA.N.large (plot 1 of 5).
'N adj.' is the input sample size after data-weighting adjustment. N eff. is the calculated effective sample size used in the McAllister-Ianelli tuning method. (plot 2 of 5)
file: comp_lenfit_flt15mkt0_page2.png

Length comps, whole catch, F15.NOA.N.large (plot 1 of 5).
'N adj.' is the input sample size after data-weighting adjustment. N eff. is the calculated effective sample size used in the McAllister-Ianelli tuning method. (plot 2 of 5) (plot 3 of 5)
file: comp_lenfit_flt15mkt0_page3.png
Length comps, whole catch, F15.NOA.N.large (plot 1 of 5).
'N adj.' is the input sample size after data-weighting adjustment. N eff. is the calculated effective sample size used in the McAllister-Ianelli tuning method. (plot 2 of 5) (plot 3 of 5) (plot 4 of 5)
file: comp_lenfit_flt15mkt0_page4.png
Length comps, whole catch, F15.NOA.N.large (plot 1 of 5).
'N adj.' is the input sample size after data-weighting adjustment. N eff. is the calculated effective sample size used in the McAllister-Ianelli tuning method. (plot 2 of 5) (plot 3 of 5) (plot 4 of 5) (plot 5 of 5)
file: comp_lenfit_flt15mkt0_page5.png
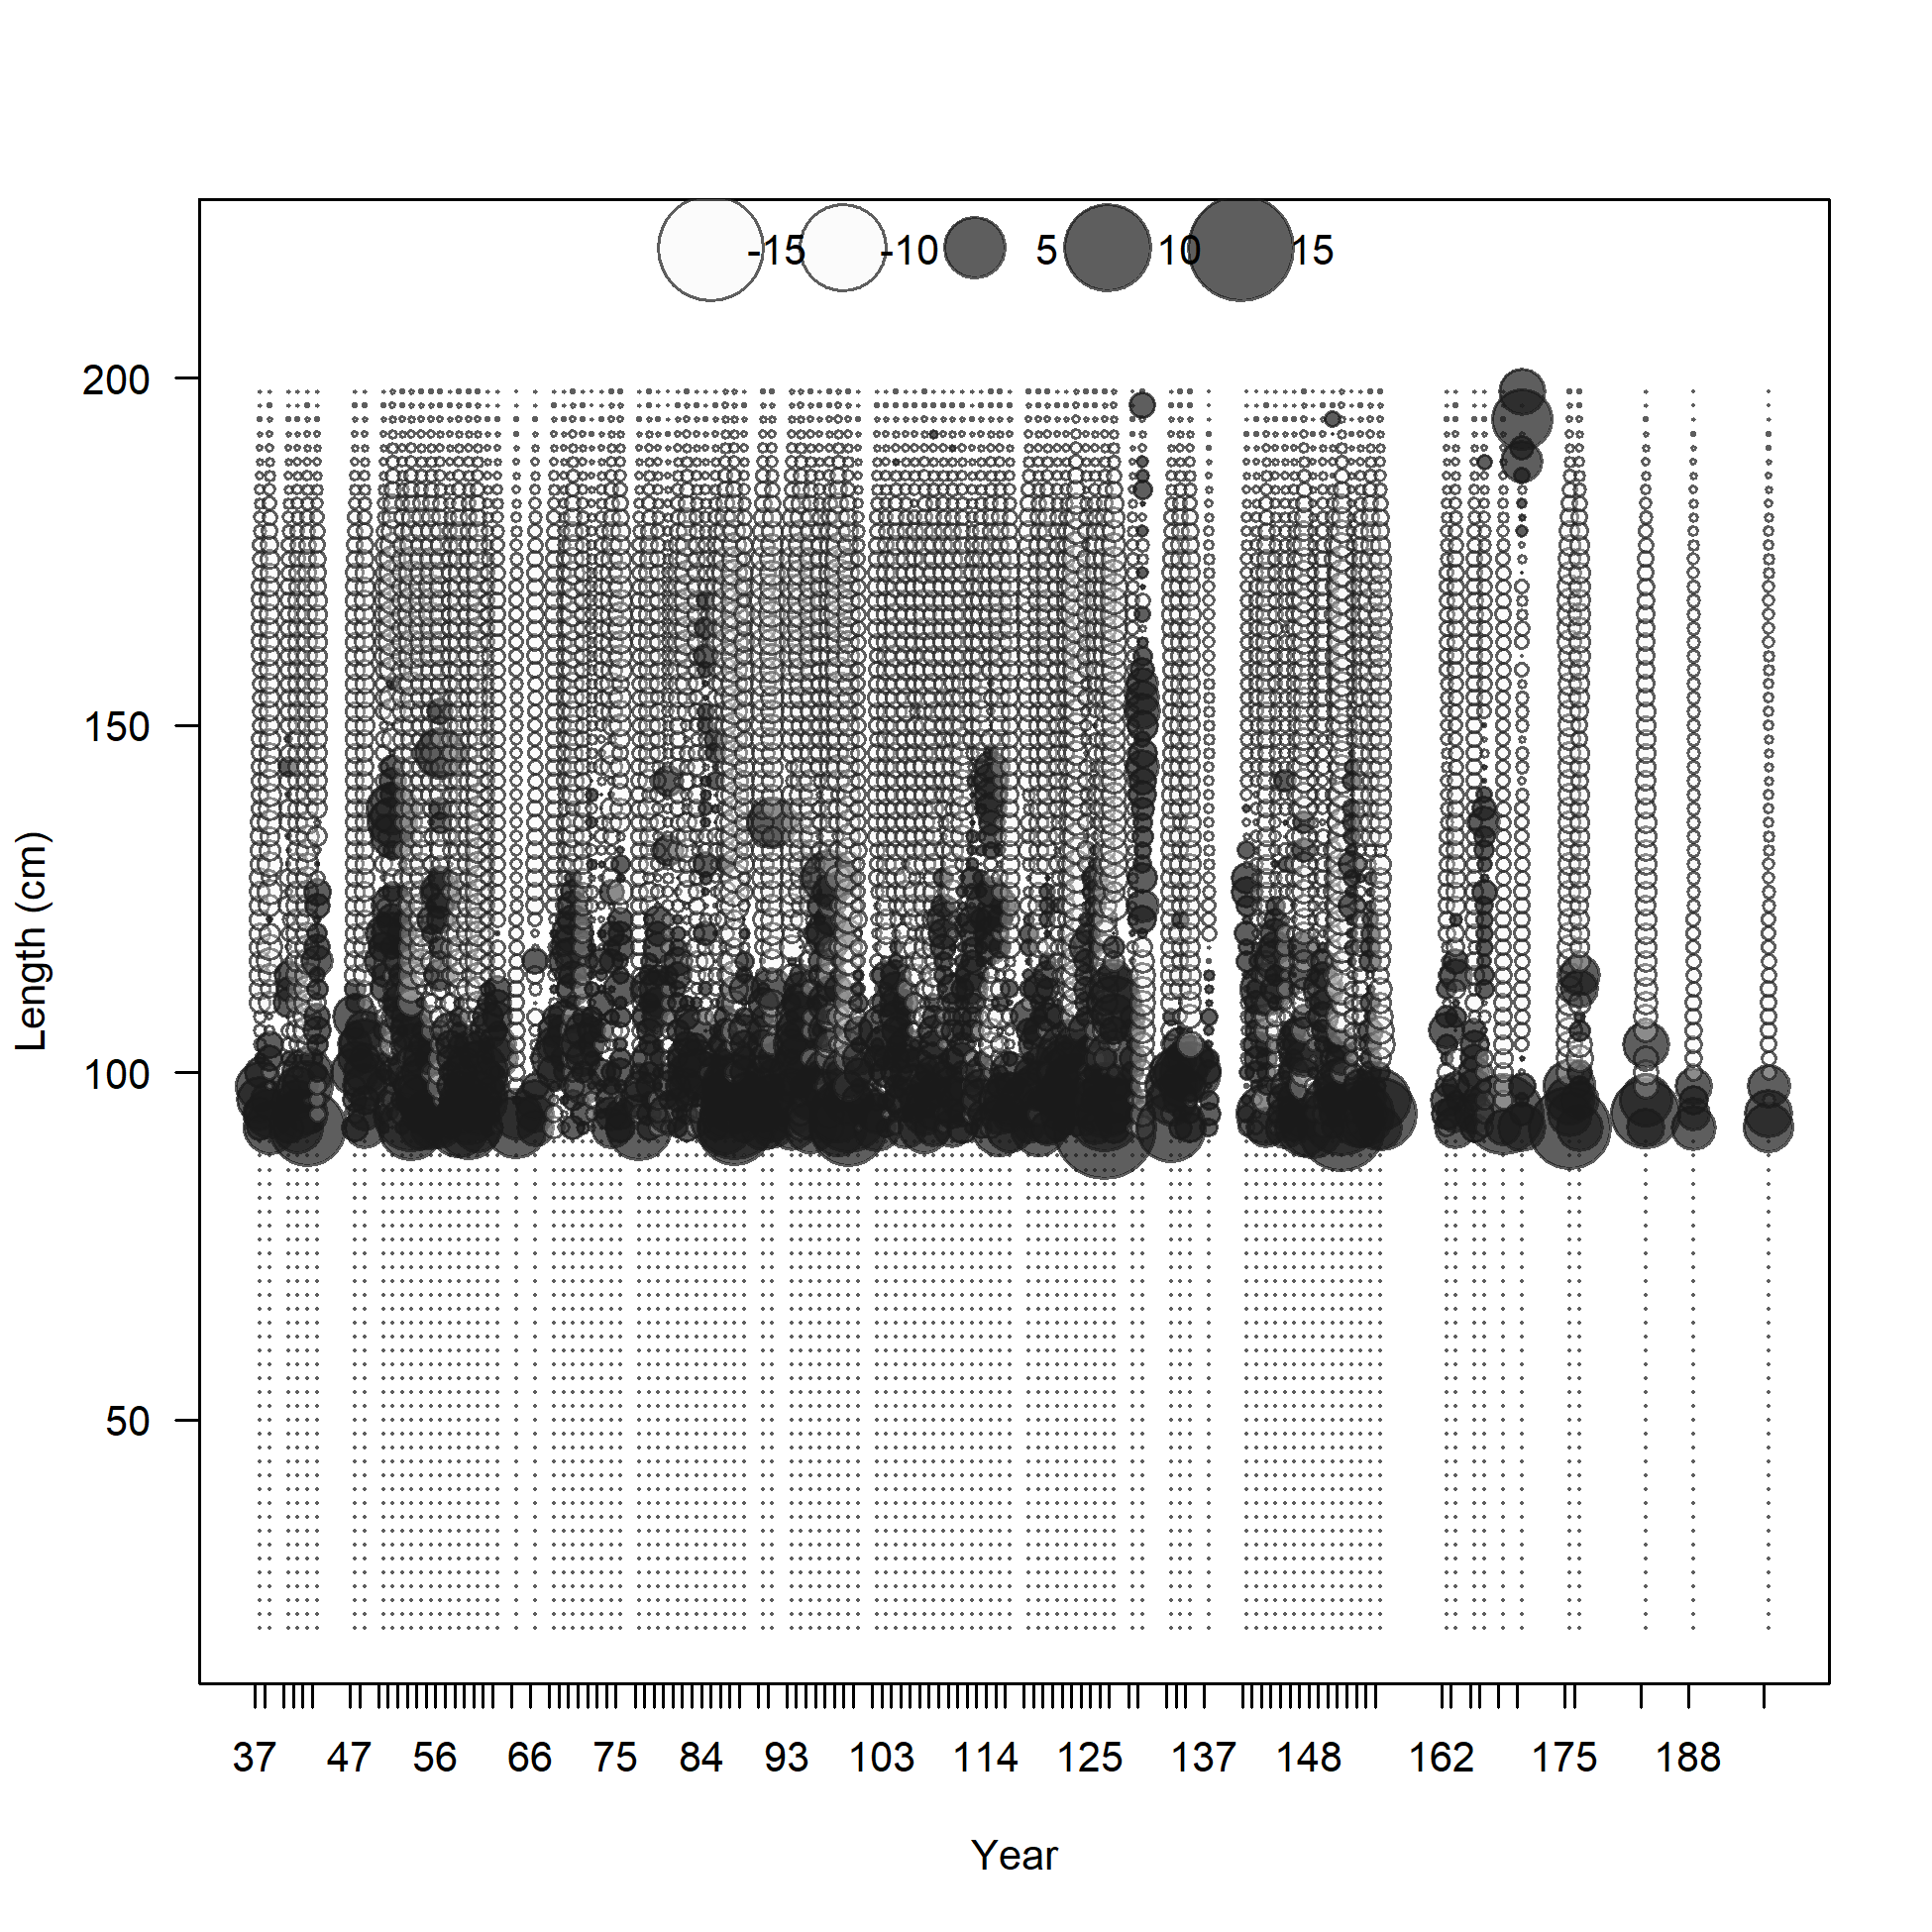
Pearson residuals, whole catch, F15.NOA.N.large (max=14.2) (plot 5 of 5)
Closed bubbles are positive residuals (observed > expected) and open bubbles are negative residuals (observed < expected).
file: comp_lenfit_residsflt15mkt0_page5.png
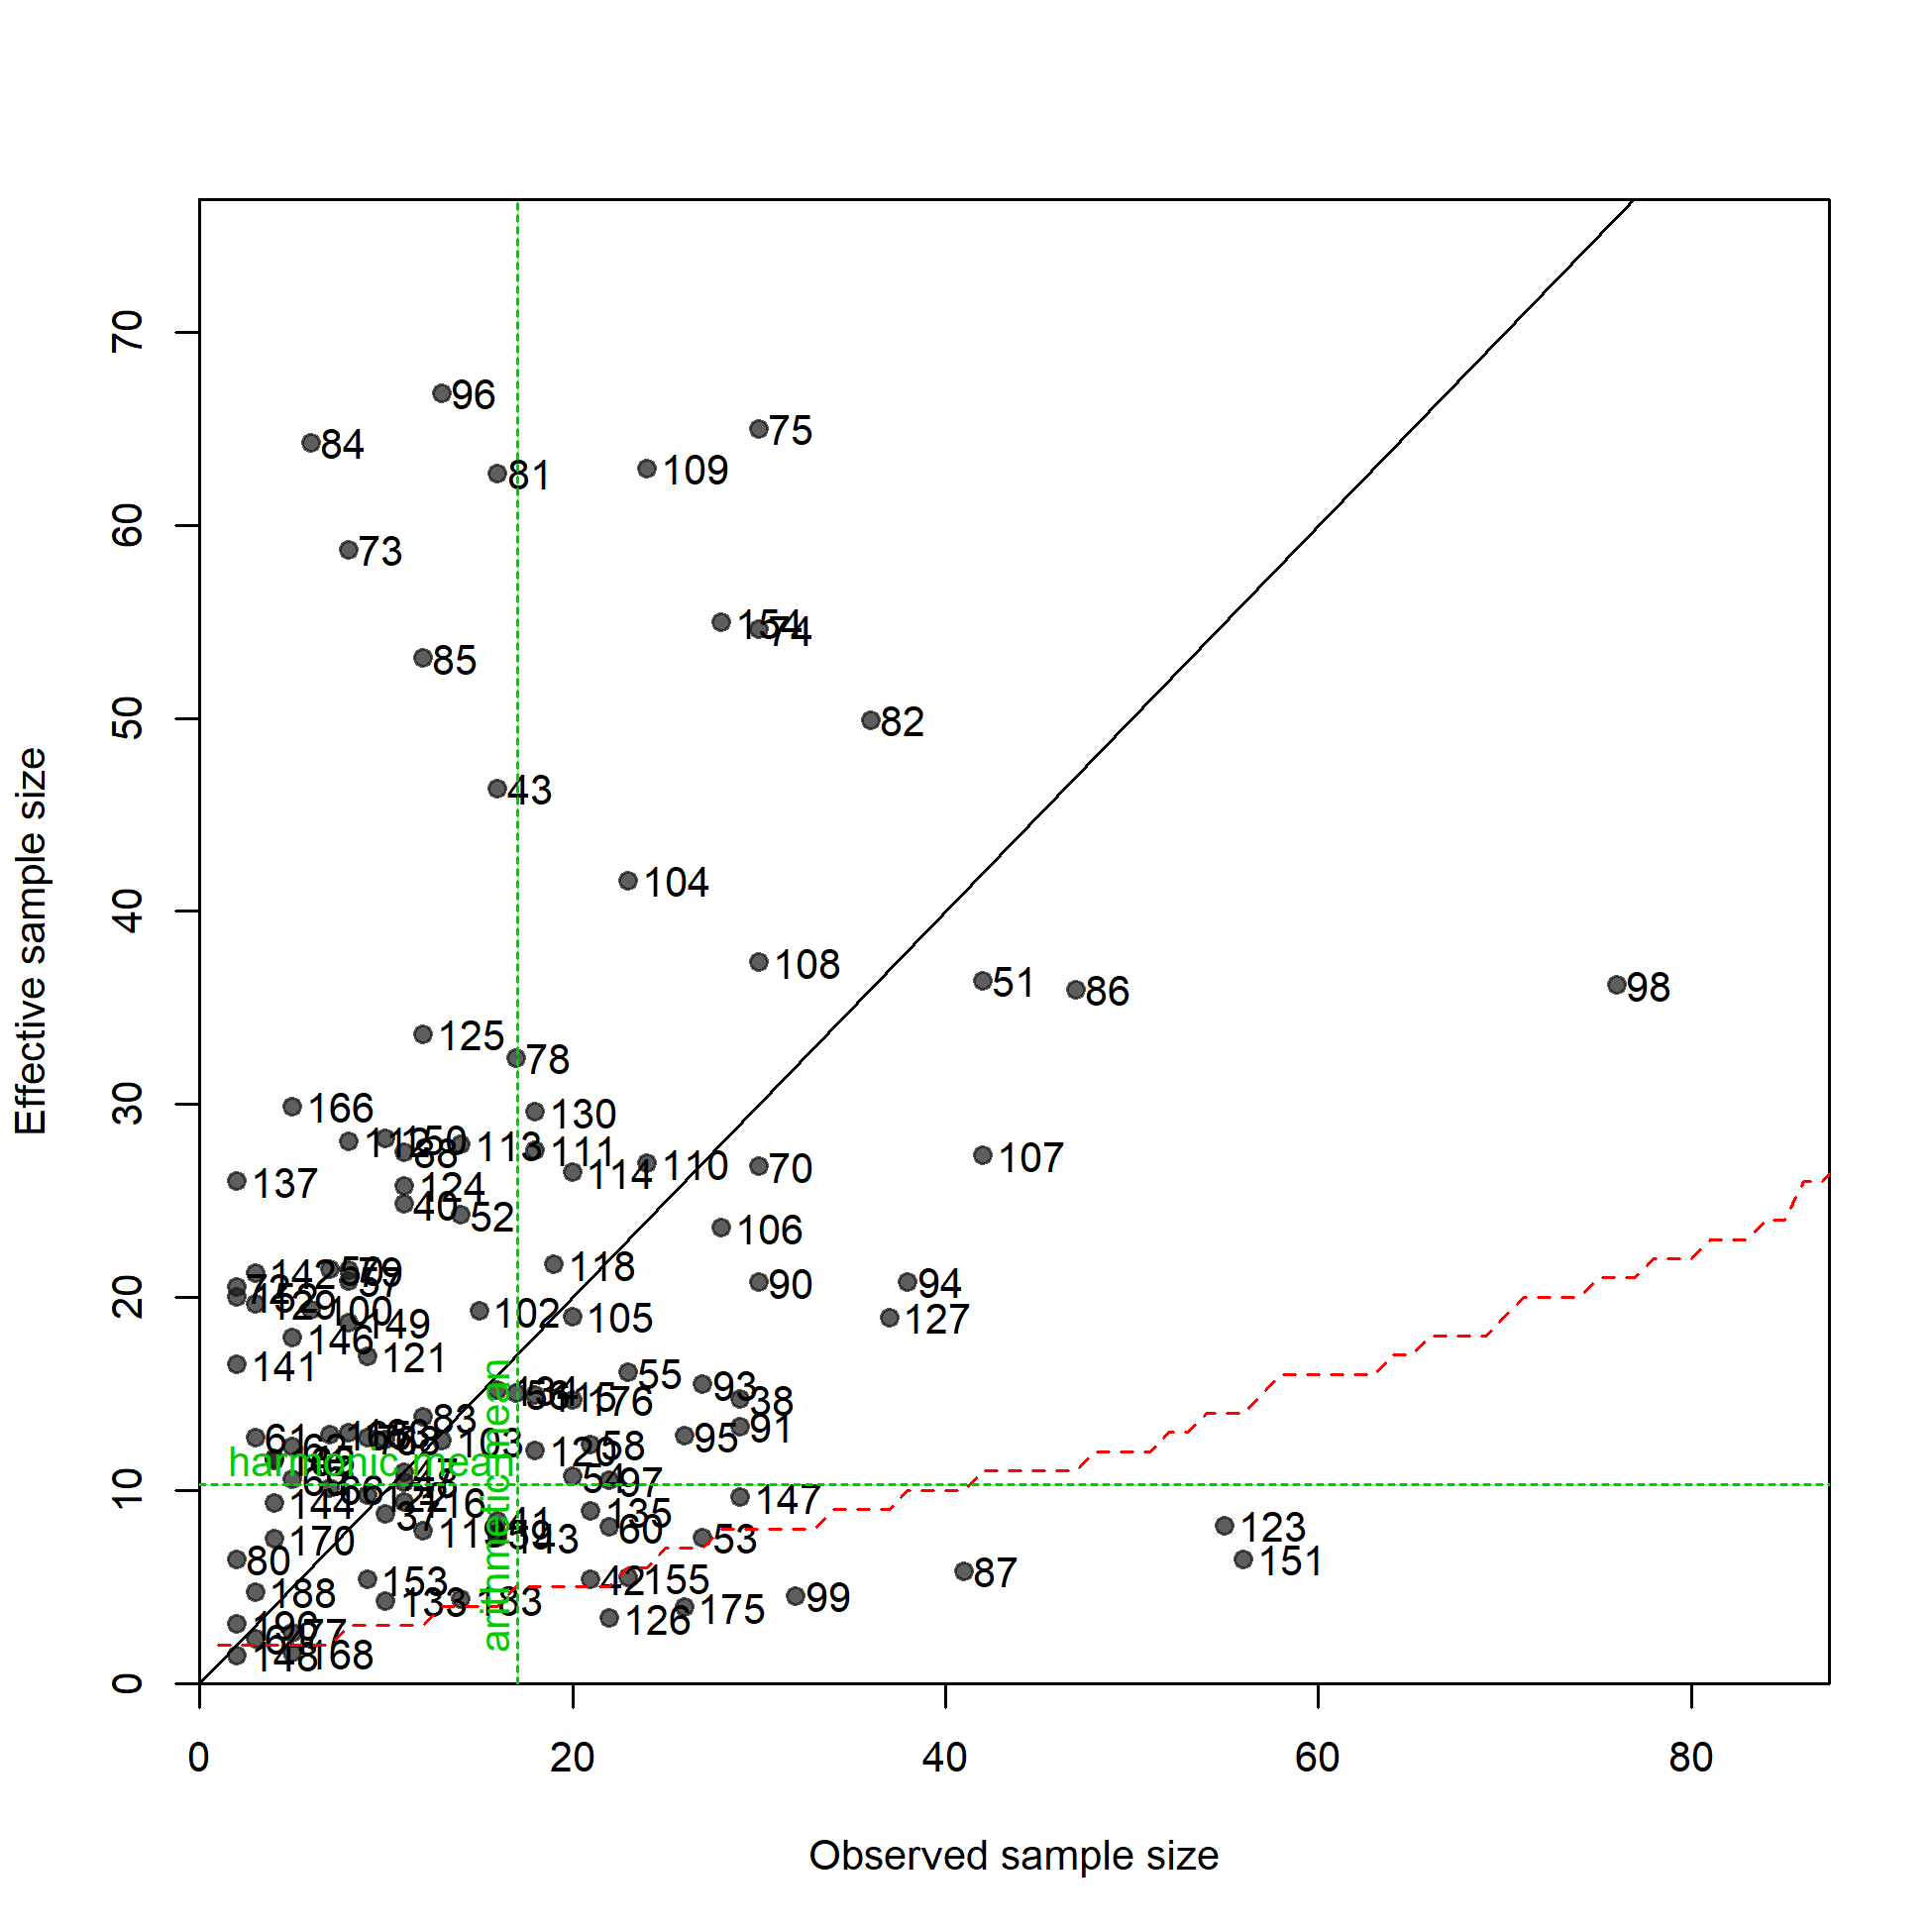
N-EffN comparison, Length comps, whole catch, F15.NOA.N.large
file: comp_lenfit_sampsize_flt15mkt0.png
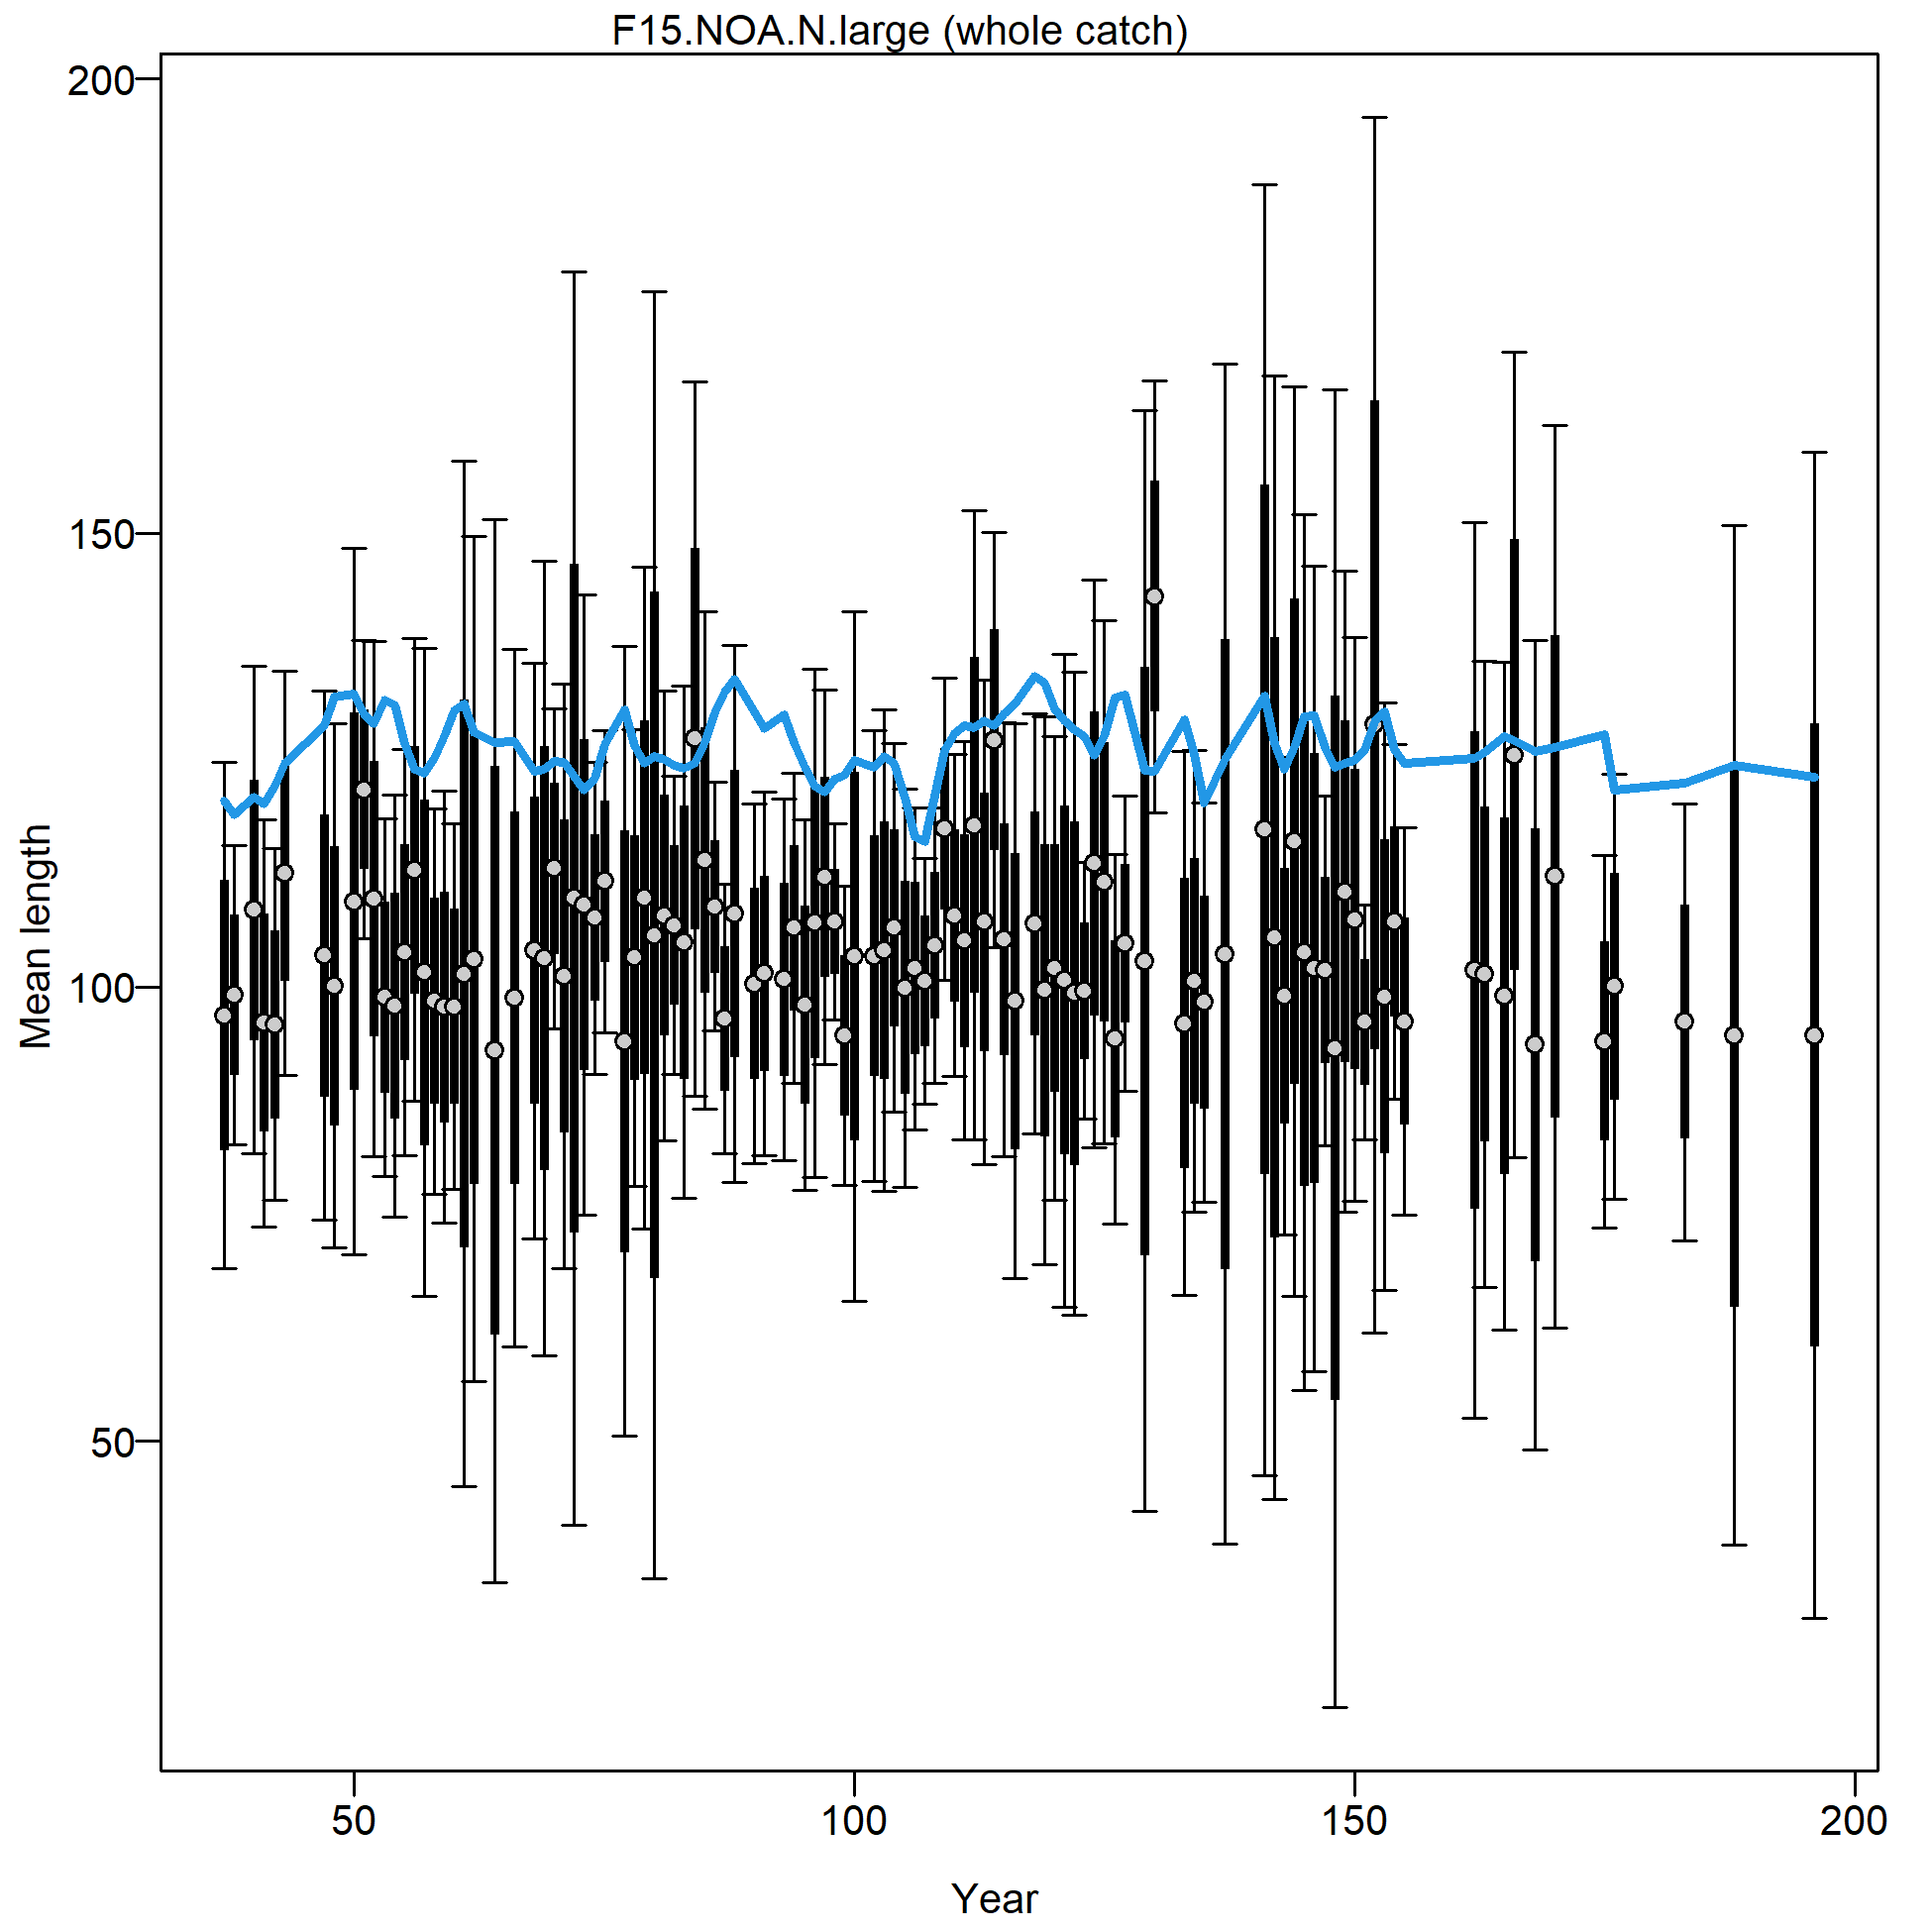
Mean length for F15.NOA.N.large with 95% confidence intervals based on current sample sizes.
Francis data weighting method TA1.8: thinner intervals (with capped ends) show result of further adjusting sample sizes based on suggested multiplier (with 95% interval) for len data from F15.NOA.N.large:
0.2855 (0.2135-0.3956)
For more info, see Francis (2011).
file: comp_lenfit_data_weighting_TA1.8_F15.NOA.N.large.png
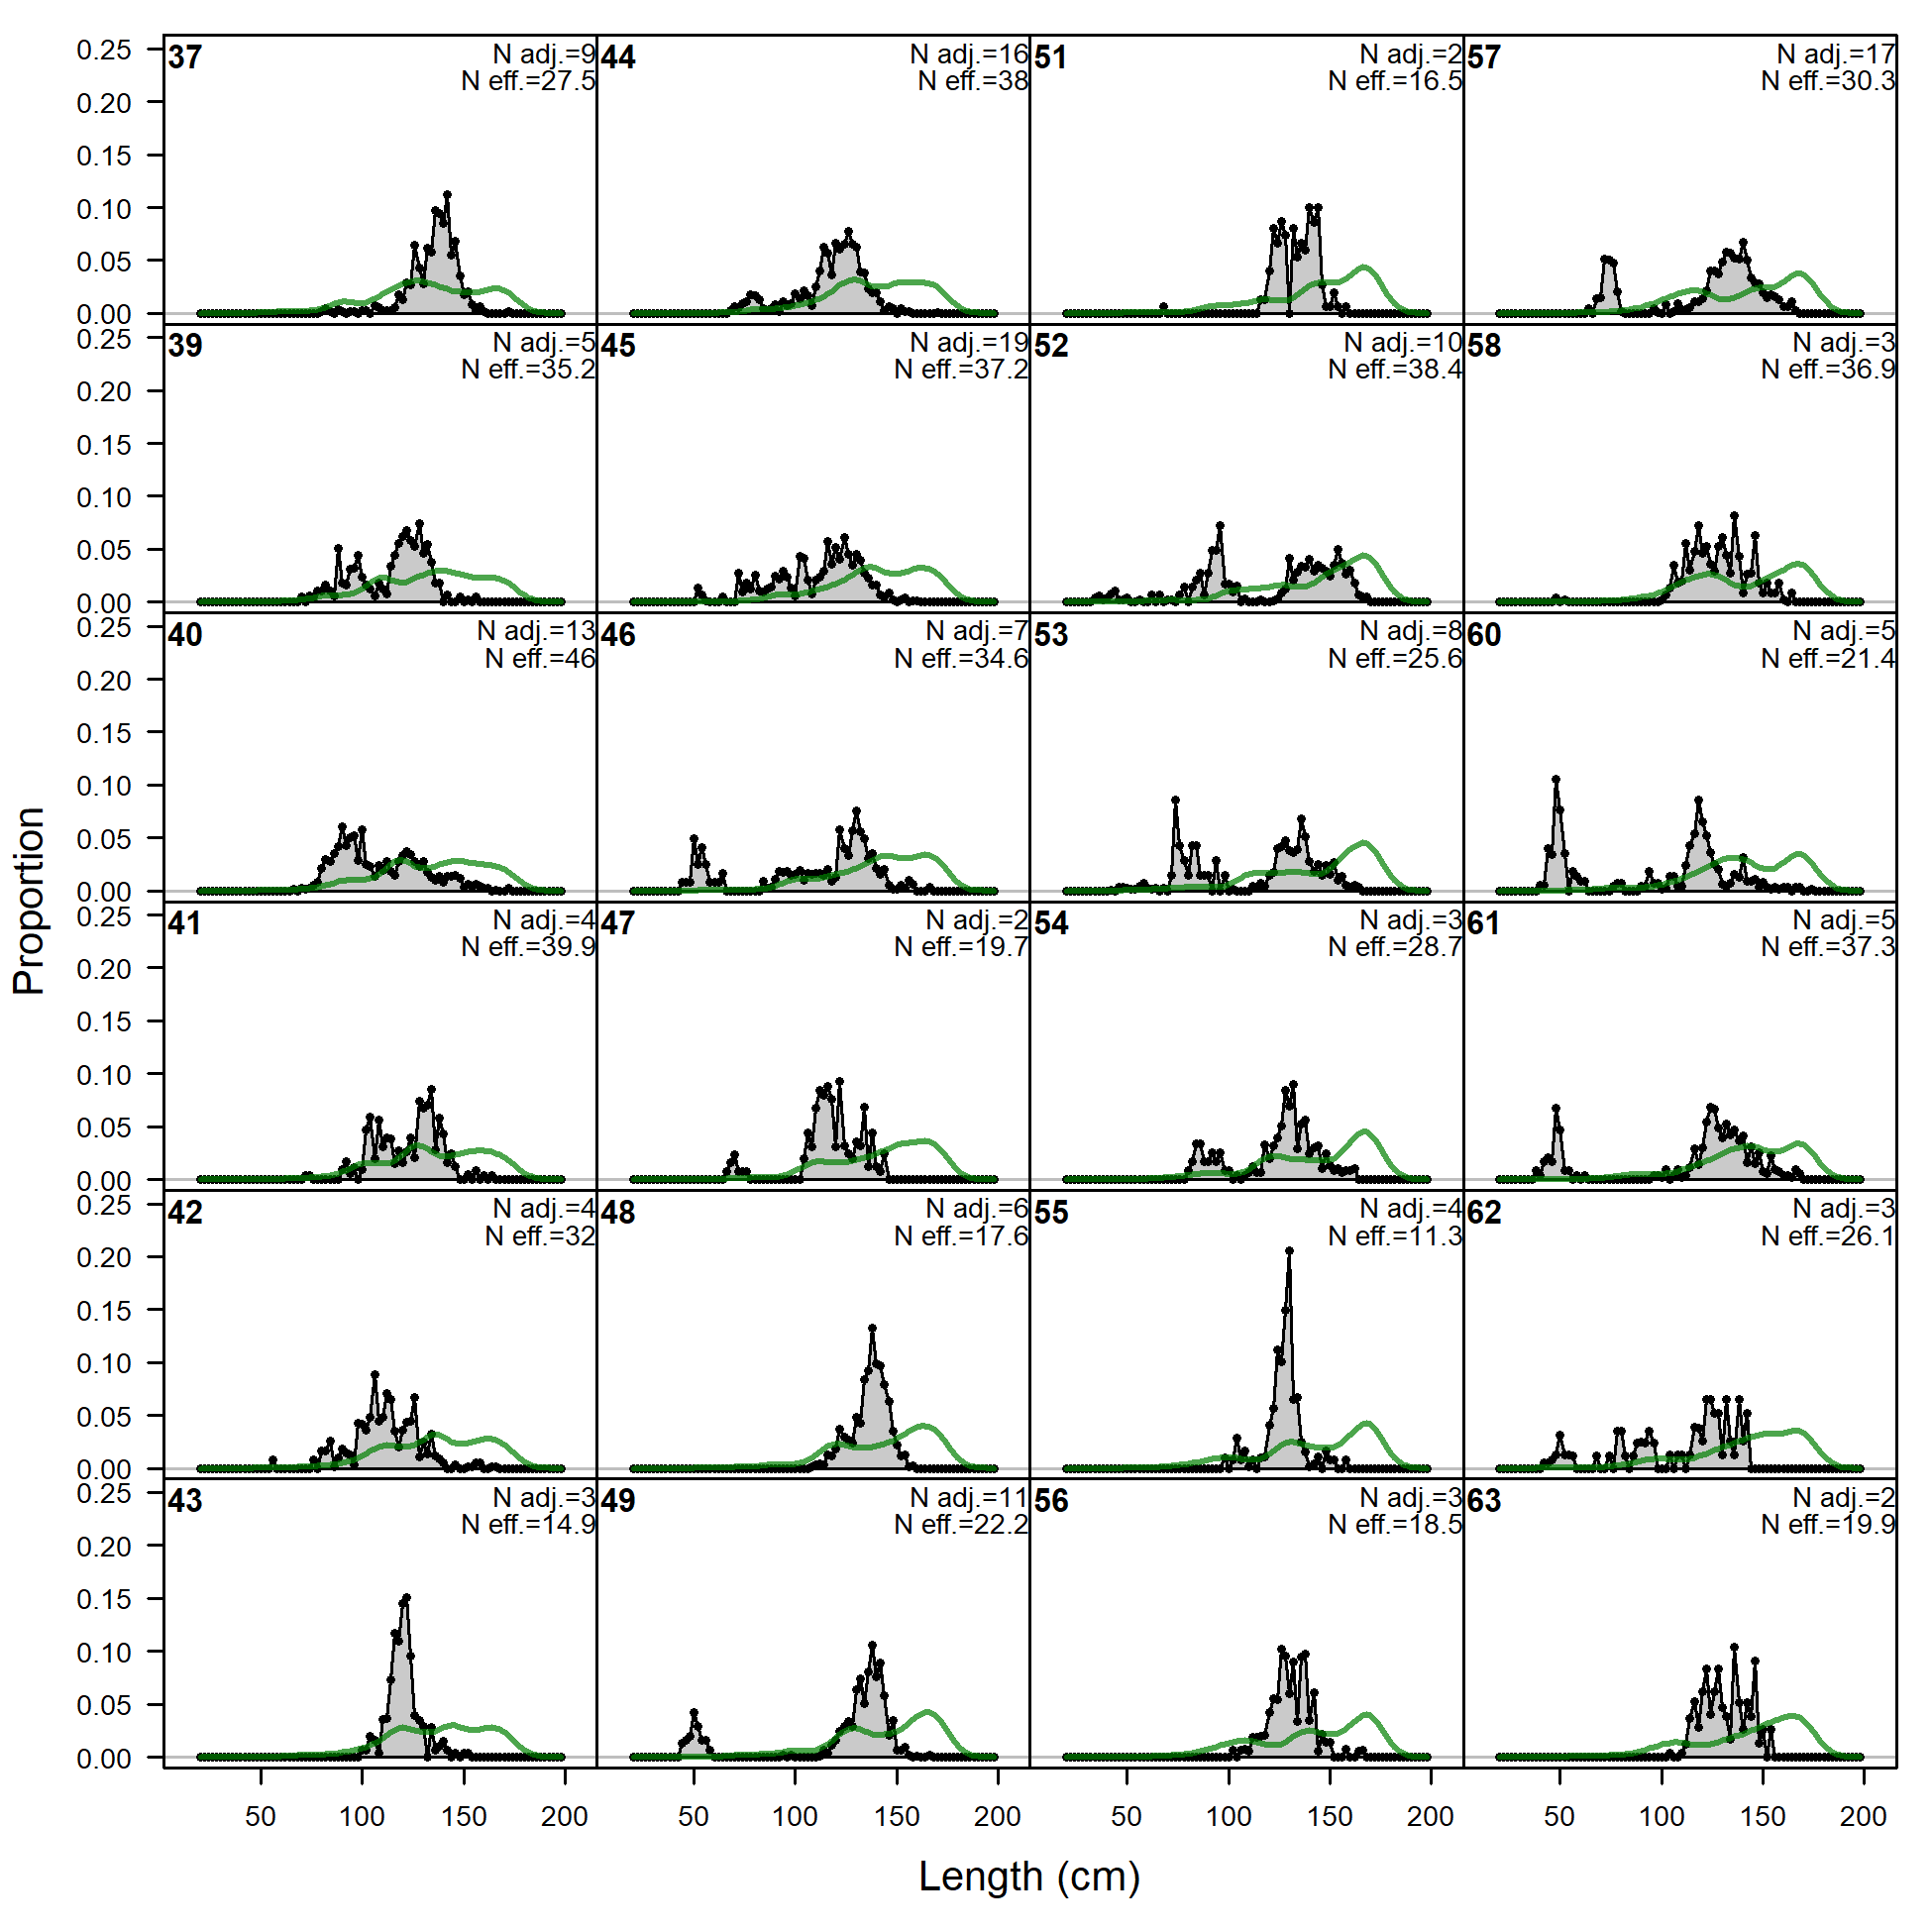
Length comps, whole catch, F16.DEL.S.offshore (plot 1 of 4).
'N adj.' is the input sample size after data-weighting adjustment. N eff. is the calculated effective sample size used in the McAllister-Ianelli tuning method.
file: comp_lenfit_flt16mkt0_page1.png
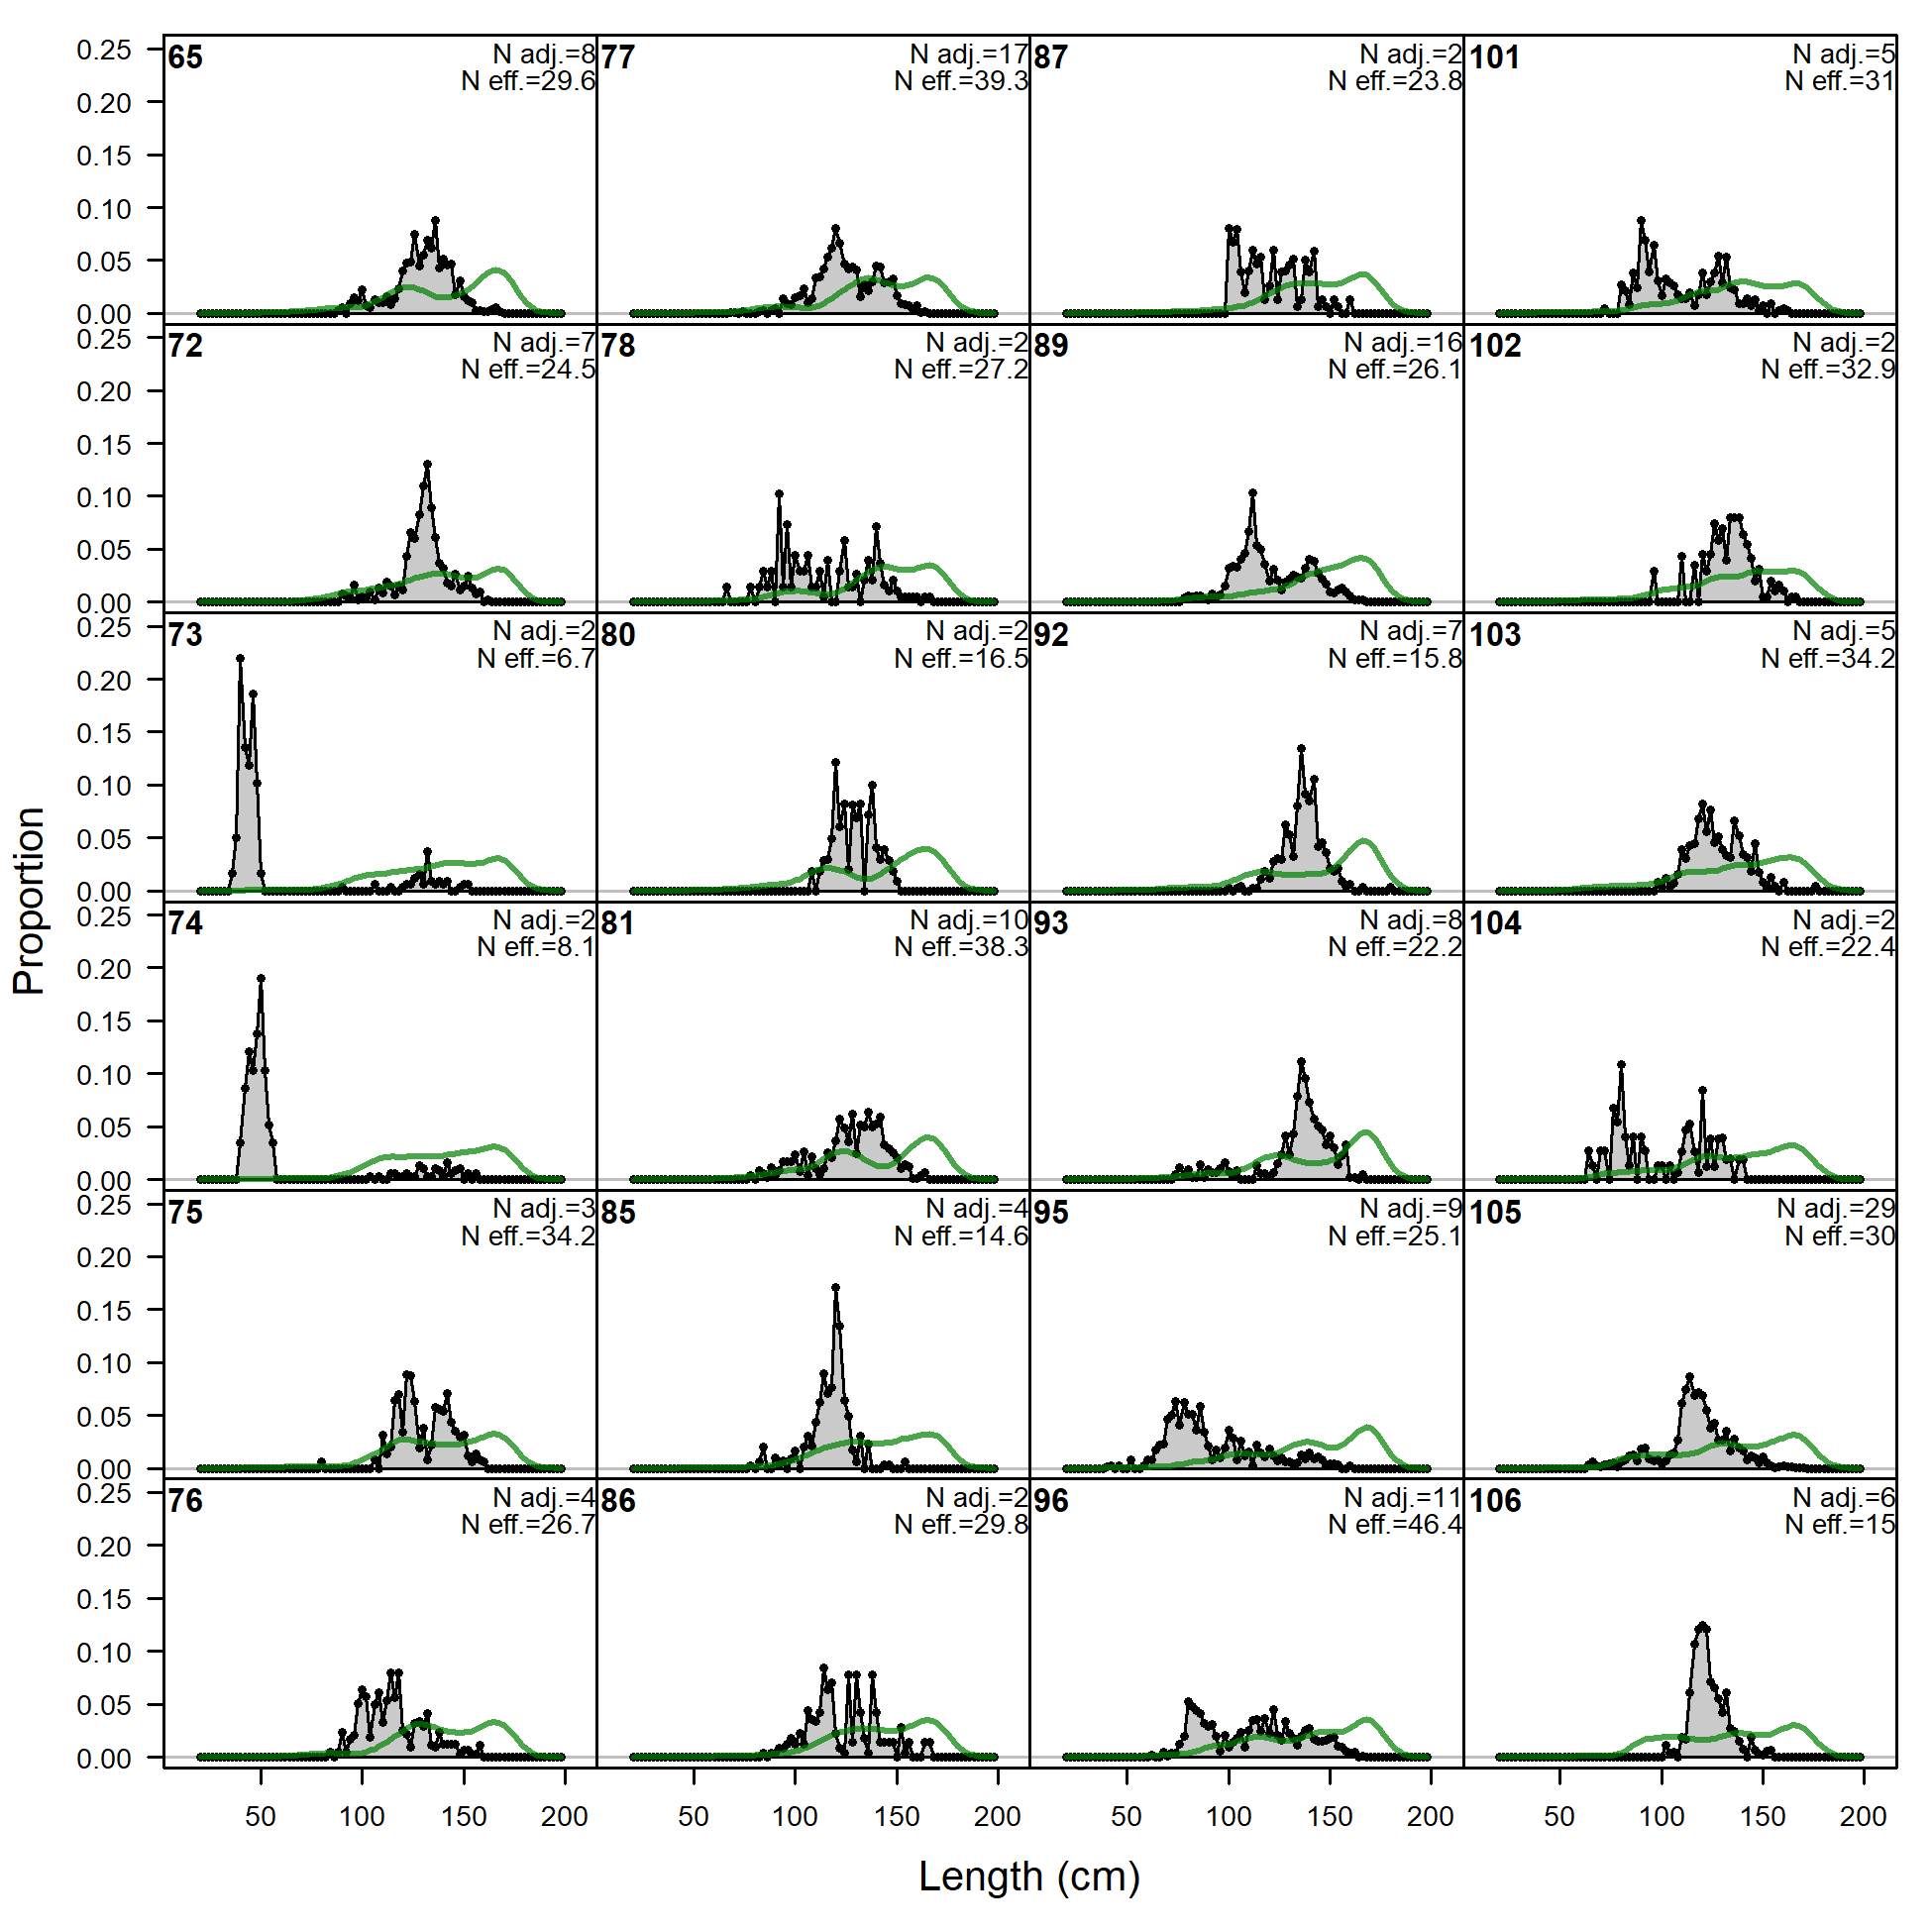
Length comps, whole catch, F16.DEL.S.offshore (plot 1 of 4).
'N adj.' is the input sample size after data-weighting adjustment. N eff. is the calculated effective sample size used in the McAllister-Ianelli tuning method. (plot 2 of 4)
file: comp_lenfit_flt16mkt0_page2.png
Length comps, whole catch, F16.DEL.S.offshore (plot 1 of 4).
'N adj.' is the input sample size after data-weighting adjustment. N eff. is the calculated effective sample size used in the McAllister-Ianelli tuning method. (plot 2 of 4) (plot 3 of 4)
file: comp_lenfit_flt16mkt0_page3.png
Length comps, whole catch, F16.DEL.S.offshore (plot 1 of 4).
'N adj.' is the input sample size after data-weighting adjustment. N eff. is the calculated effective sample size used in the McAllister-Ianelli tuning method. (plot 2 of 4) (plot 3 of 4) (plot 4 of 4)
file: comp_lenfit_flt16mkt0_page4.png
Pearson residuals, whole catch, F16.DEL.S.offshore (max=34.15) (plot 4 of 4)
Closed bubbles are positive residuals (observed > expected) and open bubbles are negative residuals (observed < expected).
file: comp_lenfit_residsflt16mkt0_page4.png
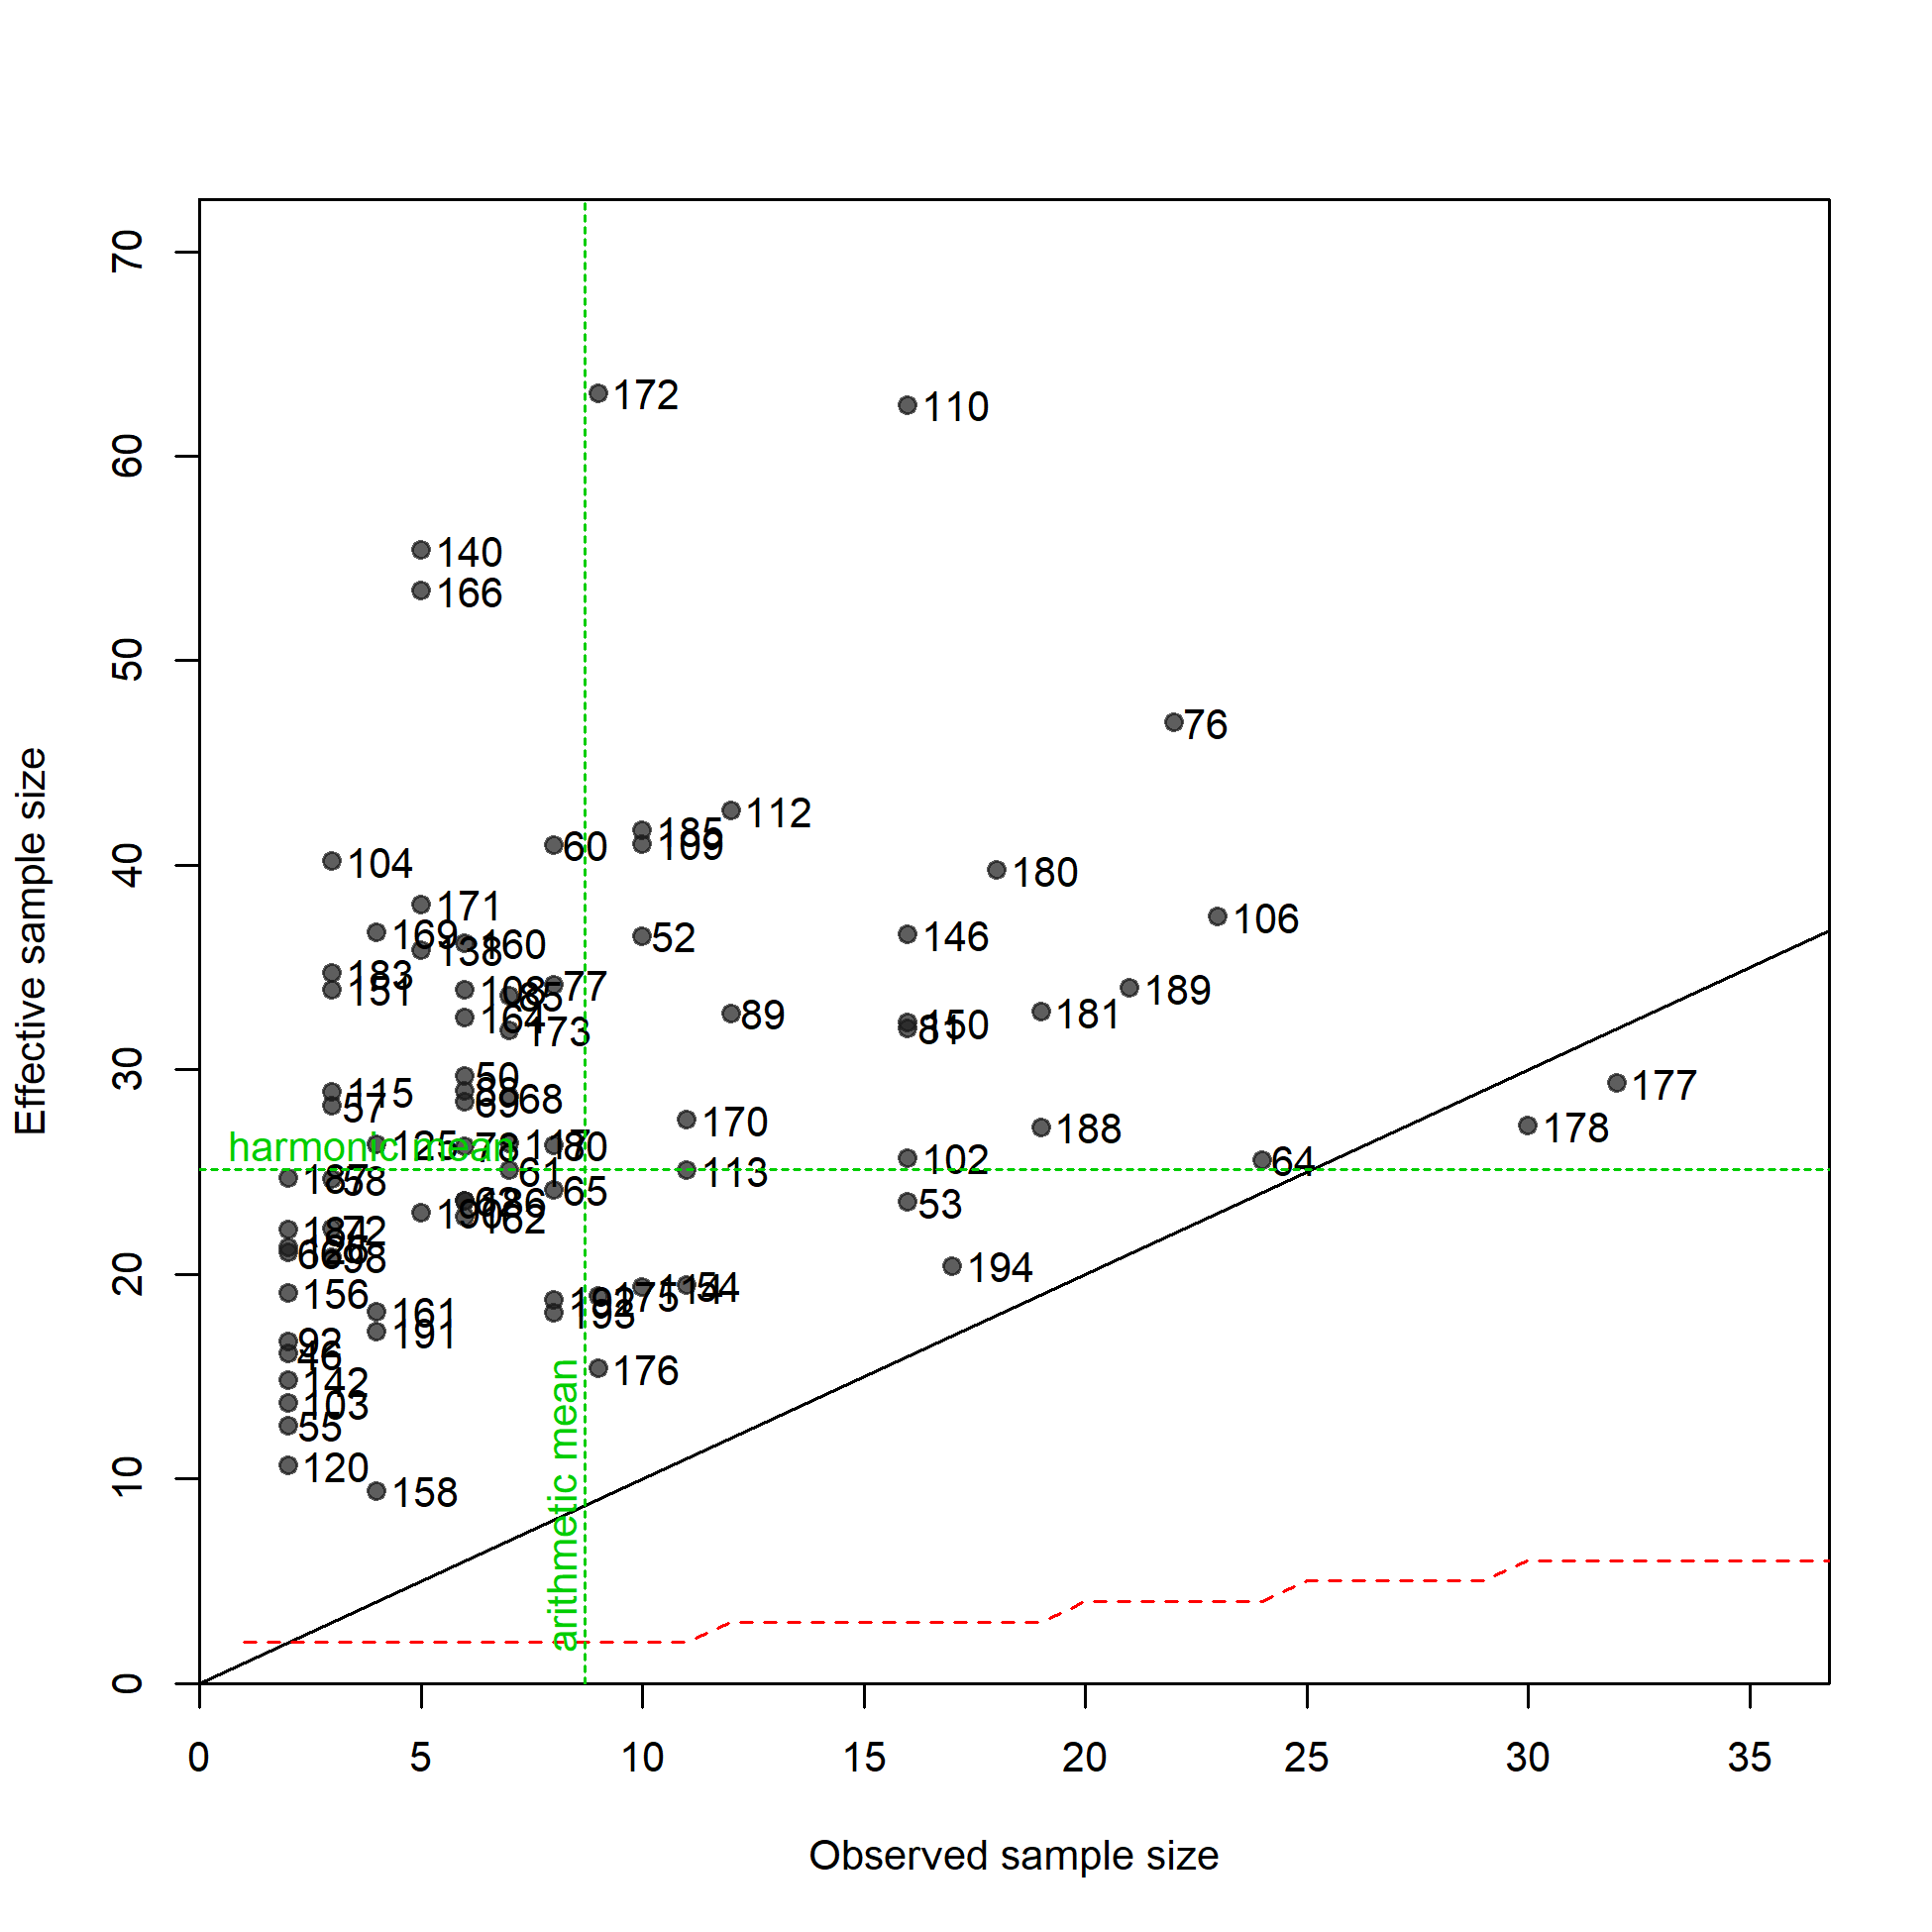
N-EffN comparison, Length comps, whole catch, F16.DEL.S.offshore
file: comp_lenfit_sampsize_flt16mkt0.png
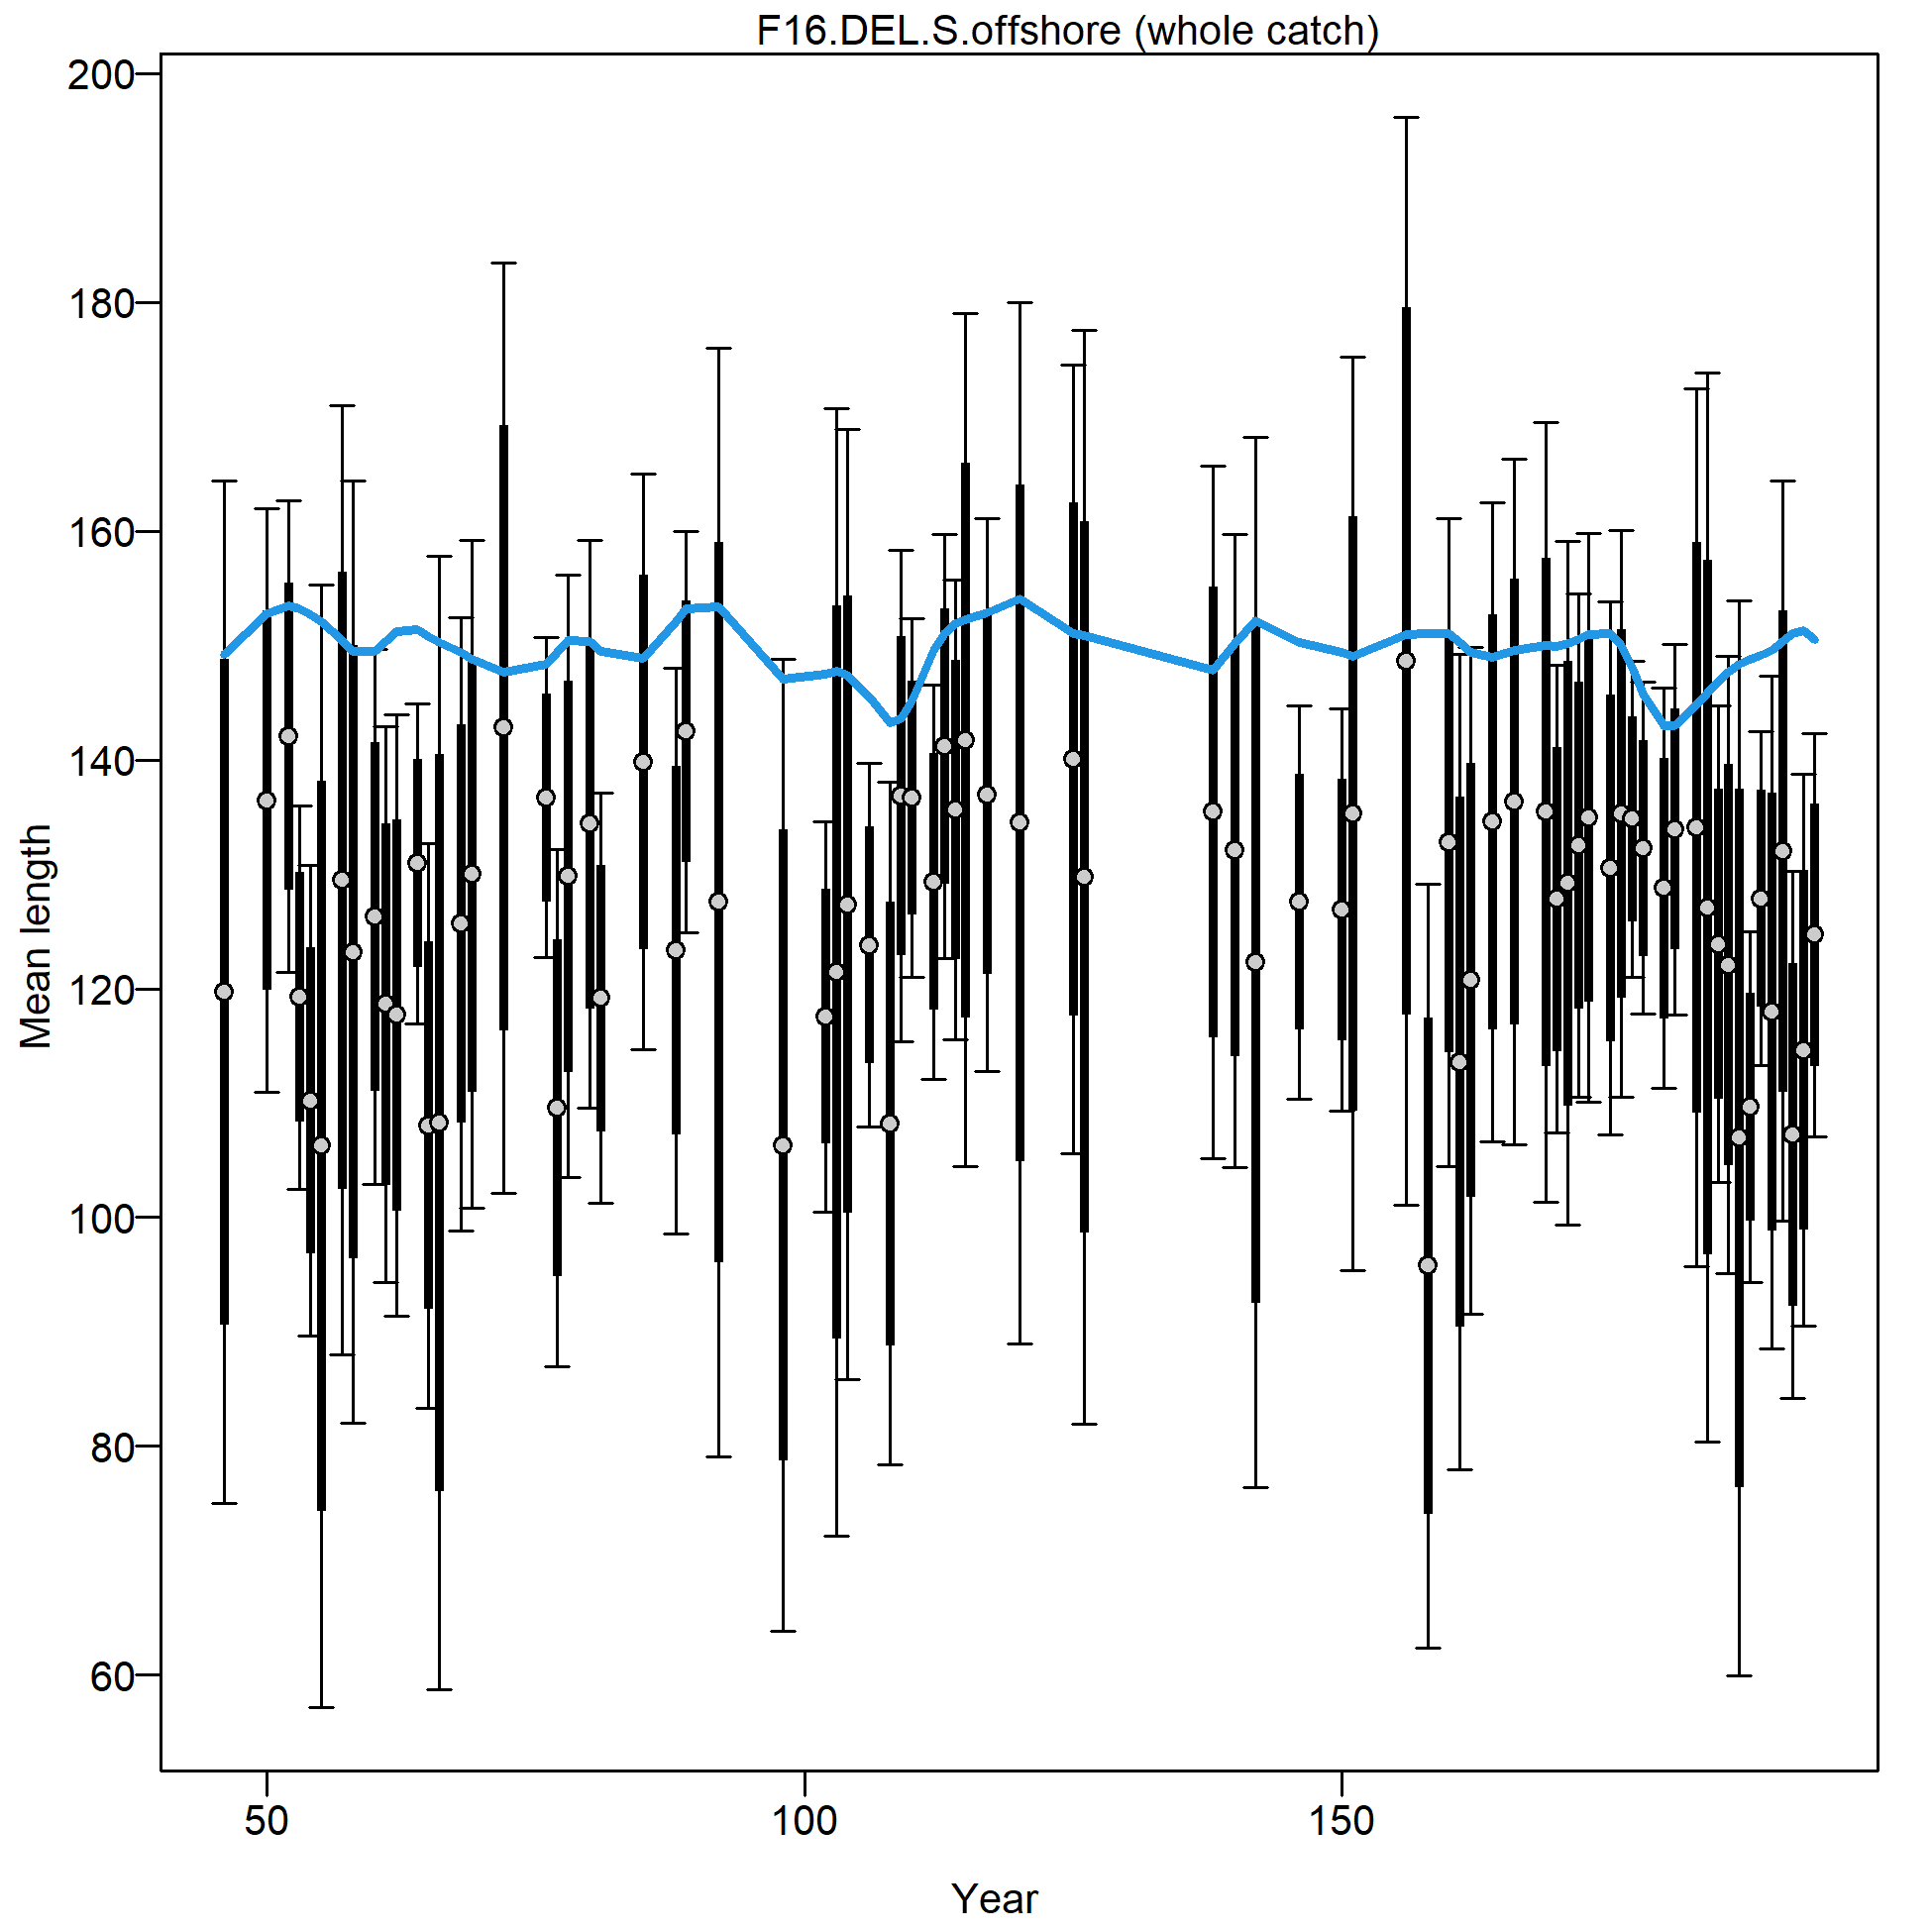
Mean length for F16.DEL.S.offshore with 95% confidence intervals based on current sample sizes.
Francis data weighting method TA1.8: thinner intervals (with capped ends) show result of further adjusting sample sizes based on suggested multiplier (with 95% interval) for len data from F16.DEL.S.offshore:
0.4232 (0.3077-0.6355)
For more info, see Francis (2011).
file: comp_lenfit_data_weighting_TA1.8_F16.DEL.S.offshore.png
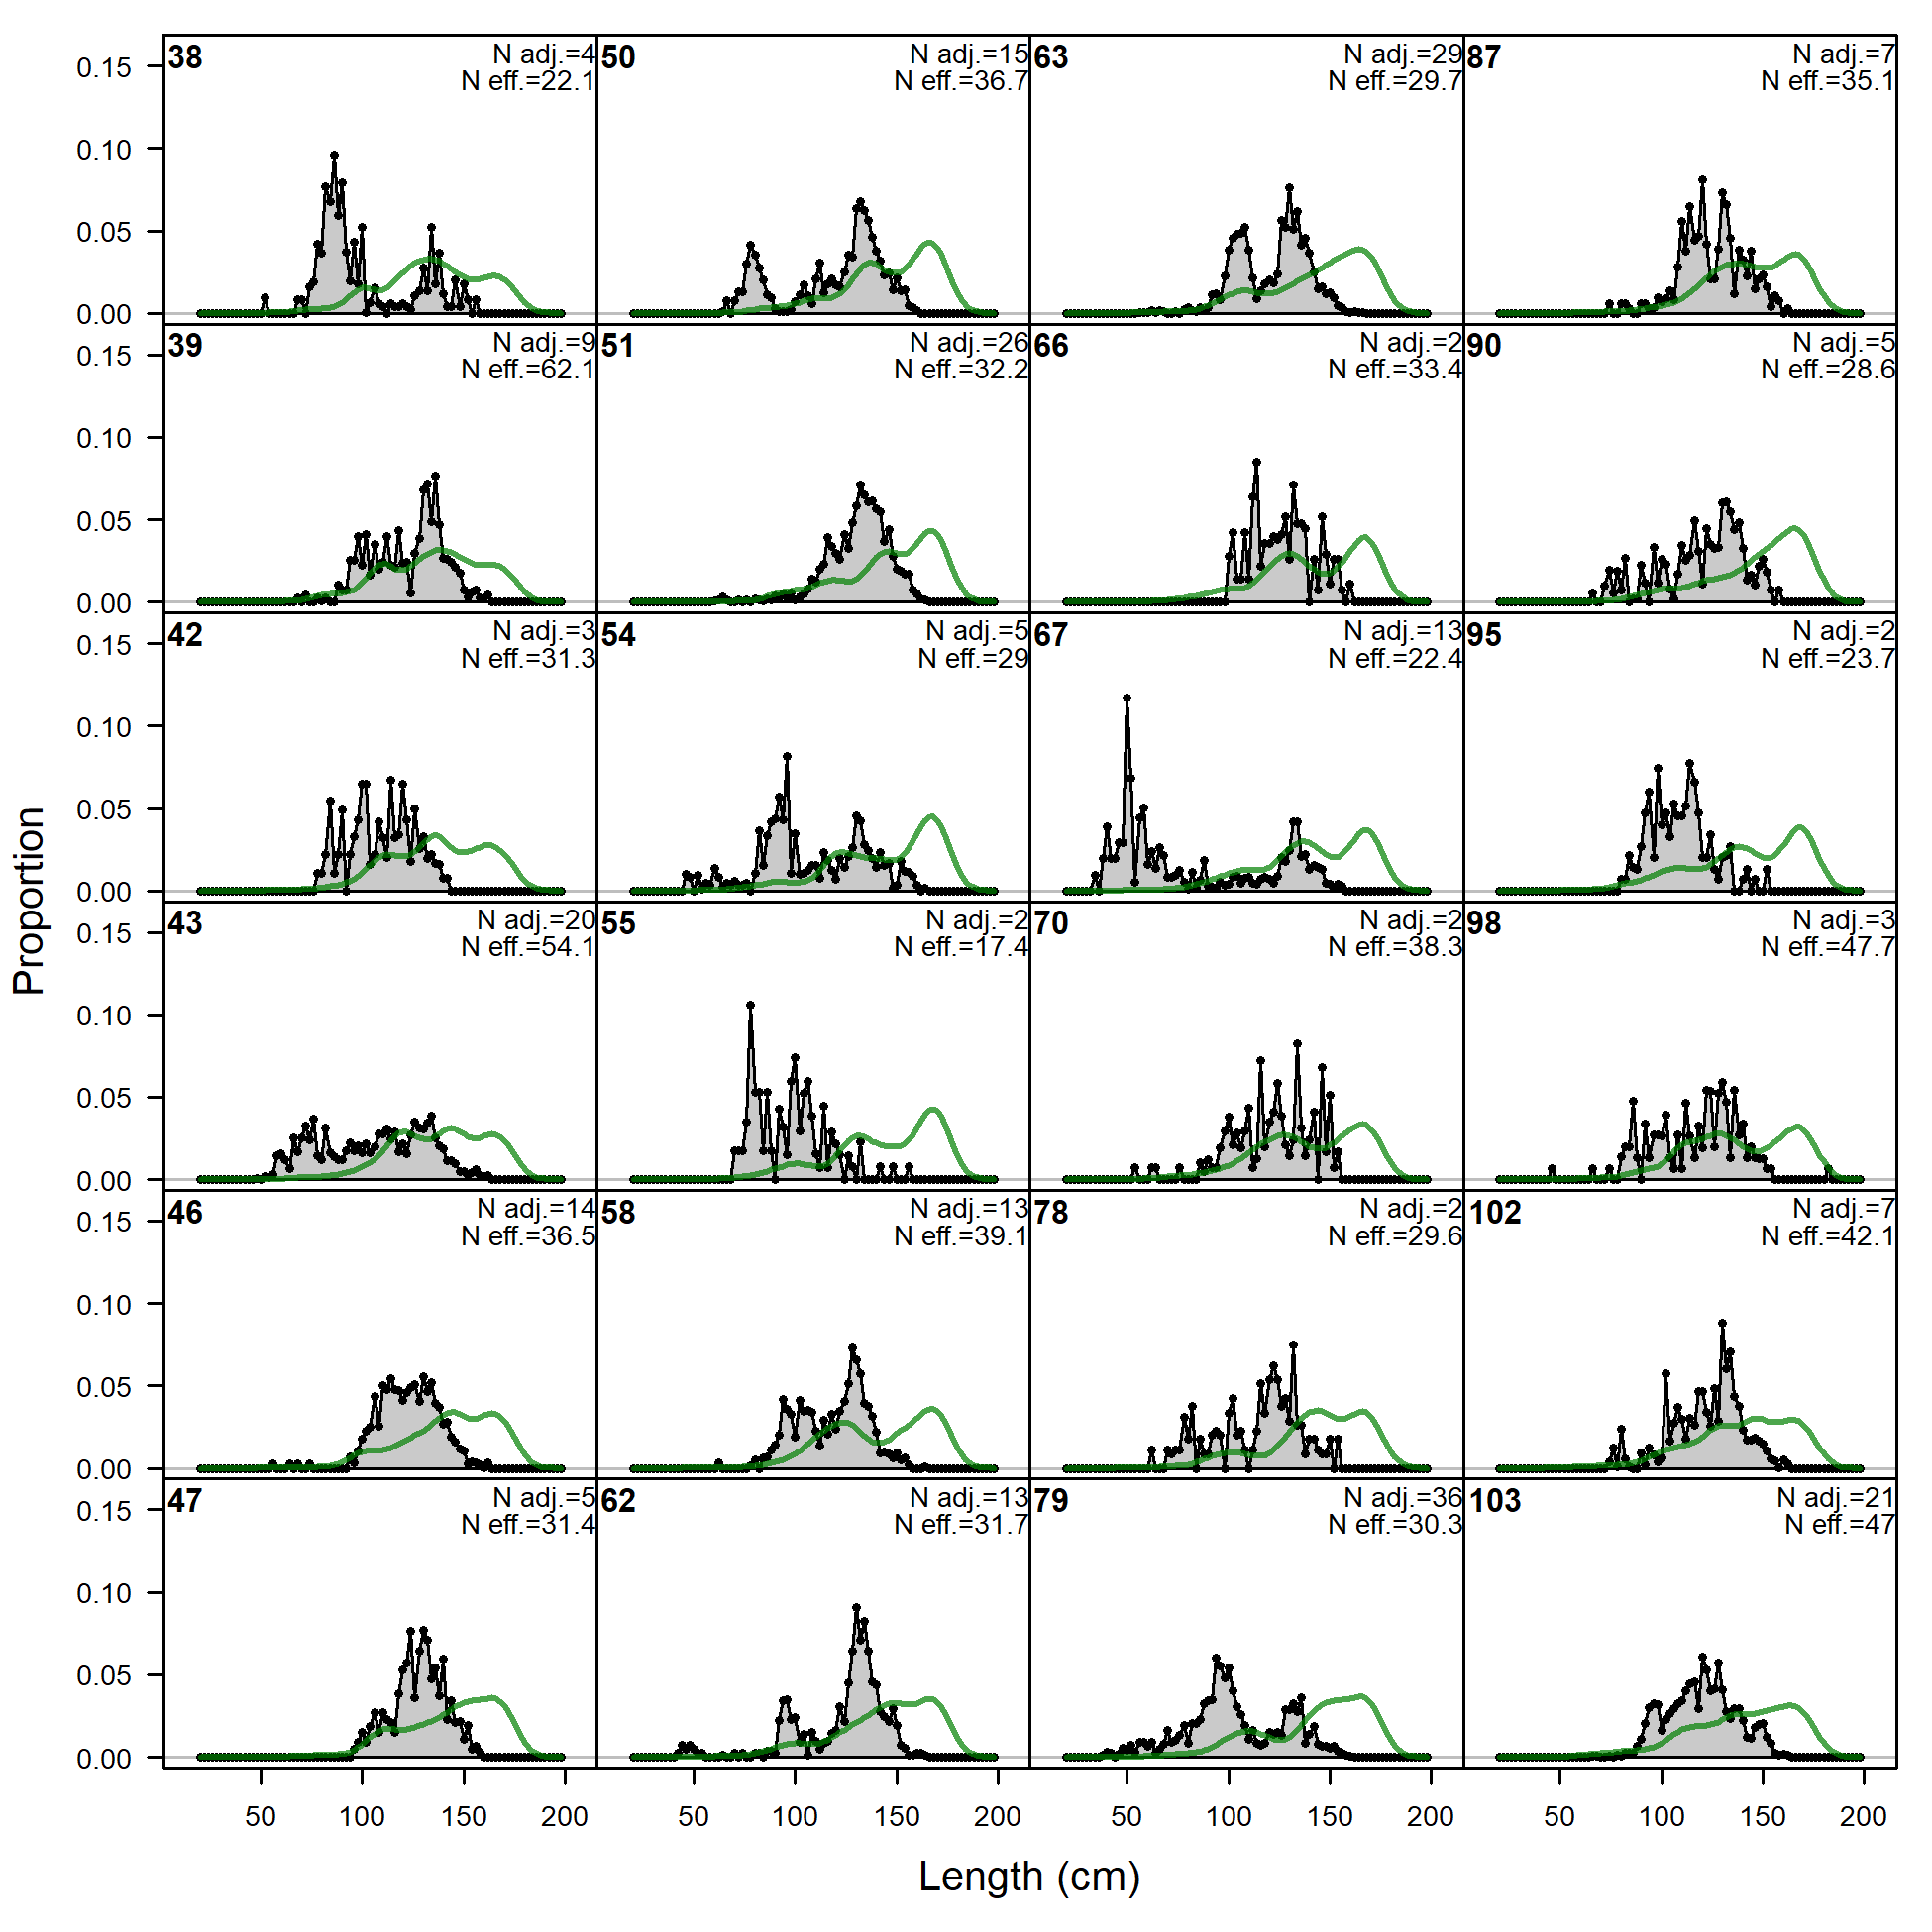
Length comps, whole catch, F17.DEL.S.inshore (plot 1 of 5).
'N adj.' is the input sample size after data-weighting adjustment. N eff. is the calculated effective sample size used in the McAllister-Ianelli tuning method.
file: comp_lenfit_flt17mkt0_page1.png
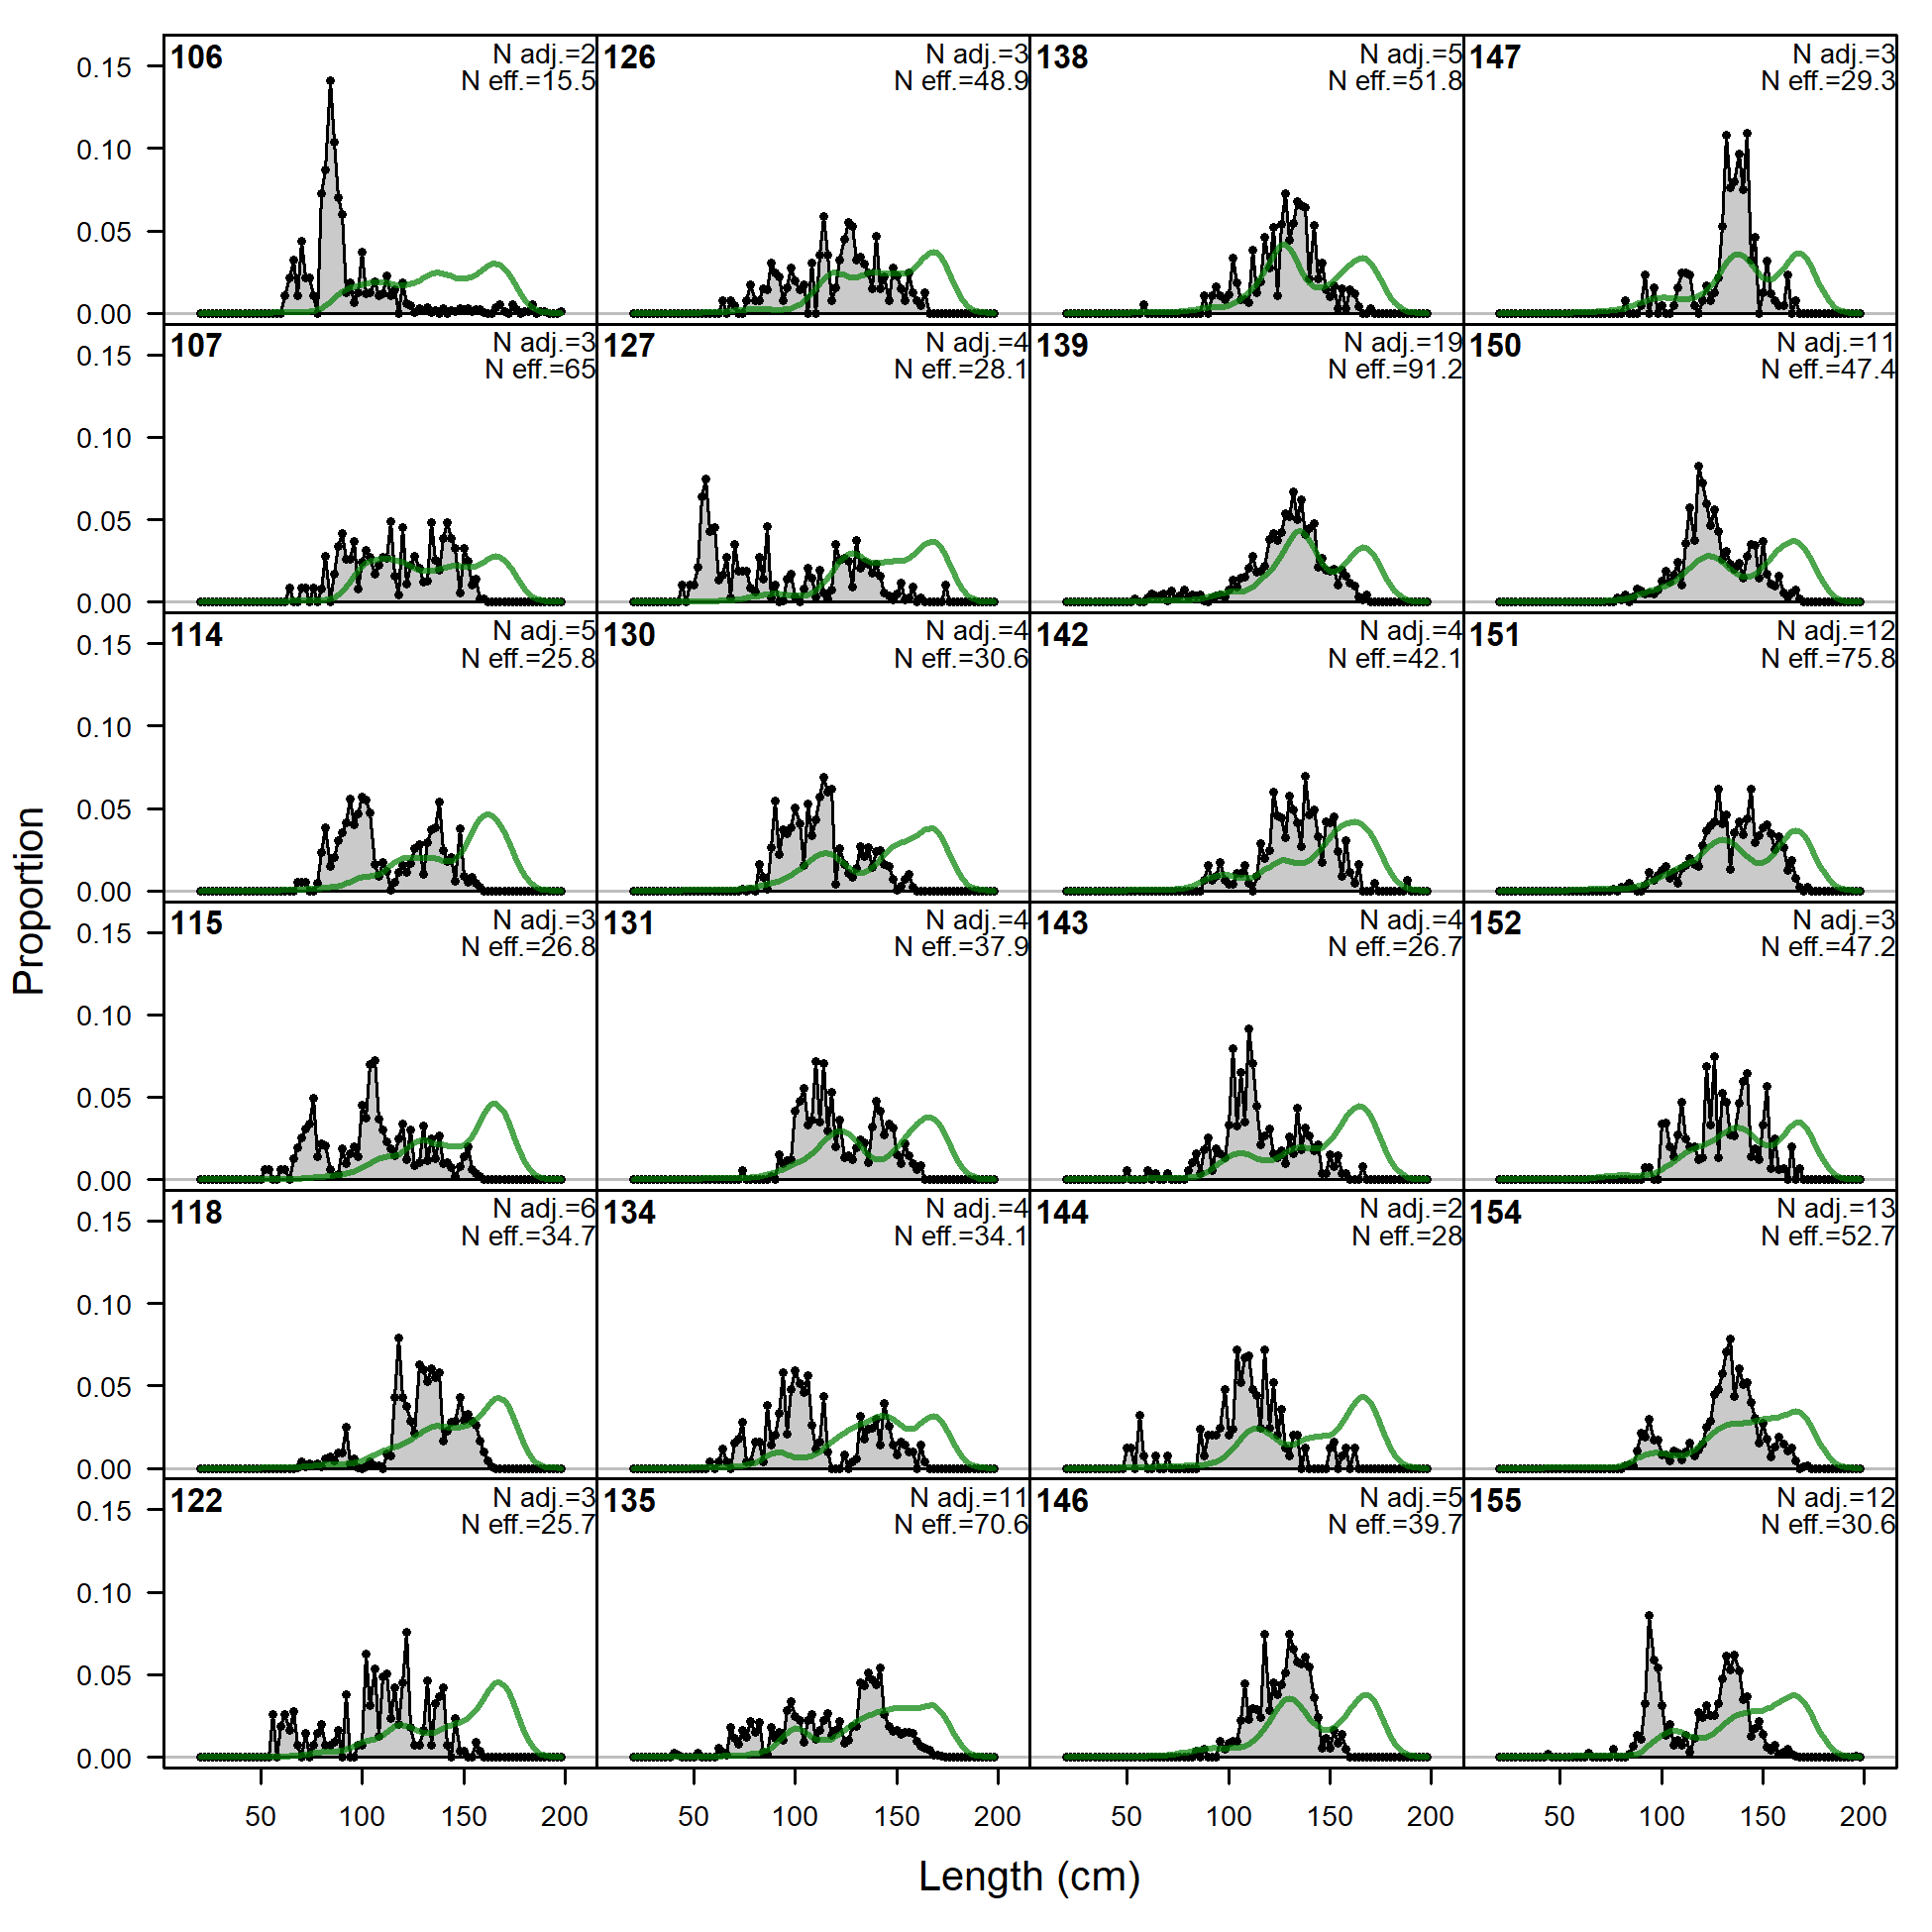
Length comps, whole catch, F17.DEL.S.inshore (plot 1 of 5).
'N adj.' is the input sample size after data-weighting adjustment. N eff. is the calculated effective sample size used in the McAllister-Ianelli tuning method. (plot 2 of 5)
file: comp_lenfit_flt17mkt0_page2.png
Length comps, whole catch, F17.DEL.S.inshore (plot 1 of 5).
'N adj.' is the input sample size after data-weighting adjustment. N eff. is the calculated effective sample size used in the McAllister-Ianelli tuning method. (plot 2 of 5) (plot 3 of 5)
file: comp_lenfit_flt17mkt0_page3.png
Length comps, whole catch, F17.DEL.S.inshore (plot 1 of 5).
'N adj.' is the input sample size after data-weighting adjustment. N eff. is the calculated effective sample size used in the McAllister-Ianelli tuning method. (plot 2 of 5) (plot 3 of 5) (plot 4 of 5)
file: comp_lenfit_flt17mkt0_page4.png
Length comps, whole catch, F17.DEL.S.inshore (plot 1 of 5).
'N adj.' is the input sample size after data-weighting adjustment. N eff. is the calculated effective sample size used in the McAllister-Ianelli tuning method. (plot 2 of 5) (plot 3 of 5) (plot 4 of 5) (plot 5 of 5)
file: comp_lenfit_flt17mkt0_page5.png
Pearson residuals, whole catch, F17.DEL.S.inshore (max=21.15) (plot 5 of 5)
Closed bubbles are positive residuals (observed > expected) and open bubbles are negative residuals (observed < expected).
file: comp_lenfit_residsflt17mkt0_page5.png
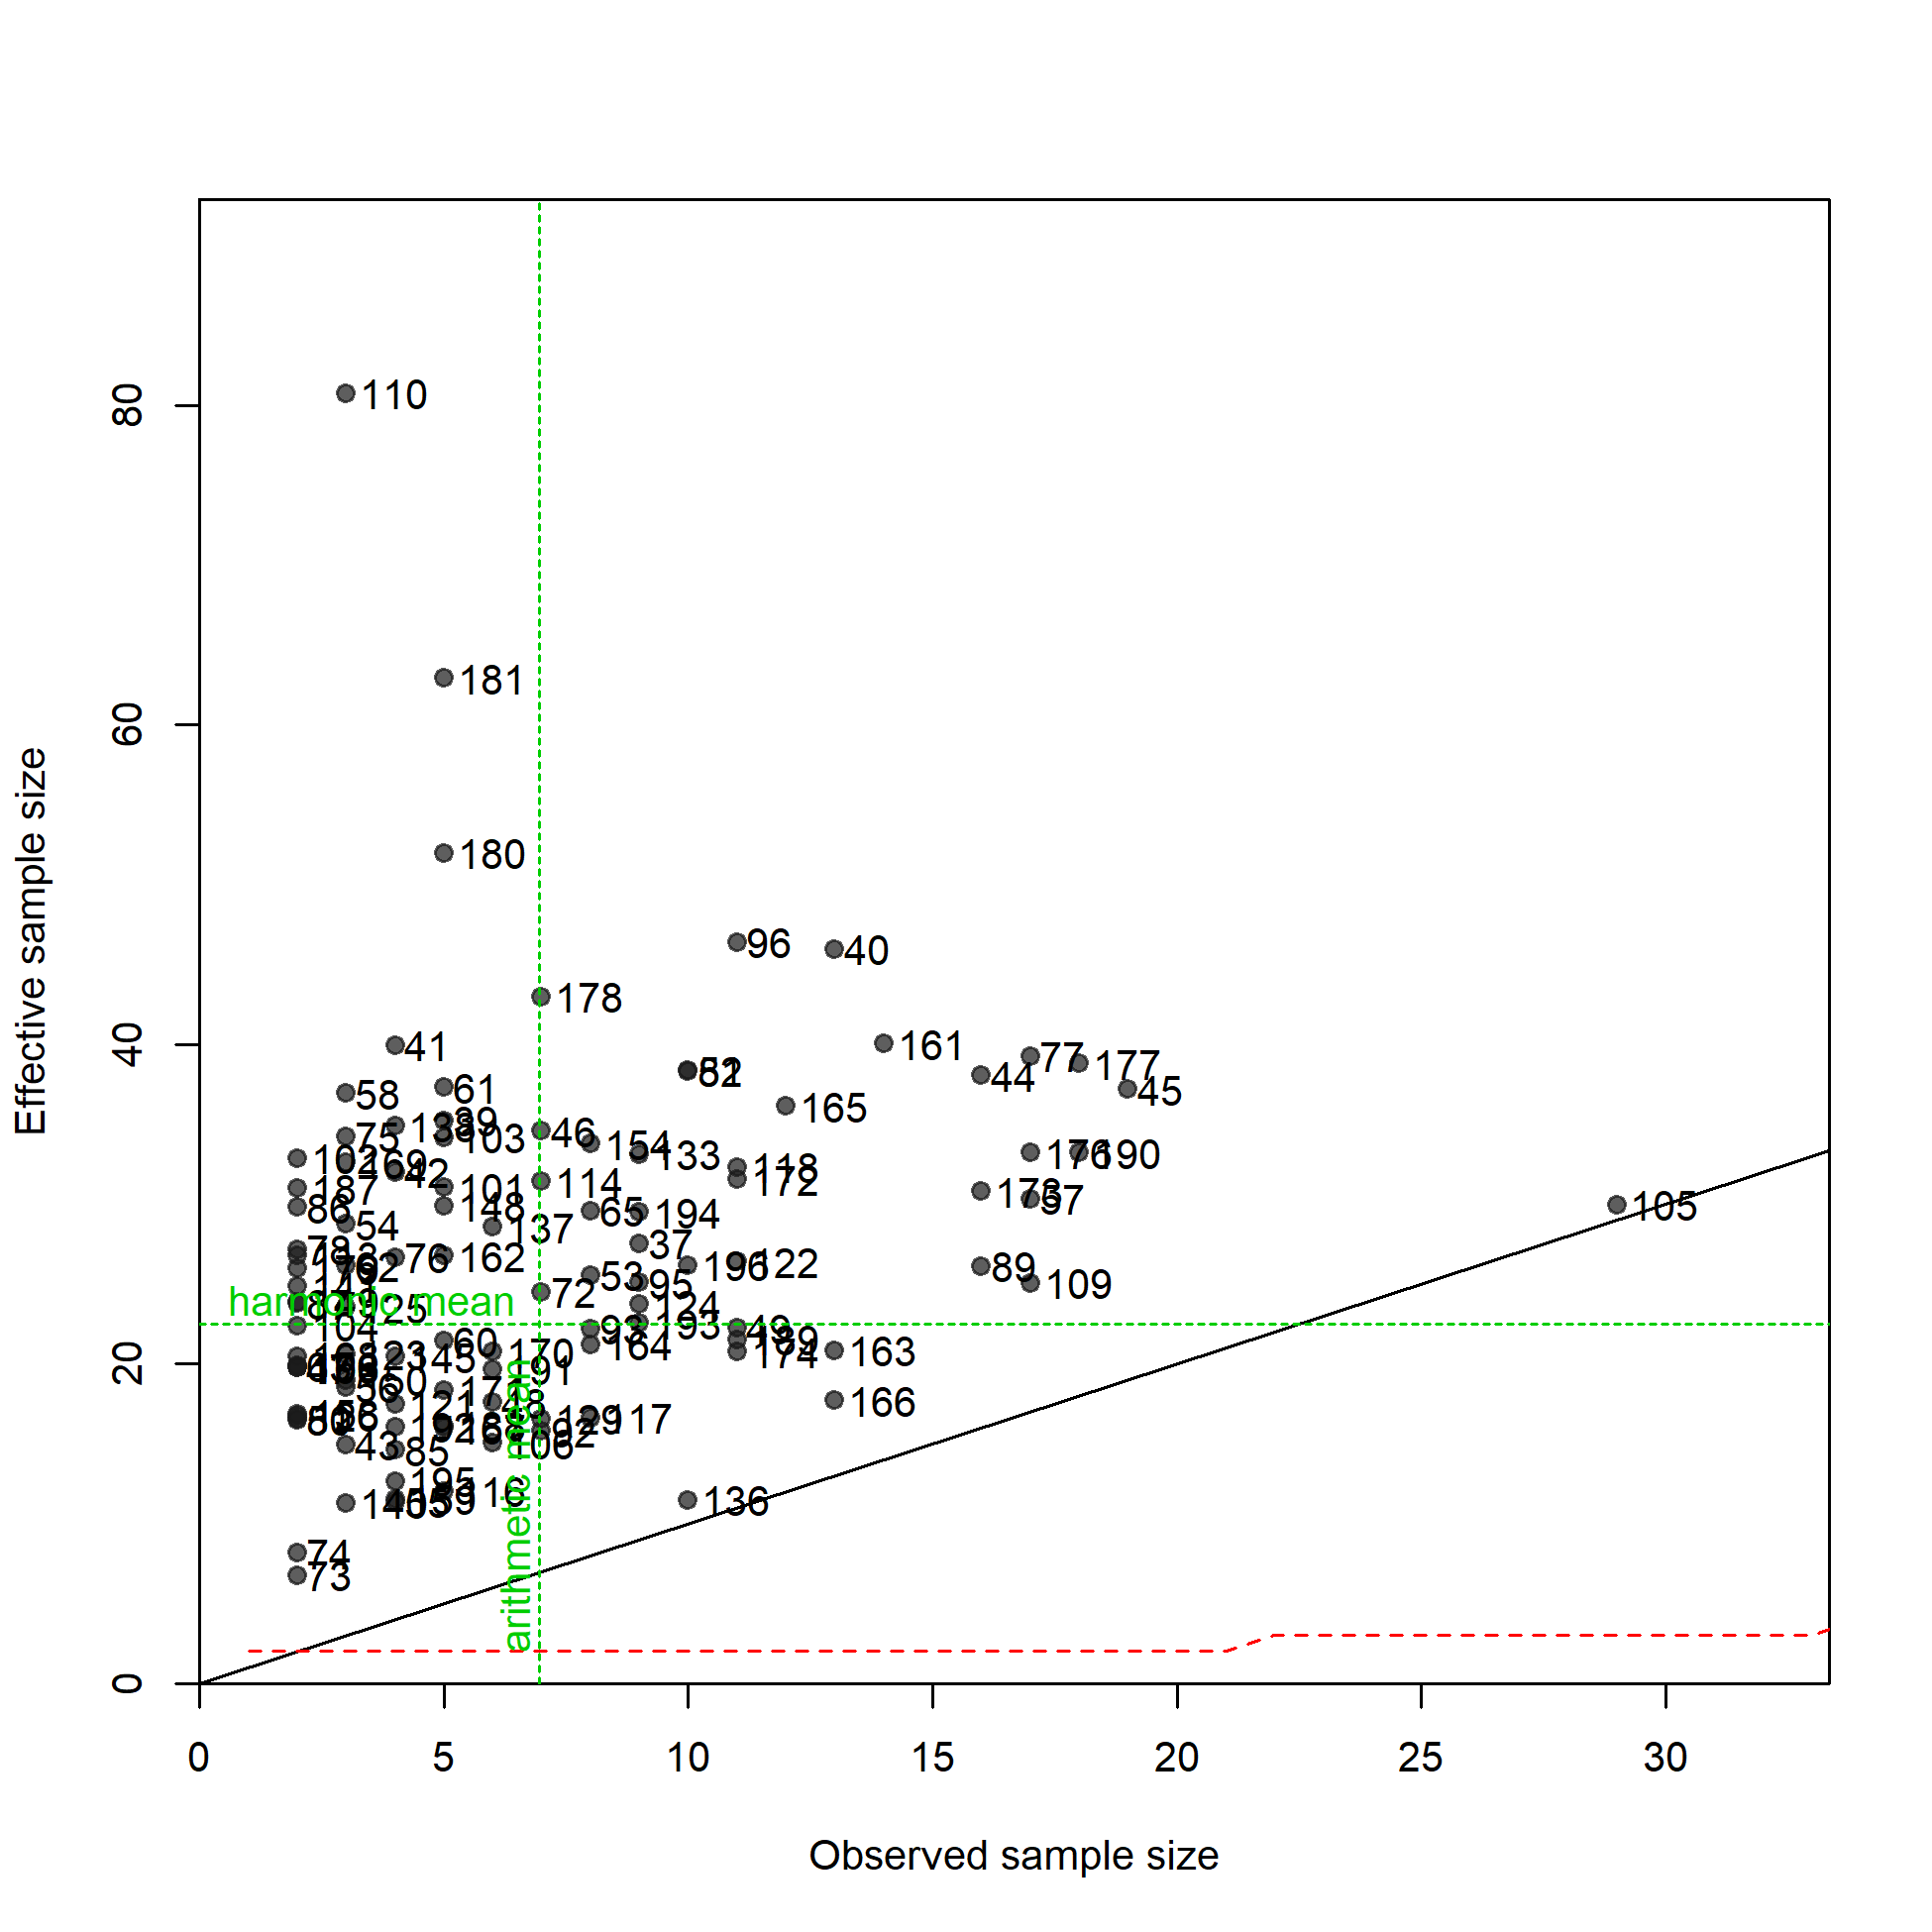
N-EffN comparison, Length comps, whole catch, F17.DEL.S.inshore
file: comp_lenfit_sampsize_flt17mkt0.png
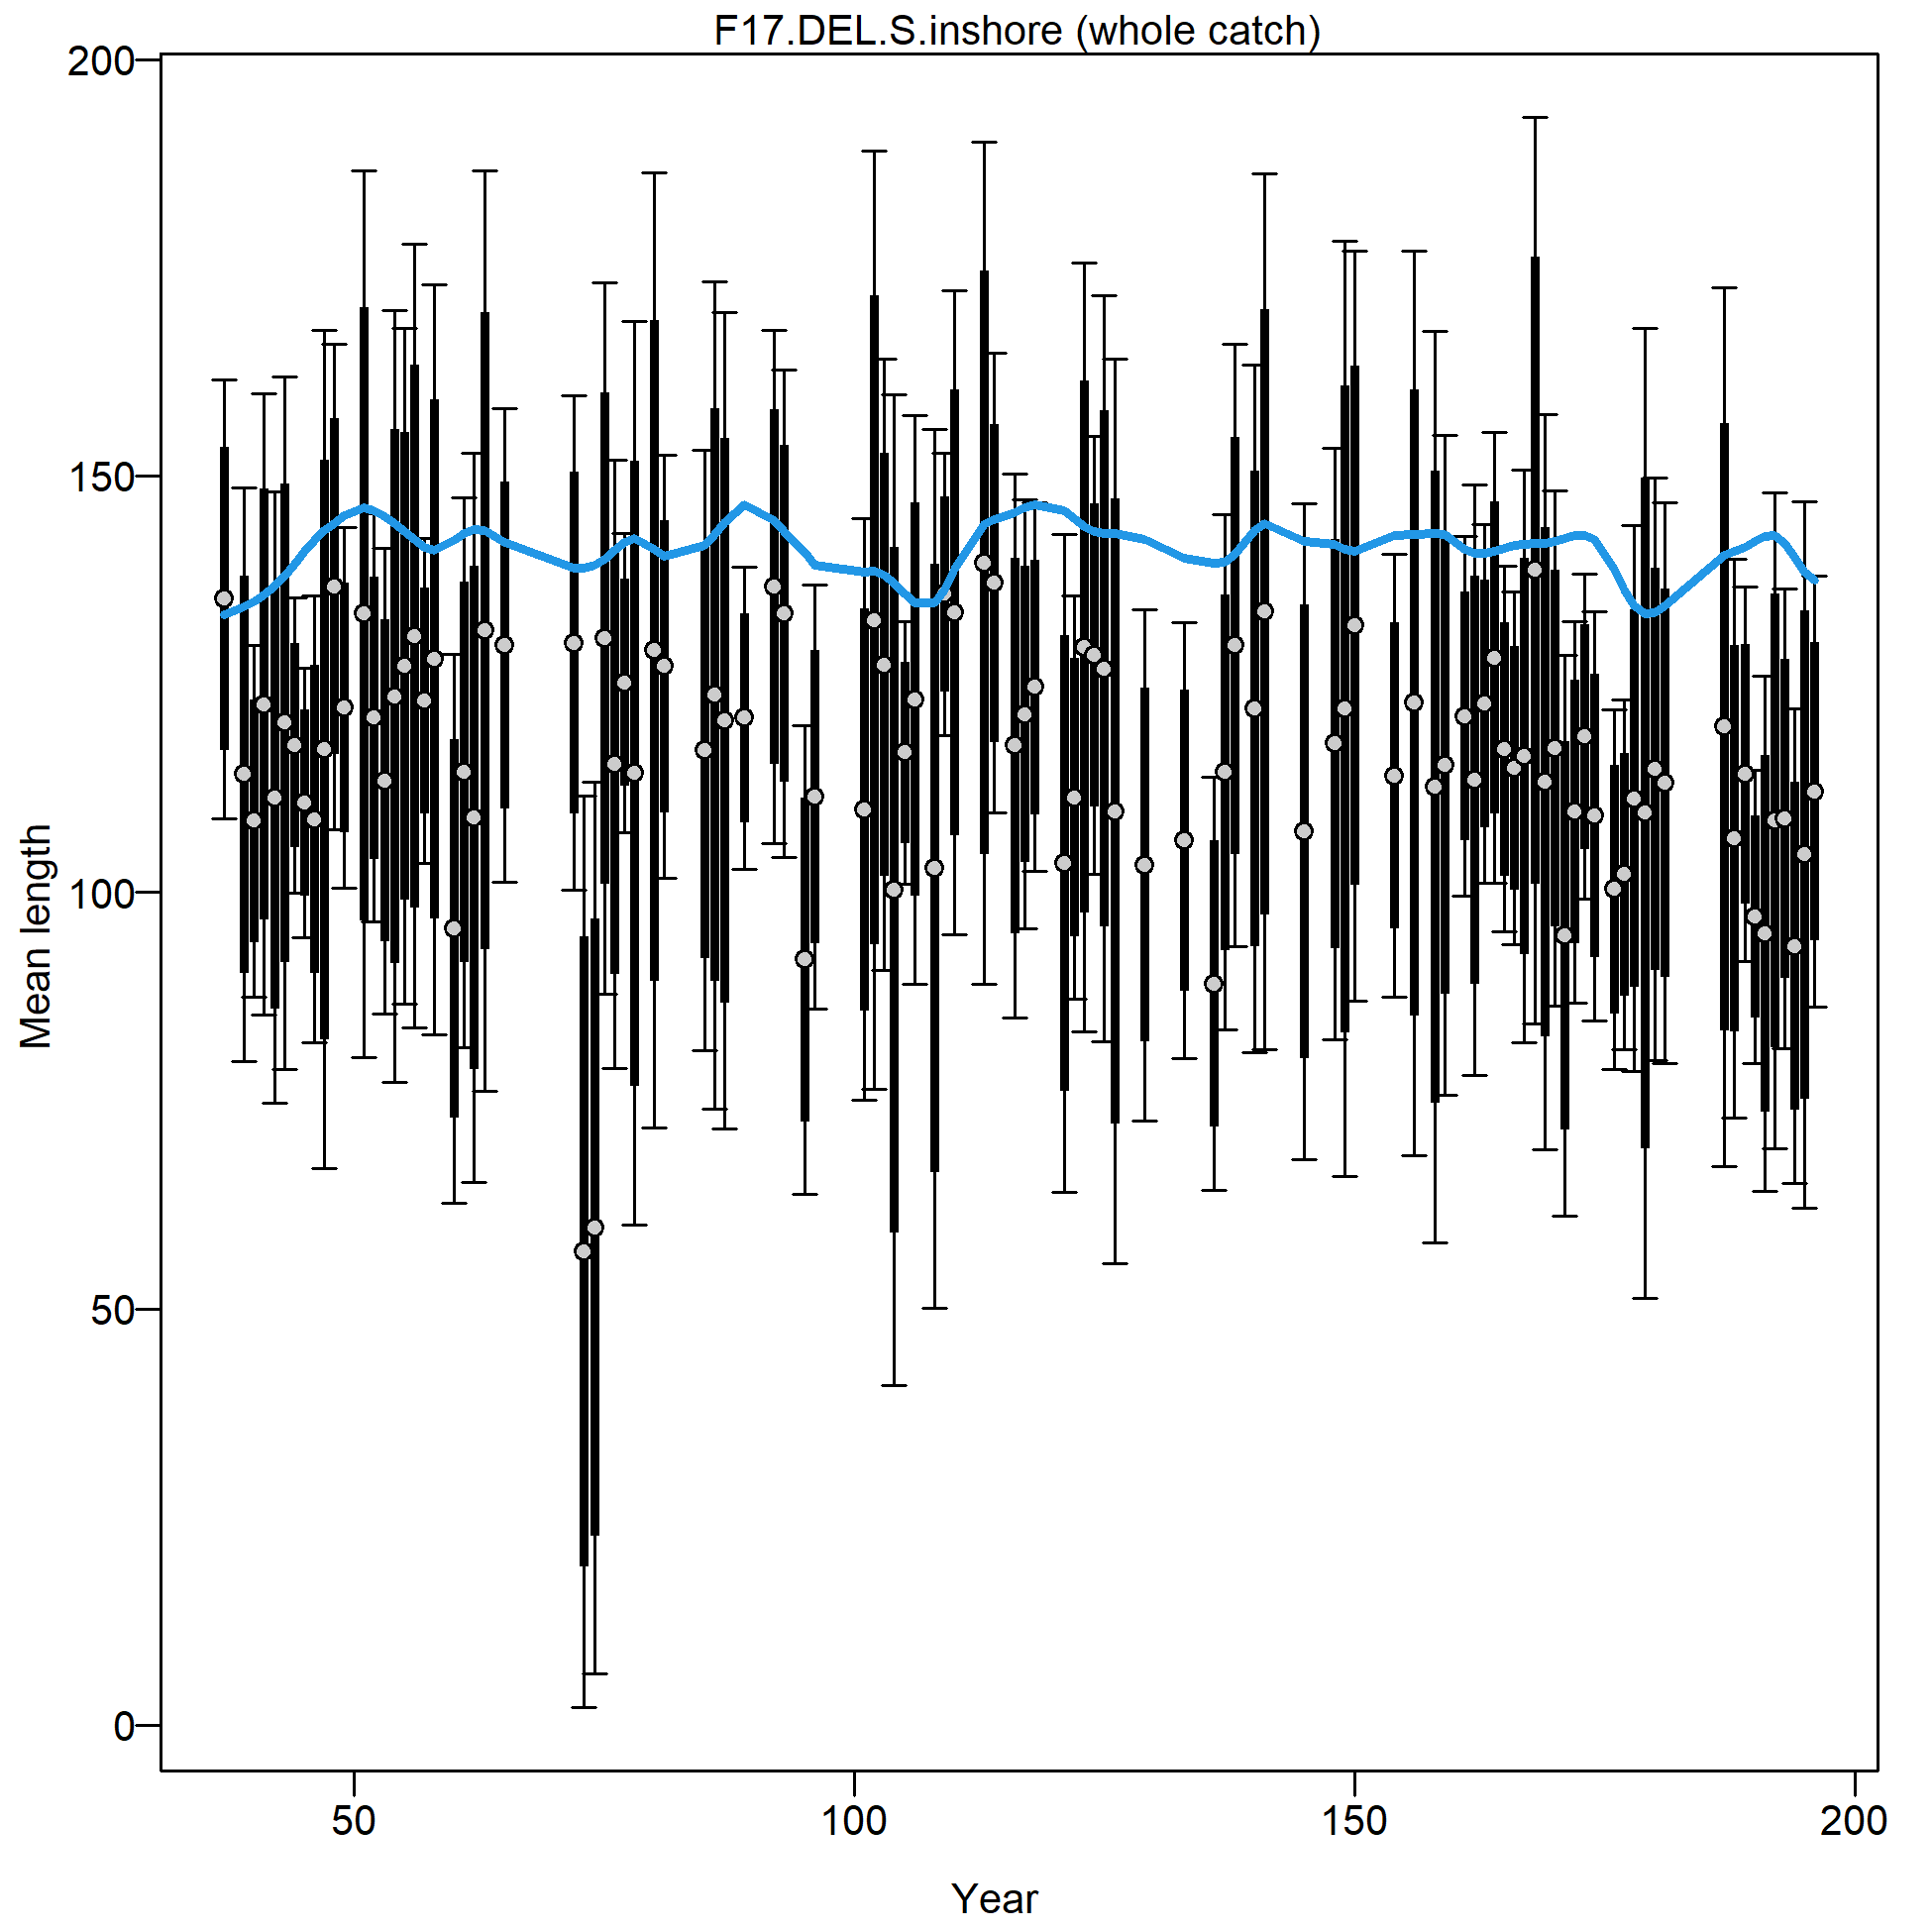
Mean length for F17.DEL.S.inshore with 95% confidence intervals based on current sample sizes.
Francis data weighting method TA1.8: thinner intervals (with capped ends) show result of further adjusting sample sizes based on suggested multiplier (with 95% interval) for len data from F17.DEL.S.inshore:
0.4786 (0.3664-0.6331)
For more info, see Francis (2011).
file: comp_lenfit_data_weighting_TA1.8_F17.DEL.S.inshore.png
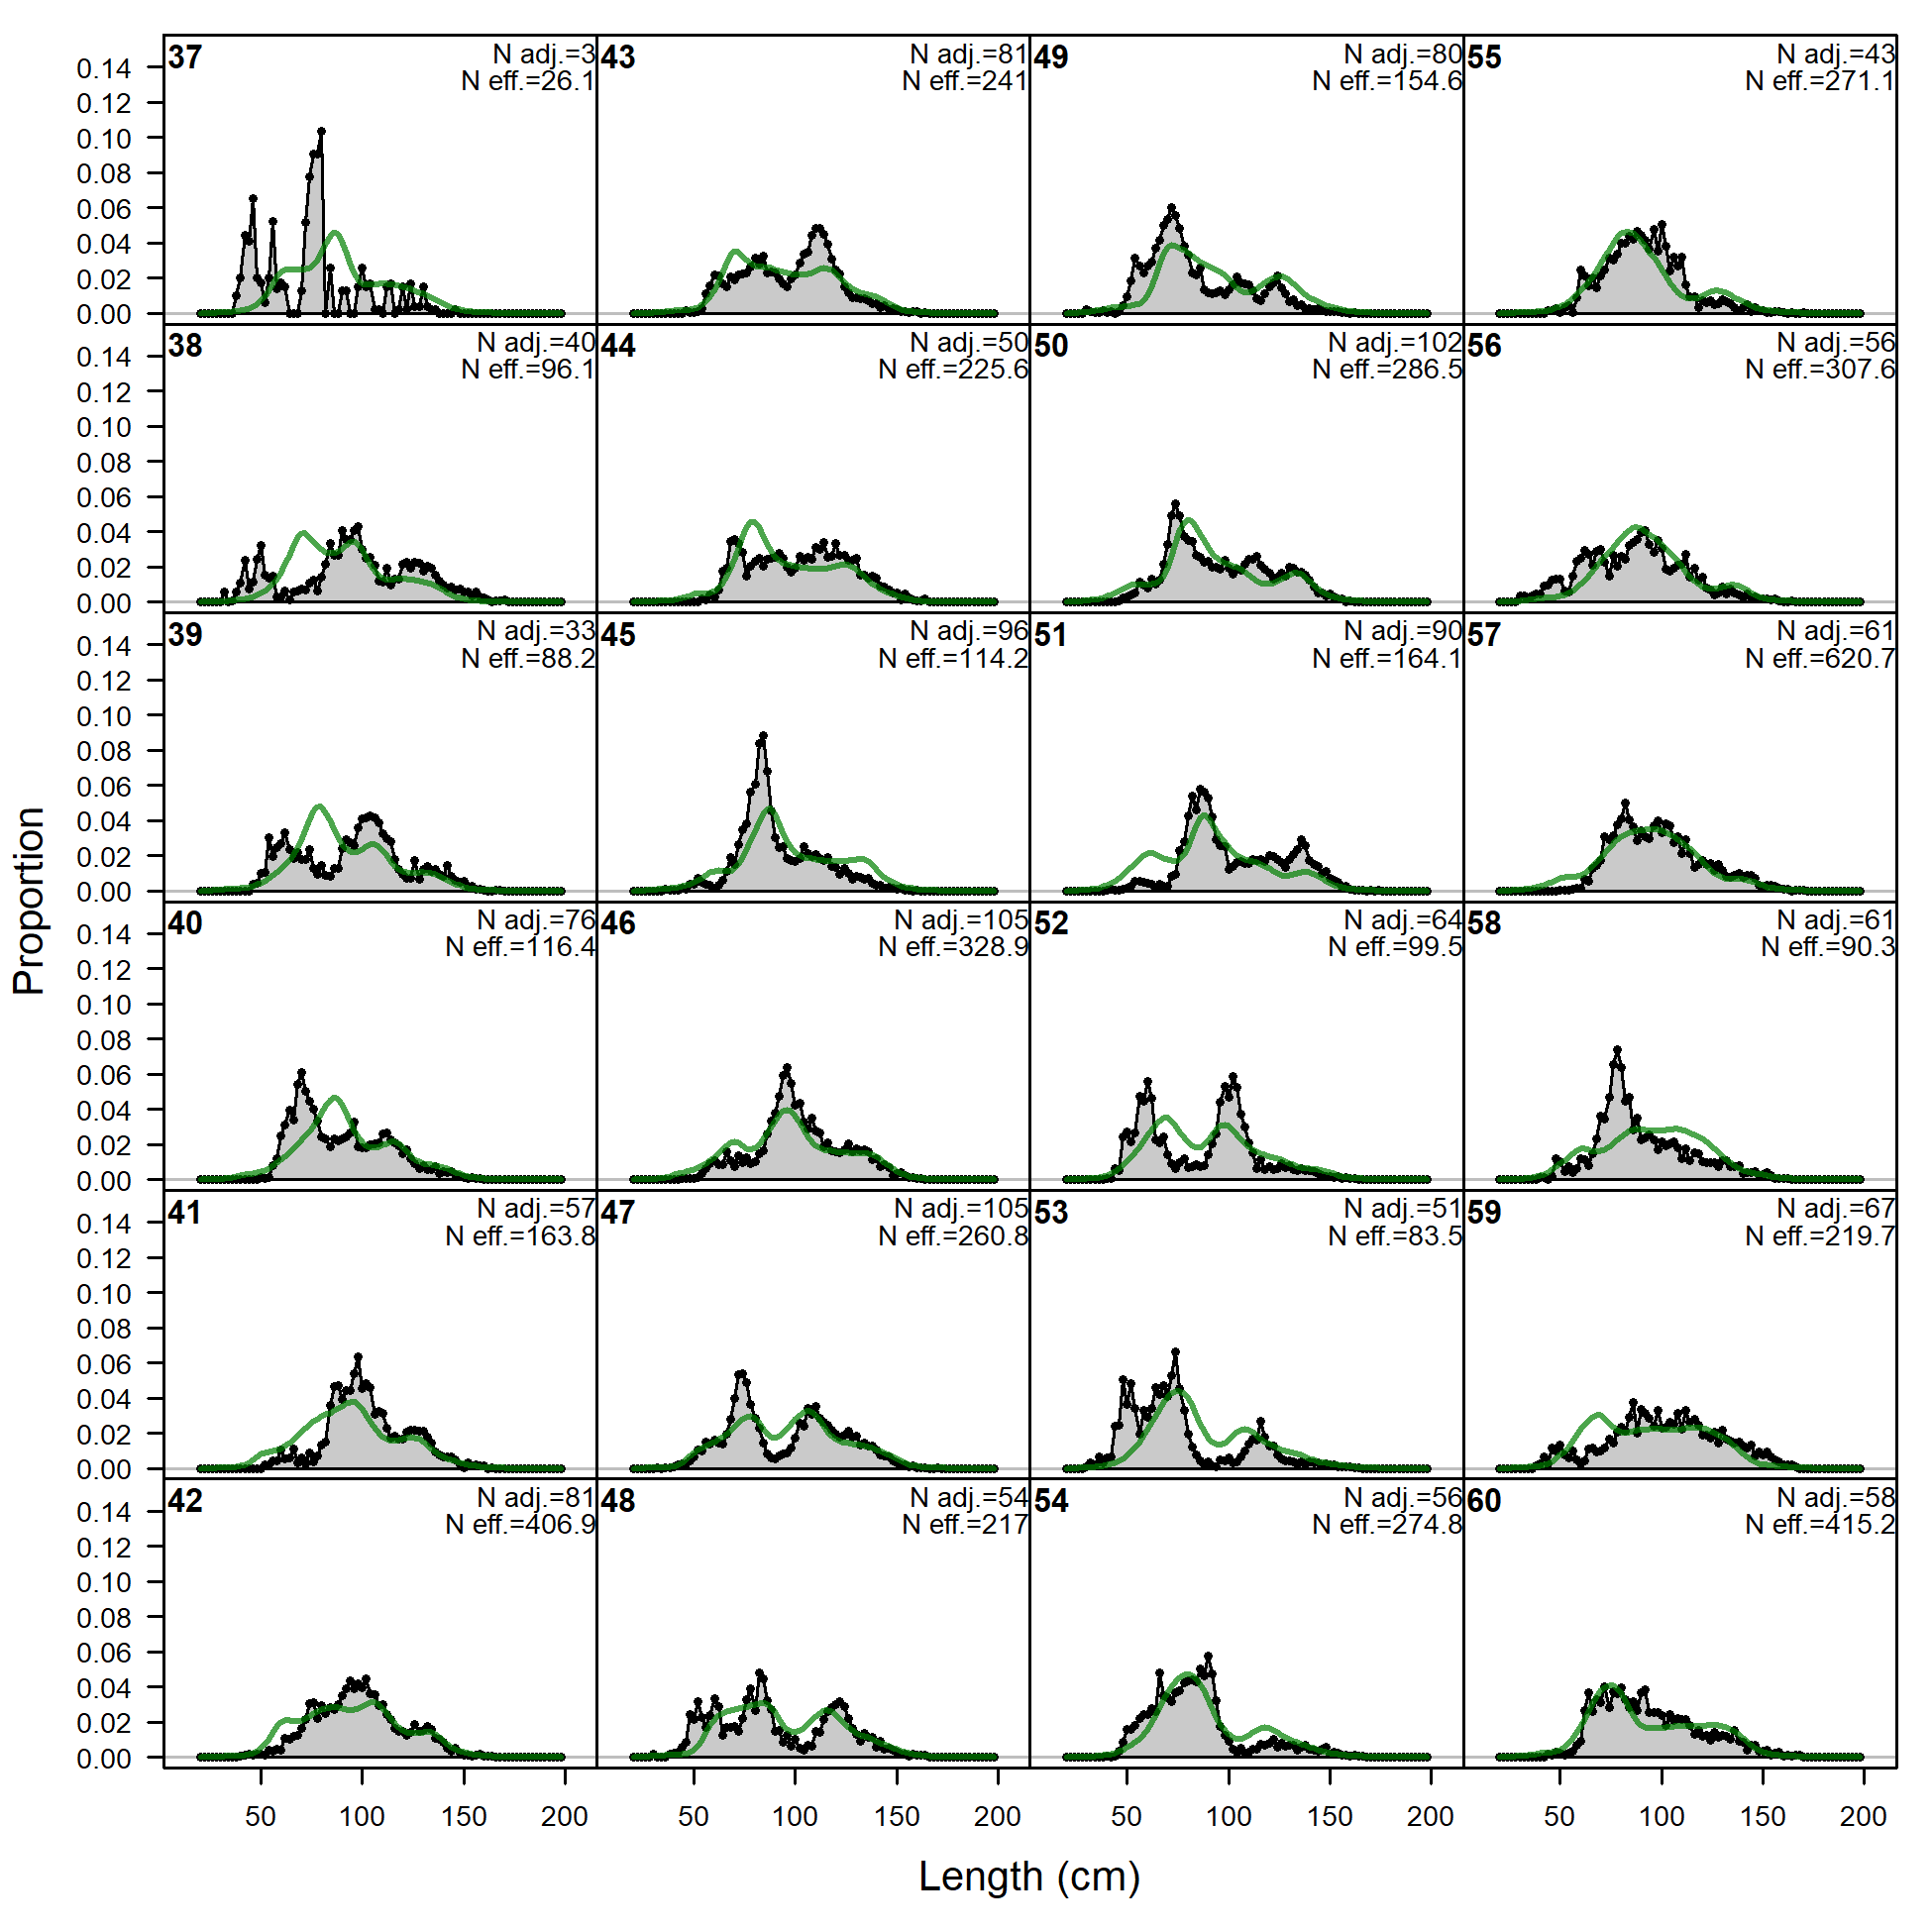
Length comps, whole catch, F18.DEL.C.offshore (plot 1 of 4).
'N adj.' is the input sample size after data-weighting adjustment. N eff. is the calculated effective sample size used in the McAllister-Ianelli tuning method.
file: comp_lenfit_flt18mkt0_page1.png
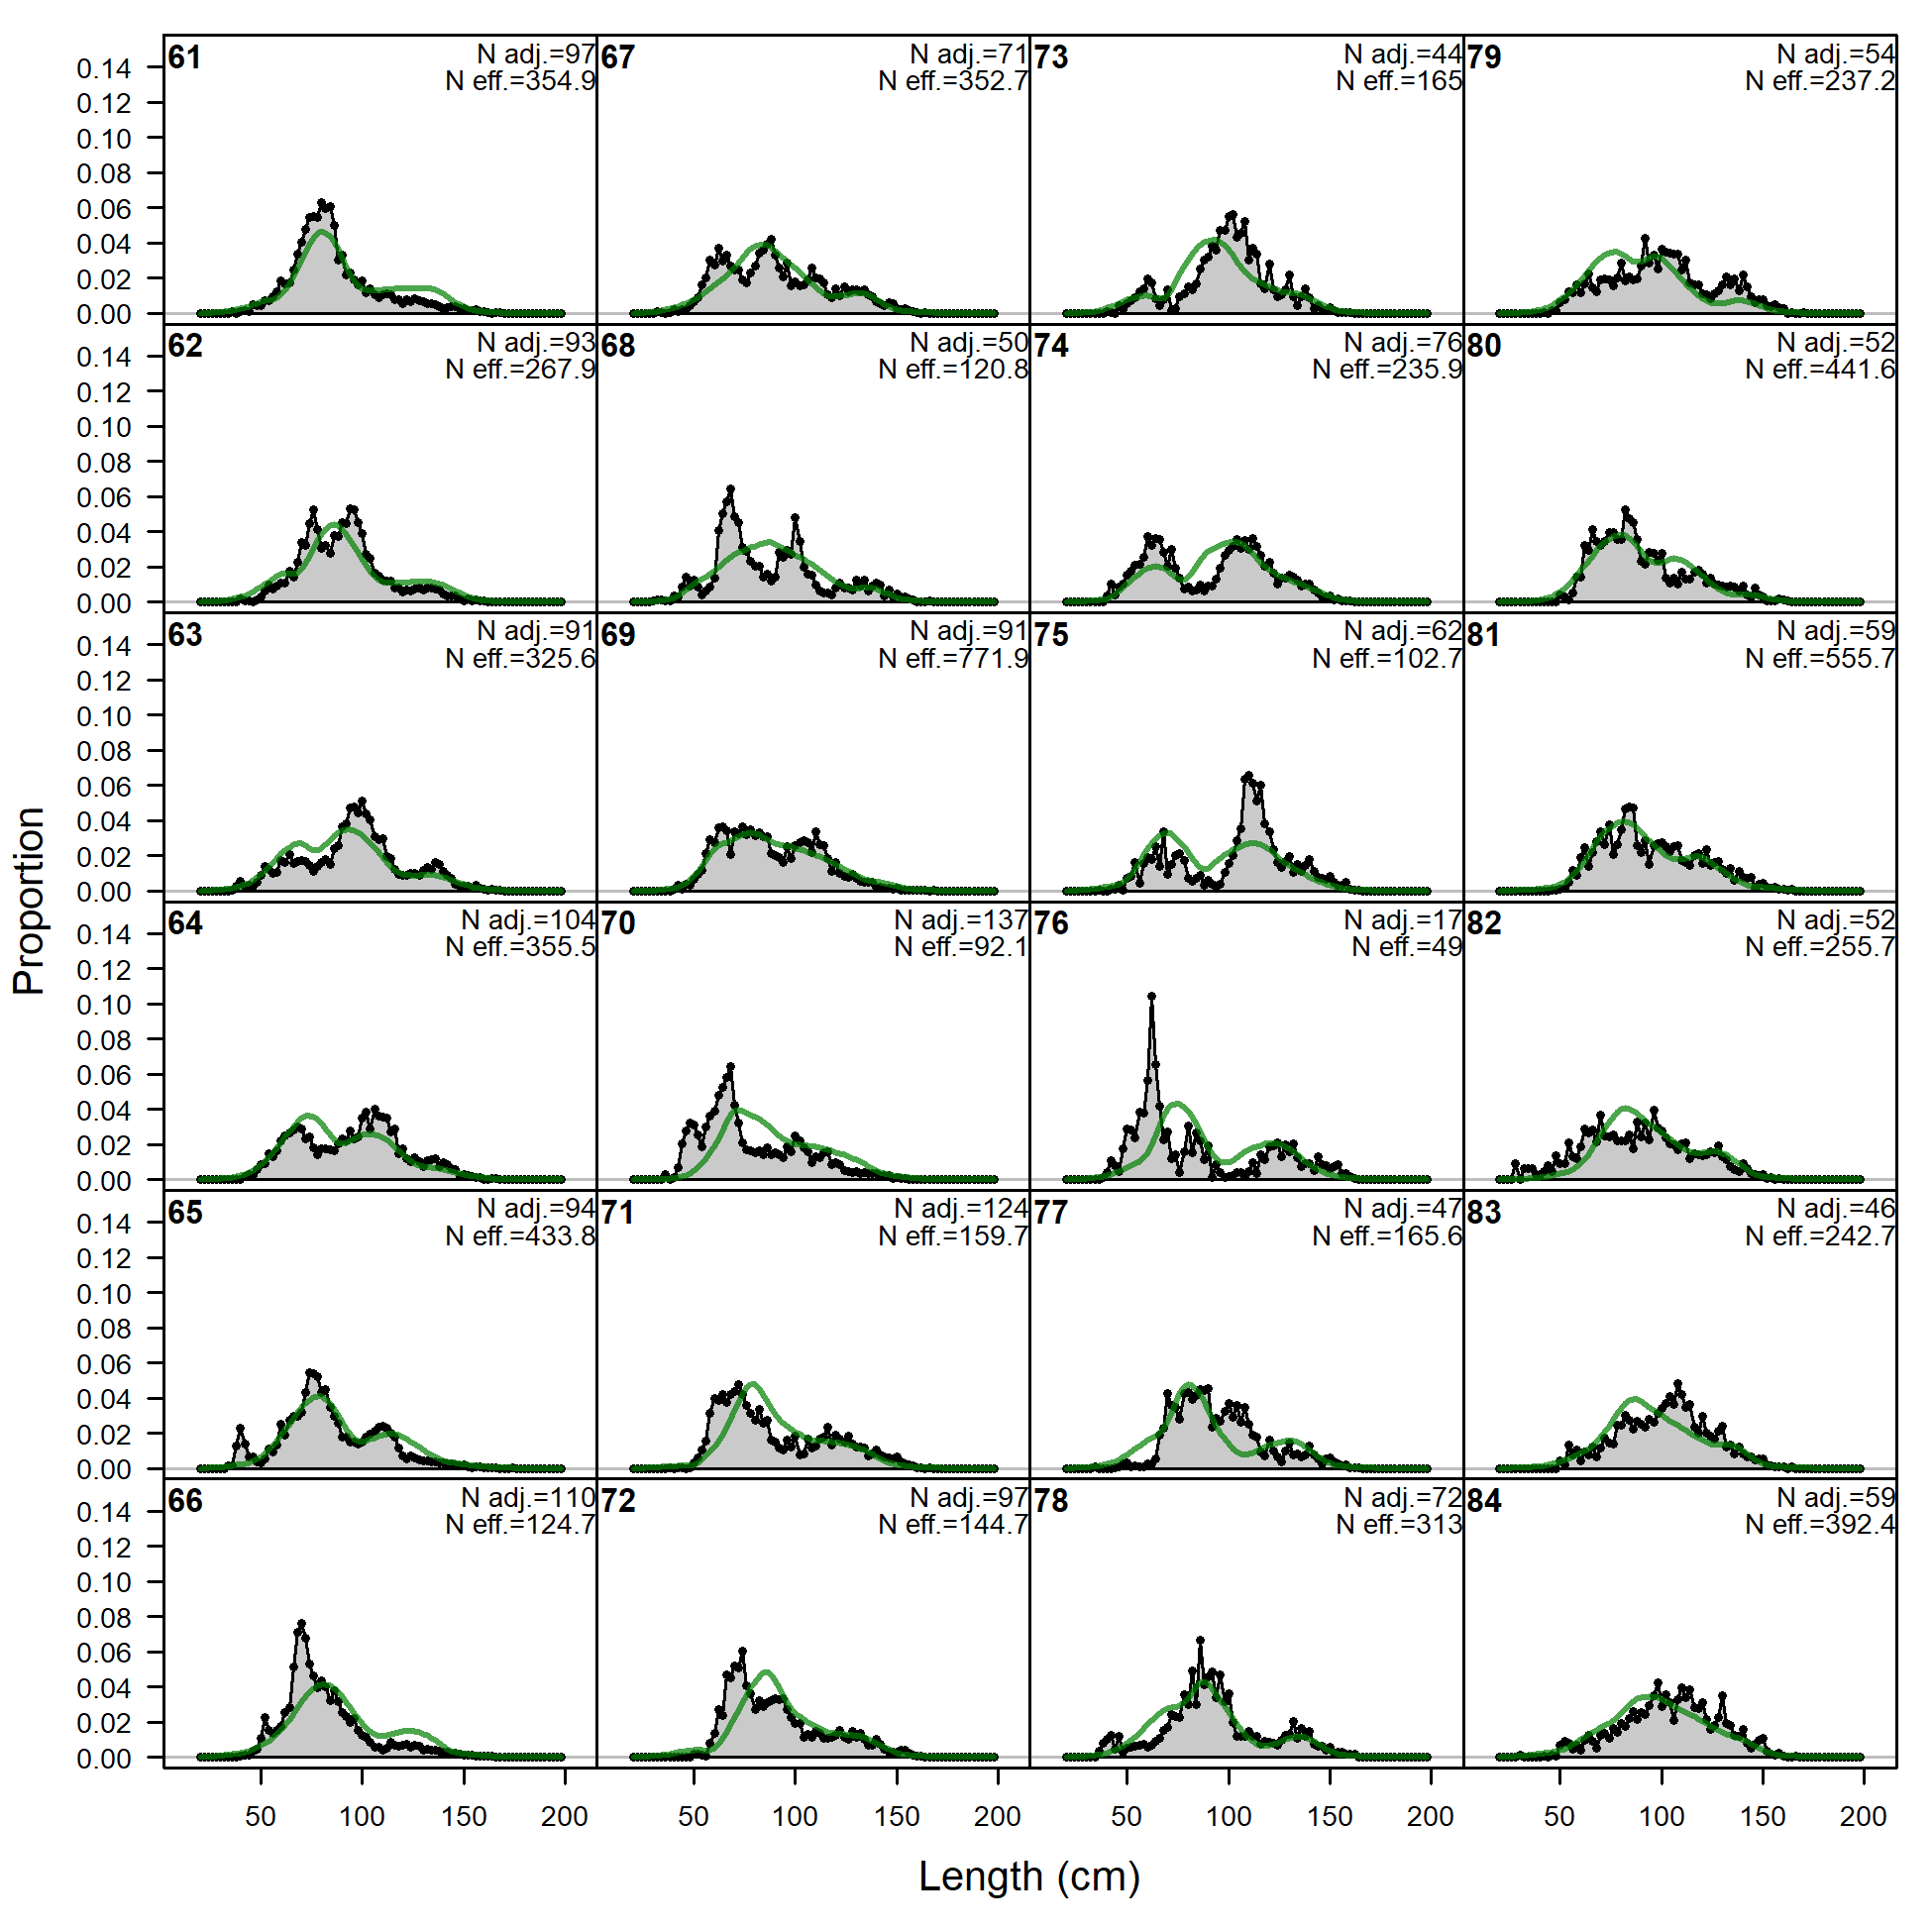
Length comps, whole catch, F18.DEL.C.offshore (plot 1 of 4).
'N adj.' is the input sample size after data-weighting adjustment. N eff. is the calculated effective sample size used in the McAllister-Ianelli tuning method. (plot 2 of 4)
file: comp_lenfit_flt18mkt0_page2.png
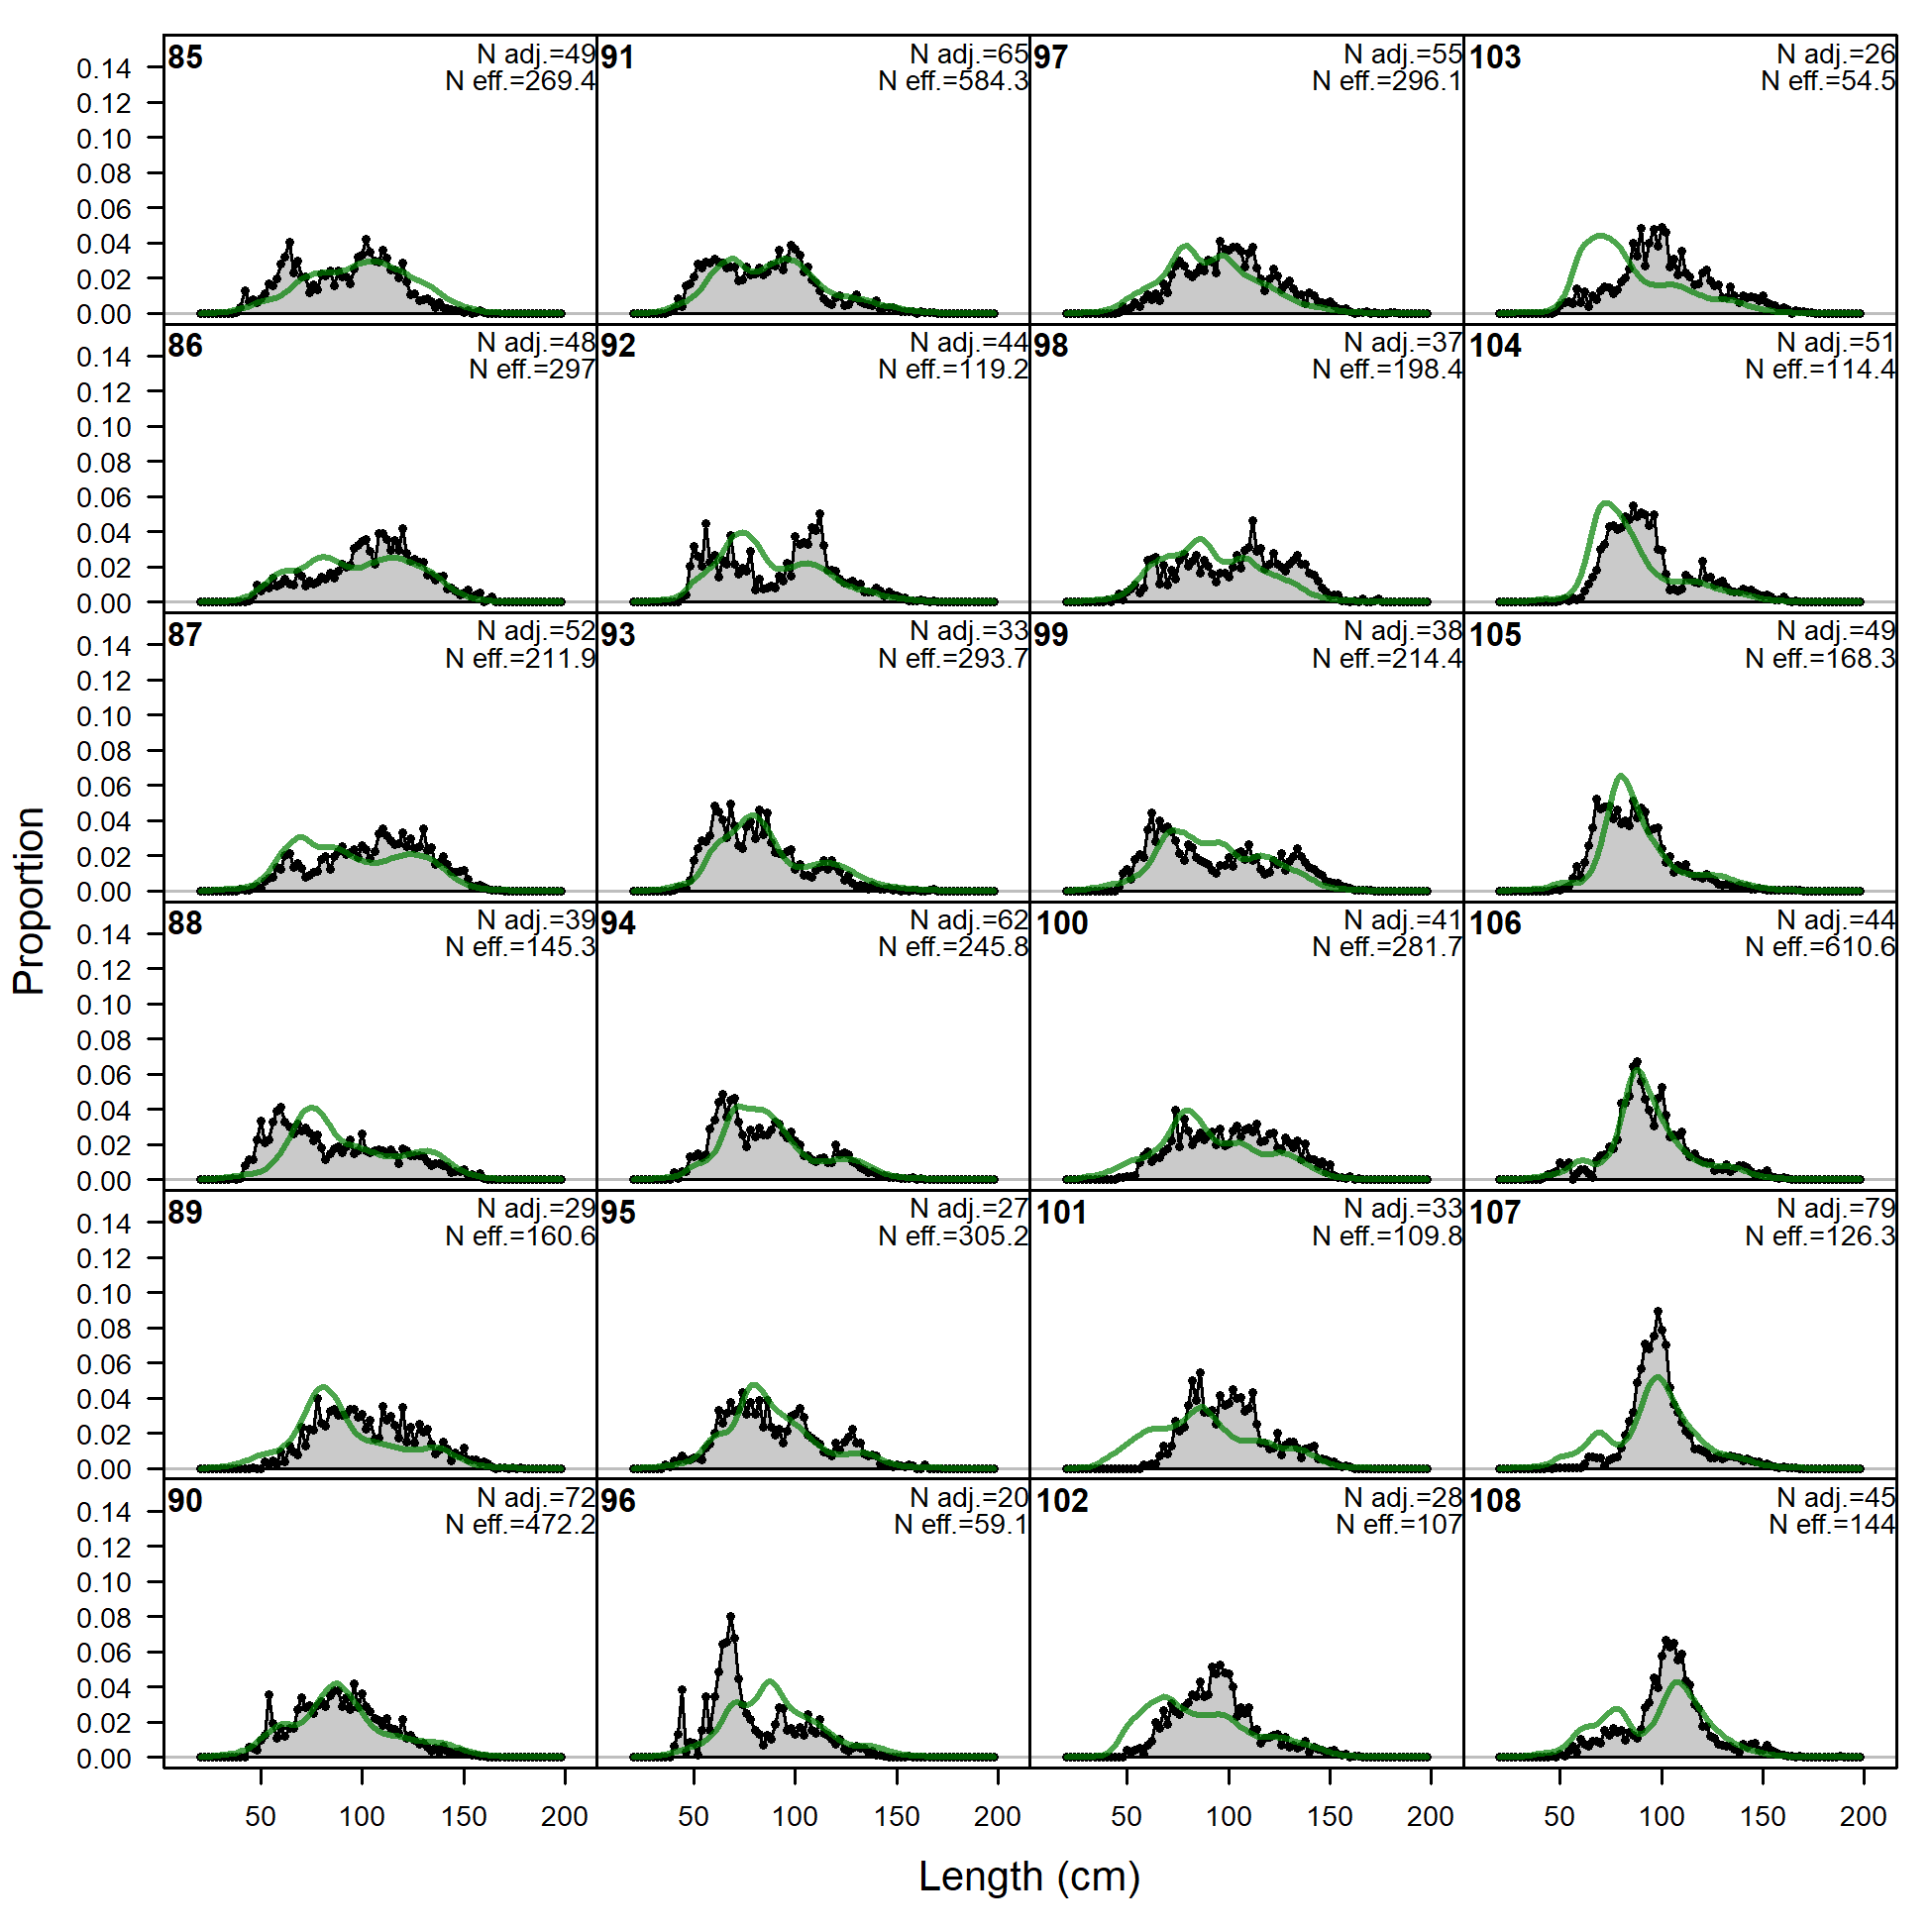
Length comps, whole catch, F18.DEL.C.offshore (plot 1 of 4).
'N adj.' is the input sample size after data-weighting adjustment. N eff. is the calculated effective sample size used in the McAllister-Ianelli tuning method. (plot 2 of 4) (plot 3 of 4)
file: comp_lenfit_flt18mkt0_page3.png
Length comps, whole catch, F18.DEL.C.offshore (plot 1 of 4).
'N adj.' is the input sample size after data-weighting adjustment. N eff. is the calculated effective sample size used in the McAllister-Ianelli tuning method. (plot 2 of 4) (plot 3 of 4) (plot 4 of 4)
file: comp_lenfit_flt18mkt0_page4.png
Pearson residuals, whole catch, F18.DEL.C.offshore (max=30.41) (plot 4 of 4)
Closed bubbles are positive residuals (observed > expected) and open bubbles are negative residuals (observed < expected).
file: comp_lenfit_residsflt18mkt0_page4.png
N-EffN comparison, Length comps, whole catch, F18.DEL.C.offshore
file: comp_lenfit_sampsize_flt18mkt0.png
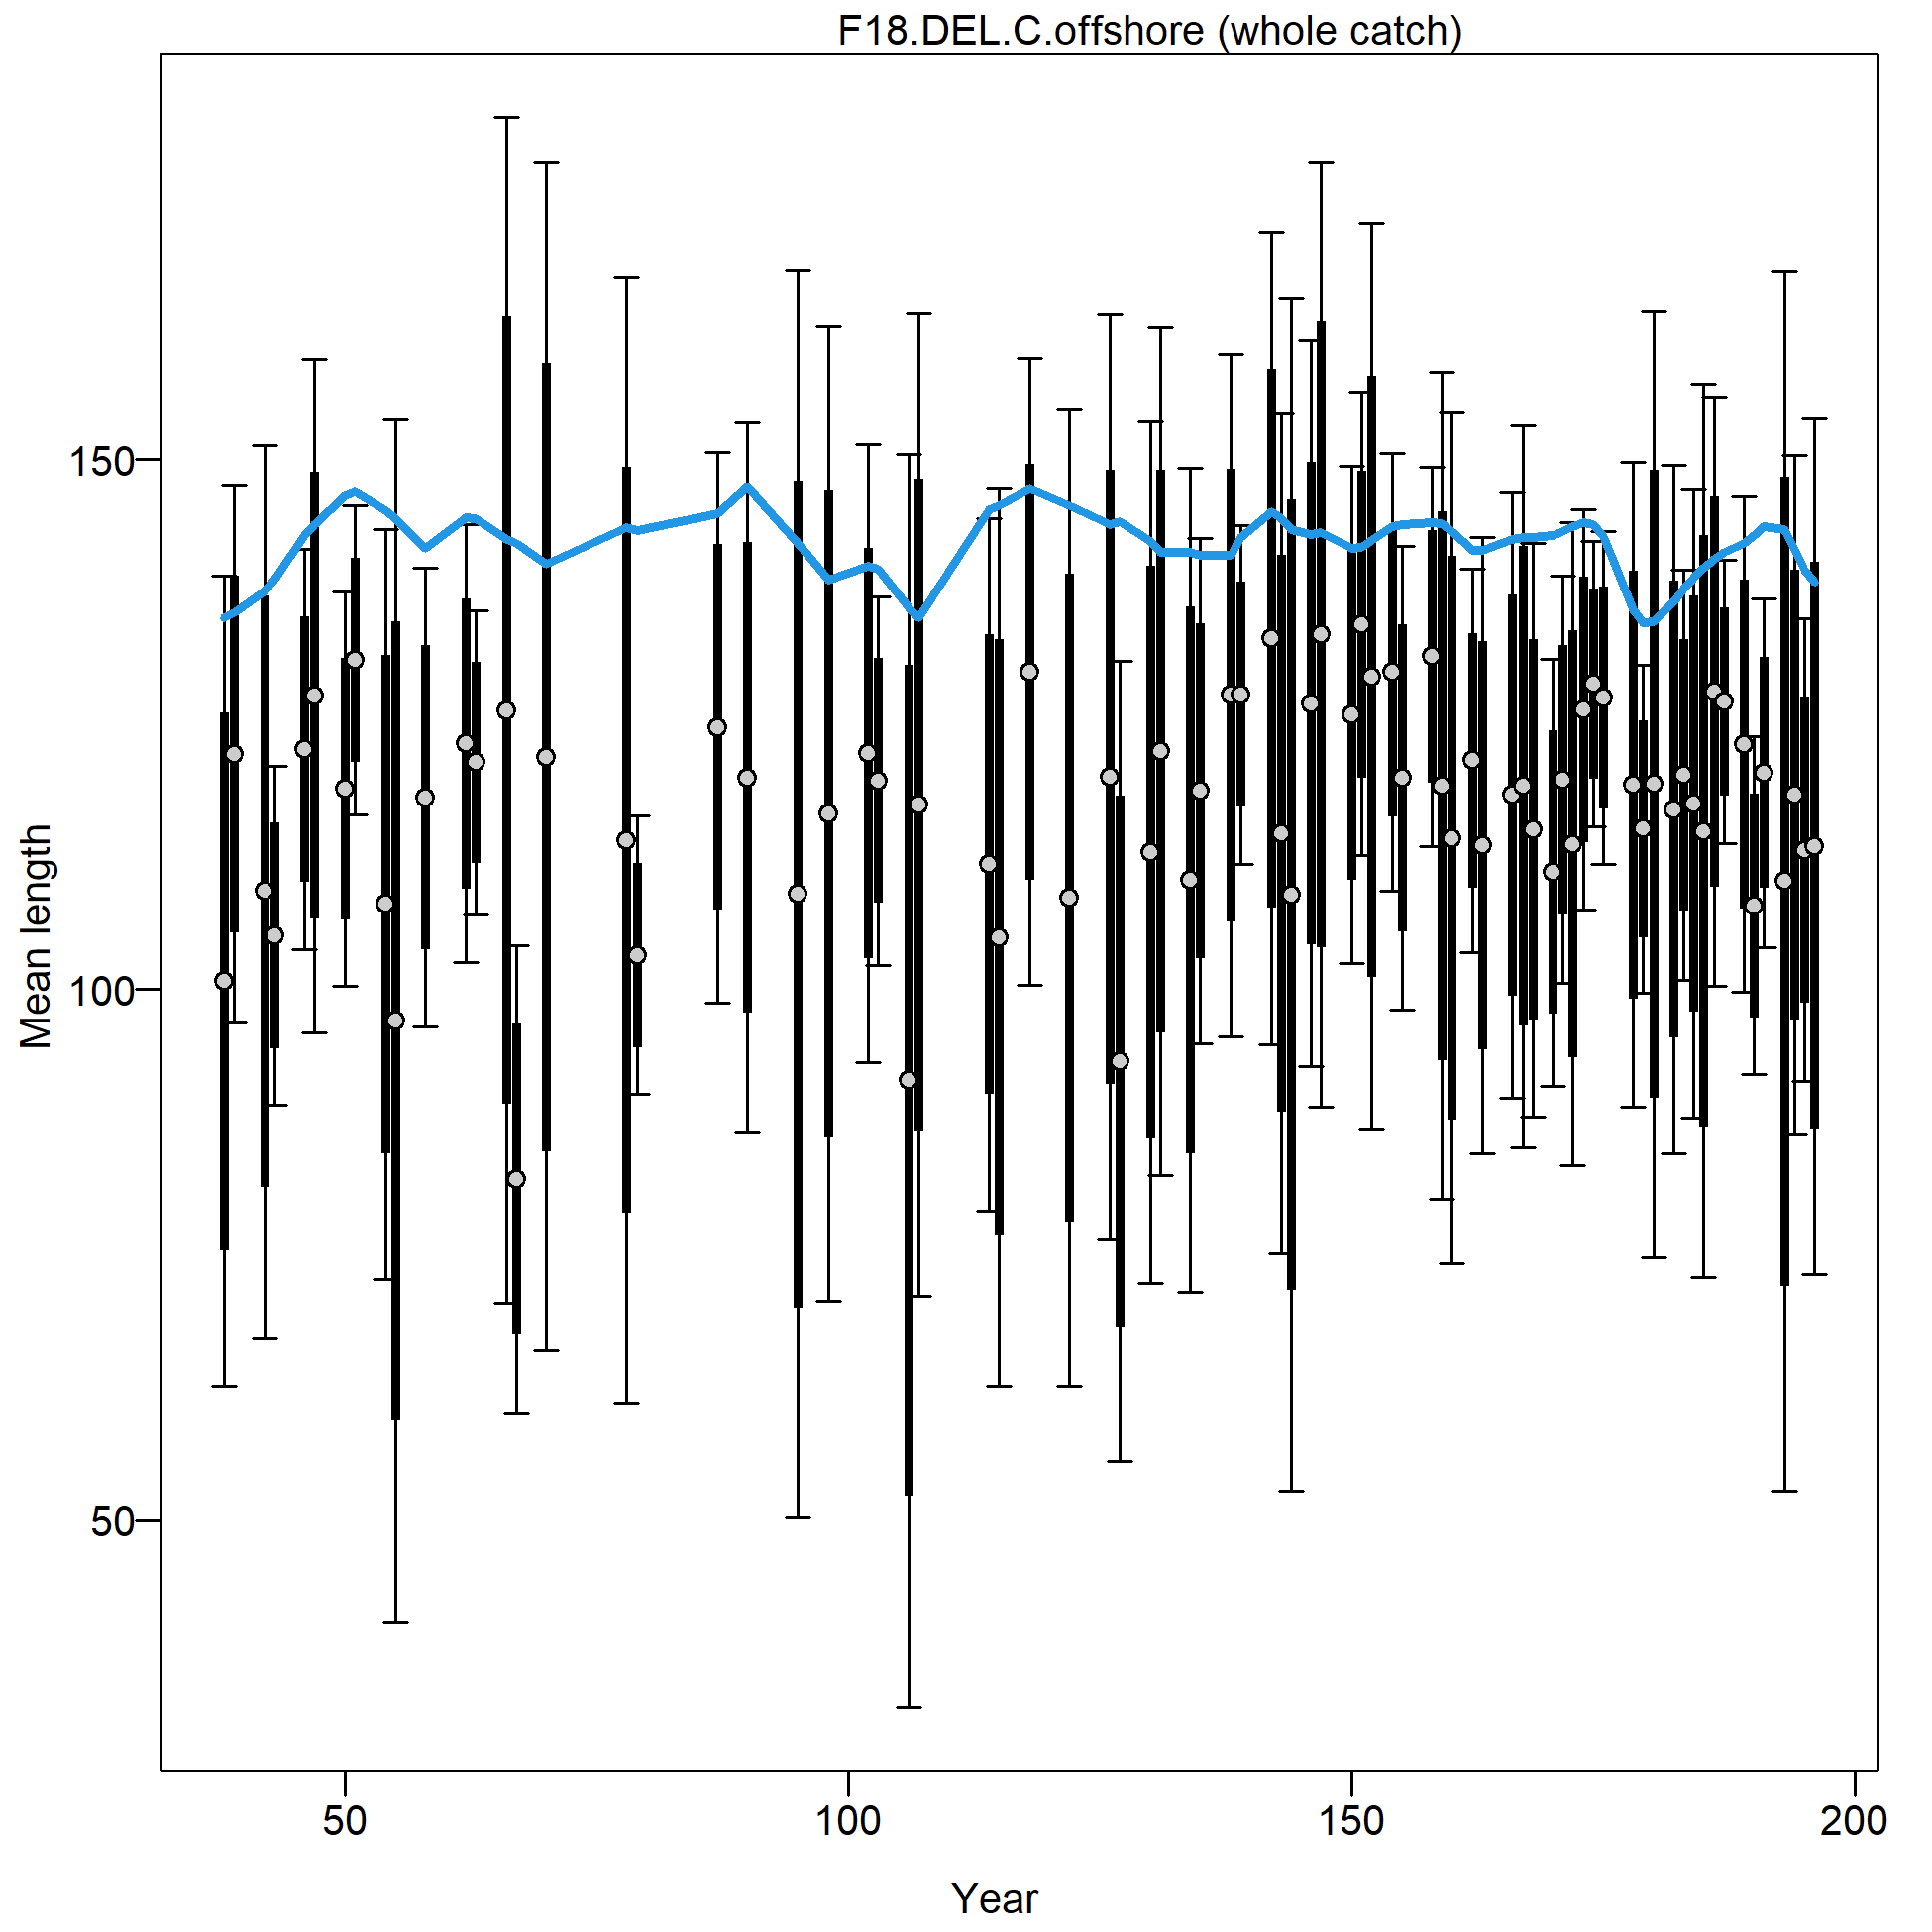
Mean length for F18.DEL.C.offshore with 95% confidence intervals based on current sample sizes.
Francis data weighting method TA1.8: thinner intervals (with capped ends) show result of further adjusting sample sizes based on suggested multiplier (with 95% interval) for len data from F18.DEL.C.offshore:
0.4401 (0.2698-0.9683)
For more info, see Francis (2011).
file: comp_lenfit_data_weighting_TA1.8_F18.DEL.C.offshore.png
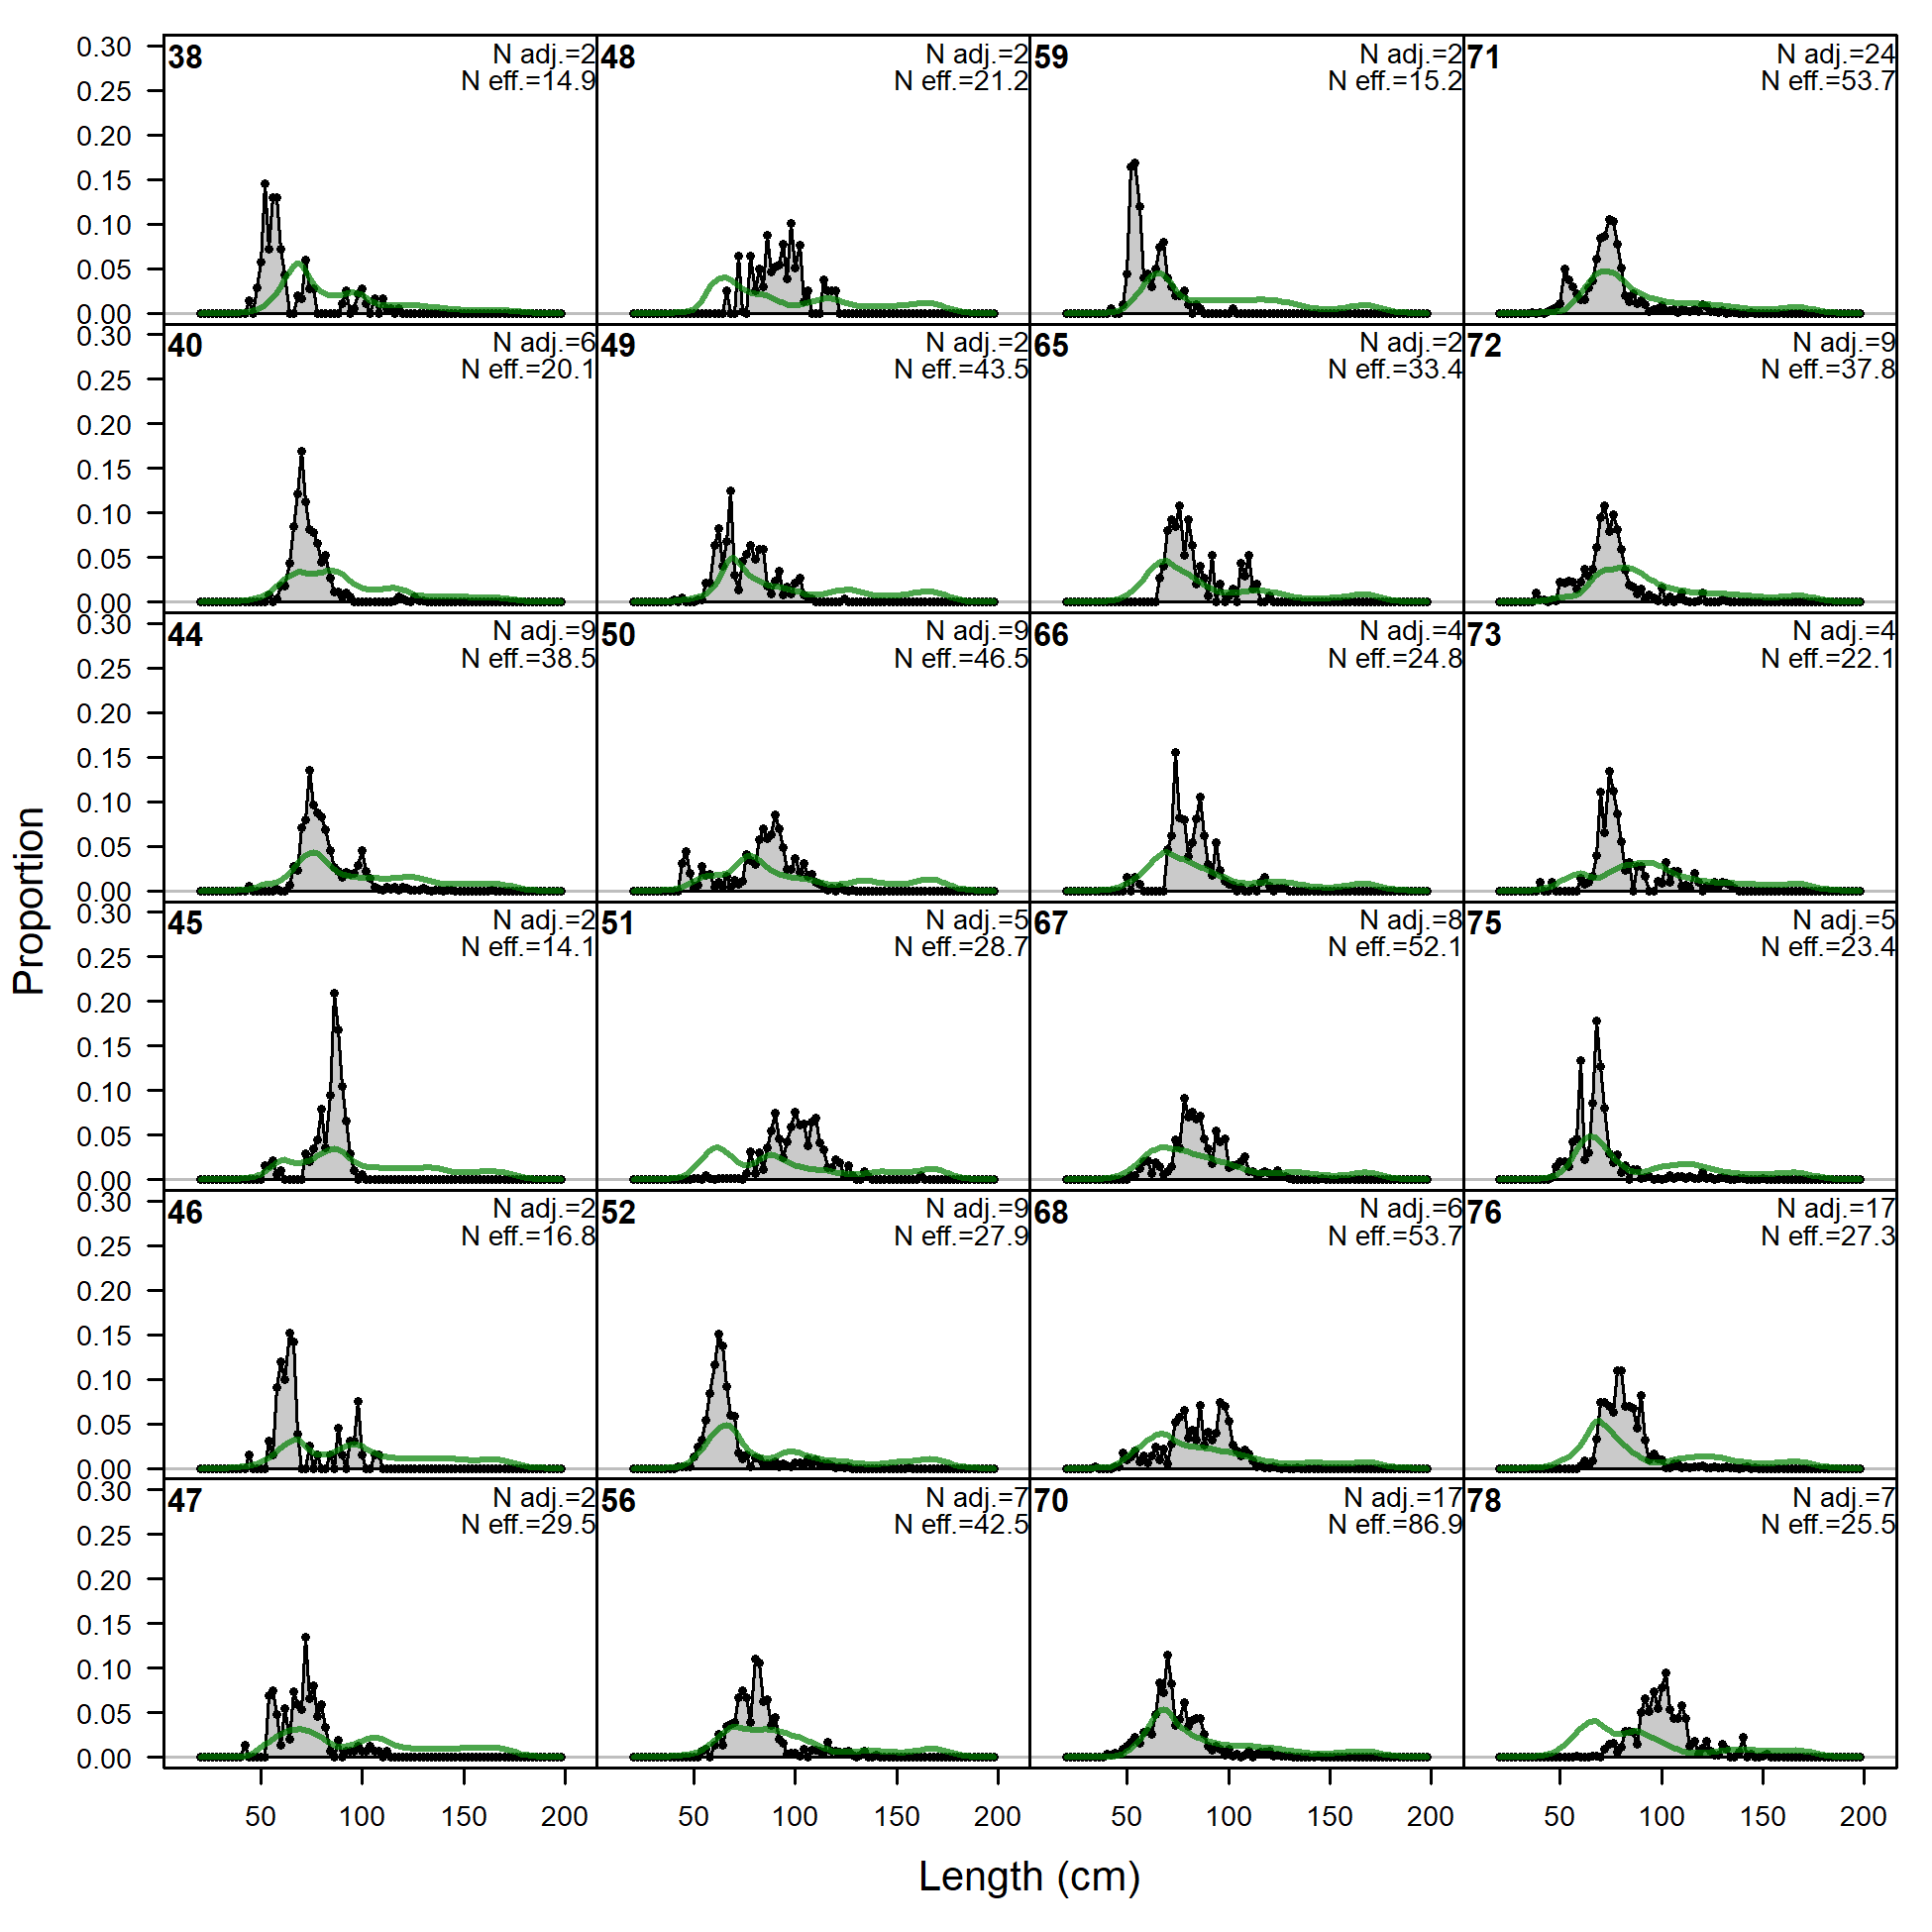
Length comps, whole catch, F19.DEL.C.inshore (plot 1 of 7).
'N adj.' is the input sample size after data-weighting adjustment. N eff. is the calculated effective sample size used in the McAllister-Ianelli tuning method.
file: comp_lenfit_flt19mkt0_page1.png
Length comps, whole catch, F19.DEL.C.inshore (plot 1 of 7).
'N adj.' is the input sample size after data-weighting adjustment. N eff. is the calculated effective sample size used in the McAllister-Ianelli tuning method. (plot 2 of 7)
file: comp_lenfit_flt19mkt0_page2.png
Length comps, whole catch, F19.DEL.C.inshore (plot 1 of 7).
'N adj.' is the input sample size after data-weighting adjustment. N eff. is the calculated effective sample size used in the McAllister-Ianelli tuning method. (plot 2 of 7) (plot 3 of 7)
file: comp_lenfit_flt19mkt0_page3.png
Length comps, whole catch, F19.DEL.C.inshore (plot 1 of 7).
'N adj.' is the input sample size after data-weighting adjustment. N eff. is the calculated effective sample size used in the McAllister-Ianelli tuning method. (plot 2 of 7) (plot 3 of 7) (plot 4 of 7)
file: comp_lenfit_flt19mkt0_page4.png
Length comps, whole catch, F19.DEL.C.inshore (plot 1 of 7).
'N adj.' is the input sample size after data-weighting adjustment. N eff. is the calculated effective sample size used in the McAllister-Ianelli tuning method. (plot 2 of 7) (plot 3 of 7) (plot 4 of 7) (plot 5 of 7)
file: comp_lenfit_flt19mkt0_page5.png
Length comps, whole catch, F19.DEL.C.inshore (plot 1 of 7).
'N adj.' is the input sample size after data-weighting adjustment. N eff. is the calculated effective sample size used in the McAllister-Ianelli tuning method. (plot 2 of 7) (plot 3 of 7) (plot 4 of 7) (plot 5 of 7) (plot 6 of 7)
file: comp_lenfit_flt19mkt0_page6.png
Length comps, whole catch, F19.DEL.C.inshore (plot 1 of 7).
'N adj.' is the input sample size after data-weighting adjustment. N eff. is the calculated effective sample size used in the McAllister-Ianelli tuning method. (plot 2 of 7) (plot 3 of 7) (plot 4 of 7) (plot 5 of 7) (plot 6 of 7) (plot 7 of 7)
file: comp_lenfit_flt19mkt0_page7.png
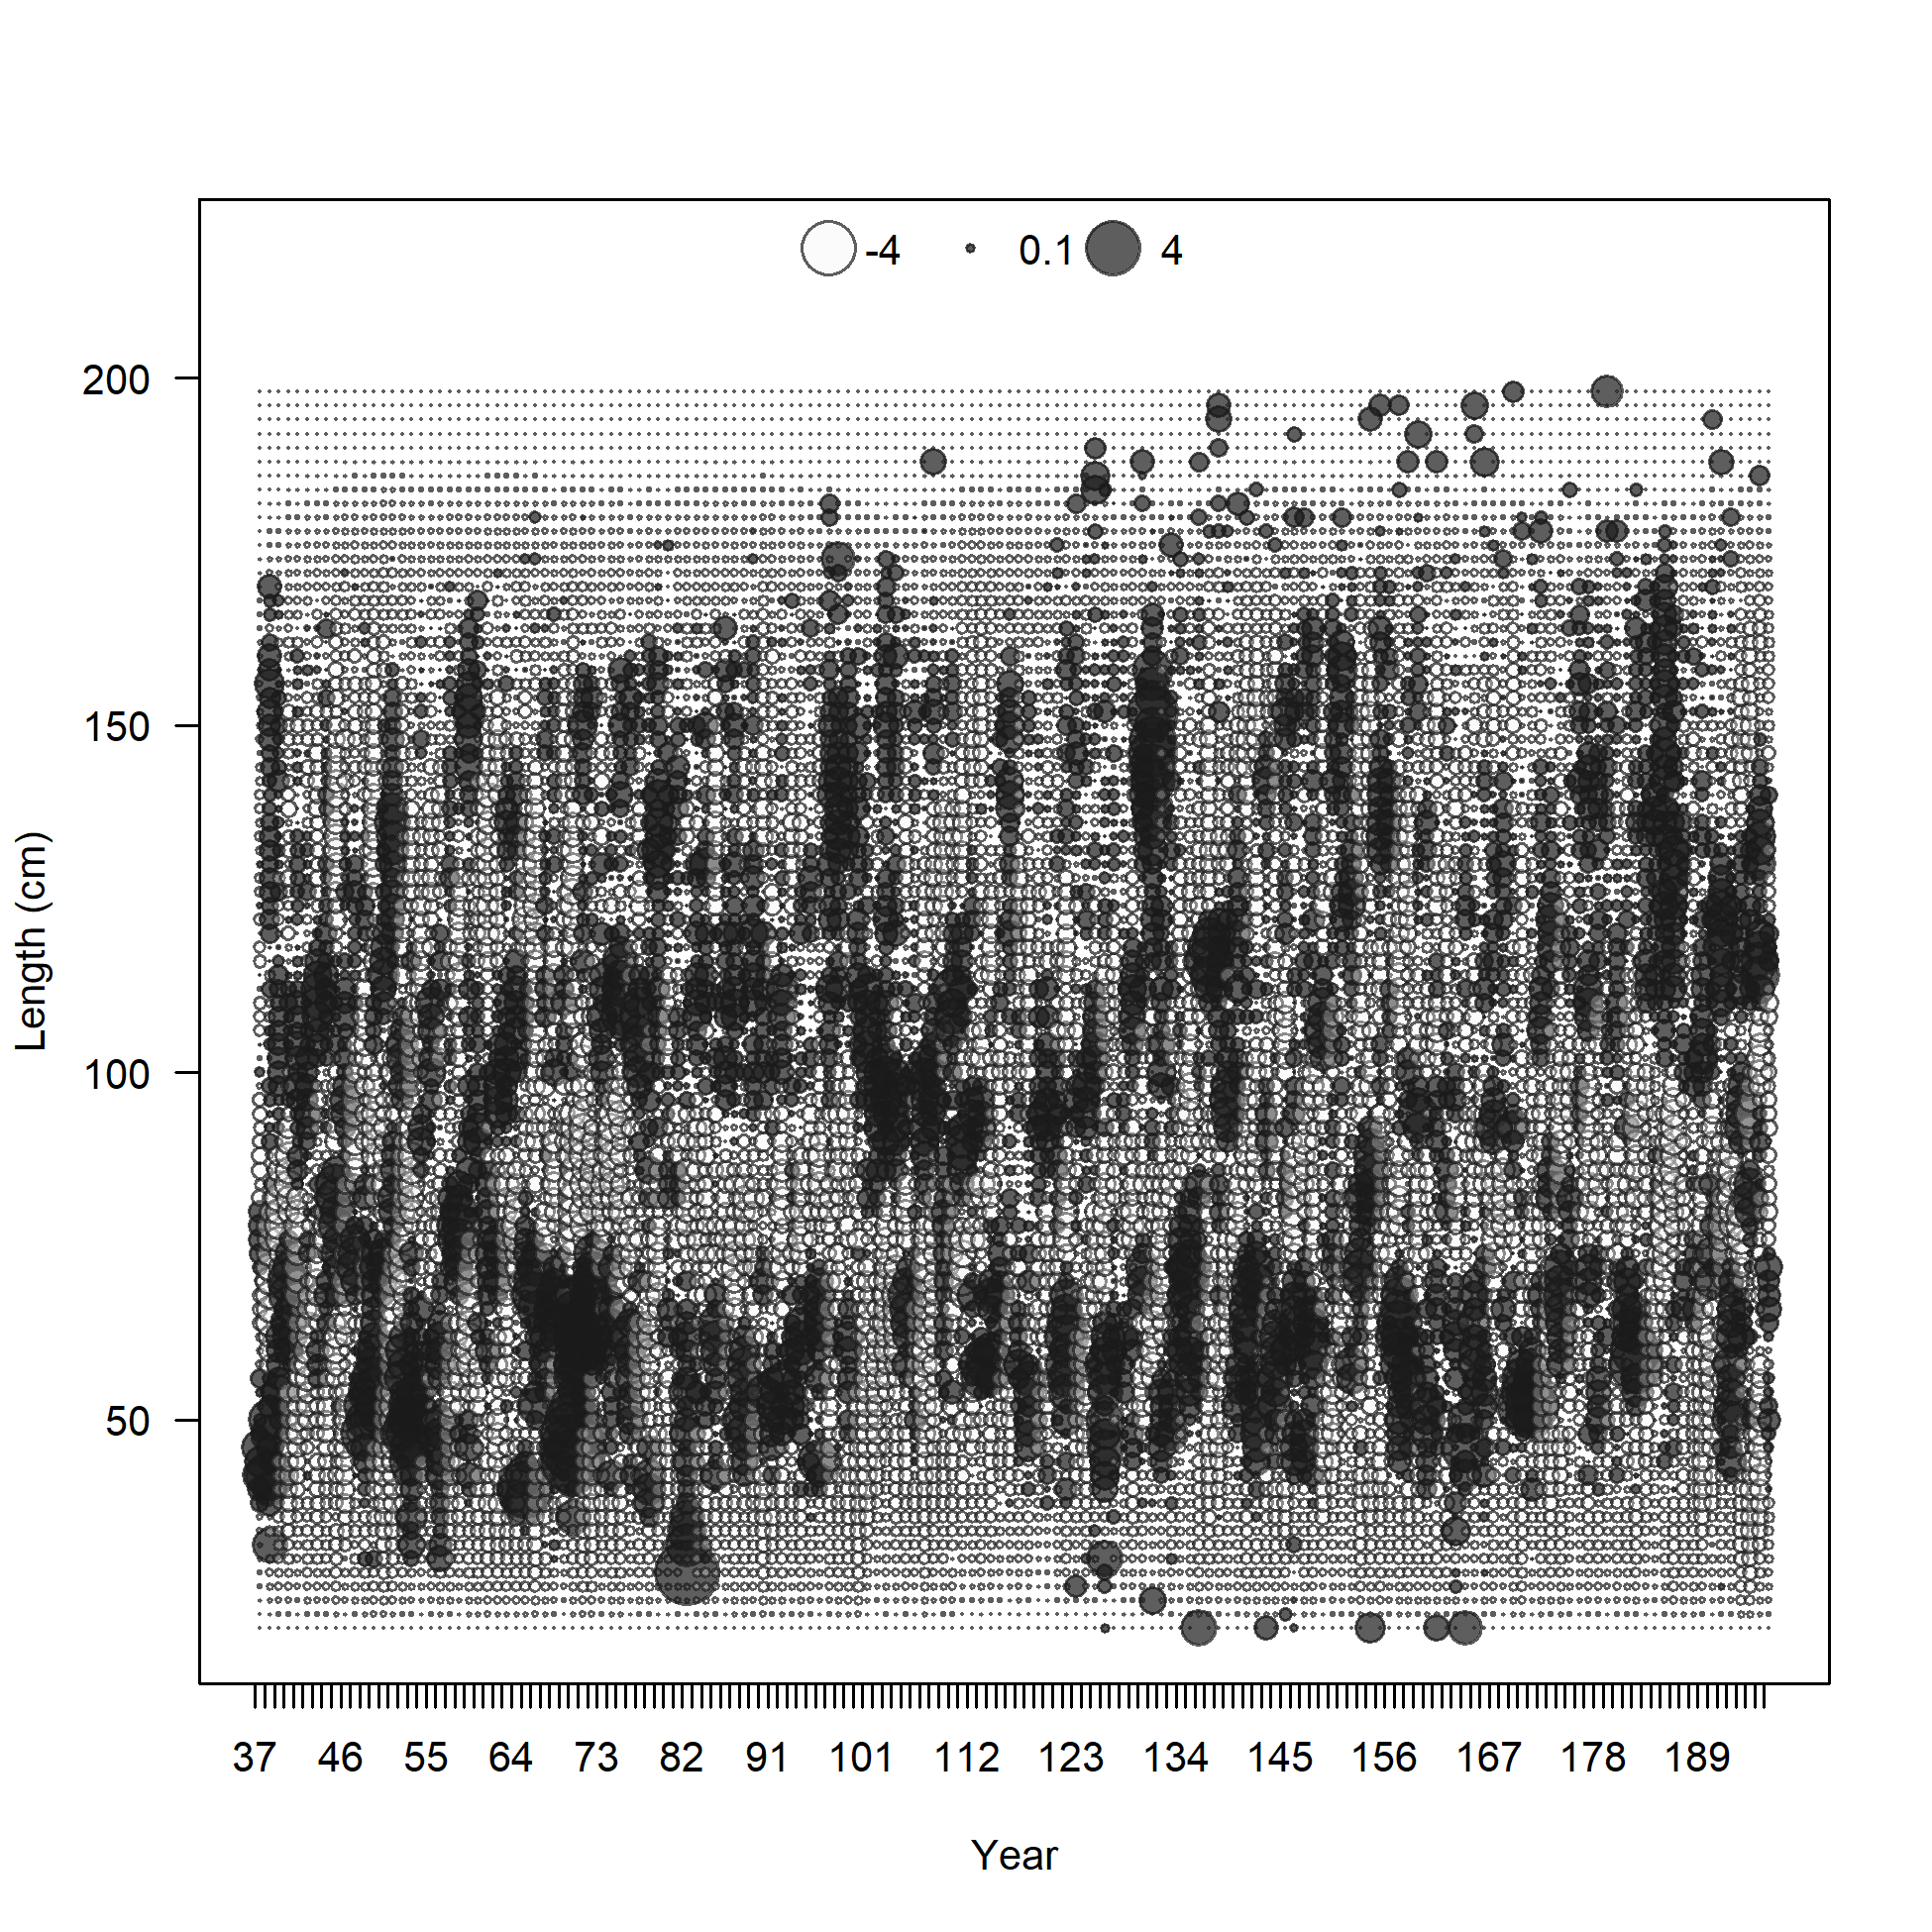
Pearson residuals, whole catch, F19.DEL.C.inshore (max=5.79) (plot 7 of 7)
Closed bubbles are positive residuals (observed > expected) and open bubbles are negative residuals (observed < expected).
file: comp_lenfit_residsflt19mkt0_page7.png
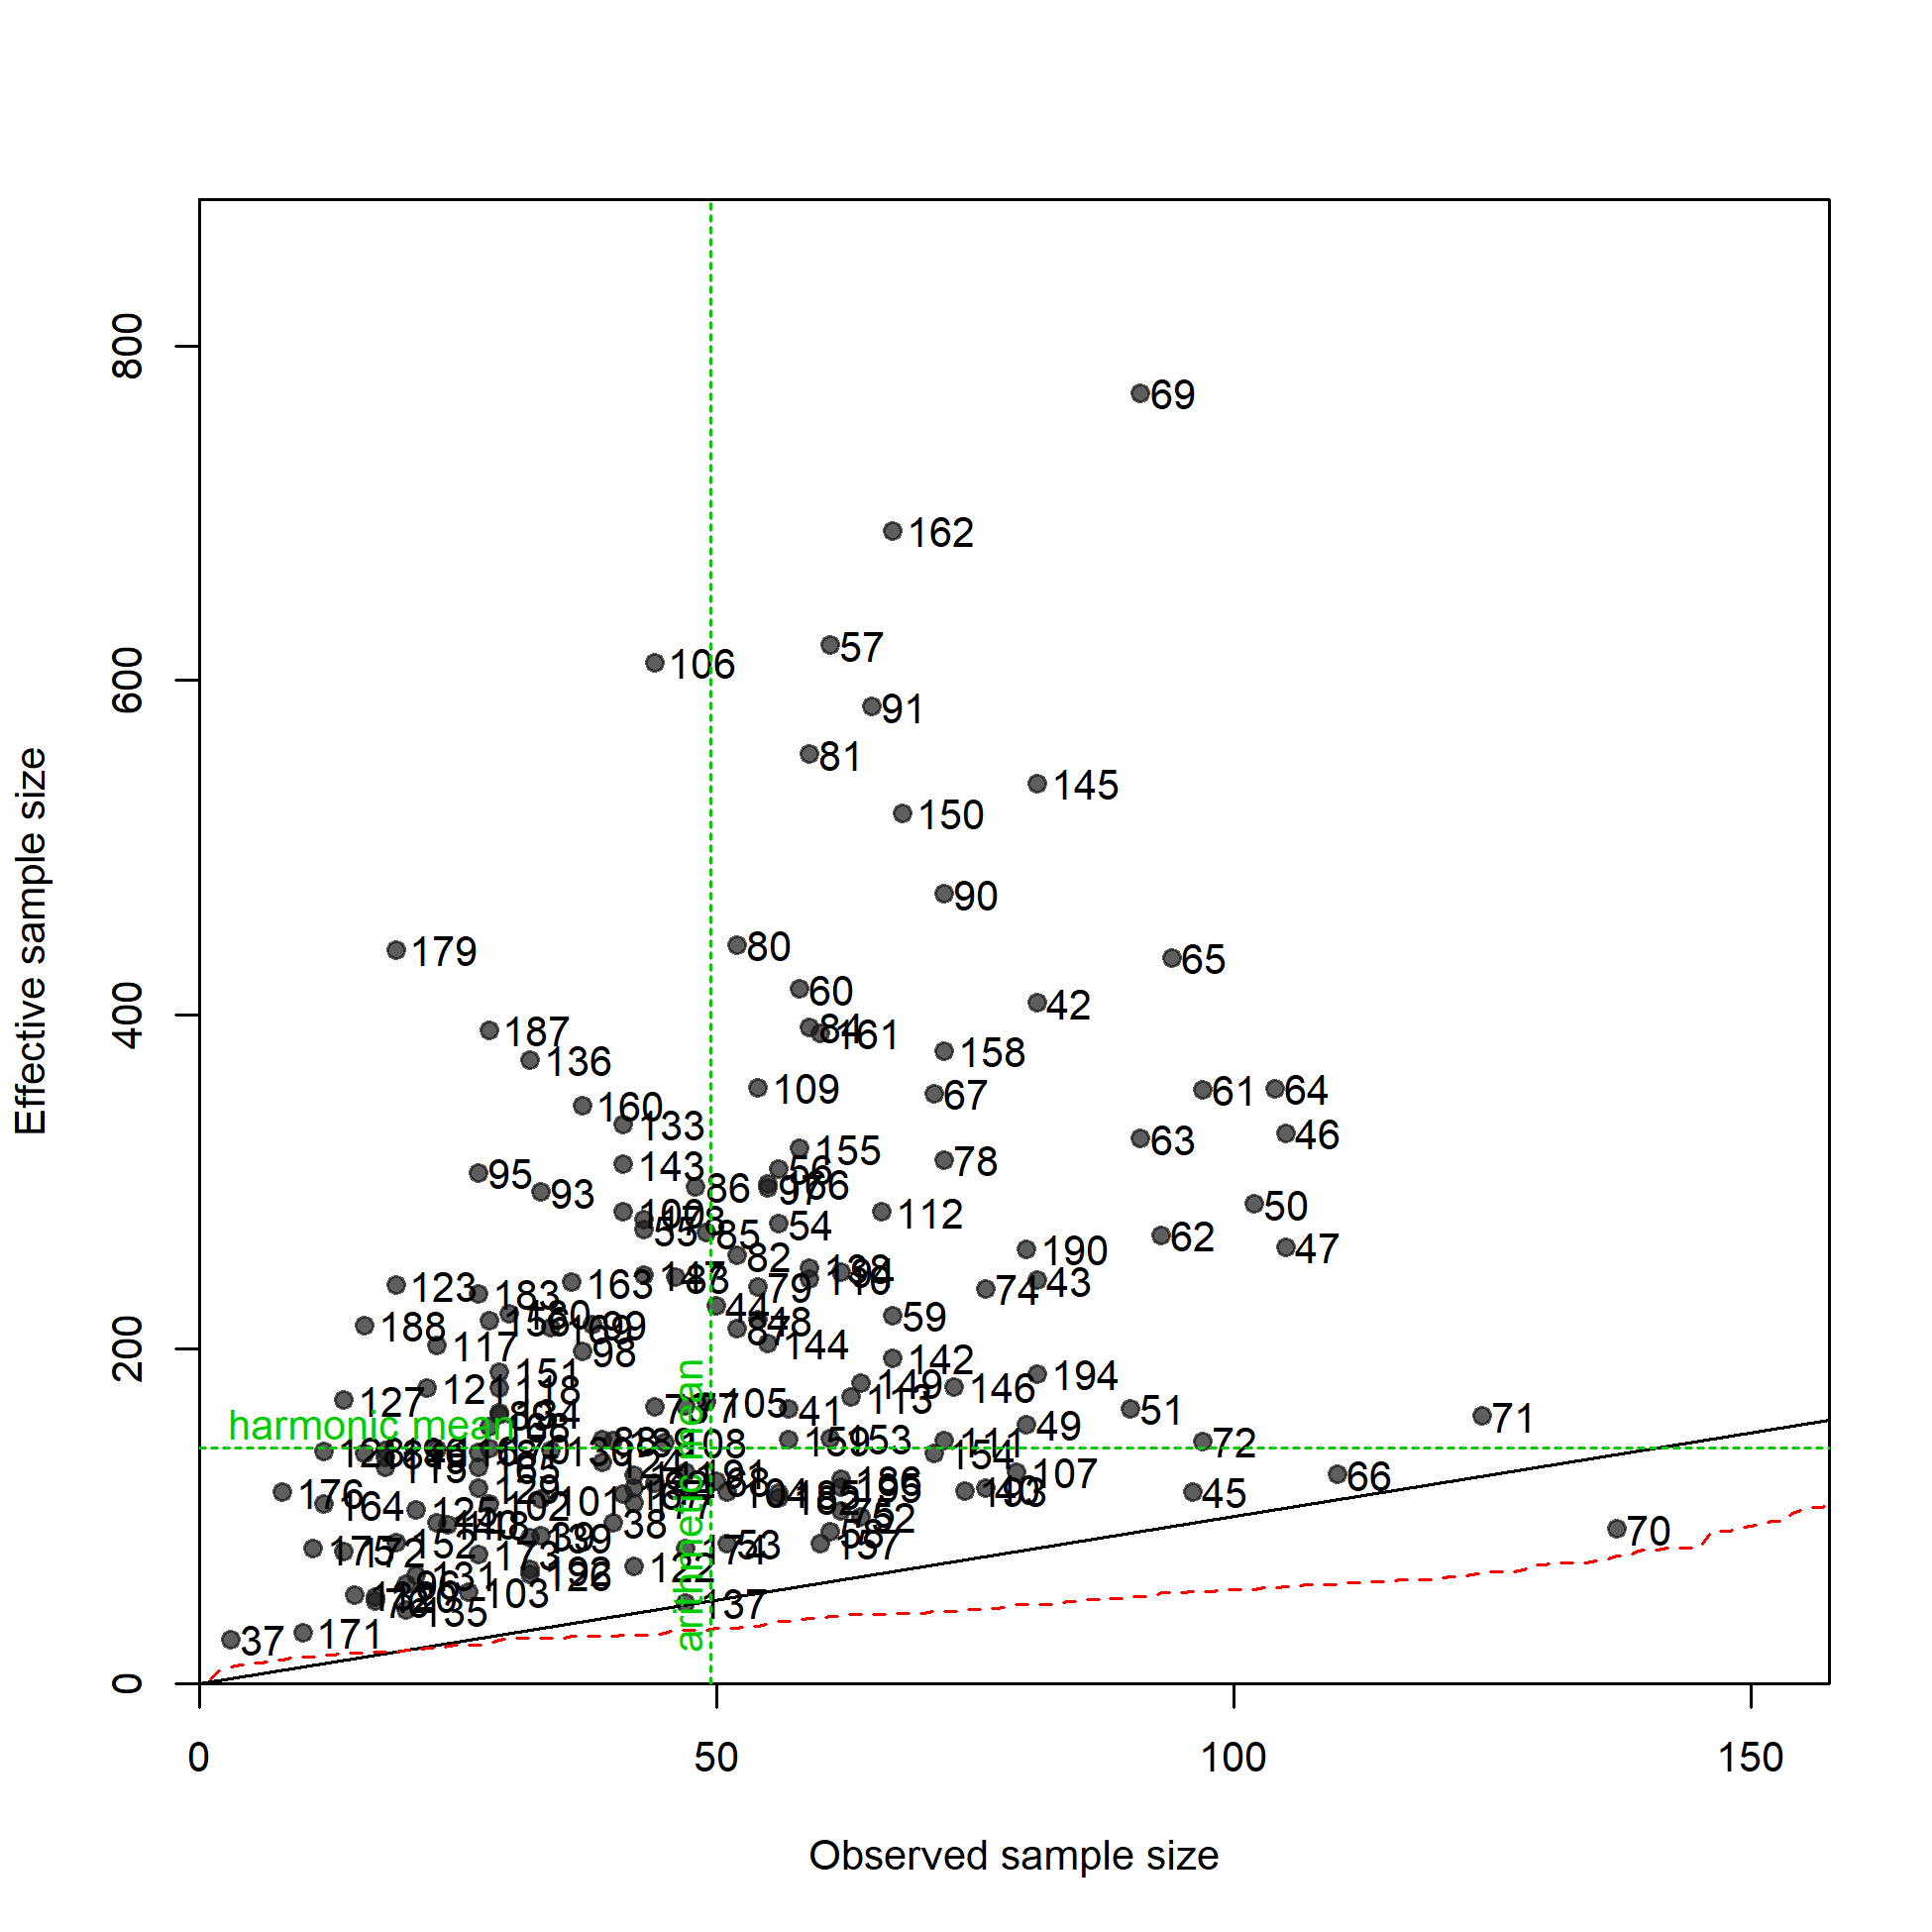
N-EffN comparison, Length comps, whole catch, F19.DEL.C.inshore
file: comp_lenfit_sampsize_flt19mkt0.png
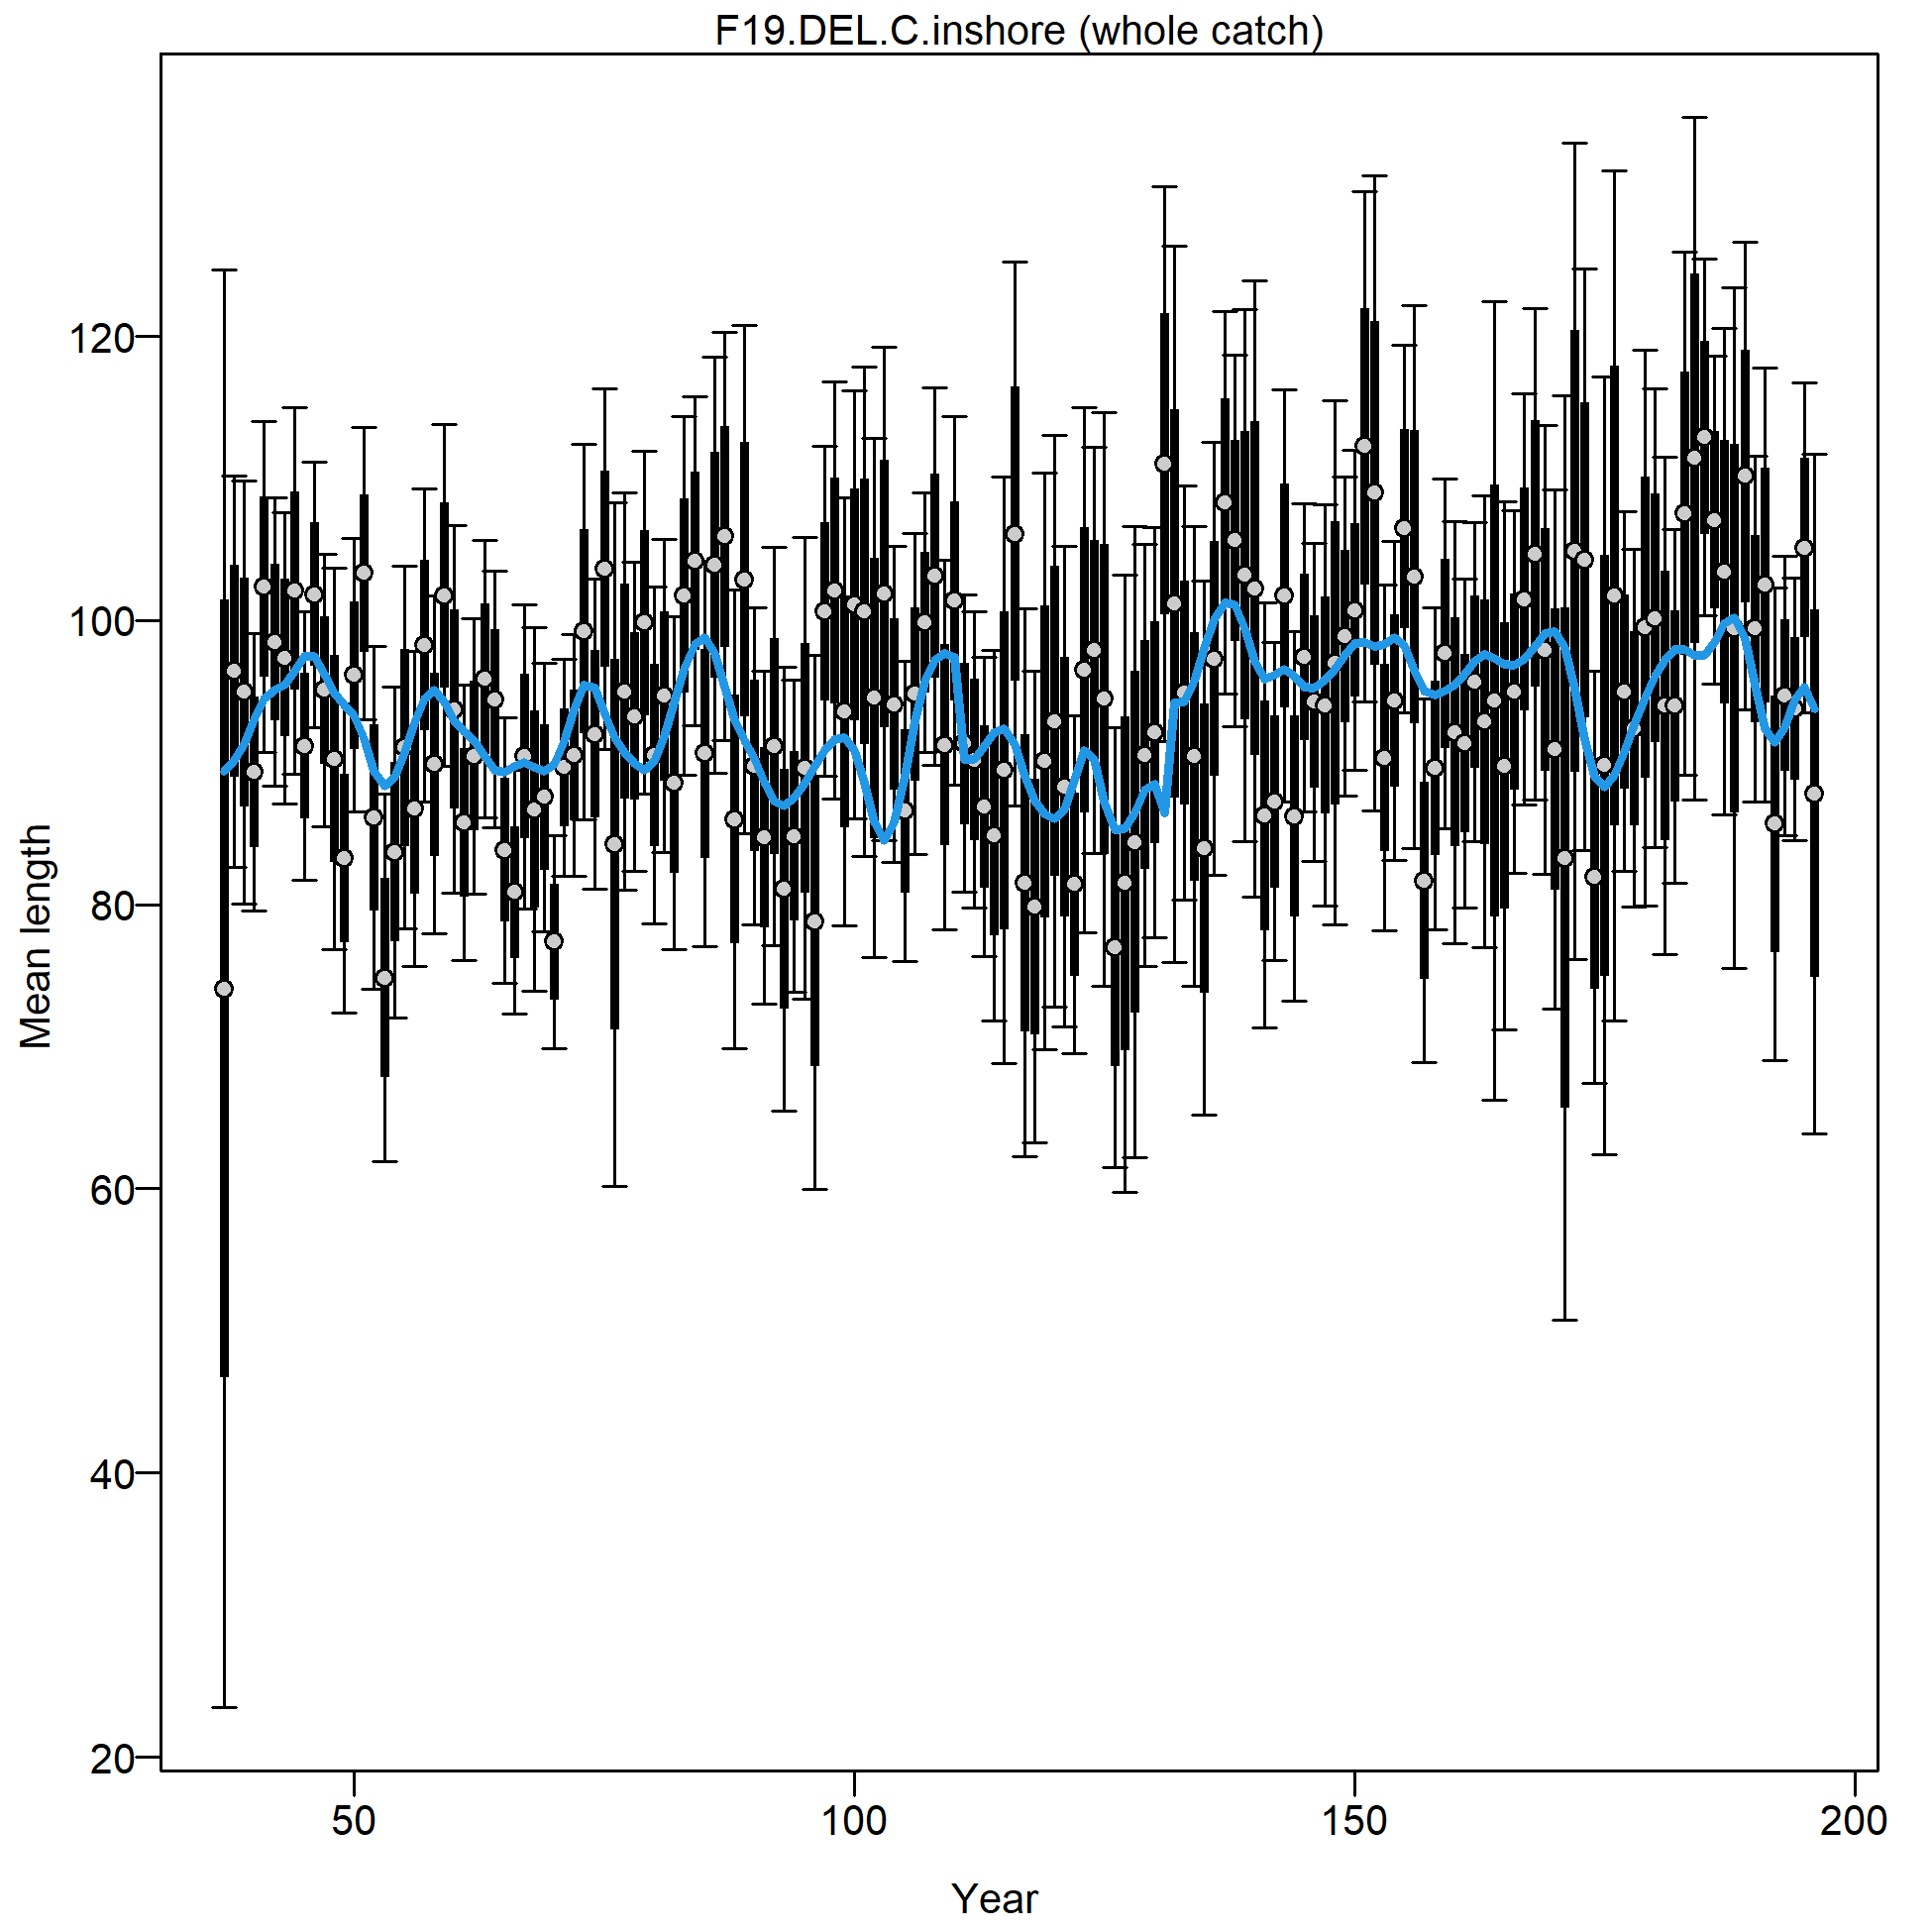
Mean length for F19.DEL.C.inshore with 95% confidence intervals based on current sample sizes.
Francis data weighting method TA1.8: thinner intervals (with capped ends) show result of further adjusting sample sizes based on suggested multiplier (with 95% interval) for len data from F19.DEL.C.inshore:
0.2934 (0.2403-0.3733)
For more info, see Francis (2011).
file: comp_lenfit_data_weighting_TA1.8_F19.DEL.C.inshore.png
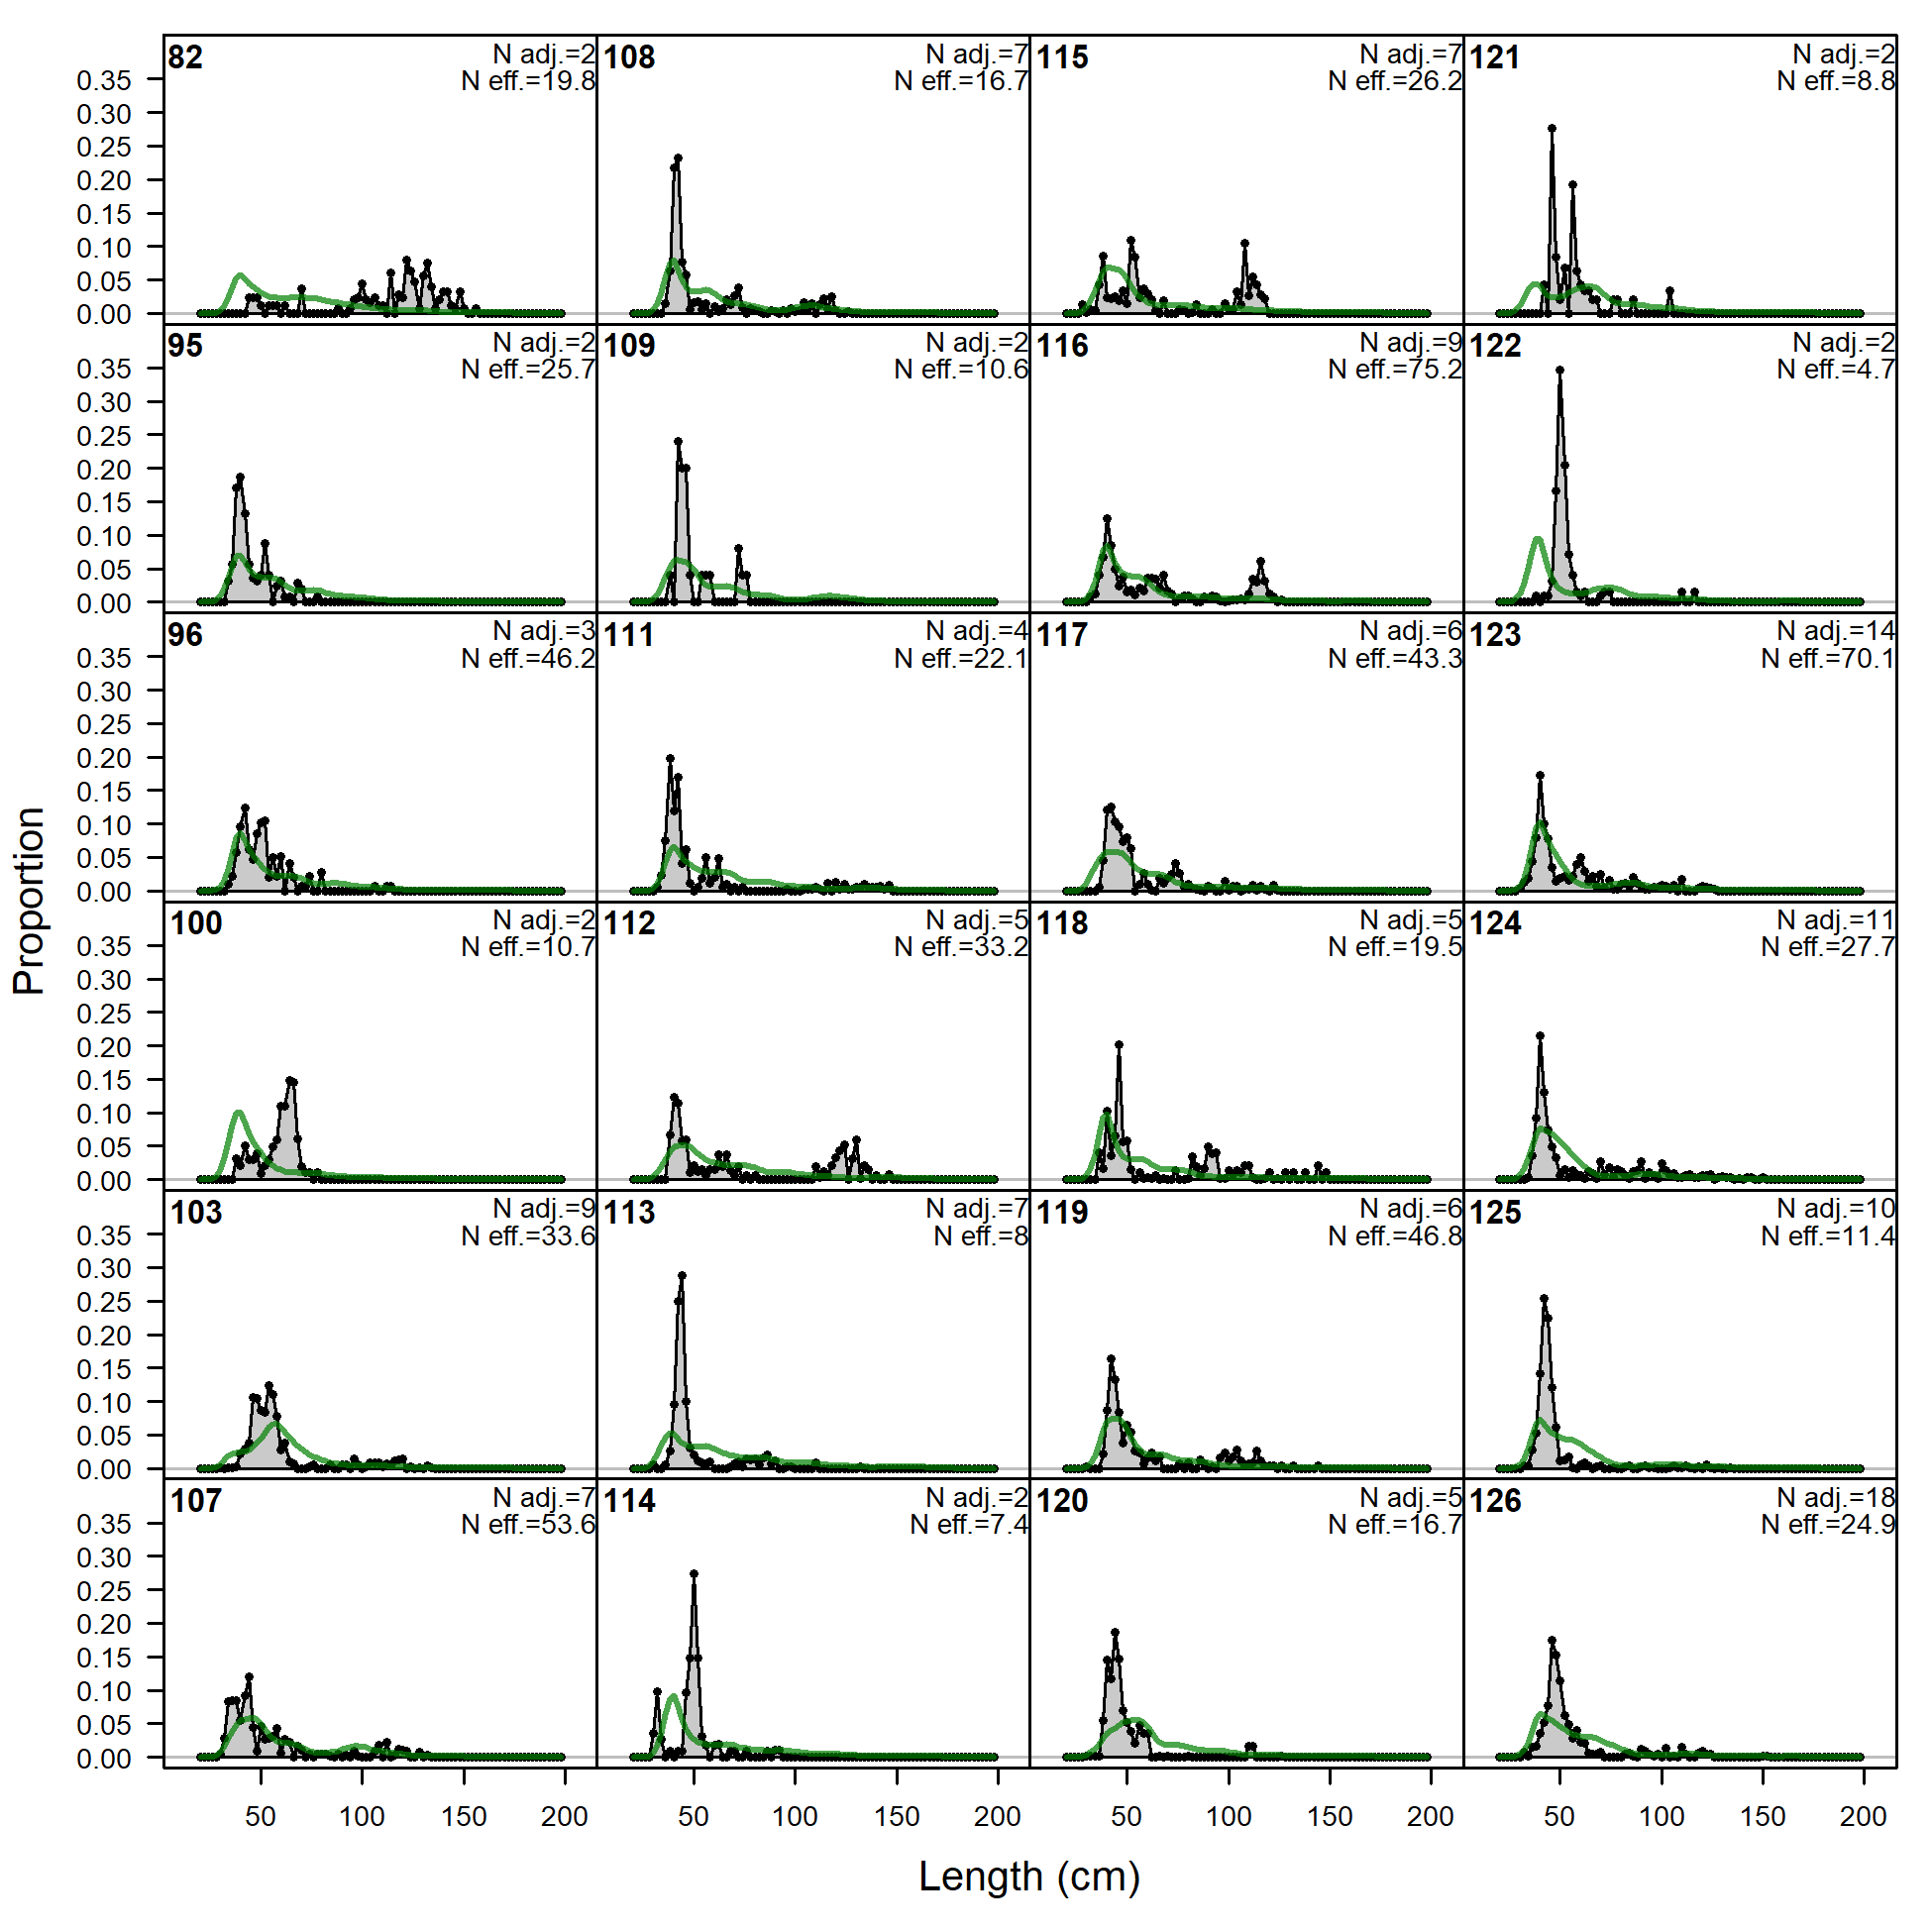
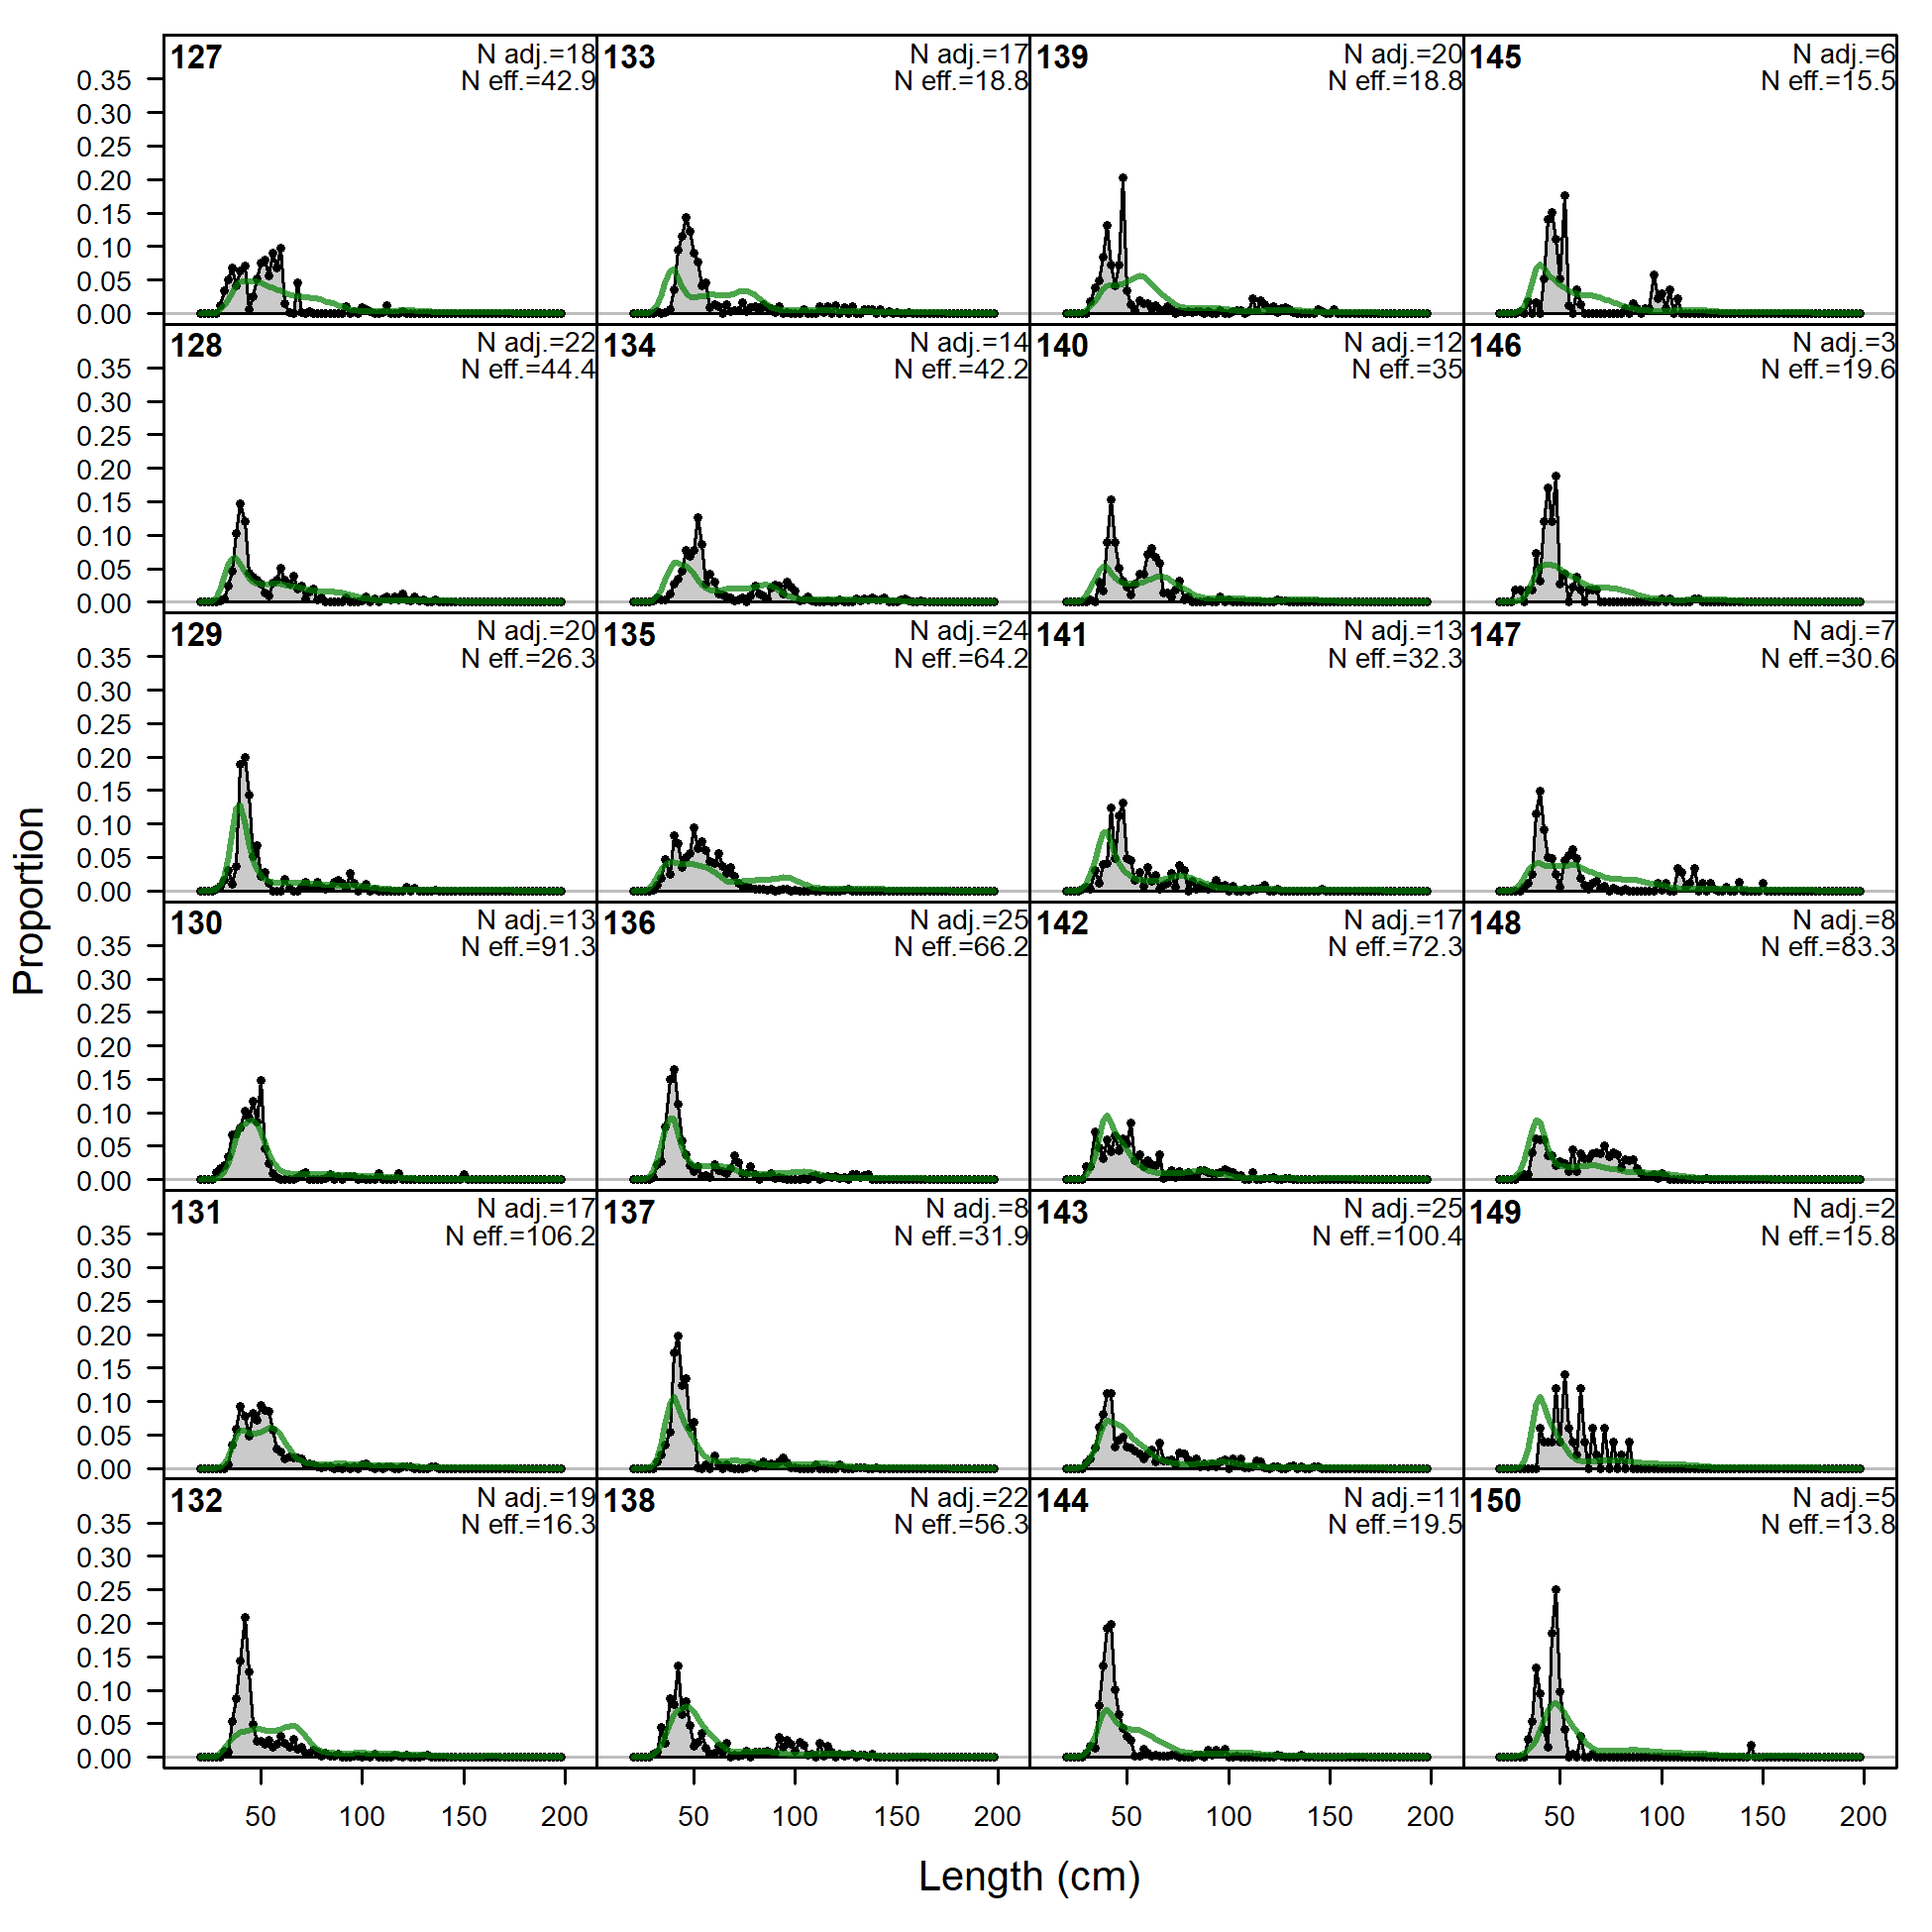
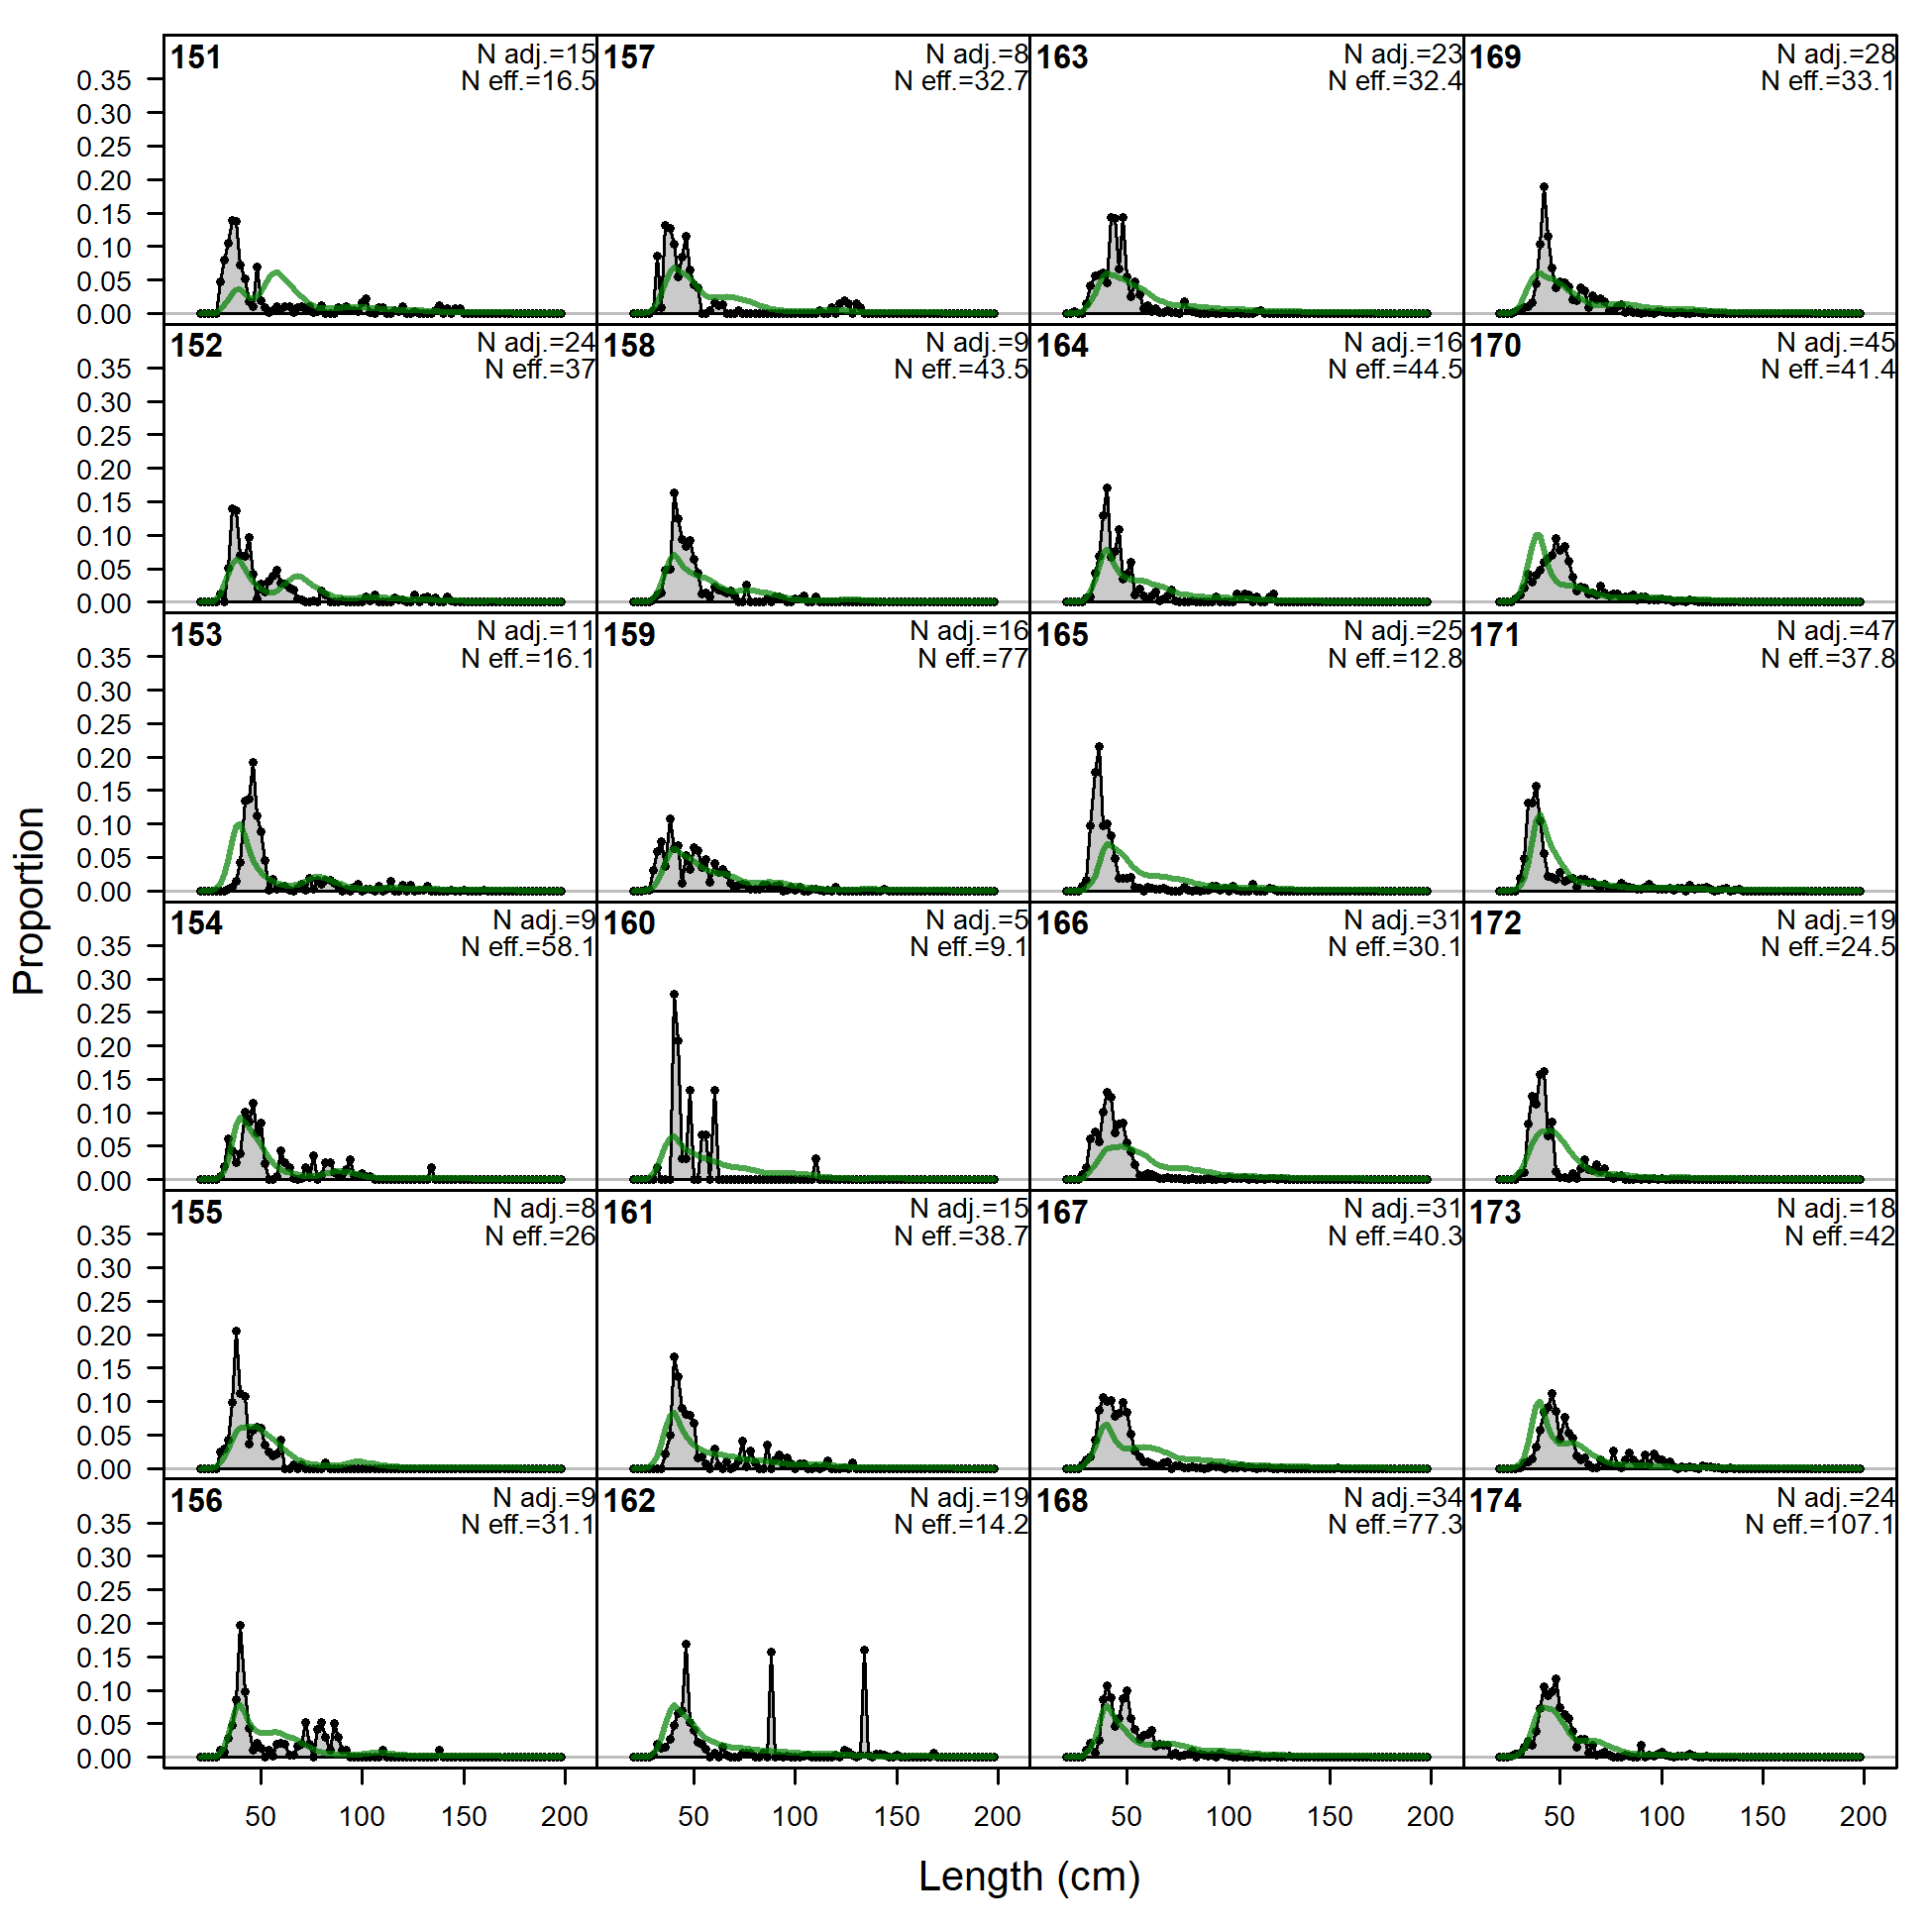
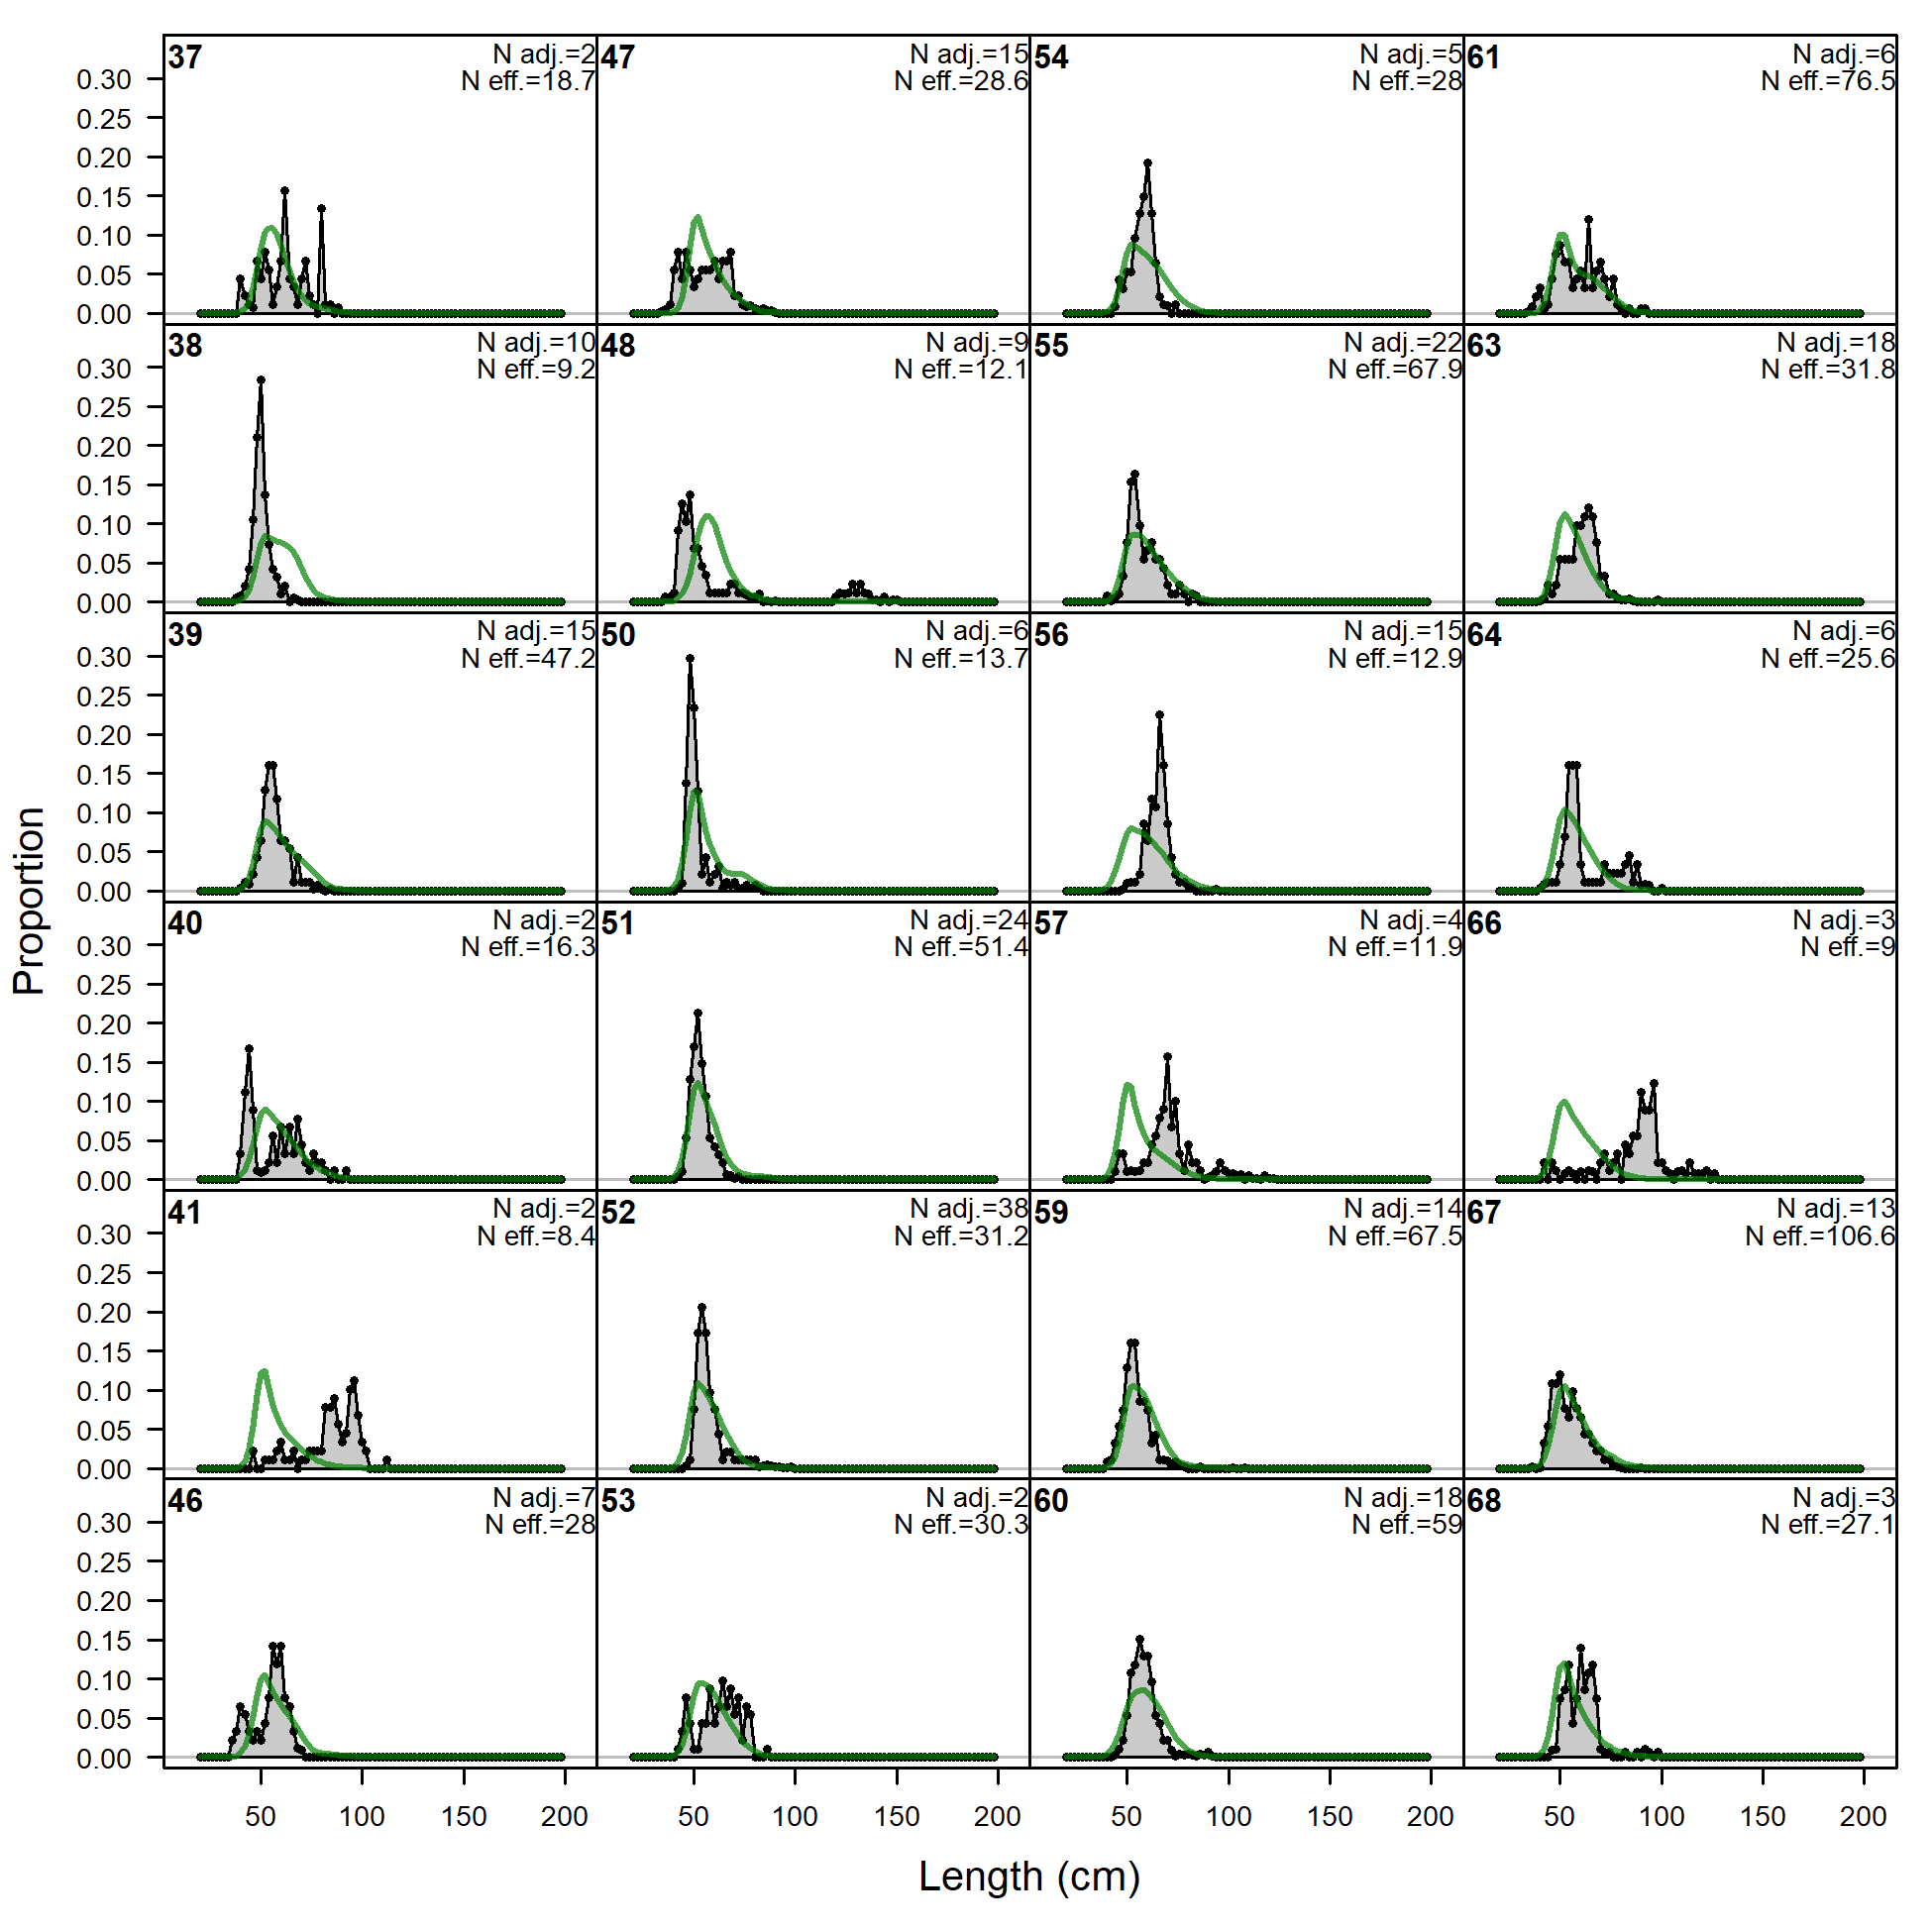
Length comps, whole catch, F20.DEL.N (plot 1 of 5).
'N adj.' is the input sample size after data-weighting adjustment. N eff. is the calculated effective sample size used in the McAllister-Ianelli tuning method.
file: comp_lenfit_flt20mkt0_page1.png
Length comps, whole catch, F20.DEL.N (plot 1 of 5).
'N adj.' is the input sample size after data-weighting adjustment. N eff. is the calculated effective sample size used in the McAllister-Ianelli tuning method. (plot 2 of 5)
file: comp_lenfit_flt20mkt0_page2.png
Length comps, whole catch, F20.DEL.N (plot 1 of 5).
'N adj.' is the input sample size after data-weighting adjustment. N eff. is the calculated effective sample size used in the McAllister-Ianelli tuning method. (plot 2 of 5) (plot 3 of 5)
file: comp_lenfit_flt20mkt0_page3.png
Length comps, whole catch, F20.DEL.N (plot 1 of 5).
'N adj.' is the input sample size after data-weighting adjustment. N eff. is the calculated effective sample size used in the McAllister-Ianelli tuning method. (plot 2 of 5) (plot 3 of 5) (plot 4 of 5)
file: comp_lenfit_flt20mkt0_page4.png
Length comps, whole catch, F20.DEL.N (plot 1 of 5).
'N adj.' is the input sample size after data-weighting adjustment. N eff. is the calculated effective sample size used in the McAllister-Ianelli tuning method. (plot 2 of 5) (plot 3 of 5) (plot 4 of 5) (plot 5 of 5)
file: comp_lenfit_flt20mkt0_page5.png
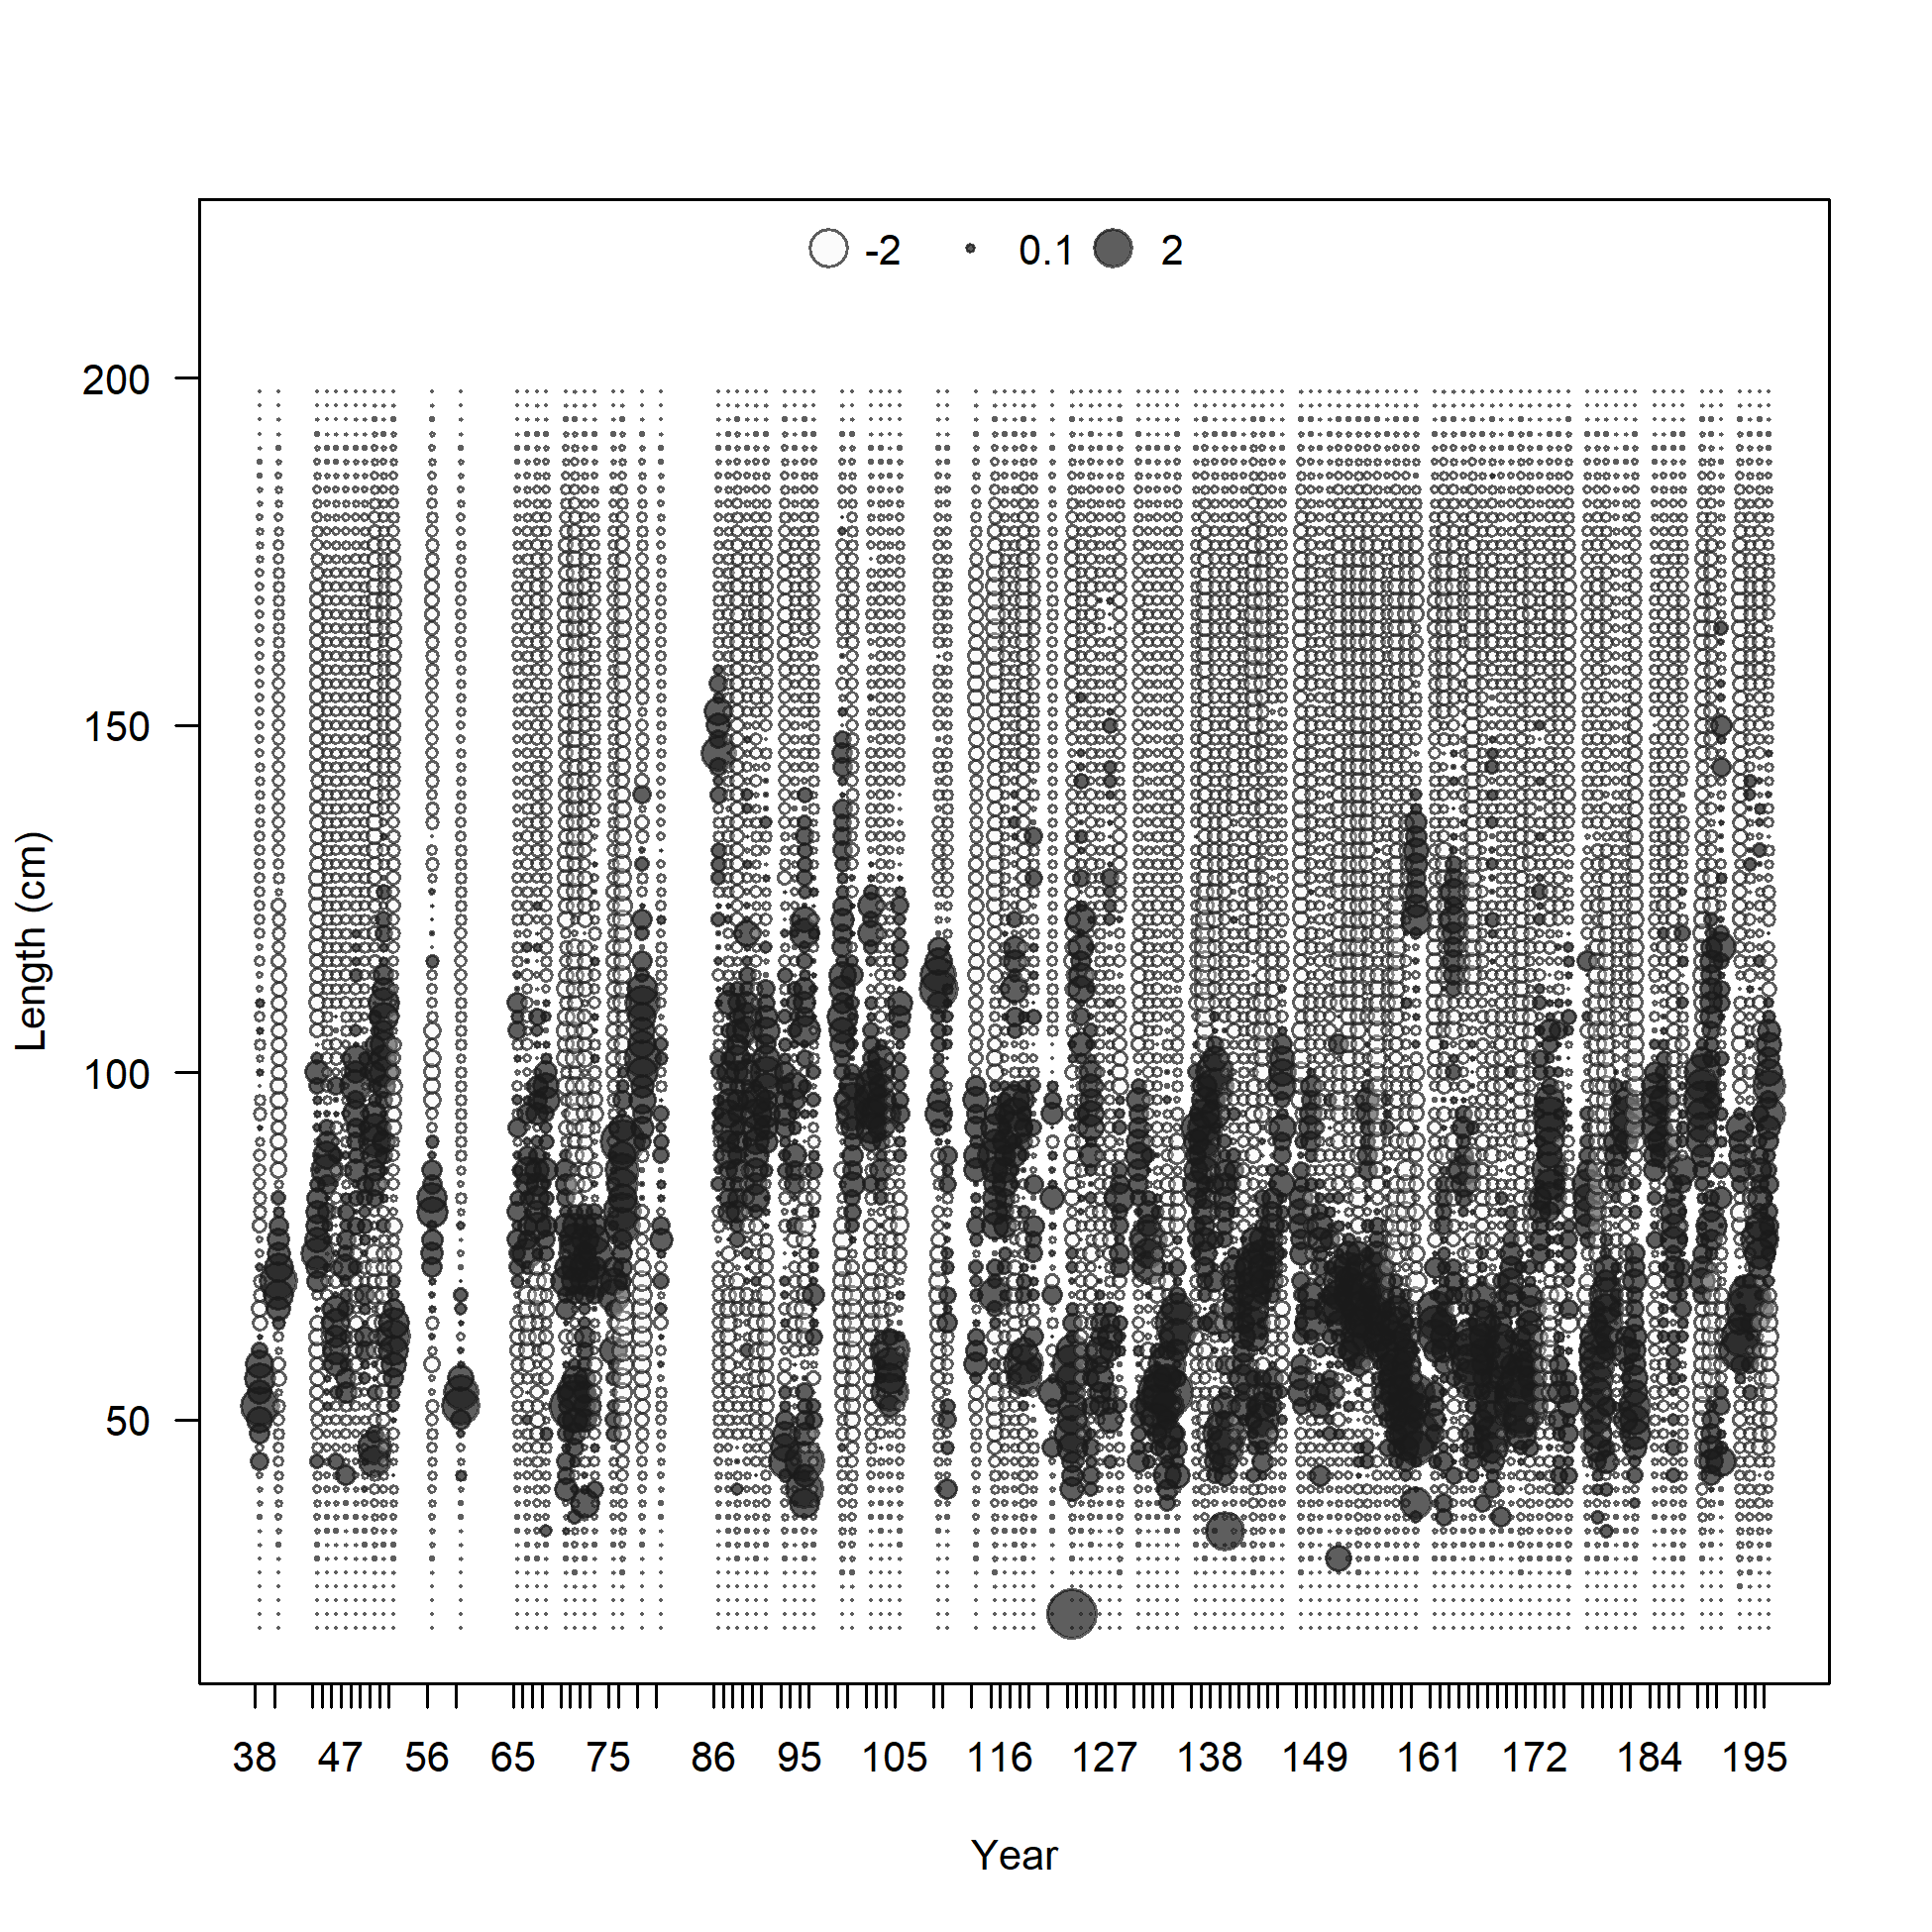
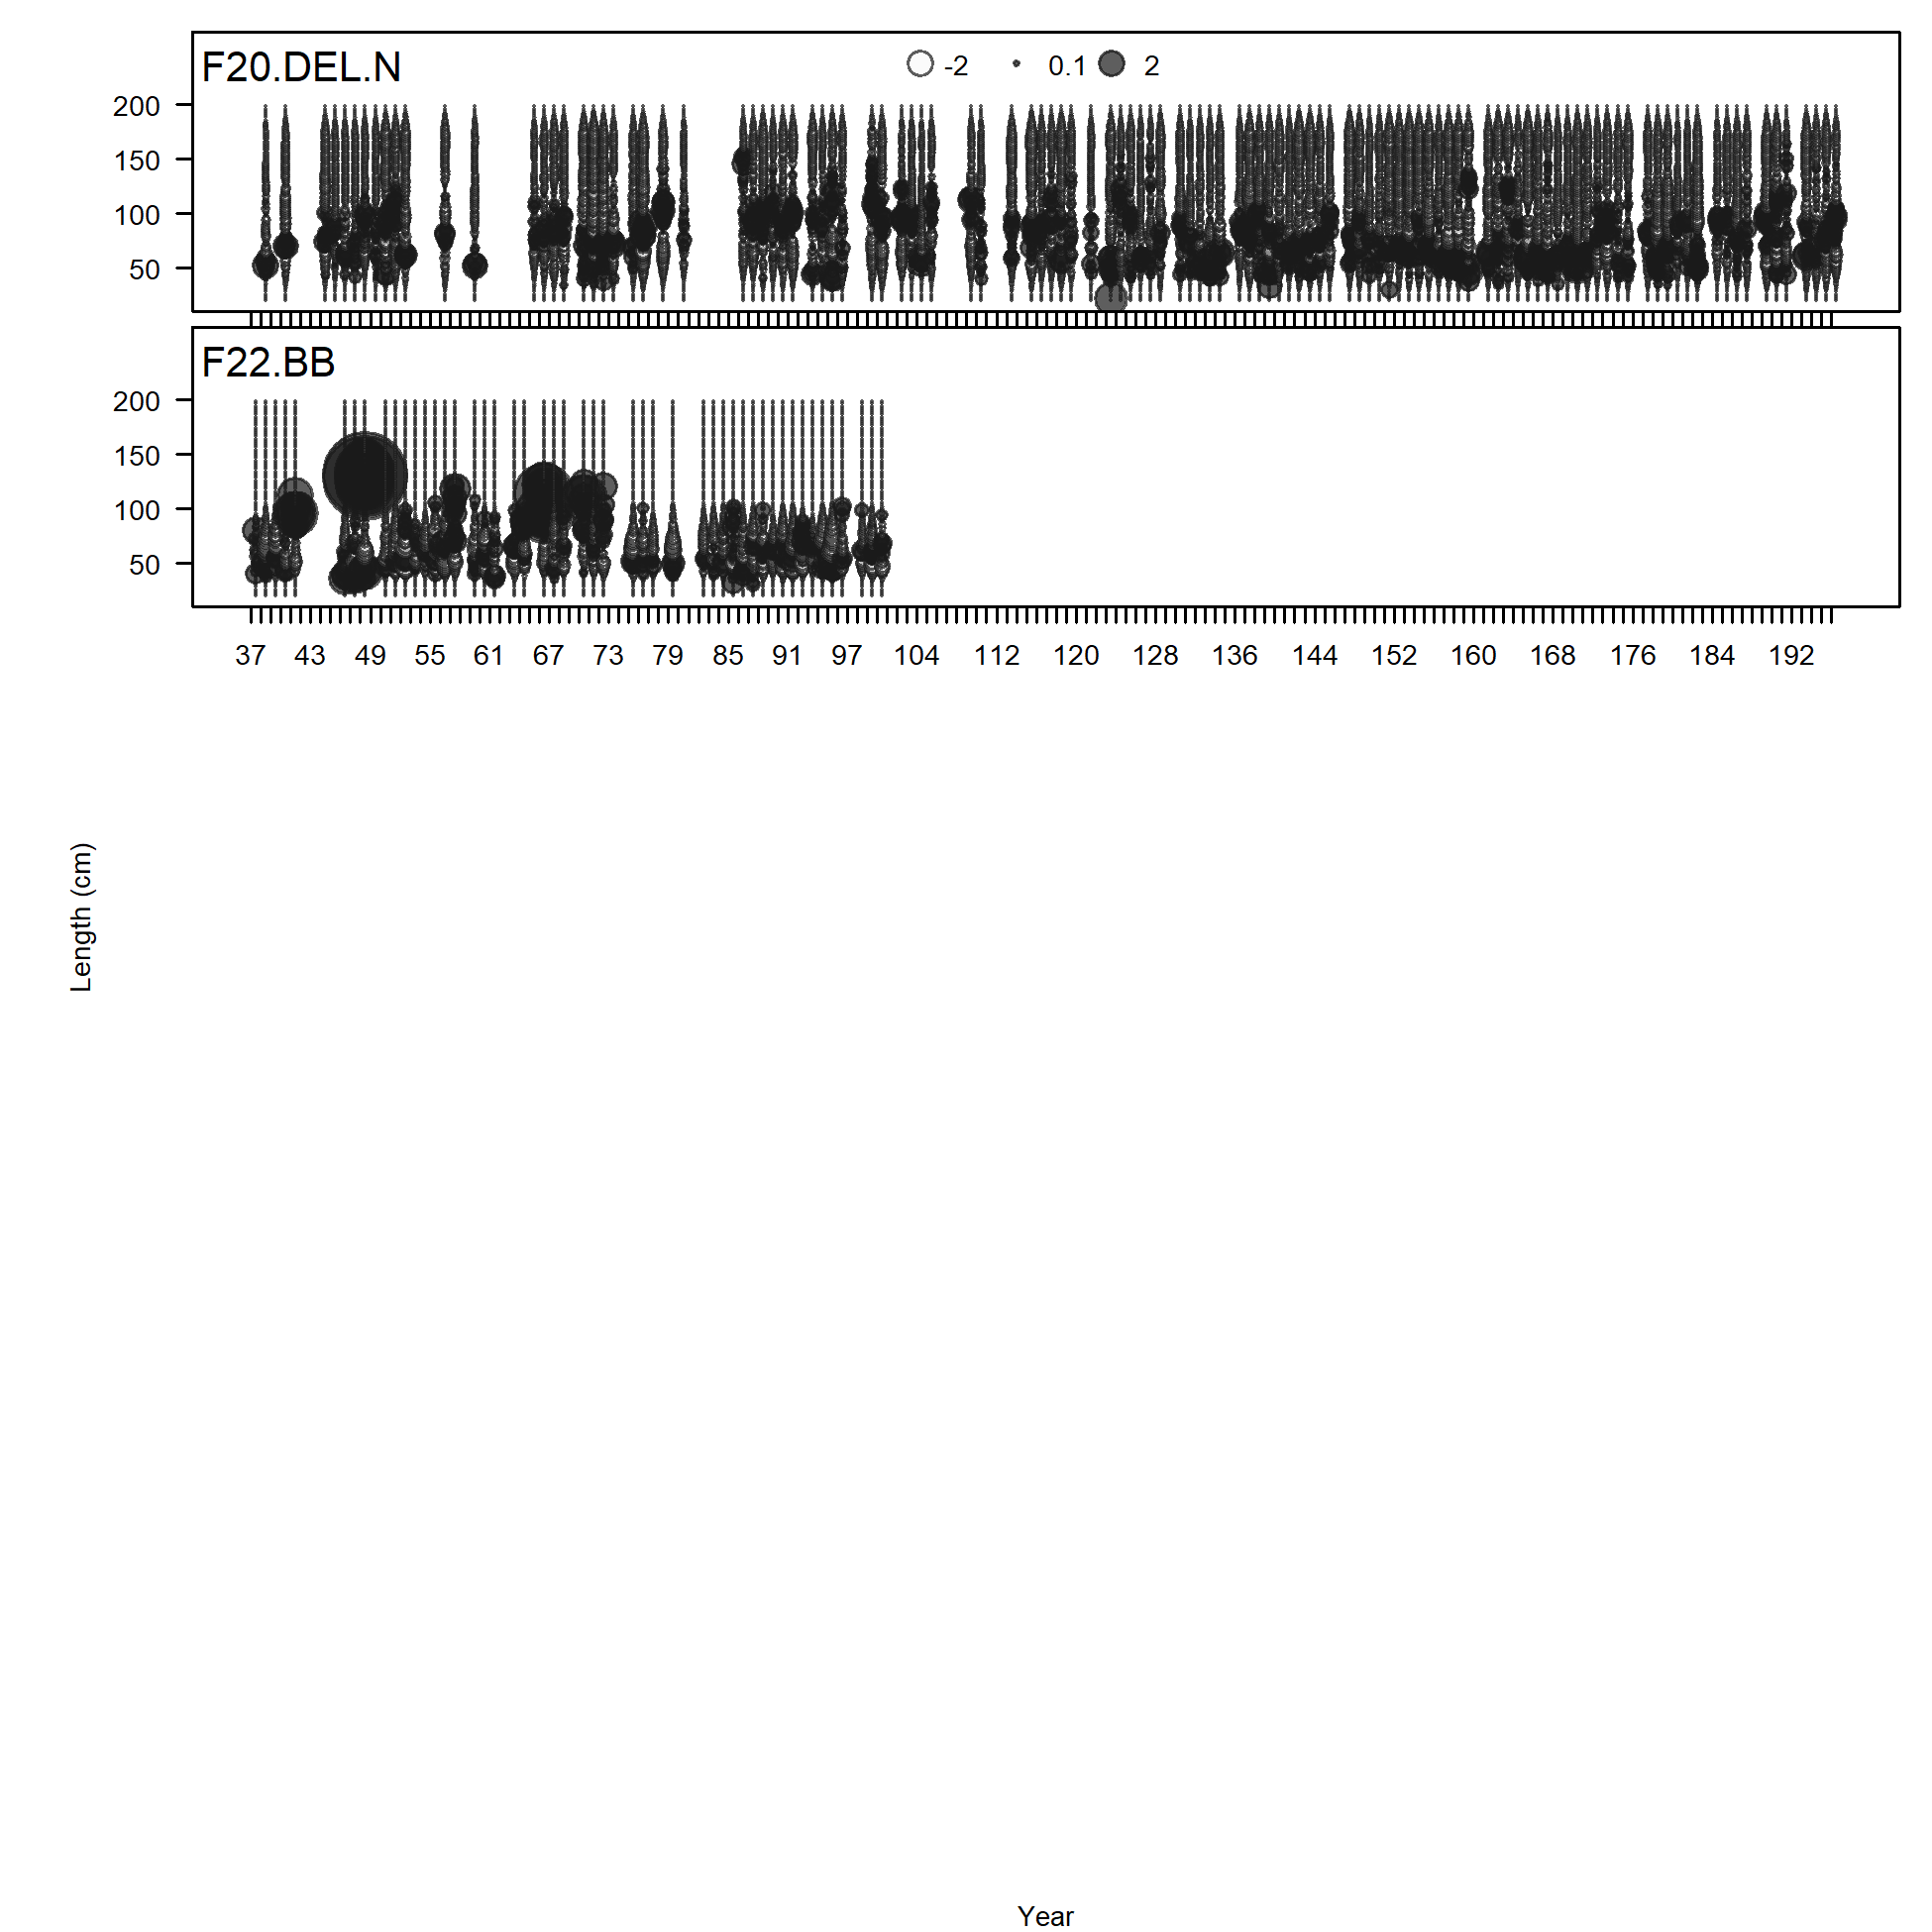
Pearson residuals, whole catch, F20.DEL.N (max=3.86) (plot 5 of 5)
Closed bubbles are positive residuals (observed > expected) and open bubbles are negative residuals (observed < expected).
file: comp_lenfit_residsflt20mkt0_page5.png
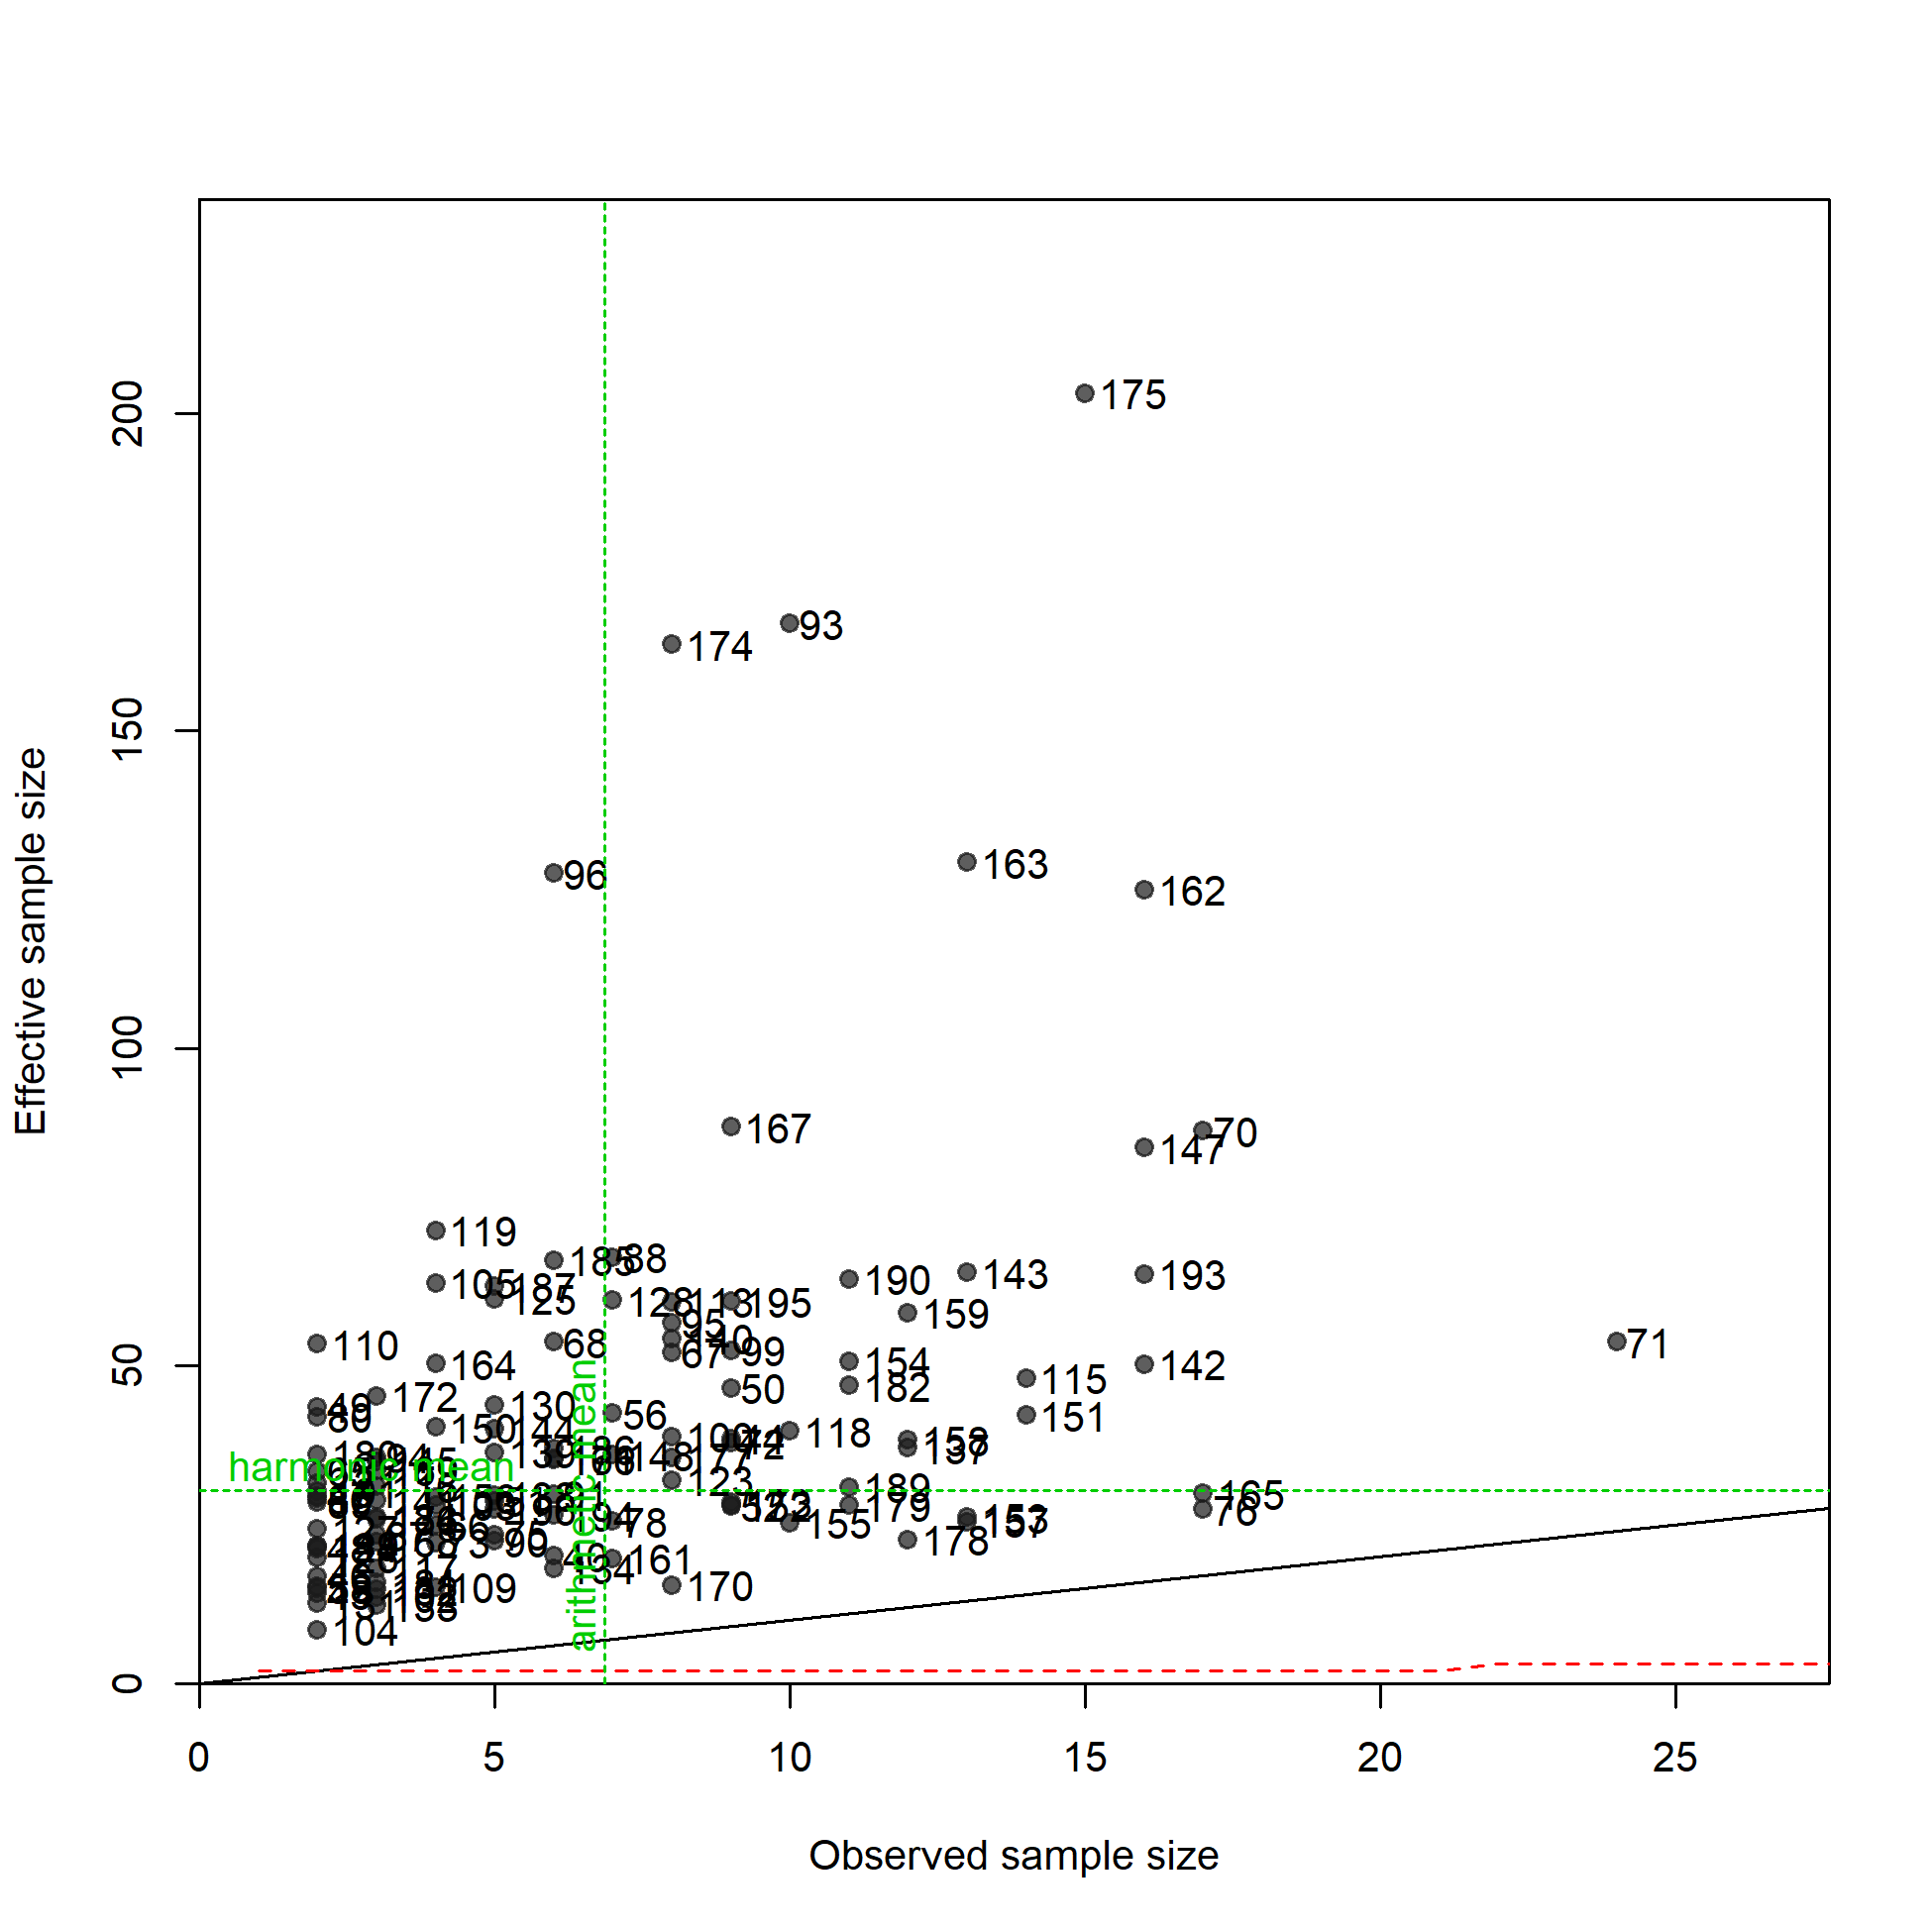
N-EffN comparison, Length comps, whole catch, F20.DEL.N
file: comp_lenfit_sampsize_flt20mkt0.png
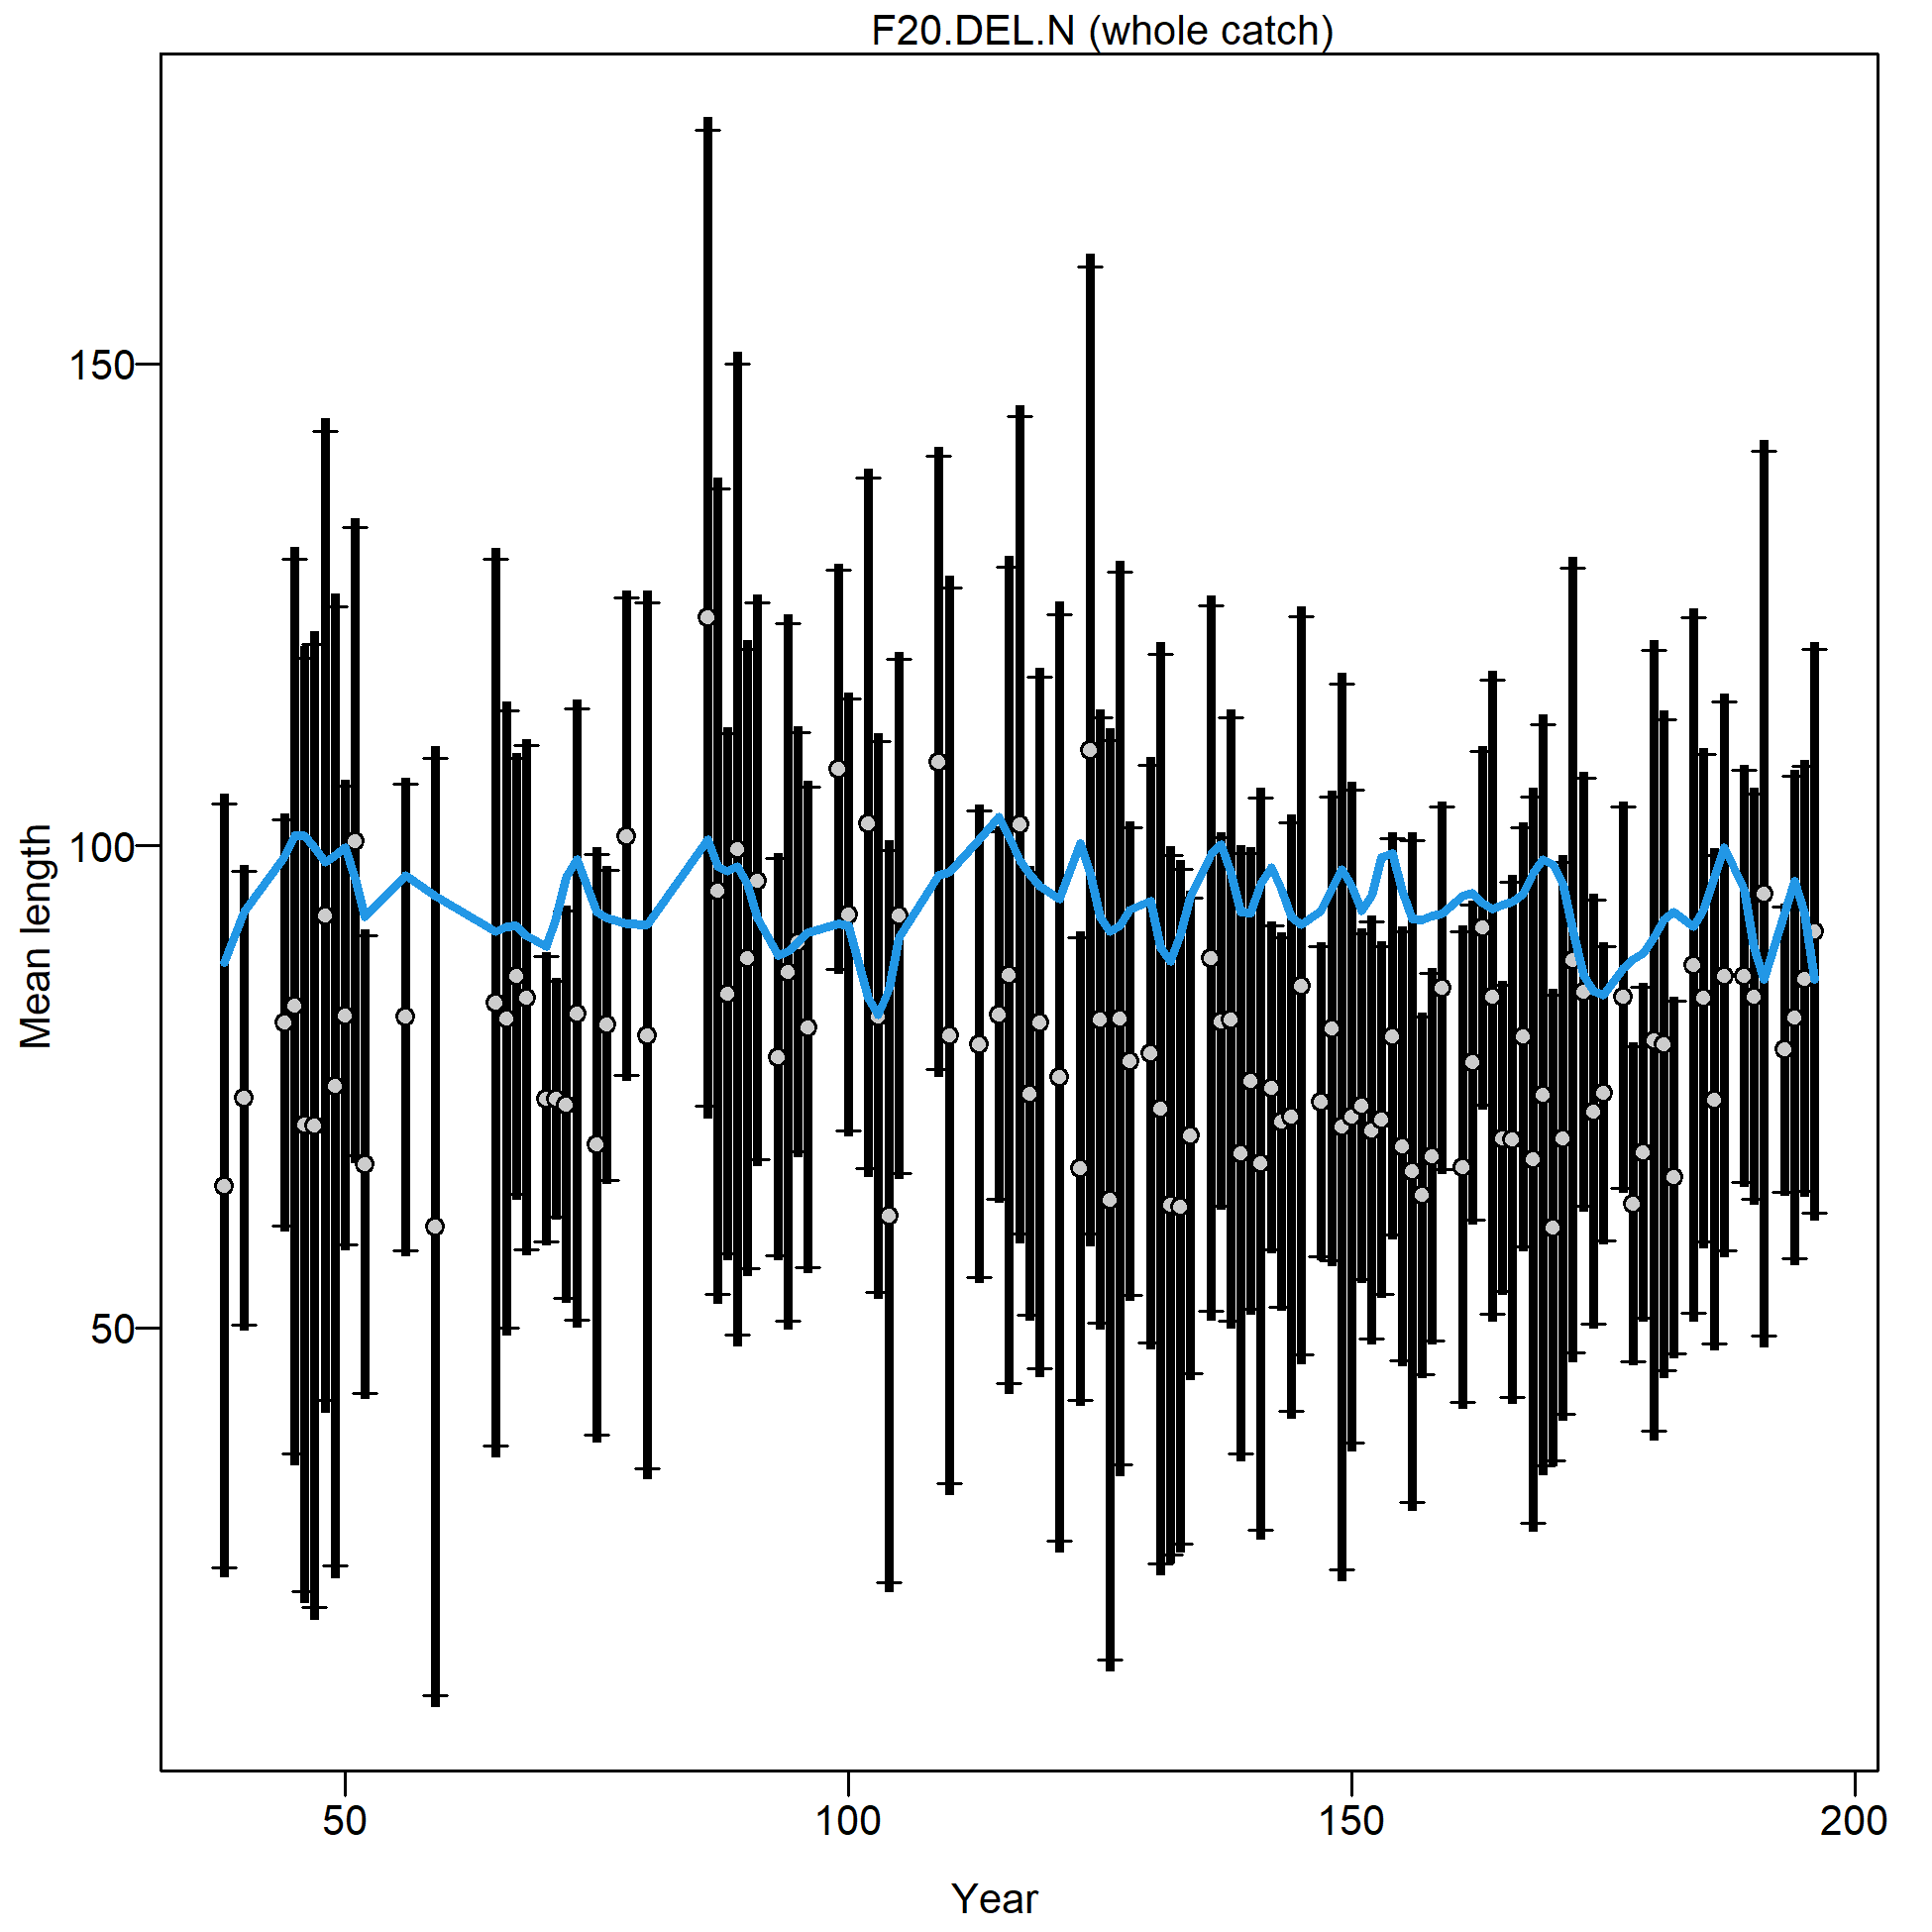
Mean length for F20.DEL.N with 95% confidence intervals based on current sample sizes.
Francis data weighting method TA1.8: thinner intervals (with capped ends) show result of further adjusting sample sizes based on suggested multiplier (with 95% interval) for len data from F20.DEL.N:
1.0528 (0.8566-1.3811)
For more info, see Francis (2011).
file: comp_lenfit_data_weighting_TA1.8_F20.DEL.N.png
Length comps, whole catch, F22.BB (plot 1 of 3).
'N adj.' is the input sample size after data-weighting adjustment. N eff. is the calculated effective sample size used in the McAllister-Ianelli tuning method.
file: comp_lenfit_flt22mkt0_page1.png
Length comps, whole catch, F22.BB (plot 1 of 3).
'N adj.' is the input sample size after data-weighting adjustment. N eff. is the calculated effective sample size used in the McAllister-Ianelli tuning method. (plot 2 of 3)
file: comp_lenfit_flt22mkt0_page2.png
Length comps, whole catch, F22.BB (plot 1 of 3).
'N adj.' is the input sample size after data-weighting adjustment. N eff. is the calculated effective sample size used in the McAllister-Ianelli tuning method. (plot 2 of 3) (plot 3 of 3)
file: comp_lenfit_flt22mkt0_page3.png
Pearson residuals, whole catch, F22.BB (max=21.67) (plot 3 of 3)
Closed bubbles are positive residuals (observed > expected) and open bubbles are negative residuals (observed < expected).
file: comp_lenfit_residsflt22mkt0_page3.png
N-EffN comparison, Length comps, whole catch, F22.BB
file: comp_lenfit_sampsize_flt22mkt0.png
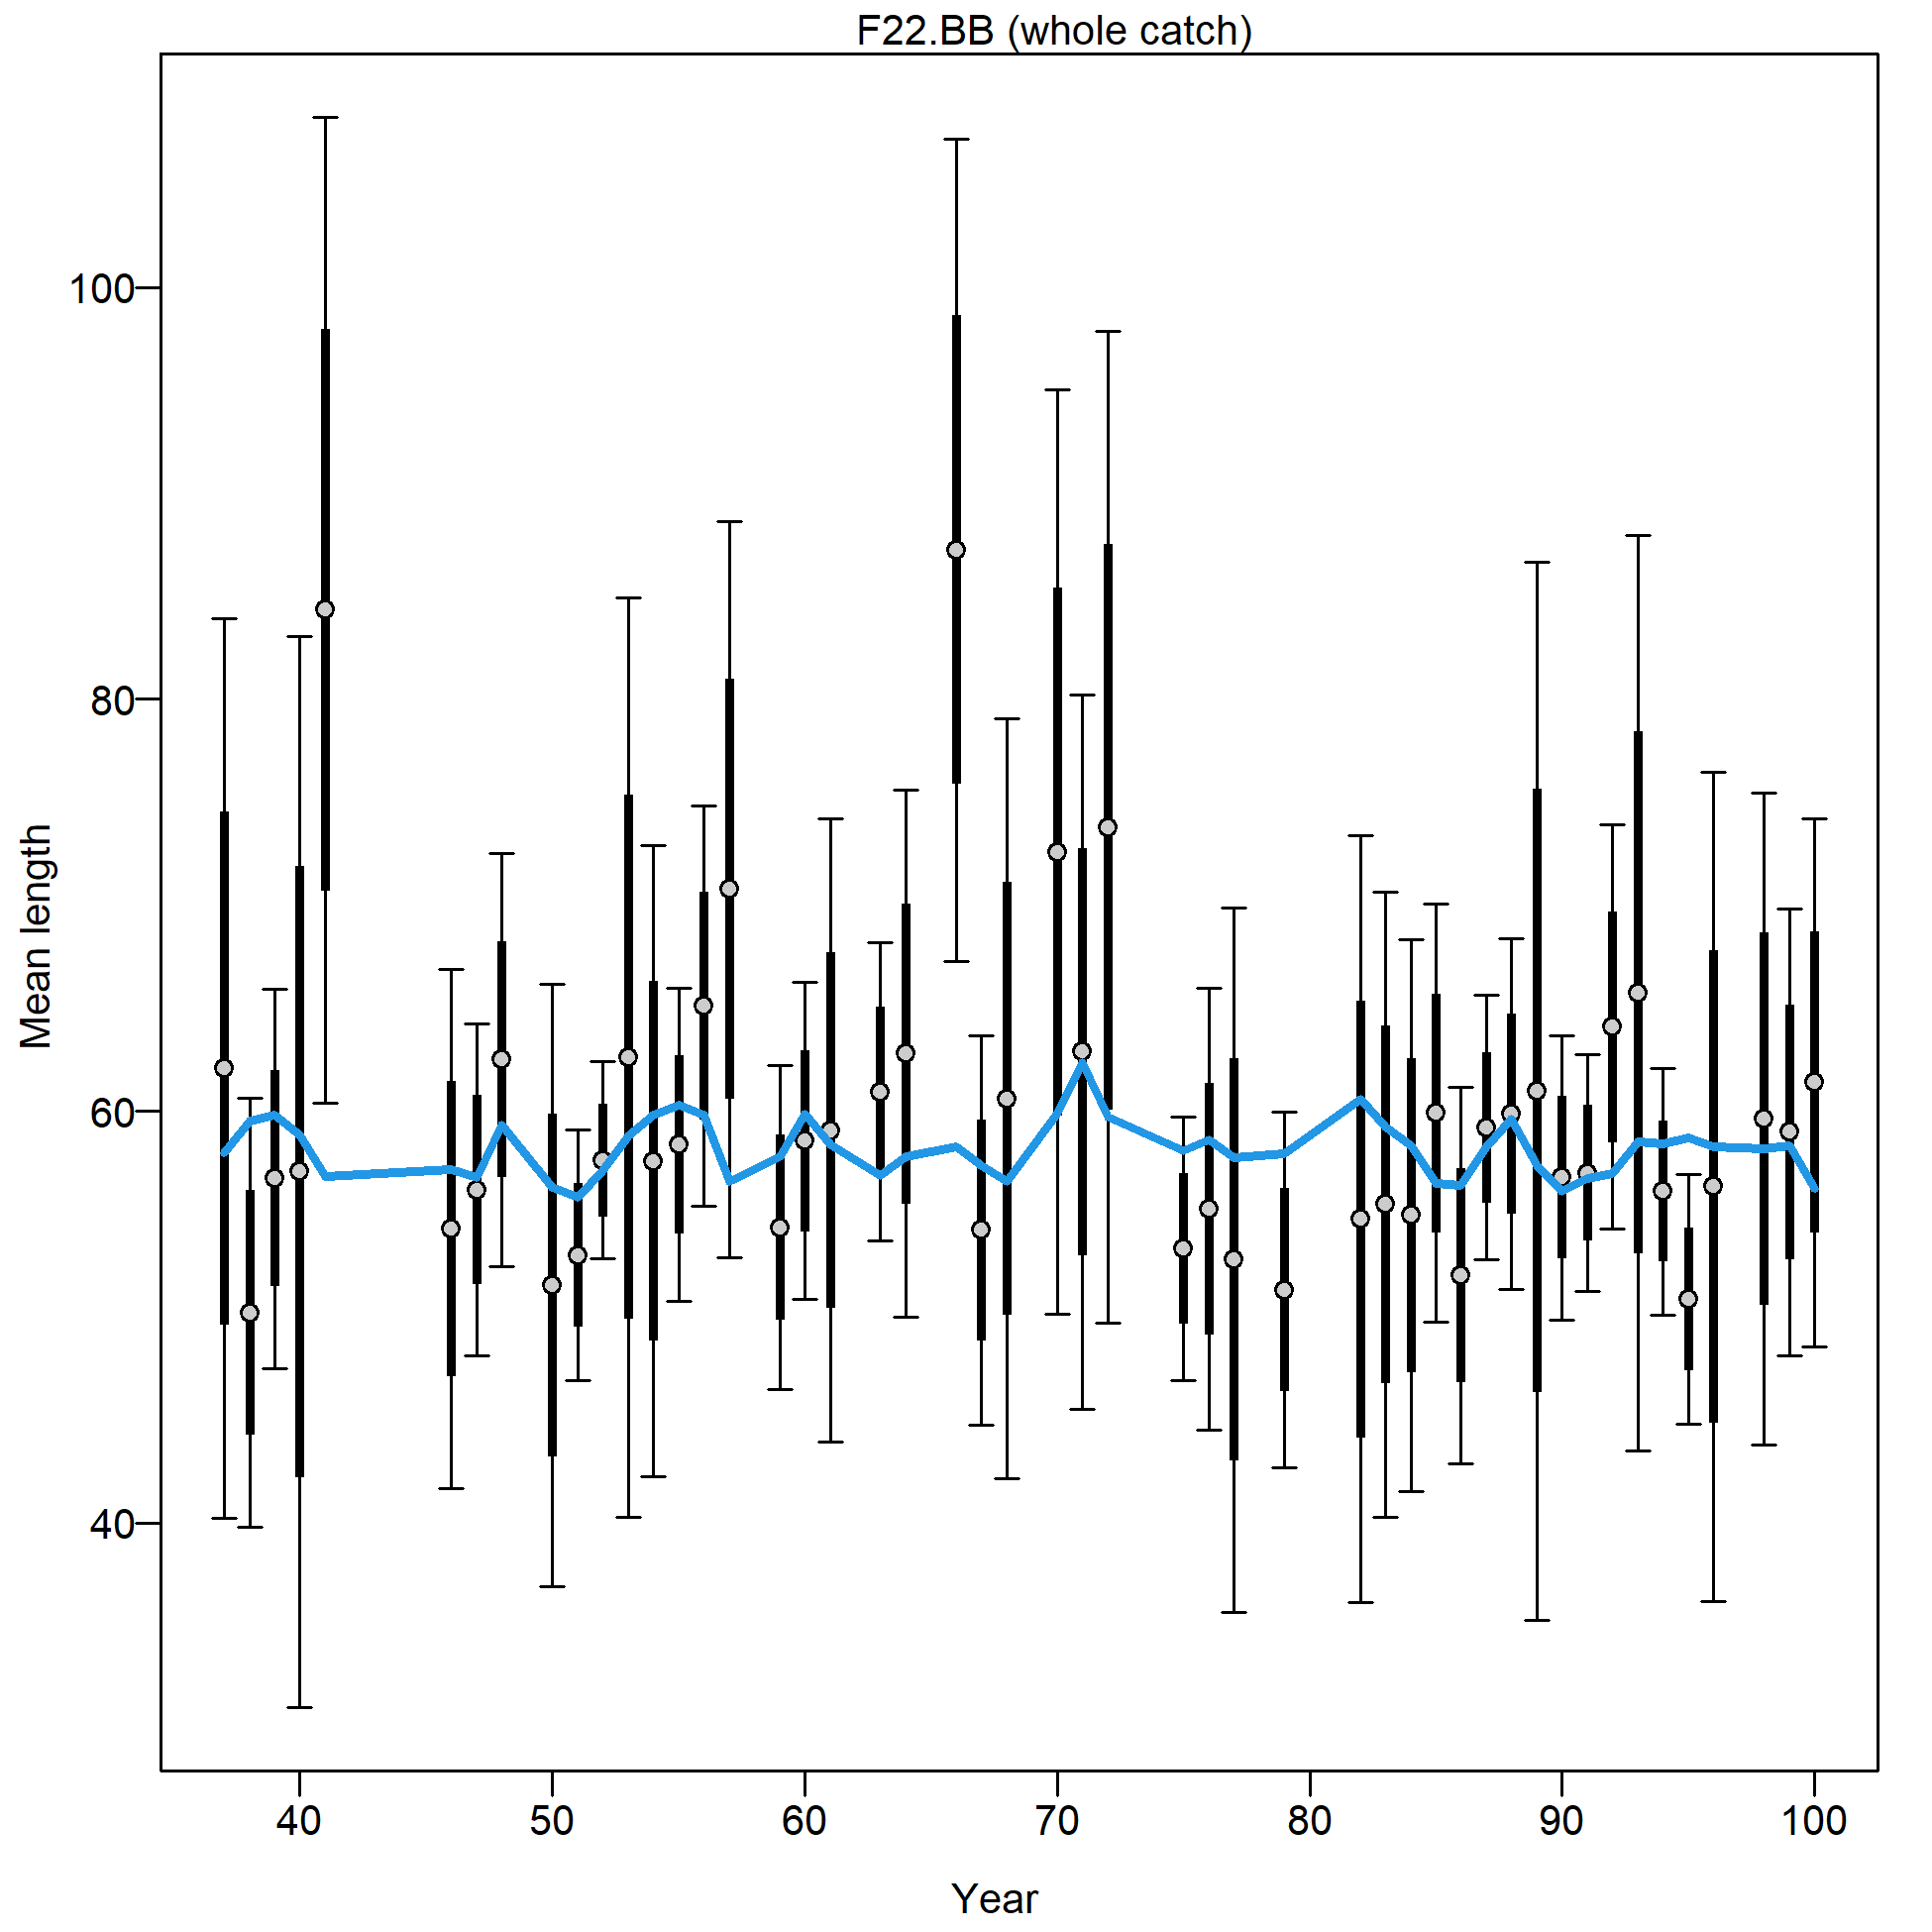
Mean length for F22.BB with 95% confidence intervals based on current sample sizes.
Francis data weighting method TA1.8: thinner intervals (with capped ends) show result of further adjusting sample sizes based on suggested multiplier (with 95% interval) for len data from F22.BB:
0.3251 (0.2182-0.5581)
For more info, see Francis (2011).
file: comp_lenfit_data_weighting_TA1.8_F22.BB.png