
Beginning of year expected numbers at age of females in (max ~ 8.6 million)
file: numbers1_sex1_beg.png
Beginning of year expected numbers at age of females in (max ~ 8.6 million)
file: numbers1_sex1_beg.png
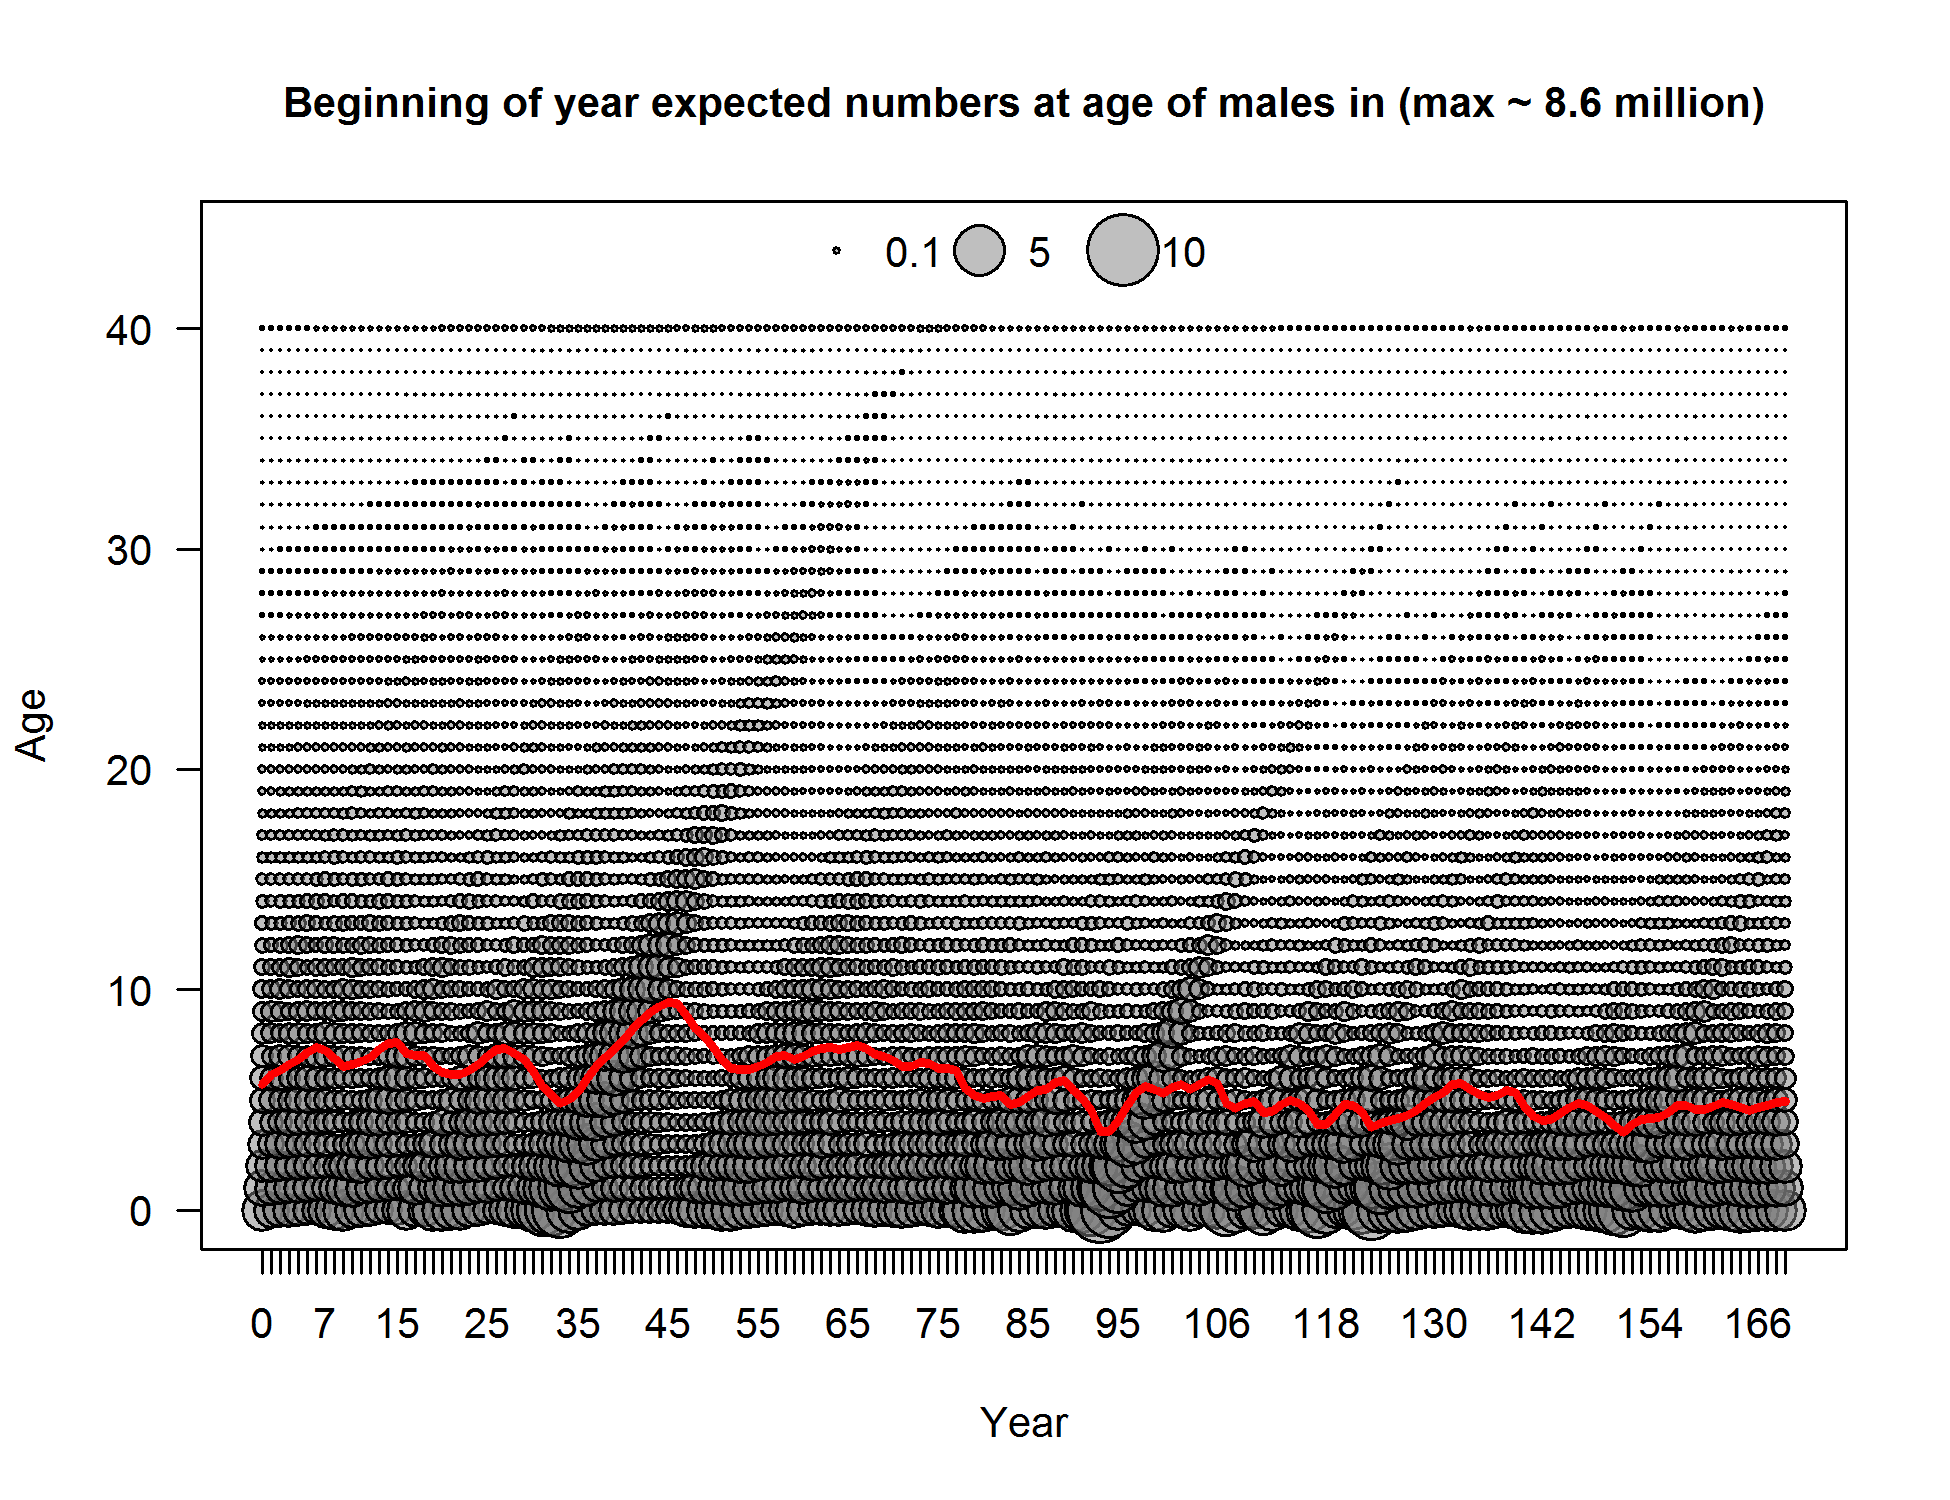
Beginning of year expected numbers at age of males in (max ~ 8.6 million)
file: numbers1_sex2_beg.png
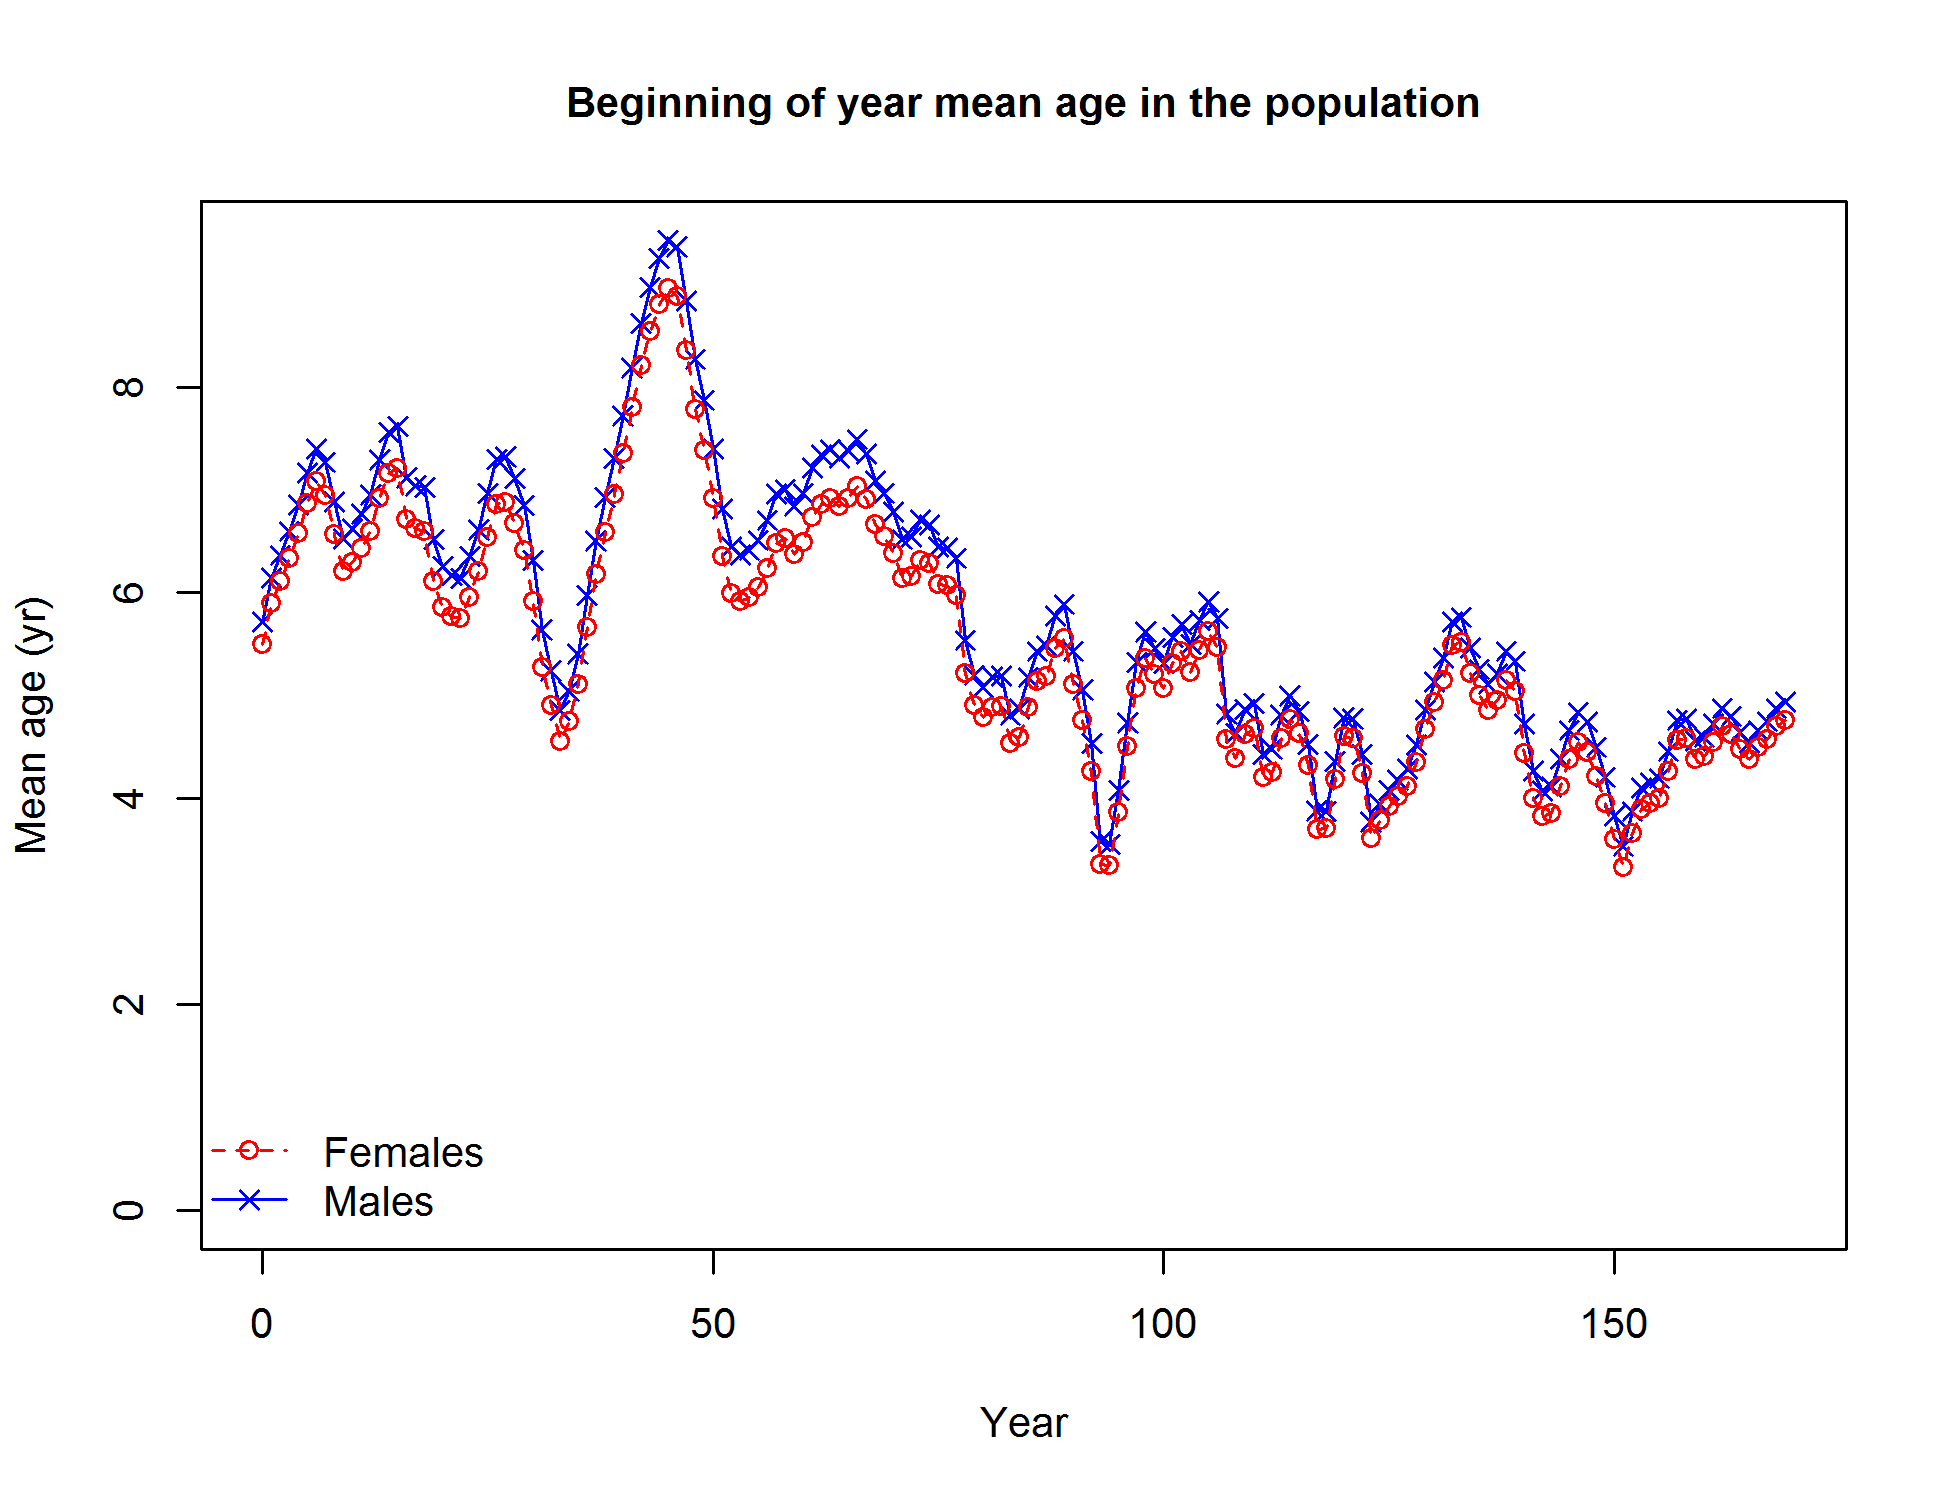
Beginning of year mean age in the population
file: numbers2_meanage_beg.png
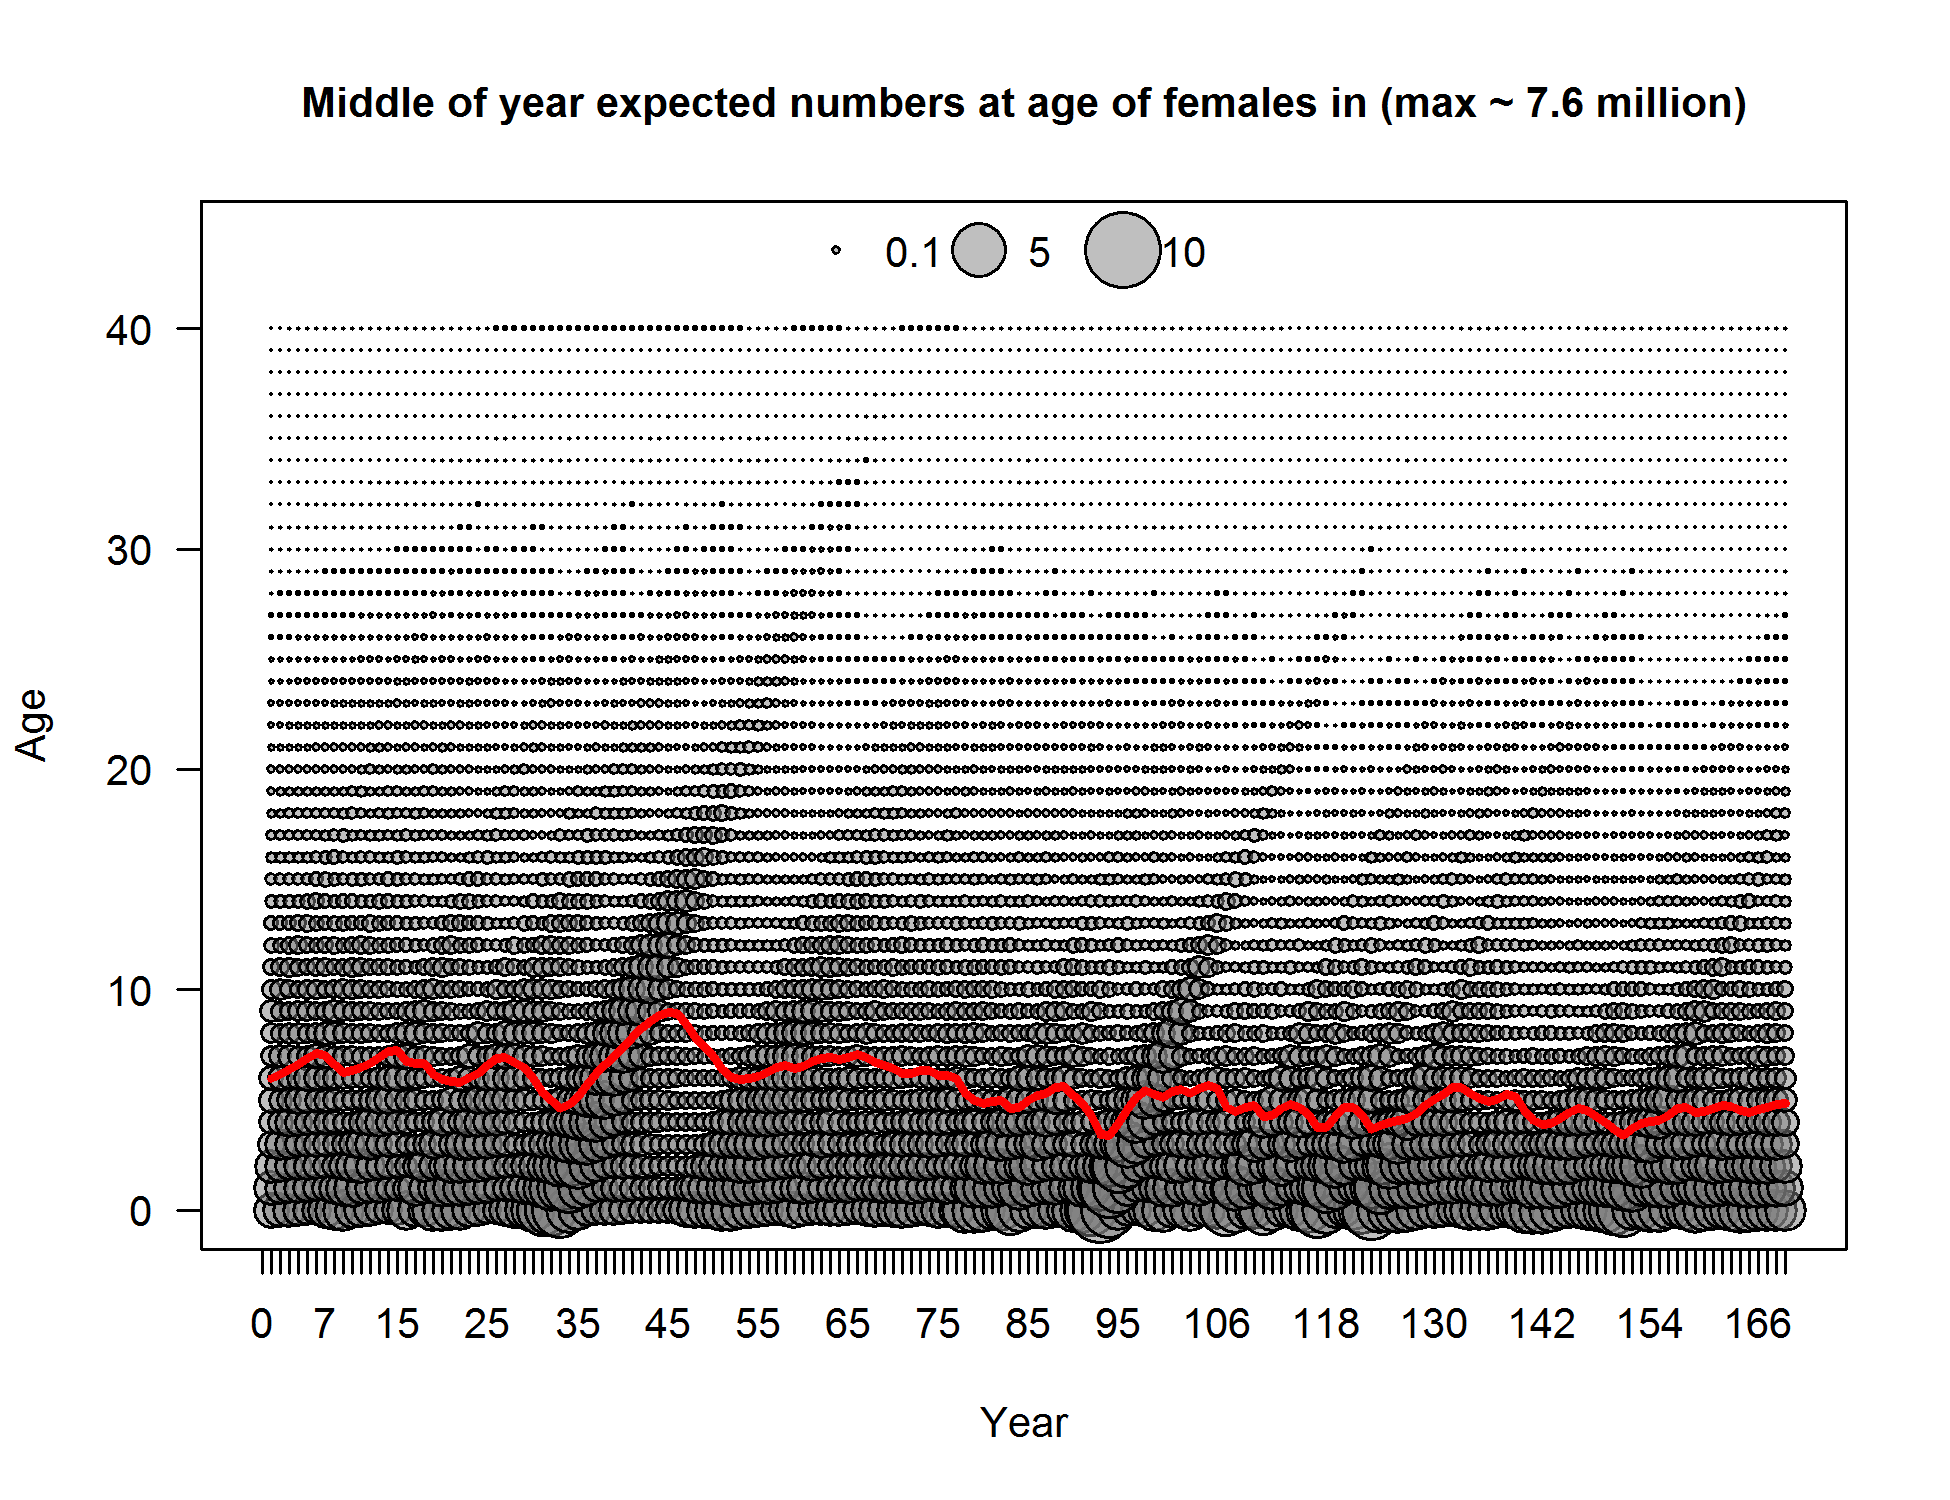
Middle of year expected numbers at age of females in (max ~ 7.6 million)
file: numbers1_sex1_mid.png
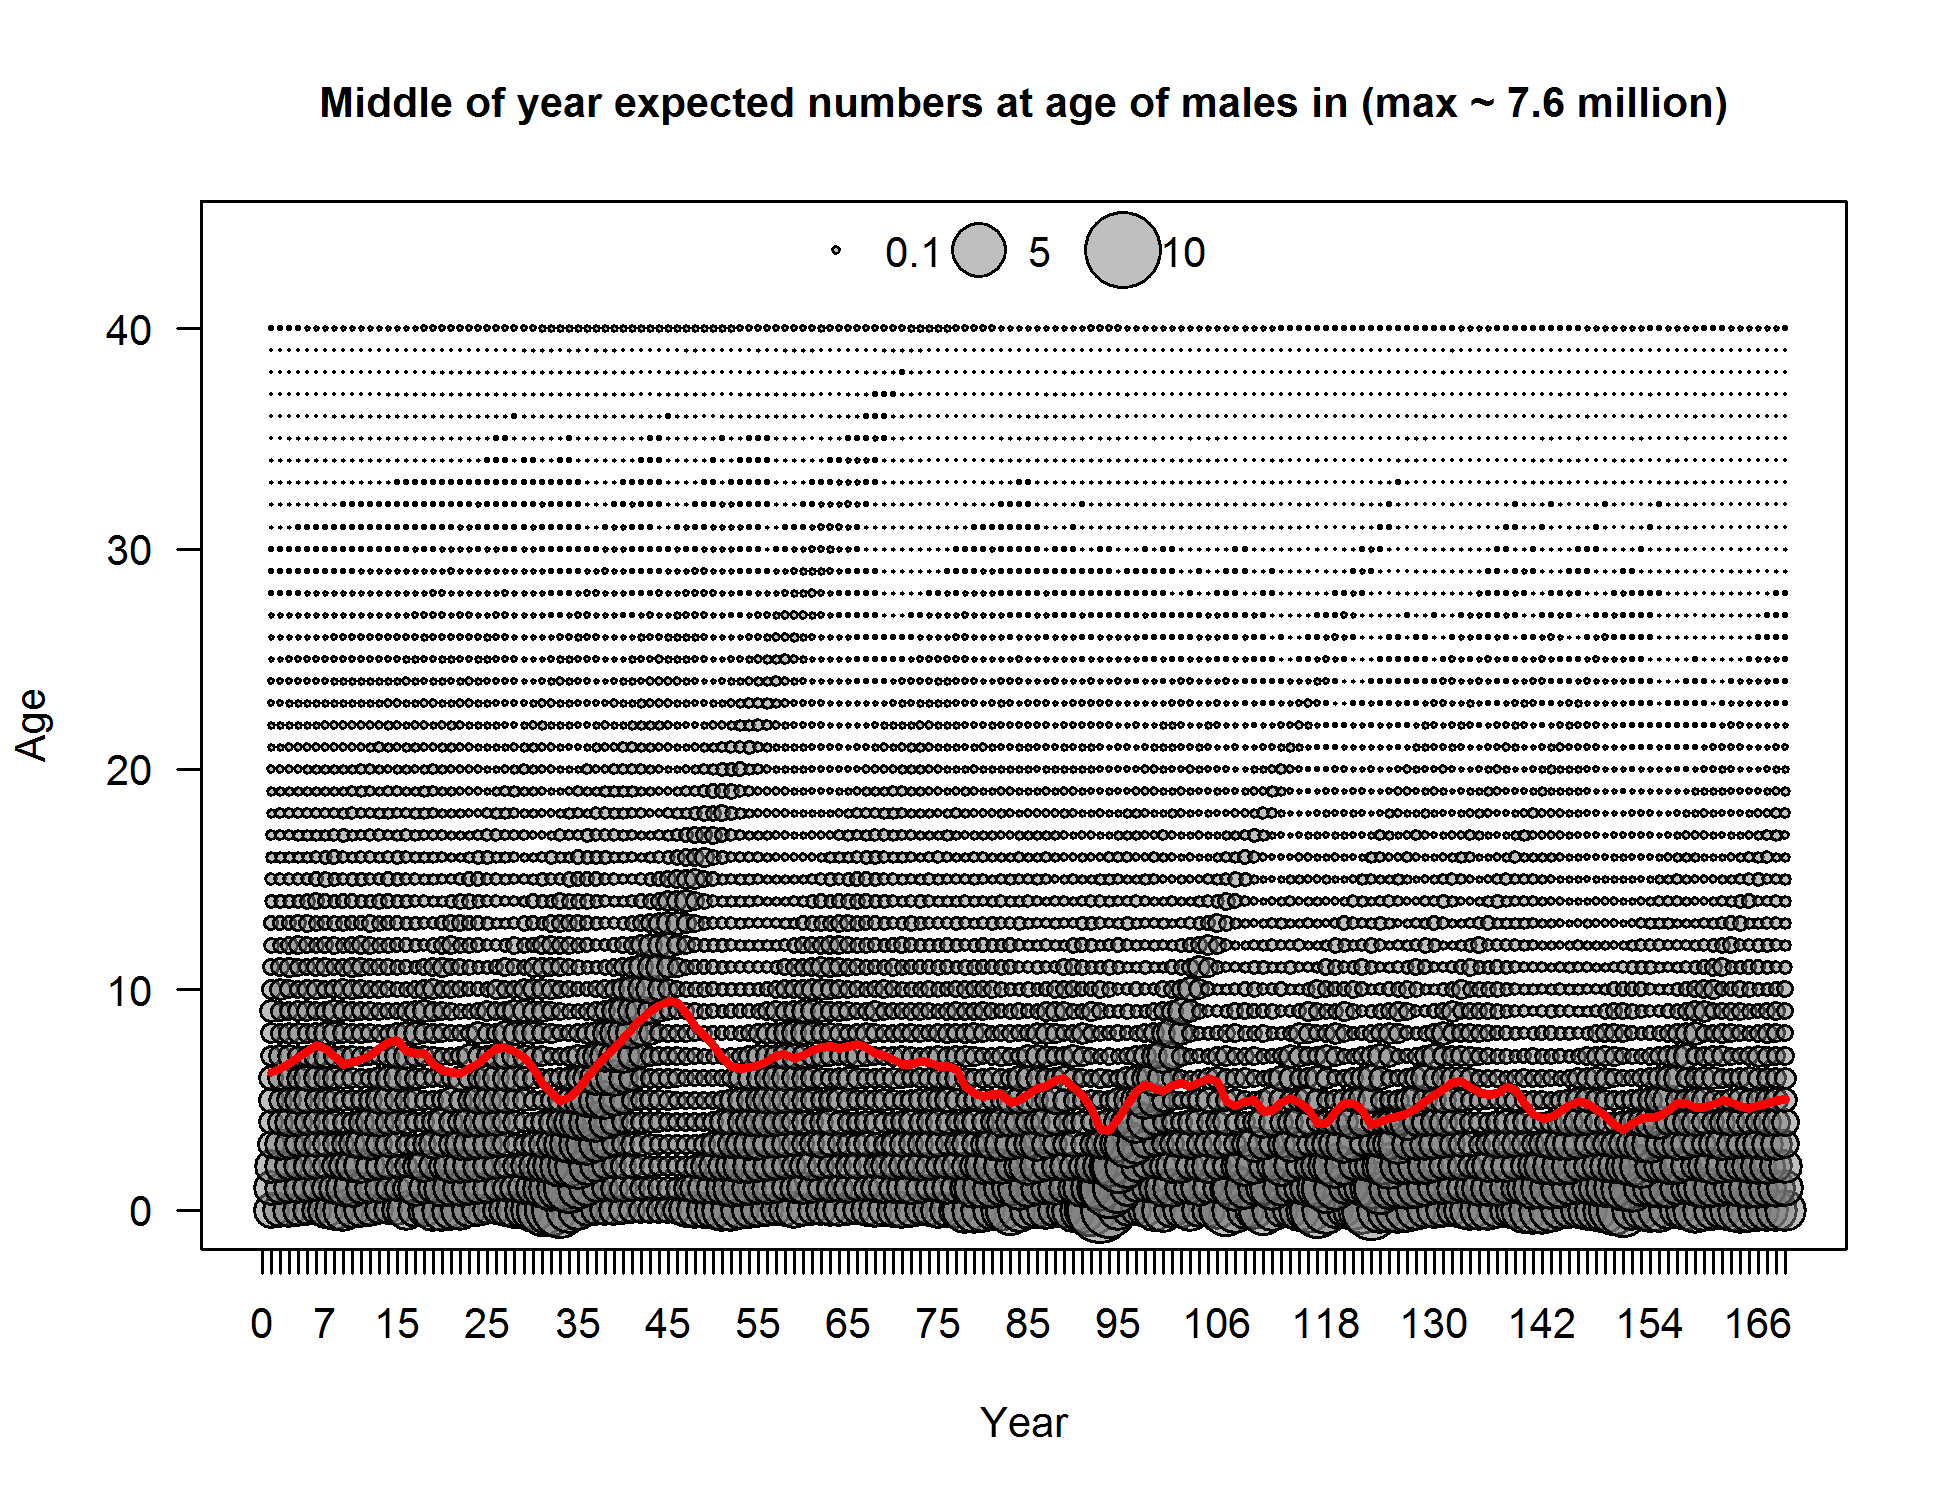
Middle of year expected numbers at age of males in (max ~ 7.6 million)
file: numbers1_sex2_mid.png
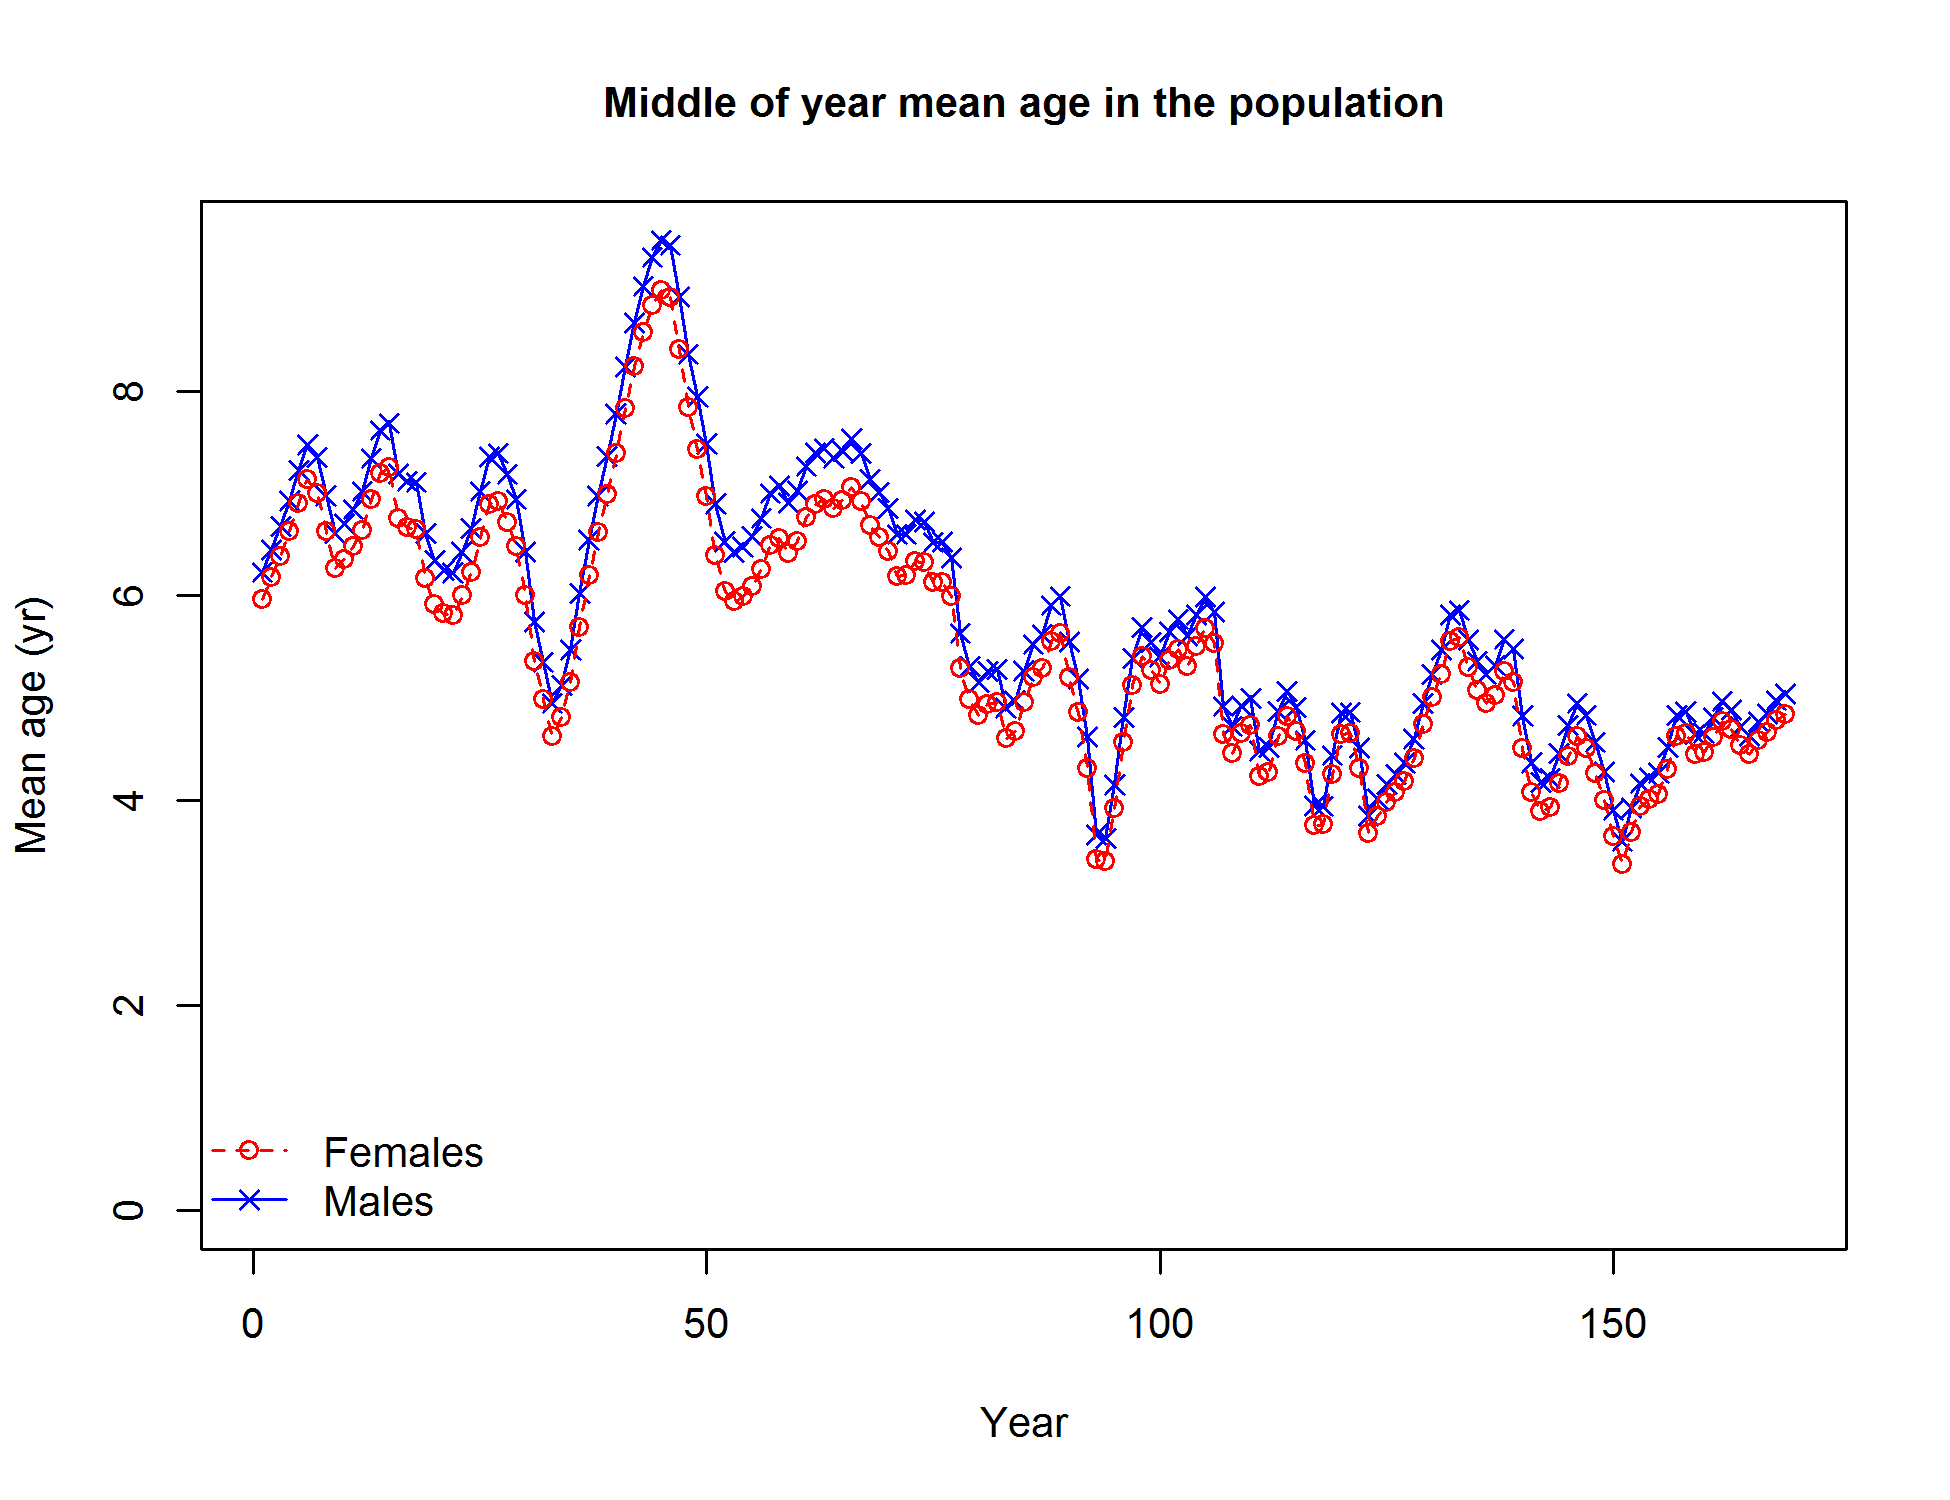
Middle of year mean age in the population
file: numbers2_meanage_mid.png
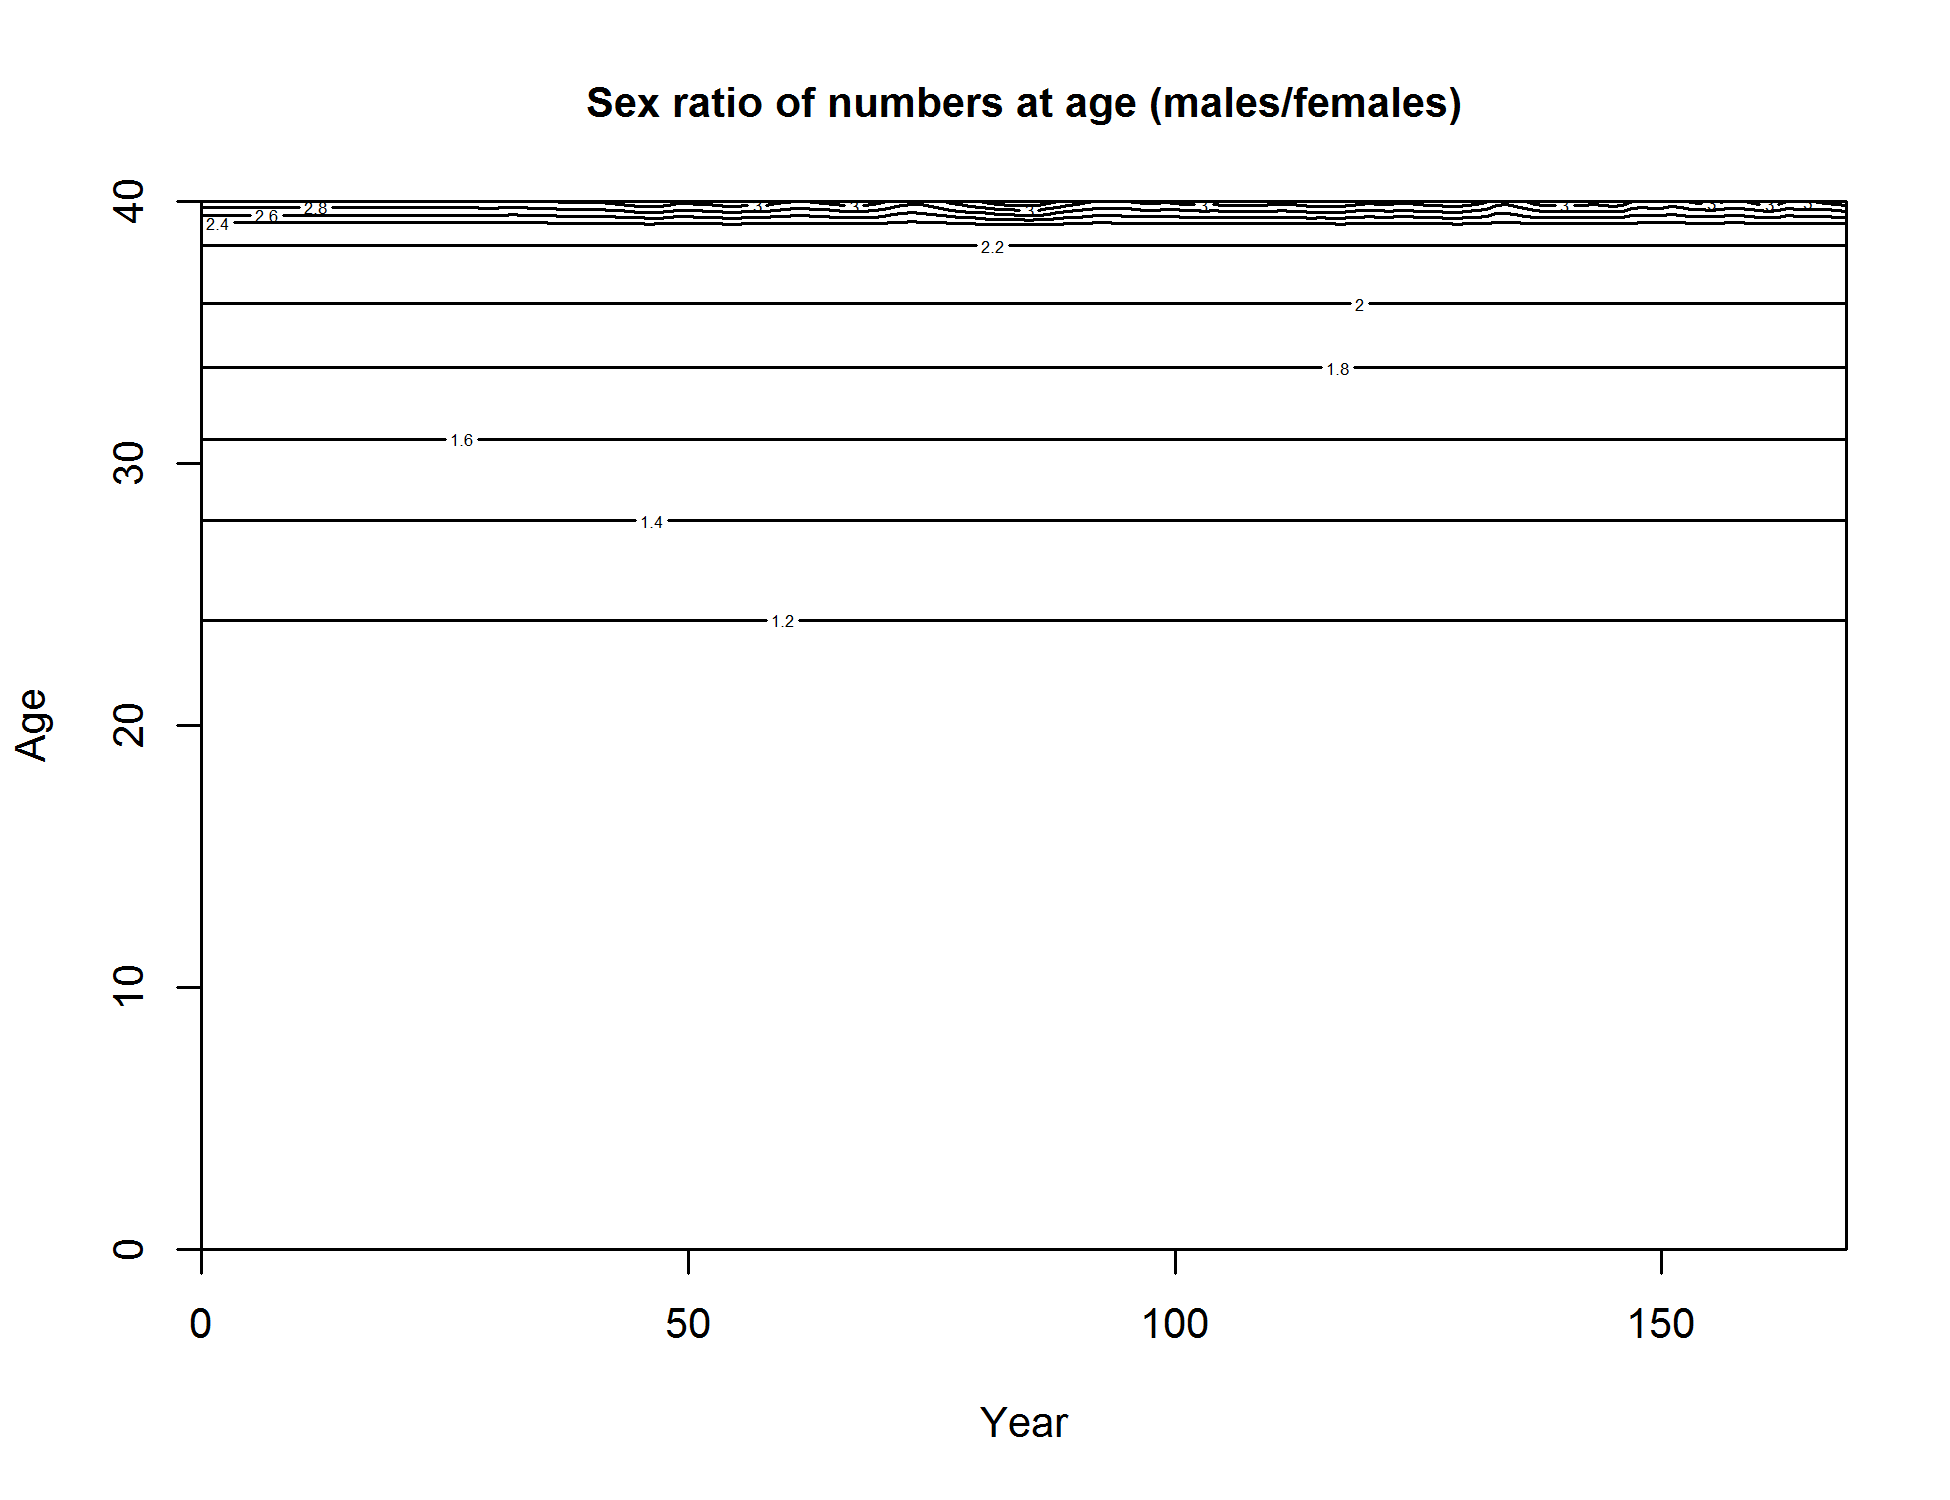
Sex ratio of numbers at age (males/females)
file: numbers3_ratio_age.png
Beginning of year expected numbers at length of females in (max ~ 7.4 million)
file: numbers6_len_sex1.png
Beginning of year expected numbers at length of males in (max ~ 7.4 million)
file: numbers6_len_sex2.png
Beginning of year mean length (cm) in the population
file: numbers7_meanlen.png
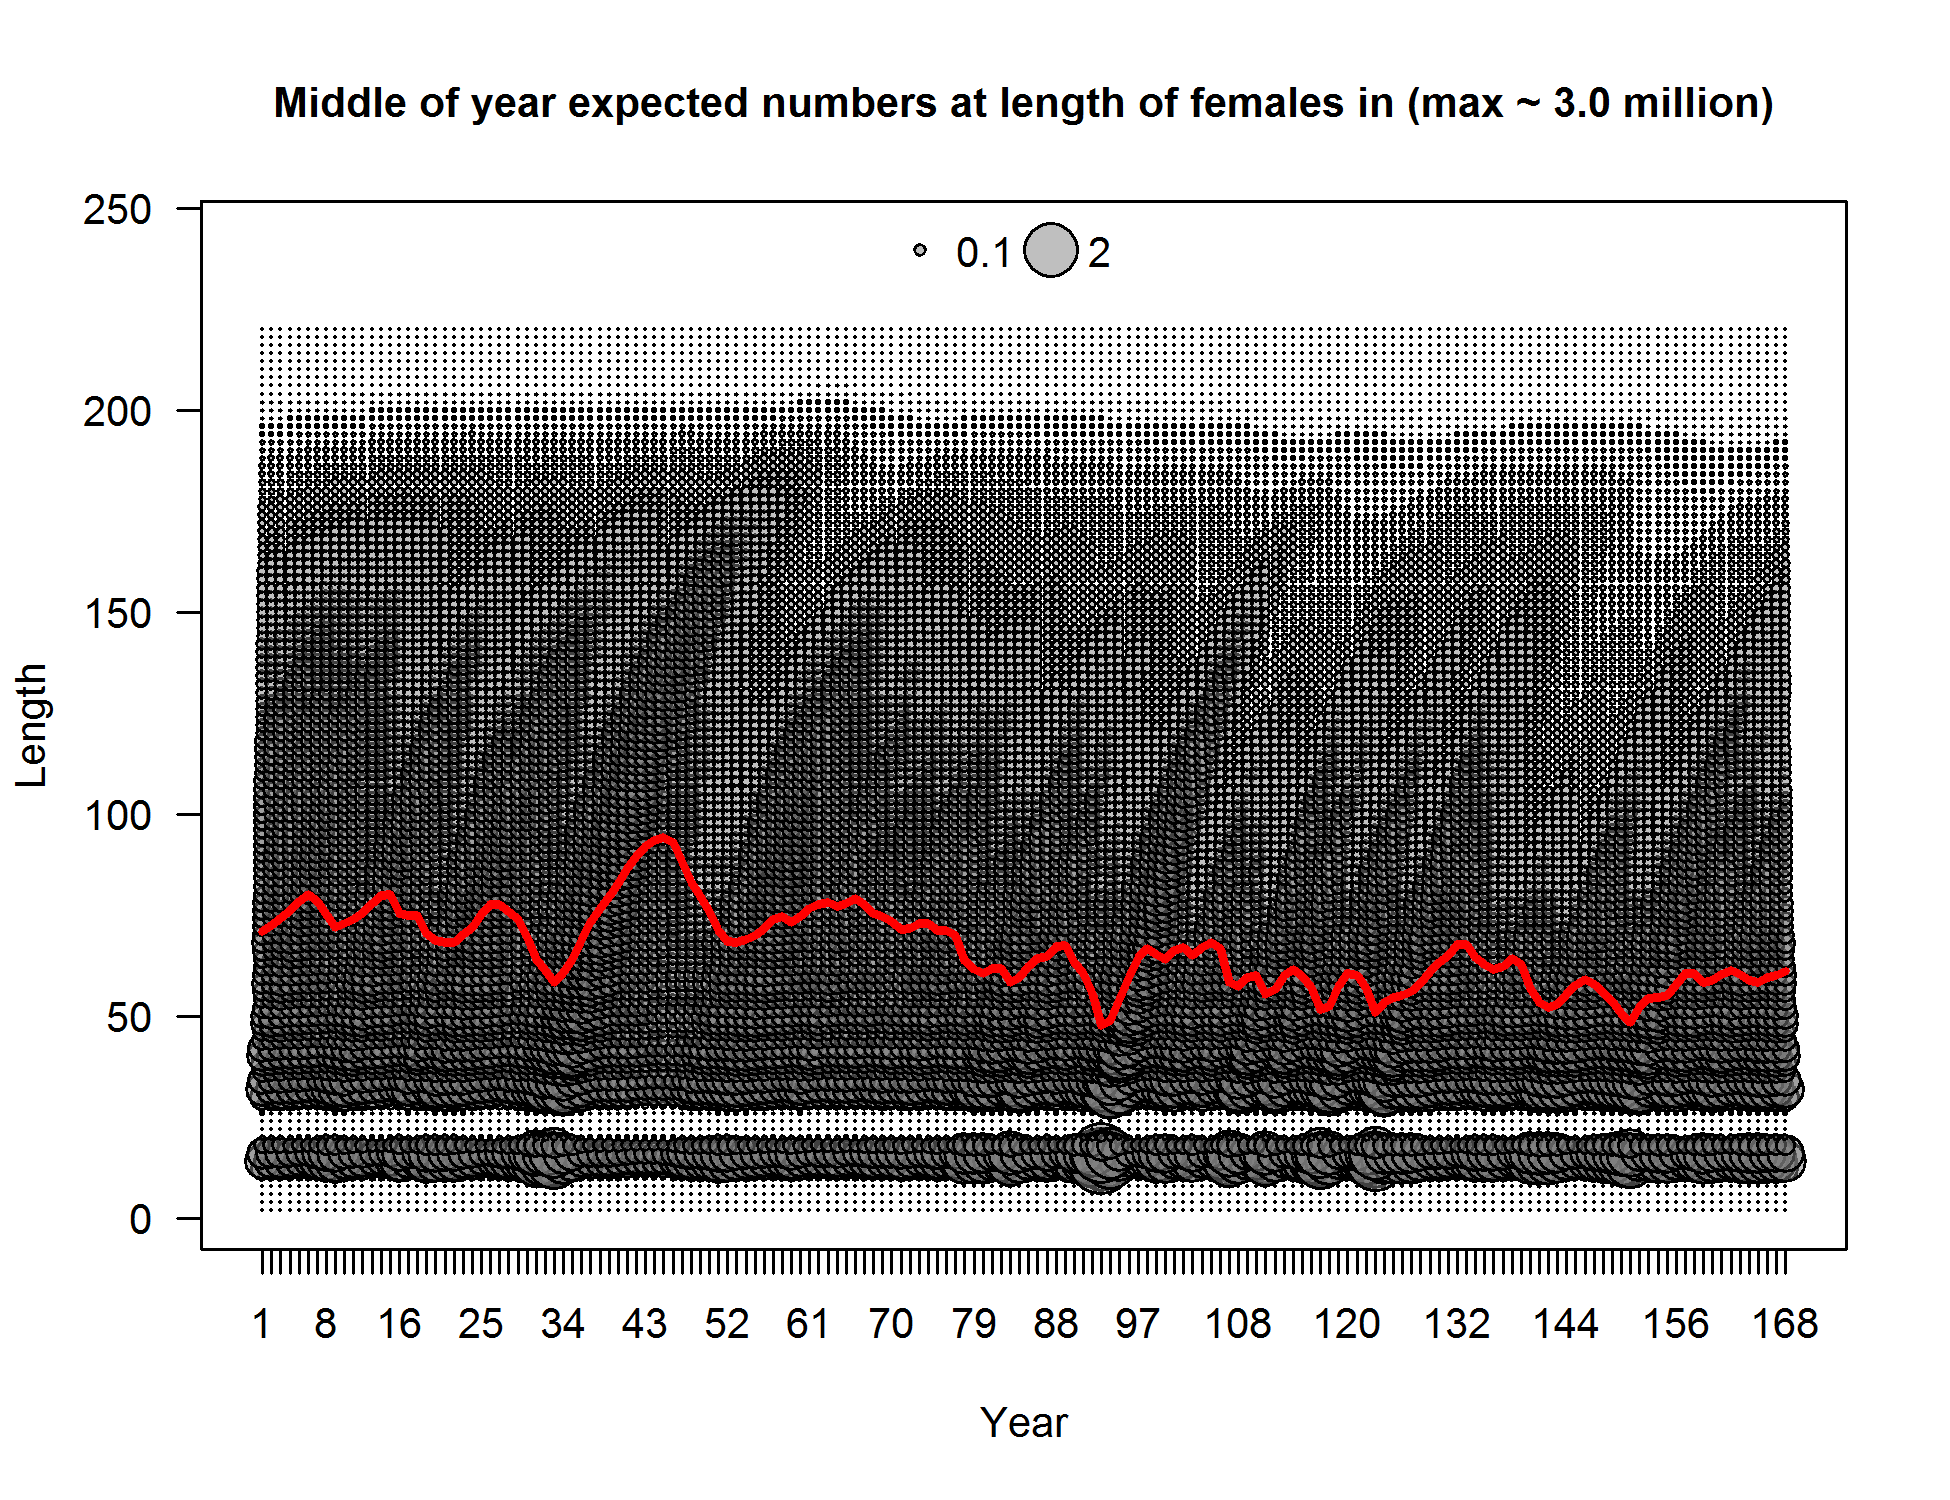
Middle of year expected numbers at length of females in (max ~ 3.0 million)
file: numbers6_len_sex1.png
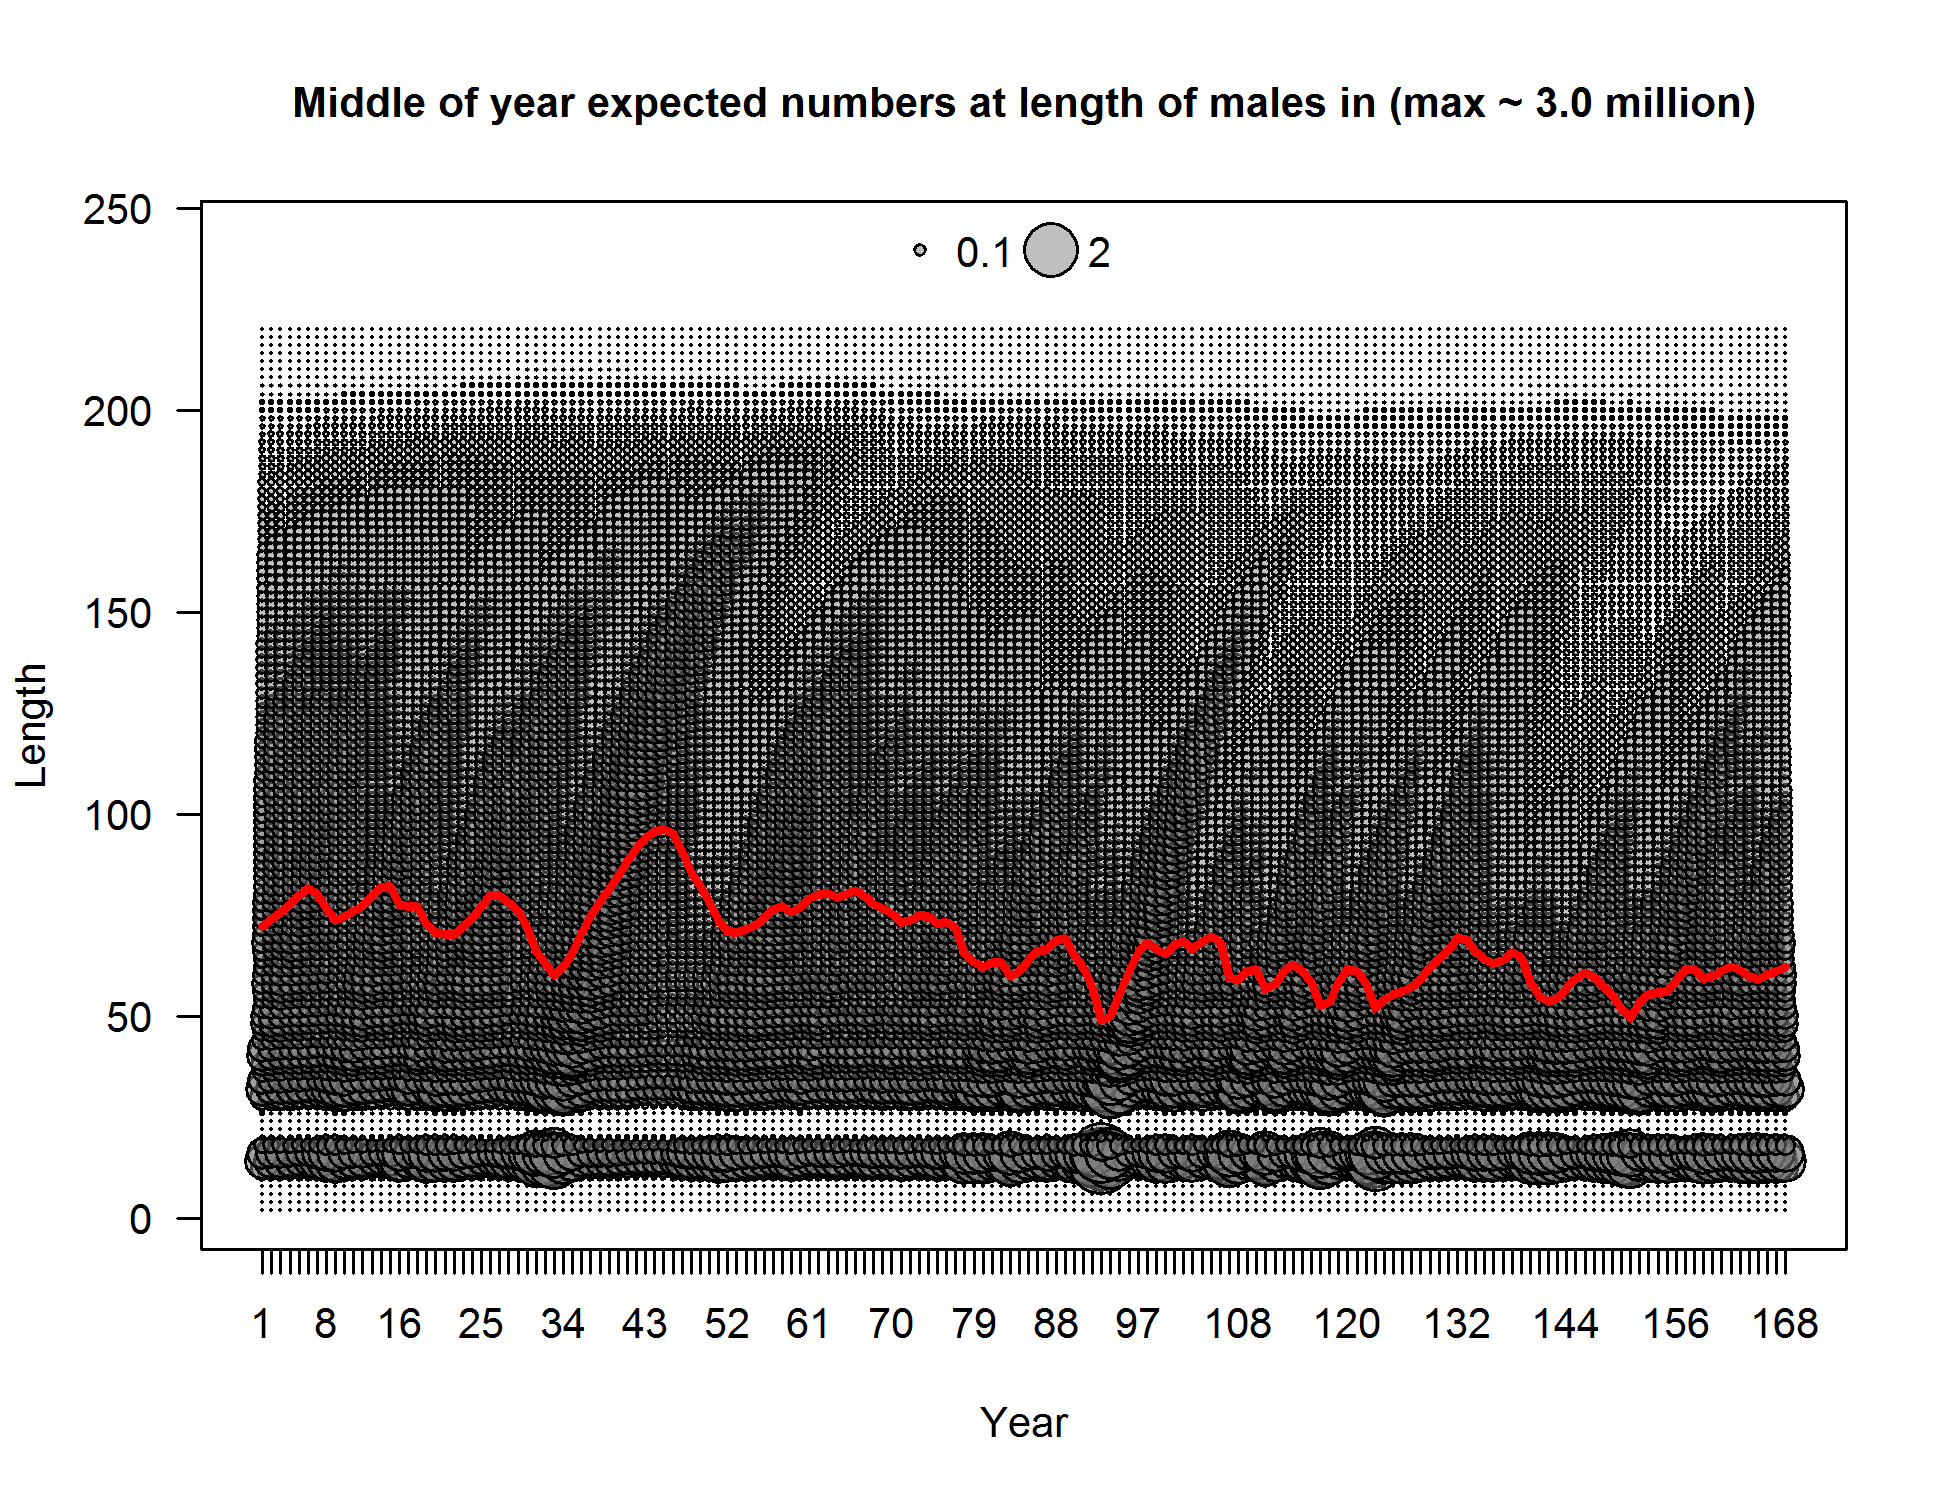
Middle of year expected numbers at length of males in (max ~ 3.0 million)
file: numbers6_len_sex2.png
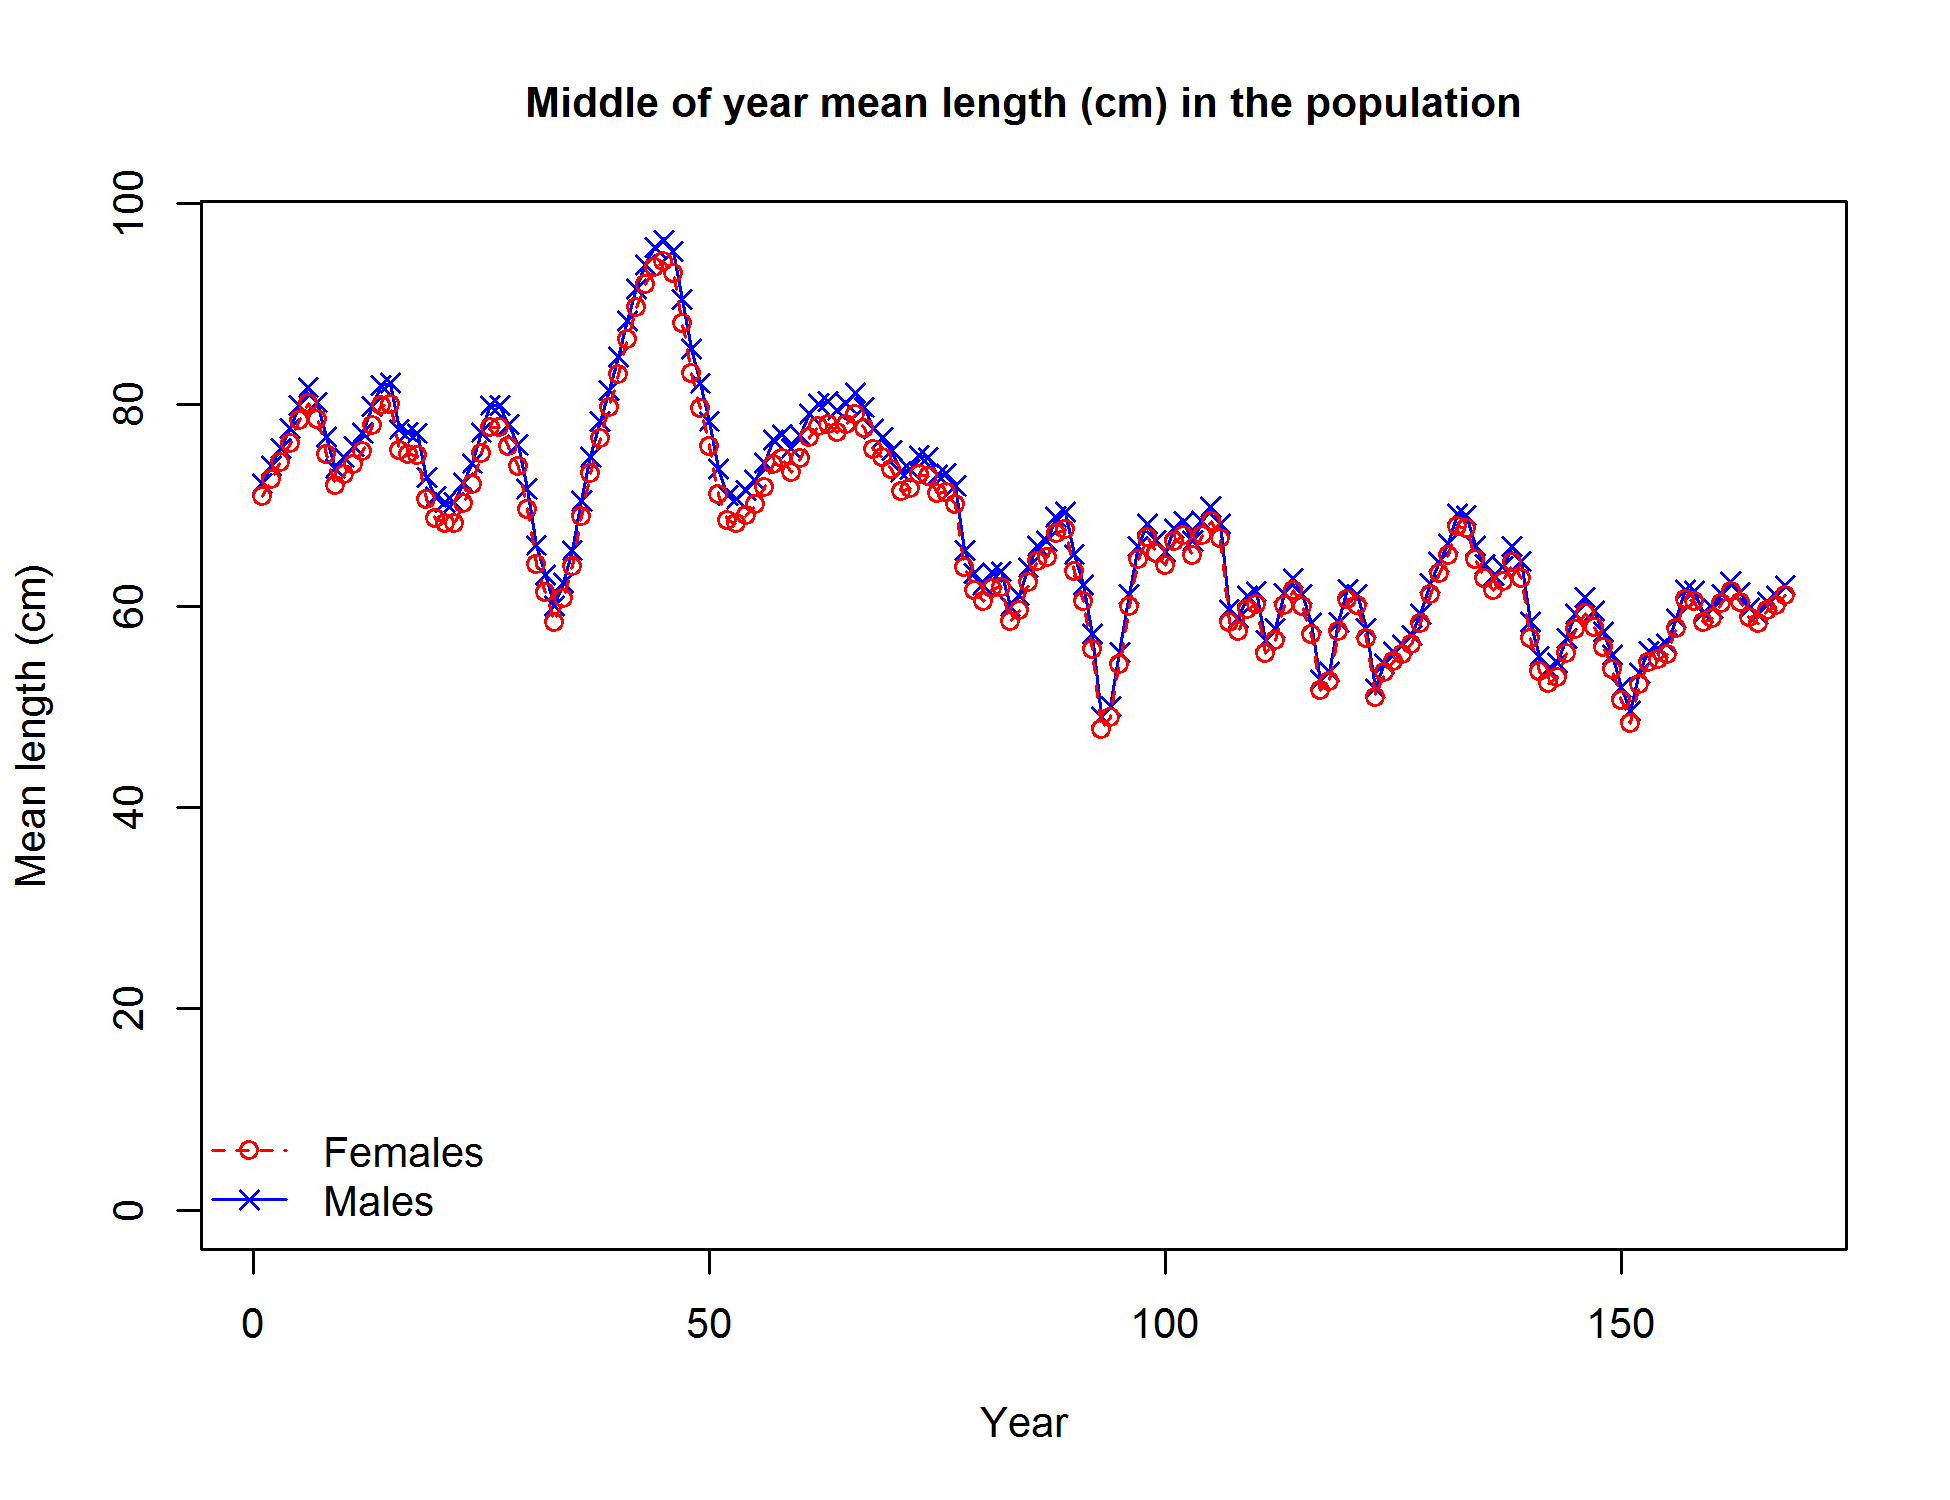
Middle of year mean length (cm) in the population
file: numbers7_meanlen.png
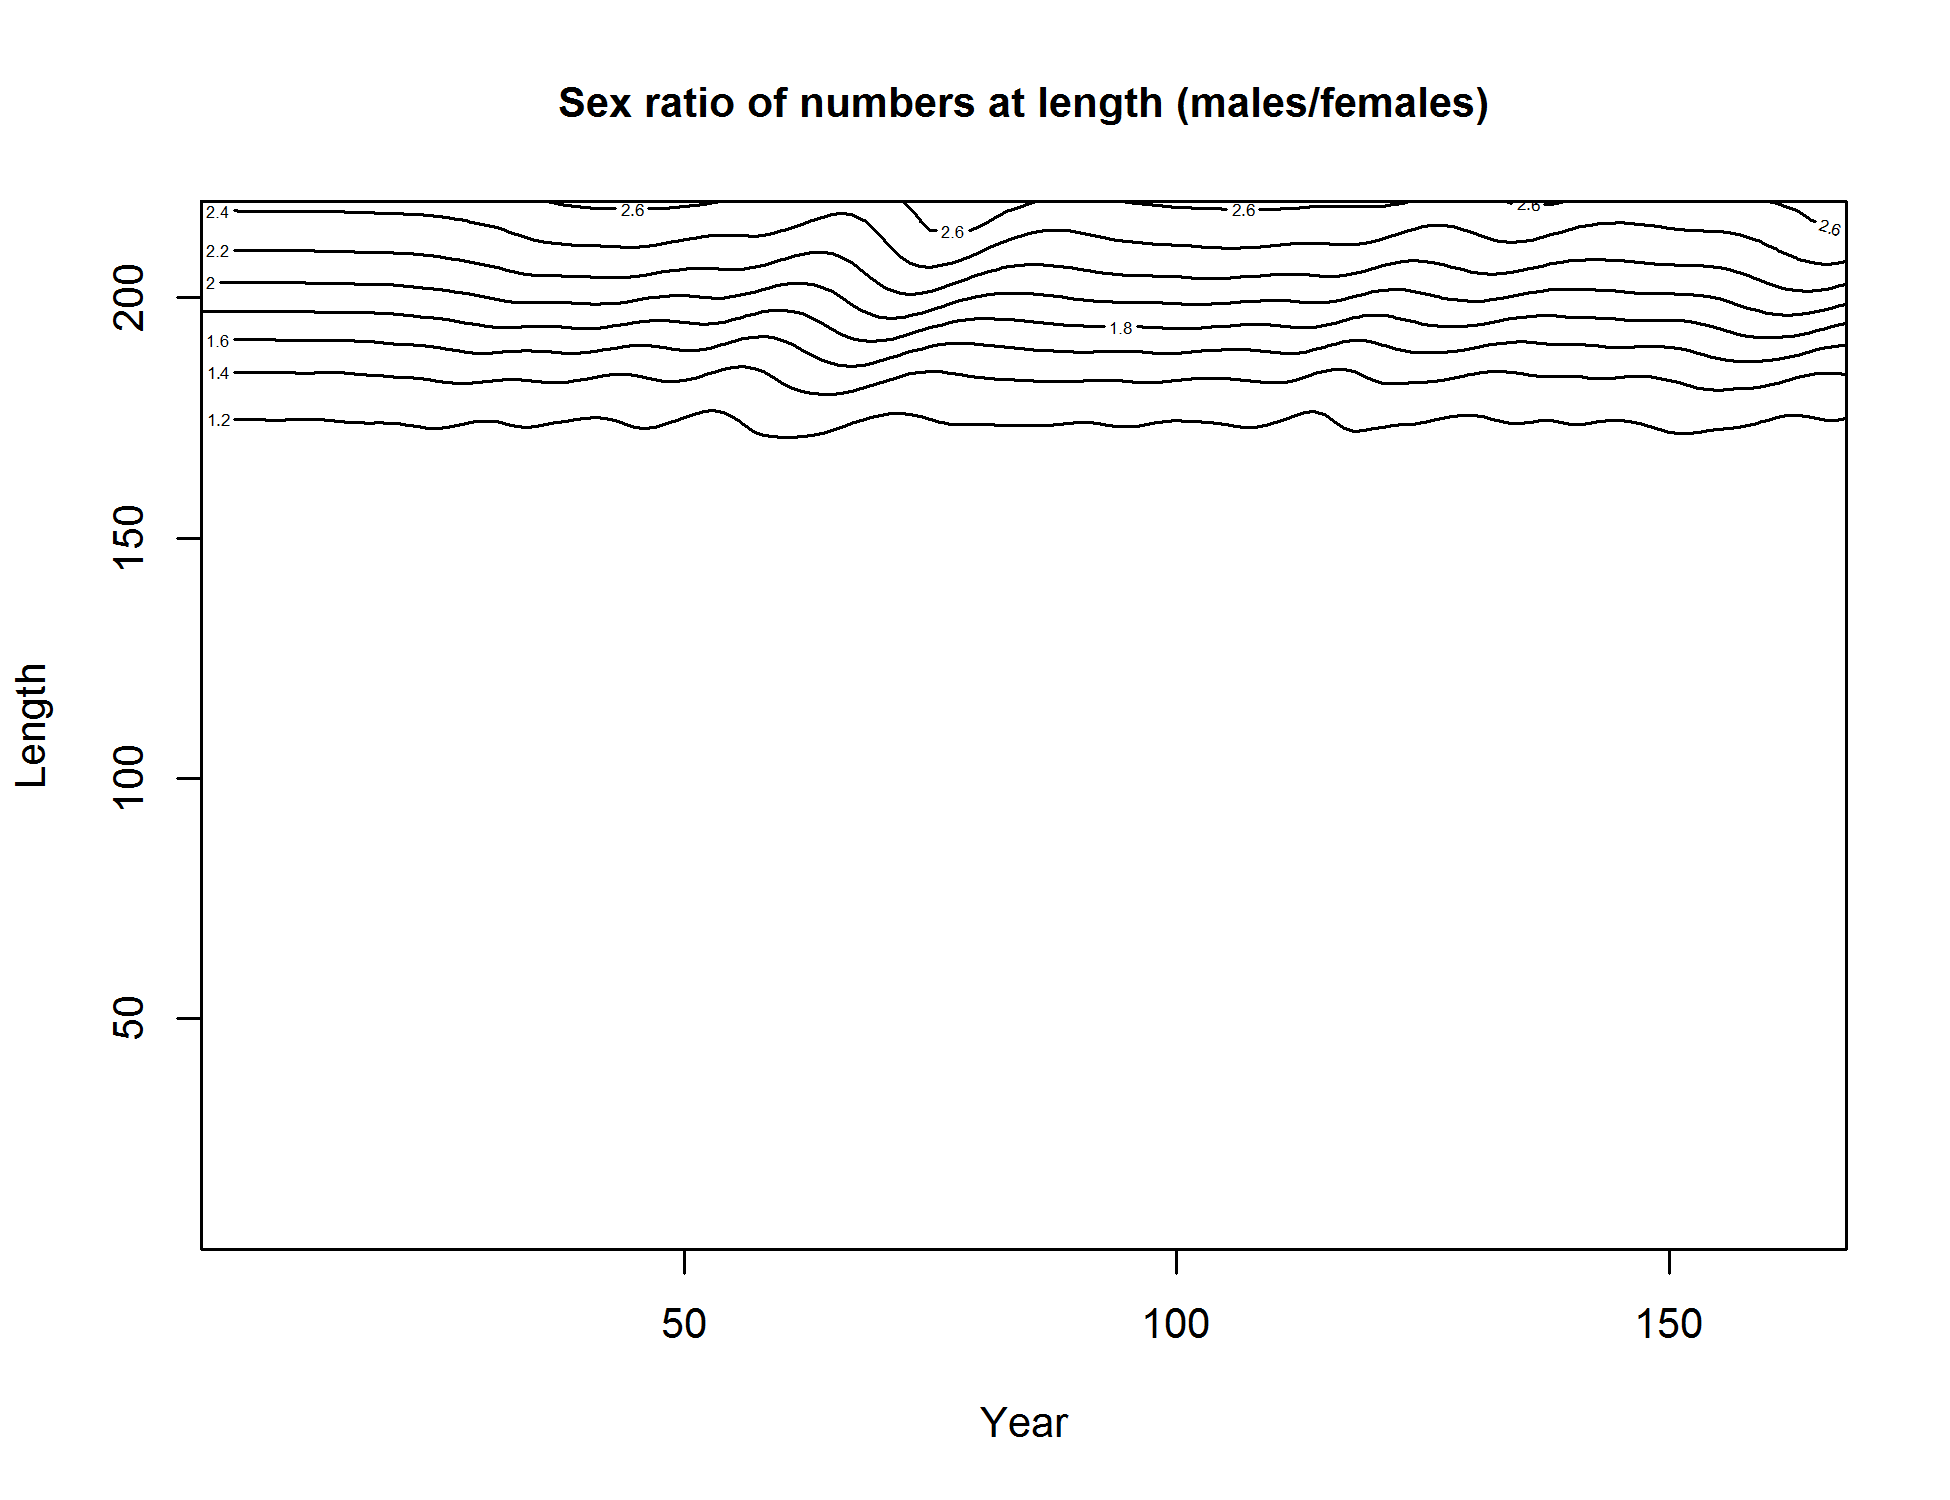
Sex ratio of numbers at length (males/females)
file: numbers8_ratio_len1.png

Sex ratio of numbers at length (females/males)
file: numbers8_ratio_len2.png
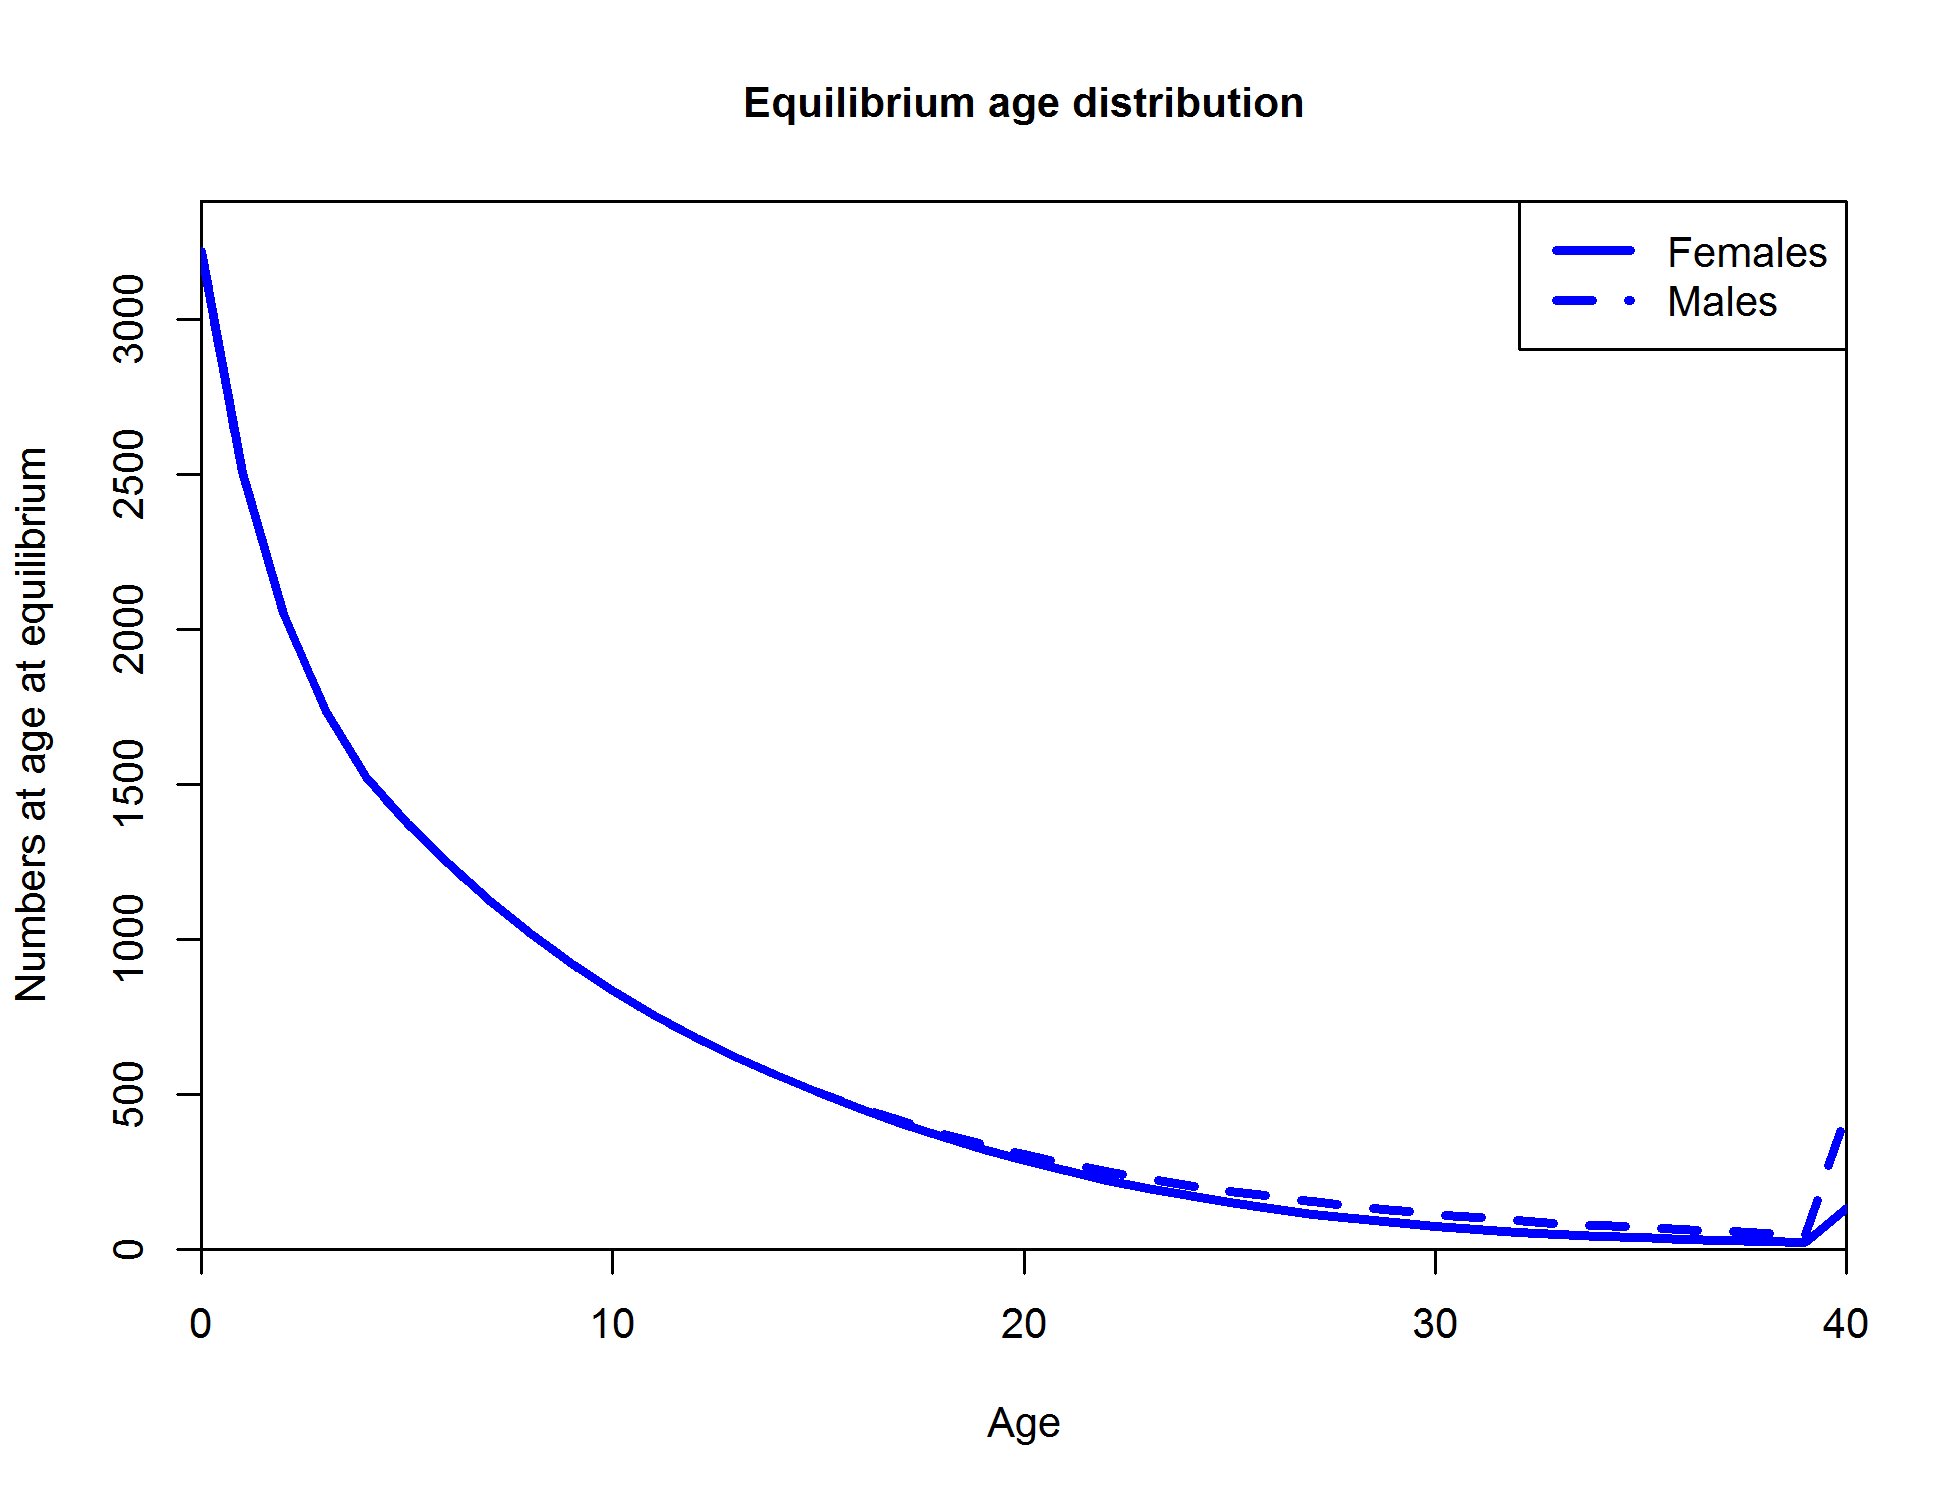
Equilibrium age distribution
file: numbers4_equilagecomp.png

Ageing imprecision: SD of observed age (yr)
file: numbers5_ageerrorSD.png
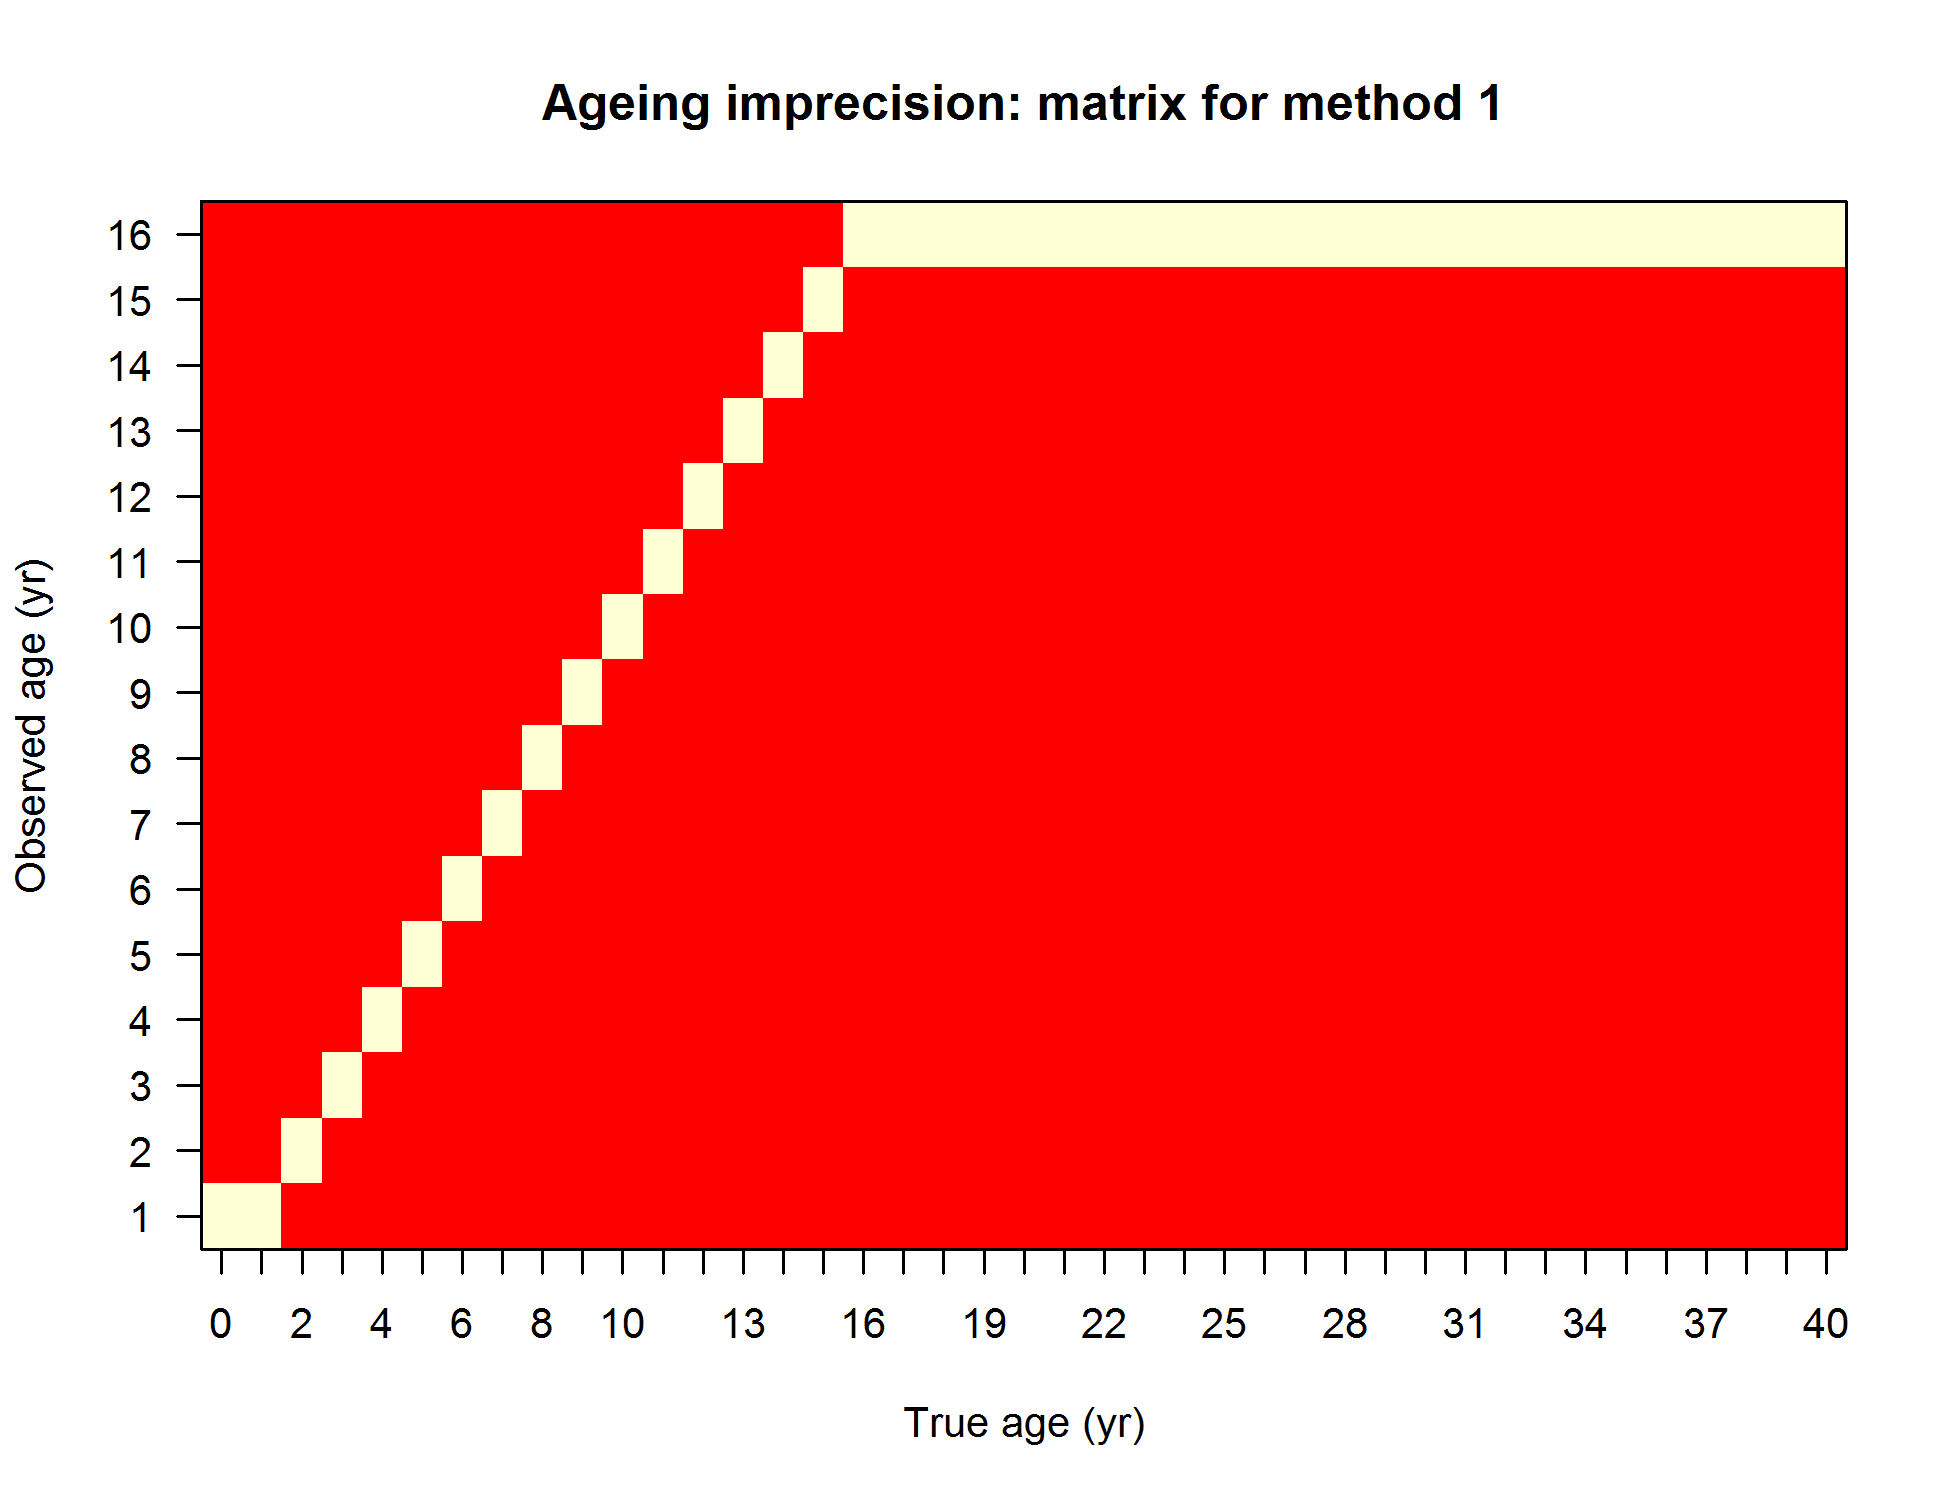
Ageing imprecision: matrix for method 1
file: numbers5_ageerror_matrix_1.png