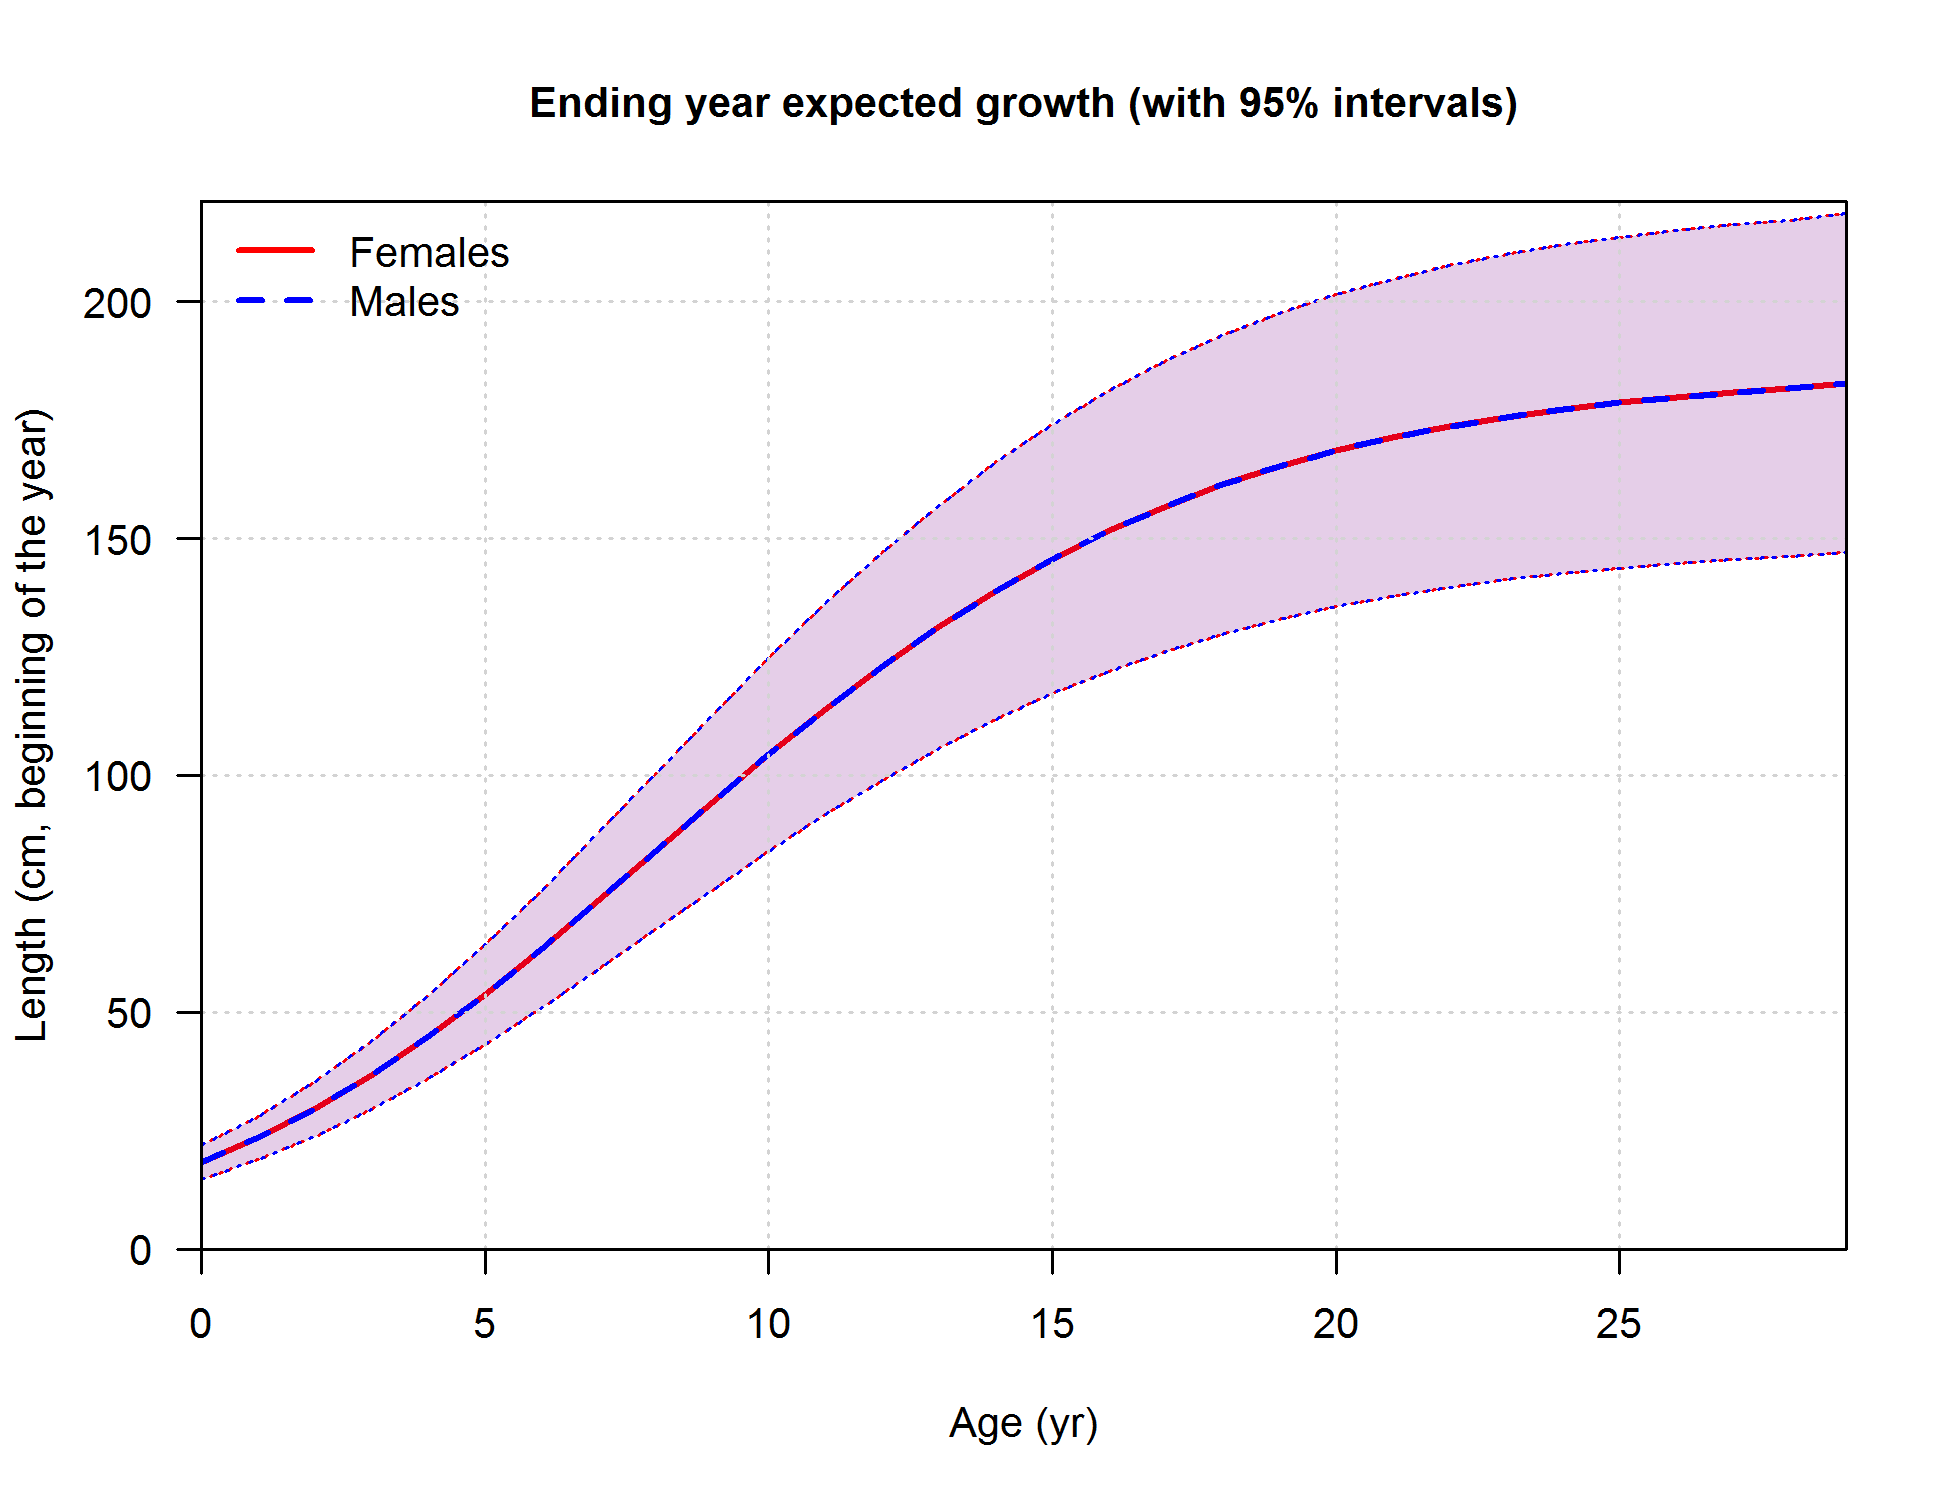
Length at age in the beginning of the year (or season) in the ending year of the model. Shaded area indicates 95% distribution of length at age around estimated growth curve.
file: bio1_sizeatage.png
Length at age in the beginning of the year (or season) in the ending year of the model. Shaded area indicates 95% distribution of length at age around estimated growth curve.
file: bio1_sizeatage.png
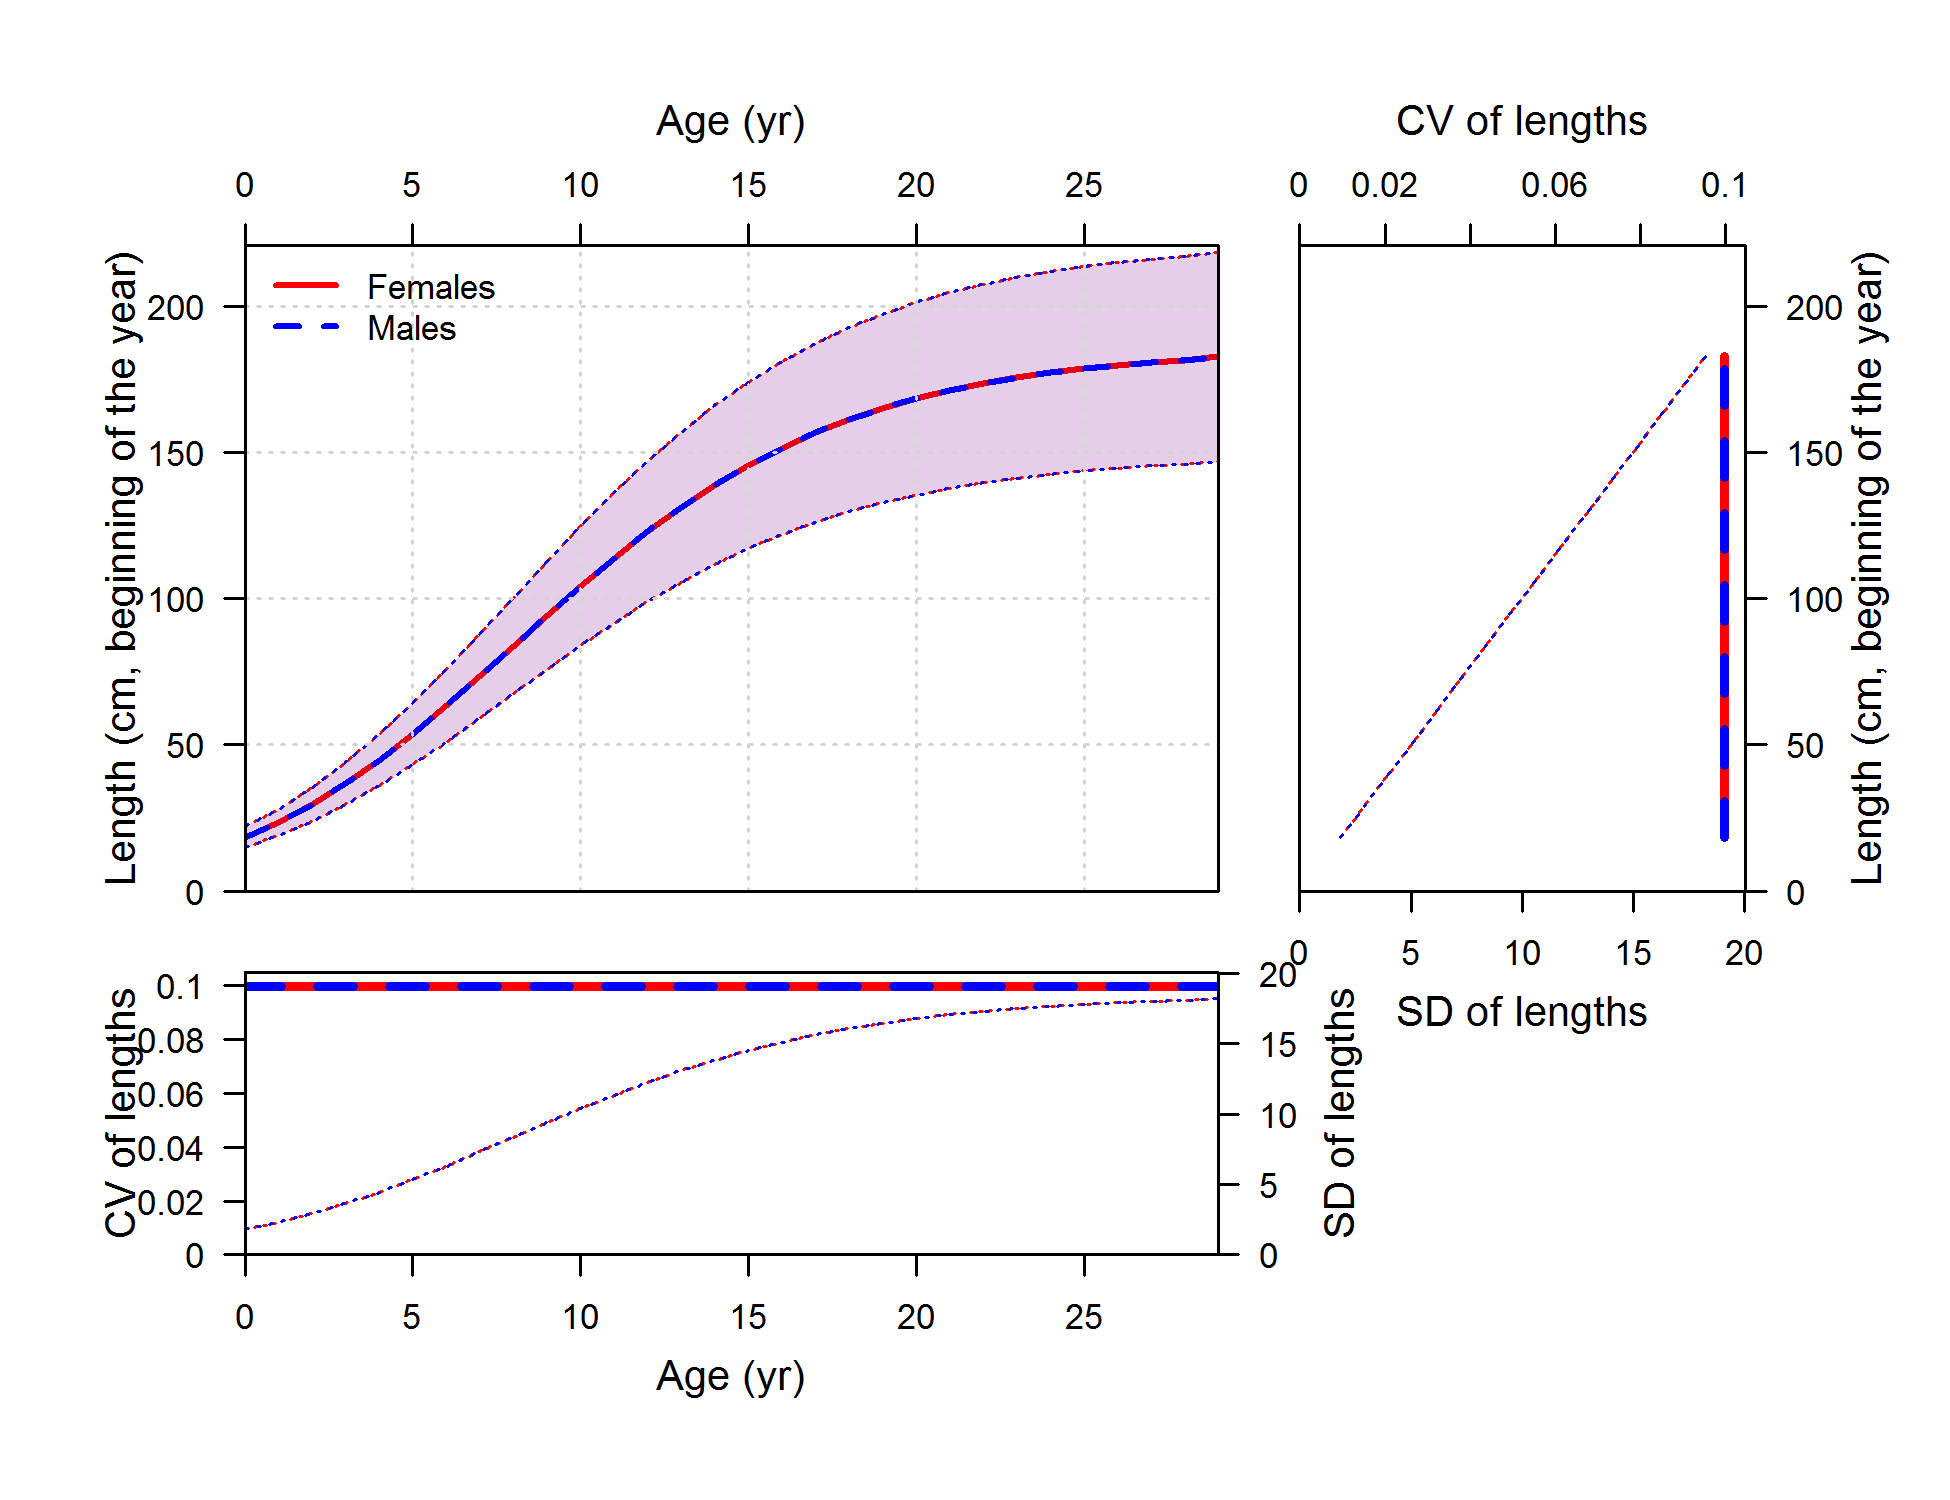
Length at age (top-left panel) with CV (thick line) and SD (thin line) of length at age shown in top-right and lower-left panels
file: bio2_sizeatage_plus_CV_and_SD.png
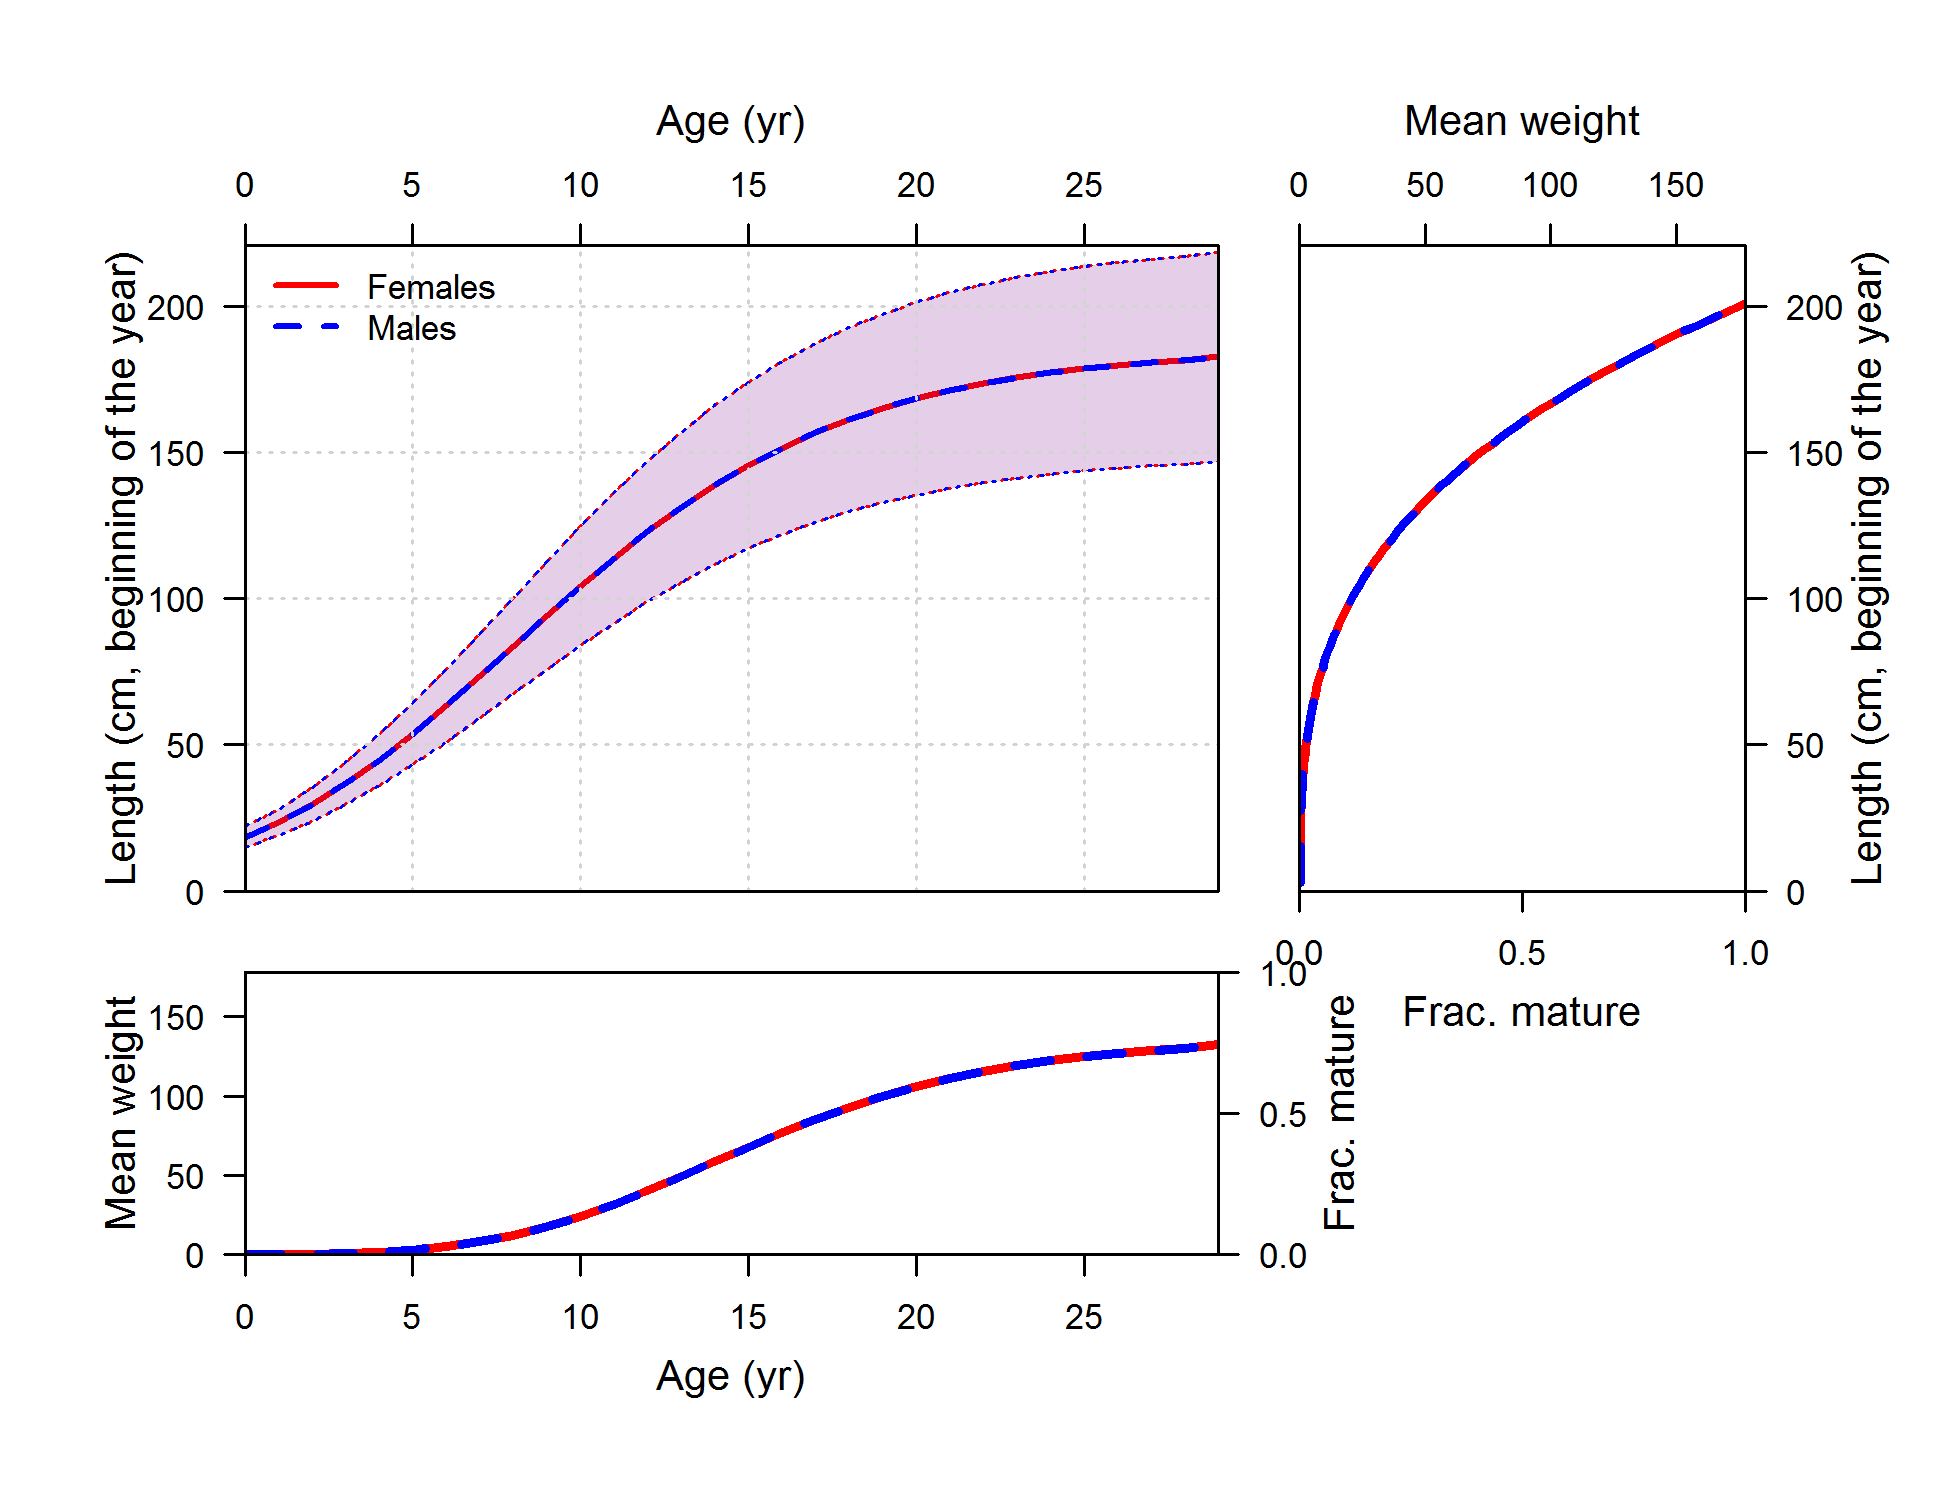
Length at age (top-left panel) with weight (thick line) and maturity (thin line) shown in top-right and lower-left panels
file: bio3_sizeatage_plus_WT_and_MAT.png
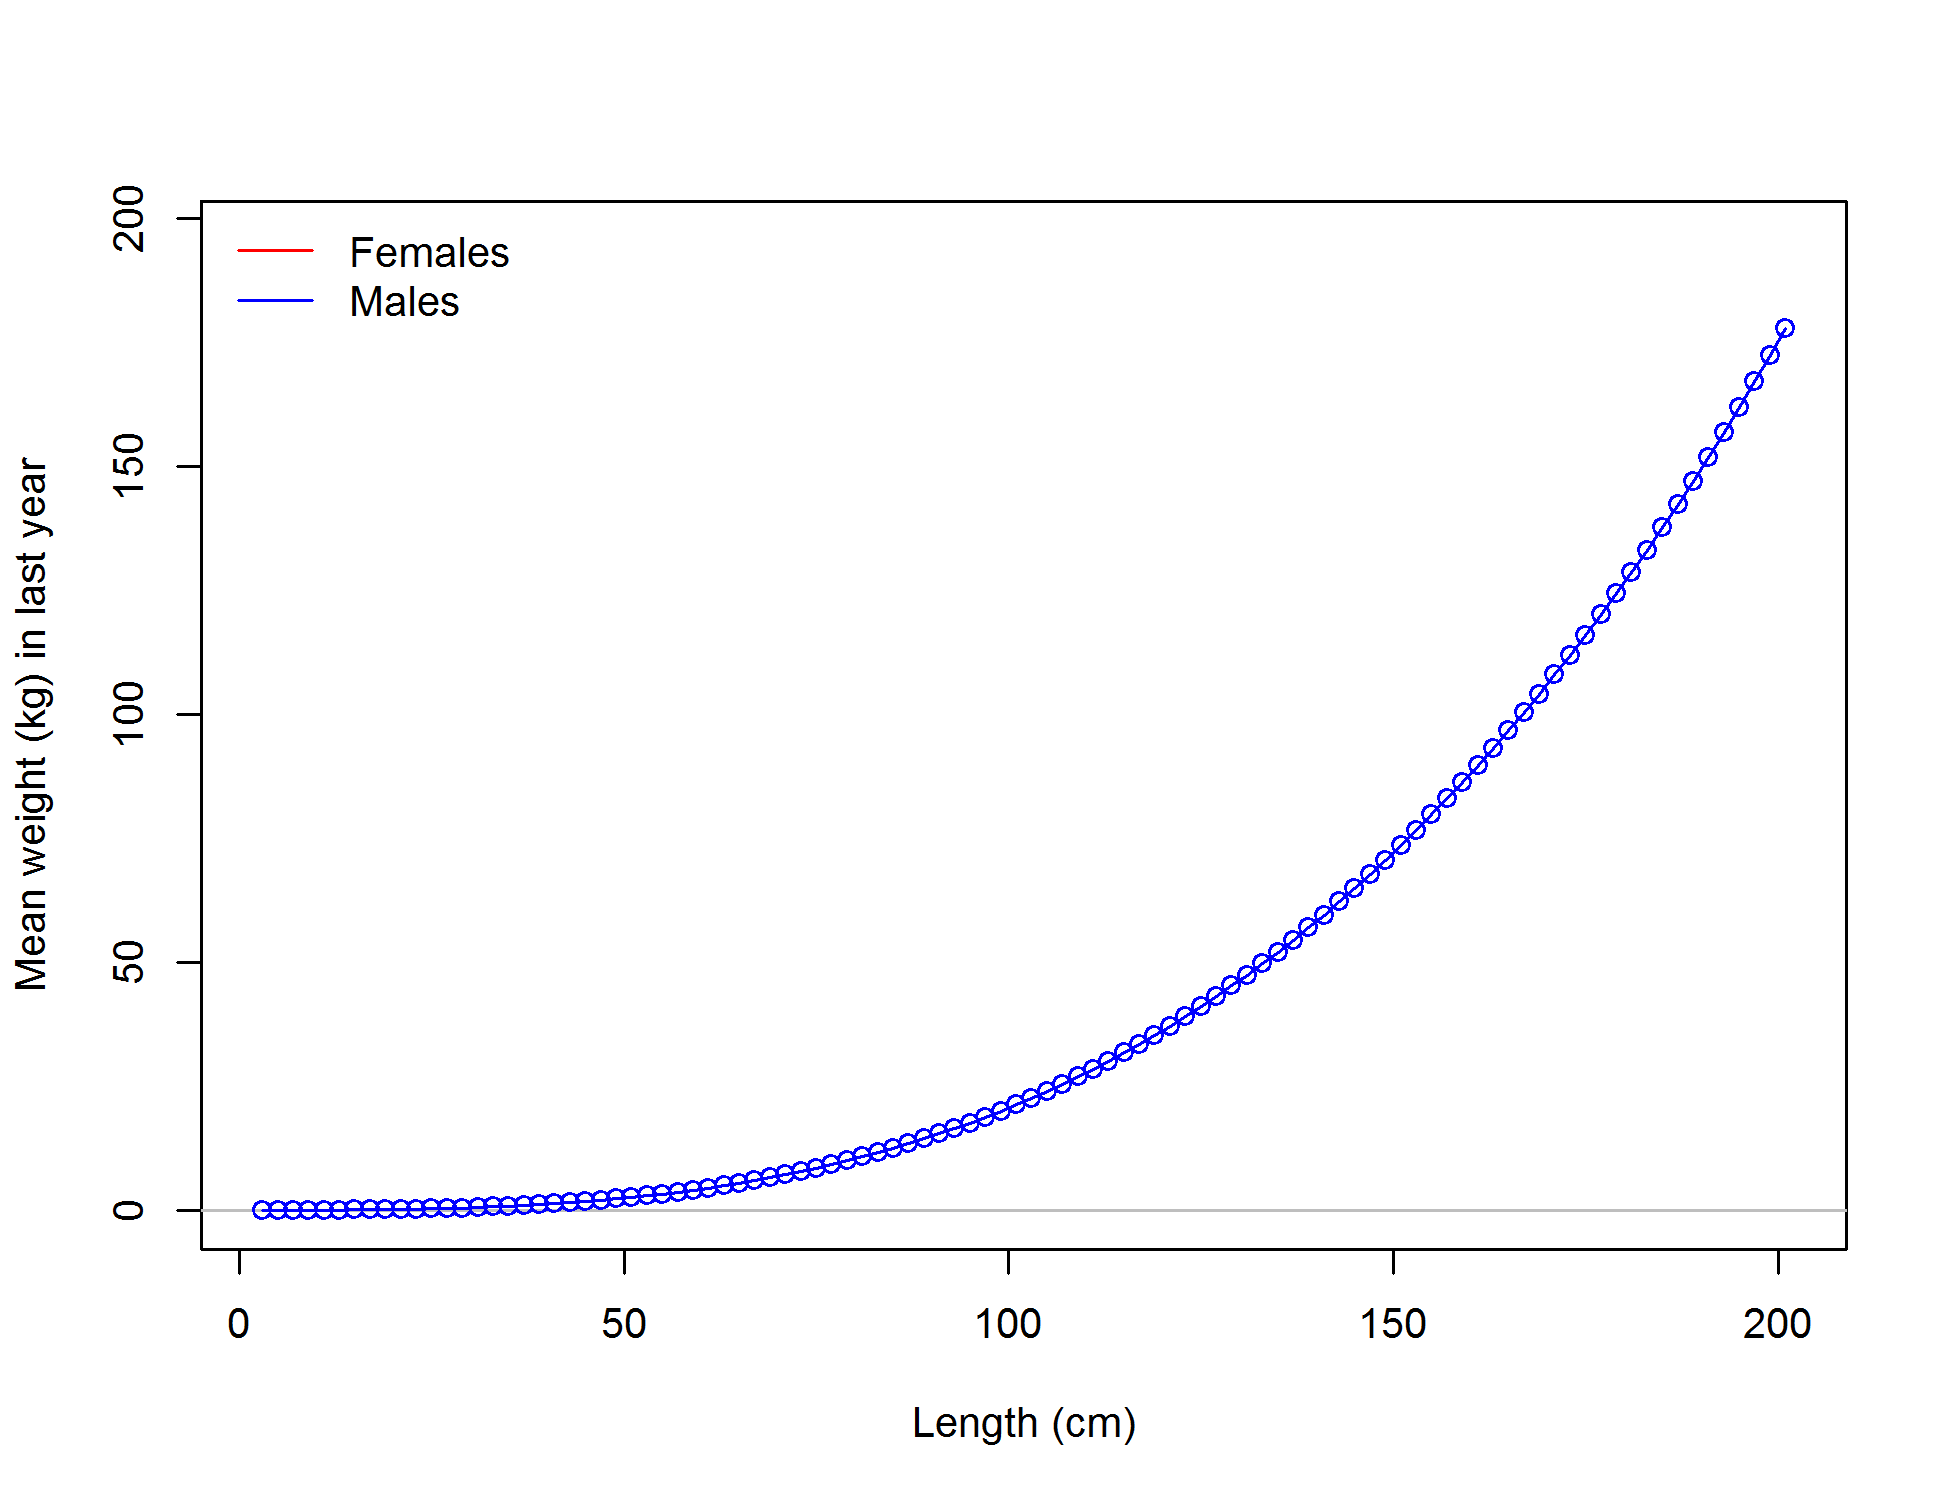
Weight-length relationship for females
file: bio5_weightatsize.png
Maturity at length
file: bio6_maturity.png
Fecundity
file: bio7_fecundity.png
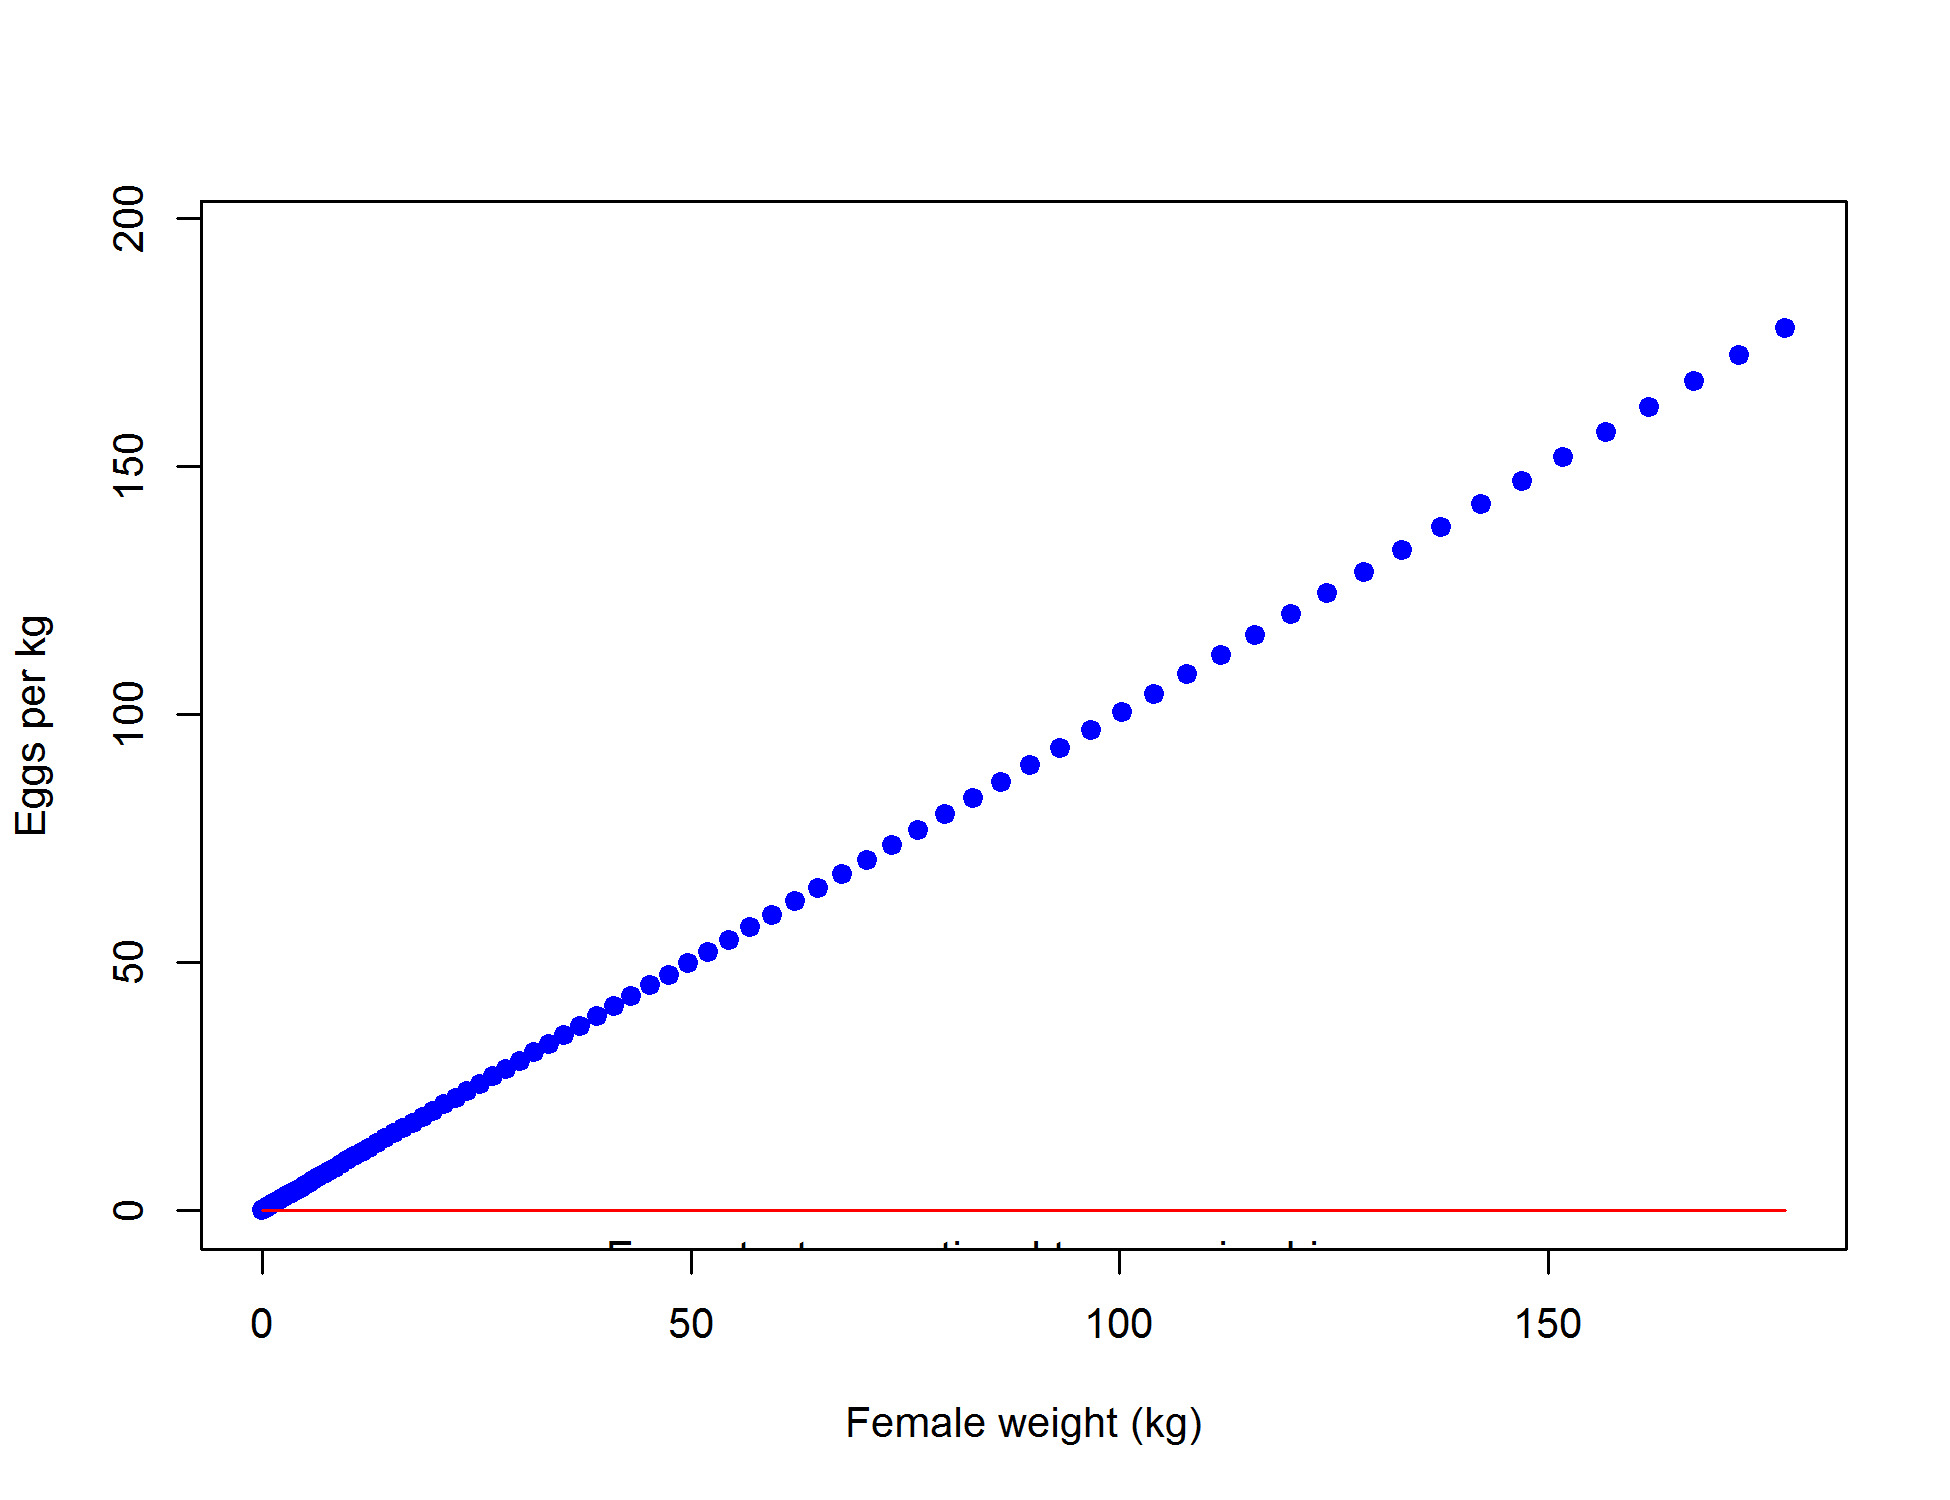
Fecundity as a function of weight
file: bio8_fecundity_wt.png
Fecundity as a function of length
file: bio9_fecundity_len.png
Spawning output at length
file: bio10_spawningoutput.png