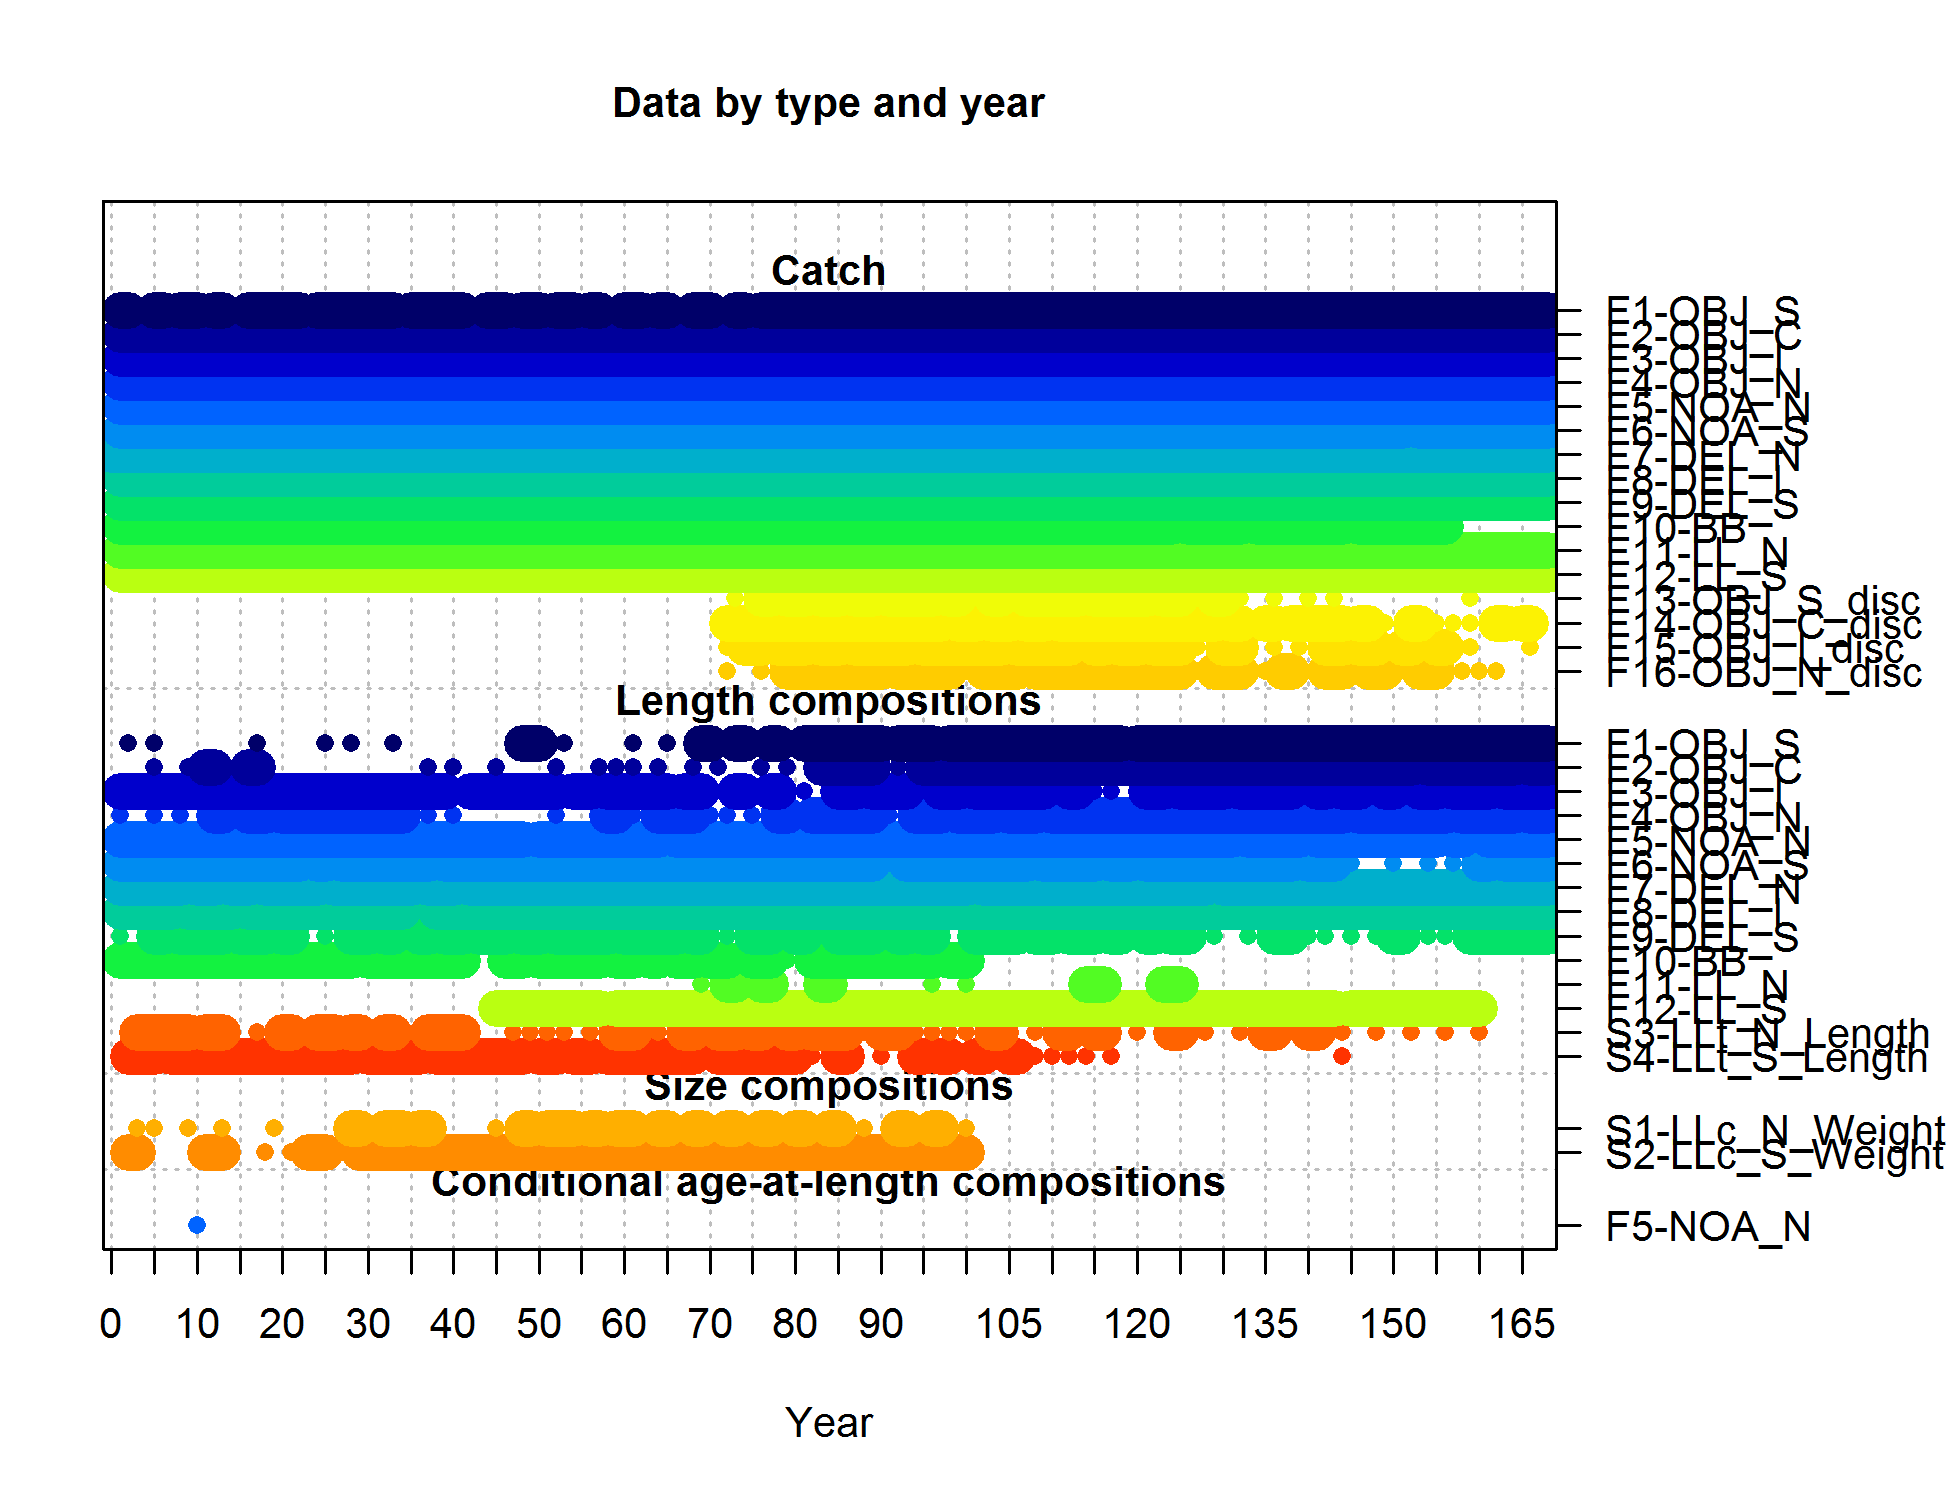
Data presence by year for each fleet
file: data_plot.png
Data presence by year for each fleet
file: data_plot.png
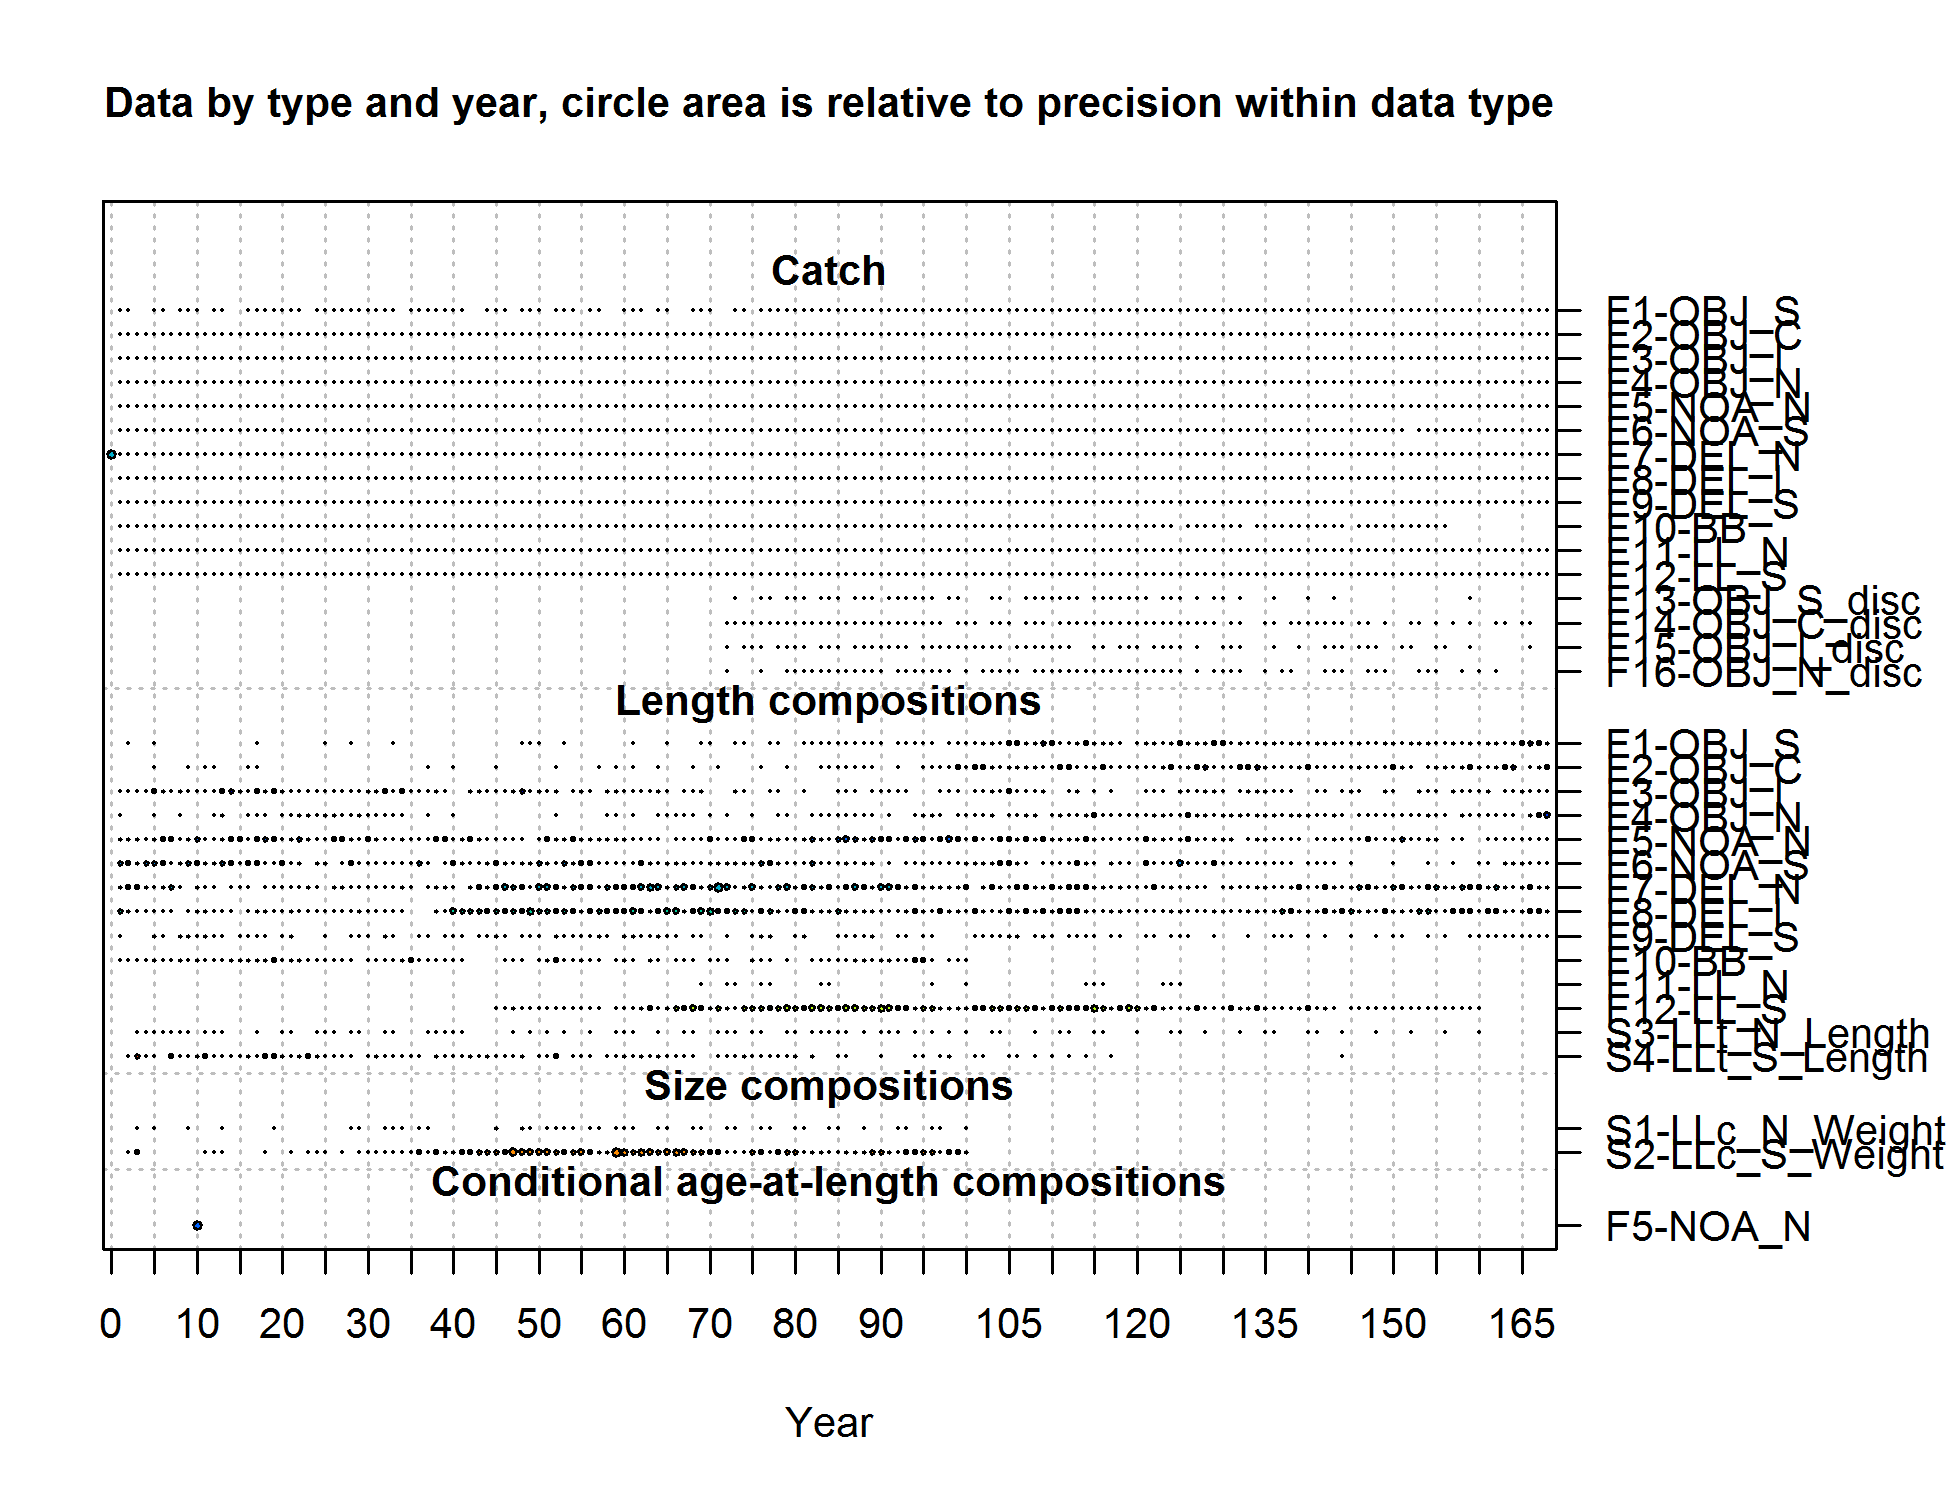
Data presence by year for each fleet, where circle area is relative
within a data type, and proportional to precision for indices and compositions,
and absolute catch for catches.
Note that since the circles are are scaled relative to maximum,
scaling within separate plots should not be compared.
file: data_plot2.png