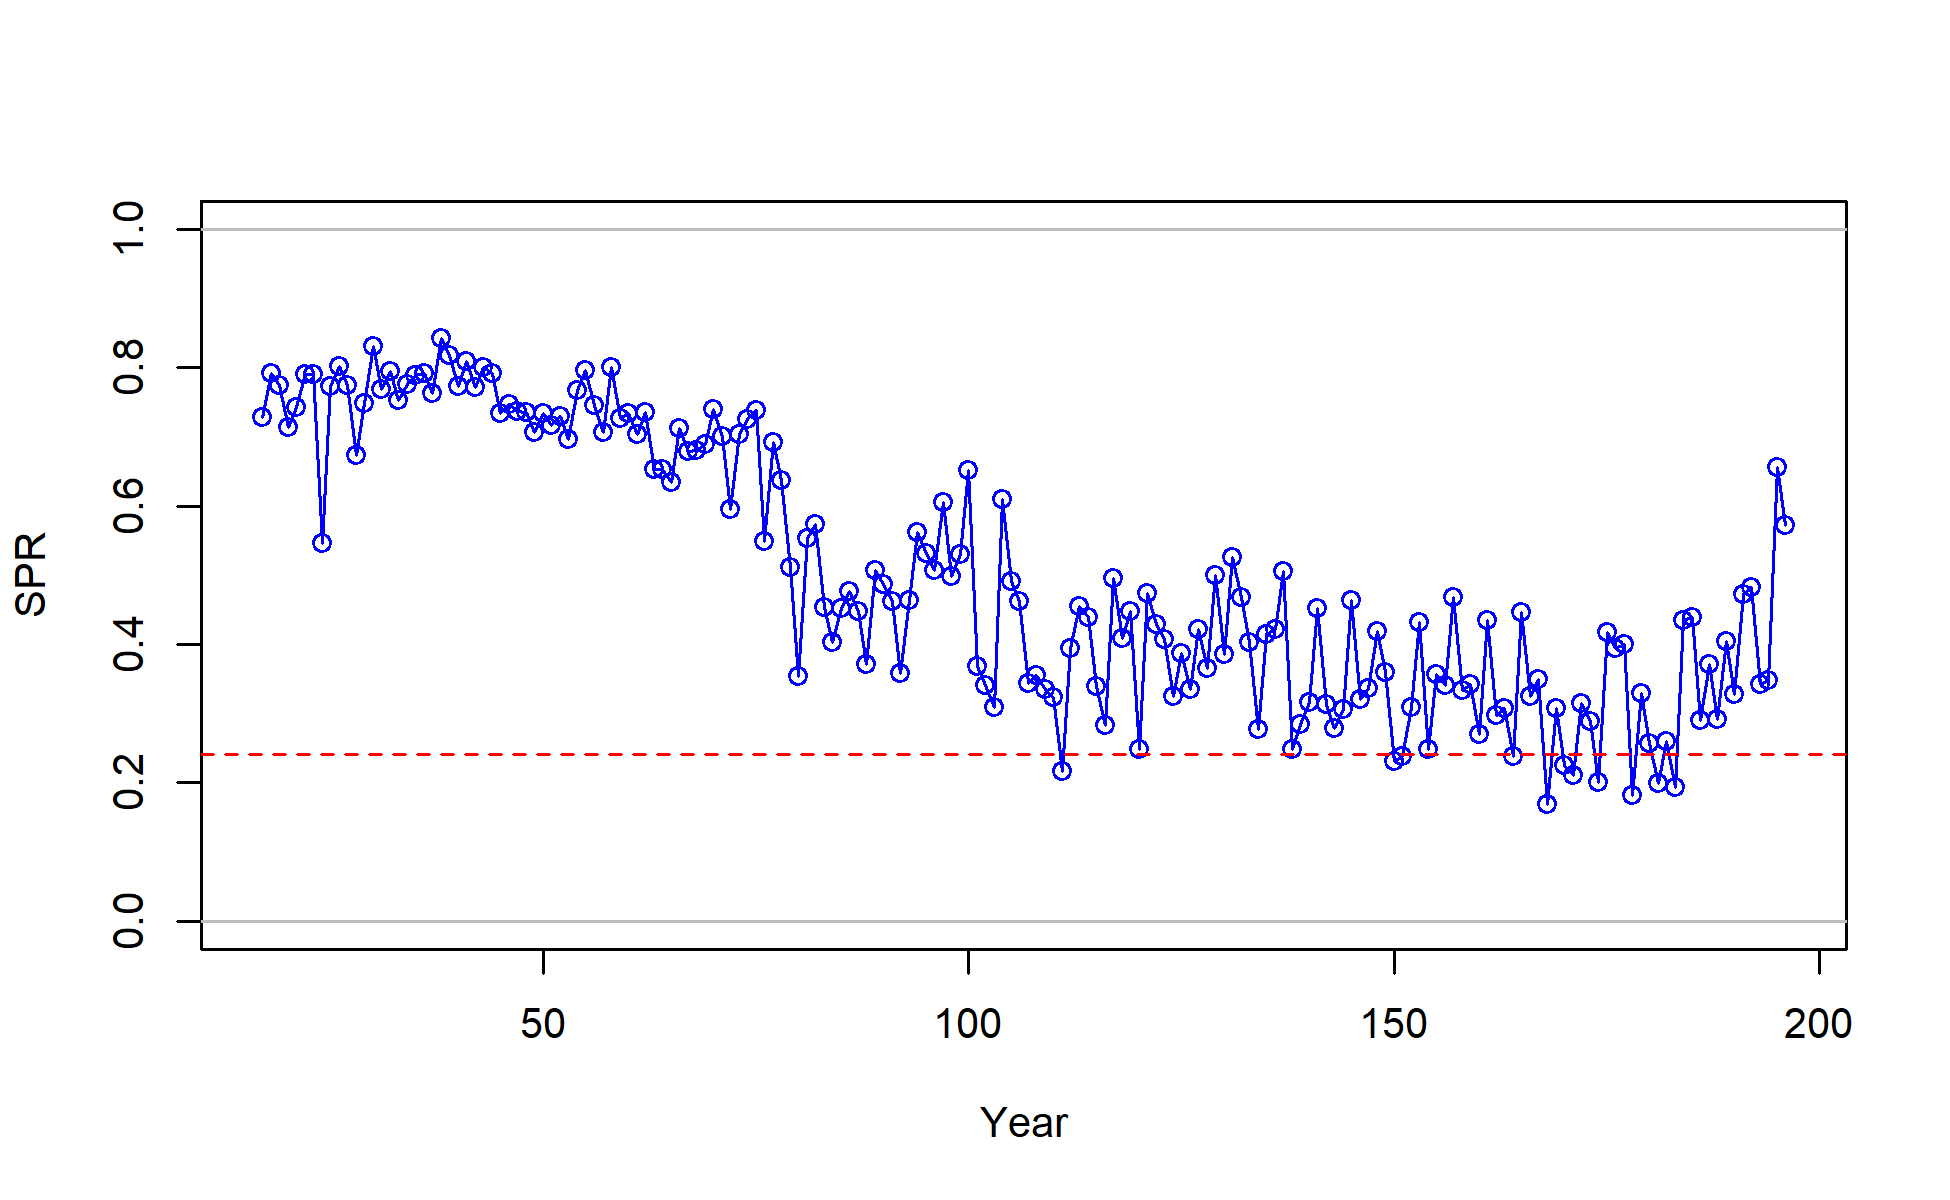
Timeseries of SPR. Horizontal line is at SPR at MSY: 0.241
file: SPR1_series.png
Timeseries of SPR. Horizontal line is at SPR at MSY: 0.241
file: SPR1_series.png
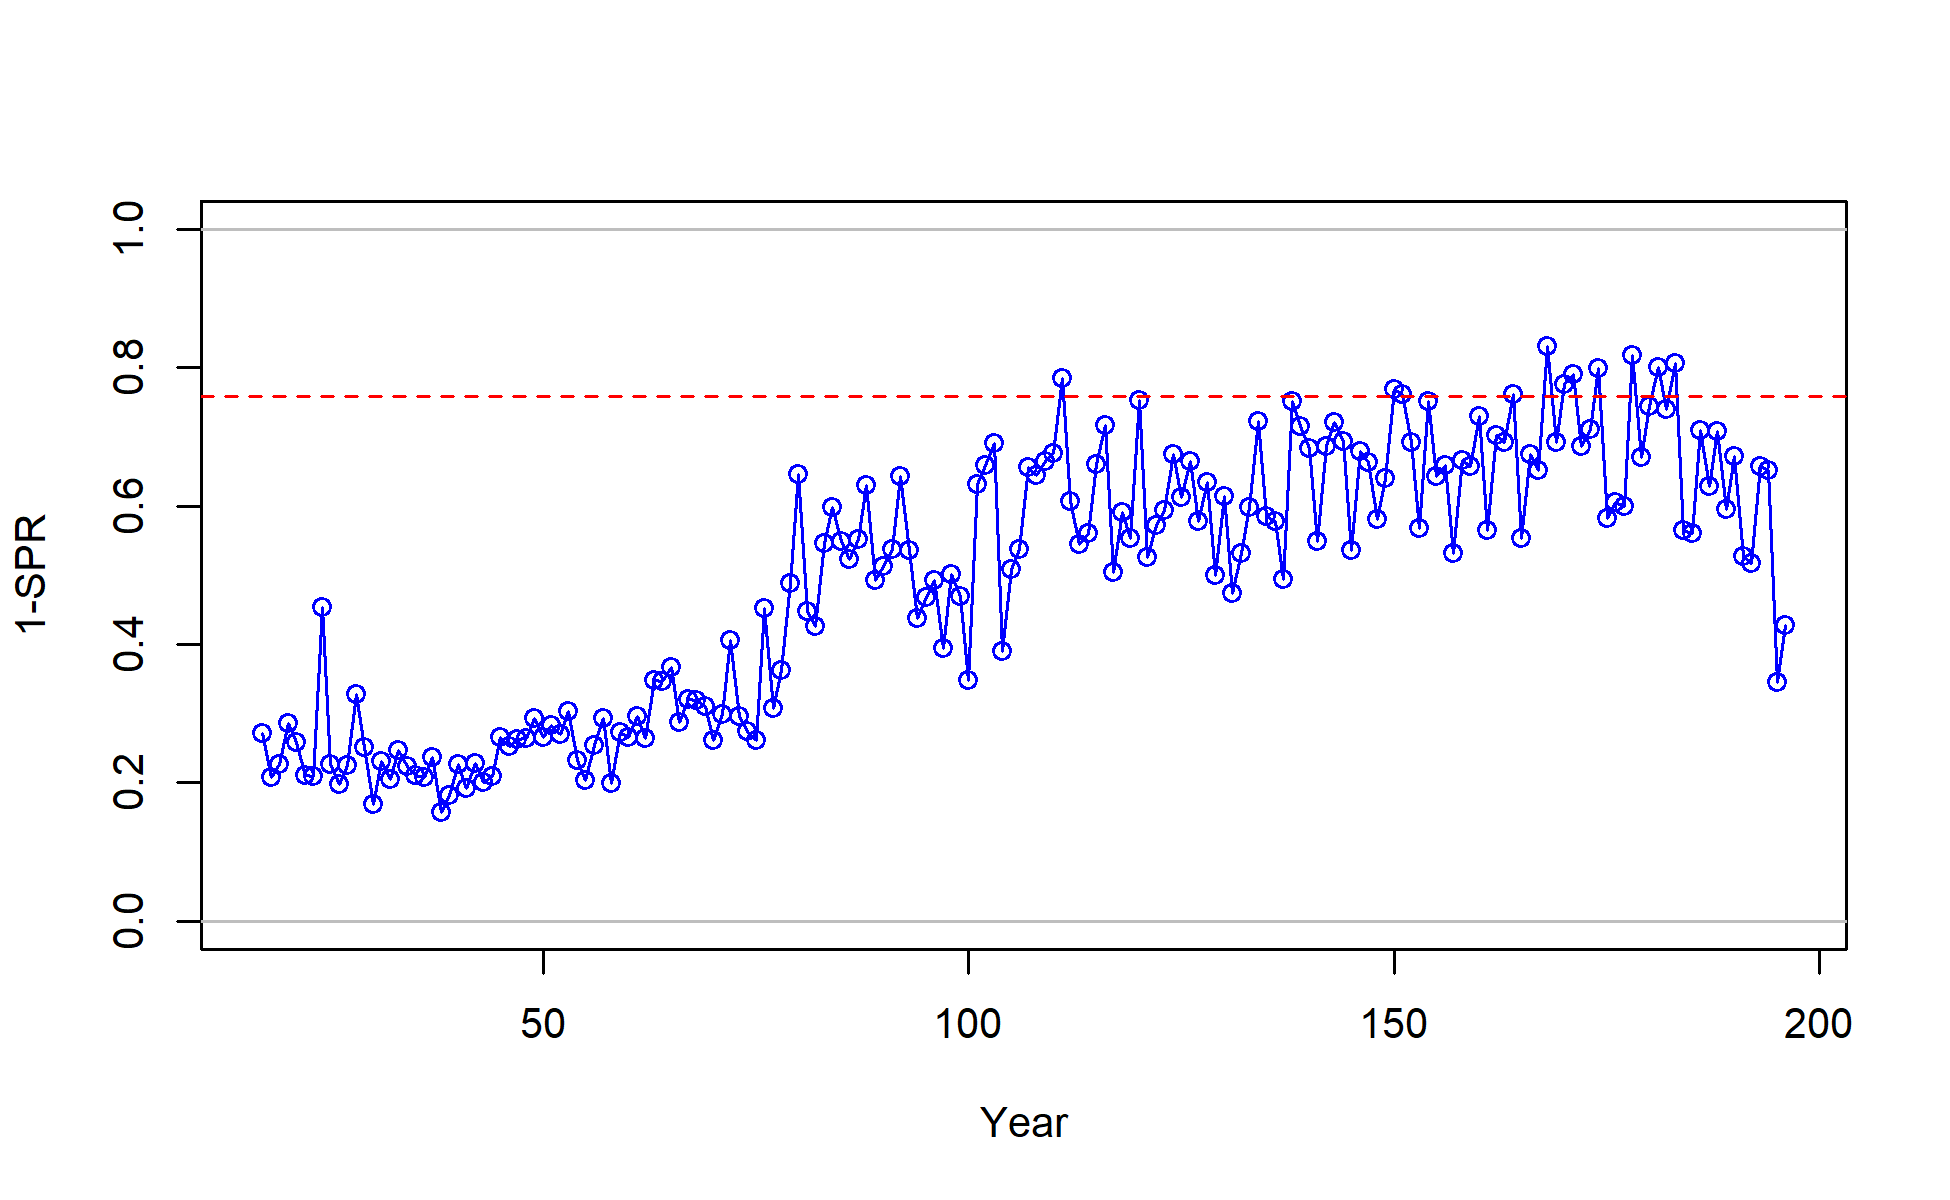
Timeseries of 1-SPR. Horizontal line is at 1 - SPR at MSY: 1 - 0.241 = 0.759
file: SPR2_minusSPRseries.png
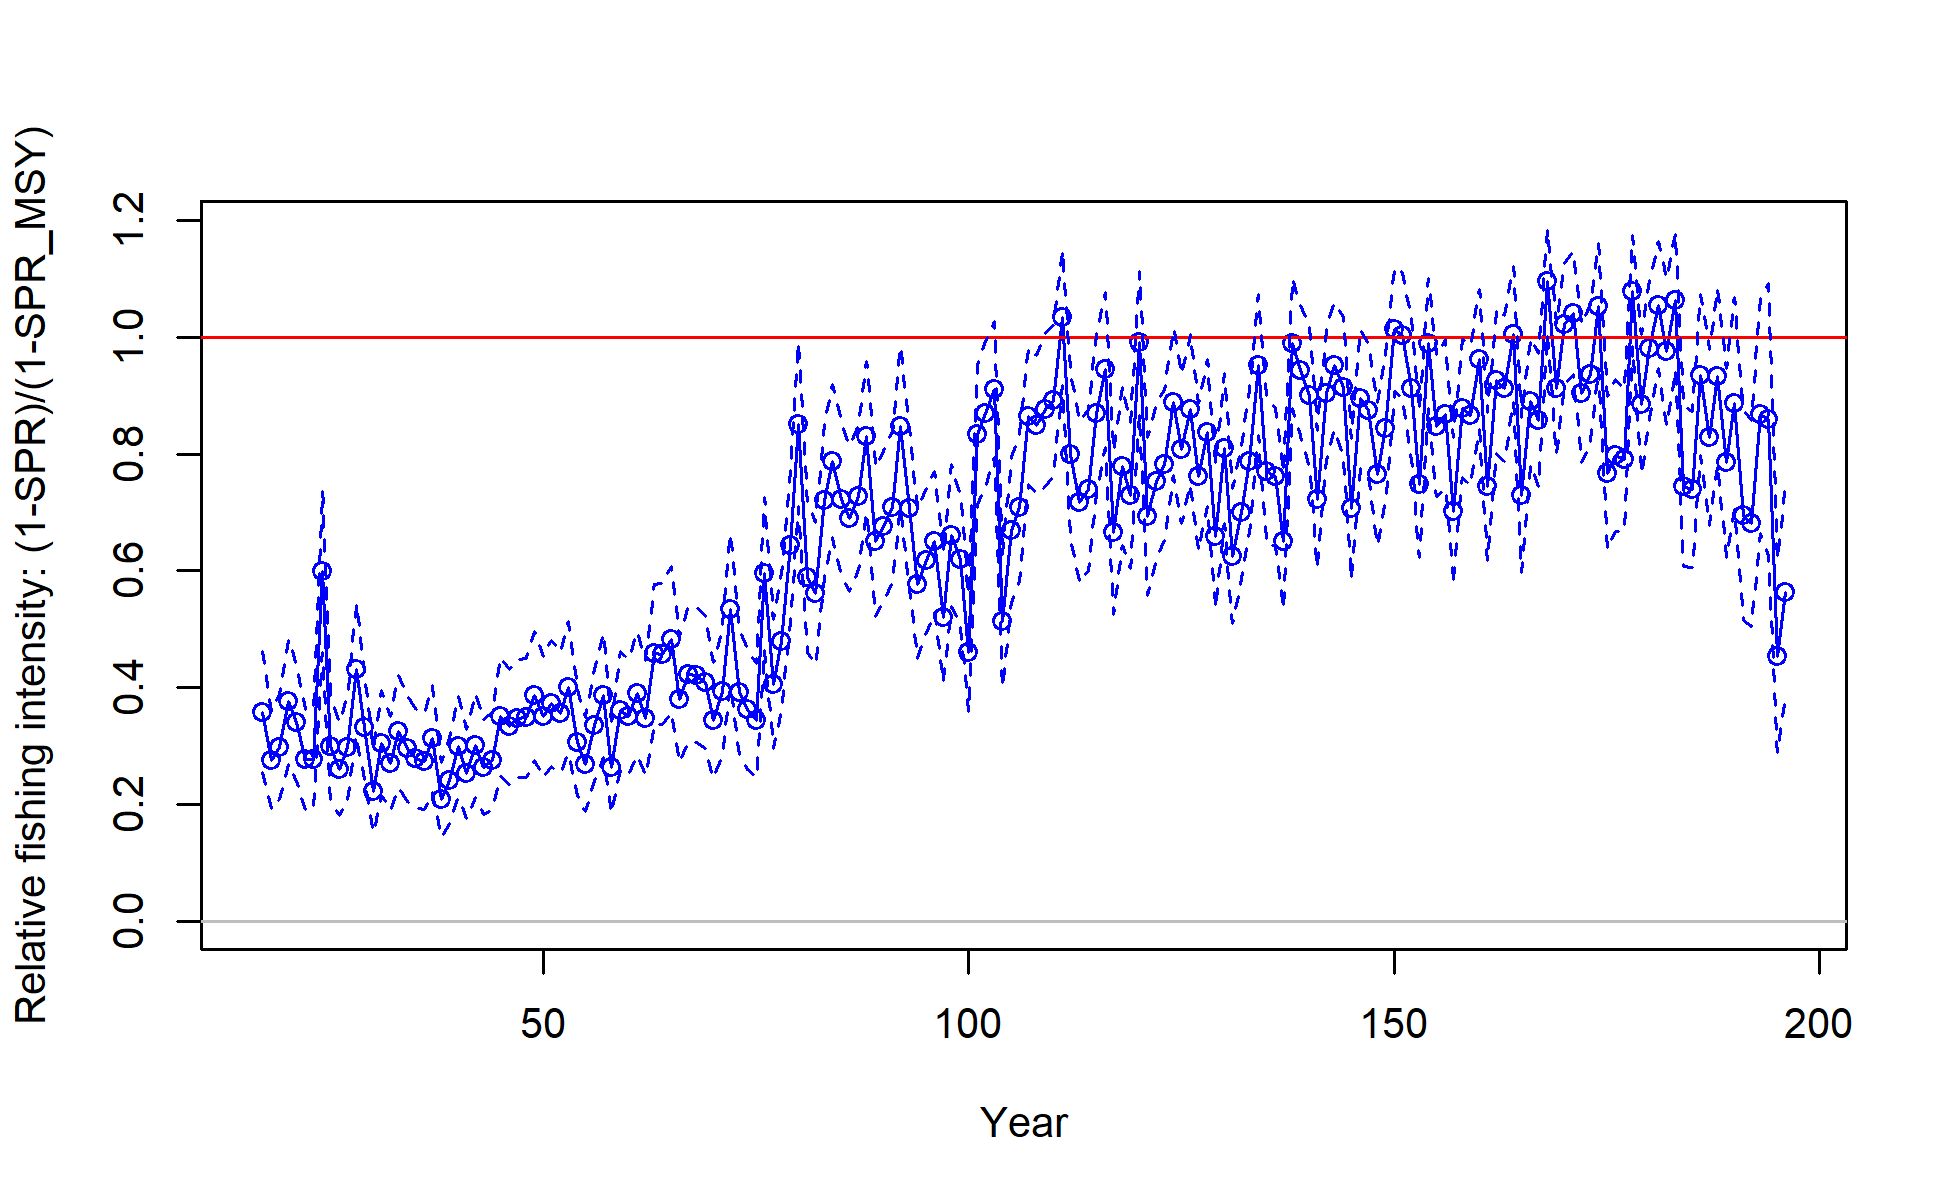
Timeseries of SPR ratio: (1-SPR)/(1-SPR_MSY)
file: SPR3_ratiointerval.png
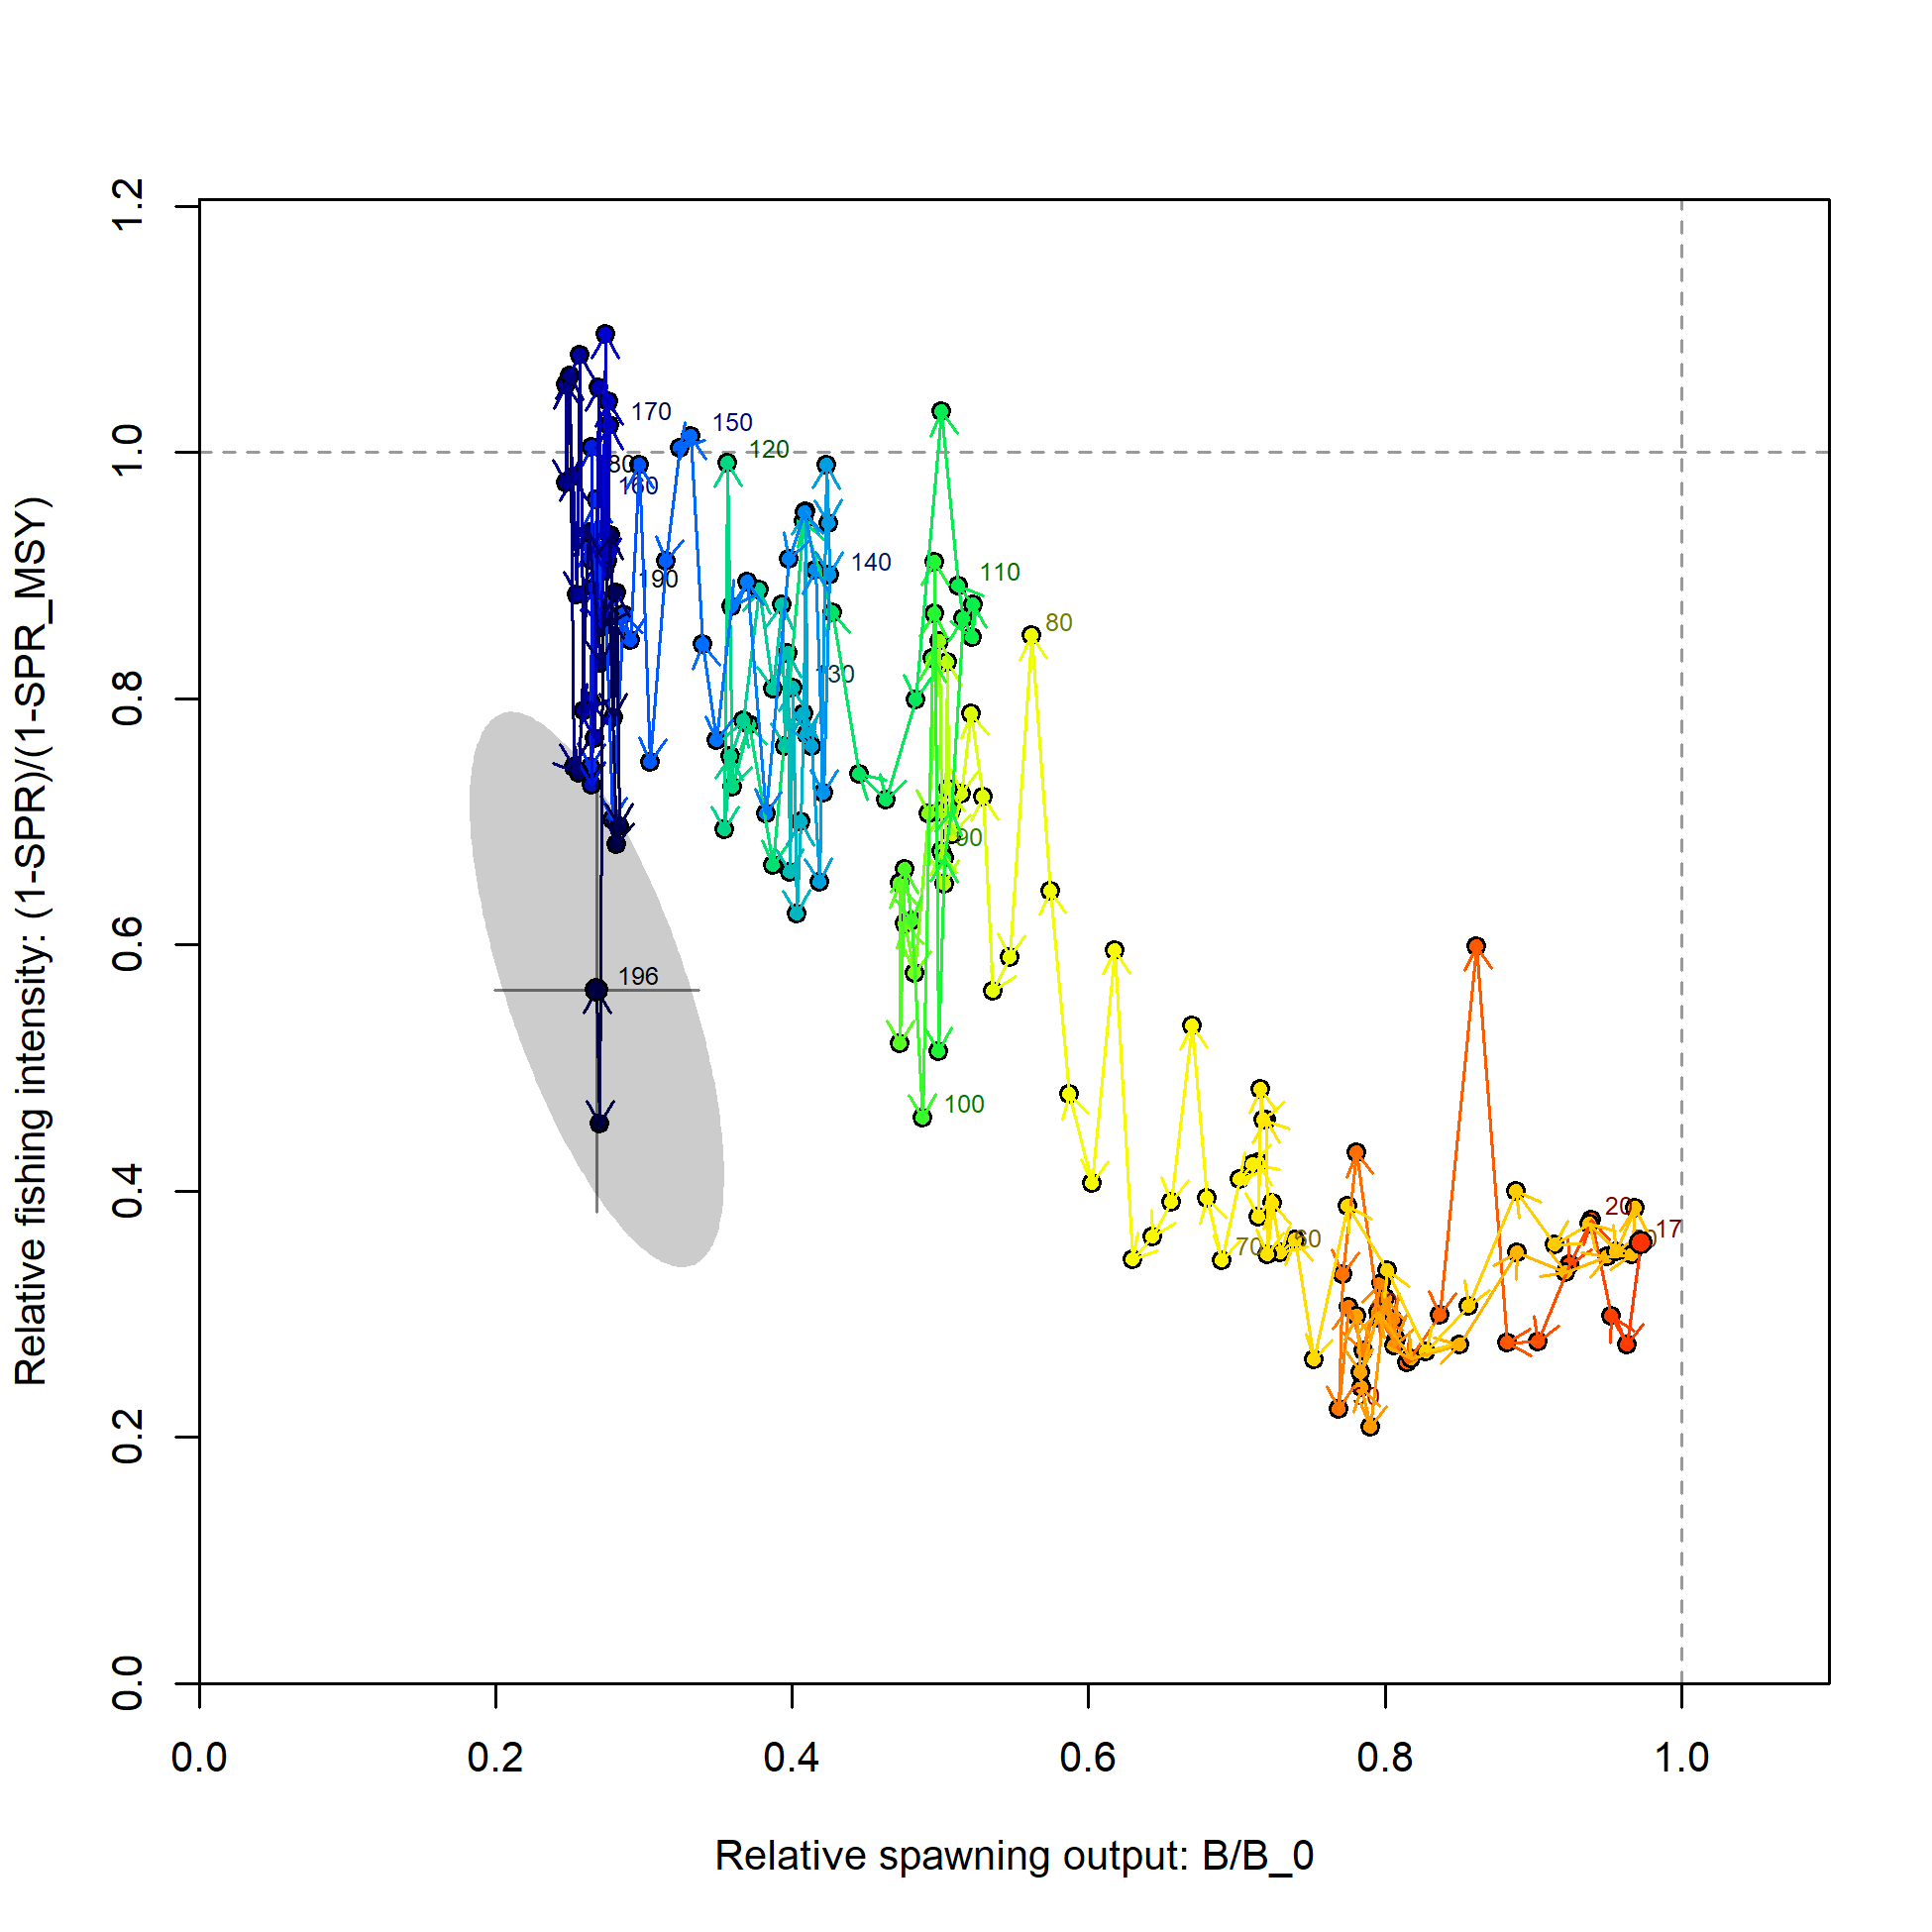
Phase plot of biomass ratio vs. SPR ratio.
Each point represents the biomass ratio at the start of the year and the relative fishing intensity in that same year. Warmer colors (red) represent early years and colder colors (blue) represent recent years. Lines through the final point show 95% intervals based on the asymptotic uncertainty for each dimension. The shaded ellipse is a 95% region which accounts for the estimated correlation between the two quantities: -0.672.
file: SPR4_phase.png