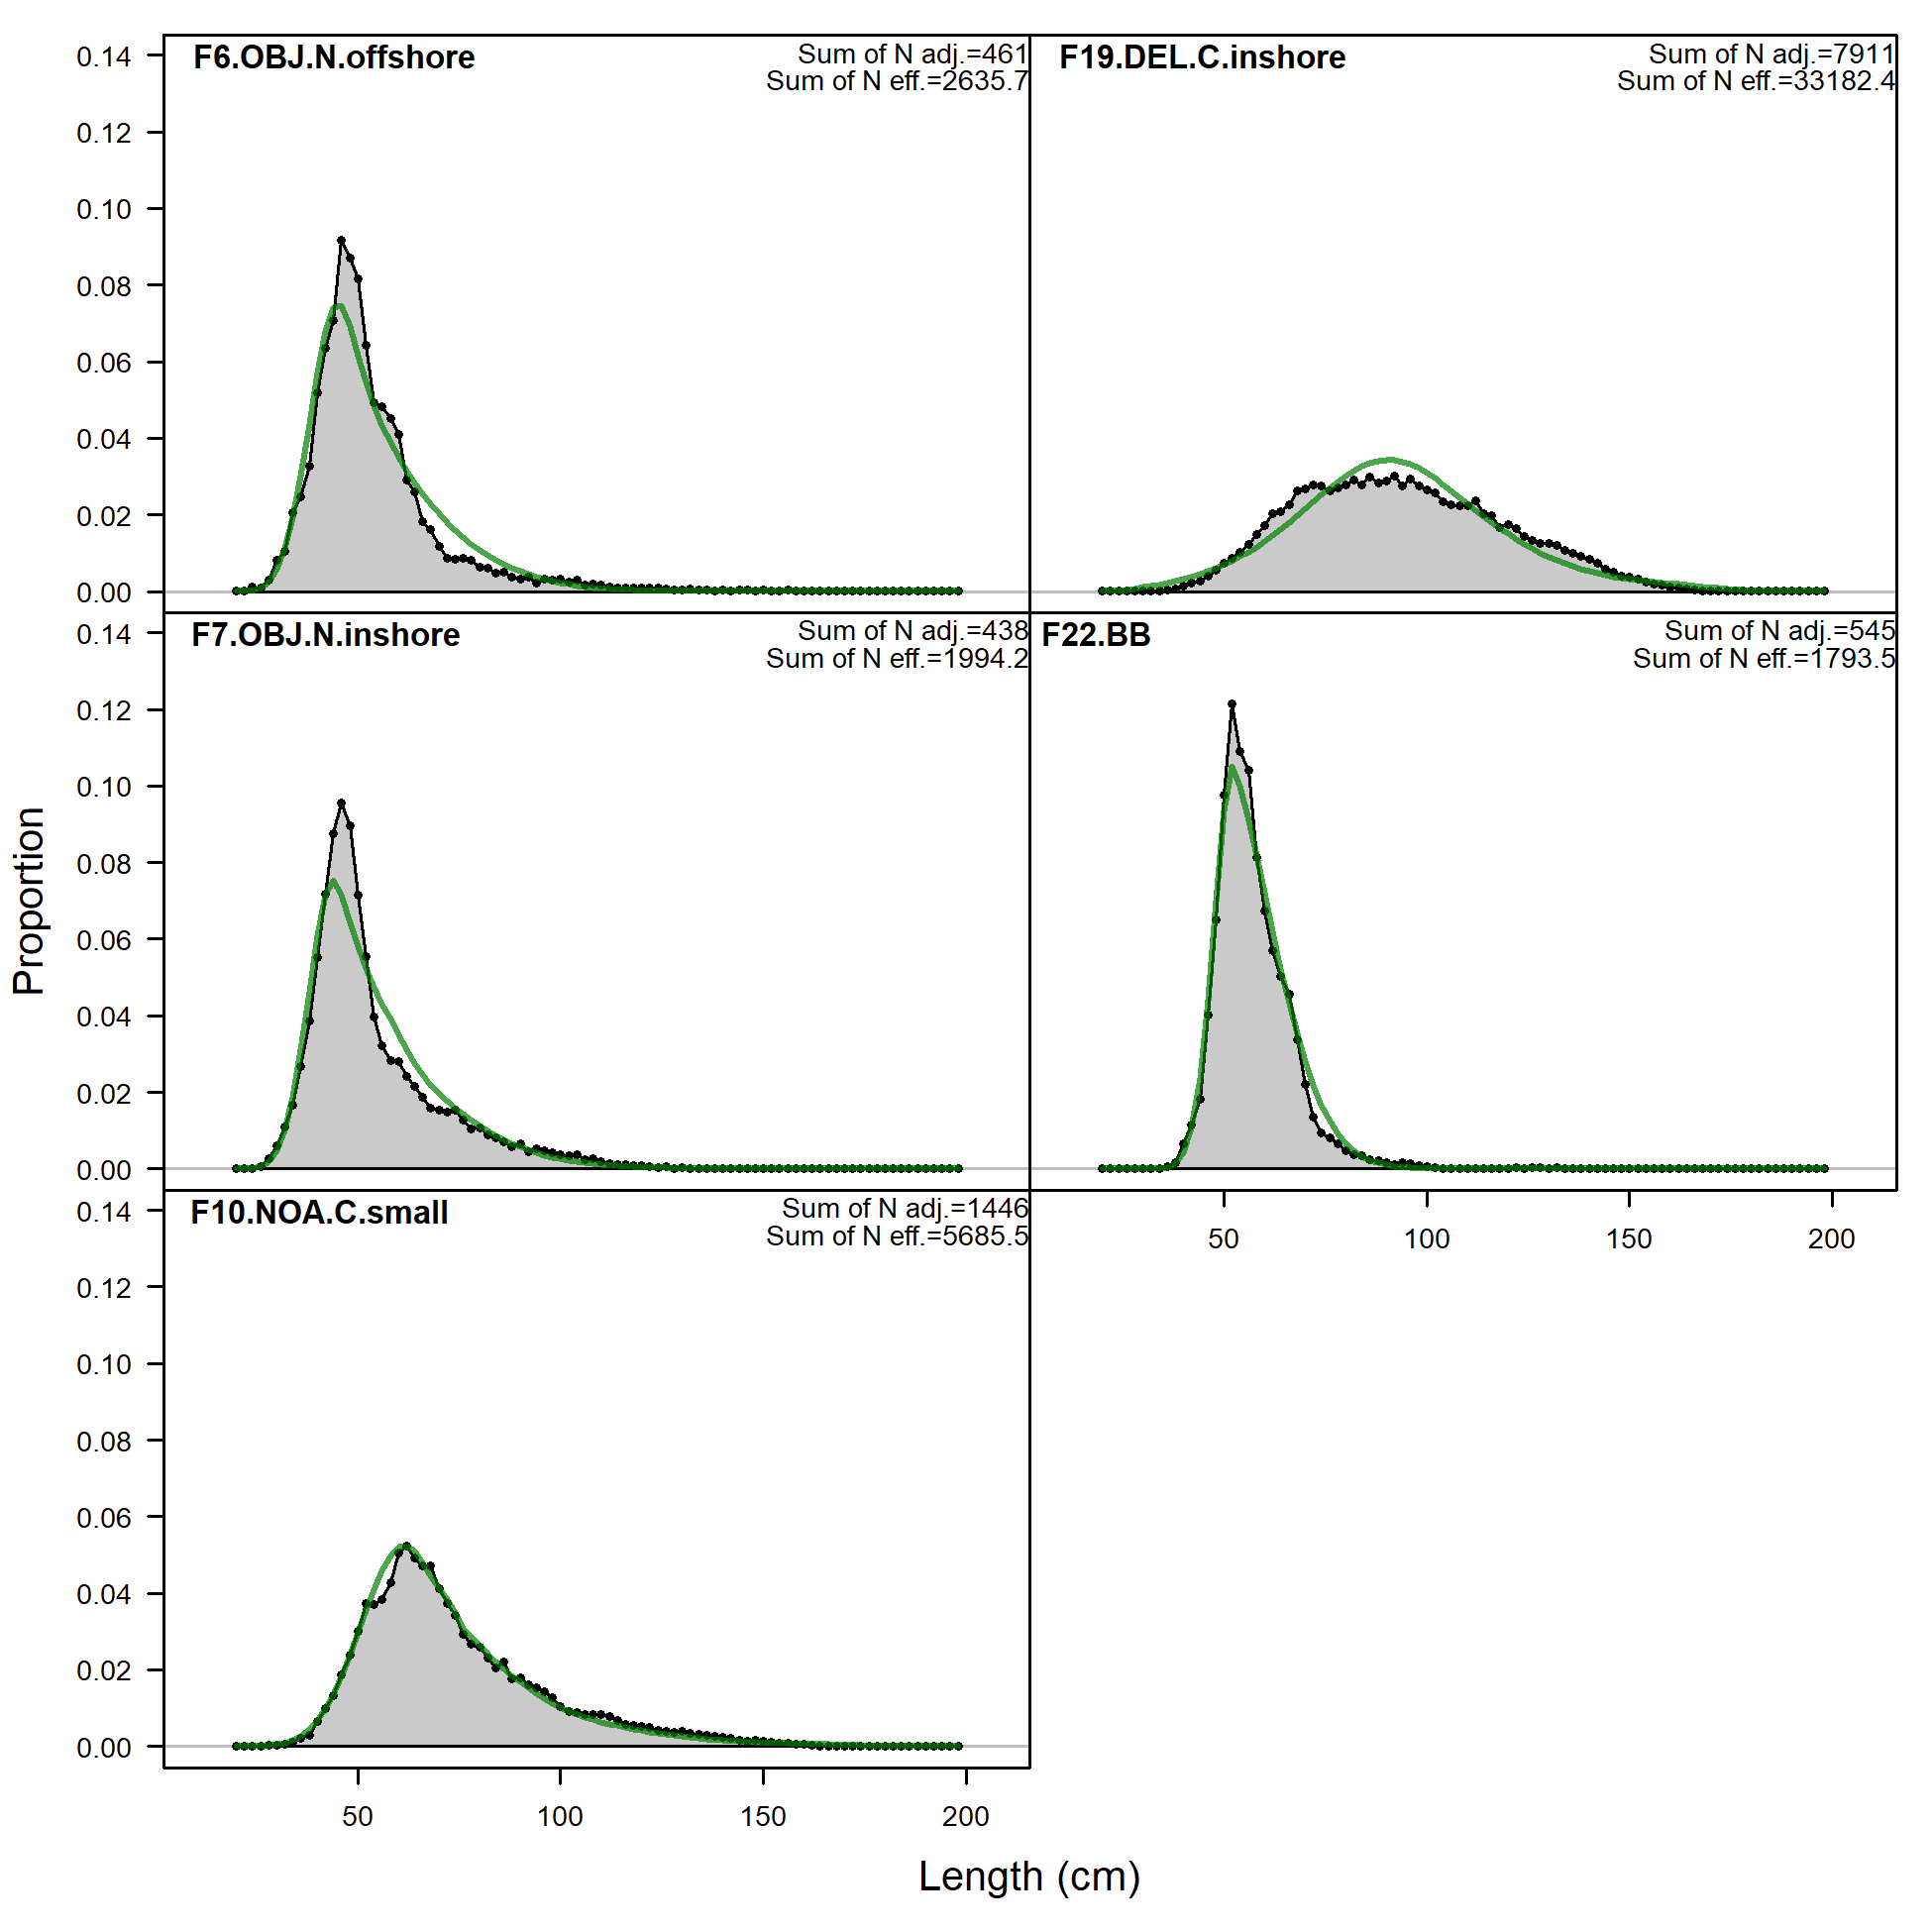
Length comps, aggregated across time by fleet.
Labels 'retained' and 'discard' indicate discarded or retained sampled for each fleet. Panels without this designation represent the whole catch.
file: comp_lenfit__aggregated_across_time.png
Length comps, aggregated across time by fleet.
Labels 'retained' and 'discard' indicate discarded or retained sampled for each fleet. Panels without this designation represent the whole catch.
file: comp_lenfit__aggregated_across_time.png
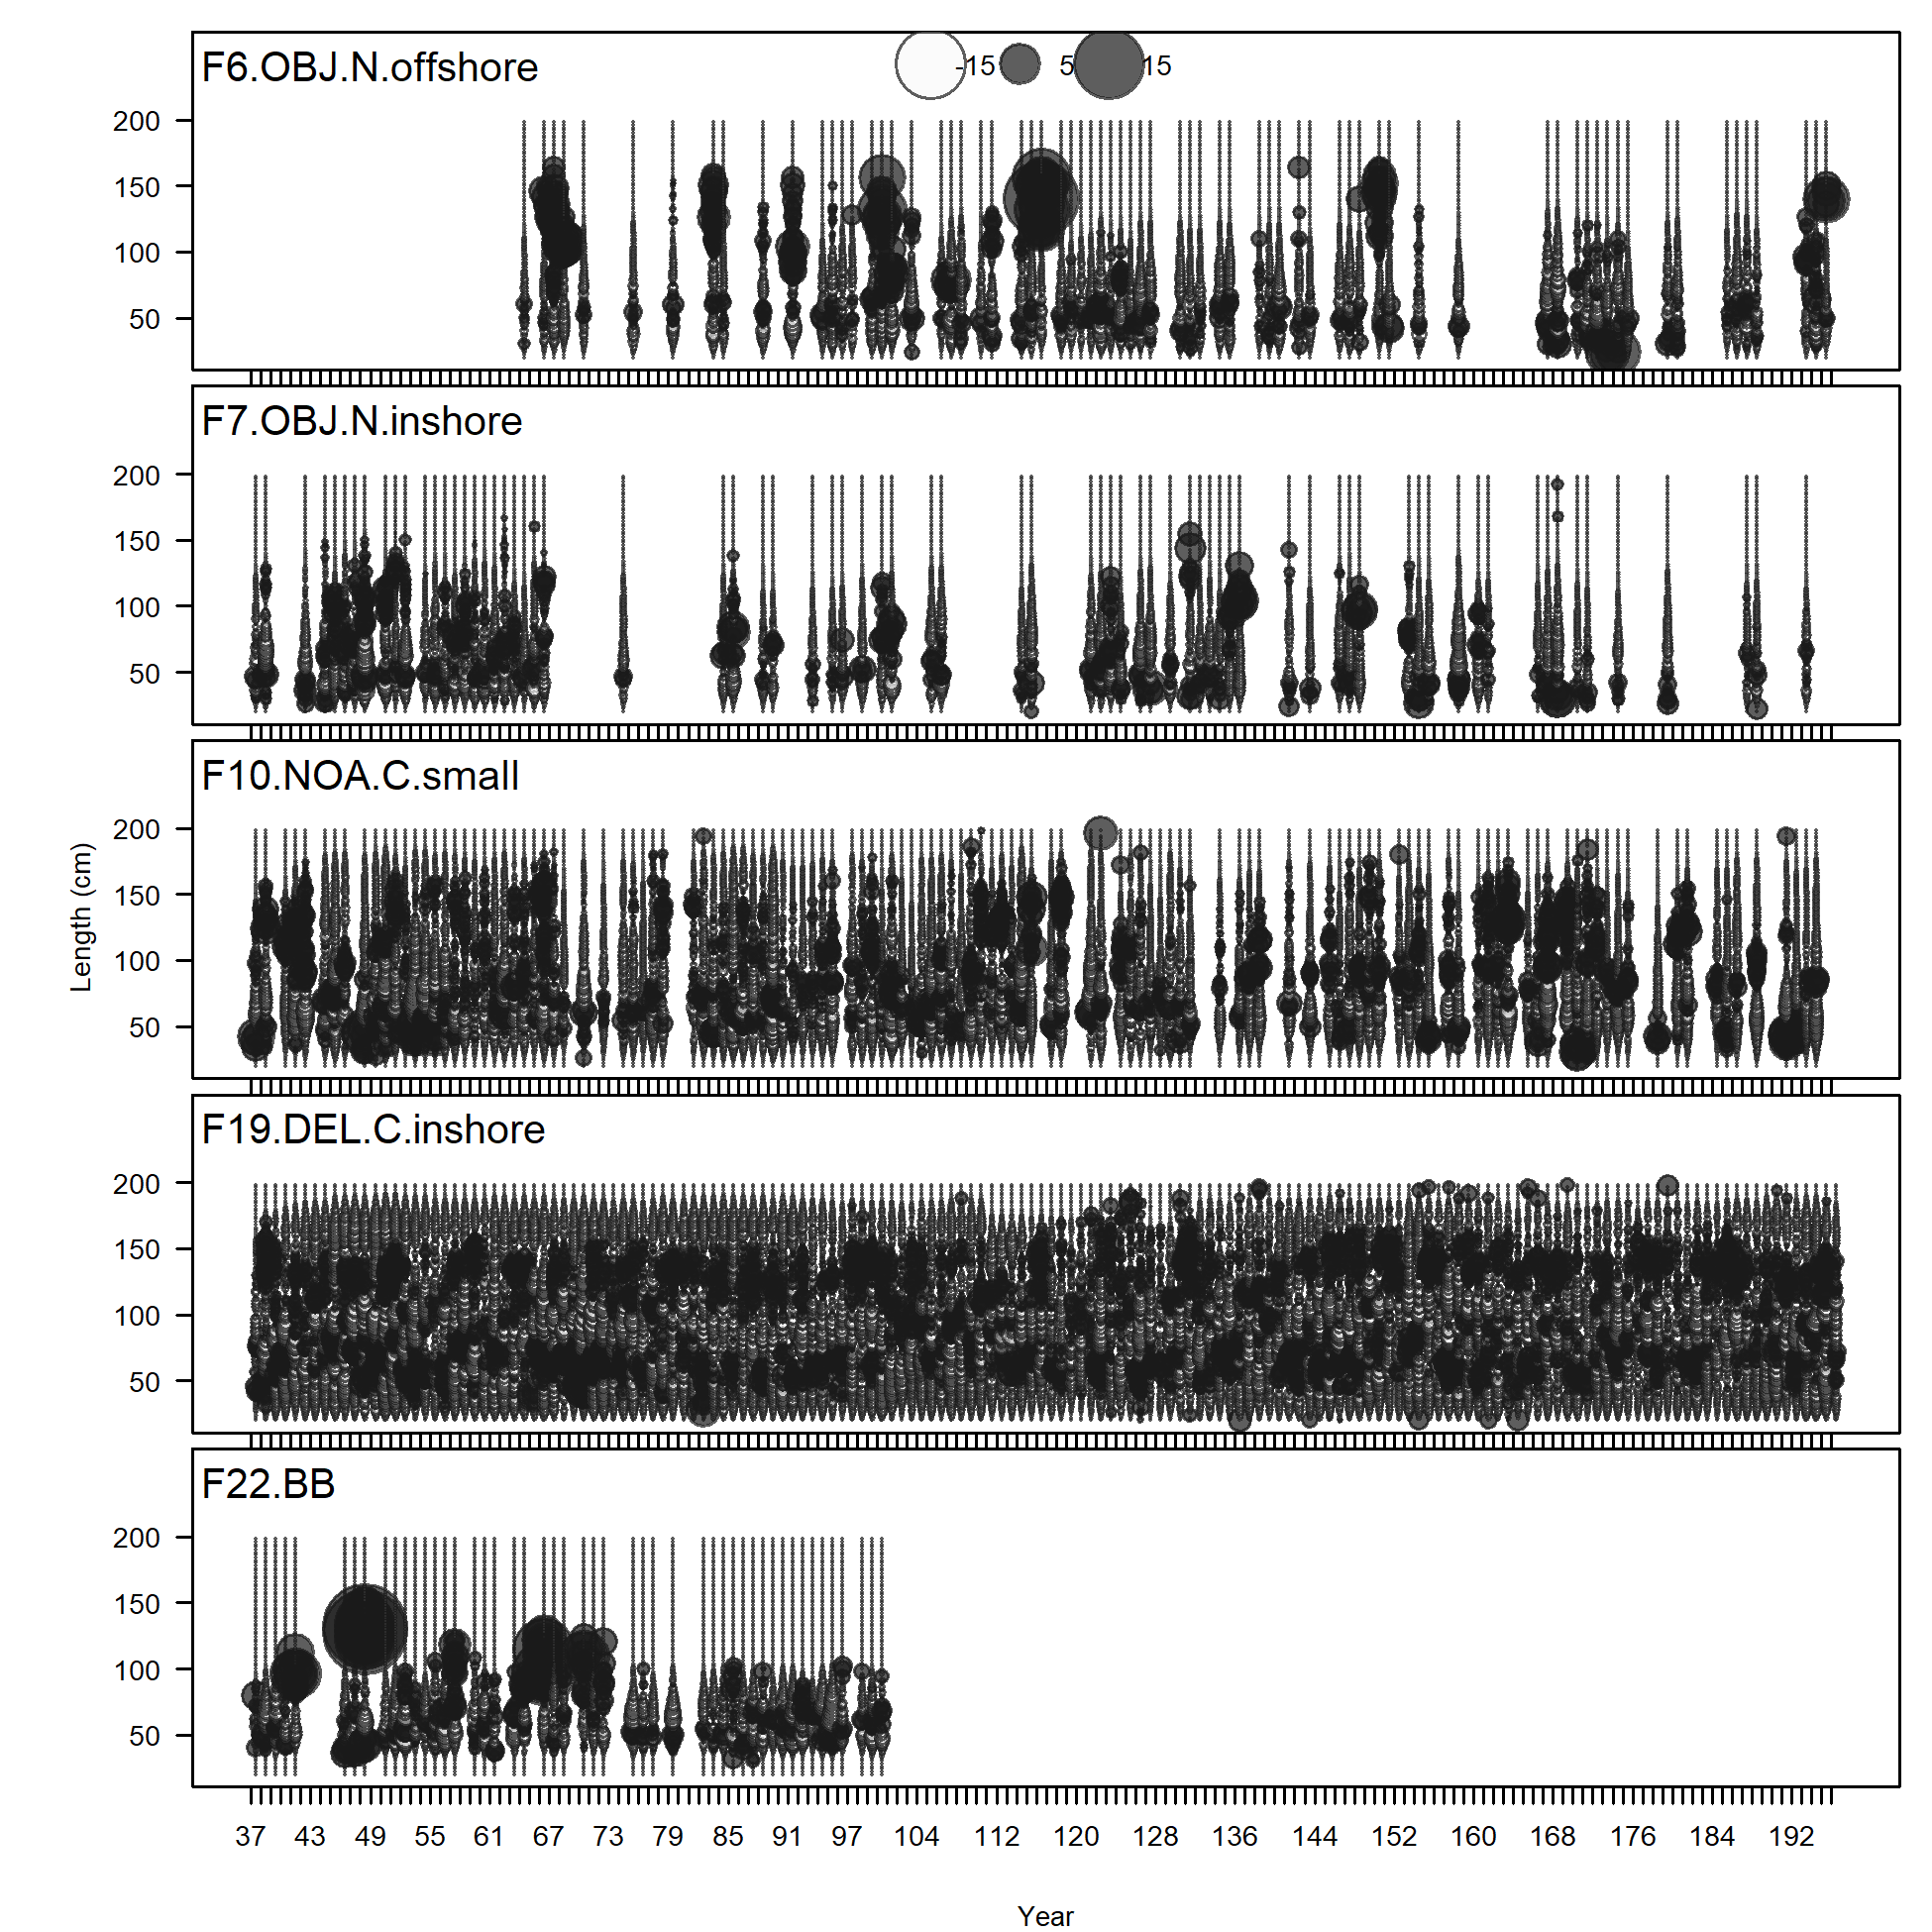
Pearson residuals, comparing across fleets
Closed bubbles are positive residuals (observed > expected) and open bubbles are negative residuals (observed < expected).
file: comp_lenfit__multi-fleet_comparison.png
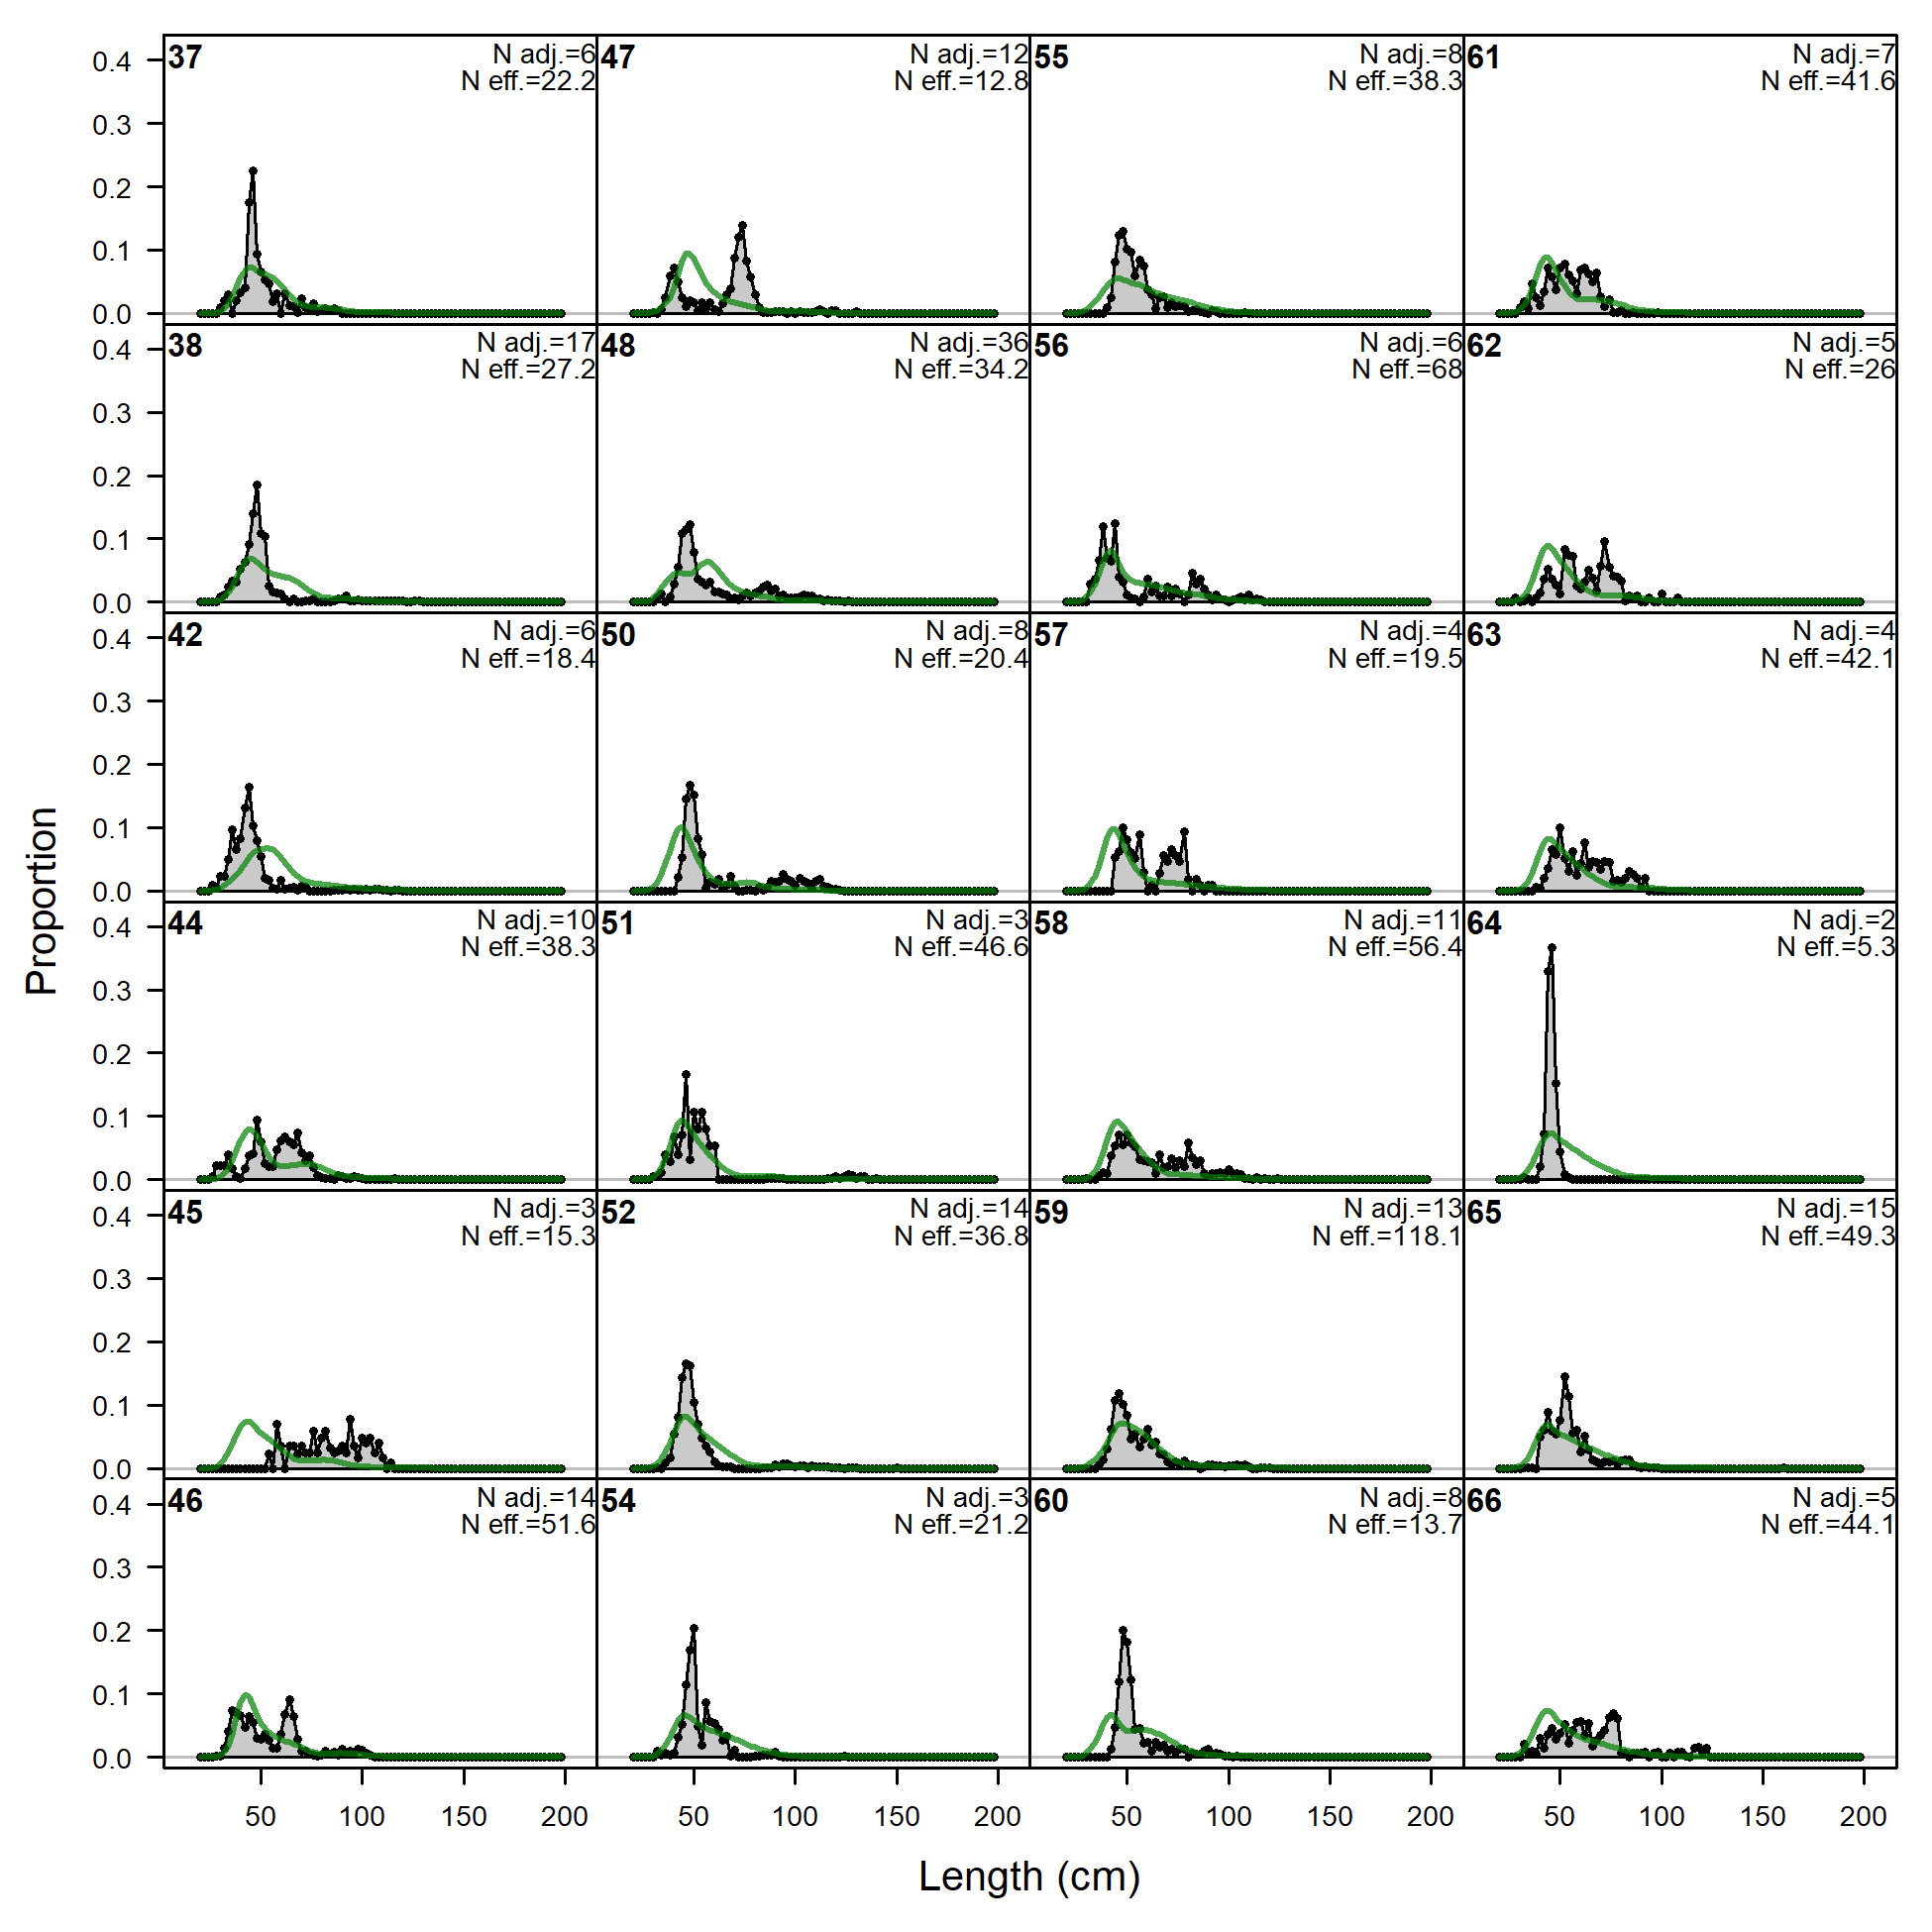
Length comps, whole catch, F6.OBJ.N.offshore (plot 1 of 3).
'N adj.' is the input sample size after data-weighting adjustment. N eff. is the calculated effective sample size used in the McAllister-Ianelli tuning method.
file: comp_lenfit_flt6mkt0_page1.png

Length comps, whole catch, F6.OBJ.N.offshore (plot 1 of 3).
'N adj.' is the input sample size after data-weighting adjustment. N eff. is the calculated effective sample size used in the McAllister-Ianelli tuning method. (plot 2 of 3)
file: comp_lenfit_flt6mkt0_page2.png
Length comps, whole catch, F6.OBJ.N.offshore (plot 1 of 3).
'N adj.' is the input sample size after data-weighting adjustment. N eff. is the calculated effective sample size used in the McAllister-Ianelli tuning method. (plot 2 of 3) (plot 3 of 3)
file: comp_lenfit_flt6mkt0_page3.png
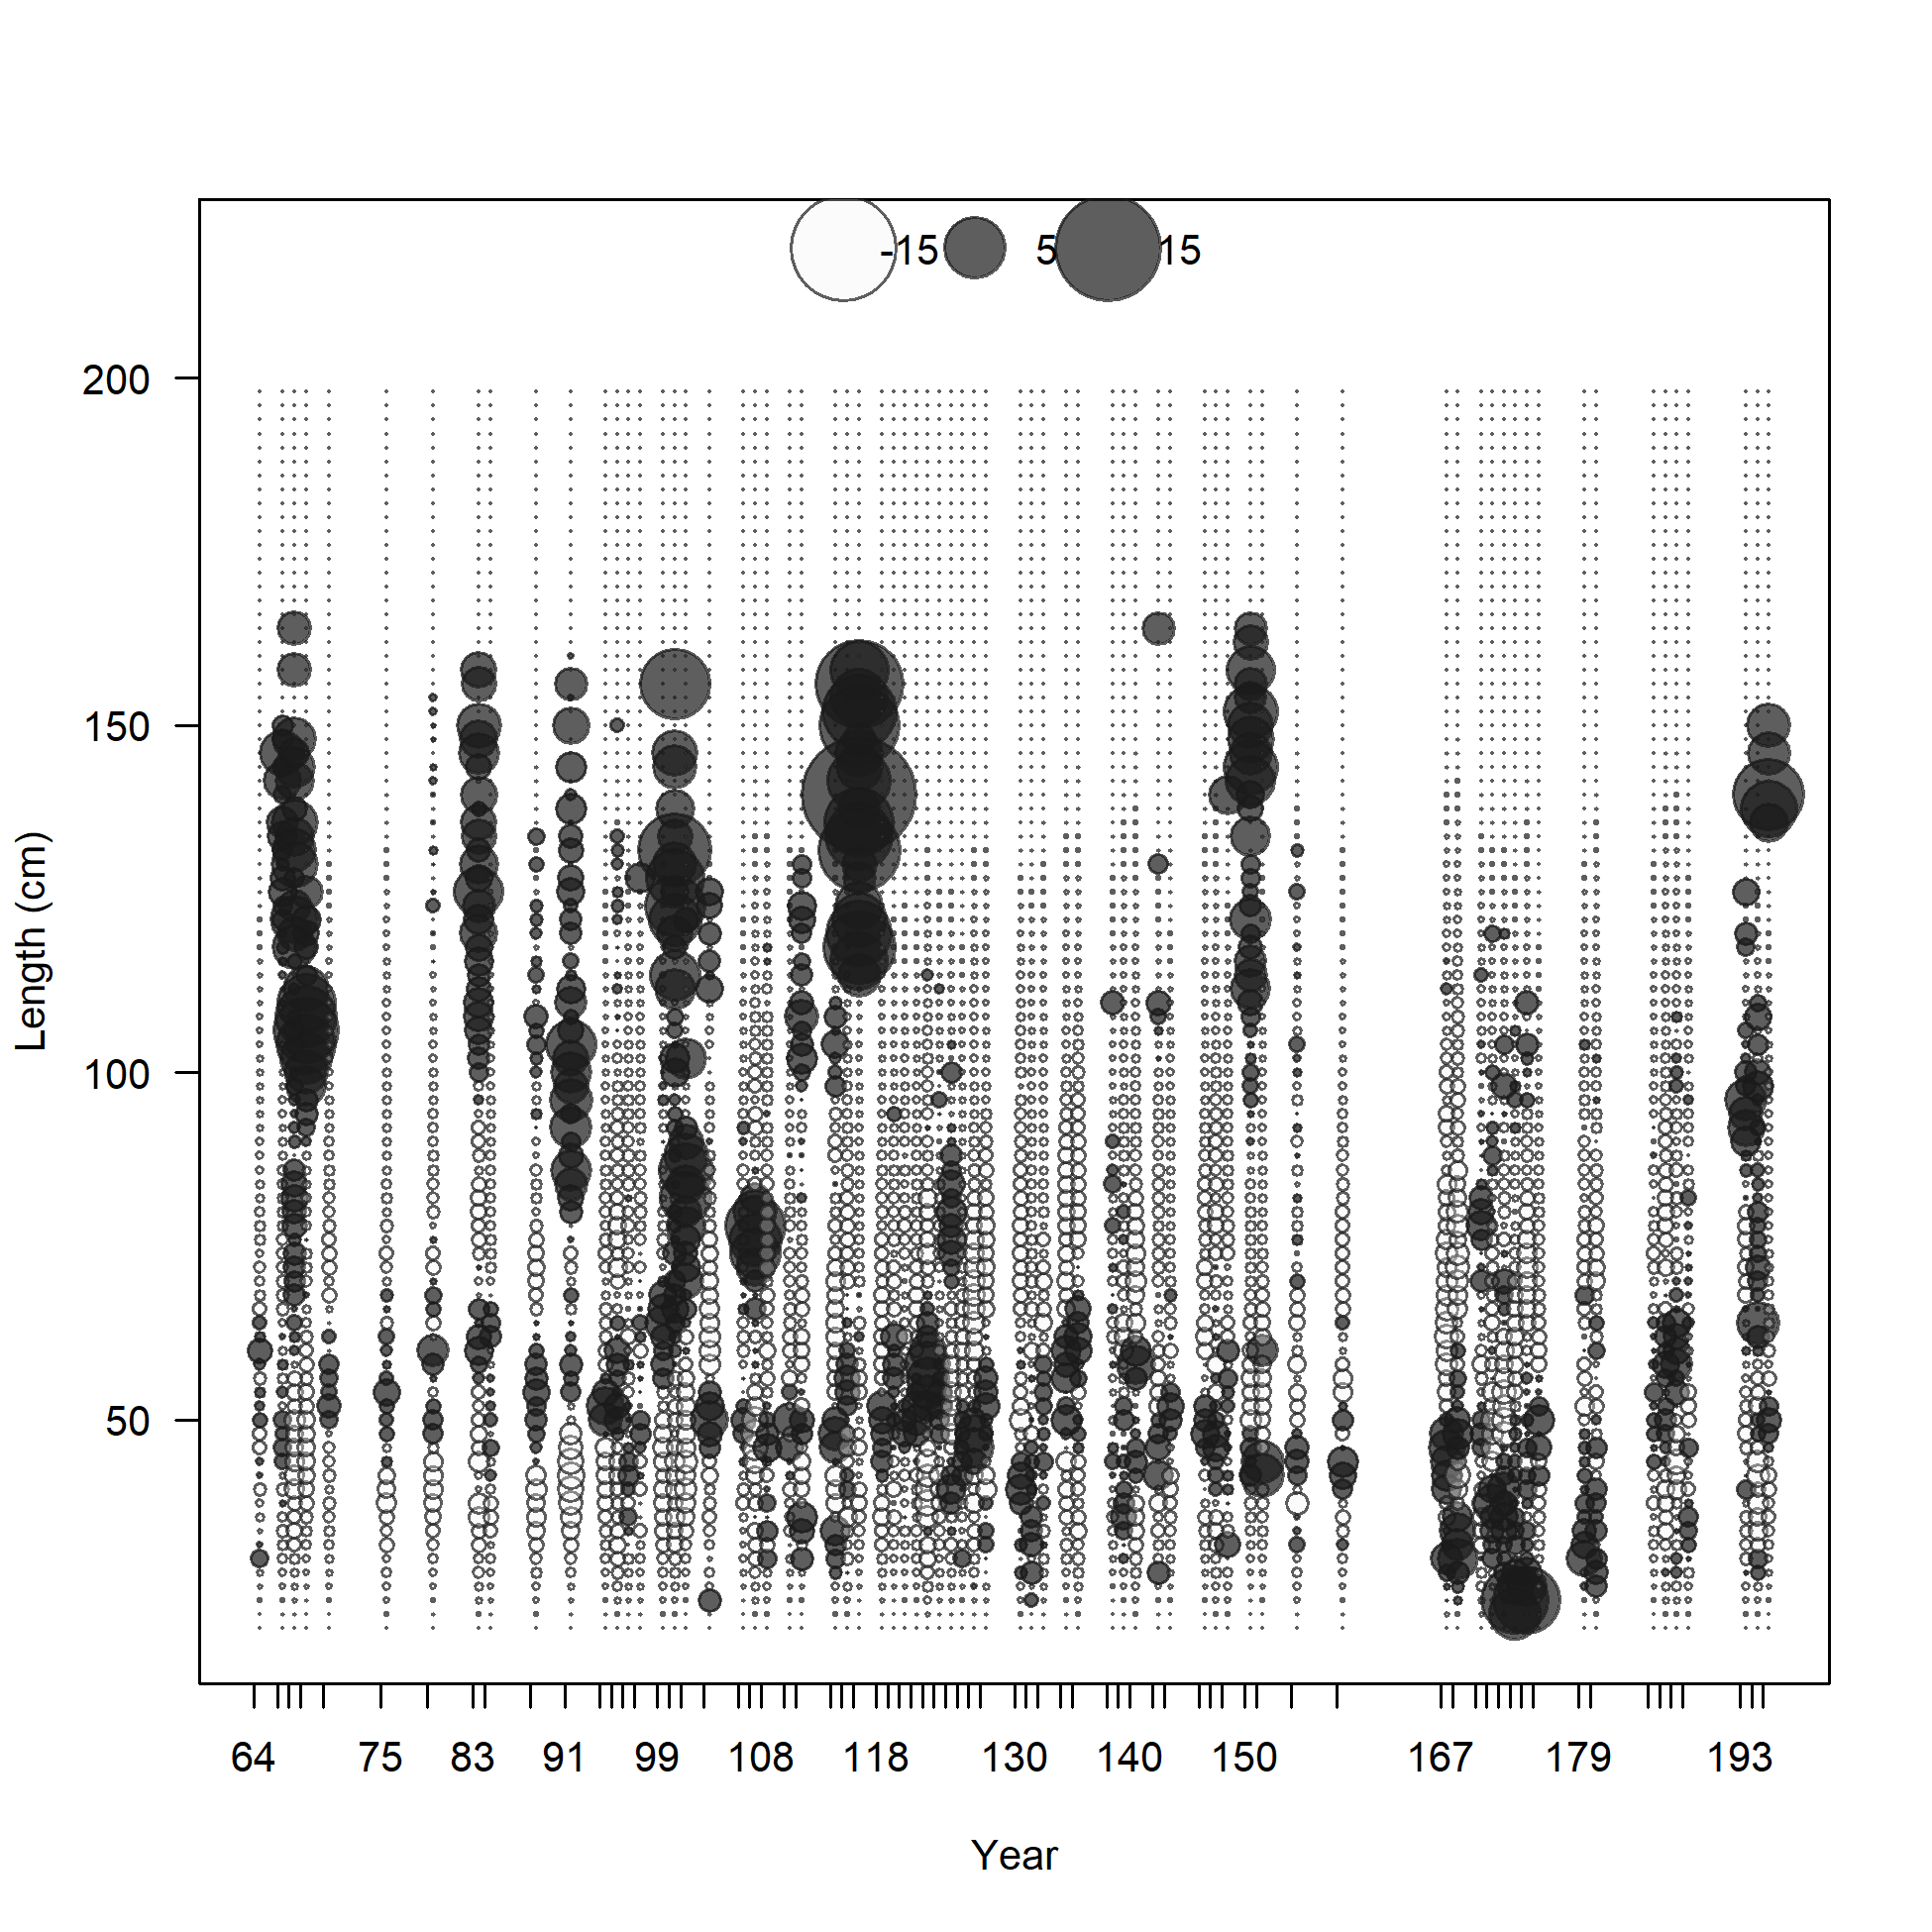
Pearson residuals, whole catch, F6.OBJ.N.offshore (max=17.53) (plot 3 of 3)
Closed bubbles are positive residuals (observed > expected) and open bubbles are negative residuals (observed < expected).
file: comp_lenfit_residsflt6mkt0_page3.png
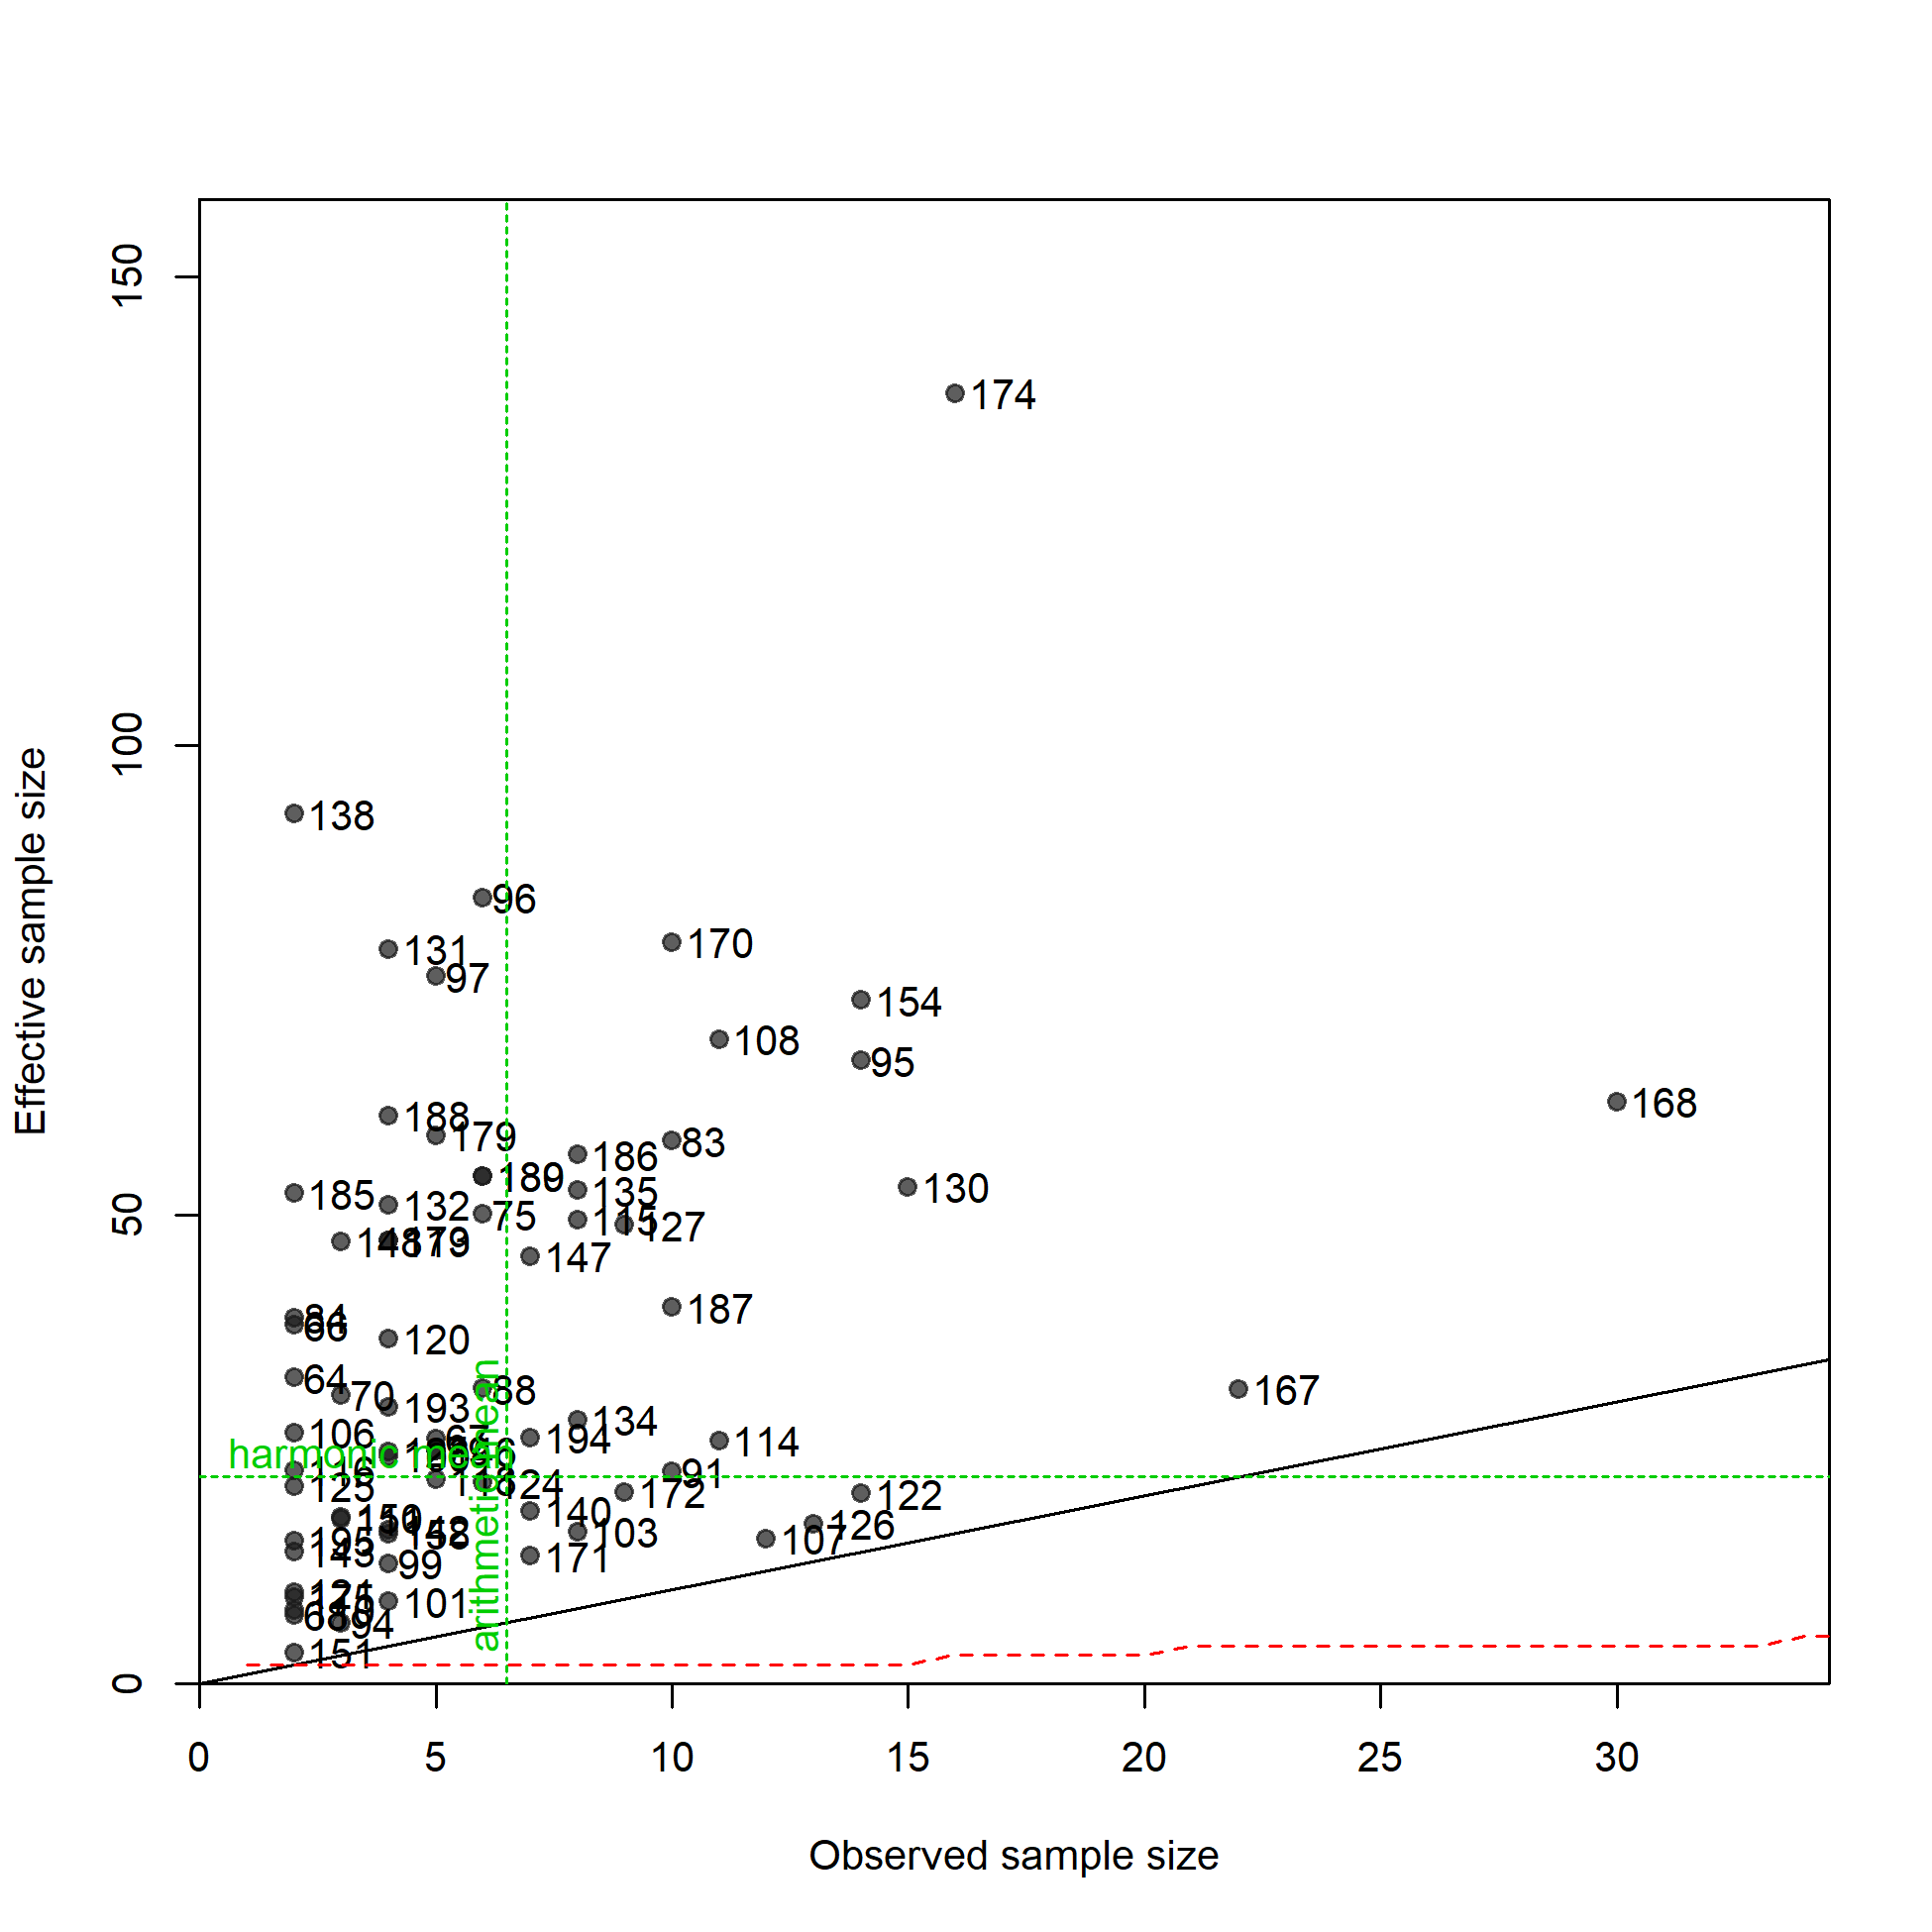
N-EffN comparison, Length comps, whole catch, F6.OBJ.N.offshore
file: comp_lenfit_sampsize_flt6mkt0.png
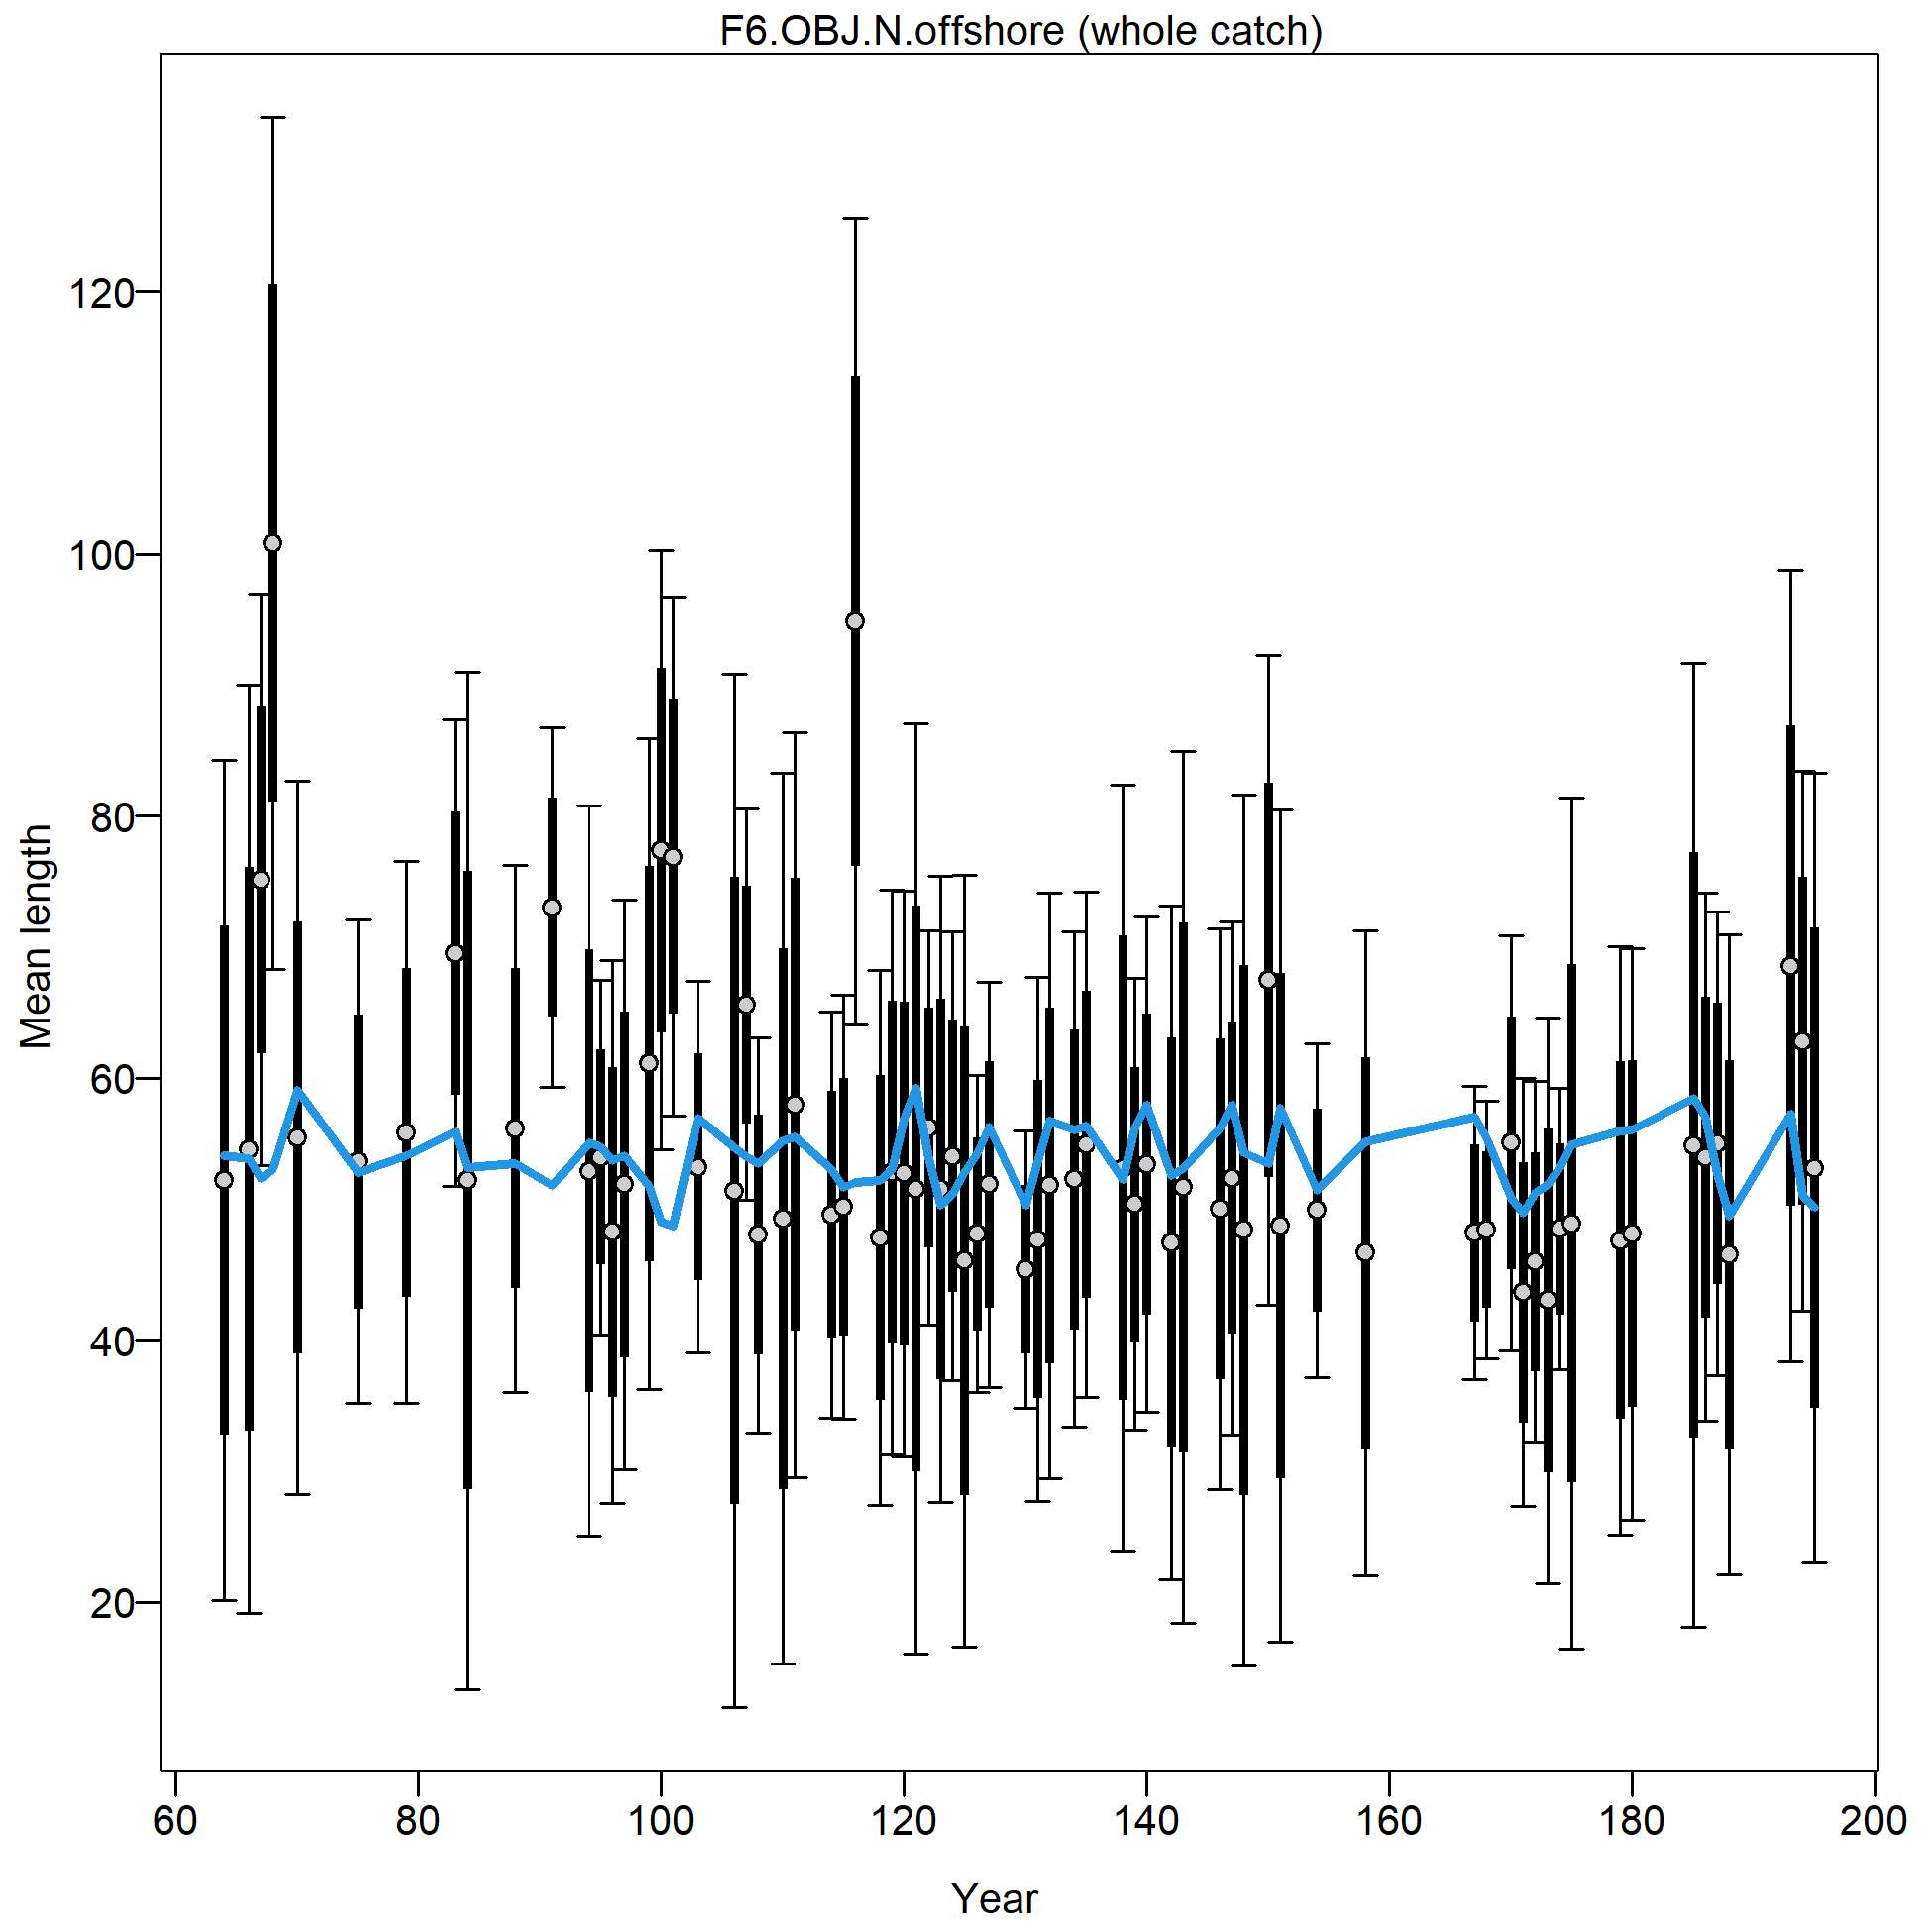
Mean length for F6.OBJ.N.offshore with 95% confidence intervals based on current sample sizes.
Francis data weighting method TA1.8: thinner intervals (with capped ends) show result of further adjusting sample sizes based on suggested multiplier (with 95% interval) for len data from F6.OBJ.N.offshore:
0.3688 (0.2489-0.6798)
For more info, see Francis (2011).
file: comp_lenfit_data_weighting_TA1.8_F6.OBJ.N.offshore.png
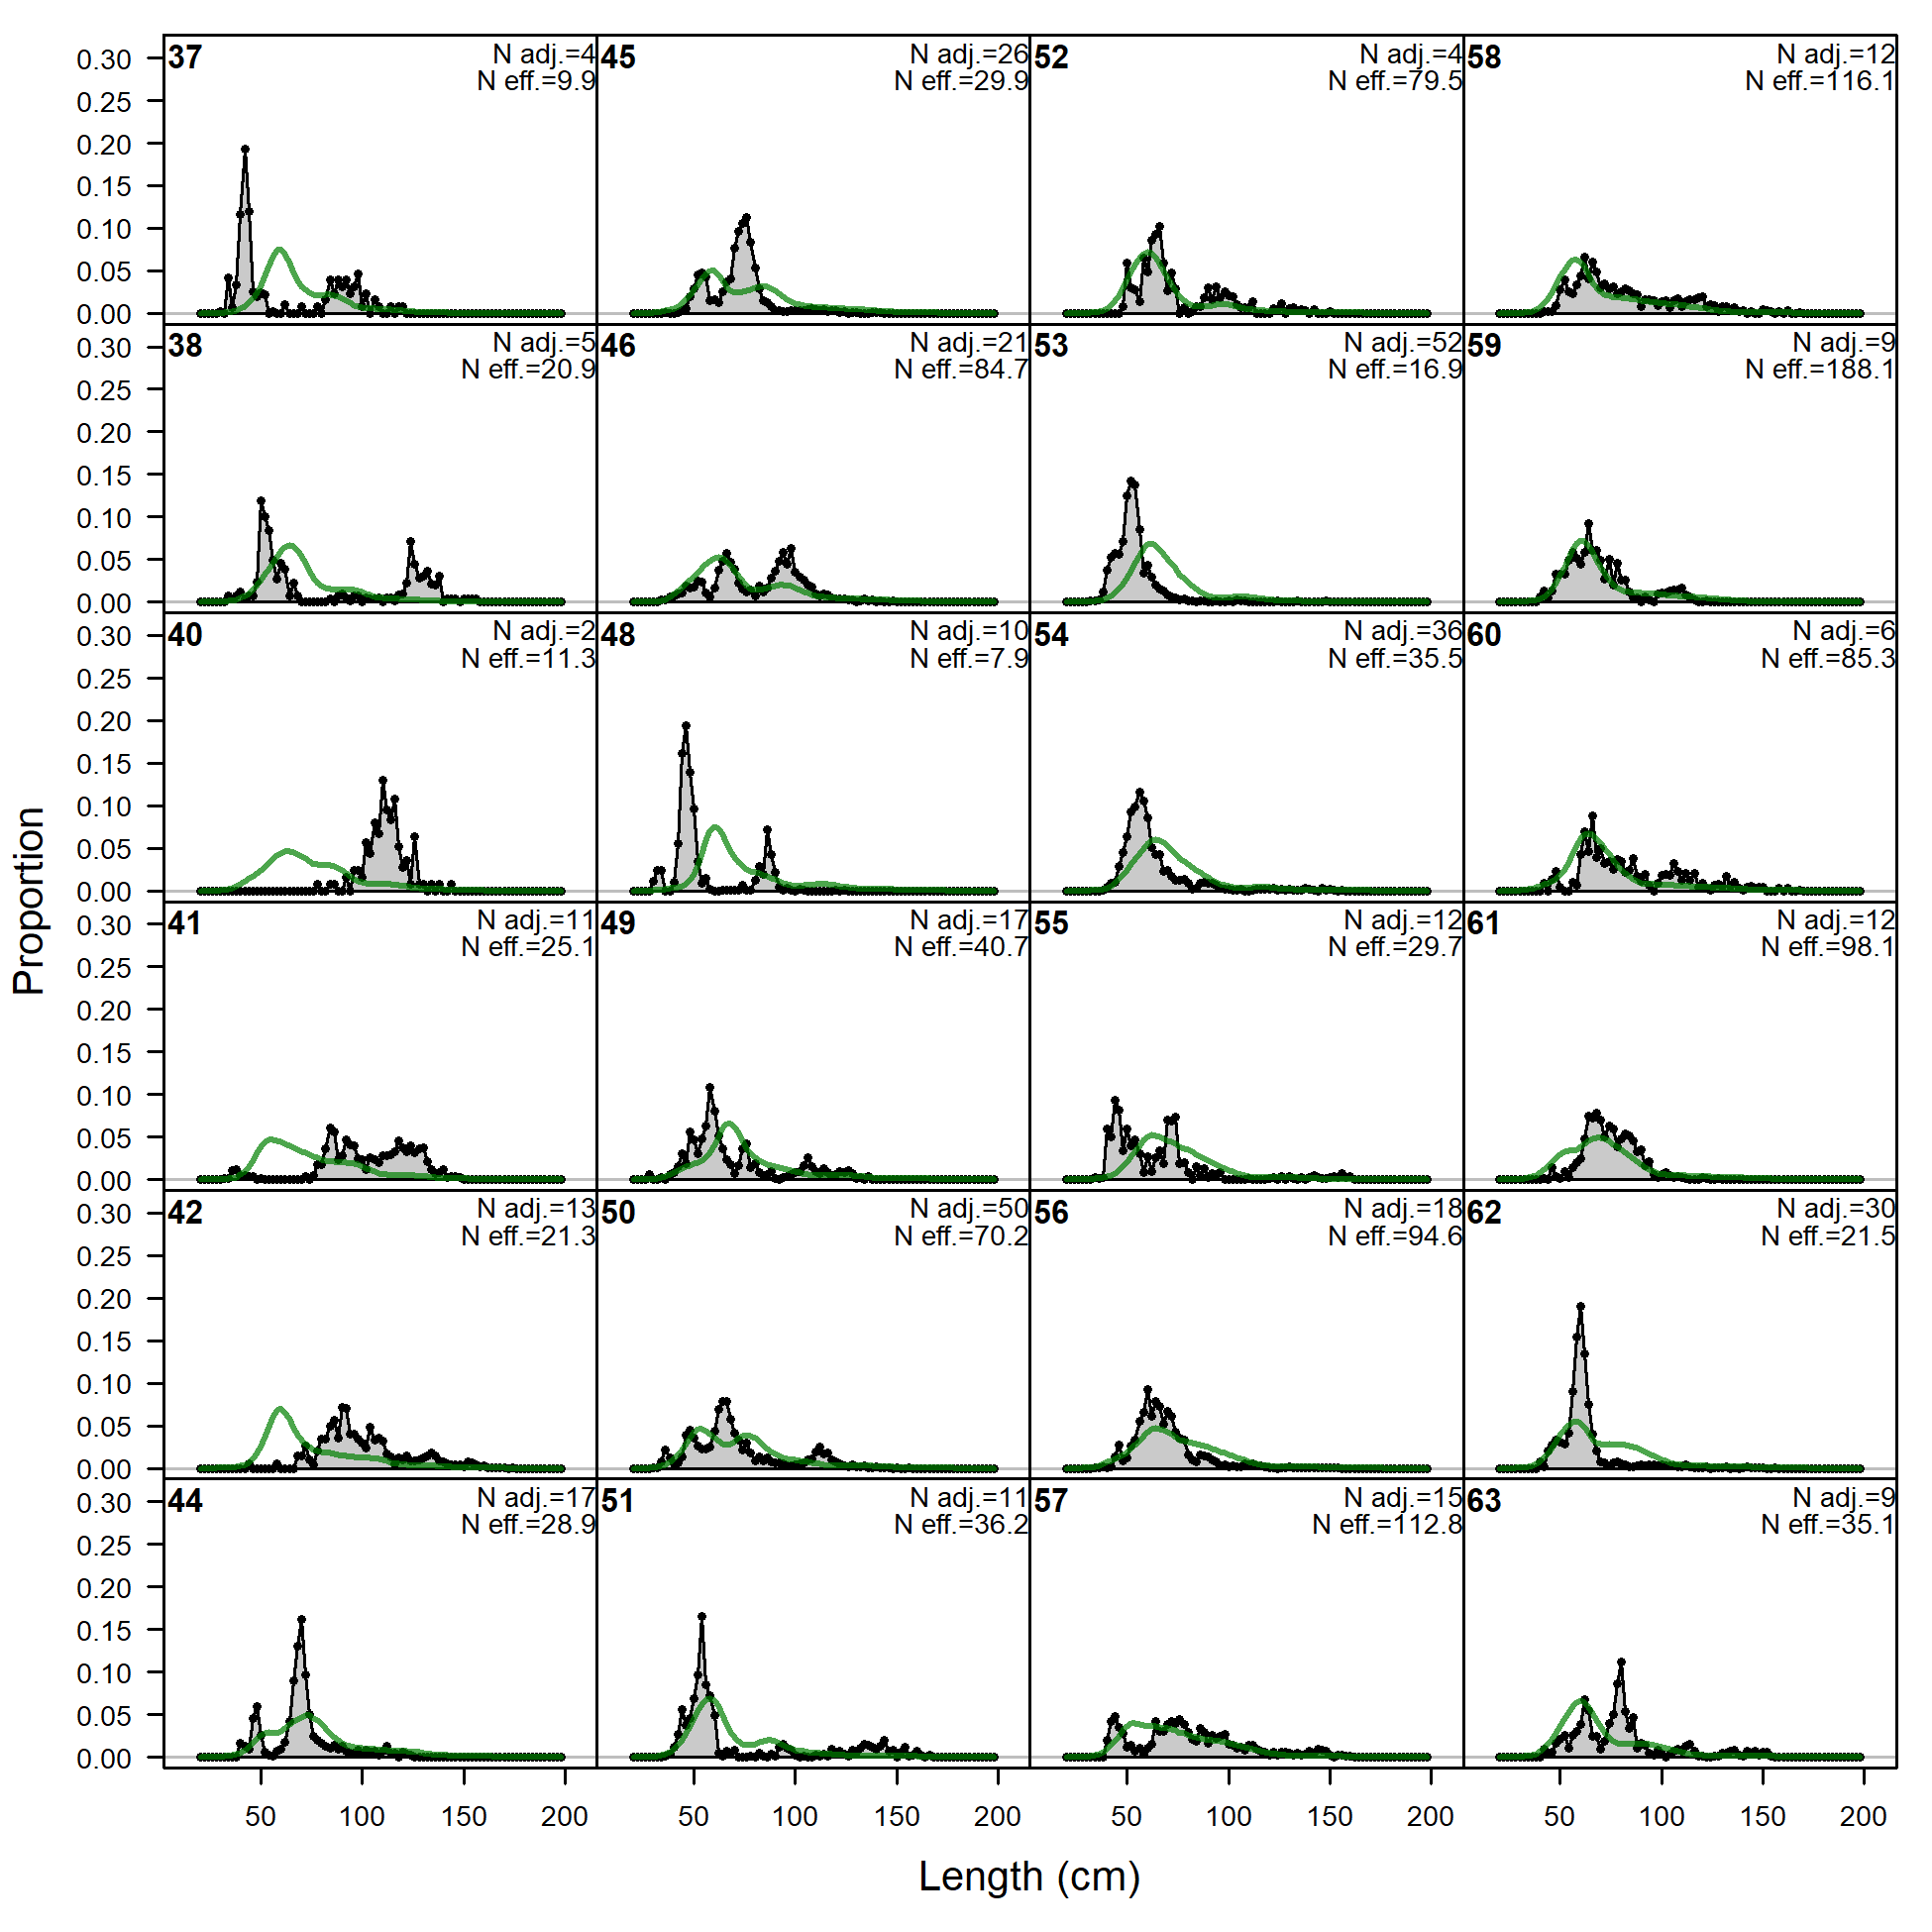
Length comps, whole catch, F7.OBJ.N.inshore (plot 1 of 4).
'N adj.' is the input sample size after data-weighting adjustment. N eff. is the calculated effective sample size used in the McAllister-Ianelli tuning method.
file: comp_lenfit_flt7mkt0_page1.png
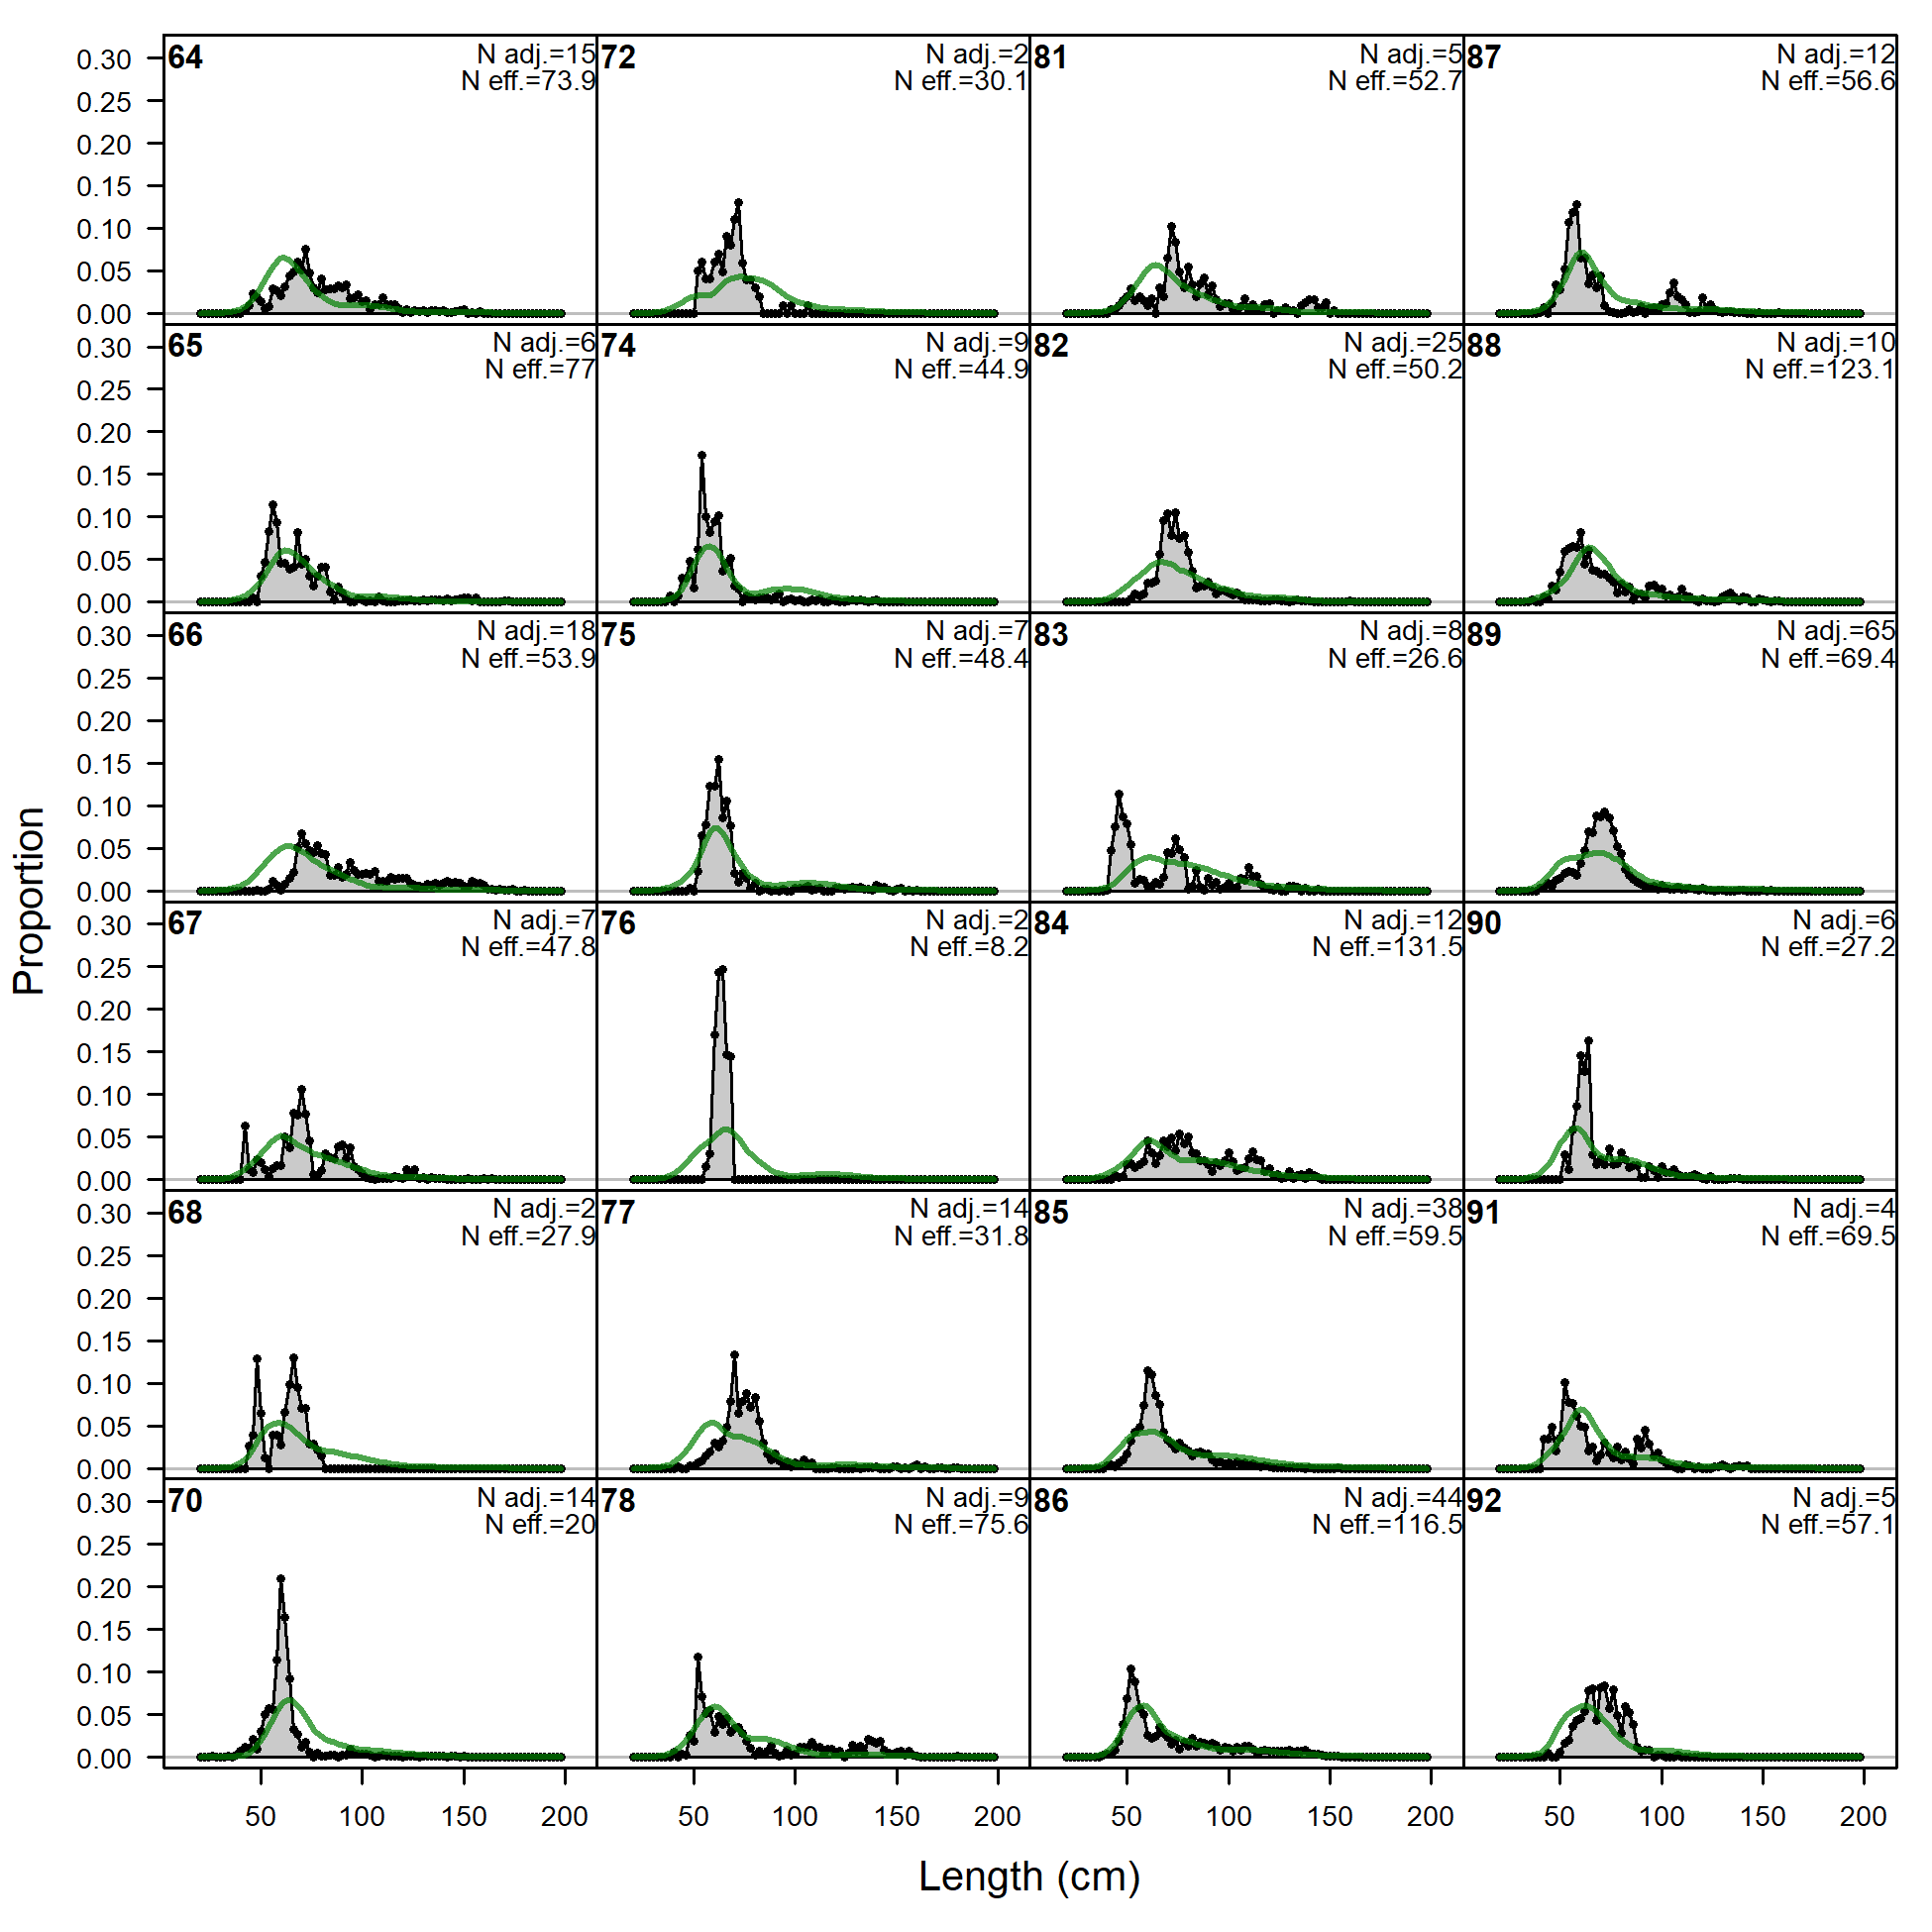
Length comps, whole catch, F7.OBJ.N.inshore (plot 1 of 4).
'N adj.' is the input sample size after data-weighting adjustment. N eff. is the calculated effective sample size used in the McAllister-Ianelli tuning method. (plot 2 of 4)
file: comp_lenfit_flt7mkt0_page2.png
Length comps, whole catch, F7.OBJ.N.inshore (plot 1 of 4).
'N adj.' is the input sample size after data-weighting adjustment. N eff. is the calculated effective sample size used in the McAllister-Ianelli tuning method. (plot 2 of 4) (plot 3 of 4)
file: comp_lenfit_flt7mkt0_page3.png
Length comps, whole catch, F7.OBJ.N.inshore (plot 1 of 4).
'N adj.' is the input sample size after data-weighting adjustment. N eff. is the calculated effective sample size used in the McAllister-Ianelli tuning method. (plot 2 of 4) (plot 3 of 4) (plot 4 of 4)
file: comp_lenfit_flt7mkt0_page4.png
Pearson residuals, whole catch, F7.OBJ.N.inshore (max=4.27) (plot 4 of 4)
Closed bubbles are positive residuals (observed > expected) and open bubbles are negative residuals (observed < expected).
file: comp_lenfit_residsflt7mkt0_page4.png
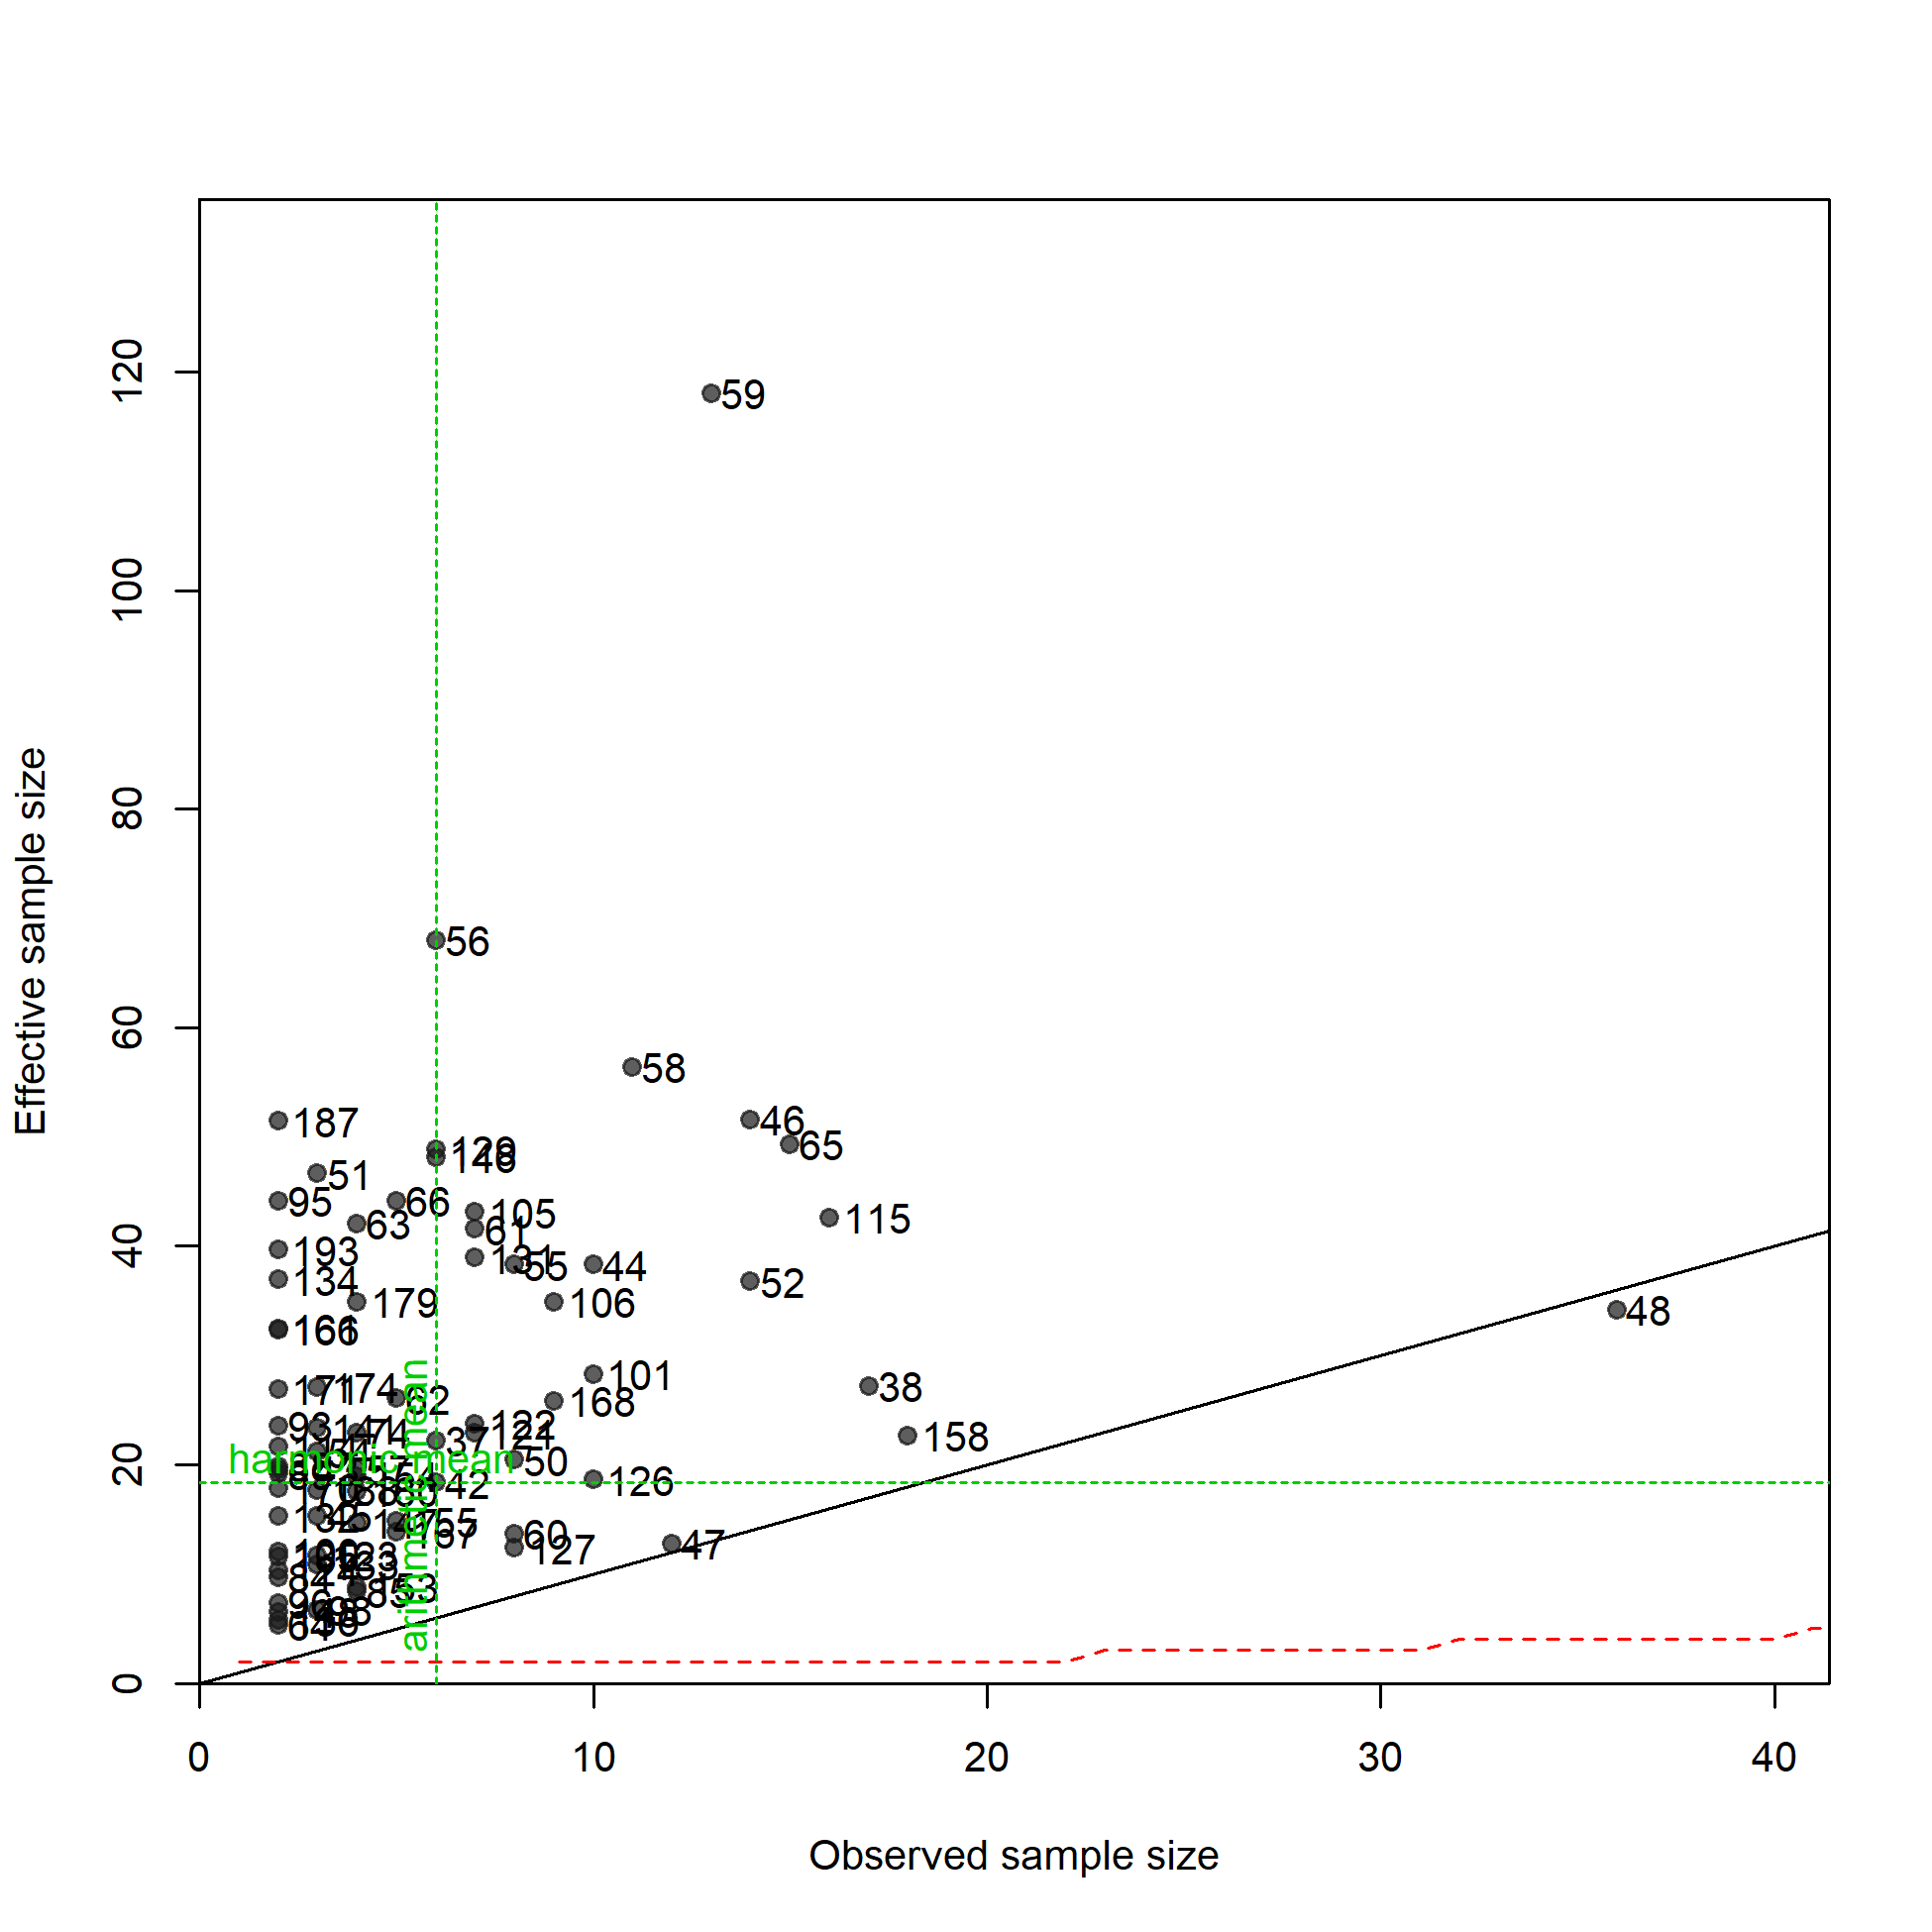
N-EffN comparison, Length comps, whole catch, F7.OBJ.N.inshore
file: comp_lenfit_sampsize_flt7mkt0.png
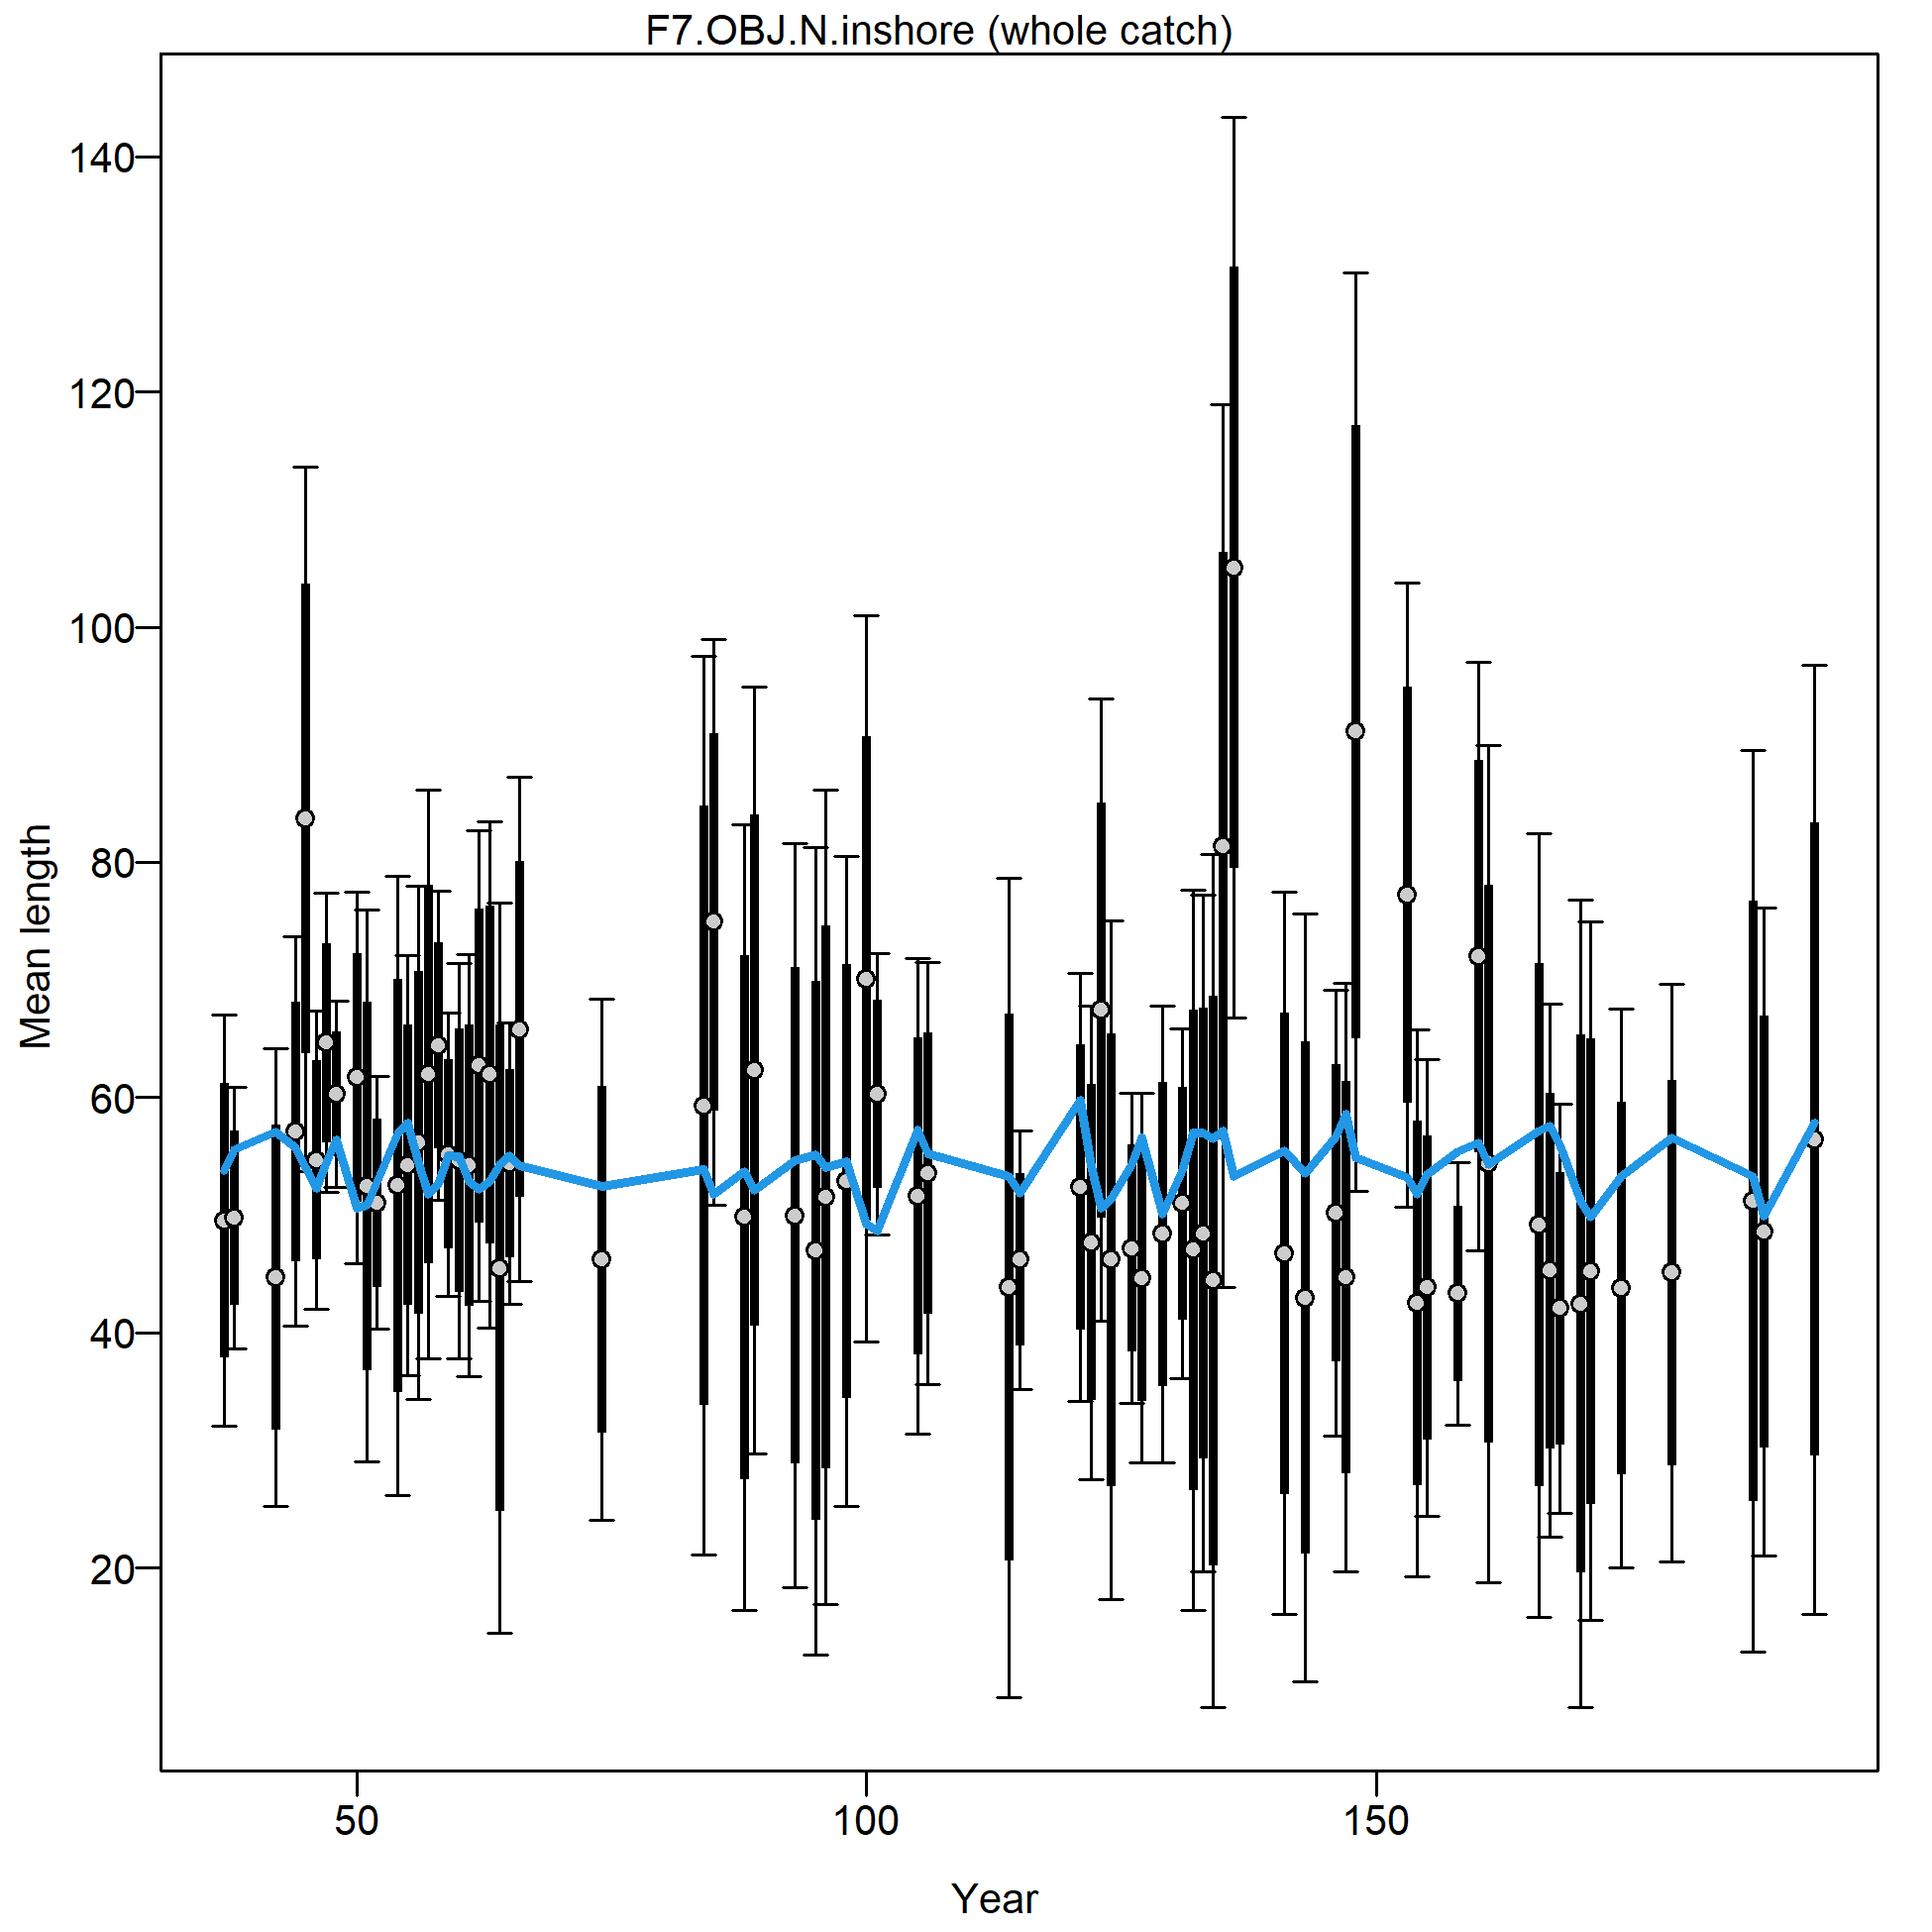
Mean length for F7.OBJ.N.inshore with 95% confidence intervals based on current sample sizes.
Francis data weighting method TA1.8: thinner intervals (with capped ends) show result of further adjusting sample sizes based on suggested multiplier (with 95% interval) for len data from F7.OBJ.N.inshore:
0.445 (0.3424-0.6515)
For more info, see Francis (2011).
file: comp_lenfit_data_weighting_TA1.8_F7.OBJ.N.inshore.png
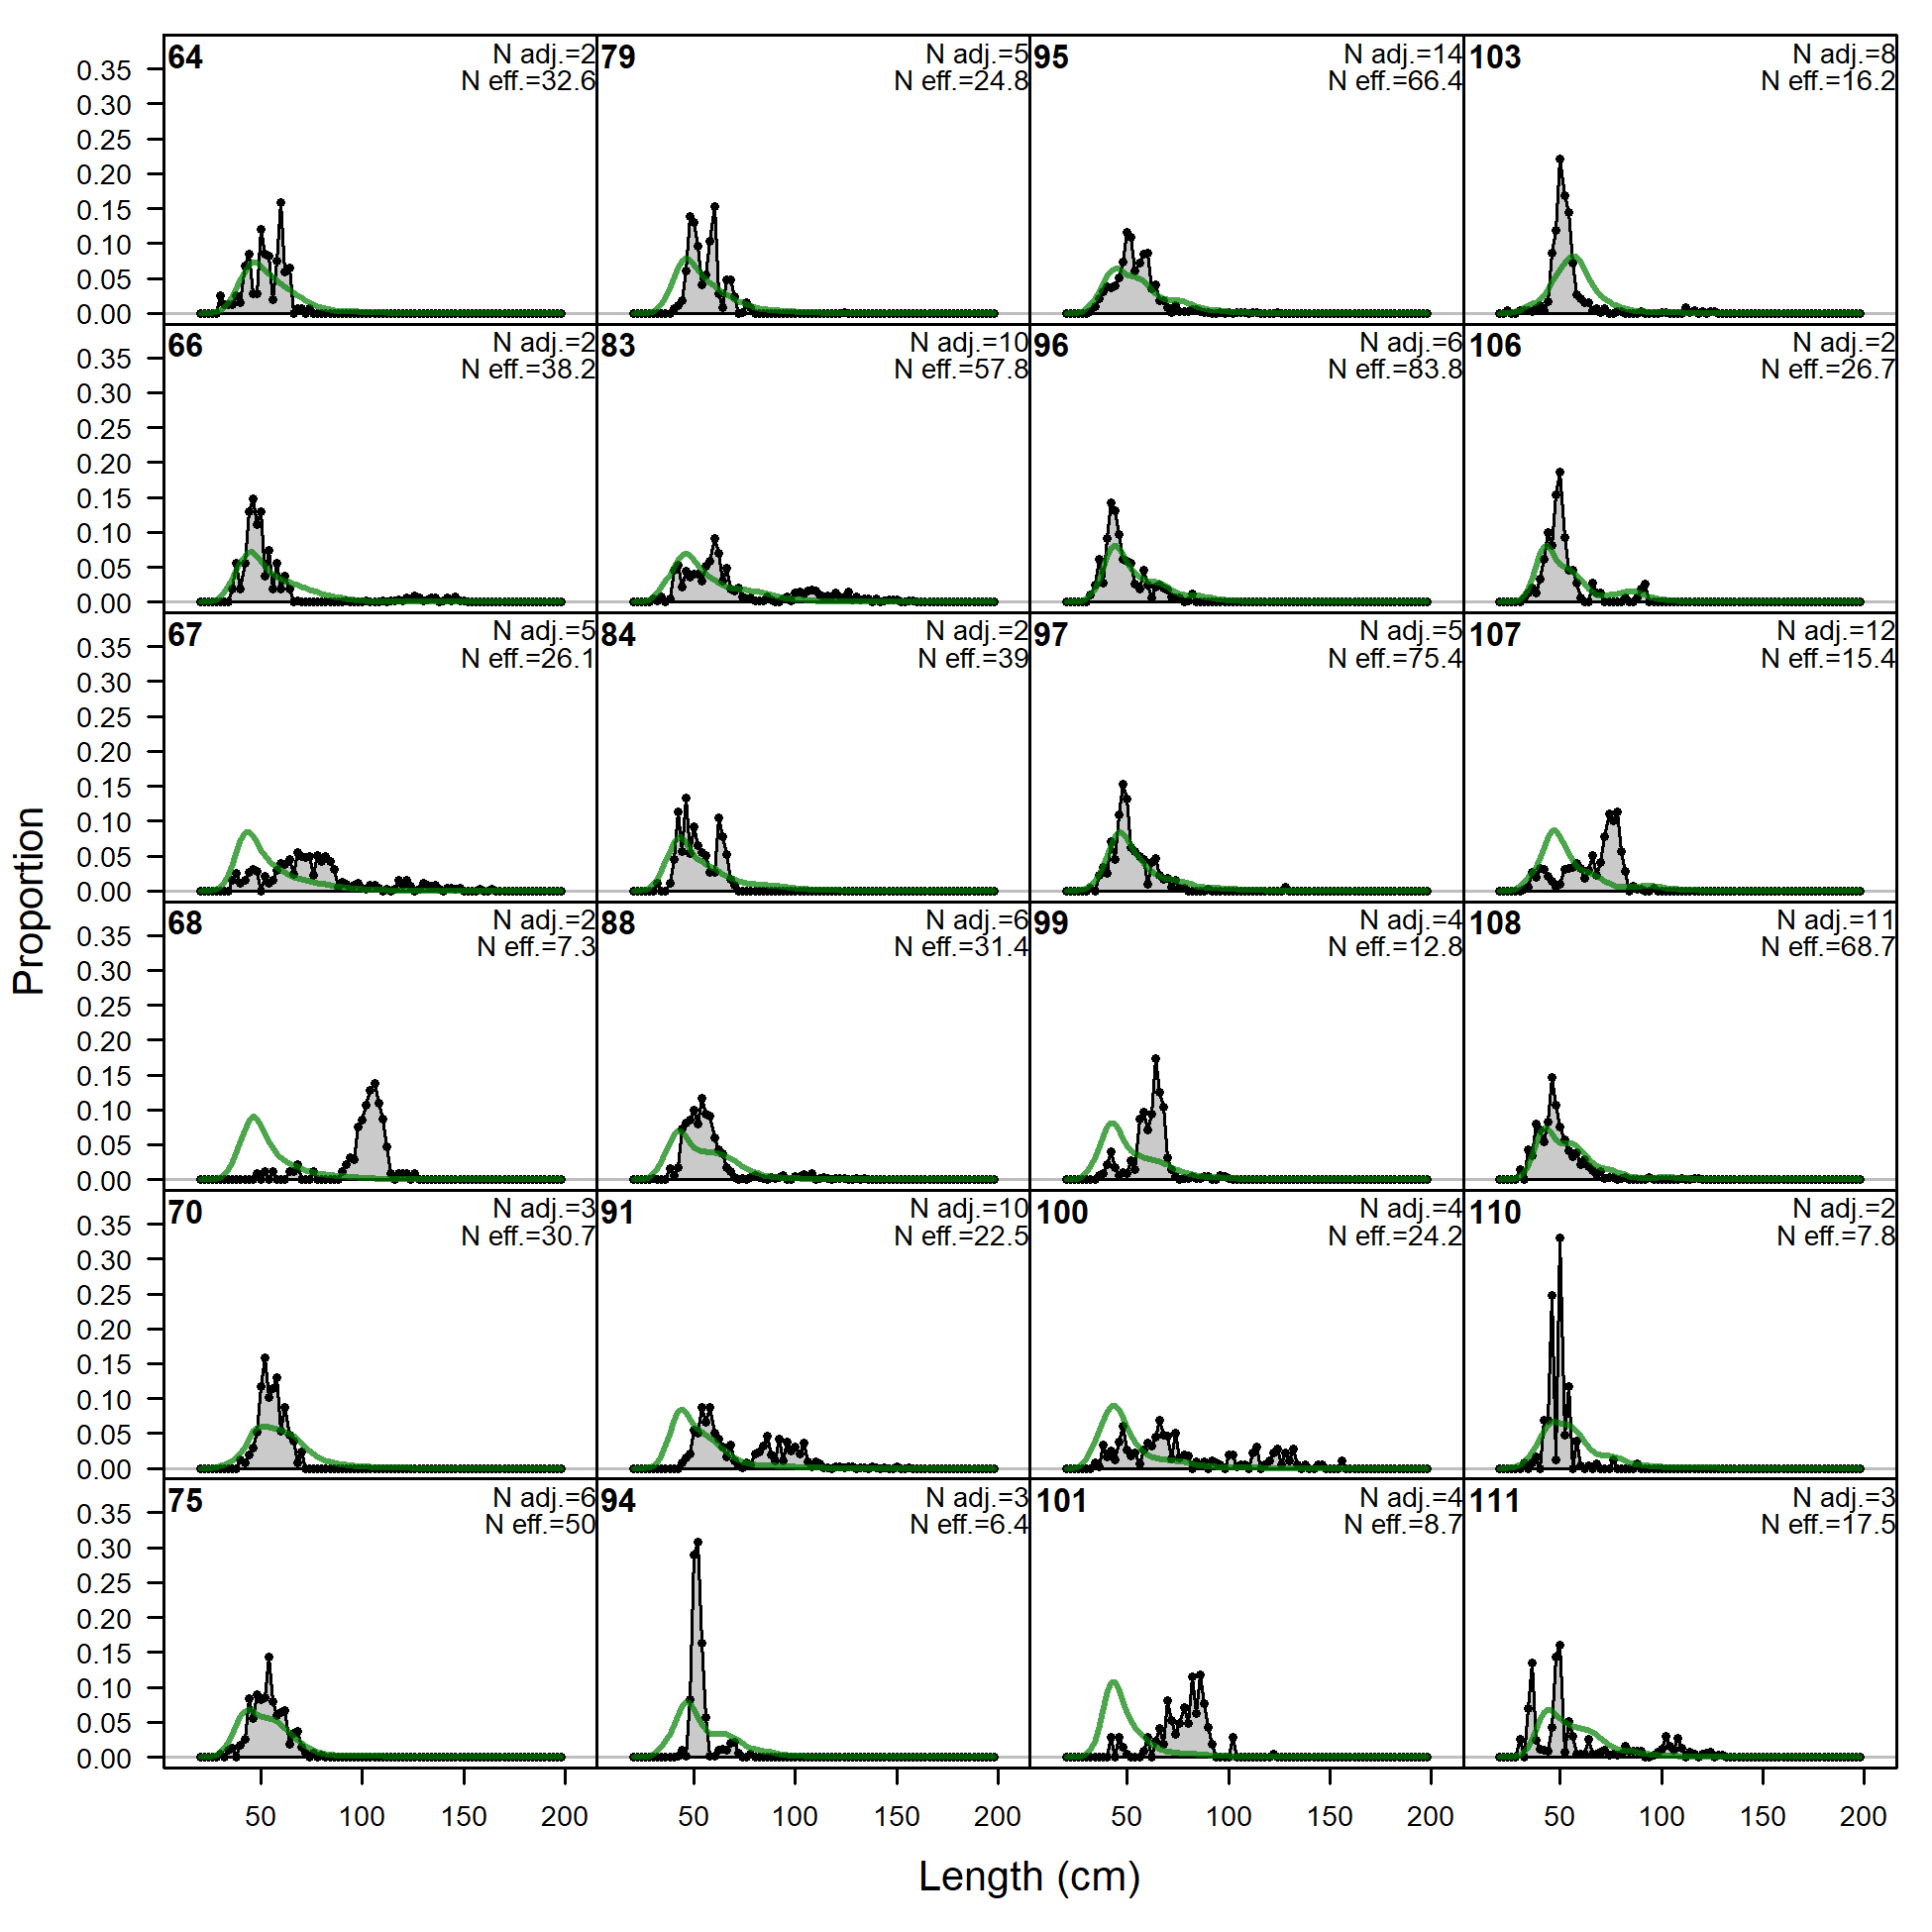
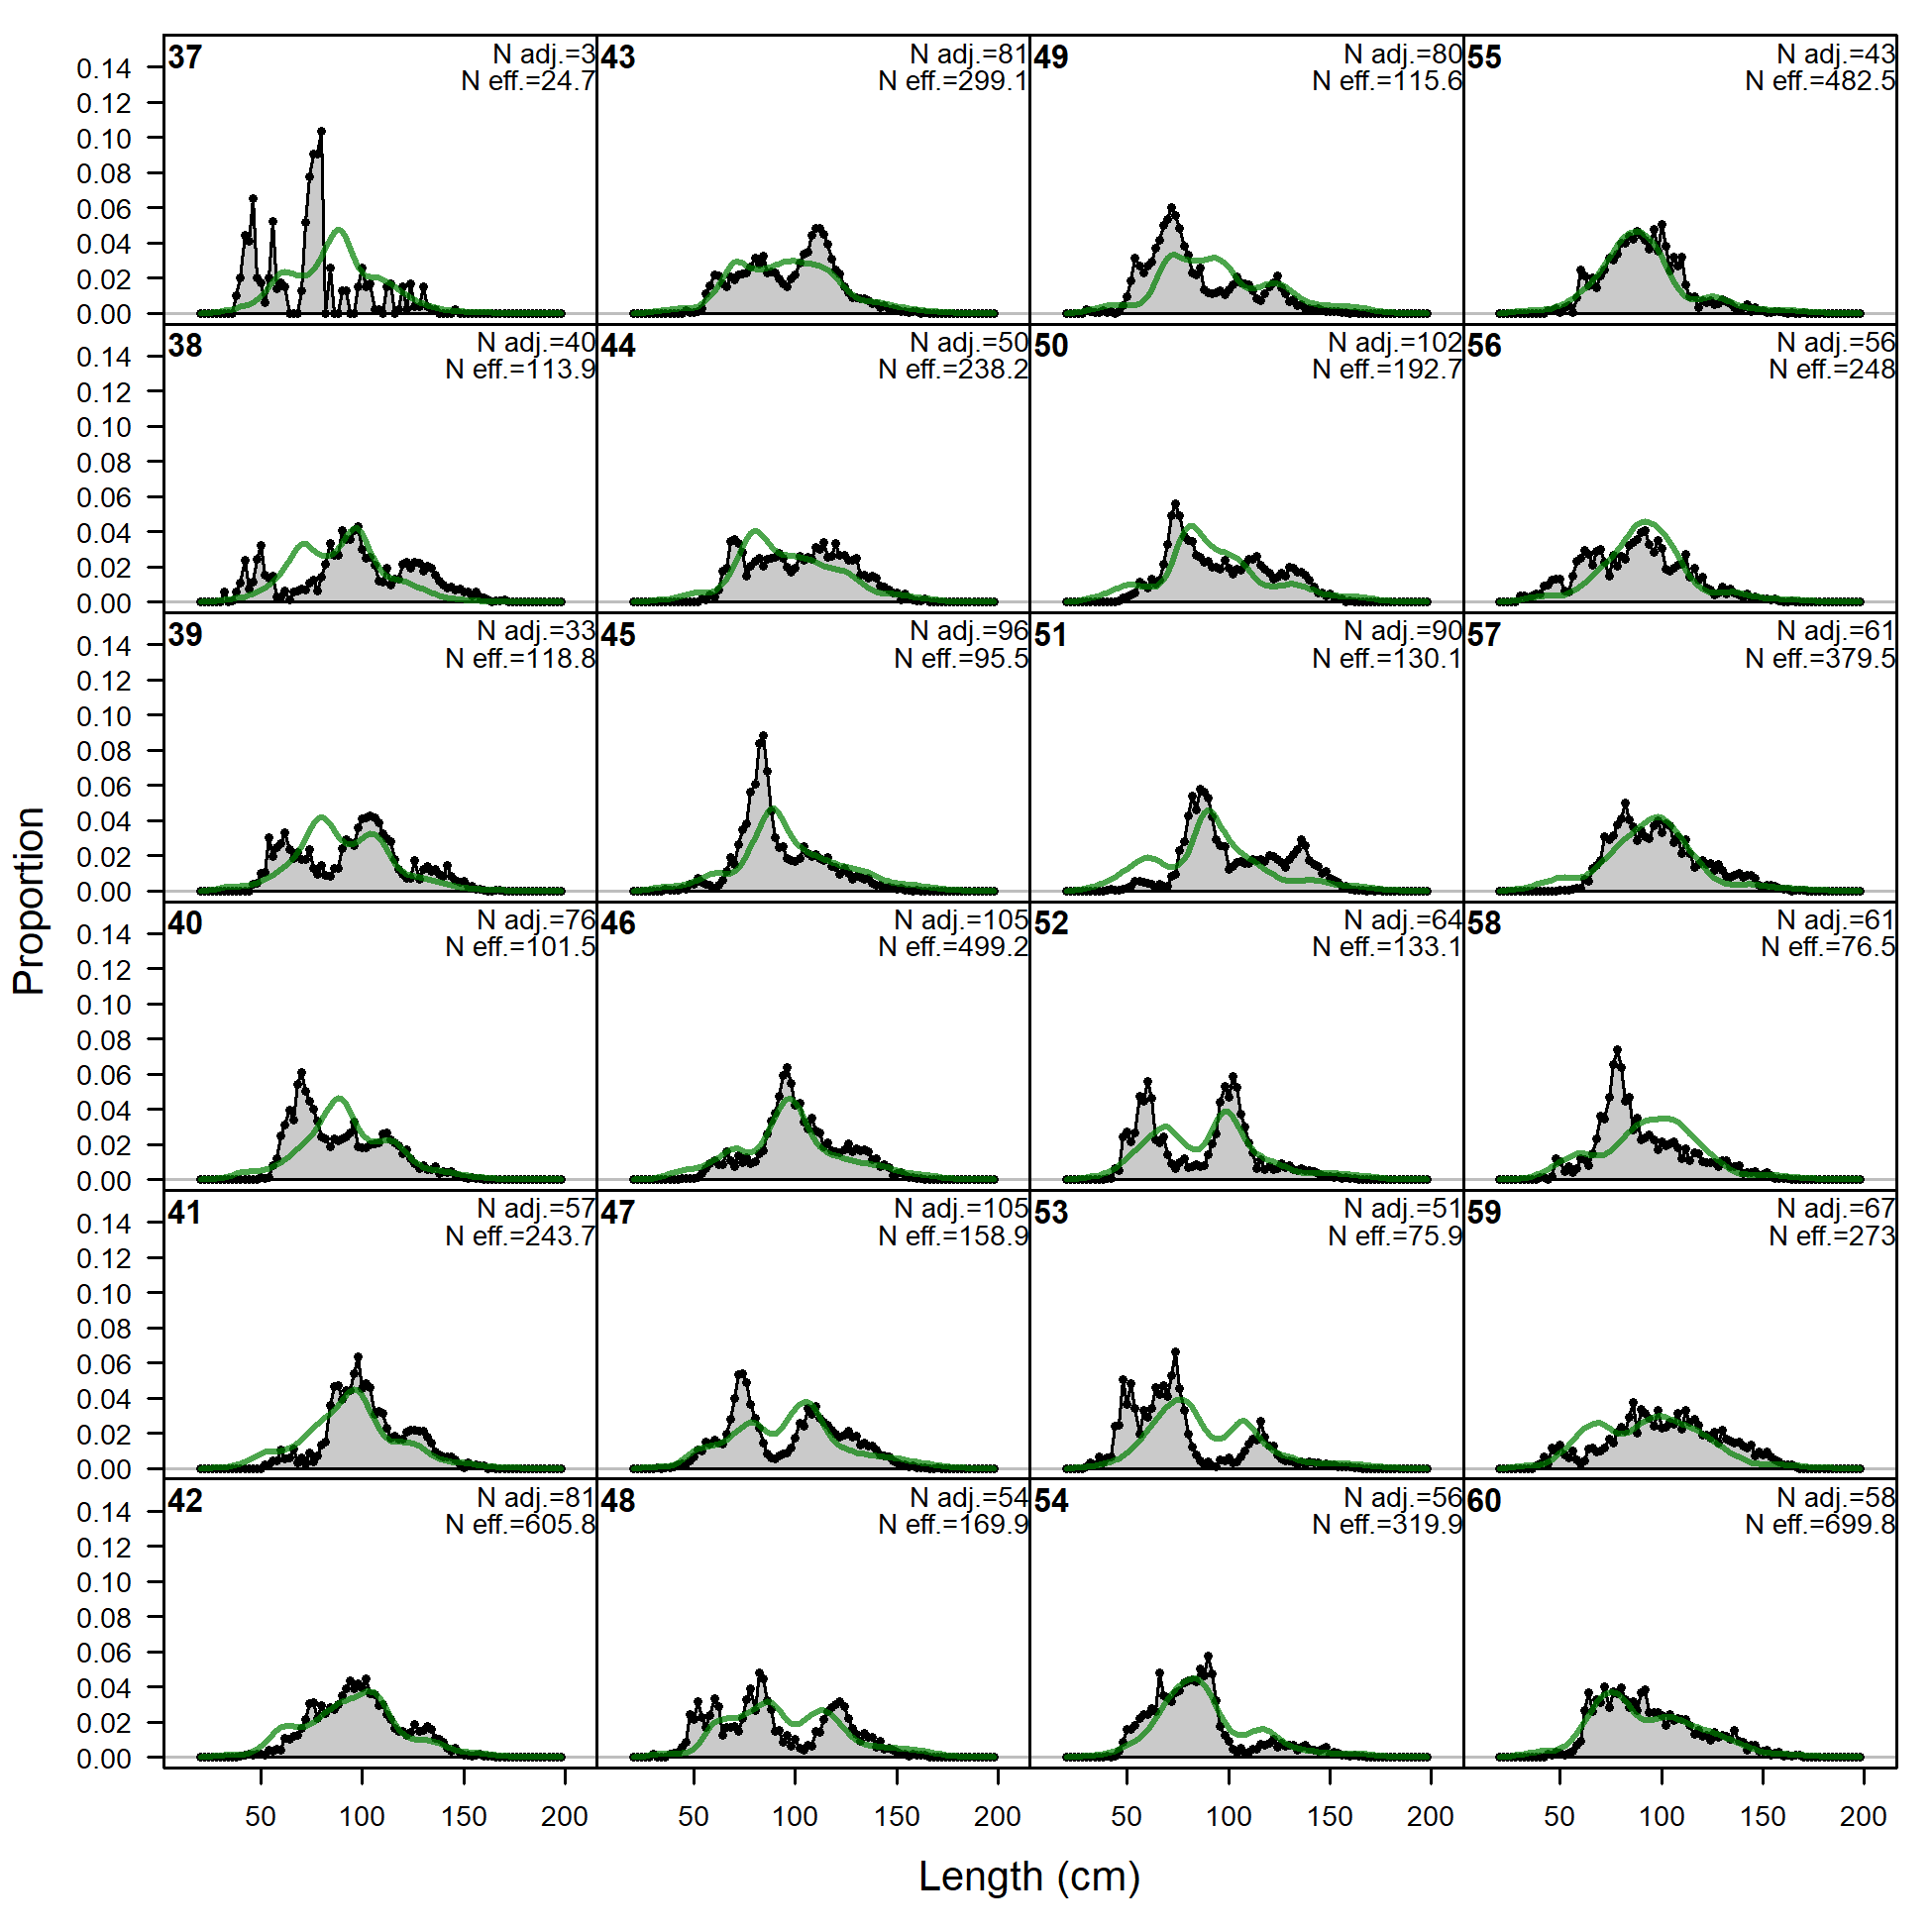
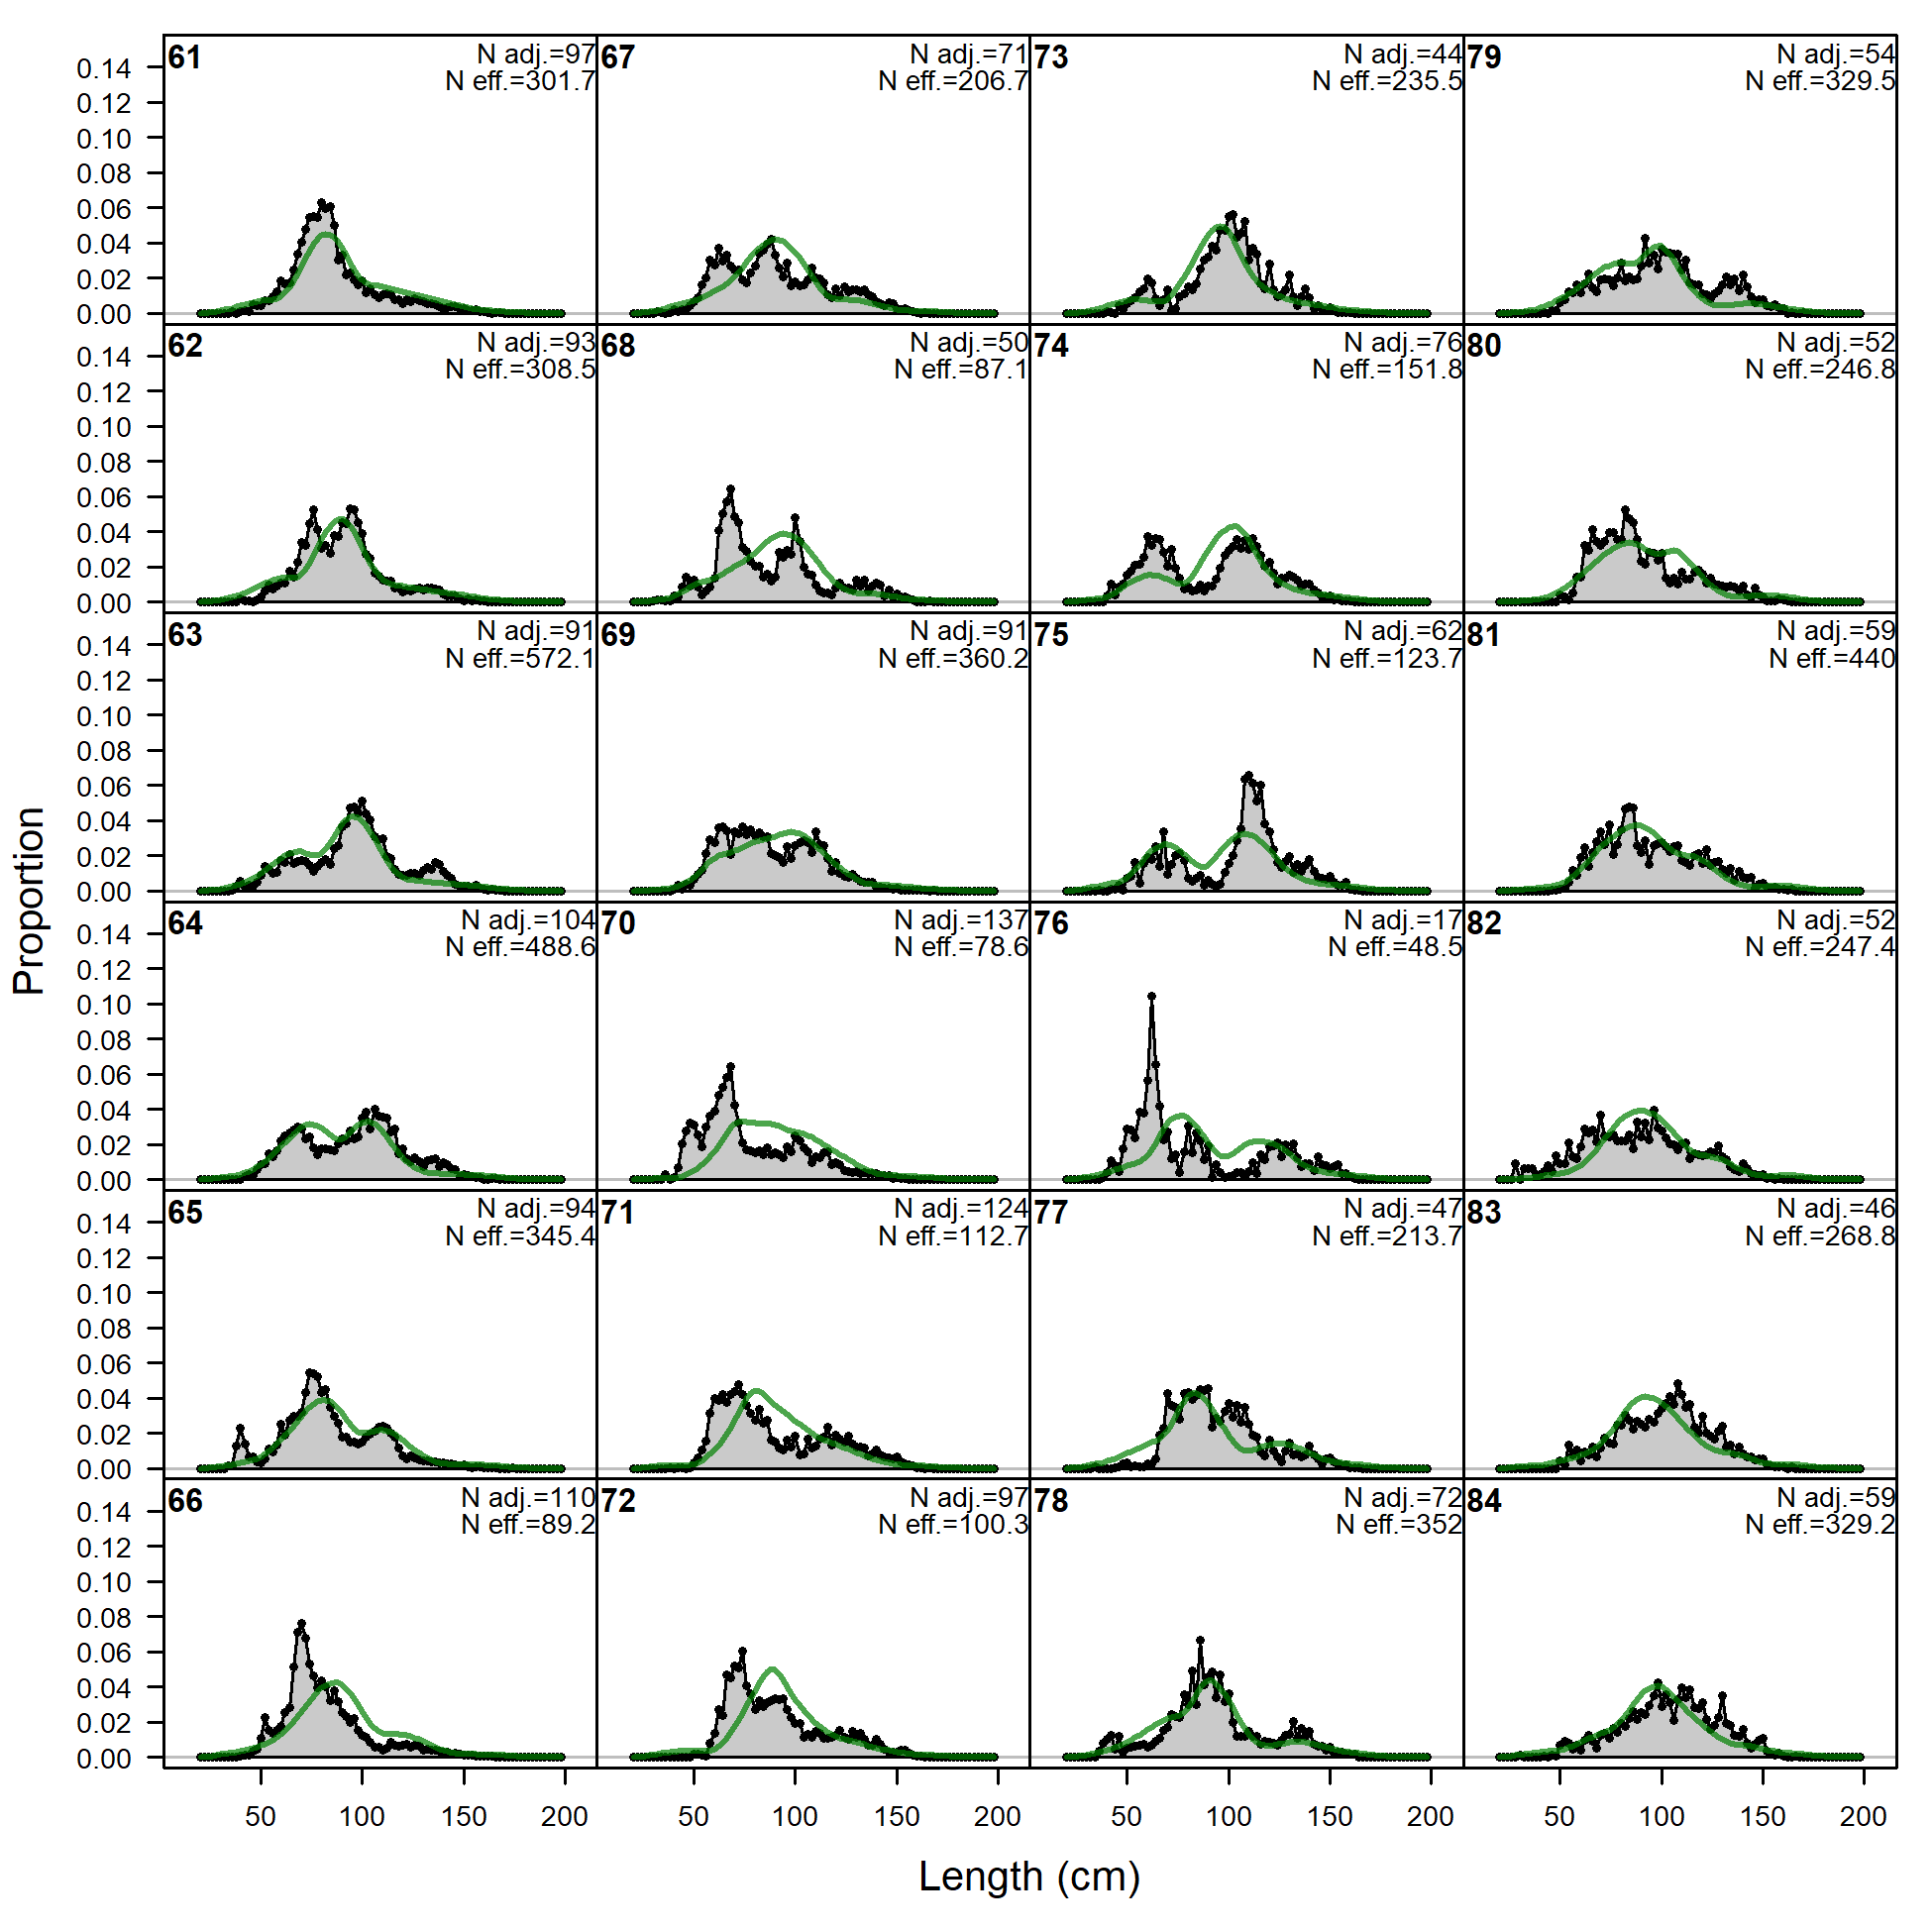
Length comps, whole catch, F10.NOA.C.small (plot 1 of 6).
'N adj.' is the input sample size after data-weighting adjustment. N eff. is the calculated effective sample size used in the McAllister-Ianelli tuning method.
file: comp_lenfit_flt10mkt0_page1.png
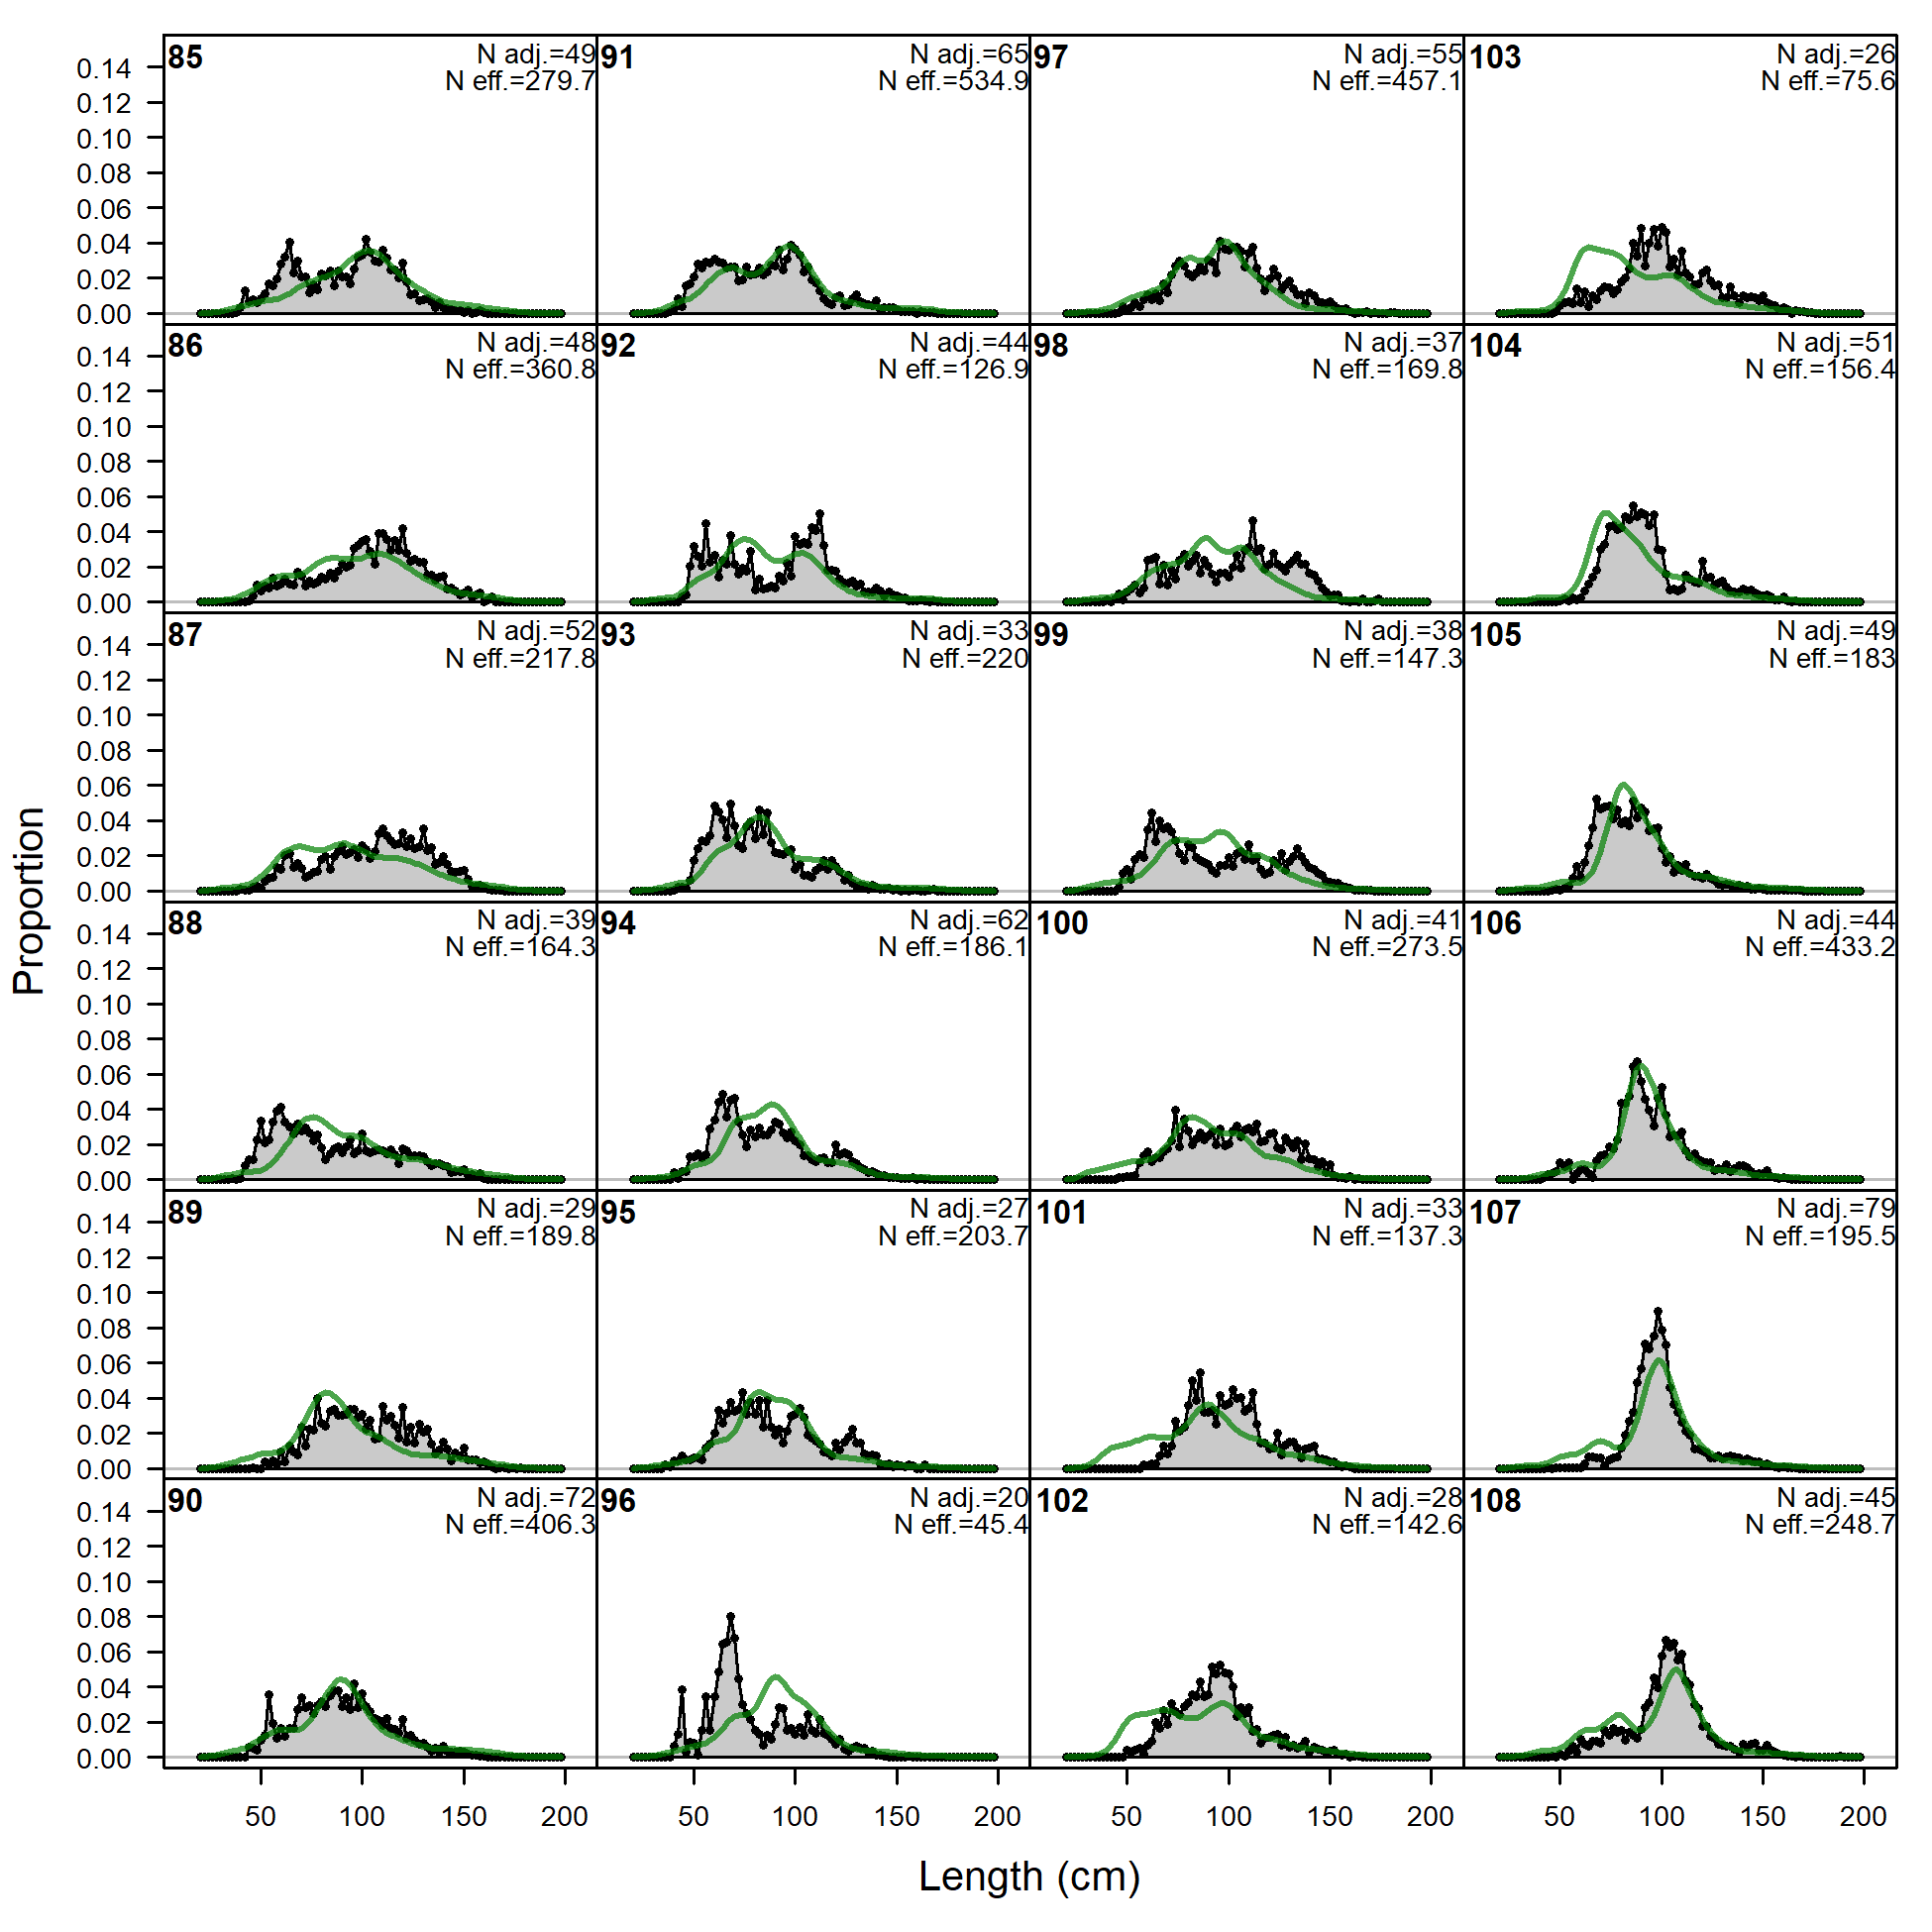
Length comps, whole catch, F10.NOA.C.small (plot 1 of 6).
'N adj.' is the input sample size after data-weighting adjustment. N eff. is the calculated effective sample size used in the McAllister-Ianelli tuning method. (plot 2 of 6)
file: comp_lenfit_flt10mkt0_page2.png
Length comps, whole catch, F10.NOA.C.small (plot 1 of 6).
'N adj.' is the input sample size after data-weighting adjustment. N eff. is the calculated effective sample size used in the McAllister-Ianelli tuning method. (plot 2 of 6) (plot 3 of 6)
file: comp_lenfit_flt10mkt0_page3.png
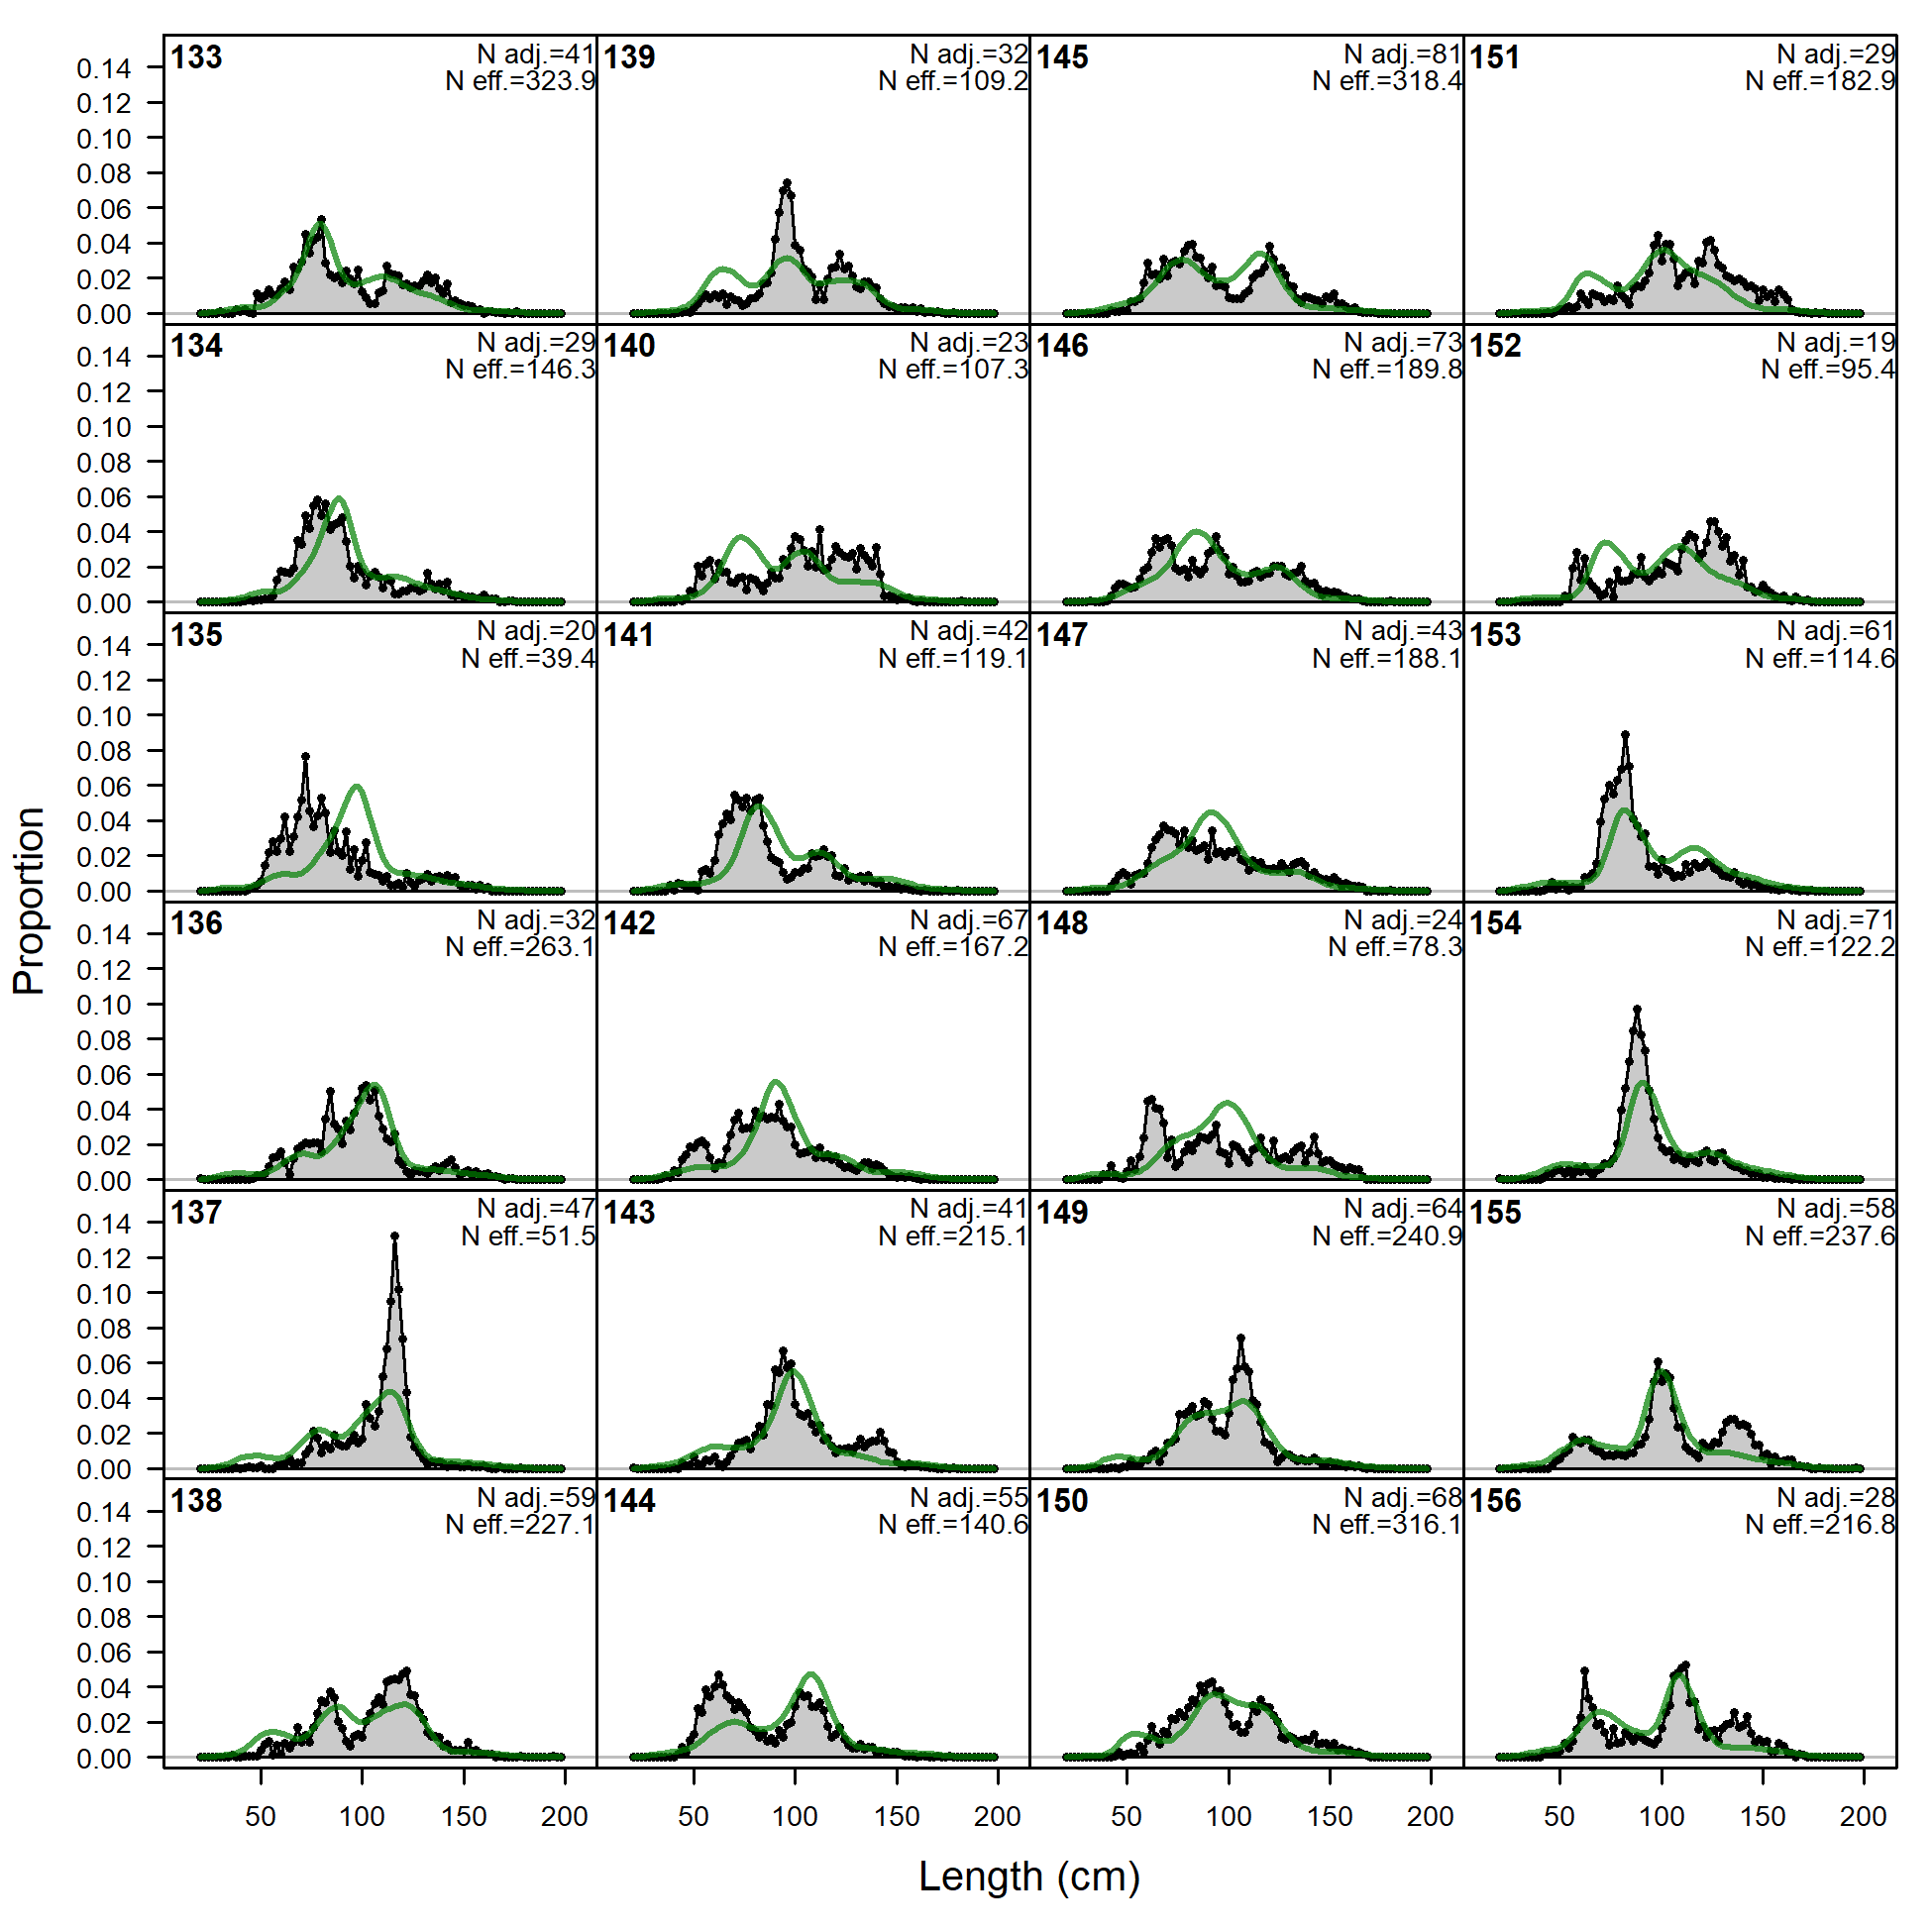
Length comps, whole catch, F10.NOA.C.small (plot 1 of 6).
'N adj.' is the input sample size after data-weighting adjustment. N eff. is the calculated effective sample size used in the McAllister-Ianelli tuning method. (plot 2 of 6) (plot 3 of 6) (plot 4 of 6)
file: comp_lenfit_flt10mkt0_page4.png
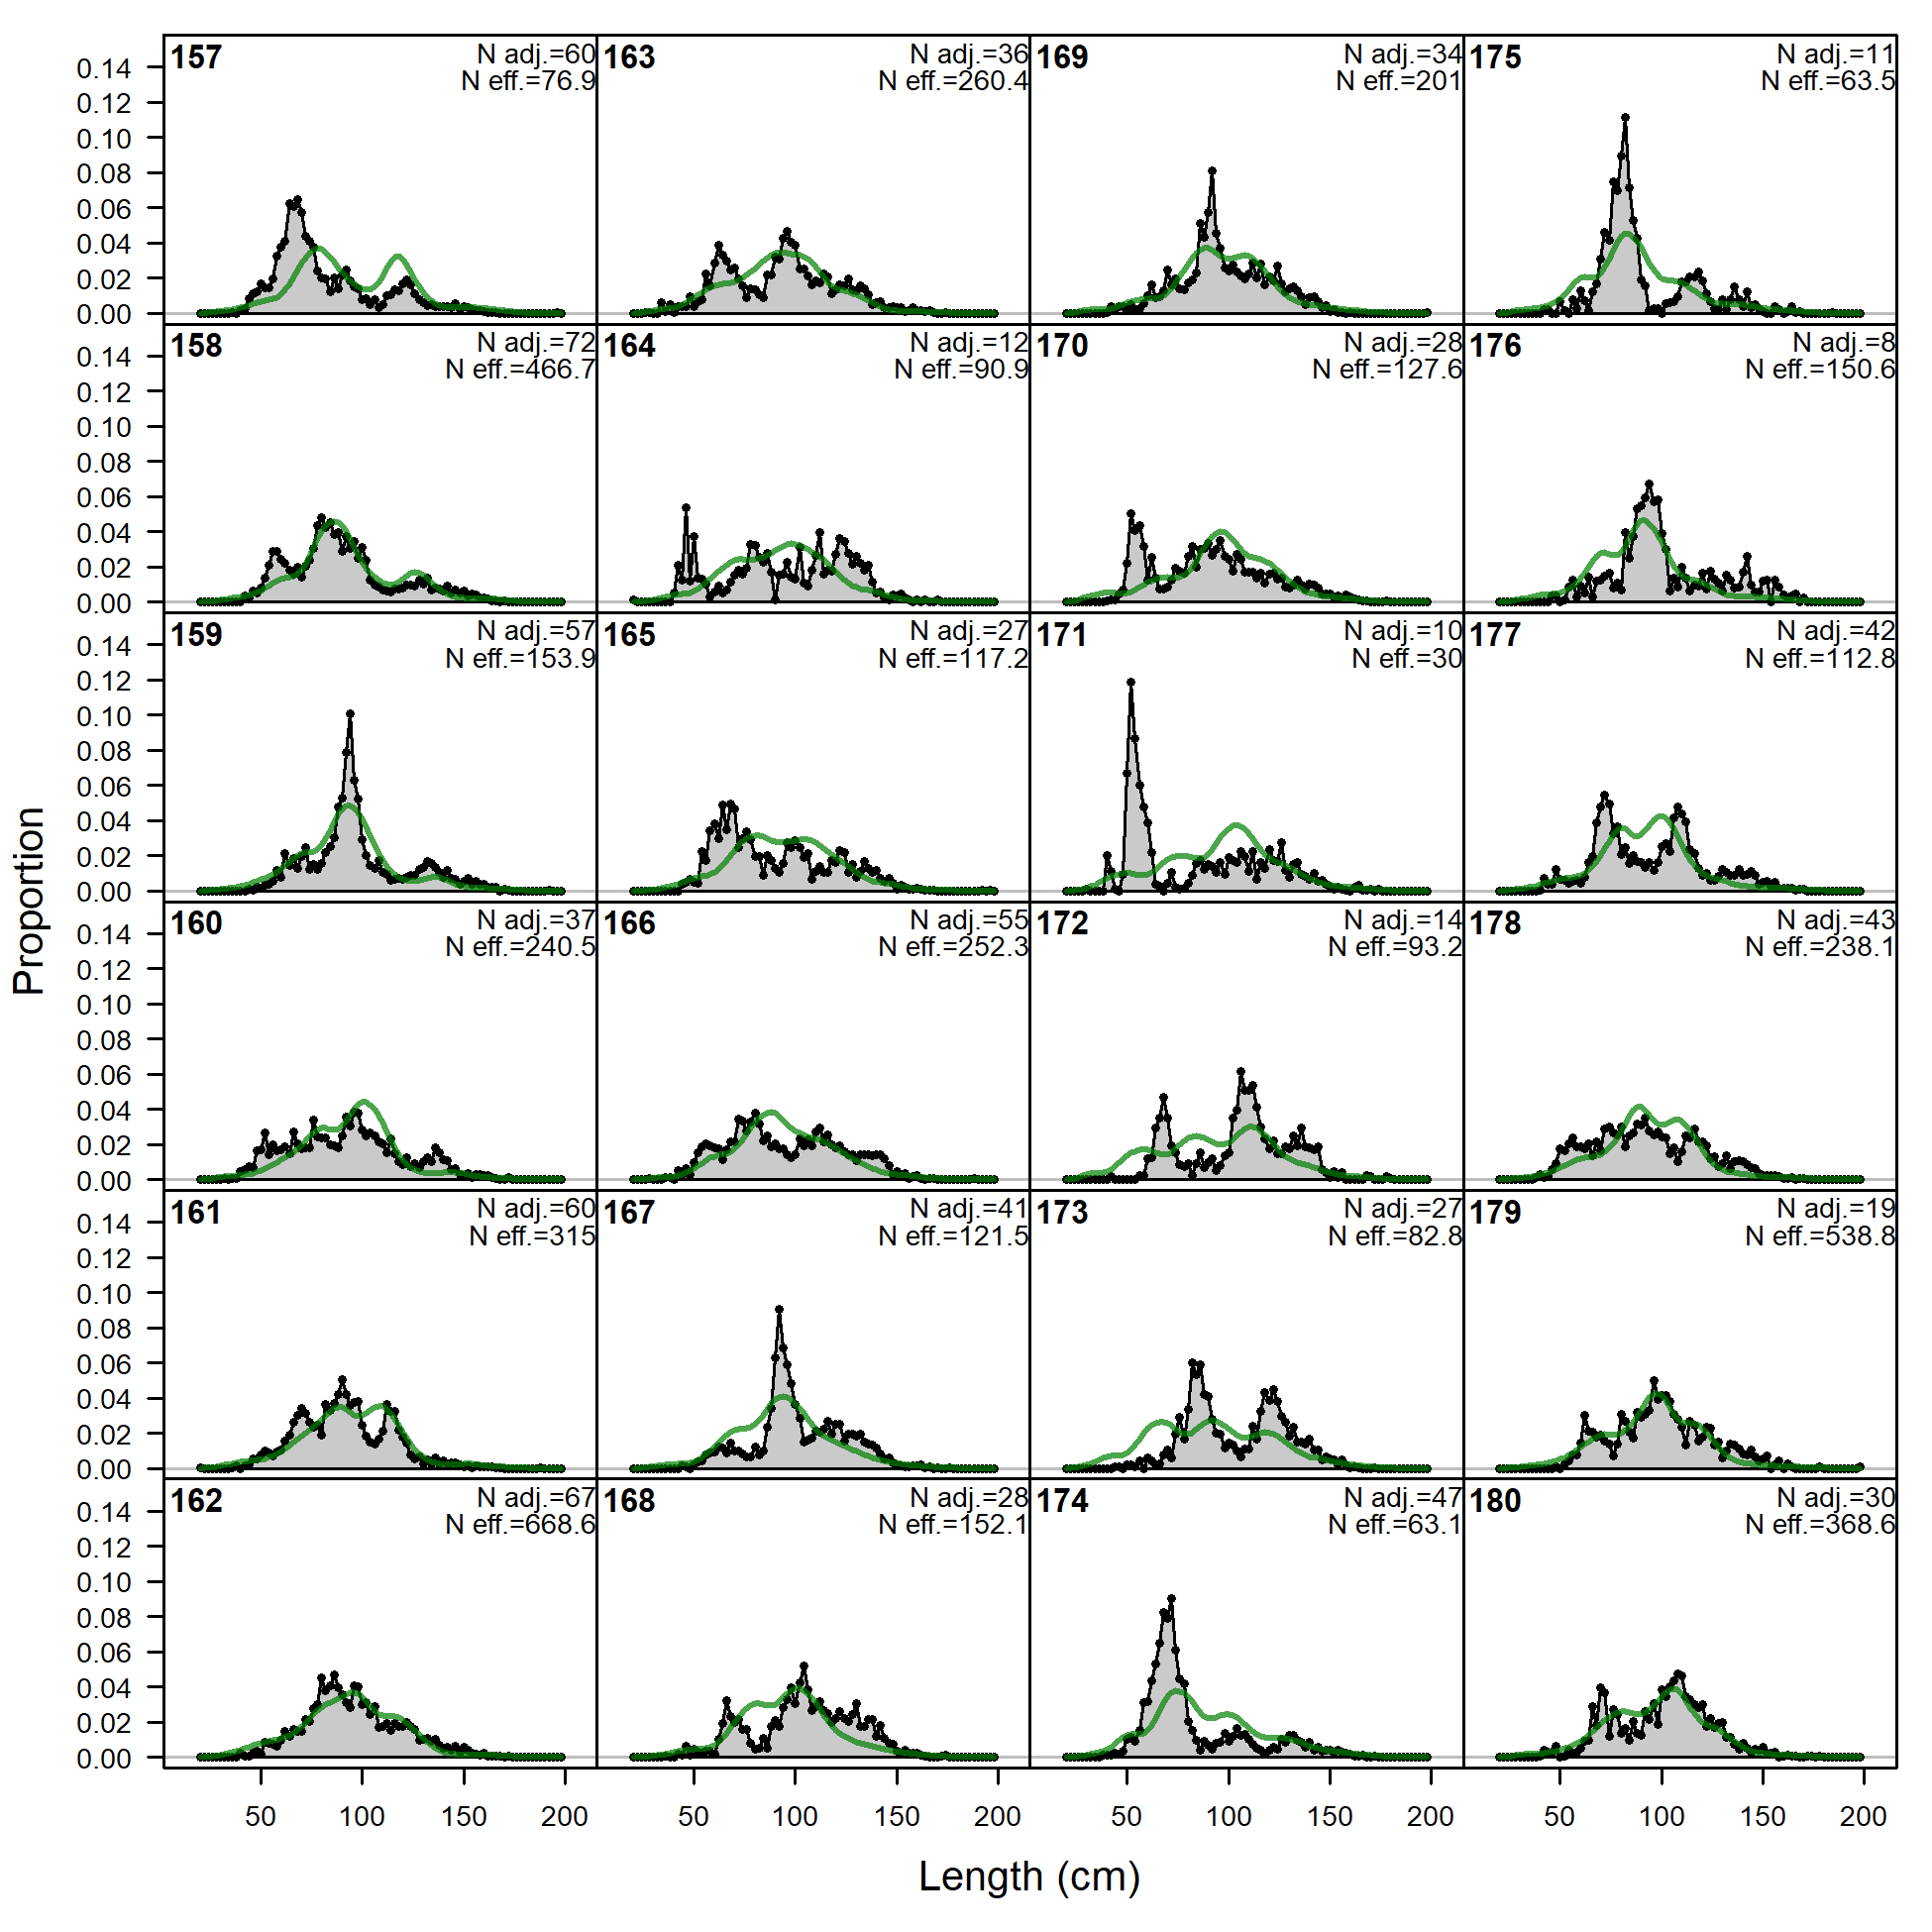
Length comps, whole catch, F10.NOA.C.small (plot 1 of 6).
'N adj.' is the input sample size after data-weighting adjustment. N eff. is the calculated effective sample size used in the McAllister-Ianelli tuning method. (plot 2 of 6) (plot 3 of 6) (plot 4 of 6) (plot 5 of 6)
file: comp_lenfit_flt10mkt0_page5.png
Length comps, whole catch, F10.NOA.C.small (plot 1 of 6).
'N adj.' is the input sample size after data-weighting adjustment. N eff. is the calculated effective sample size used in the McAllister-Ianelli tuning method. (plot 2 of 6) (plot 3 of 6) (plot 4 of 6) (plot 5 of 6) (plot 6 of 6)
file: comp_lenfit_flt10mkt0_page6.png
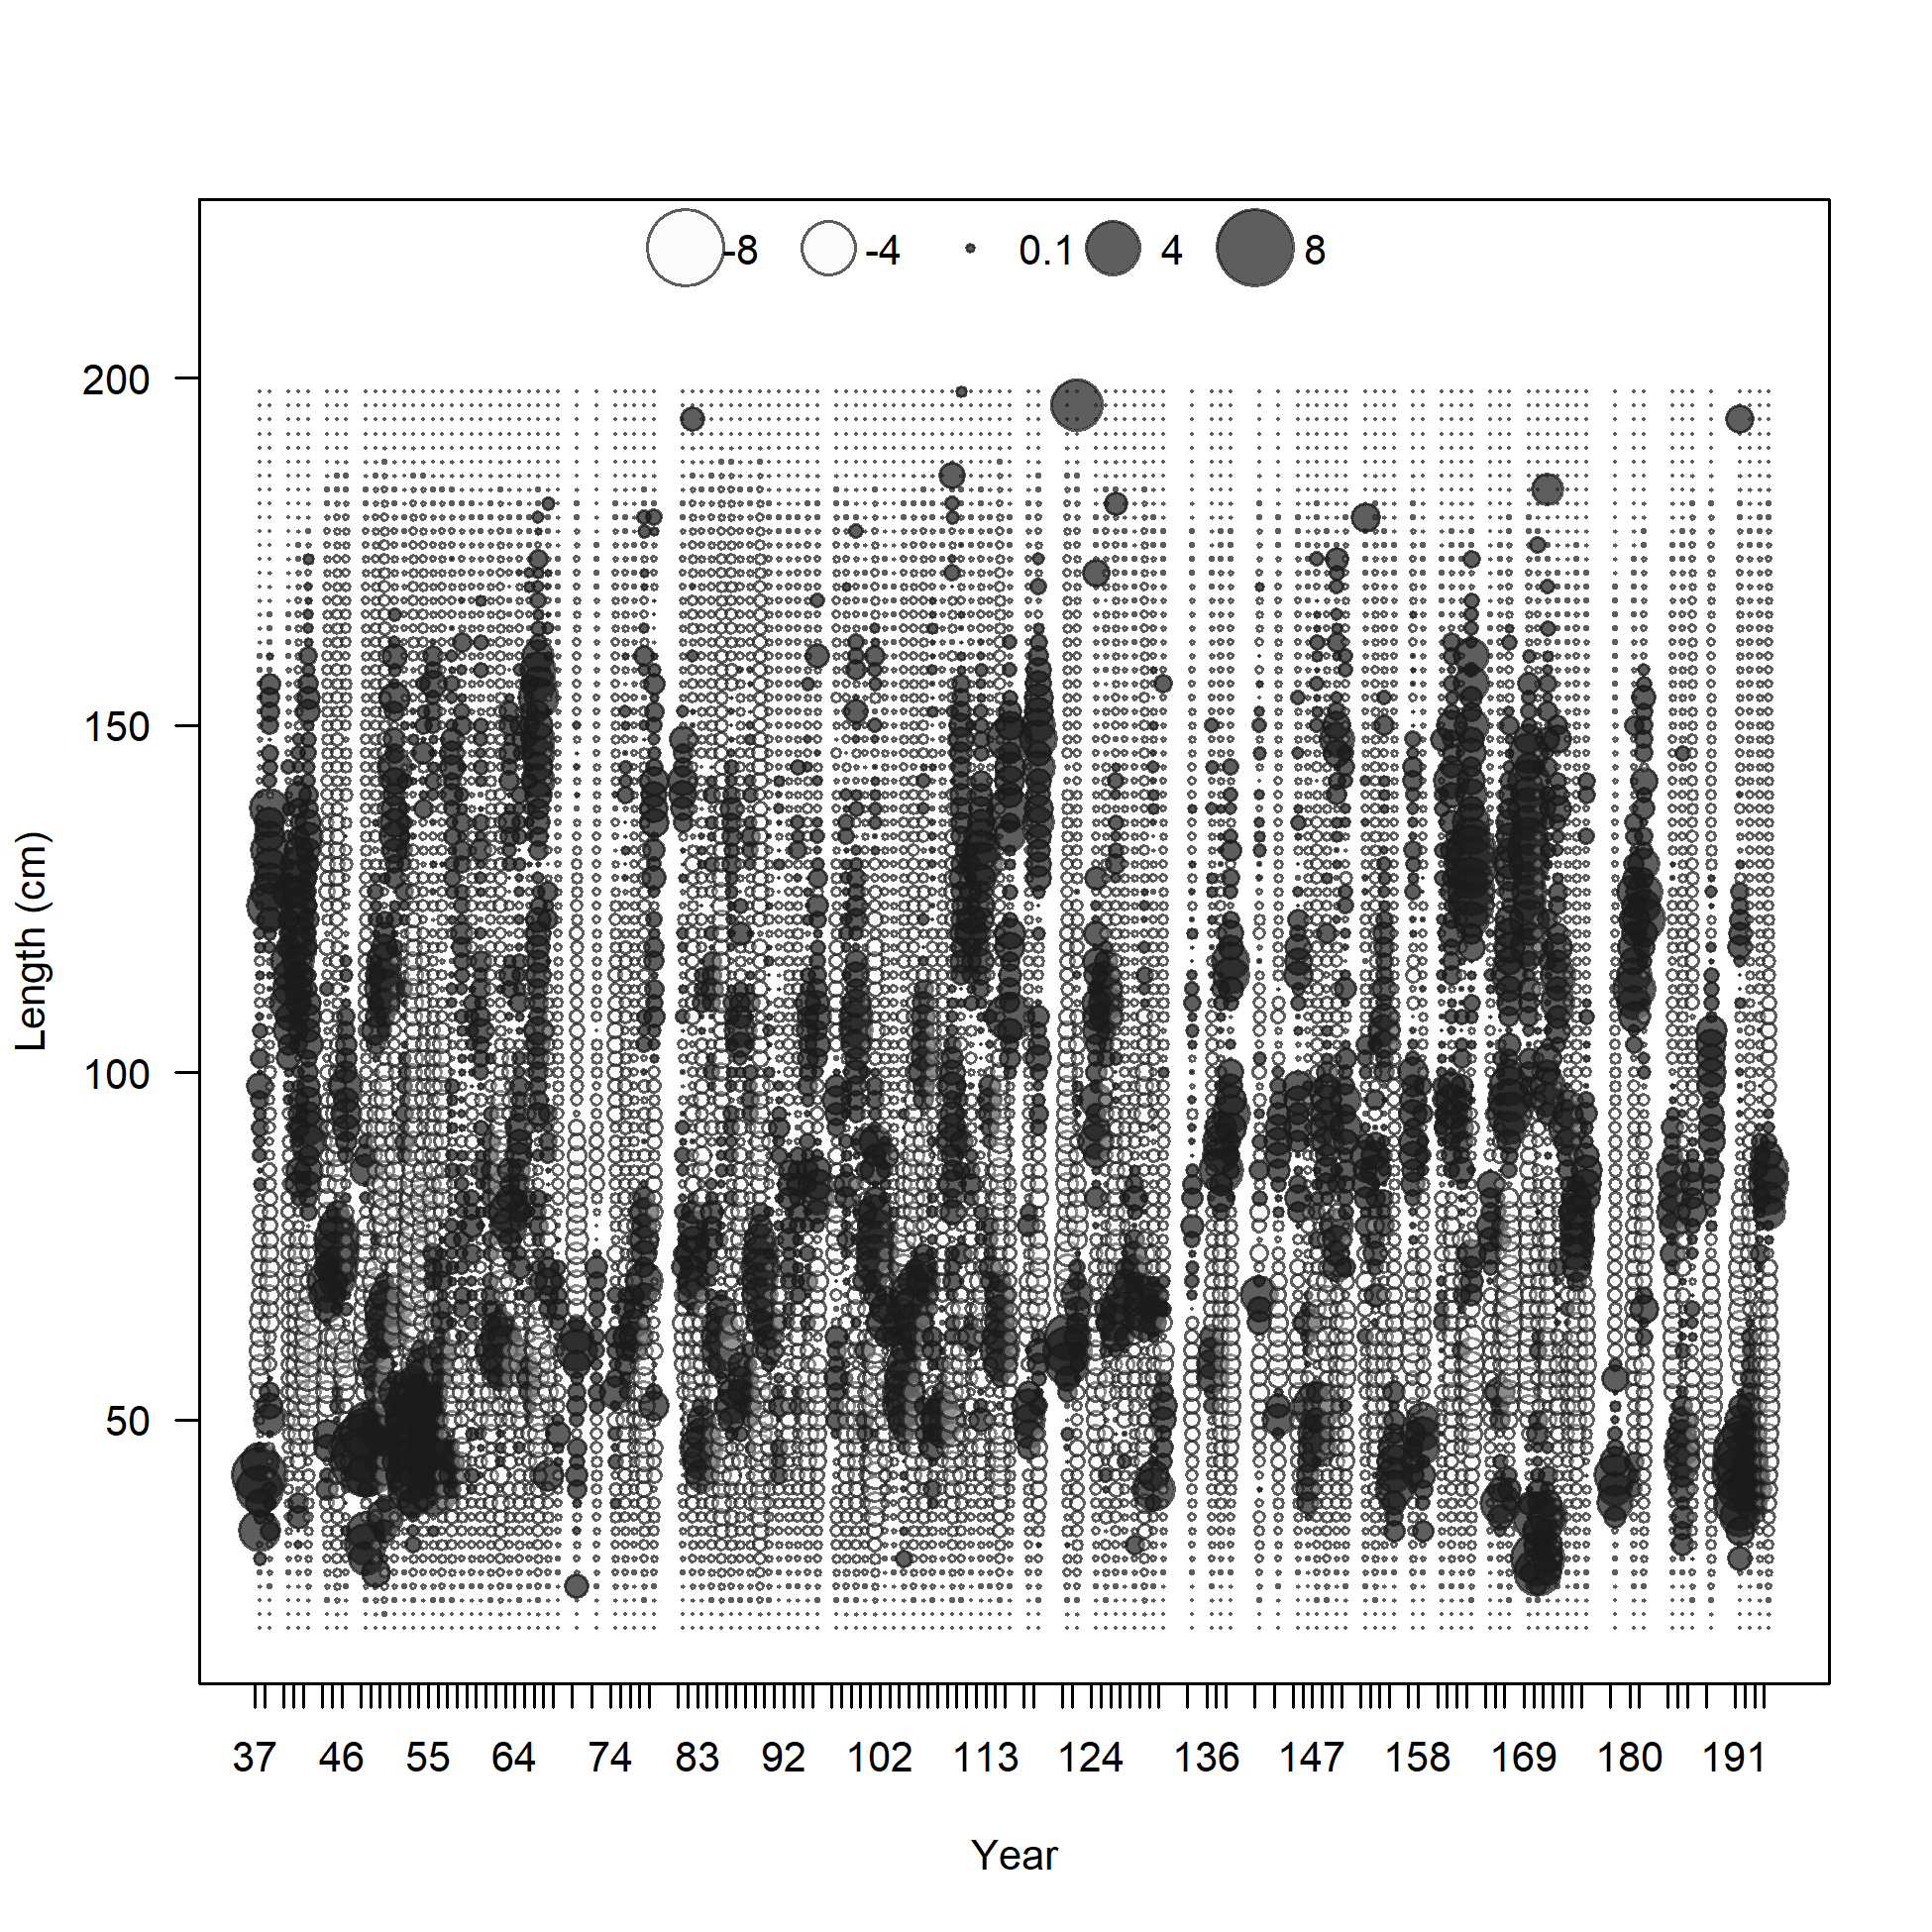
Pearson residuals, whole catch, F10.NOA.C.small (max=6.46) (plot 6 of 6)
Closed bubbles are positive residuals (observed > expected) and open bubbles are negative residuals (observed < expected).
file: comp_lenfit_residsflt10mkt0_page6.png
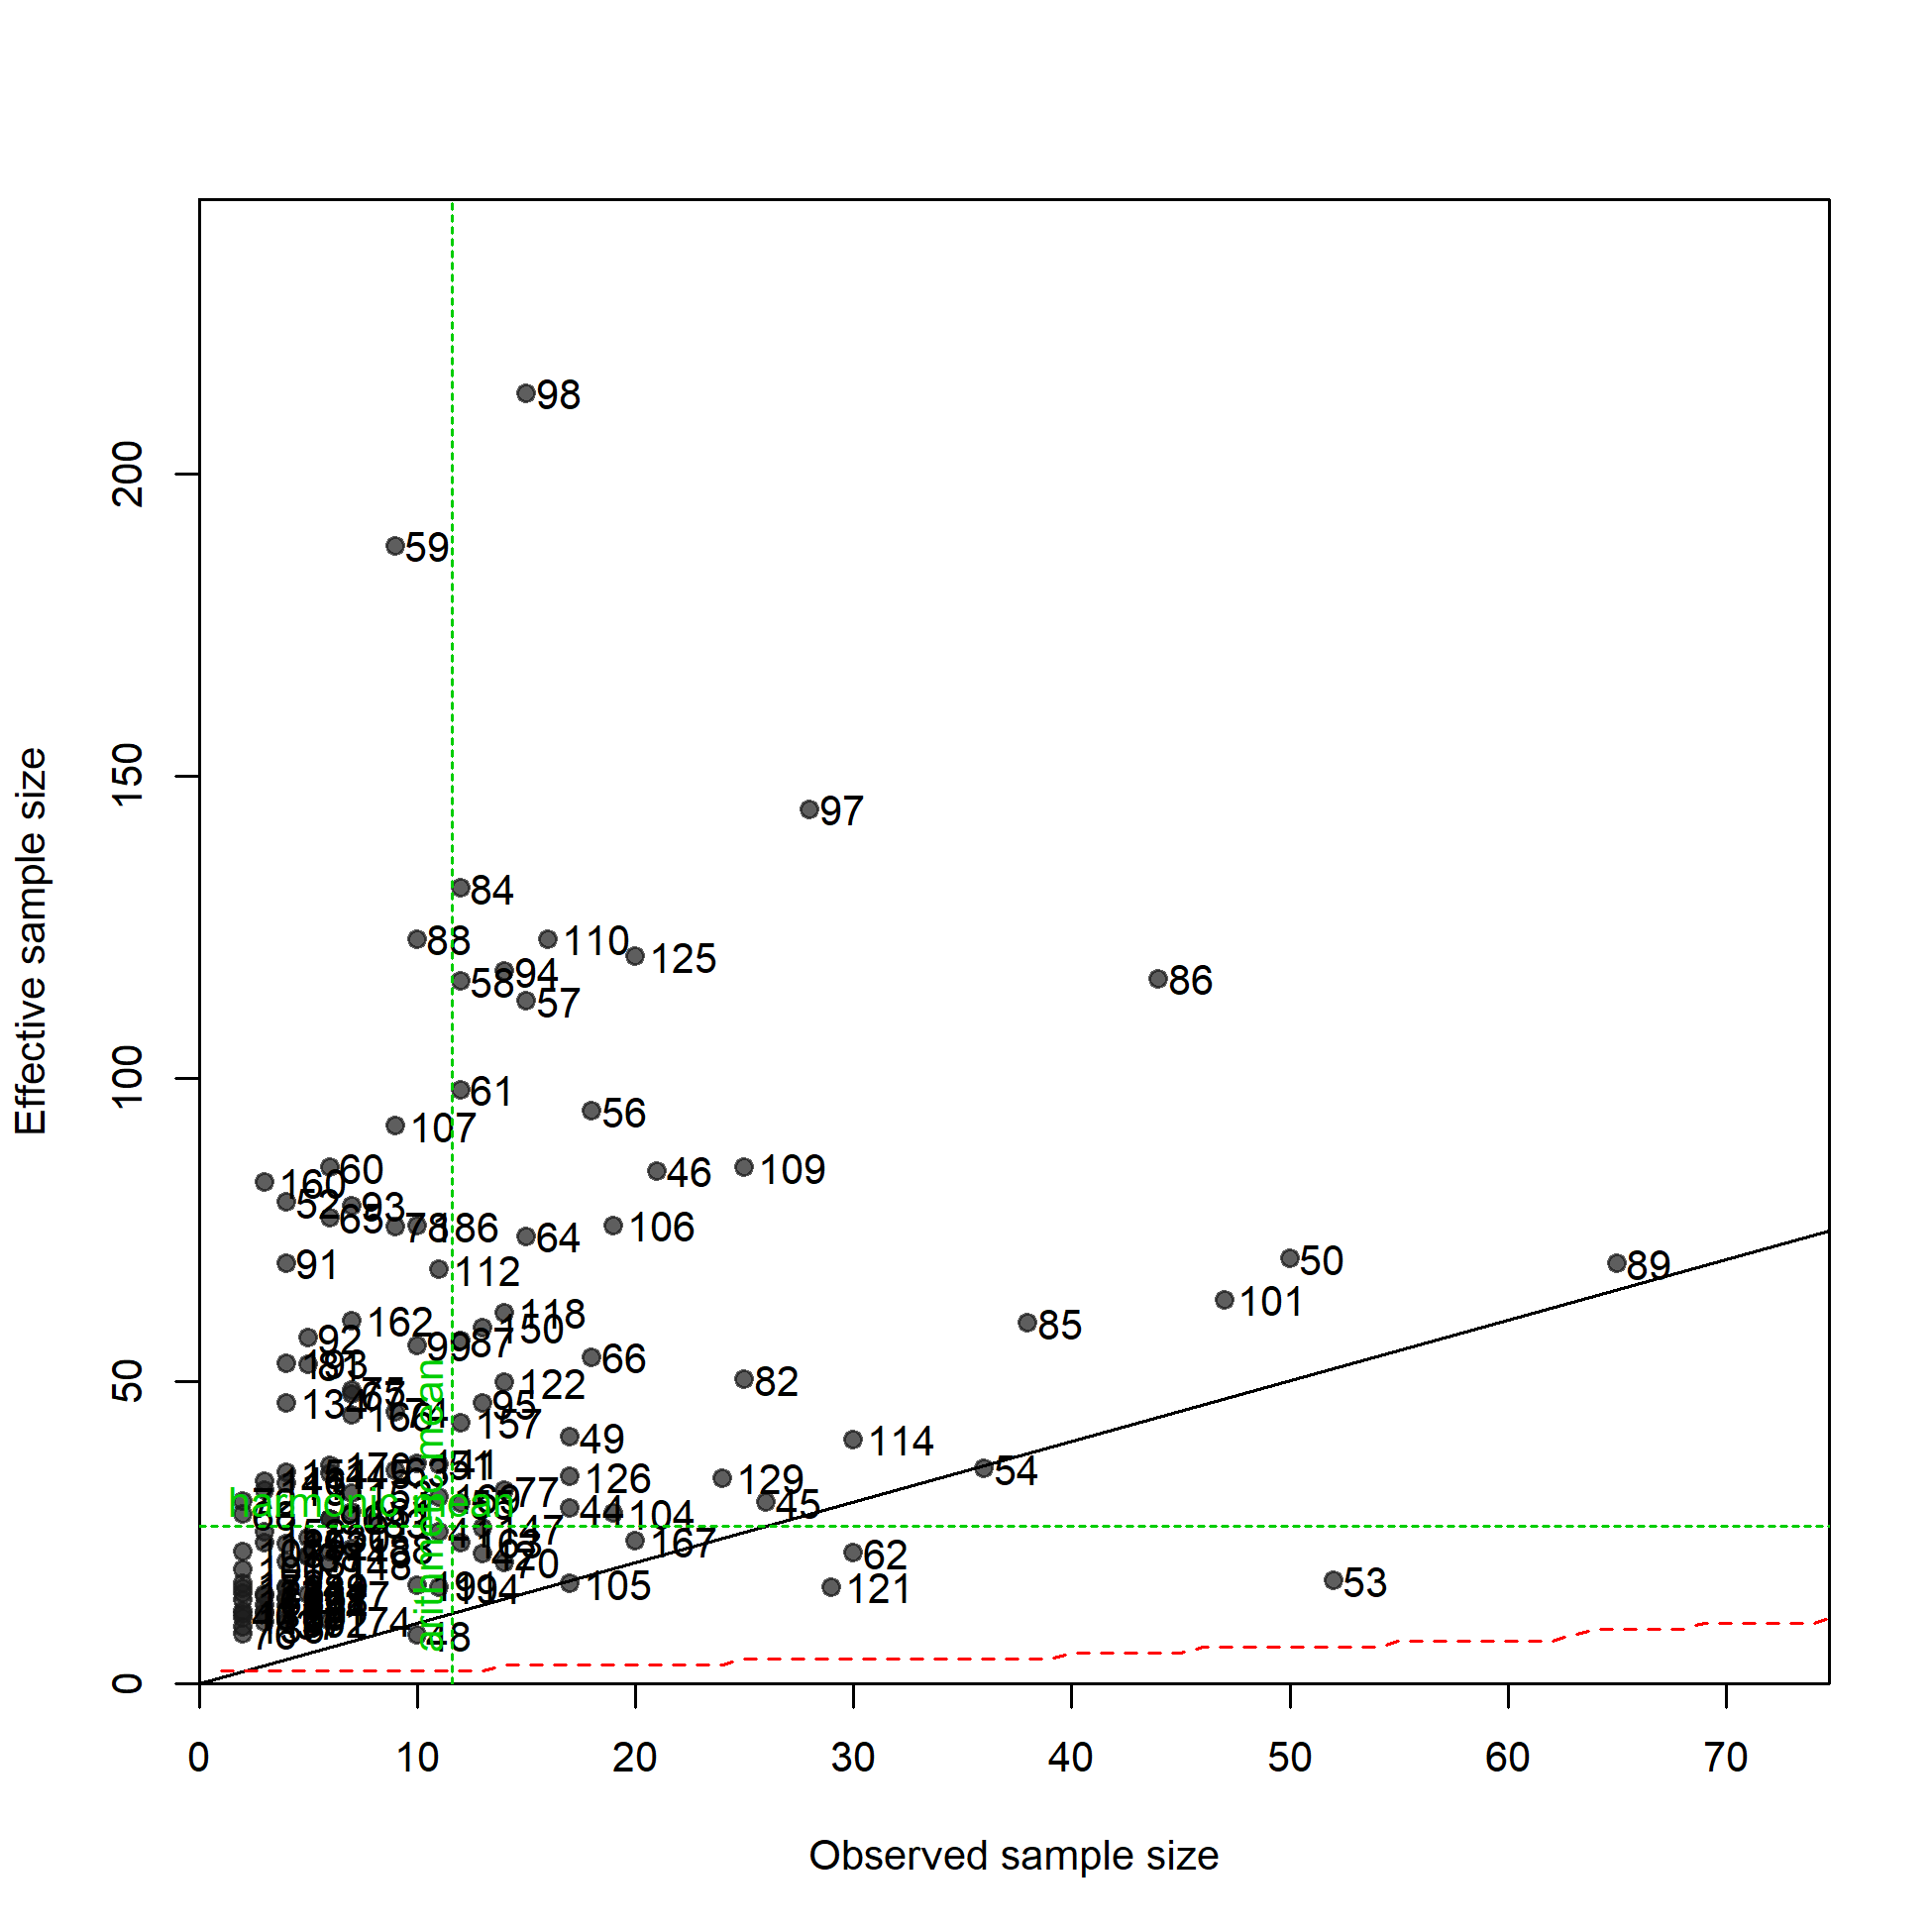
N-EffN comparison, Length comps, whole catch, F10.NOA.C.small
file: comp_lenfit_sampsize_flt10mkt0.png
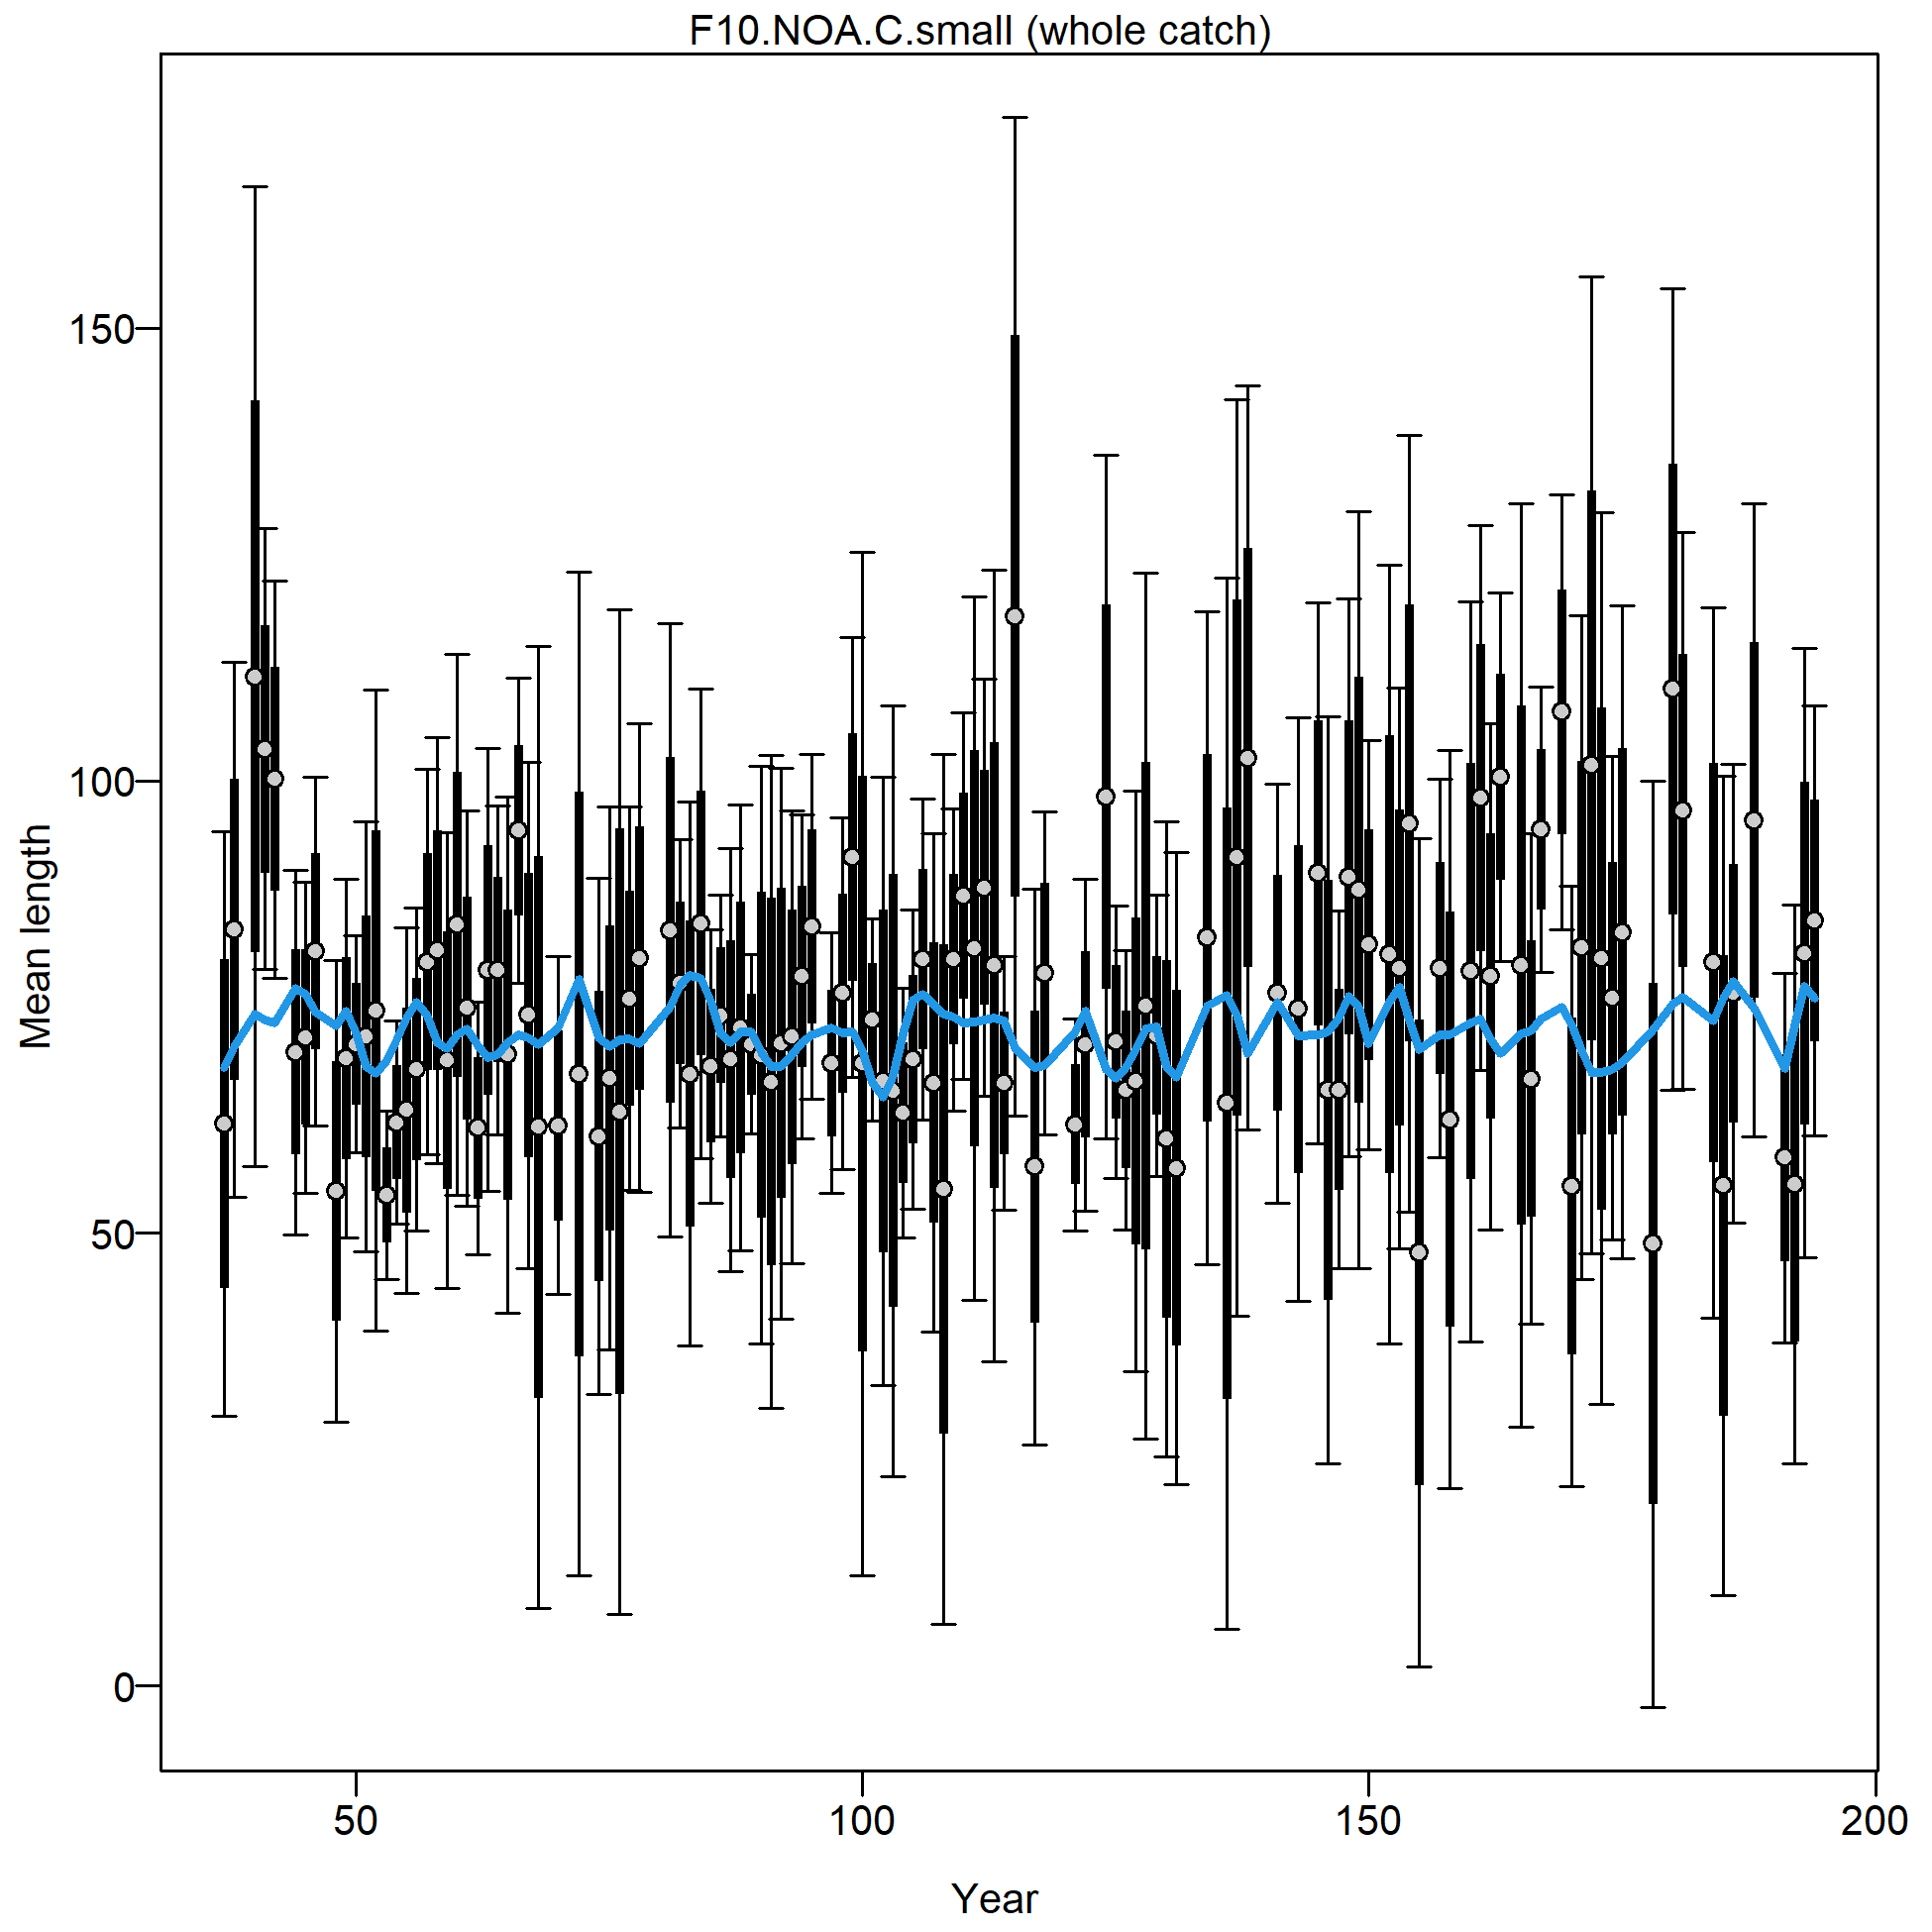
Mean length for F10.NOA.C.small with 95% confidence intervals based on current sample sizes.
Francis data weighting method TA1.8: thinner intervals (with capped ends) show result of further adjusting sample sizes based on suggested multiplier (with 95% interval) for len data from F10.NOA.C.small:
0.3166 (0.2418-0.4417)
For more info, see Francis (2011).
file: comp_lenfit_data_weighting_TA1.8_F10.NOA.C.small.png
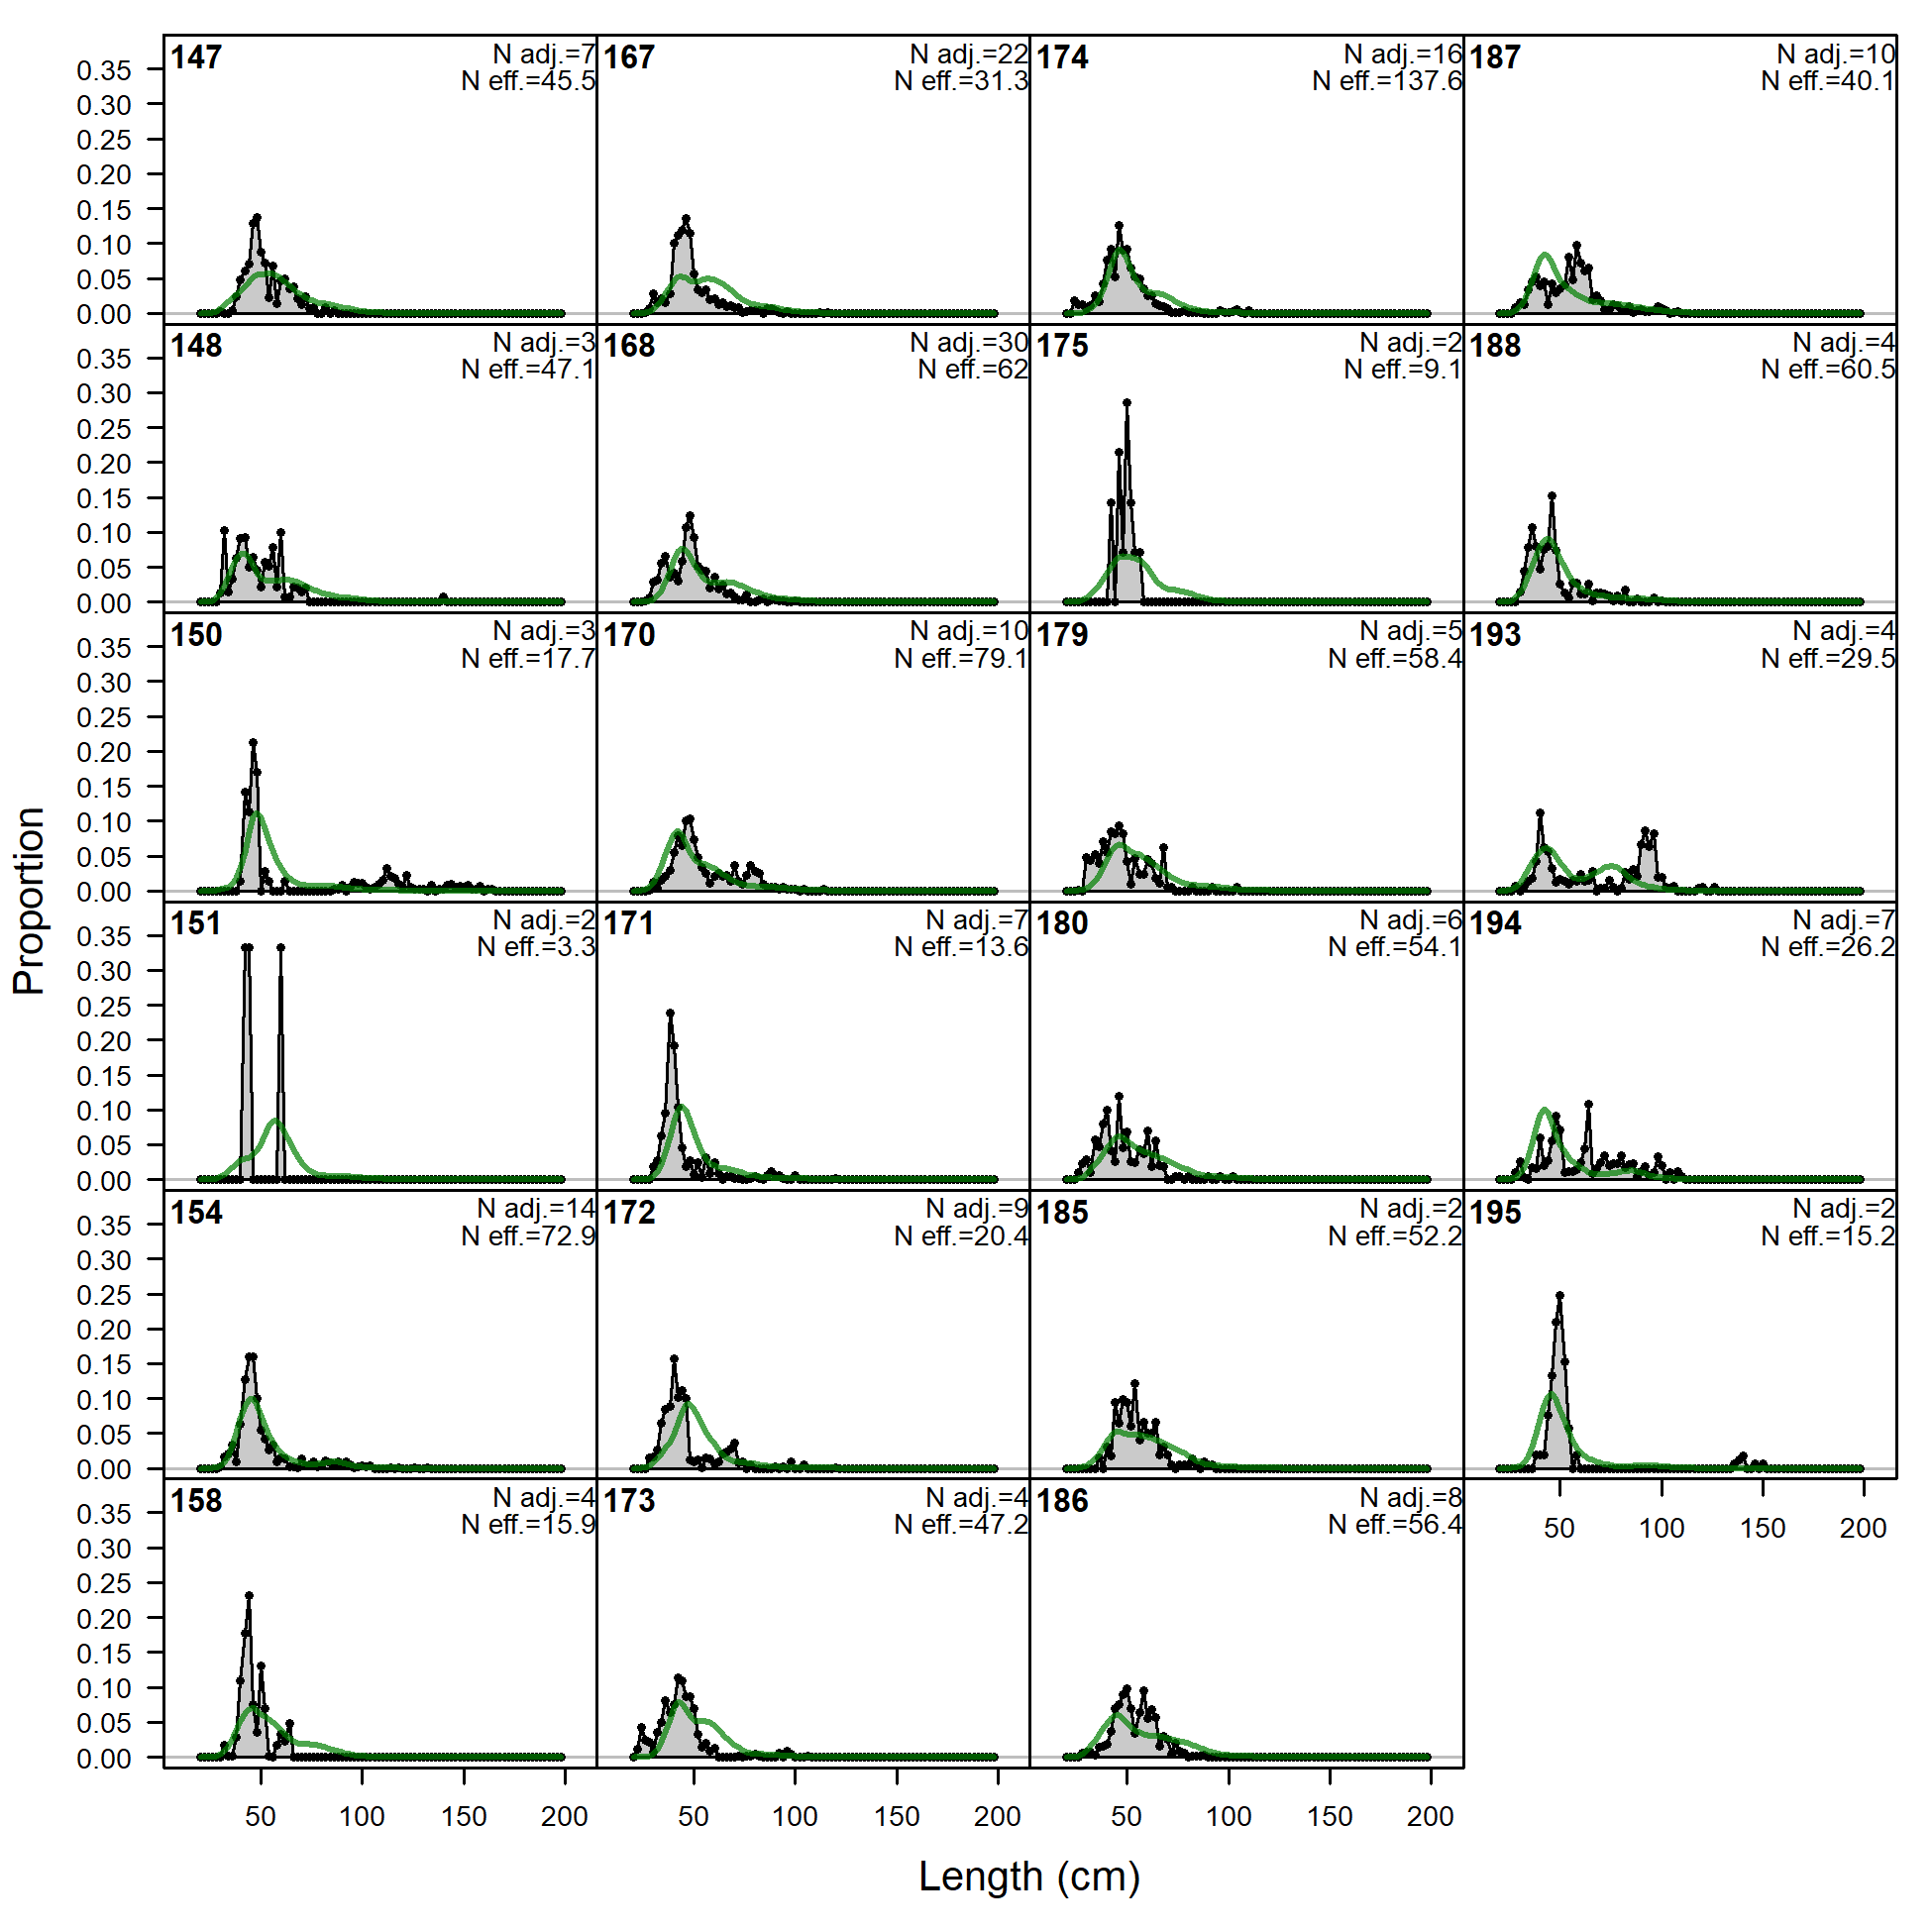
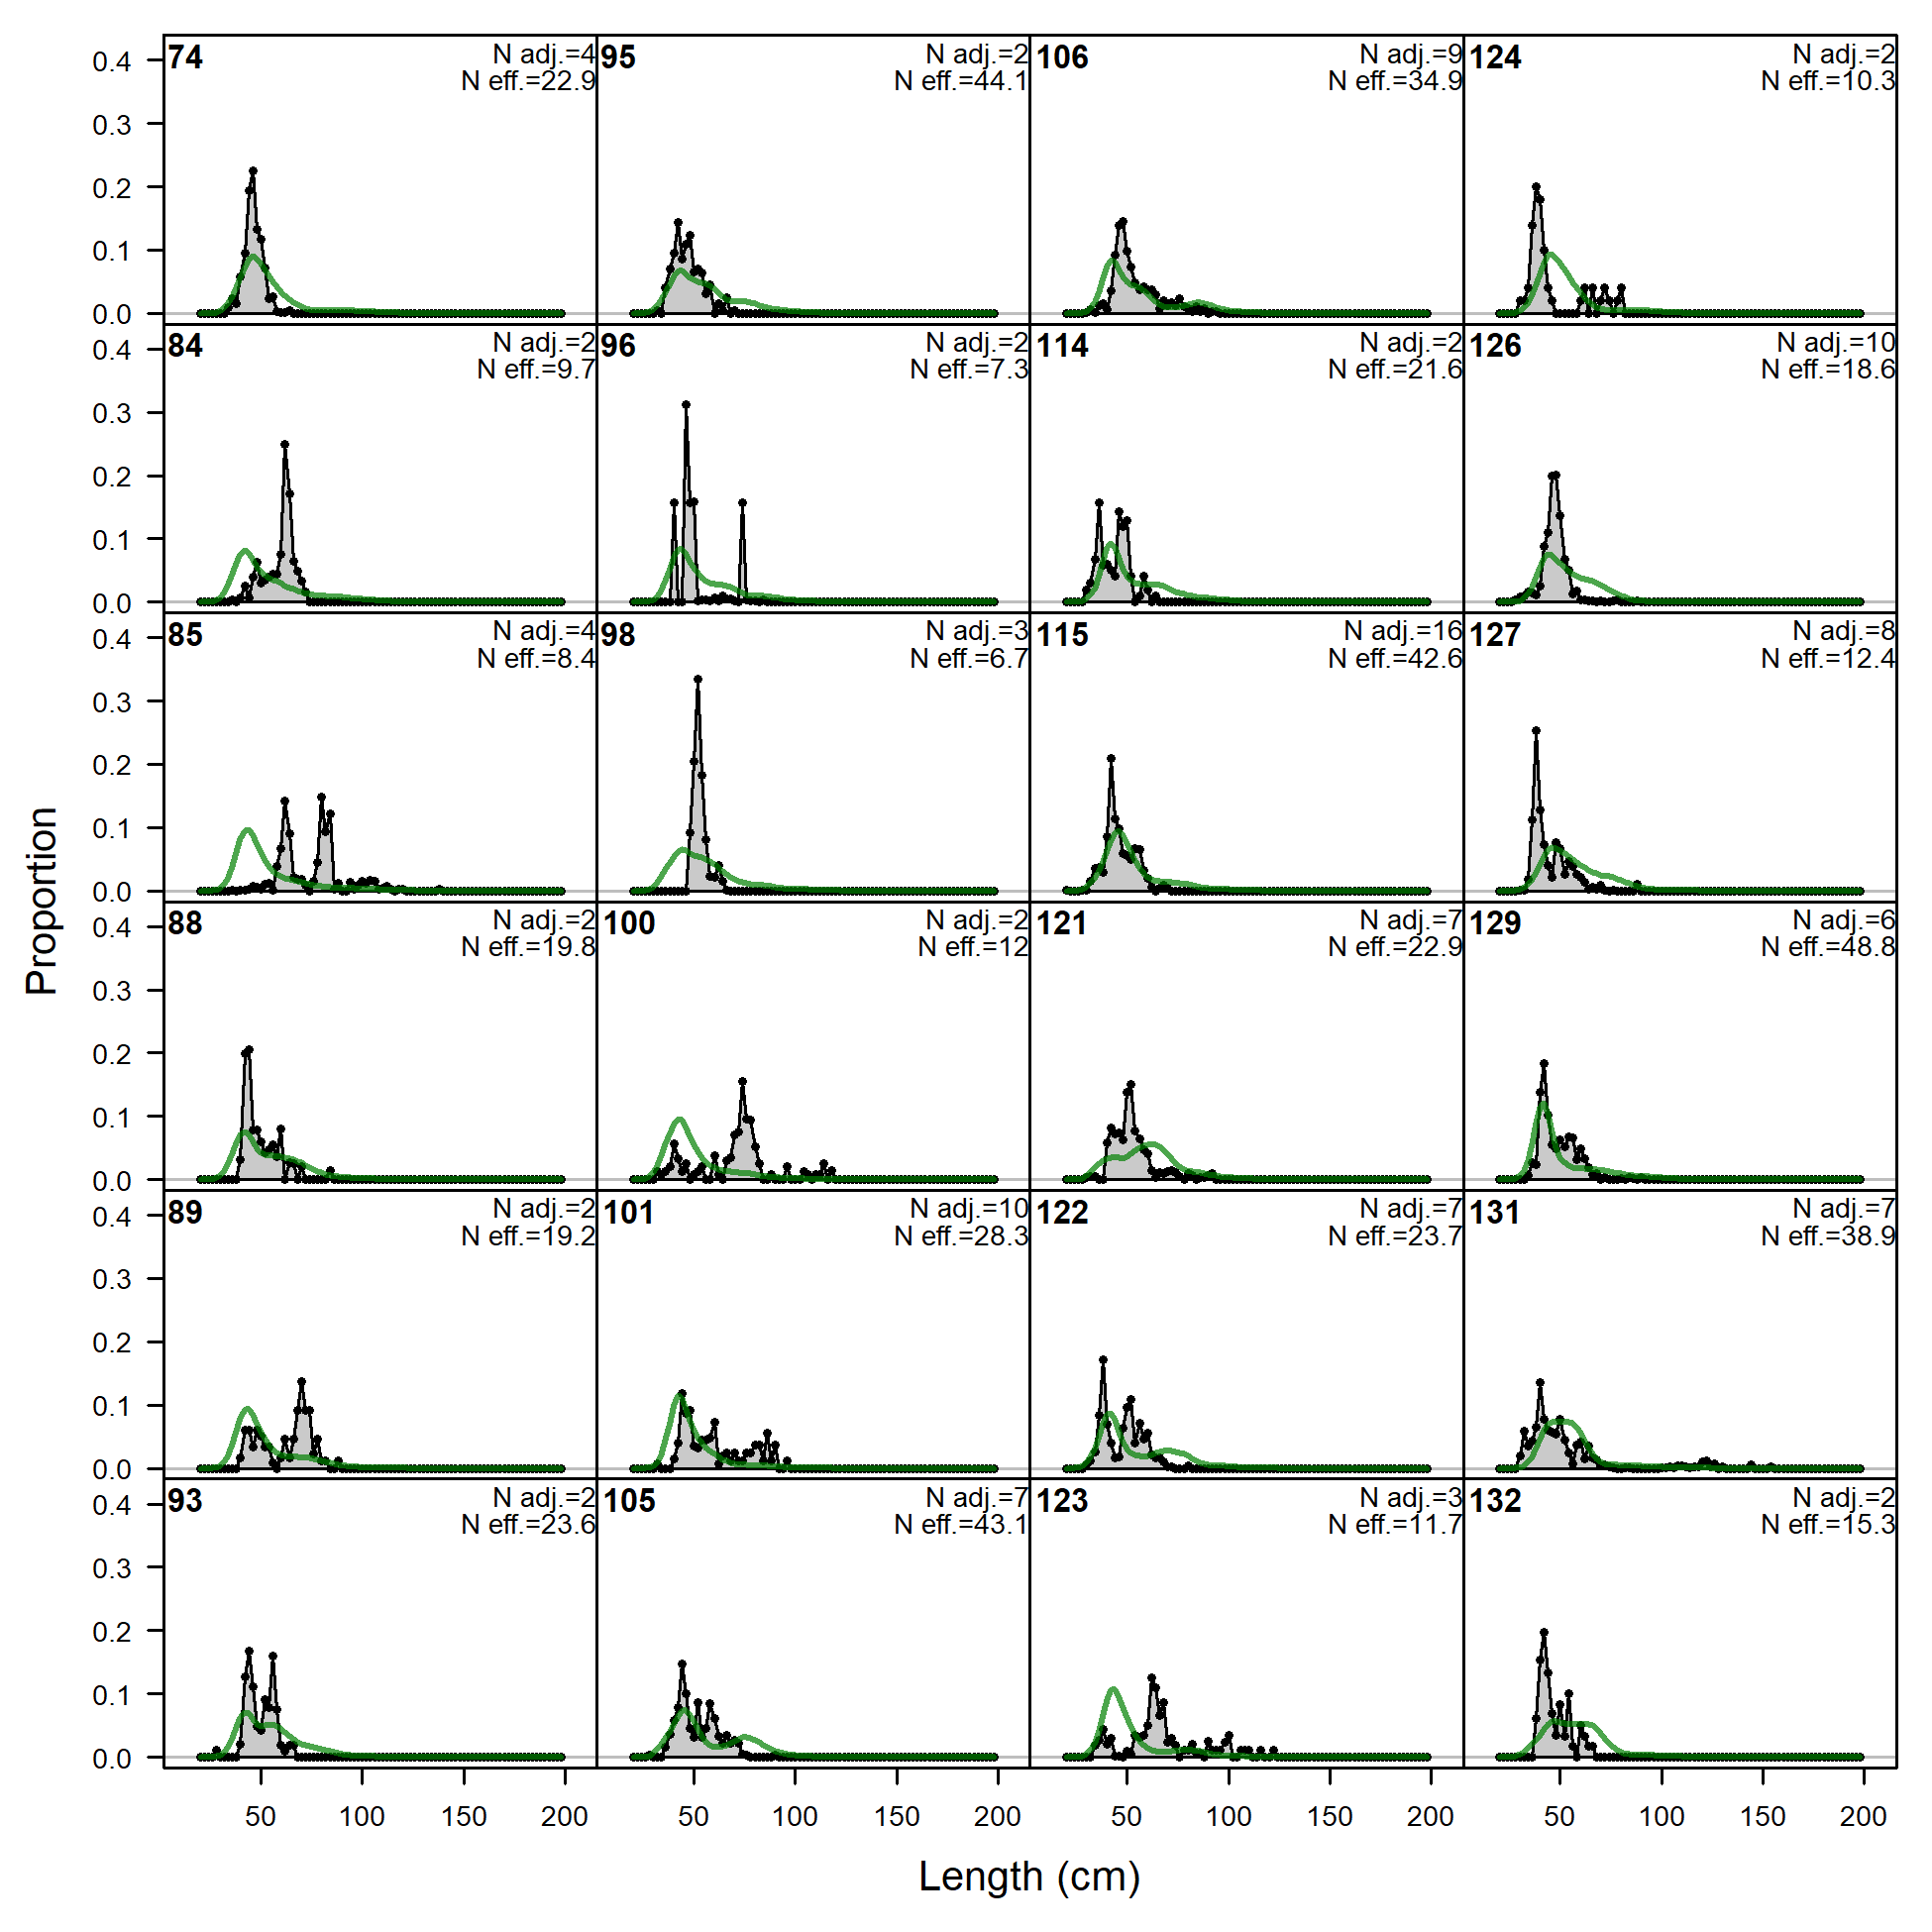
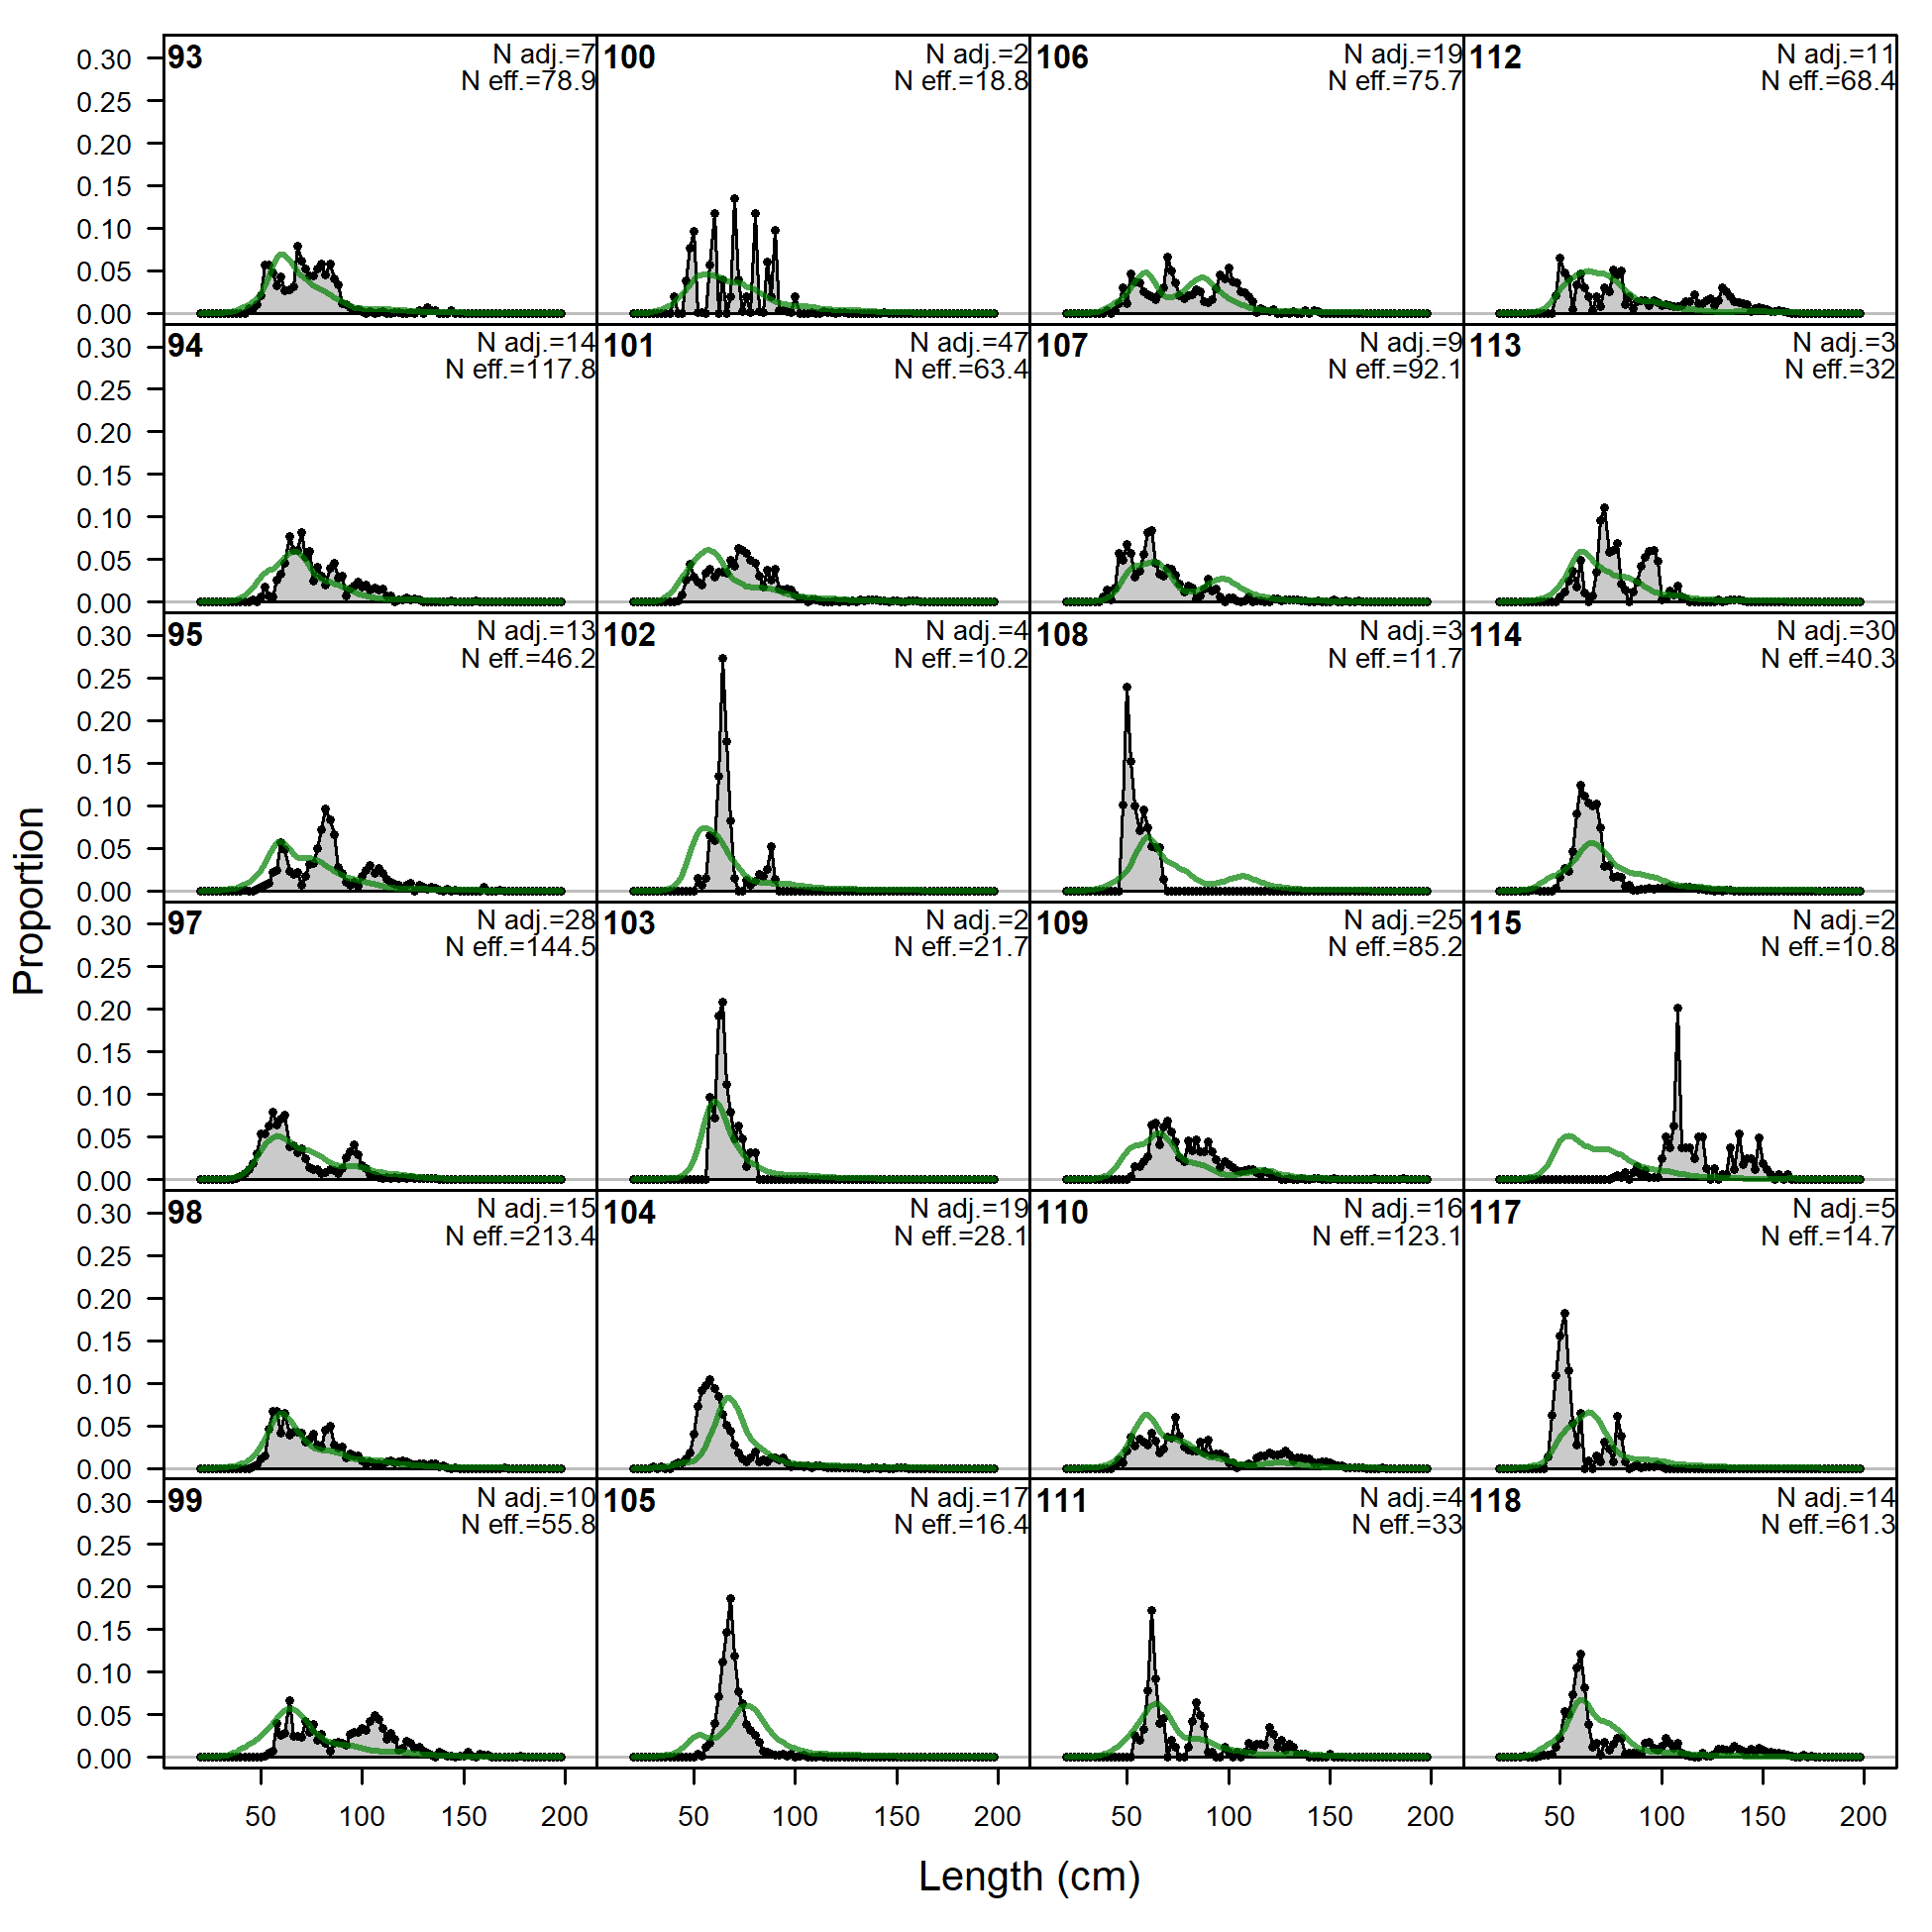
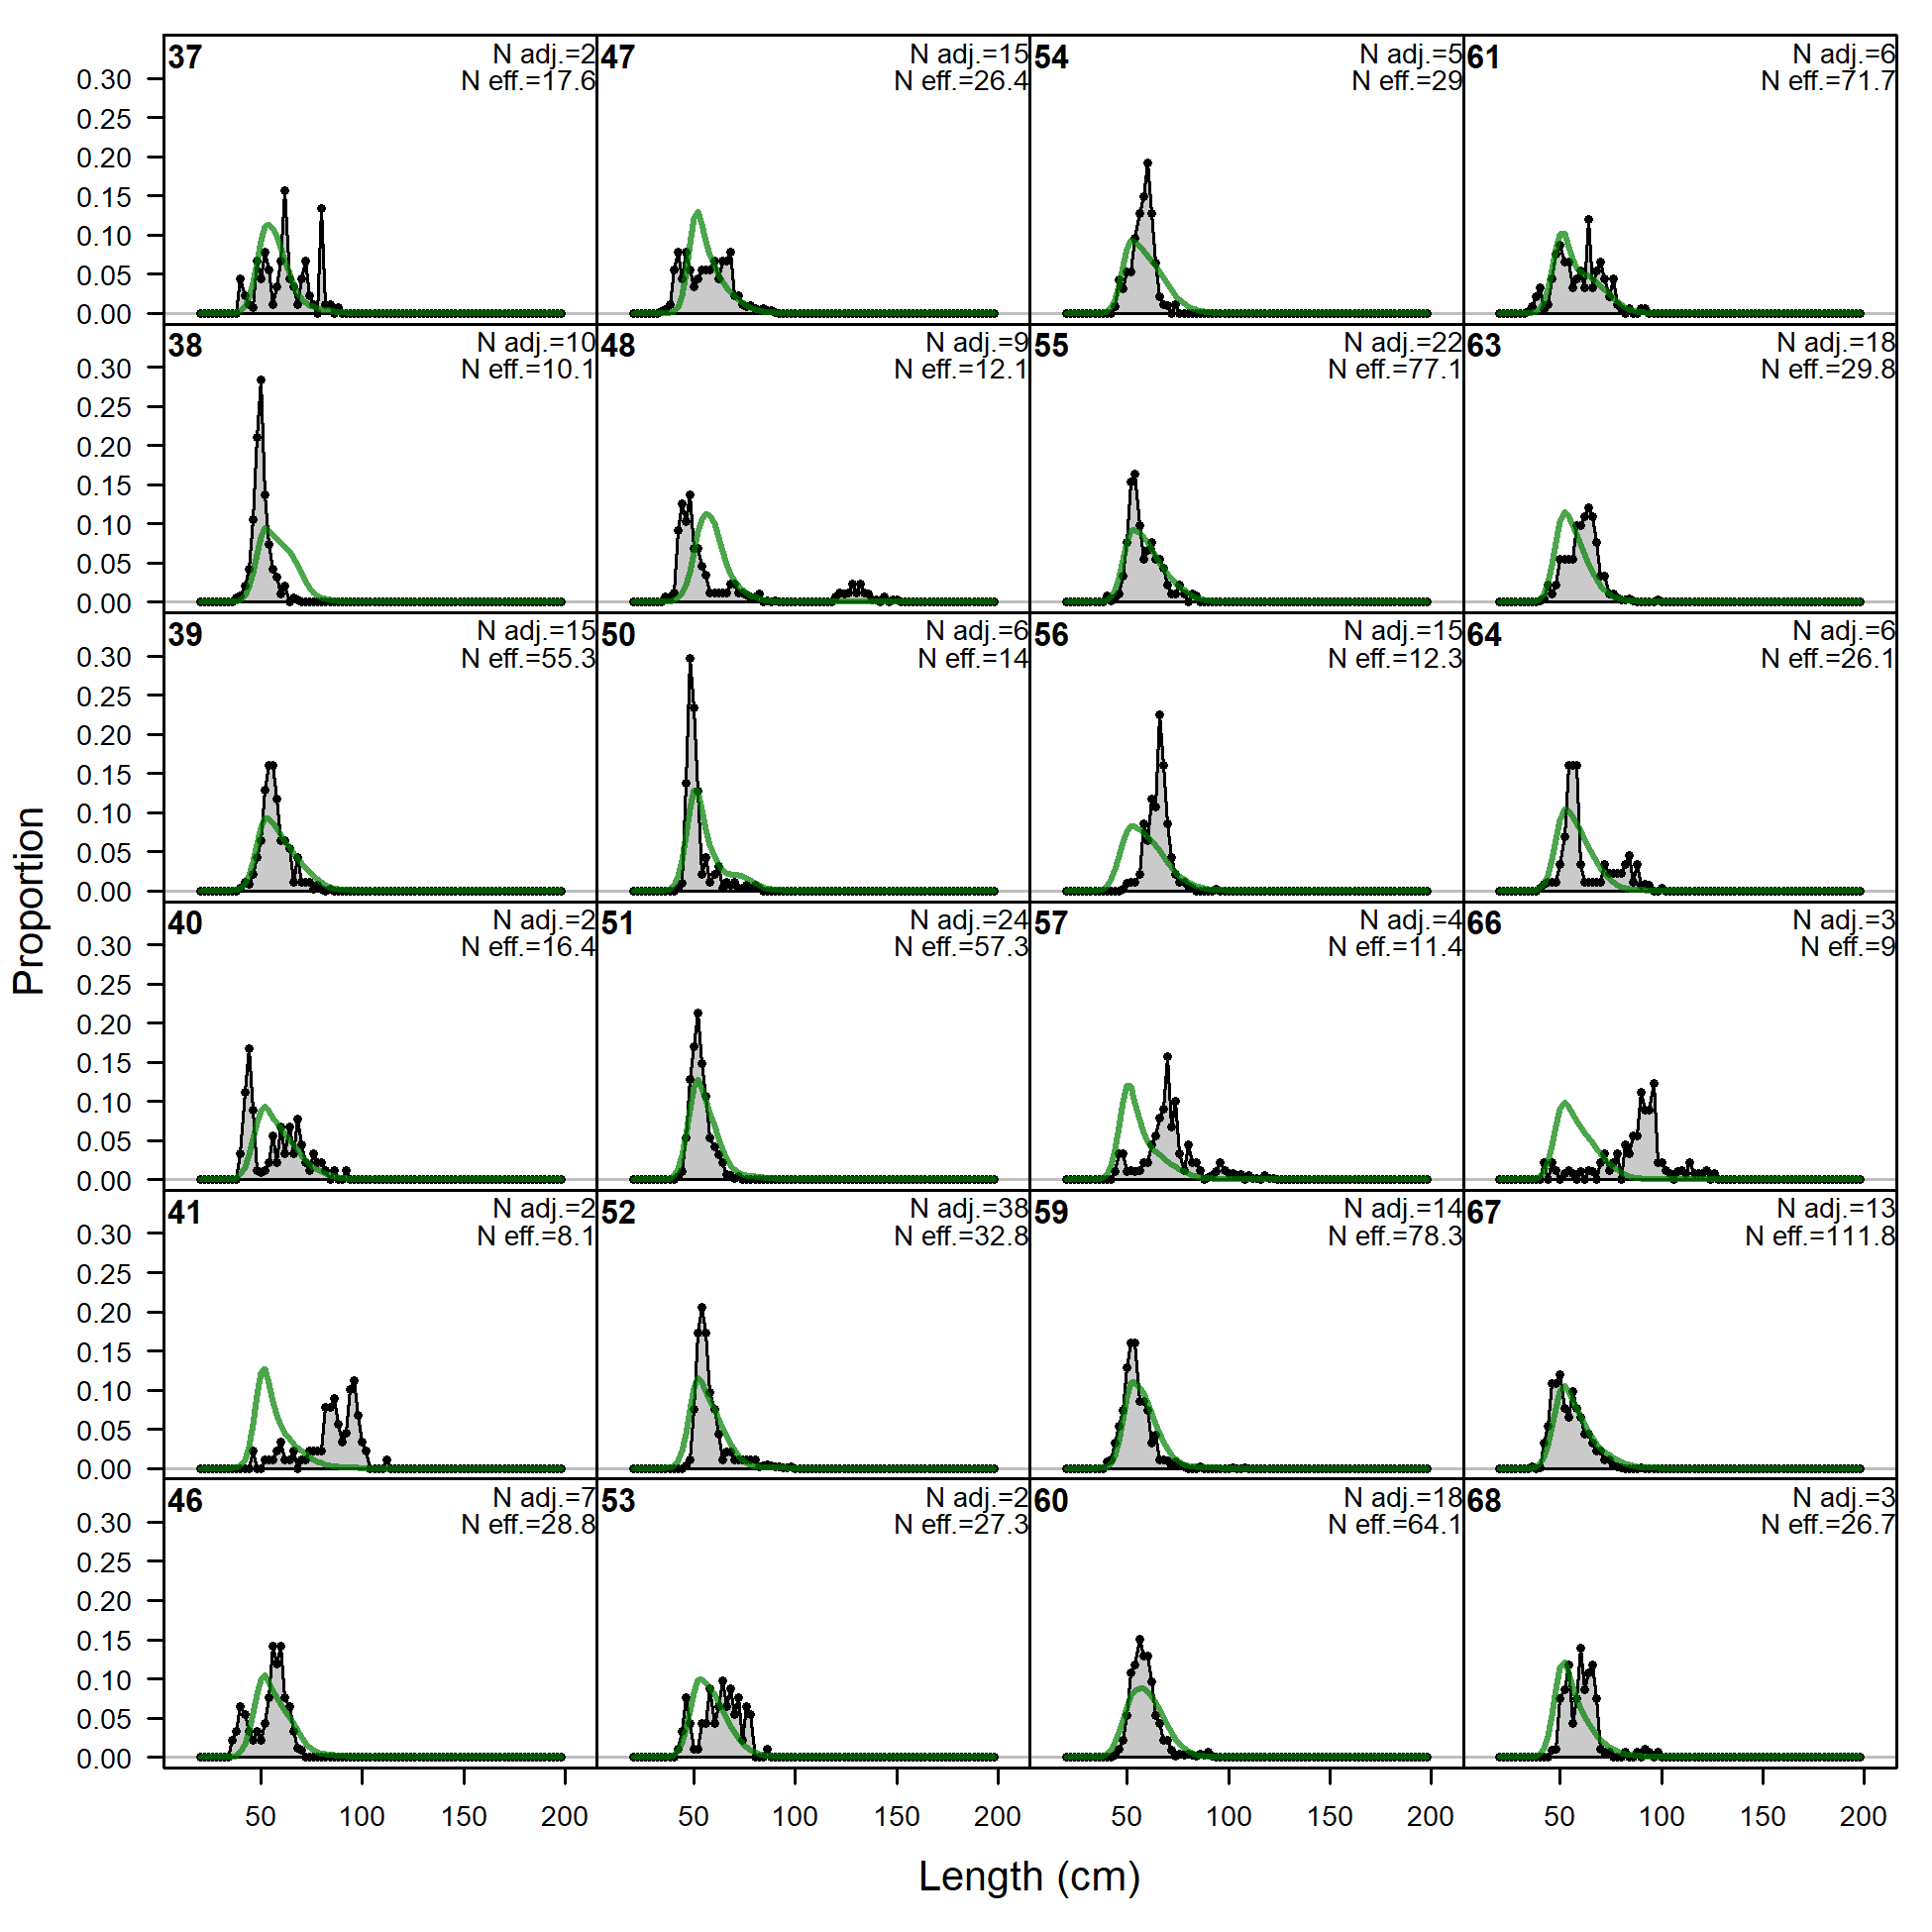
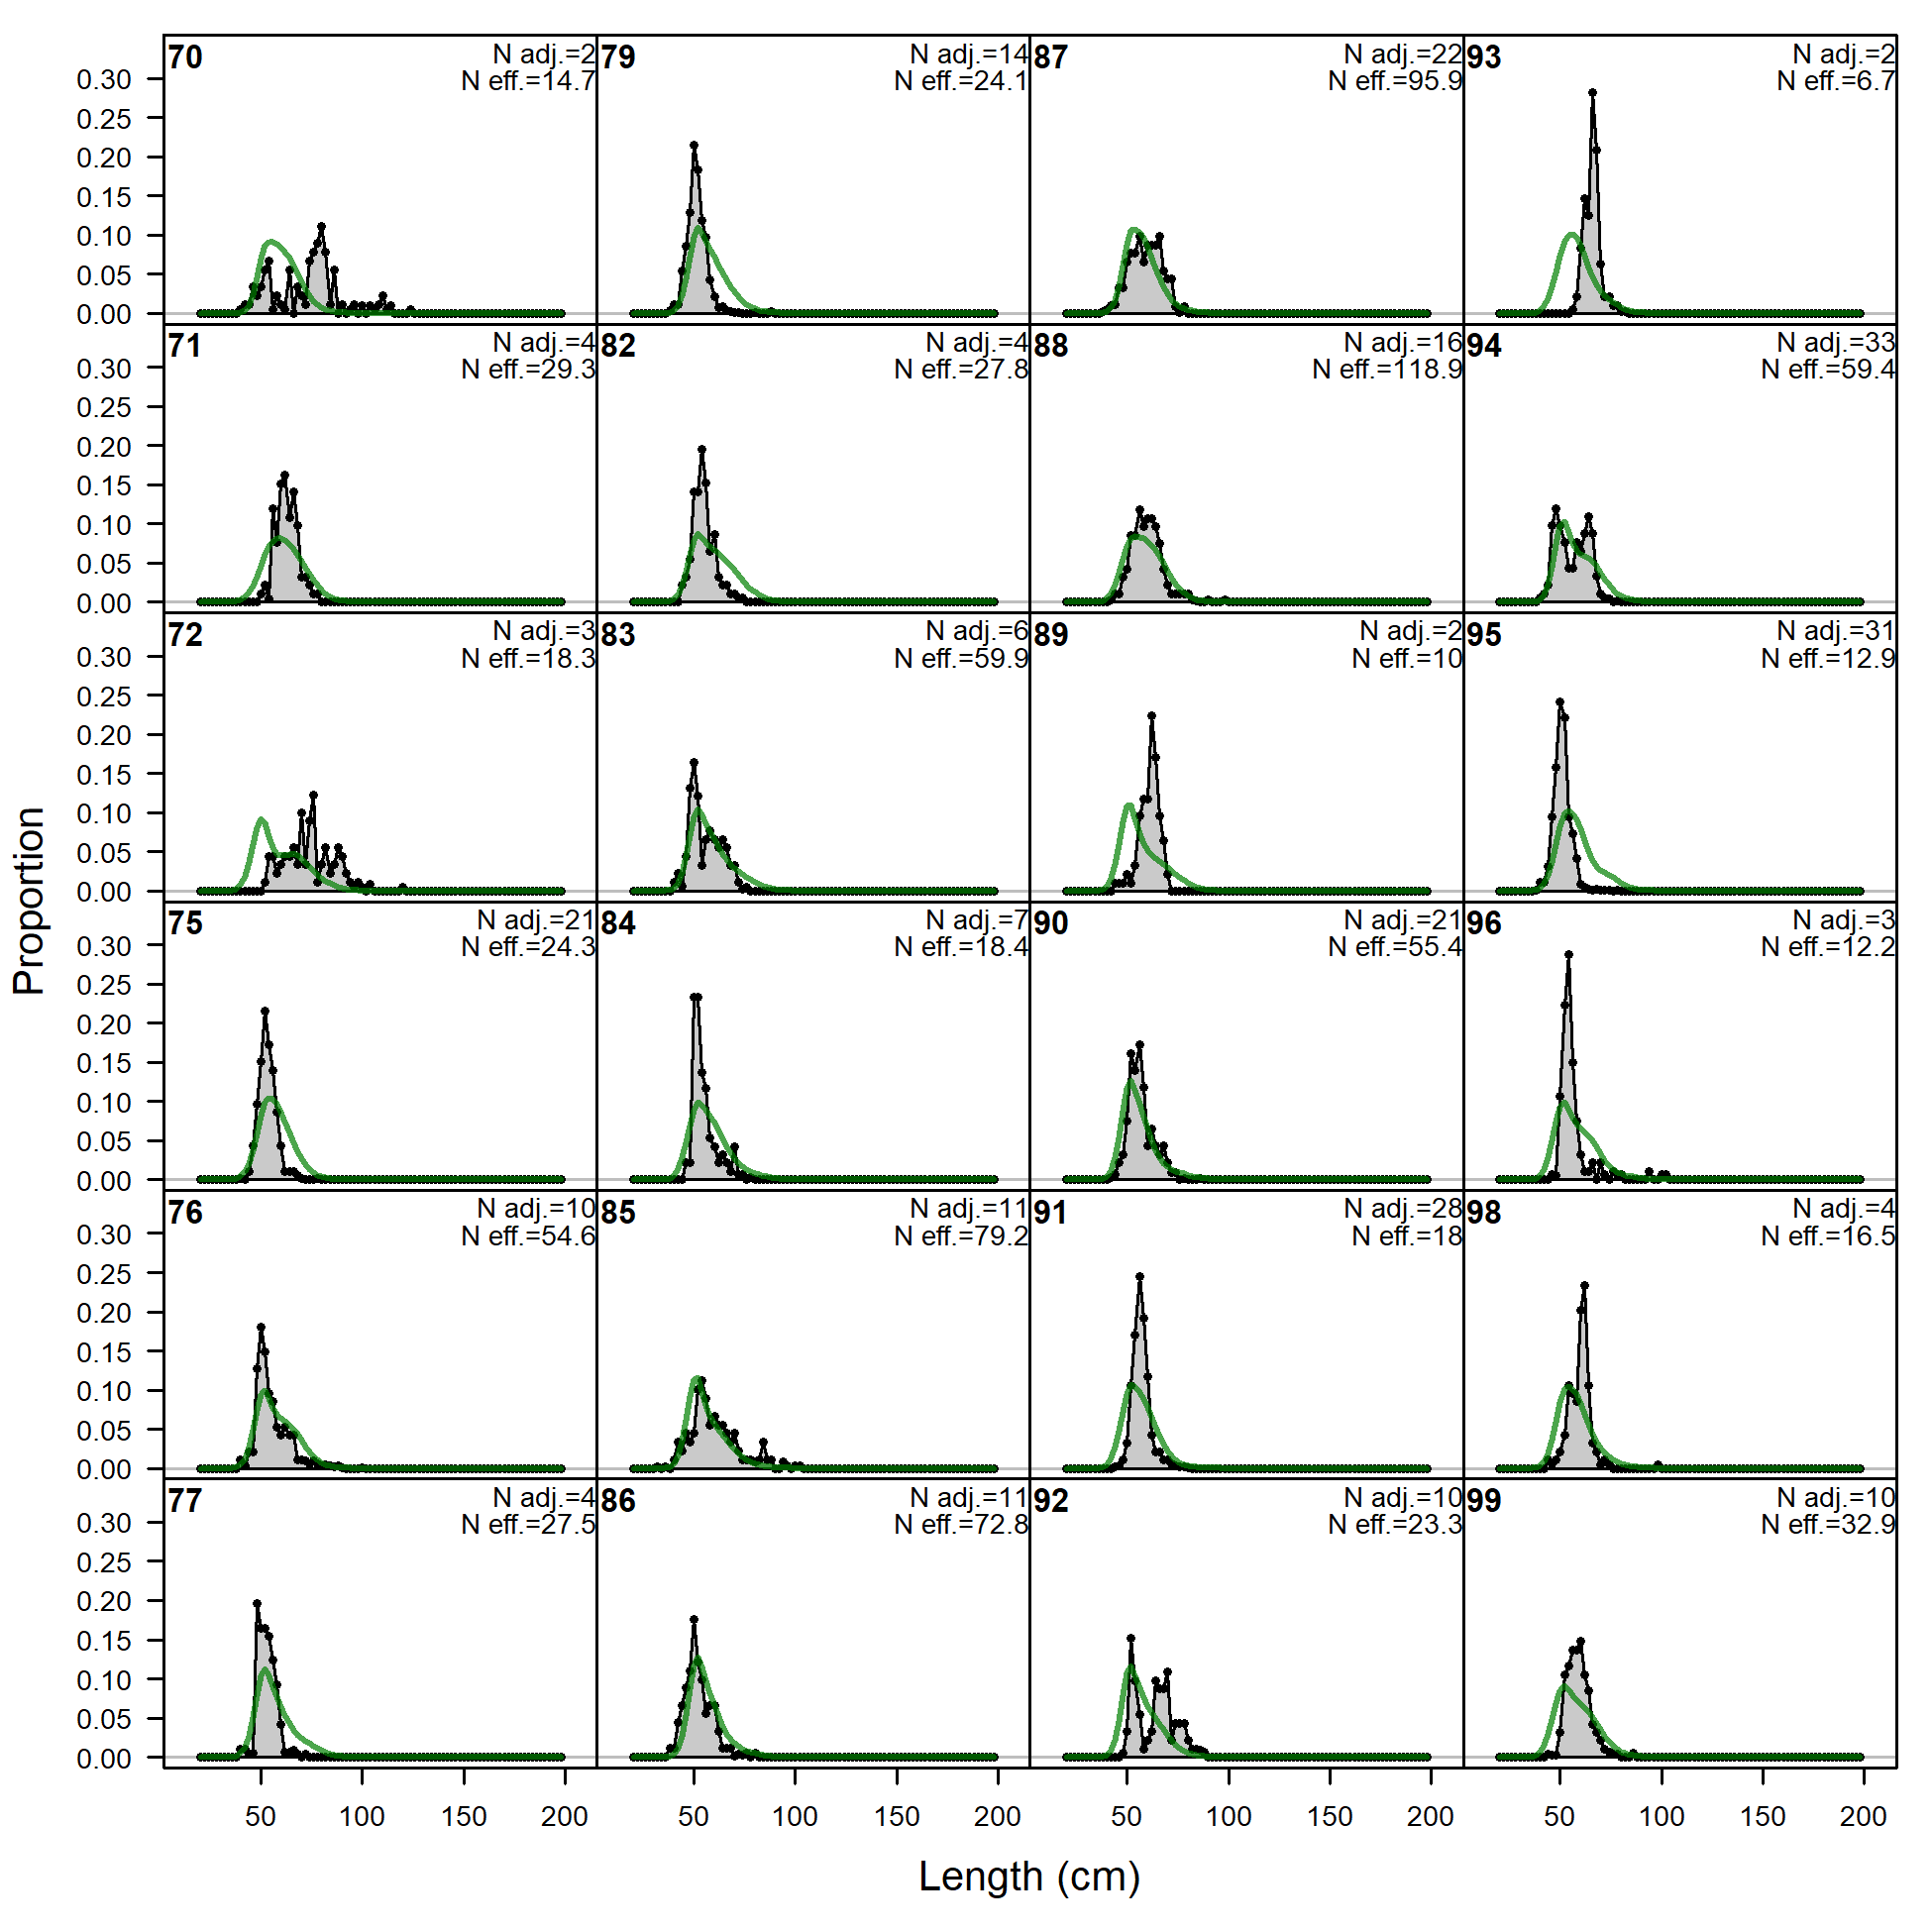
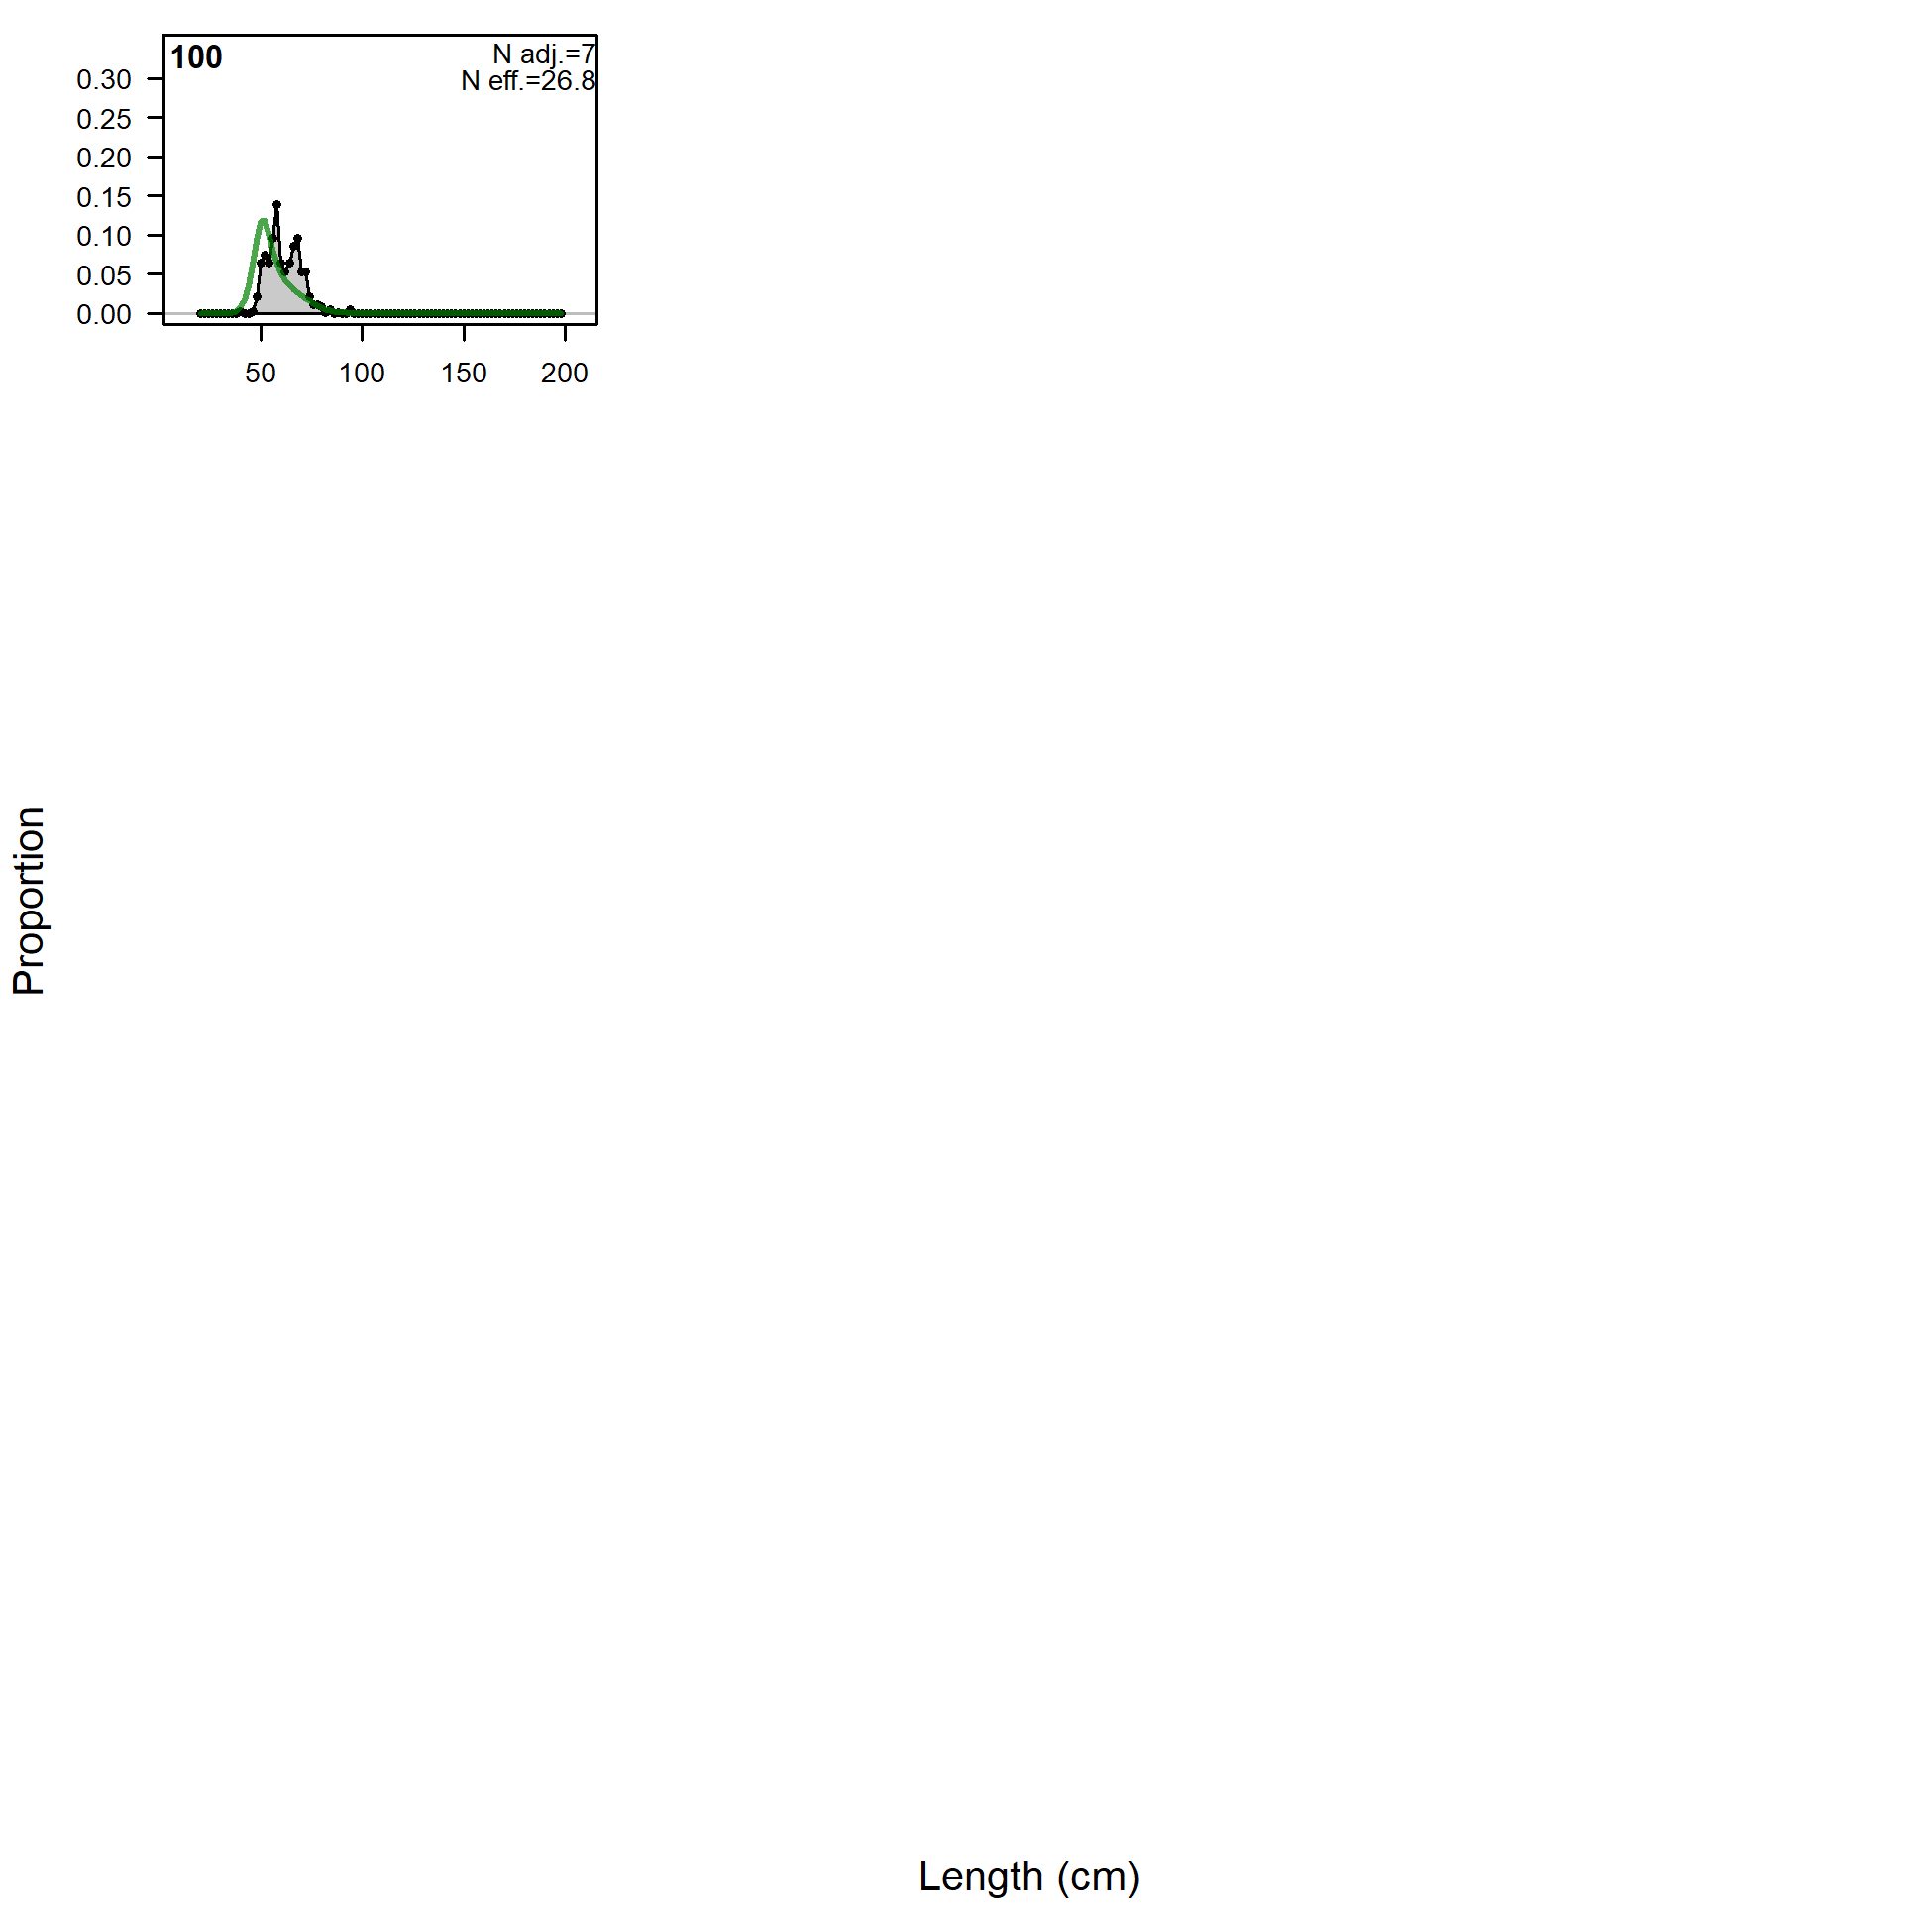
Length comps, whole catch, F19.DEL.C.inshore (plot 1 of 7).
'N adj.' is the input sample size after data-weighting adjustment. N eff. is the calculated effective sample size used in the McAllister-Ianelli tuning method.
file: comp_lenfit_flt19mkt0_page1.png
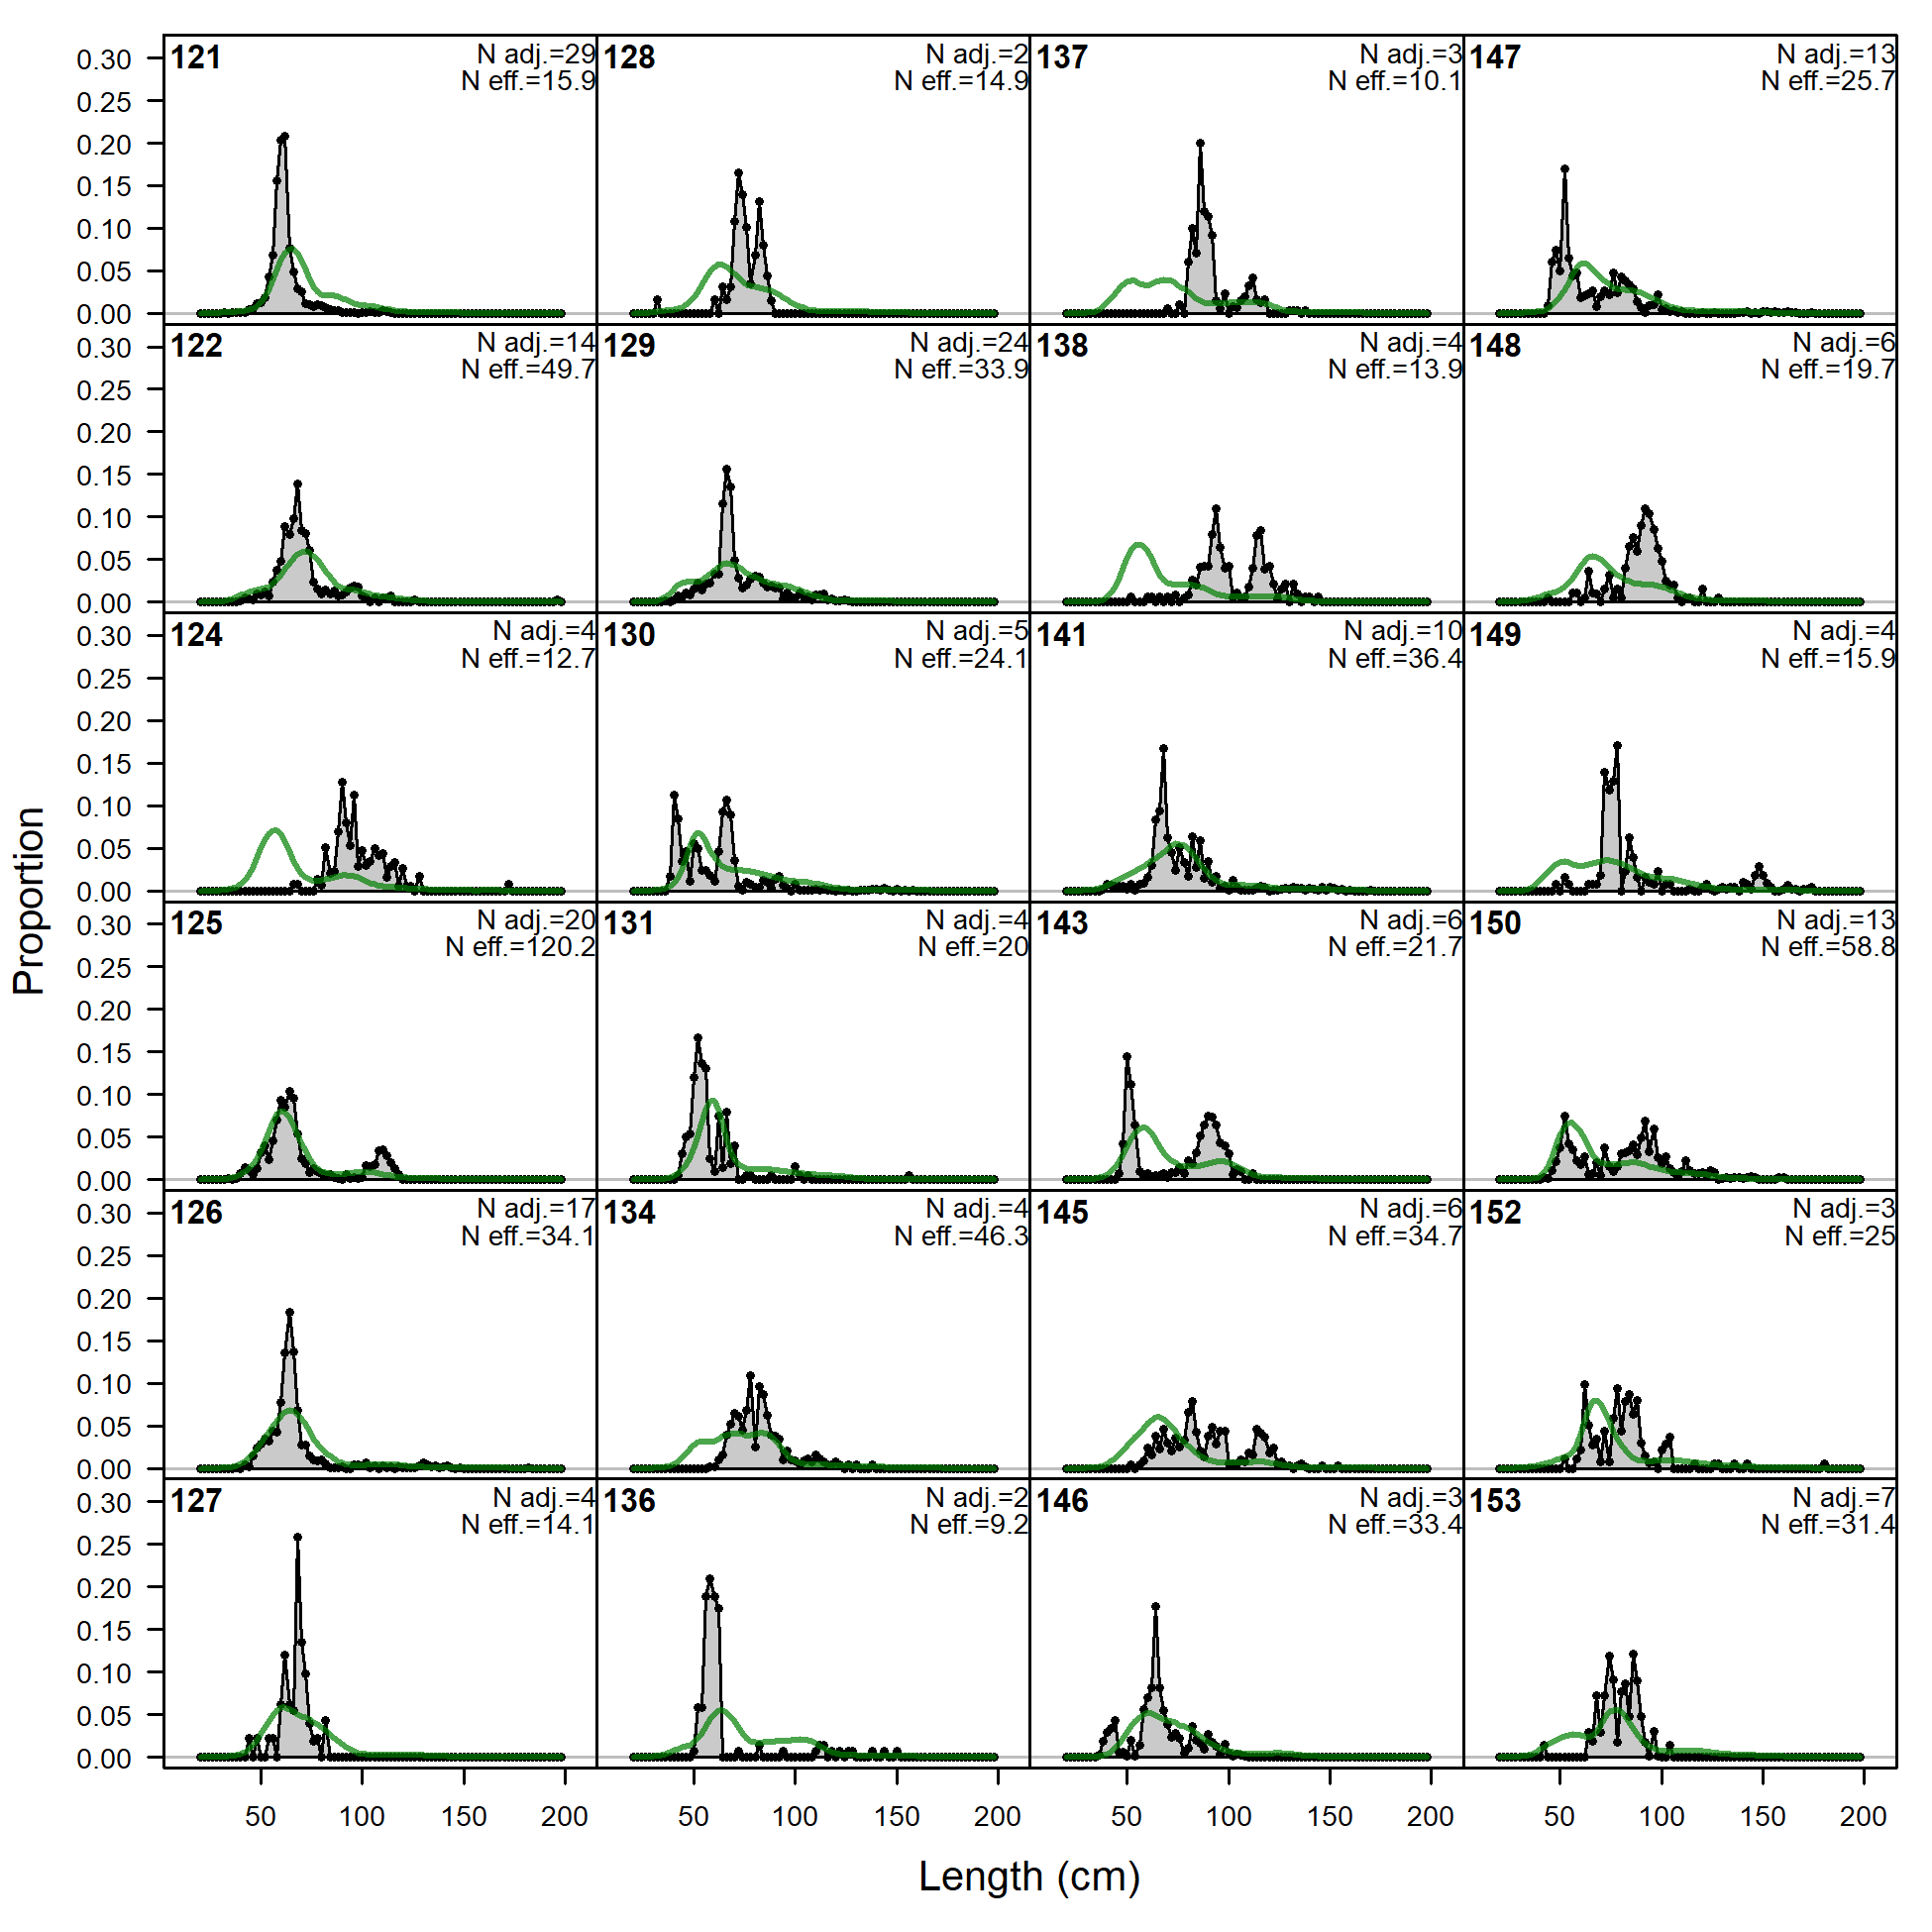
Length comps, whole catch, F19.DEL.C.inshore (plot 1 of 7).
'N adj.' is the input sample size after data-weighting adjustment. N eff. is the calculated effective sample size used in the McAllister-Ianelli tuning method. (plot 2 of 7)
file: comp_lenfit_flt19mkt0_page2.png
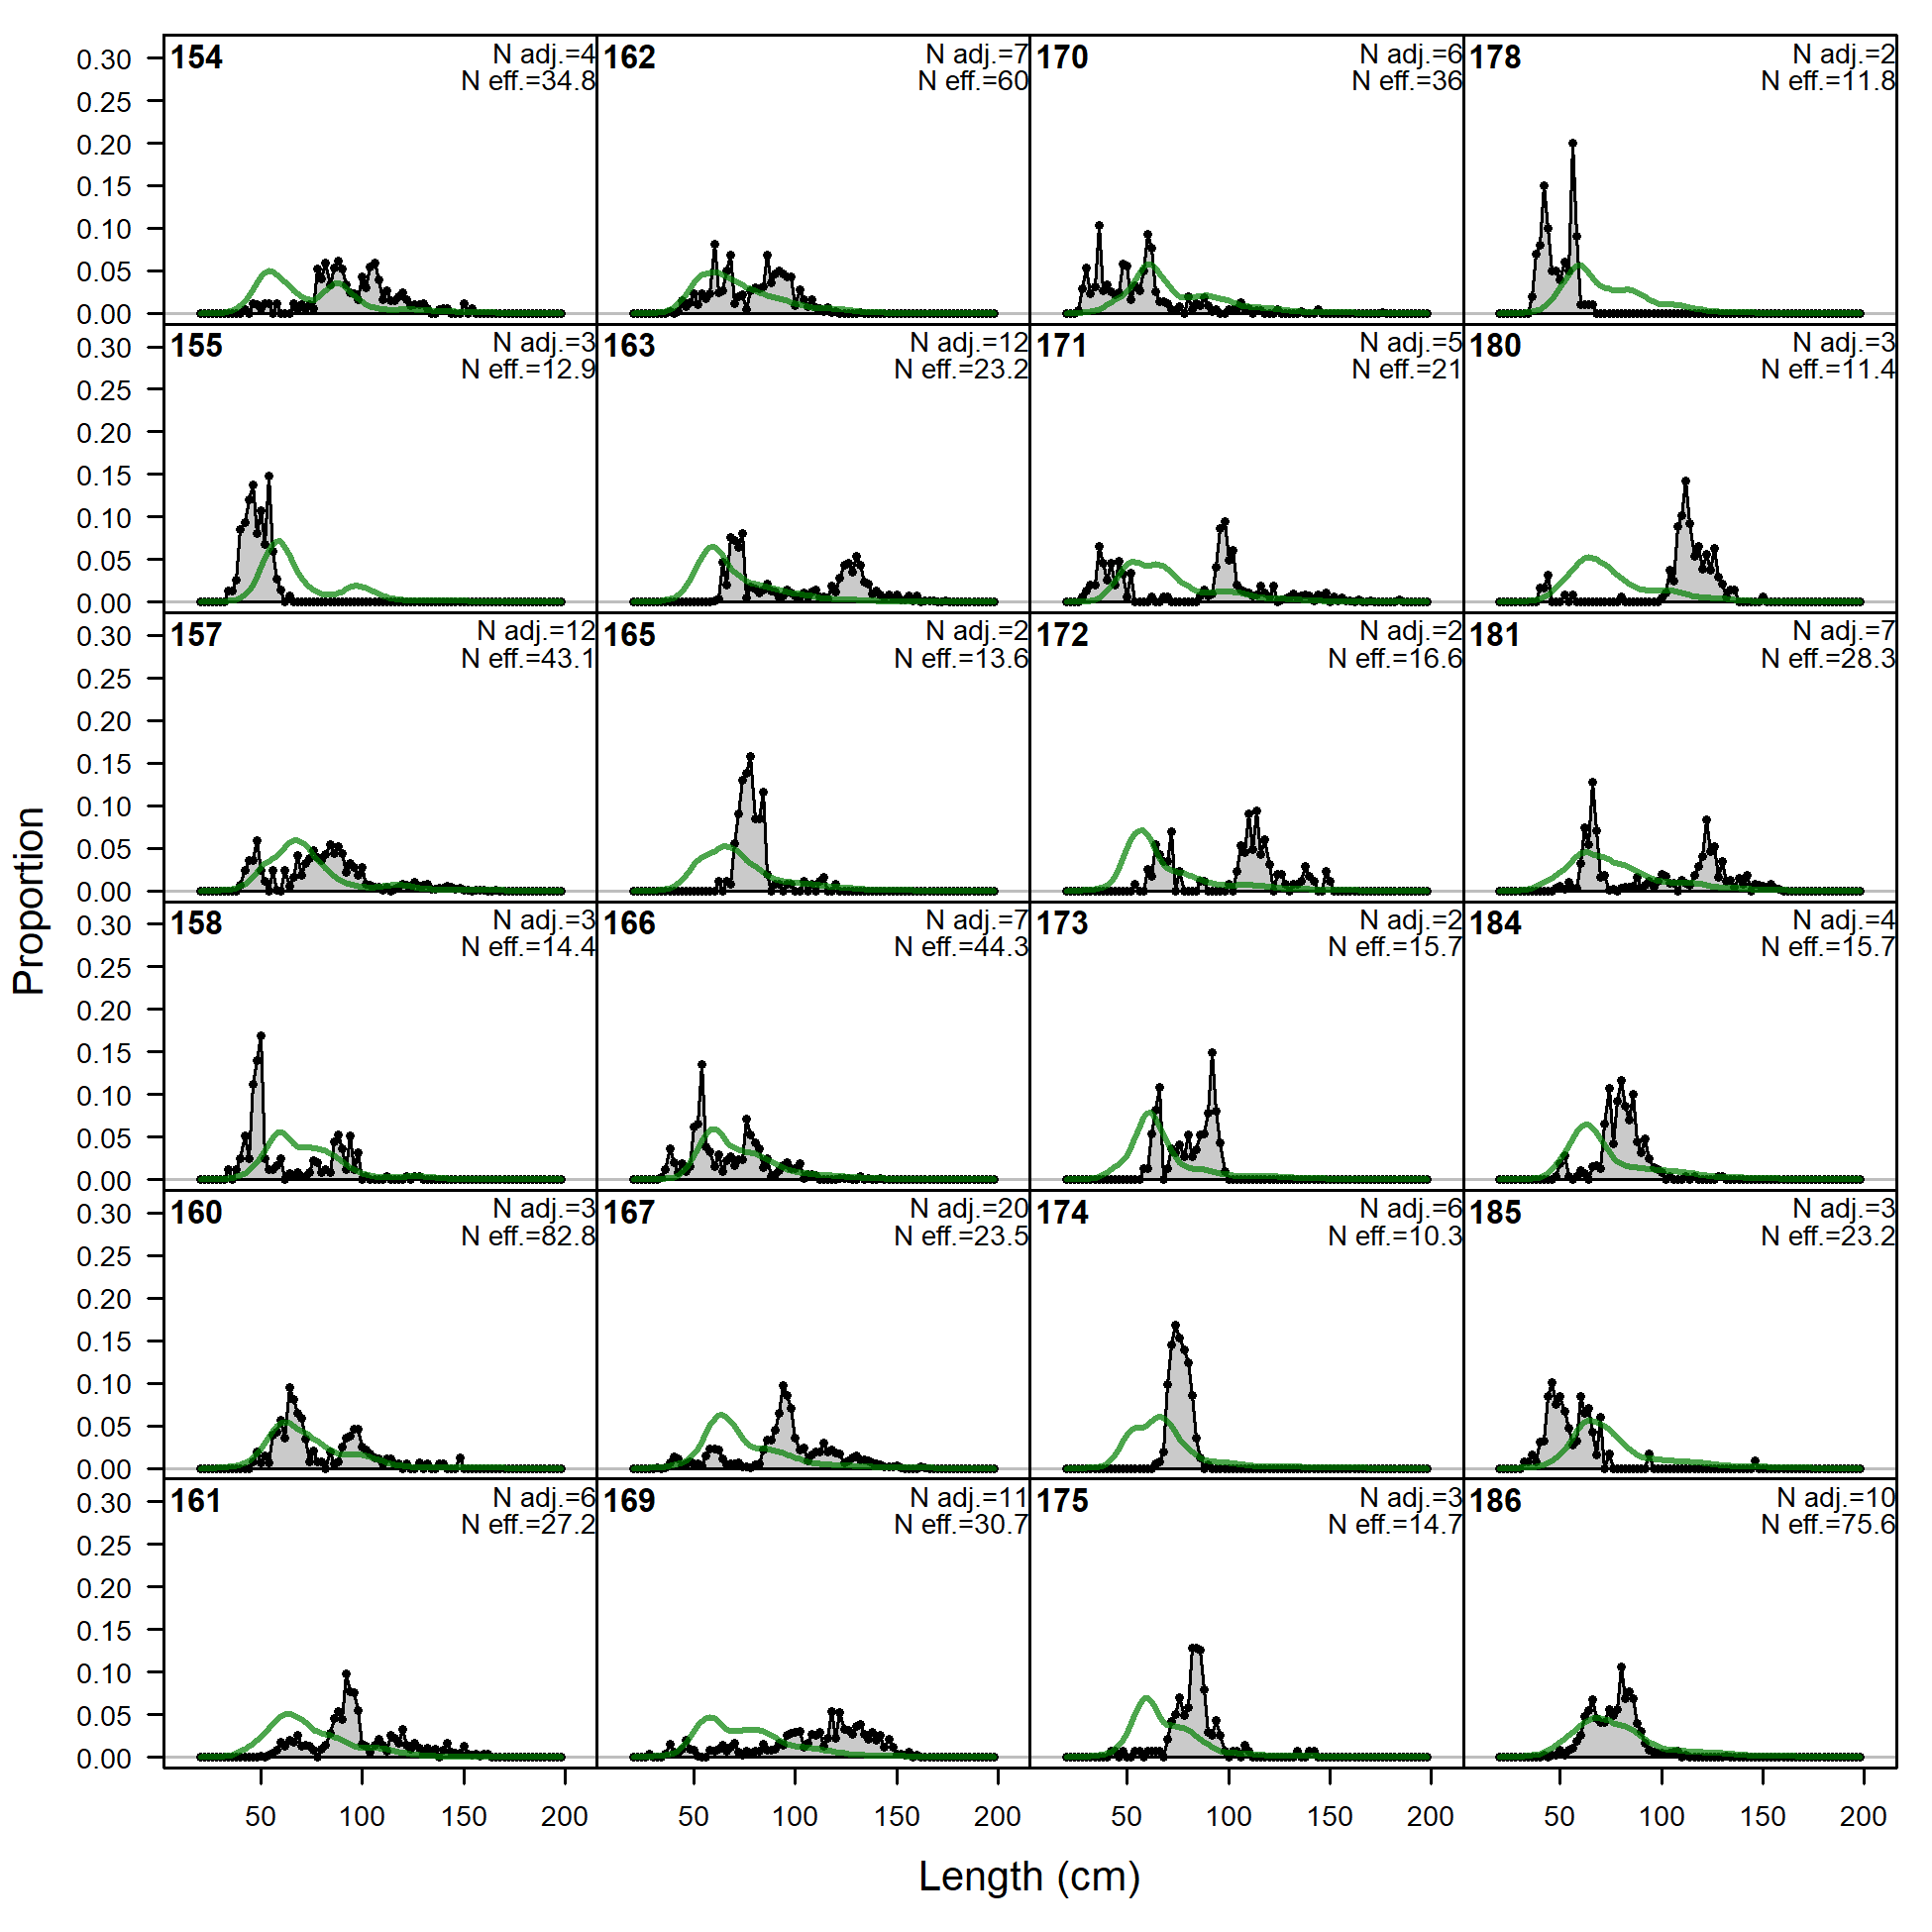
Length comps, whole catch, F19.DEL.C.inshore (plot 1 of 7).
'N adj.' is the input sample size after data-weighting adjustment. N eff. is the calculated effective sample size used in the McAllister-Ianelli tuning method. (plot 2 of 7) (plot 3 of 7)
file: comp_lenfit_flt19mkt0_page3.png

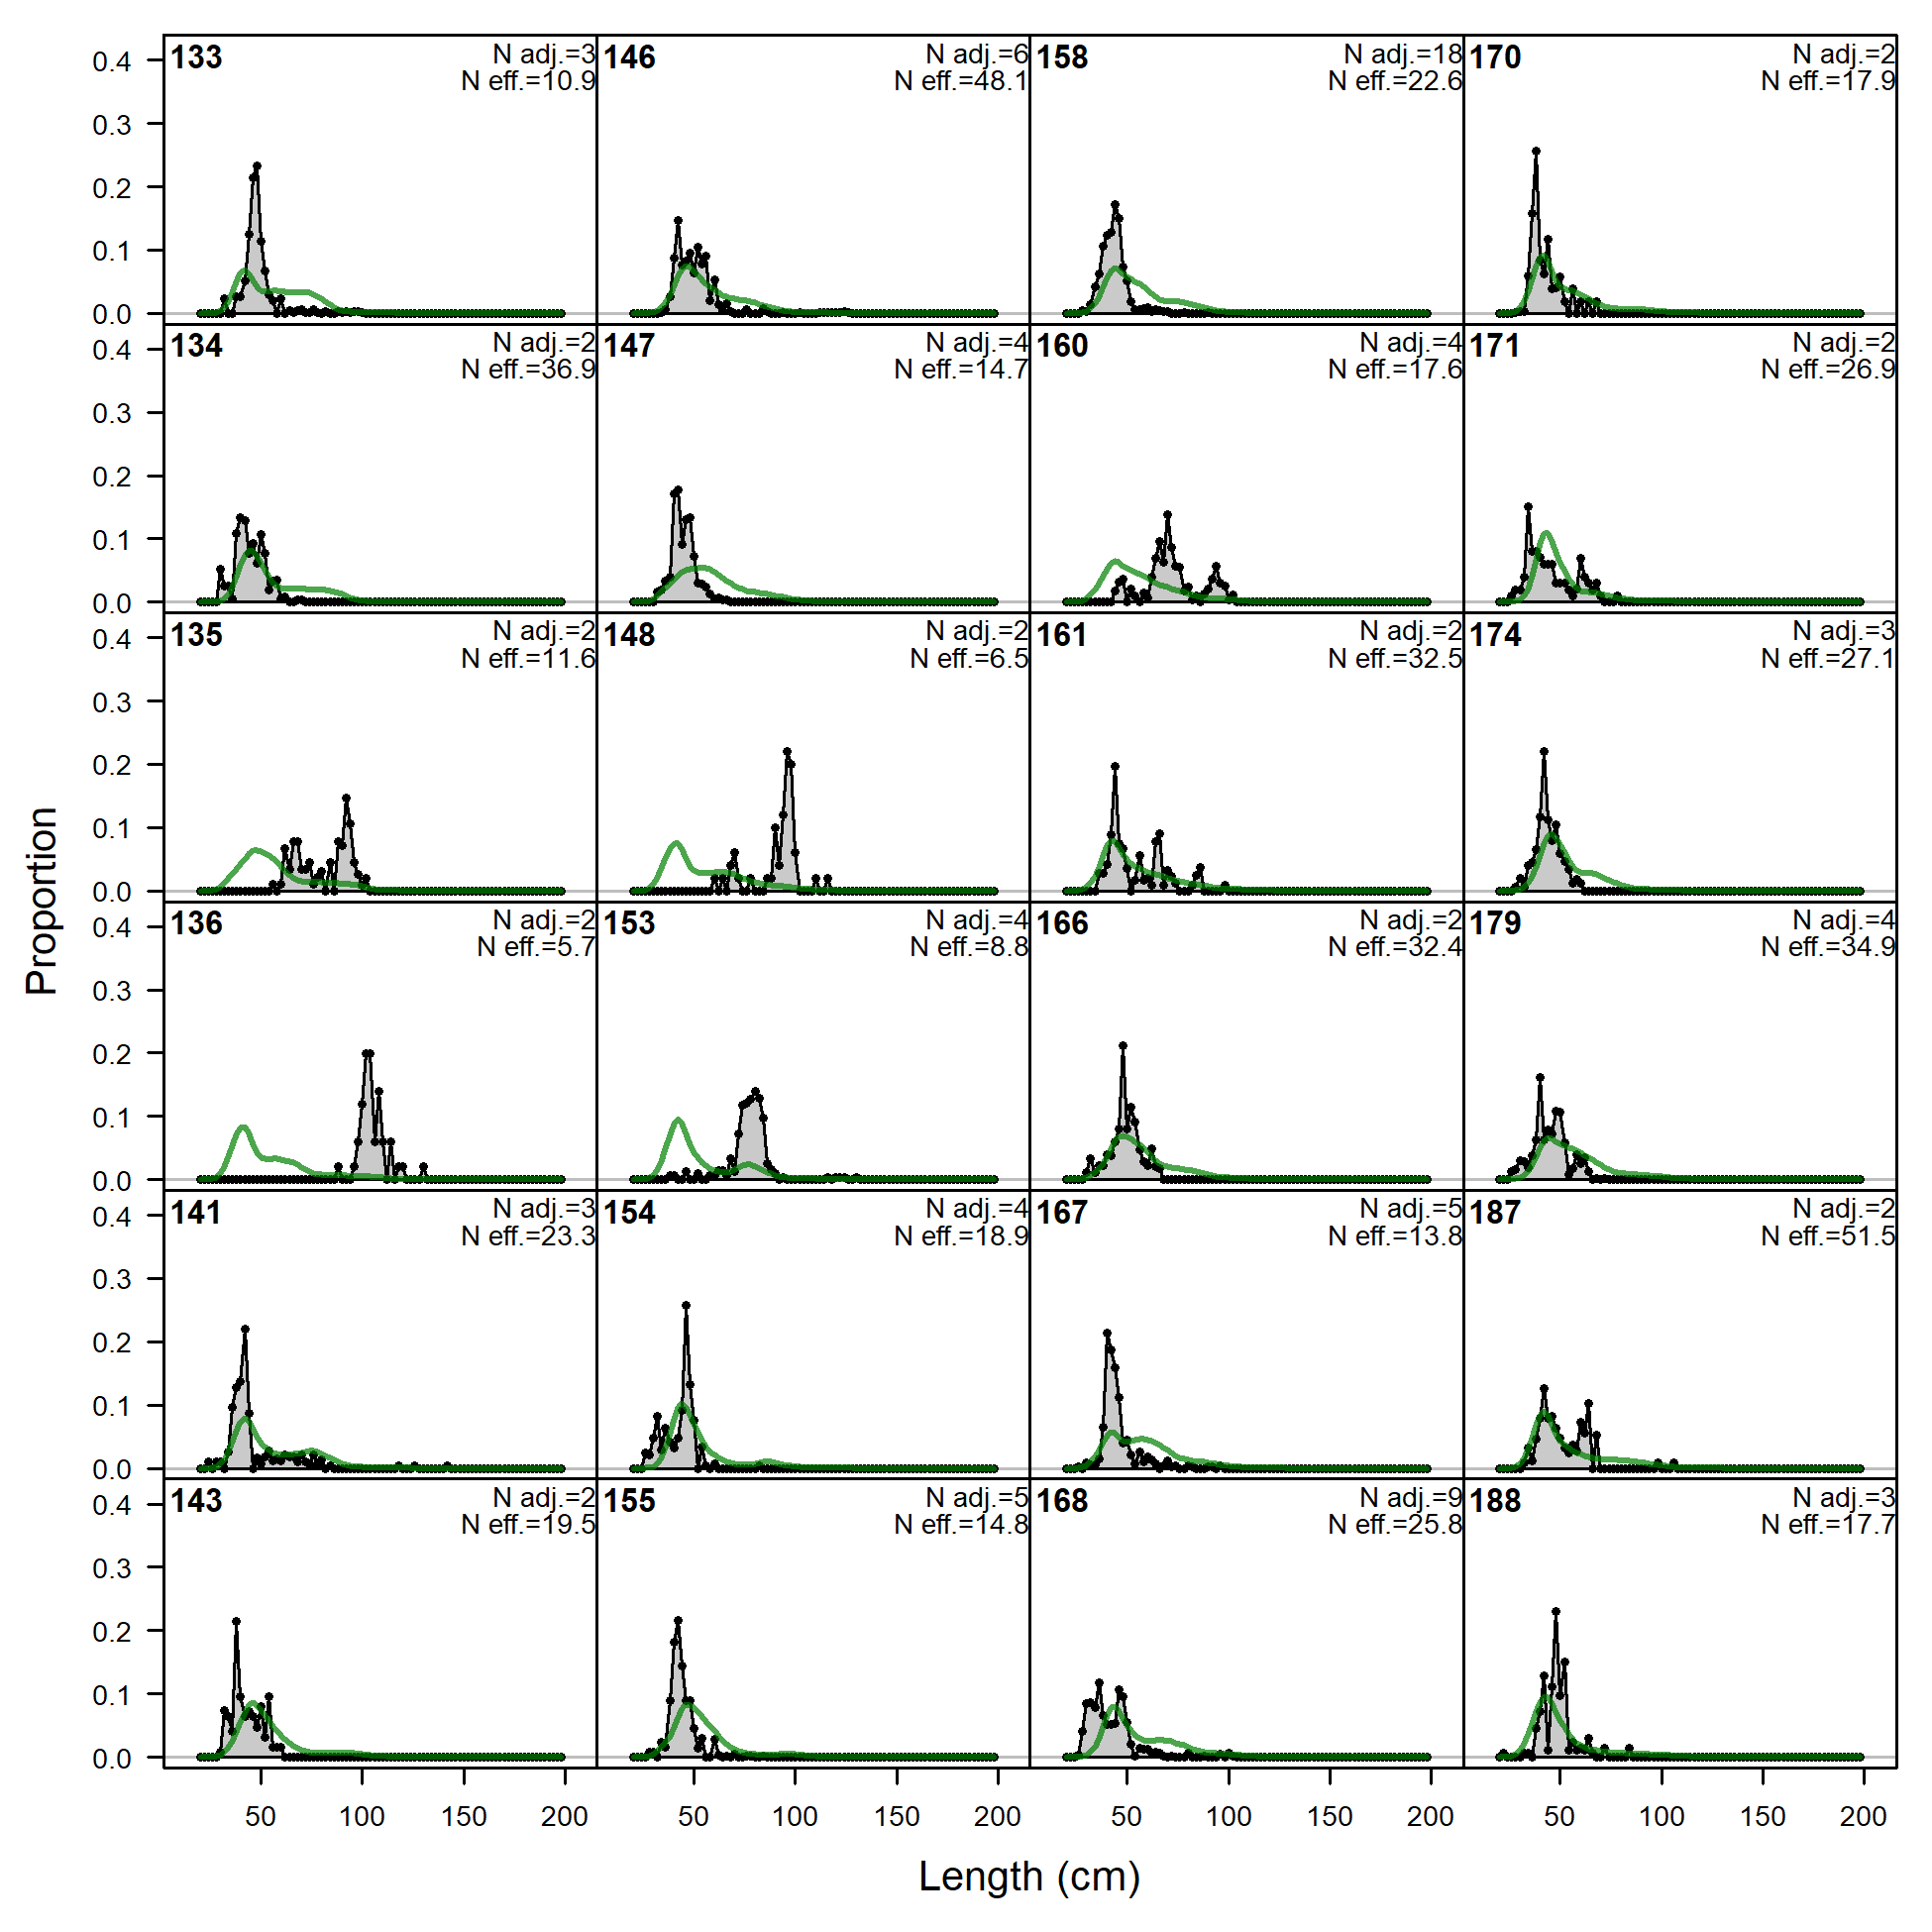
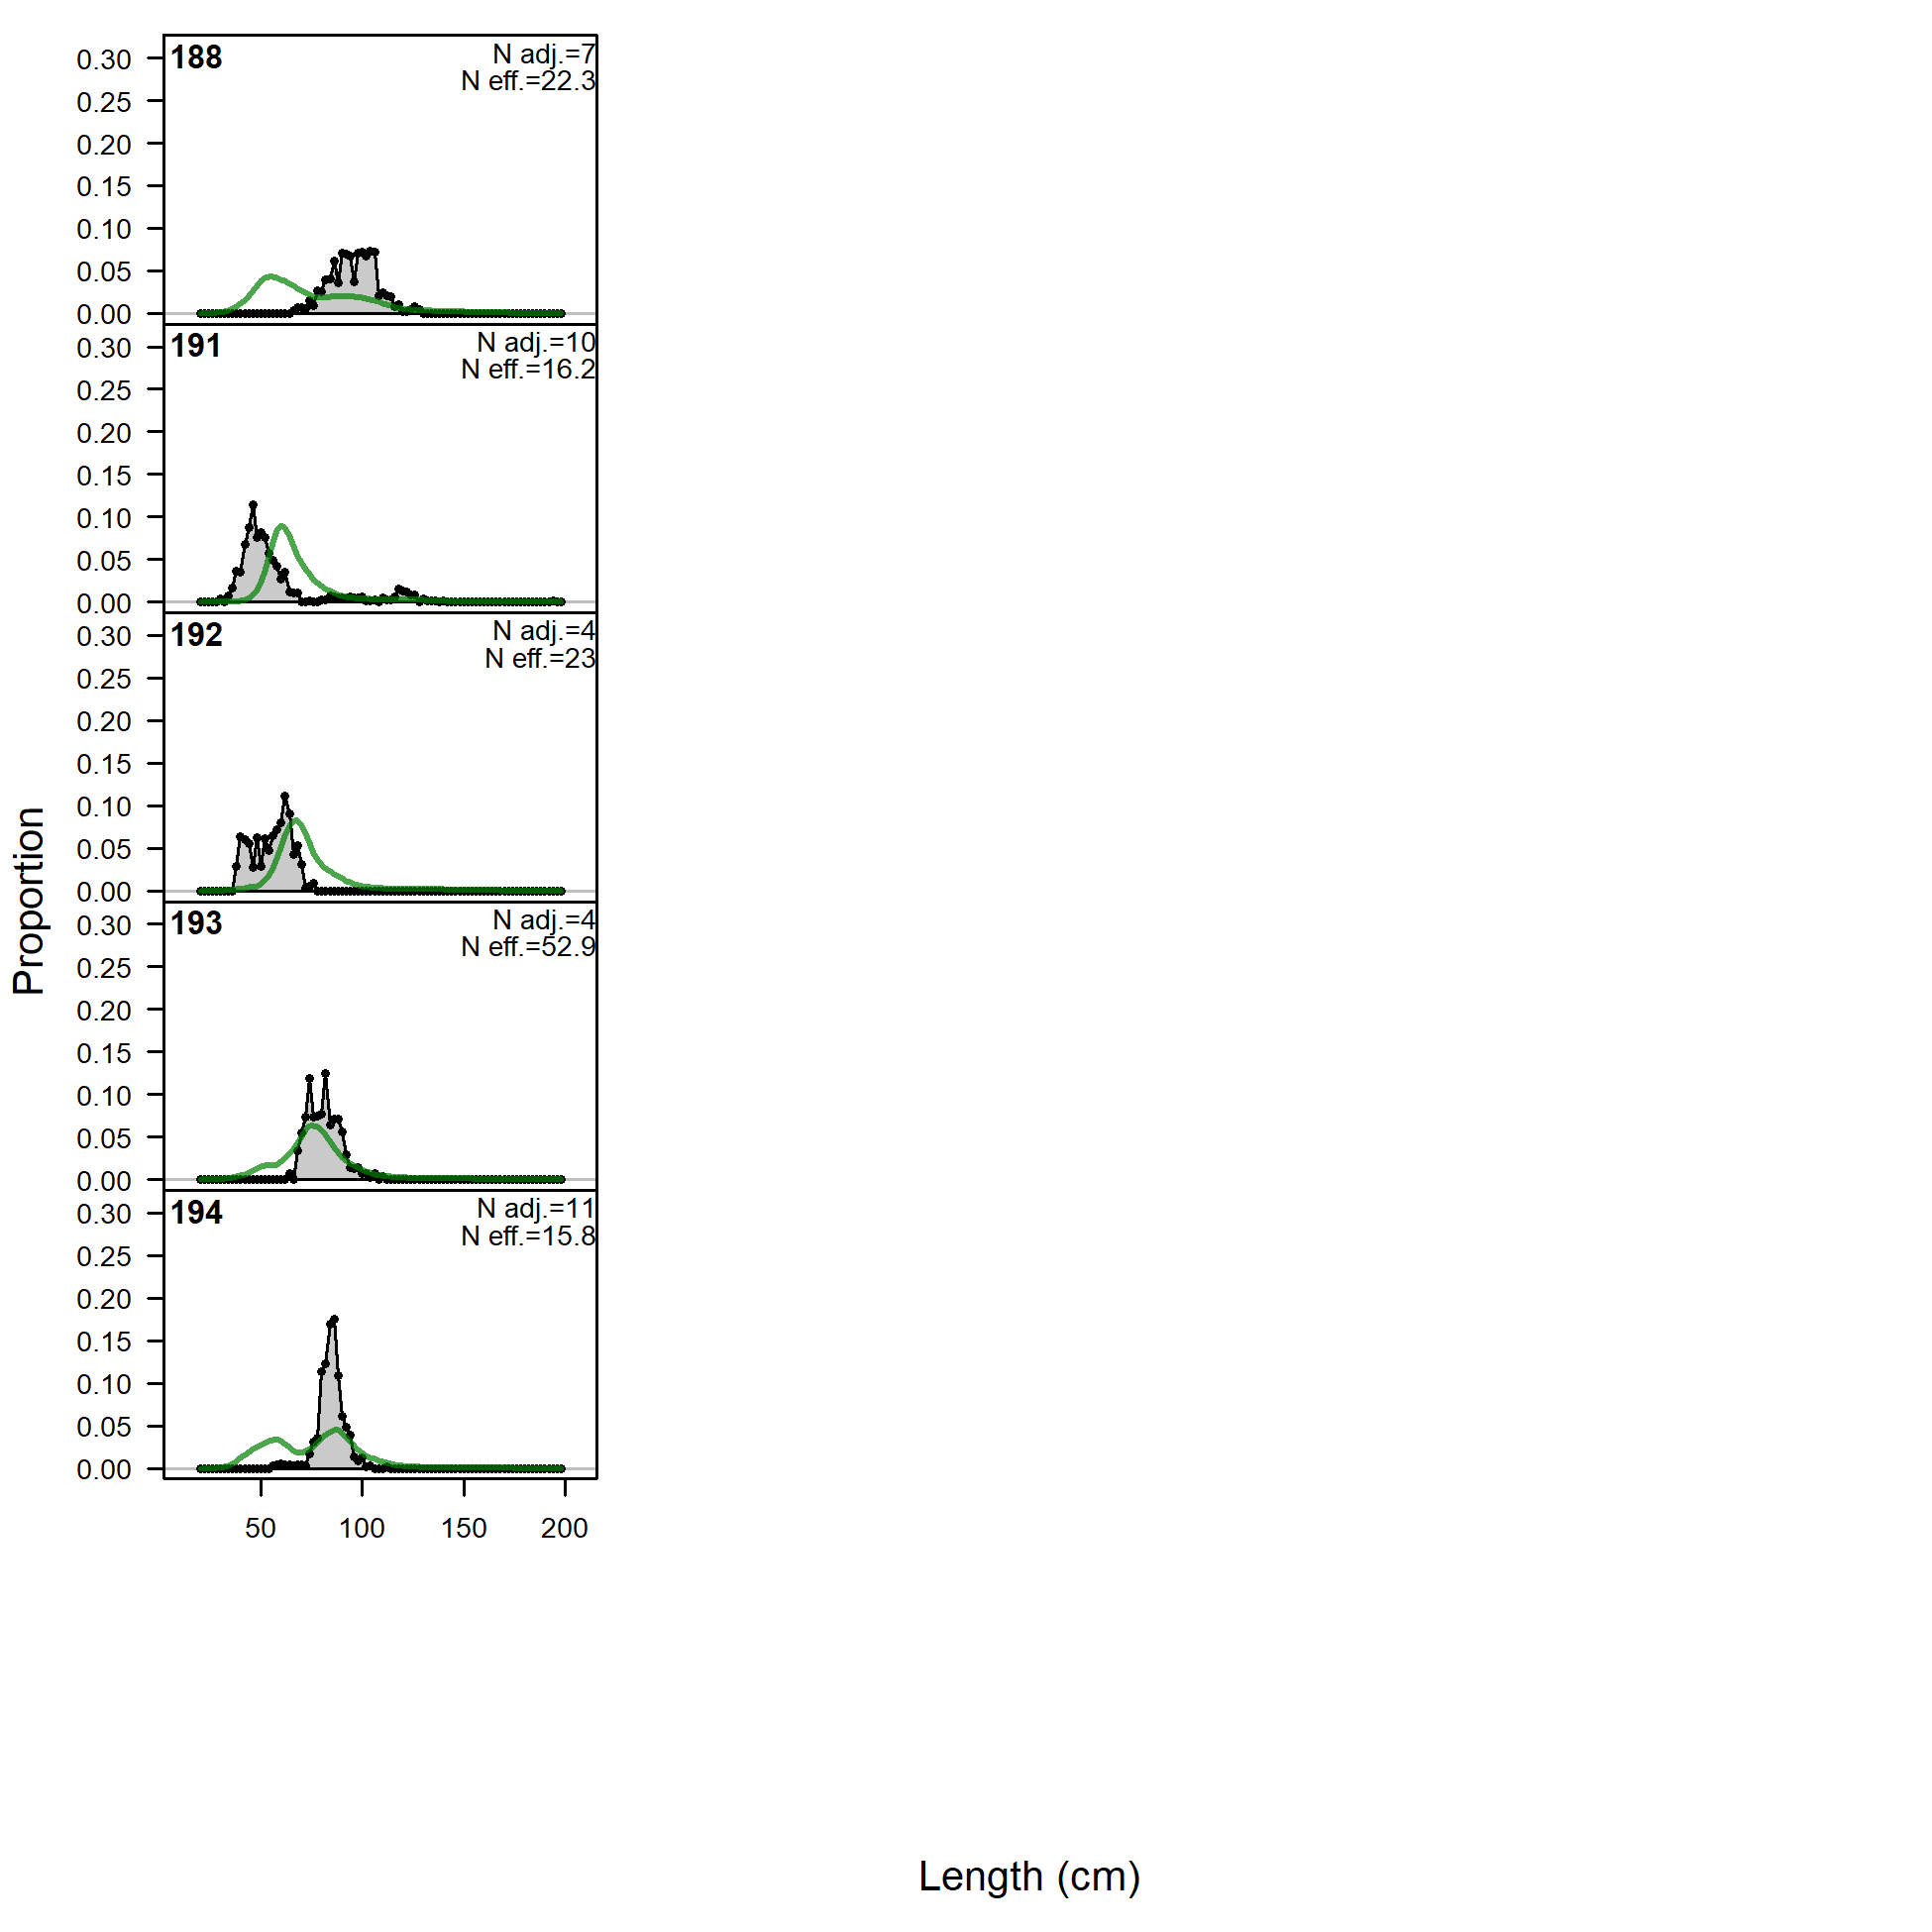
Length comps, whole catch, F19.DEL.C.inshore (plot 1 of 7).
'N adj.' is the input sample size after data-weighting adjustment. N eff. is the calculated effective sample size used in the McAllister-Ianelli tuning method. (plot 2 of 7) (plot 3 of 7) (plot 4 of 7)
file: comp_lenfit_flt19mkt0_page4.png
Length comps, whole catch, F19.DEL.C.inshore (plot 1 of 7).
'N adj.' is the input sample size after data-weighting adjustment. N eff. is the calculated effective sample size used in the McAllister-Ianelli tuning method. (plot 2 of 7) (plot 3 of 7) (plot 4 of 7) (plot 5 of 7)
file: comp_lenfit_flt19mkt0_page5.png
Length comps, whole catch, F19.DEL.C.inshore (plot 1 of 7).
'N adj.' is the input sample size after data-weighting adjustment. N eff. is the calculated effective sample size used in the McAllister-Ianelli tuning method. (plot 2 of 7) (plot 3 of 7) (plot 4 of 7) (plot 5 of 7) (plot 6 of 7)
file: comp_lenfit_flt19mkt0_page6.png
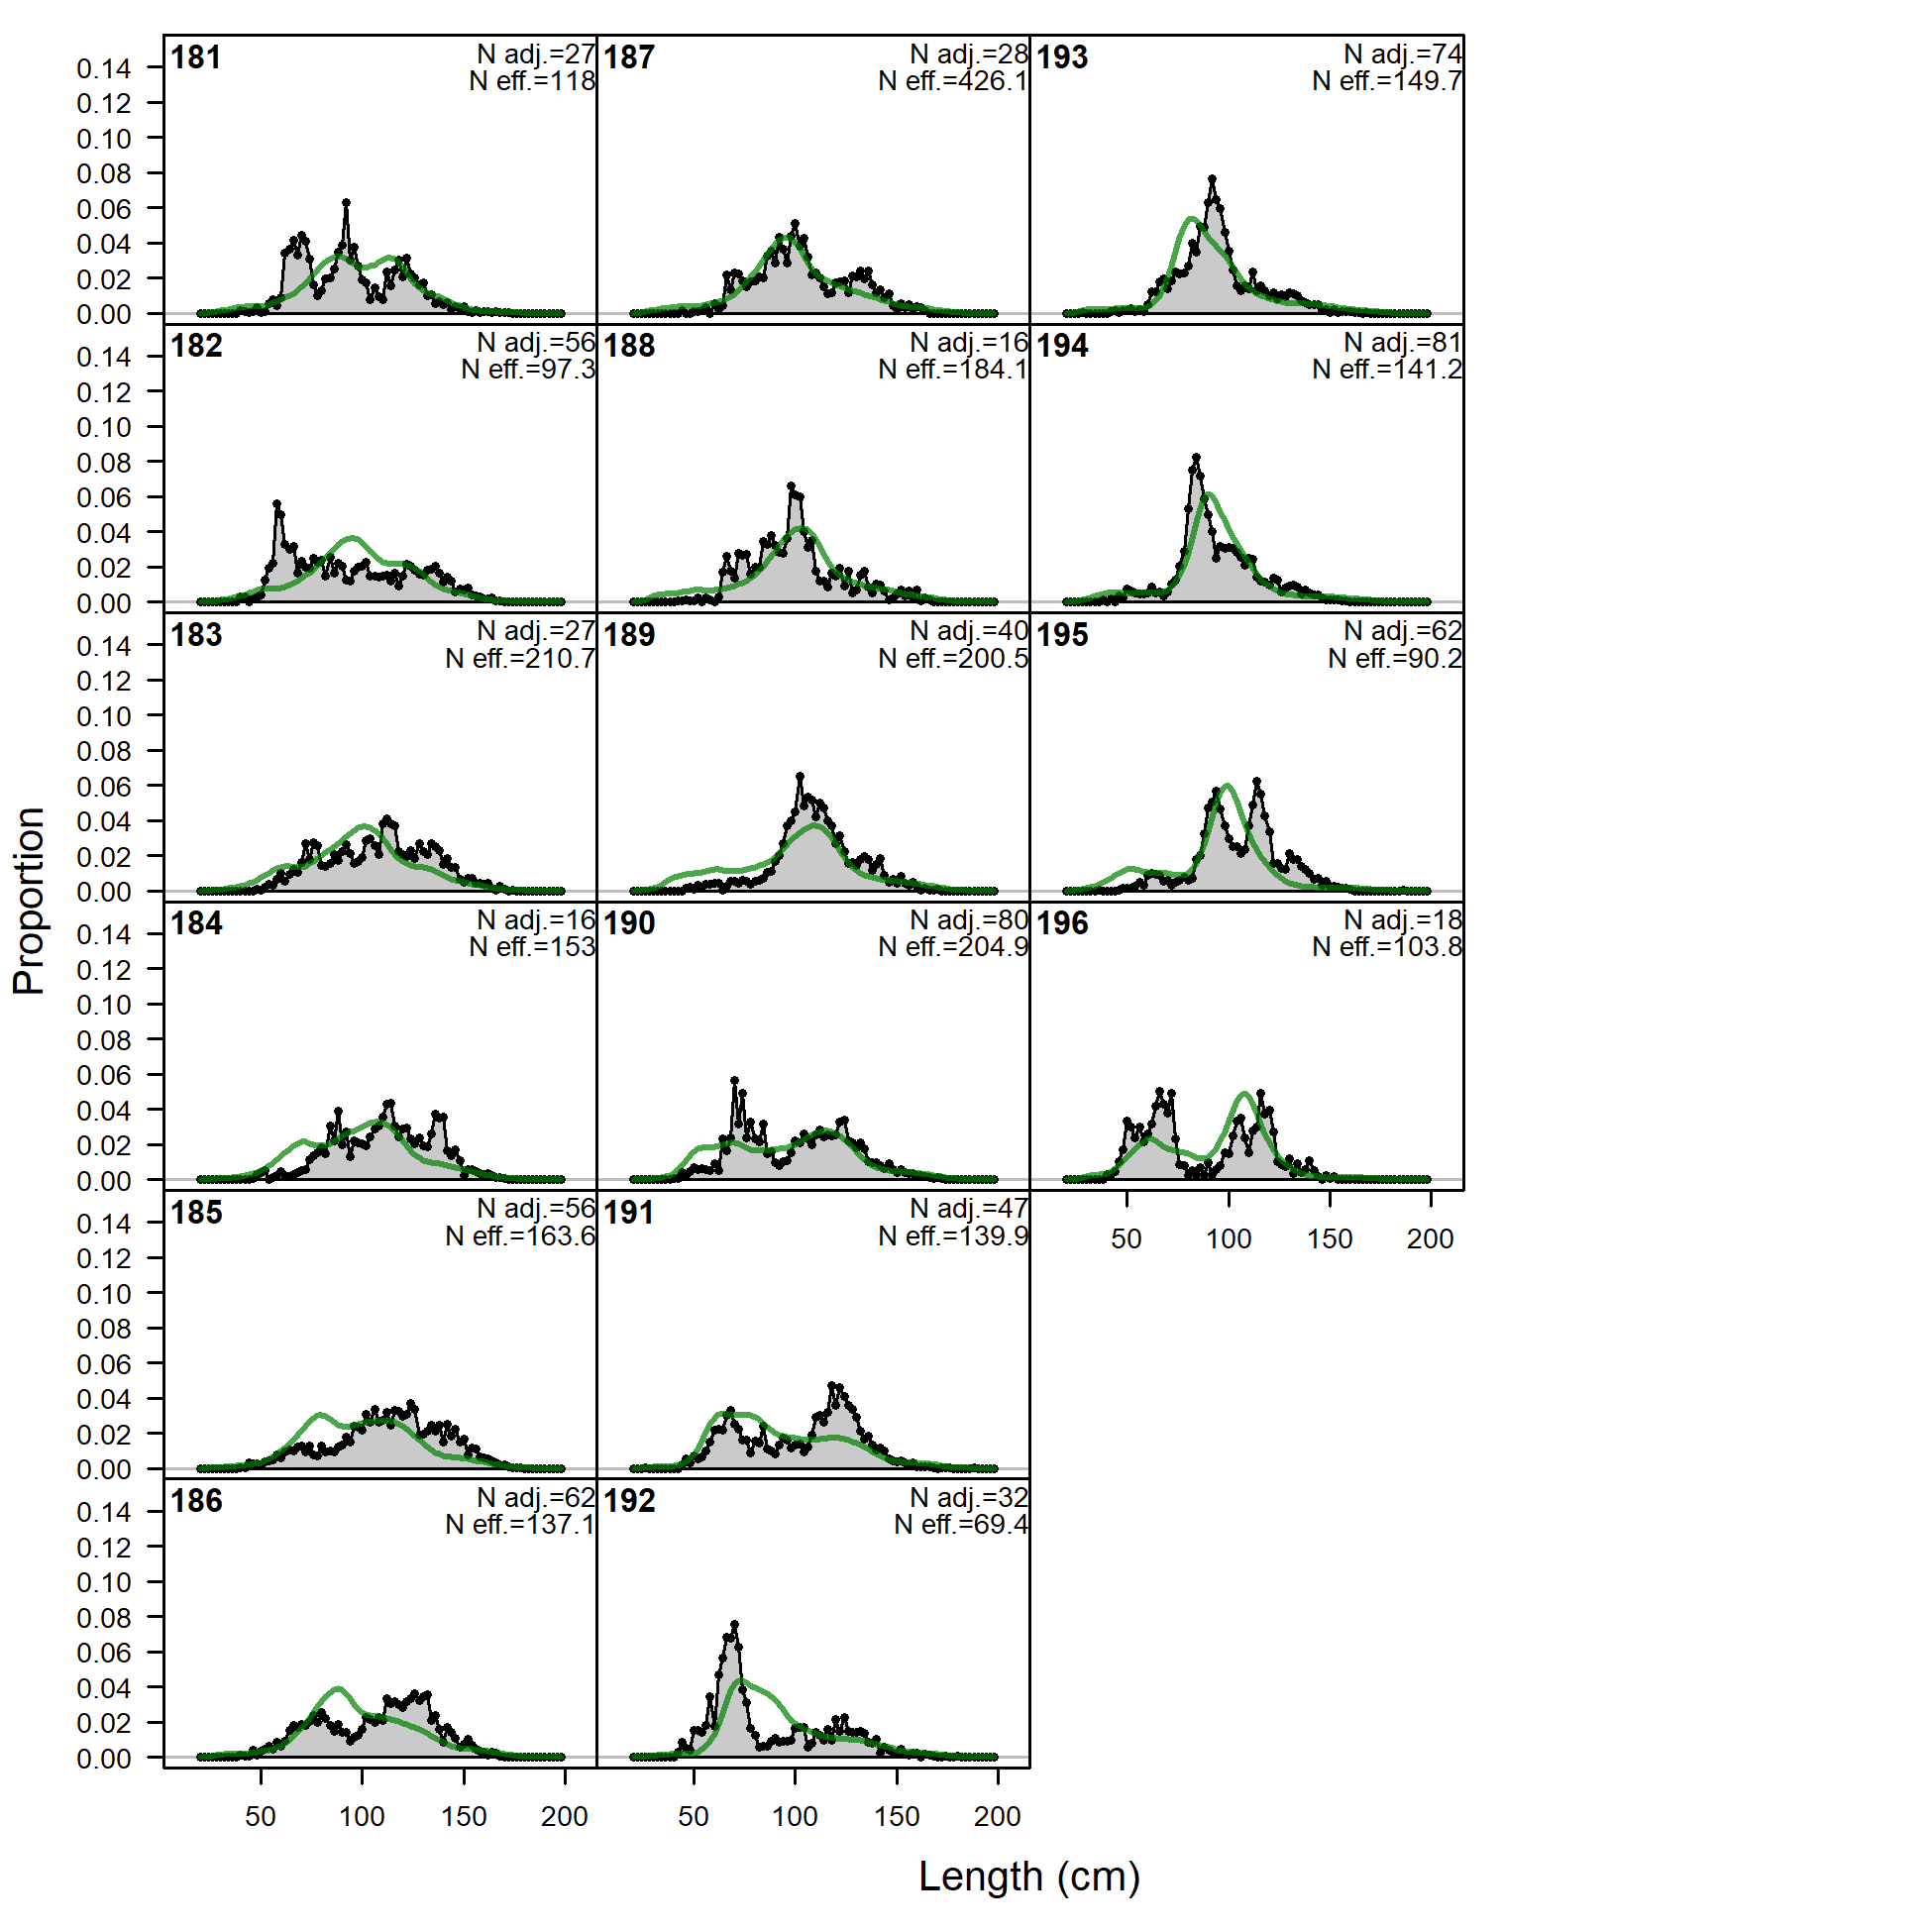
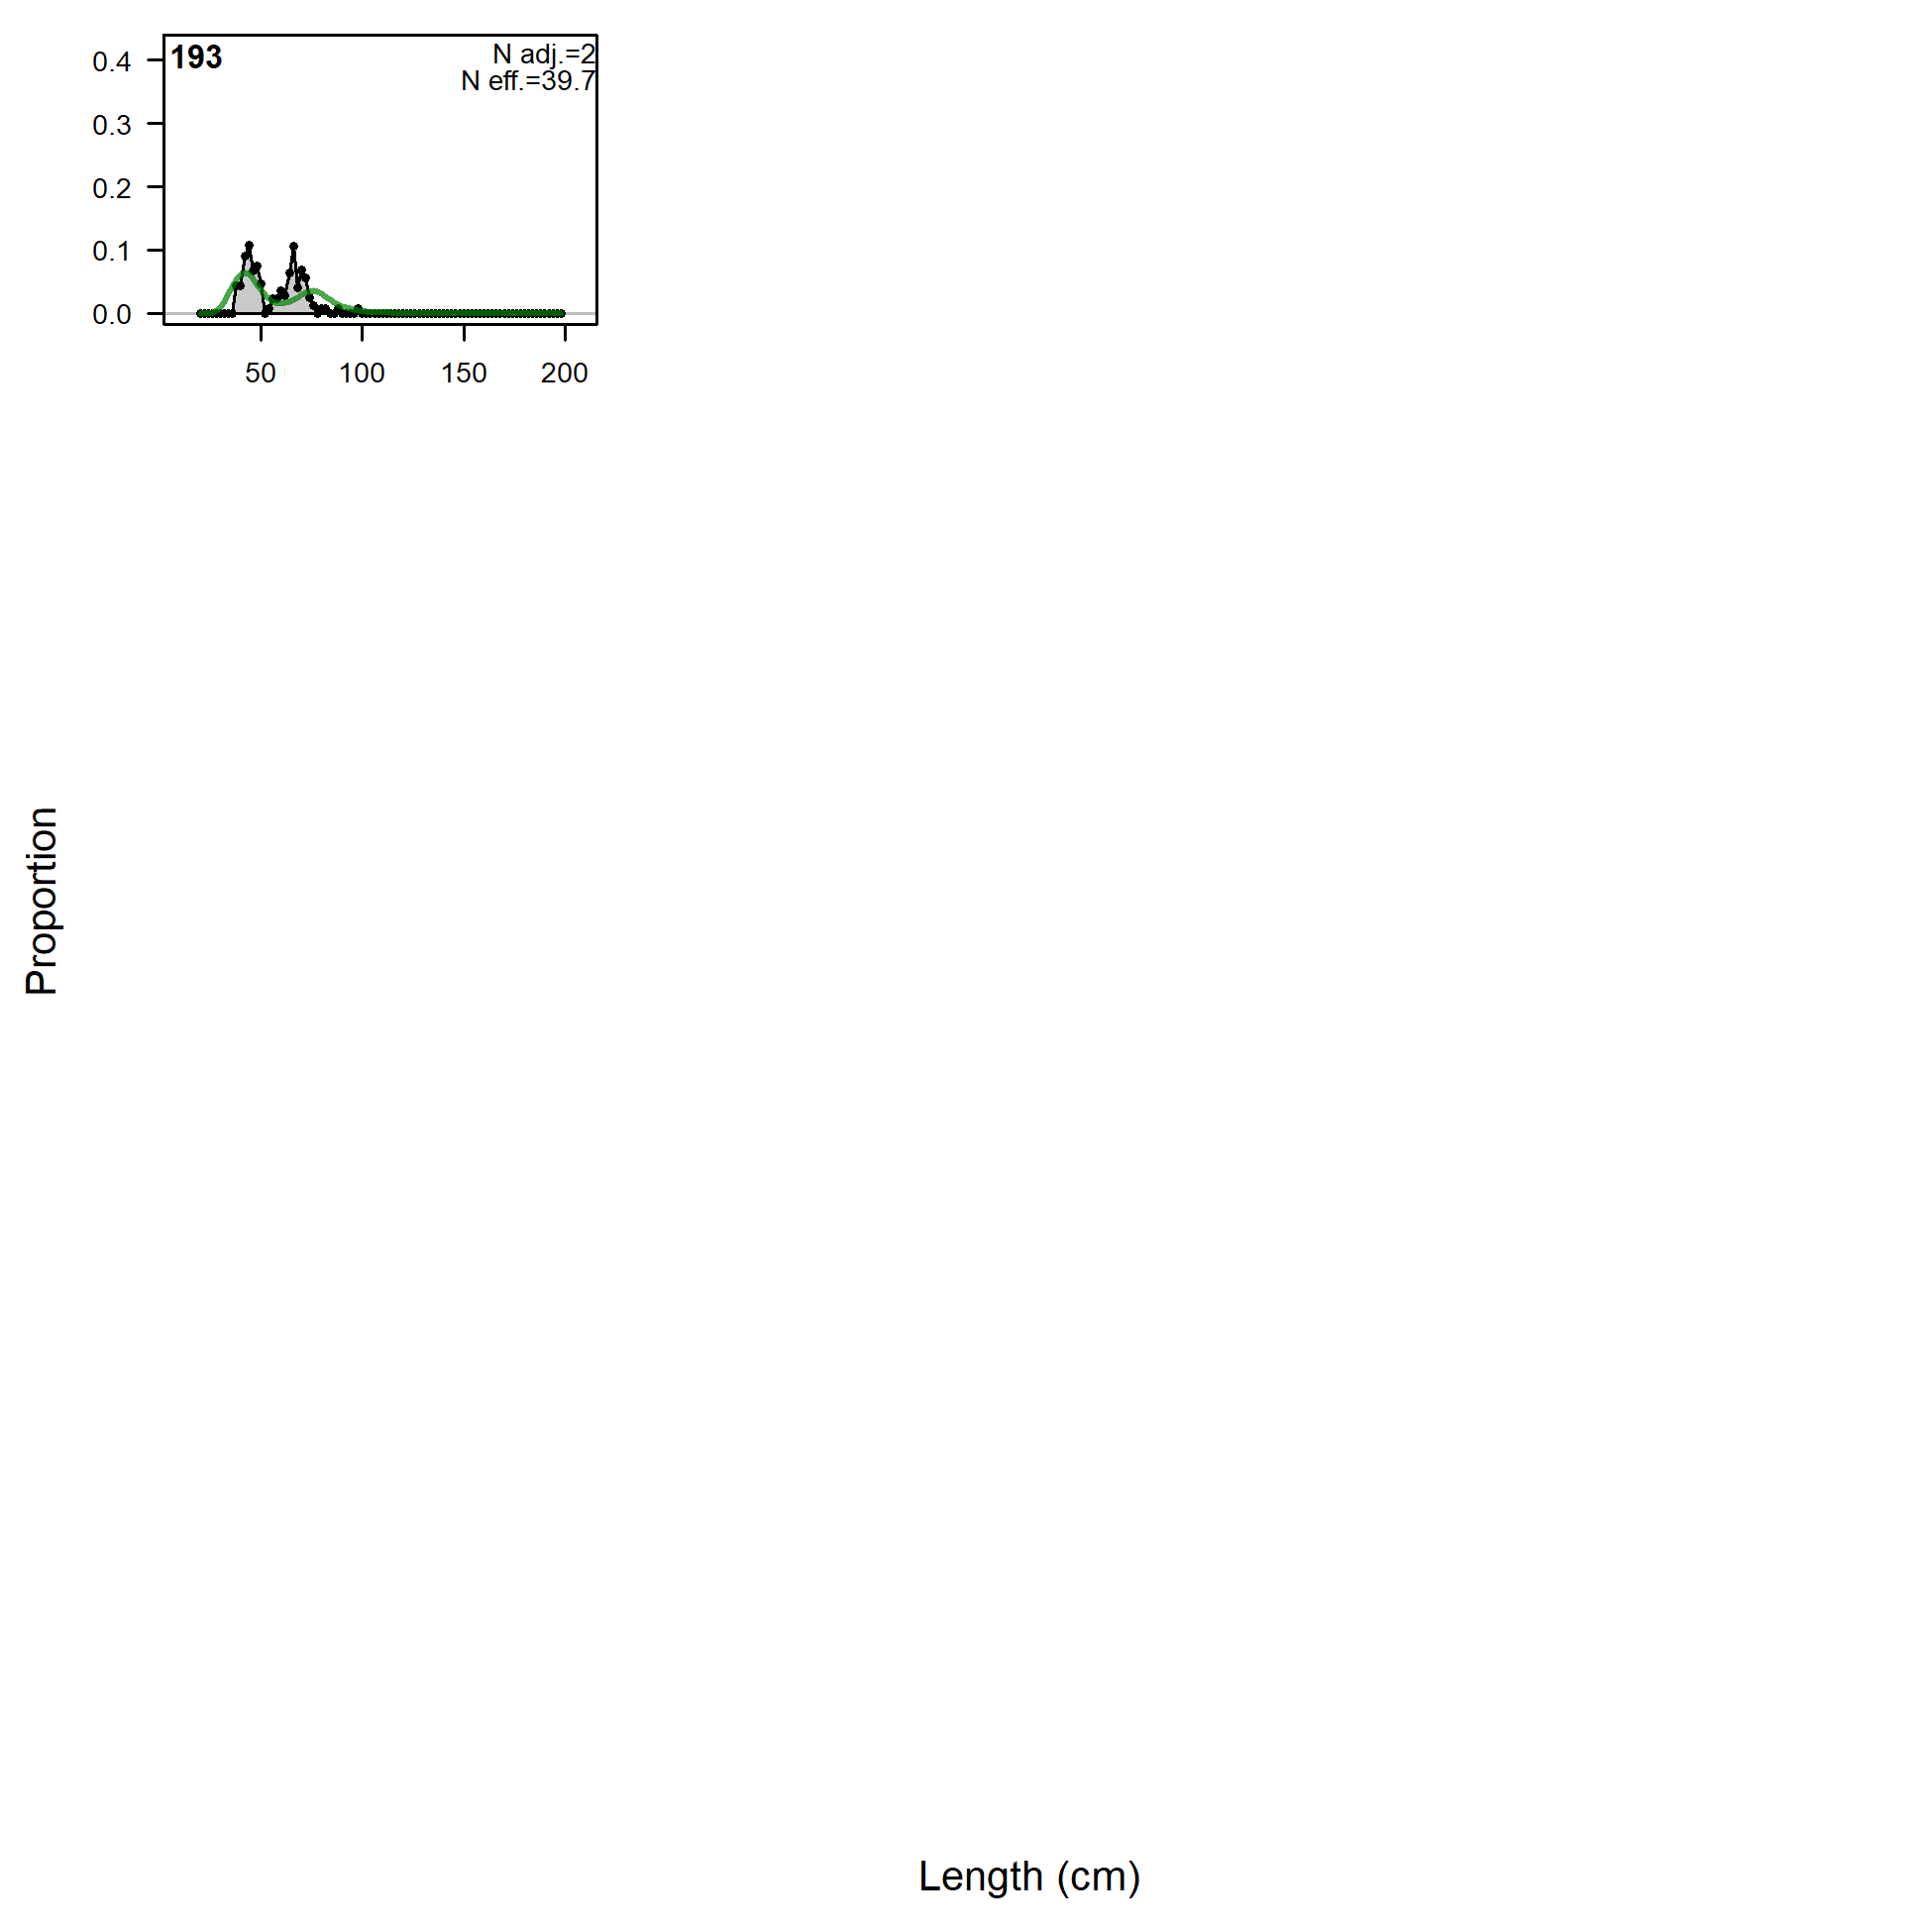
Length comps, whole catch, F19.DEL.C.inshore (plot 1 of 7).
'N adj.' is the input sample size after data-weighting adjustment. N eff. is the calculated effective sample size used in the McAllister-Ianelli tuning method. (plot 2 of 7) (plot 3 of 7) (plot 4 of 7) (plot 5 of 7) (plot 6 of 7) (plot 7 of 7)
file: comp_lenfit_flt19mkt0_page7.png
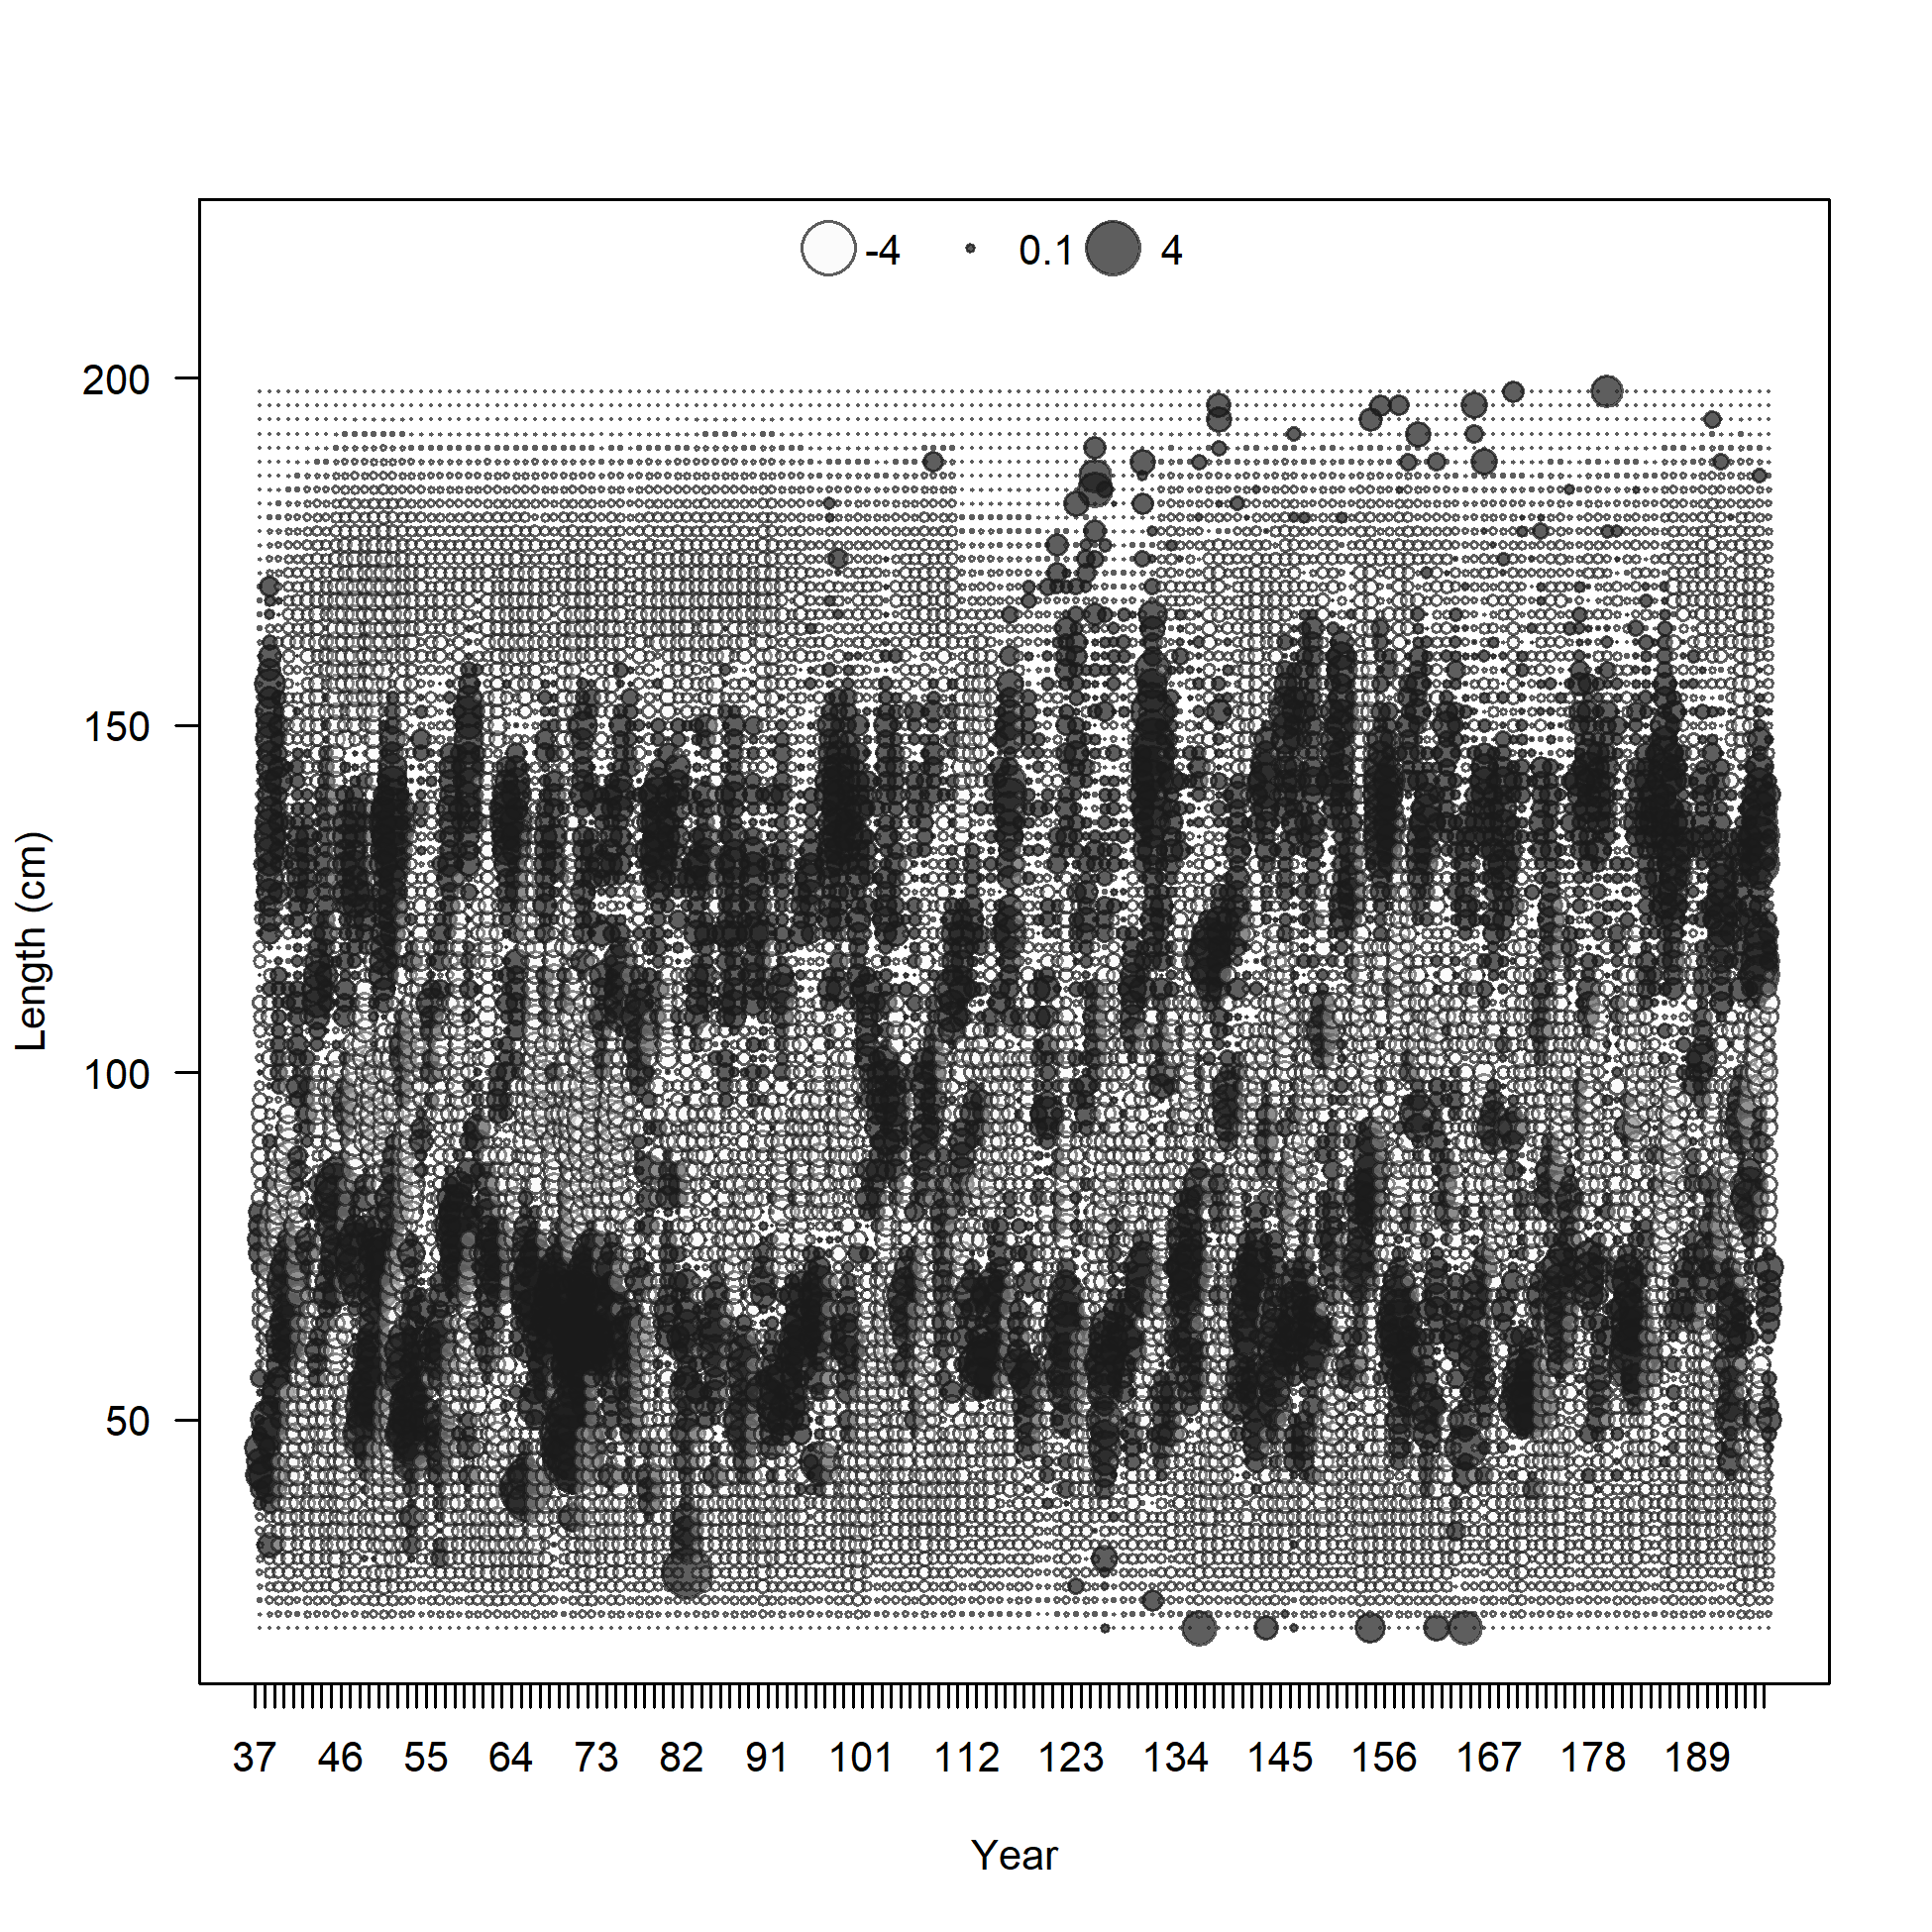
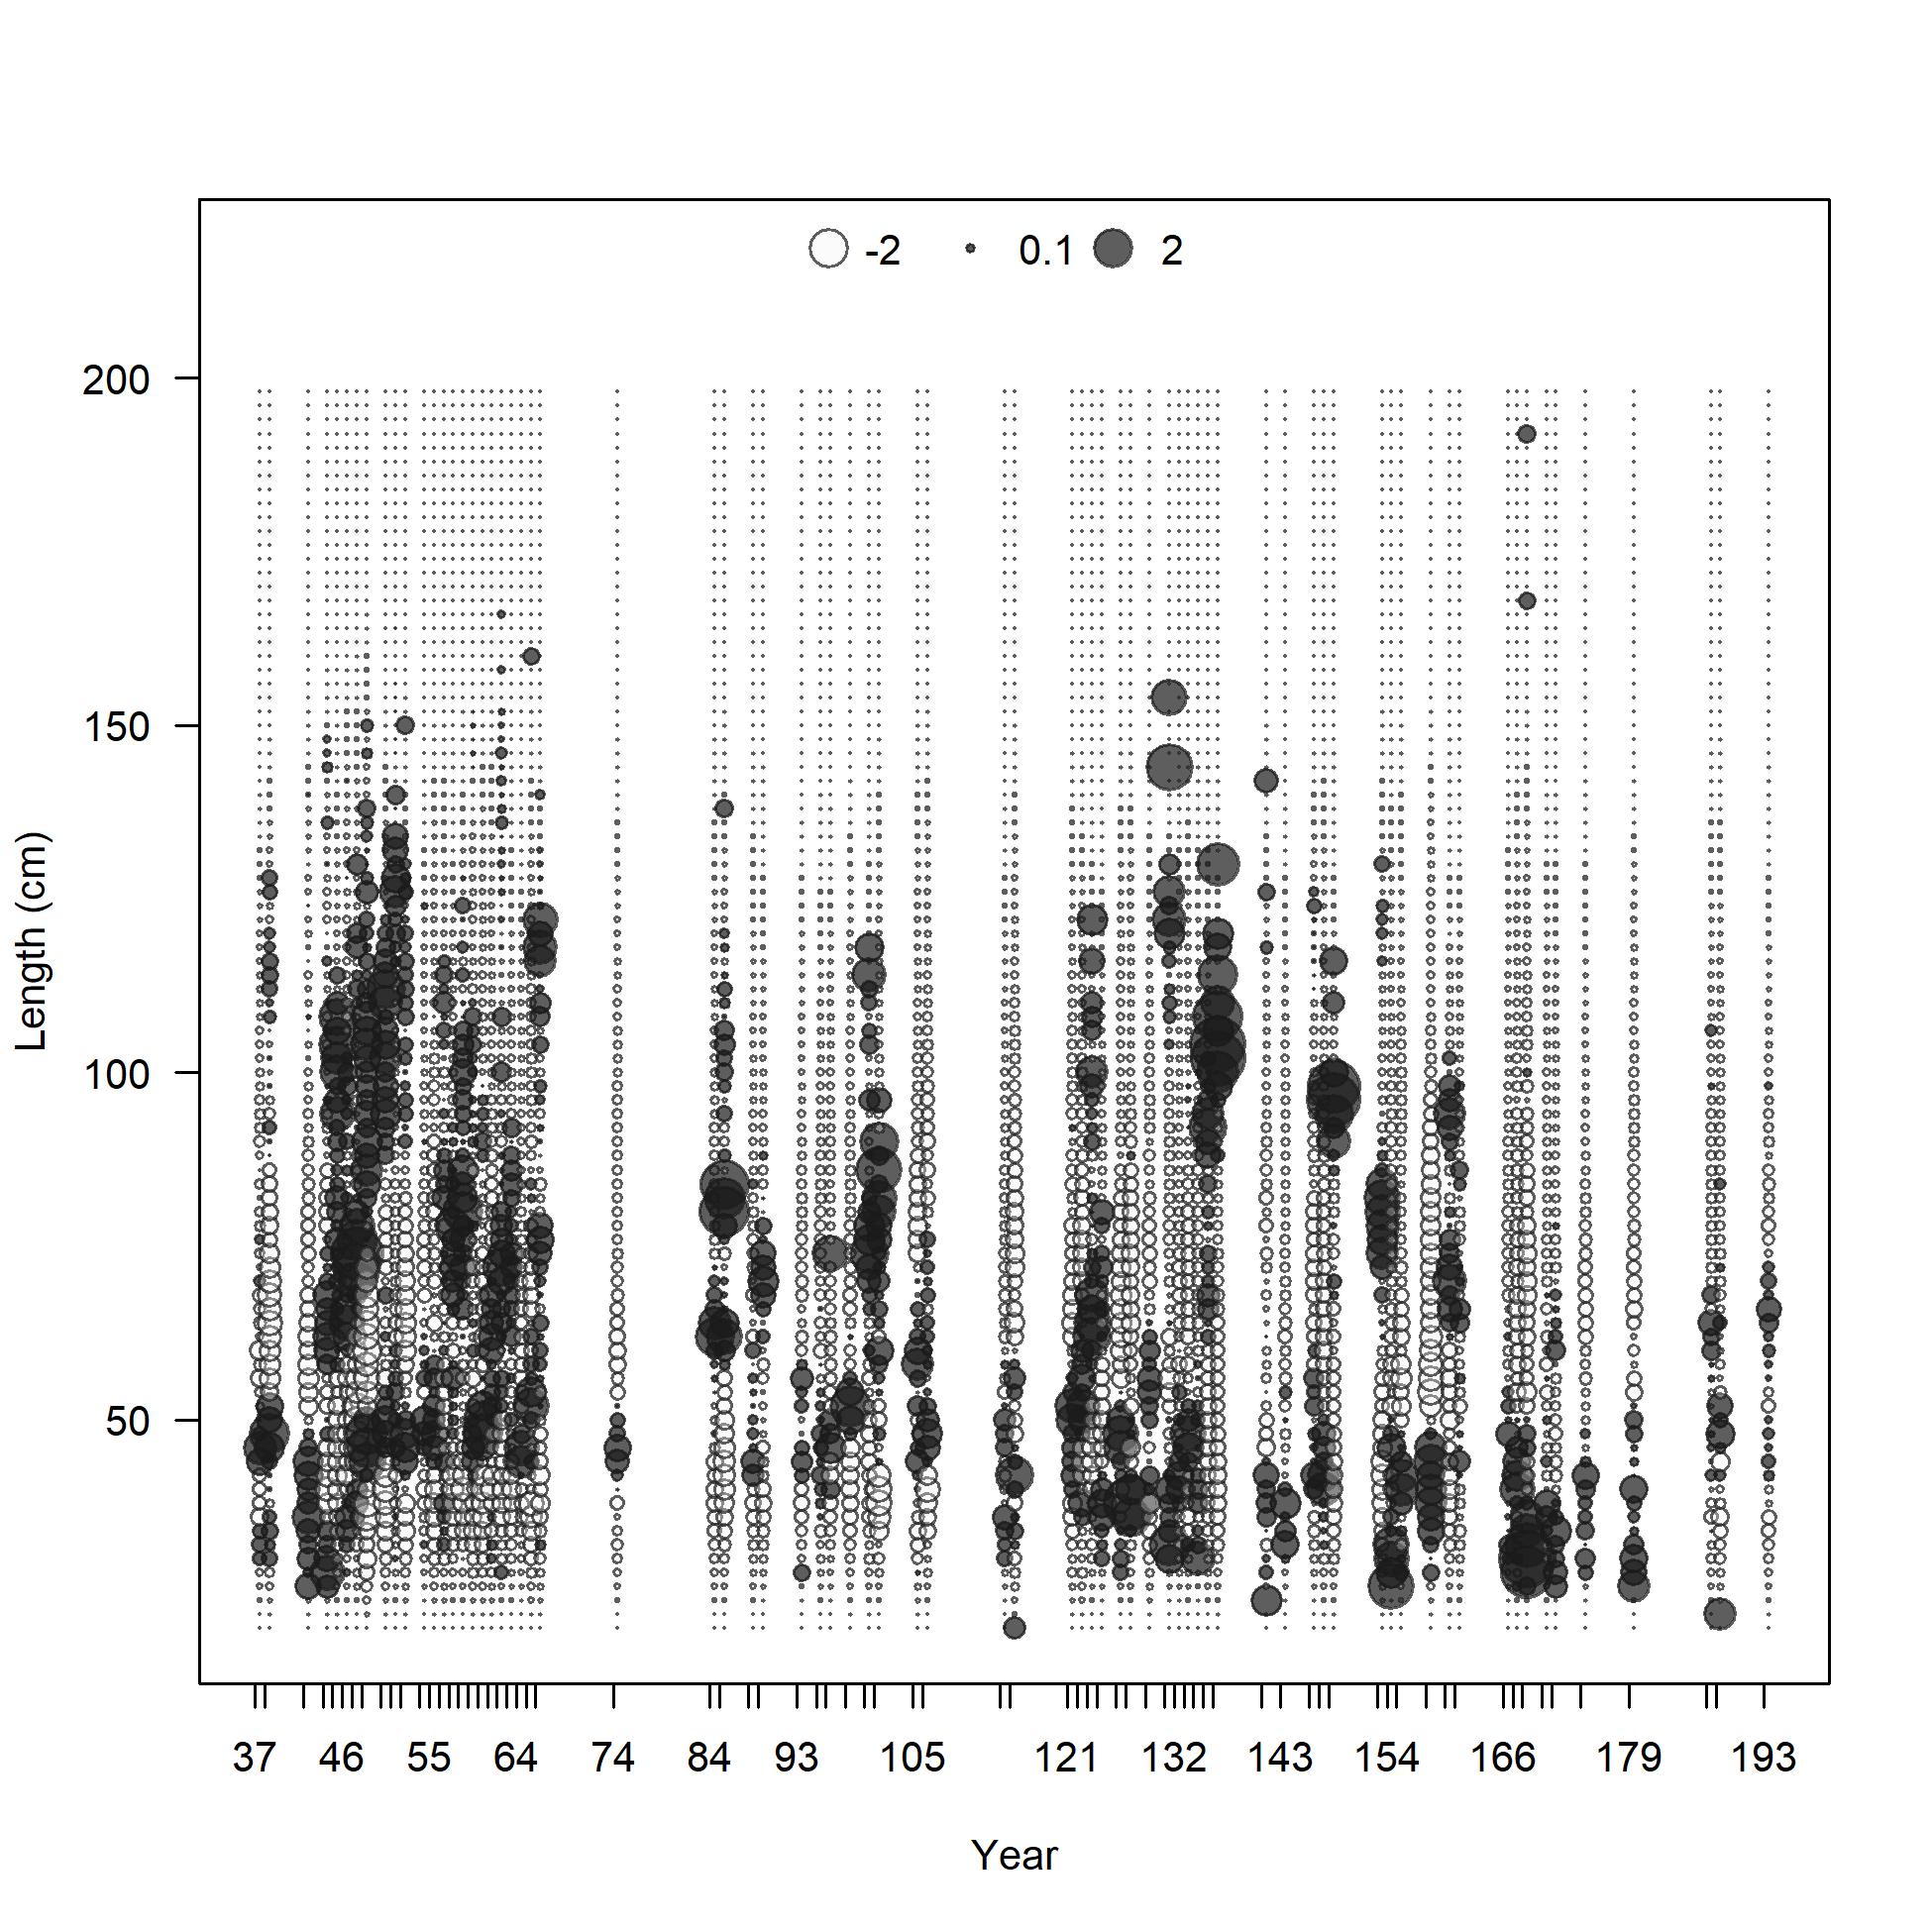
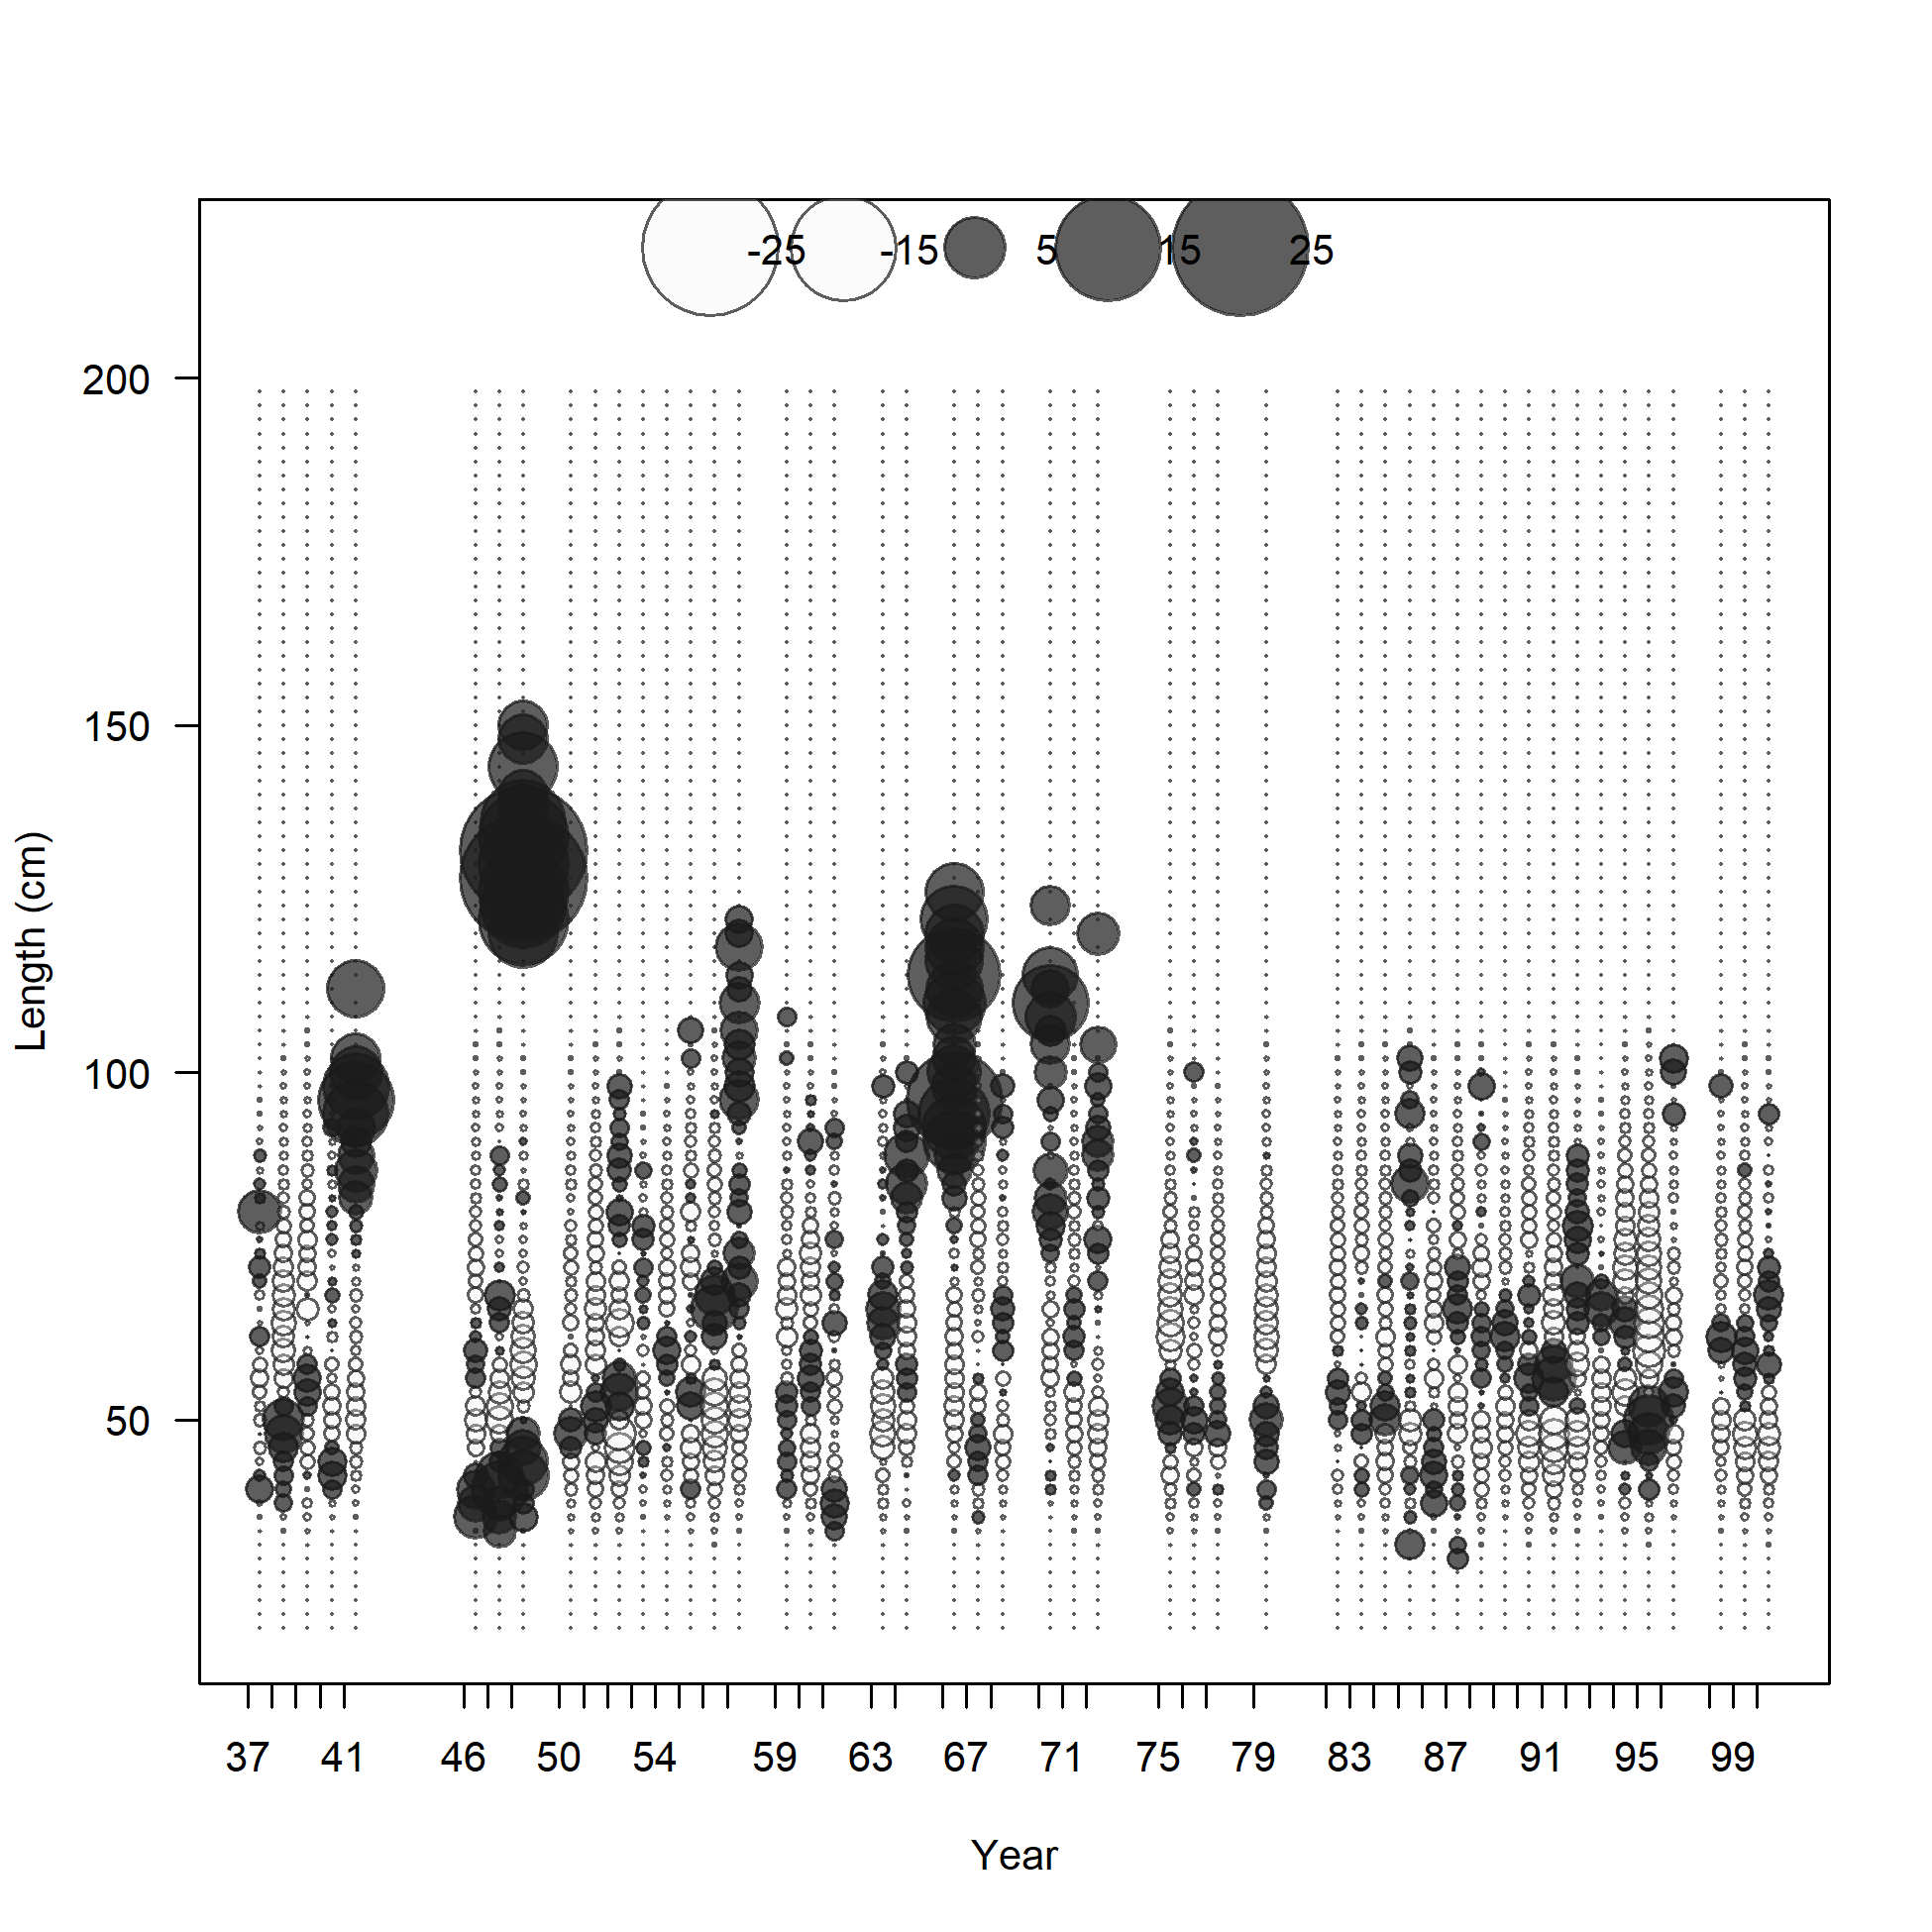
Pearson residuals, whole catch, F19.DEL.C.inshore (max=5.51) (plot 7 of 7)
Closed bubbles are positive residuals (observed > expected) and open bubbles are negative residuals (observed < expected).
file: comp_lenfit_residsflt19mkt0_page7.png
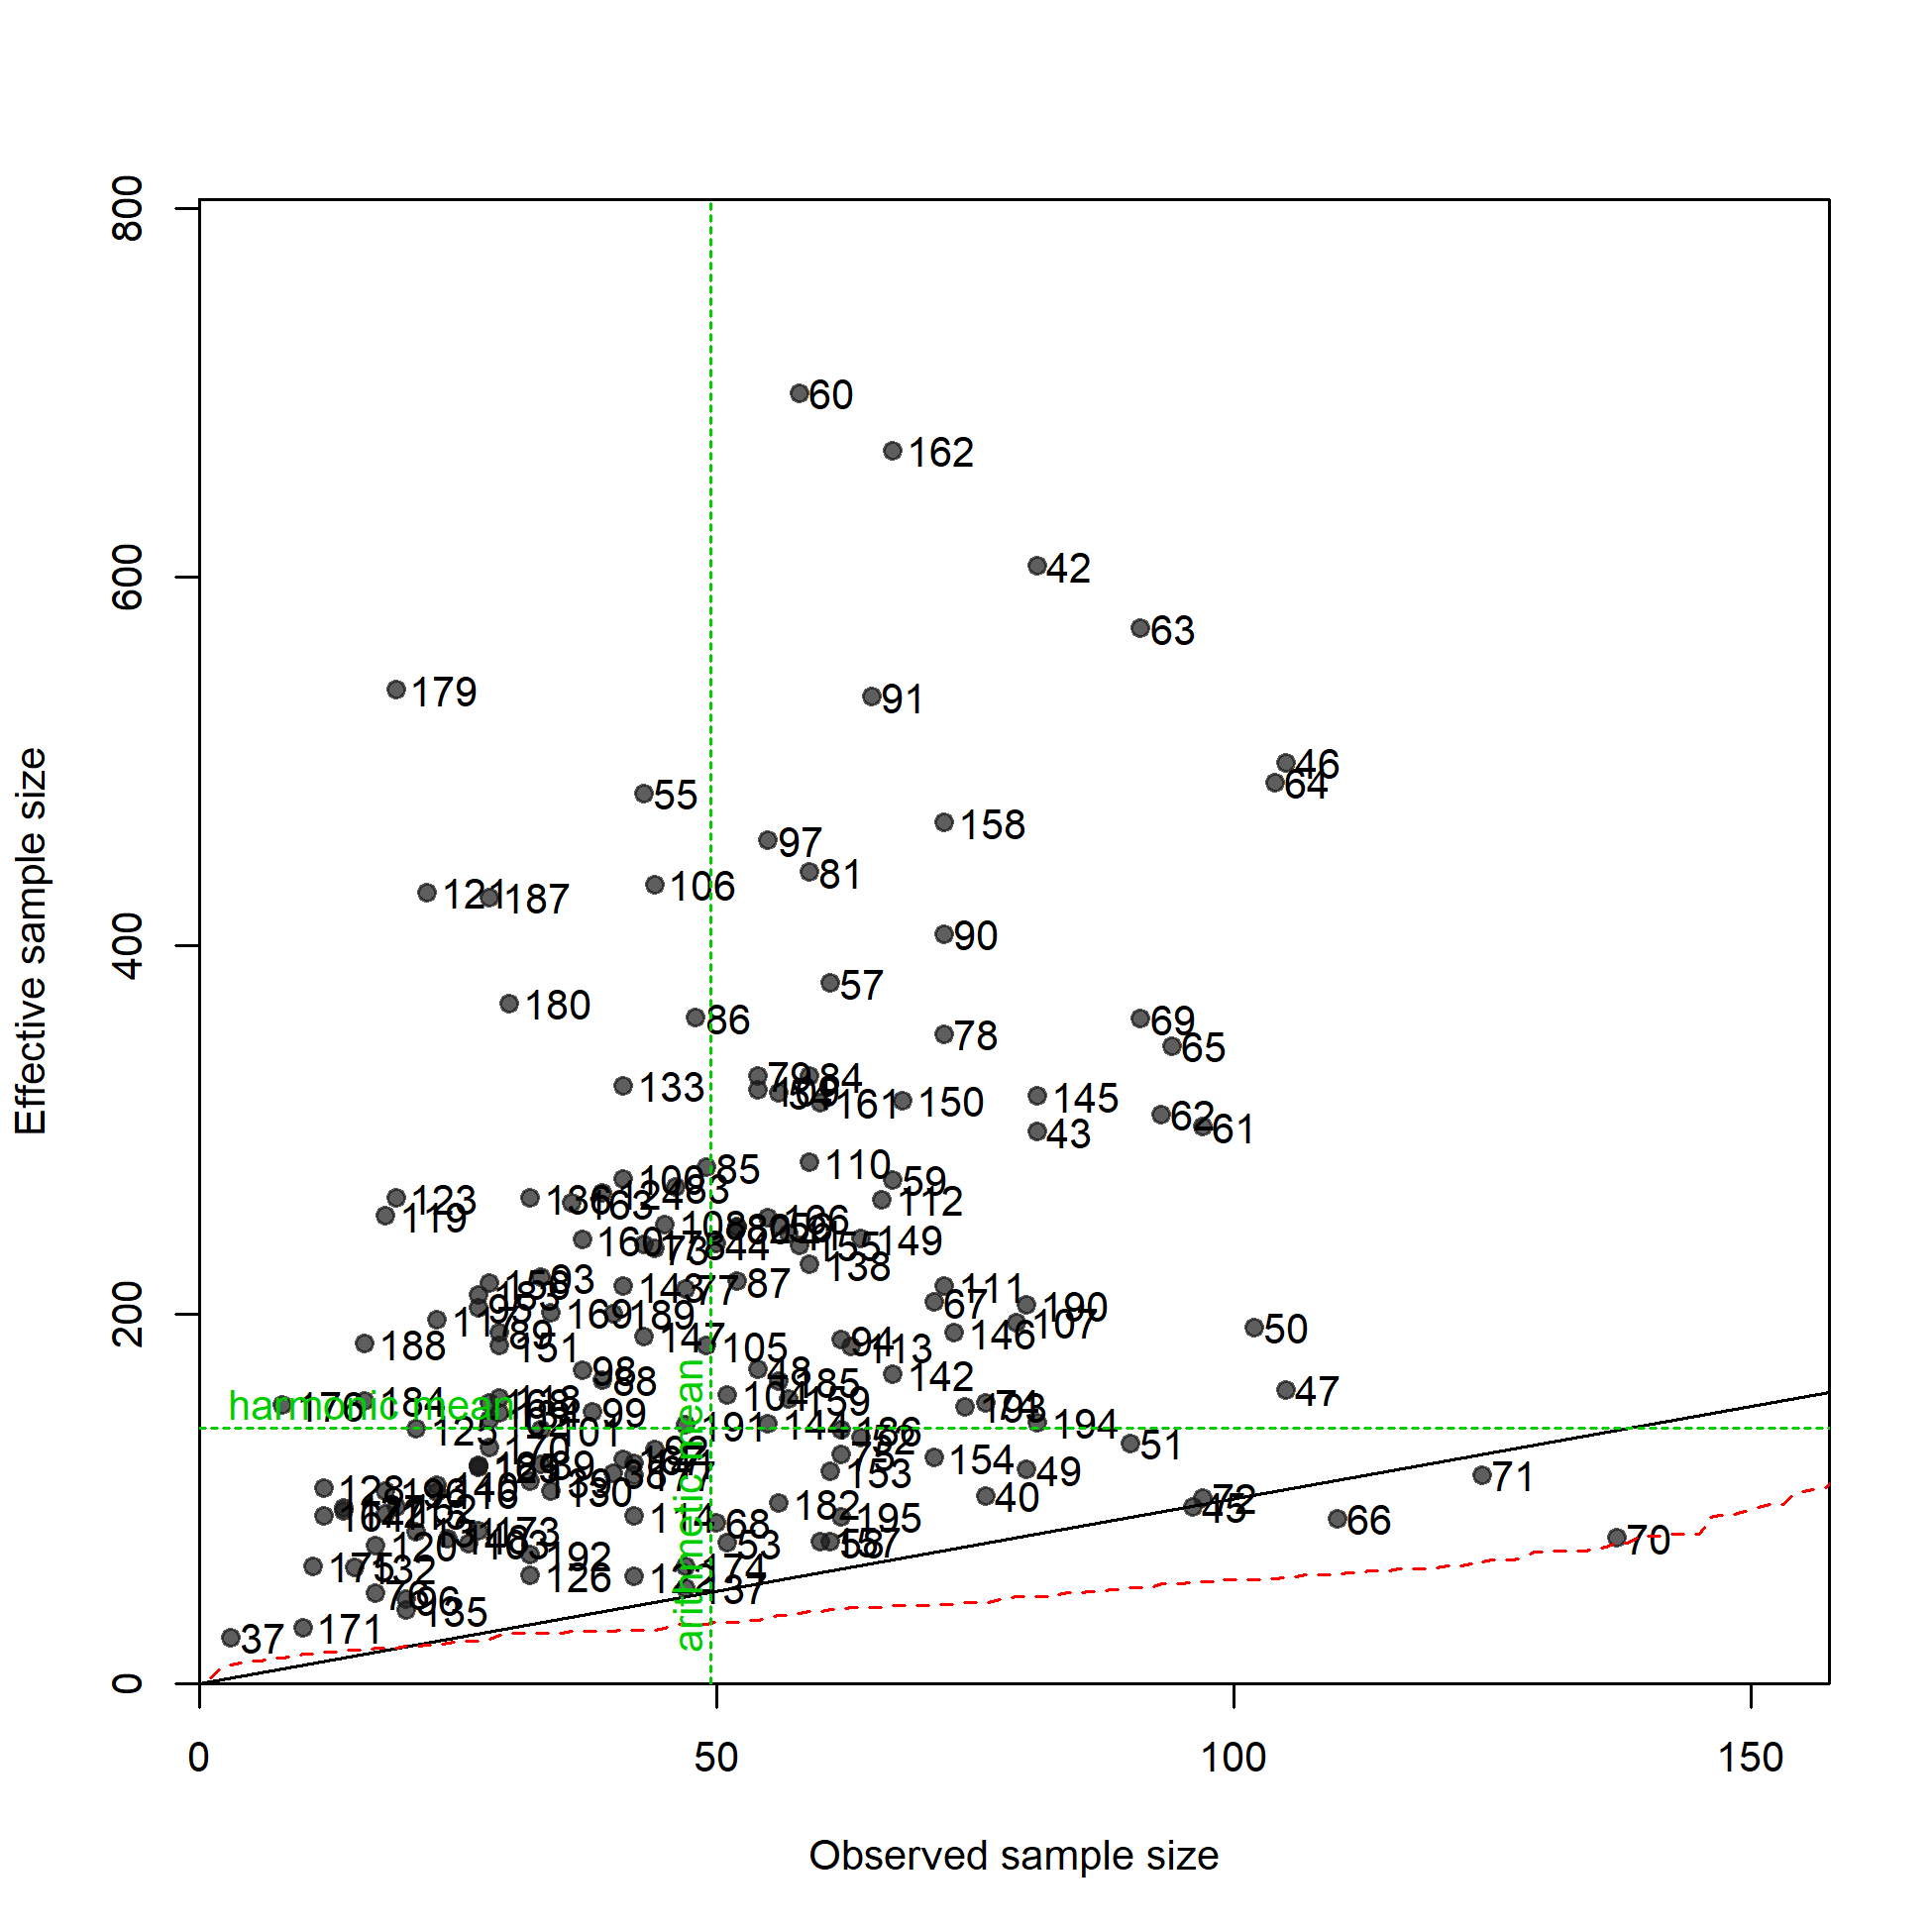
N-EffN comparison, Length comps, whole catch, F19.DEL.C.inshore
file: comp_lenfit_sampsize_flt19mkt0.png
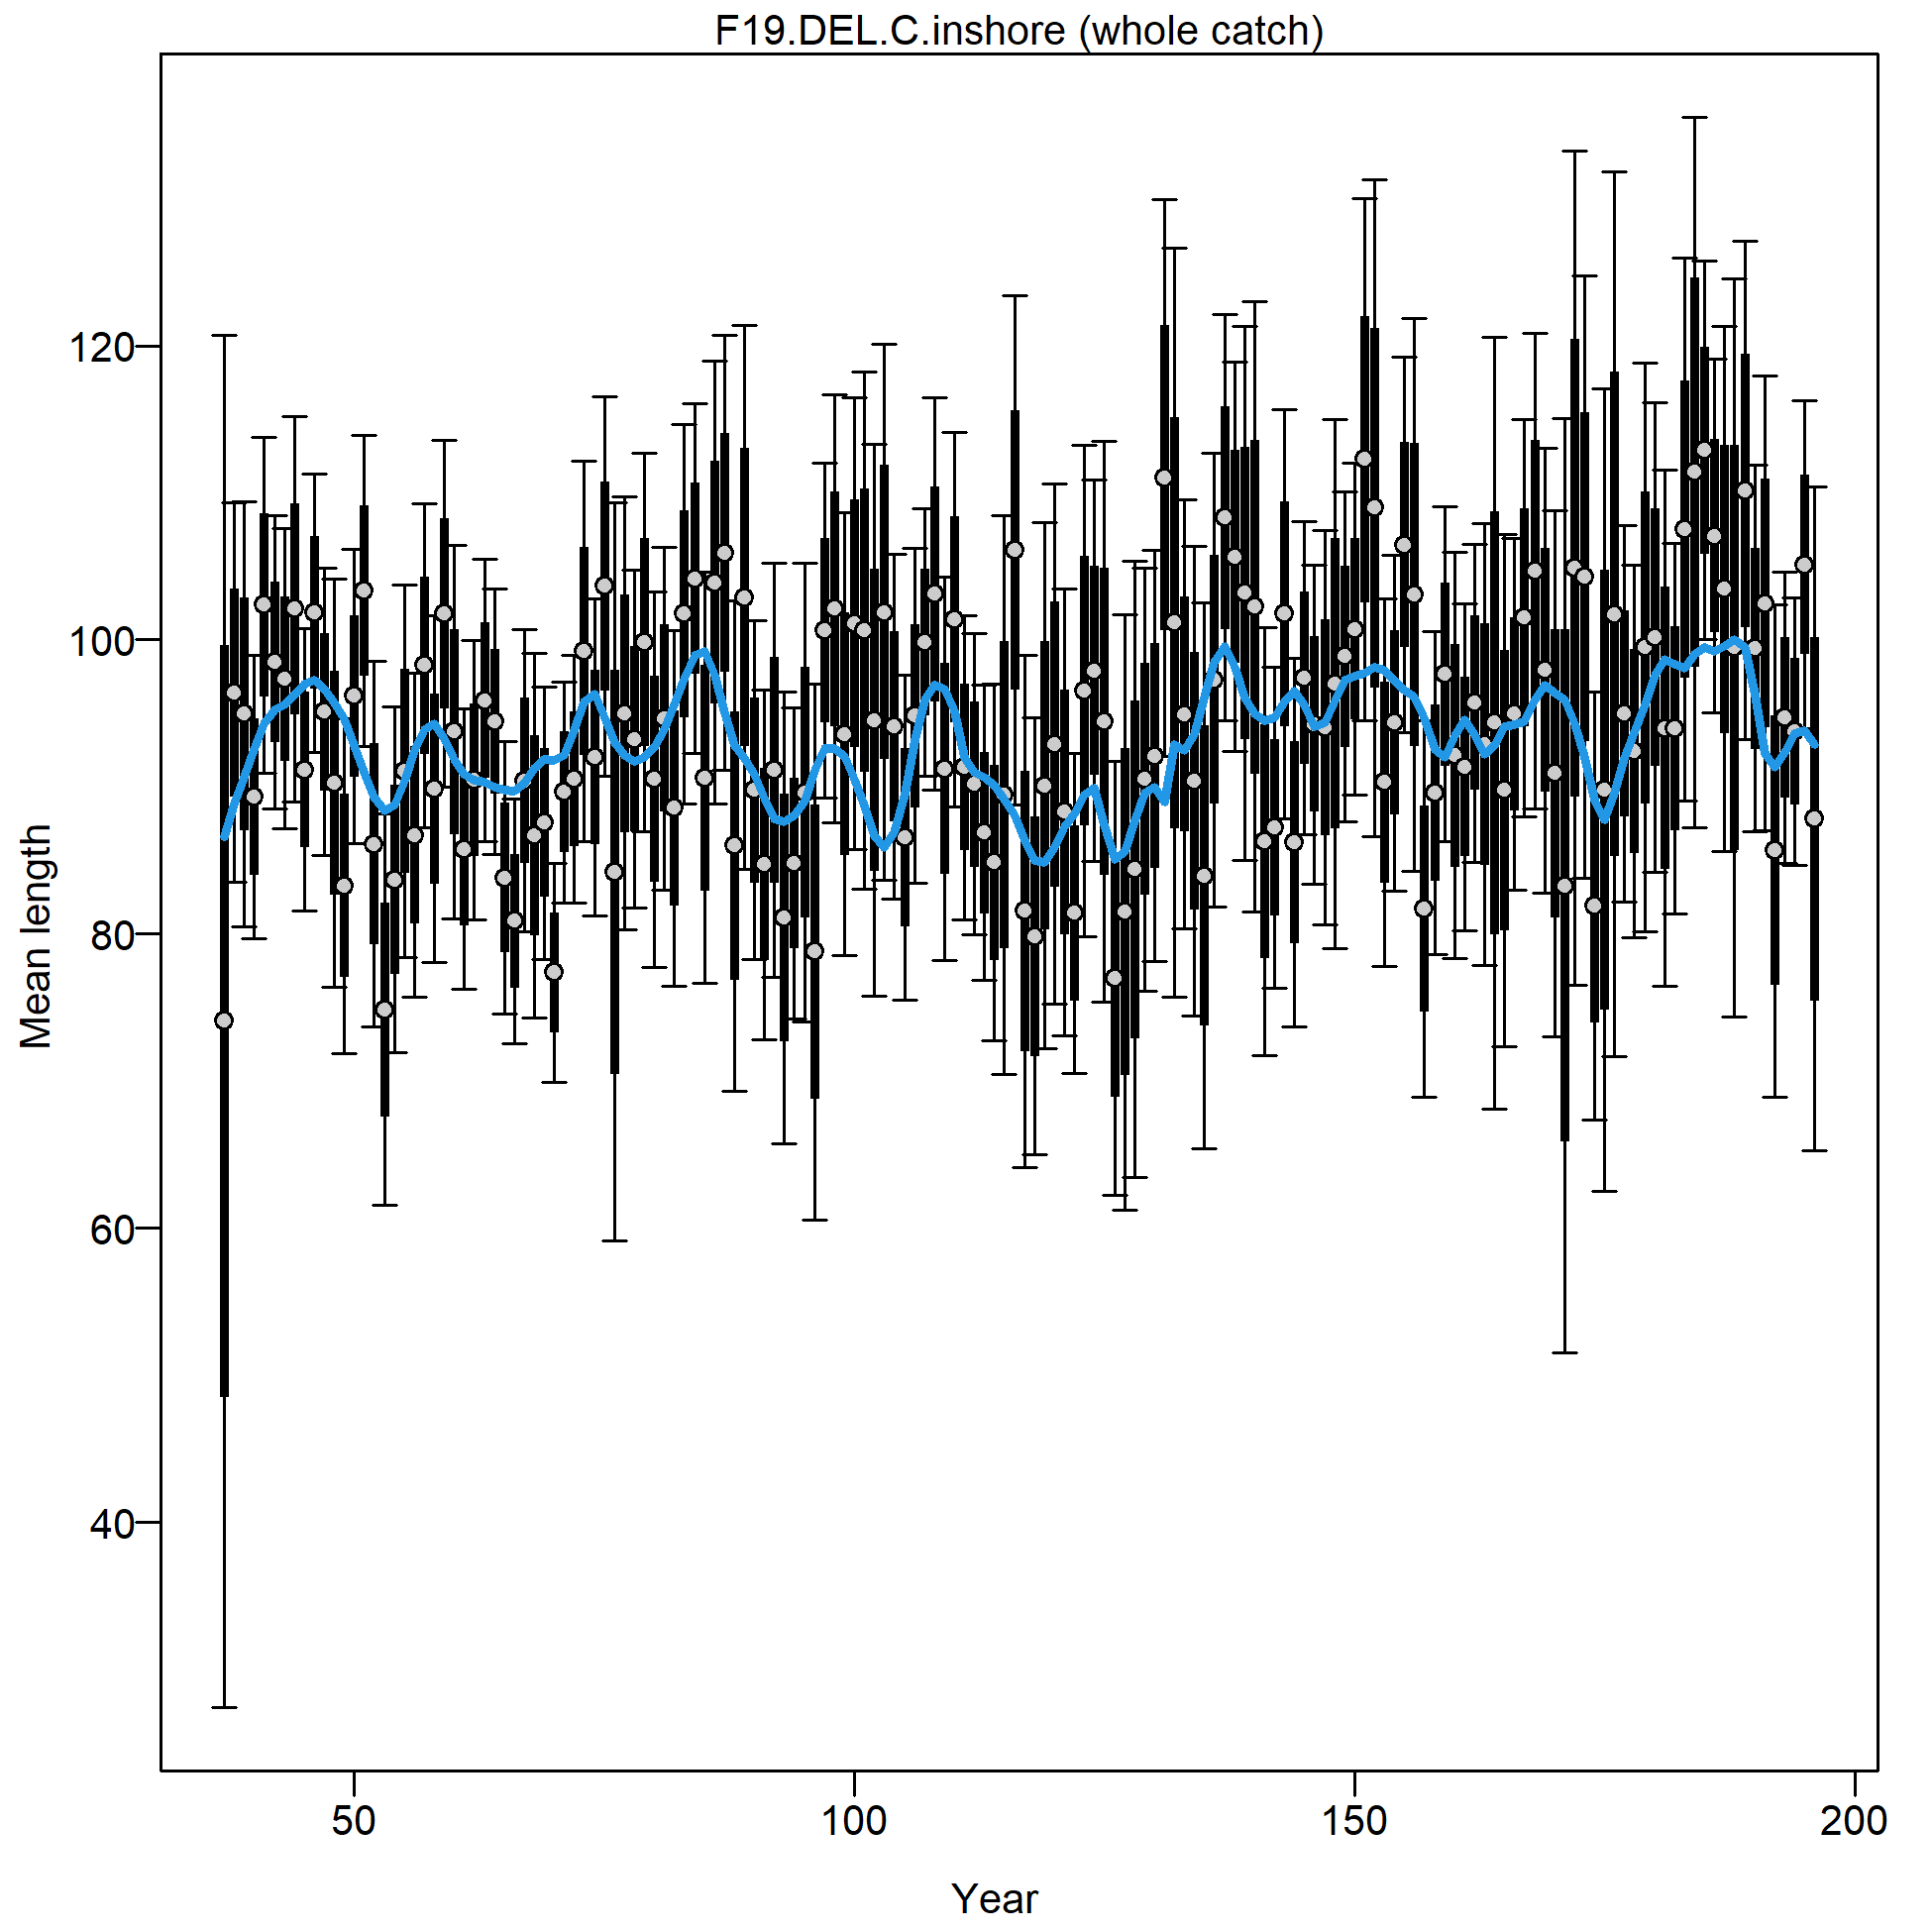
Mean length for F19.DEL.C.inshore with 95% confidence intervals based on current sample sizes.
Francis data weighting method TA1.8: thinner intervals (with capped ends) show result of further adjusting sample sizes based on suggested multiplier (with 95% interval) for len data from F19.DEL.C.inshore:
0.3004 (0.2371-0.3941)
For more info, see Francis (2011).
file: comp_lenfit_data_weighting_TA1.8_F19.DEL.C.inshore.png
Length comps, whole catch, F22.BB (plot 1 of 3).
'N adj.' is the input sample size after data-weighting adjustment. N eff. is the calculated effective sample size used in the McAllister-Ianelli tuning method.
file: comp_lenfit_flt22mkt0_page1.png
Length comps, whole catch, F22.BB (plot 1 of 3).
'N adj.' is the input sample size after data-weighting adjustment. N eff. is the calculated effective sample size used in the McAllister-Ianelli tuning method. (plot 2 of 3)
file: comp_lenfit_flt22mkt0_page2.png
Length comps, whole catch, F22.BB (plot 1 of 3).
'N adj.' is the input sample size after data-weighting adjustment. N eff. is the calculated effective sample size used in the McAllister-Ianelli tuning method. (plot 2 of 3) (plot 3 of 3)
file: comp_lenfit_flt22mkt0_page3.png
Pearson residuals, whole catch, F22.BB (max=21.68) (plot 3 of 3)
Closed bubbles are positive residuals (observed > expected) and open bubbles are negative residuals (observed < expected).
file: comp_lenfit_residsflt22mkt0_page3.png
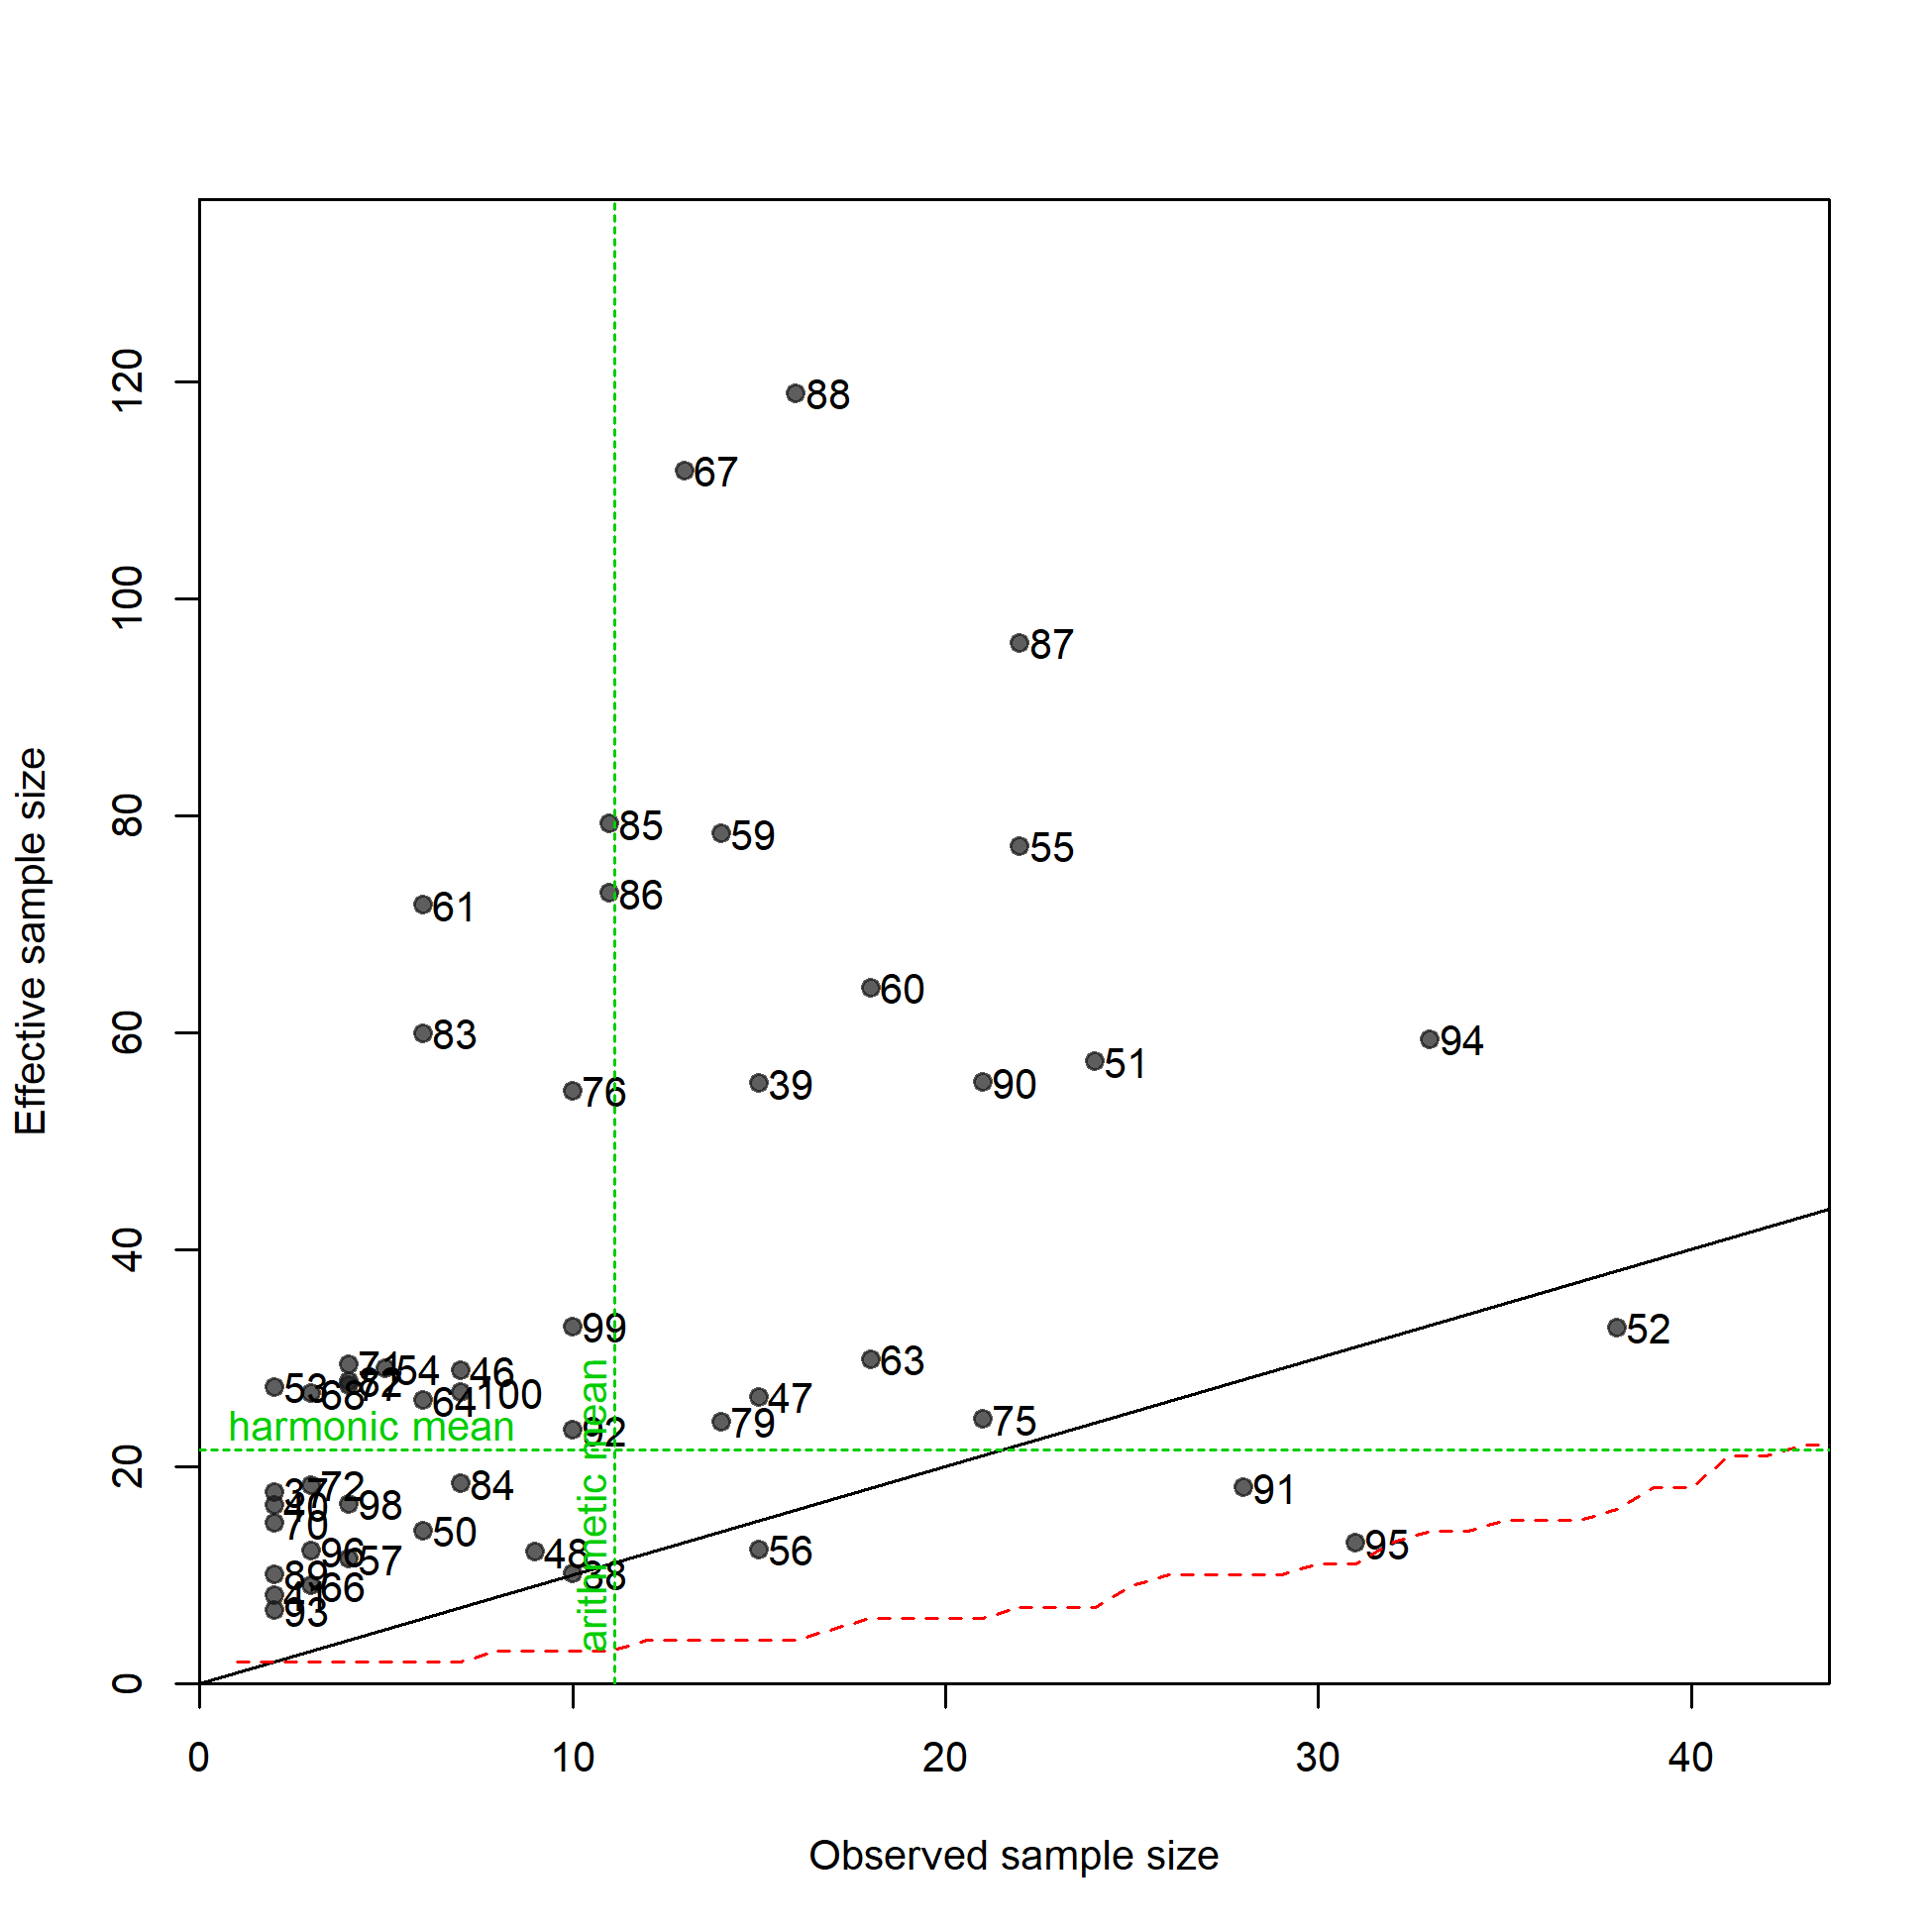
N-EffN comparison, Length comps, whole catch, F22.BB
file: comp_lenfit_sampsize_flt22mkt0.png
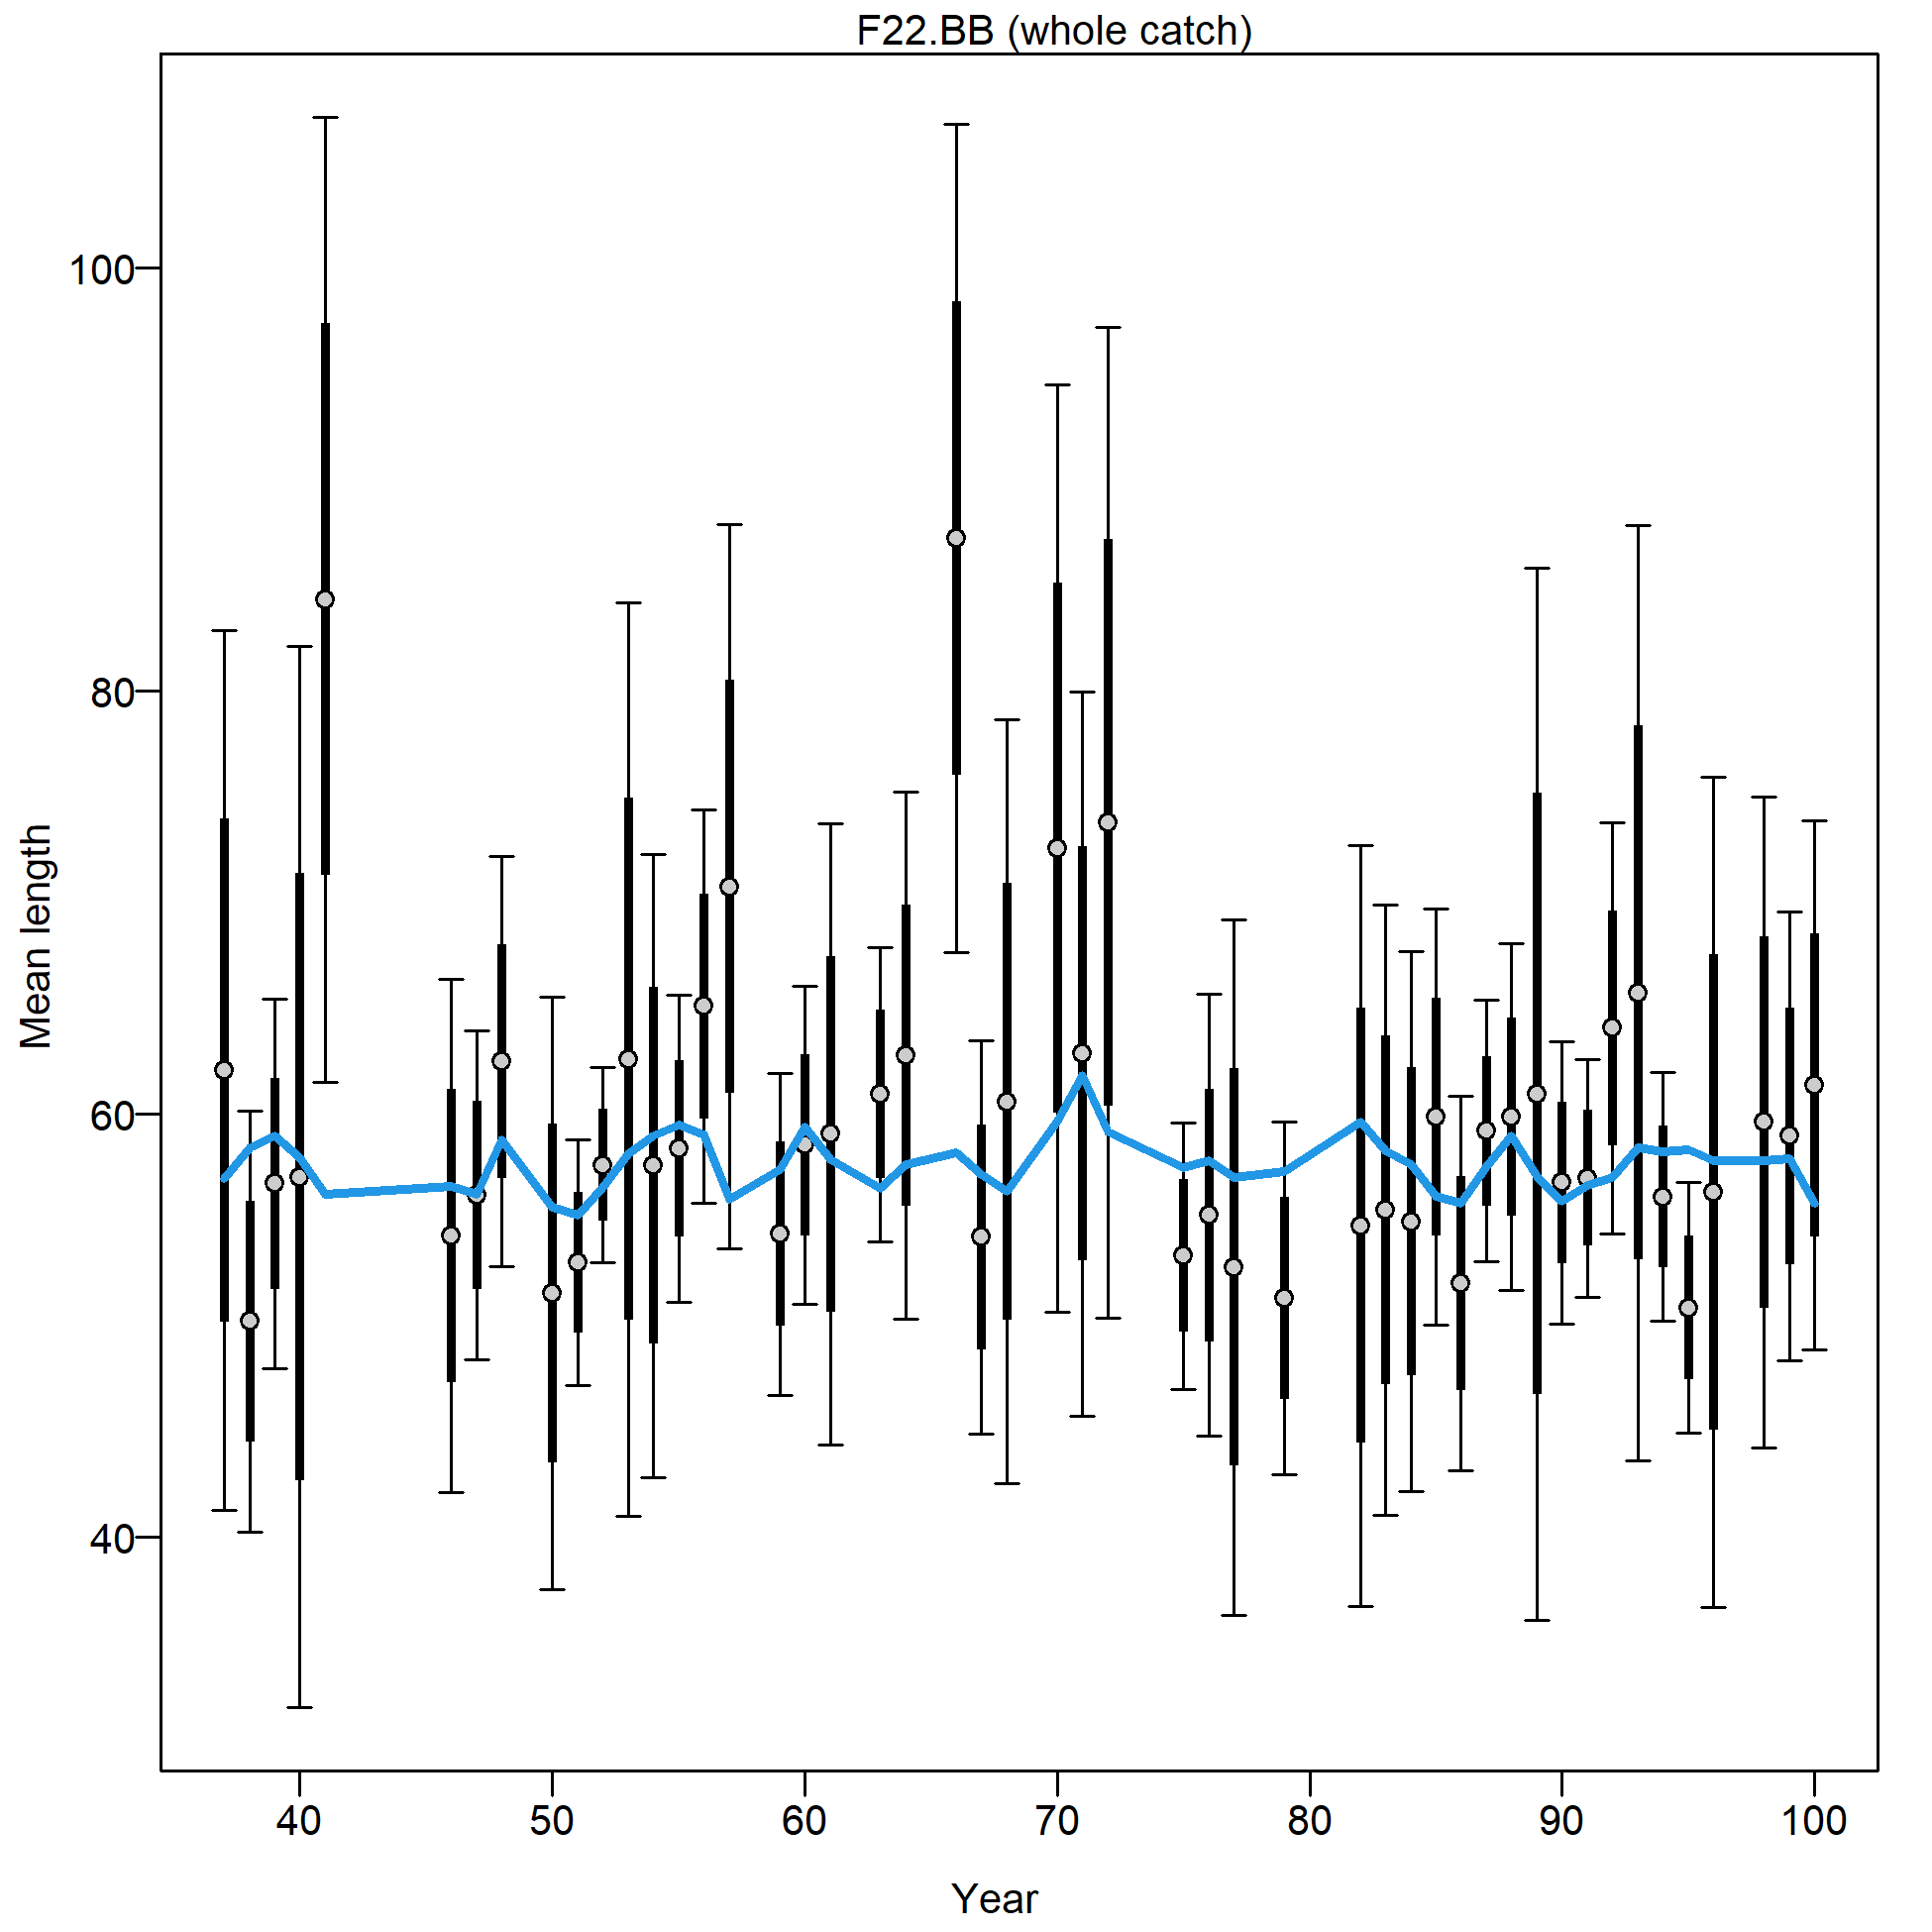
Mean length for F22.BB with 95% confidence intervals based on current sample sizes.
Francis data weighting method TA1.8: thinner intervals (with capped ends) show result of further adjusting sample sizes based on suggested multiplier (with 95% interval) for len data from F22.BB:
0.3268 (0.2149-0.5986)
For more info, see Francis (2011).
file: comp_lenfit_data_weighting_TA1.8_F22.BB.png