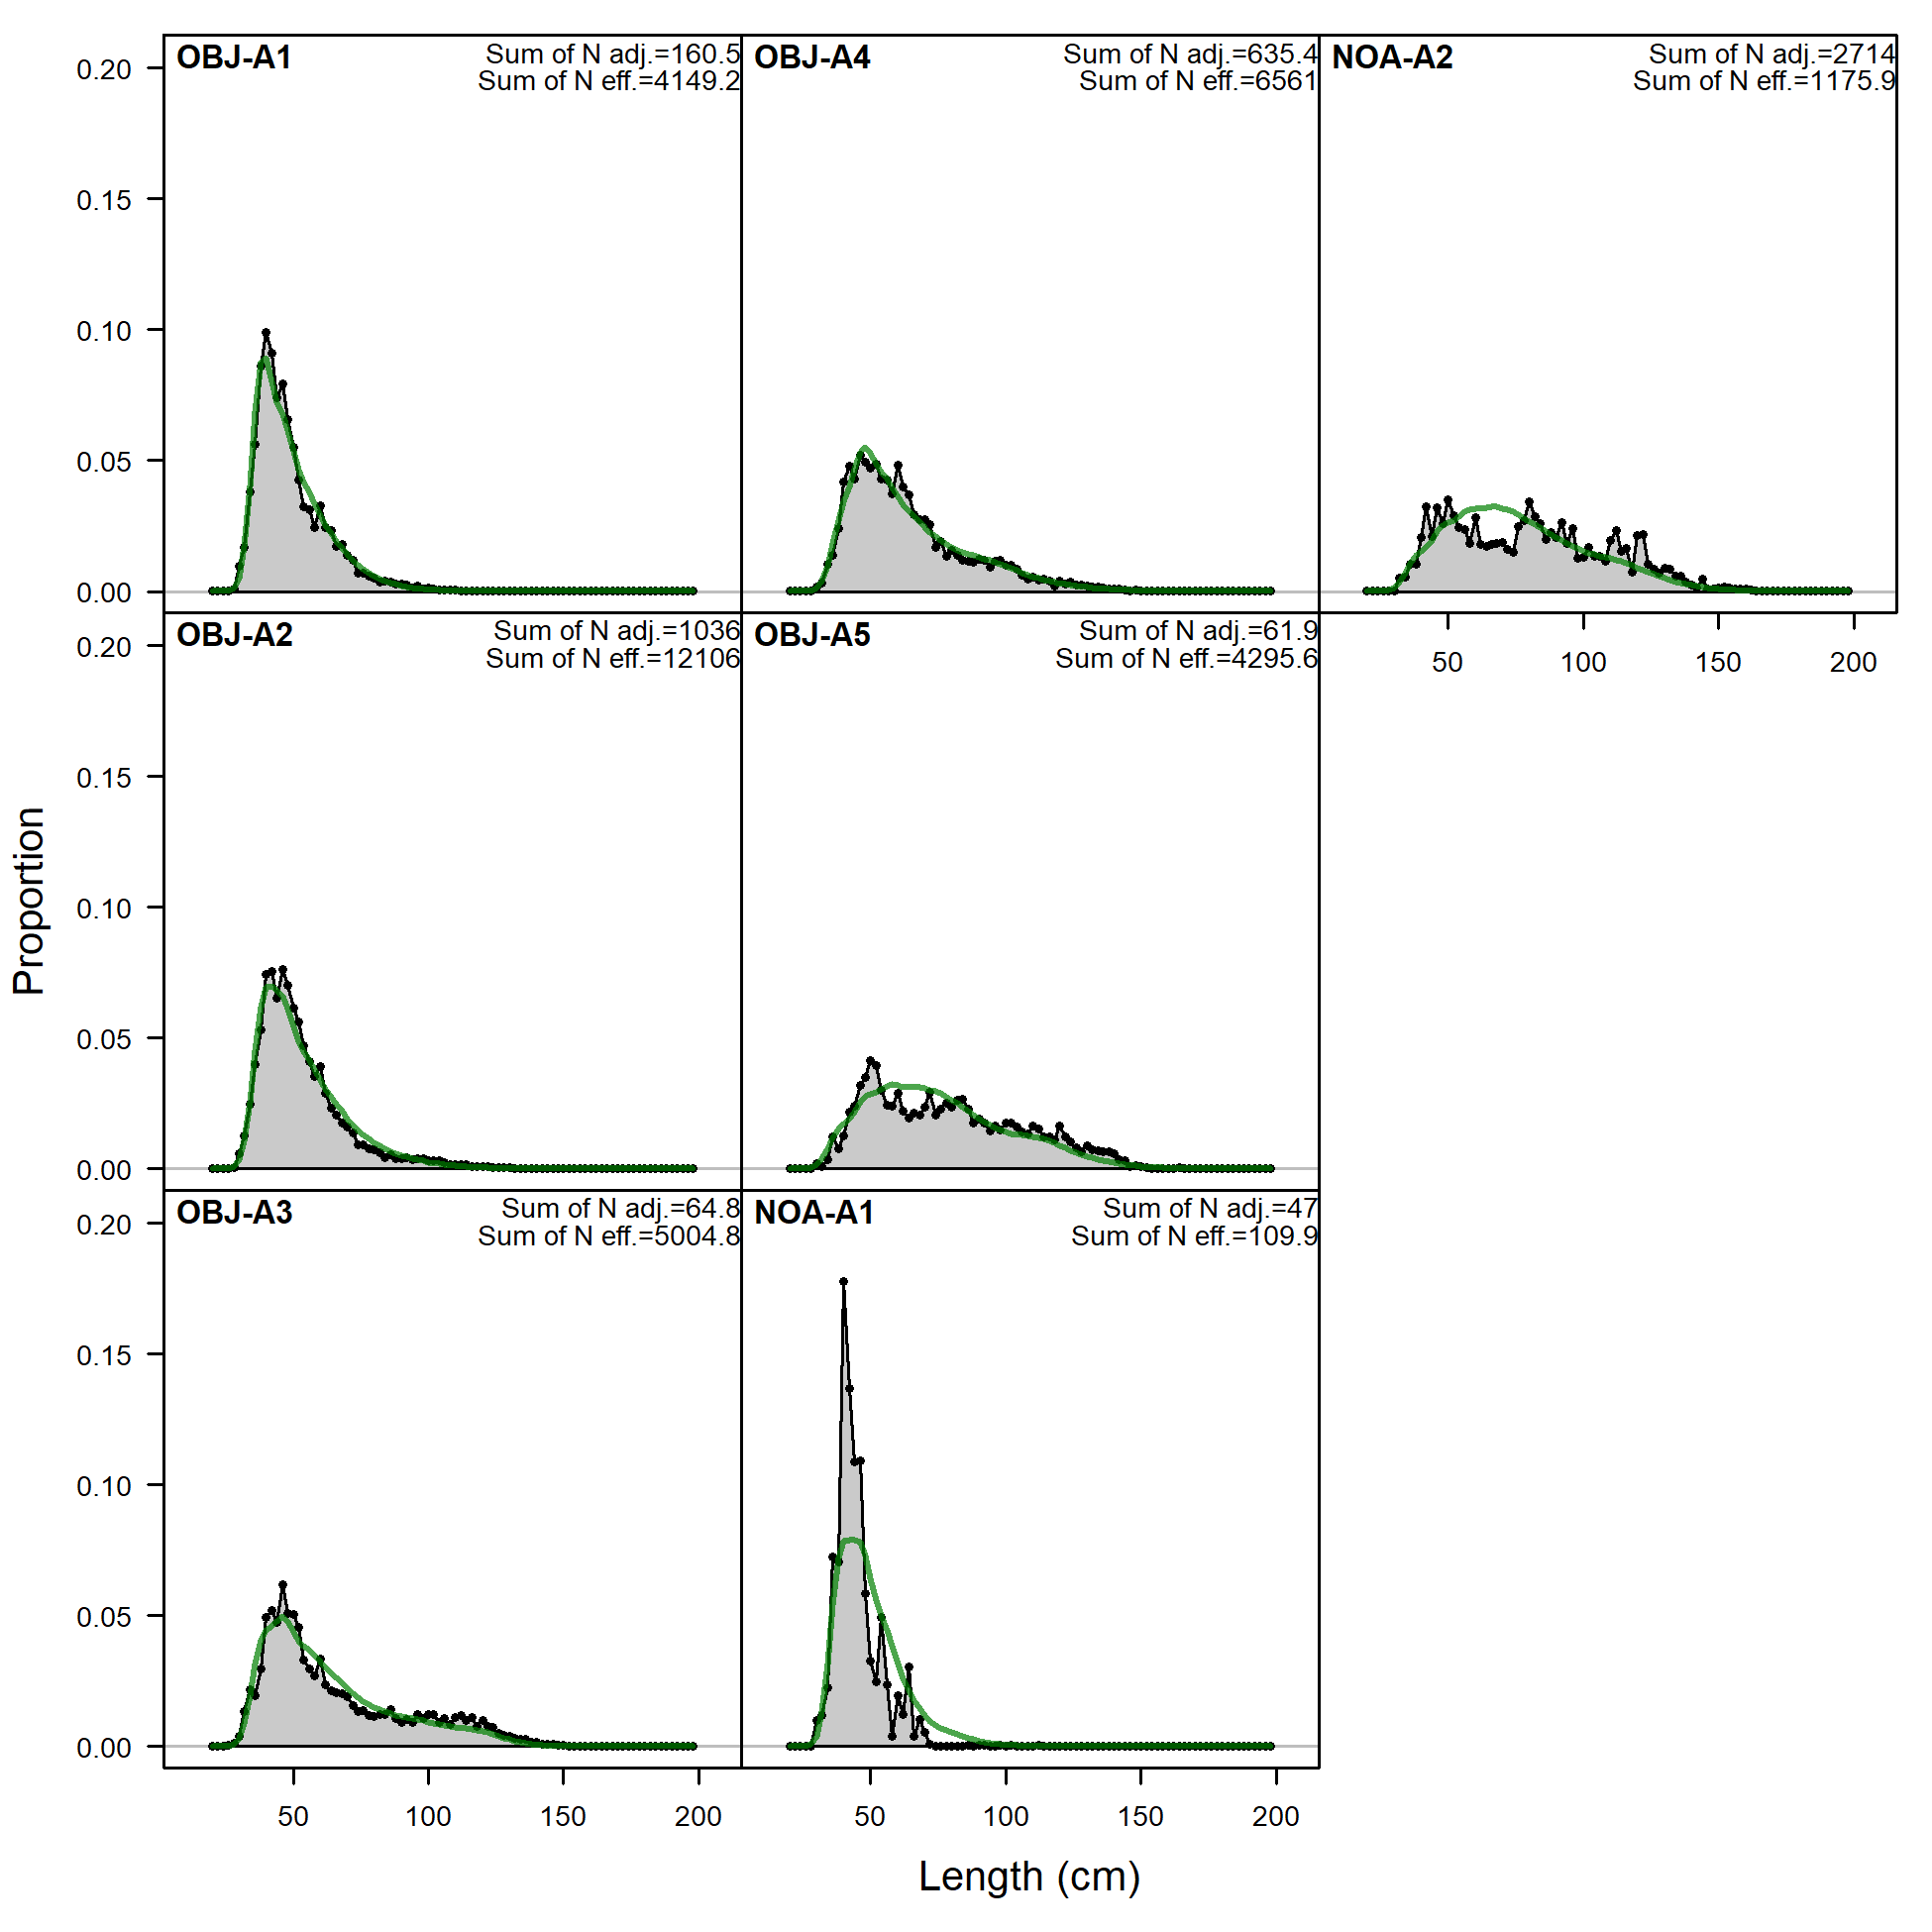
Length comps, aggregated across time by fleet.
Labels 'retained' and 'discard' indicate discarded or retained sampled for each fleet. Panels without this designation represent the whole catch.
file: comp_lenfit__aggregated_across_time.png
Length comps, aggregated across time by fleet.
Labels 'retained' and 'discard' indicate discarded or retained sampled for each fleet. Panels without this designation represent the whole catch.
file: comp_lenfit__aggregated_across_time.png
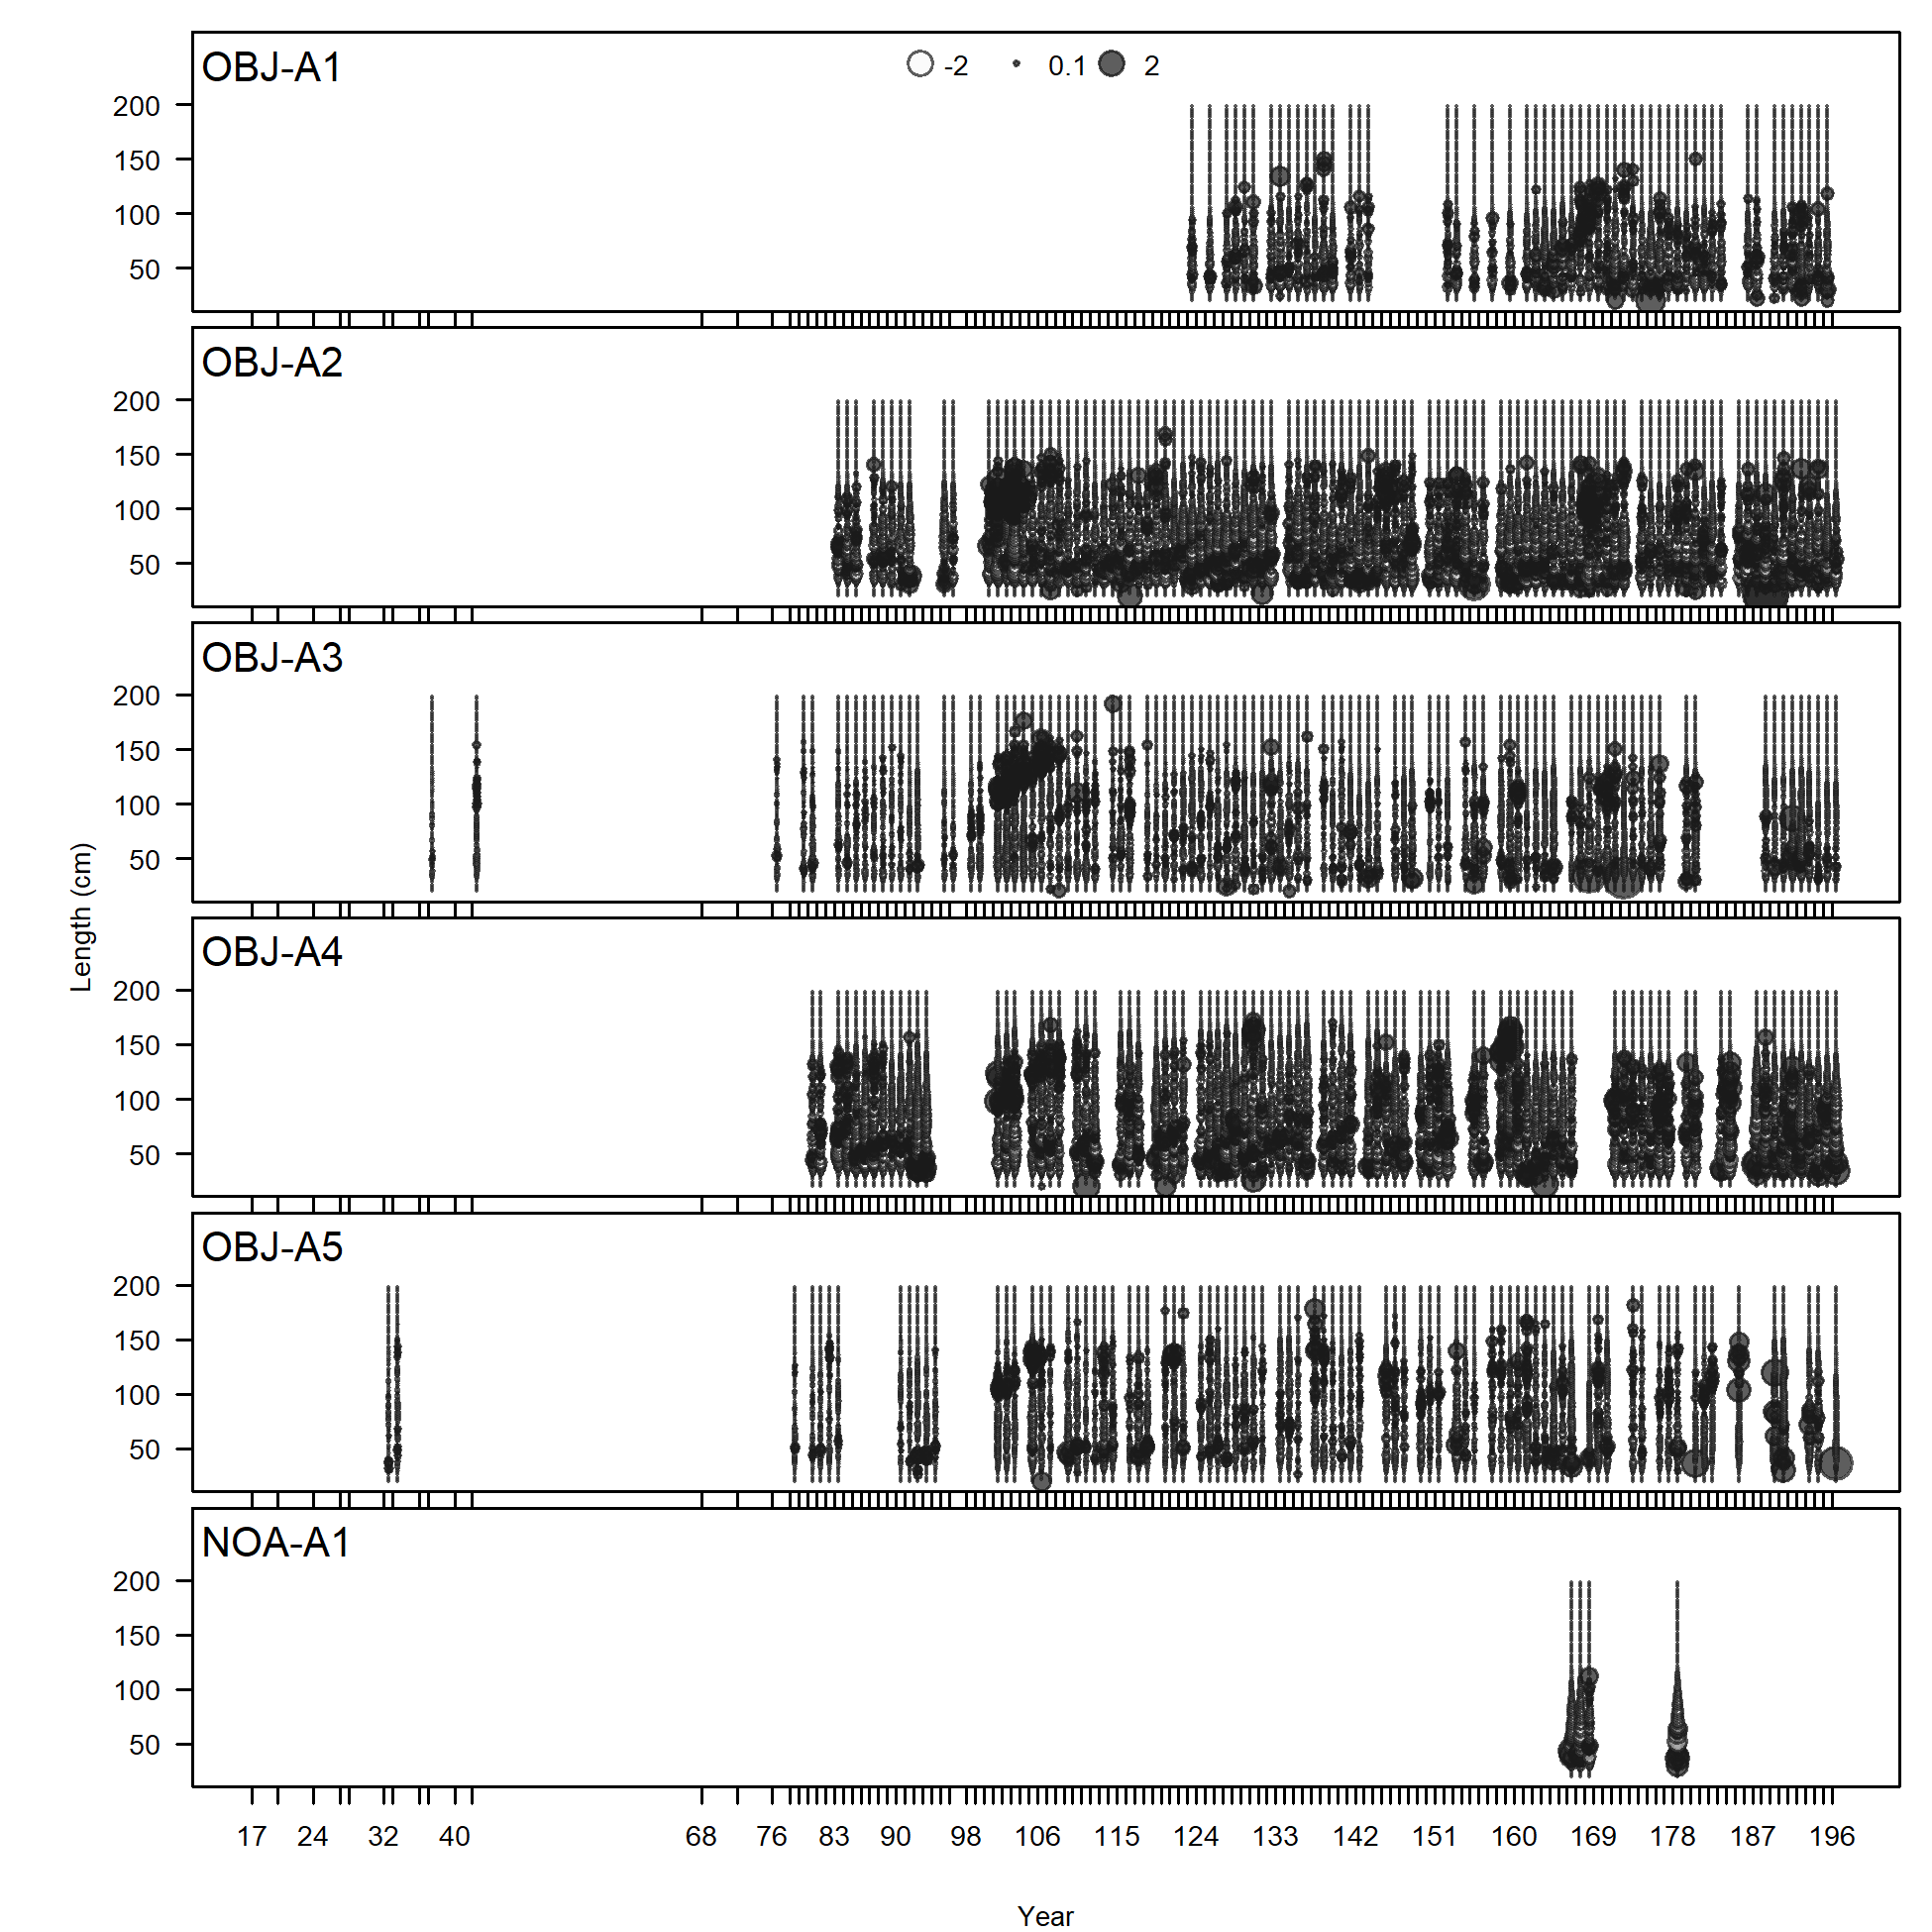
Pearson residuals, comparing across fleets (plot 1 of 2)
Closed bubbles are positive residuals (observed > expected) and open bubbles are negative residuals (observed < expected).
file: comp_lenfit__page1_multi-fleet_comparison.png
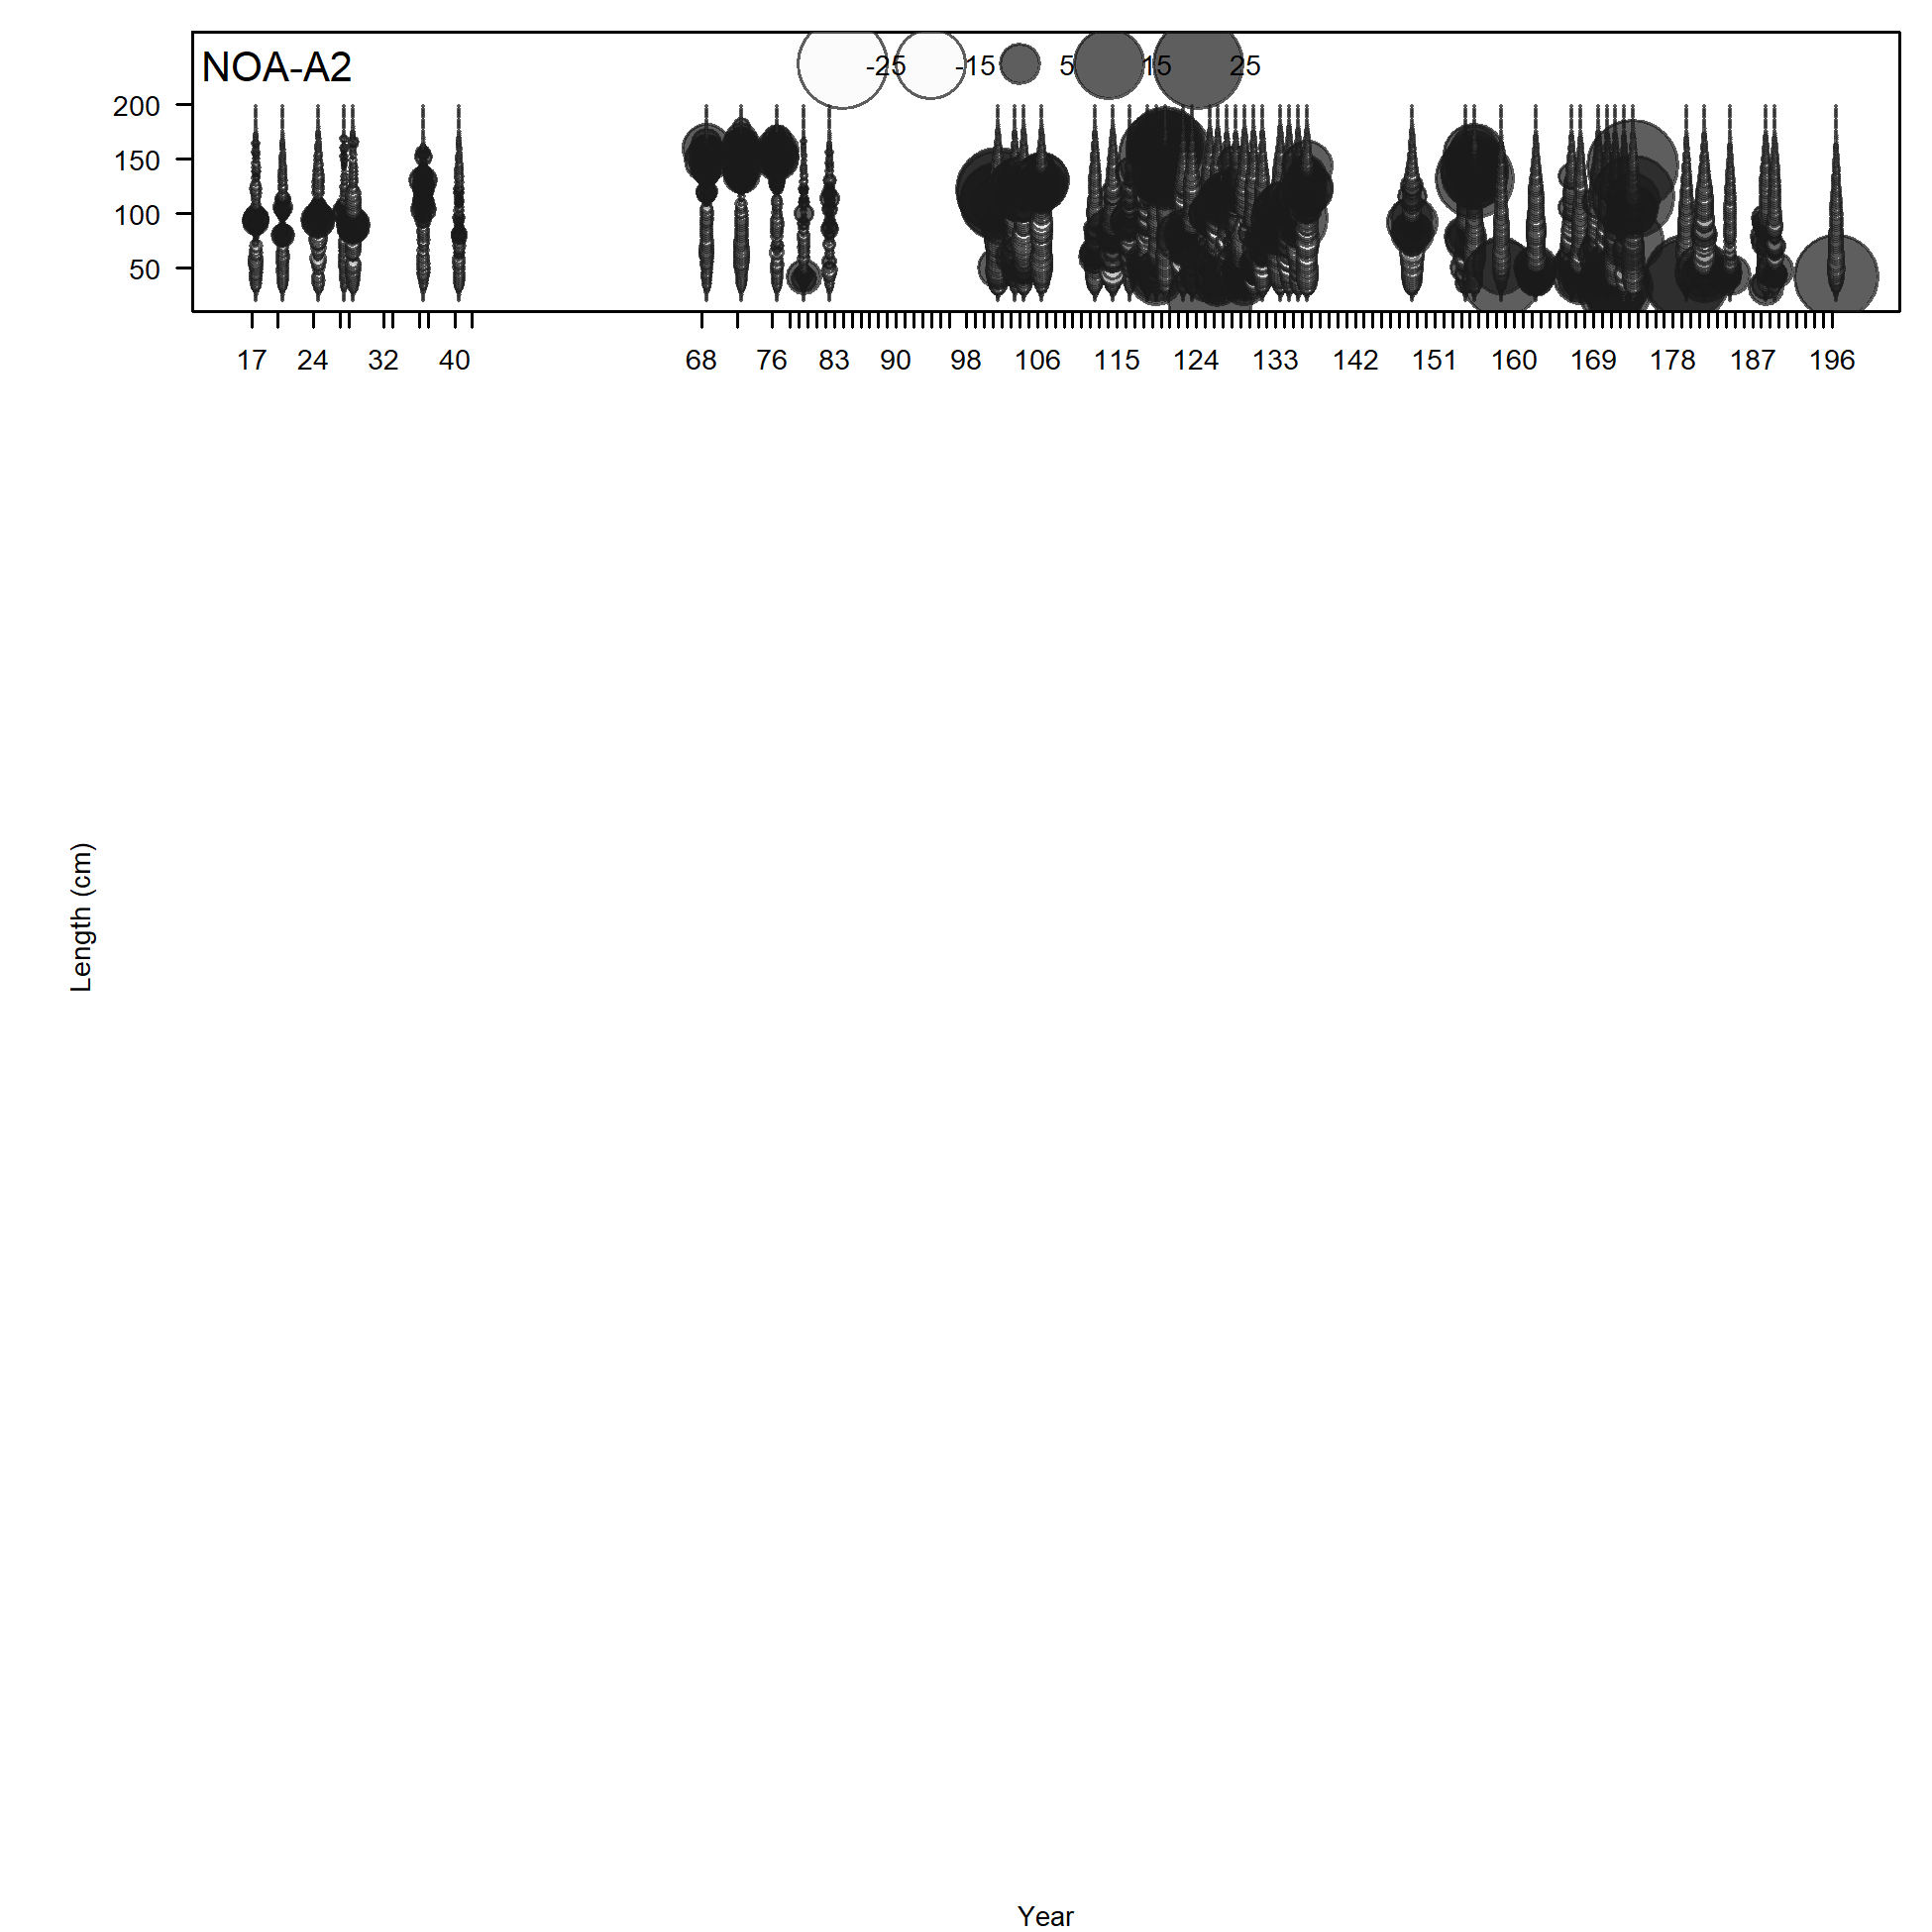
Pearson residuals, comparing across fleets (plot 2 of 2)
file: comp_lenfit__page2_multi-fleet_comparison.png
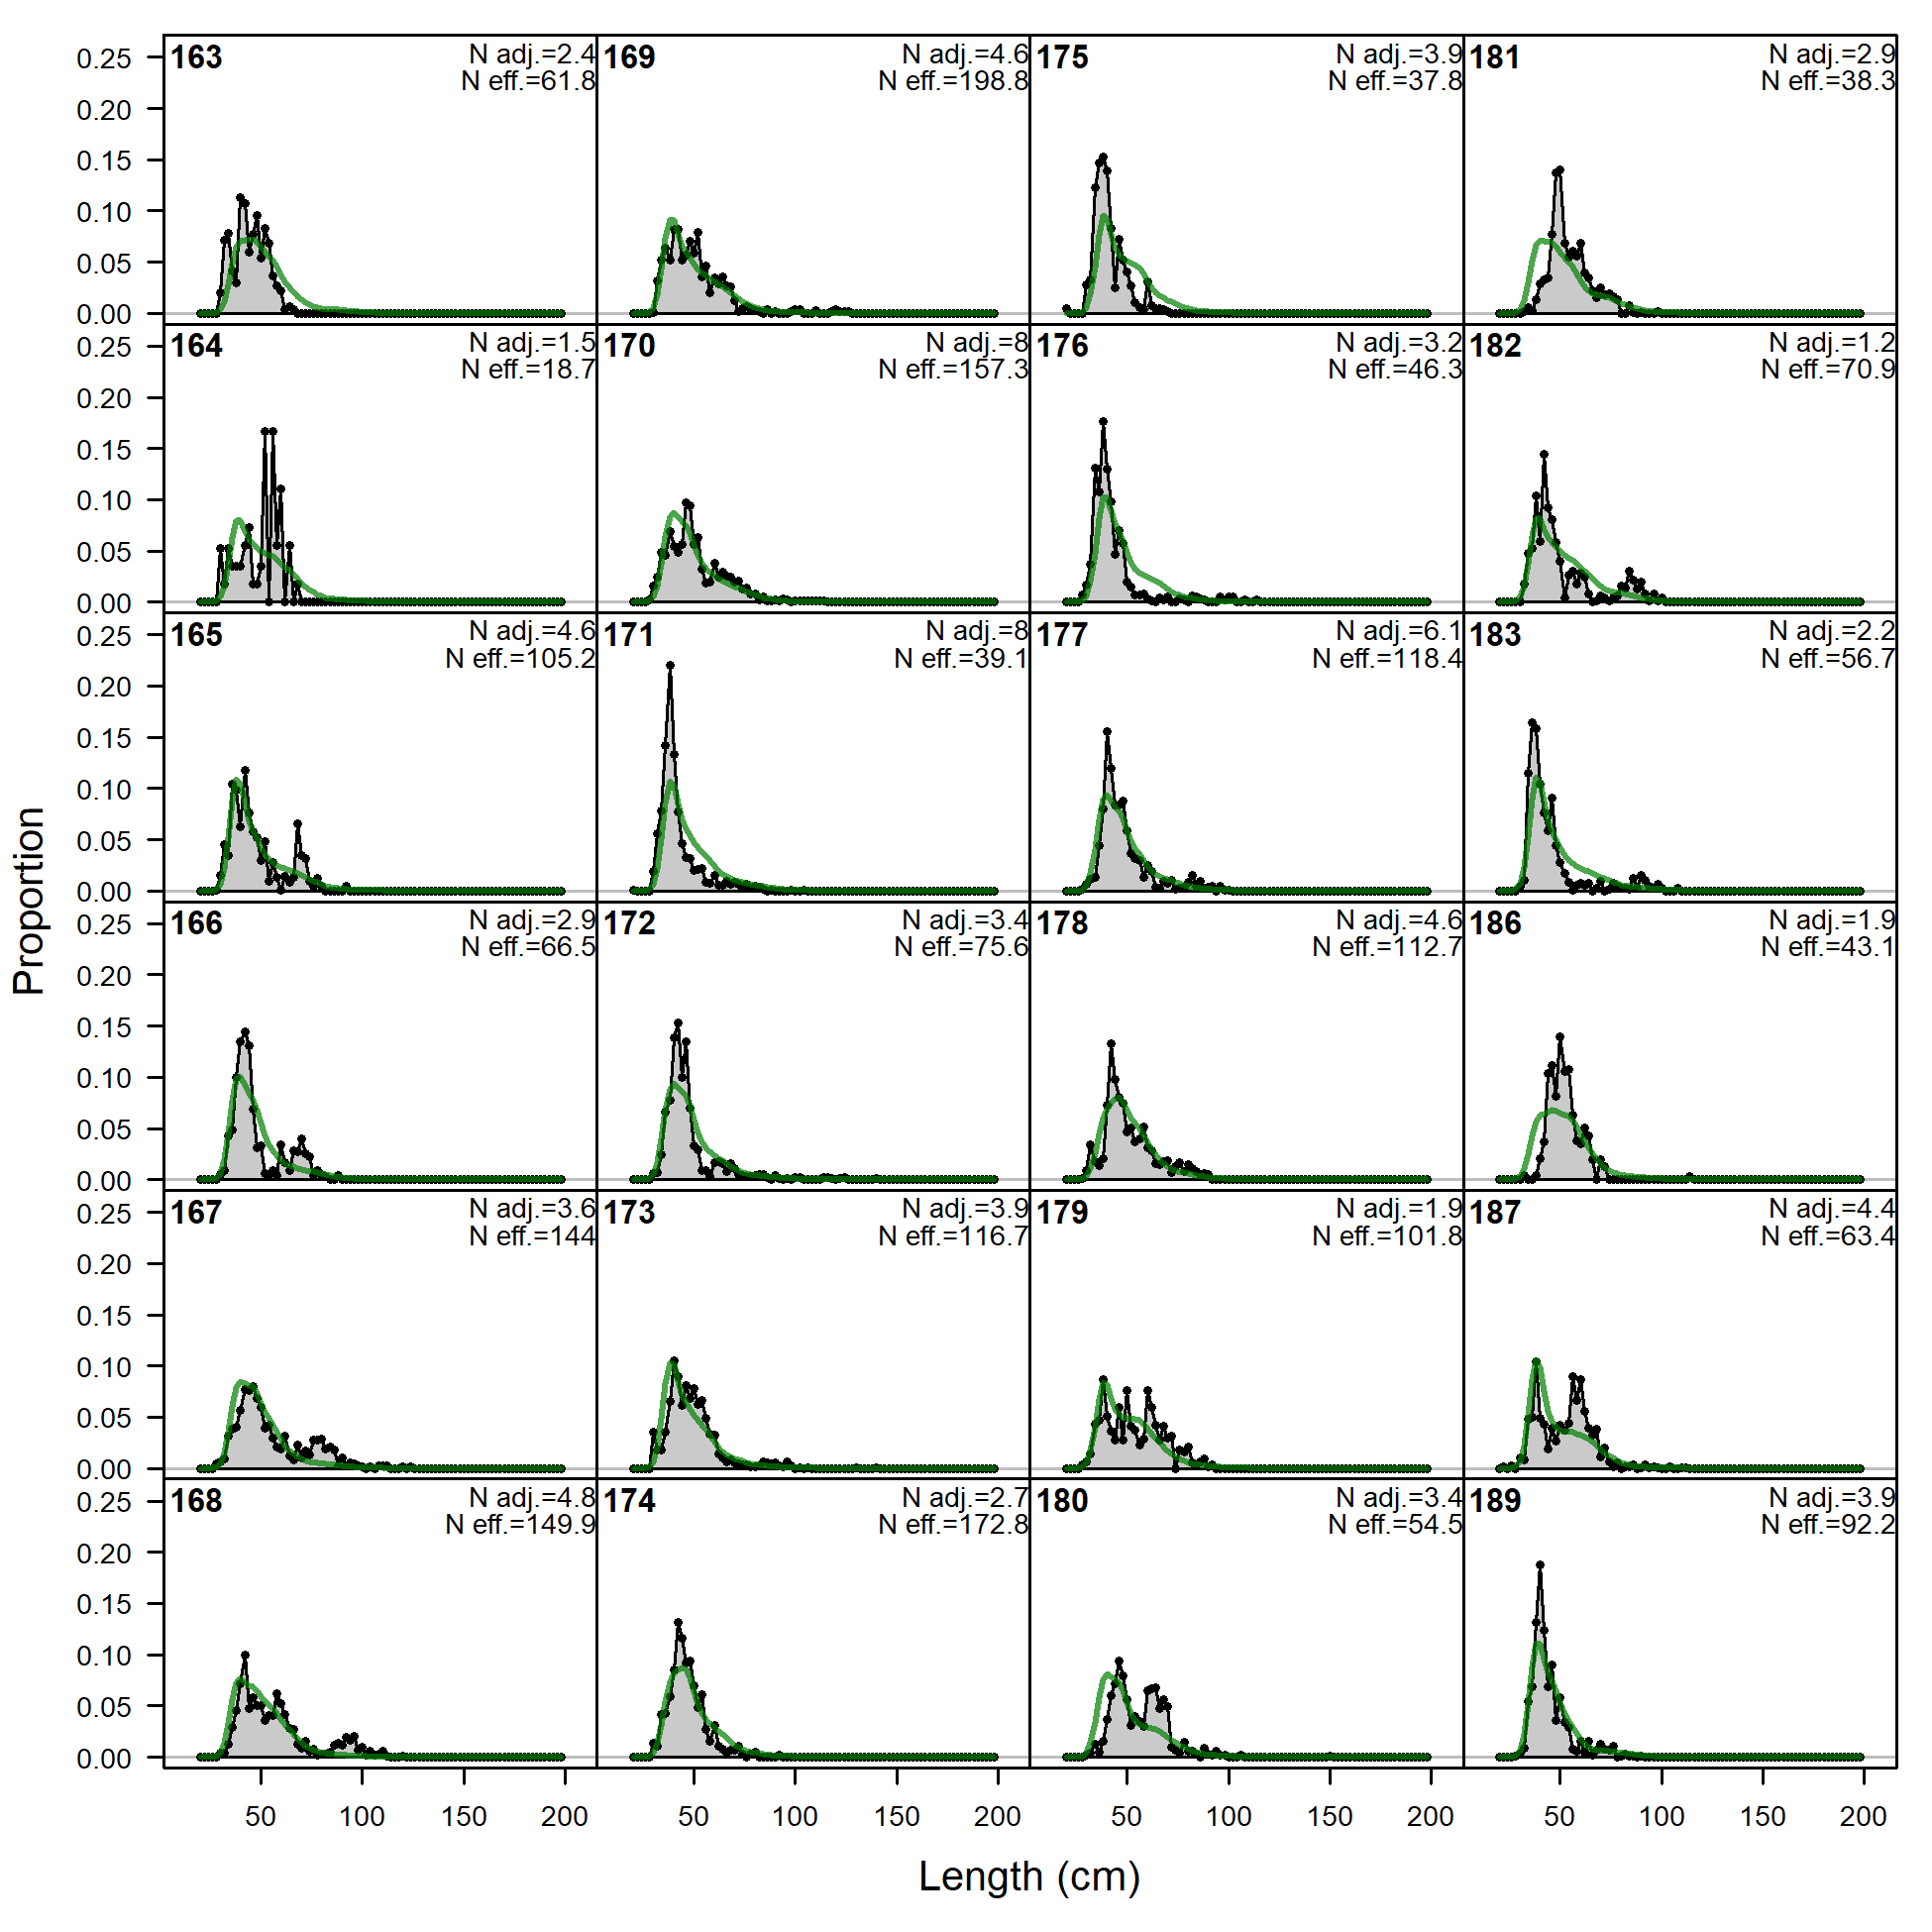
Length comps, whole catch, OBJ-A1 (plot 1 of 3).
'N adj.' is the input sample size after data-weighting adjustment. N eff. is the calculated effective sample size used in the McAllister-Ianelli tuning method.
file: comp_lenfit_flt15mkt0_page1.png
Length comps, whole catch, OBJ-A1 (plot 1 of 3).
'N adj.' is the input sample size after data-weighting adjustment. N eff. is the calculated effective sample size used in the McAllister-Ianelli tuning method. (plot 2 of 3)
file: comp_lenfit_flt15mkt0_page2.png
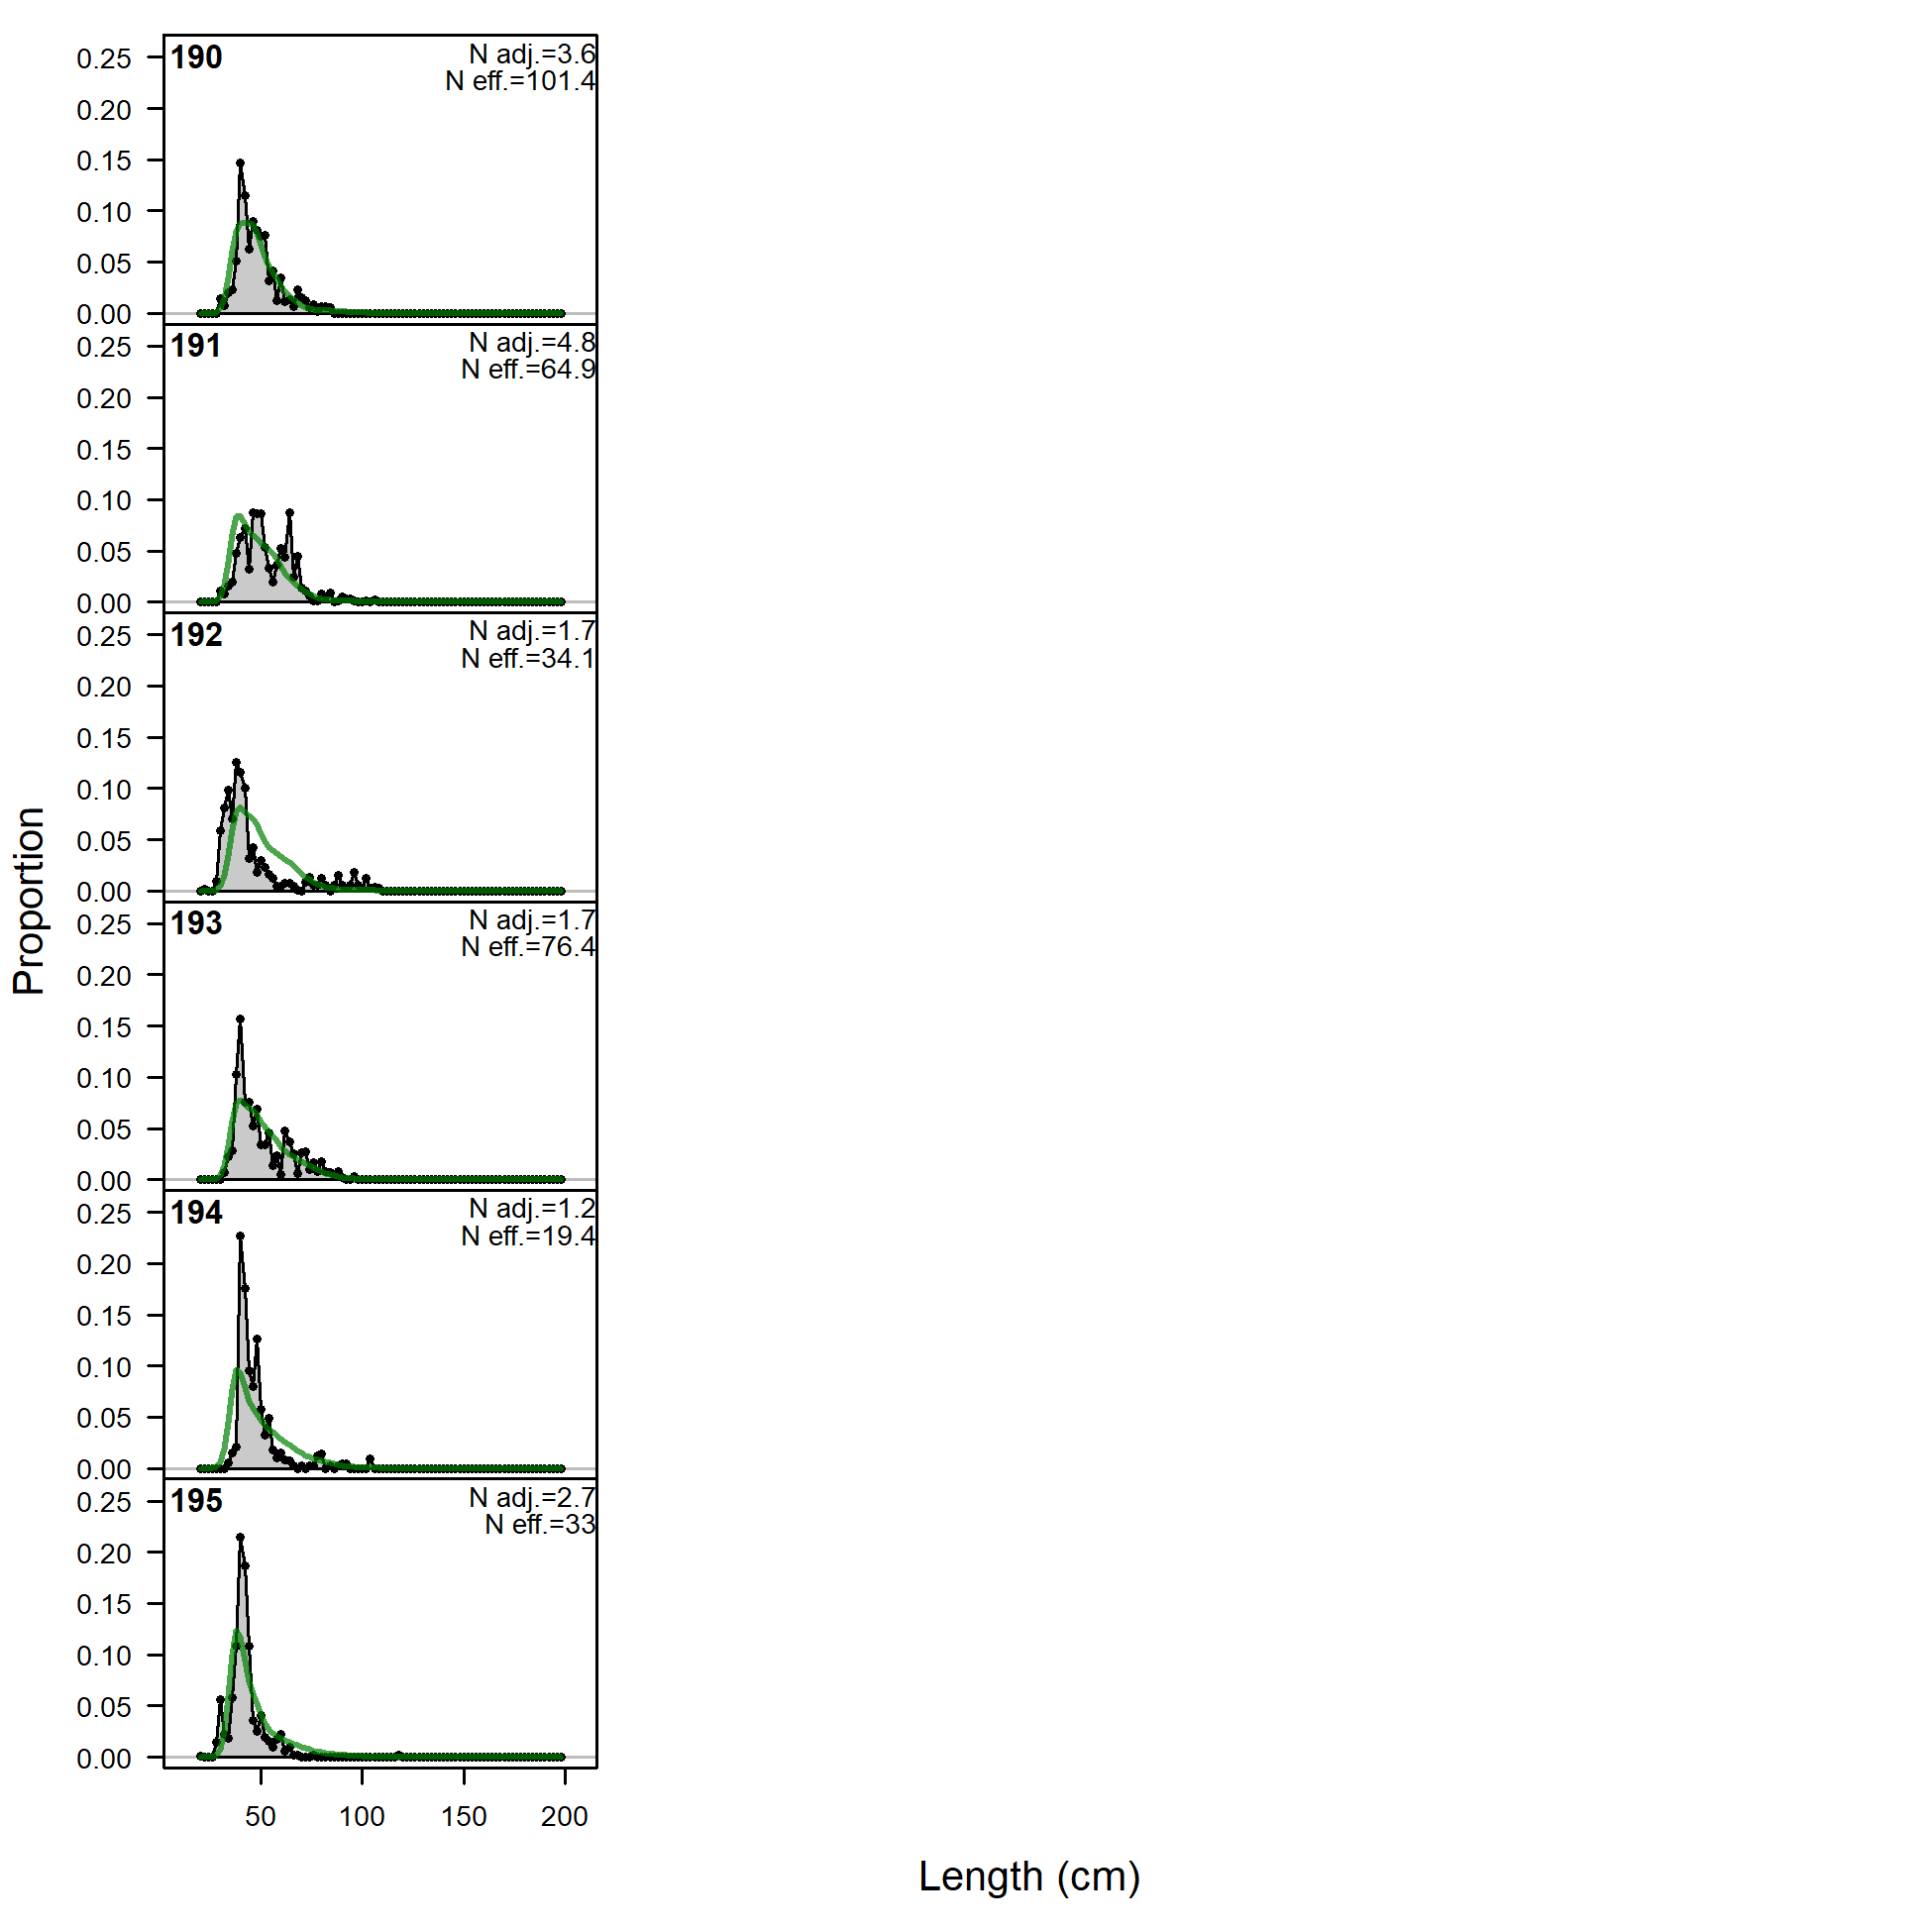
Length comps, whole catch, OBJ-A1 (plot 1 of 3).
'N adj.' is the input sample size after data-weighting adjustment. N eff. is the calculated effective sample size used in the McAllister-Ianelli tuning method. (plot 2 of 3) (plot 3 of 3)
file: comp_lenfit_flt15mkt0_page3.png
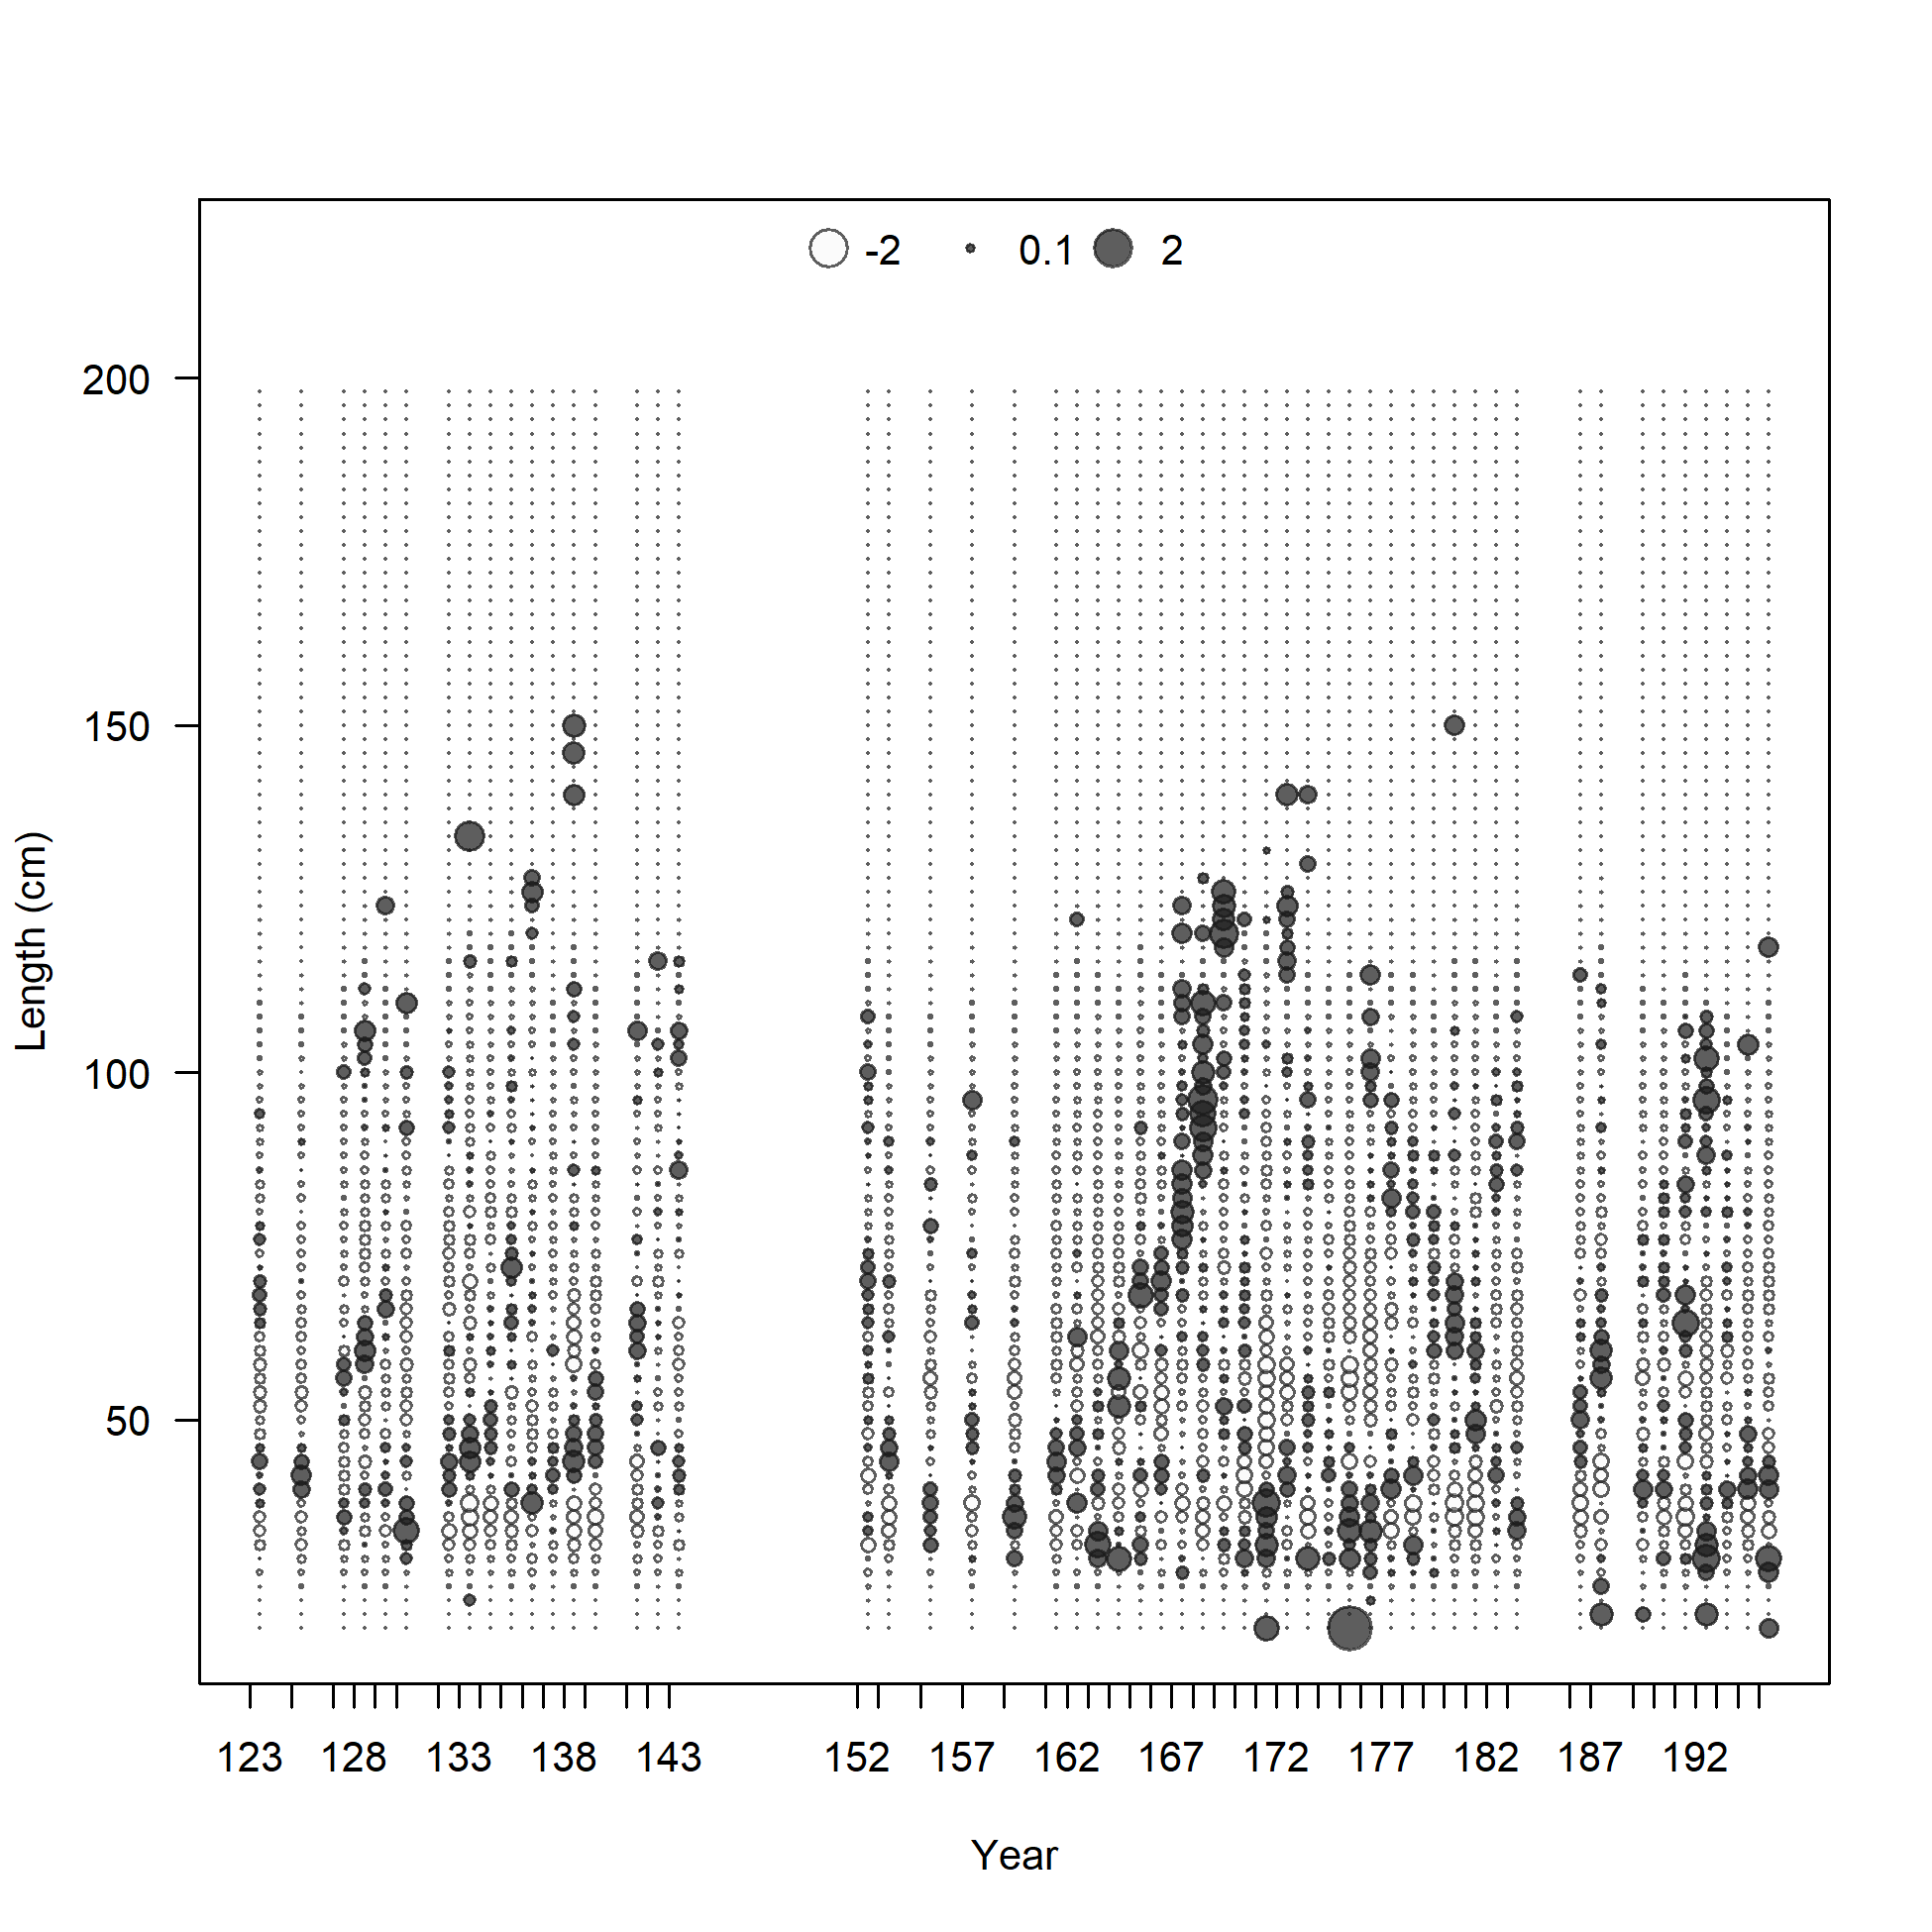
Pearson residuals, whole catch, OBJ-A1 (max=2.67) (plot 3 of 3)
Closed bubbles are positive residuals (observed > expected) and open bubbles are negative residuals (observed < expected).
file: comp_lenfit_residsflt15mkt0_page3.png

N-EffN comparison, Length comps, whole catch, OBJ-A1
file: comp_lenfit_sampsize_flt15mkt0.png
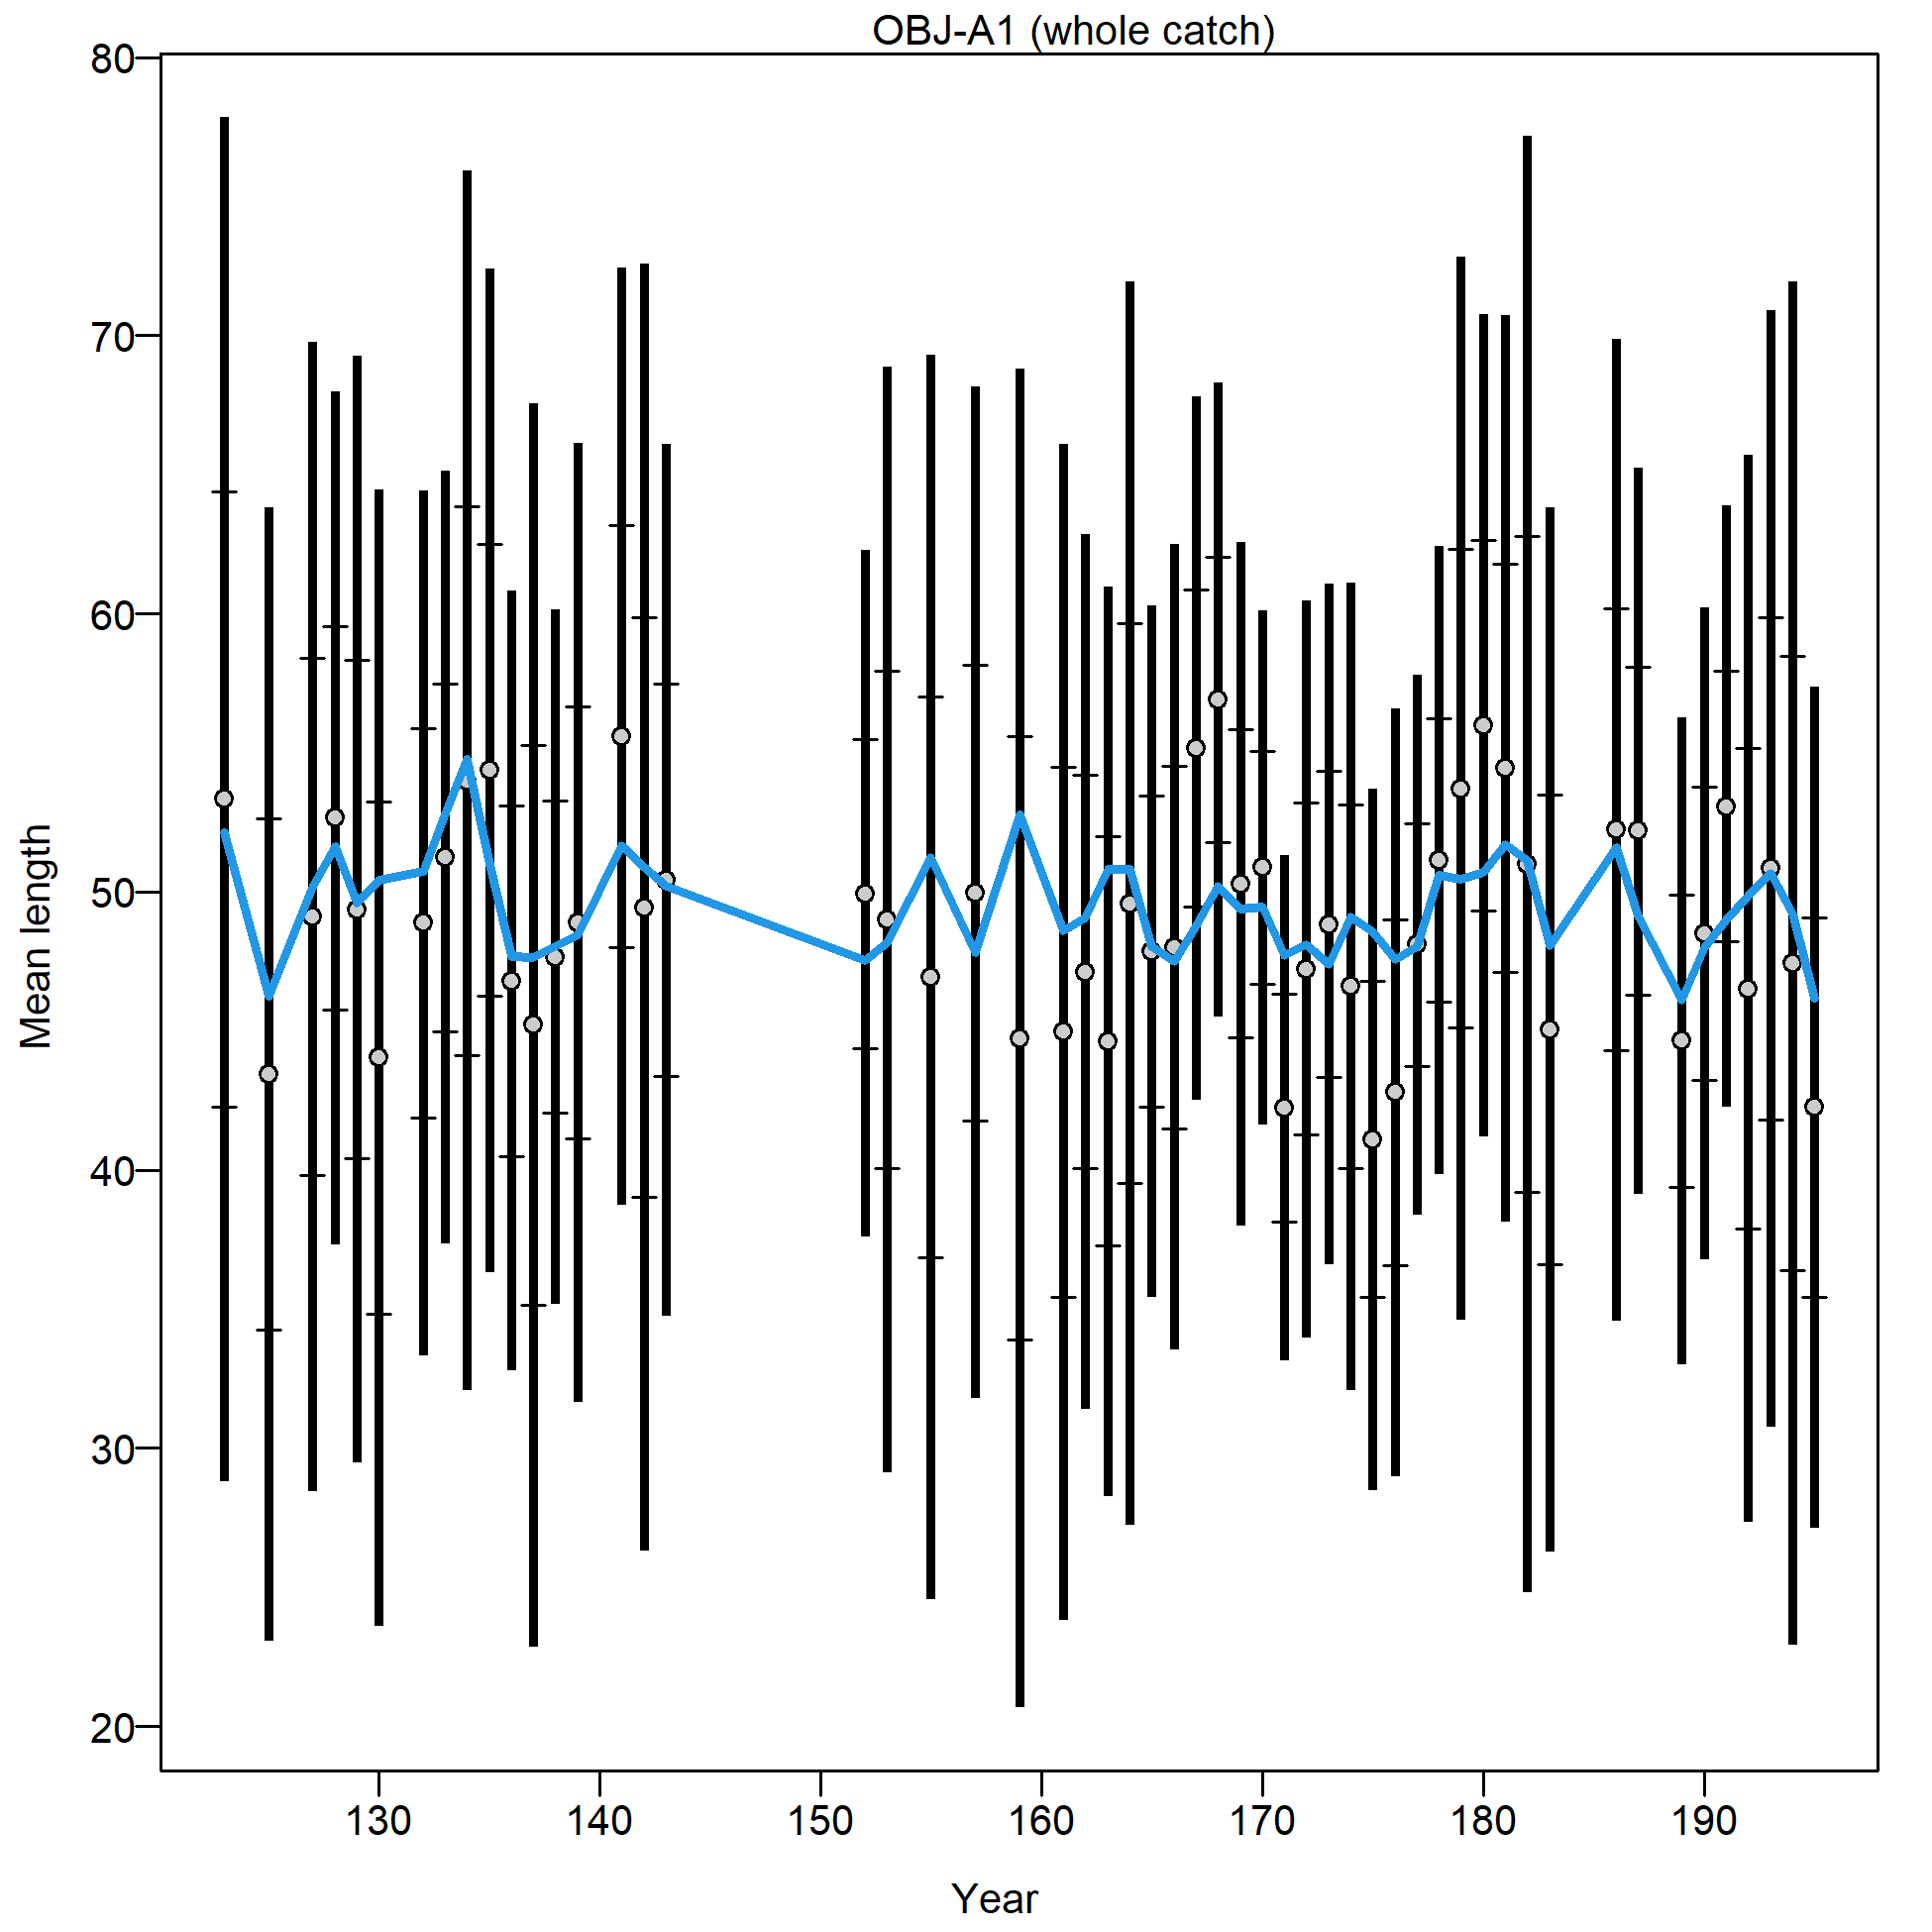
Mean length for OBJ-A1 with 95% confidence intervals based on current sample sizes.
Francis data weighting method TA1.8: thinner intervals (with capped ends) show result of further adjusting sample sizes based on suggested multiplier (with 95% interval) for len data from OBJ-A1:
4.9284 (3.266-8.6047)
For more info, see Francis (2011).
file: comp_lenfit_data_weighting_TA1.8_OBJ-A1.png
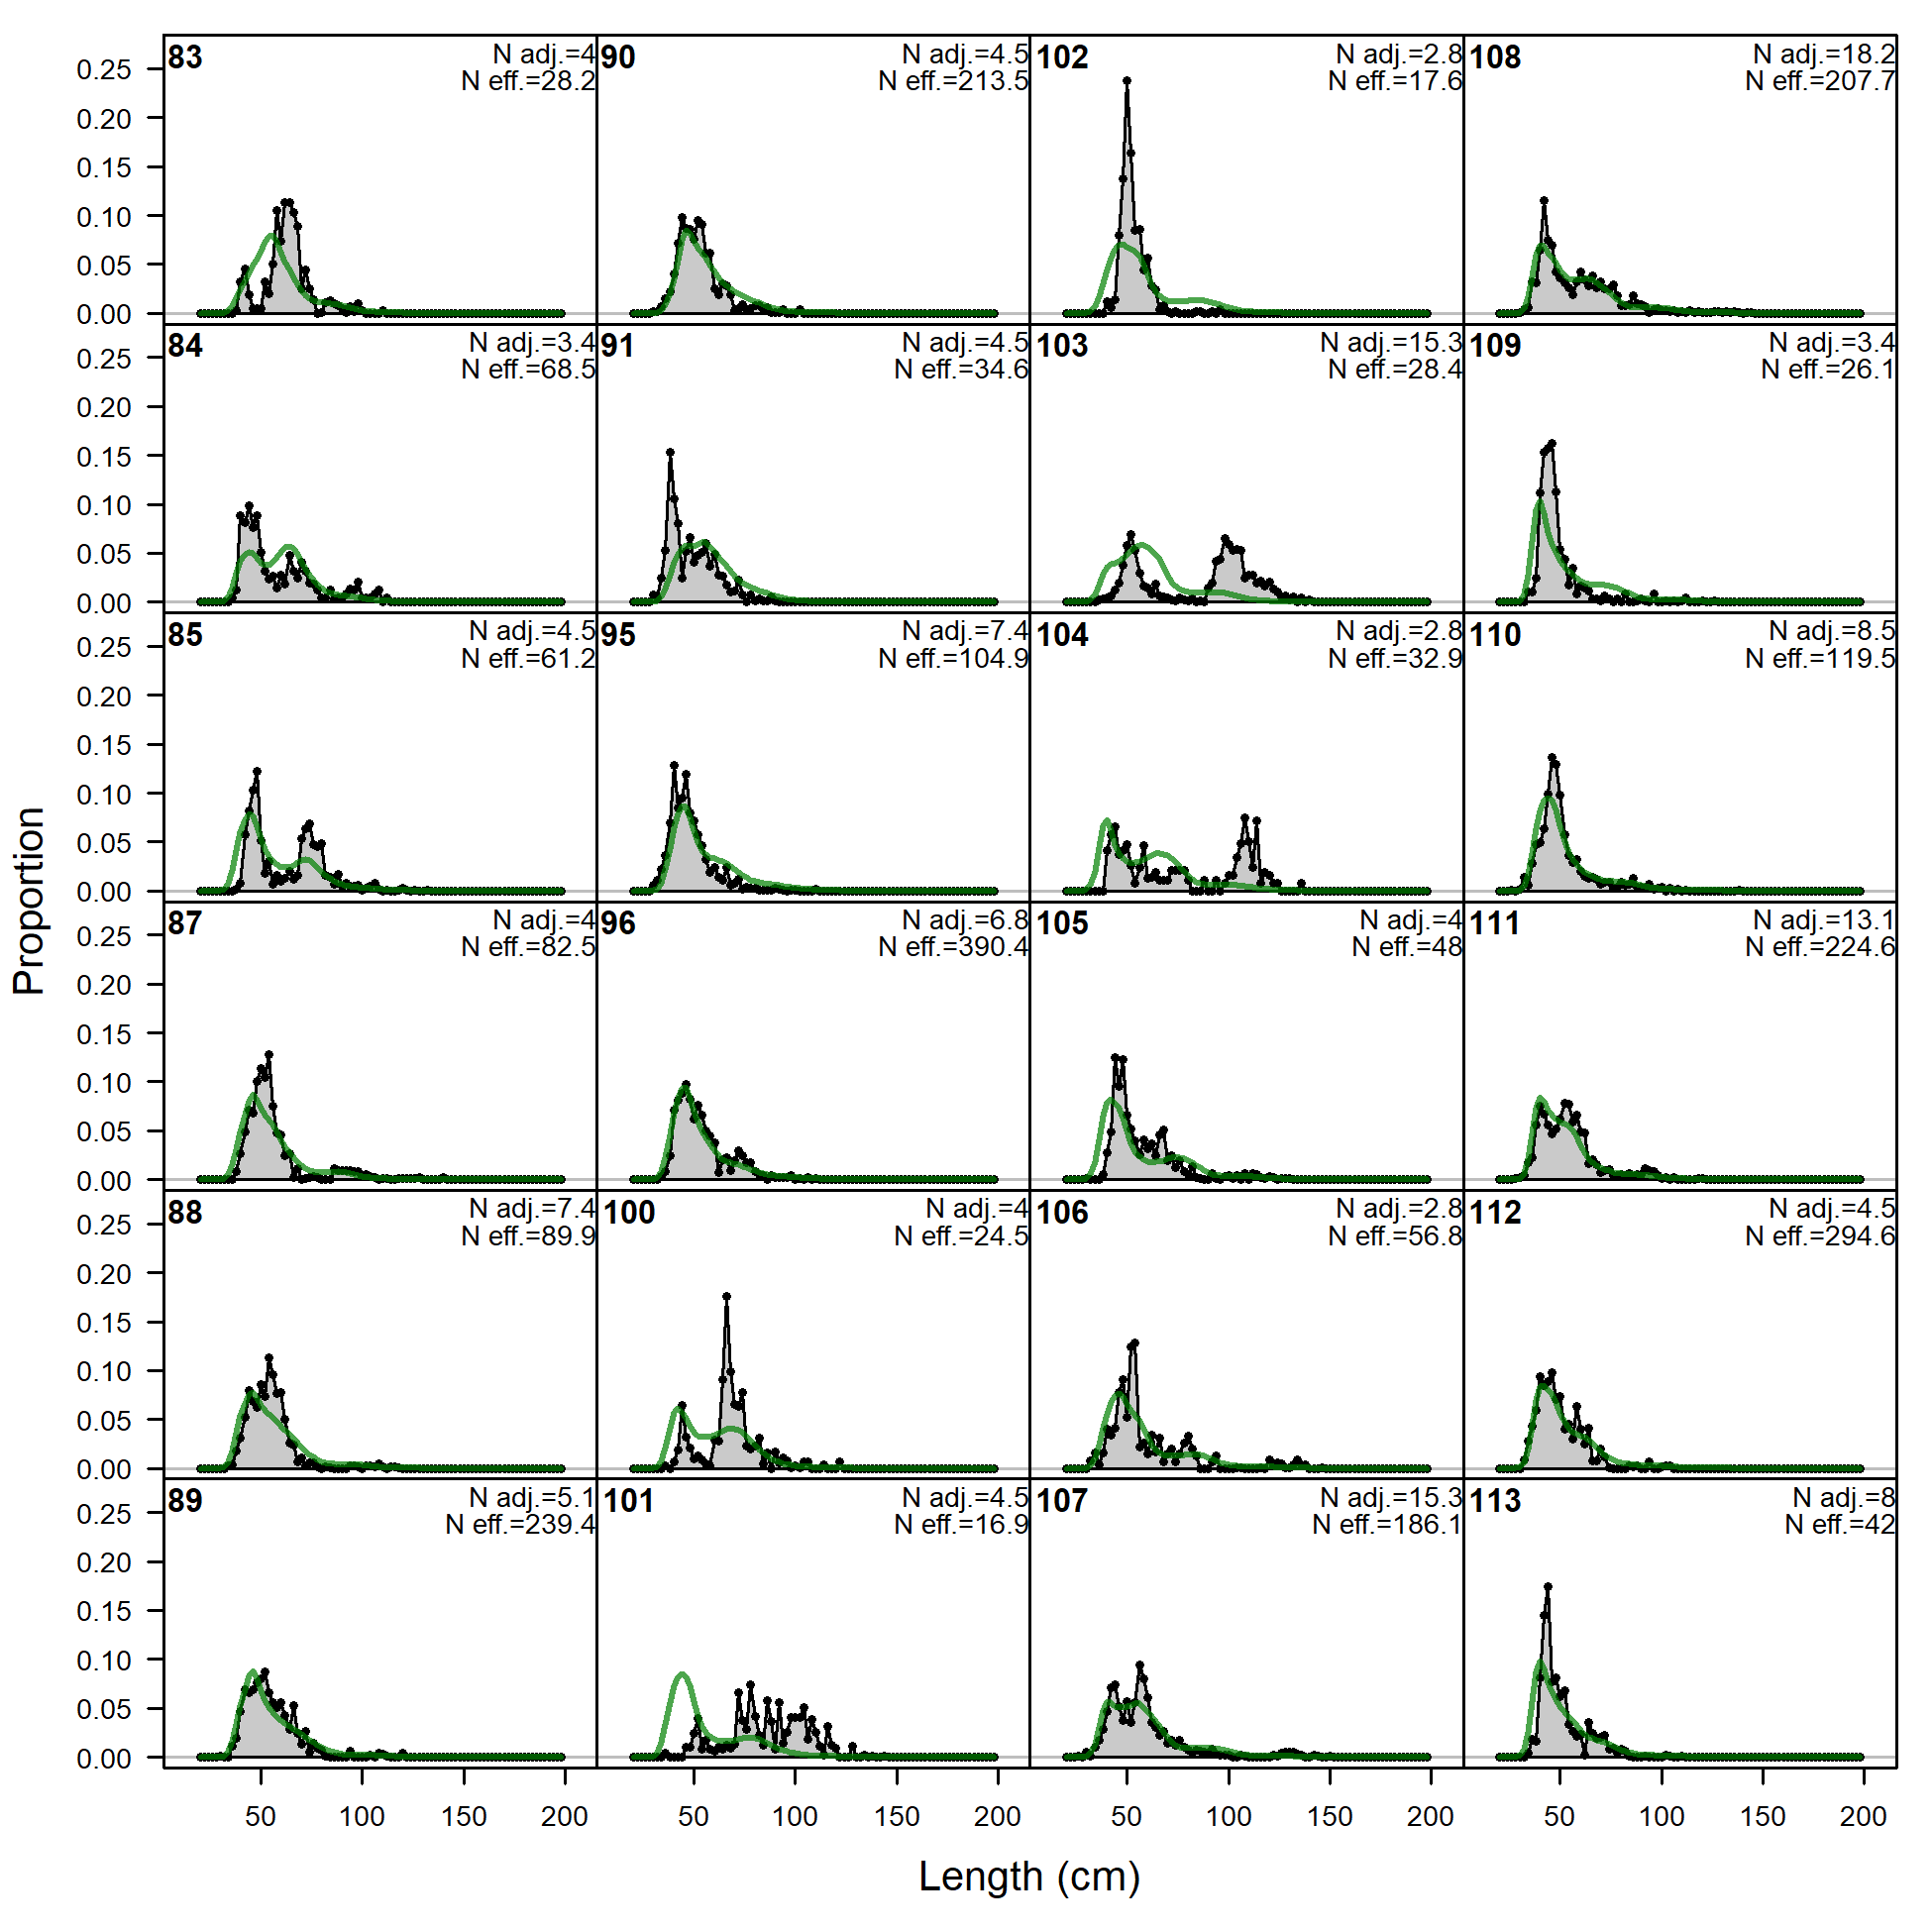
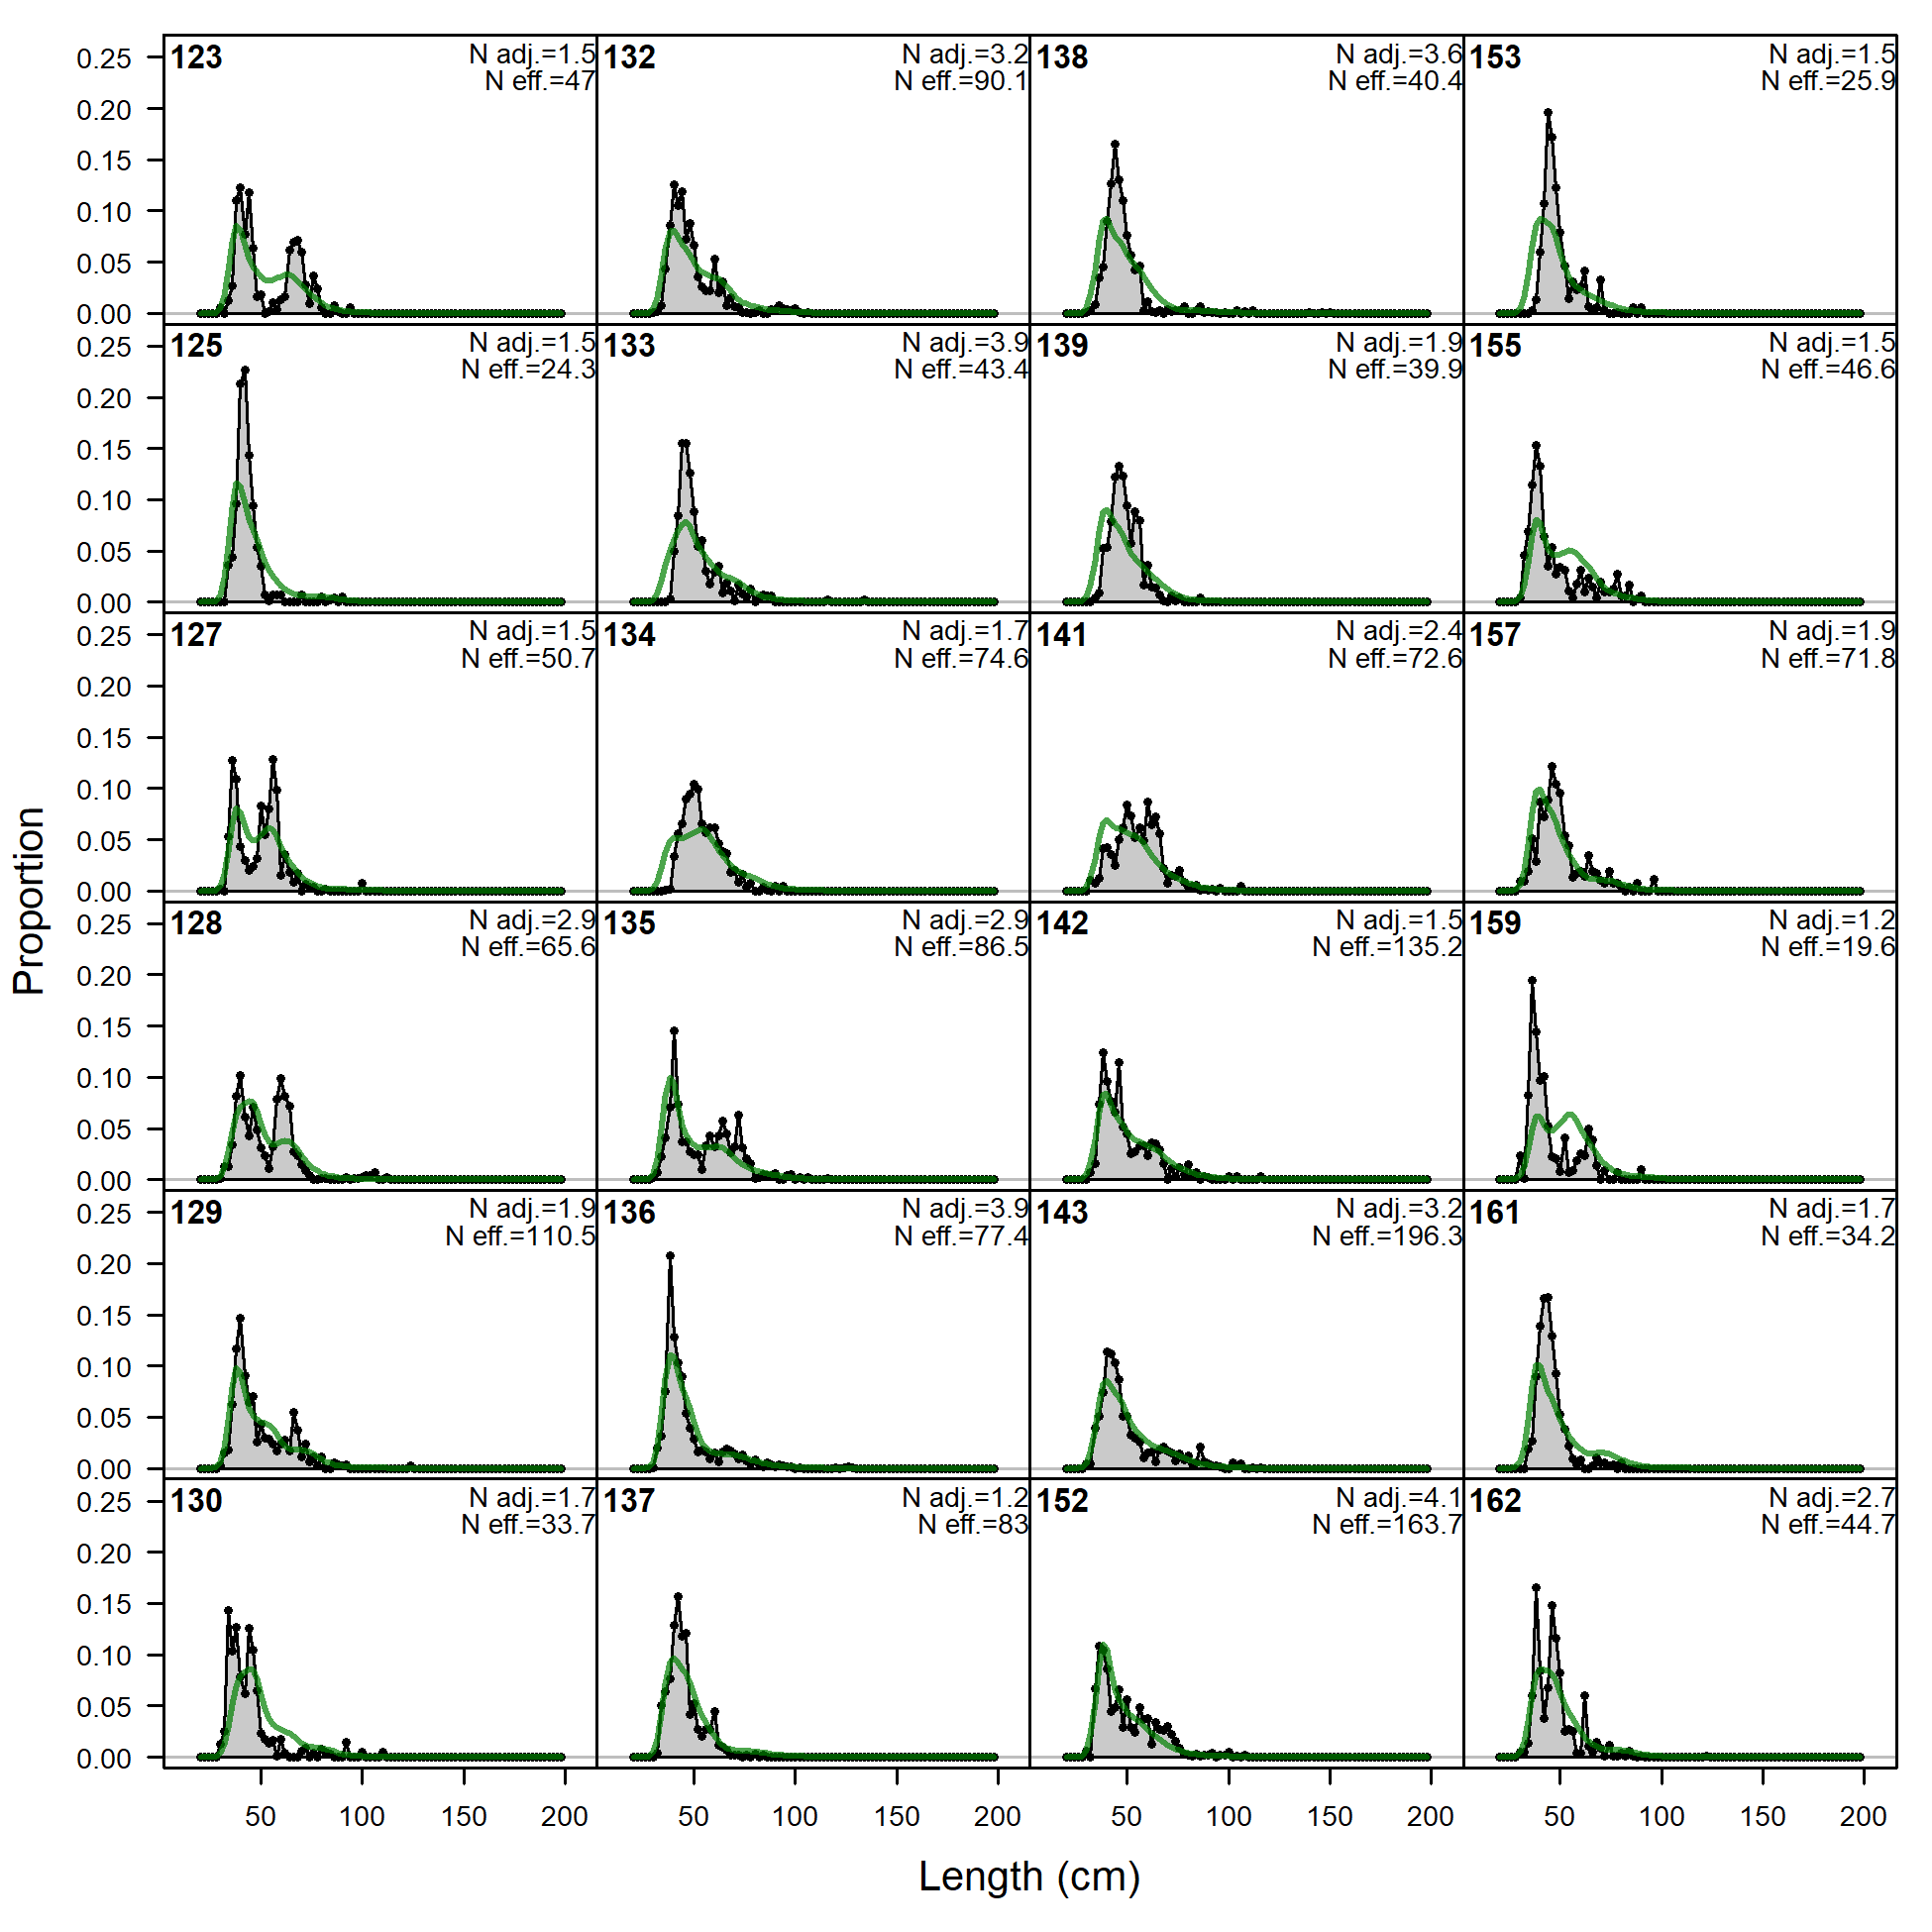
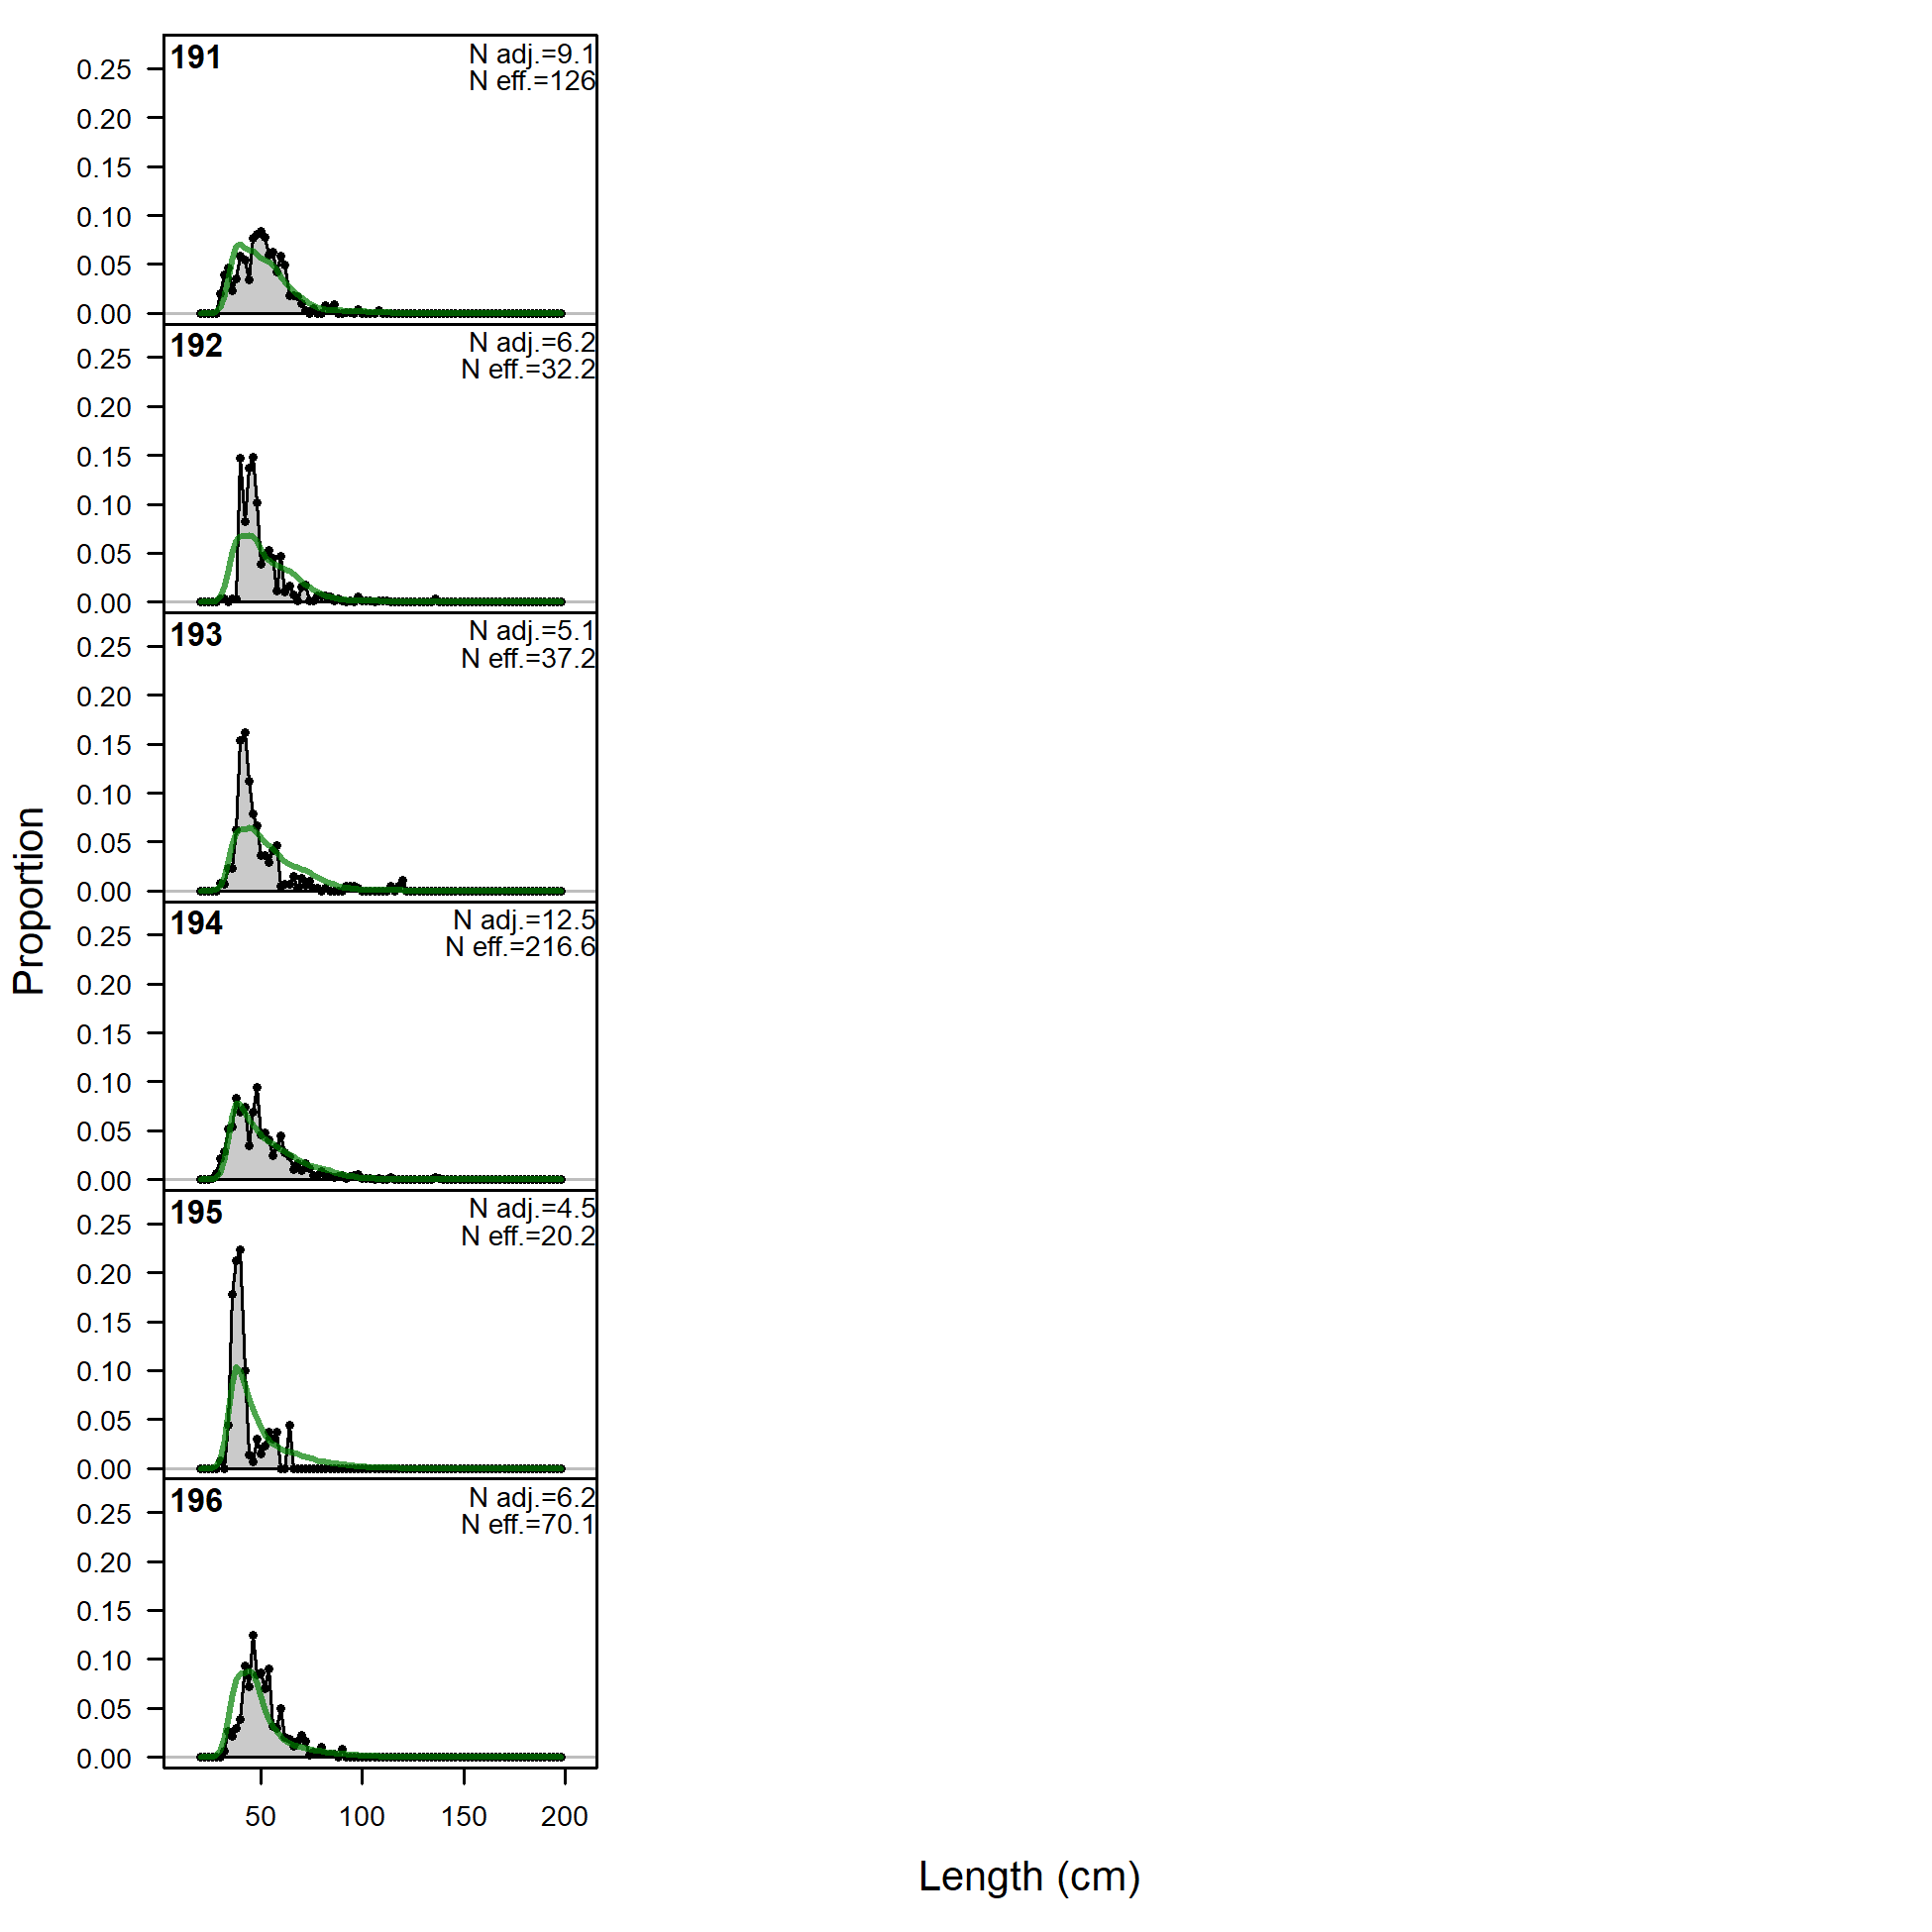
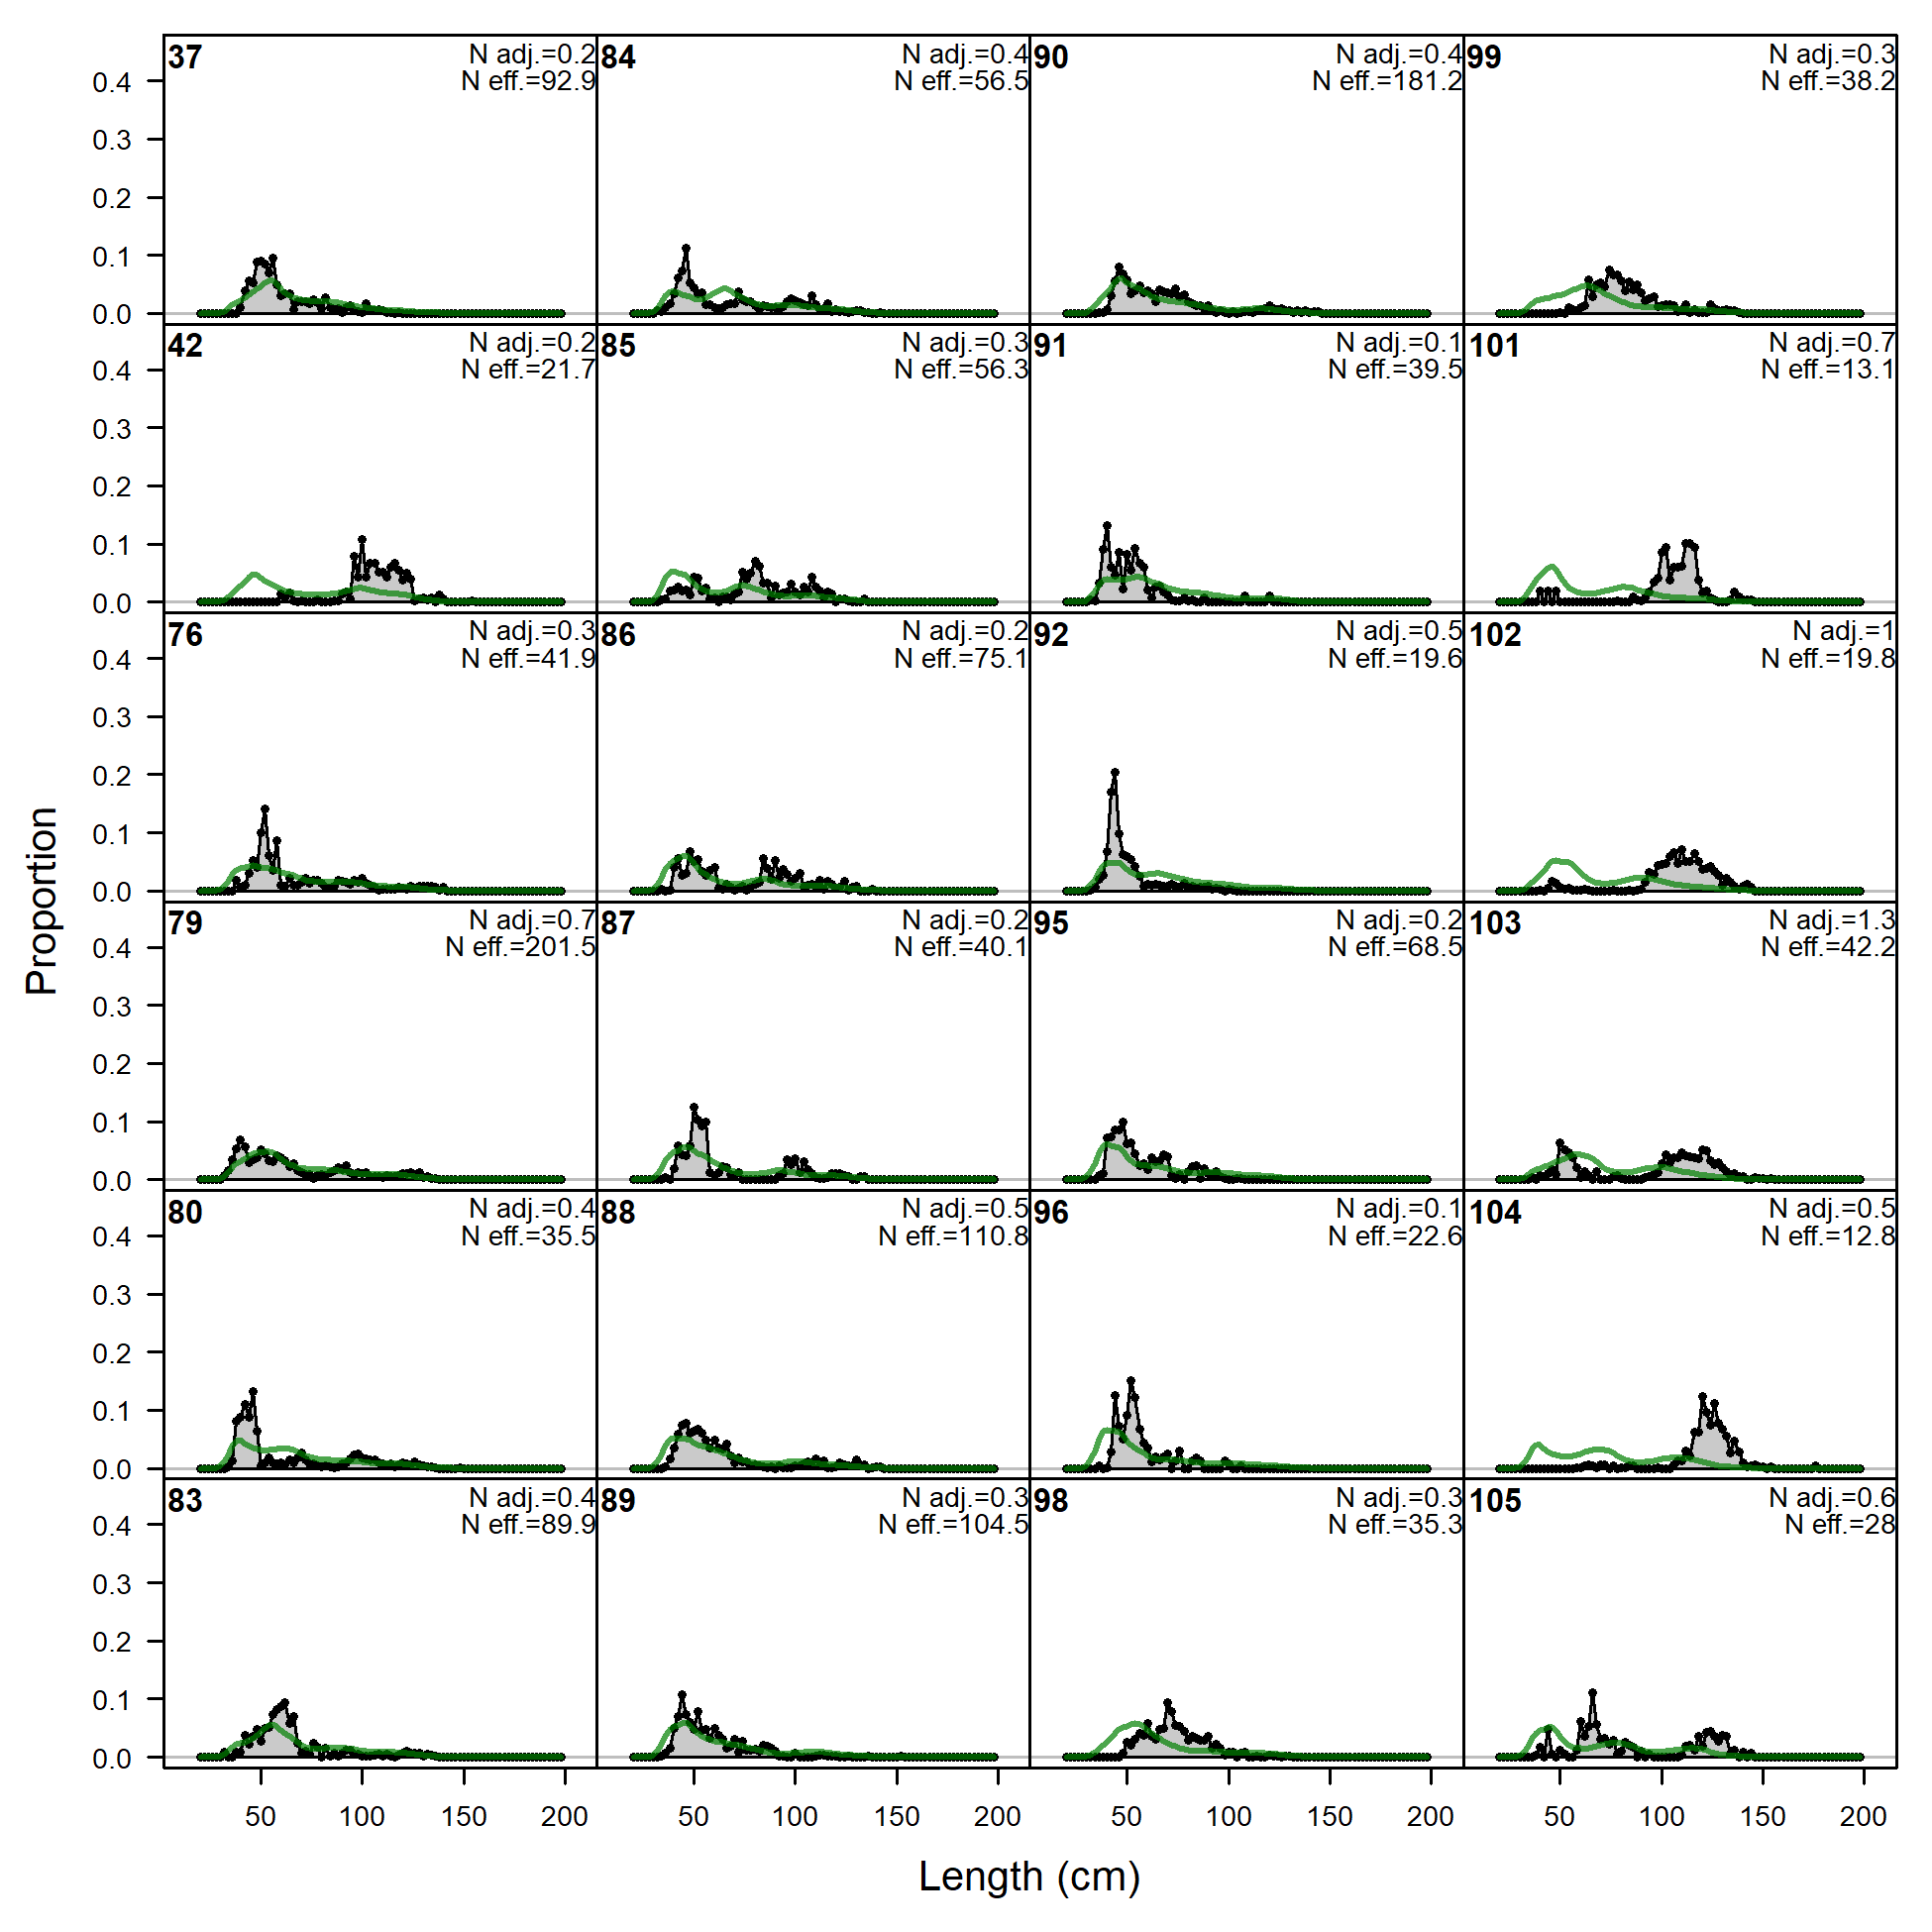
Length comps, whole catch, OBJ-A2 (plot 1 of 5).
'N adj.' is the input sample size after data-weighting adjustment. N eff. is the calculated effective sample size used in the McAllister-Ianelli tuning method.
file: comp_lenfit_flt16mkt0_page1.png
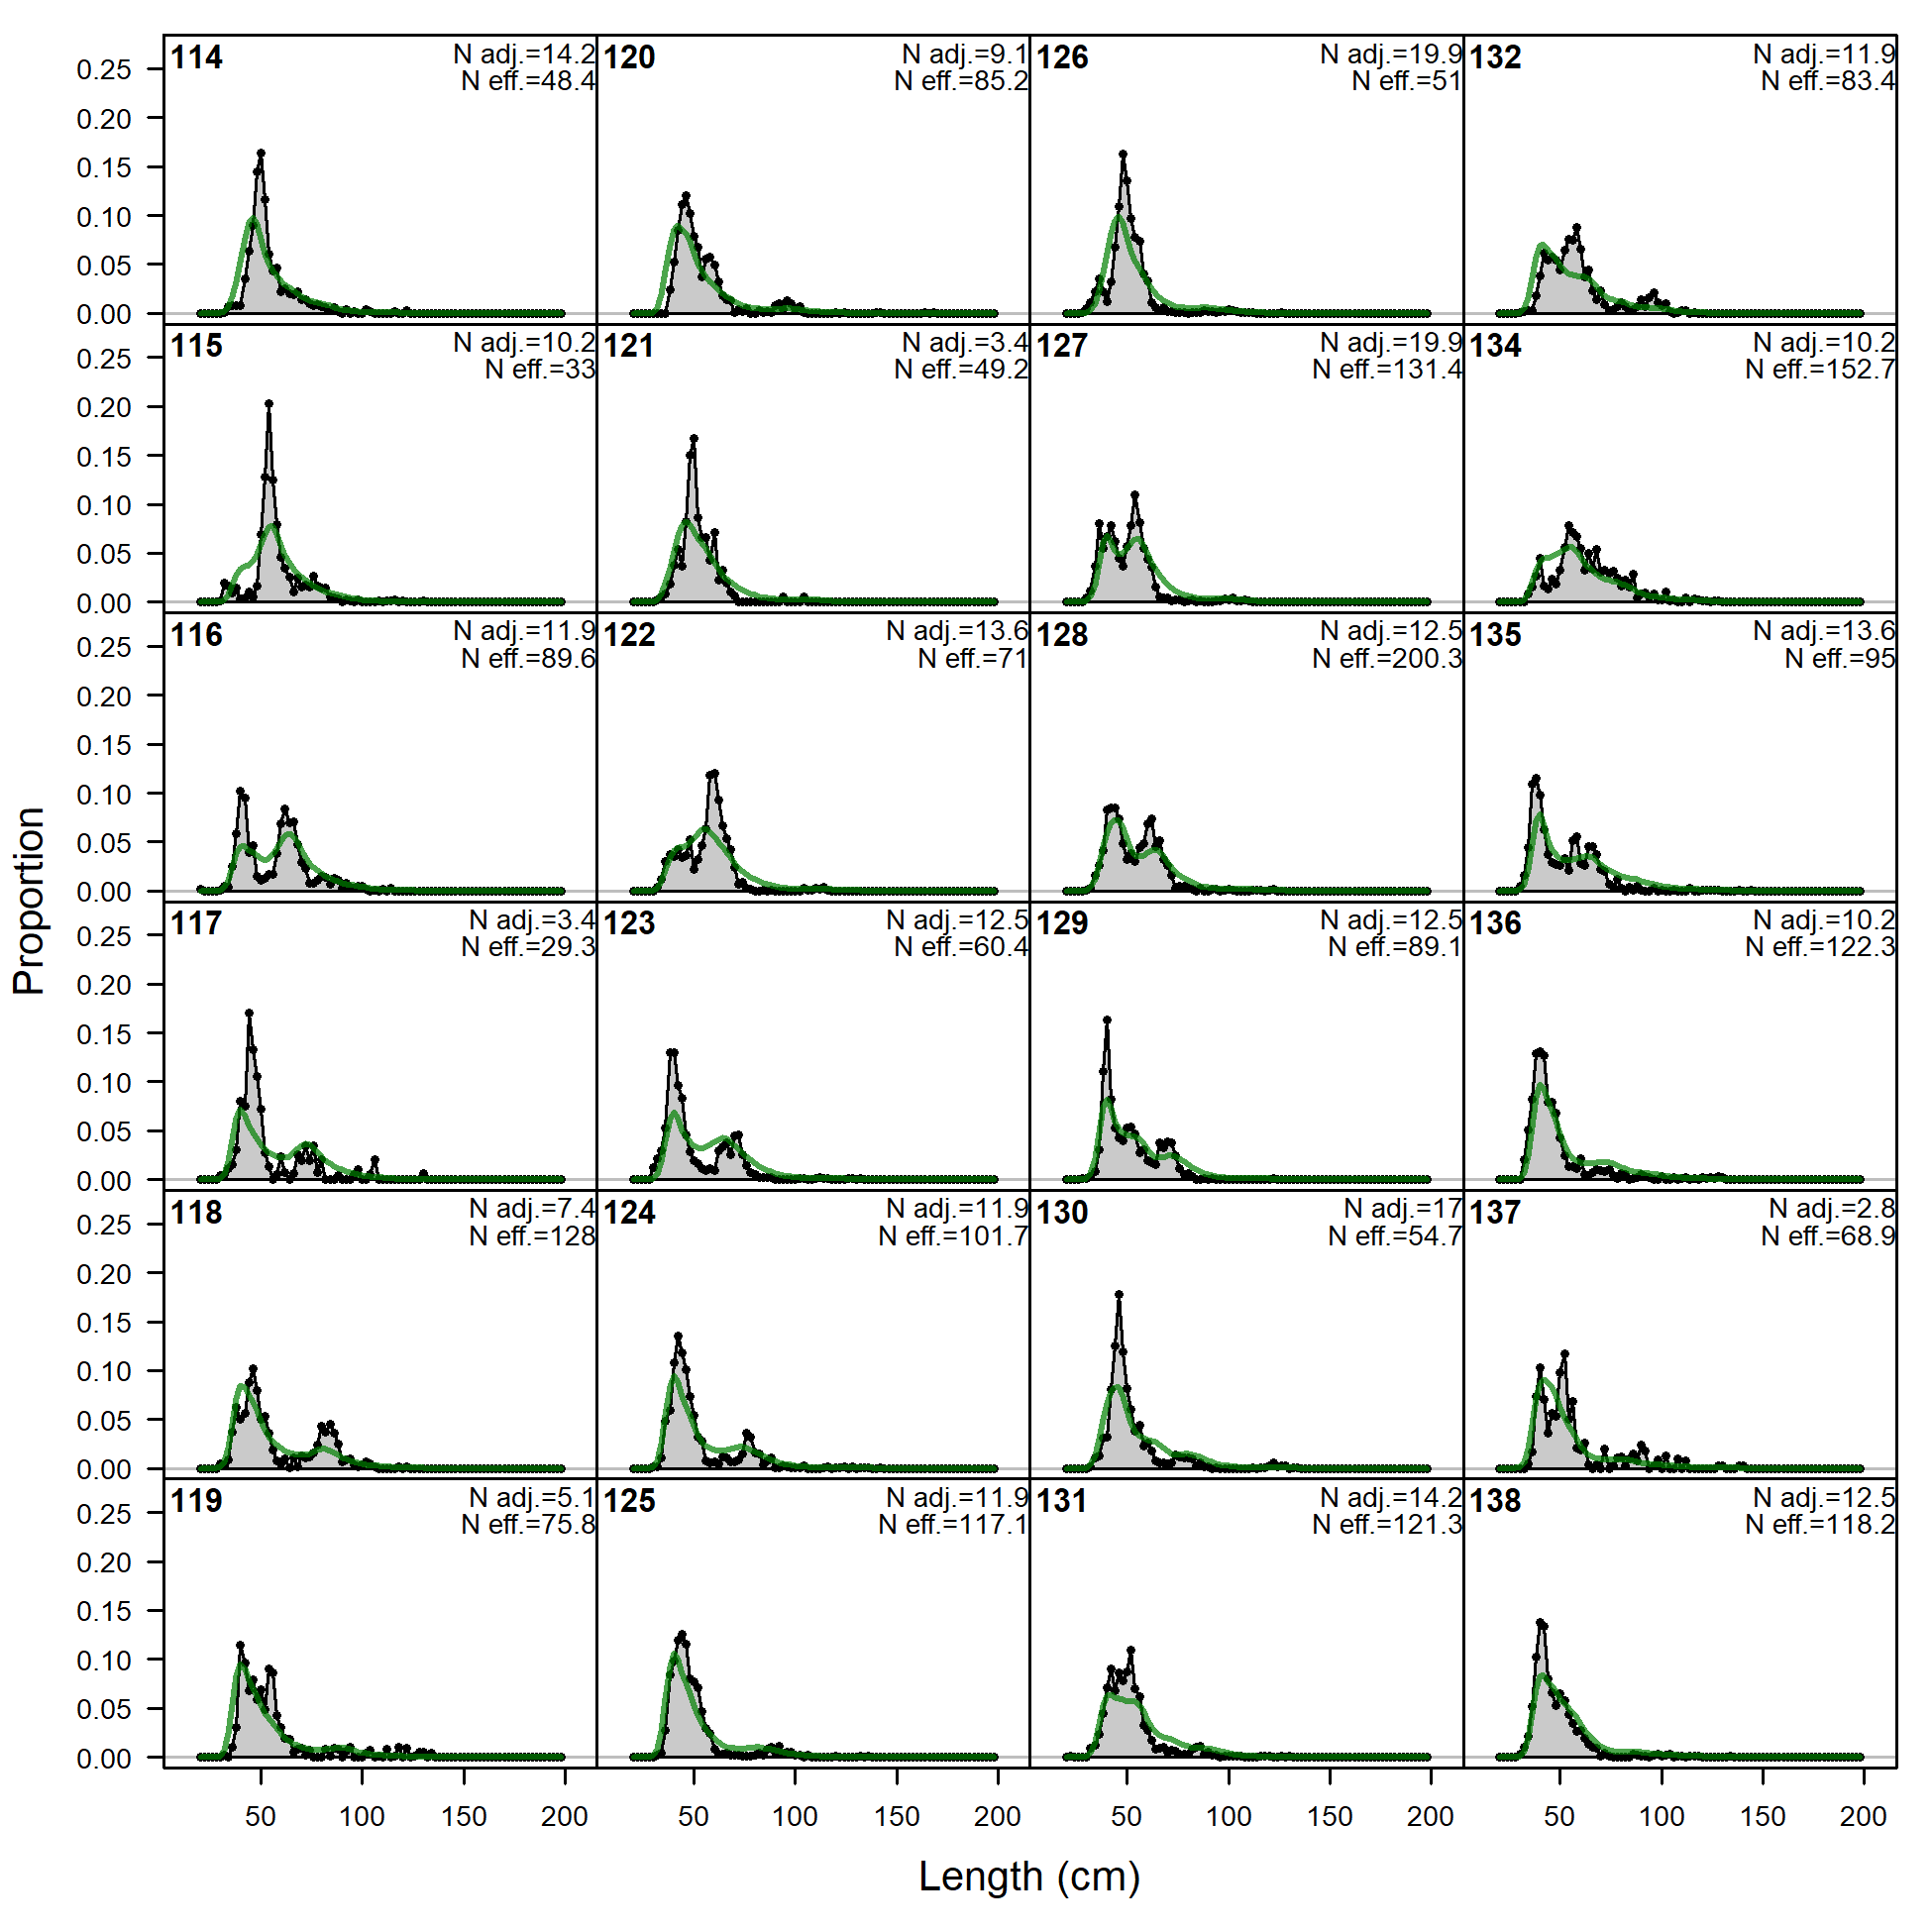
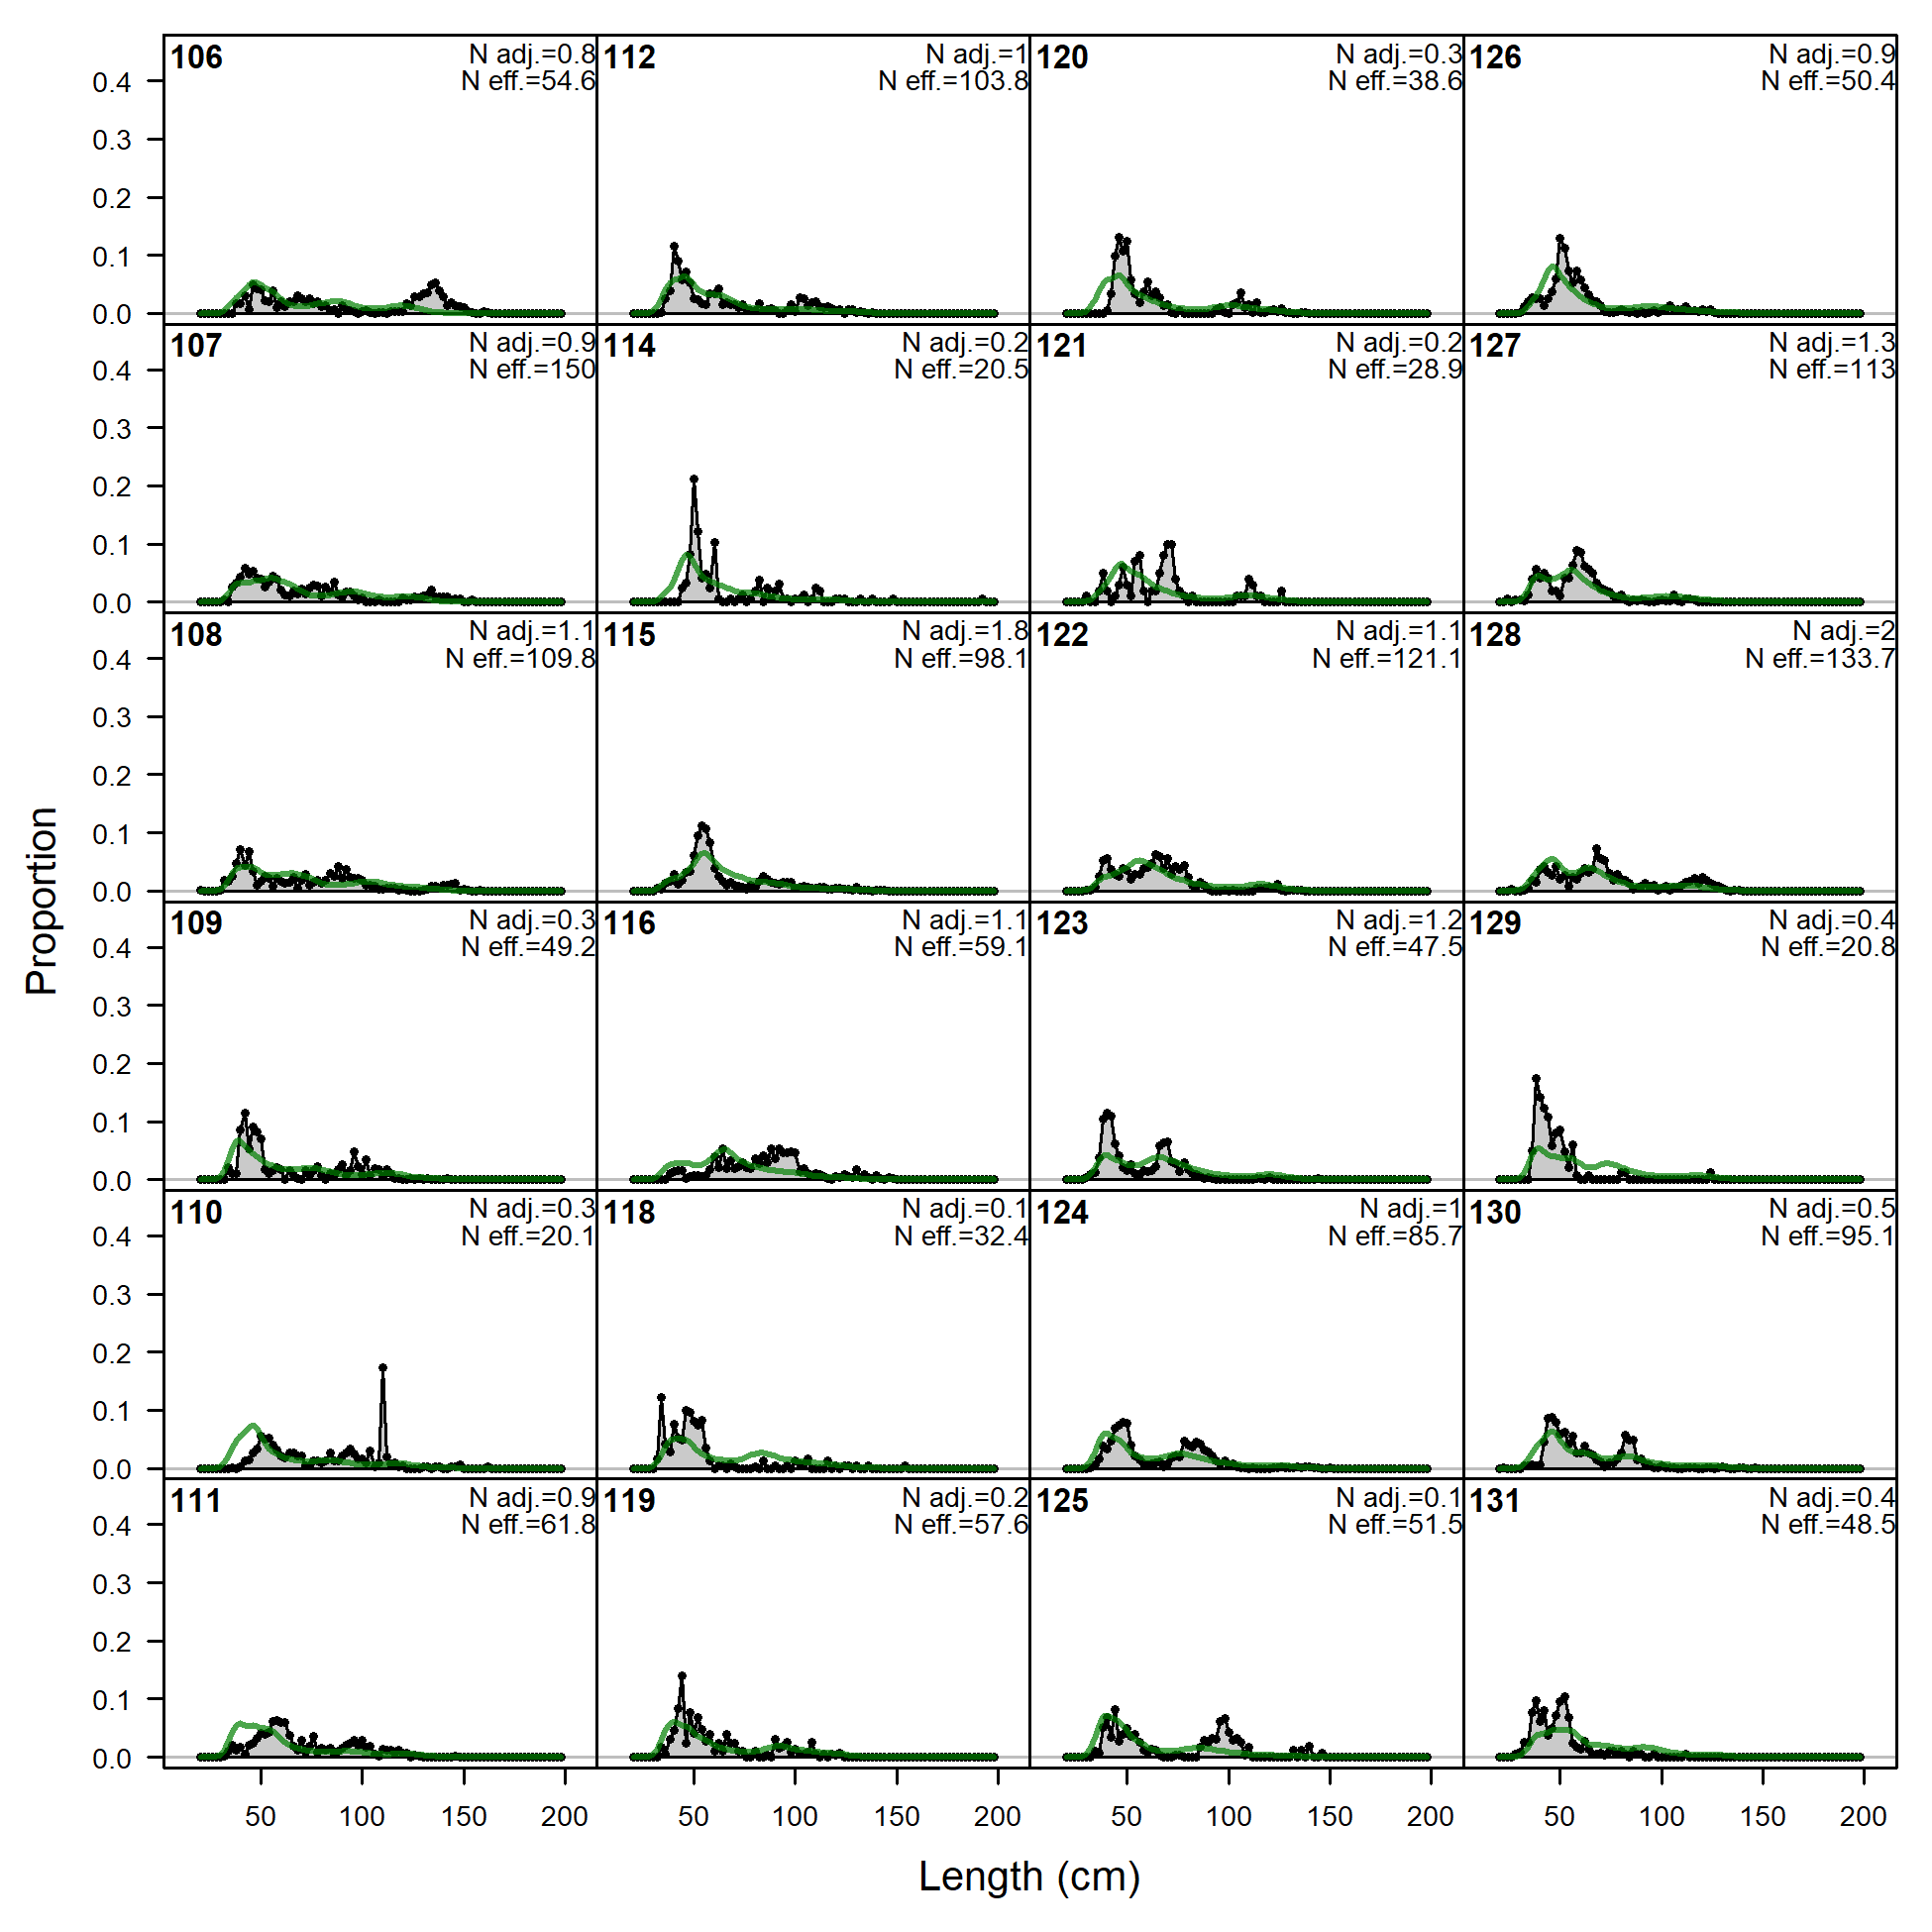
Length comps, whole catch, OBJ-A2 (plot 1 of 5).
'N adj.' is the input sample size after data-weighting adjustment. N eff. is the calculated effective sample size used in the McAllister-Ianelli tuning method. (plot 2 of 5)
file: comp_lenfit_flt16mkt0_page2.png
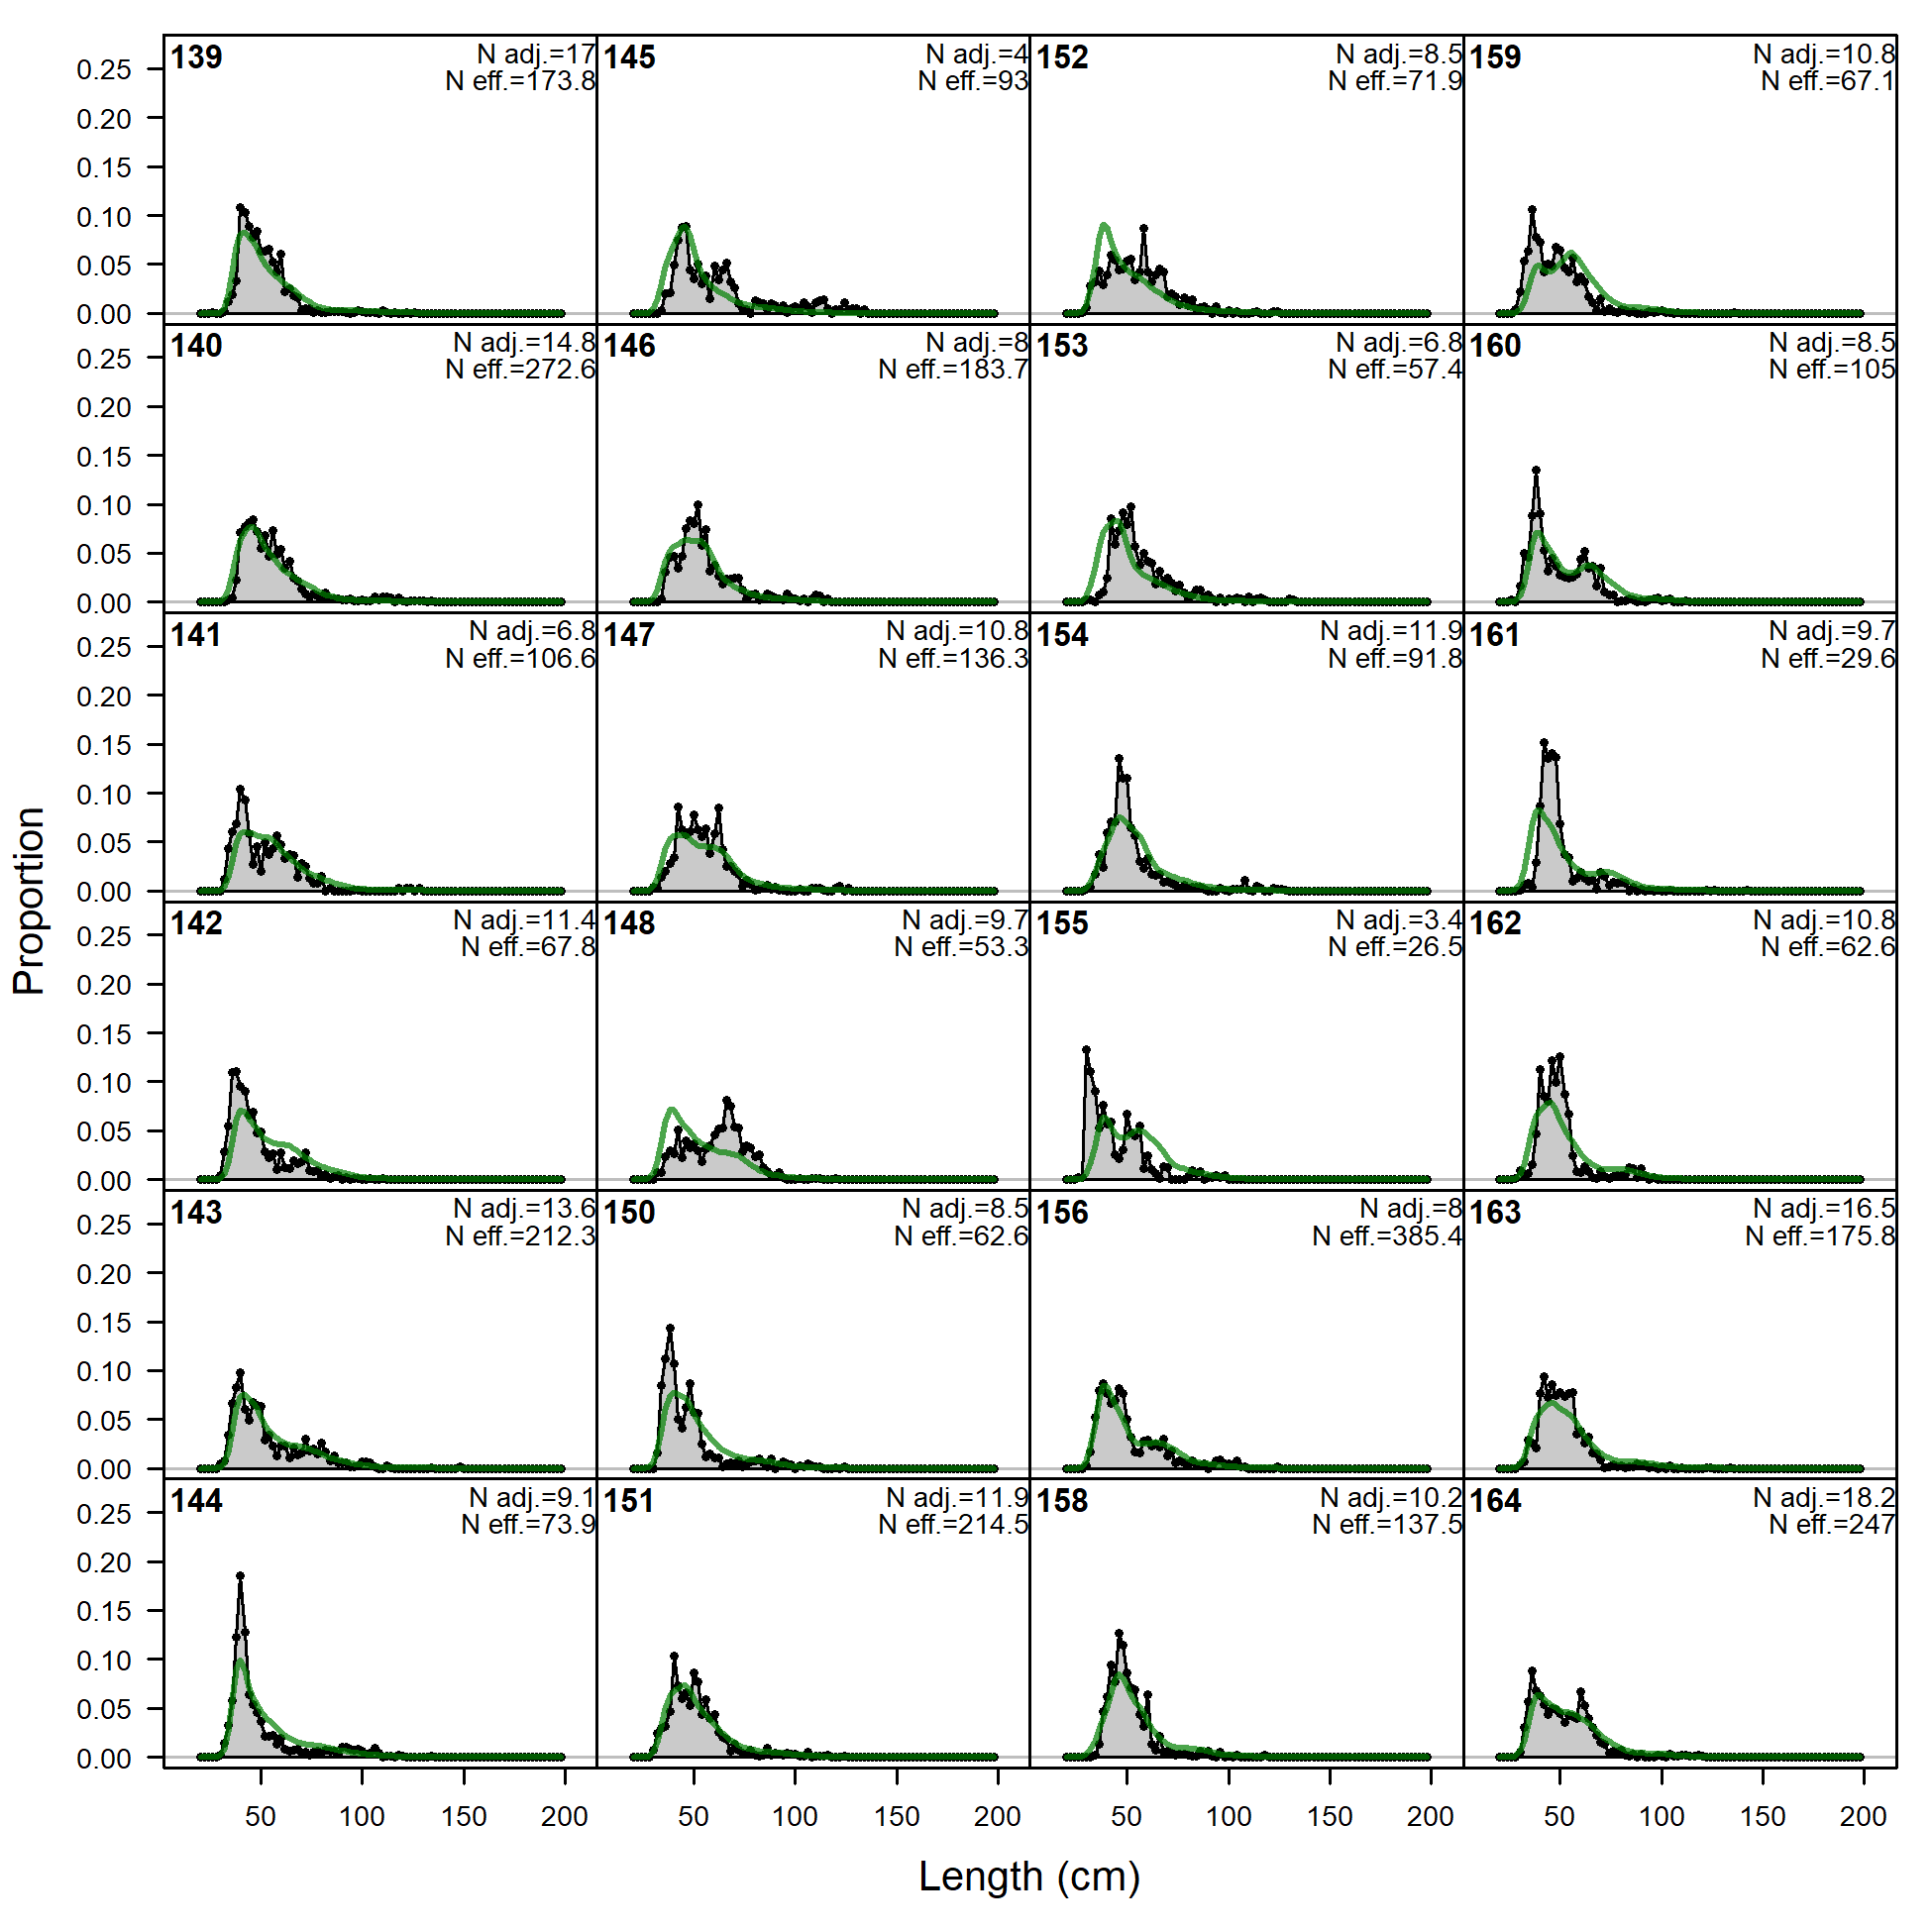
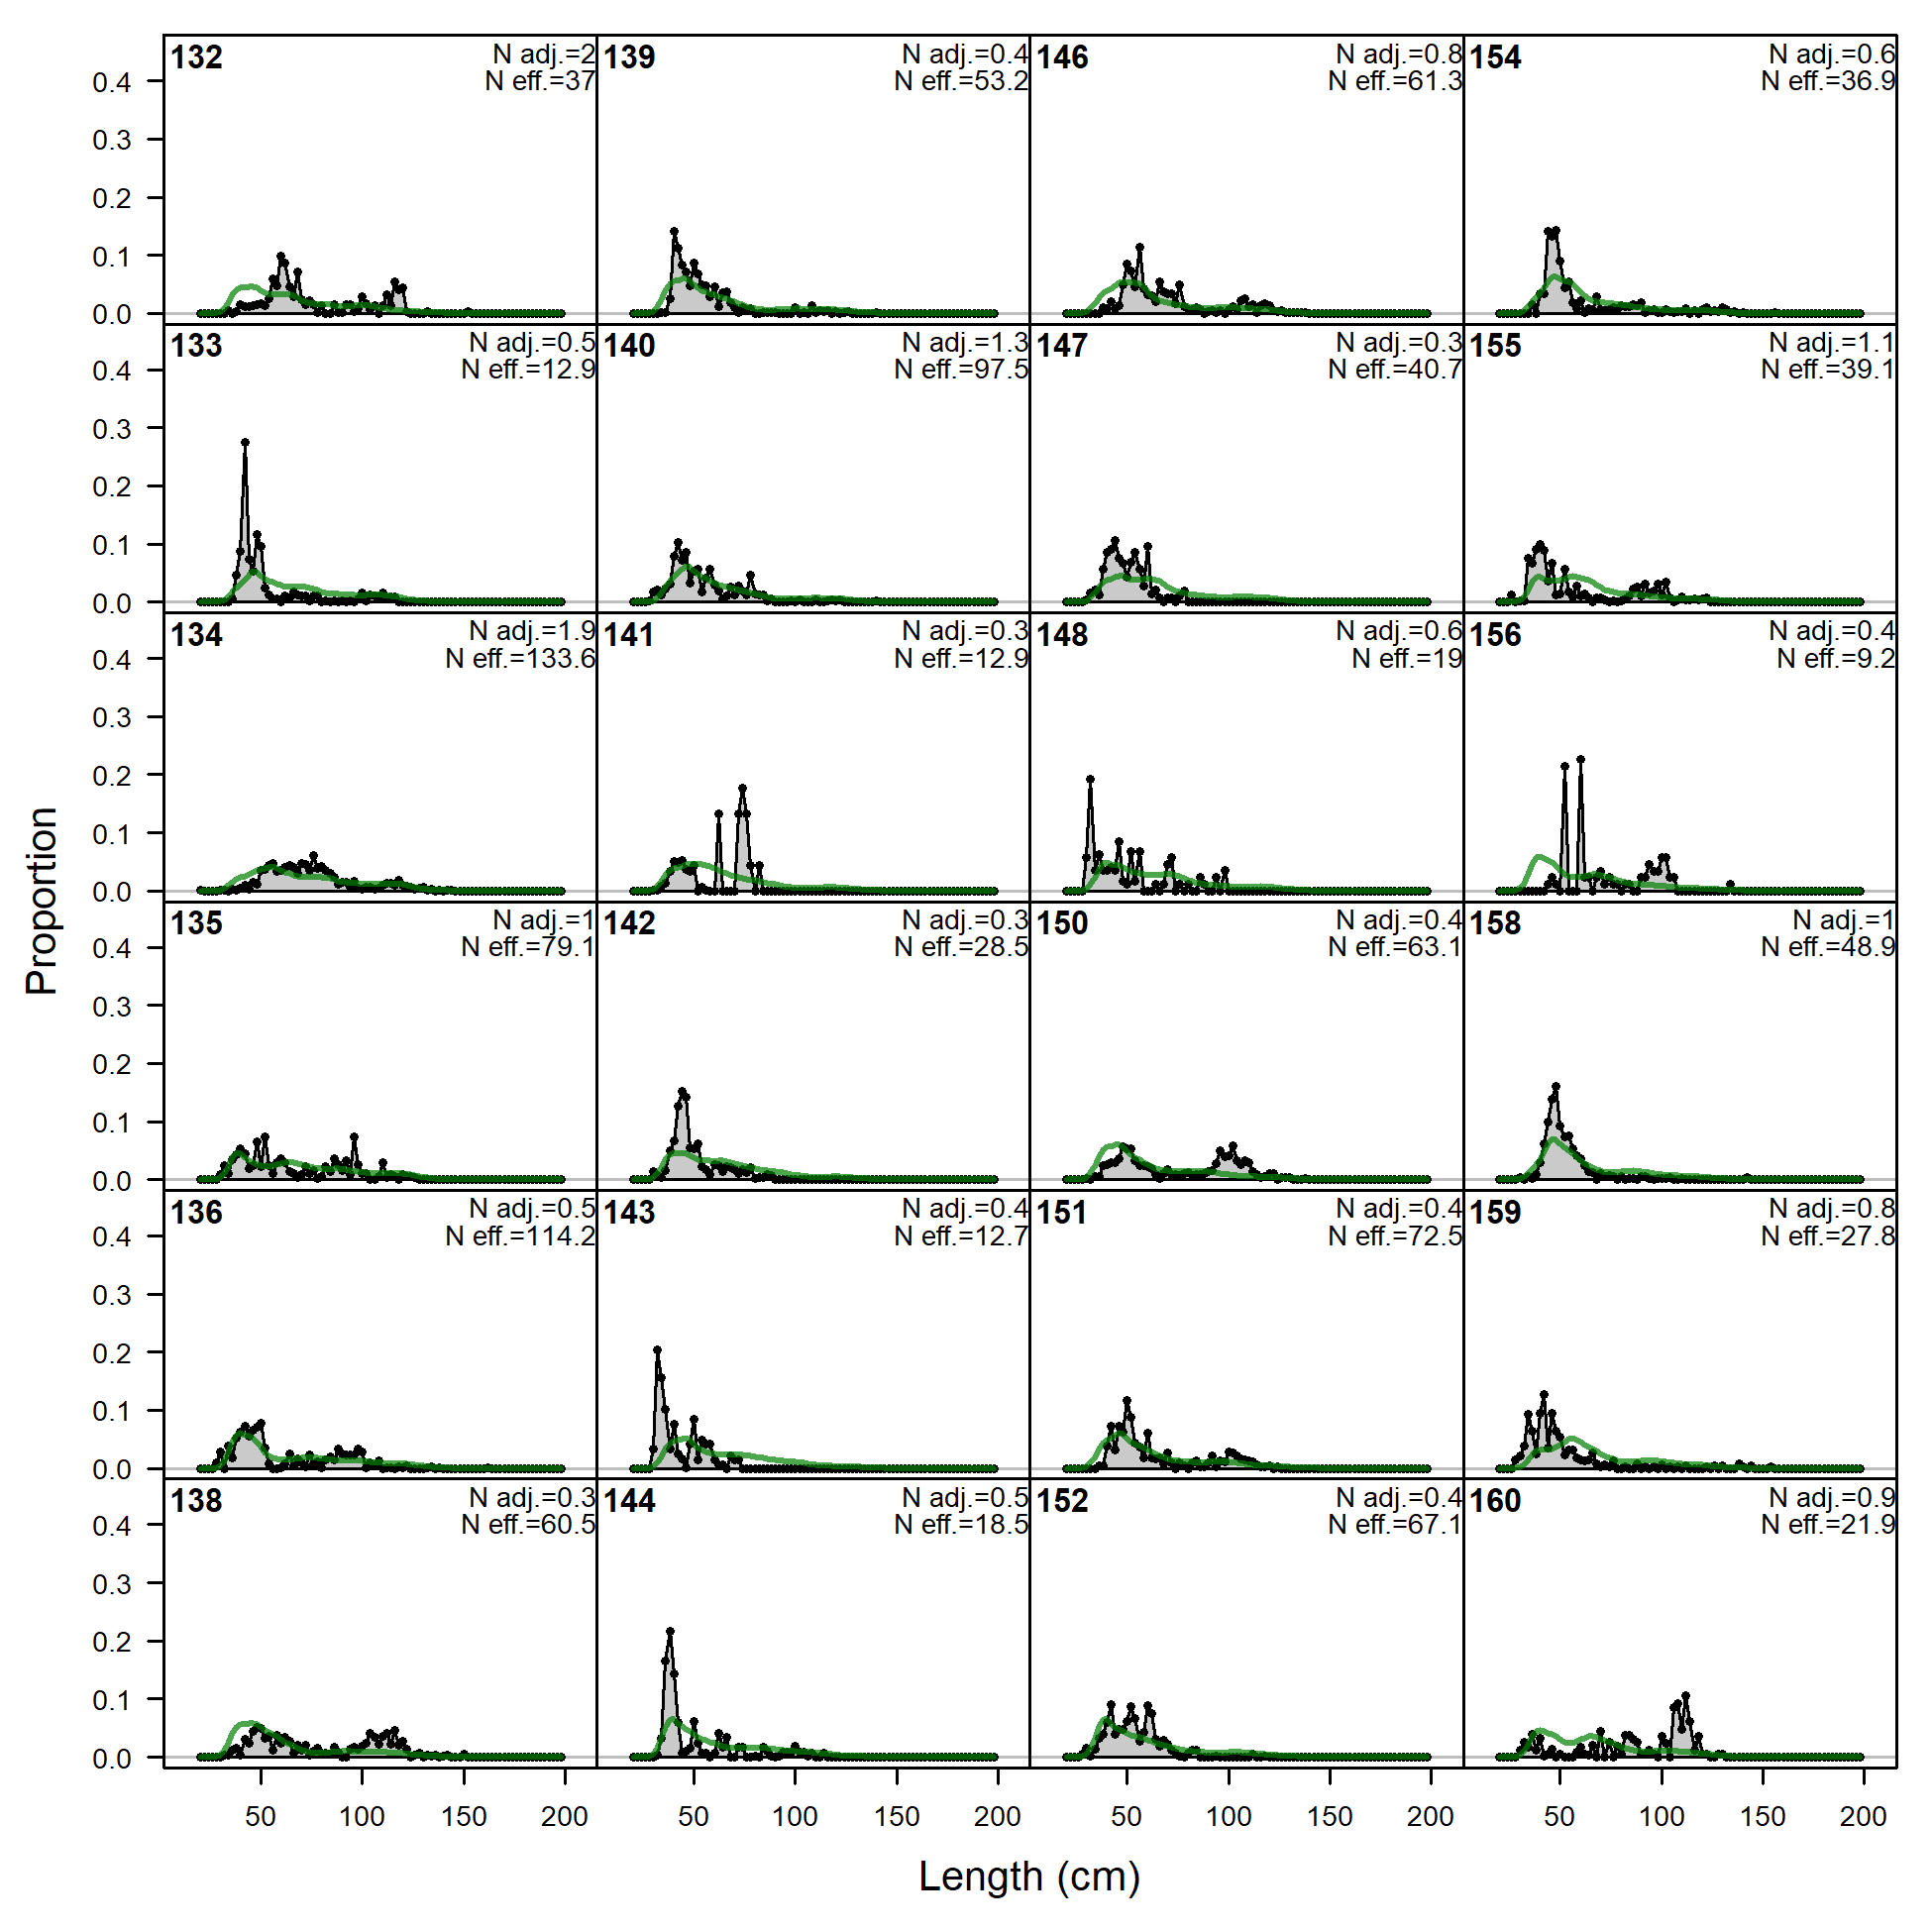
Length comps, whole catch, OBJ-A2 (plot 1 of 5).
'N adj.' is the input sample size after data-weighting adjustment. N eff. is the calculated effective sample size used in the McAllister-Ianelli tuning method. (plot 2 of 5) (plot 3 of 5)
file: comp_lenfit_flt16mkt0_page3.png
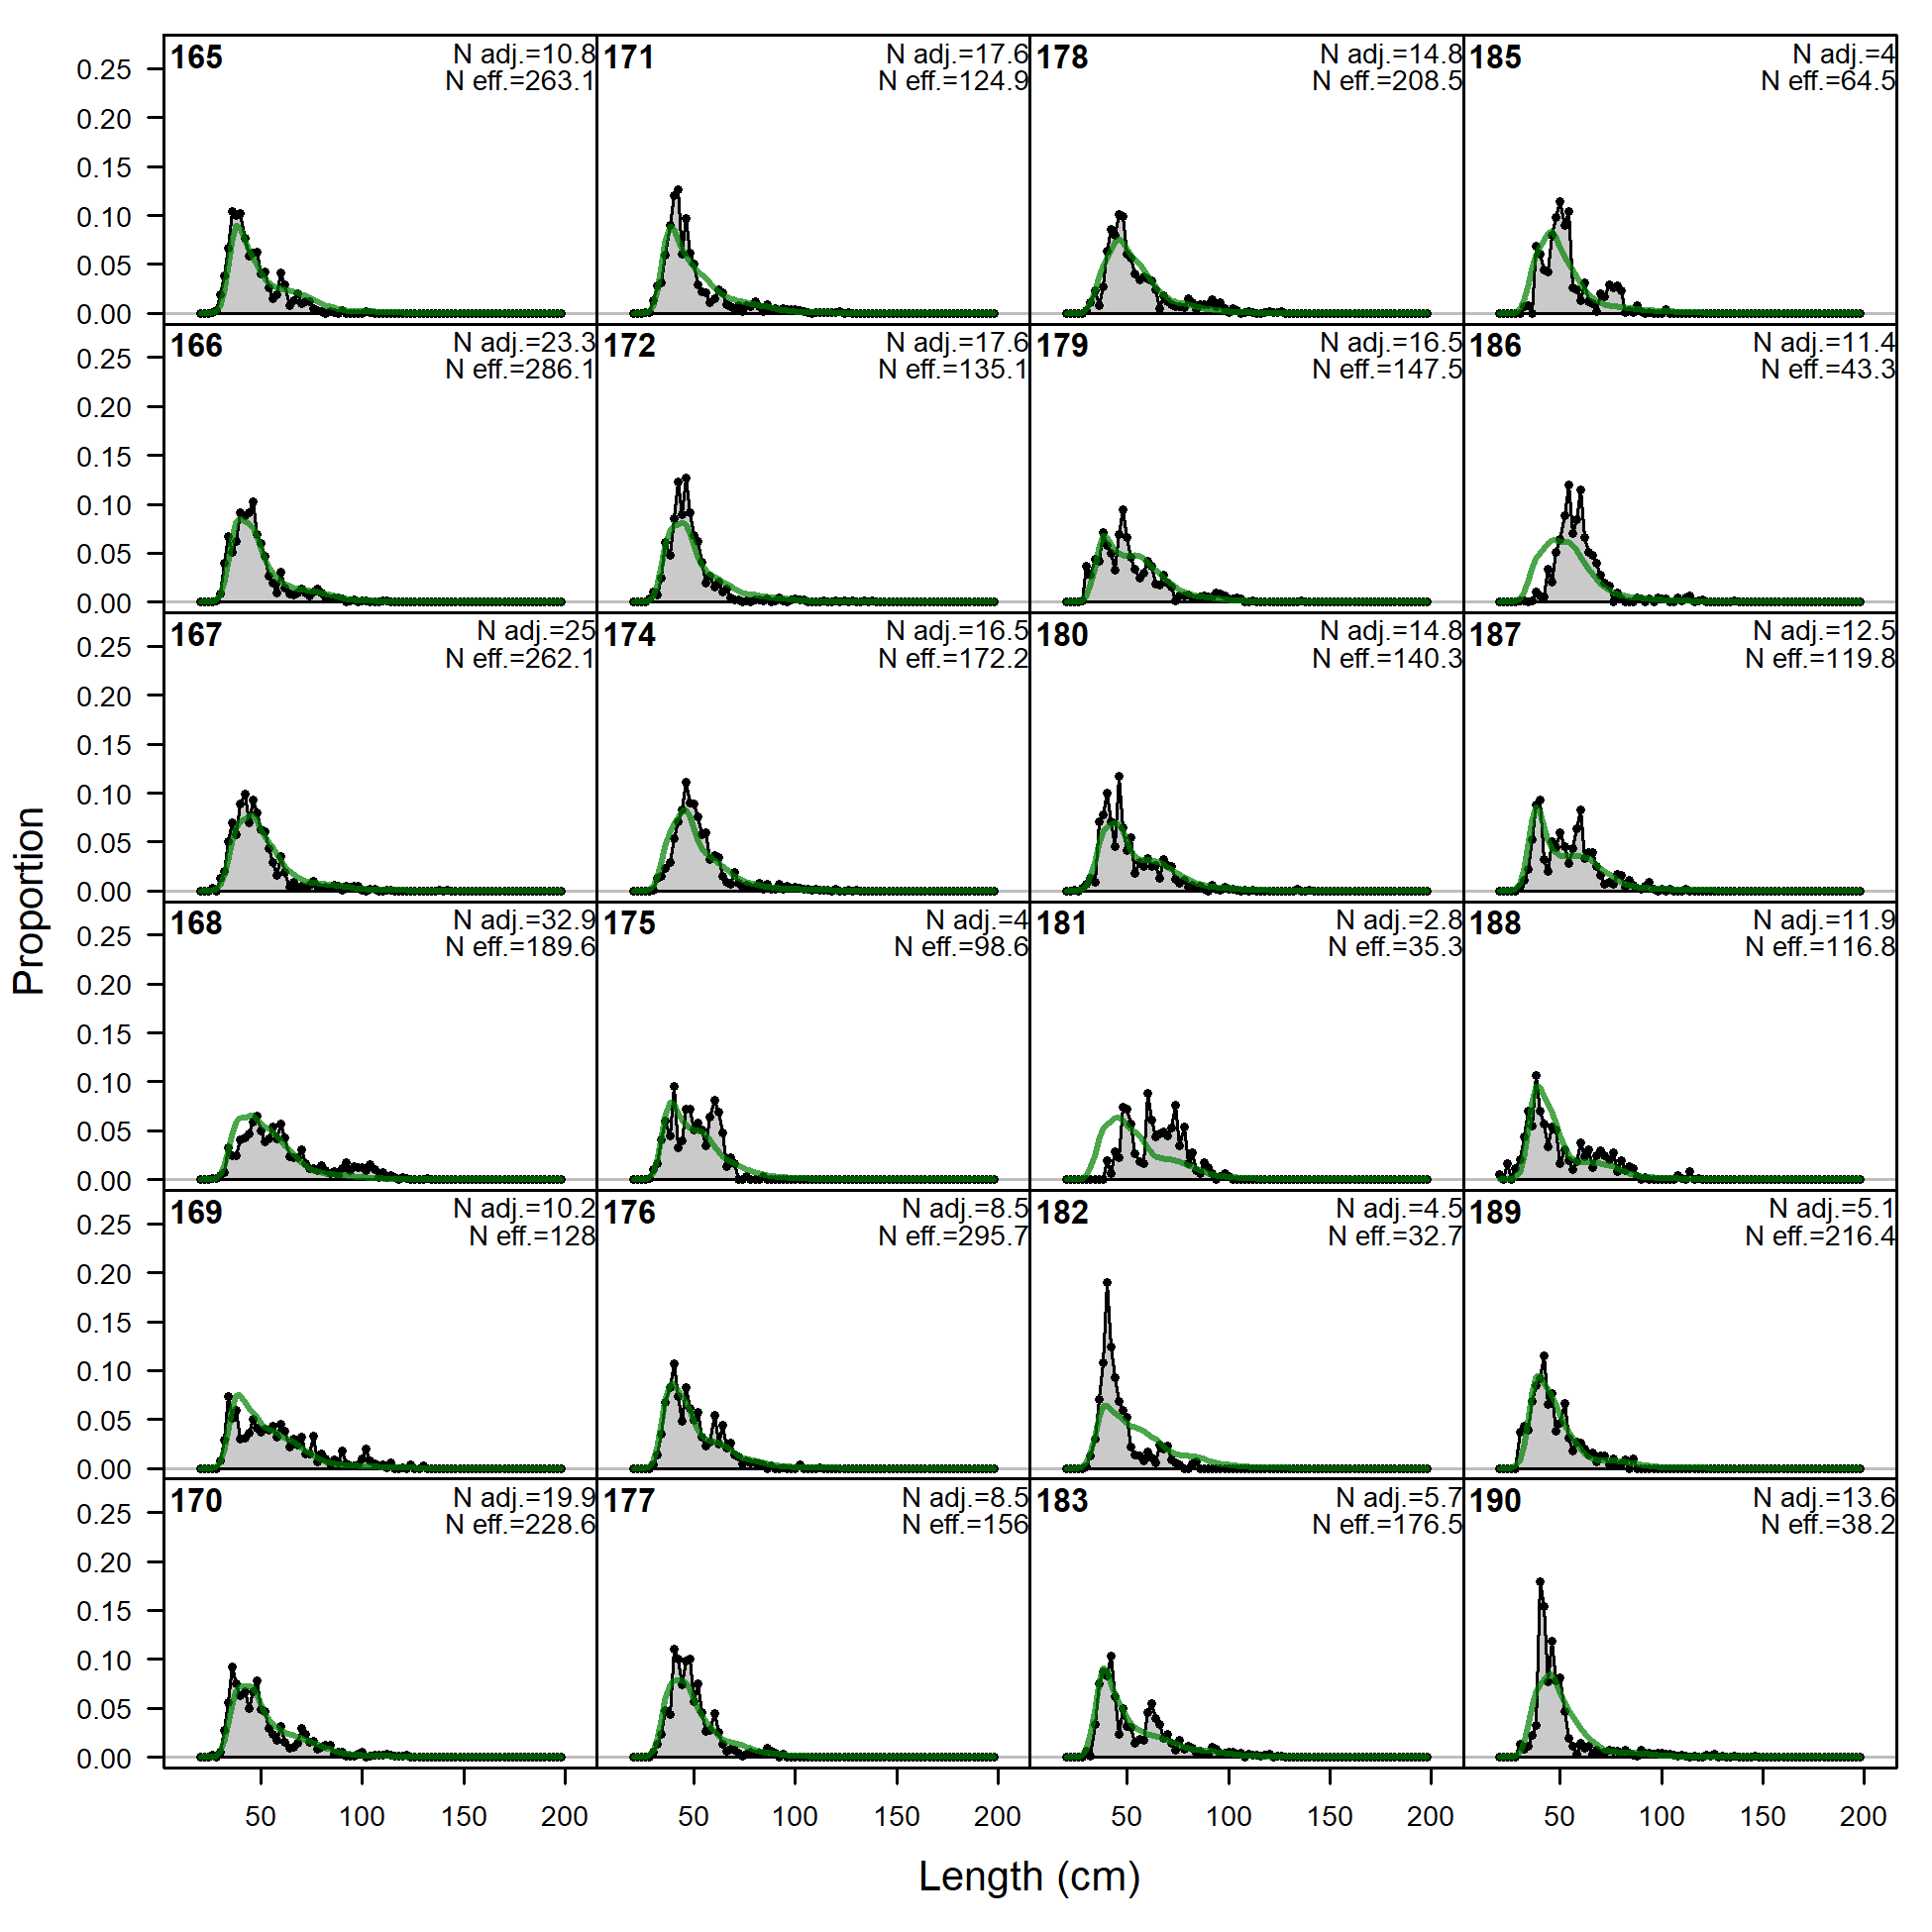
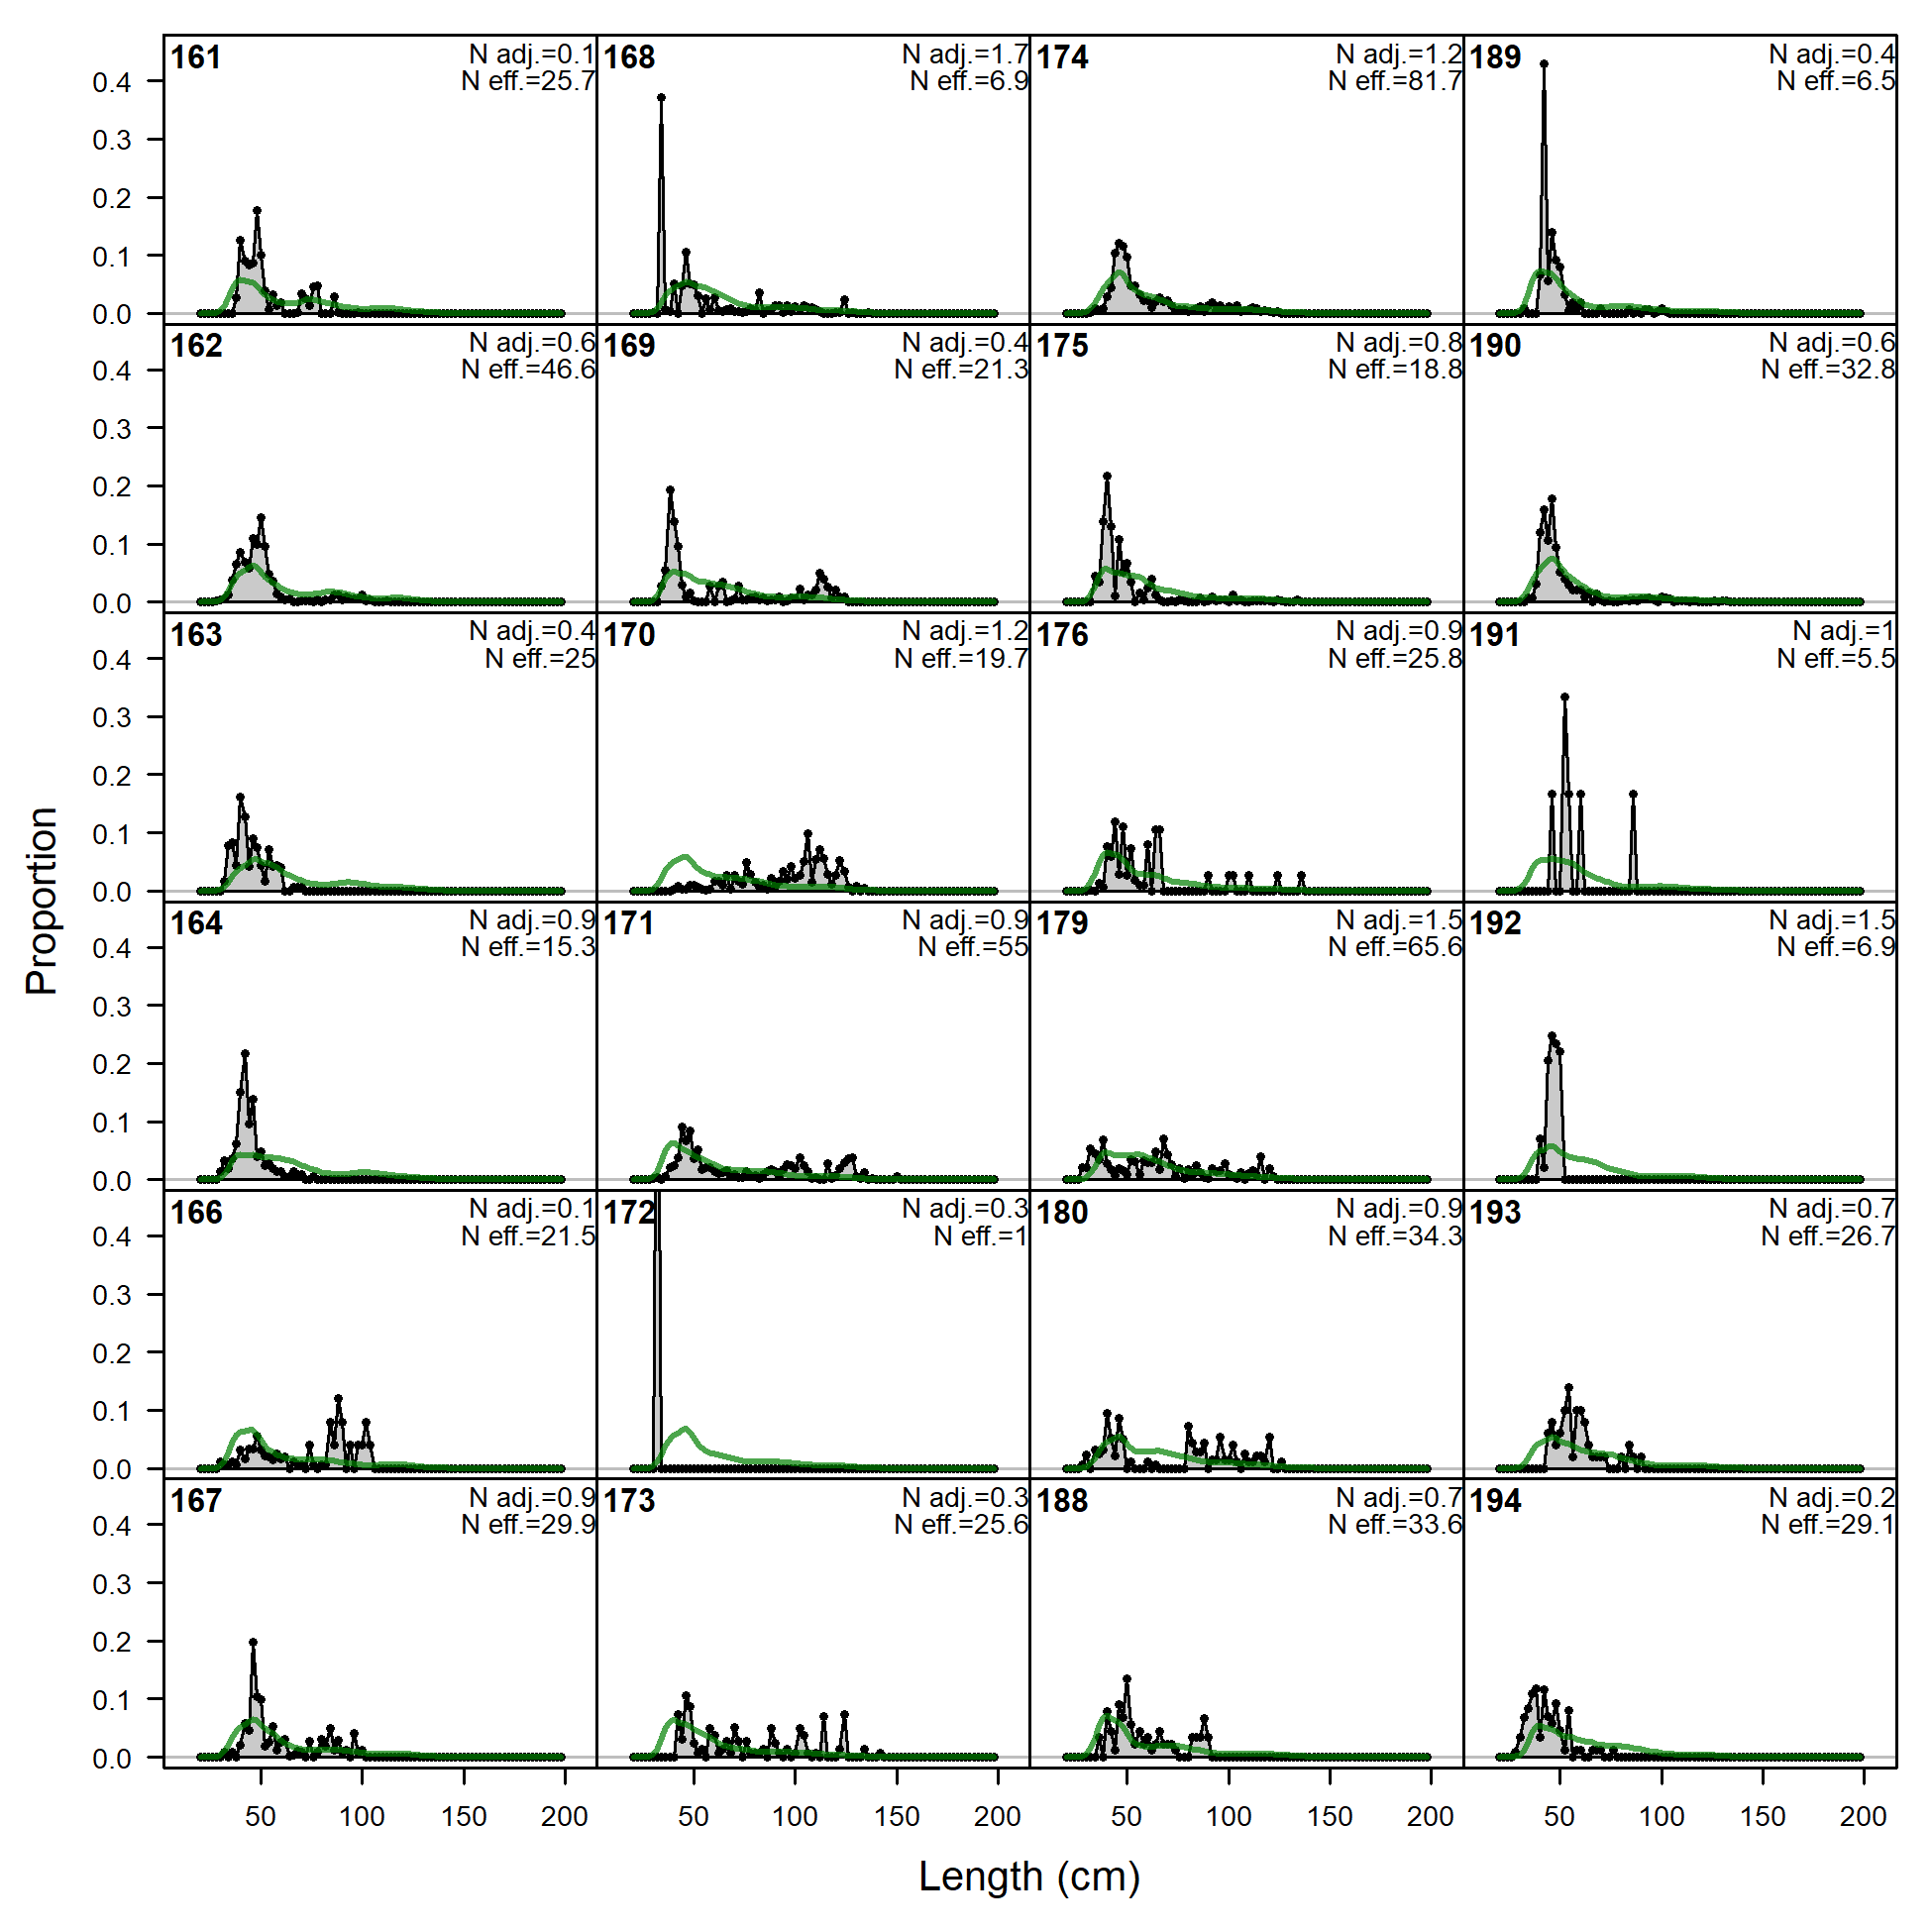
Length comps, whole catch, OBJ-A2 (plot 1 of 5).
'N adj.' is the input sample size after data-weighting adjustment. N eff. is the calculated effective sample size used in the McAllister-Ianelli tuning method. (plot 2 of 5) (plot 3 of 5) (plot 4 of 5)
file: comp_lenfit_flt16mkt0_page4.png
Length comps, whole catch, OBJ-A2 (plot 1 of 5).
'N adj.' is the input sample size after data-weighting adjustment. N eff. is the calculated effective sample size used in the McAllister-Ianelli tuning method. (plot 2 of 5) (plot 3 of 5) (plot 4 of 5) (plot 5 of 5)
file: comp_lenfit_flt16mkt0_page5.png
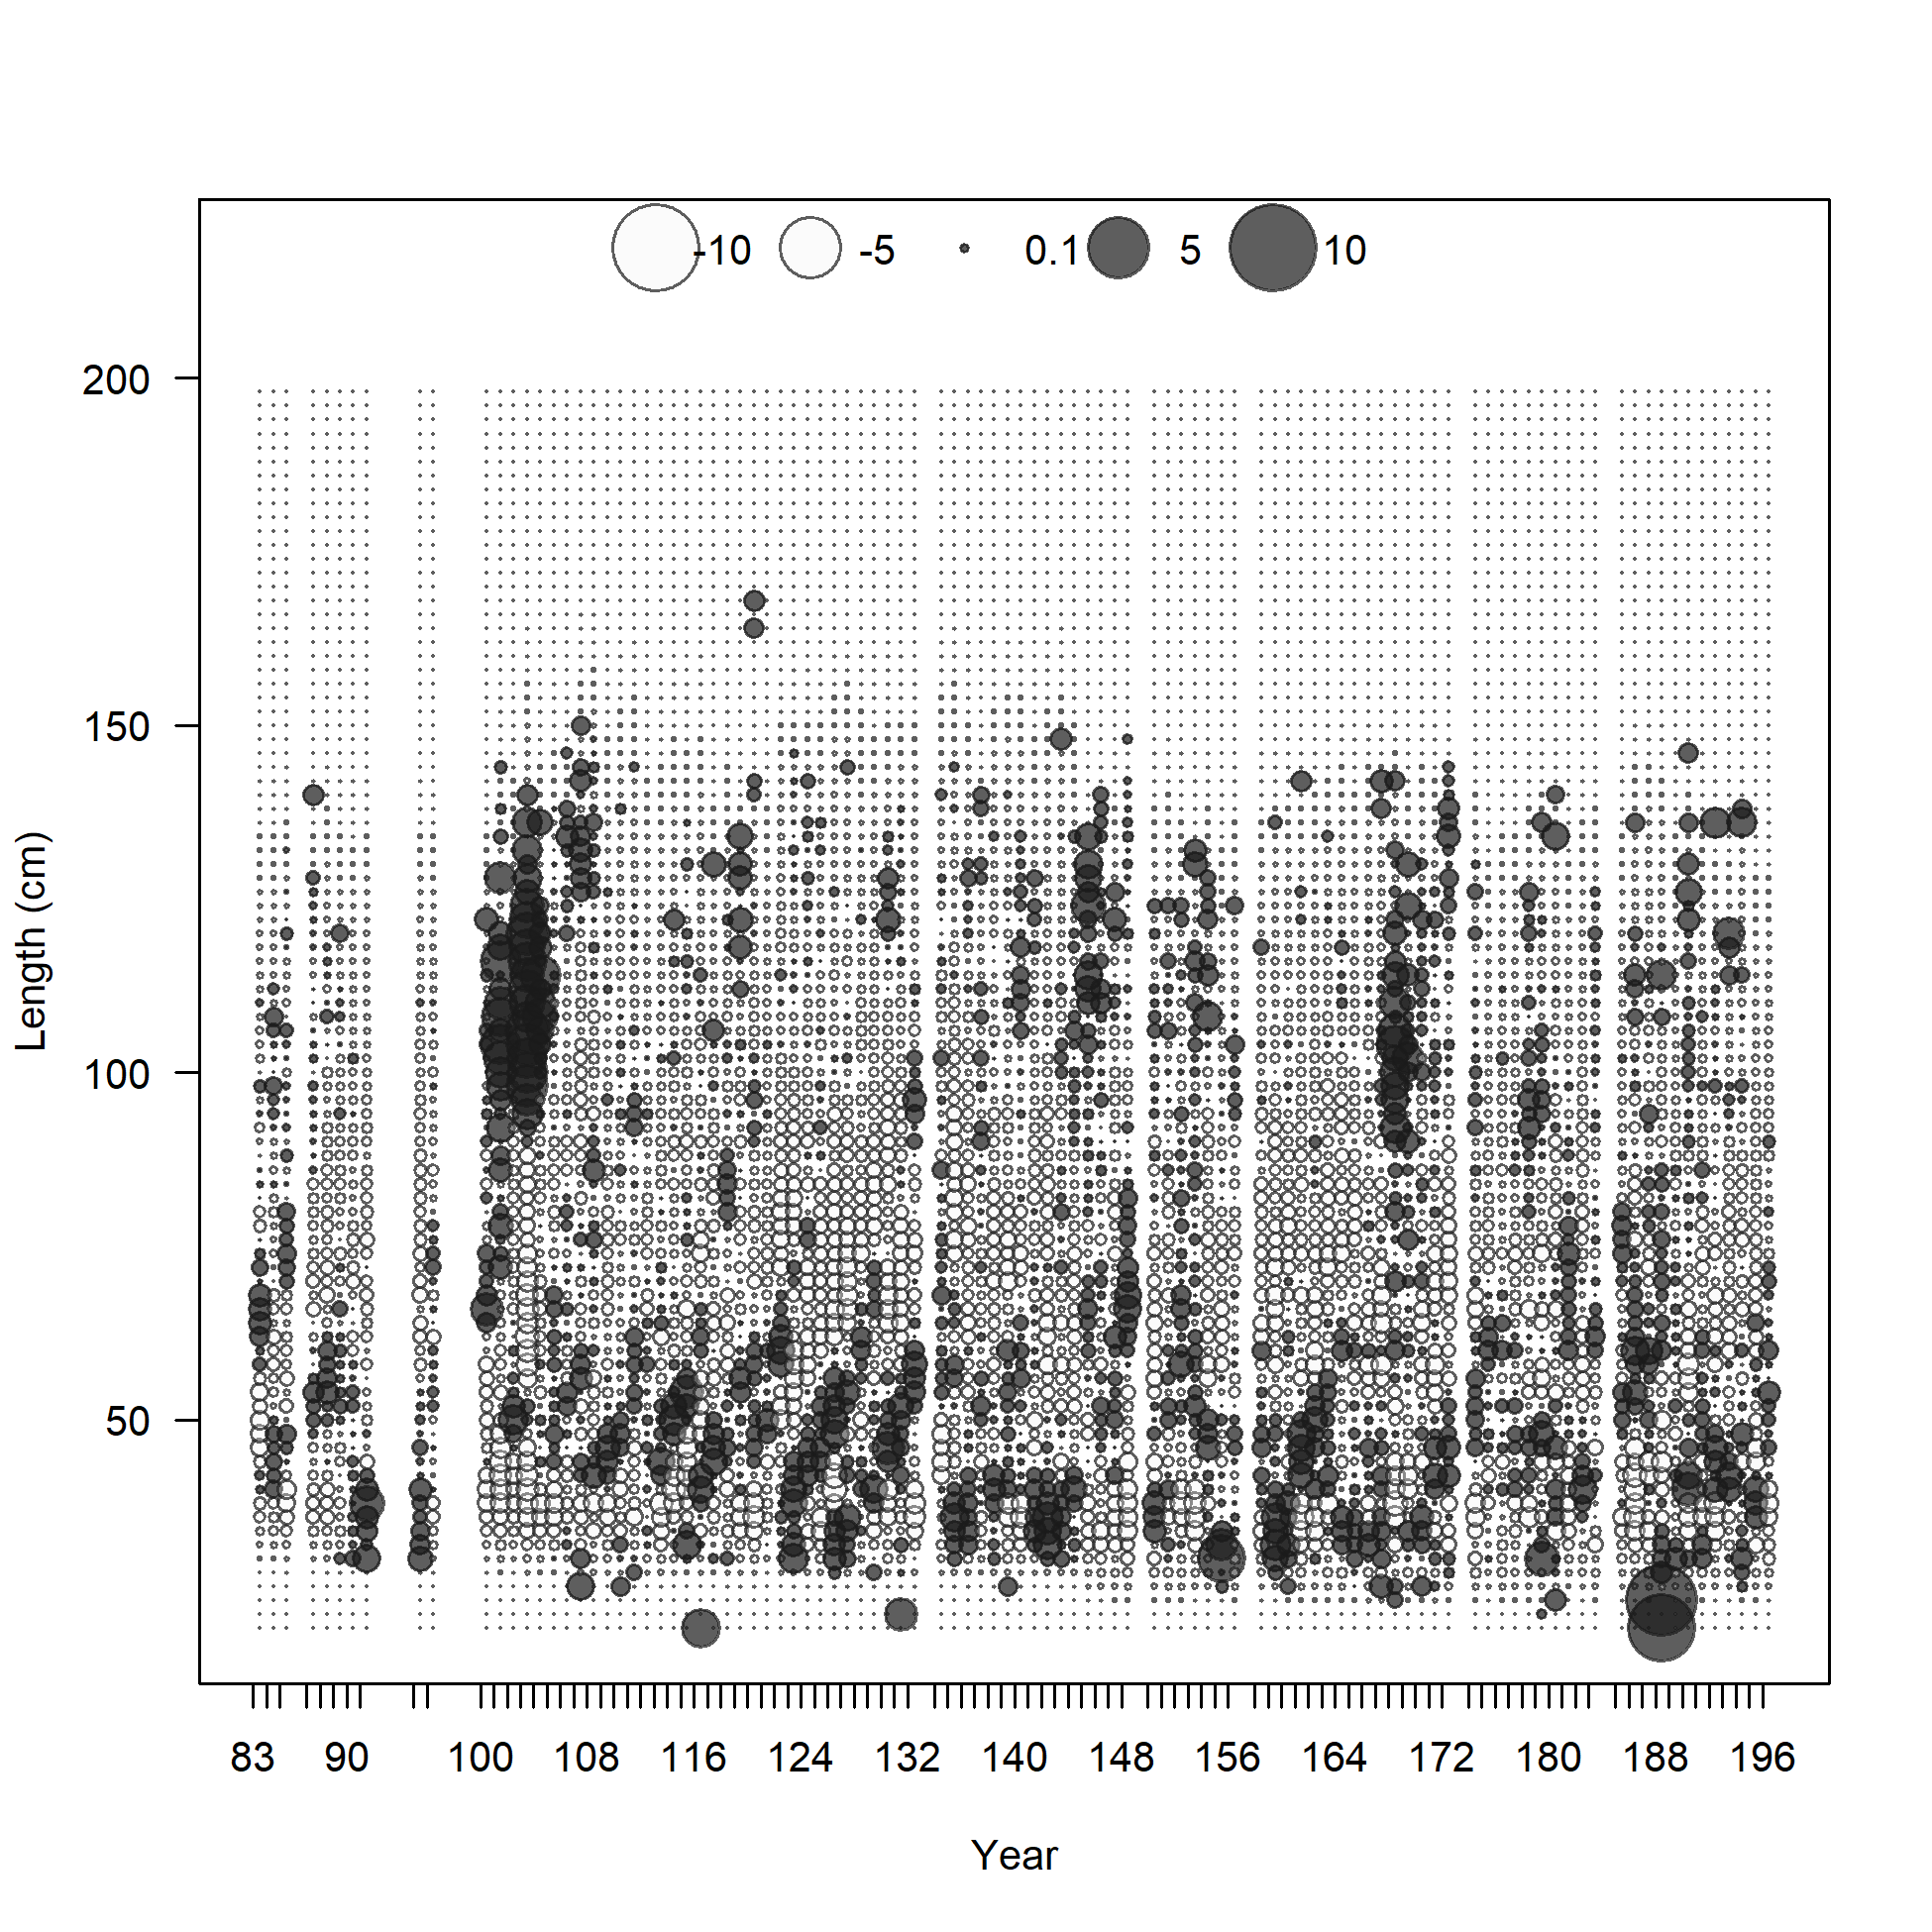
Pearson residuals, whole catch, OBJ-A2 (max=6.85) (plot 5 of 5)
Closed bubbles are positive residuals (observed > expected) and open bubbles are negative residuals (observed < expected).
file: comp_lenfit_residsflt16mkt0_page5.png
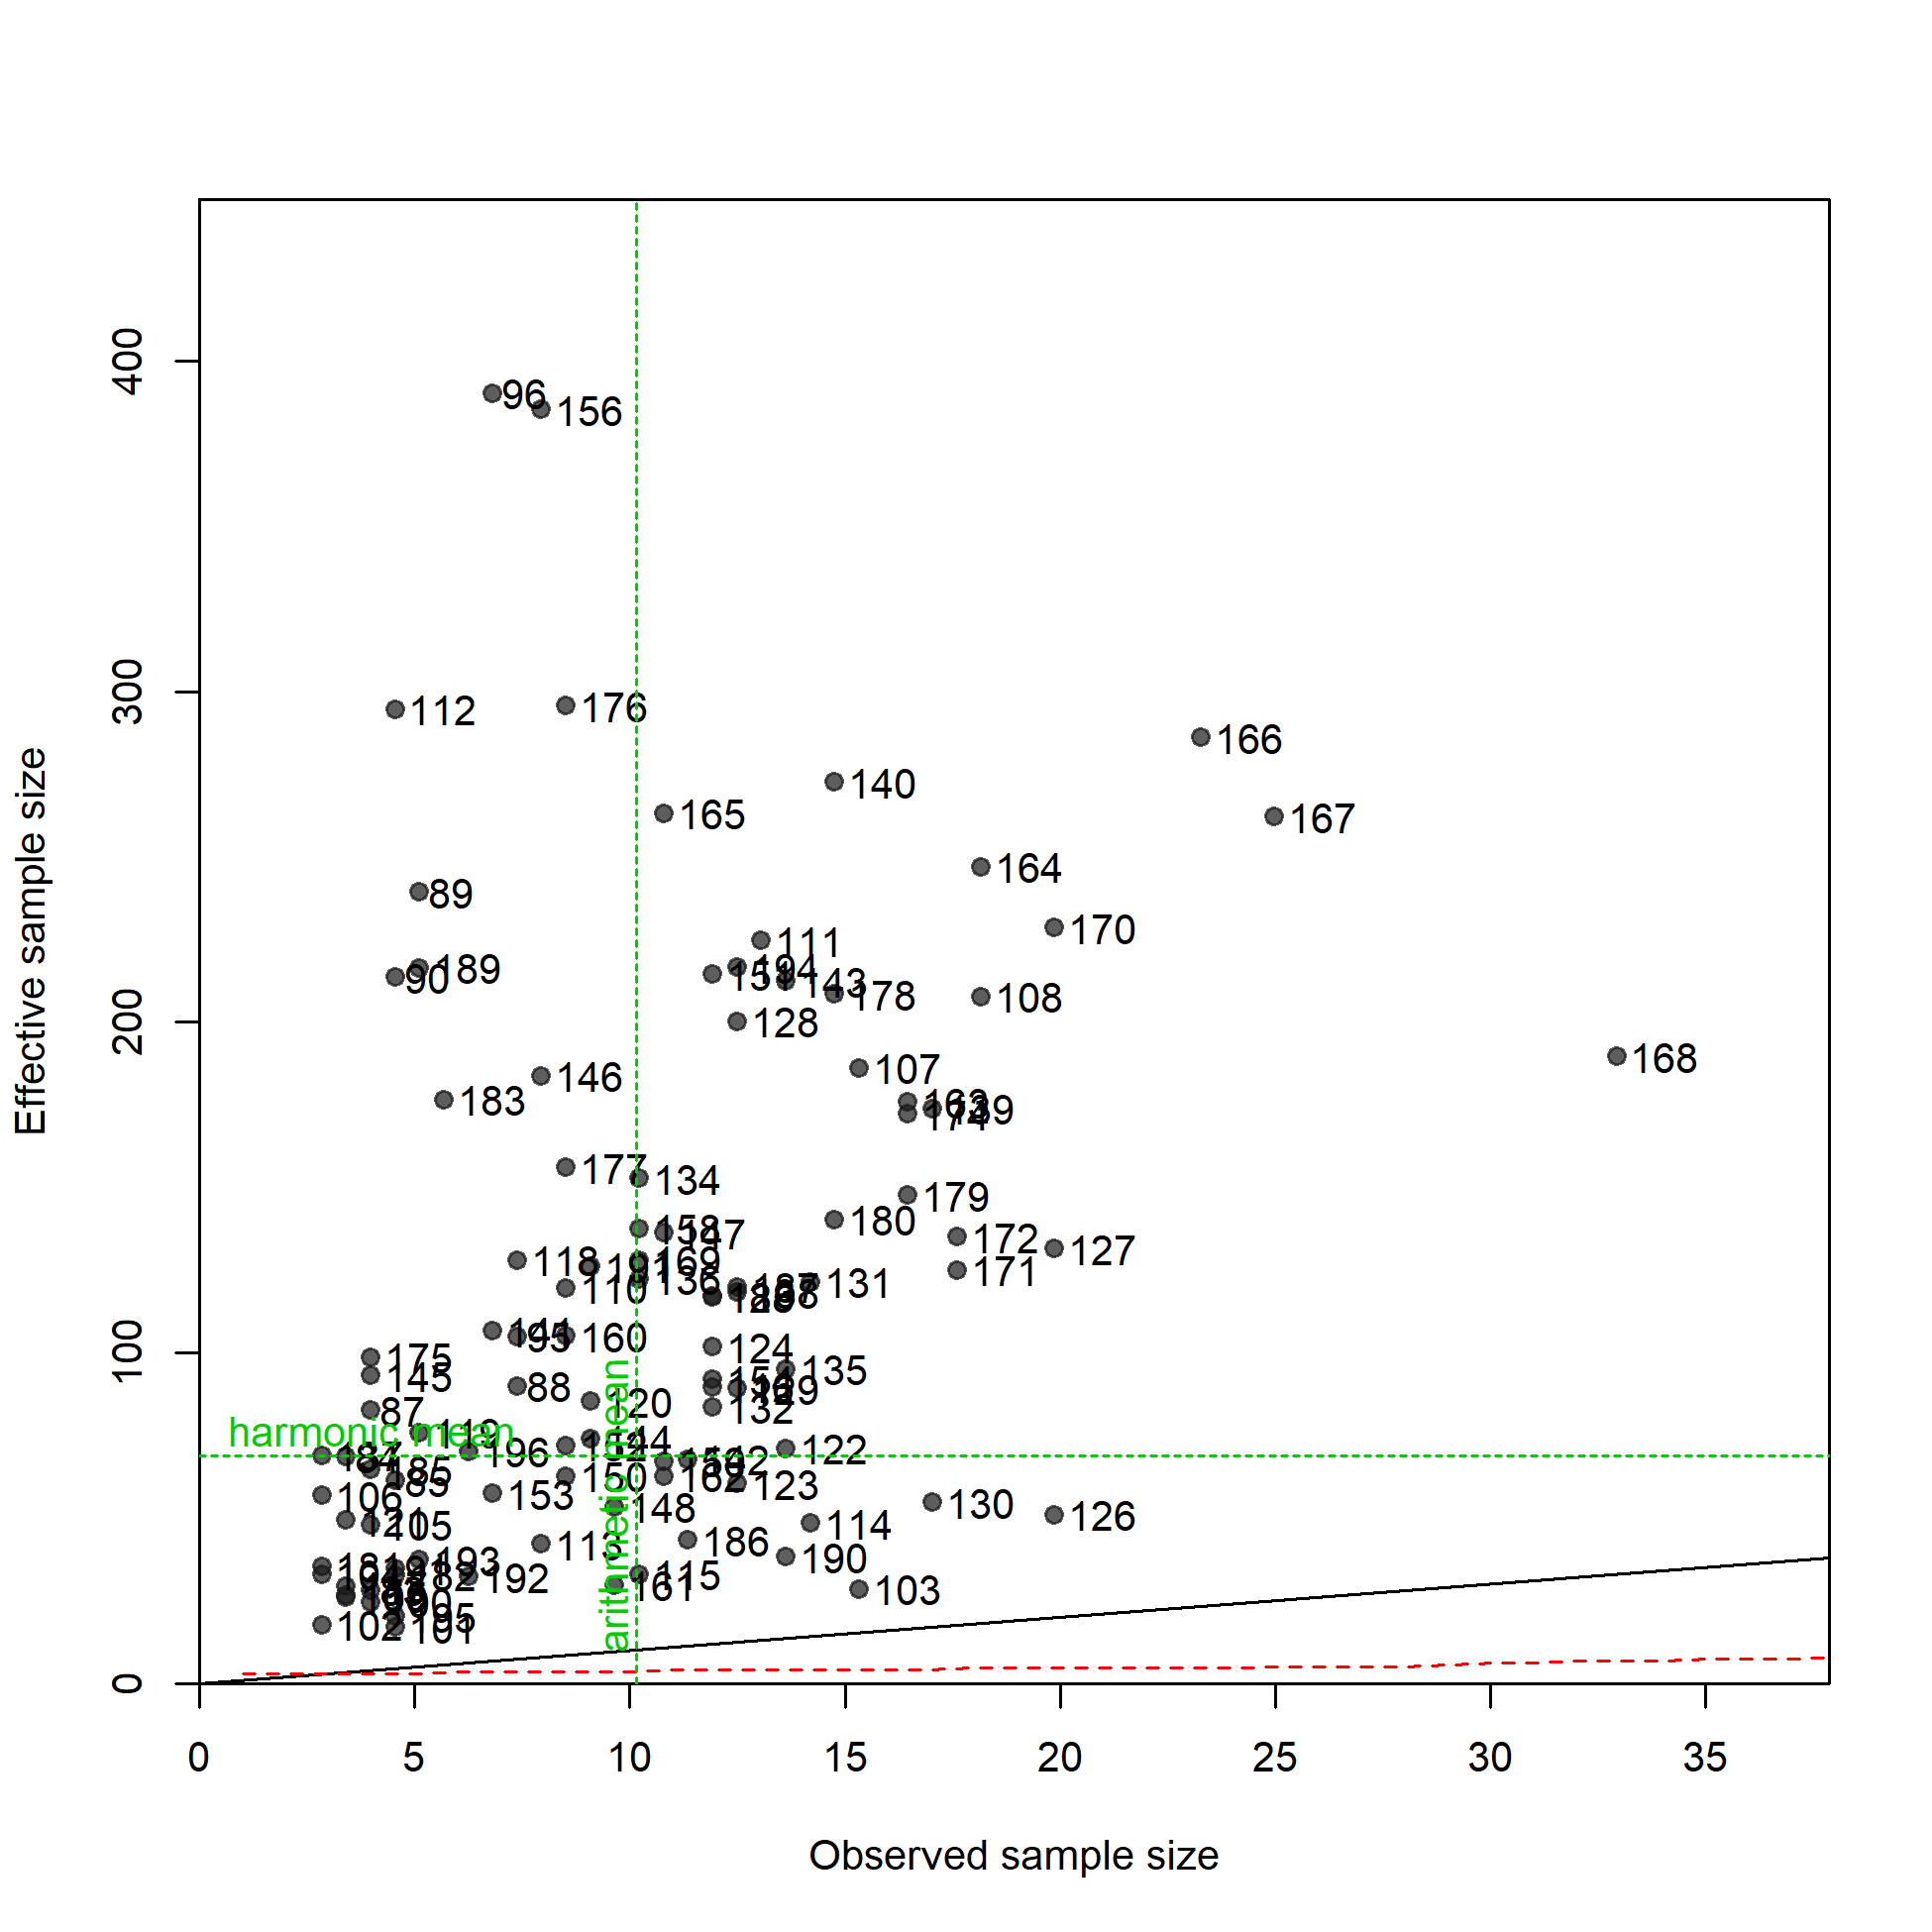
N-EffN comparison, Length comps, whole catch, OBJ-A2
file: comp_lenfit_sampsize_flt16mkt0.png
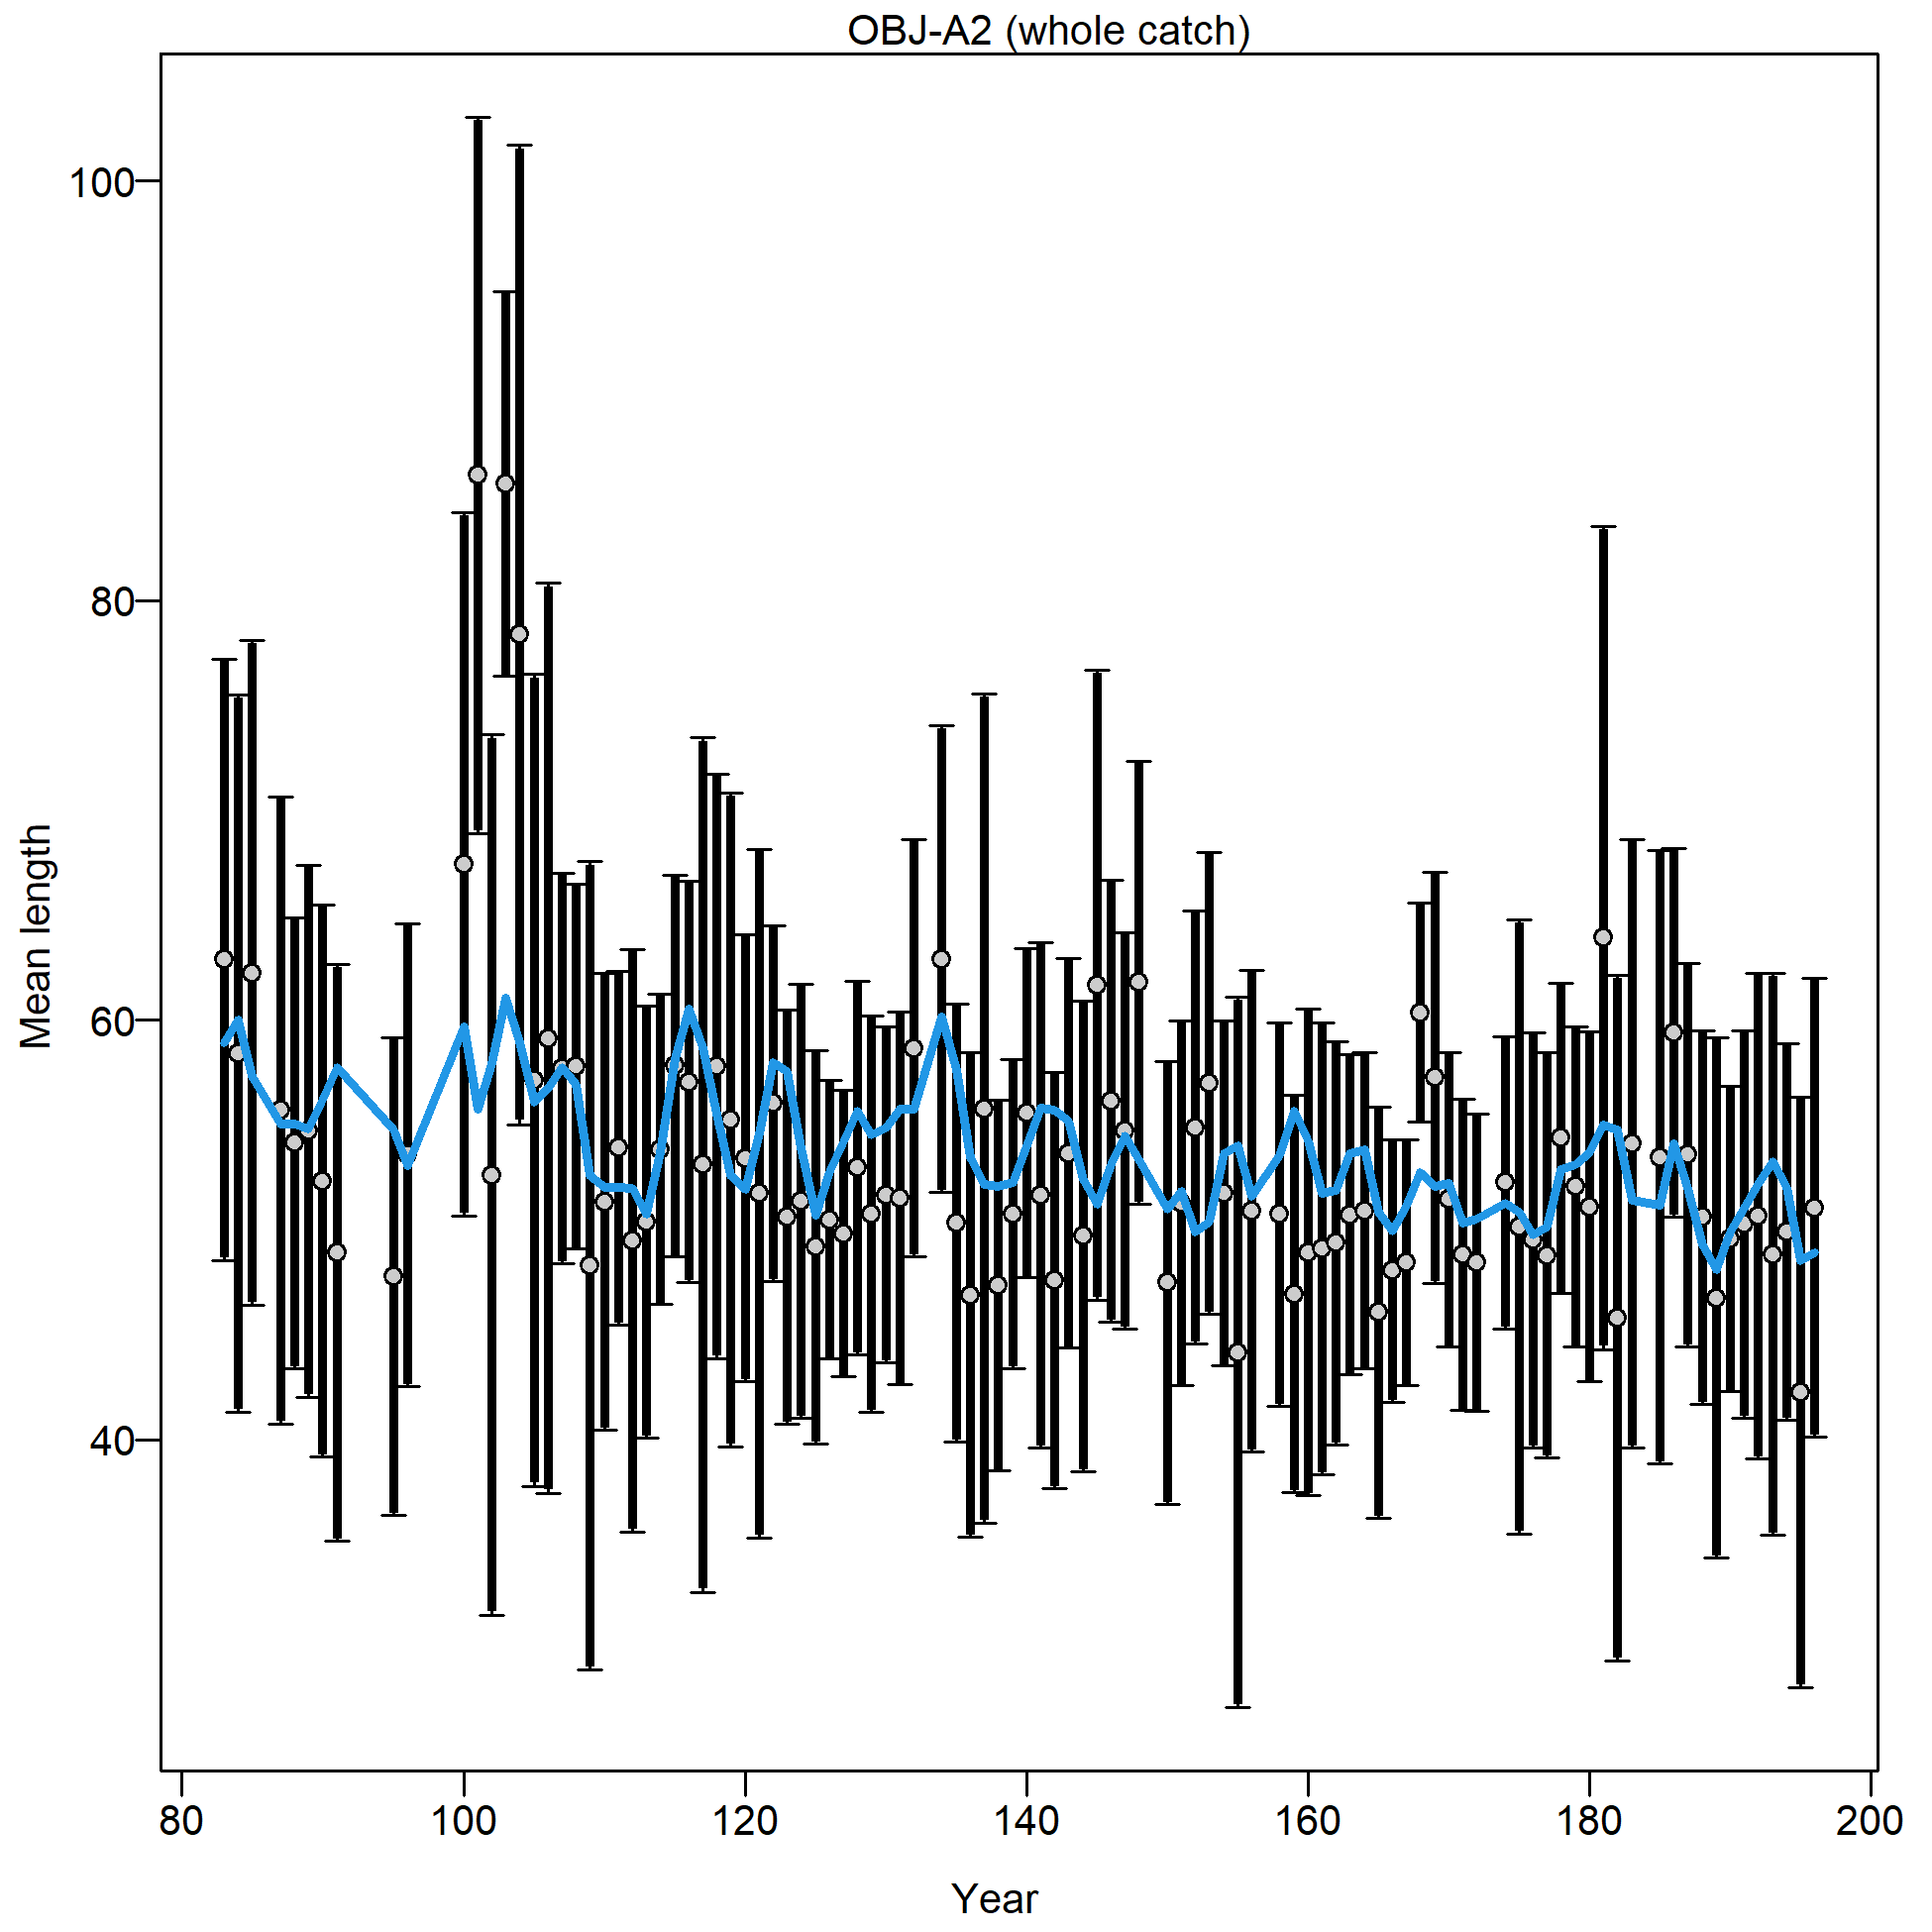
Mean length for OBJ-A2 with 95% confidence intervals based on current sample sizes.
Francis data weighting method TA1.8: thinner intervals (with capped ends) show result of further adjusting sample sizes based on suggested multiplier (with 95% interval) for len data from OBJ-A2:
0.983 (0.5624-2.1247)
For more info, see Francis (2011).
file: comp_lenfit_data_weighting_TA1.8_OBJ-A2.png
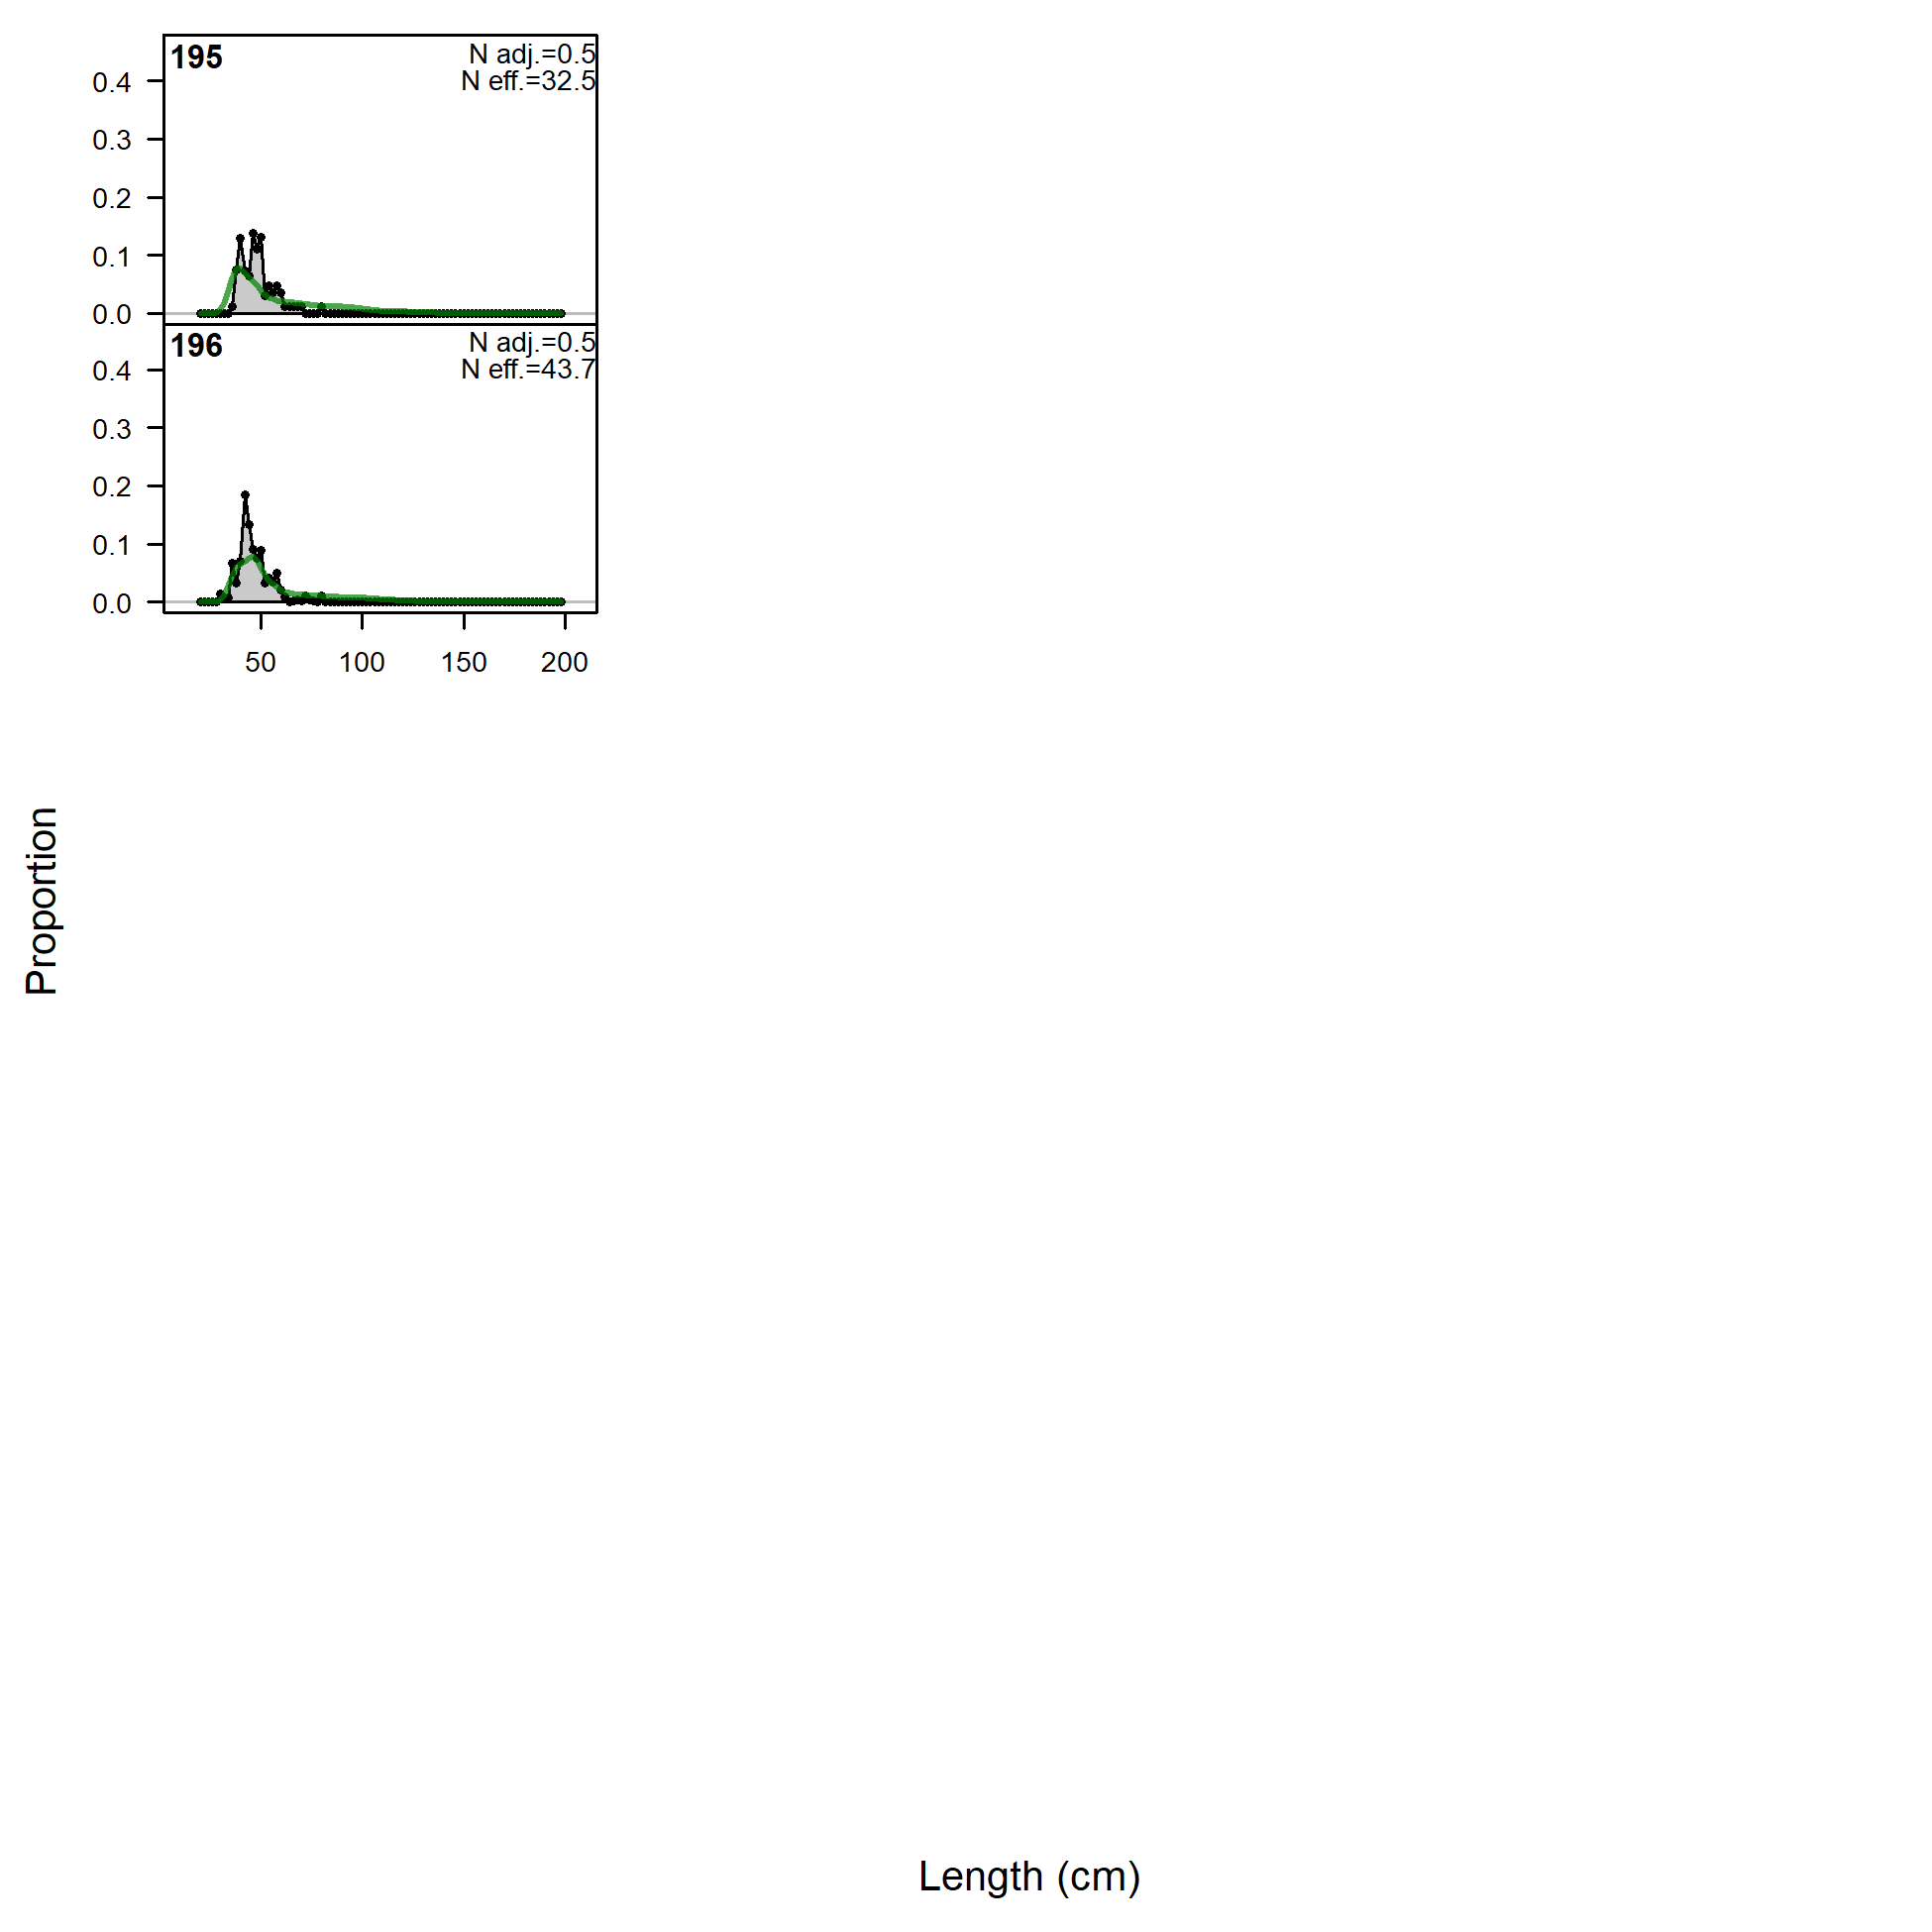
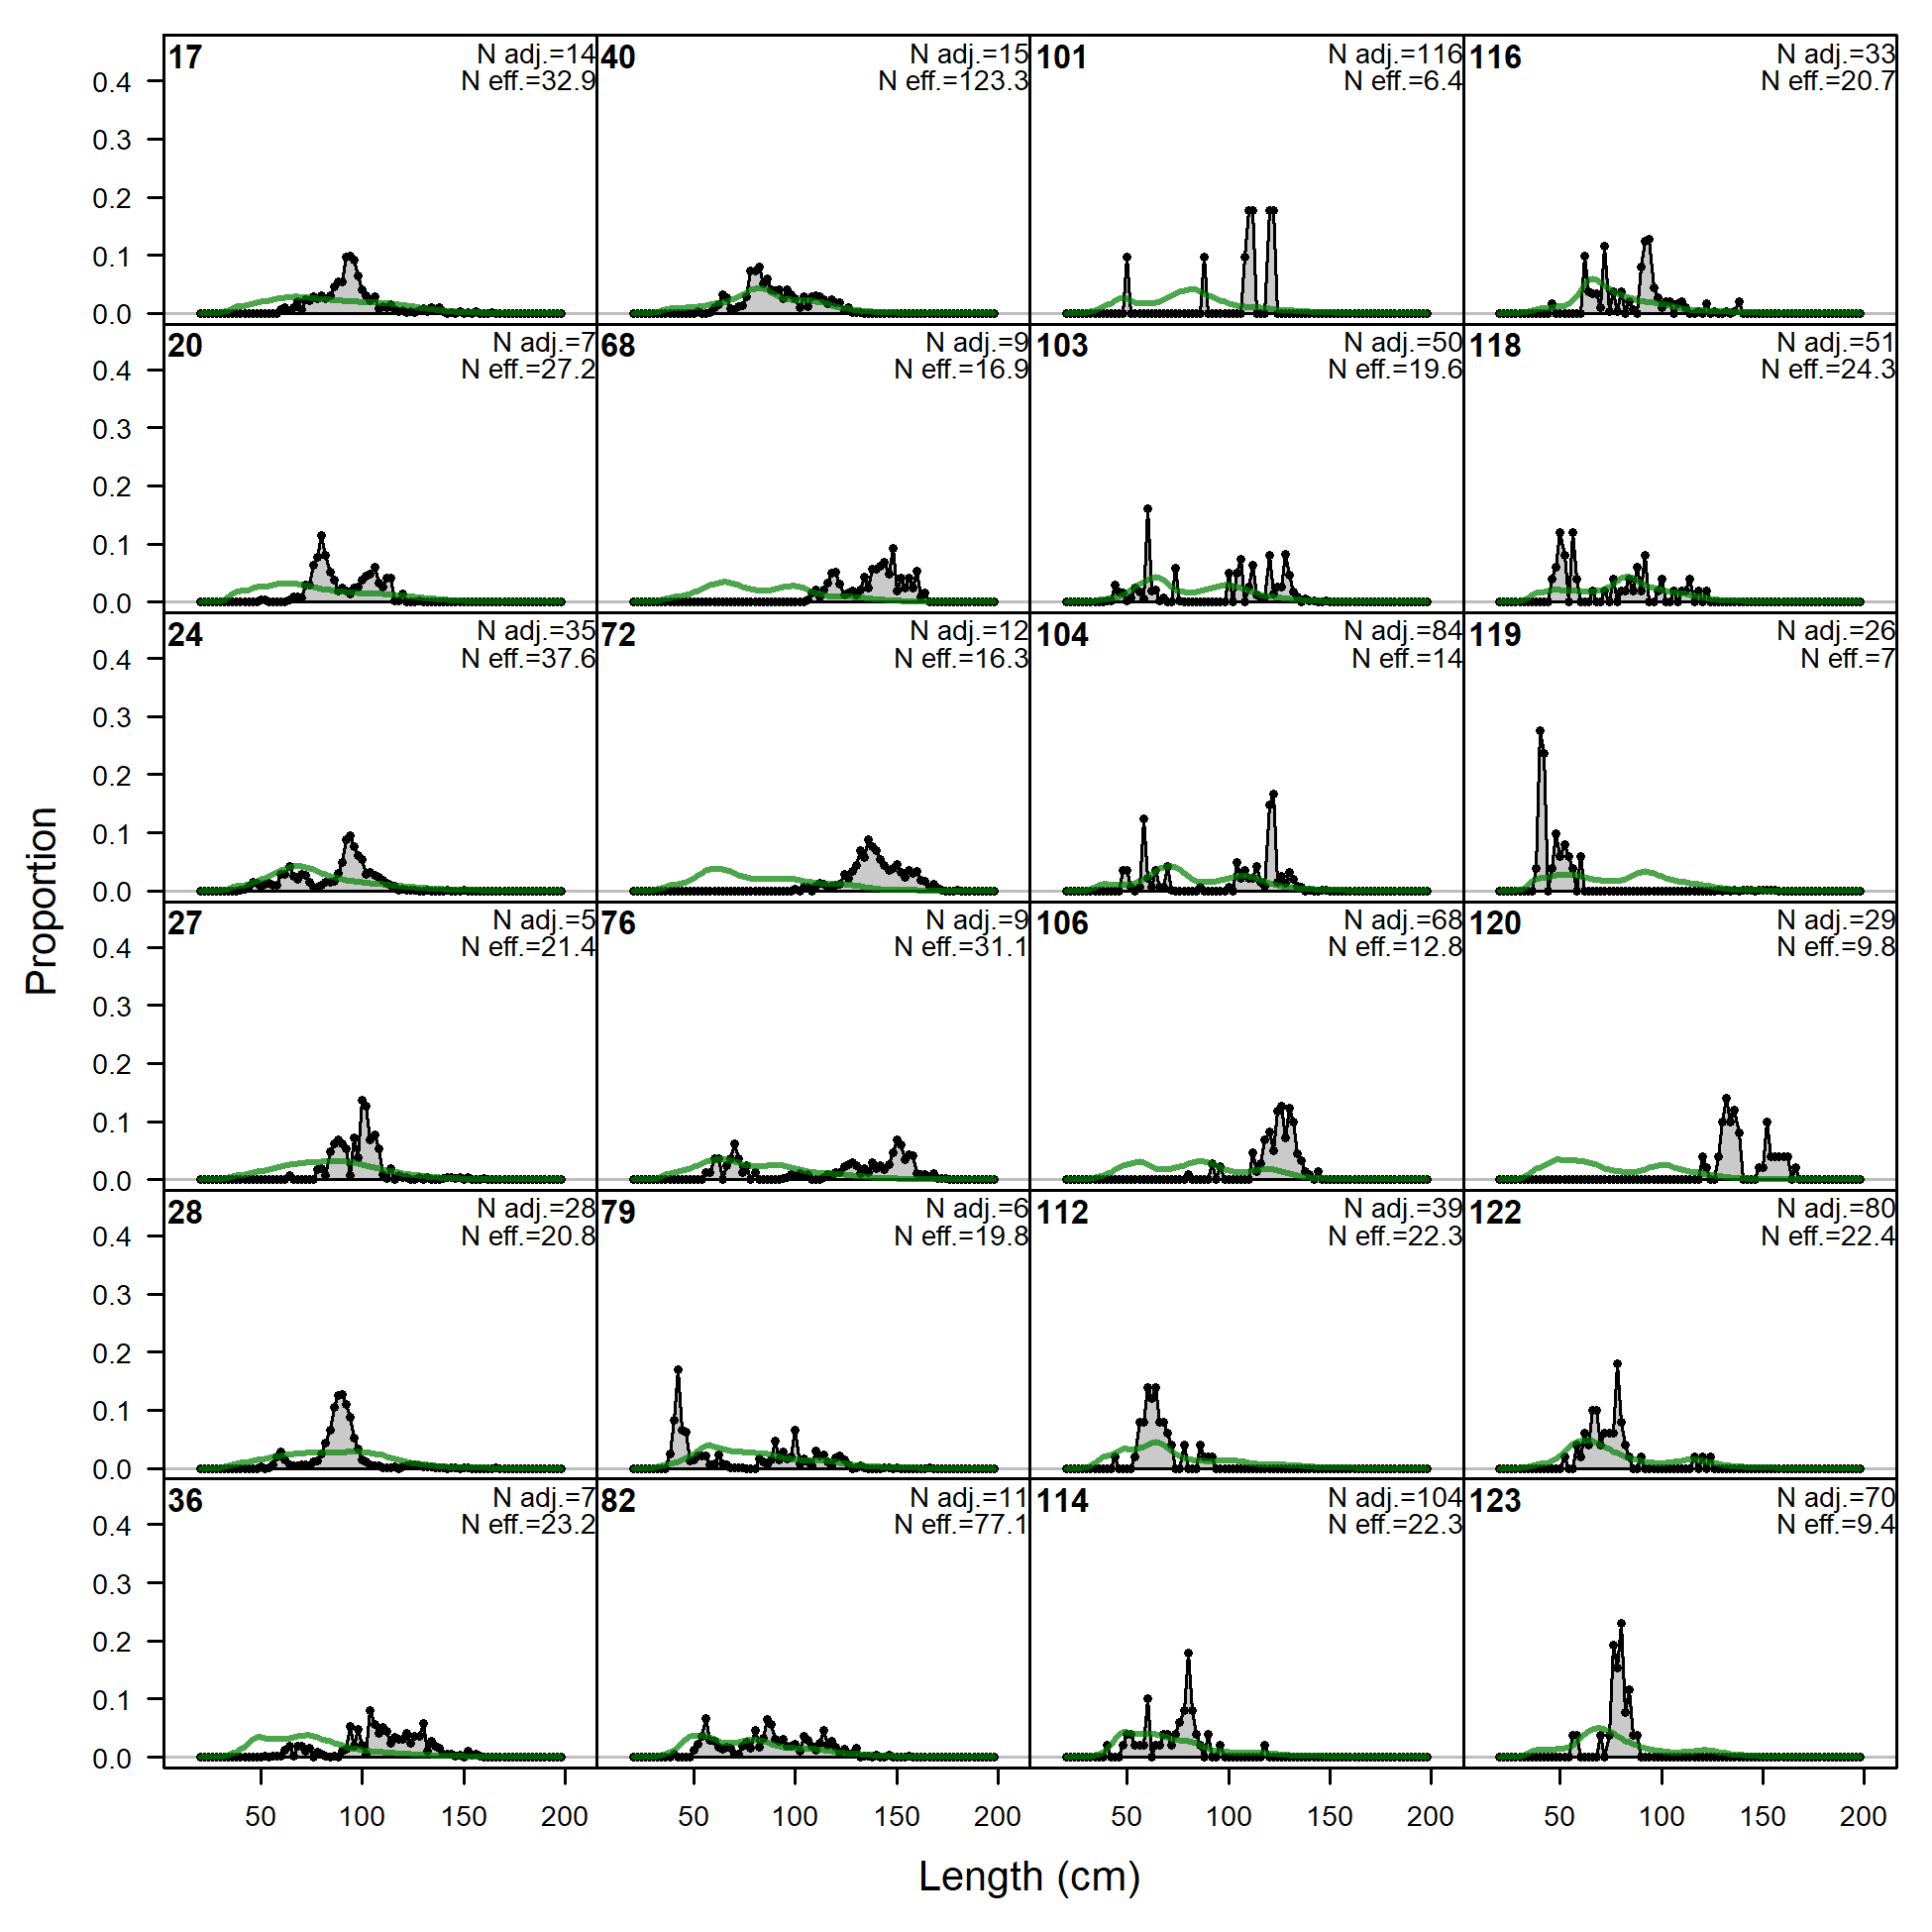
Length comps, whole catch, OBJ-A3 (plot 1 of 5).
'N adj.' is the input sample size after data-weighting adjustment. N eff. is the calculated effective sample size used in the McAllister-Ianelli tuning method.
file: comp_lenfit_flt17mkt0_page1.png
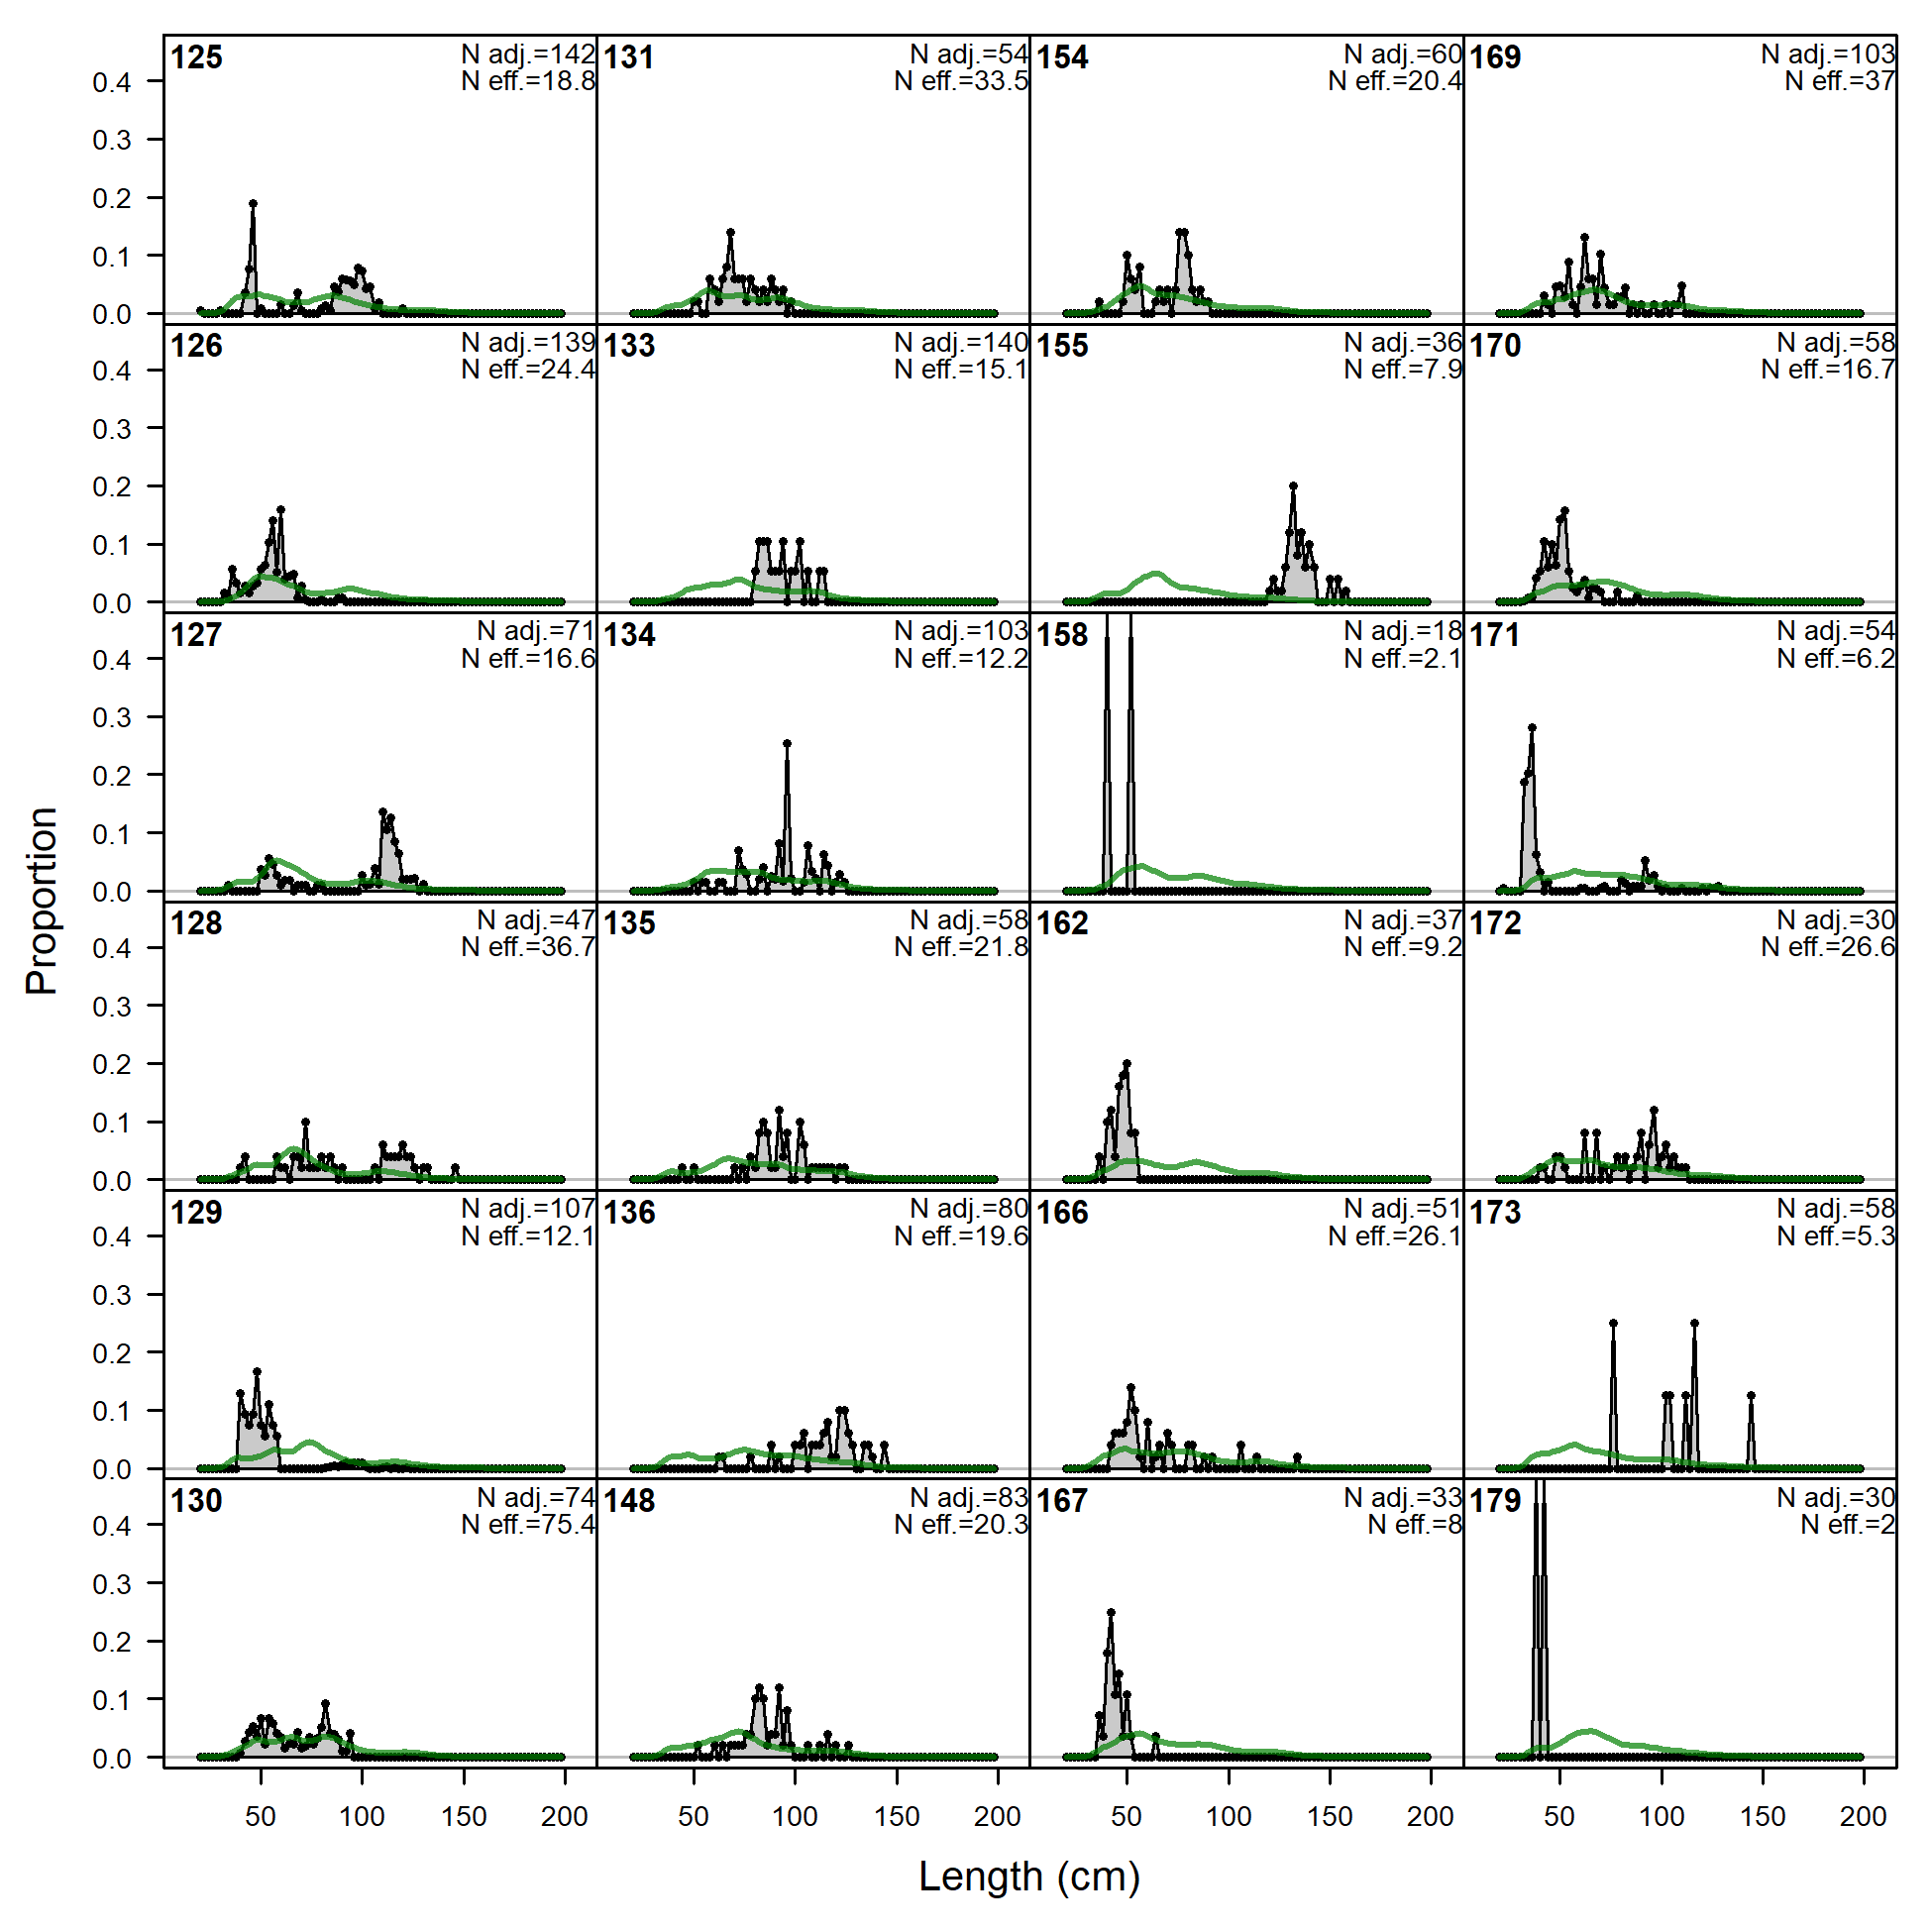
Length comps, whole catch, OBJ-A3 (plot 1 of 5).
'N adj.' is the input sample size after data-weighting adjustment. N eff. is the calculated effective sample size used in the McAllister-Ianelli tuning method. (plot 2 of 5)
file: comp_lenfit_flt17mkt0_page2.png
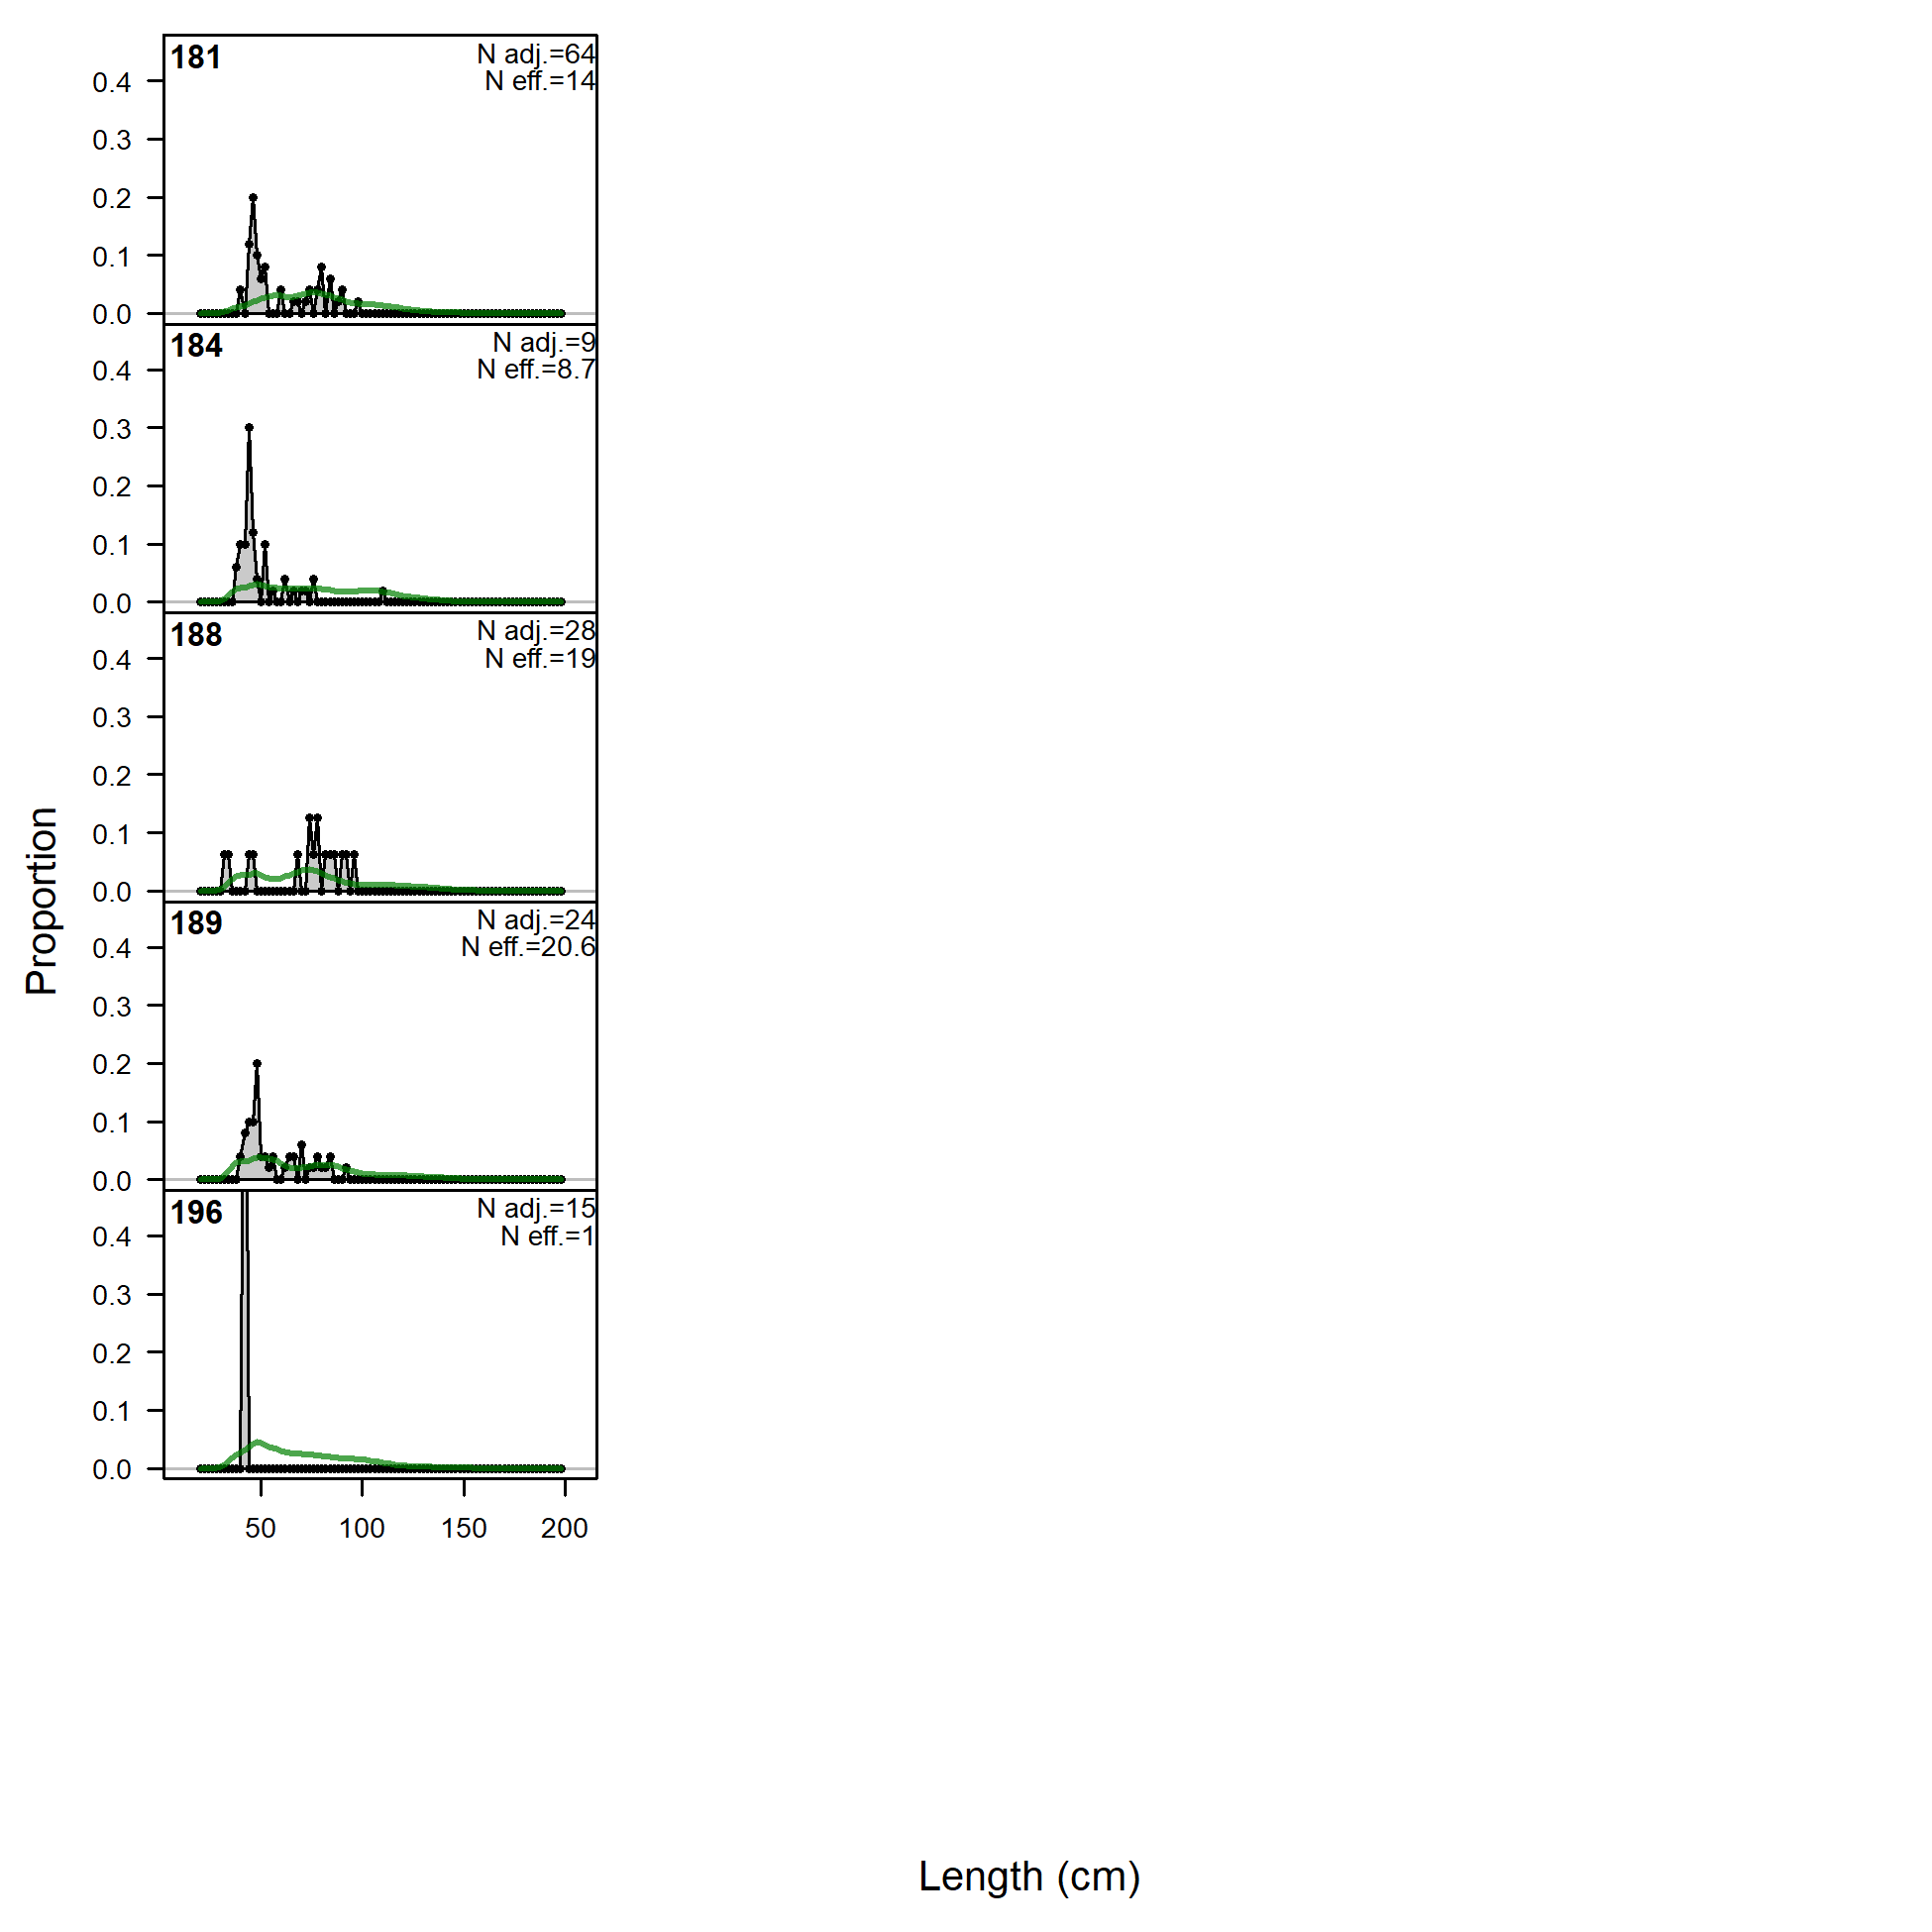
Length comps, whole catch, OBJ-A3 (plot 1 of 5).
'N adj.' is the input sample size after data-weighting adjustment. N eff. is the calculated effective sample size used in the McAllister-Ianelli tuning method. (plot 2 of 5) (plot 3 of 5)
file: comp_lenfit_flt17mkt0_page3.png
Length comps, whole catch, OBJ-A3 (plot 1 of 5).
'N adj.' is the input sample size after data-weighting adjustment. N eff. is the calculated effective sample size used in the McAllister-Ianelli tuning method. (plot 2 of 5) (plot 3 of 5) (plot 4 of 5)
file: comp_lenfit_flt17mkt0_page4.png
Length comps, whole catch, OBJ-A3 (plot 1 of 5).
'N adj.' is the input sample size after data-weighting adjustment. N eff. is the calculated effective sample size used in the McAllister-Ianelli tuning method. (plot 2 of 5) (plot 3 of 5) (plot 4 of 5) (plot 5 of 5)
file: comp_lenfit_flt17mkt0_page5.png
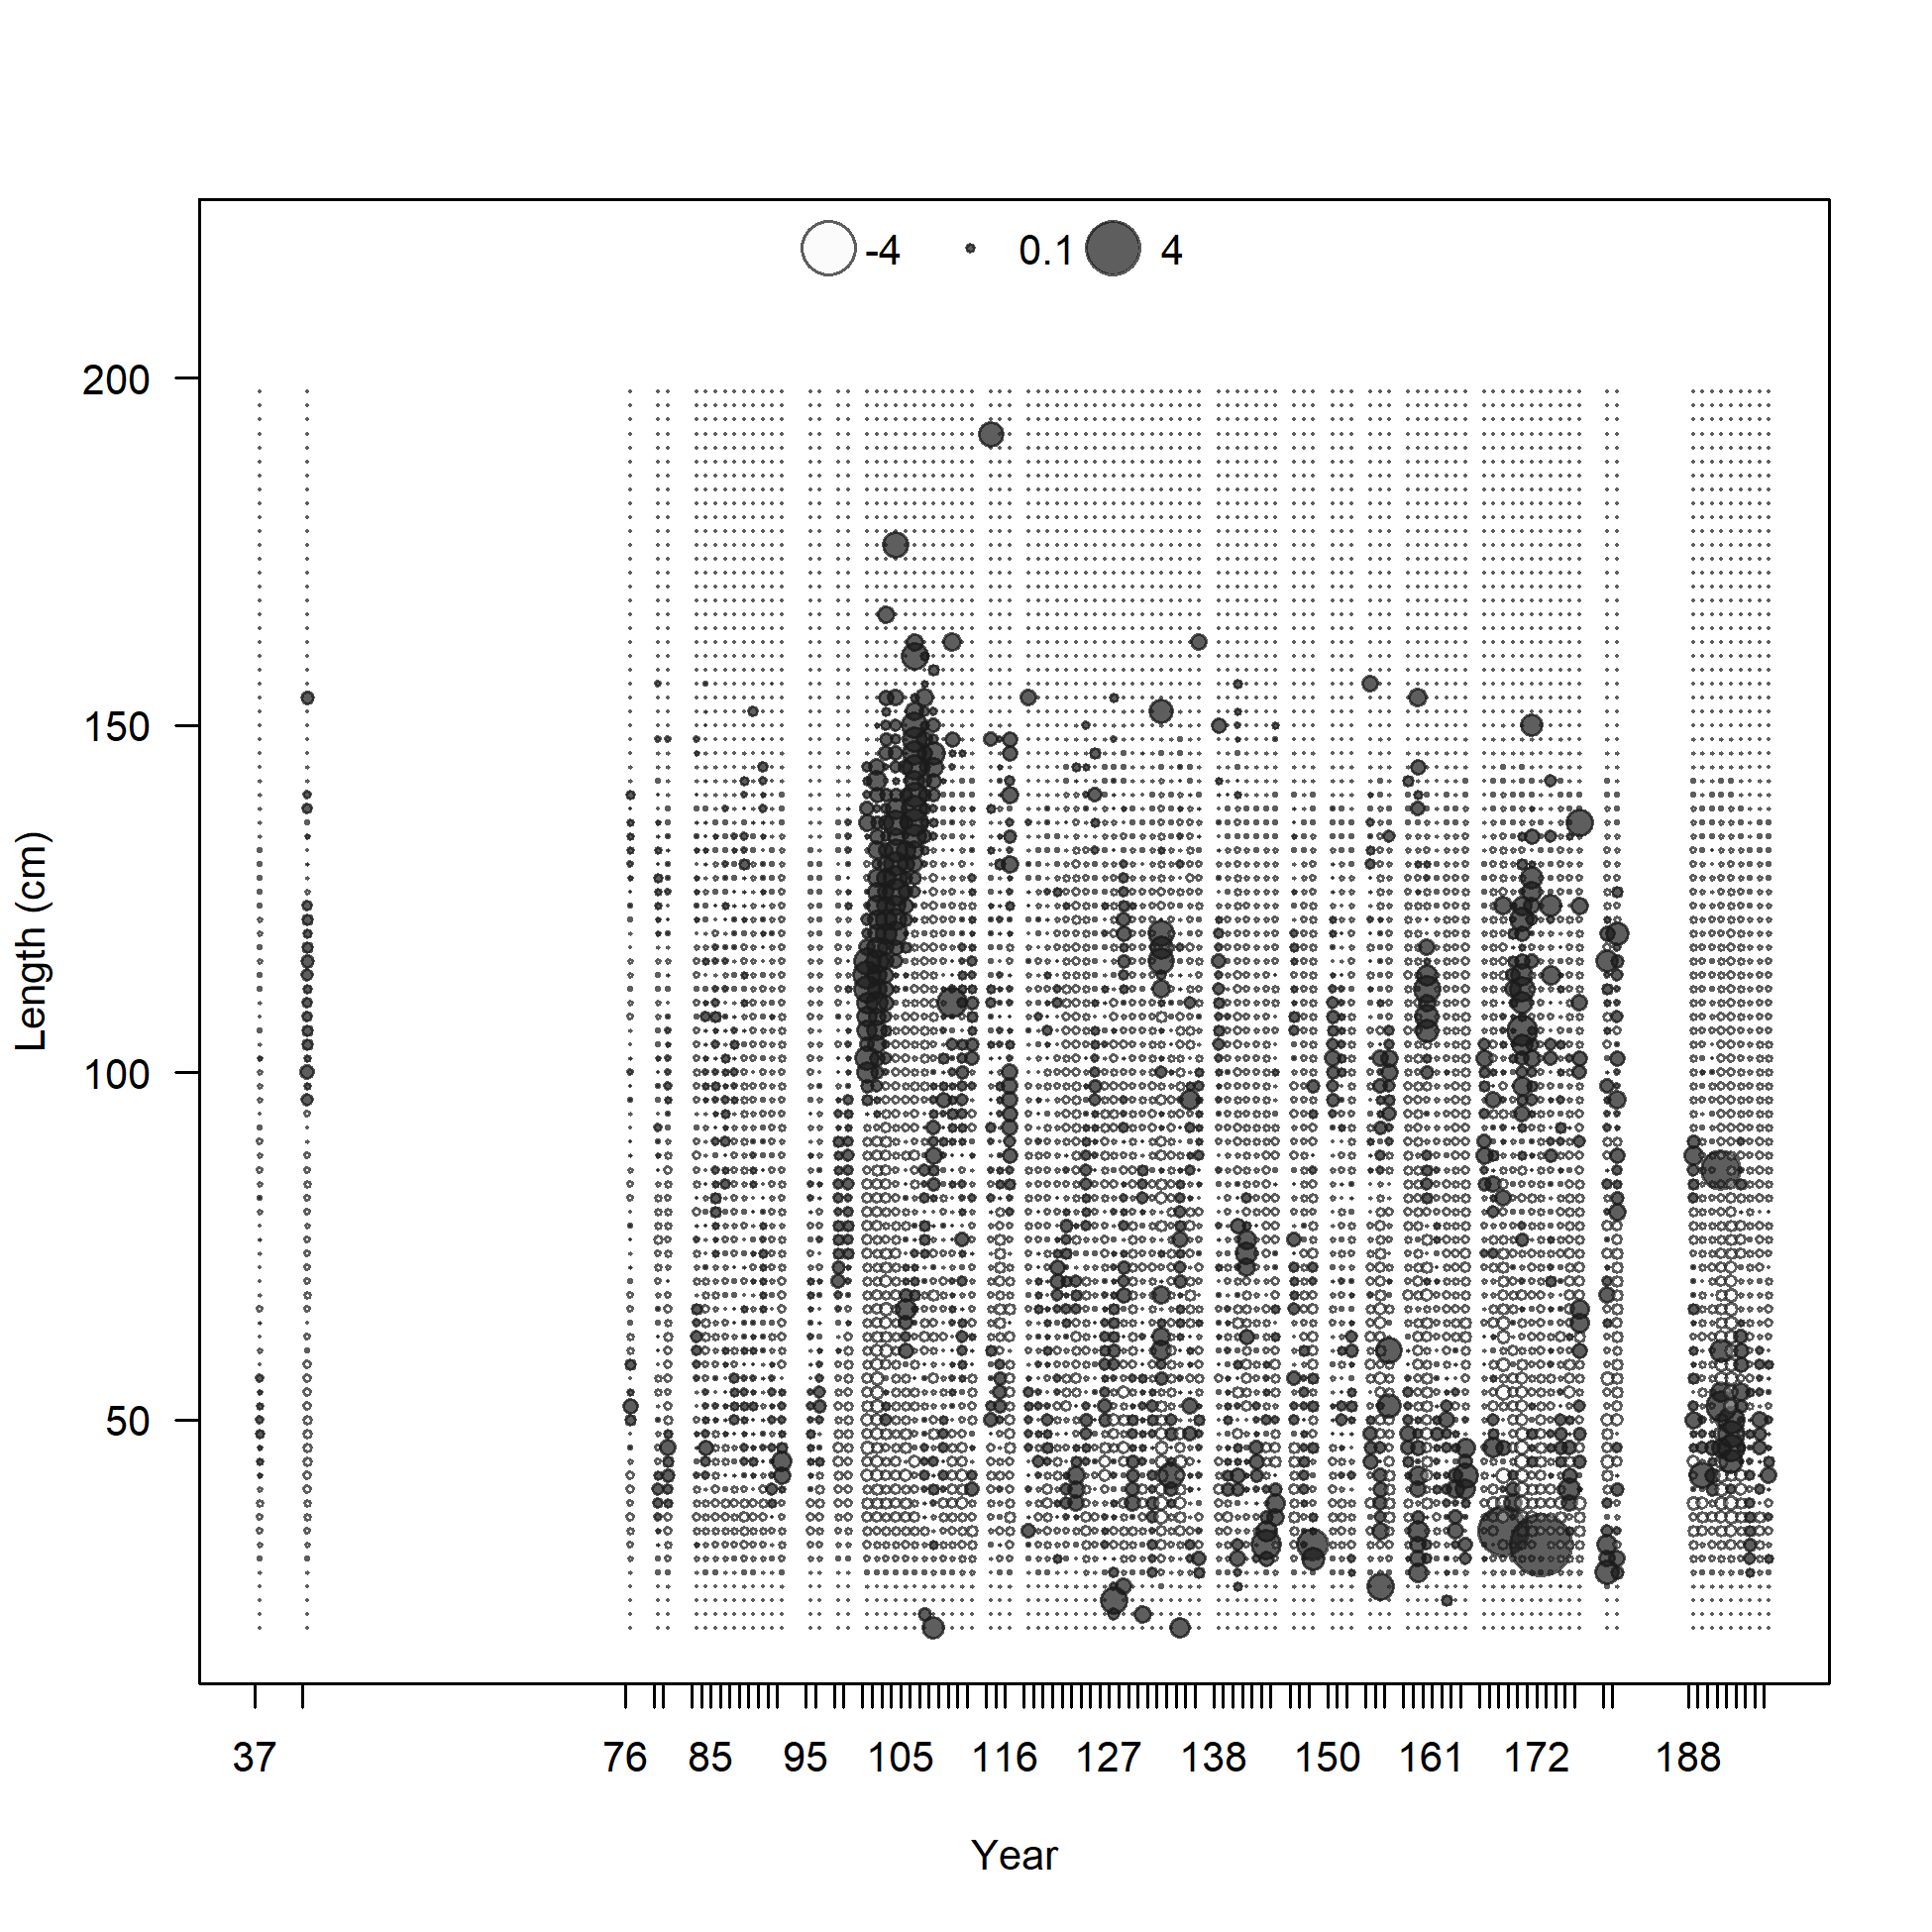
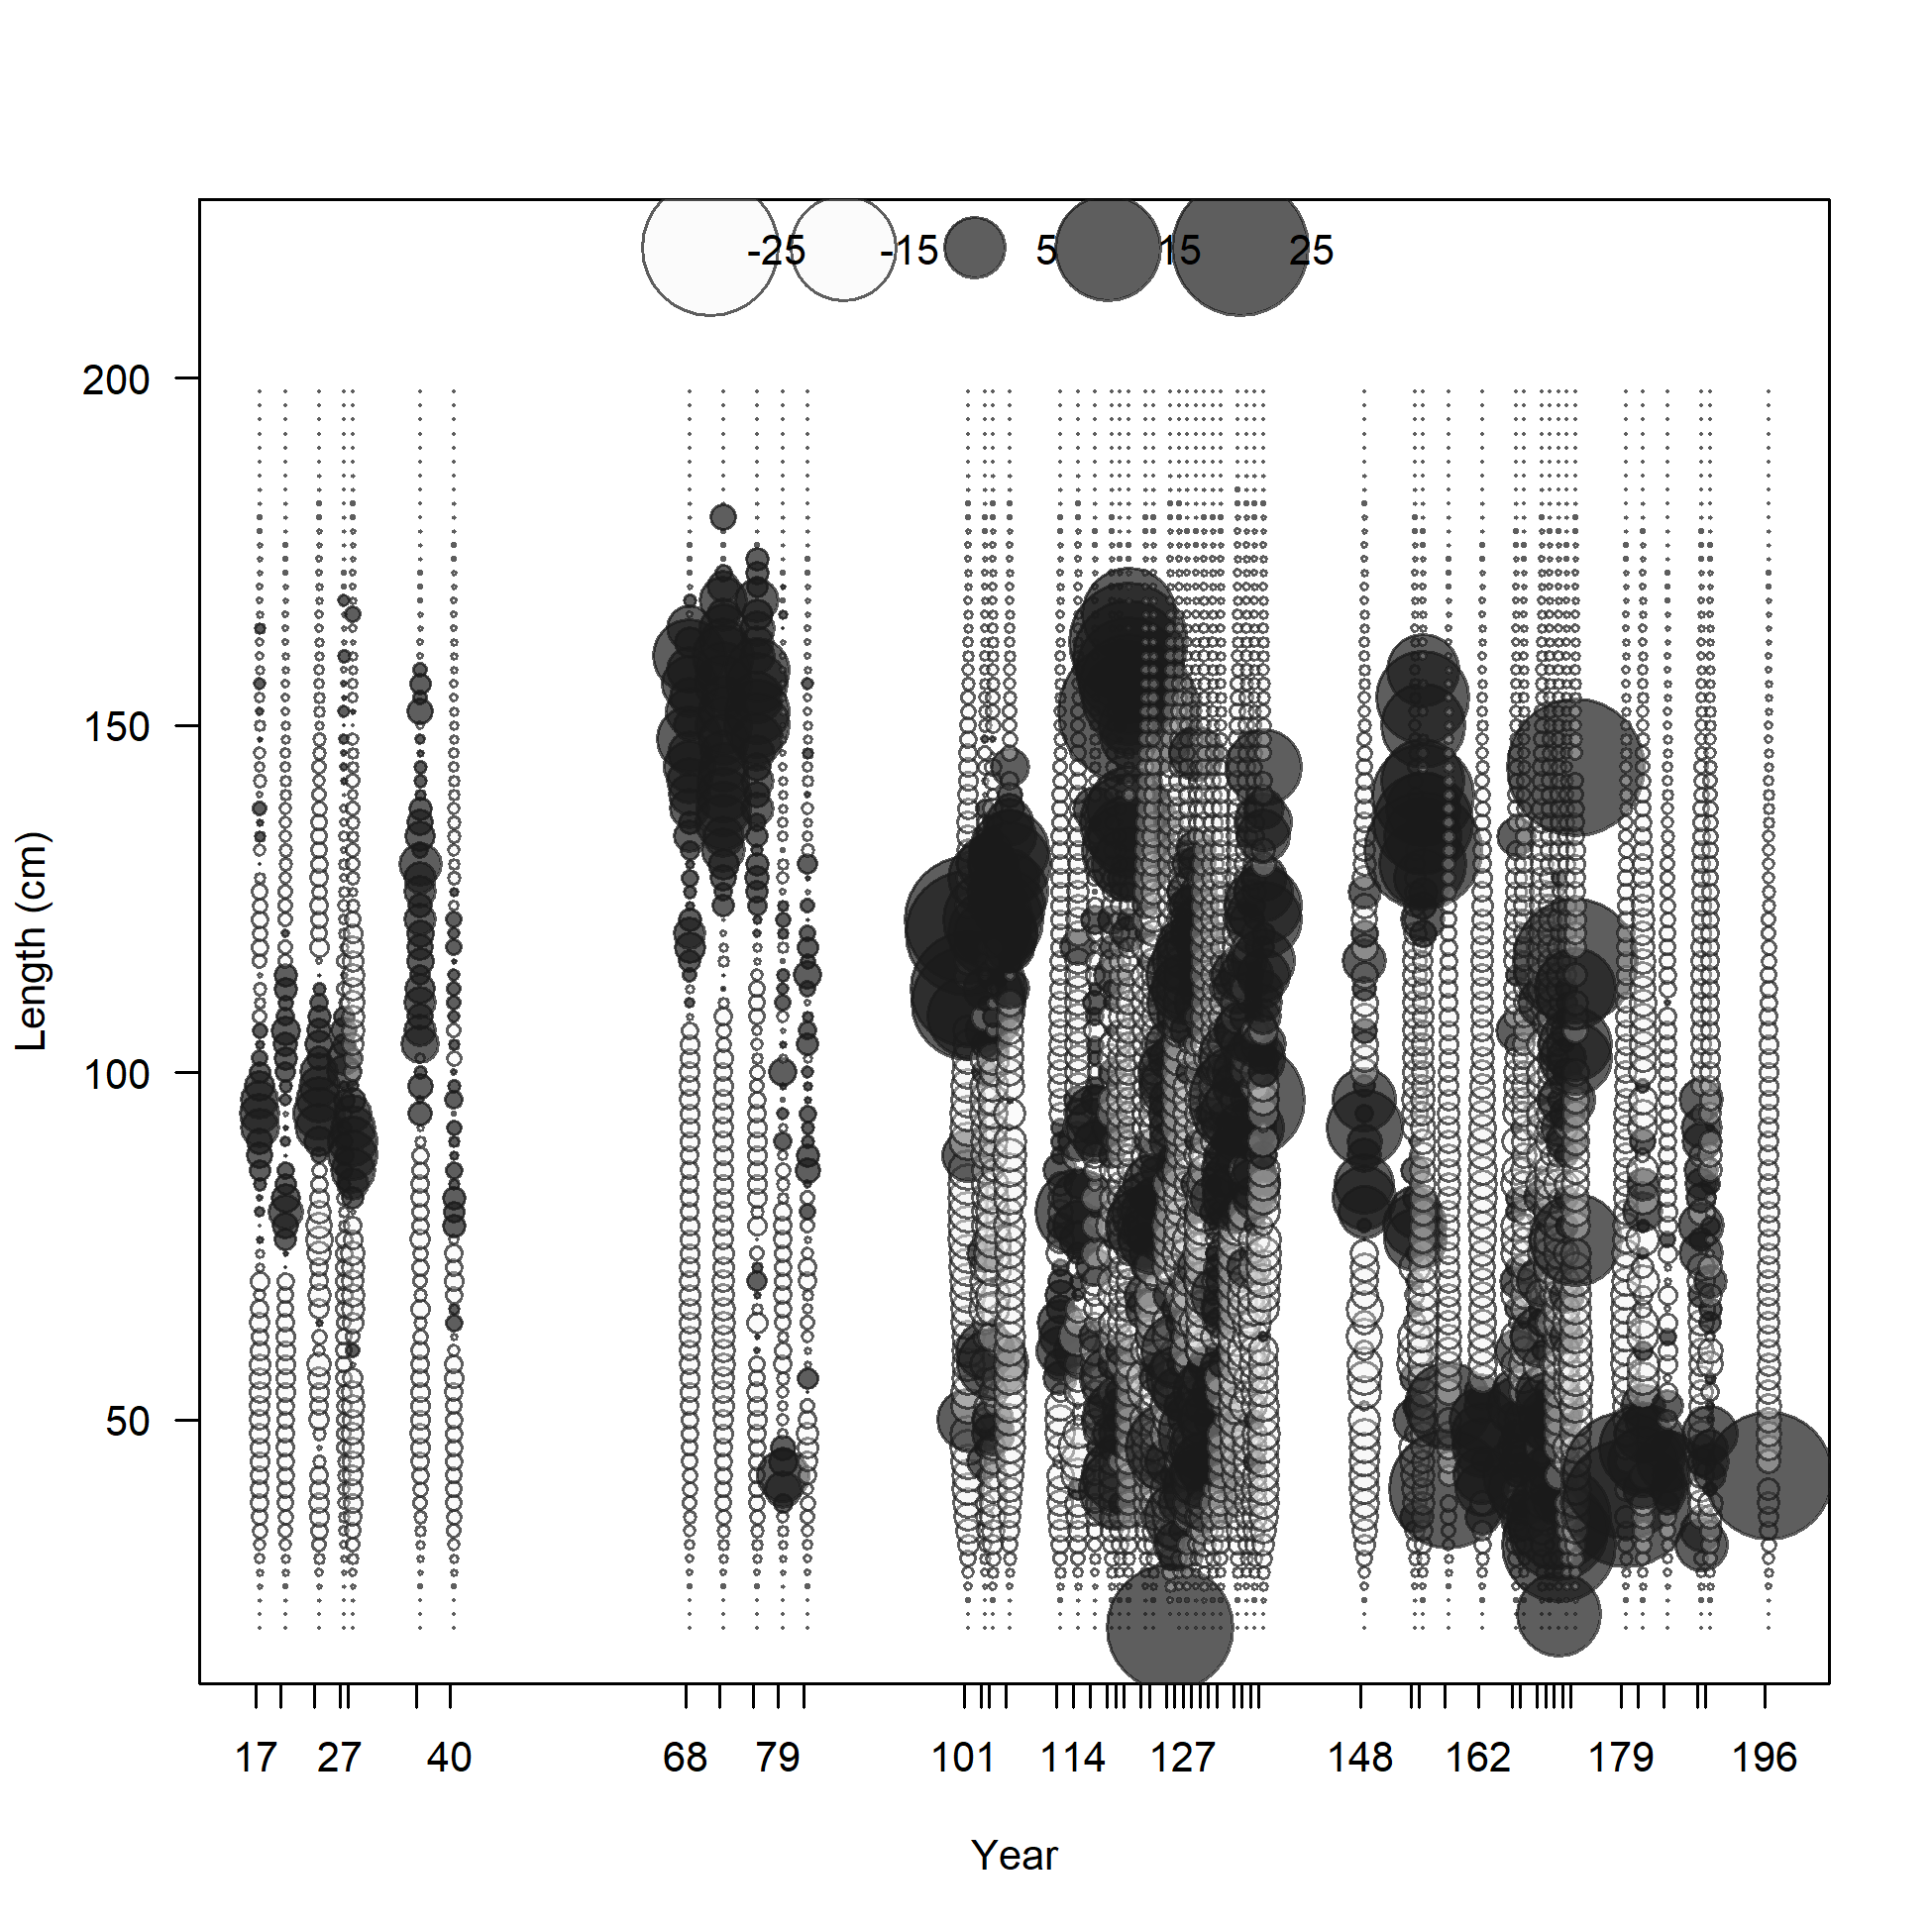
Pearson residuals, whole catch, OBJ-A3 (max=5.25) (plot 5 of 5)
Closed bubbles are positive residuals (observed > expected) and open bubbles are negative residuals (observed < expected).
file: comp_lenfit_residsflt17mkt0_page5.png
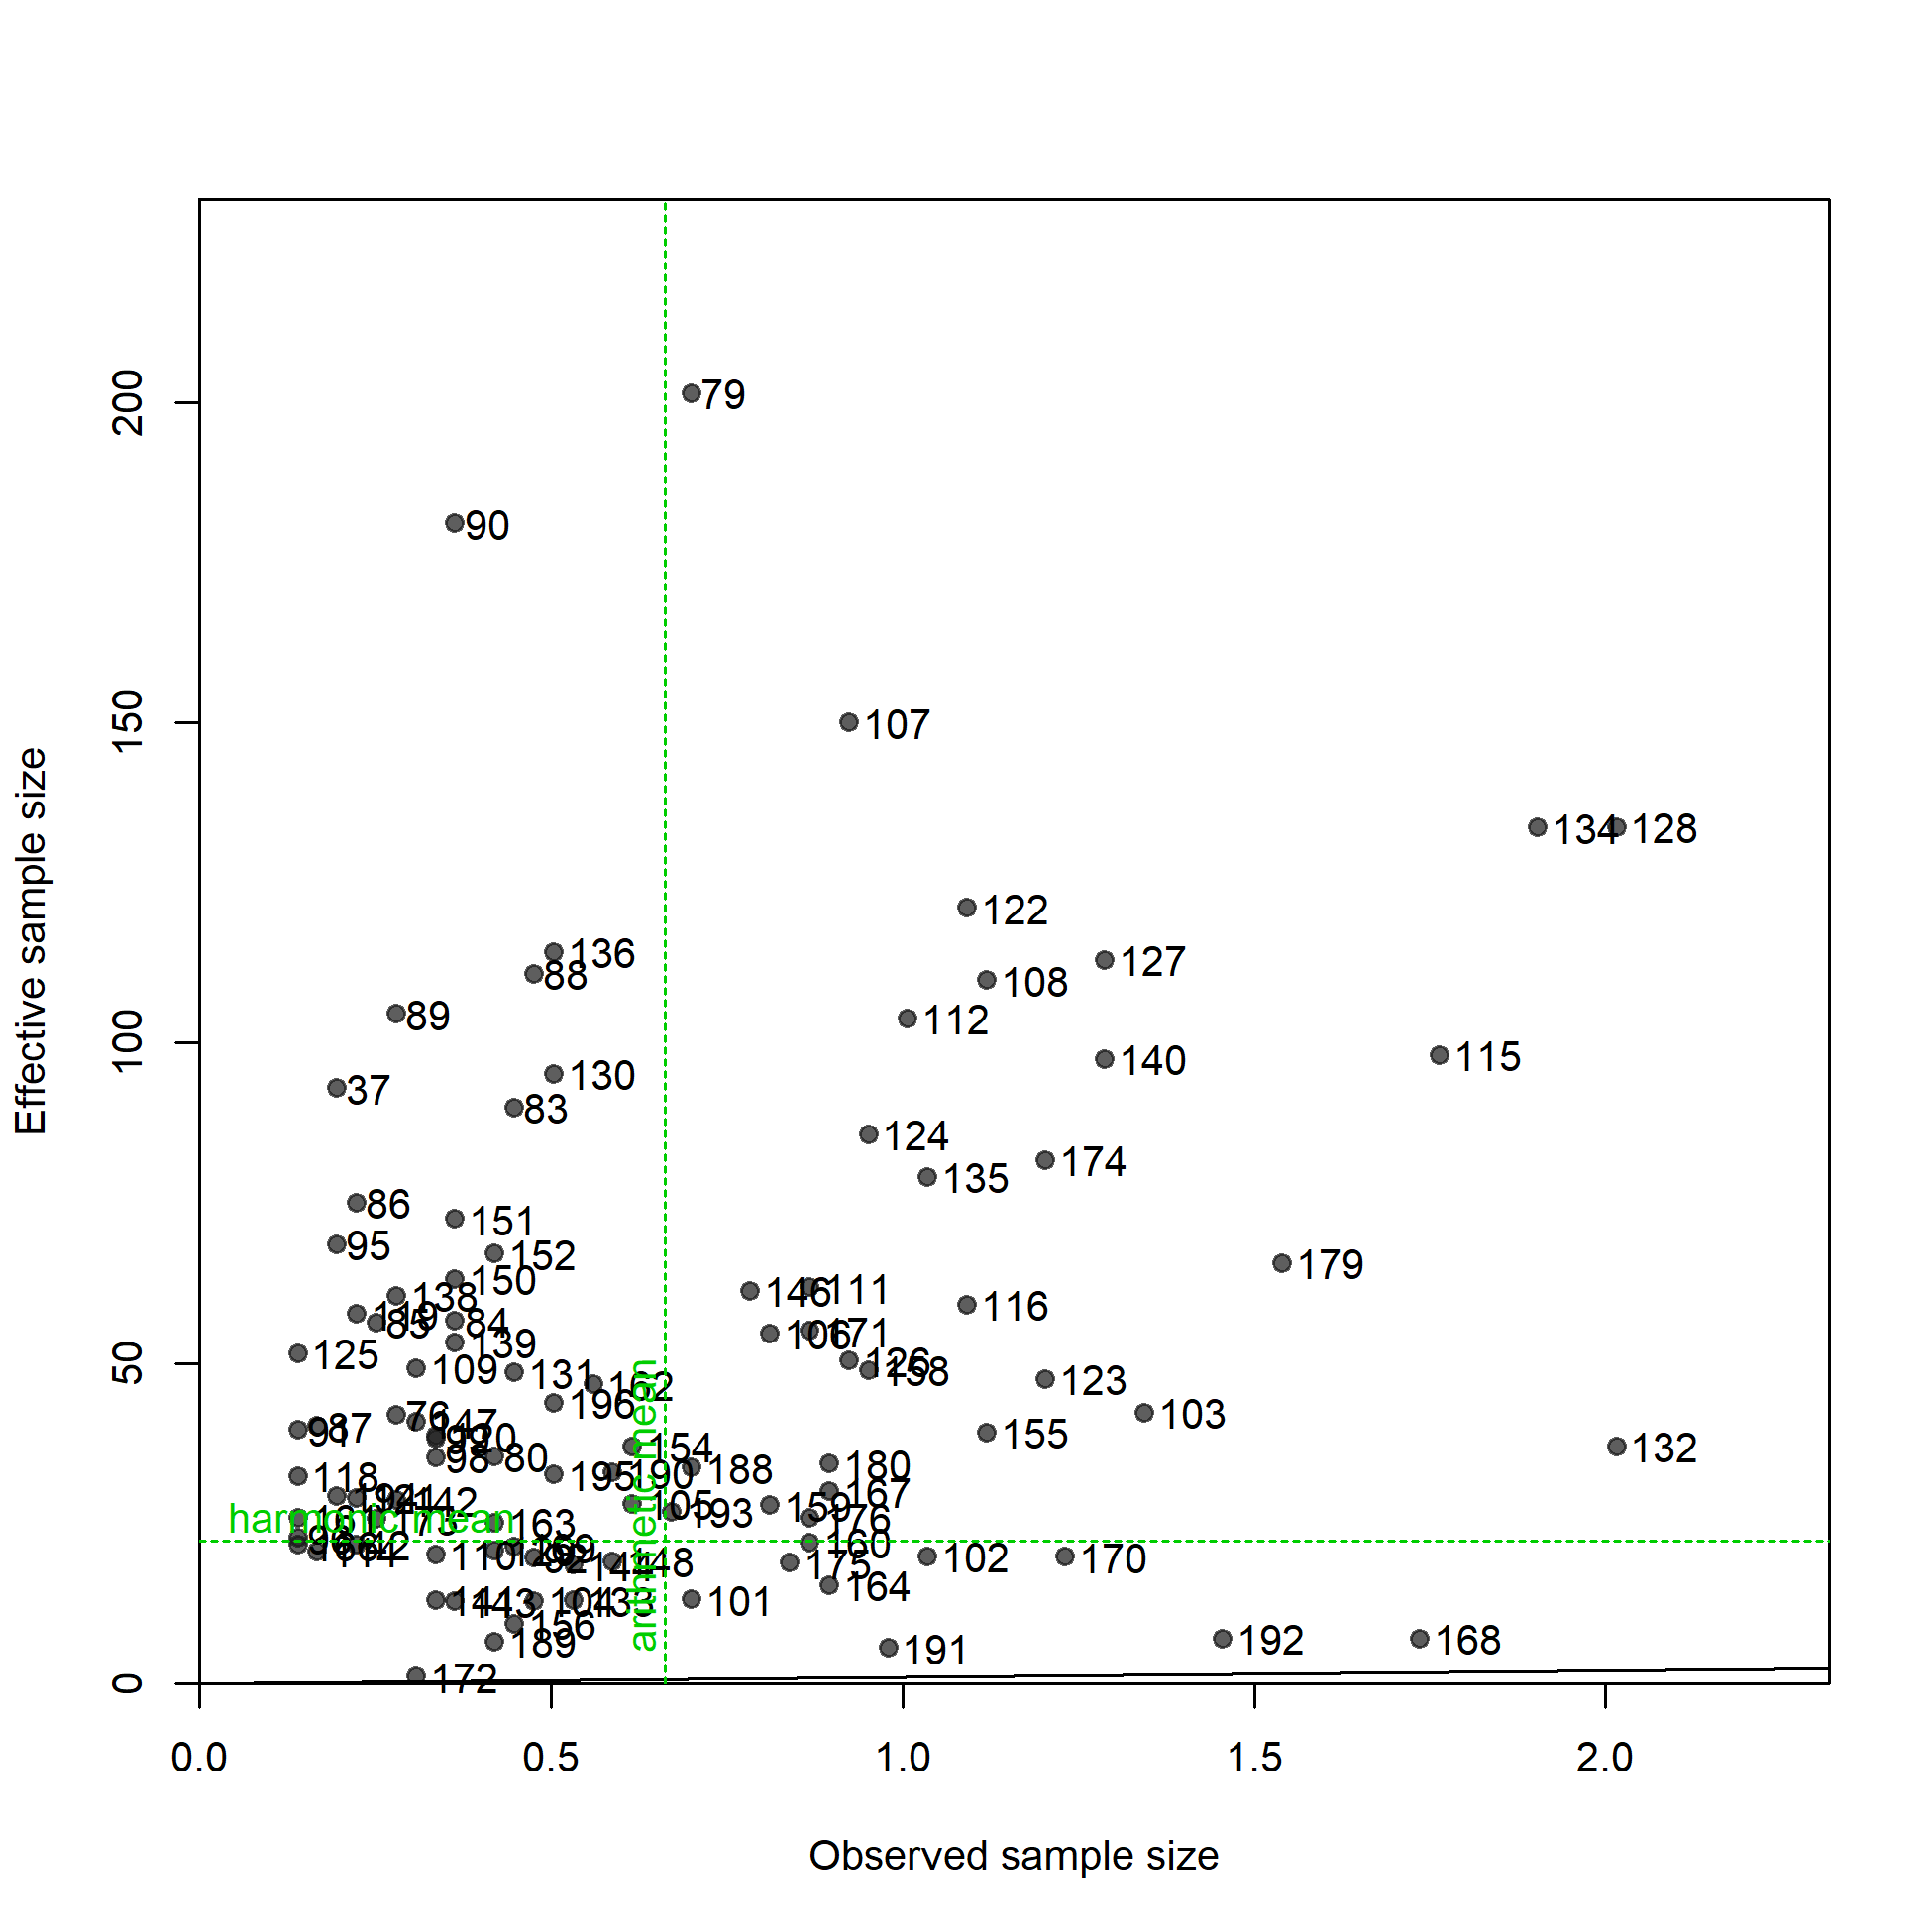
N-EffN comparison, Length comps, whole catch, OBJ-A3
file: comp_lenfit_sampsize_flt17mkt0.png
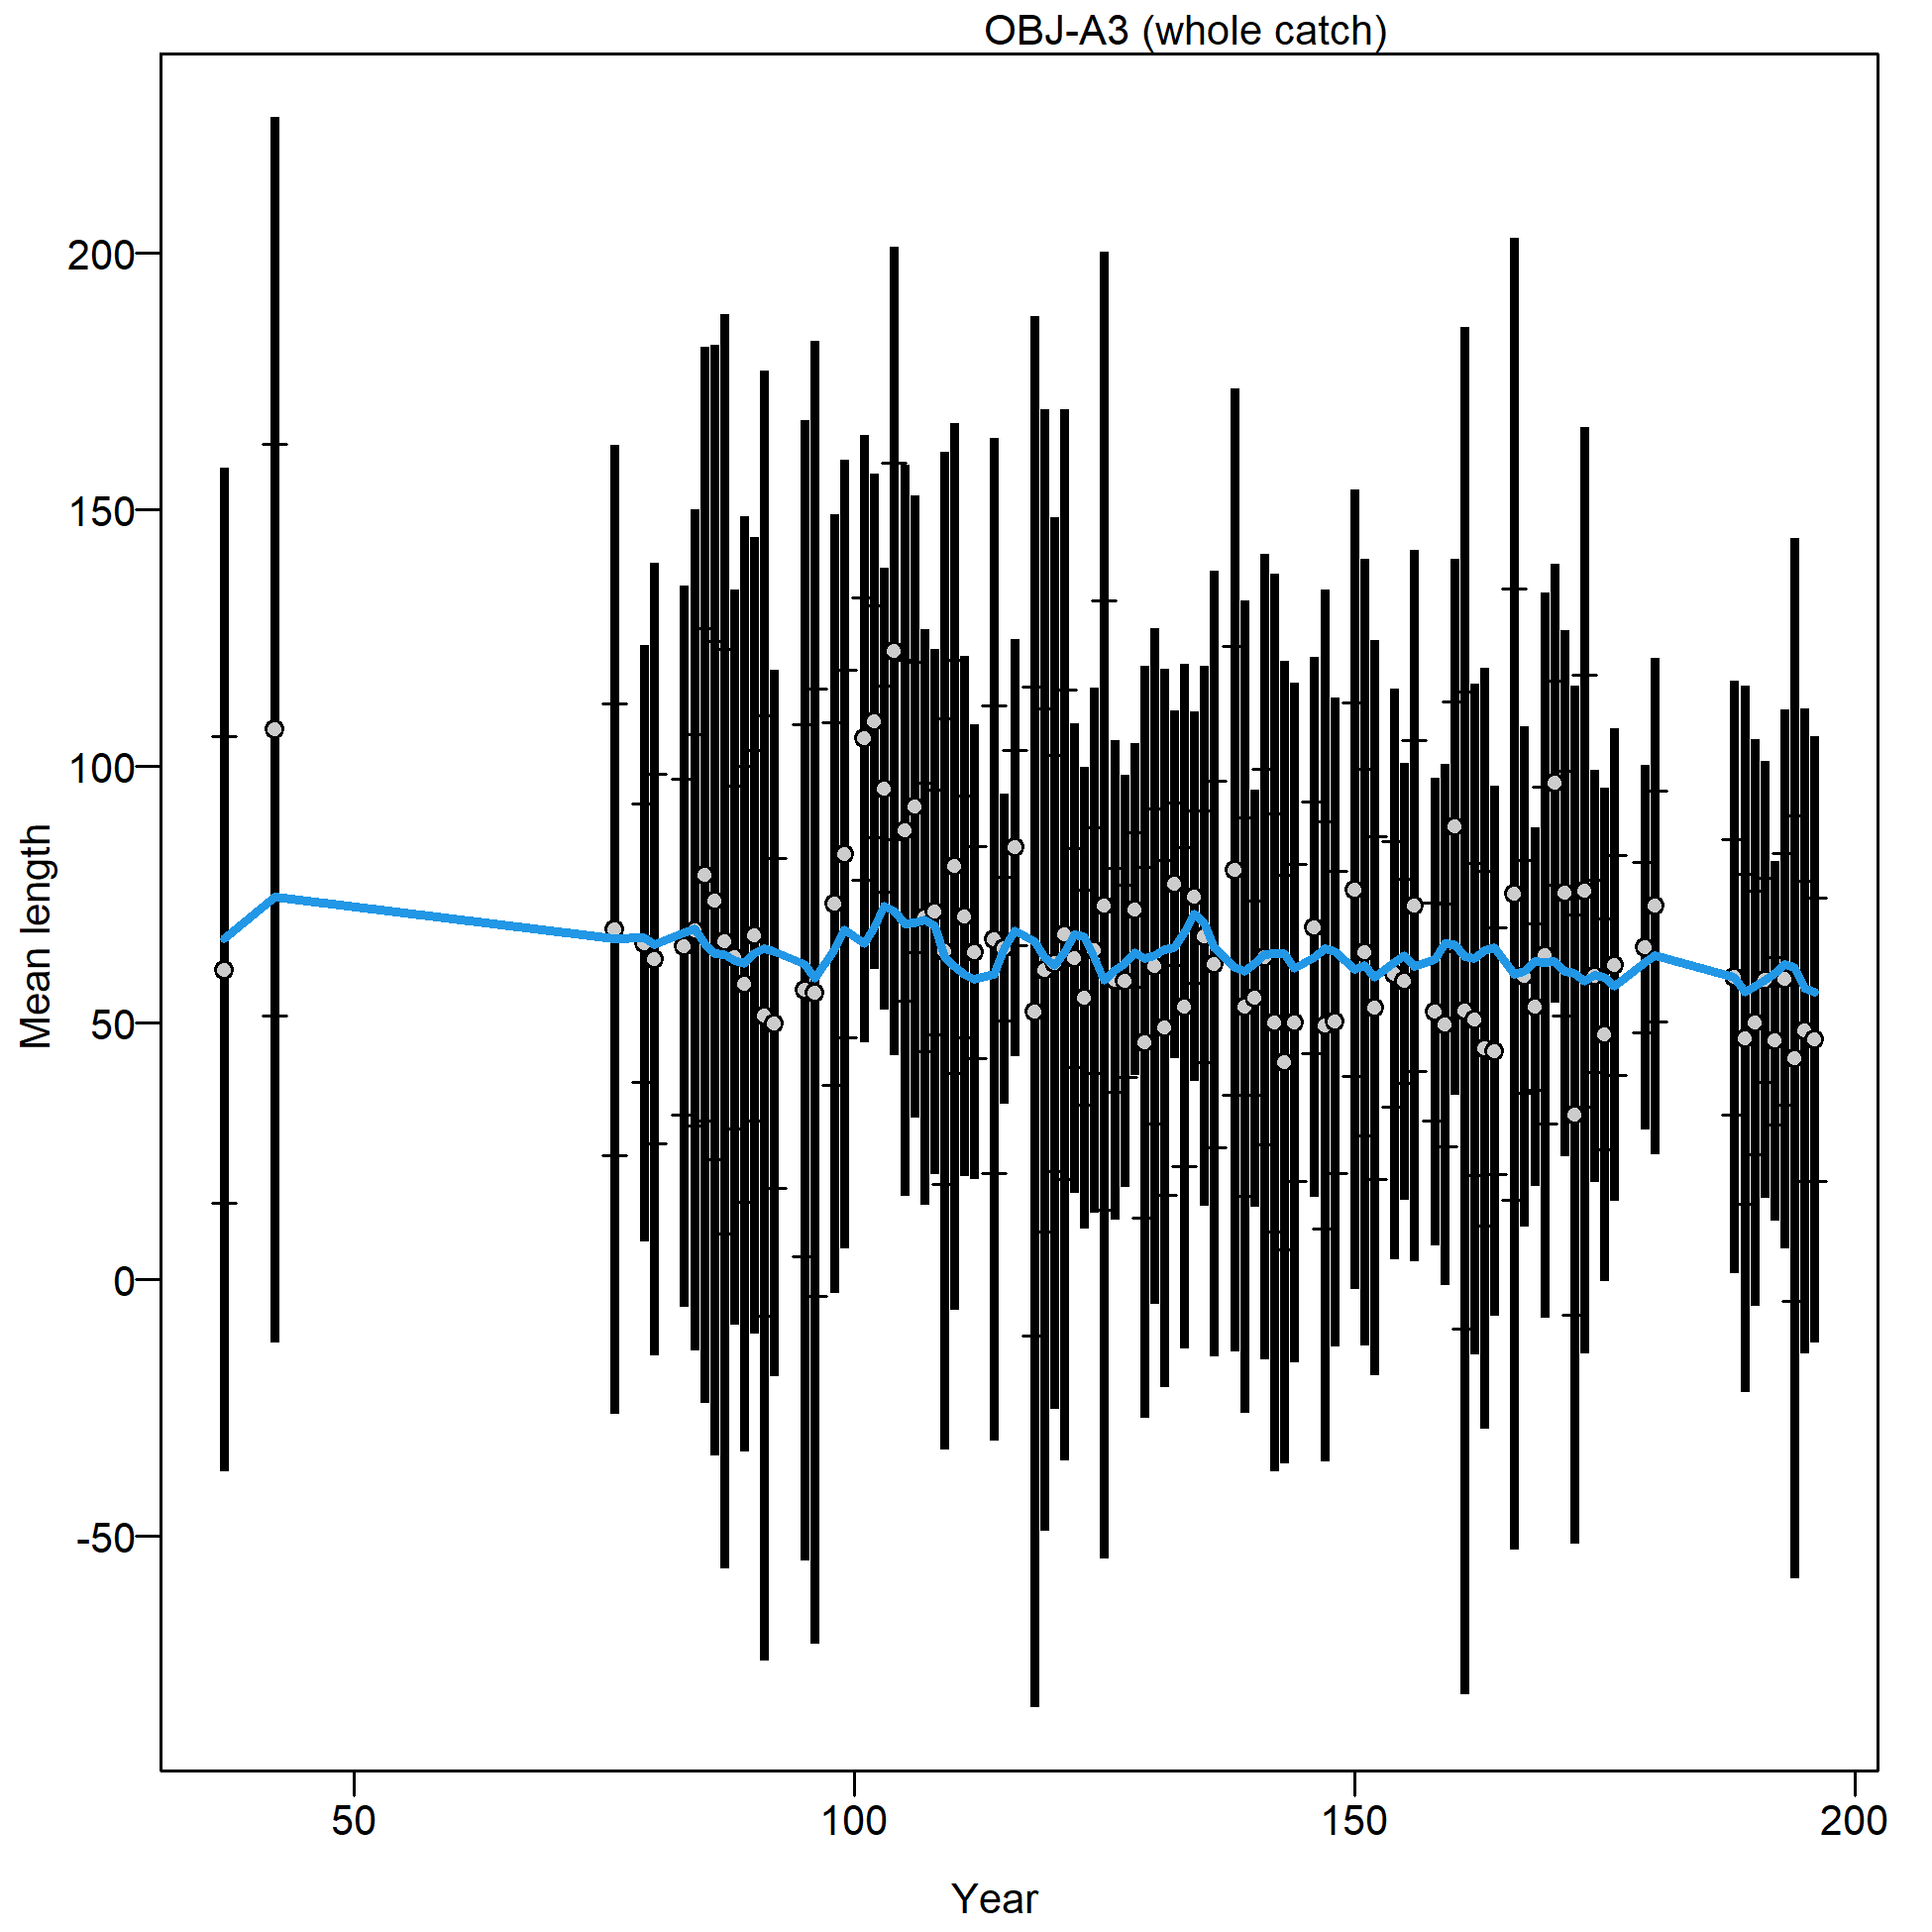
Mean length for OBJ-A3 with 95% confidence intervals based on current sample sizes.
Francis data weighting method TA1.8: thinner intervals (with capped ends) show result of further adjusting sample sizes based on suggested multiplier (with 95% interval) for len data from OBJ-A3:
4.6033 (3.2786-7.3323)
For more info, see Francis (2011).
file: comp_lenfit_data_weighting_TA1.8_OBJ-A3.png
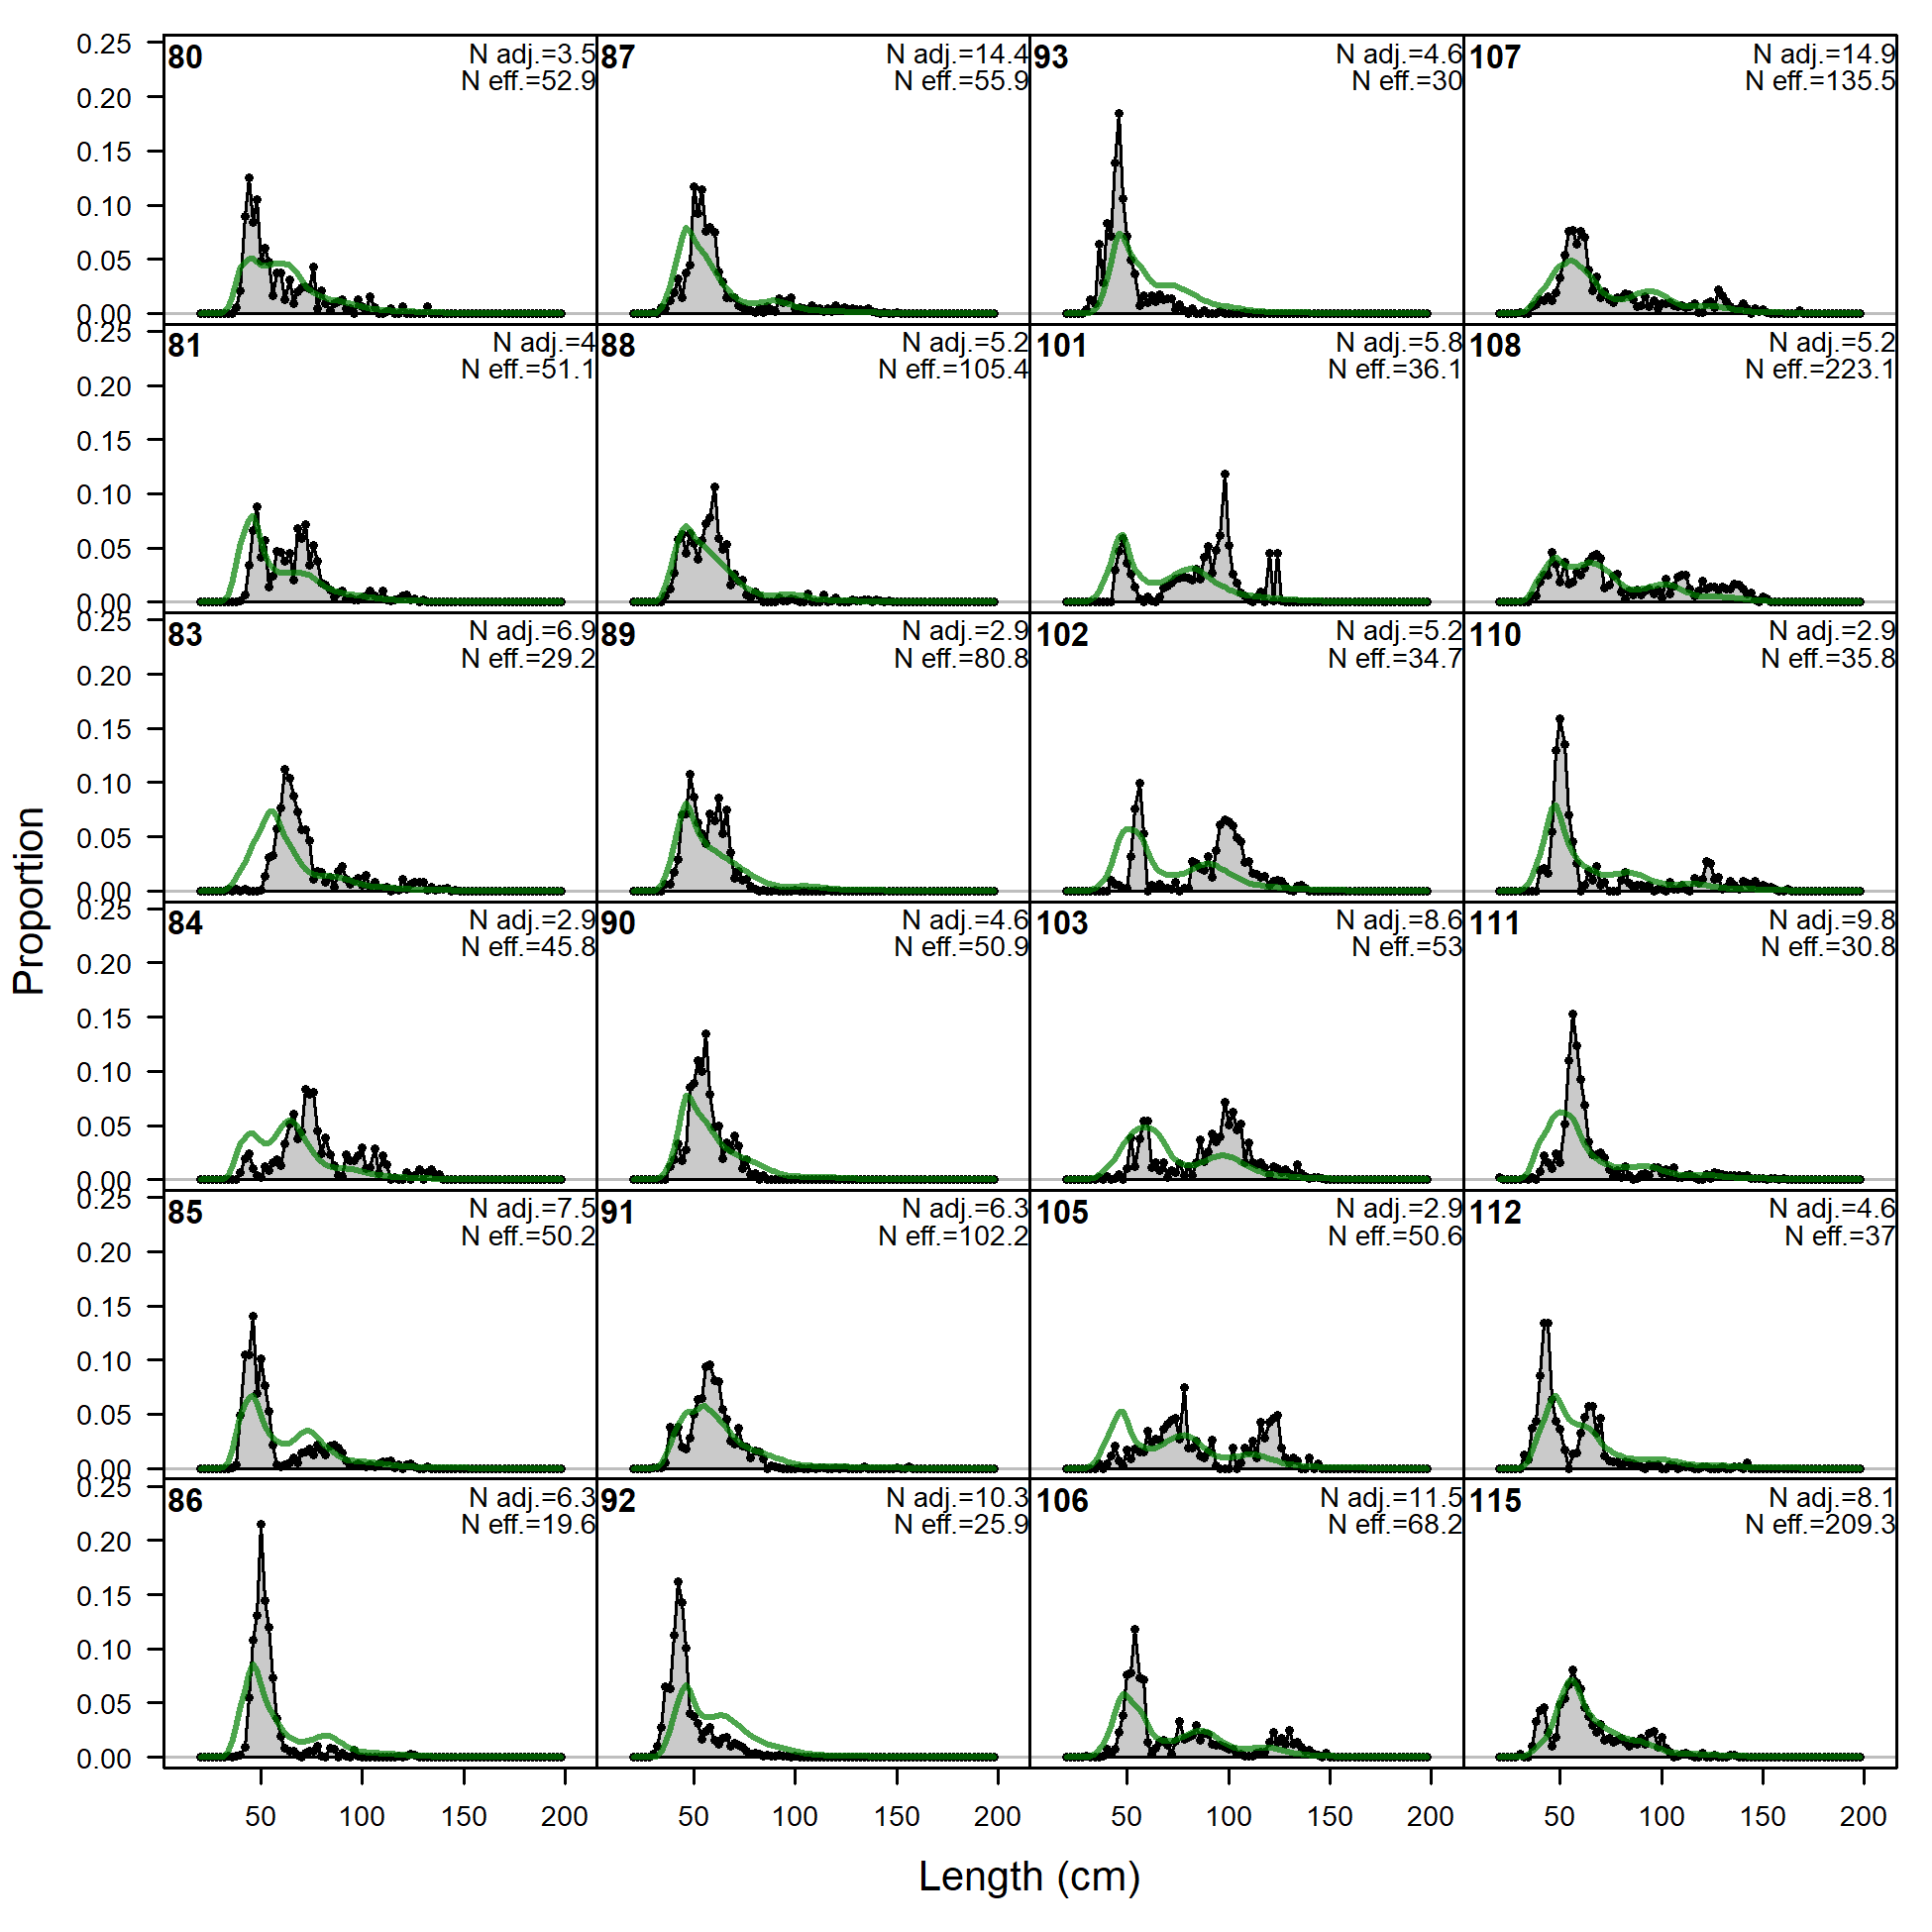
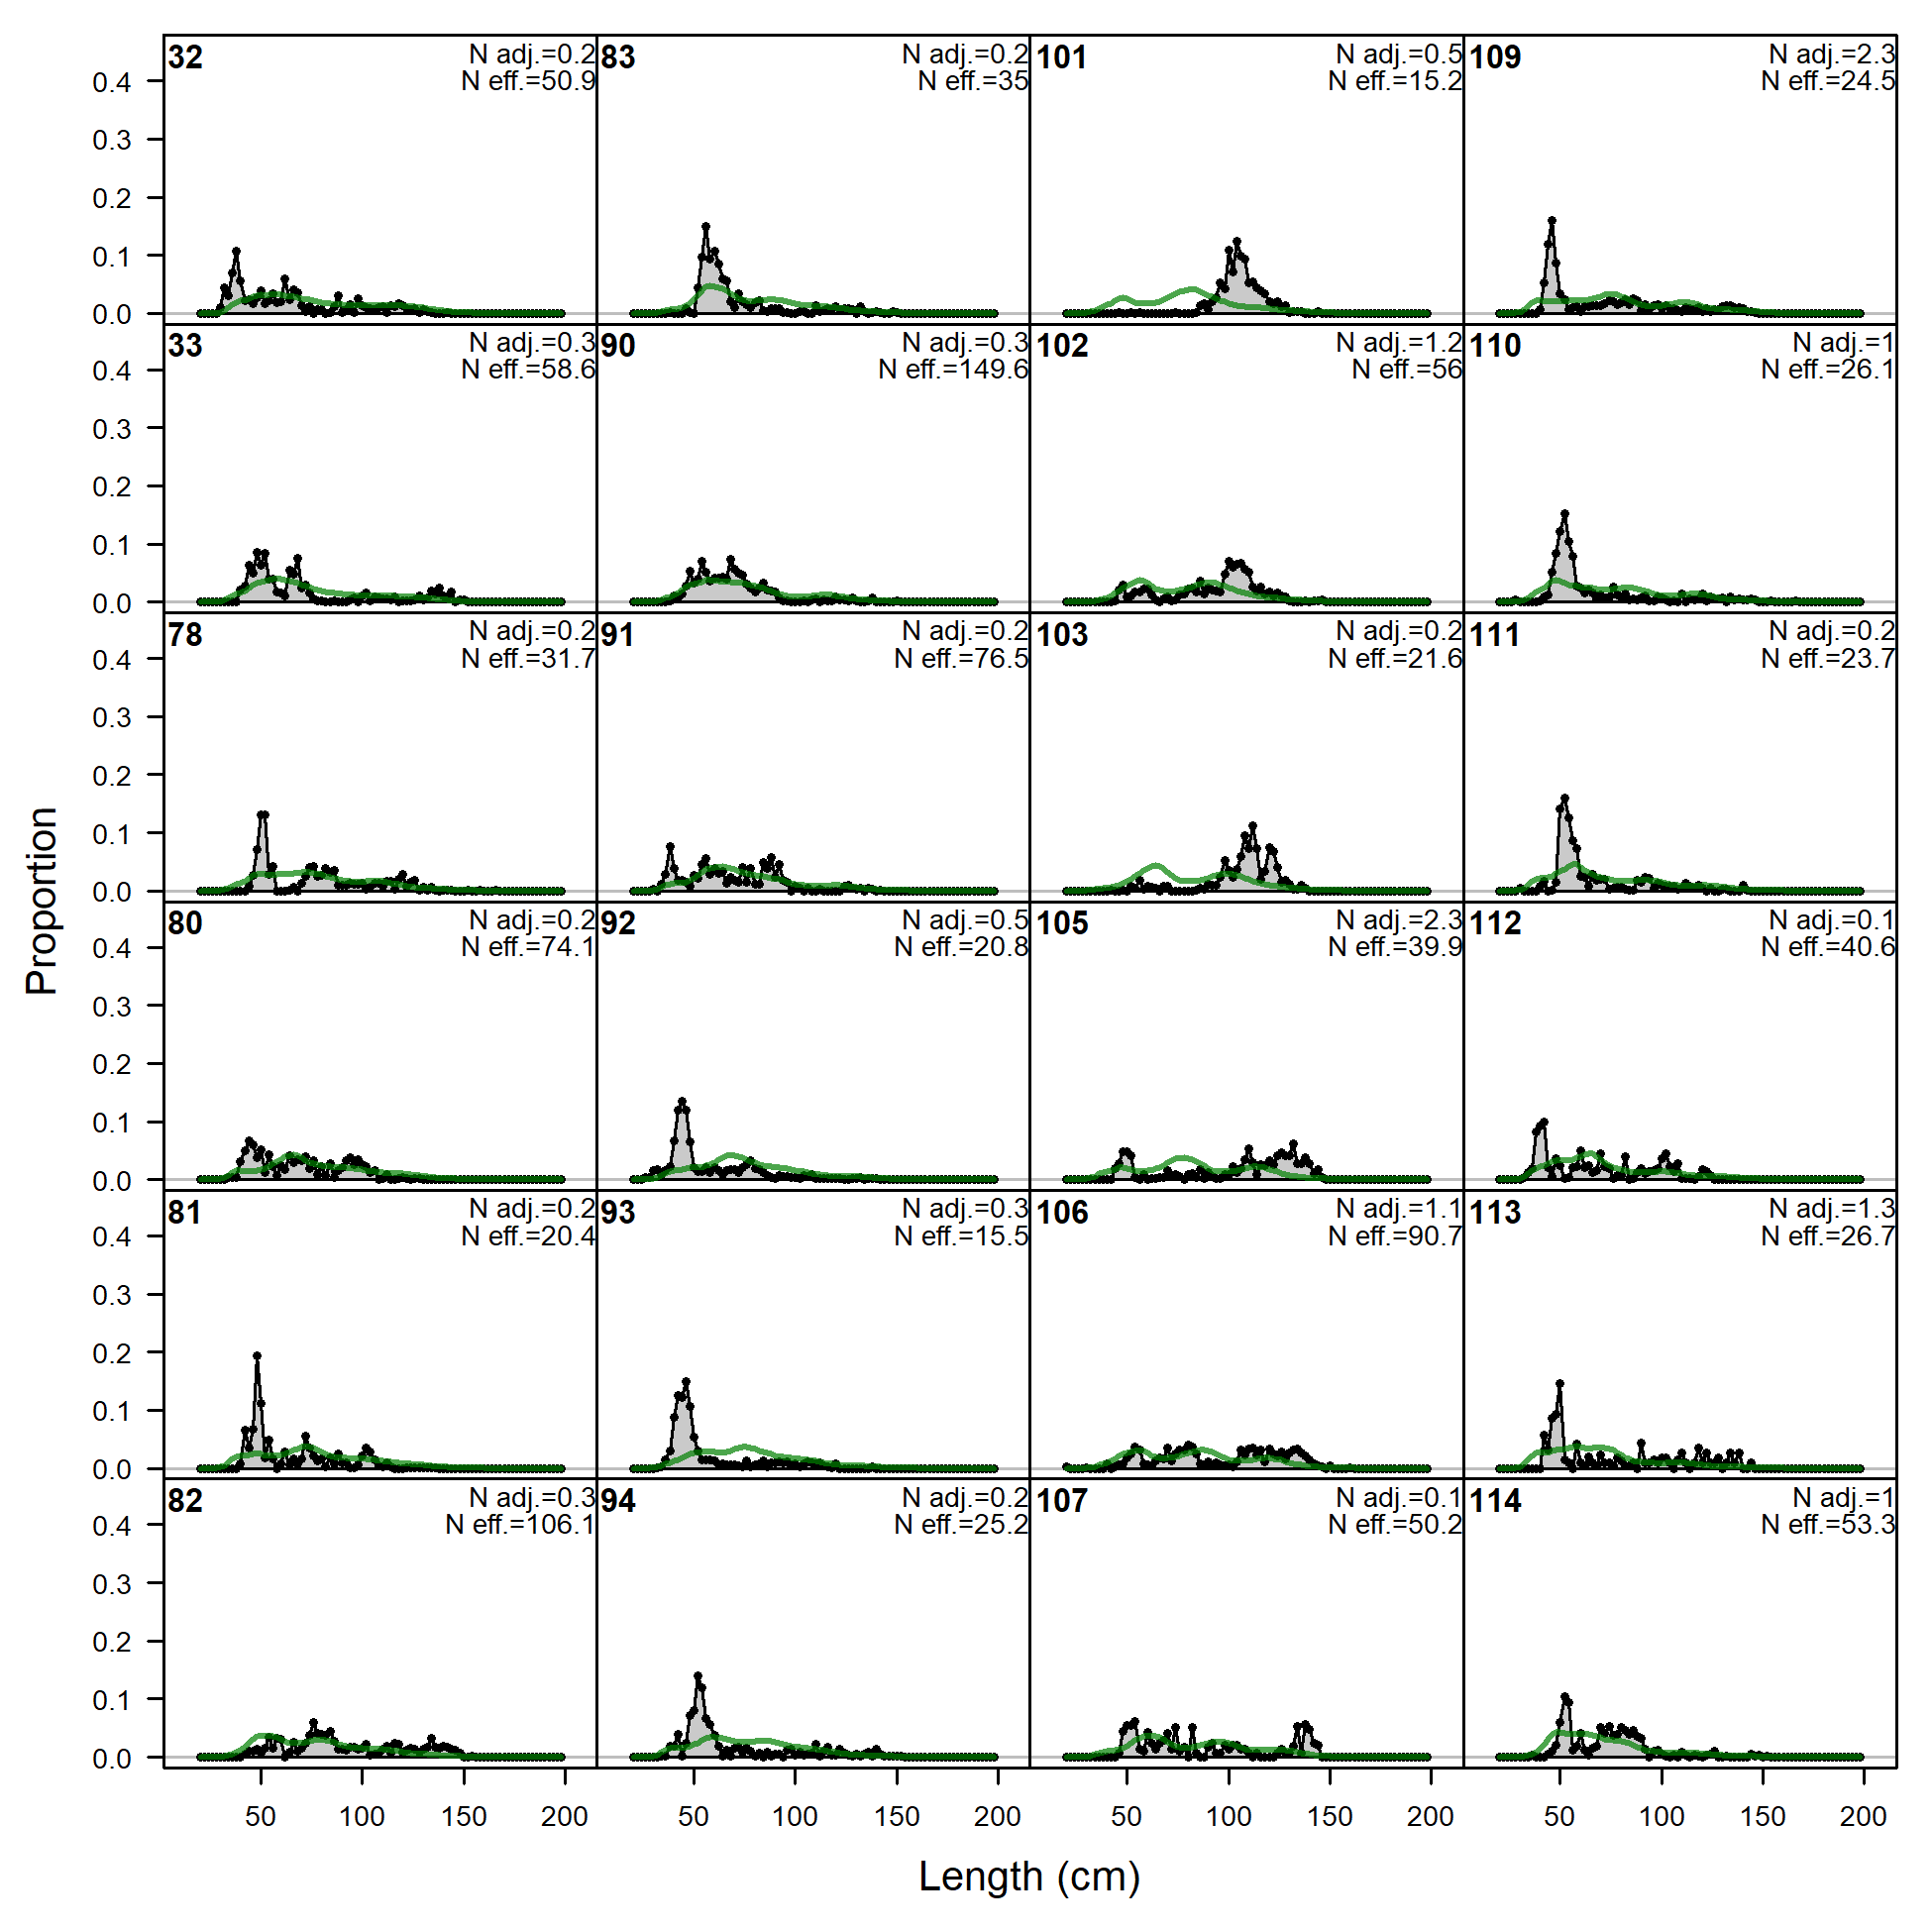
Length comps, whole catch, OBJ-A4 (plot 1 of 4).
'N adj.' is the input sample size after data-weighting adjustment. N eff. is the calculated effective sample size used in the McAllister-Ianelli tuning method.
file: comp_lenfit_flt18mkt0_page1.png
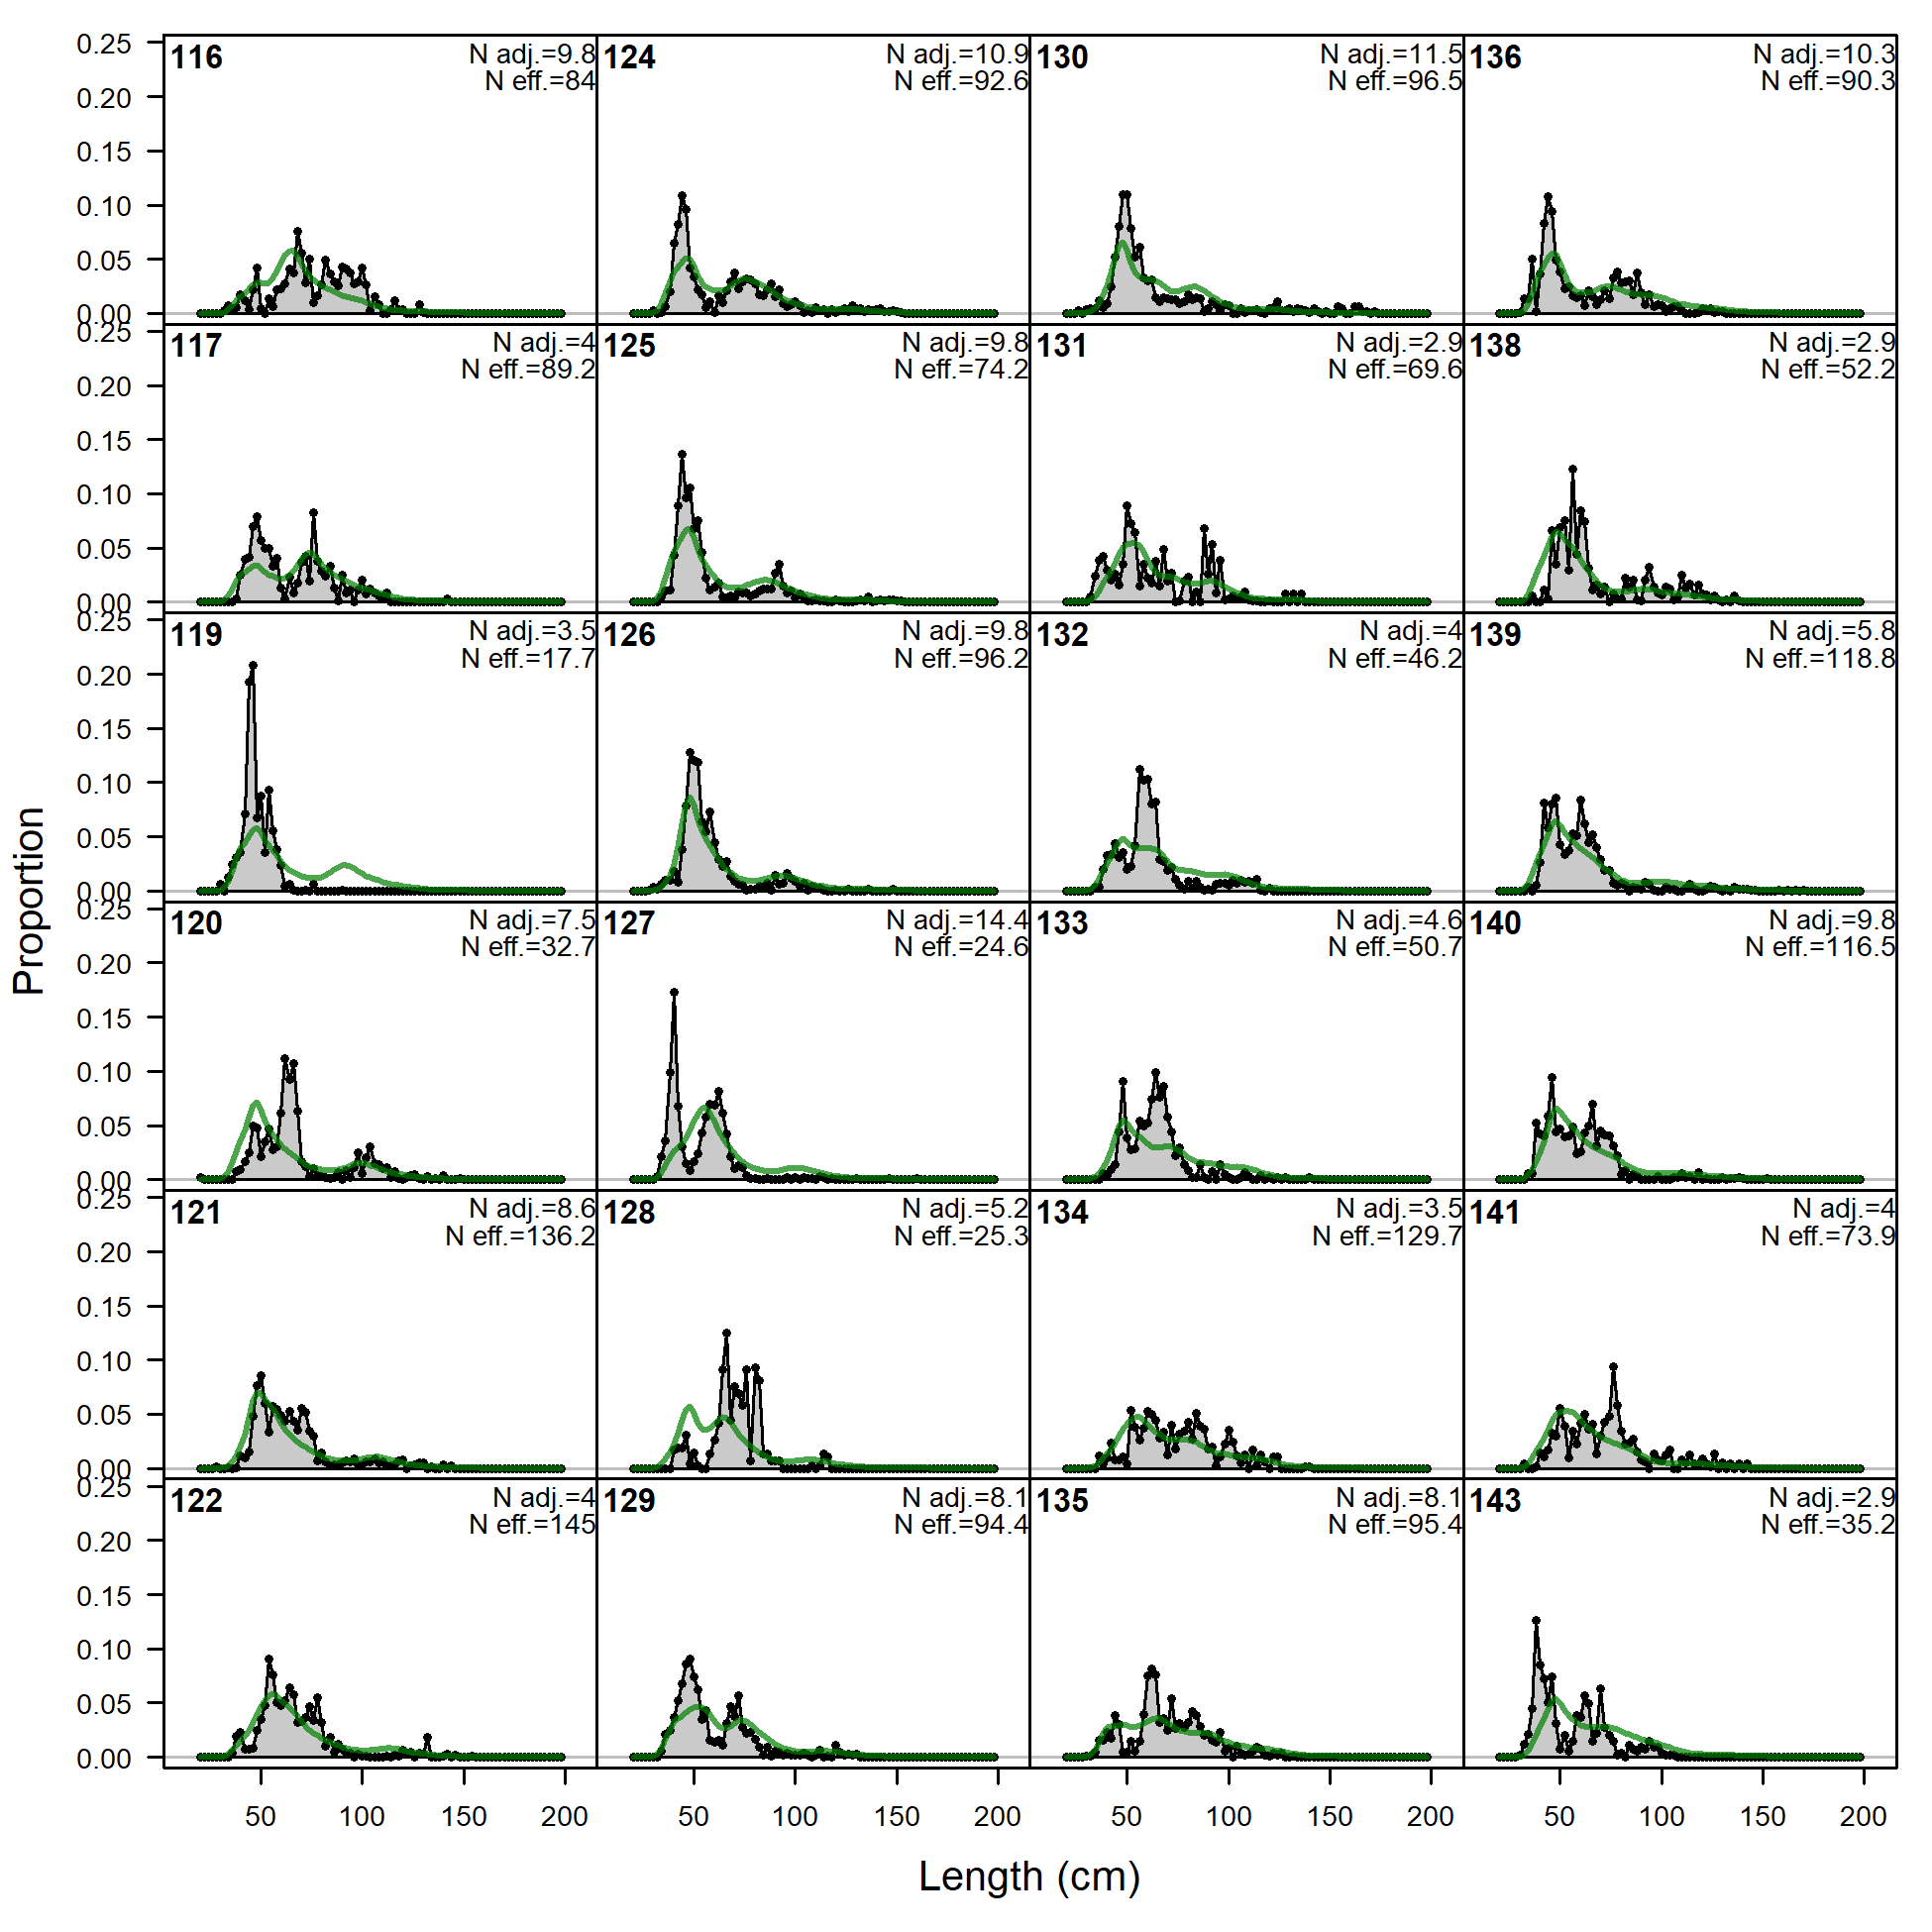
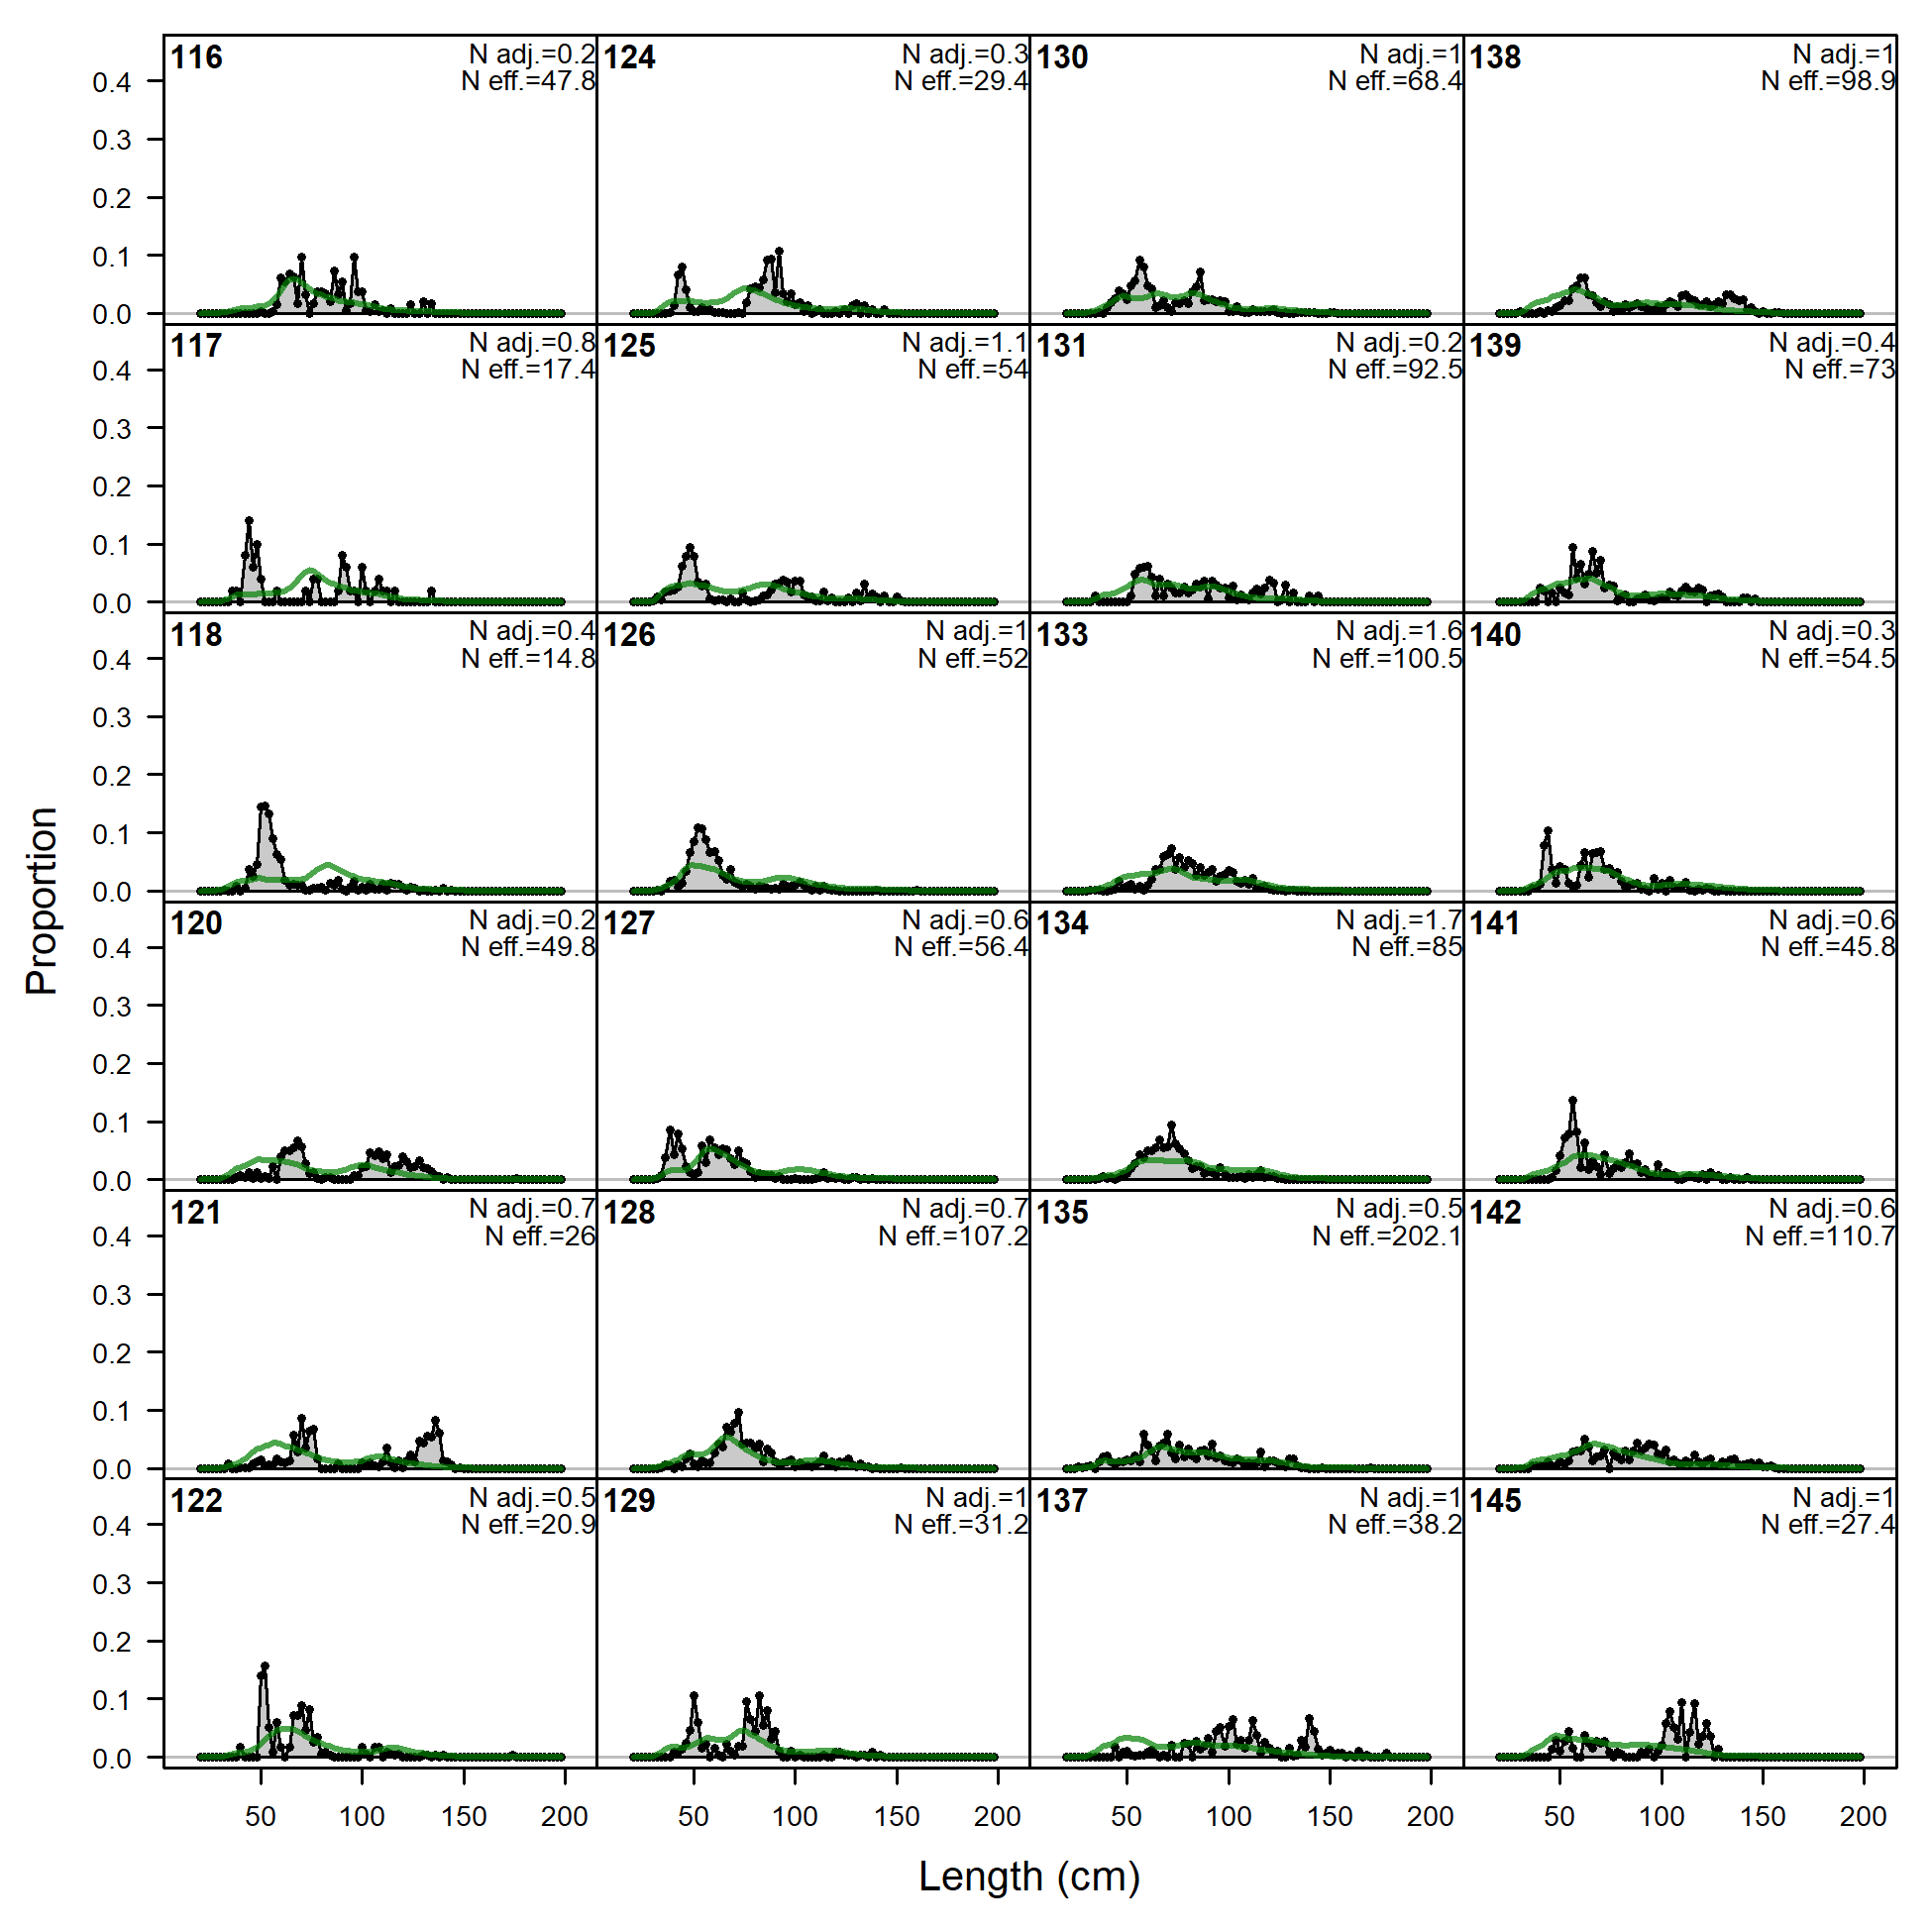
Length comps, whole catch, OBJ-A4 (plot 1 of 4).
'N adj.' is the input sample size after data-weighting adjustment. N eff. is the calculated effective sample size used in the McAllister-Ianelli tuning method. (plot 2 of 4)
file: comp_lenfit_flt18mkt0_page2.png

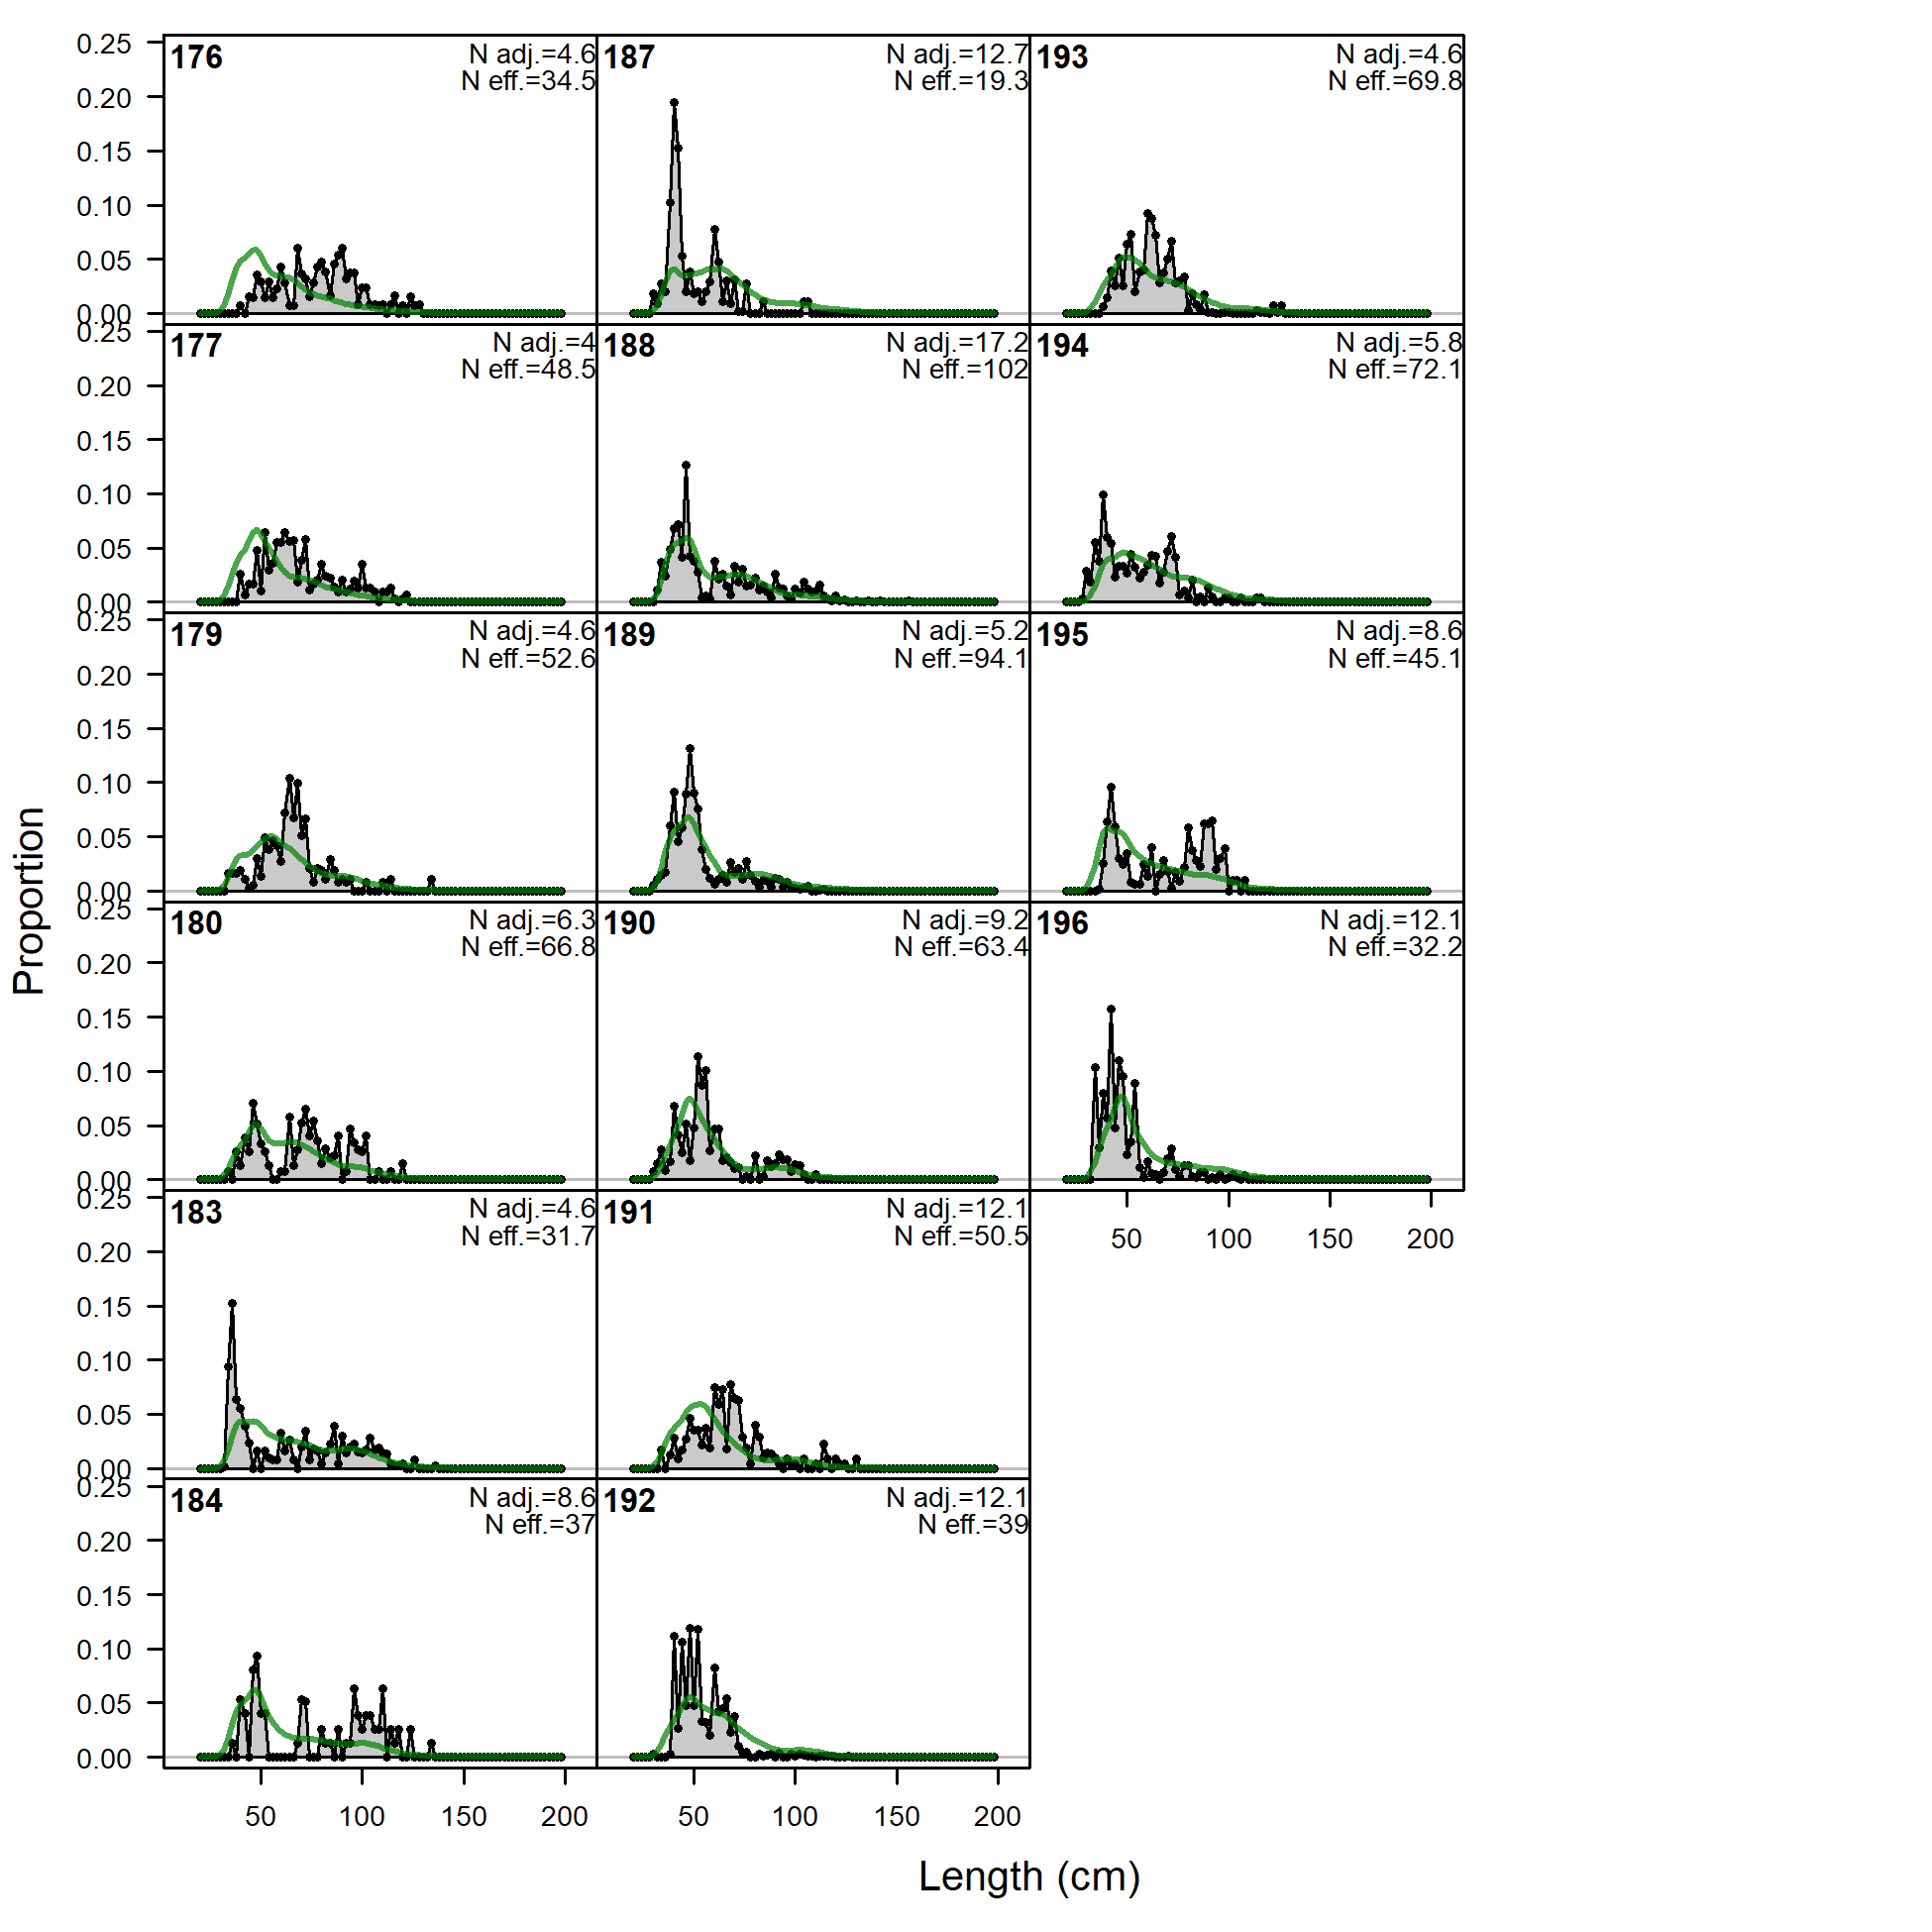
Length comps, whole catch, OBJ-A4 (plot 1 of 4).
'N adj.' is the input sample size after data-weighting adjustment. N eff. is the calculated effective sample size used in the McAllister-Ianelli tuning method. (plot 2 of 4) (plot 3 of 4)
file: comp_lenfit_flt18mkt0_page3.png
Length comps, whole catch, OBJ-A4 (plot 1 of 4).
'N adj.' is the input sample size after data-weighting adjustment. N eff. is the calculated effective sample size used in the McAllister-Ianelli tuning method. (plot 2 of 4) (plot 3 of 4) (plot 4 of 4)
file: comp_lenfit_flt18mkt0_page4.png
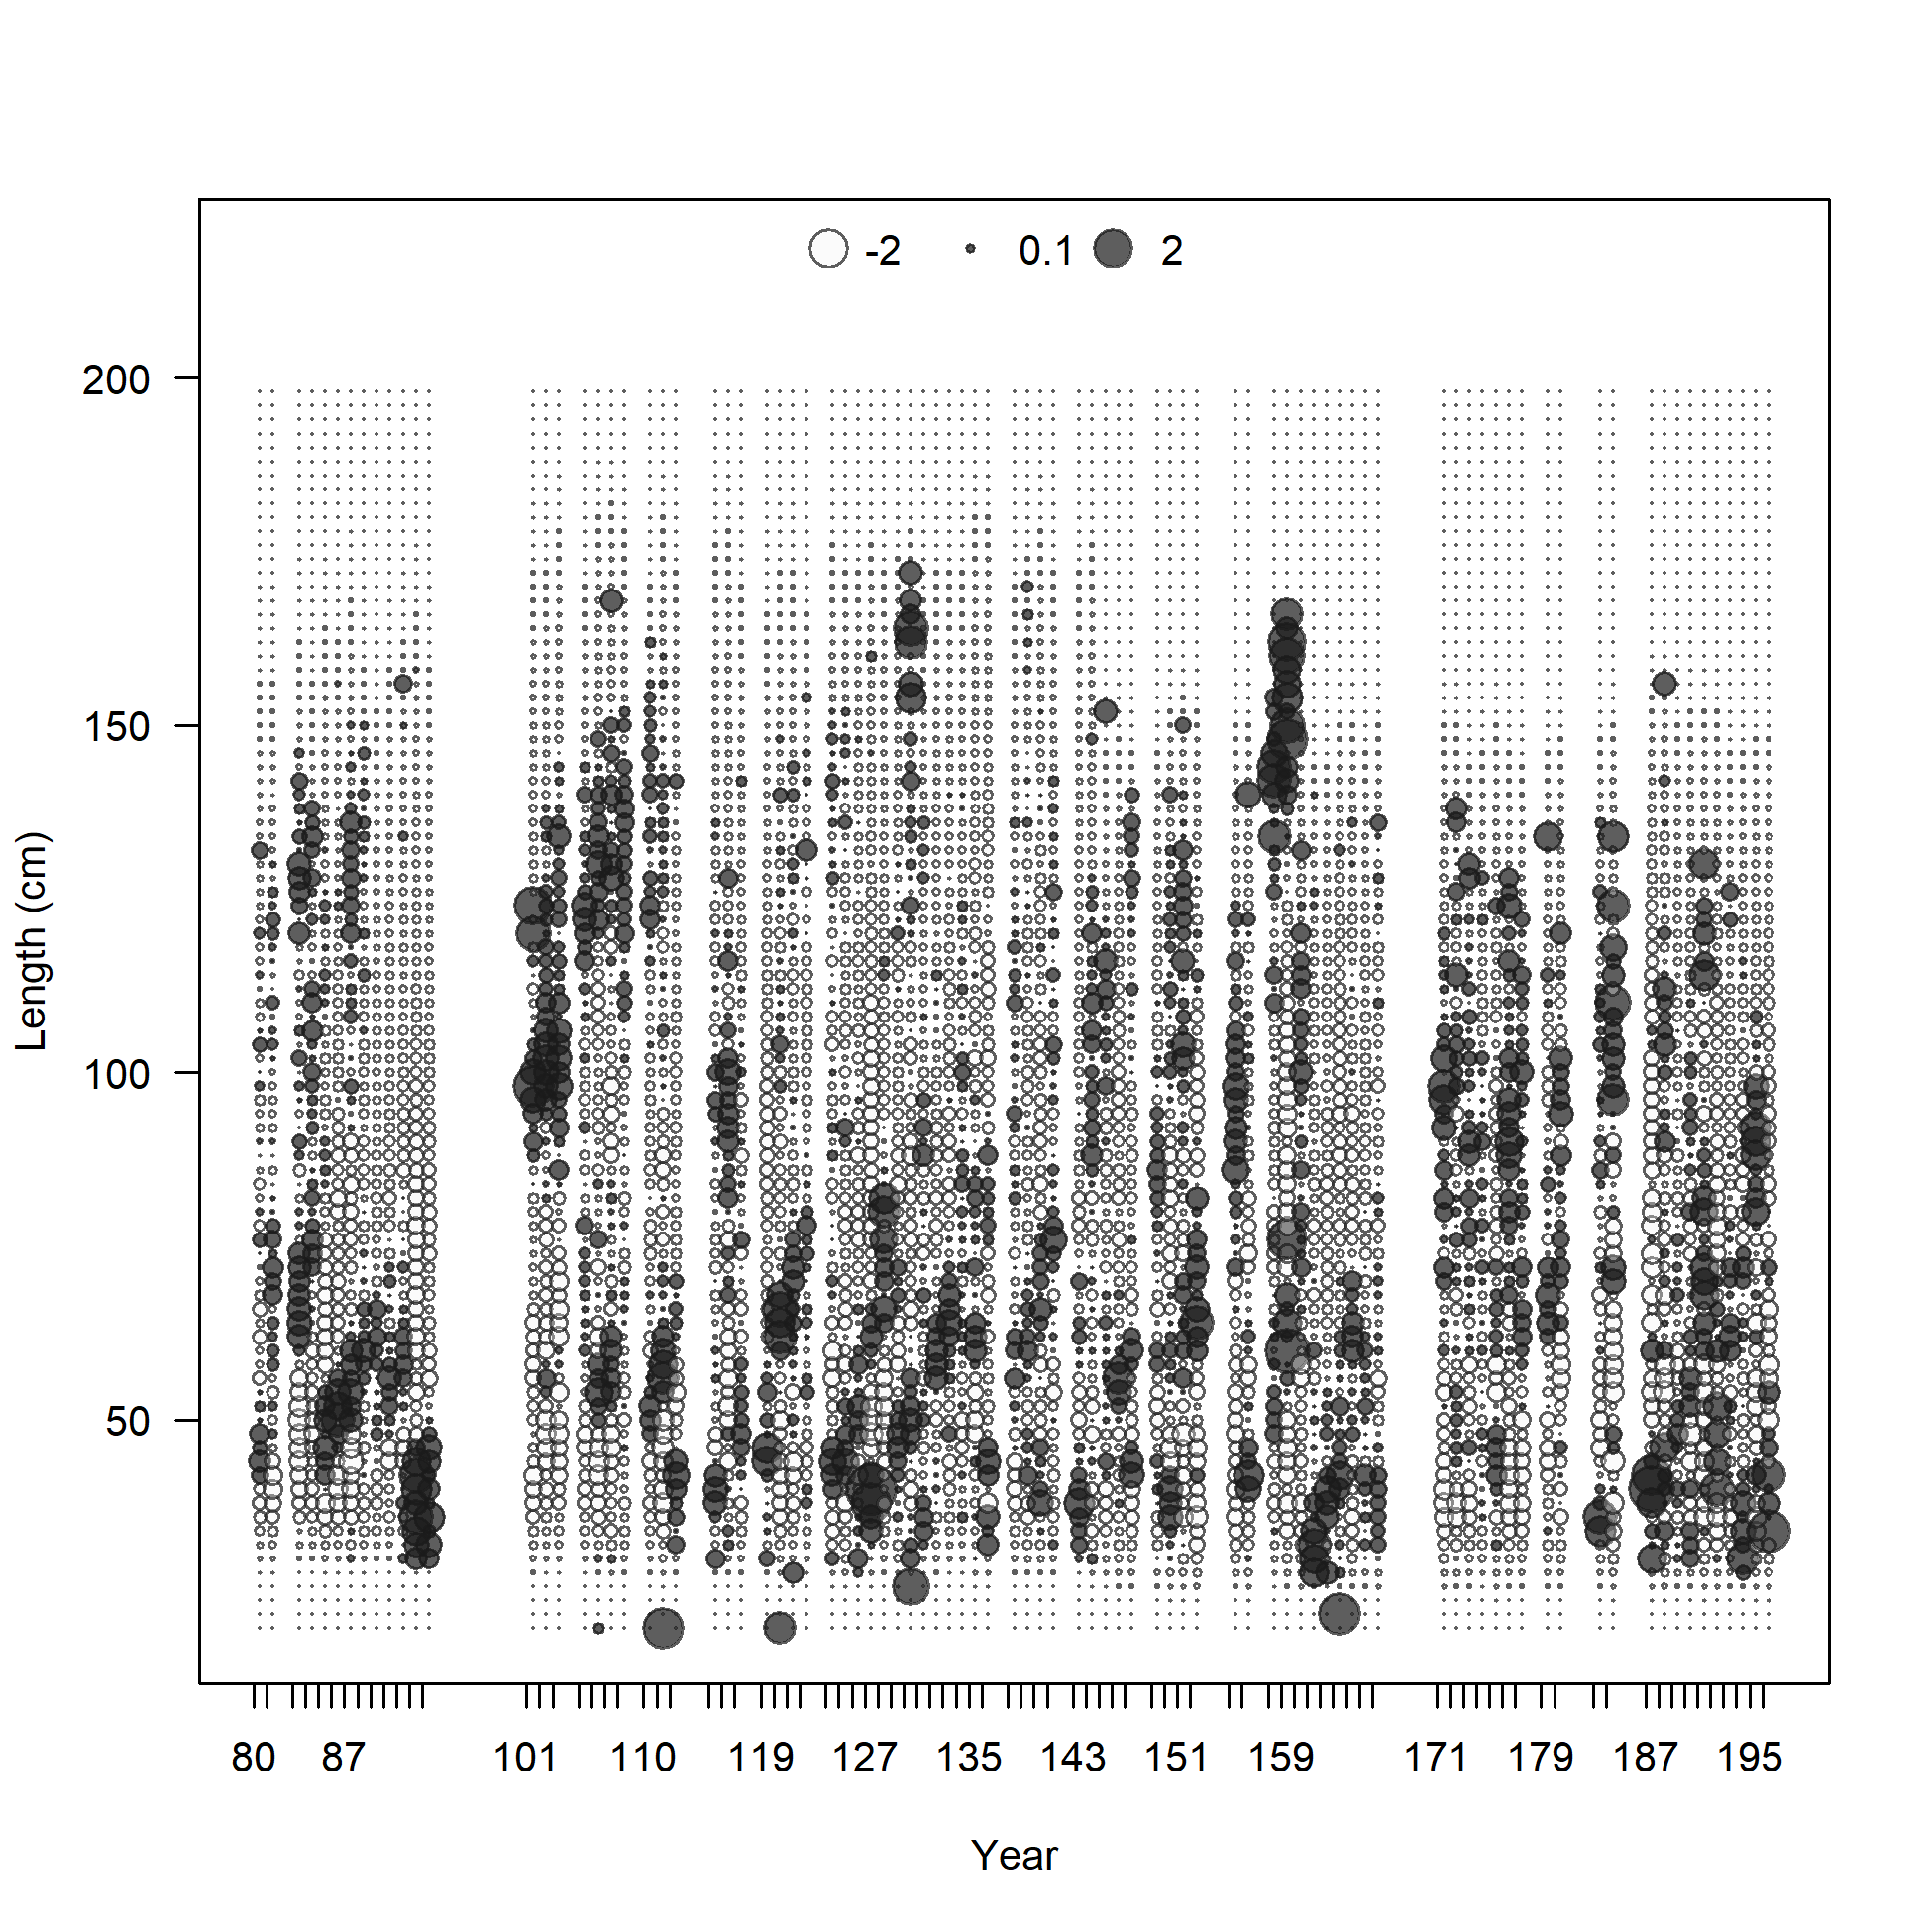
Pearson residuals, whole catch, OBJ-A4 (max=3.44) (plot 4 of 4)
Closed bubbles are positive residuals (observed > expected) and open bubbles are negative residuals (observed < expected).
file: comp_lenfit_residsflt18mkt0_page4.png
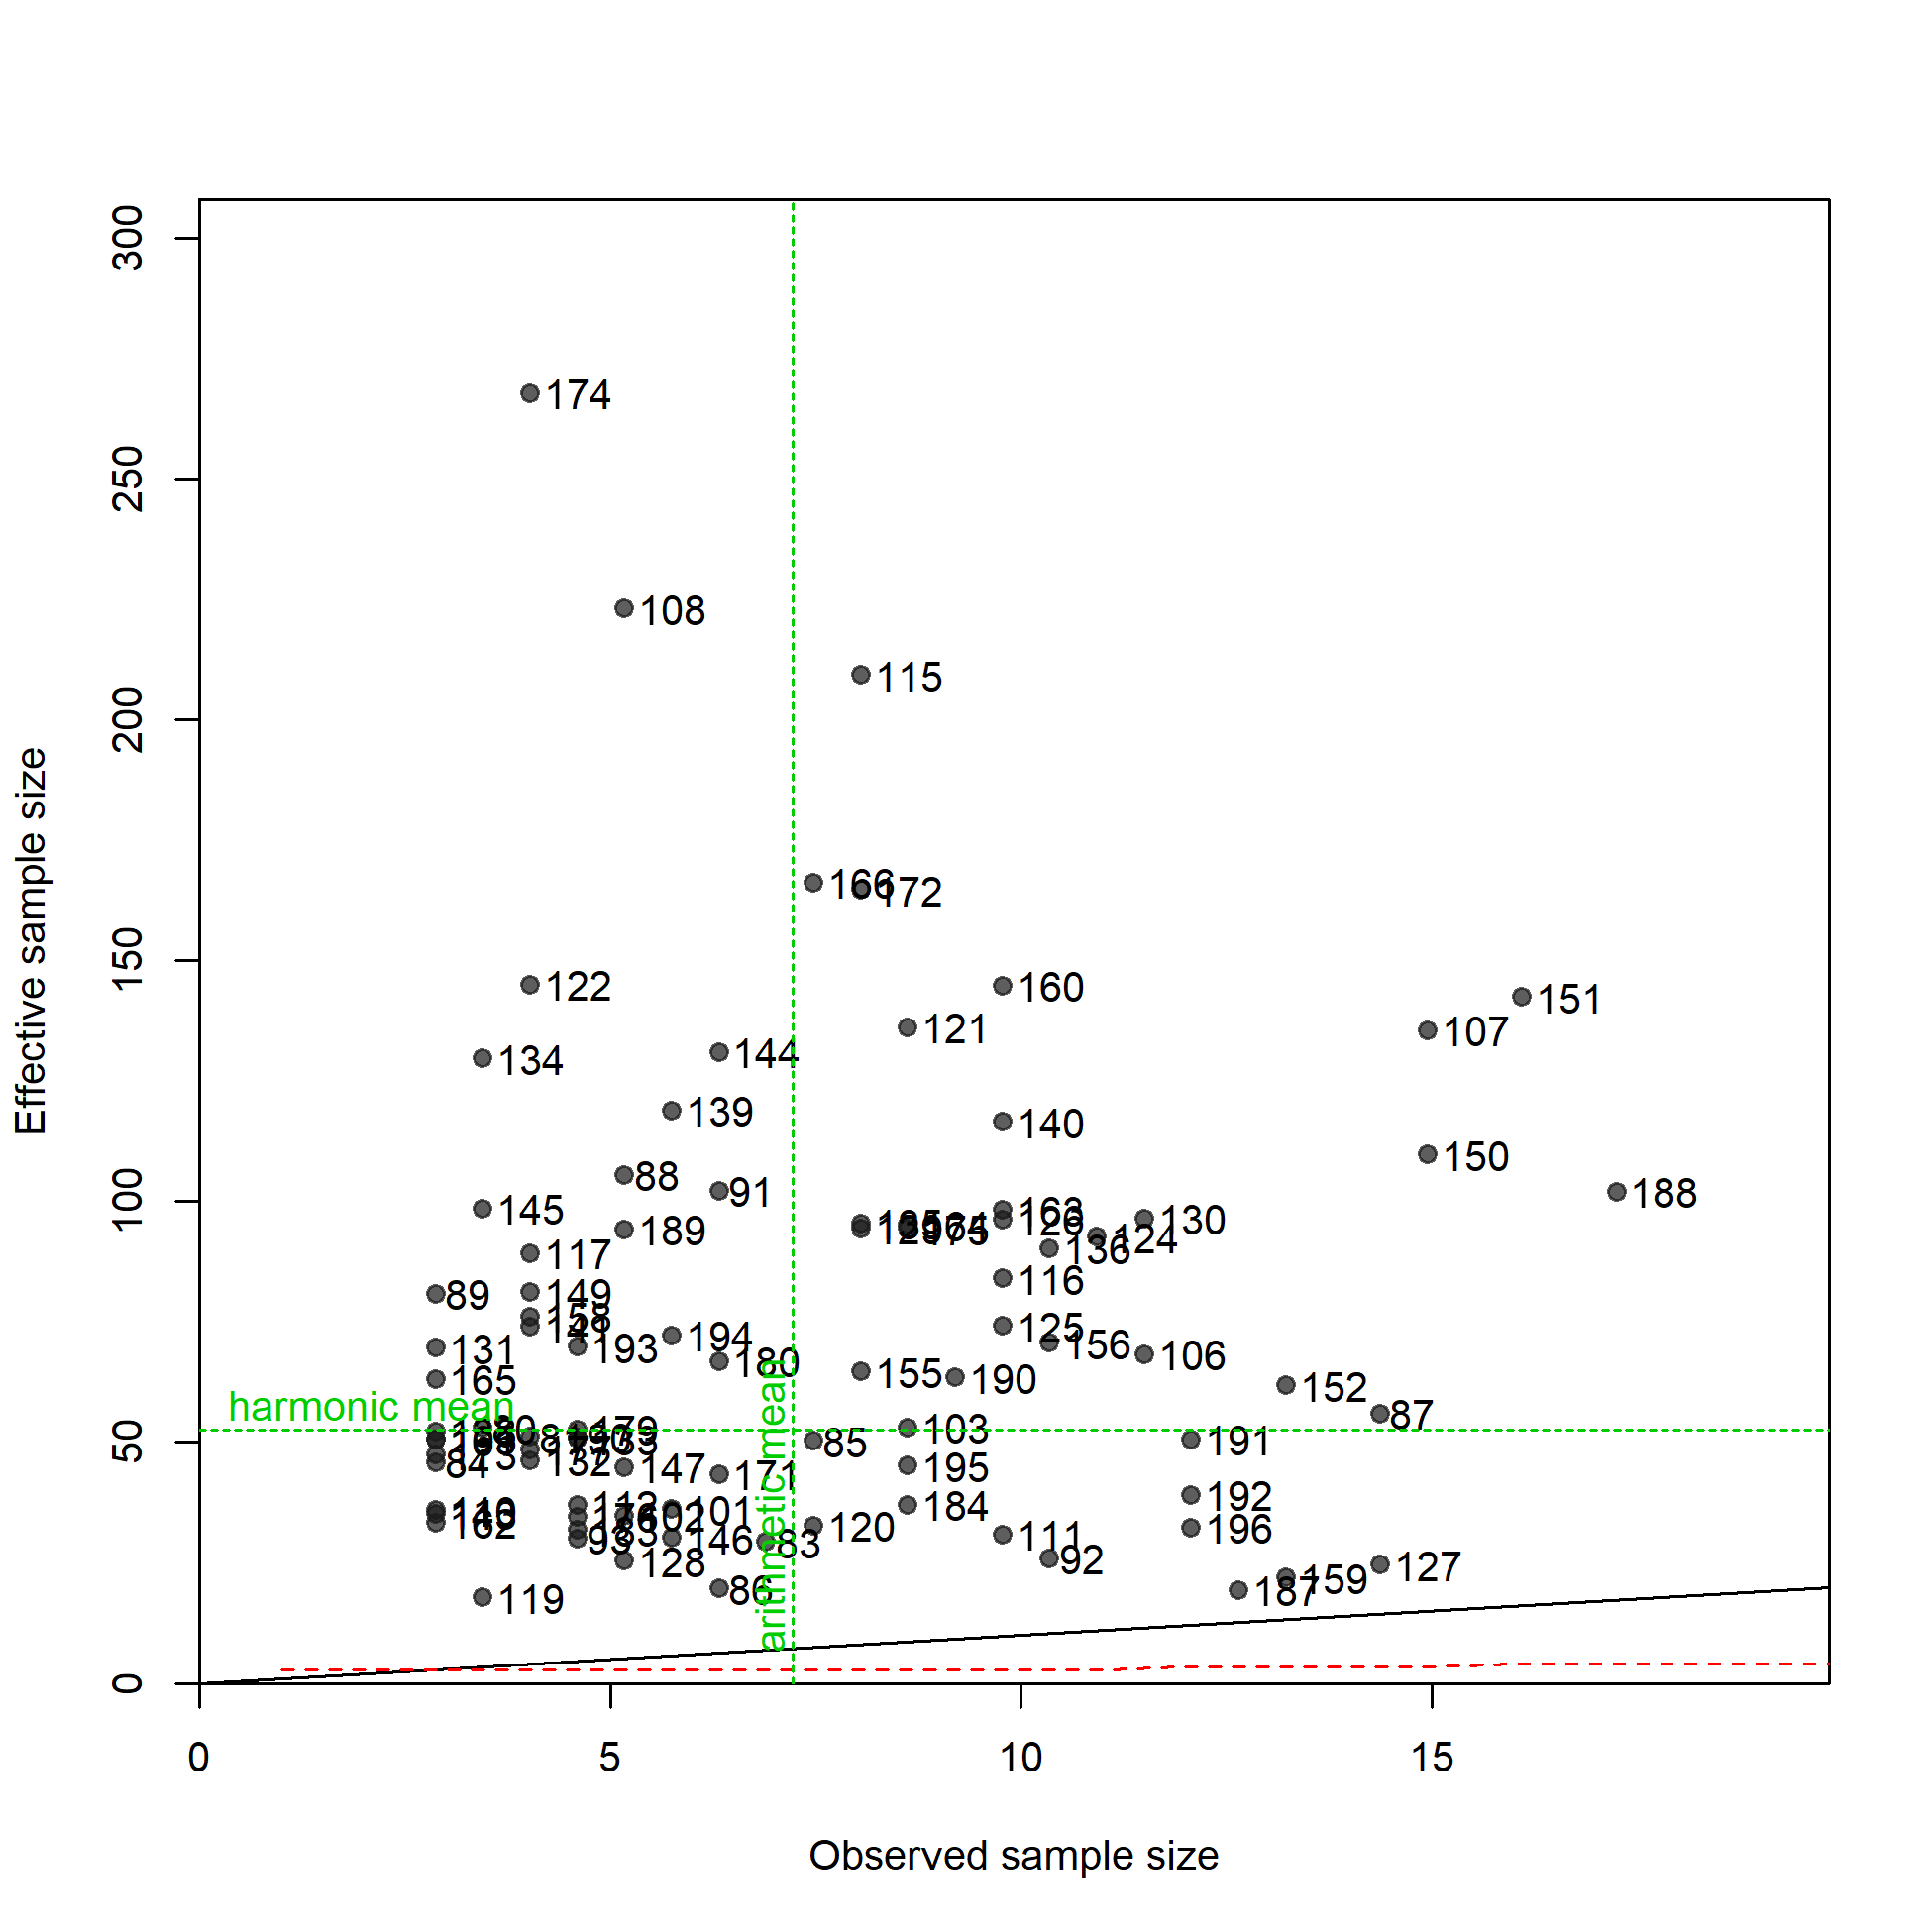
N-EffN comparison, Length comps, whole catch, OBJ-A4
file: comp_lenfit_sampsize_flt18mkt0.png
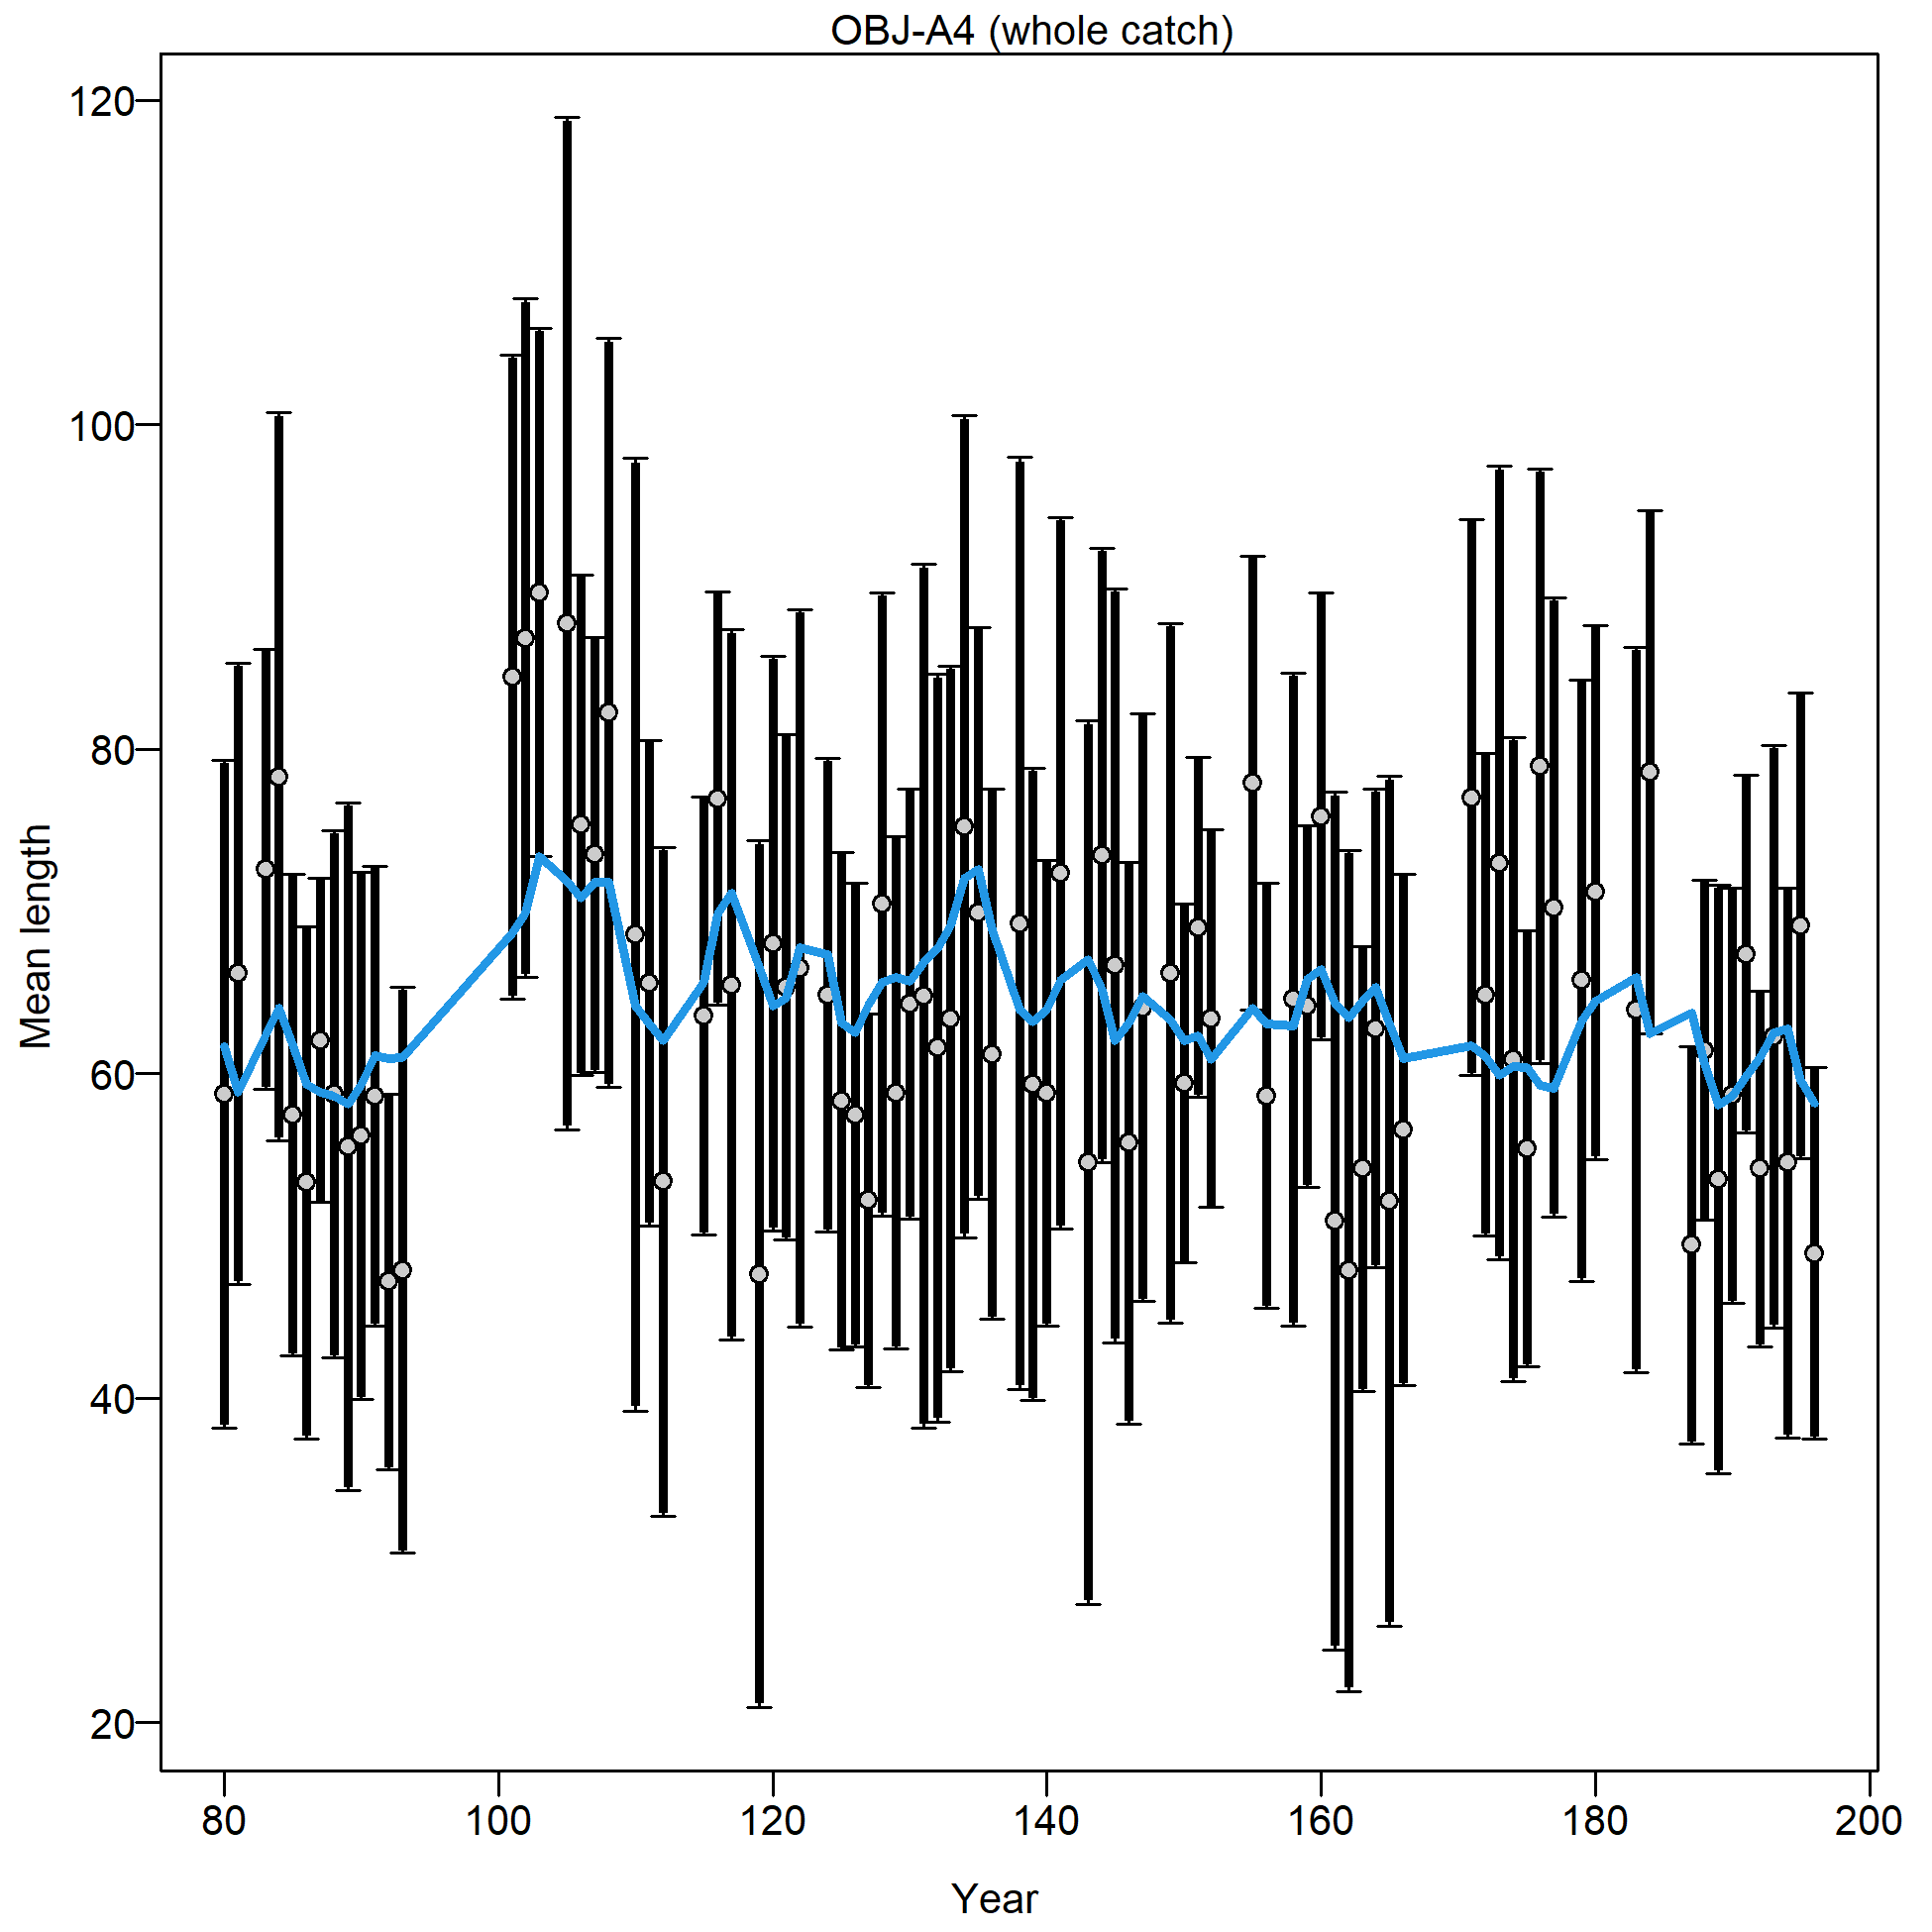
Mean length for OBJ-A4 with 95% confidence intervals based on current sample sizes.
Francis data weighting method TA1.8: thinner intervals (with capped ends) show result of further adjusting sample sizes based on suggested multiplier (with 95% interval) for len data from OBJ-A4:
0.9821 (0.7598-1.3529)
For more info, see Francis (2011).
file: comp_lenfit_data_weighting_TA1.8_OBJ-A4.png
Length comps, whole catch, OBJ-A5 (plot 1 of 4).
'N adj.' is the input sample size after data-weighting adjustment. N eff. is the calculated effective sample size used in the McAllister-Ianelli tuning method.
file: comp_lenfit_flt19mkt0_page1.png
Length comps, whole catch, OBJ-A5 (plot 1 of 4).
'N adj.' is the input sample size after data-weighting adjustment. N eff. is the calculated effective sample size used in the McAllister-Ianelli tuning method. (plot 2 of 4)
file: comp_lenfit_flt19mkt0_page2.png
Length comps, whole catch, OBJ-A5 (plot 1 of 4).
'N adj.' is the input sample size after data-weighting adjustment. N eff. is the calculated effective sample size used in the McAllister-Ianelli tuning method. (plot 2 of 4) (plot 3 of 4)
file: comp_lenfit_flt19mkt0_page3.png

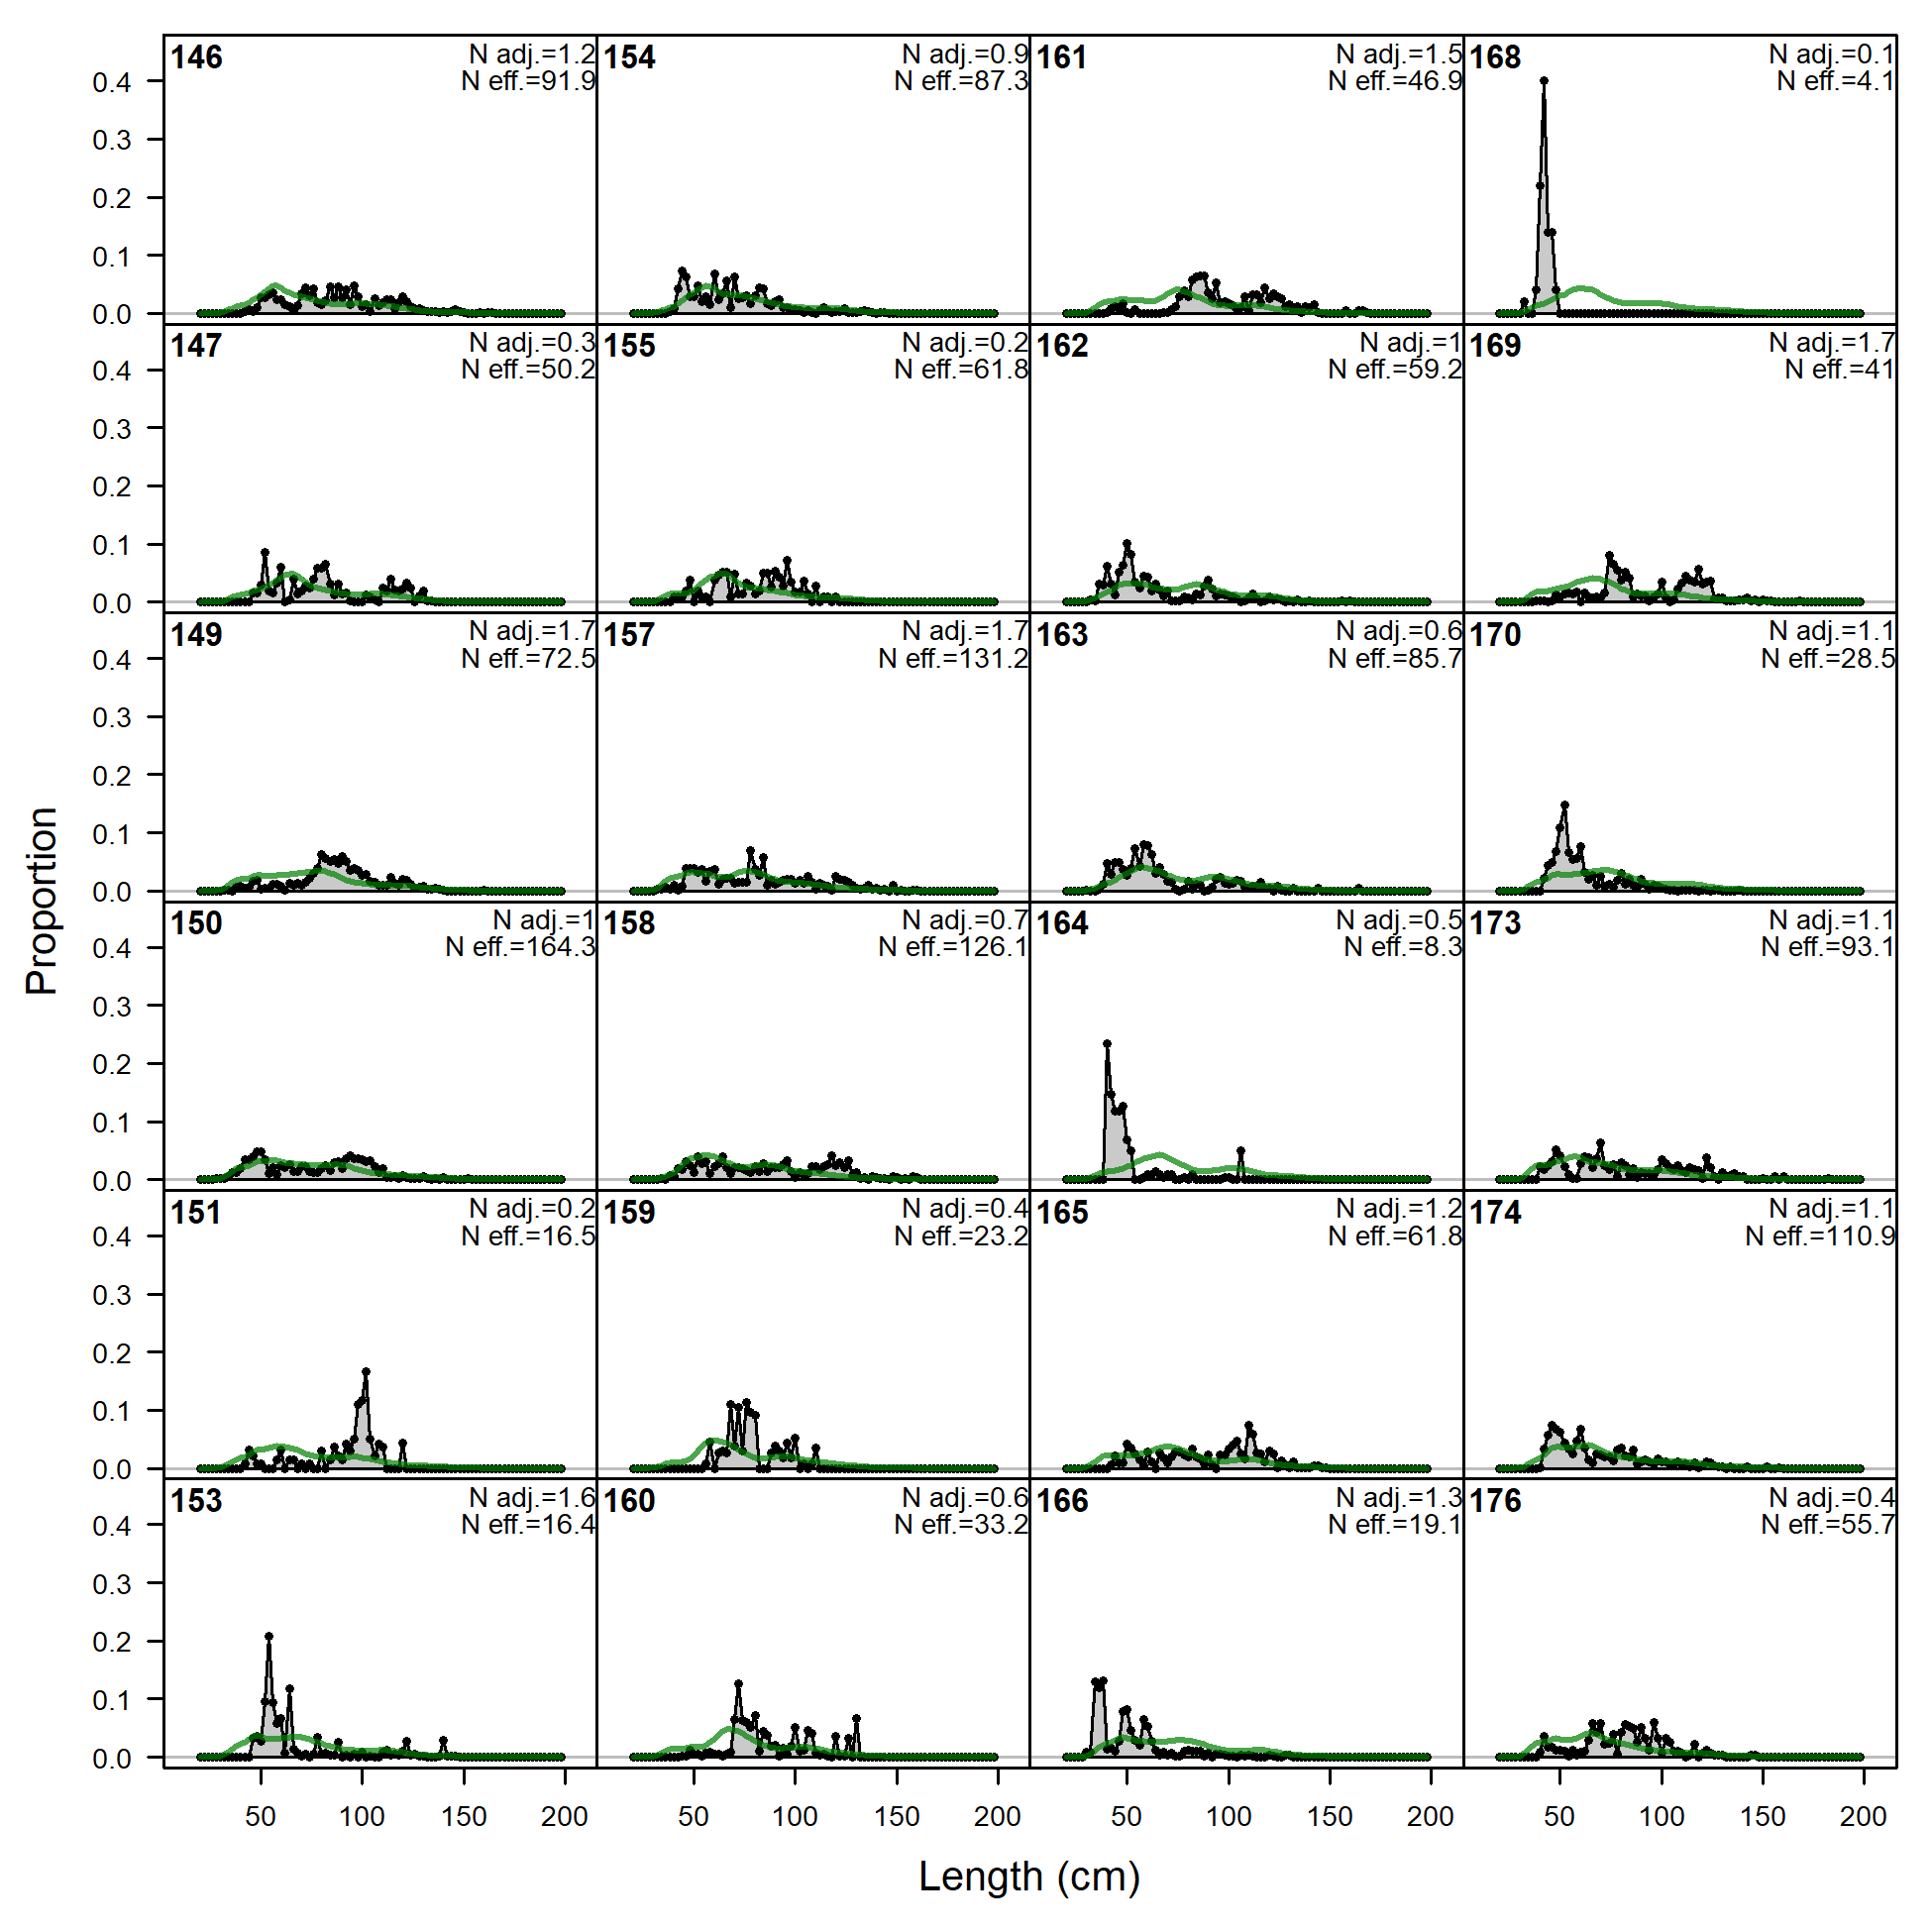
Length comps, whole catch, OBJ-A5 (plot 1 of 4).
'N adj.' is the input sample size after data-weighting adjustment. N eff. is the calculated effective sample size used in the McAllister-Ianelli tuning method. (plot 2 of 4) (plot 3 of 4) (plot 4 of 4)
file: comp_lenfit_flt19mkt0_page4.png
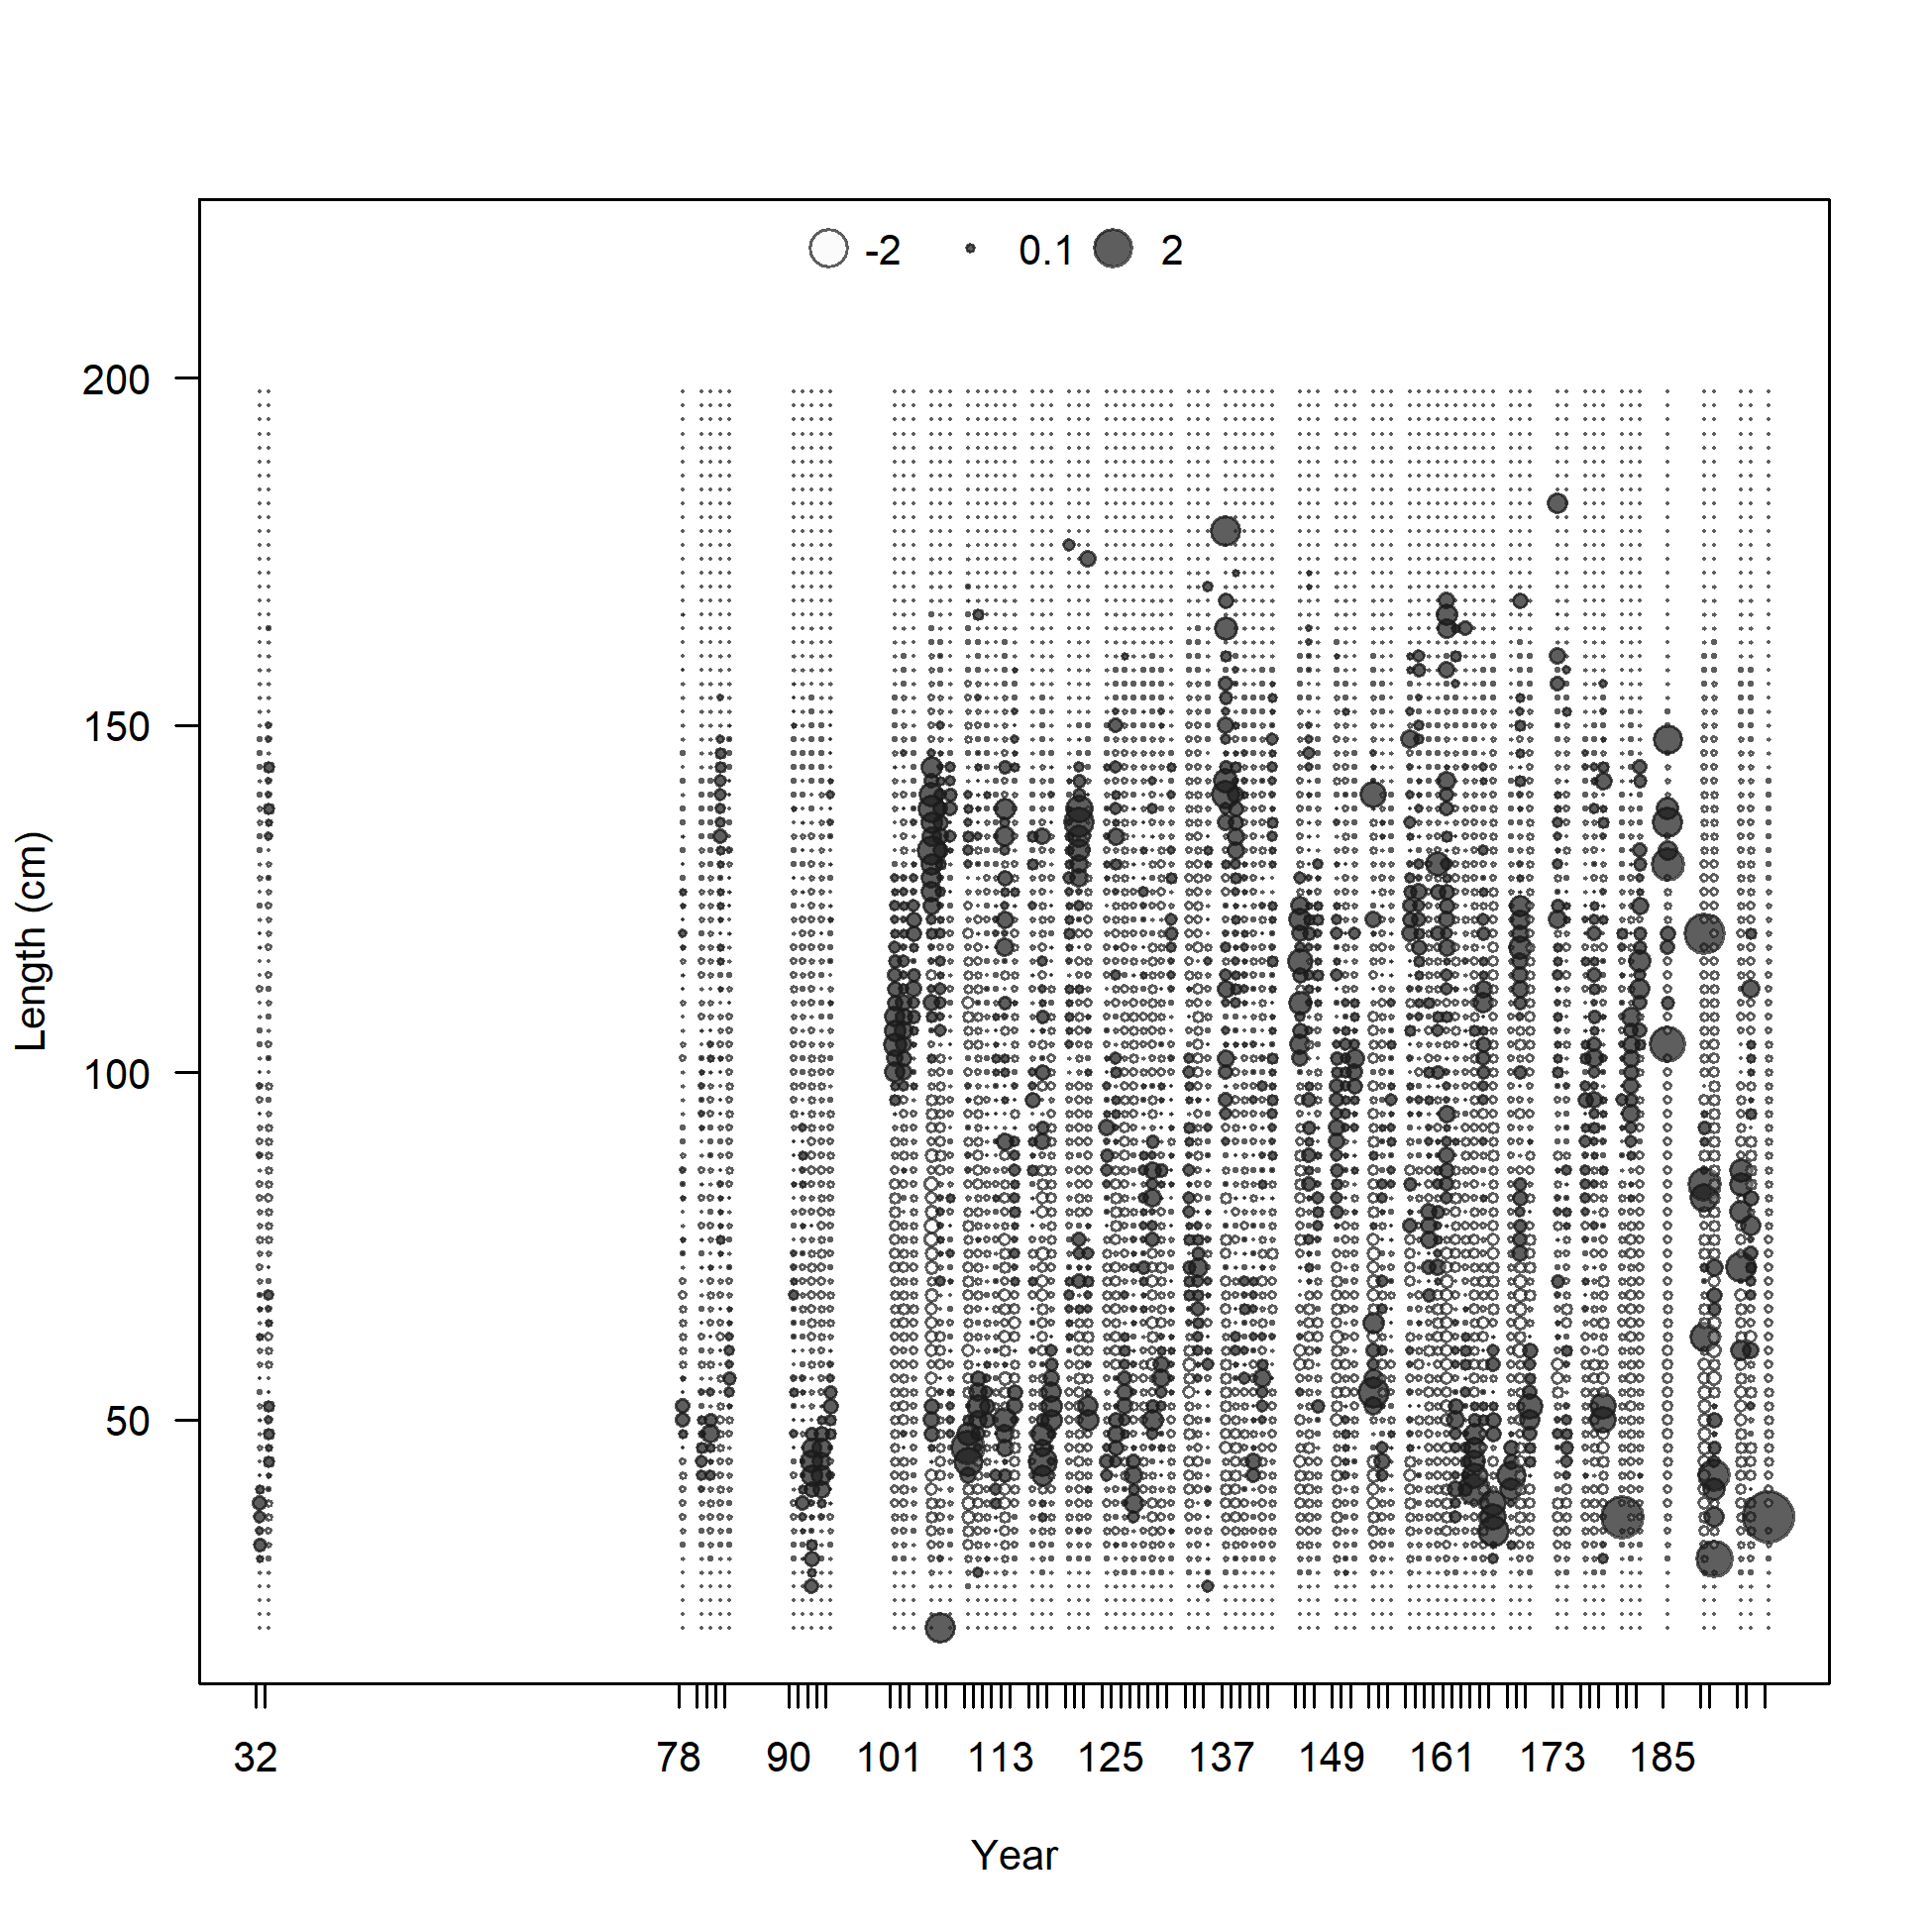
Pearson residuals, whole catch, OBJ-A5 (max=3.54) (plot 4 of 4)
Closed bubbles are positive residuals (observed > expected) and open bubbles are negative residuals (observed < expected).
file: comp_lenfit_residsflt19mkt0_page4.png
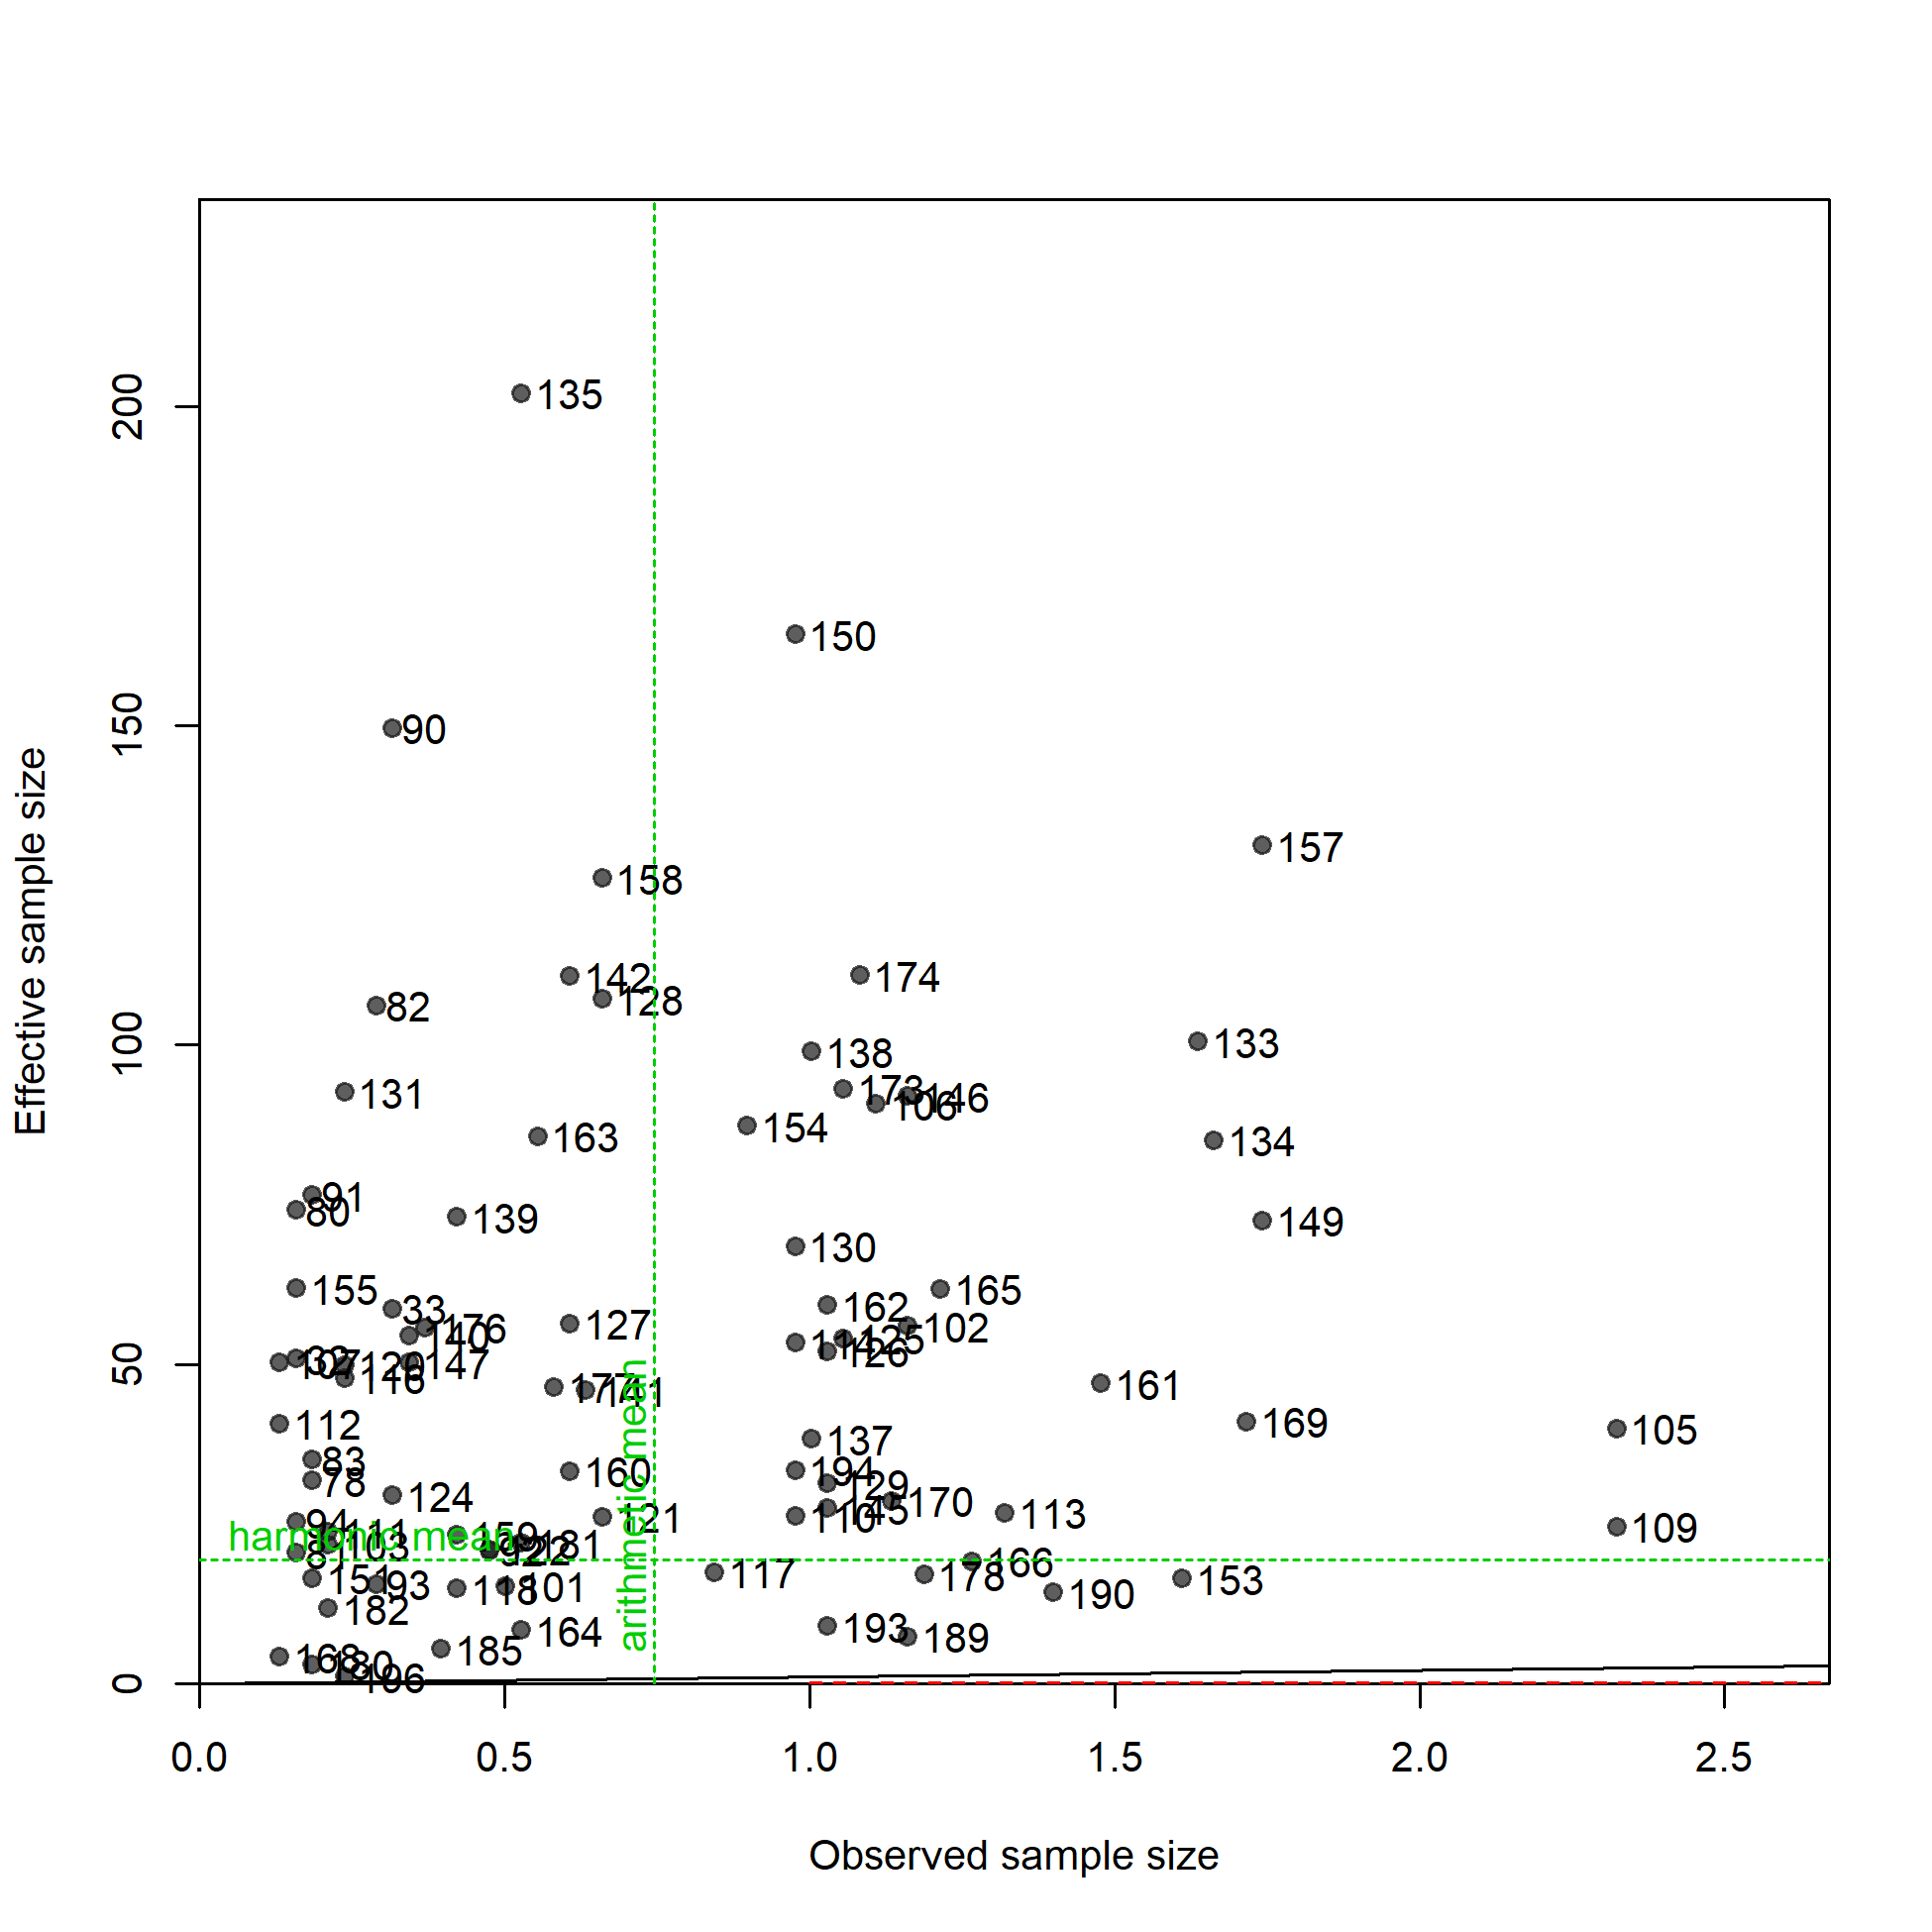
N-EffN comparison, Length comps, whole catch, OBJ-A5
file: comp_lenfit_sampsize_flt19mkt0.png
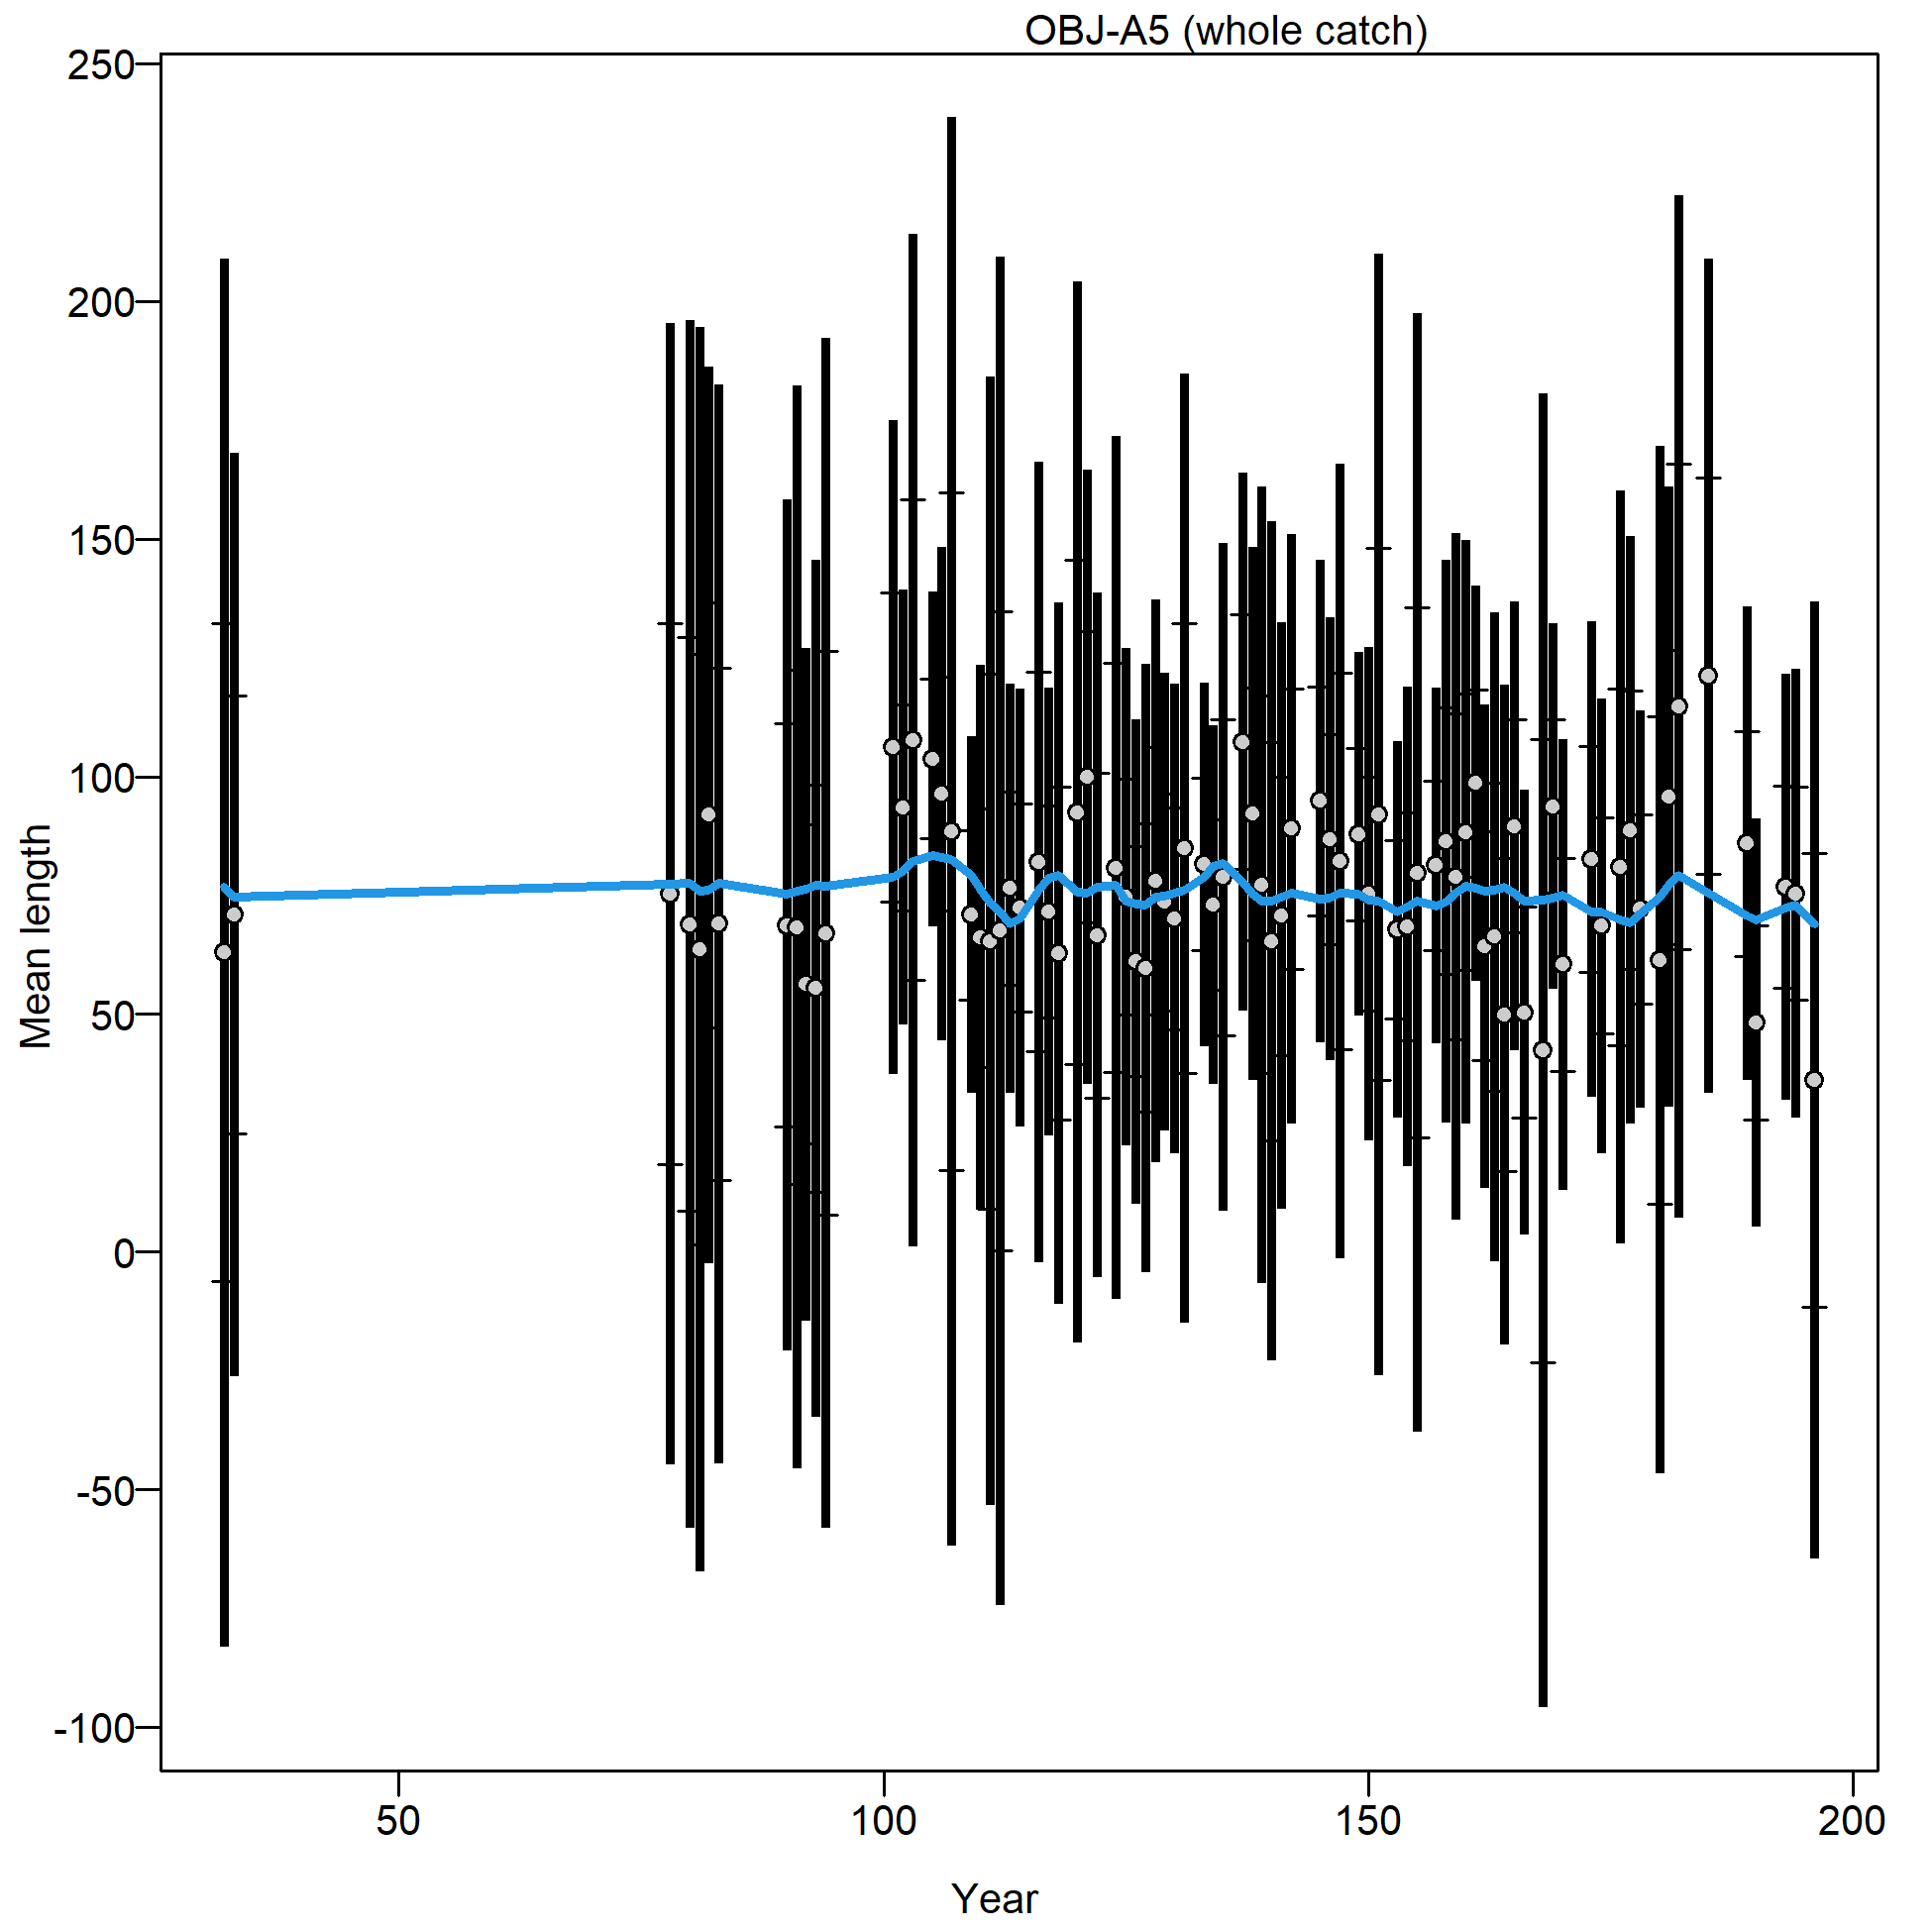
Mean length for OBJ-A5 with 95% confidence intervals based on current sample sizes.
Francis data weighting method TA1.8: thinner intervals (with capped ends) show result of further adjusting sample sizes based on suggested multiplier (with 95% interval) for len data from OBJ-A5:
4.4413 (3.4667-6.2115)
For more info, see Francis (2011).
file: comp_lenfit_data_weighting_TA1.8_OBJ-A5.png
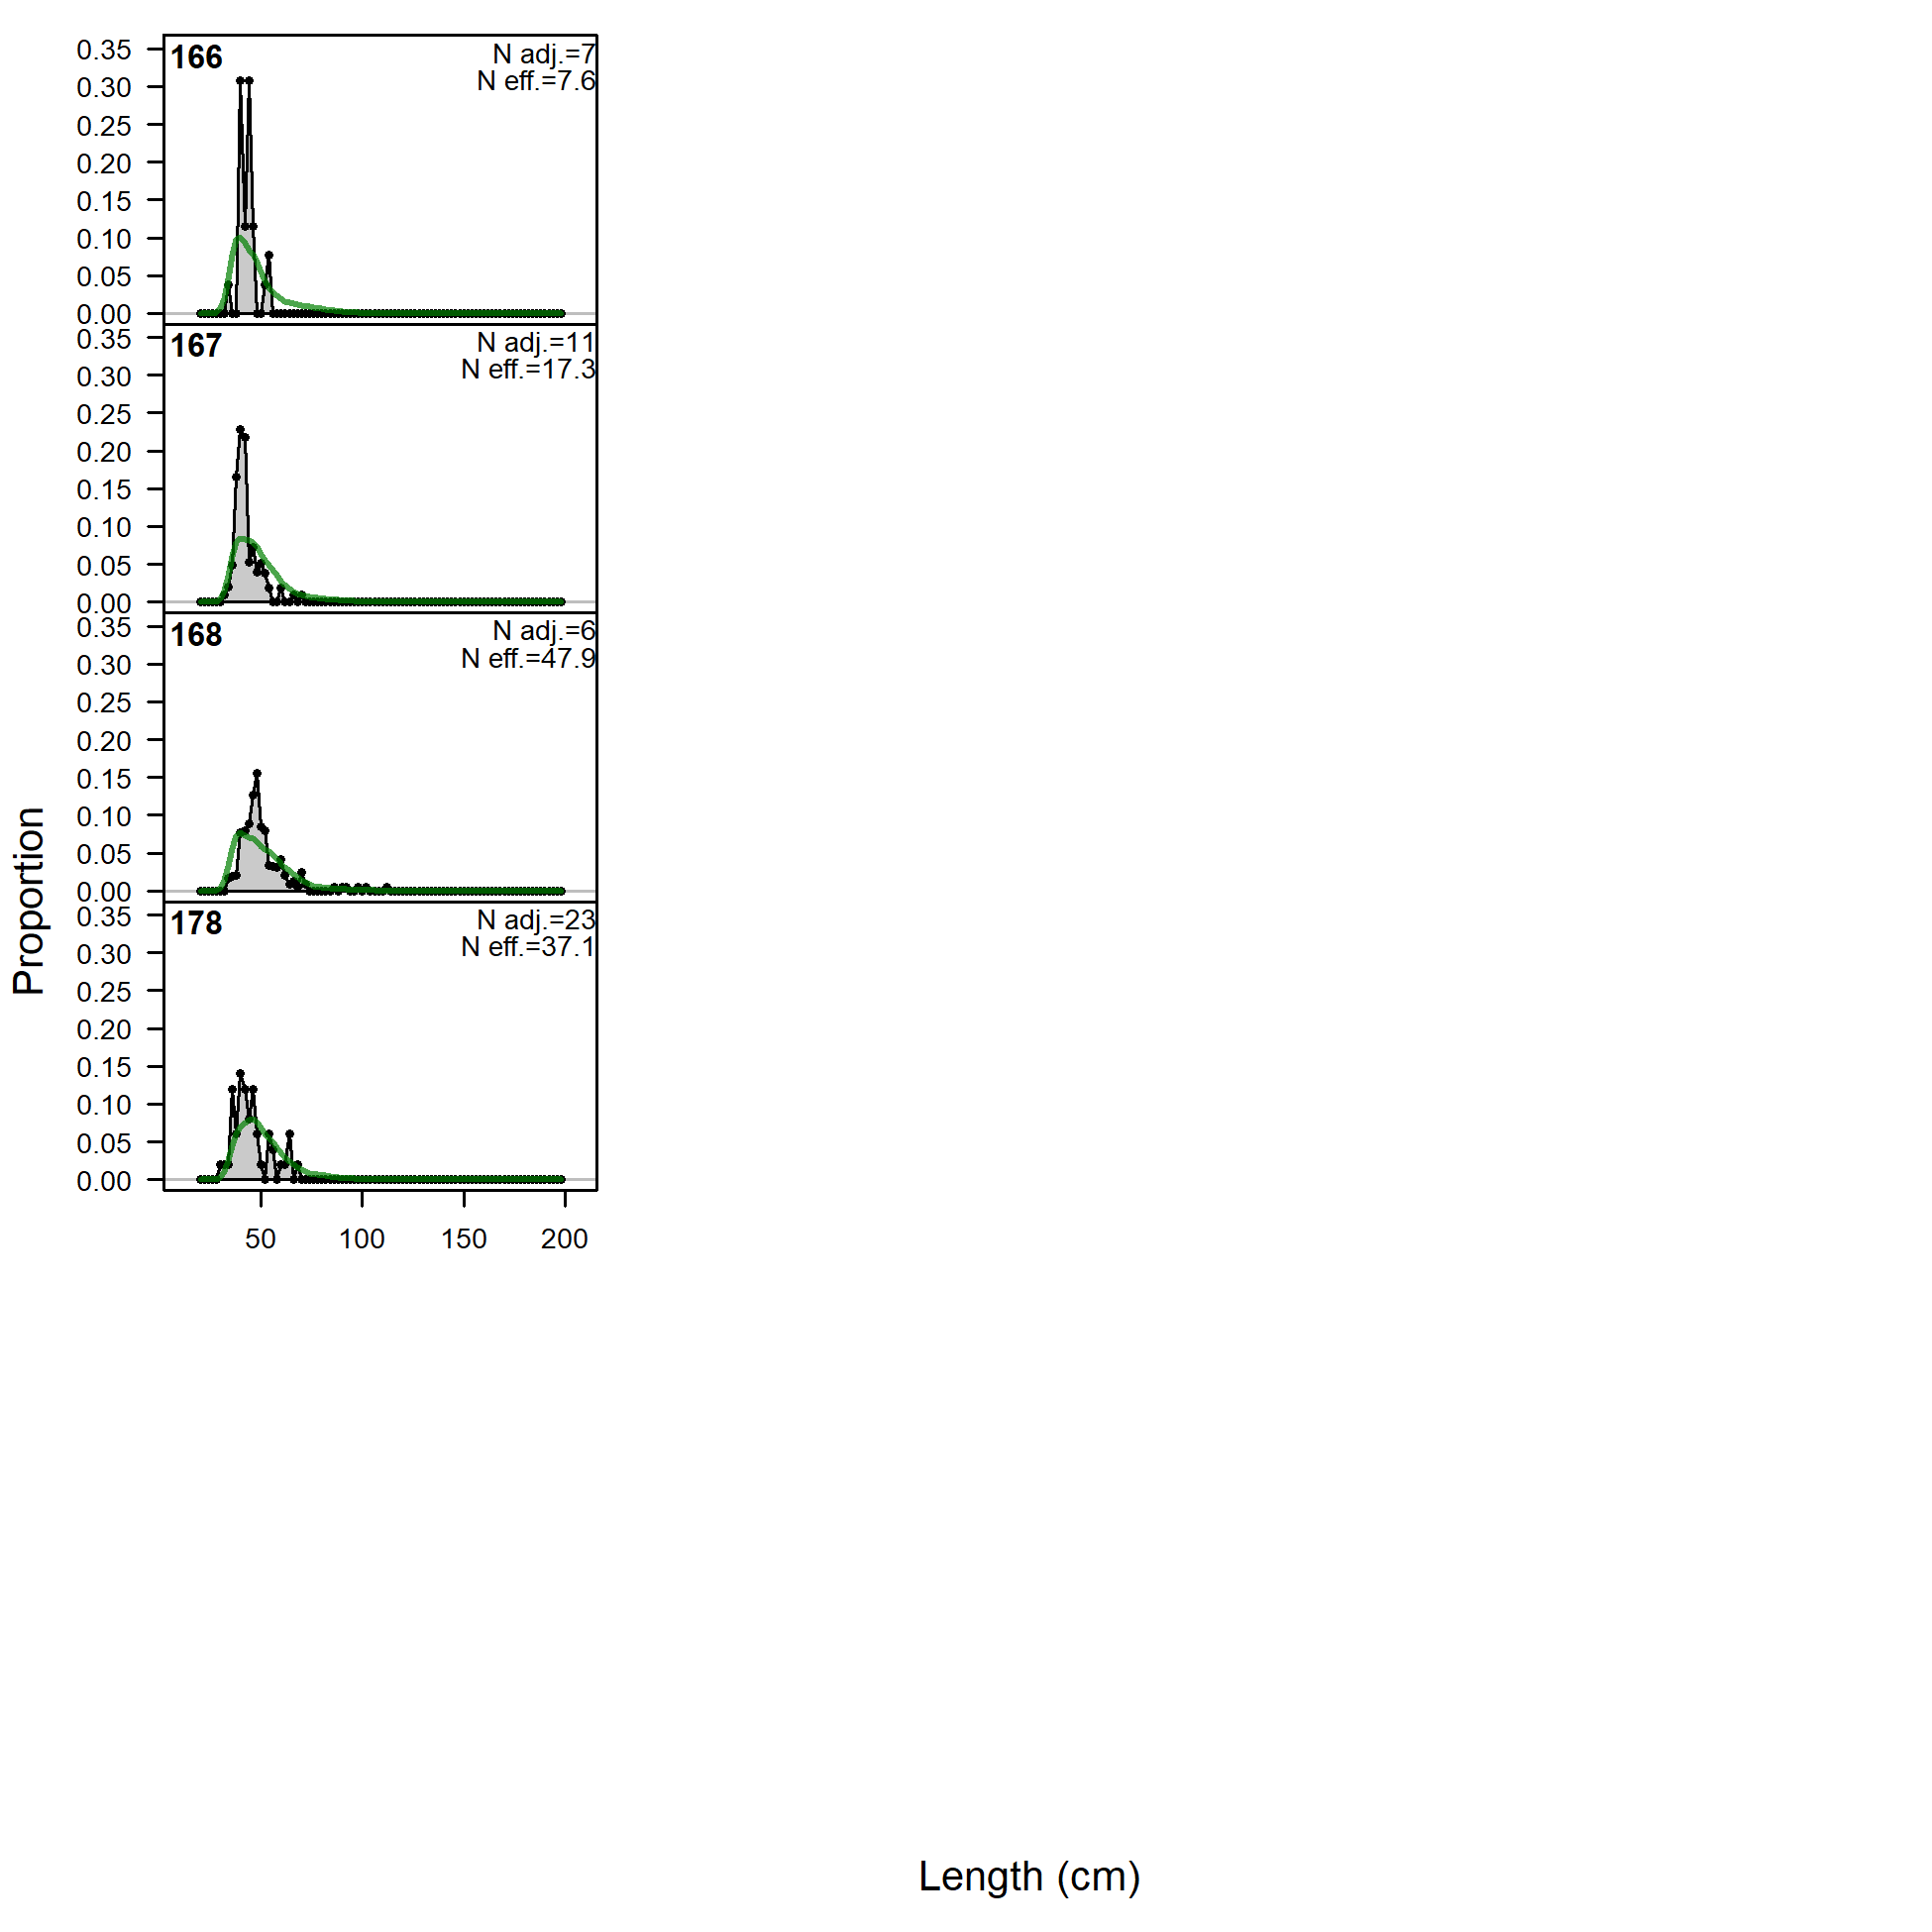
Length comps, whole catch, NOA-A1.
'N adj.' is the input sample size after data-weighting adjustment. N eff. is the calculated effective sample size used in the McAllister-Ianelli tuning method.
file: comp_lenfit_flt21mkt0.png
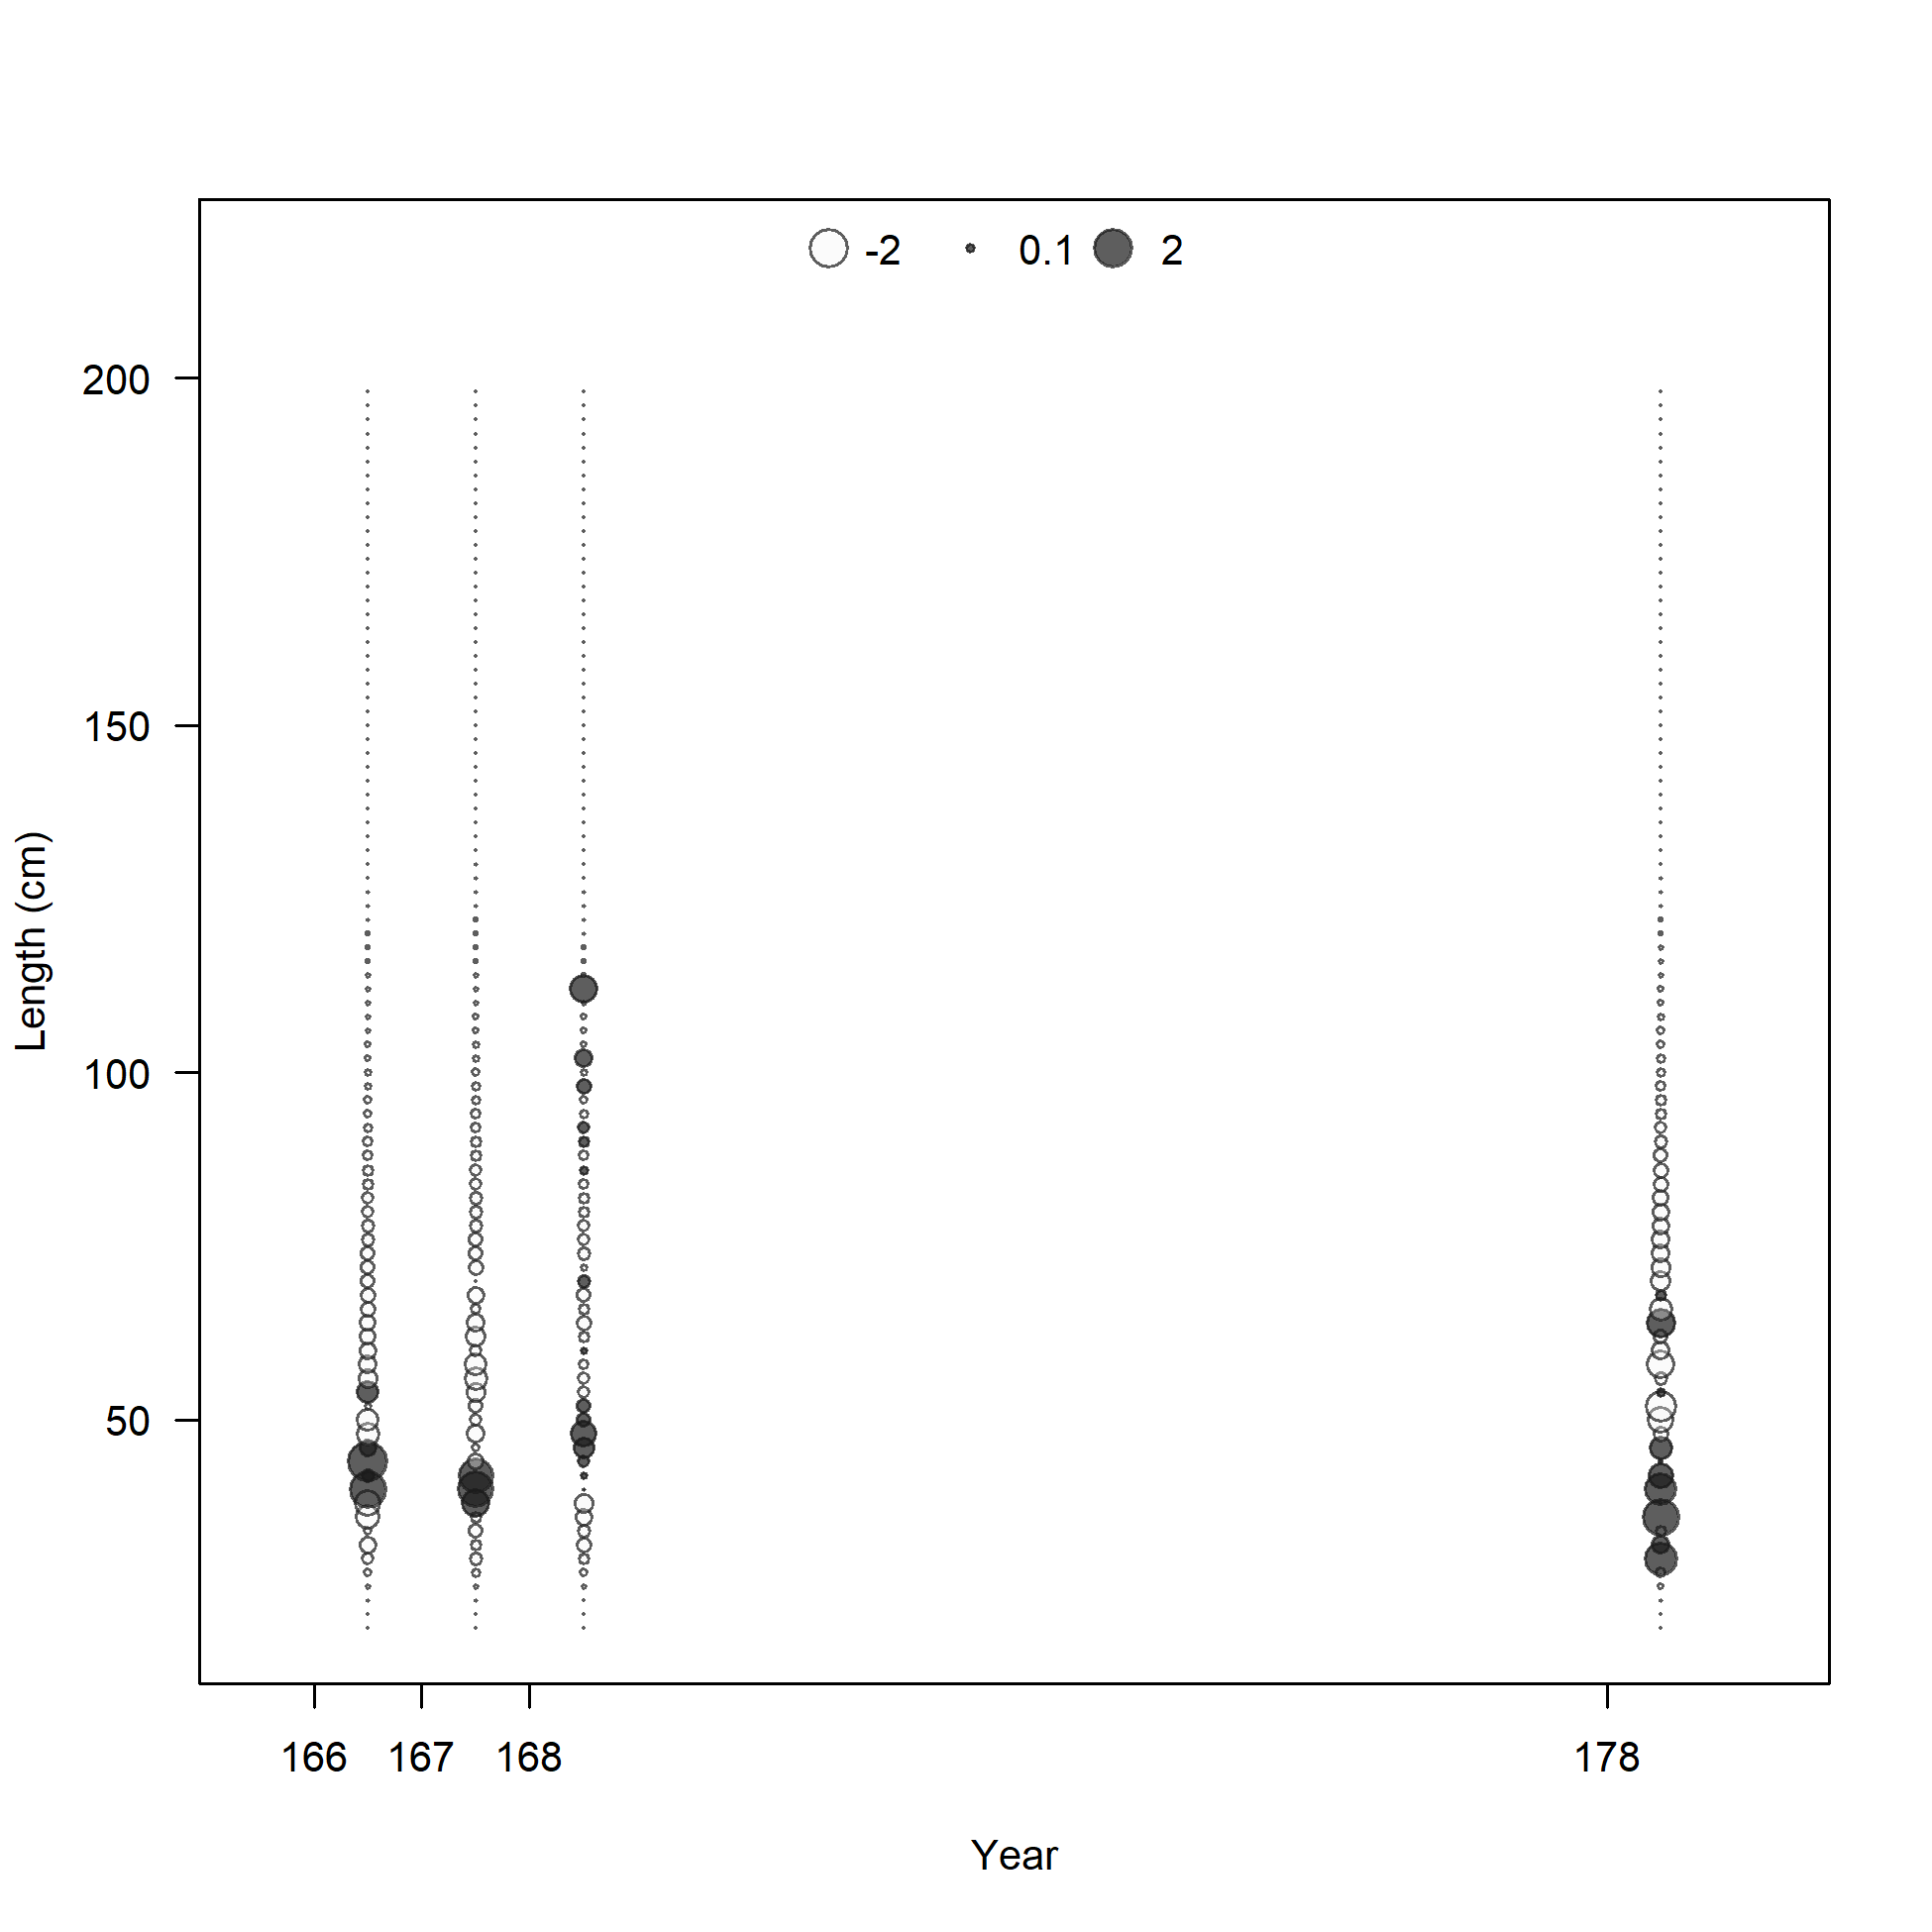
Pearson residuals, whole catch, NOA-A1 (max=2.13)
Closed bubbles are positive residuals (observed > expected) and open bubbles are negative residuals (observed < expected).
file: comp_lenfit_residsflt21mkt0.png
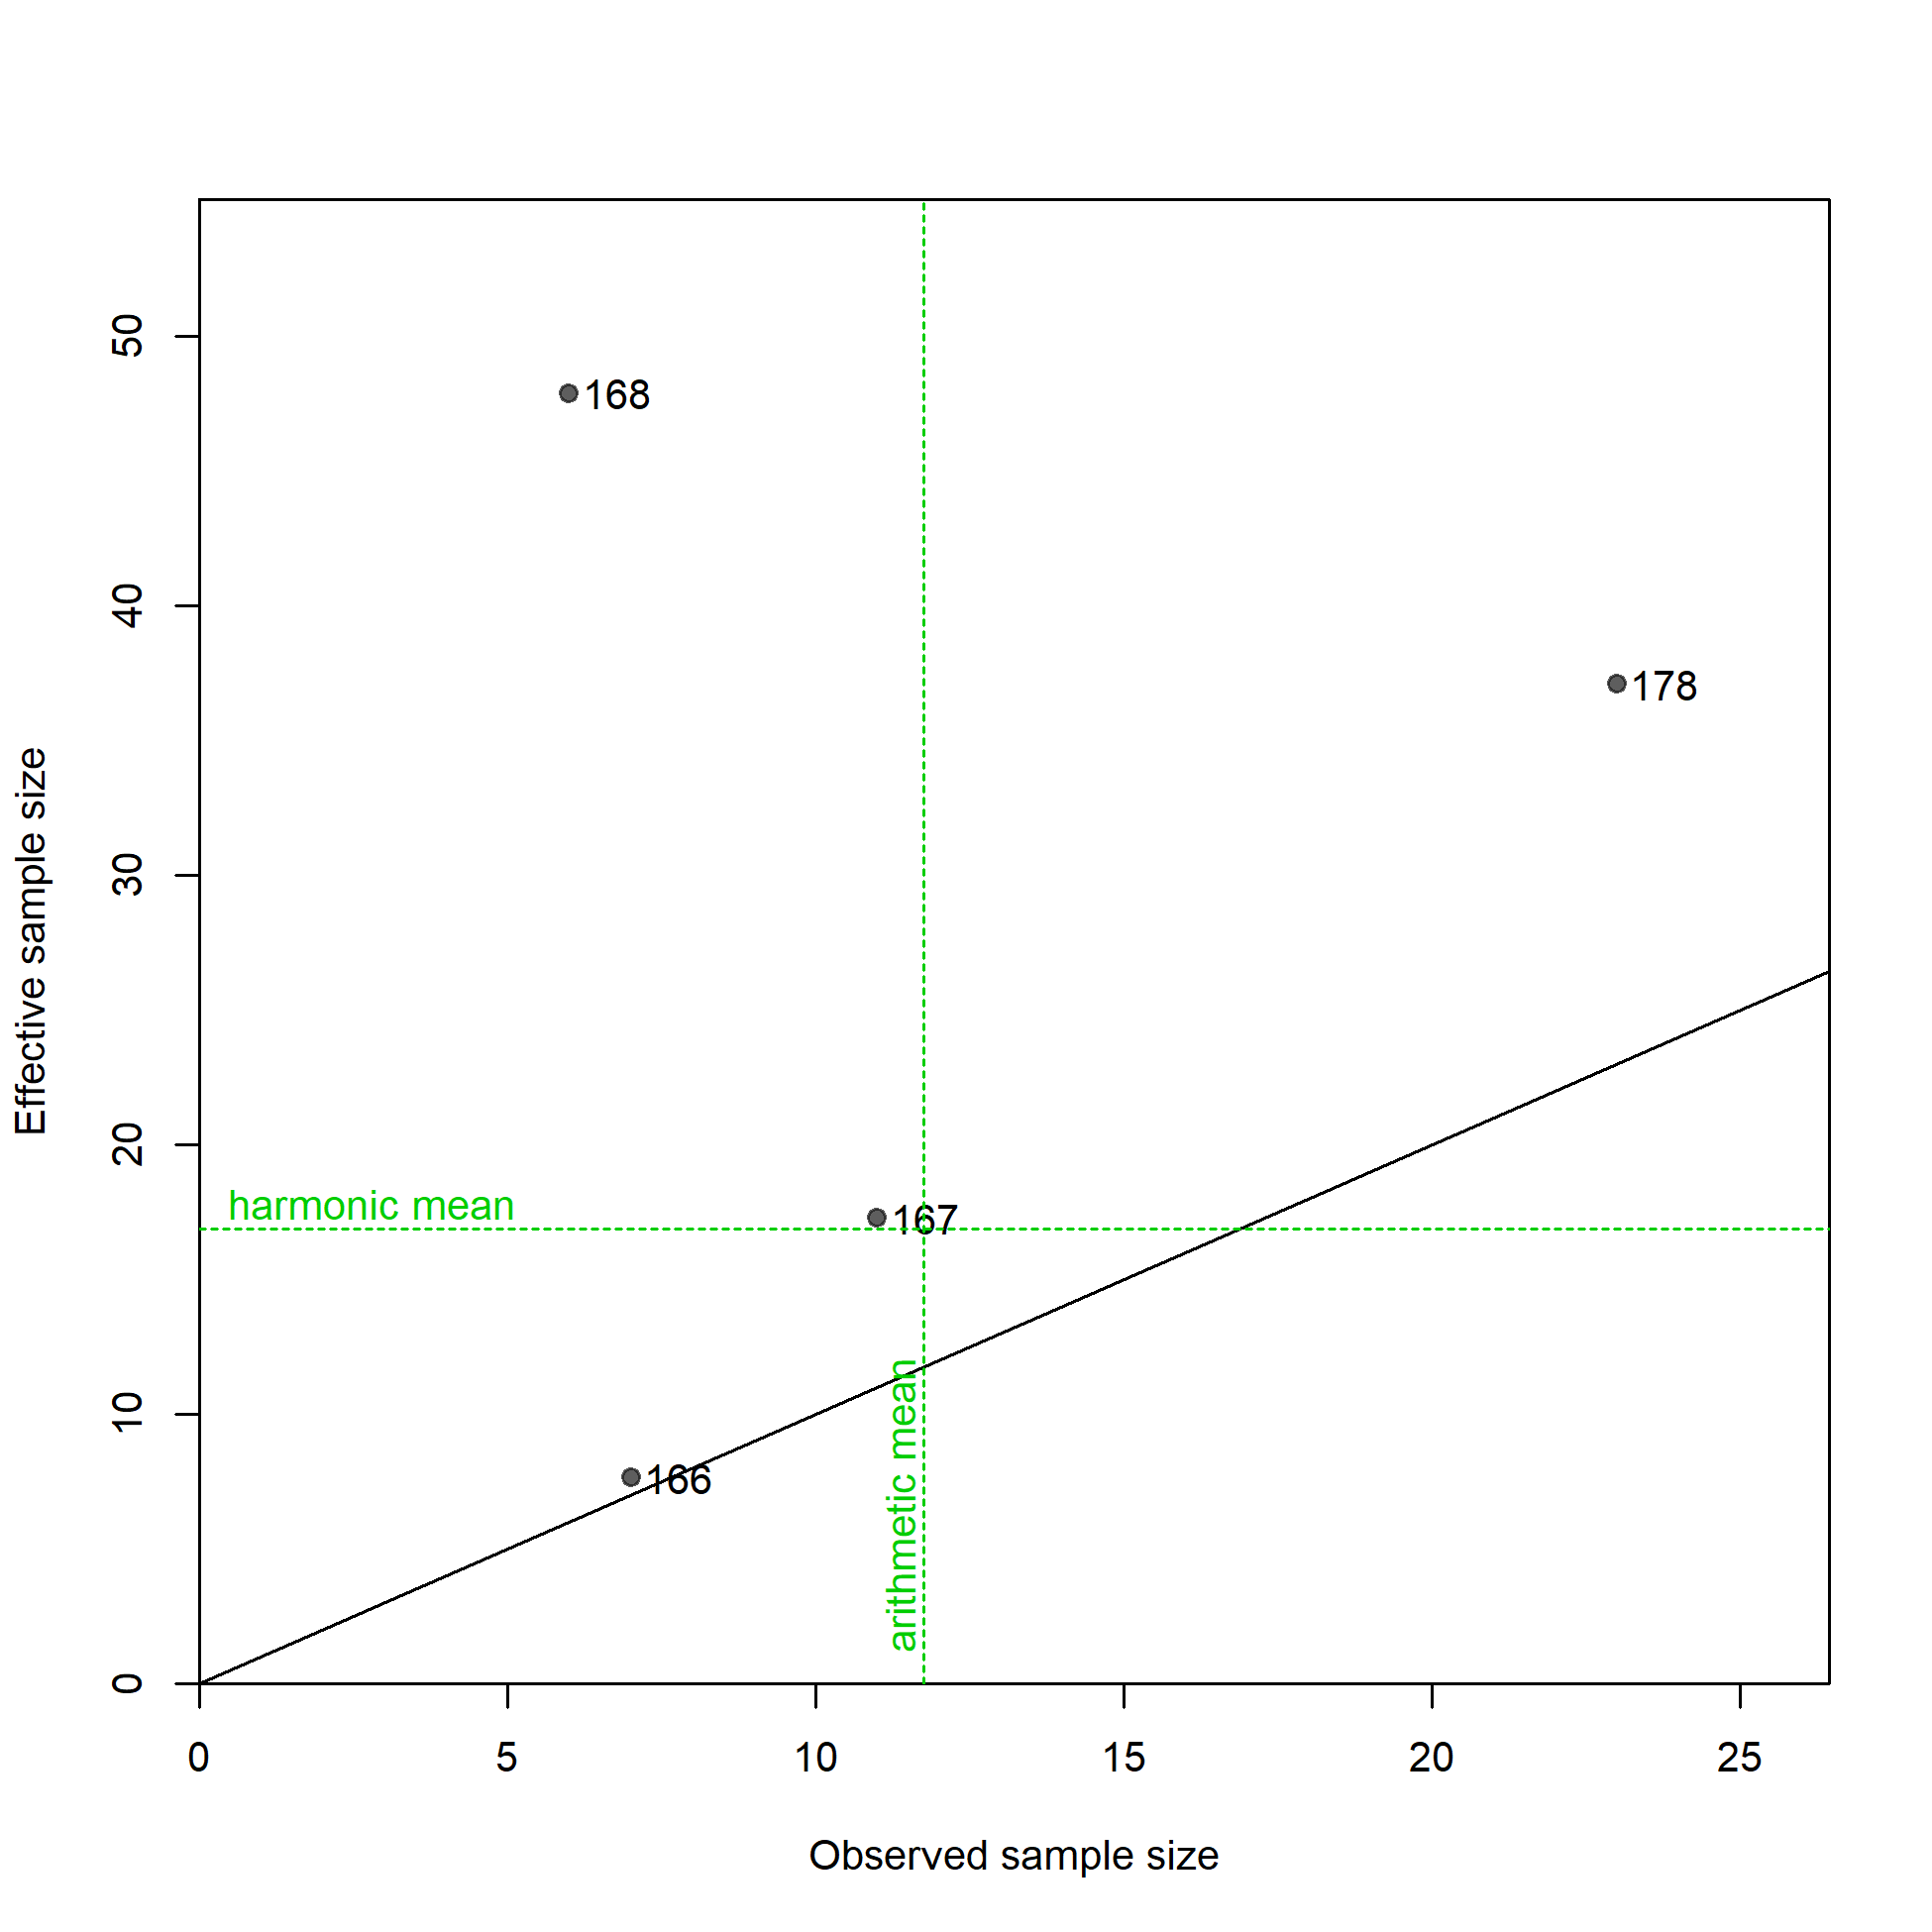
N-EffN comparison, Length comps, whole catch, NOA-A1
file: comp_lenfit_sampsize_flt21mkt0.png
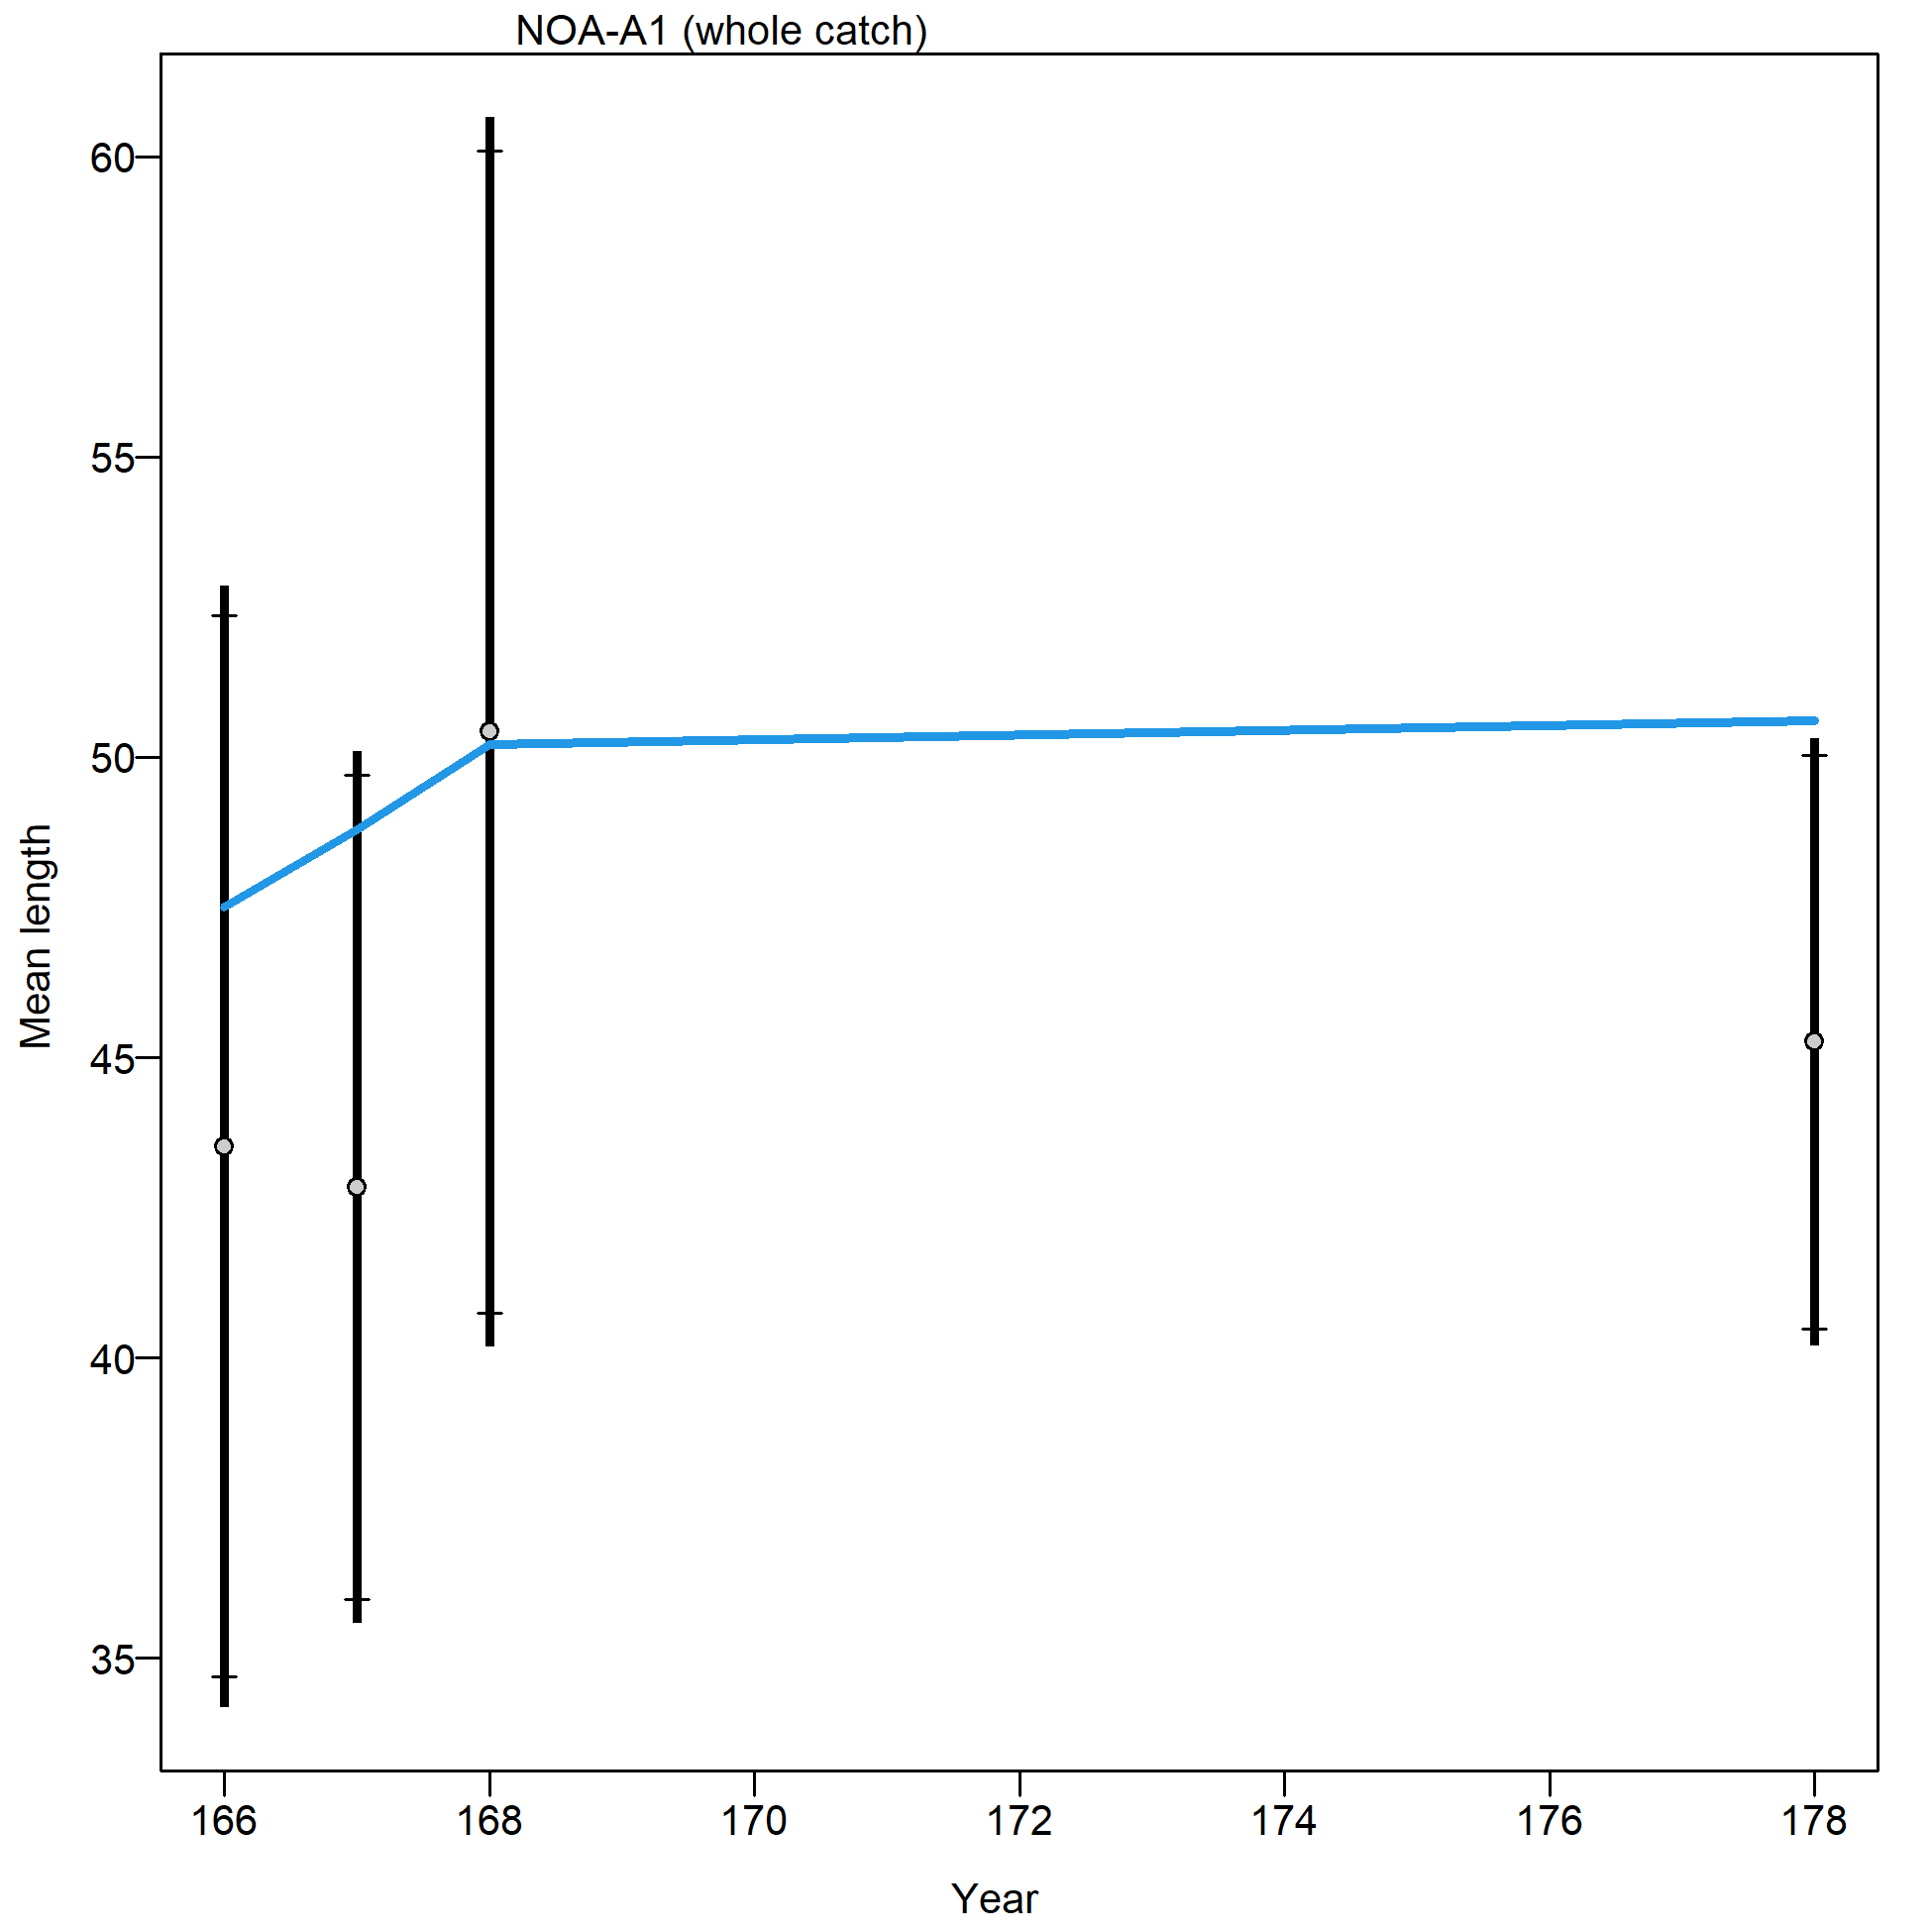
Mean length for NOA-A1 with 95% confidence intervals based on current sample sizes.
Francis data weighting method TA1.8: thinner intervals (with capped ends) show result of further adjusting sample sizes based on suggested multiplier (with 95% interval) for len data from NOA-A1:
1.119 (0.7902-17.4567)
For more info, see Francis (2011).
file: comp_lenfit_data_weighting_TA1.8_NOA-A1.png
Length comps, whole catch, NOA-A2 (plot 1 of 3).
'N adj.' is the input sample size after data-weighting adjustment. N eff. is the calculated effective sample size used in the McAllister-Ianelli tuning method.
file: comp_lenfit_flt22mkt0_page1.png
Length comps, whole catch, NOA-A2 (plot 1 of 3).
'N adj.' is the input sample size after data-weighting adjustment. N eff. is the calculated effective sample size used in the McAllister-Ianelli tuning method. (plot 2 of 3)
file: comp_lenfit_flt22mkt0_page2.png
Length comps, whole catch, NOA-A2 (plot 1 of 3).
'N adj.' is the input sample size after data-weighting adjustment. N eff. is the calculated effective sample size used in the McAllister-Ianelli tuning method. (plot 2 of 3) (plot 3 of 3)
file: comp_lenfit_flt22mkt0_page3.png
Pearson residuals, whole catch, NOA-A2 (max=26.82) (plot 3 of 3)
Closed bubbles are positive residuals (observed > expected) and open bubbles are negative residuals (observed < expected).
file: comp_lenfit_residsflt22mkt0_page3.png
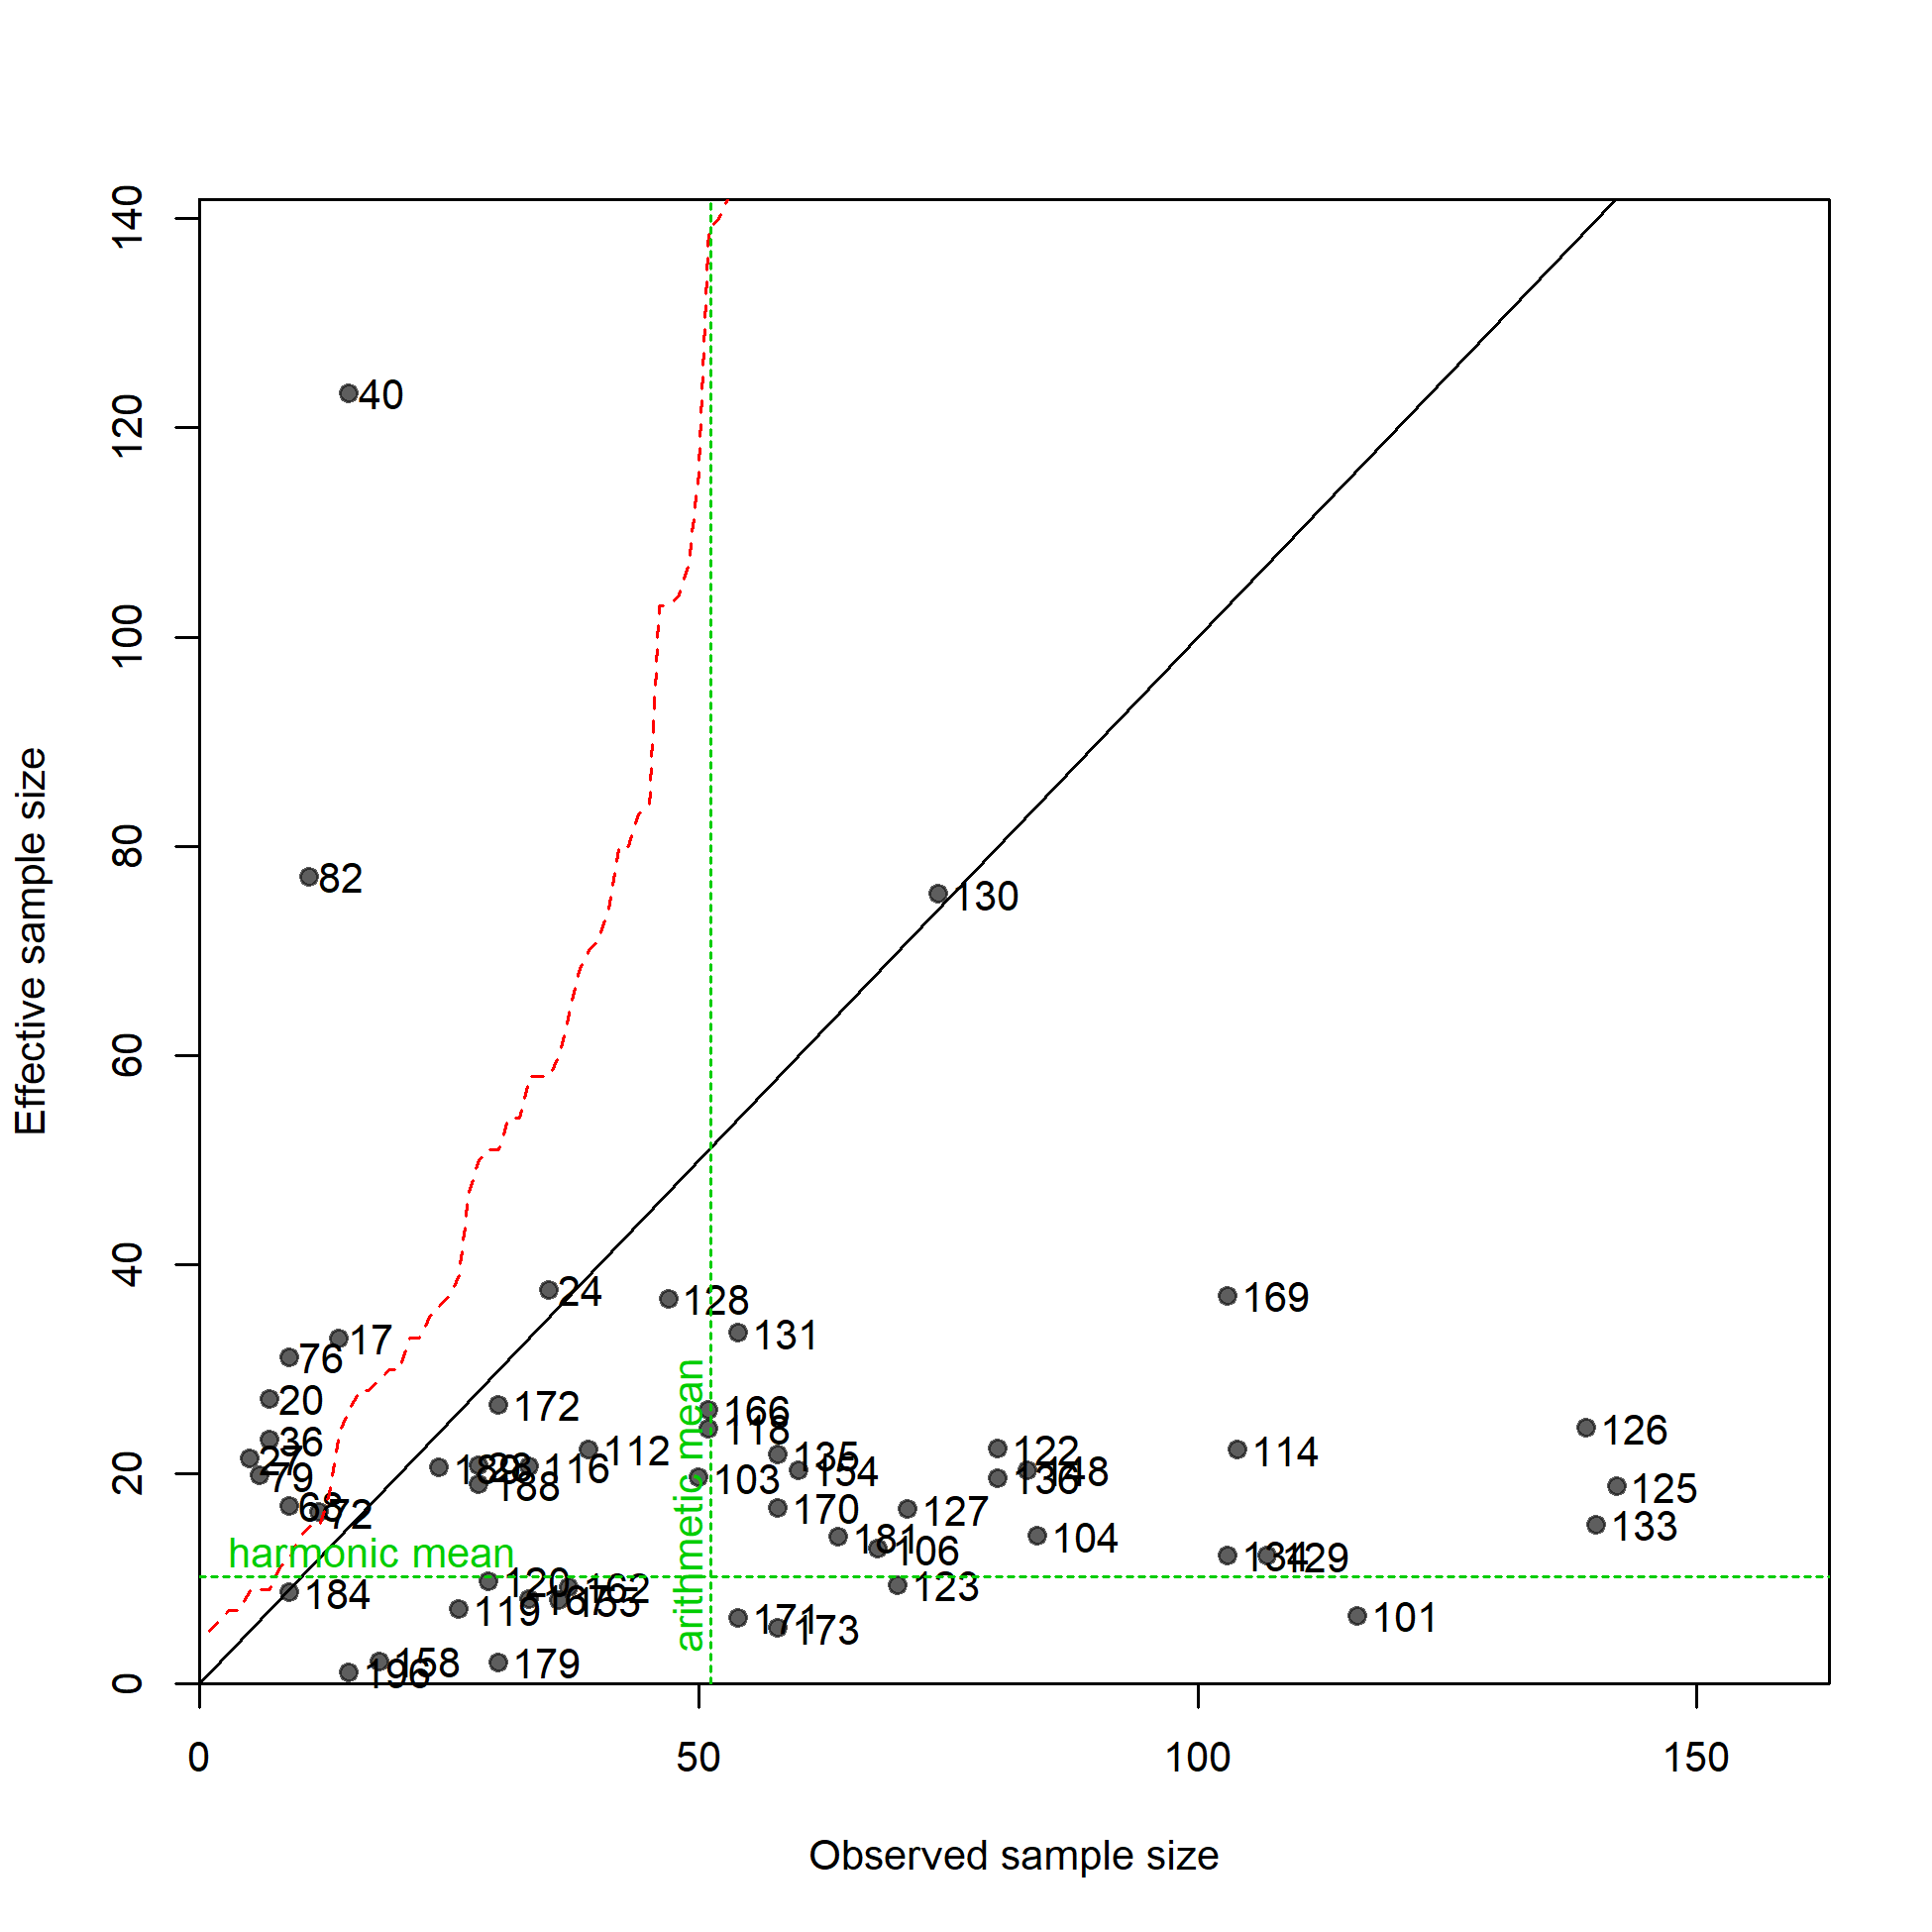
N-EffN comparison, Length comps, whole catch, NOA-A2
file: comp_lenfit_sampsize_flt22mkt0.png
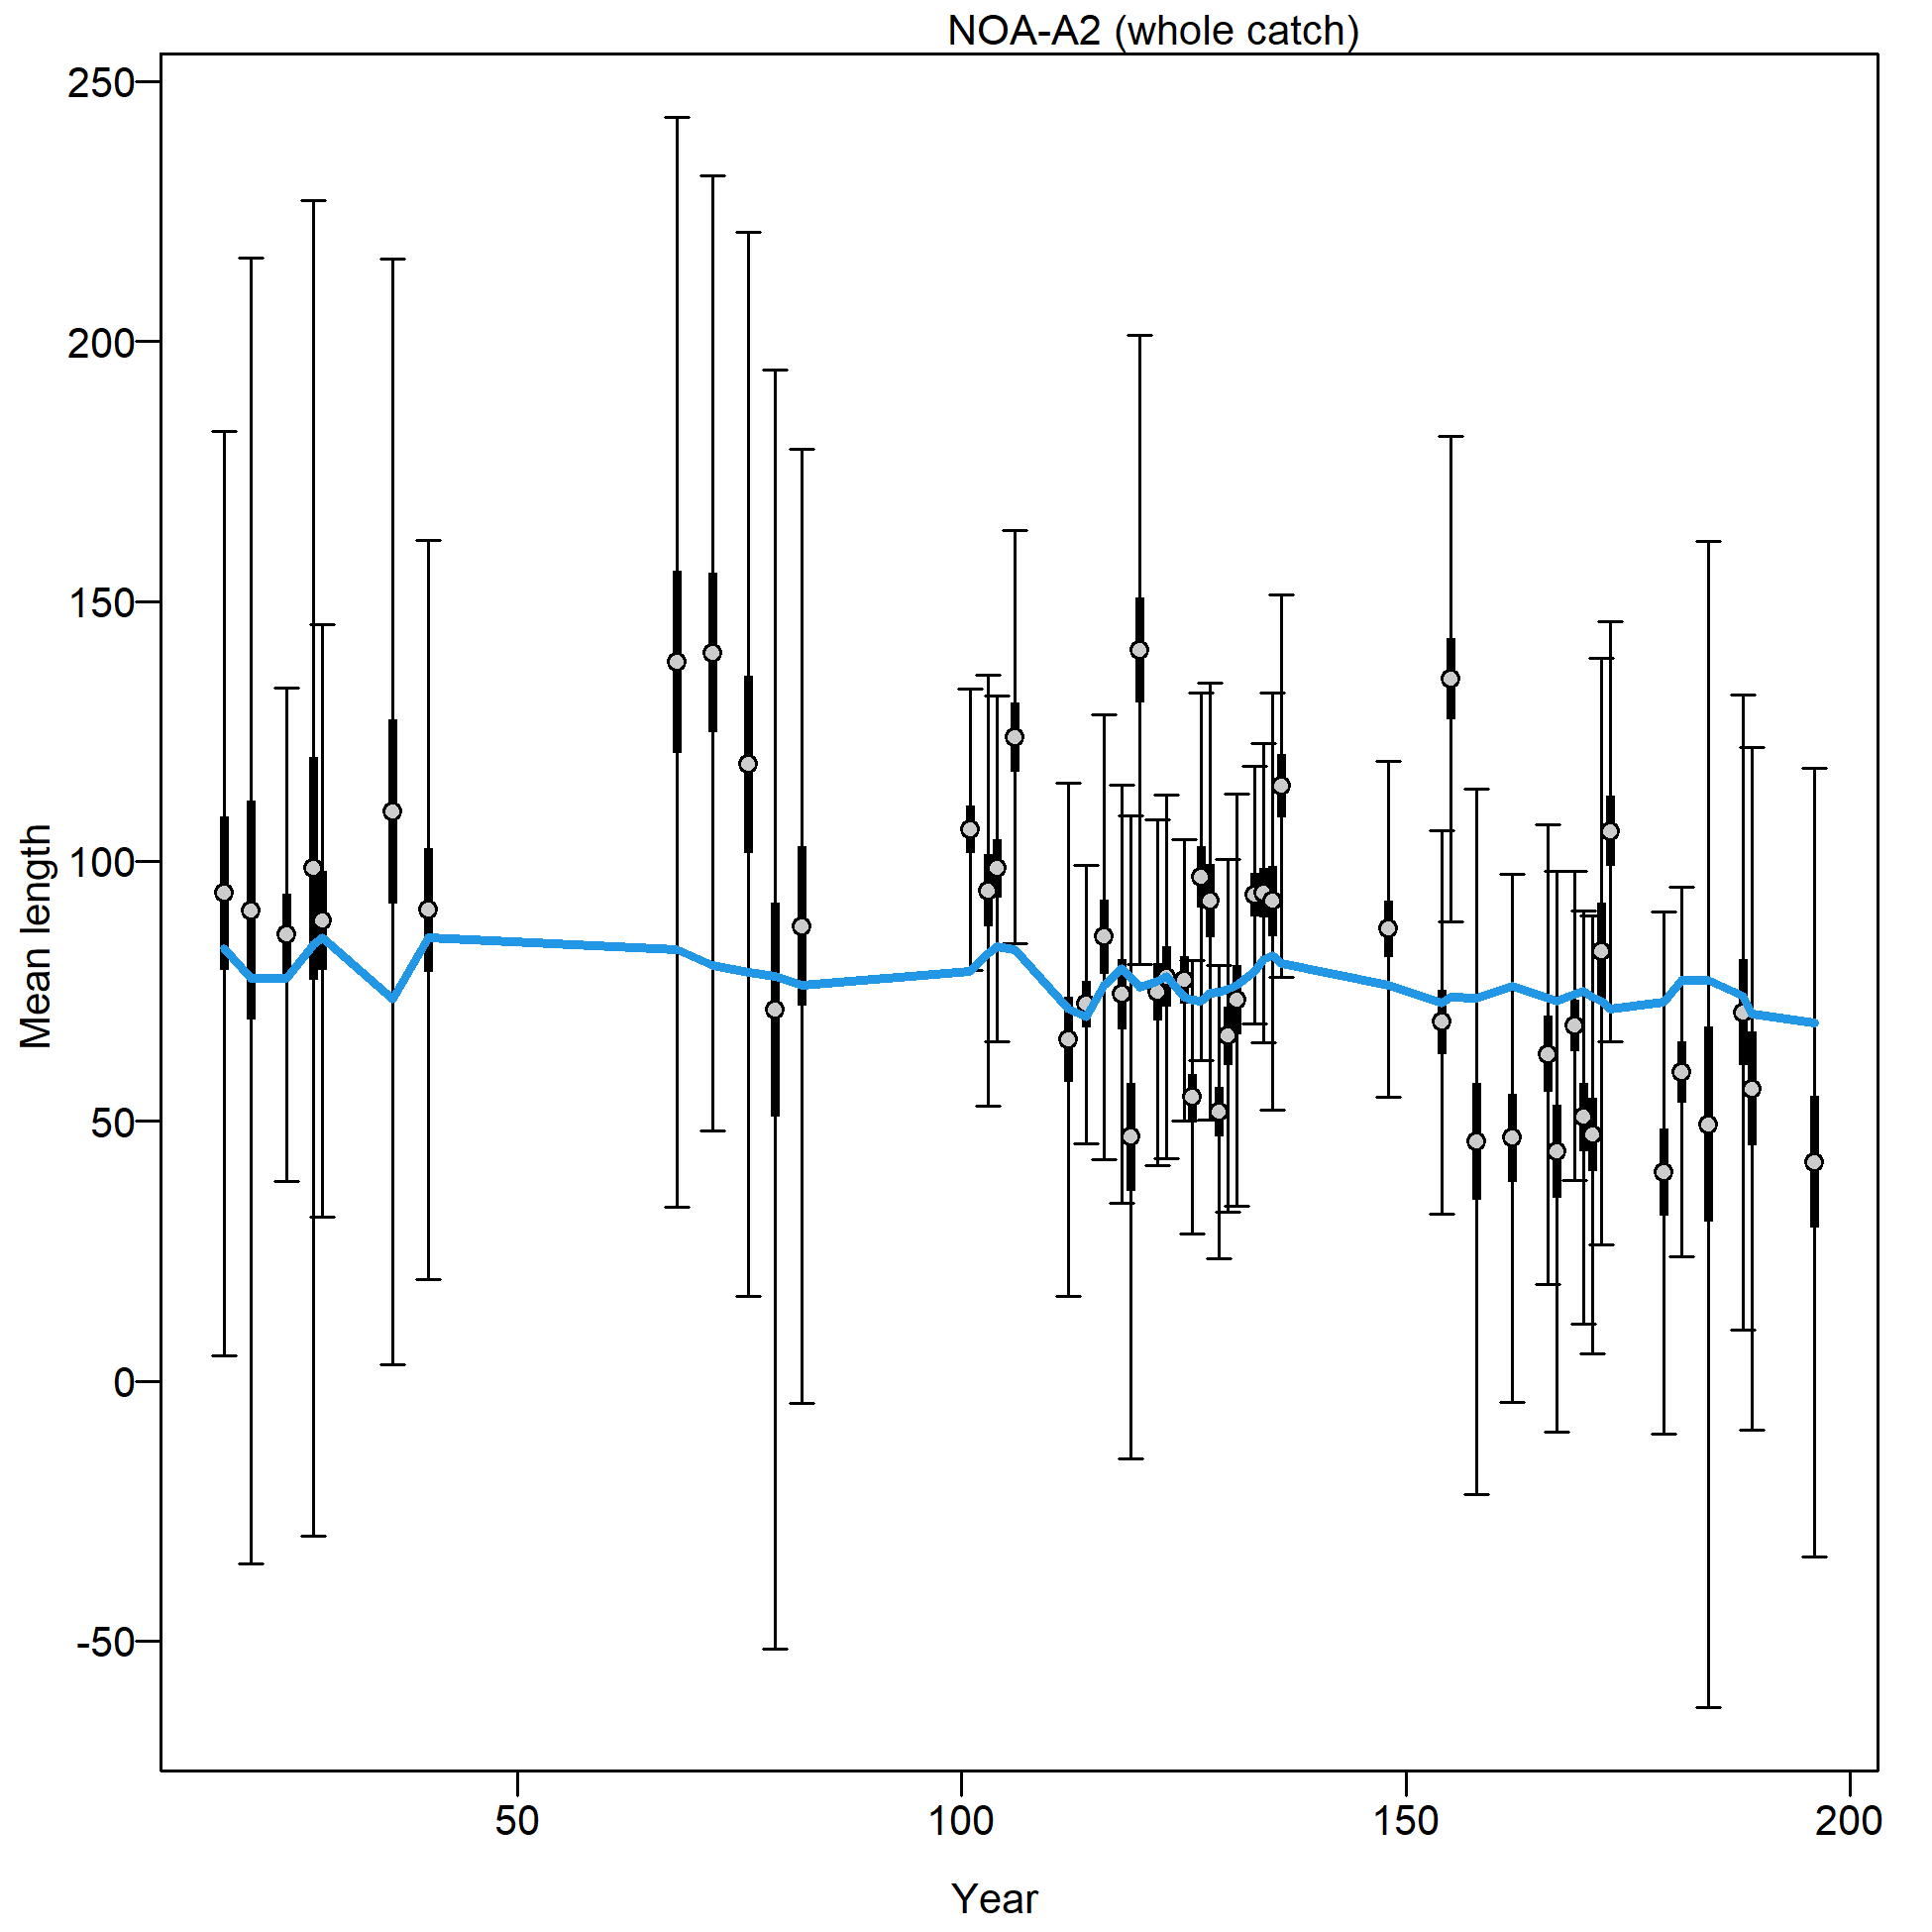
Mean length for NOA-A2 with 95% confidence intervals based on current sample sizes.
Francis data weighting method TA1.8: thinner intervals (with capped ends) show result of further adjusting sample sizes based on suggested multiplier (with 95% interval) for len data from NOA-A2:
0.0279 (0.0209-0.0427)
For more info, see Francis (2011).
file: comp_lenfit_data_weighting_TA1.8_NOA-A2.png