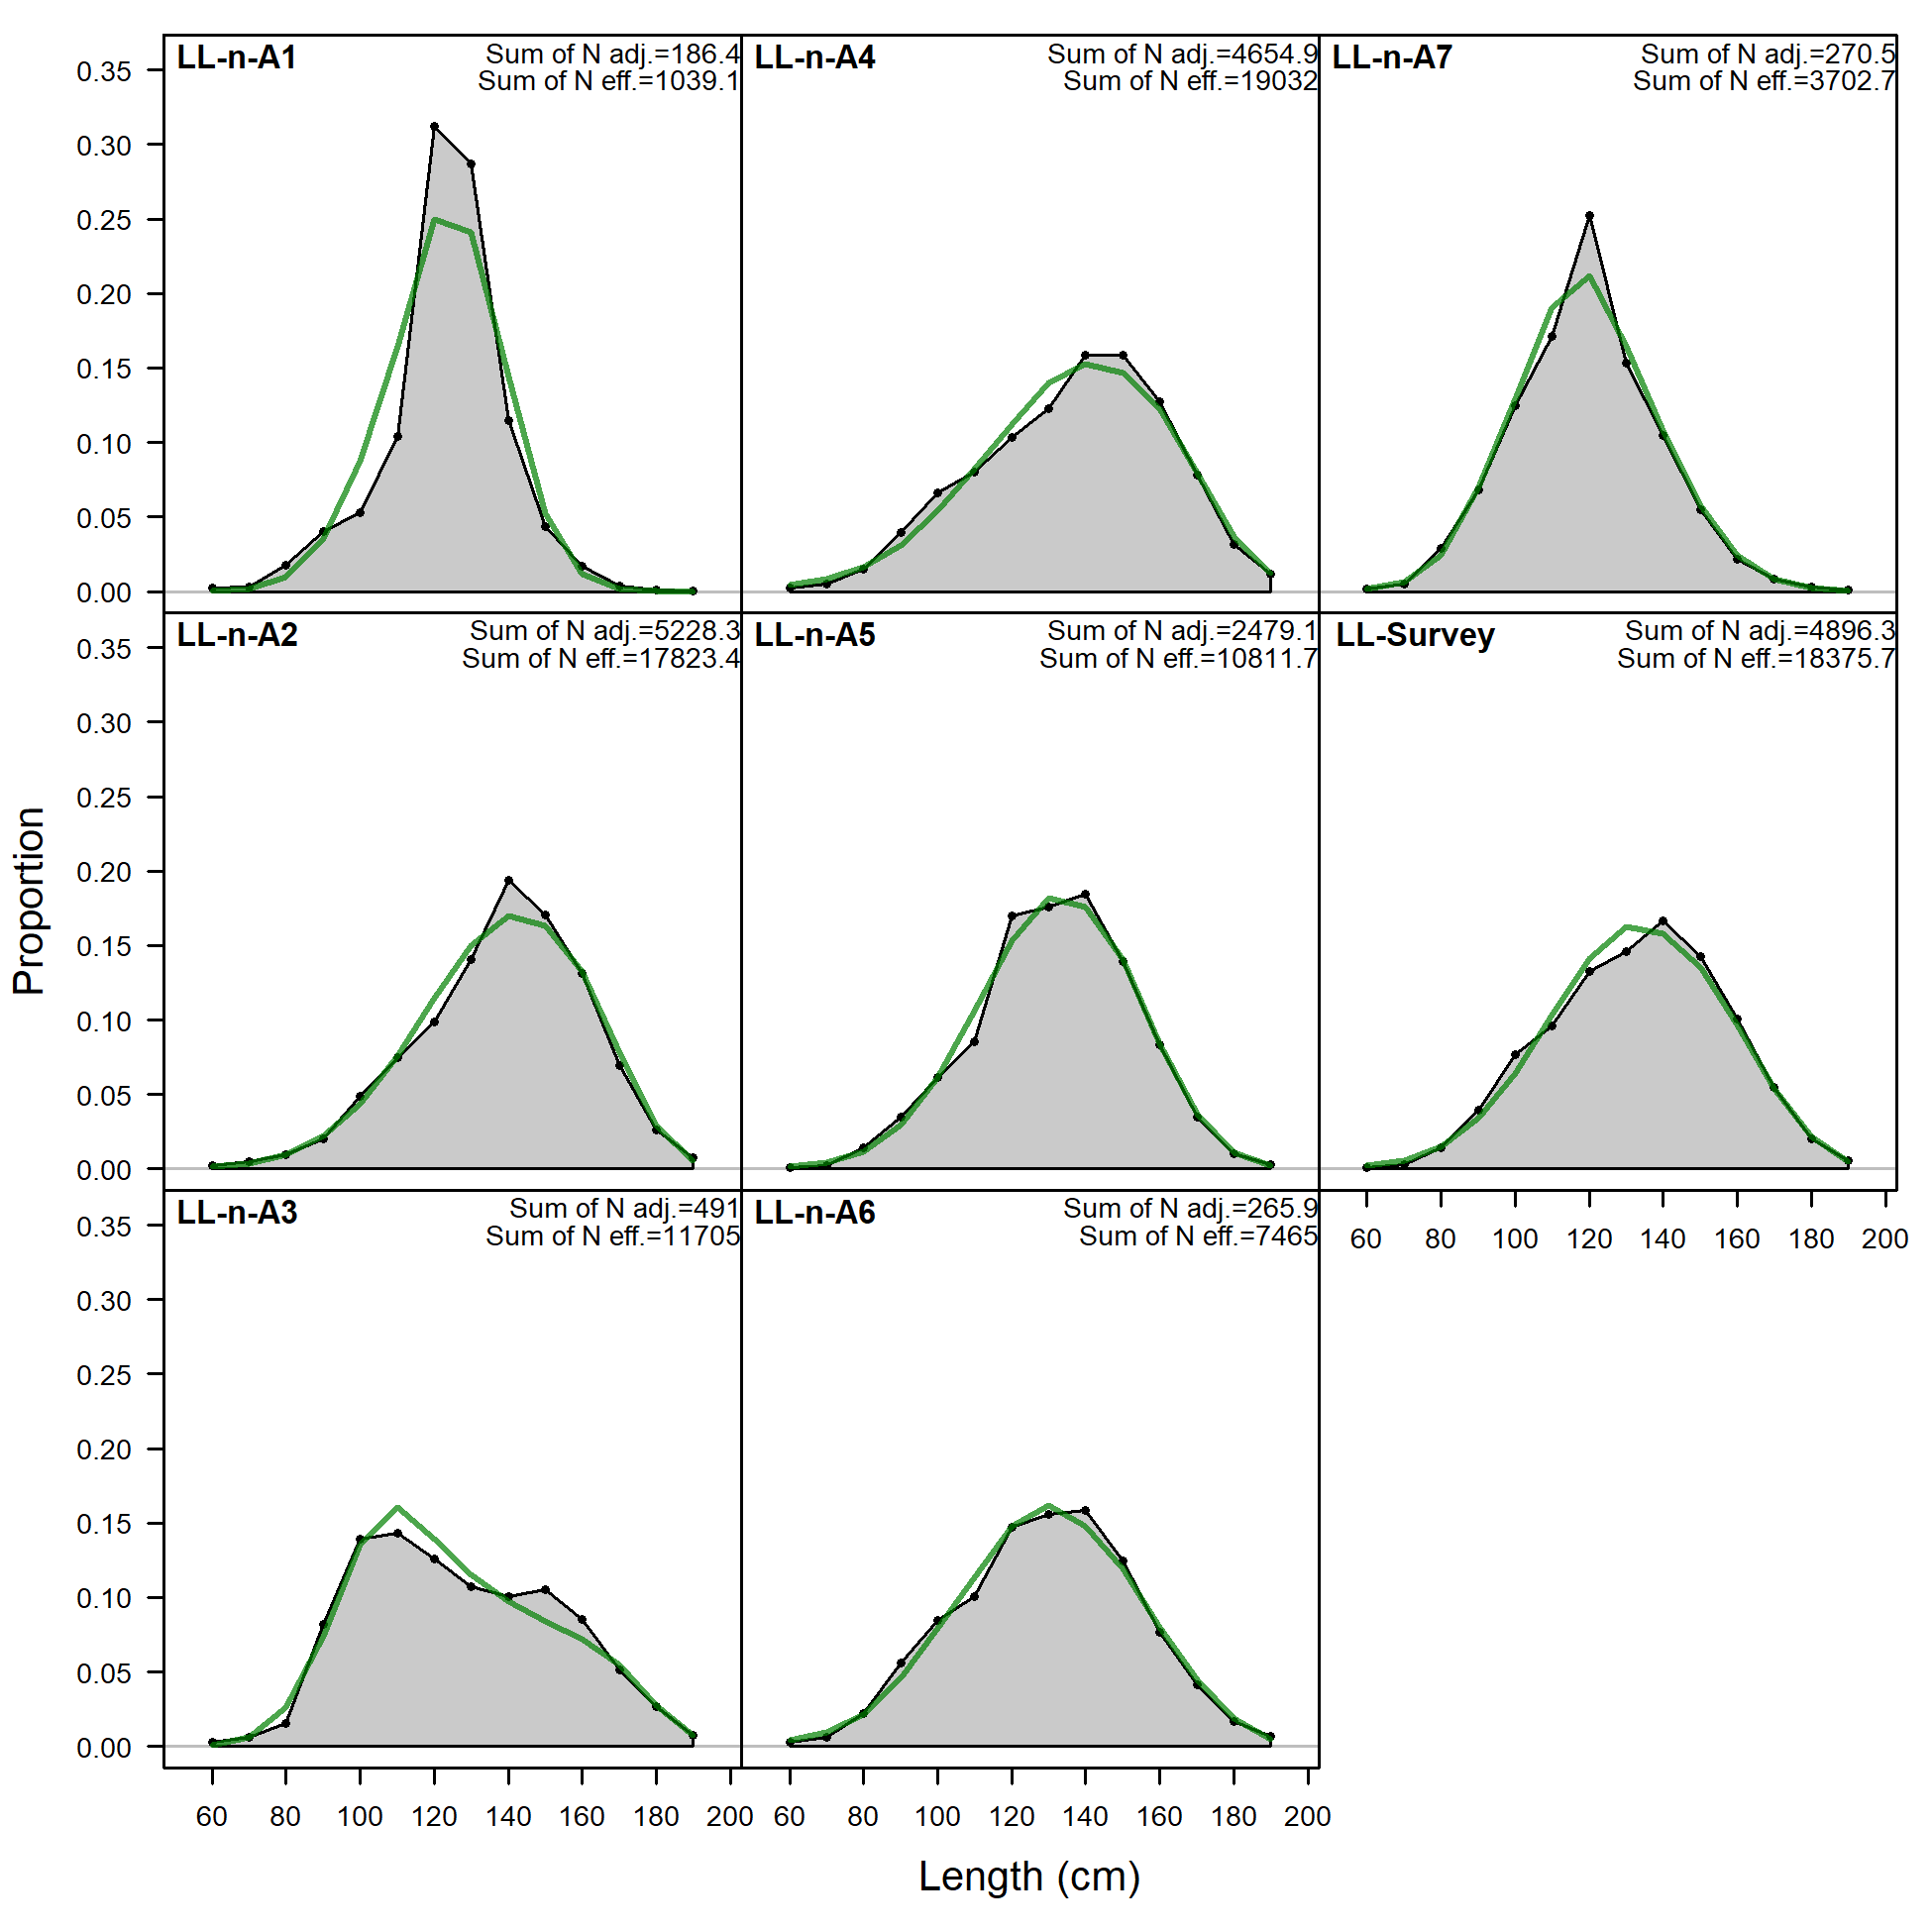
Size comps, aggregated across time by fleet.
Labels 'retained' and 'discard' indicate discarded or retained sampled for each fleet. Panels without this designation represent the whole catch.
file: comp_sizefit__aggregated_across_time.png
Size comps, aggregated across time by fleet.
Labels 'retained' and 'discard' indicate discarded or retained sampled for each fleet. Panels without this designation represent the whole catch.
file: comp_sizefit__aggregated_across_time.png
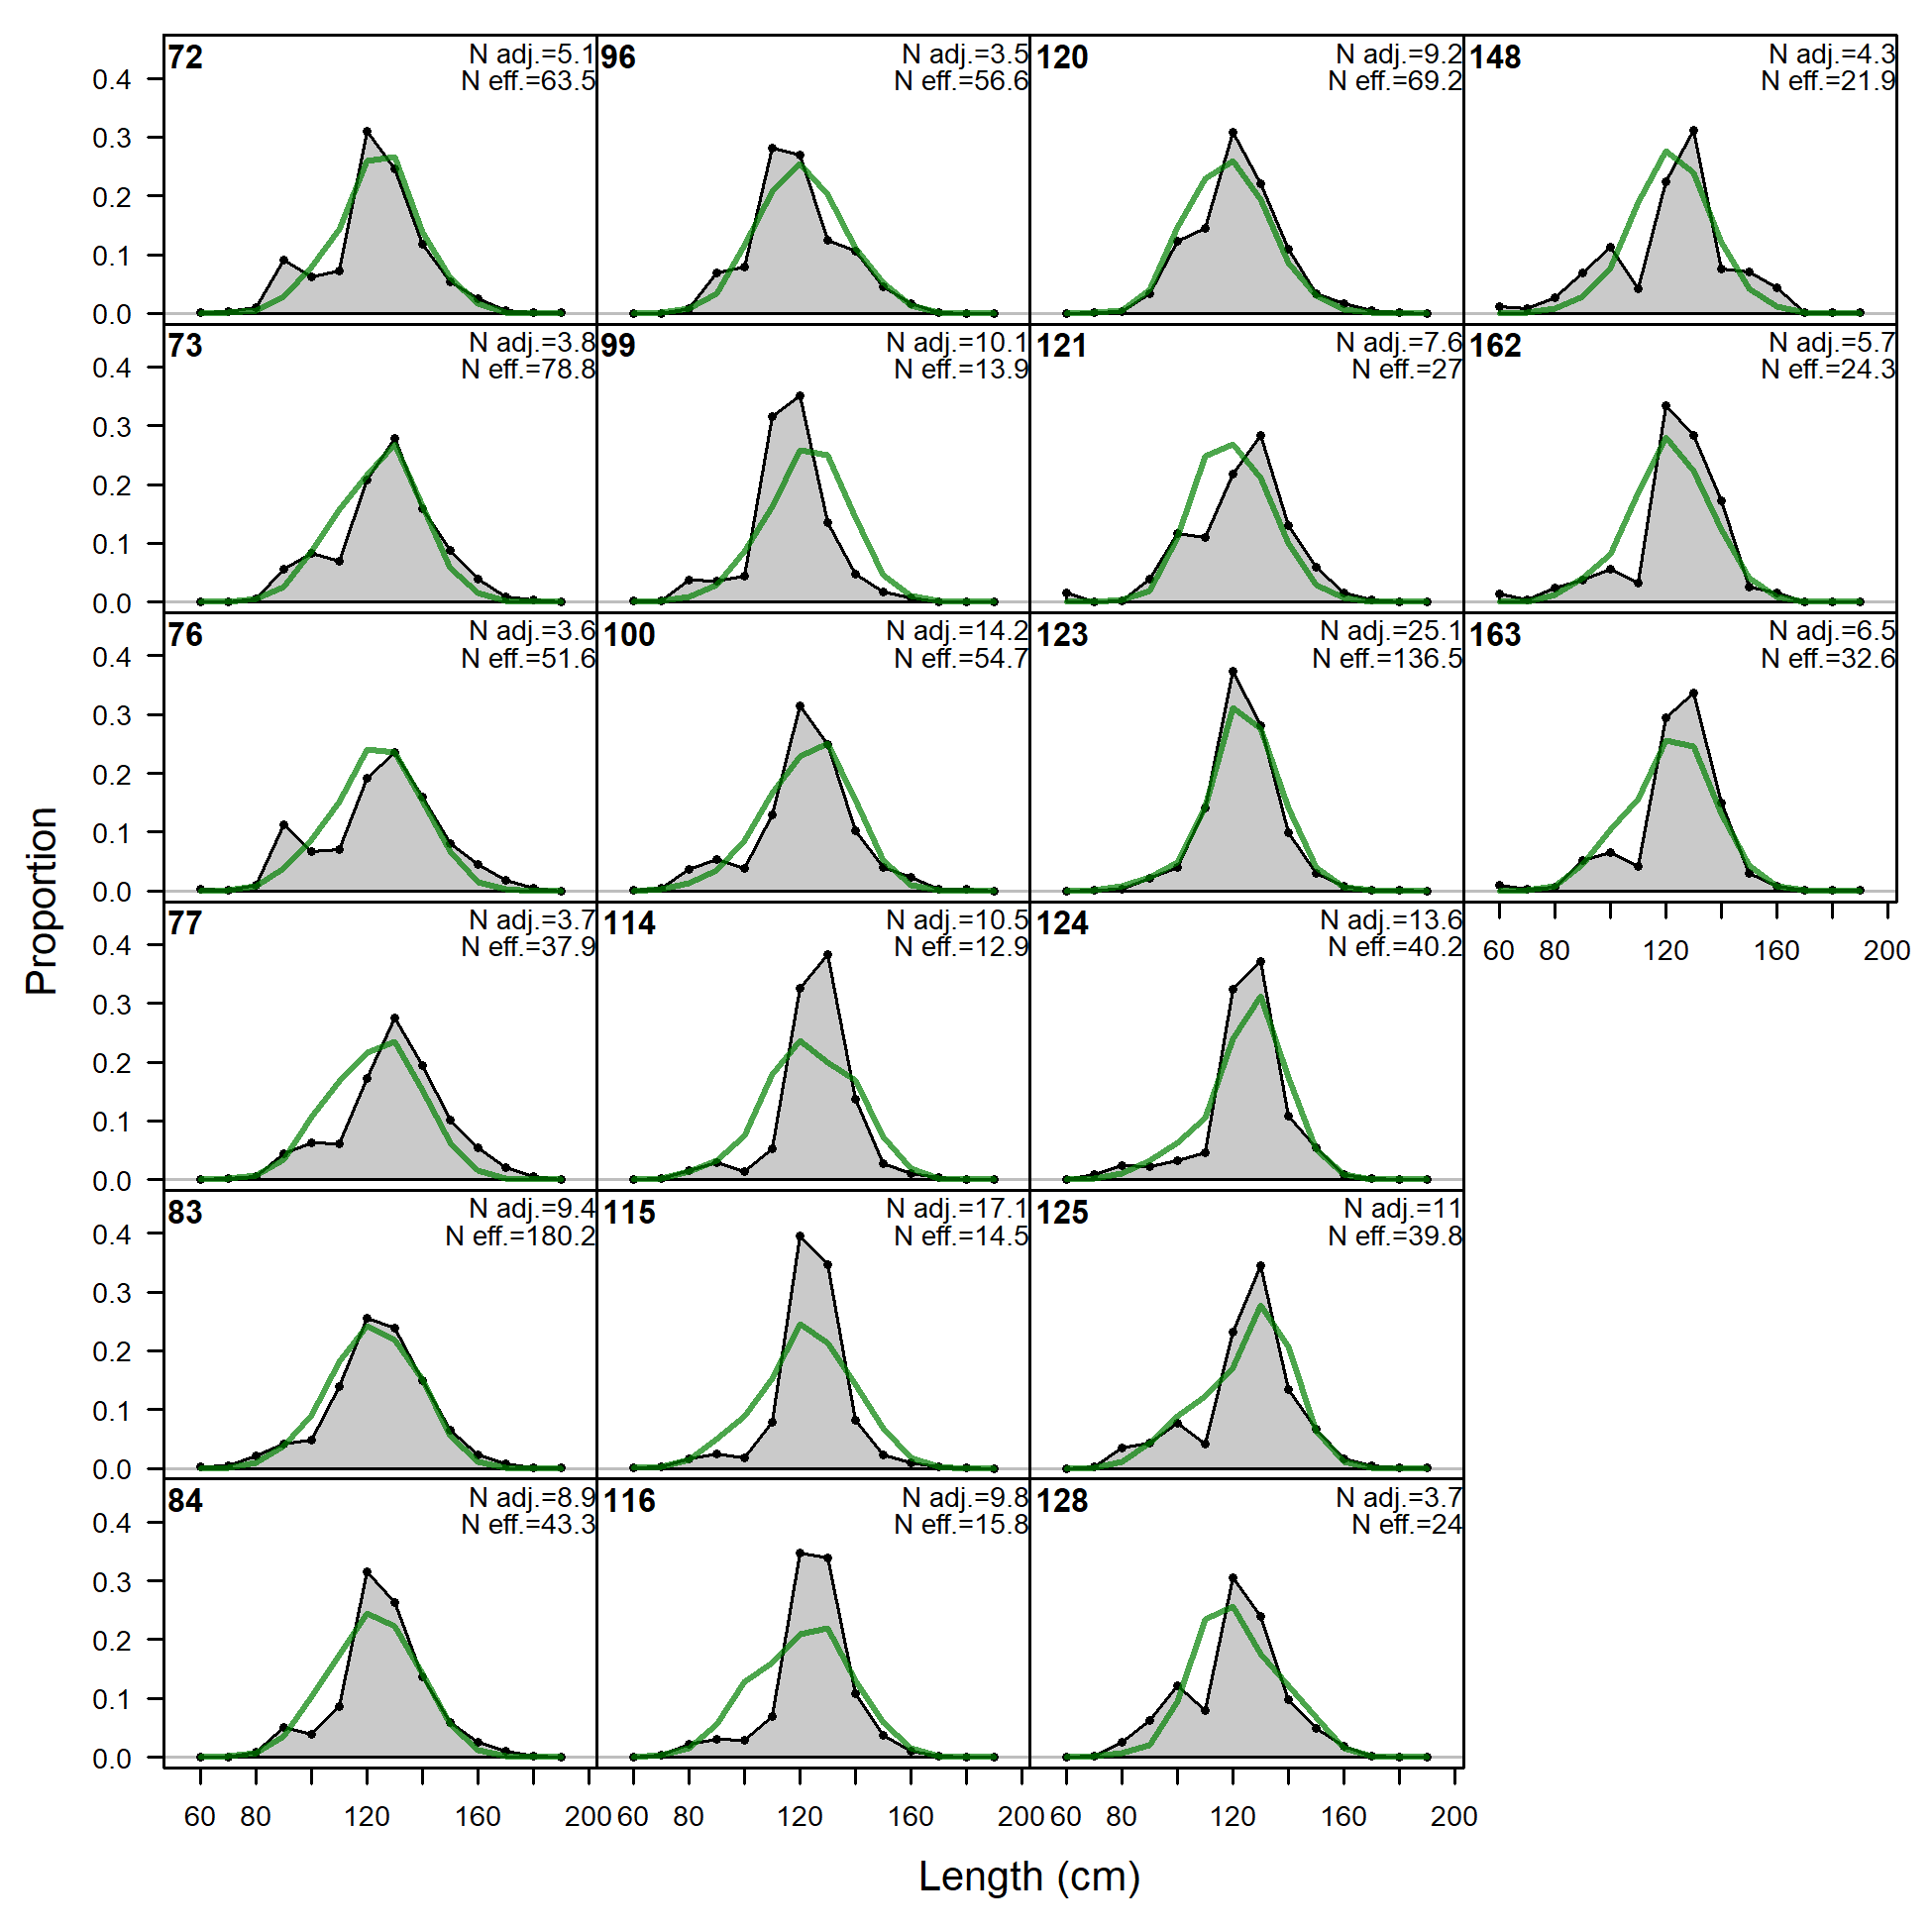
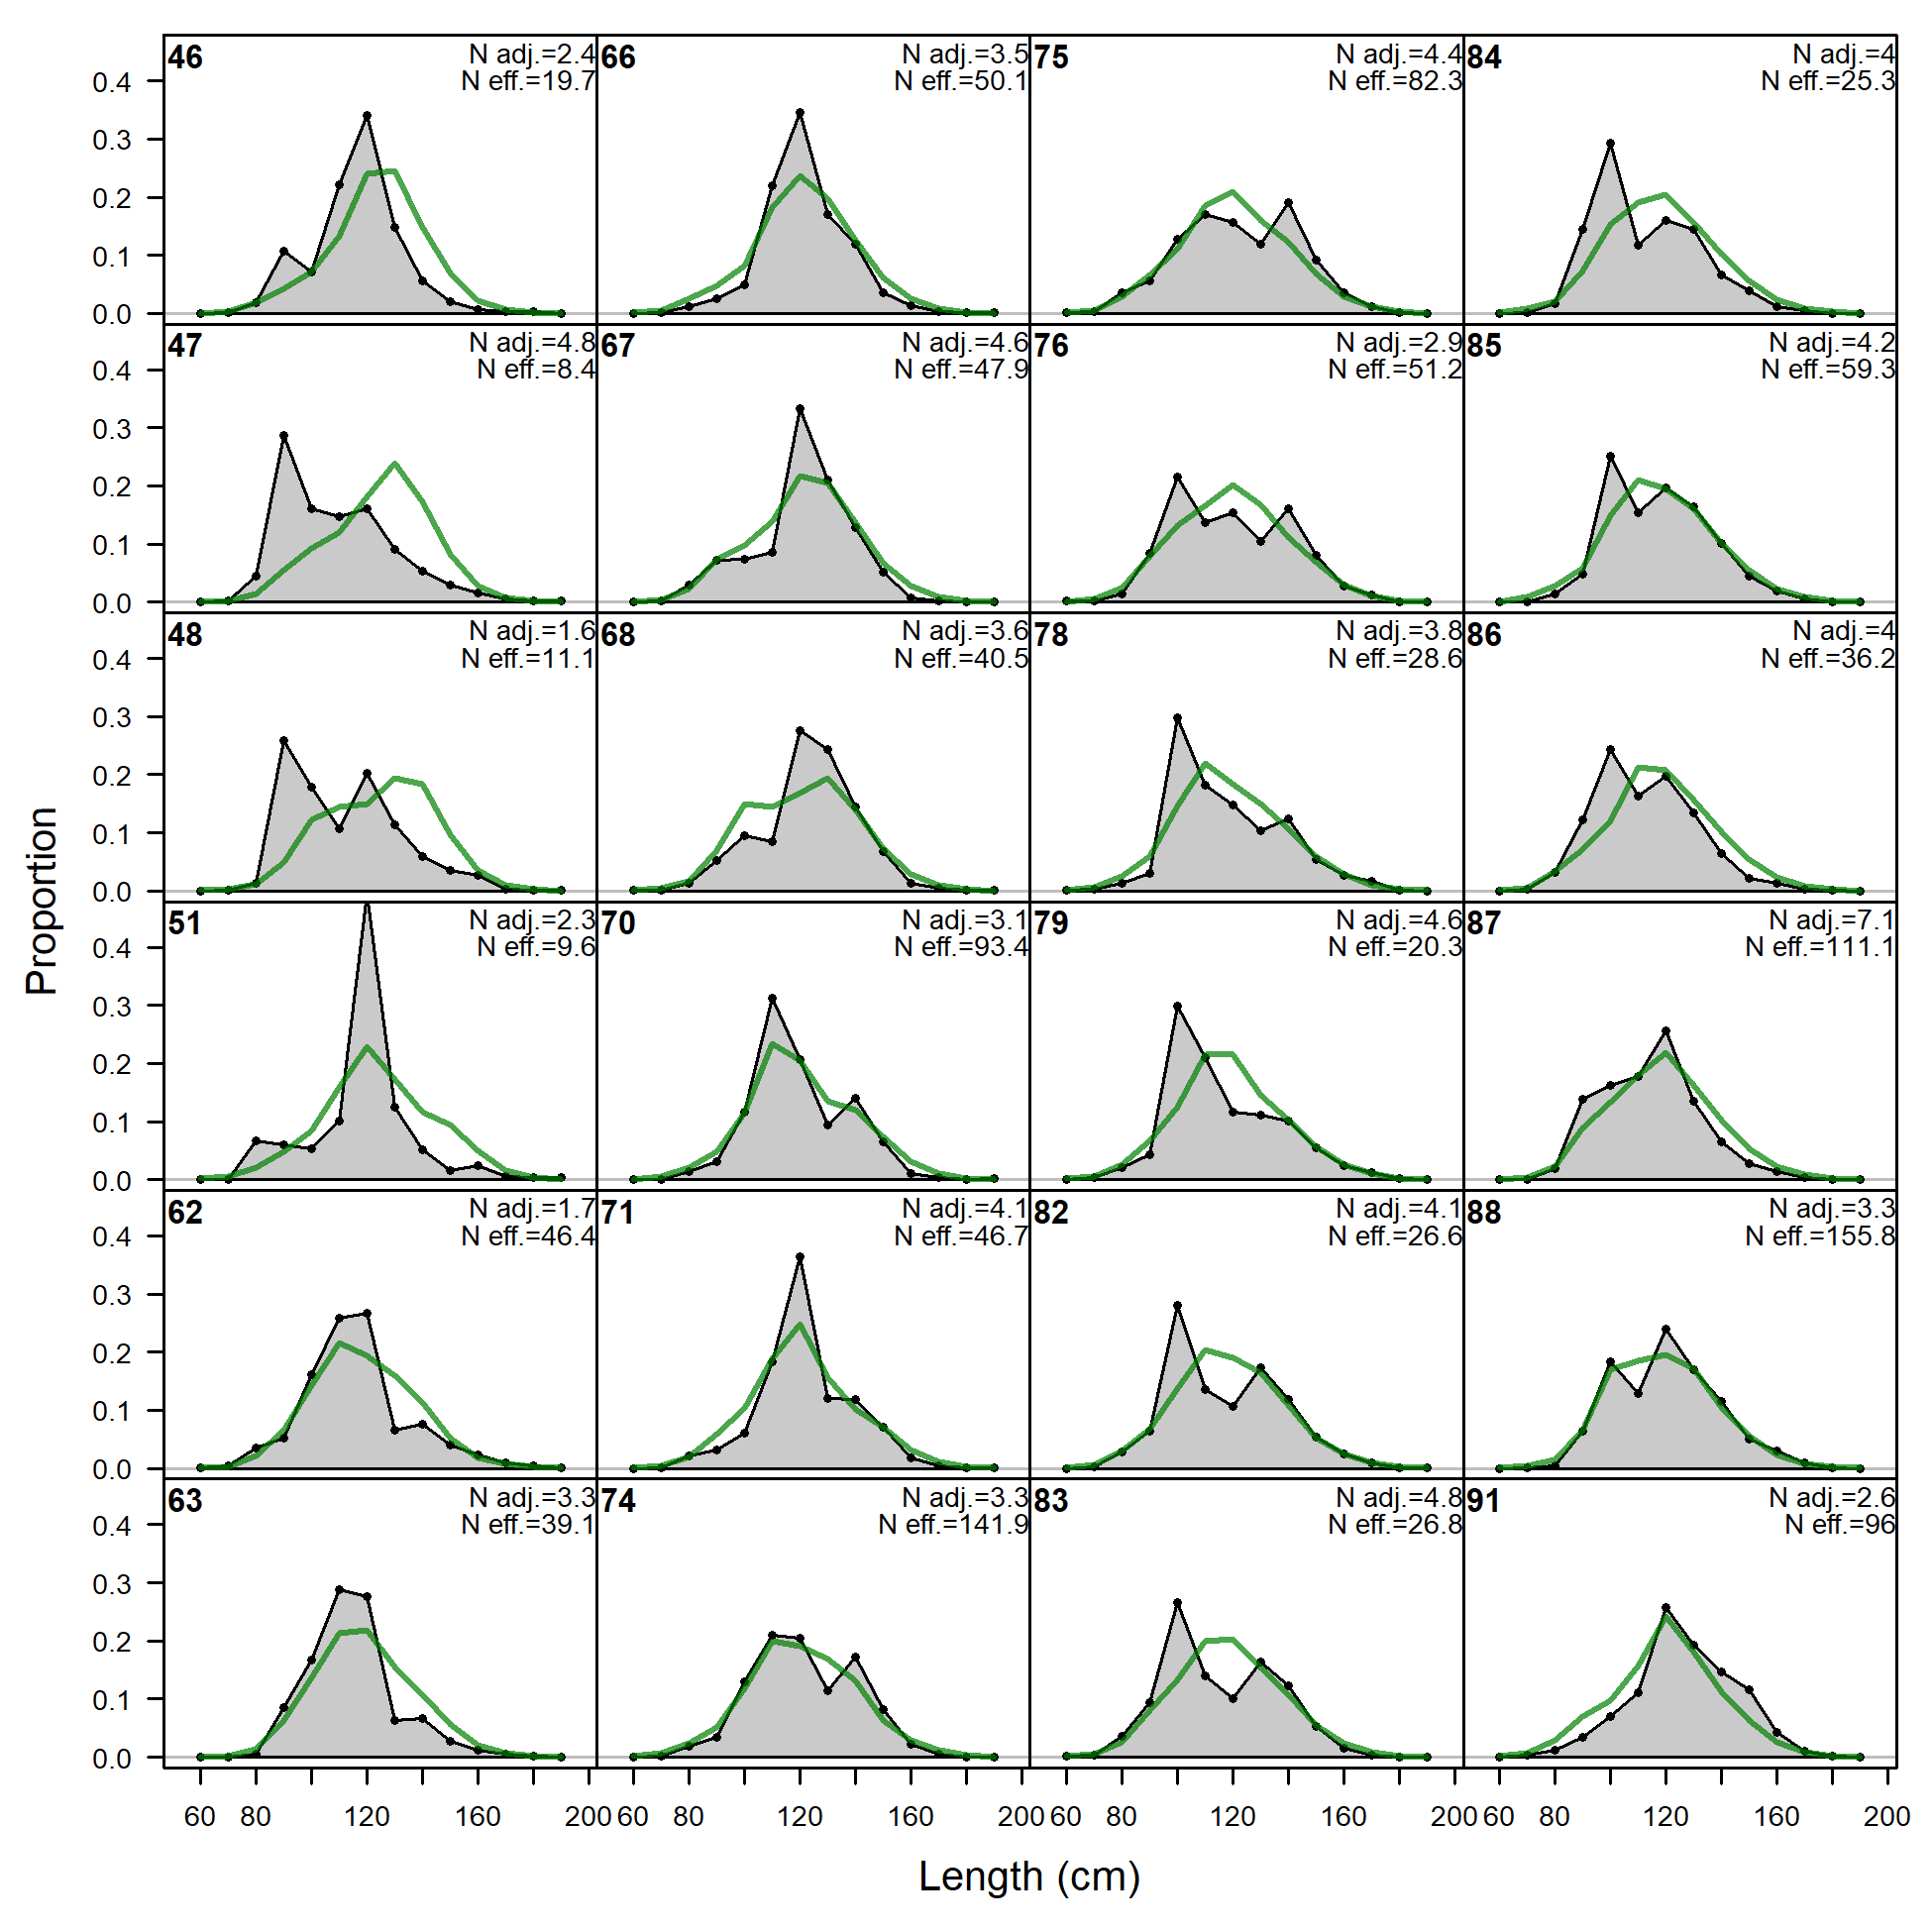
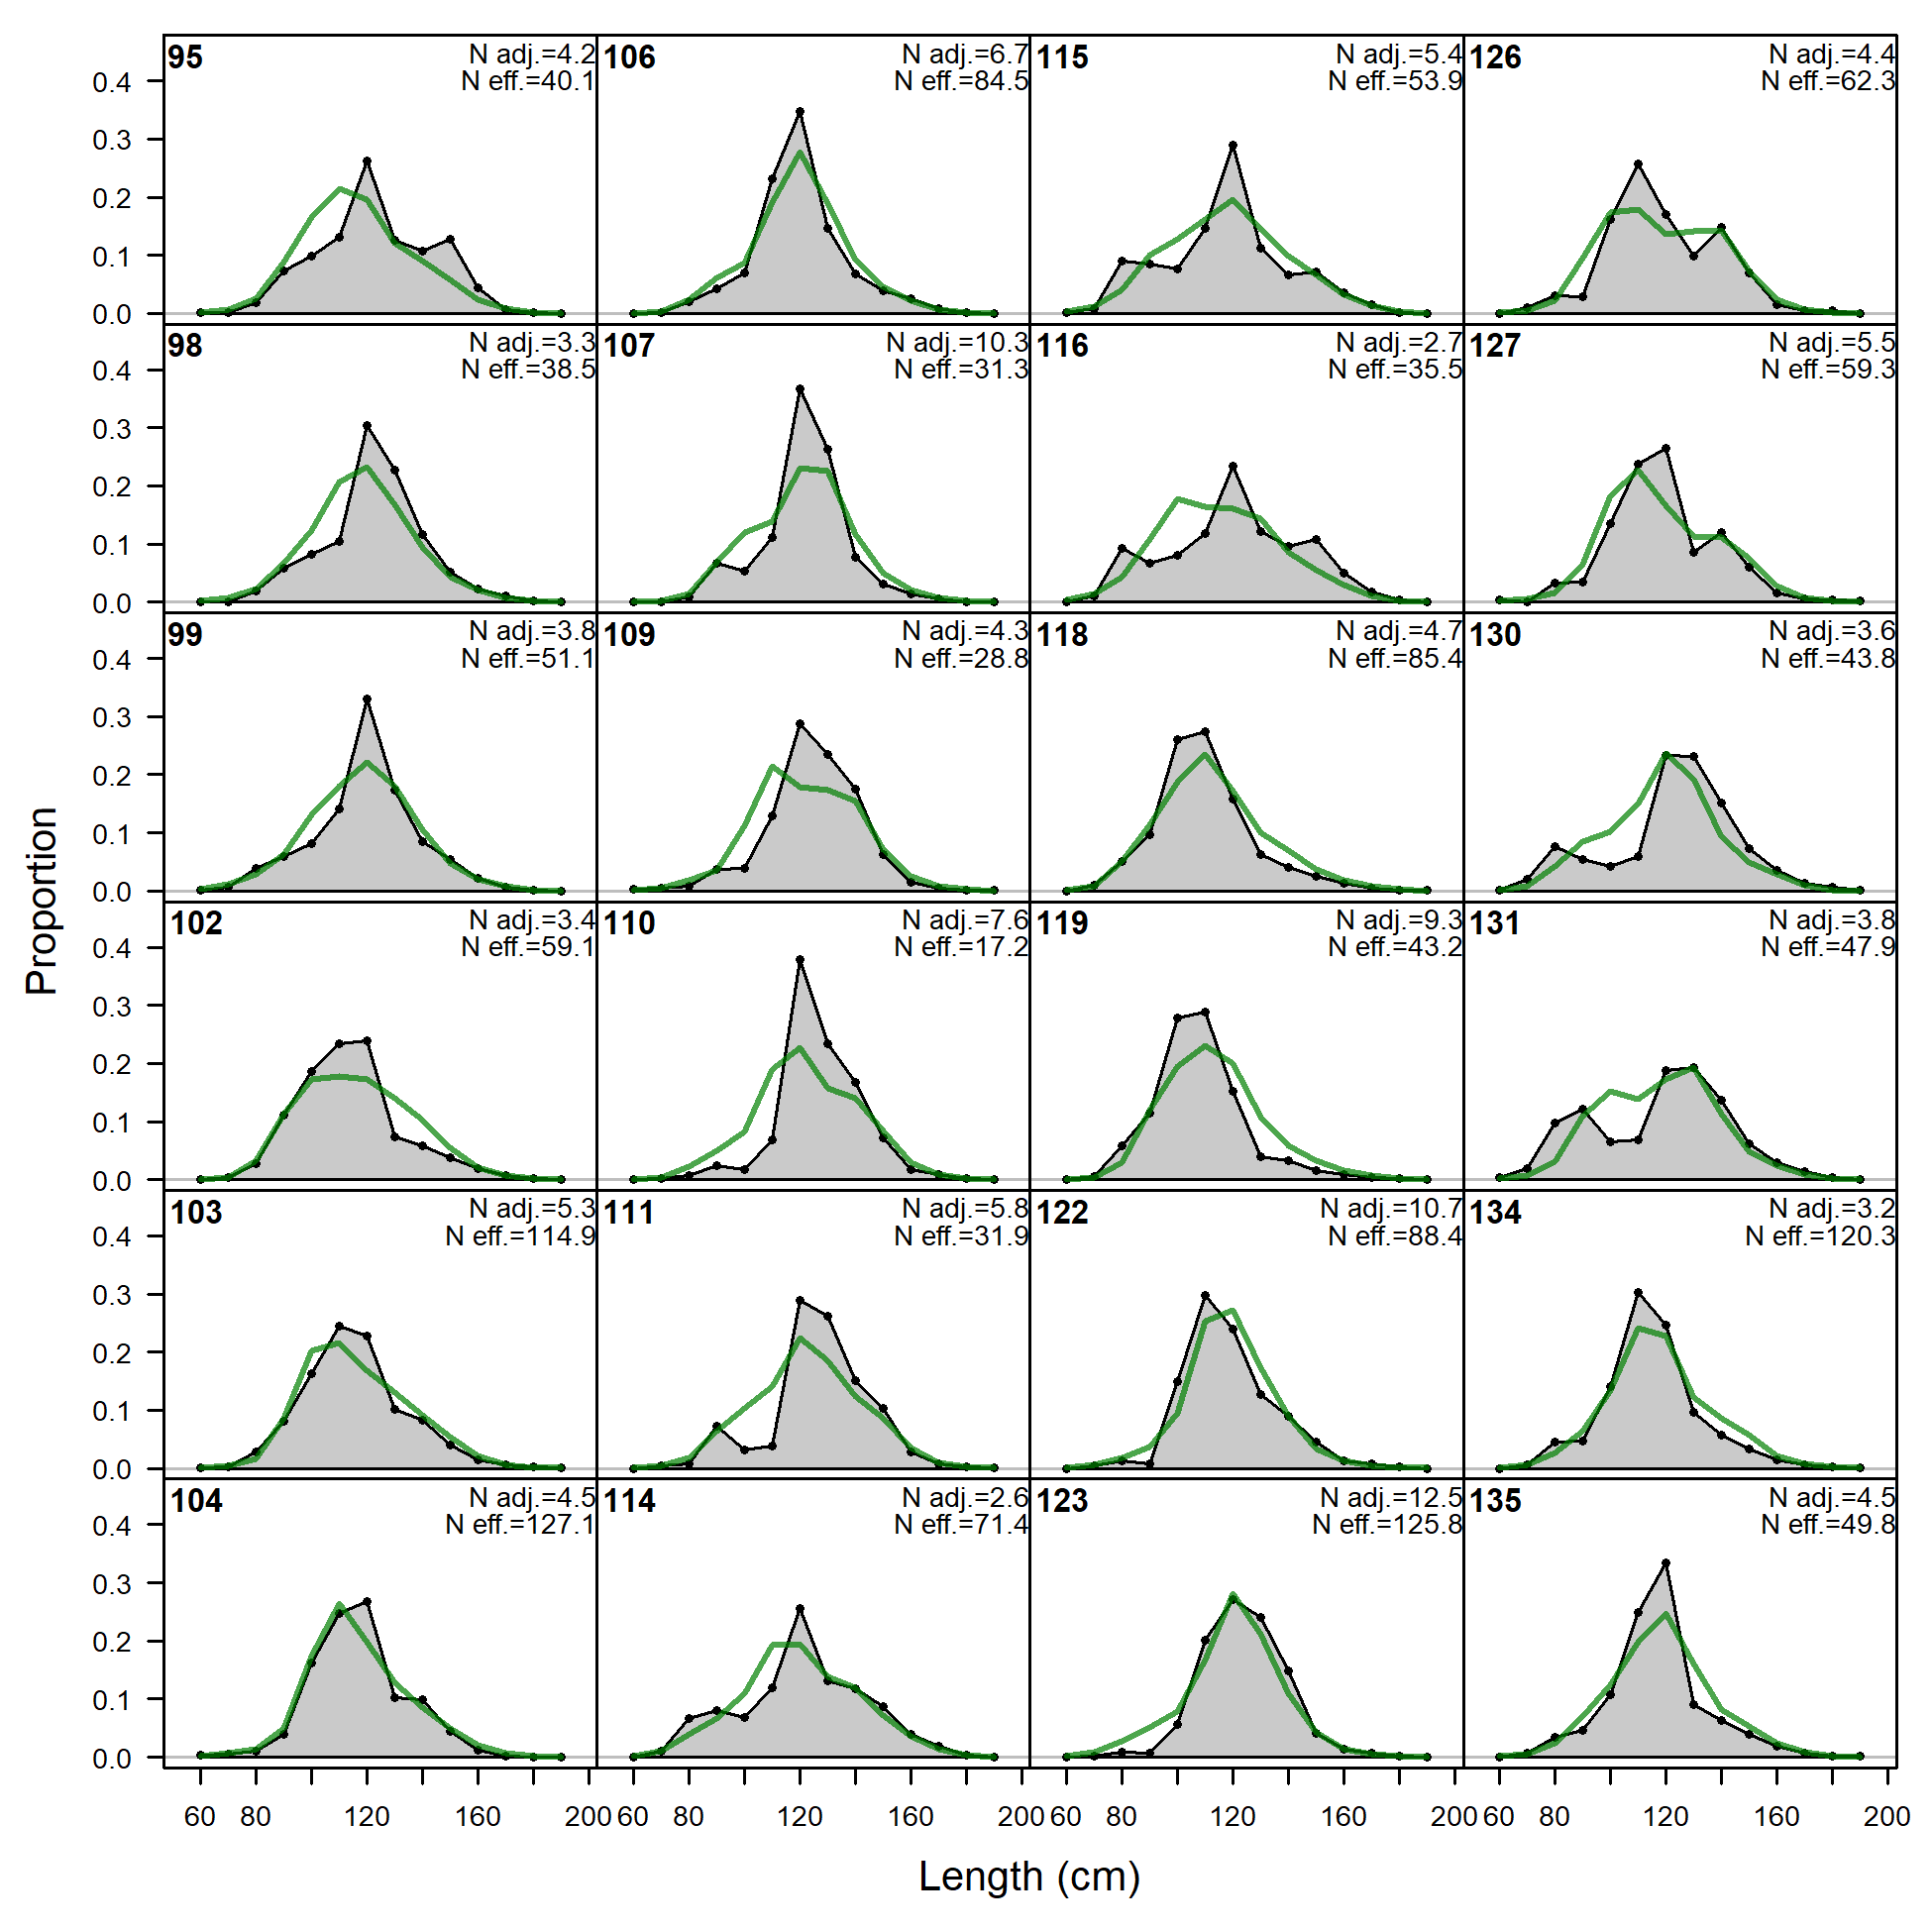
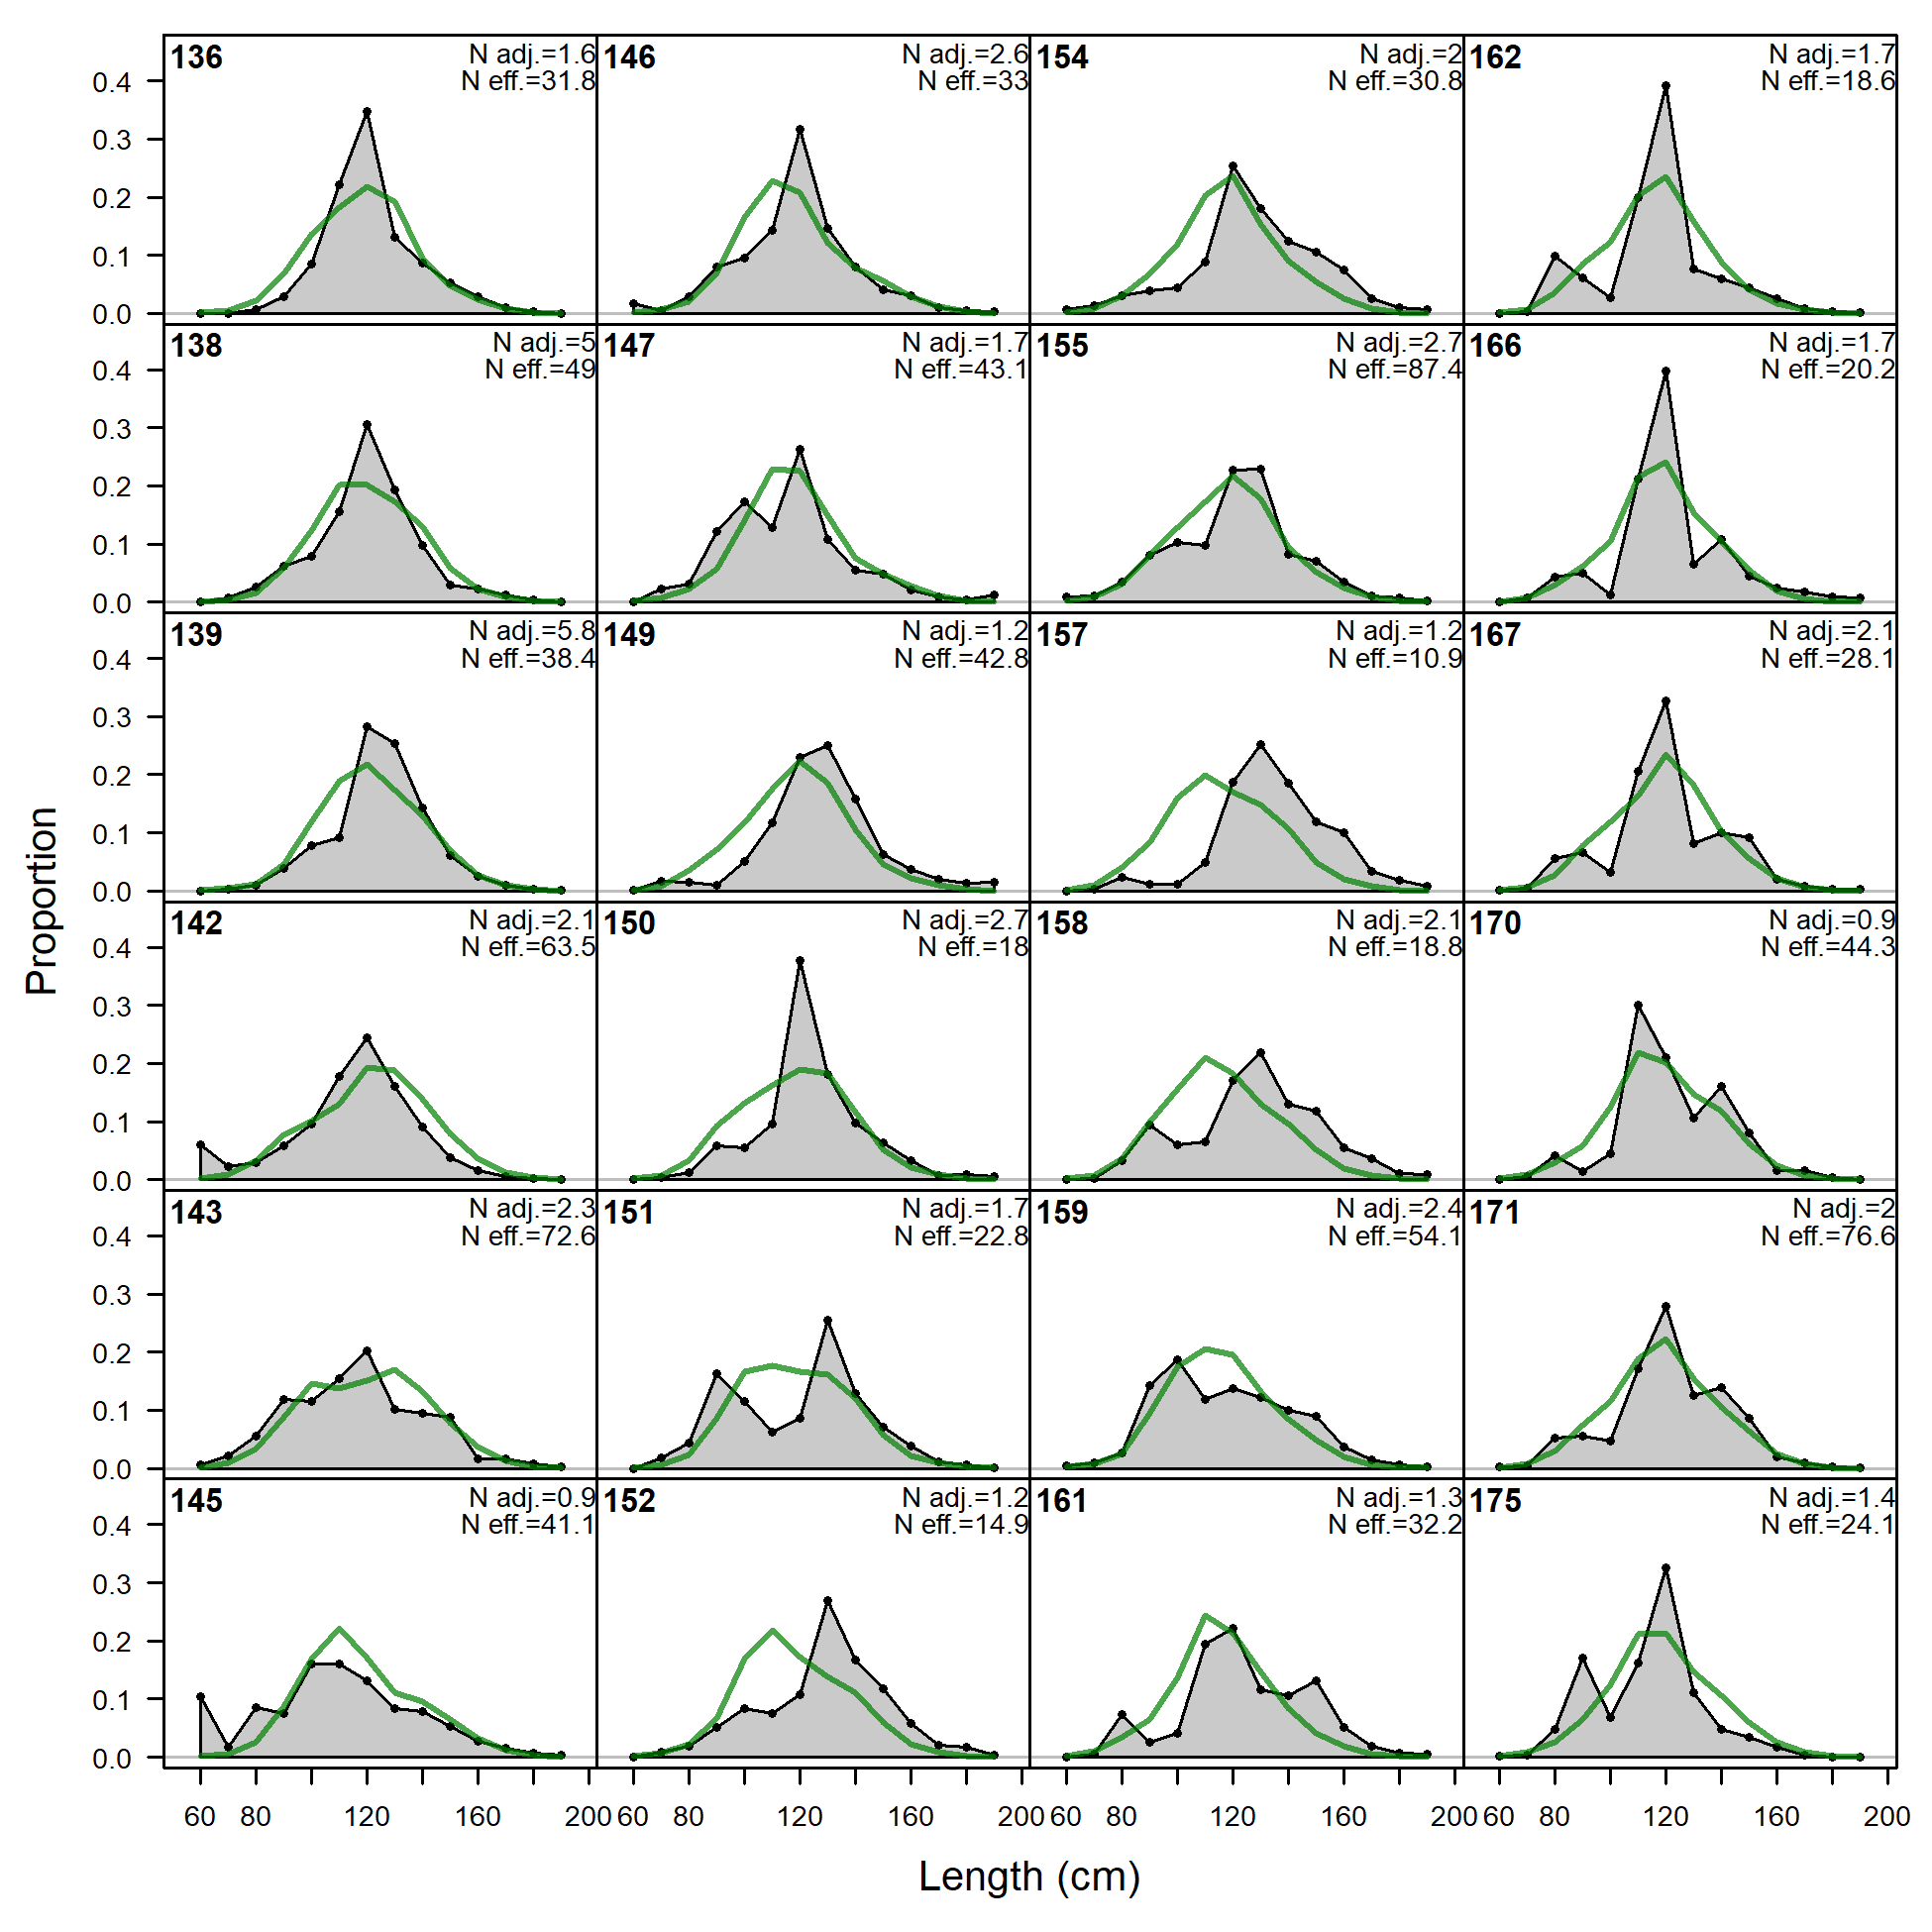
Size comps, whole catch, LL-n-A1.
'N adj.' is the input sample size after data-weighting adjustment. N eff. is the calculated effective sample size used in the McAllister-Ianelli tuning method.
file: comp_sizefit_flt1mkt0.png

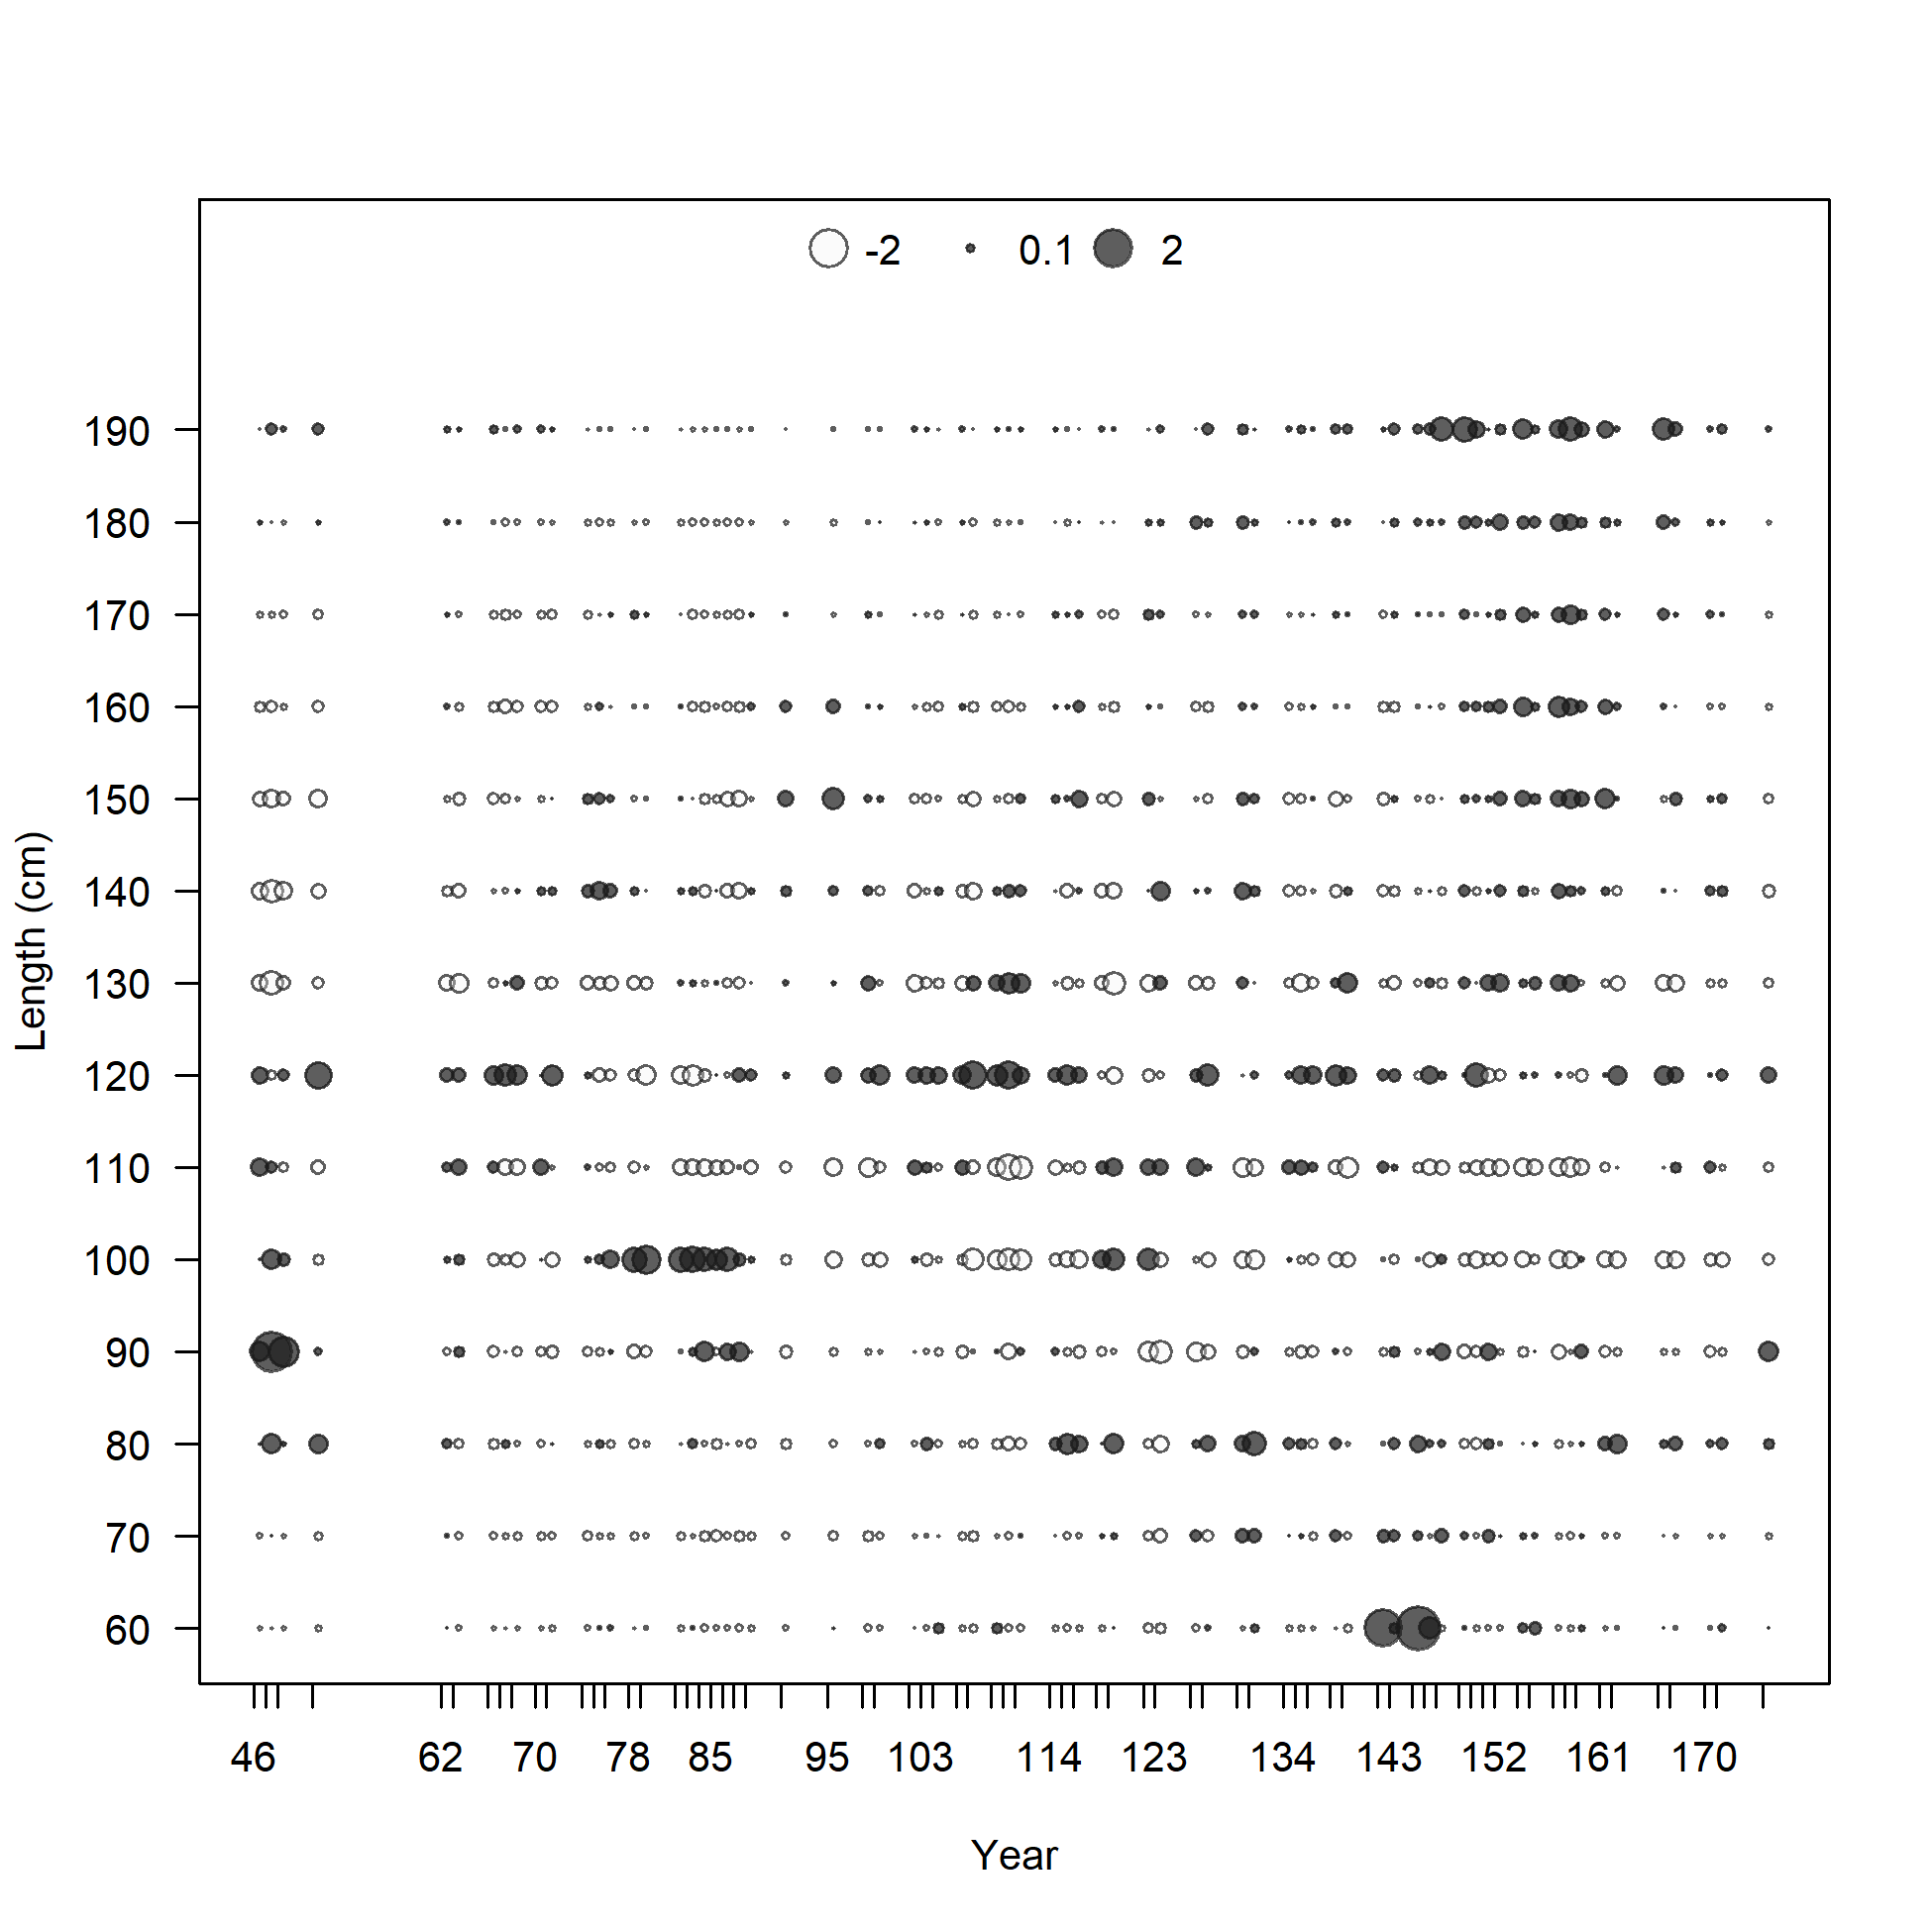
Pearson residuals, whole catch, LL-n-A1 (max=2.94)
Closed bubbles are positive residuals (observed > expected) and open bubbles are negative residuals (observed < expected).
file: comp_sizefit_residsflt1mkt0.png
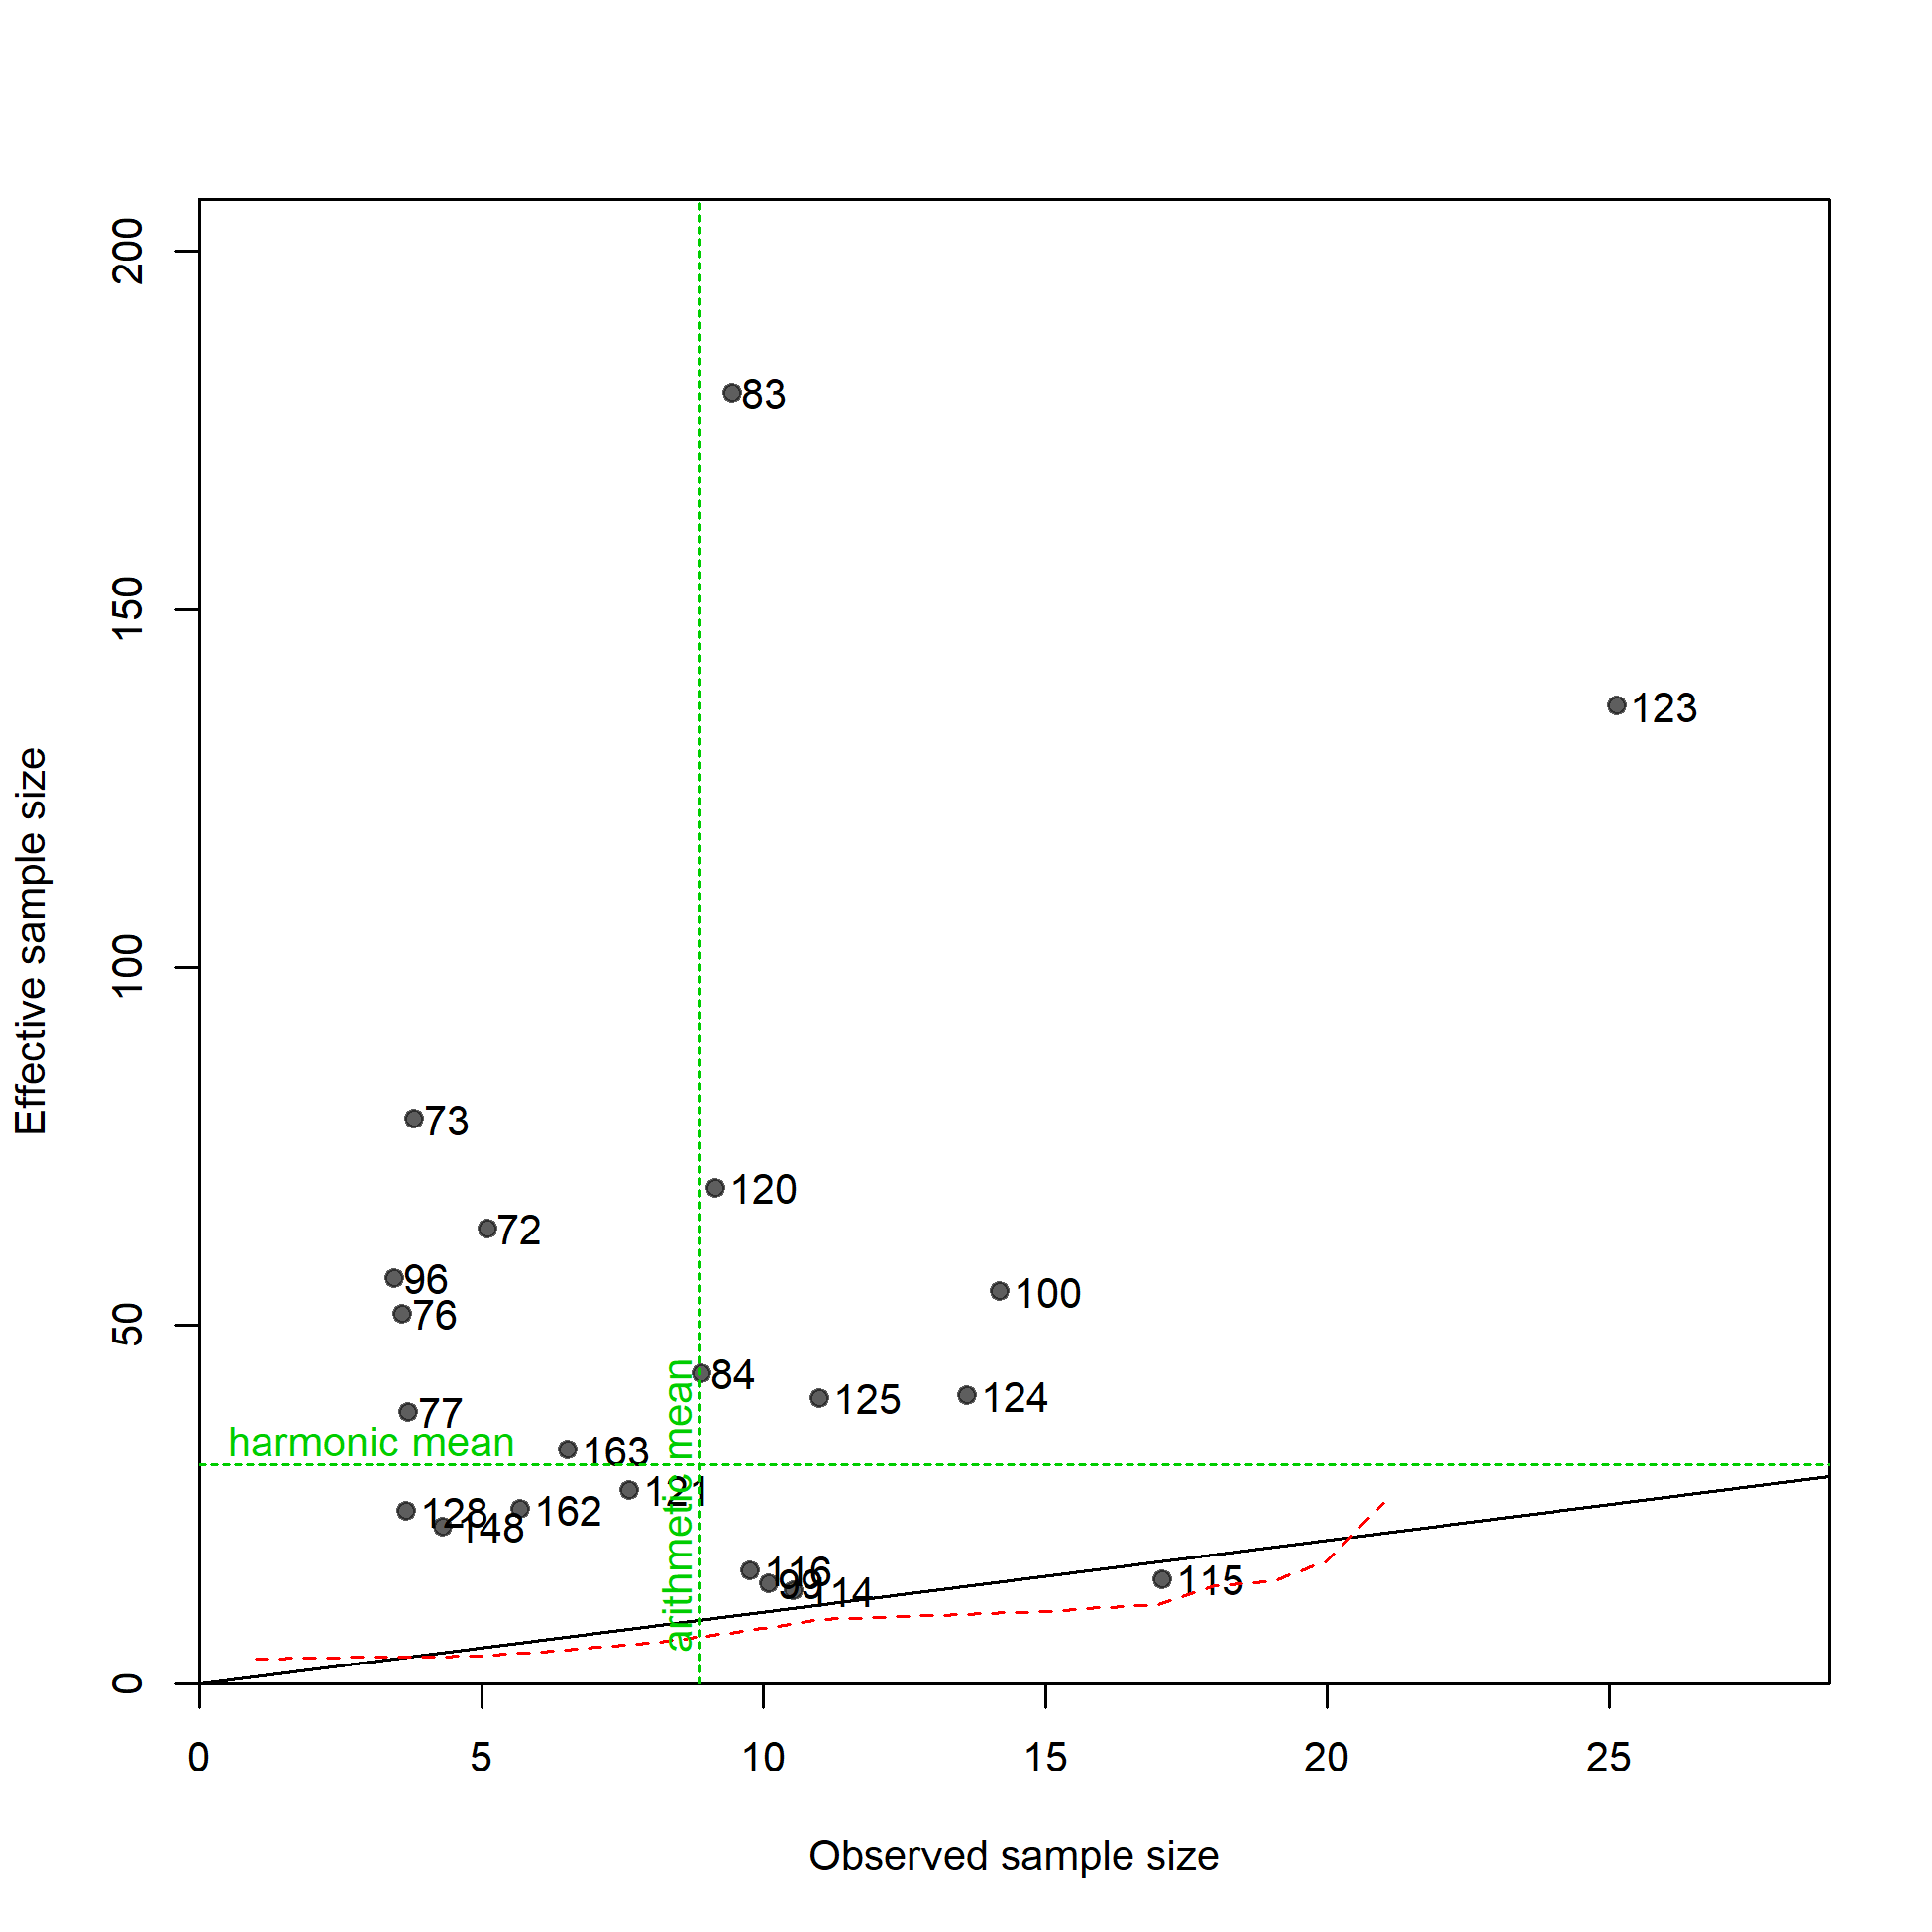
N-EffN comparison, Size comps, whole catch, LL-n-A1
file: comp_sizefit_sampsize_flt1mkt0.png
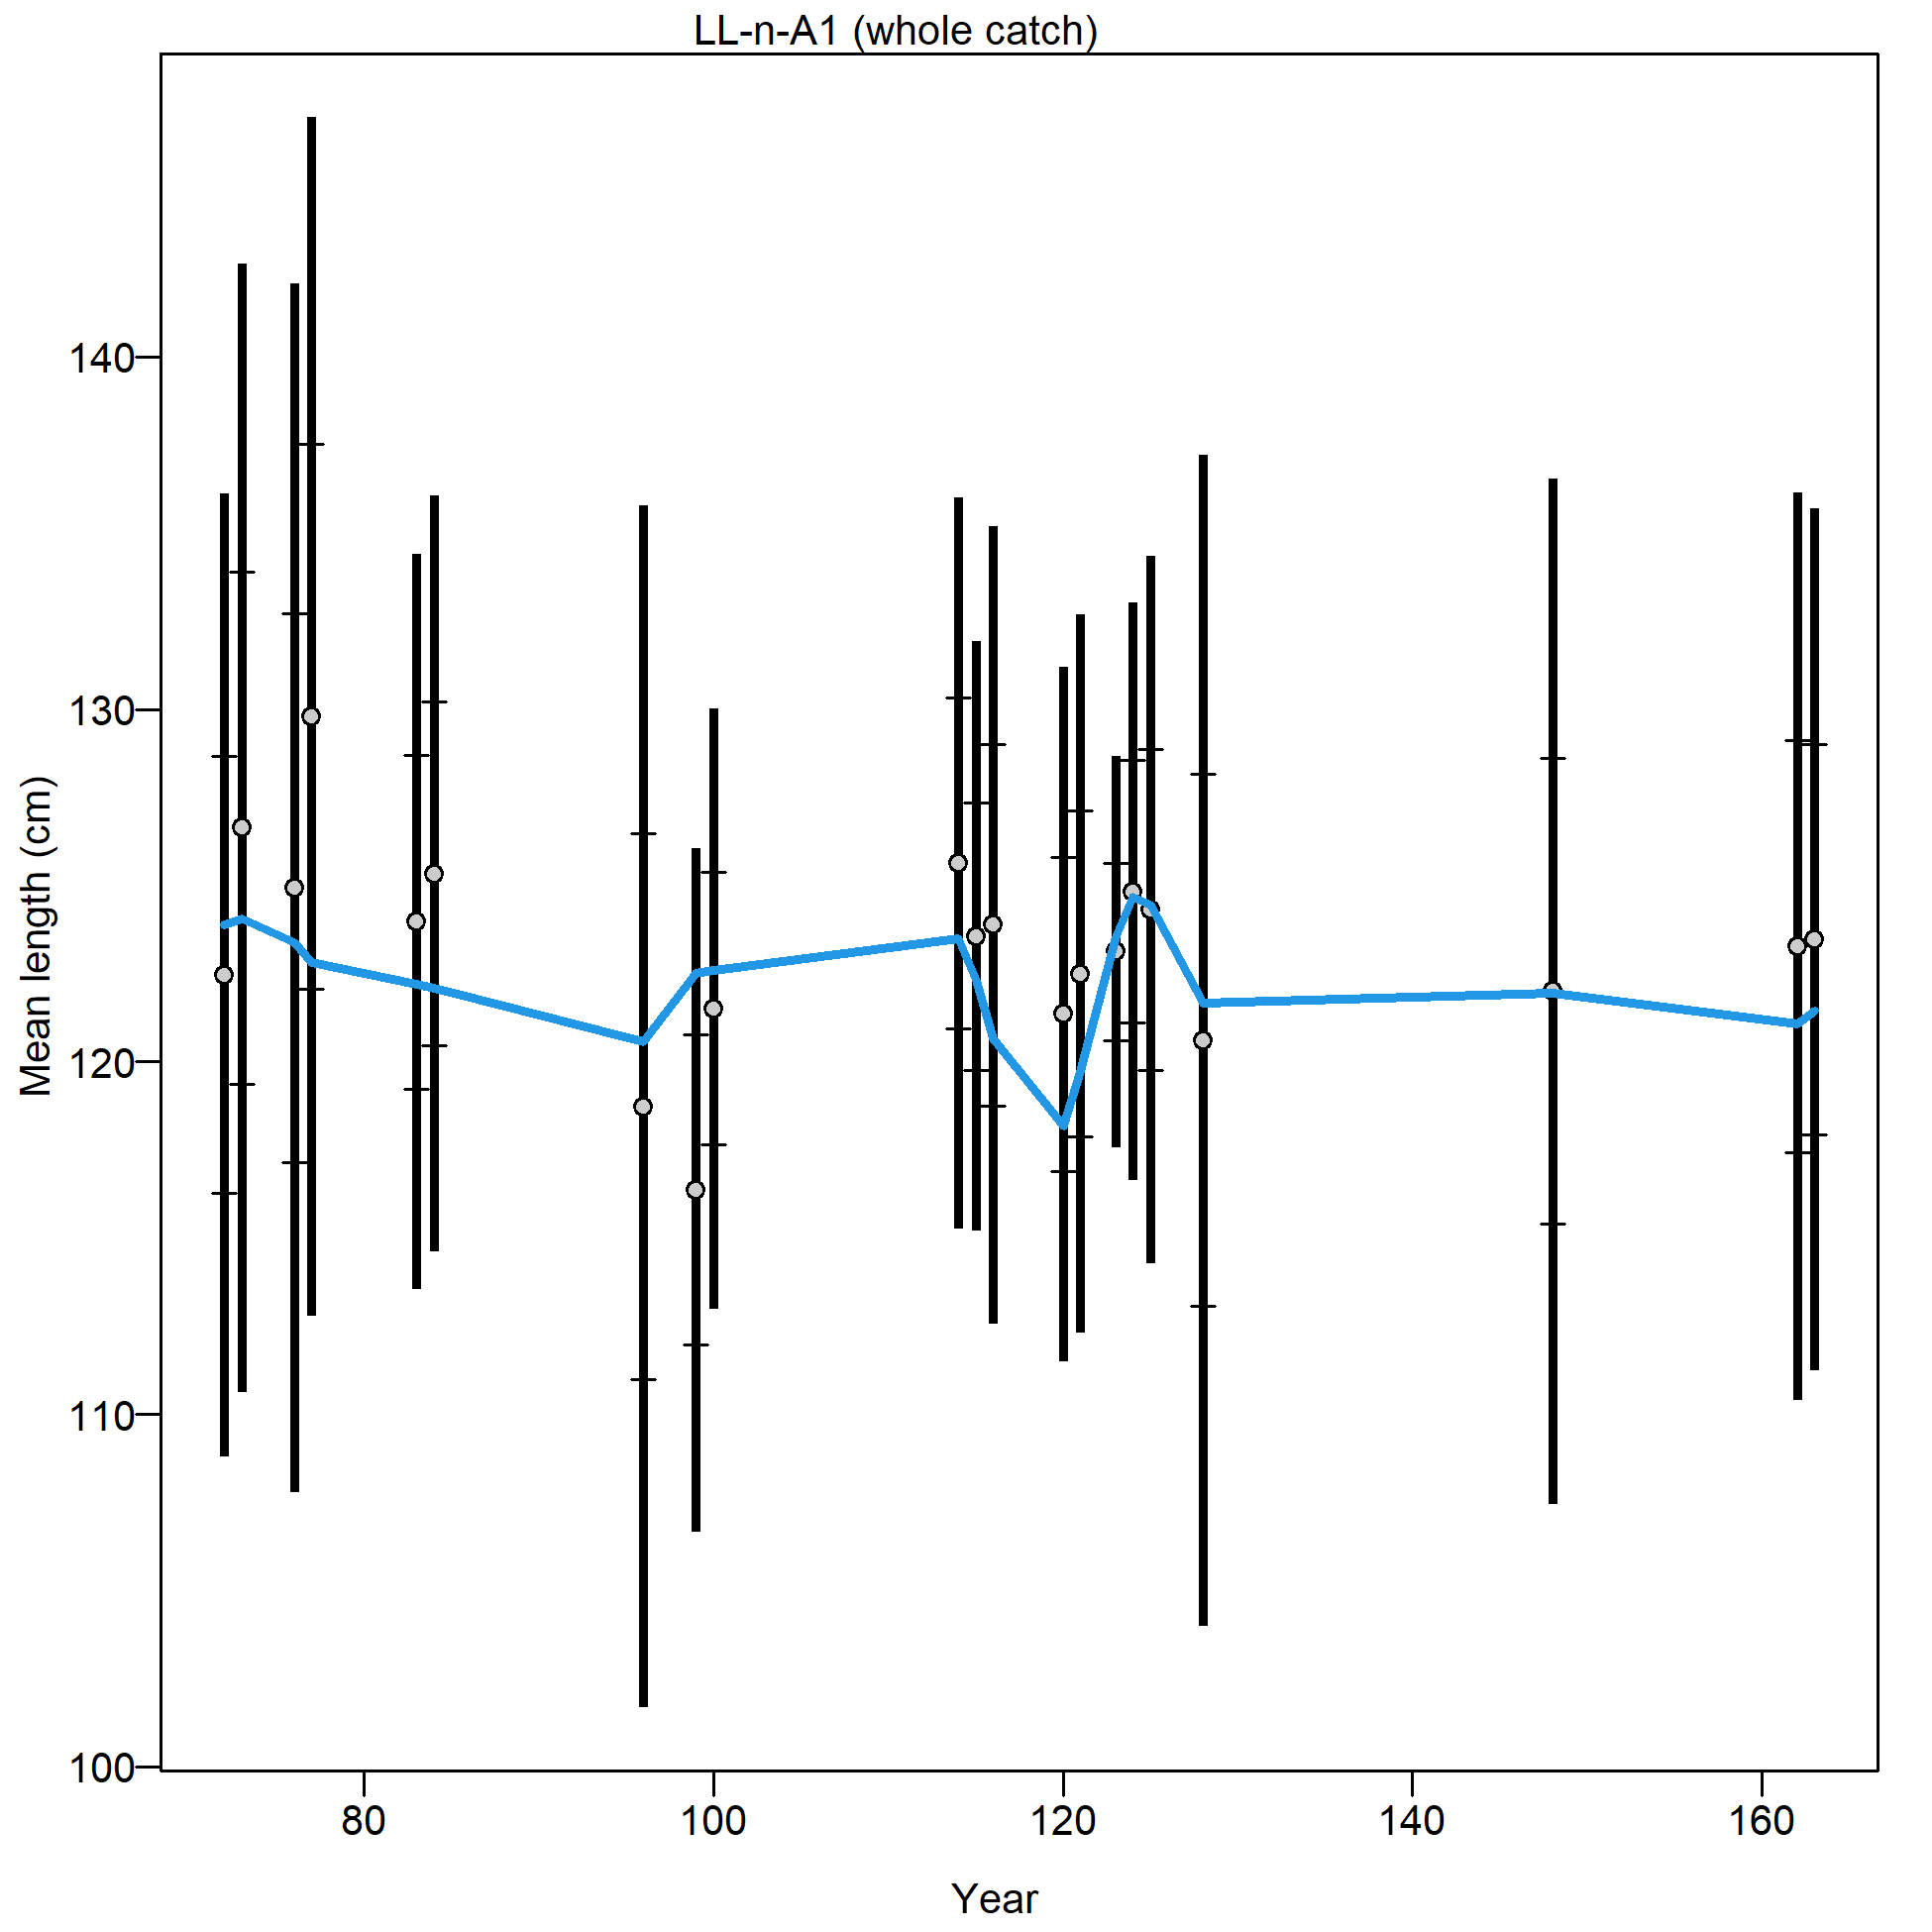
Mean size for LL-n-A1 with 95% confidence intervals based on current sample sizes.
Francis data weighting method TA1.8: thinner intervals (with capped ends) show result of further adjusting sample sizes based on suggested multiplier (with 95% interval) for size data from LL-n-A1:
4.8493 (2.4118-14.5716)
For more info, see Francis (2011).
file: comp_sizefit_data_weighting_TA1.8_LL-n-A1.png
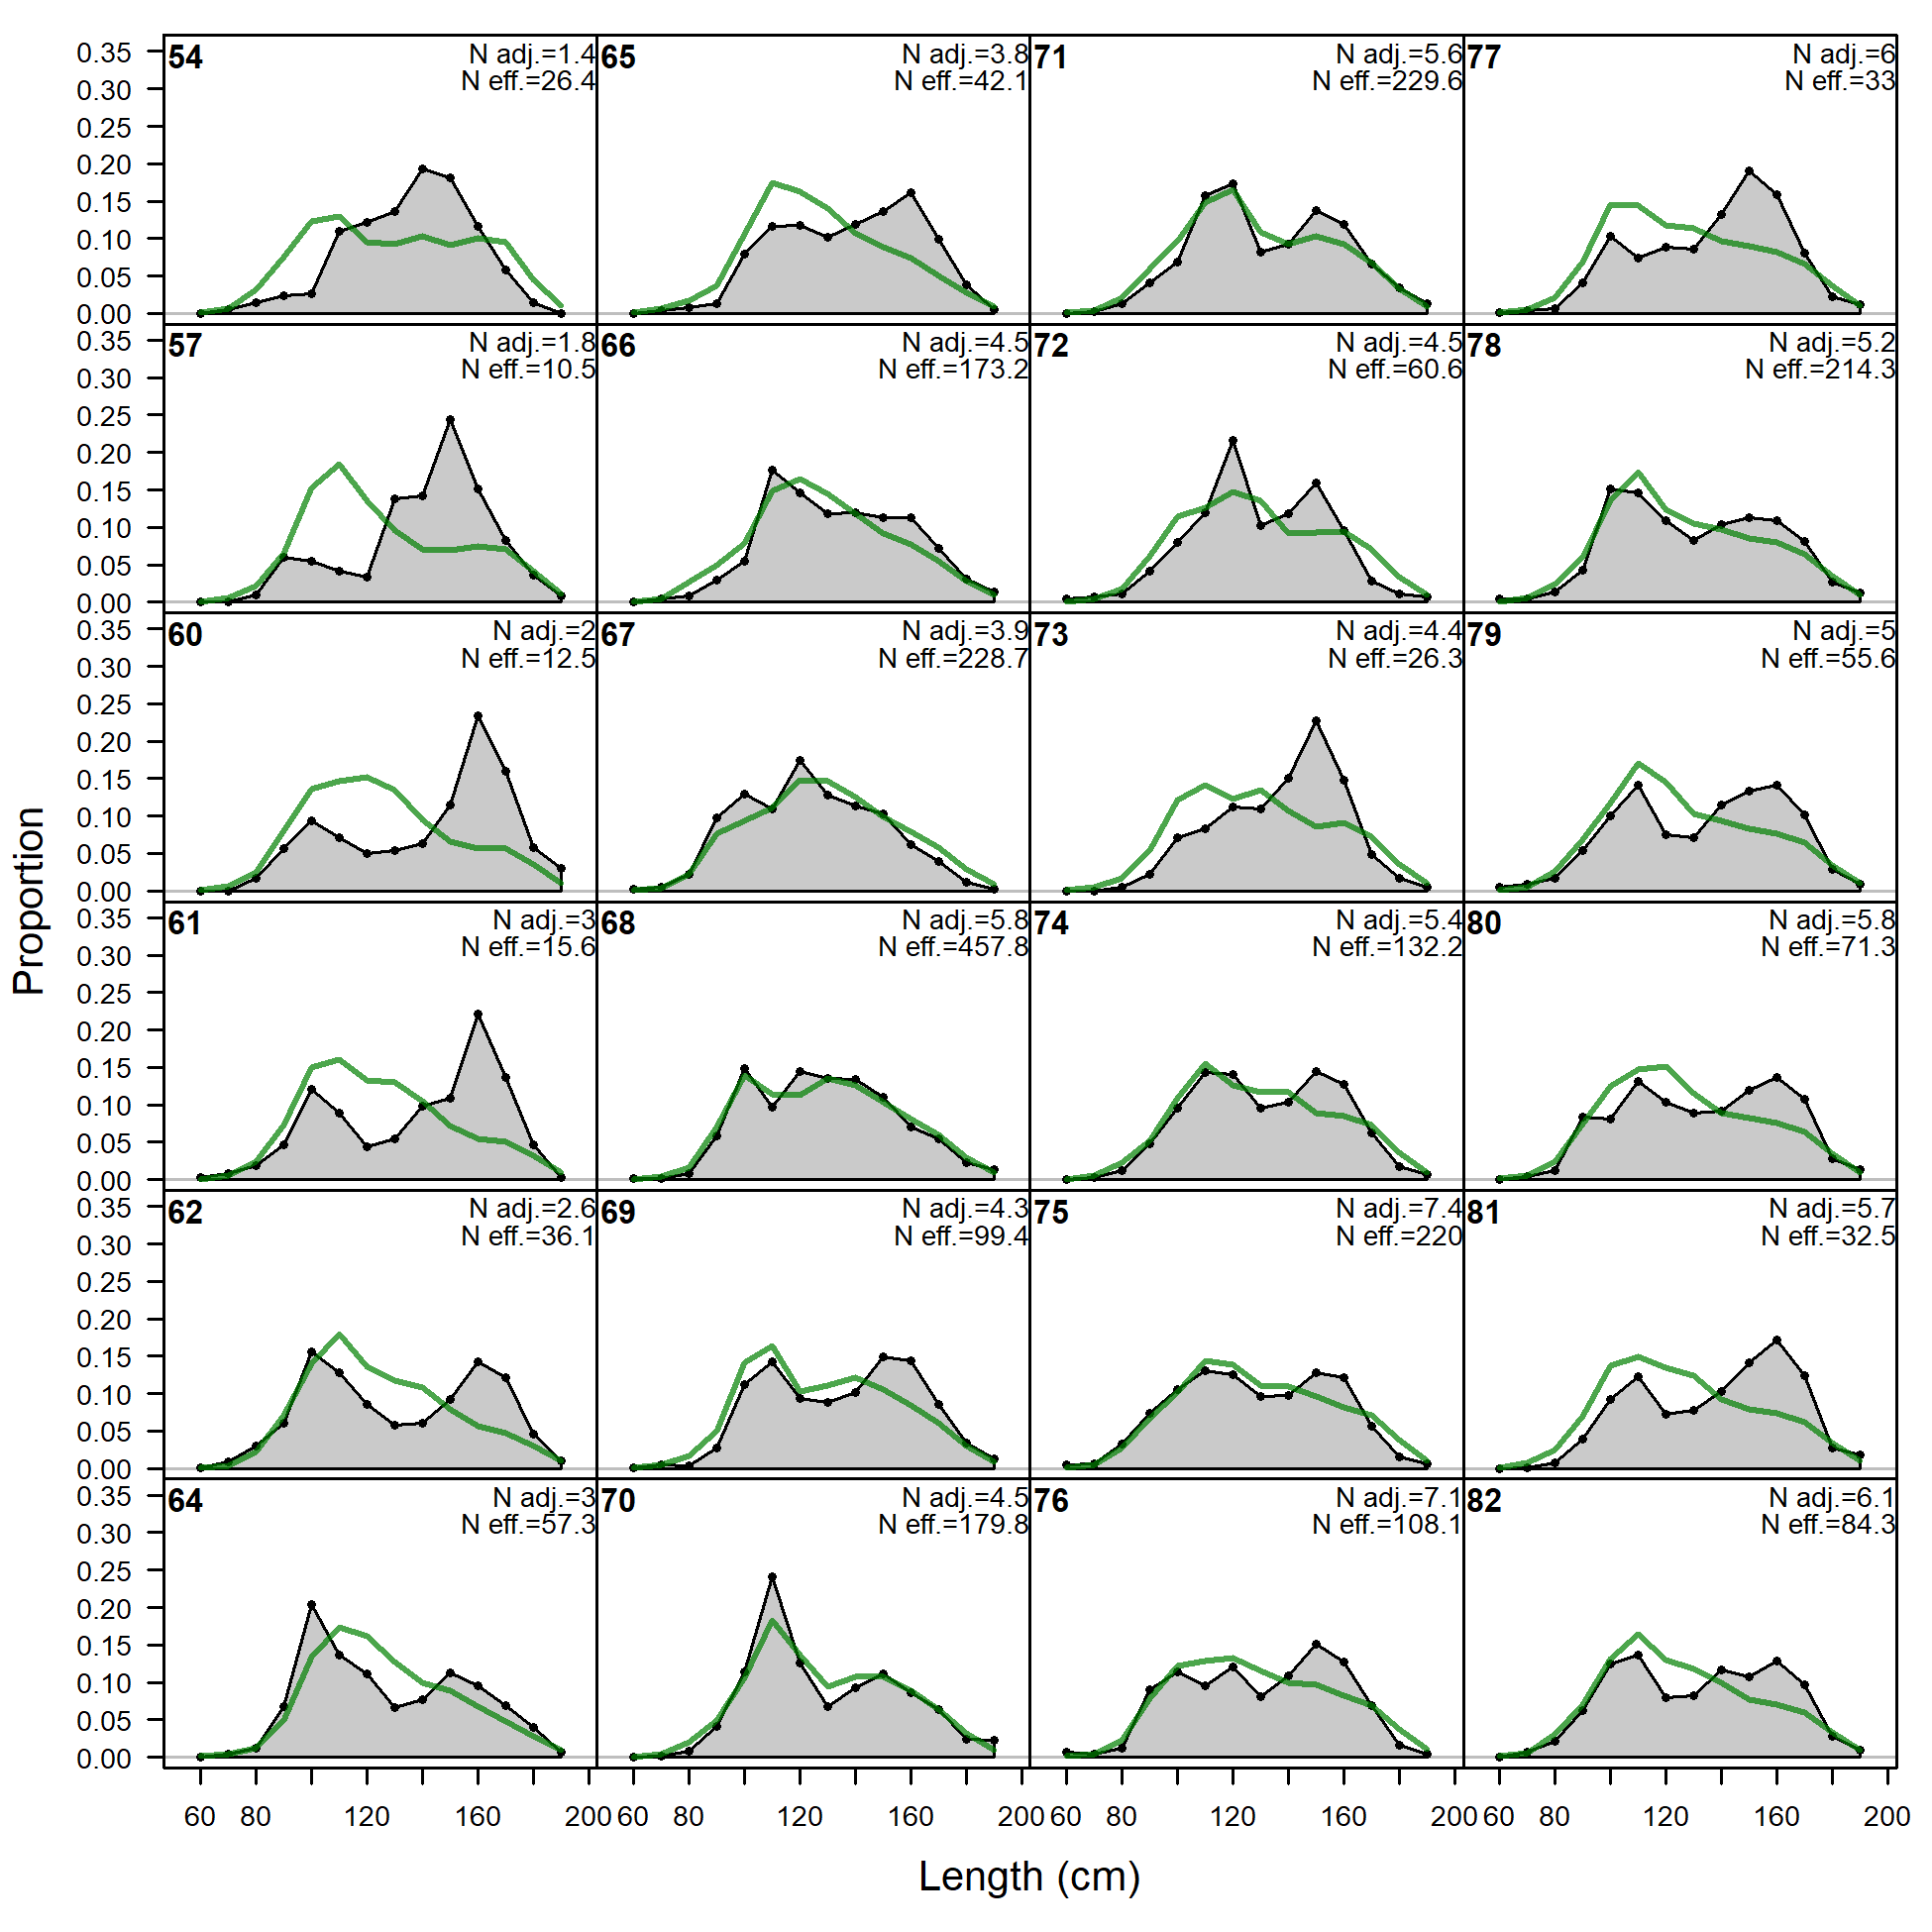
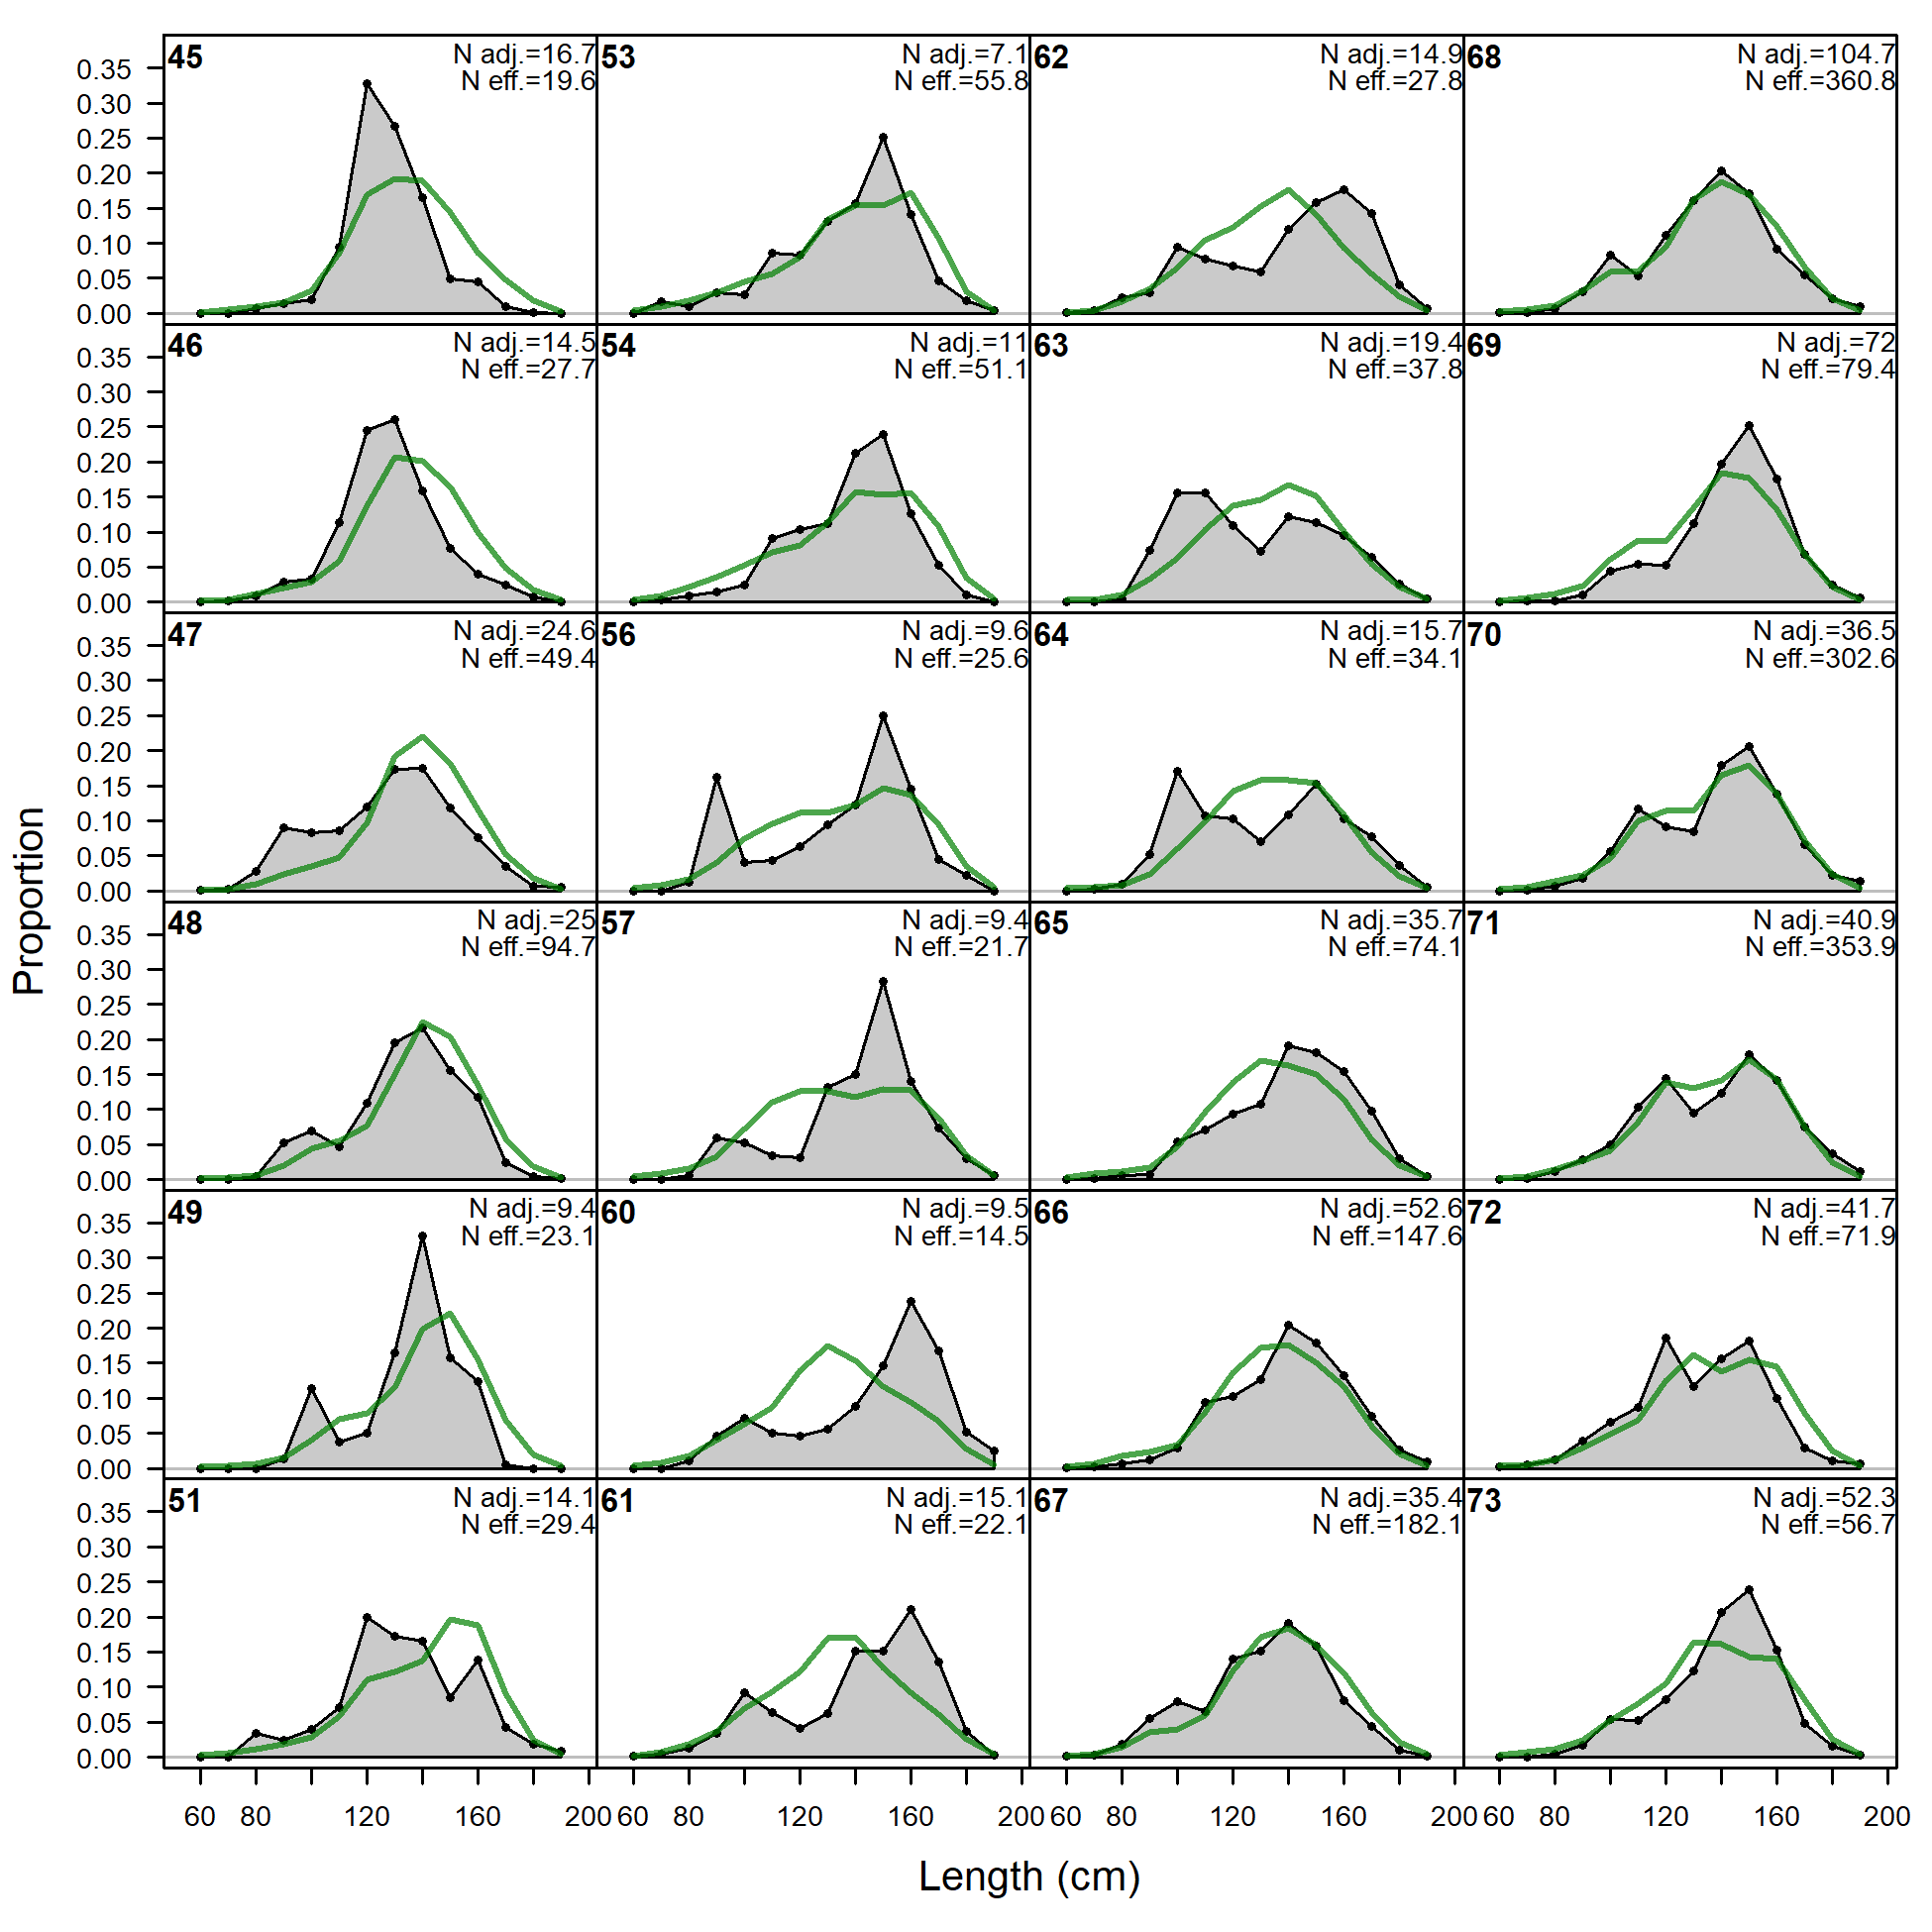
Size comps, whole catch, LL-n-A2 (plot 1 of 5).
'N adj.' is the input sample size after data-weighting adjustment. N eff. is the calculated effective sample size used in the McAllister-Ianelli tuning method.
file: comp_sizefit_flt2mkt0_page1.png
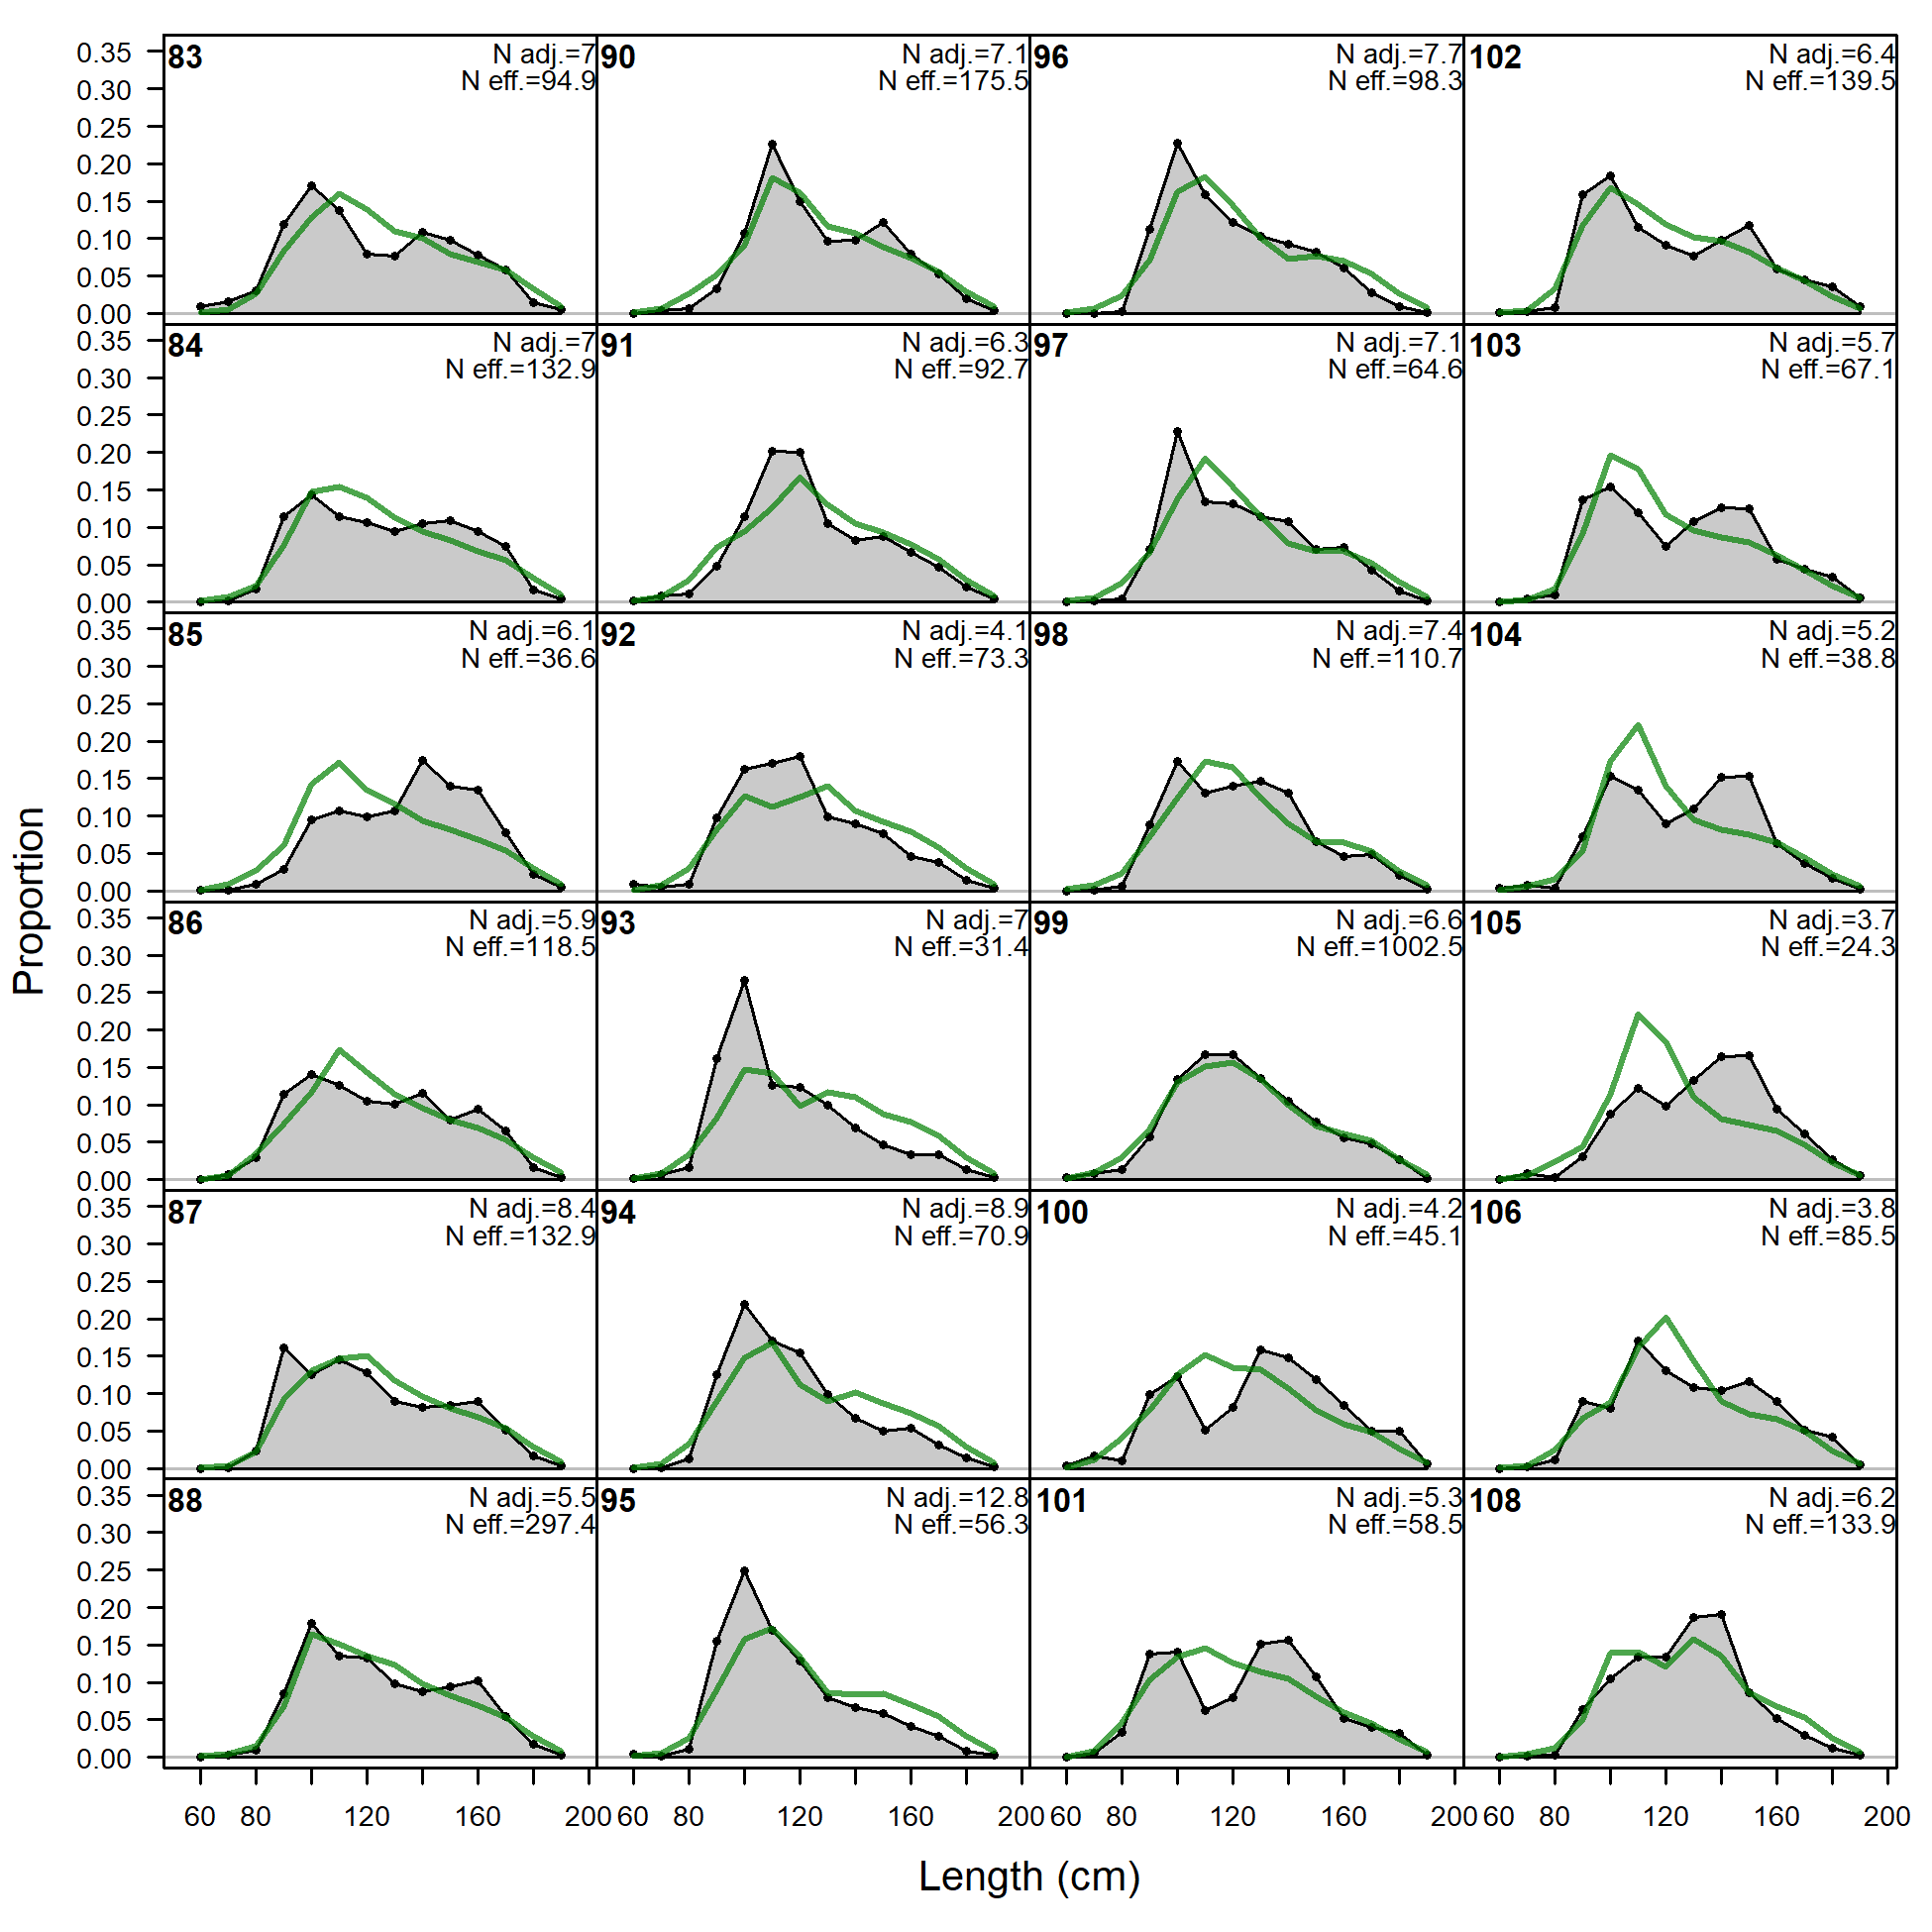
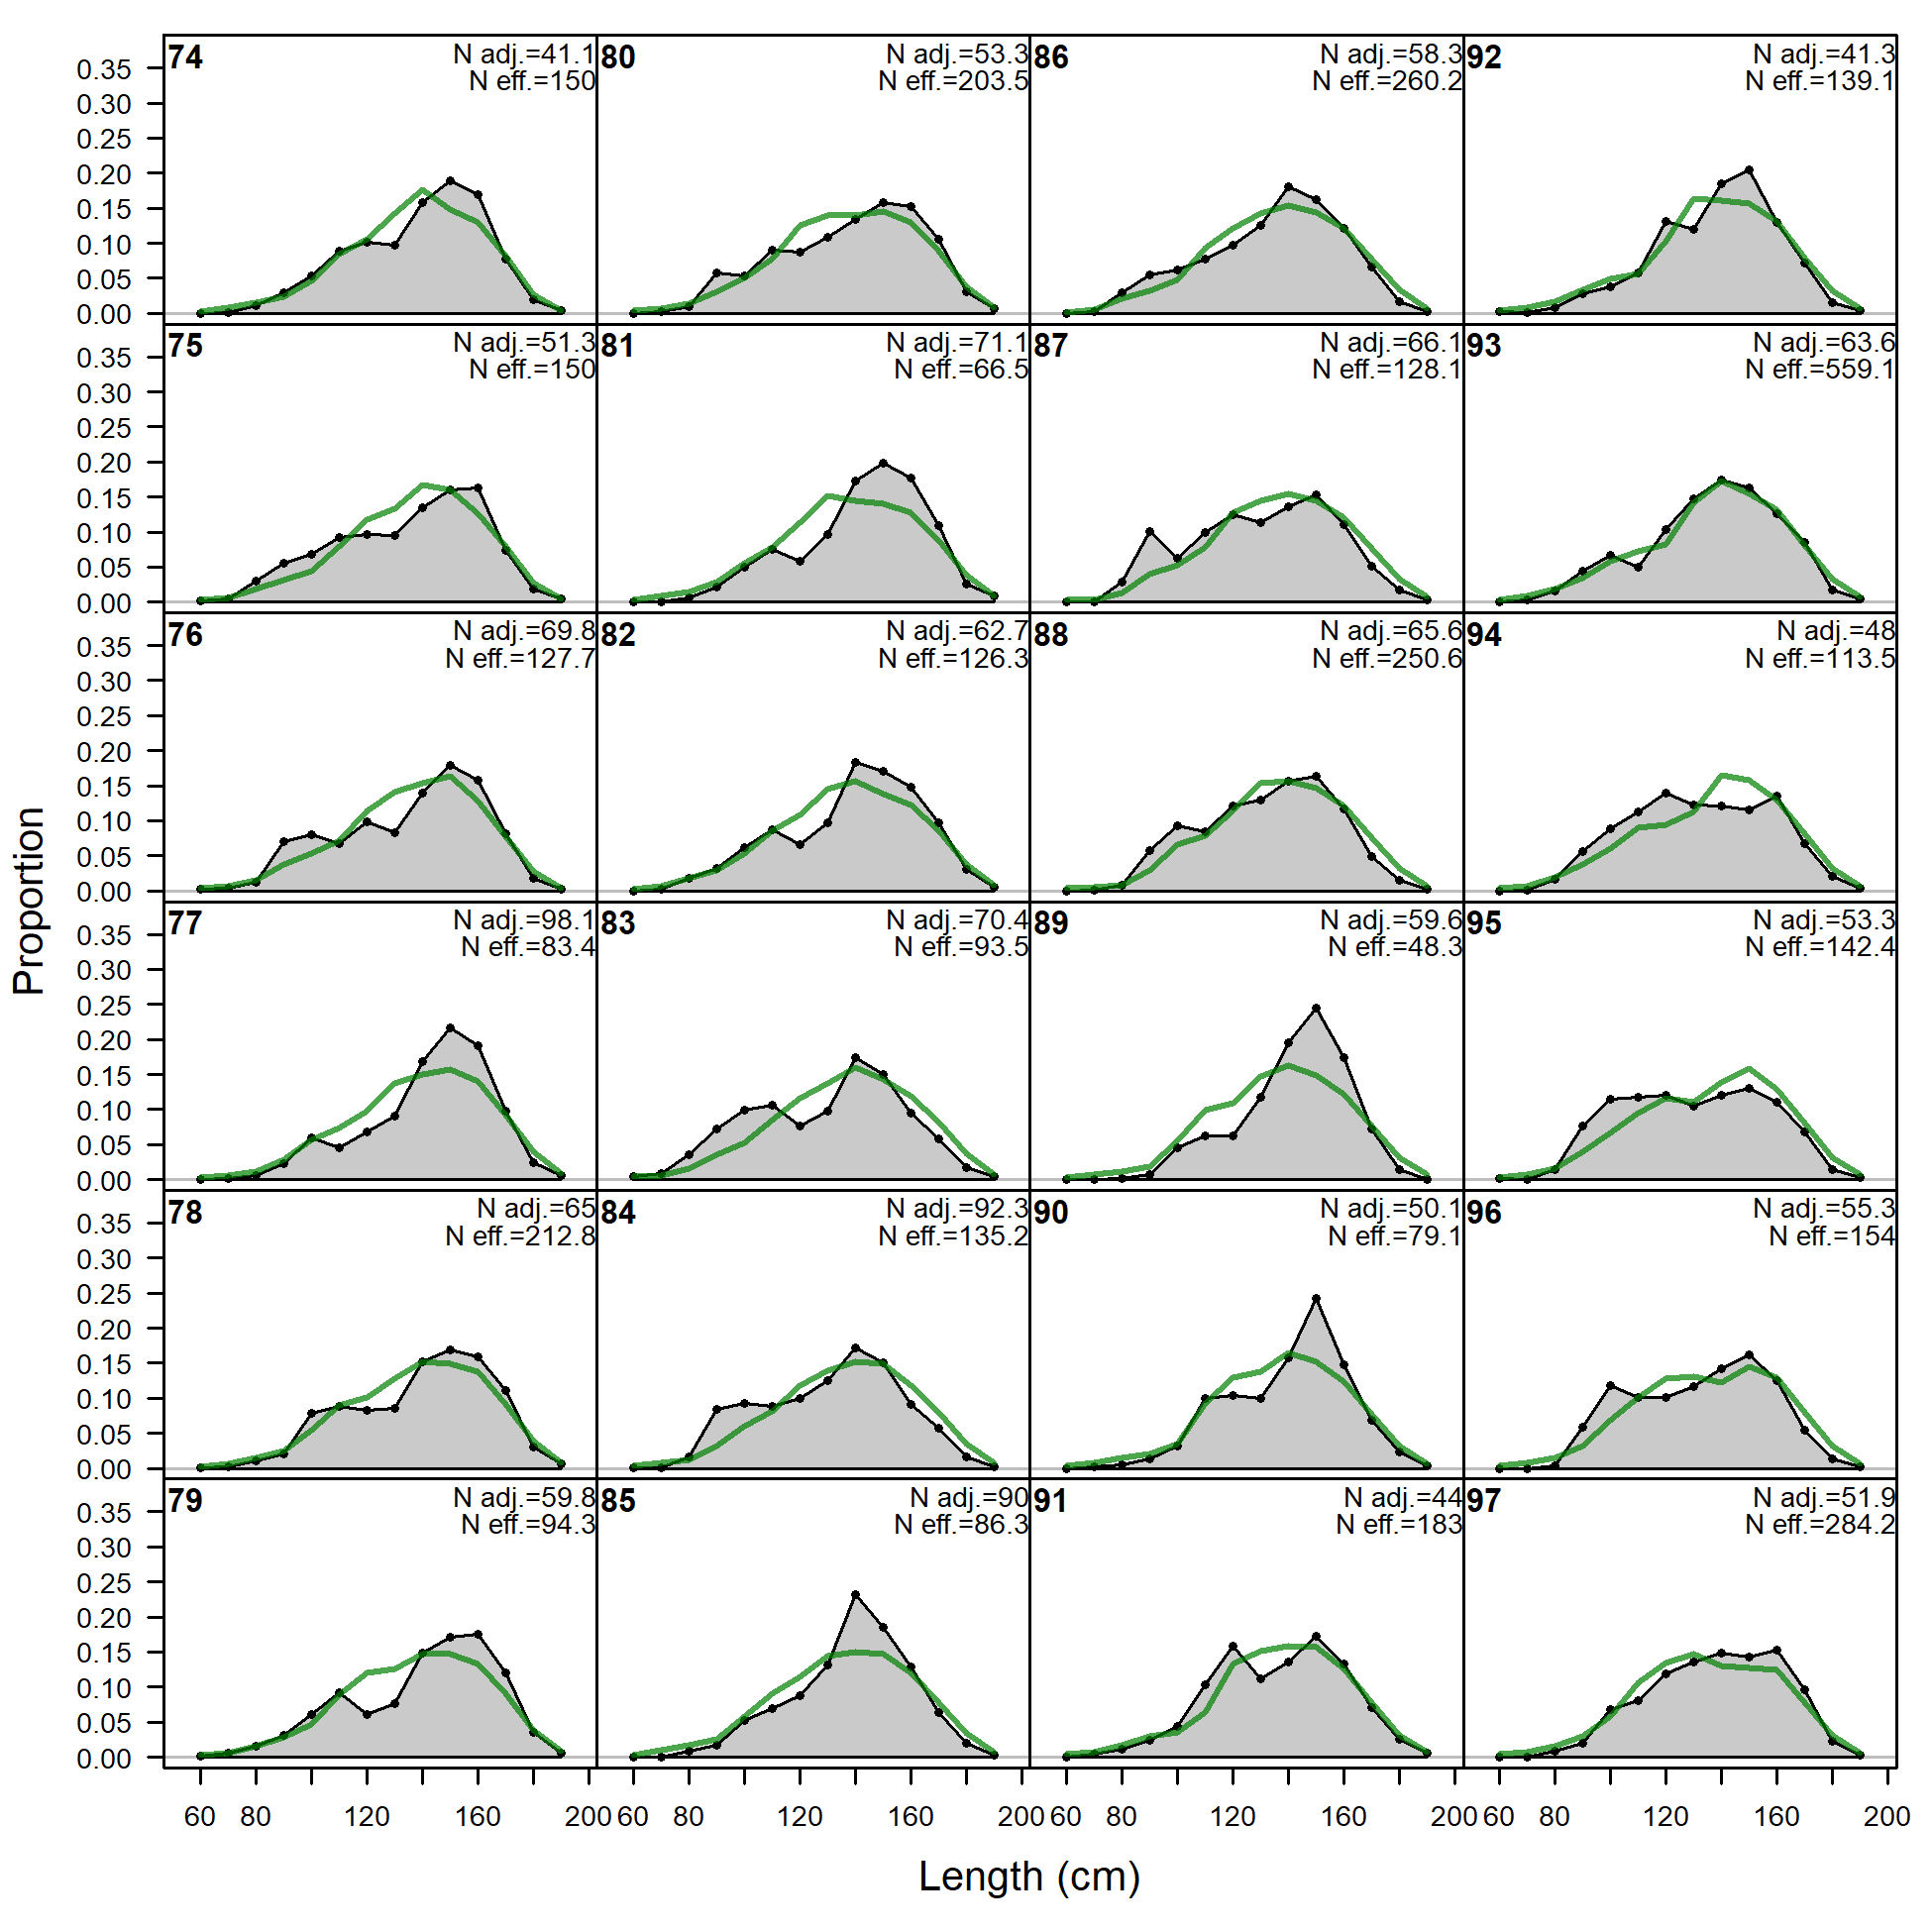
Size comps, whole catch, LL-n-A2 (plot 1 of 5).
'N adj.' is the input sample size after data-weighting adjustment. N eff. is the calculated effective sample size used in the McAllister-Ianelli tuning method. (plot 2 of 5)
file: comp_sizefit_flt2mkt0_page2.png
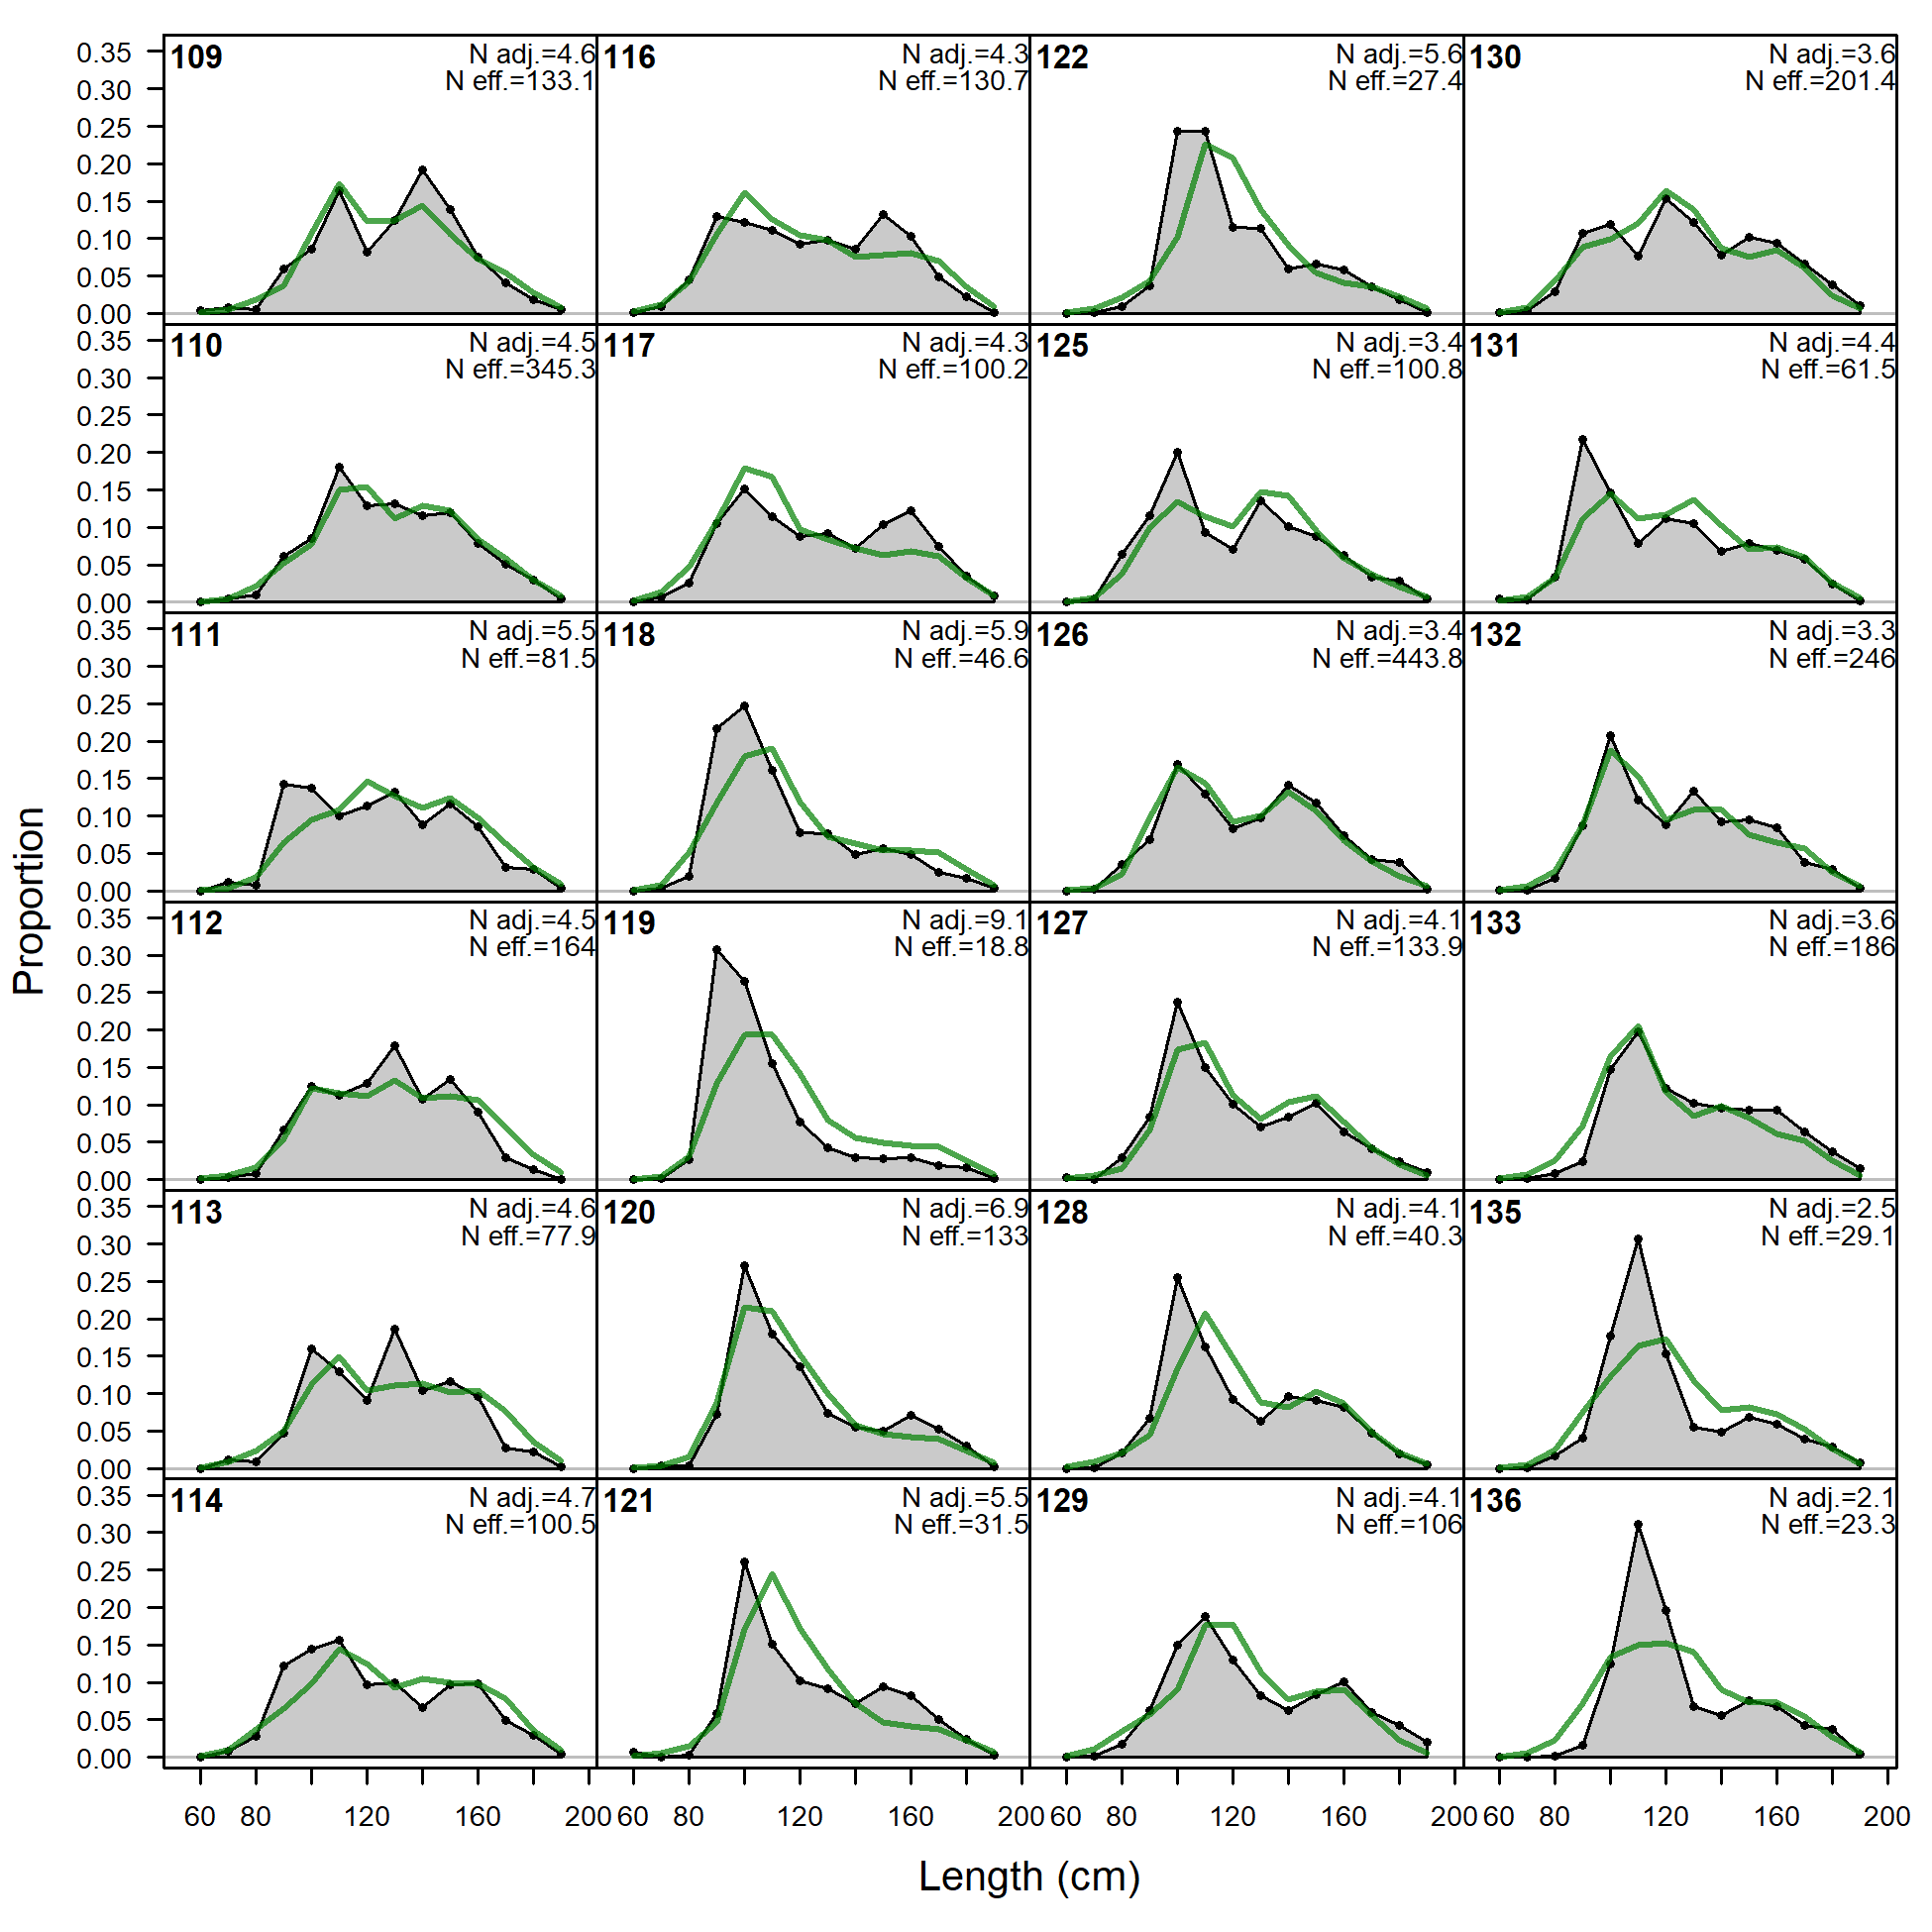
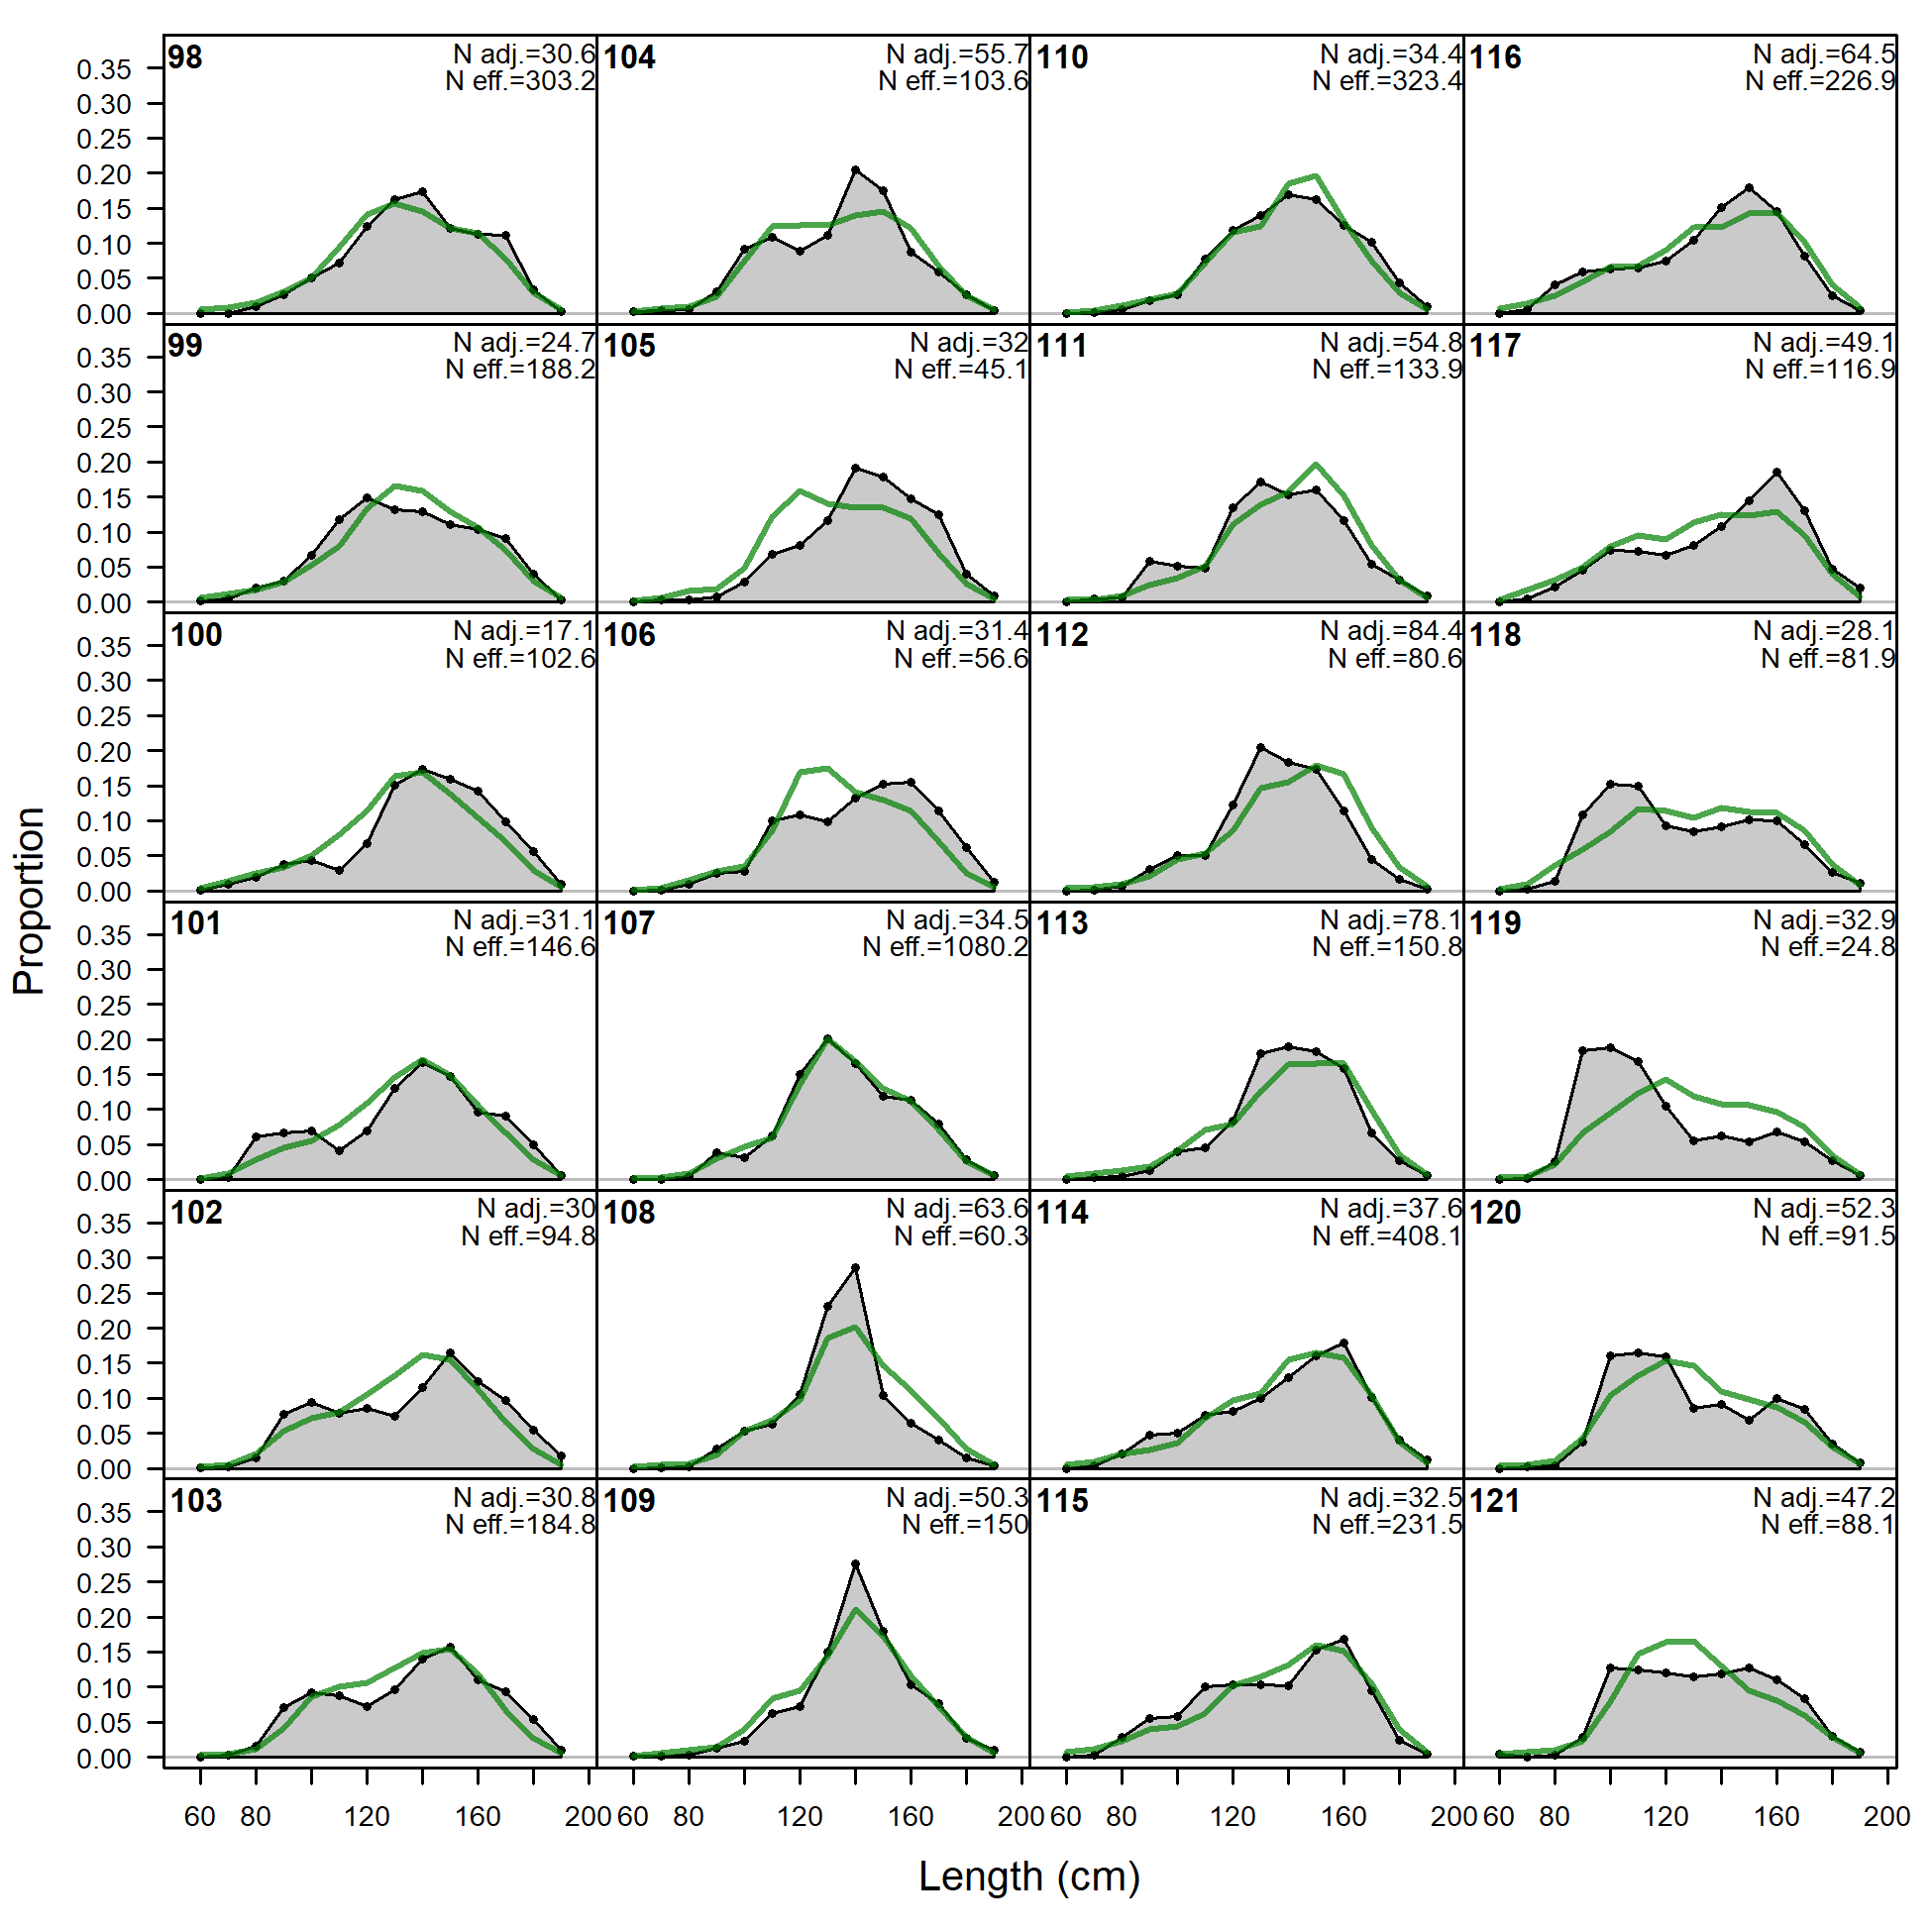
Size comps, whole catch, LL-n-A2 (plot 1 of 5).
'N adj.' is the input sample size after data-weighting adjustment. N eff. is the calculated effective sample size used in the McAllister-Ianelli tuning method. (plot 2 of 5) (plot 3 of 5)
file: comp_sizefit_flt2mkt0_page3.png
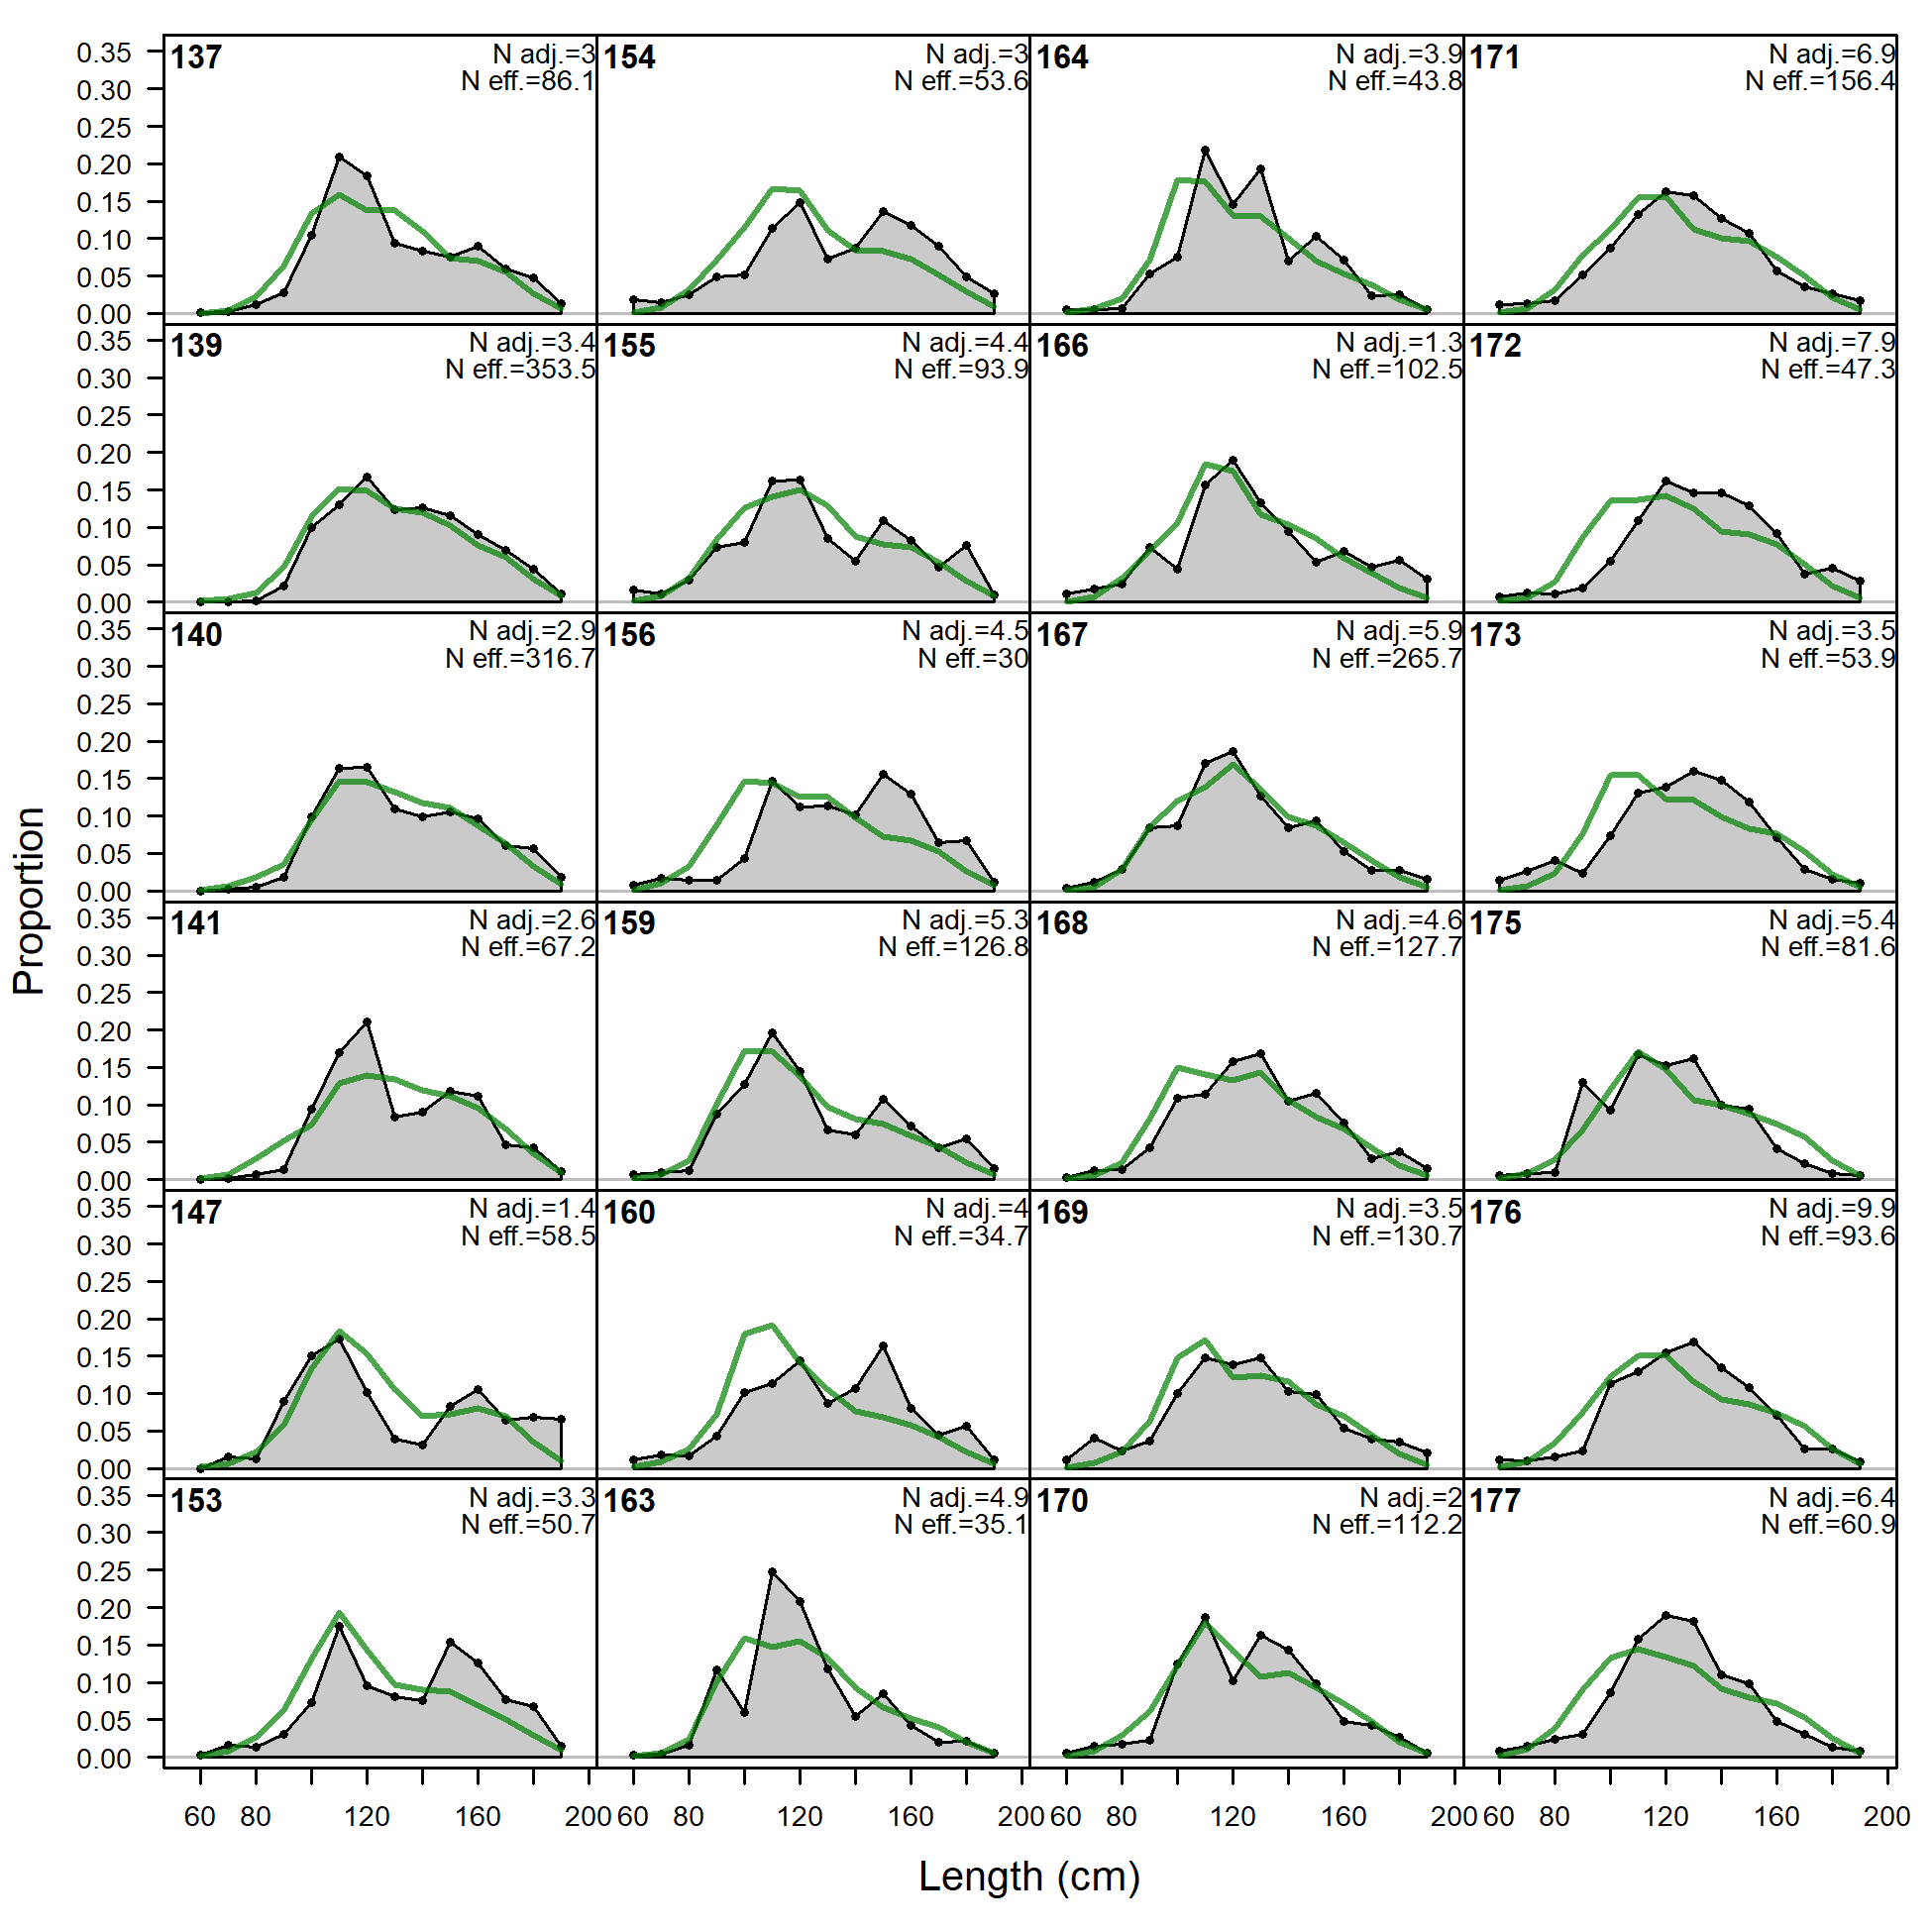
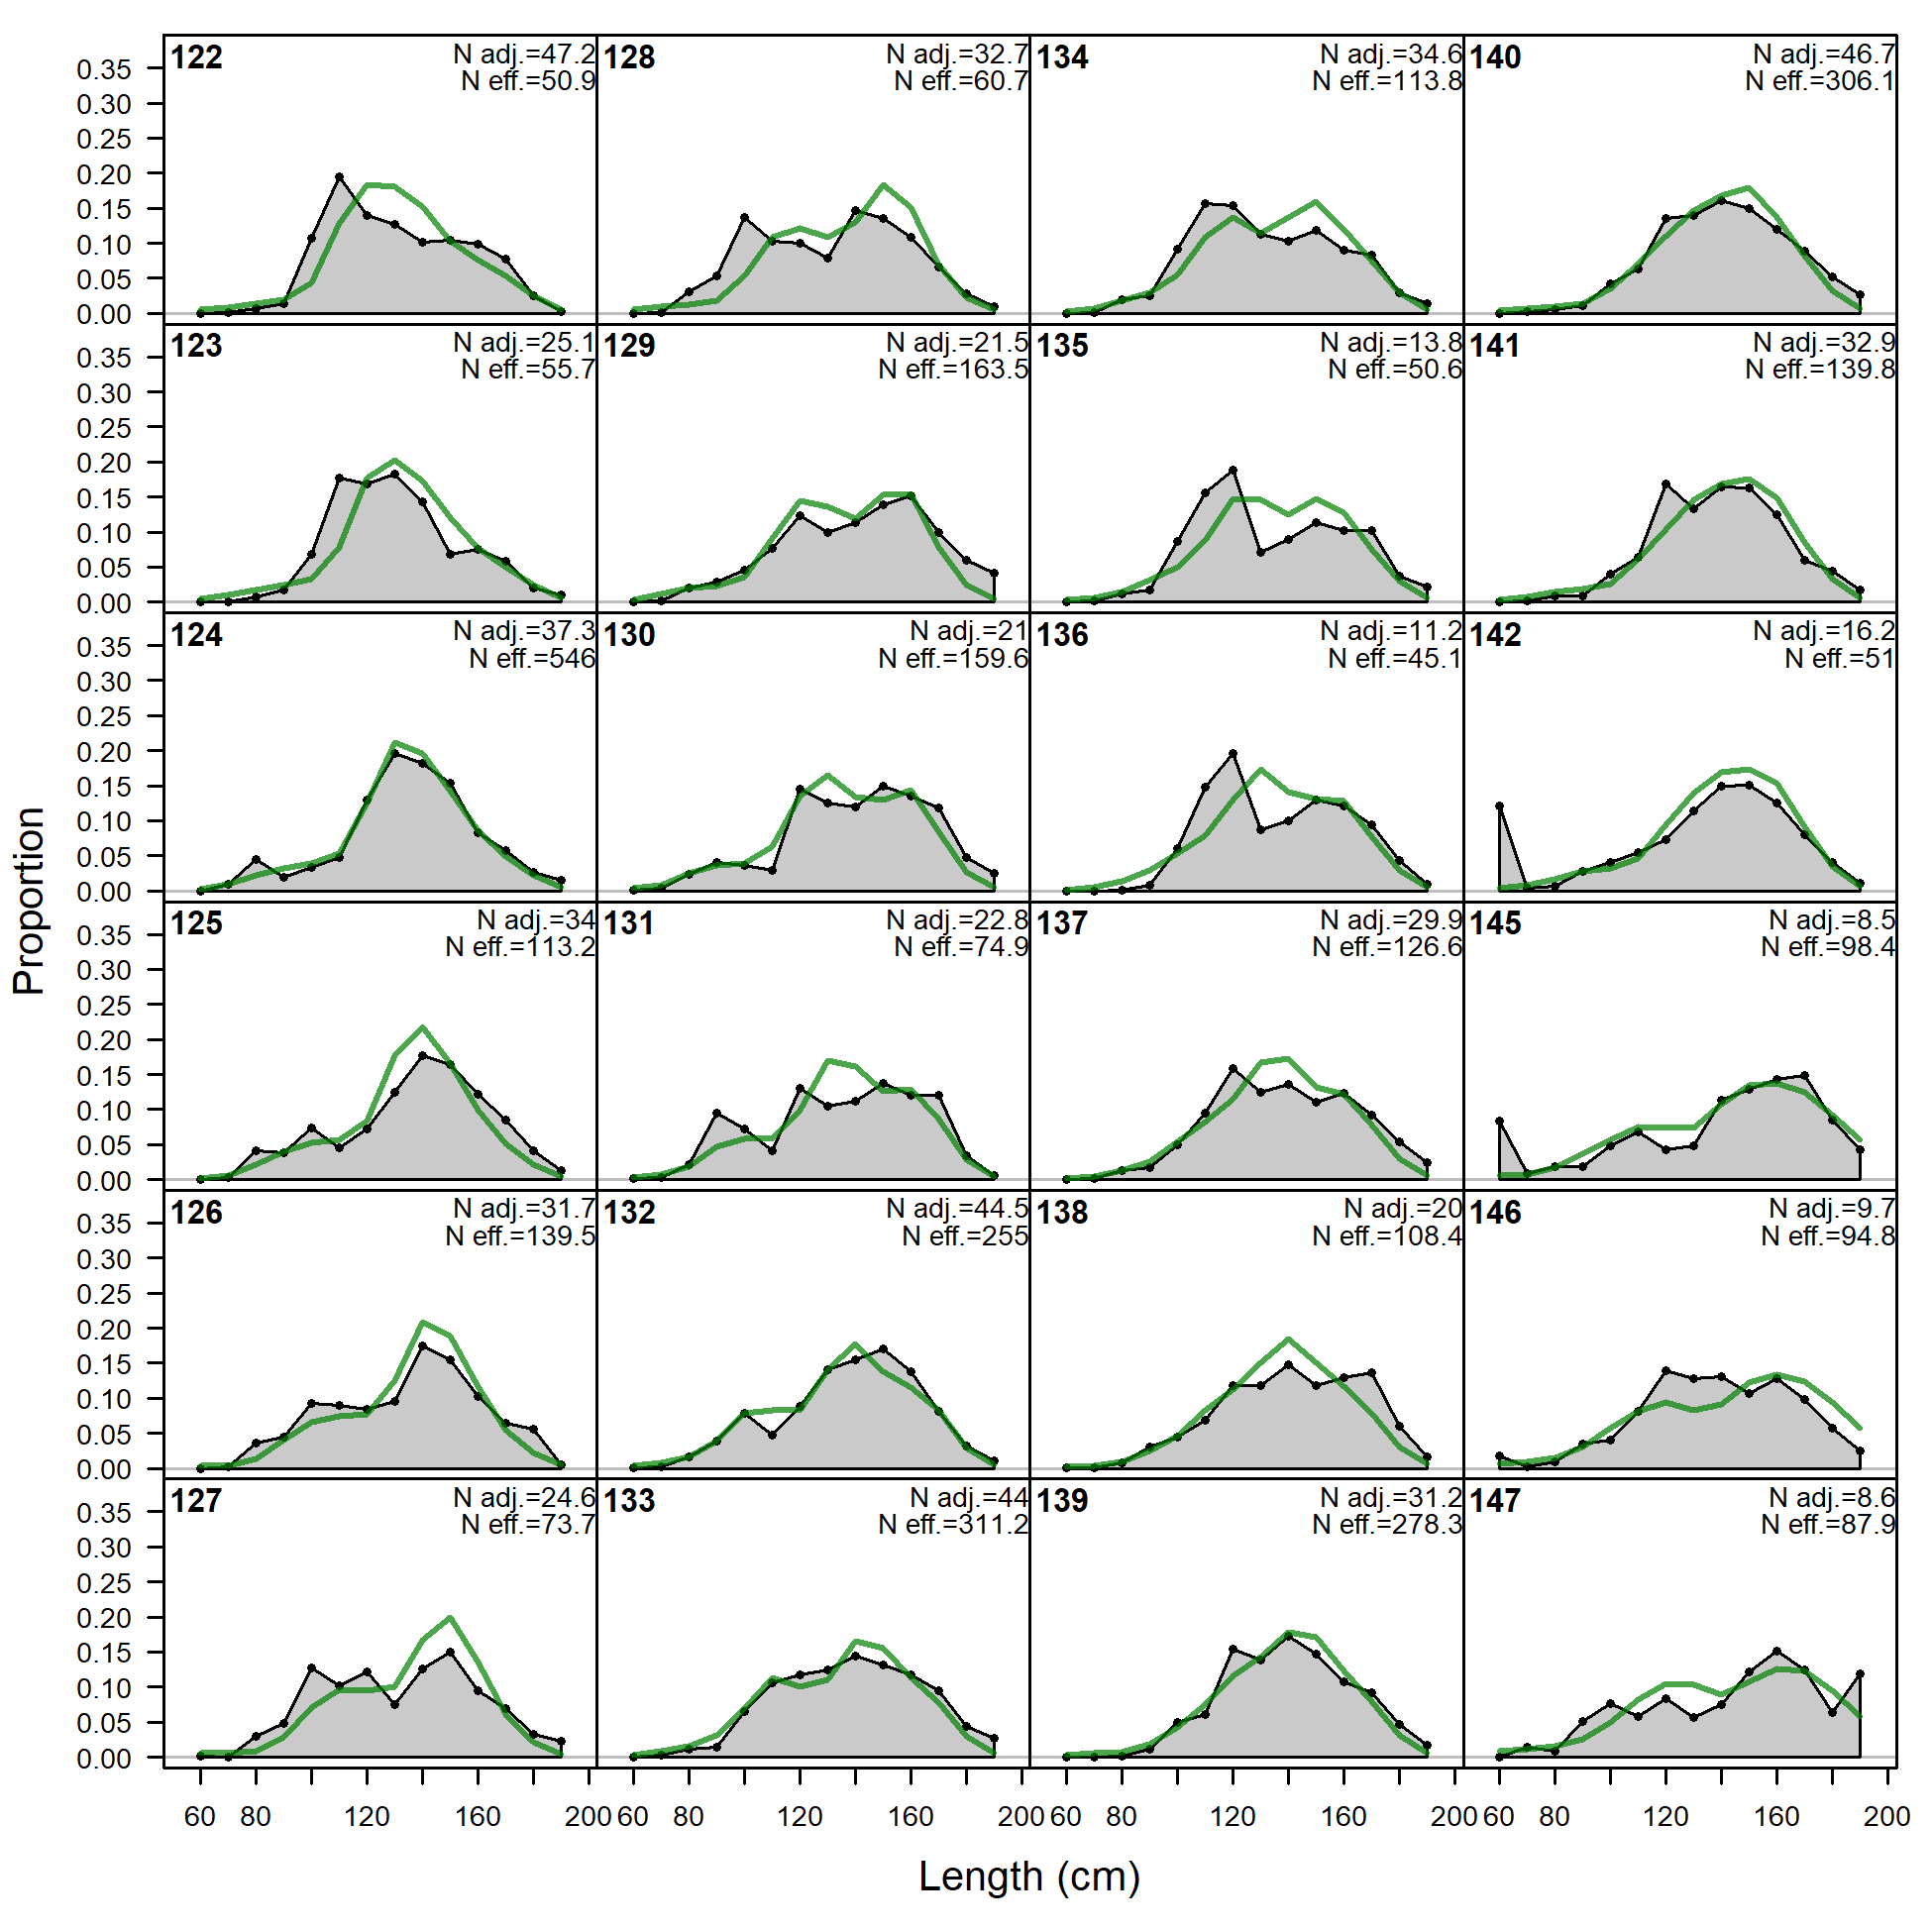
Size comps, whole catch, LL-n-A2 (plot 1 of 5).
'N adj.' is the input sample size after data-weighting adjustment. N eff. is the calculated effective sample size used in the McAllister-Ianelli tuning method. (plot 2 of 5) (plot 3 of 5) (plot 4 of 5)
file: comp_sizefit_flt2mkt0_page4.png
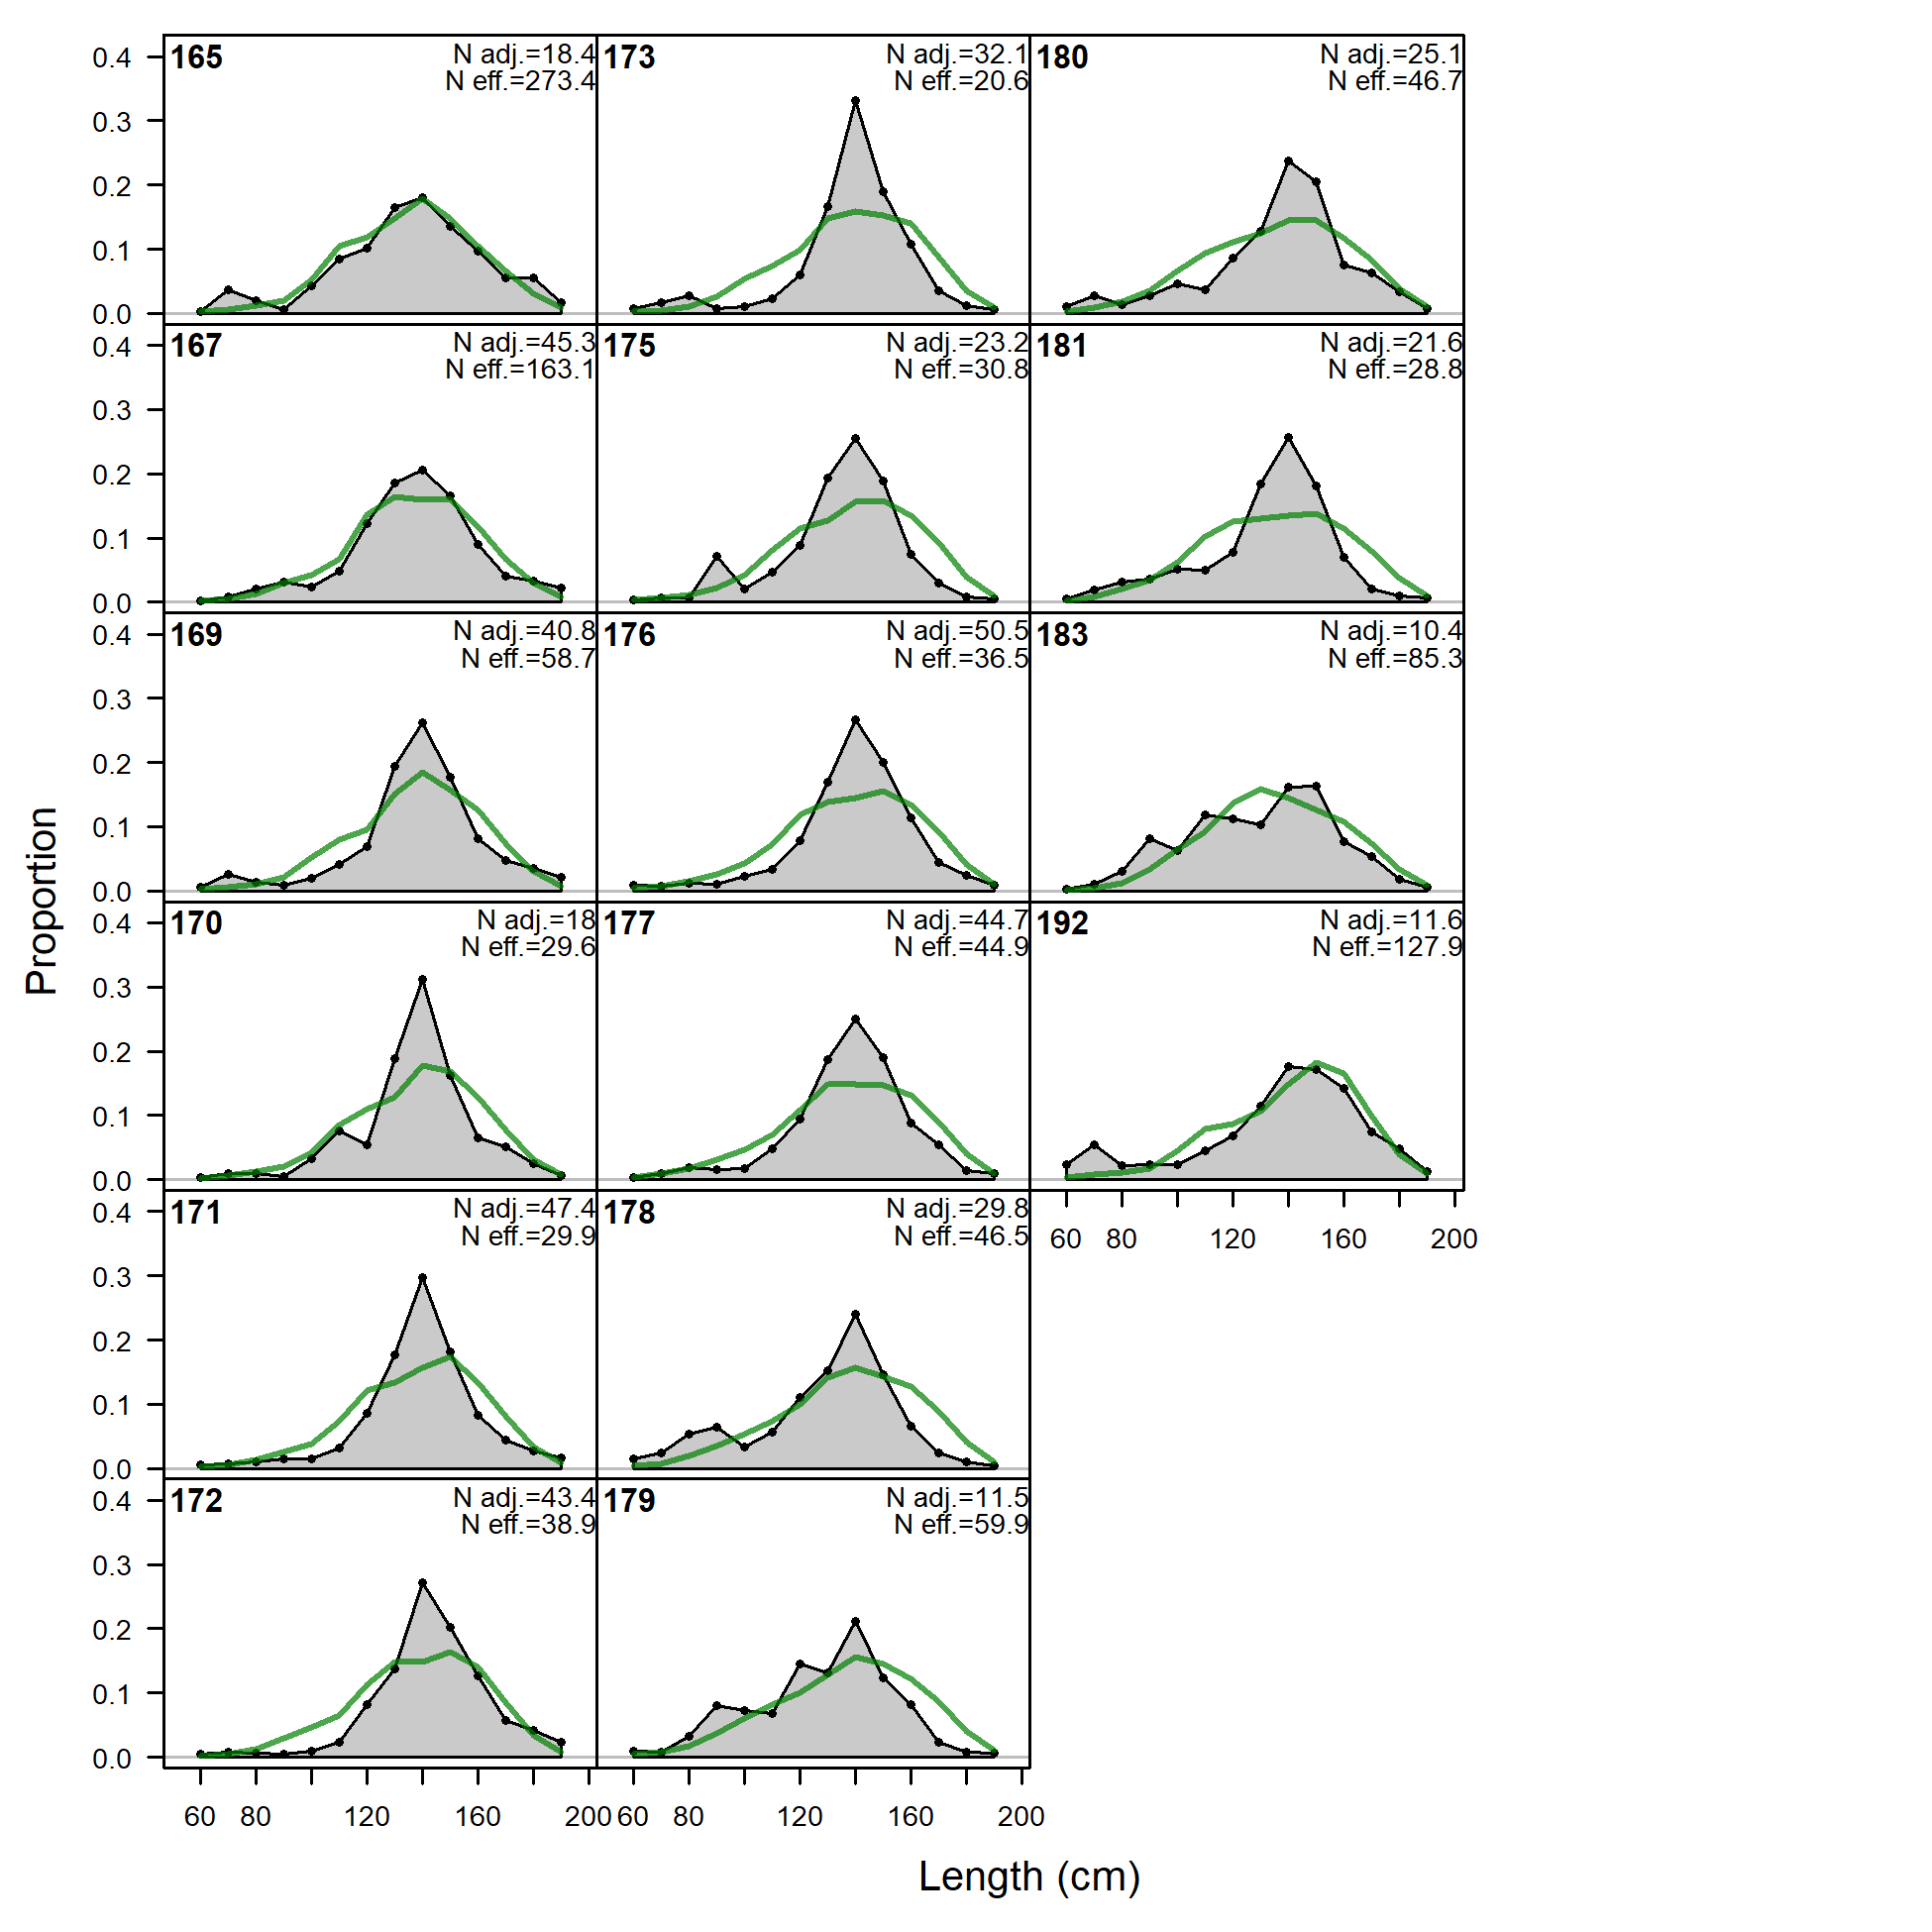
Size comps, whole catch, LL-n-A2 (plot 1 of 5).
'N adj.' is the input sample size after data-weighting adjustment. N eff. is the calculated effective sample size used in the McAllister-Ianelli tuning method. (plot 2 of 5) (plot 3 of 5) (plot 4 of 5) (plot 5 of 5)
file: comp_sizefit_flt2mkt0_page5.png
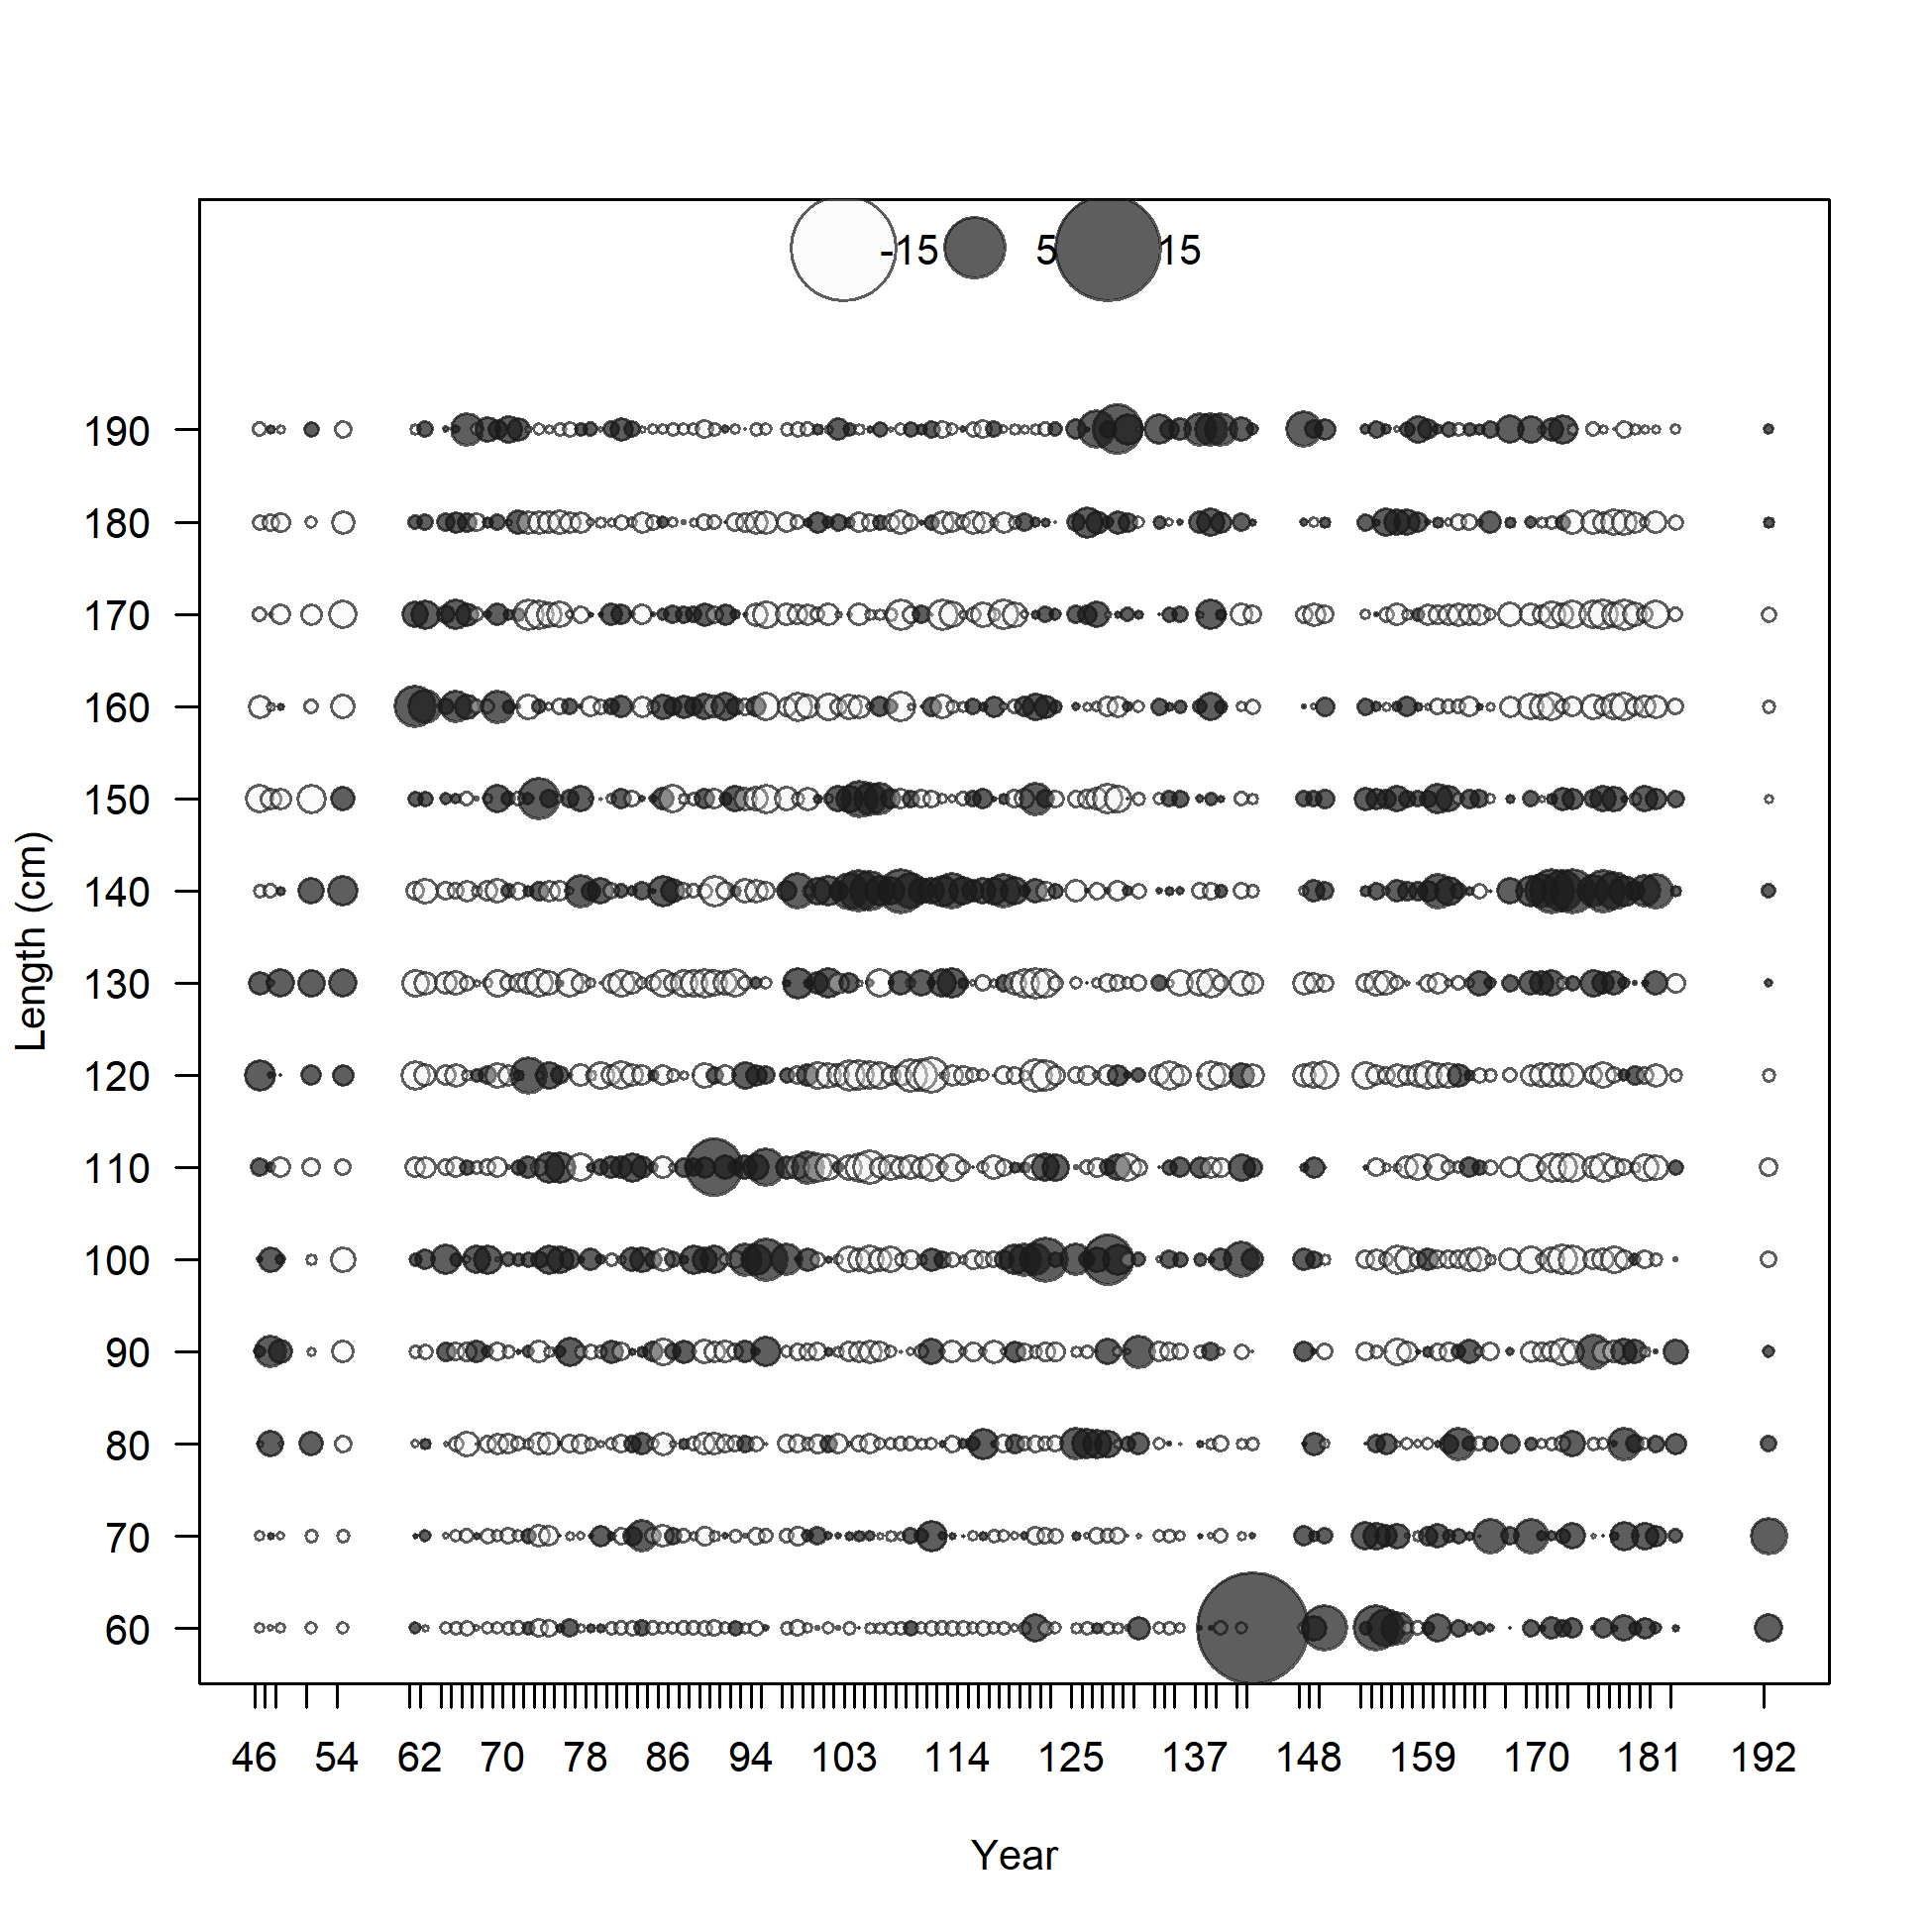
Pearson residuals, whole catch, LL-n-A2 (max=16.74) (plot 5 of 5)
Closed bubbles are positive residuals (observed > expected) and open bubbles are negative residuals (observed < expected).
file: comp_sizefit_residsflt2mkt0_page5.png
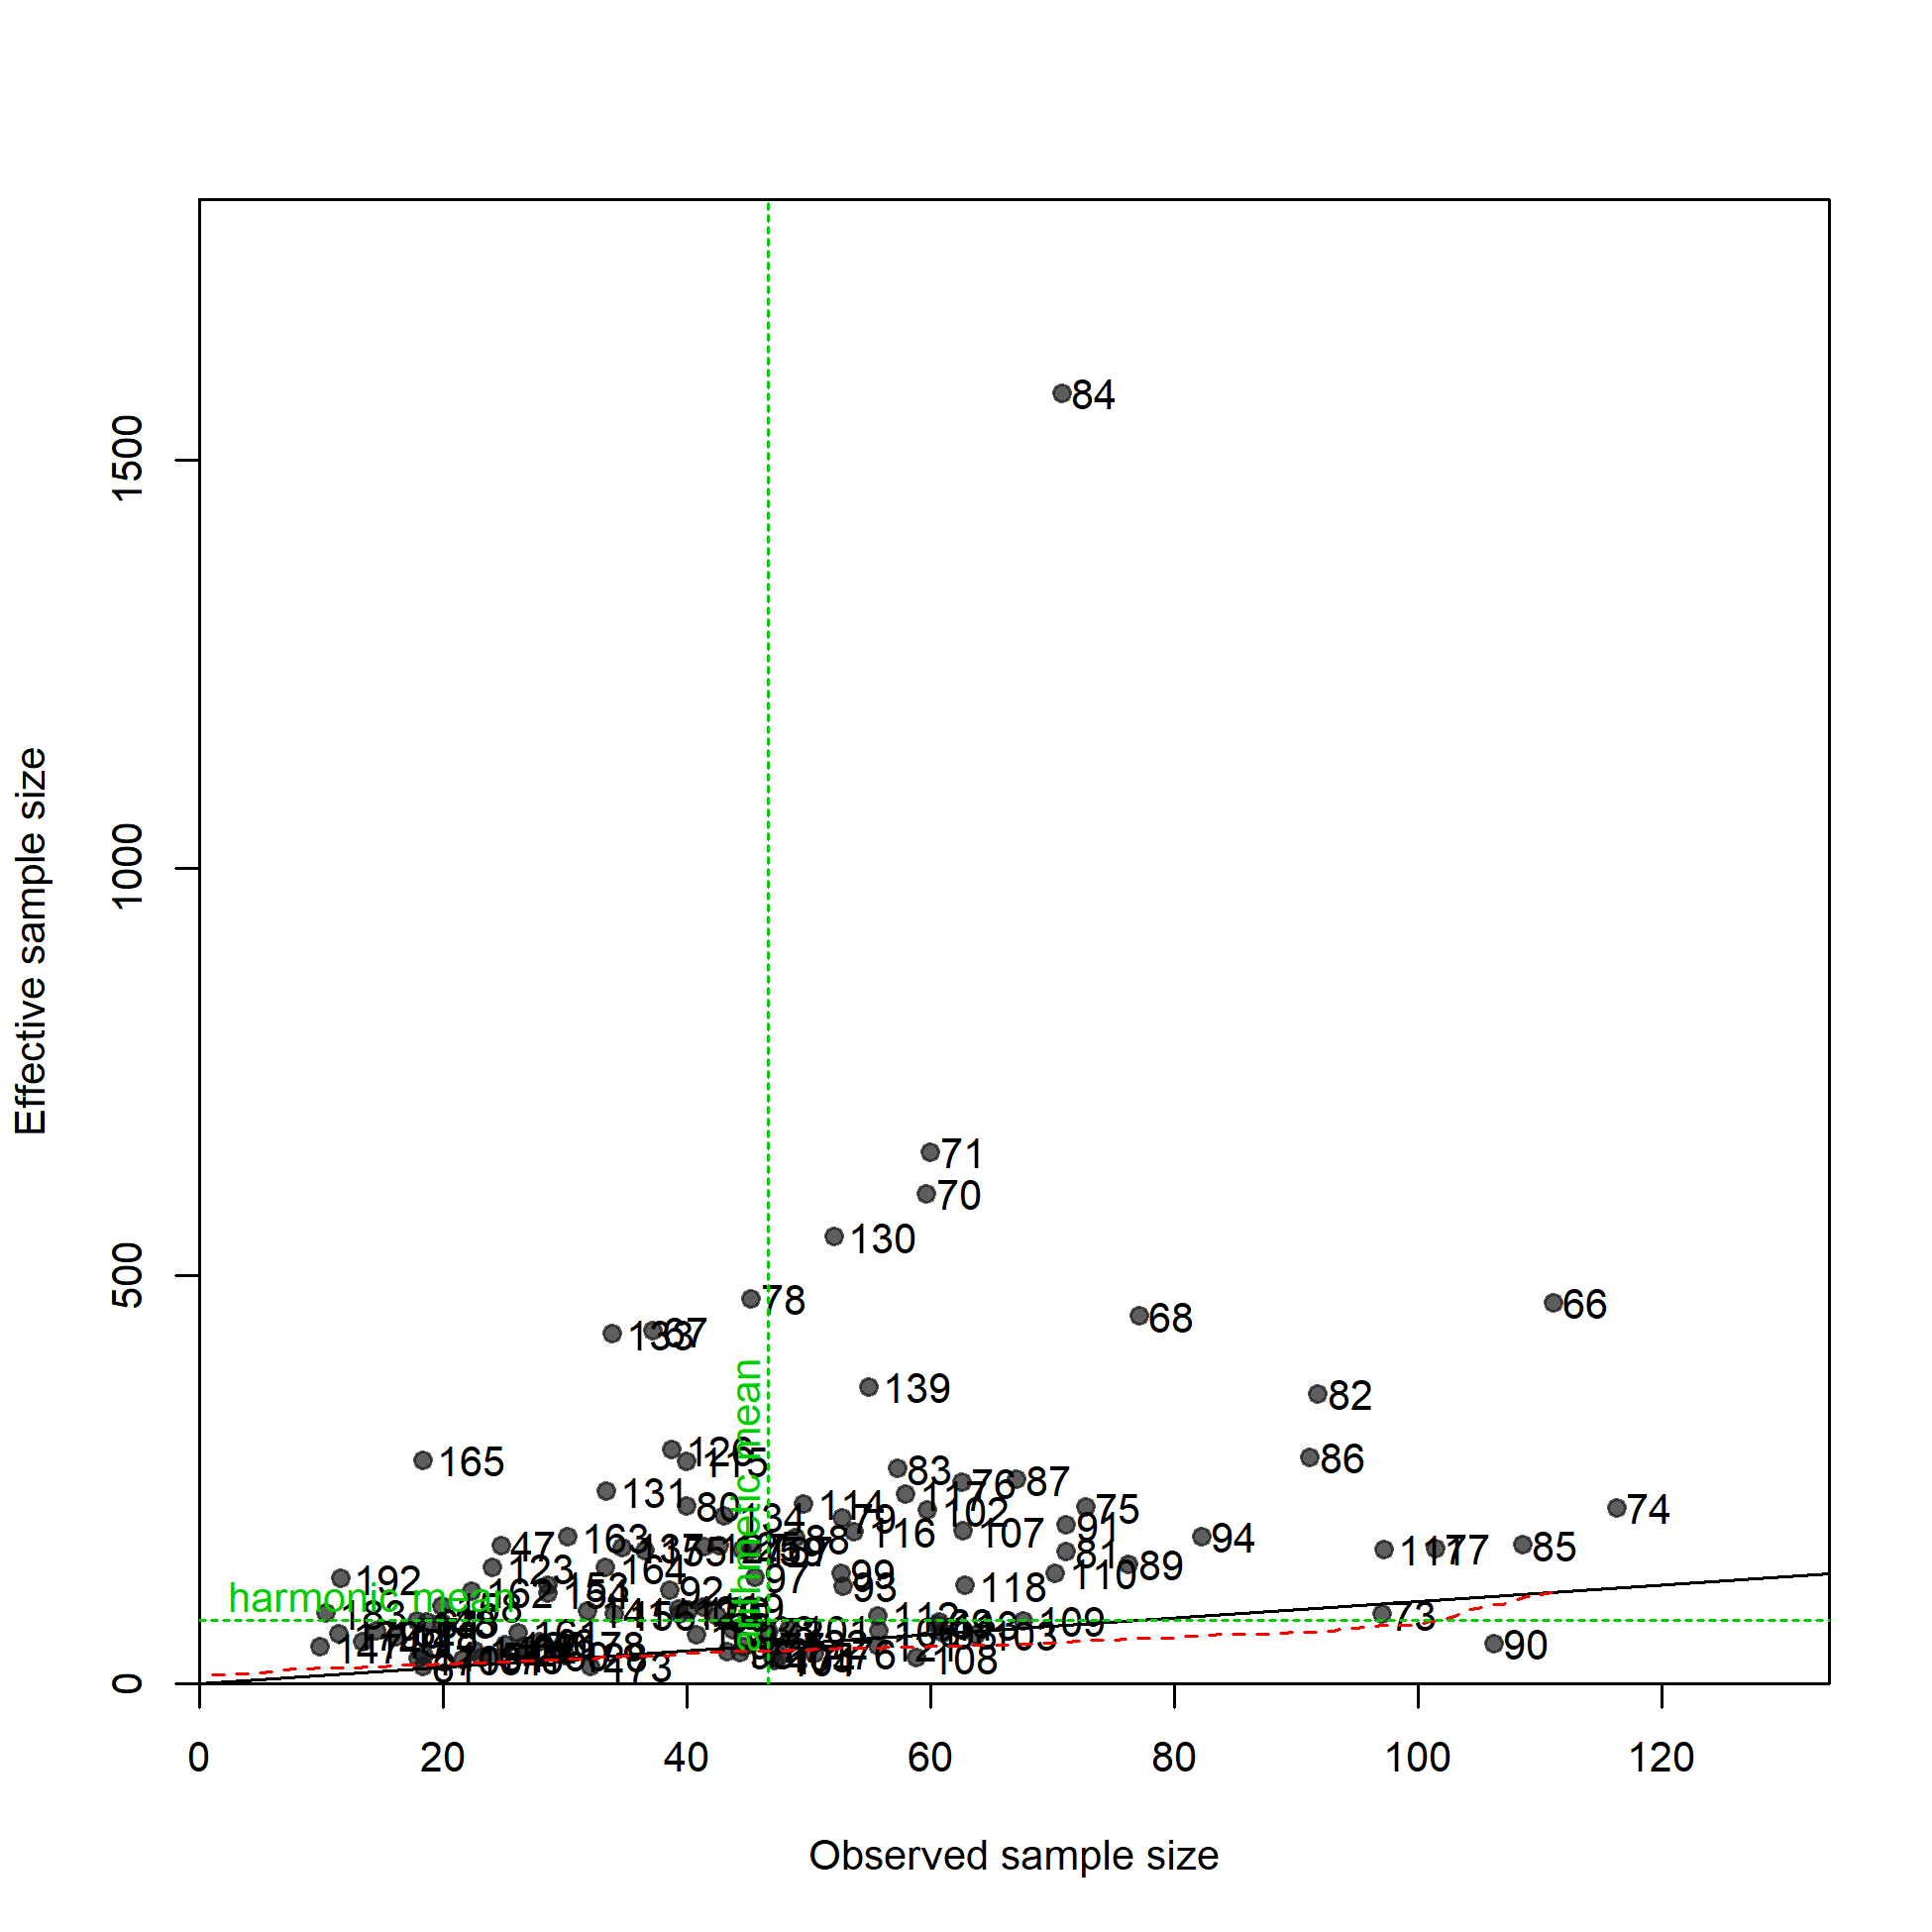
N-EffN comparison, Size comps, whole catch, LL-n-A2
file: comp_sizefit_sampsize_flt2mkt0.png
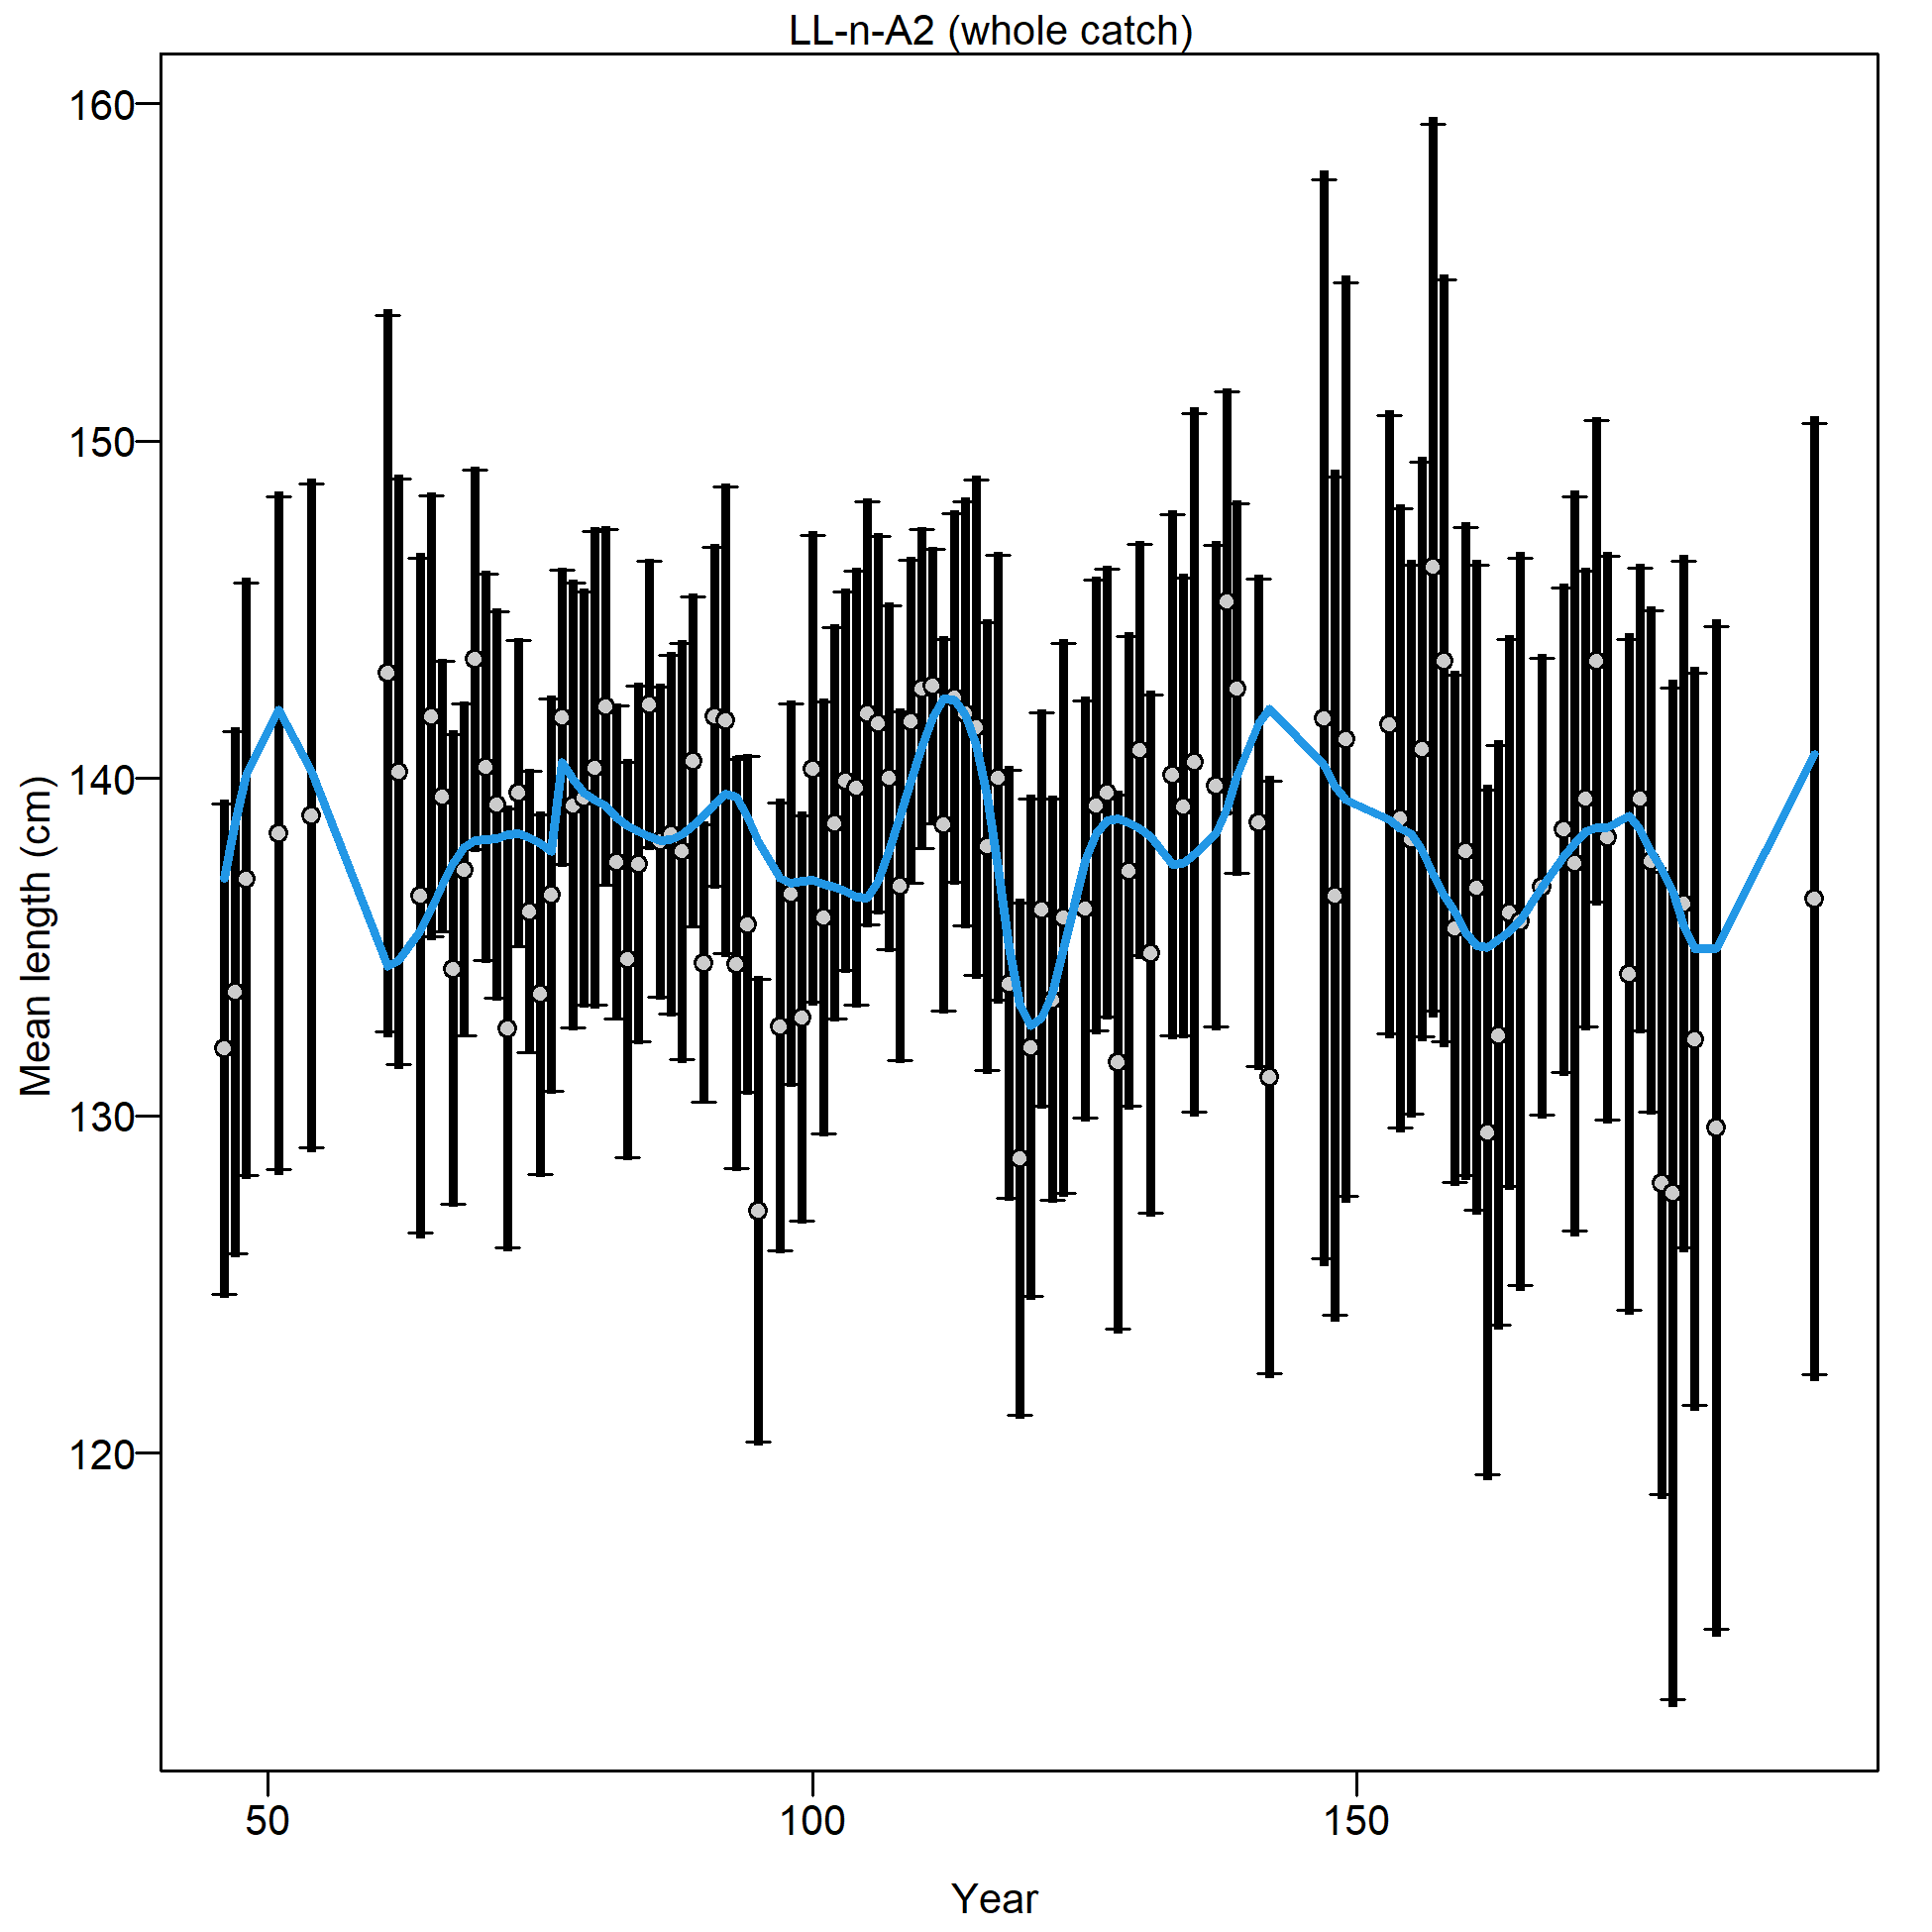
Mean size for LL-n-A2 with 95% confidence intervals based on current sample sizes.
Francis data weighting method TA1.8: thinner intervals (with capped ends) show result of further adjusting sample sizes based on suggested multiplier (with 95% interval) for size data from LL-n-A2:
1.0314 (0.8185-1.3909)
For more info, see Francis (2011).
file: comp_sizefit_data_weighting_TA1.8_LL-n-A2.png
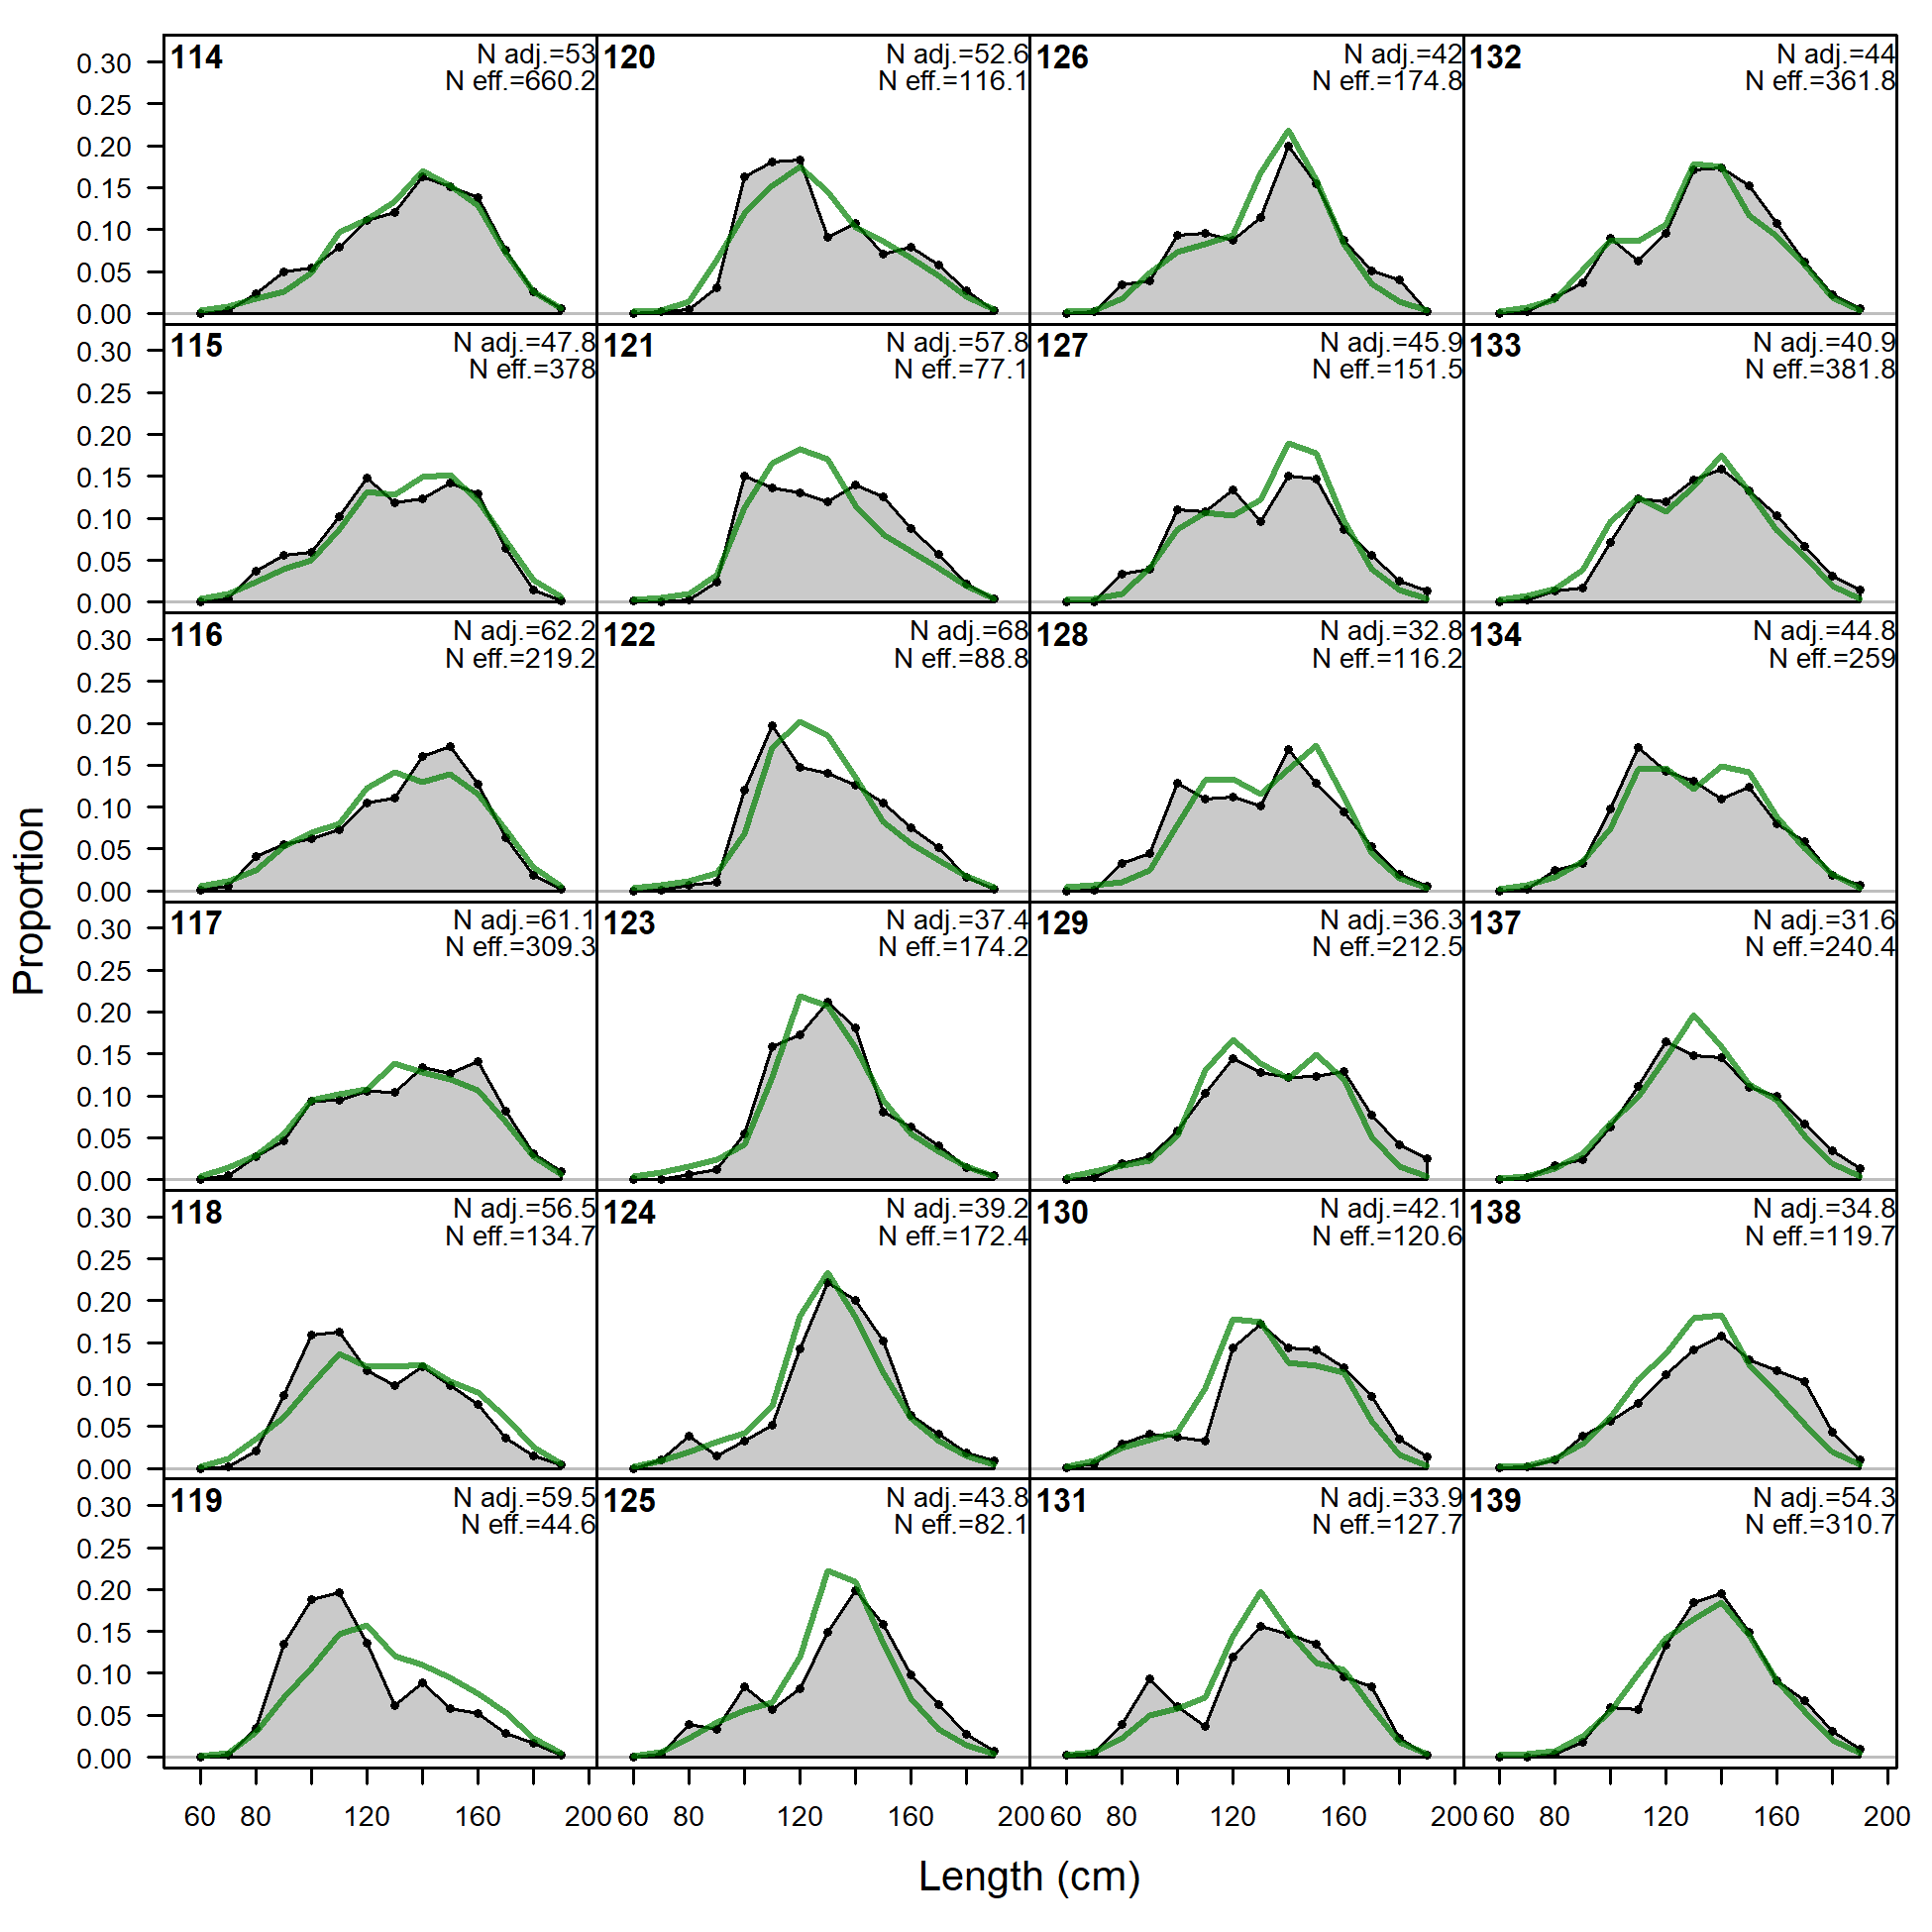
Size comps, whole catch, LL-n-A3 (plot 1 of 5).
'N adj.' is the input sample size after data-weighting adjustment. N eff. is the calculated effective sample size used in the McAllister-Ianelli tuning method.
file: comp_sizefit_flt3mkt0_page1.png
Size comps, whole catch, LL-n-A3 (plot 1 of 5).
'N adj.' is the input sample size after data-weighting adjustment. N eff. is the calculated effective sample size used in the McAllister-Ianelli tuning method. (plot 2 of 5)
file: comp_sizefit_flt3mkt0_page2.png
Size comps, whole catch, LL-n-A3 (plot 1 of 5).
'N adj.' is the input sample size after data-weighting adjustment. N eff. is the calculated effective sample size used in the McAllister-Ianelli tuning method. (plot 2 of 5) (plot 3 of 5)
file: comp_sizefit_flt3mkt0_page3.png
Size comps, whole catch, LL-n-A3 (plot 1 of 5).
'N adj.' is the input sample size after data-weighting adjustment. N eff. is the calculated effective sample size used in the McAllister-Ianelli tuning method. (plot 2 of 5) (plot 3 of 5) (plot 4 of 5)
file: comp_sizefit_flt3mkt0_page4.png
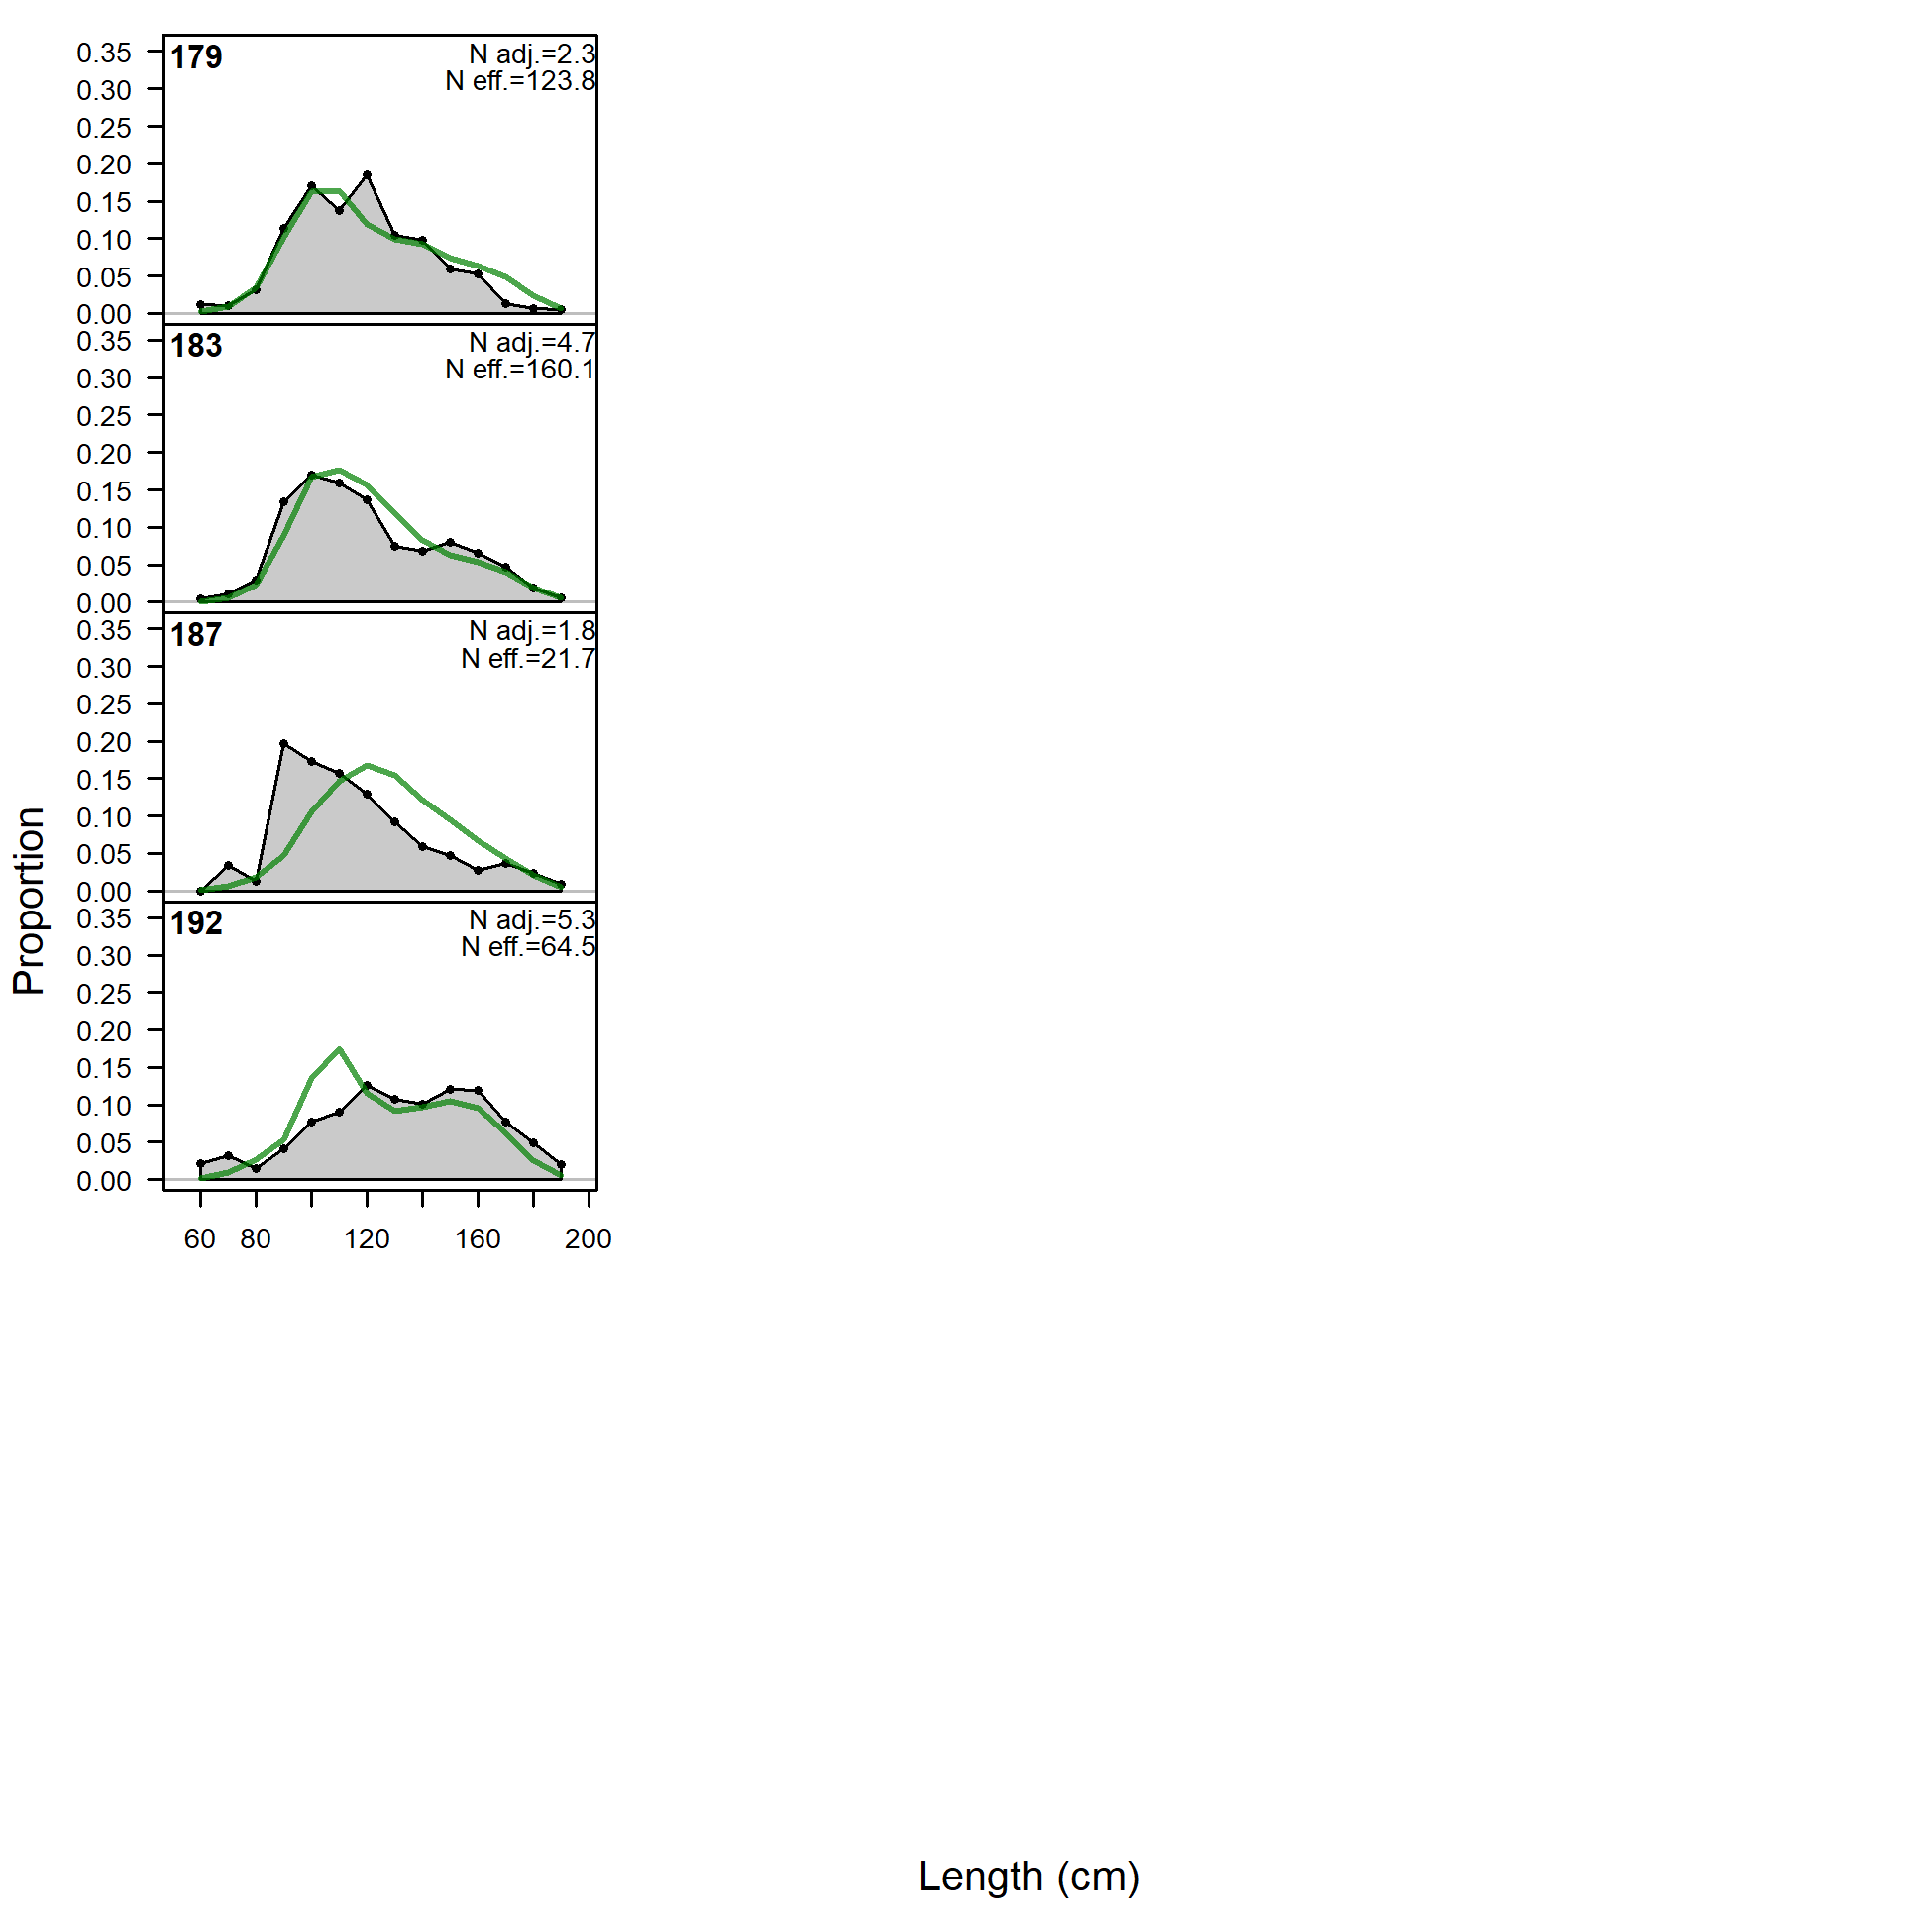
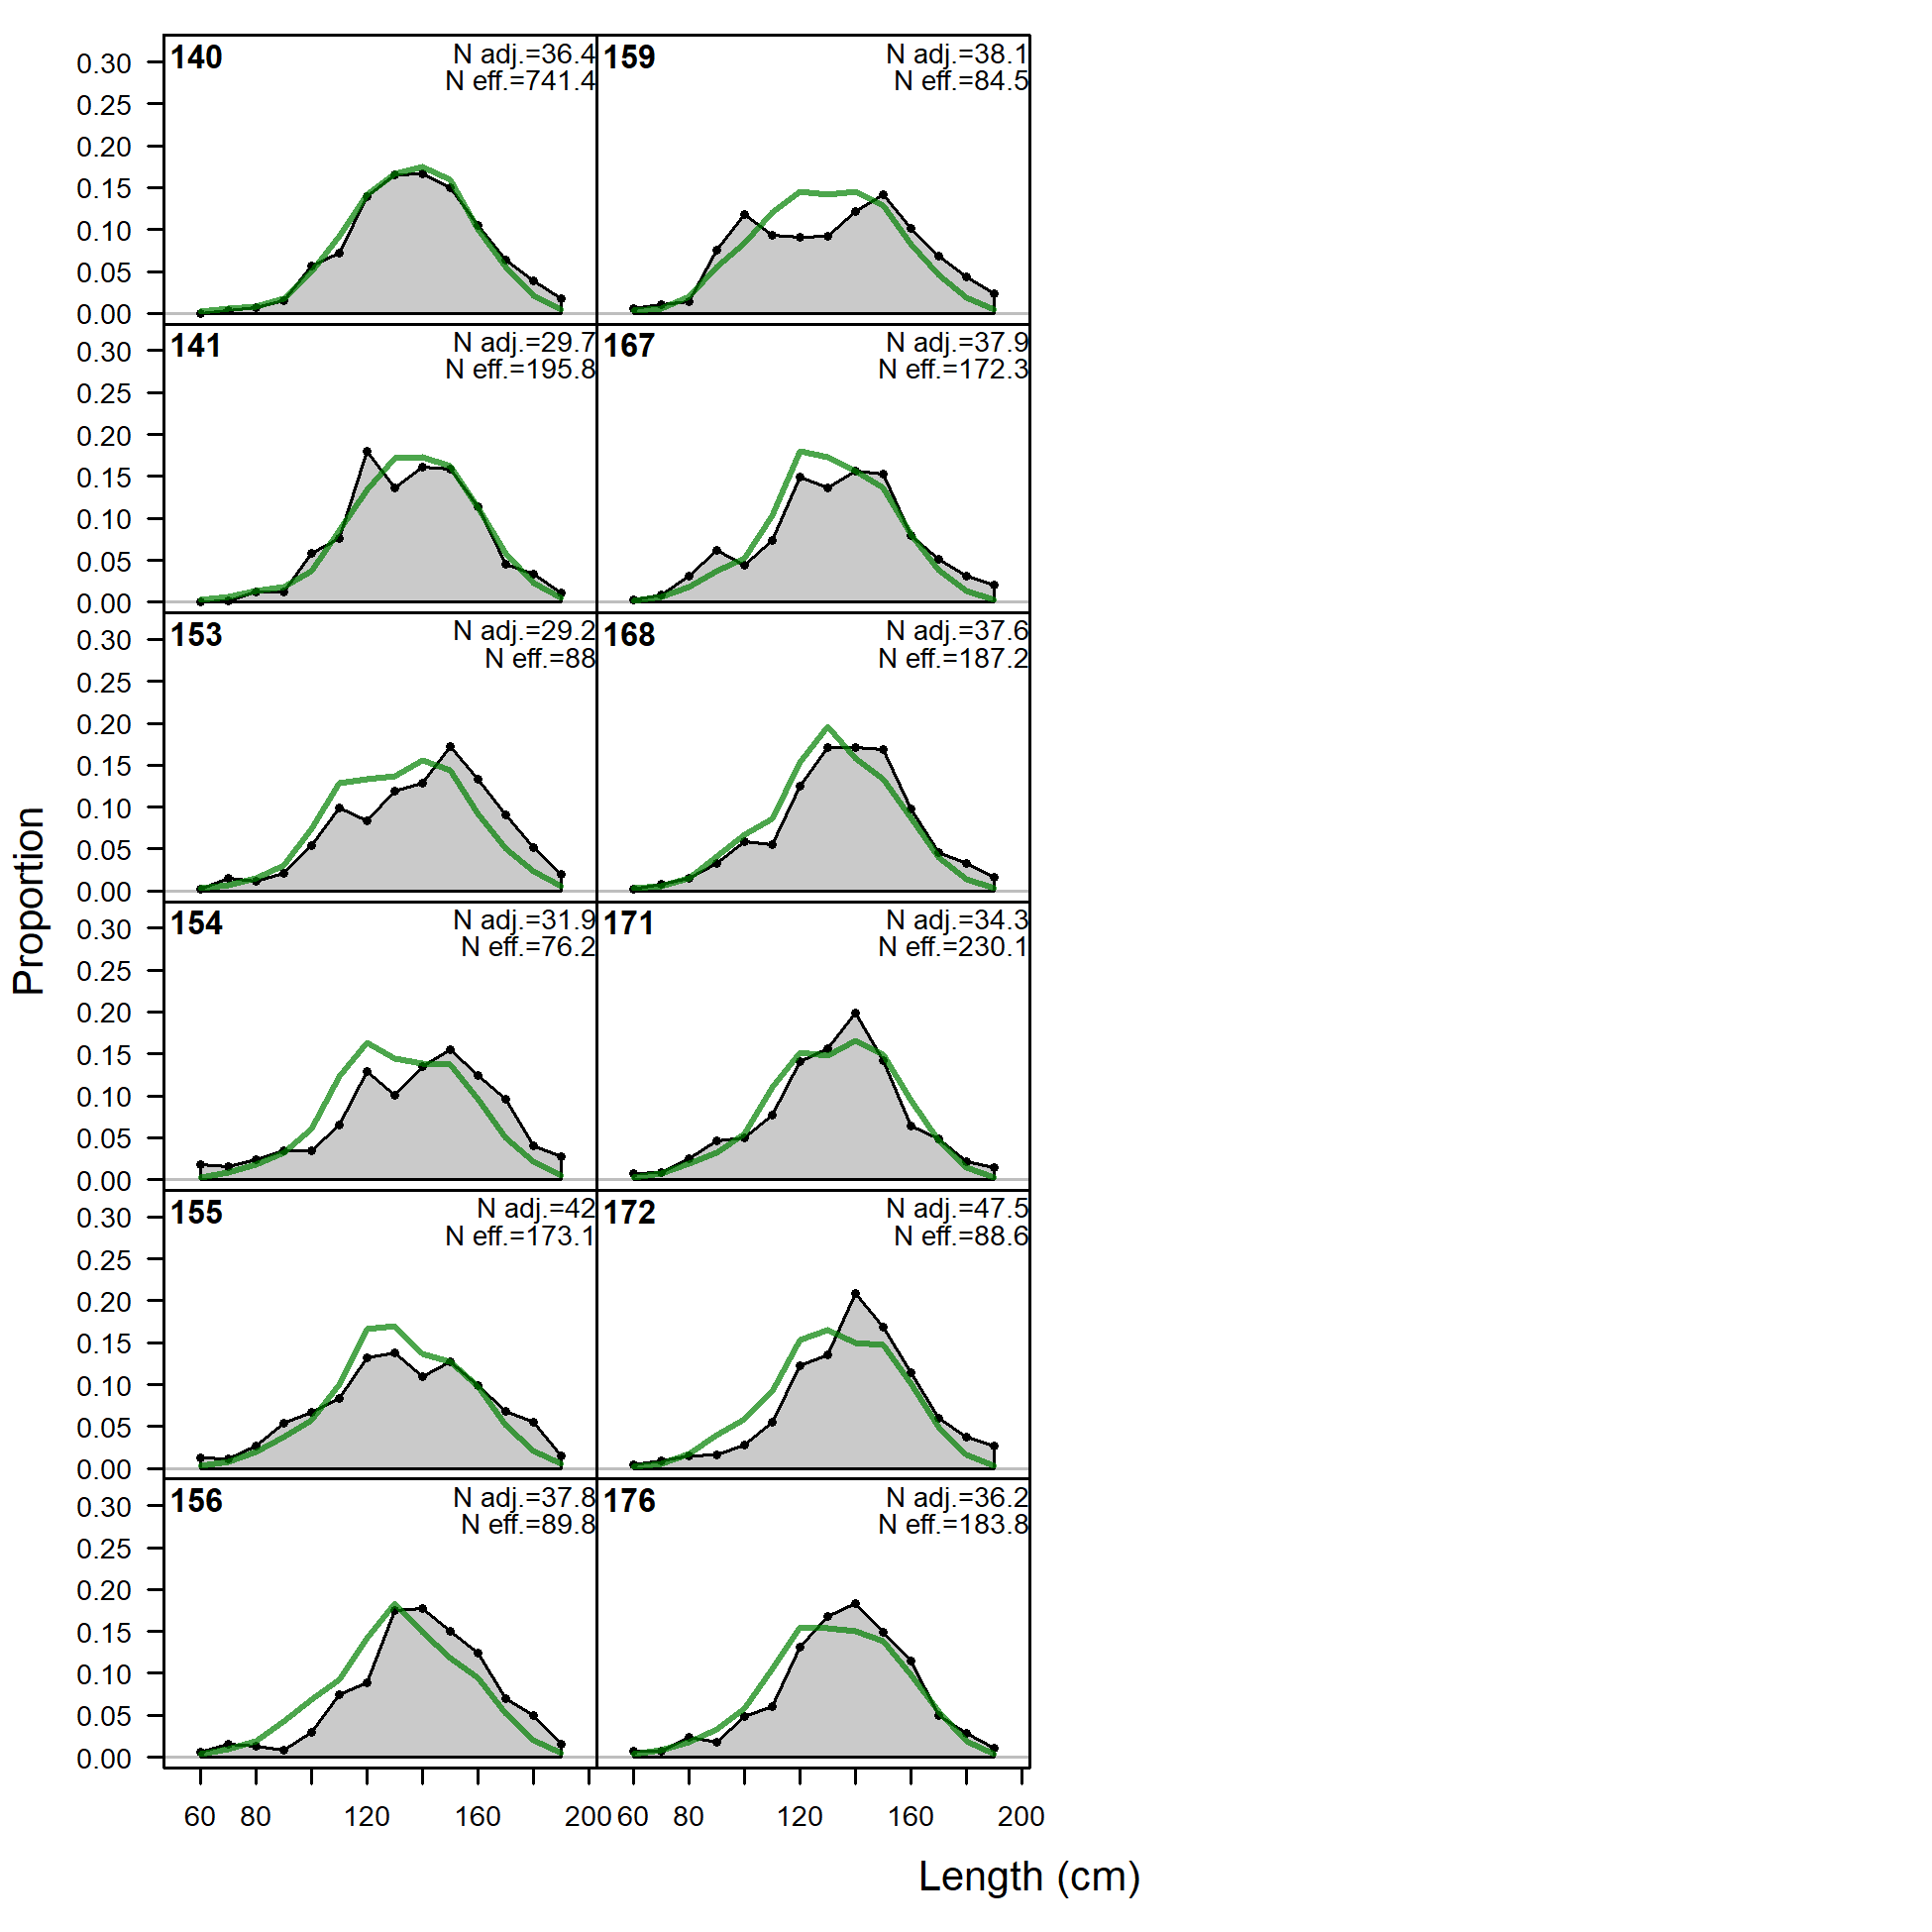
Size comps, whole catch, LL-n-A3 (plot 1 of 5).
'N adj.' is the input sample size after data-weighting adjustment. N eff. is the calculated effective sample size used in the McAllister-Ianelli tuning method. (plot 2 of 5) (plot 3 of 5) (plot 4 of 5) (plot 5 of 5)
file: comp_sizefit_flt3mkt0_page5.png
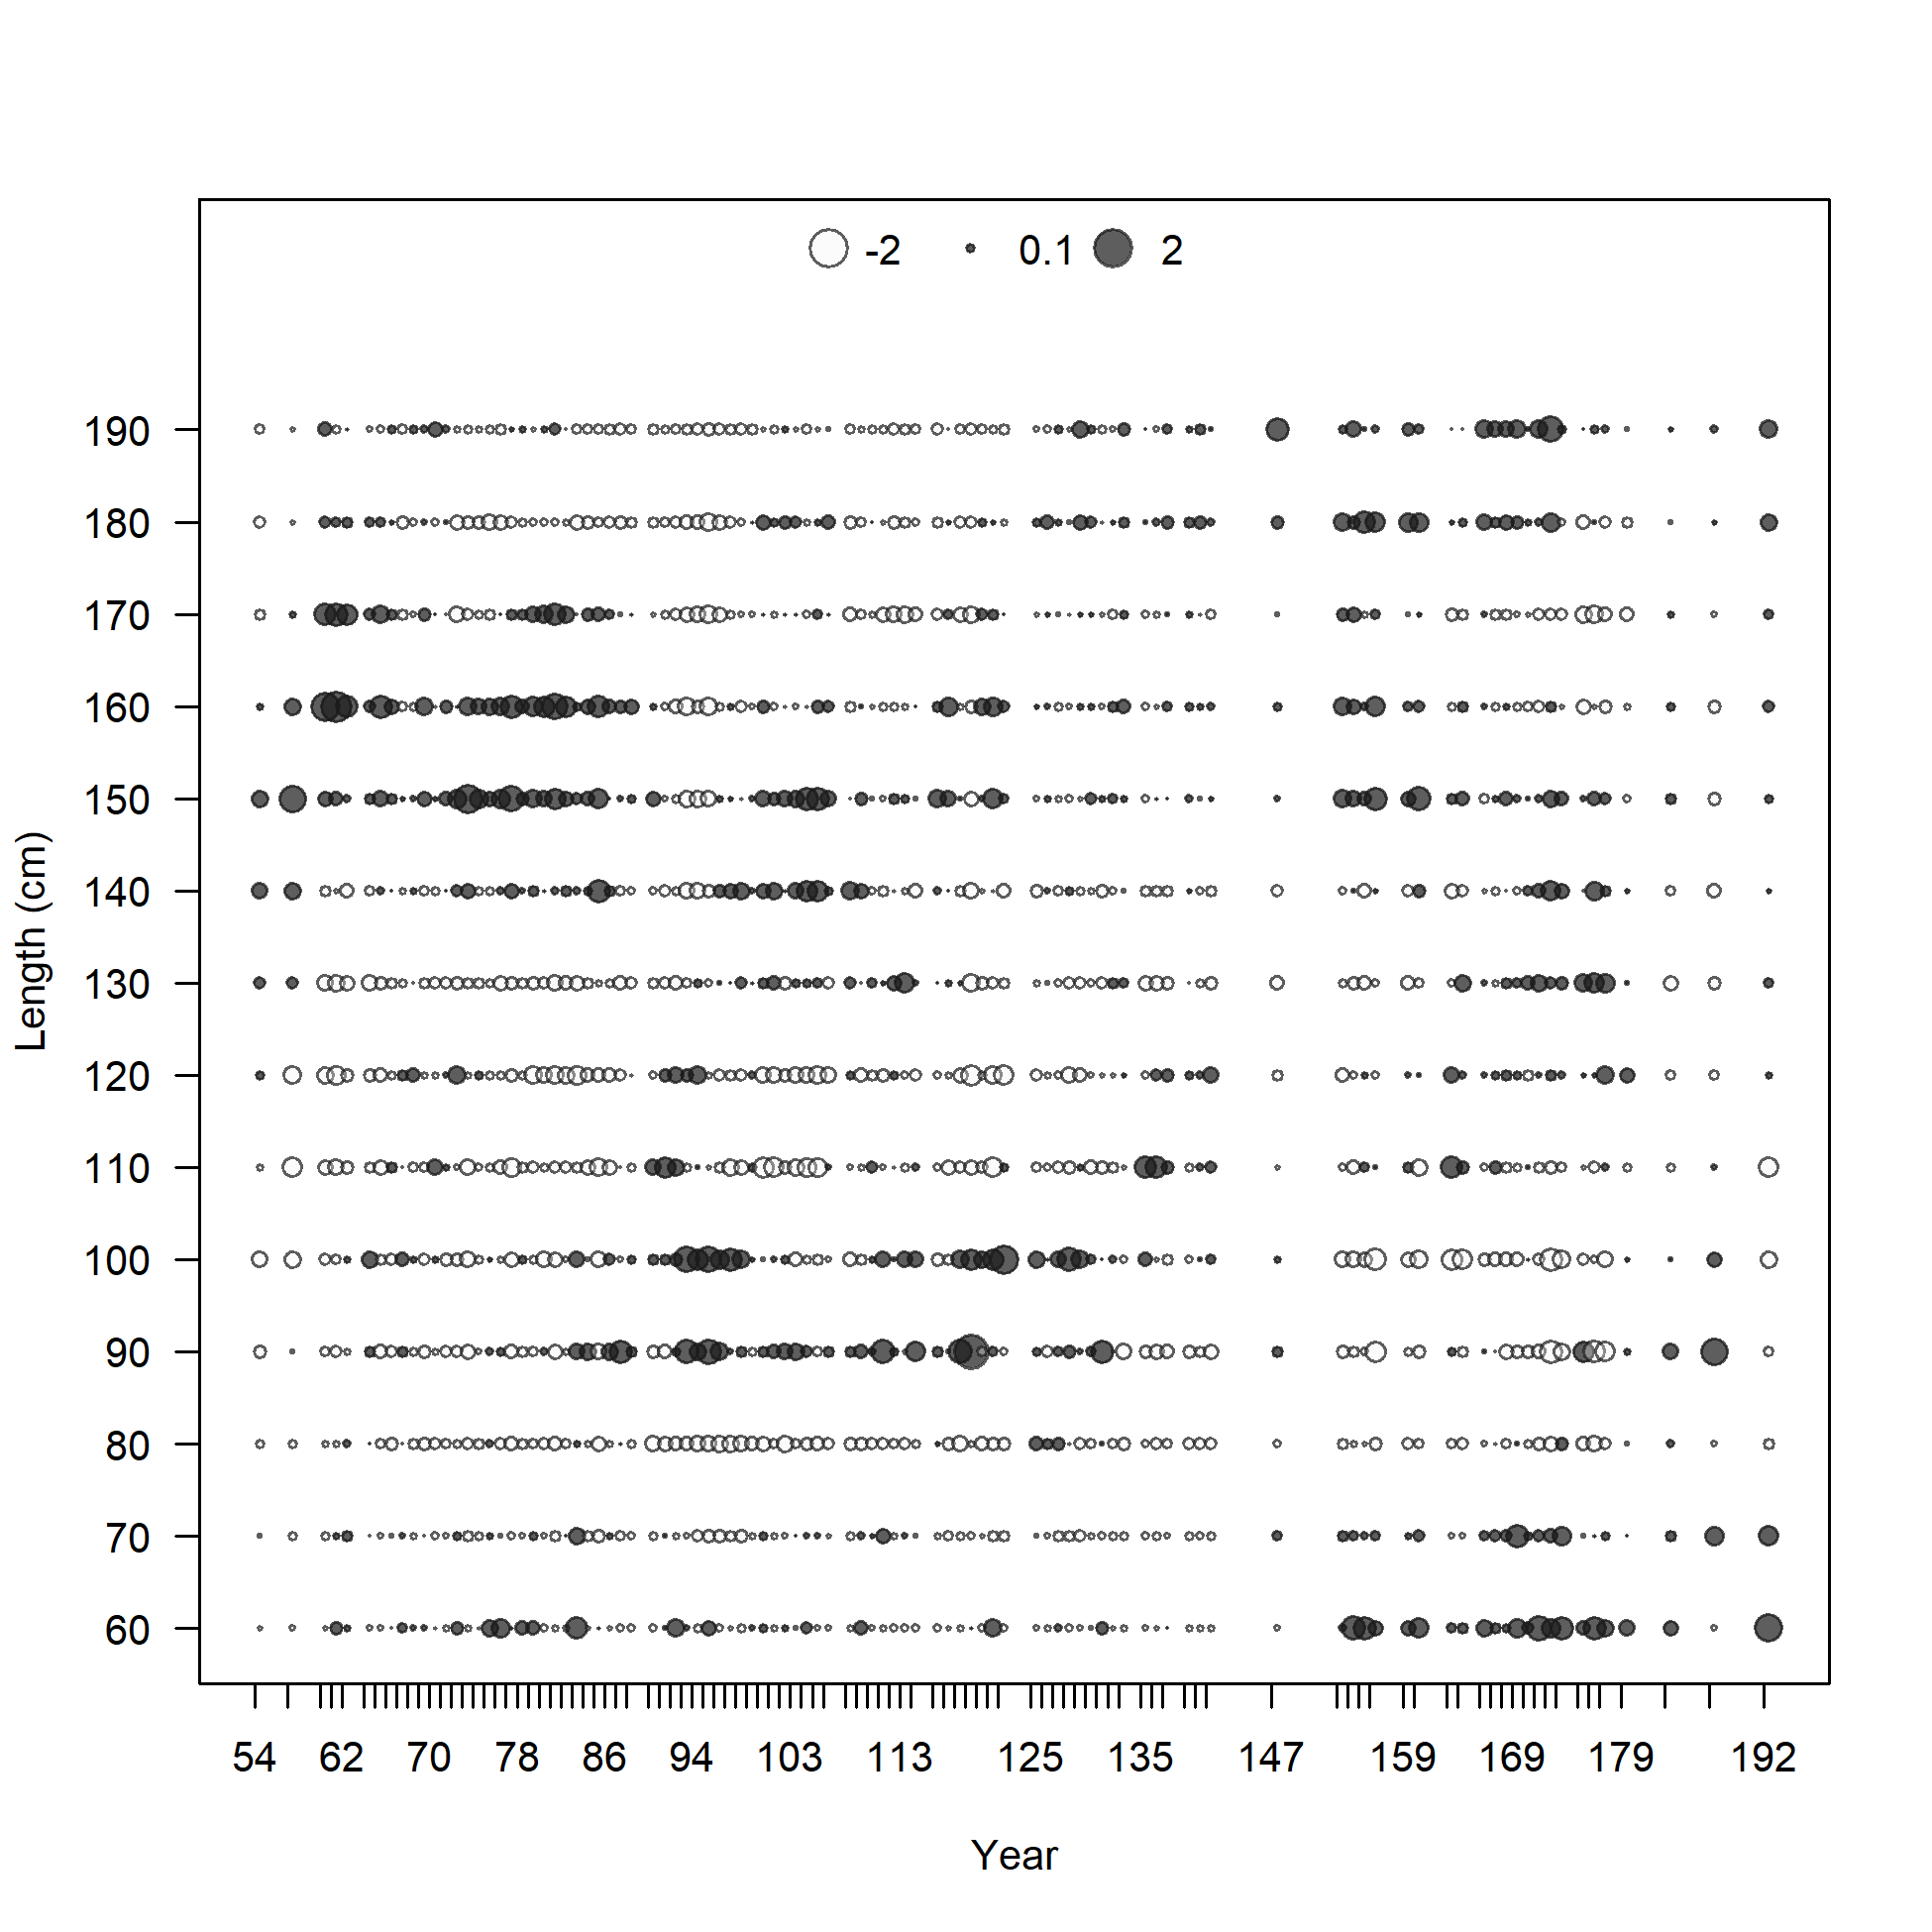
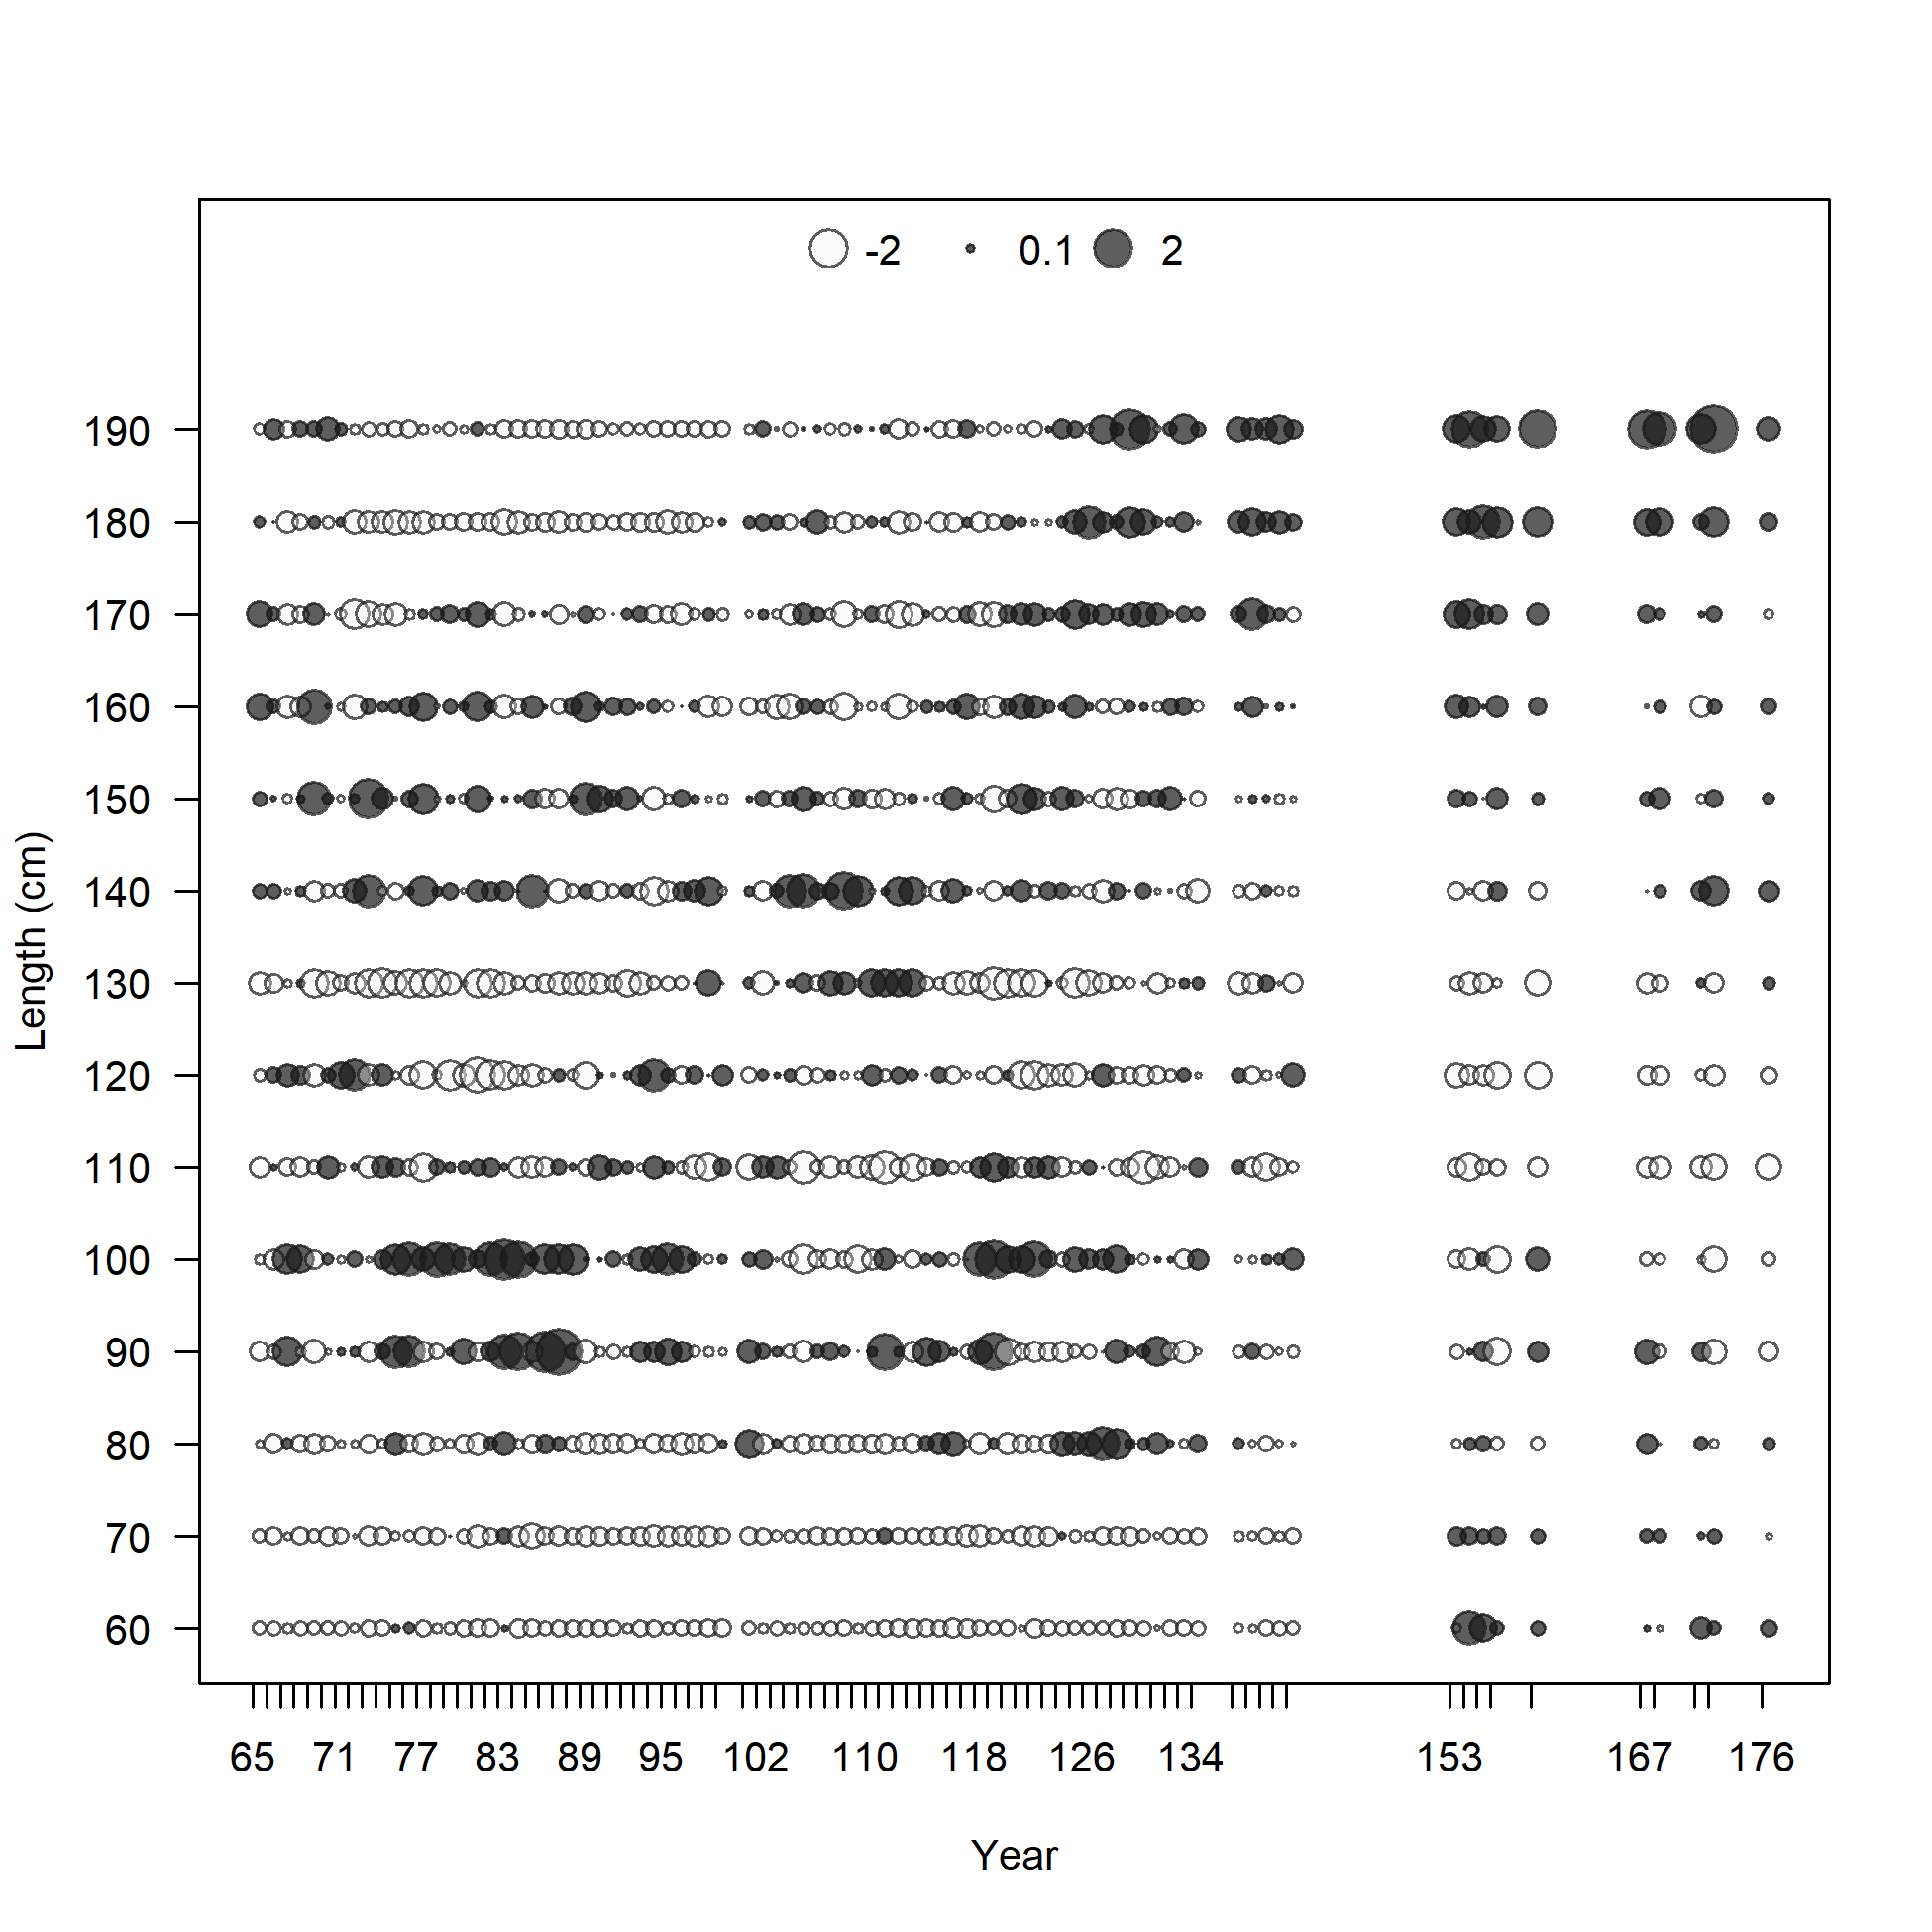
Pearson residuals, whole catch, LL-n-A3 (max=1.61) (plot 5 of 5)
Closed bubbles are positive residuals (observed > expected) and open bubbles are negative residuals (observed < expected).
file: comp_sizefit_residsflt3mkt0_page5.png
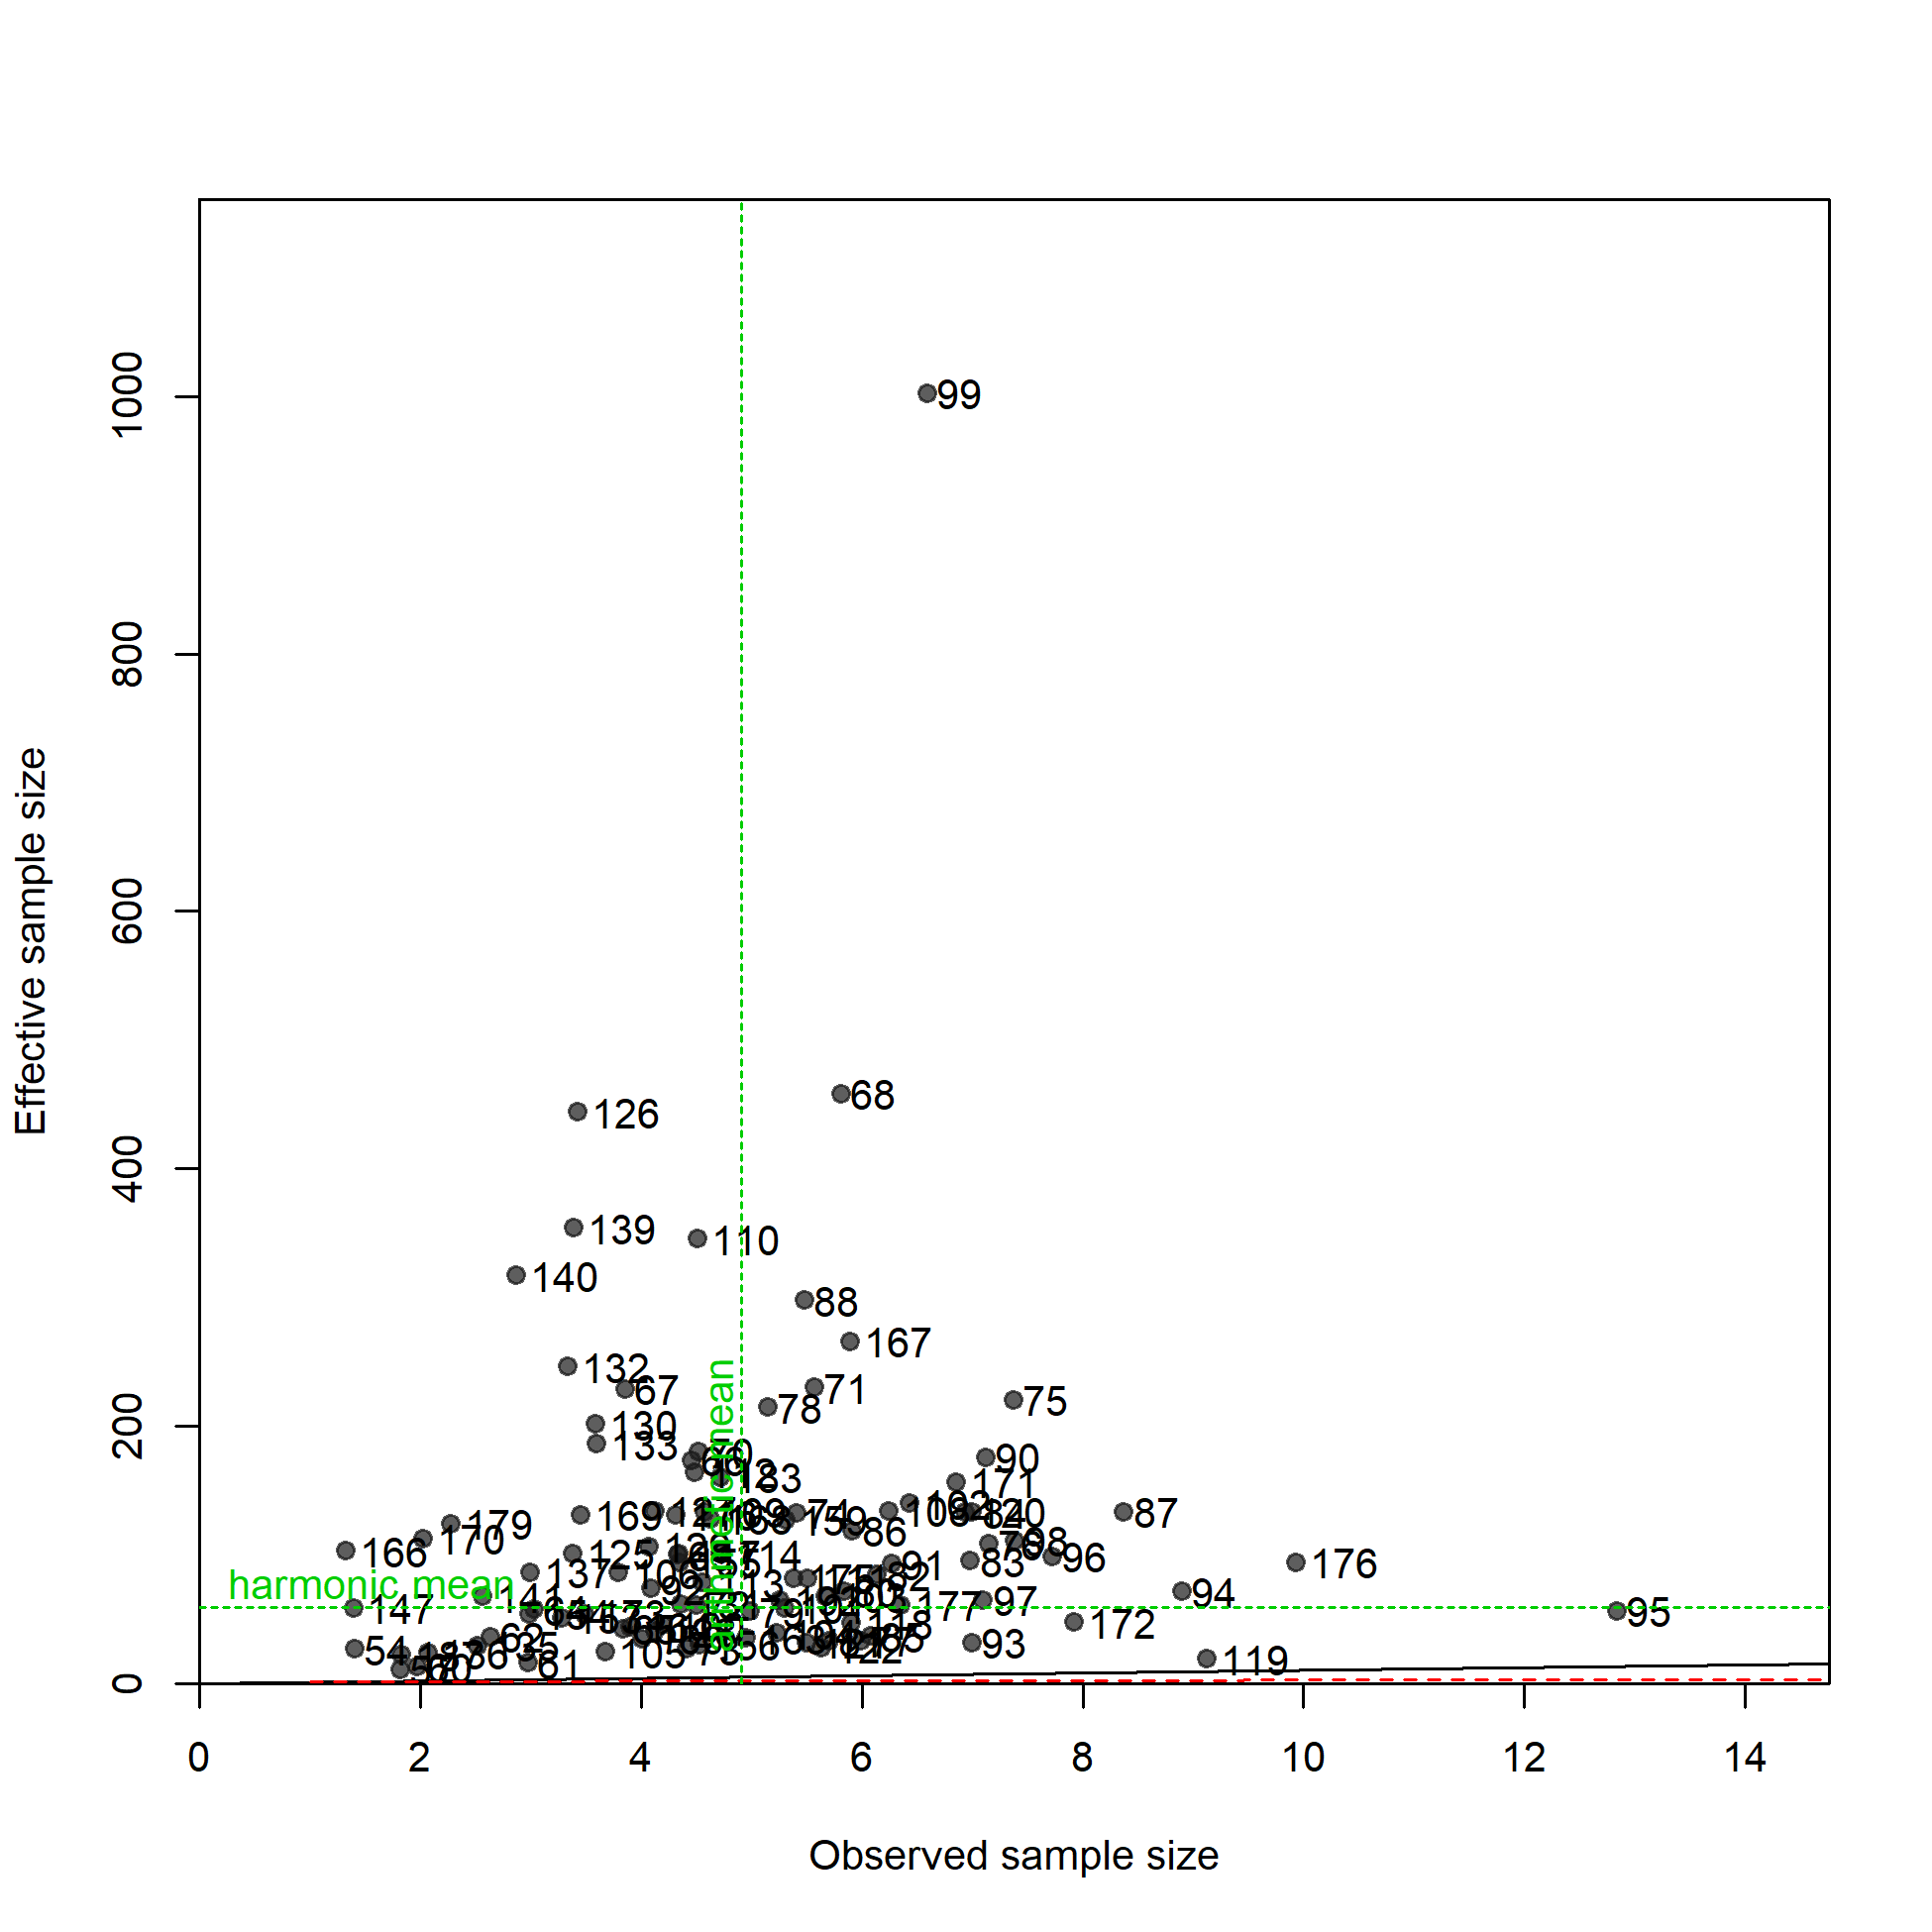
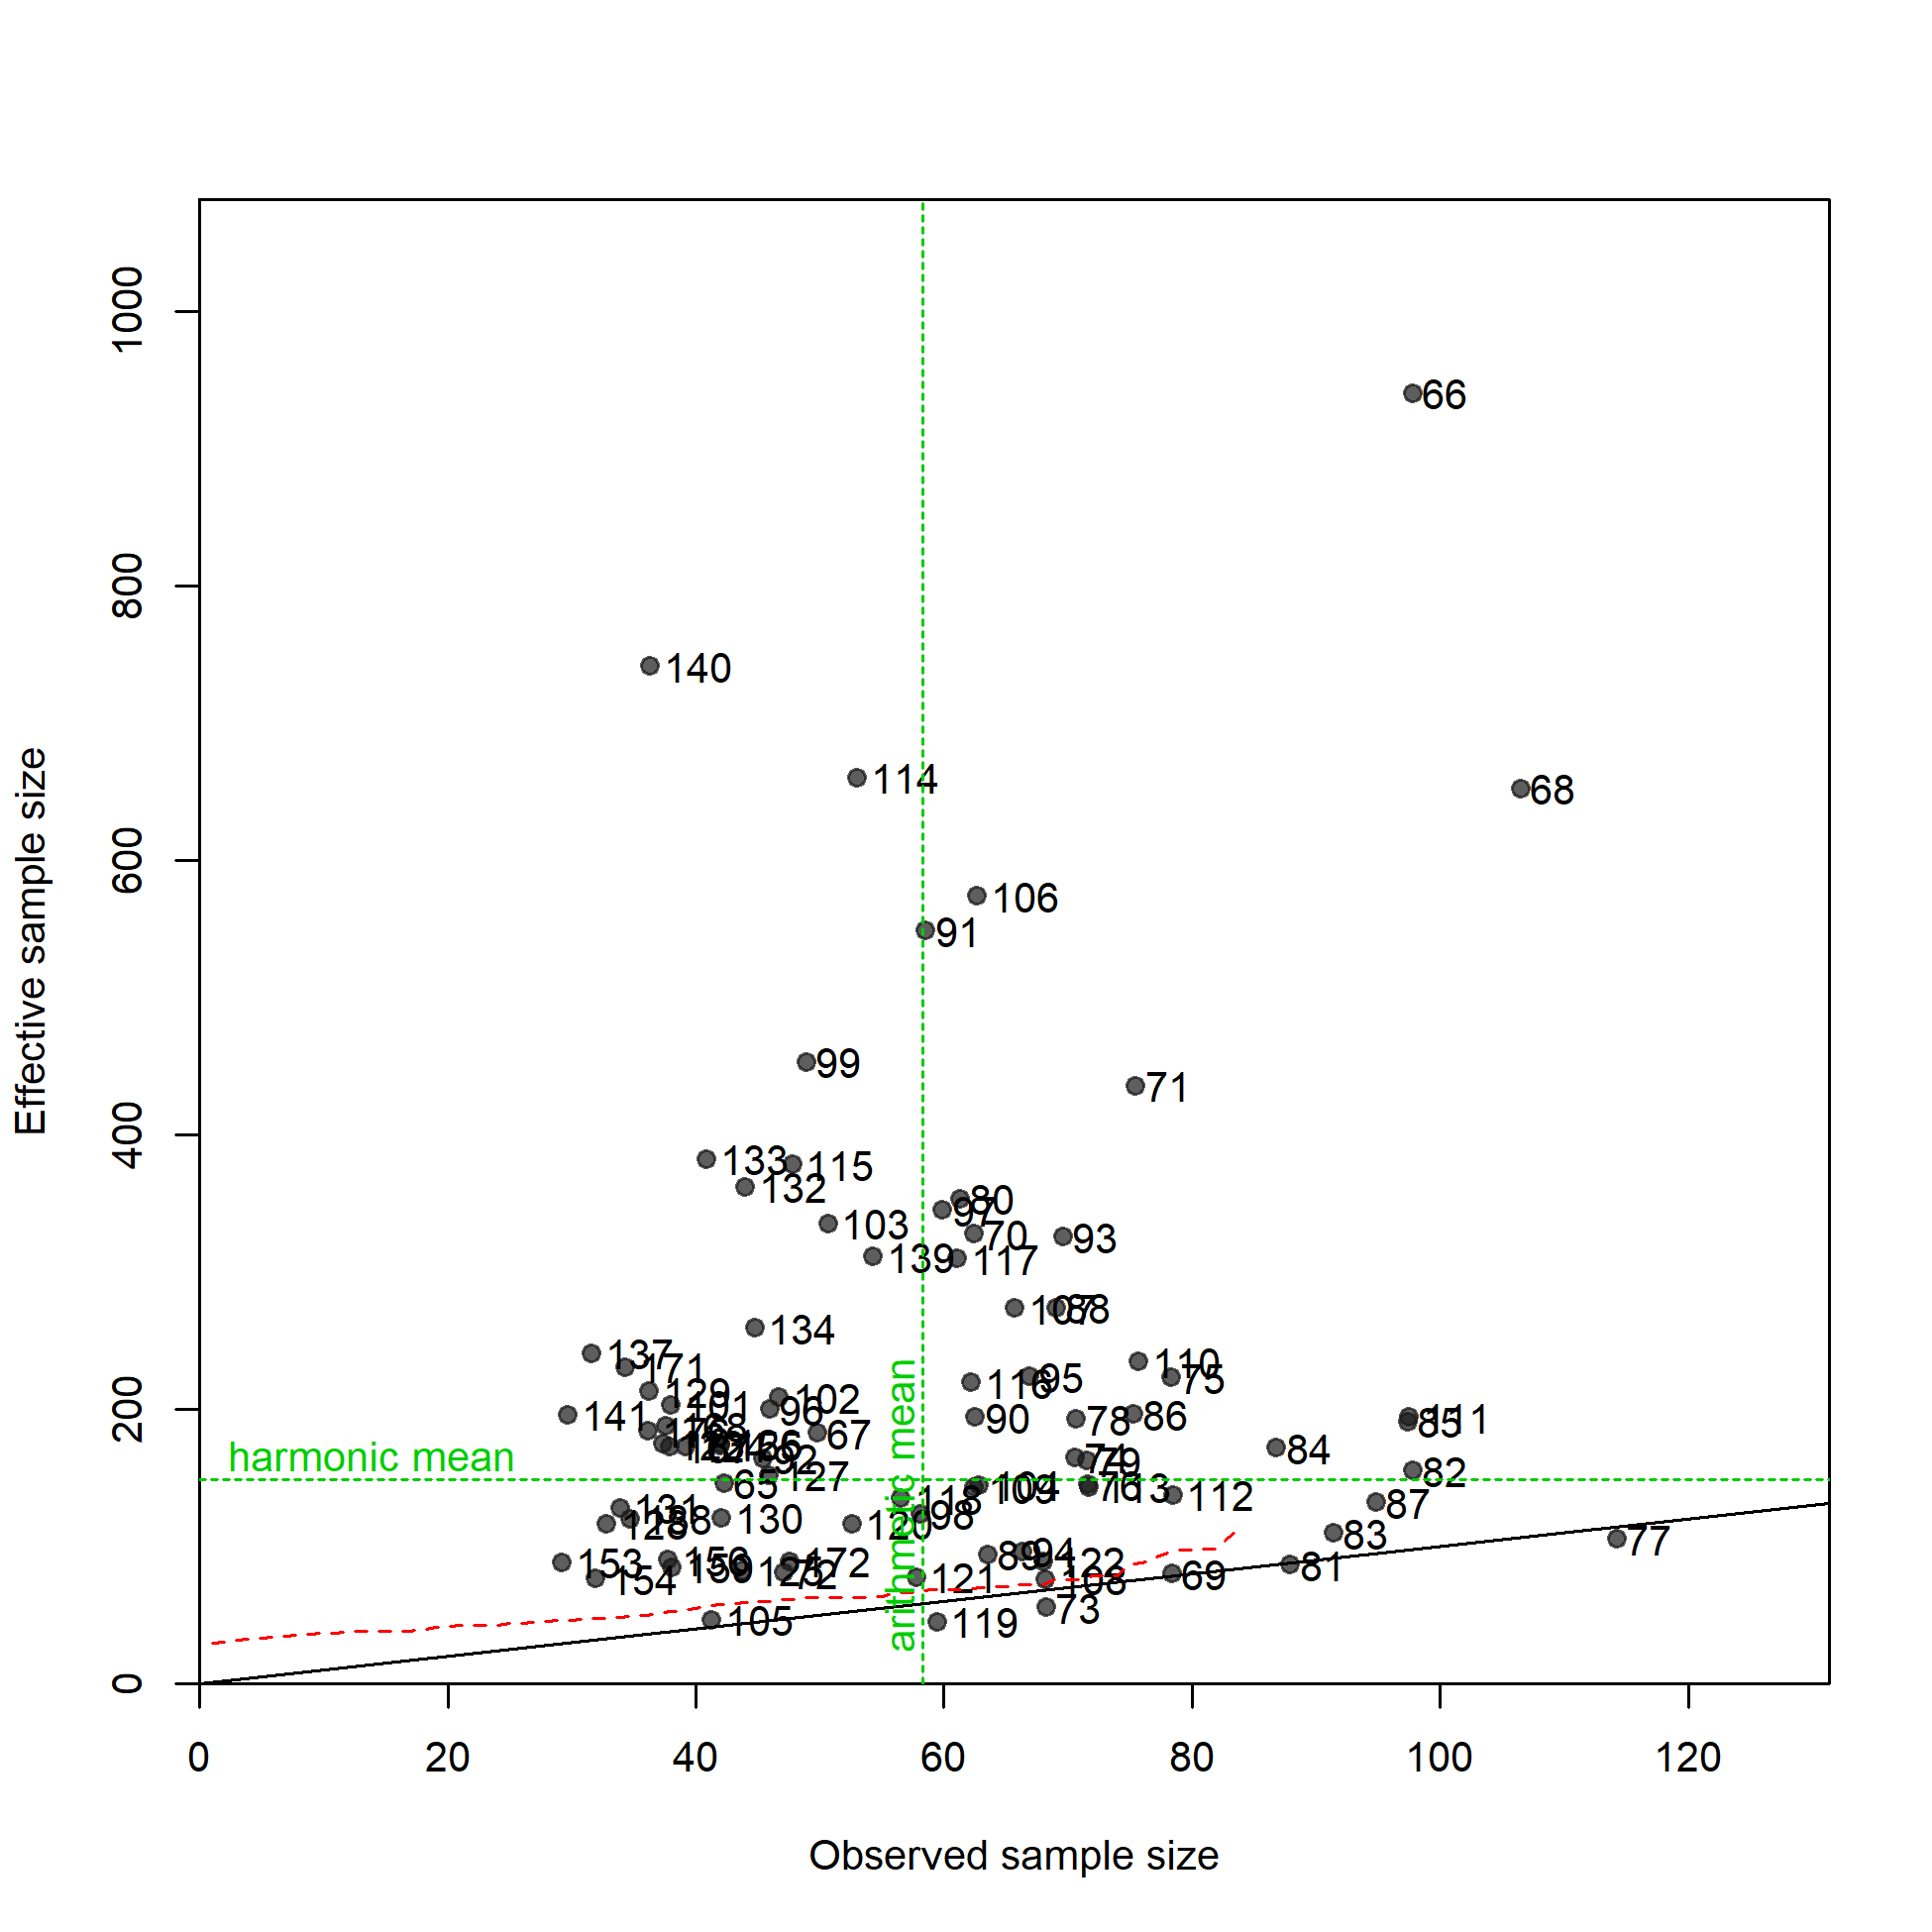
N-EffN comparison, Size comps, whole catch, LL-n-A3
file: comp_sizefit_sampsize_flt3mkt0.png
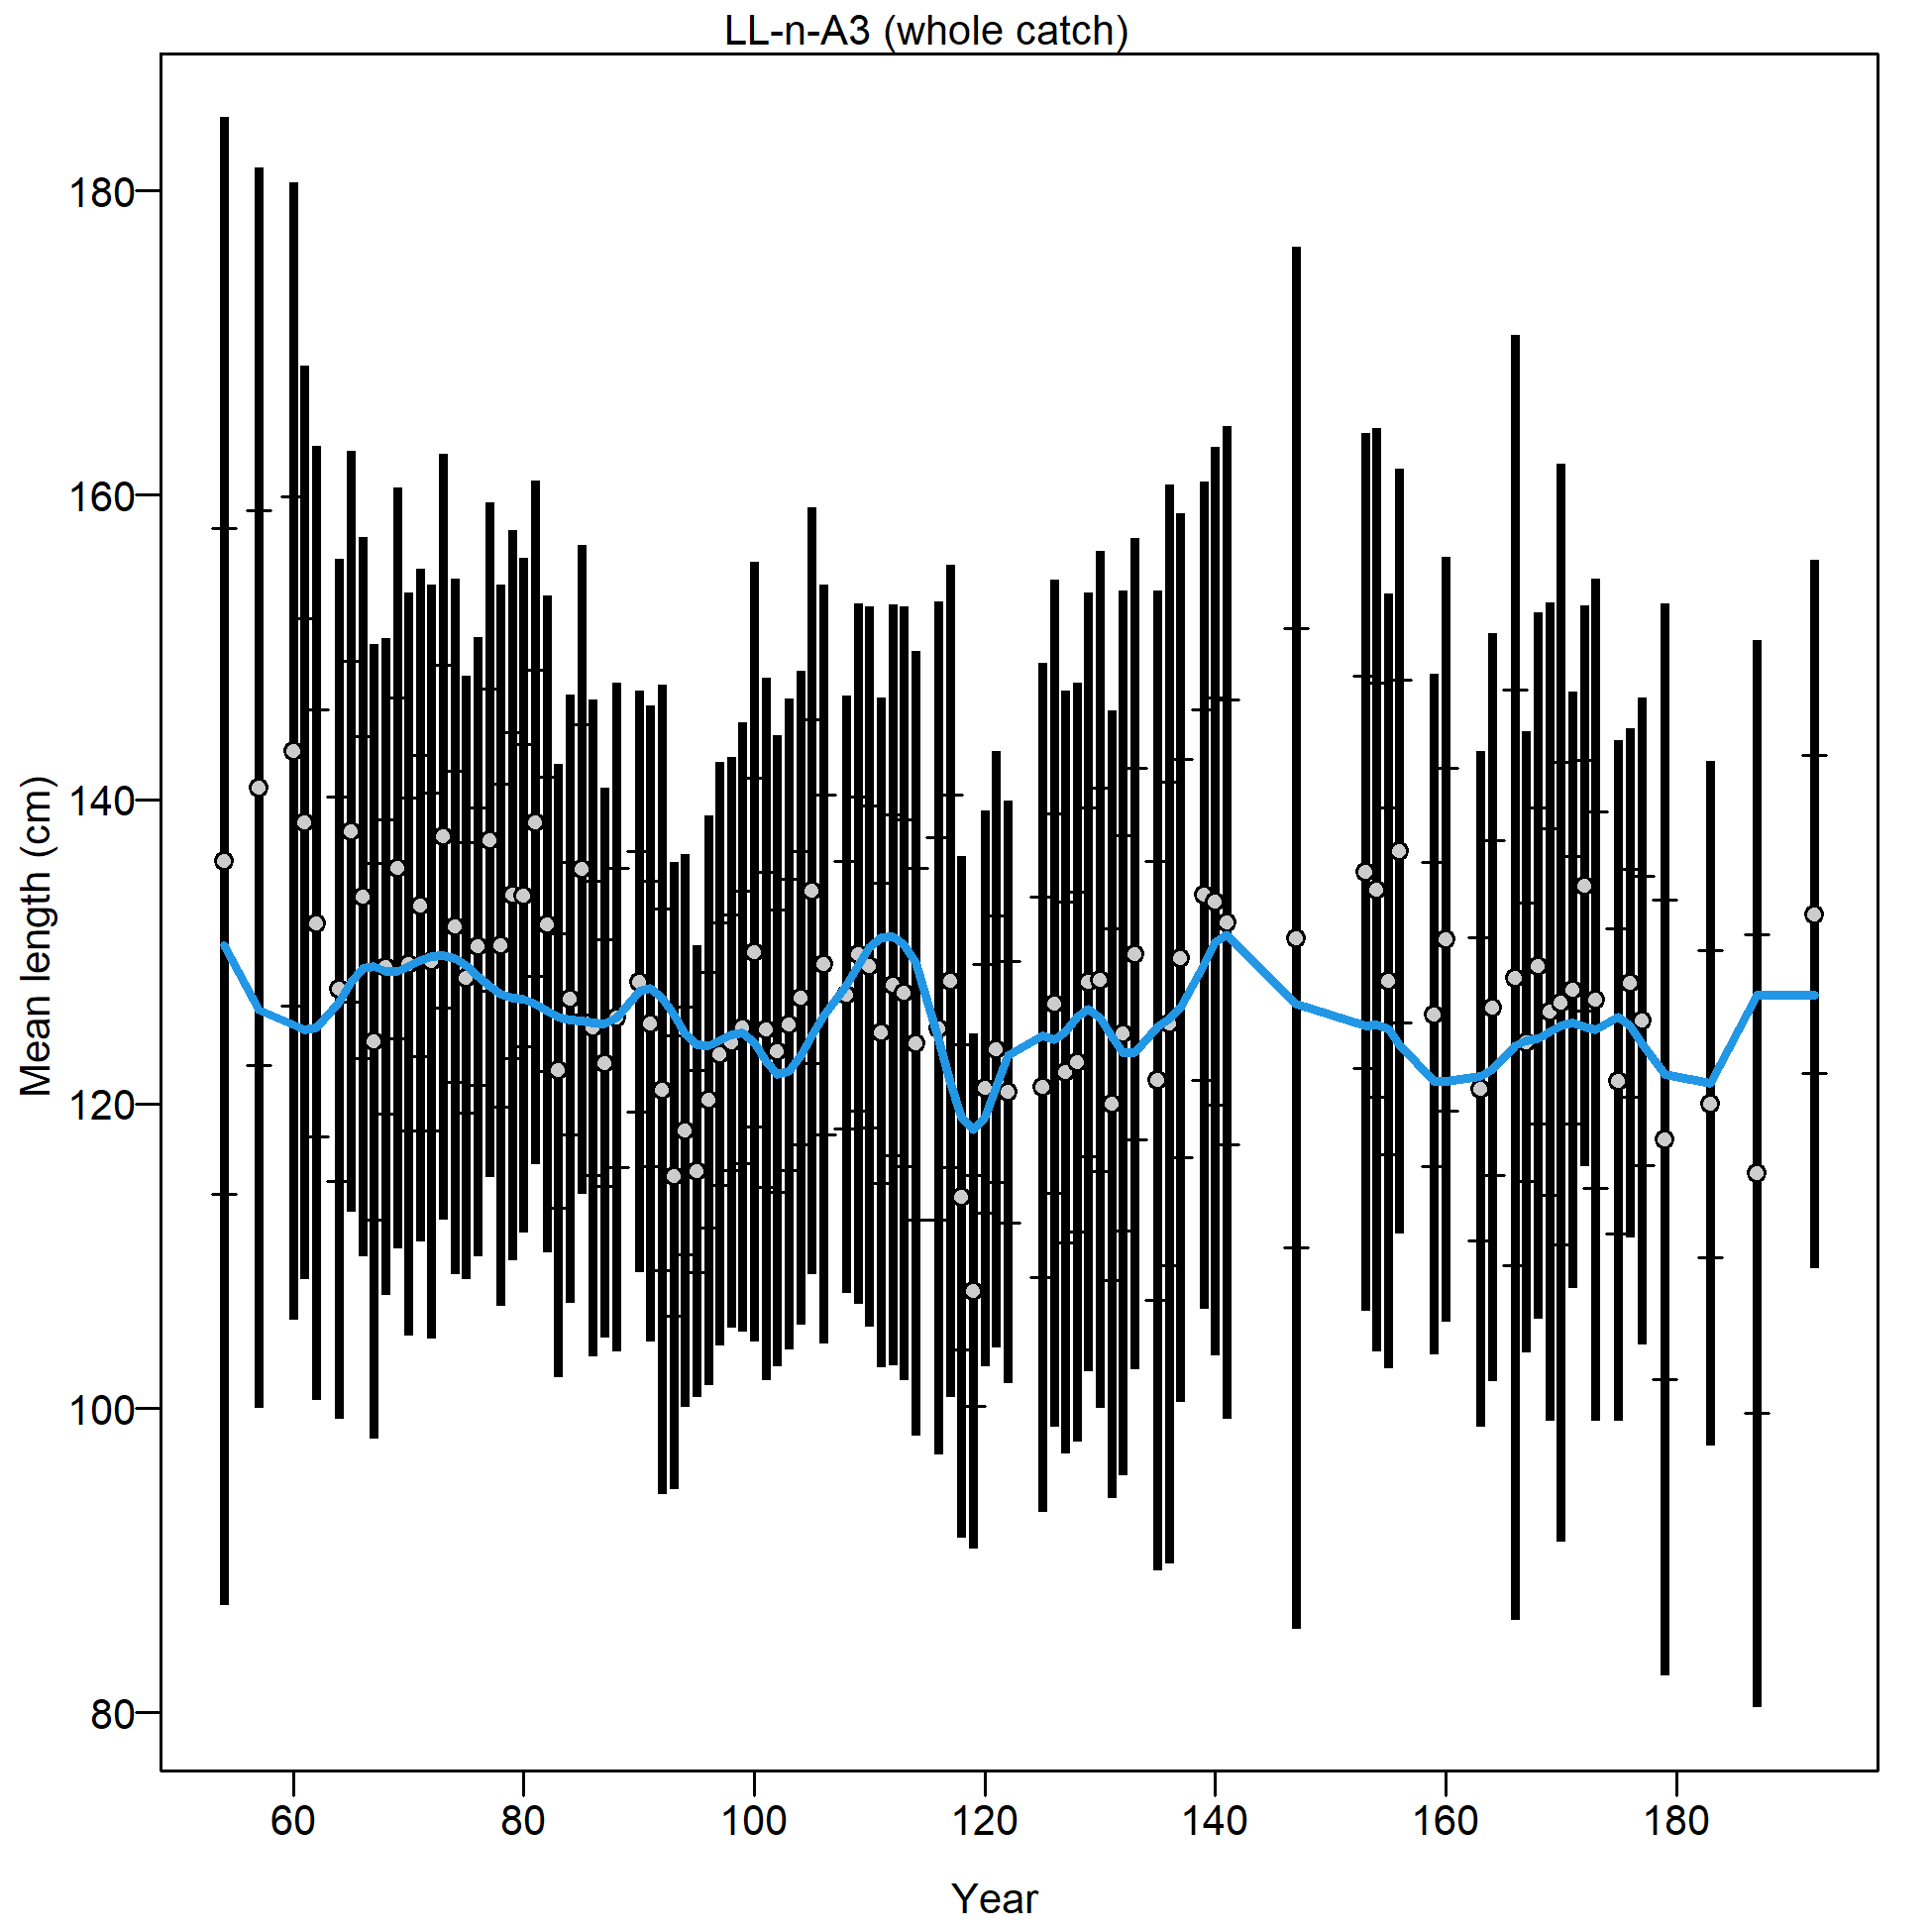
Mean size for LL-n-A3 with 95% confidence intervals based on current sample sizes.
Francis data weighting method TA1.8: thinner intervals (with capped ends) show result of further adjusting sample sizes based on suggested multiplier (with 95% interval) for size data from LL-n-A3:
4.9868 (3.7268-7.099)
For more info, see Francis (2011).
file: comp_sizefit_data_weighting_TA1.8_LL-n-A3.png
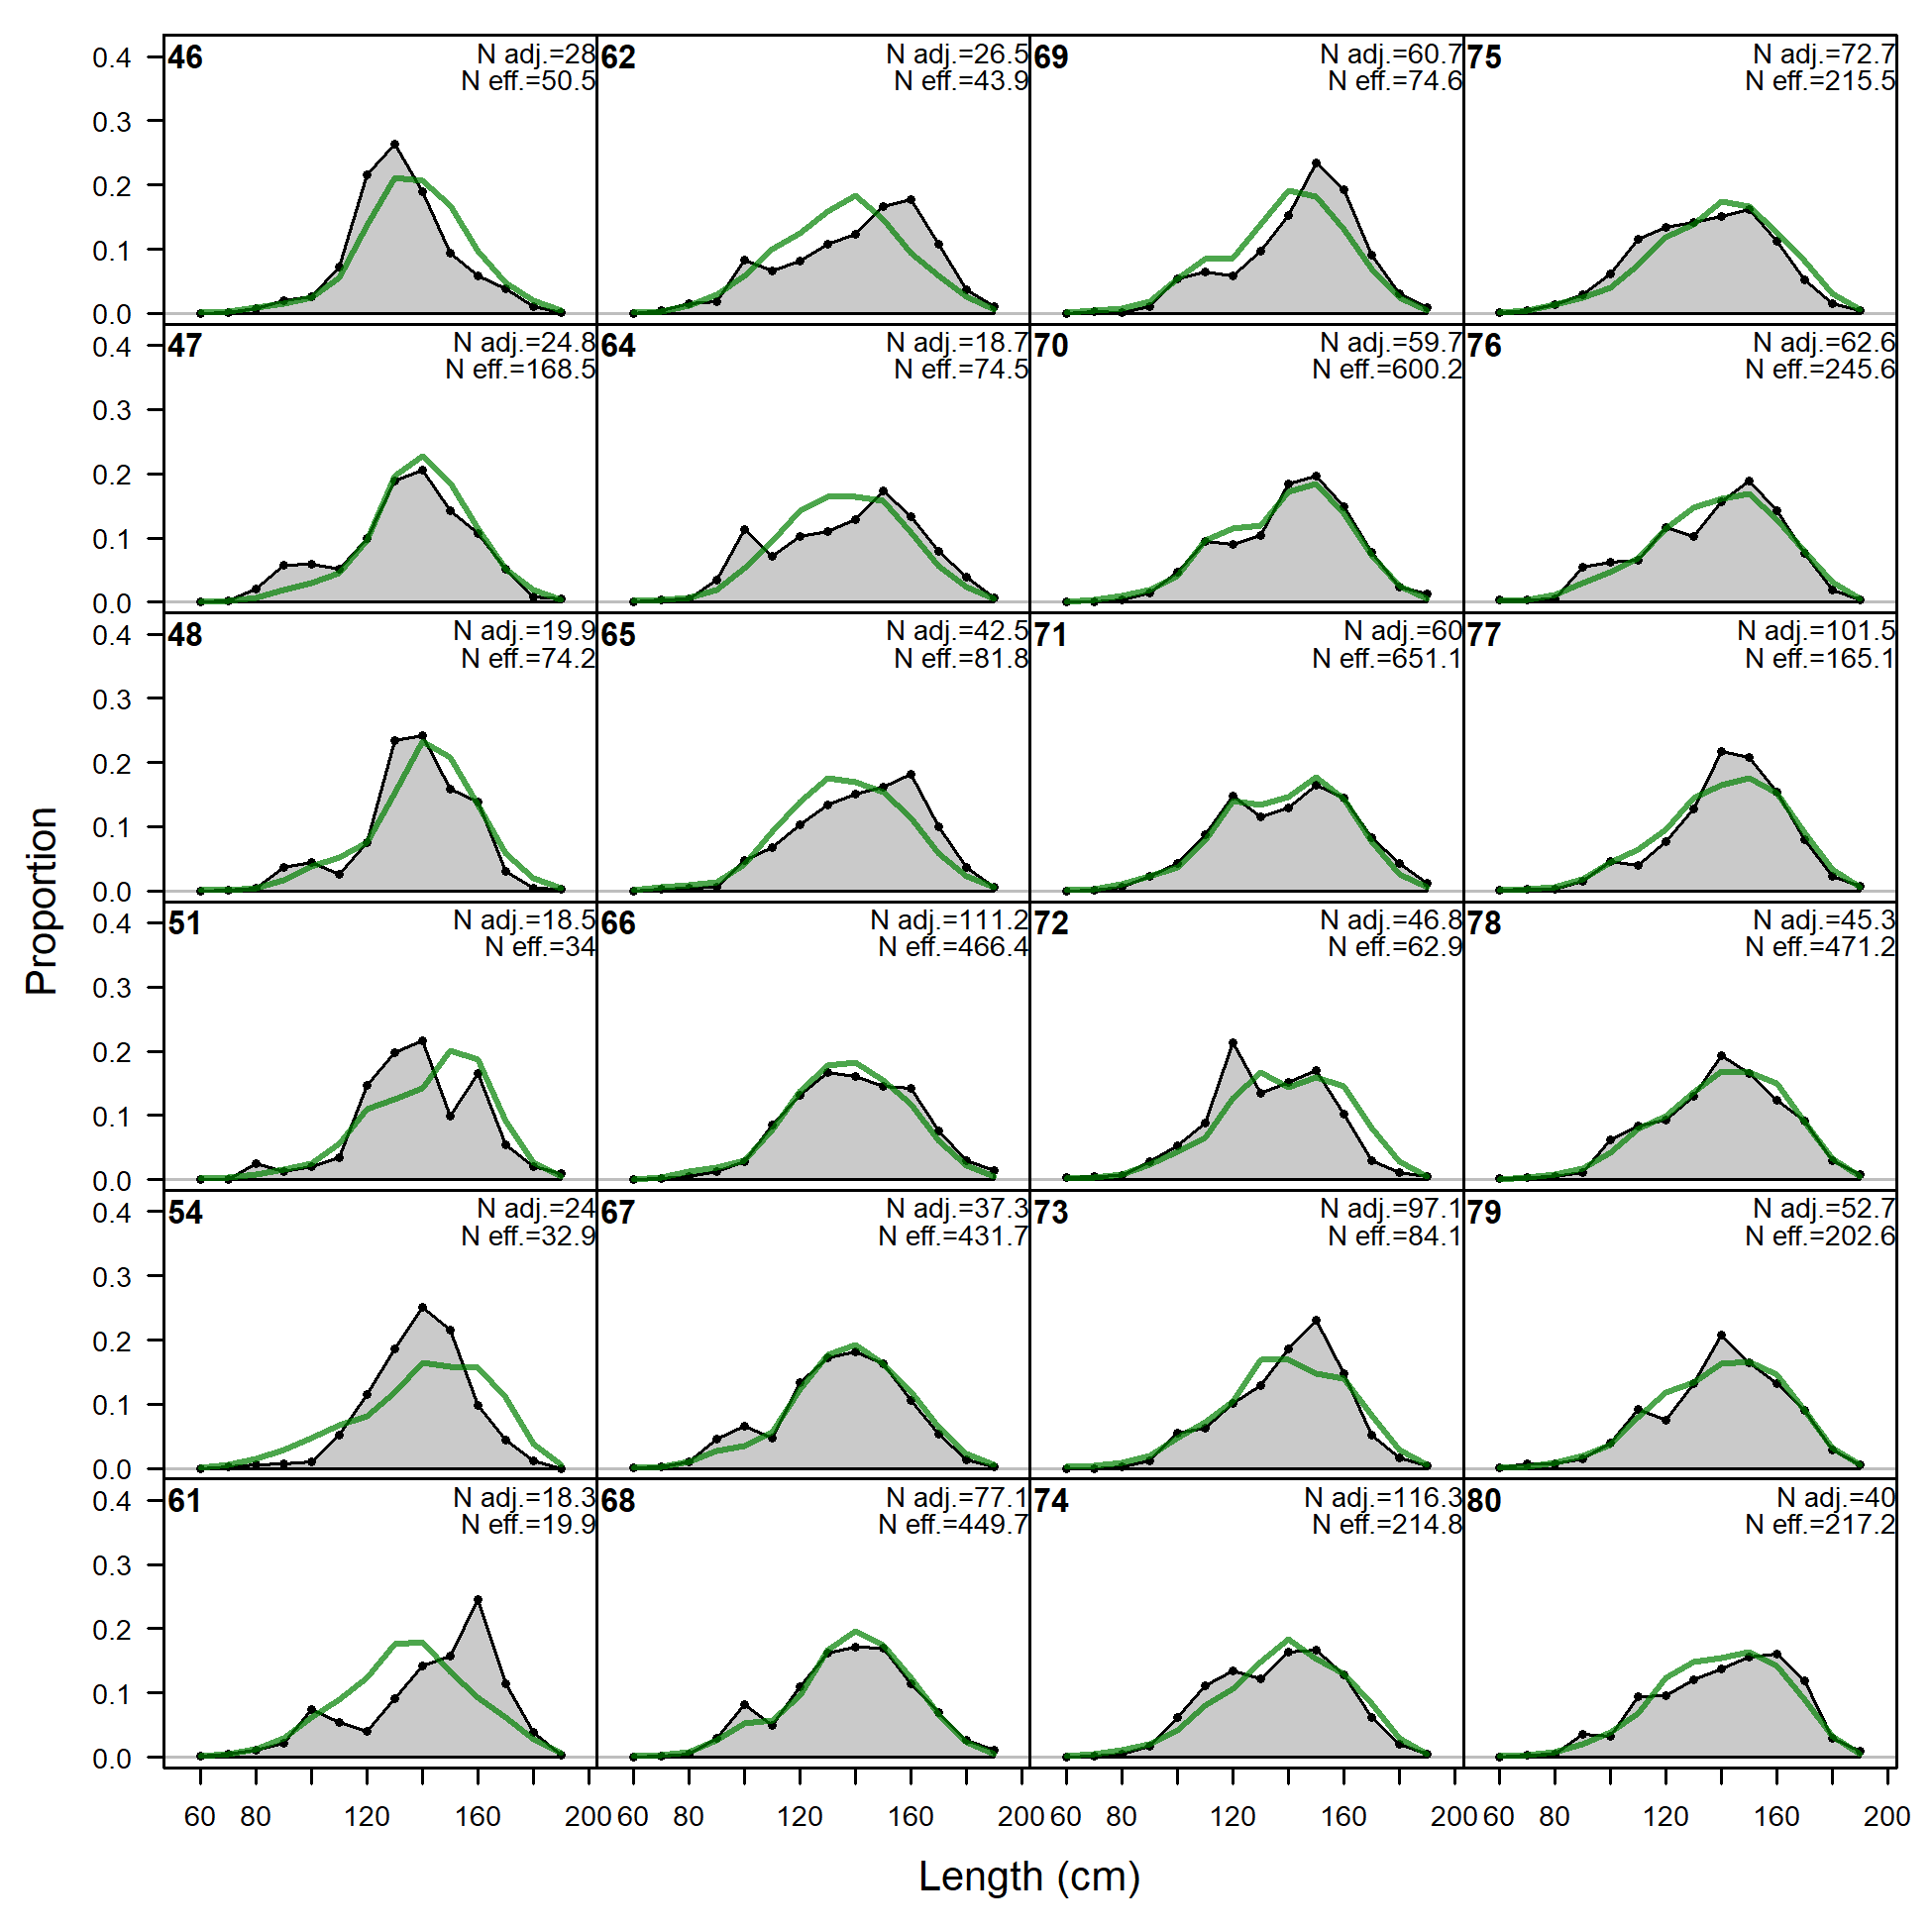
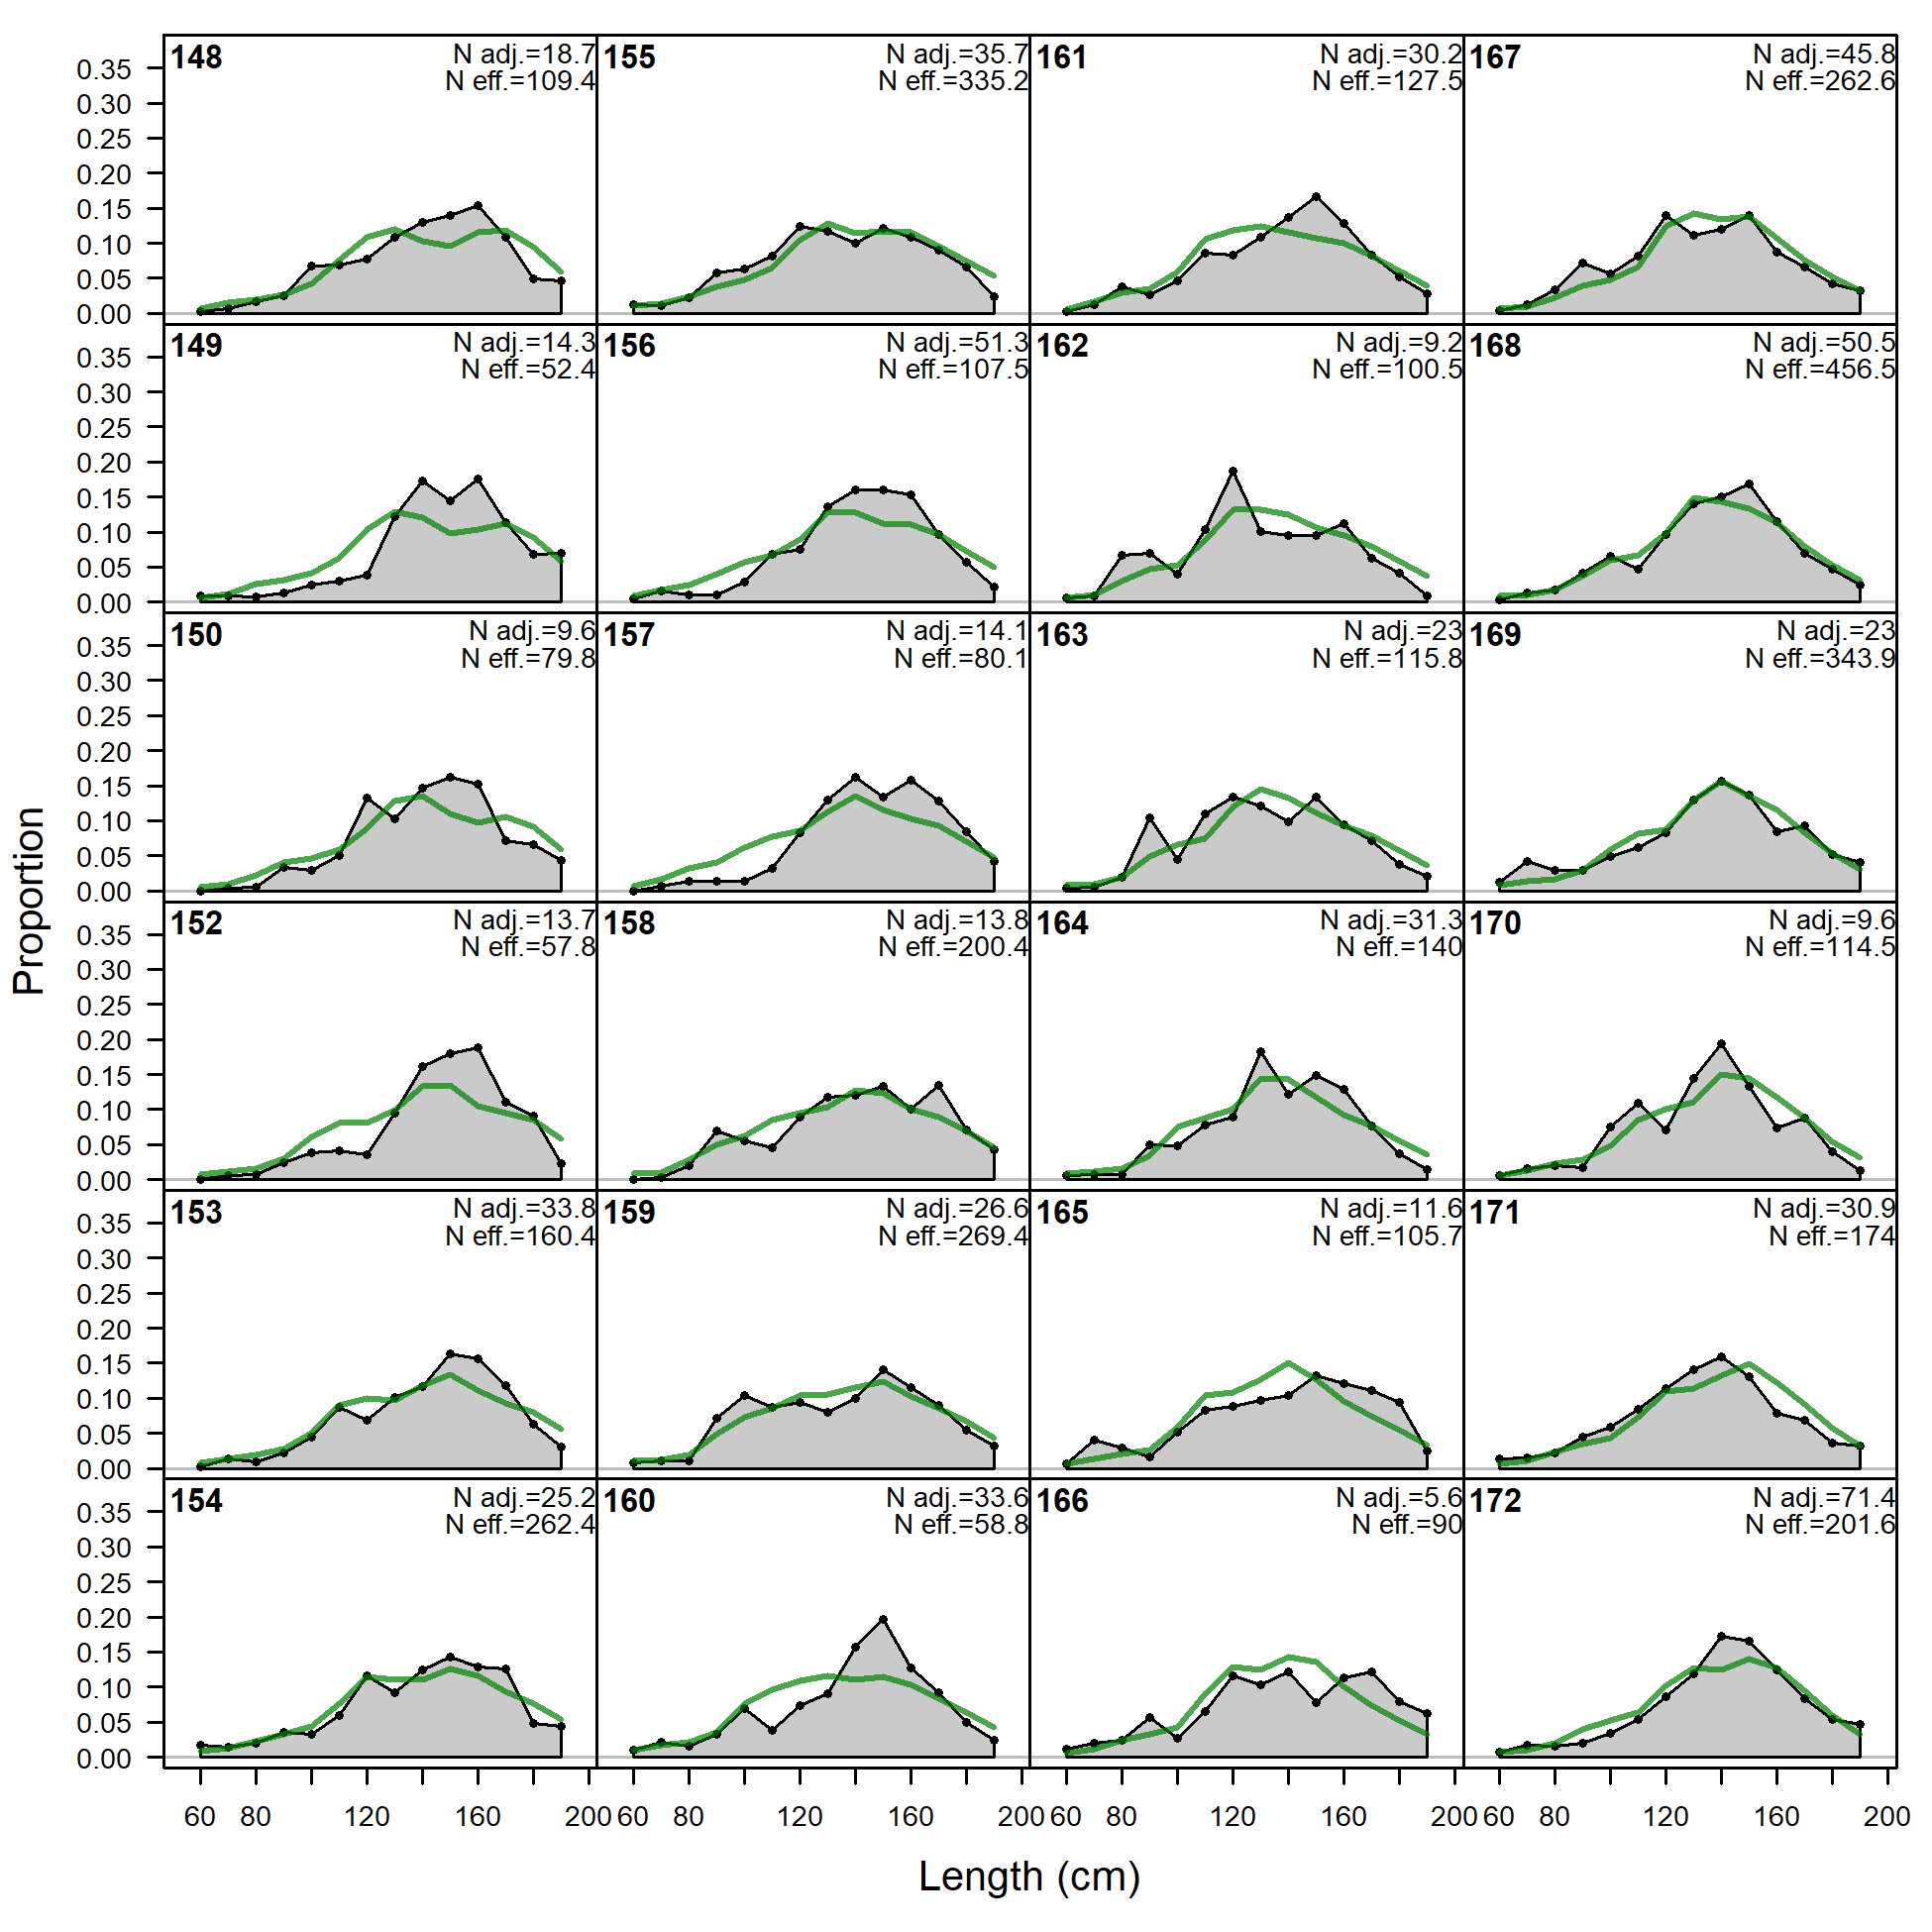
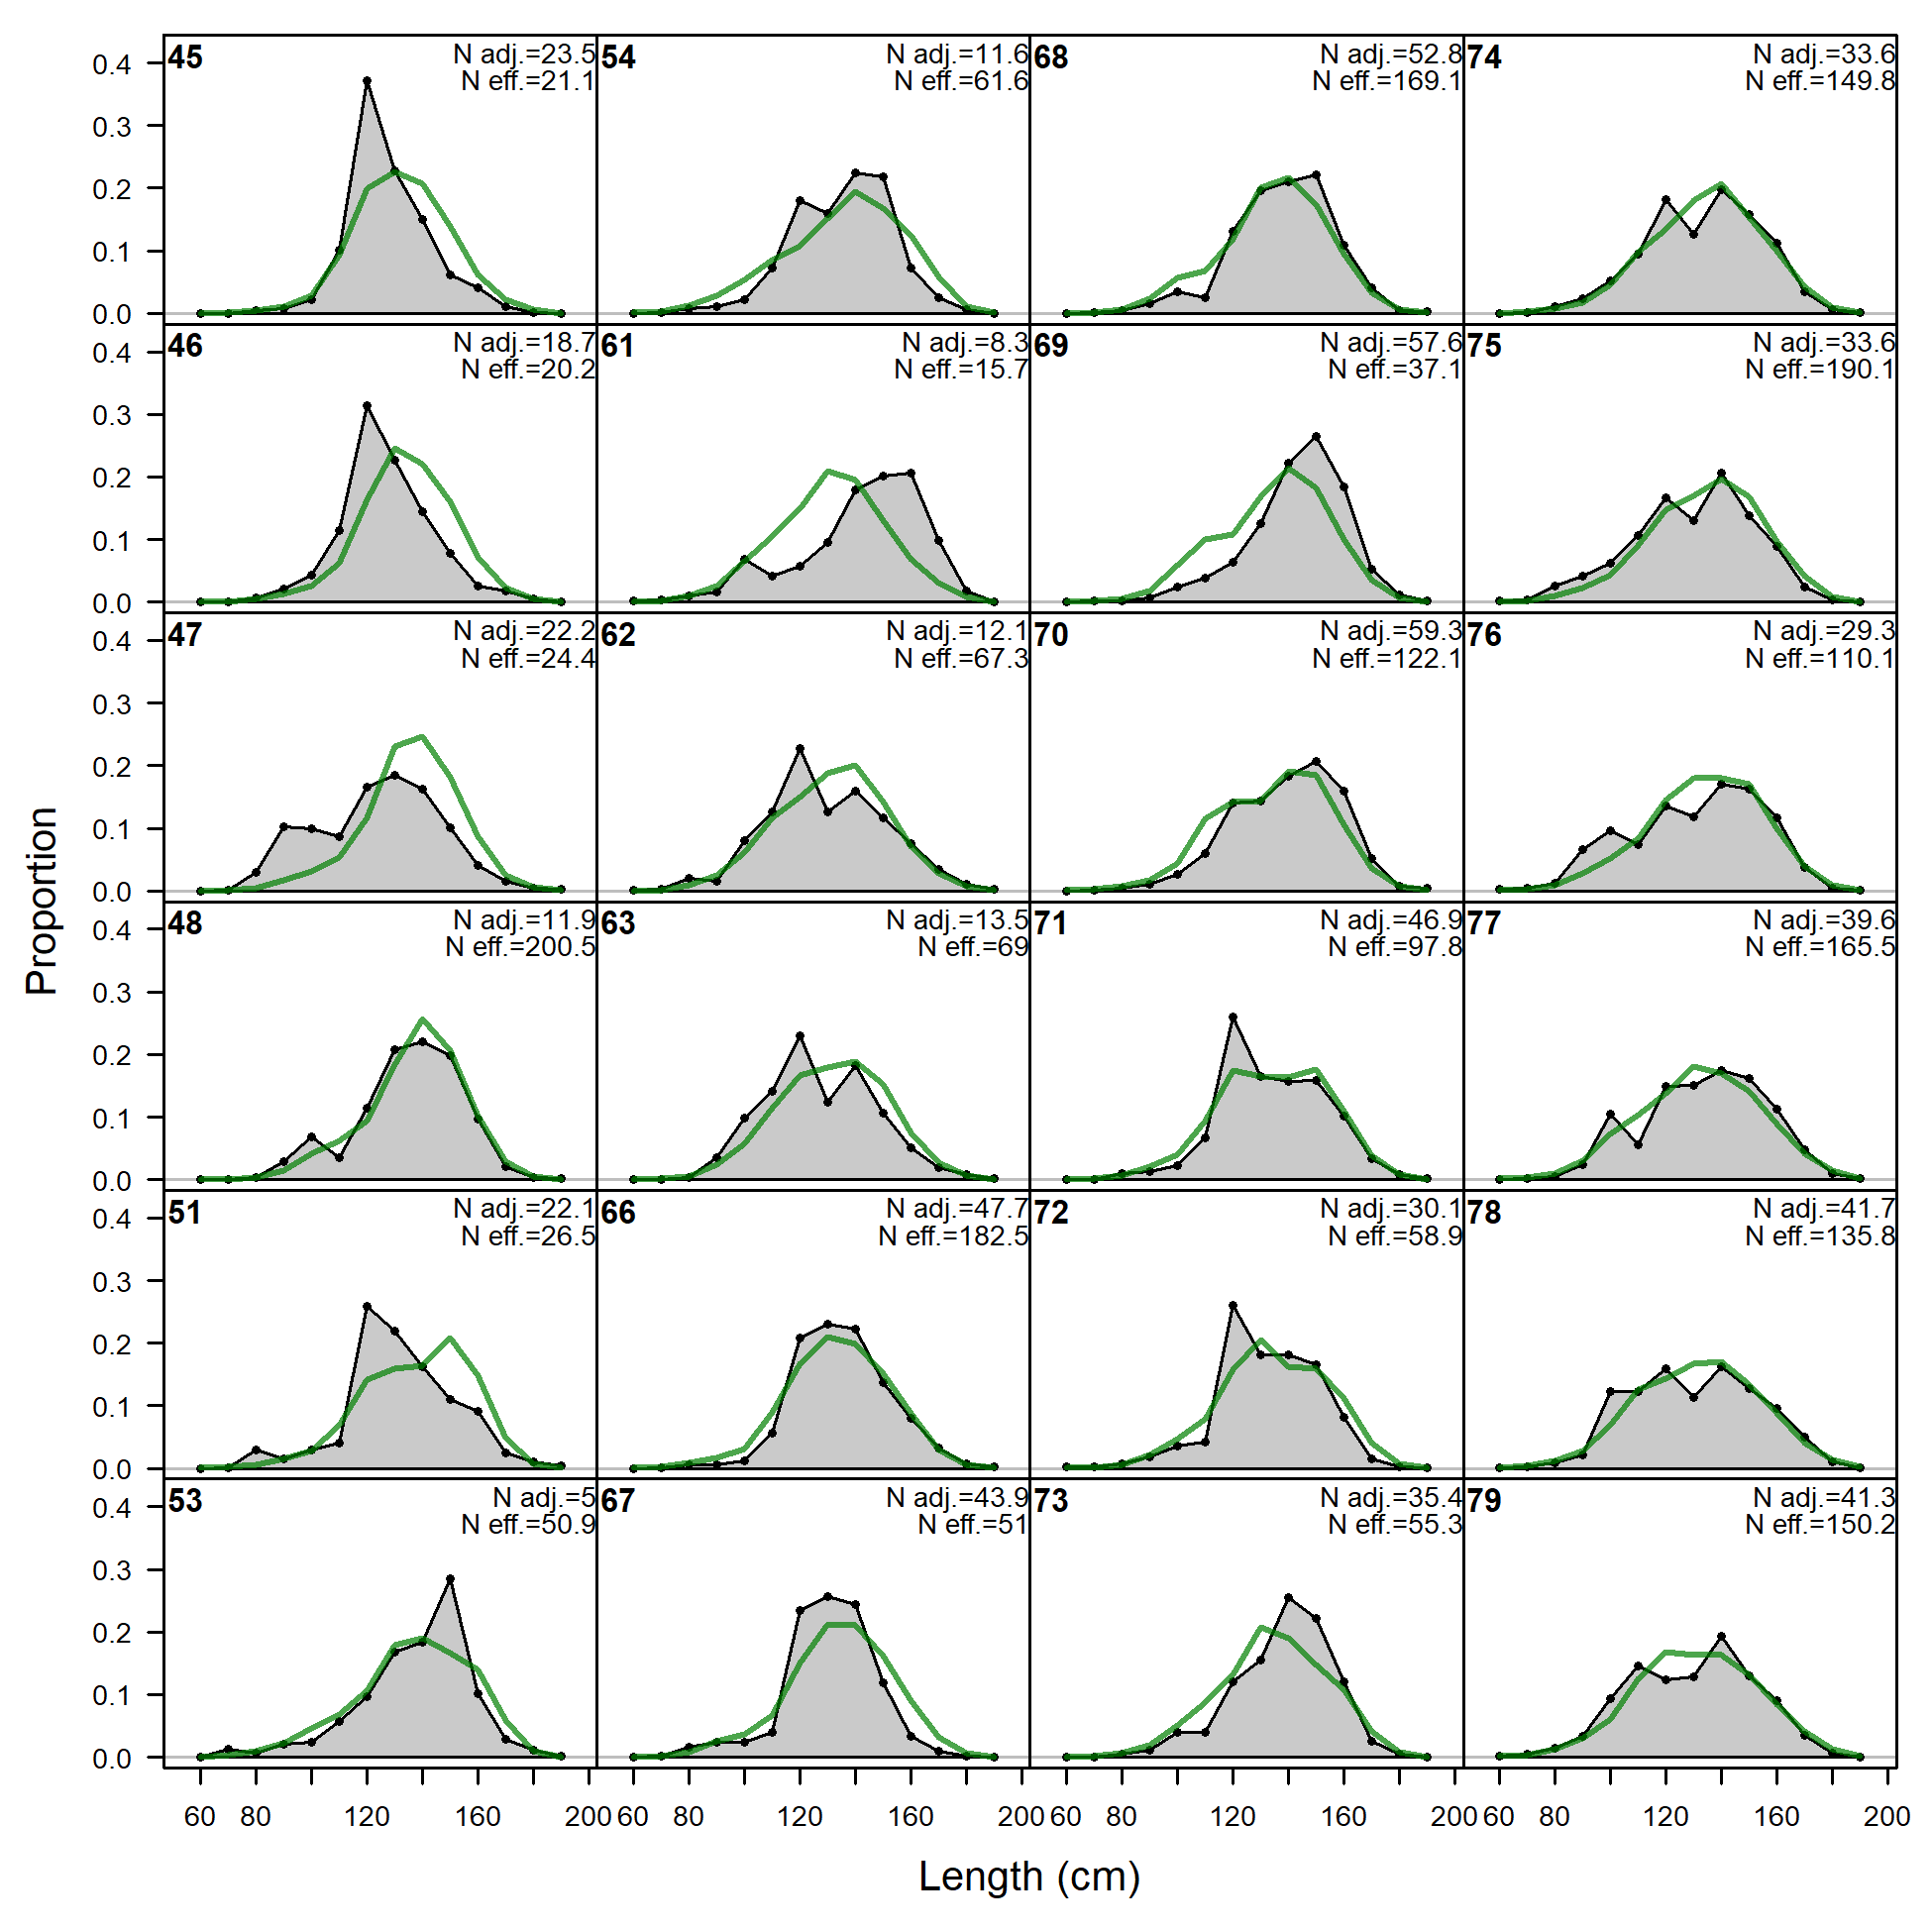
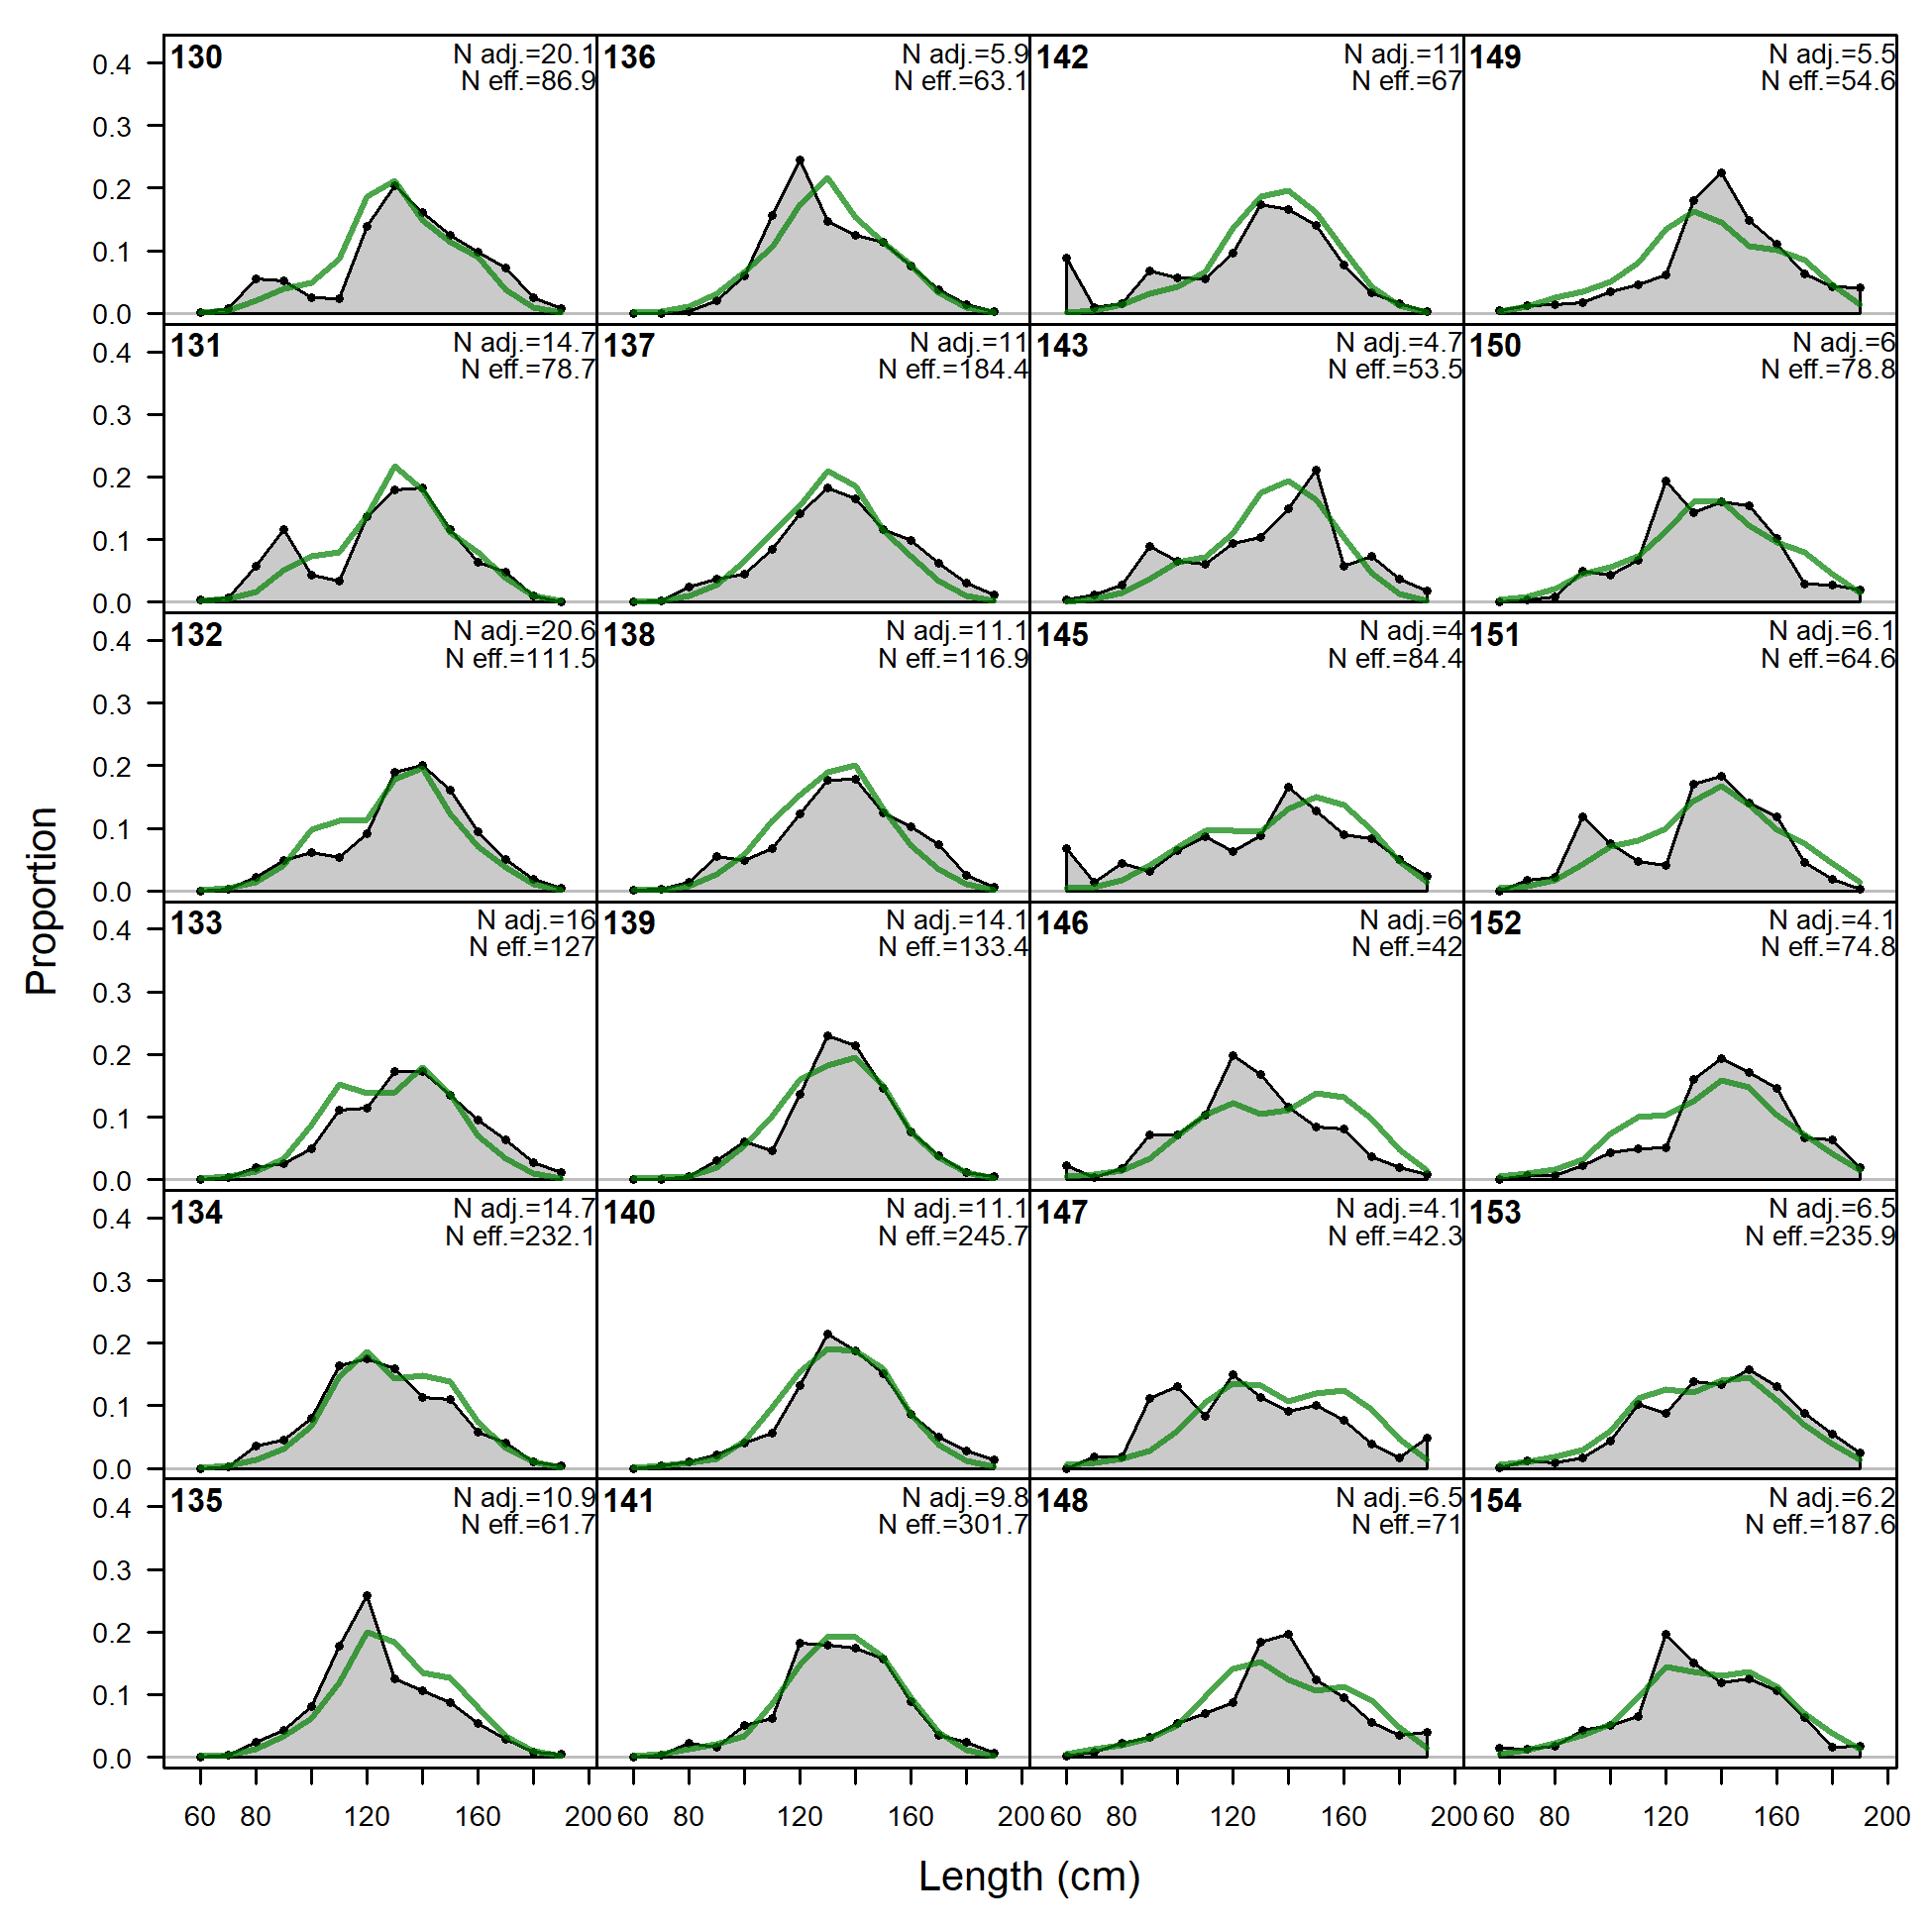
Size comps, whole catch, LL-n-A4 (plot 1 of 6).
'N adj.' is the input sample size after data-weighting adjustment. N eff. is the calculated effective sample size used in the McAllister-Ianelli tuning method.
file: comp_sizefit_flt4mkt0_page1.png
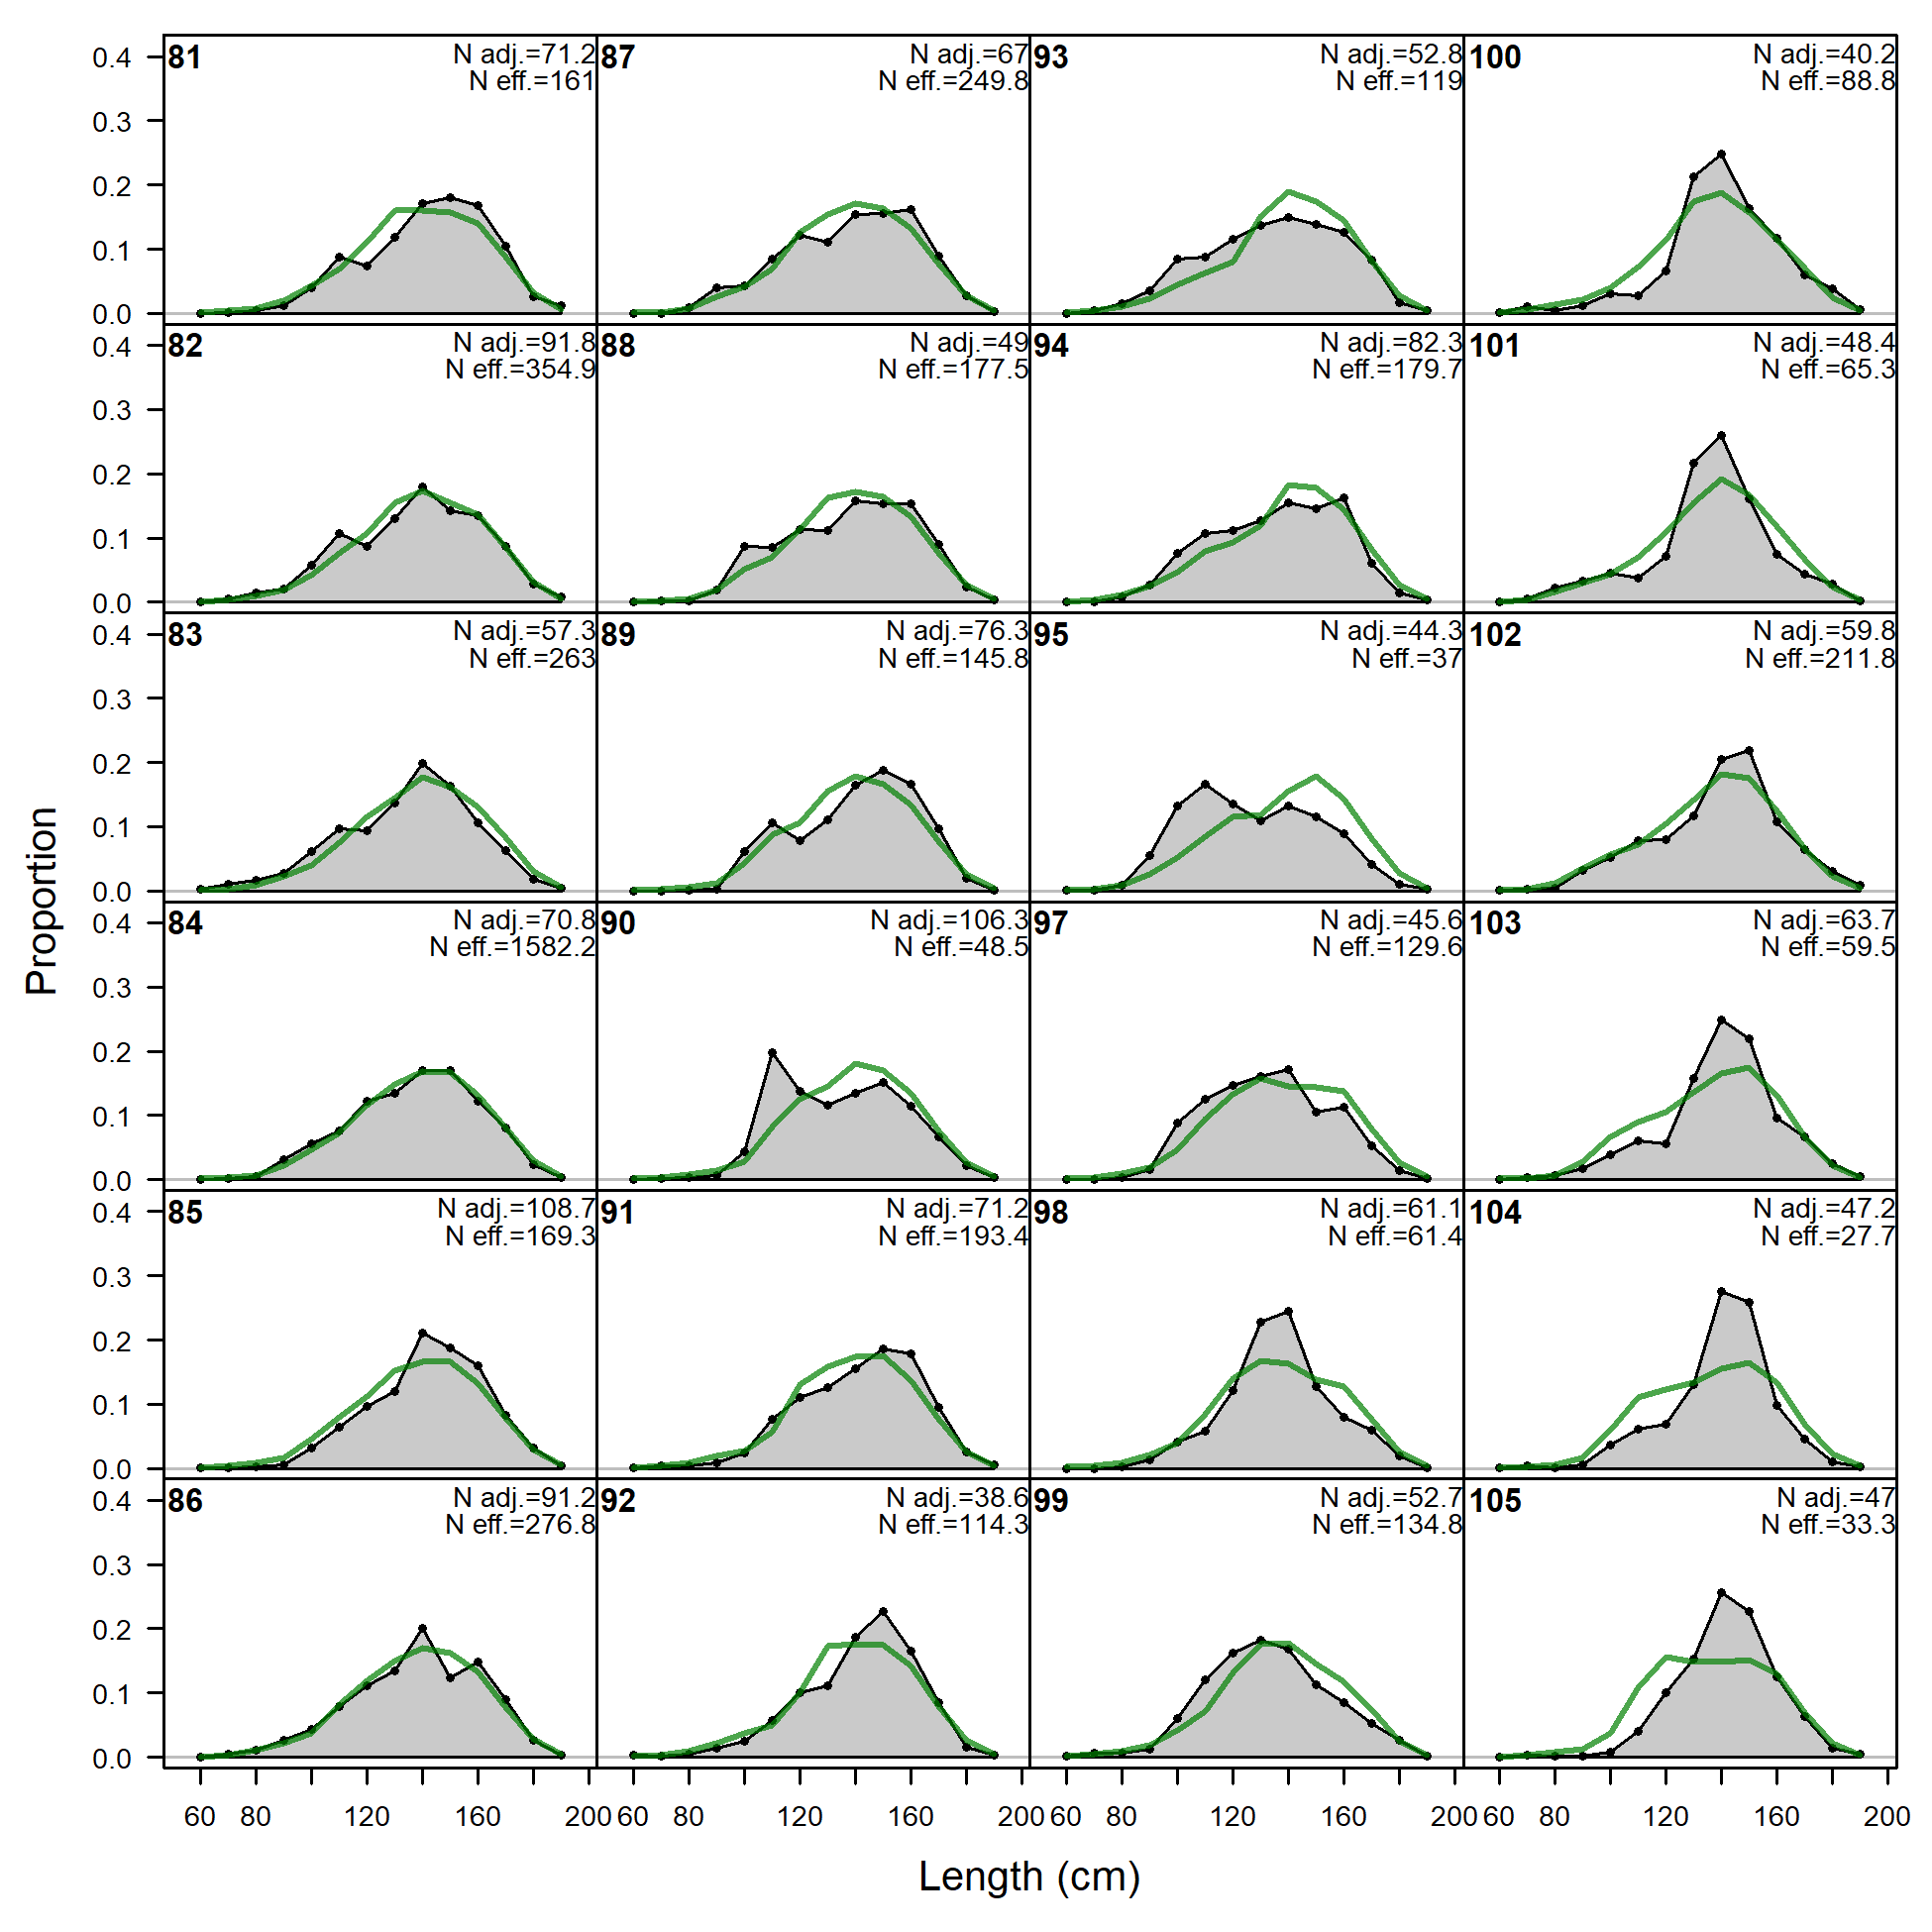
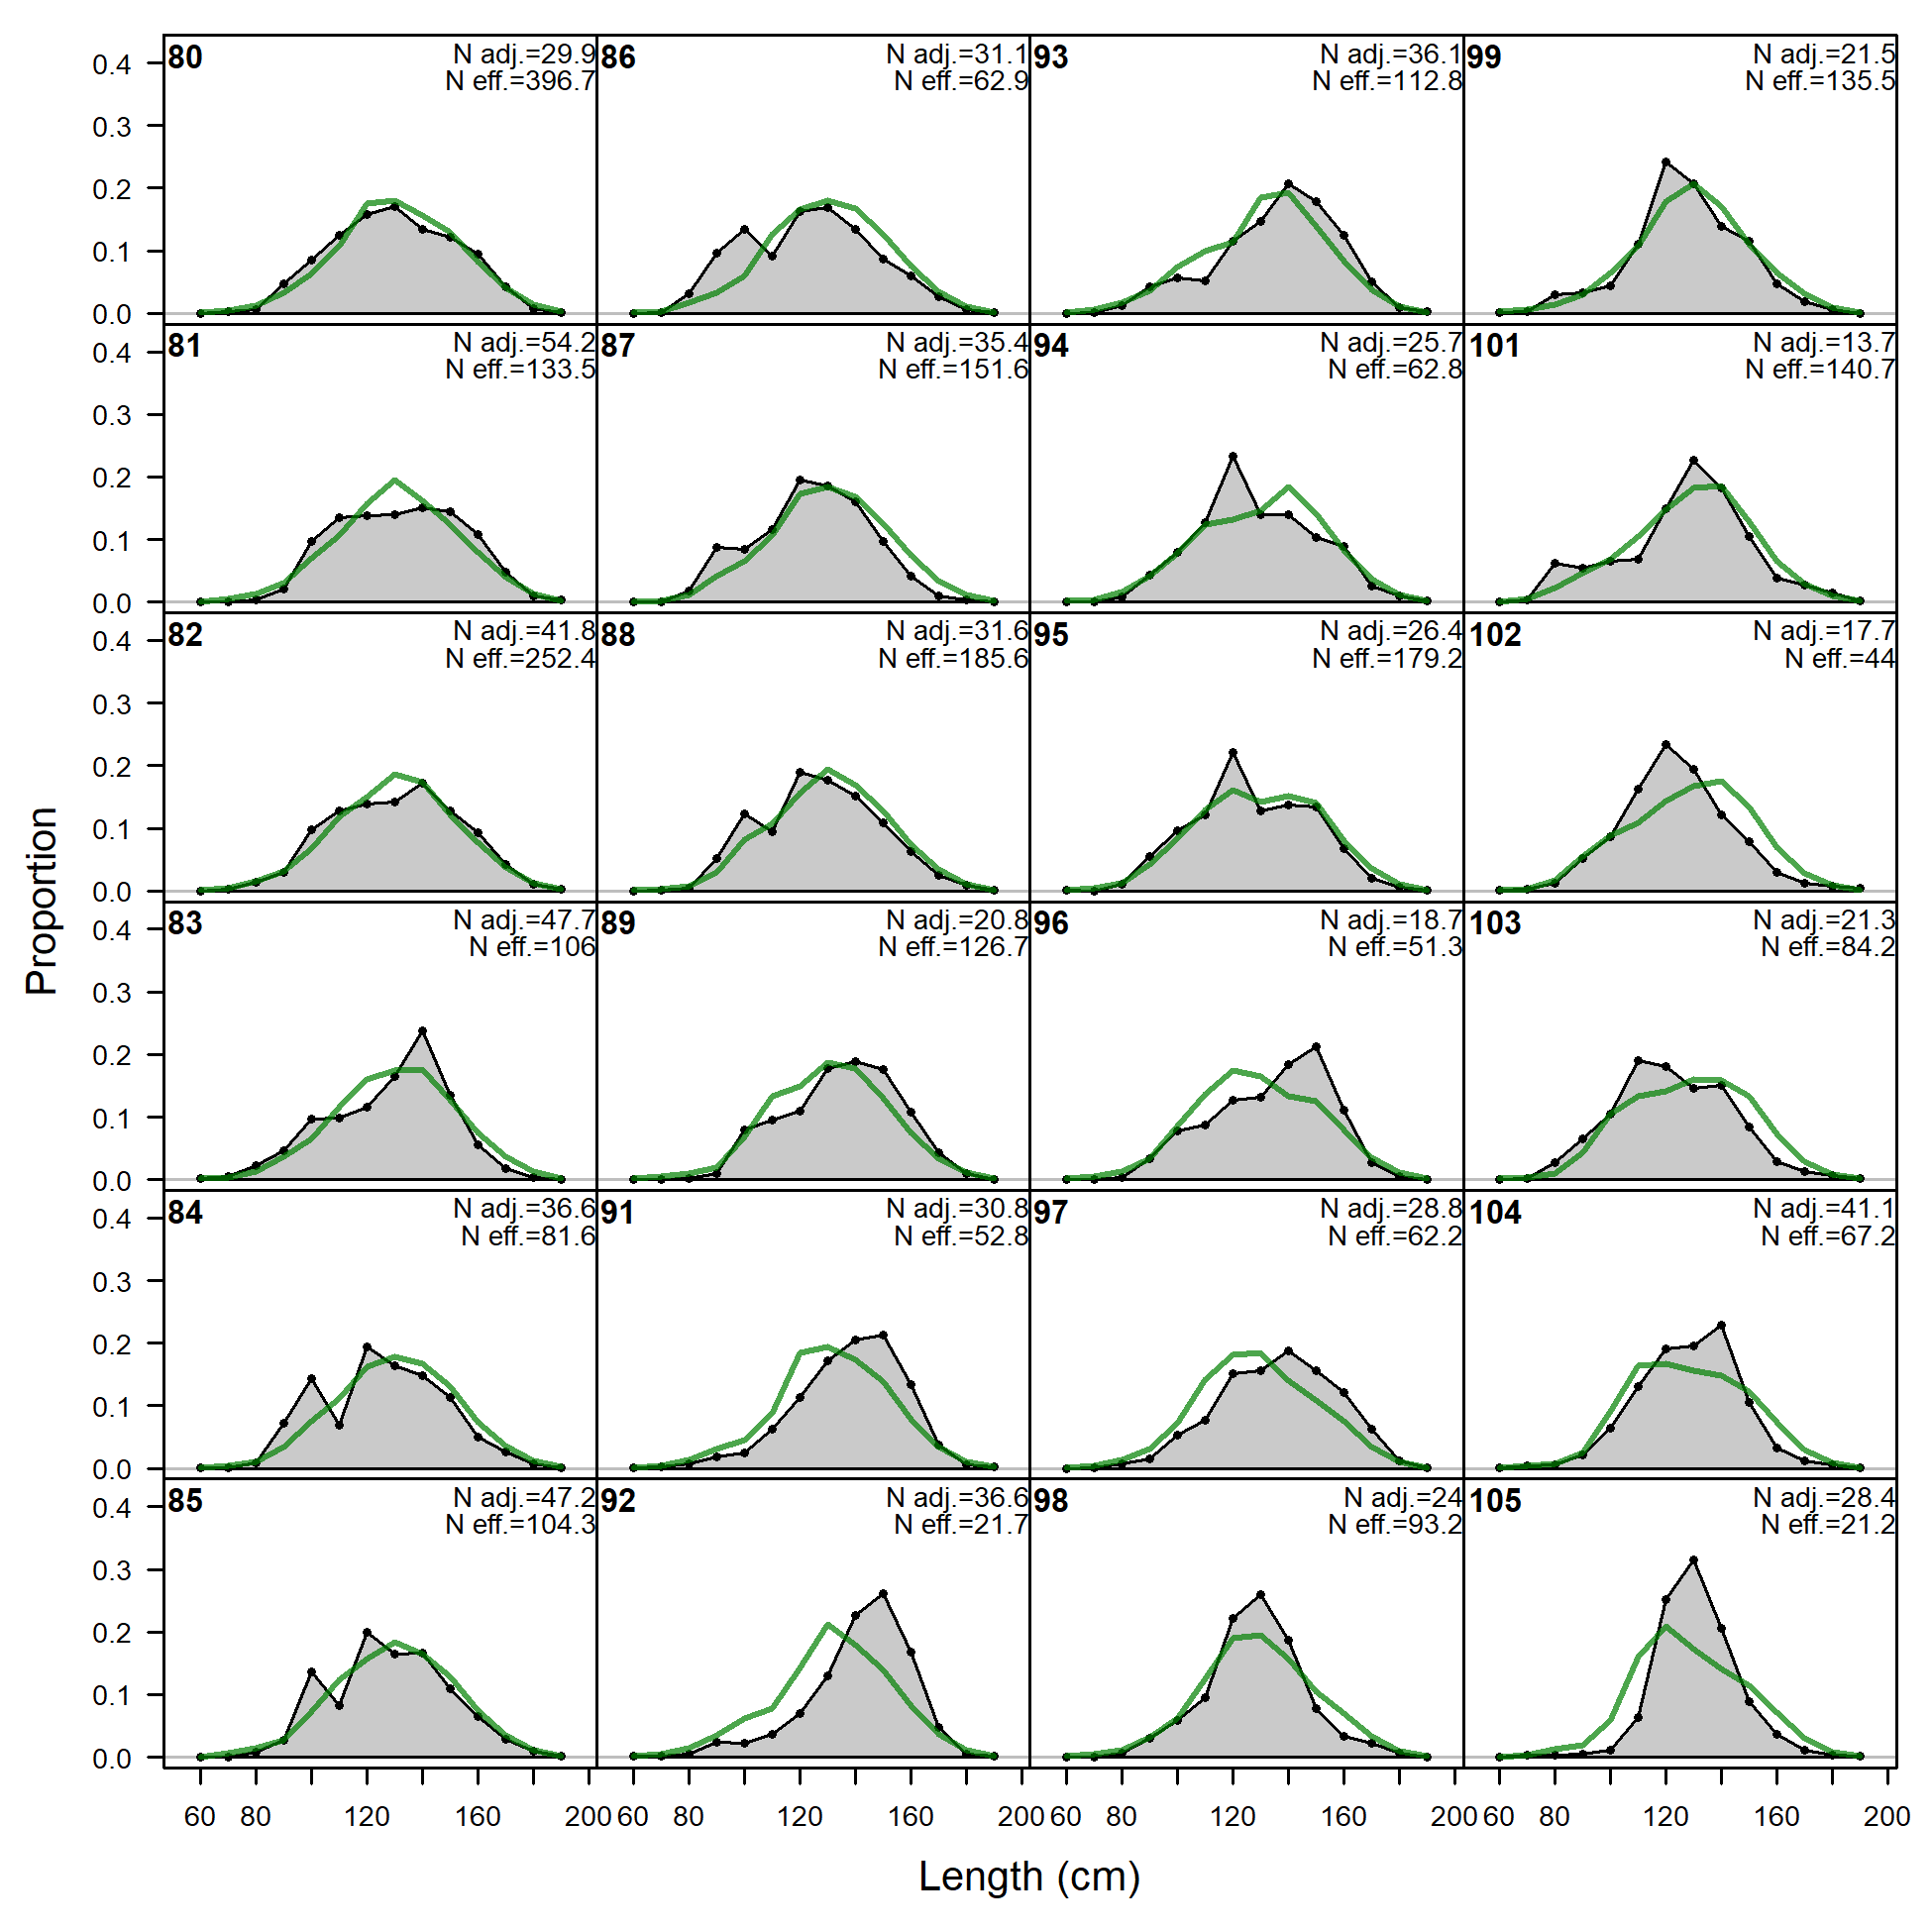
Size comps, whole catch, LL-n-A4 (plot 1 of 6).
'N adj.' is the input sample size after data-weighting adjustment. N eff. is the calculated effective sample size used in the McAllister-Ianelli tuning method. (plot 2 of 6)
file: comp_sizefit_flt4mkt0_page2.png
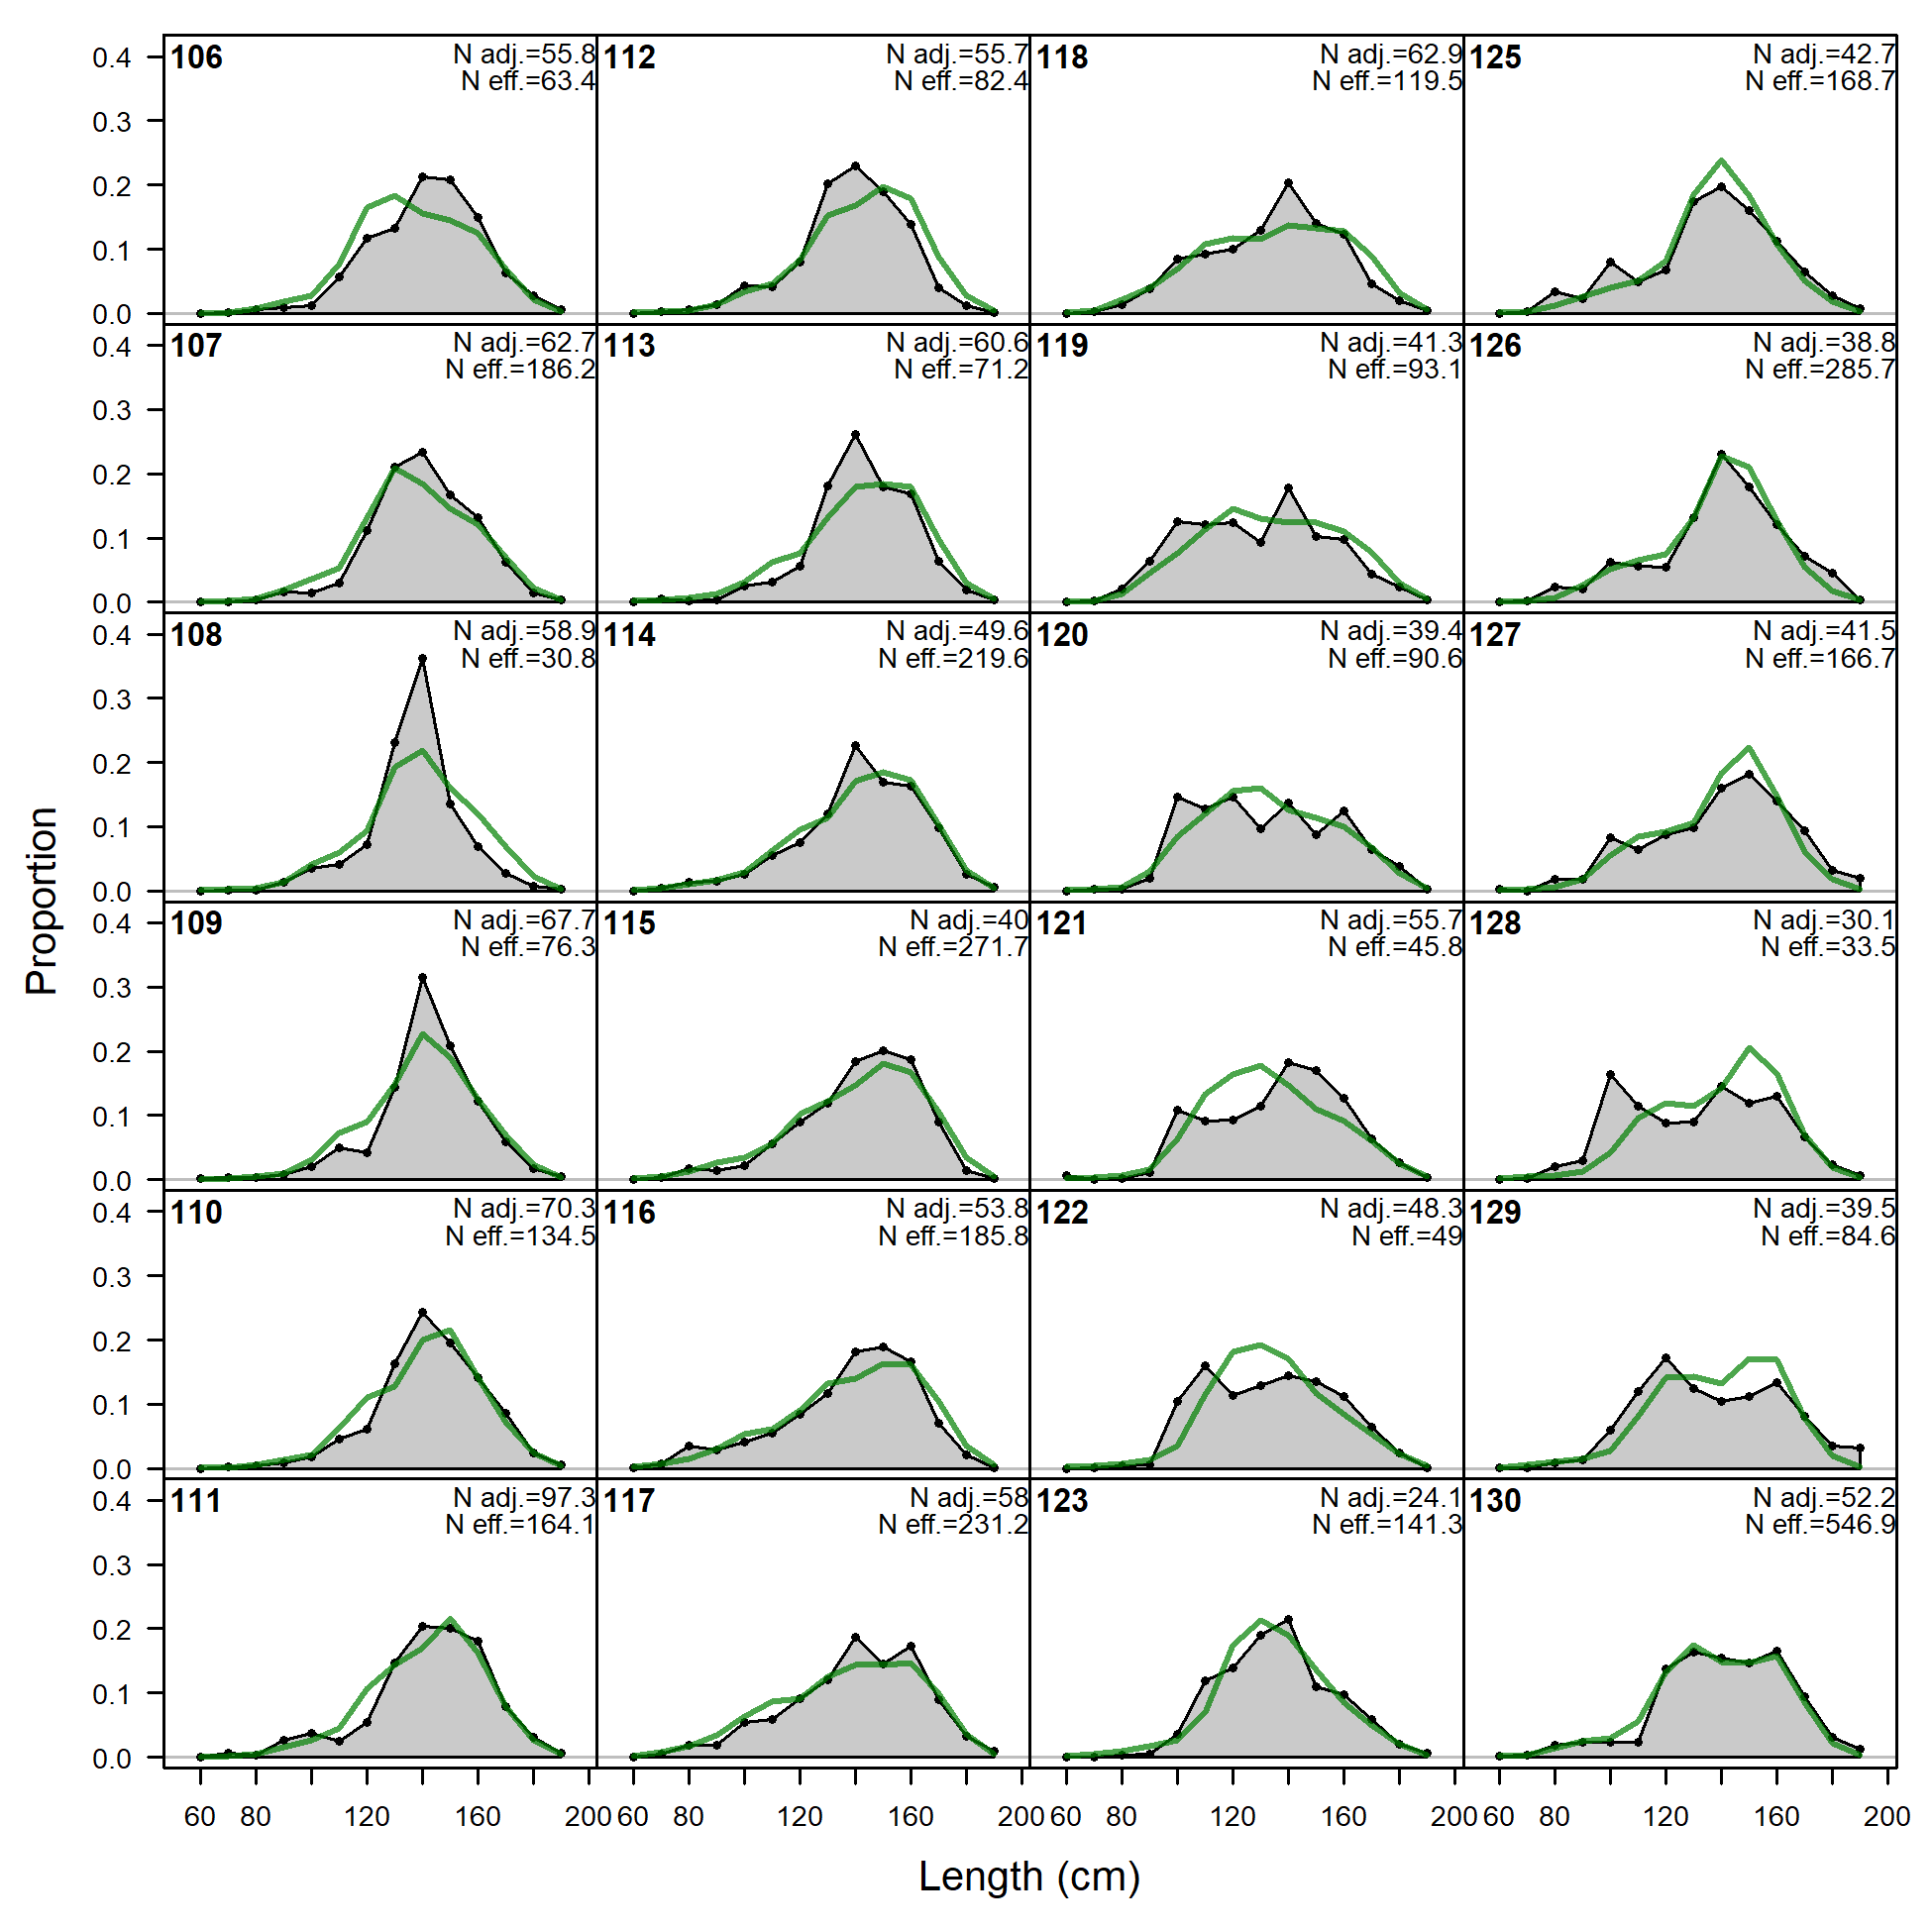
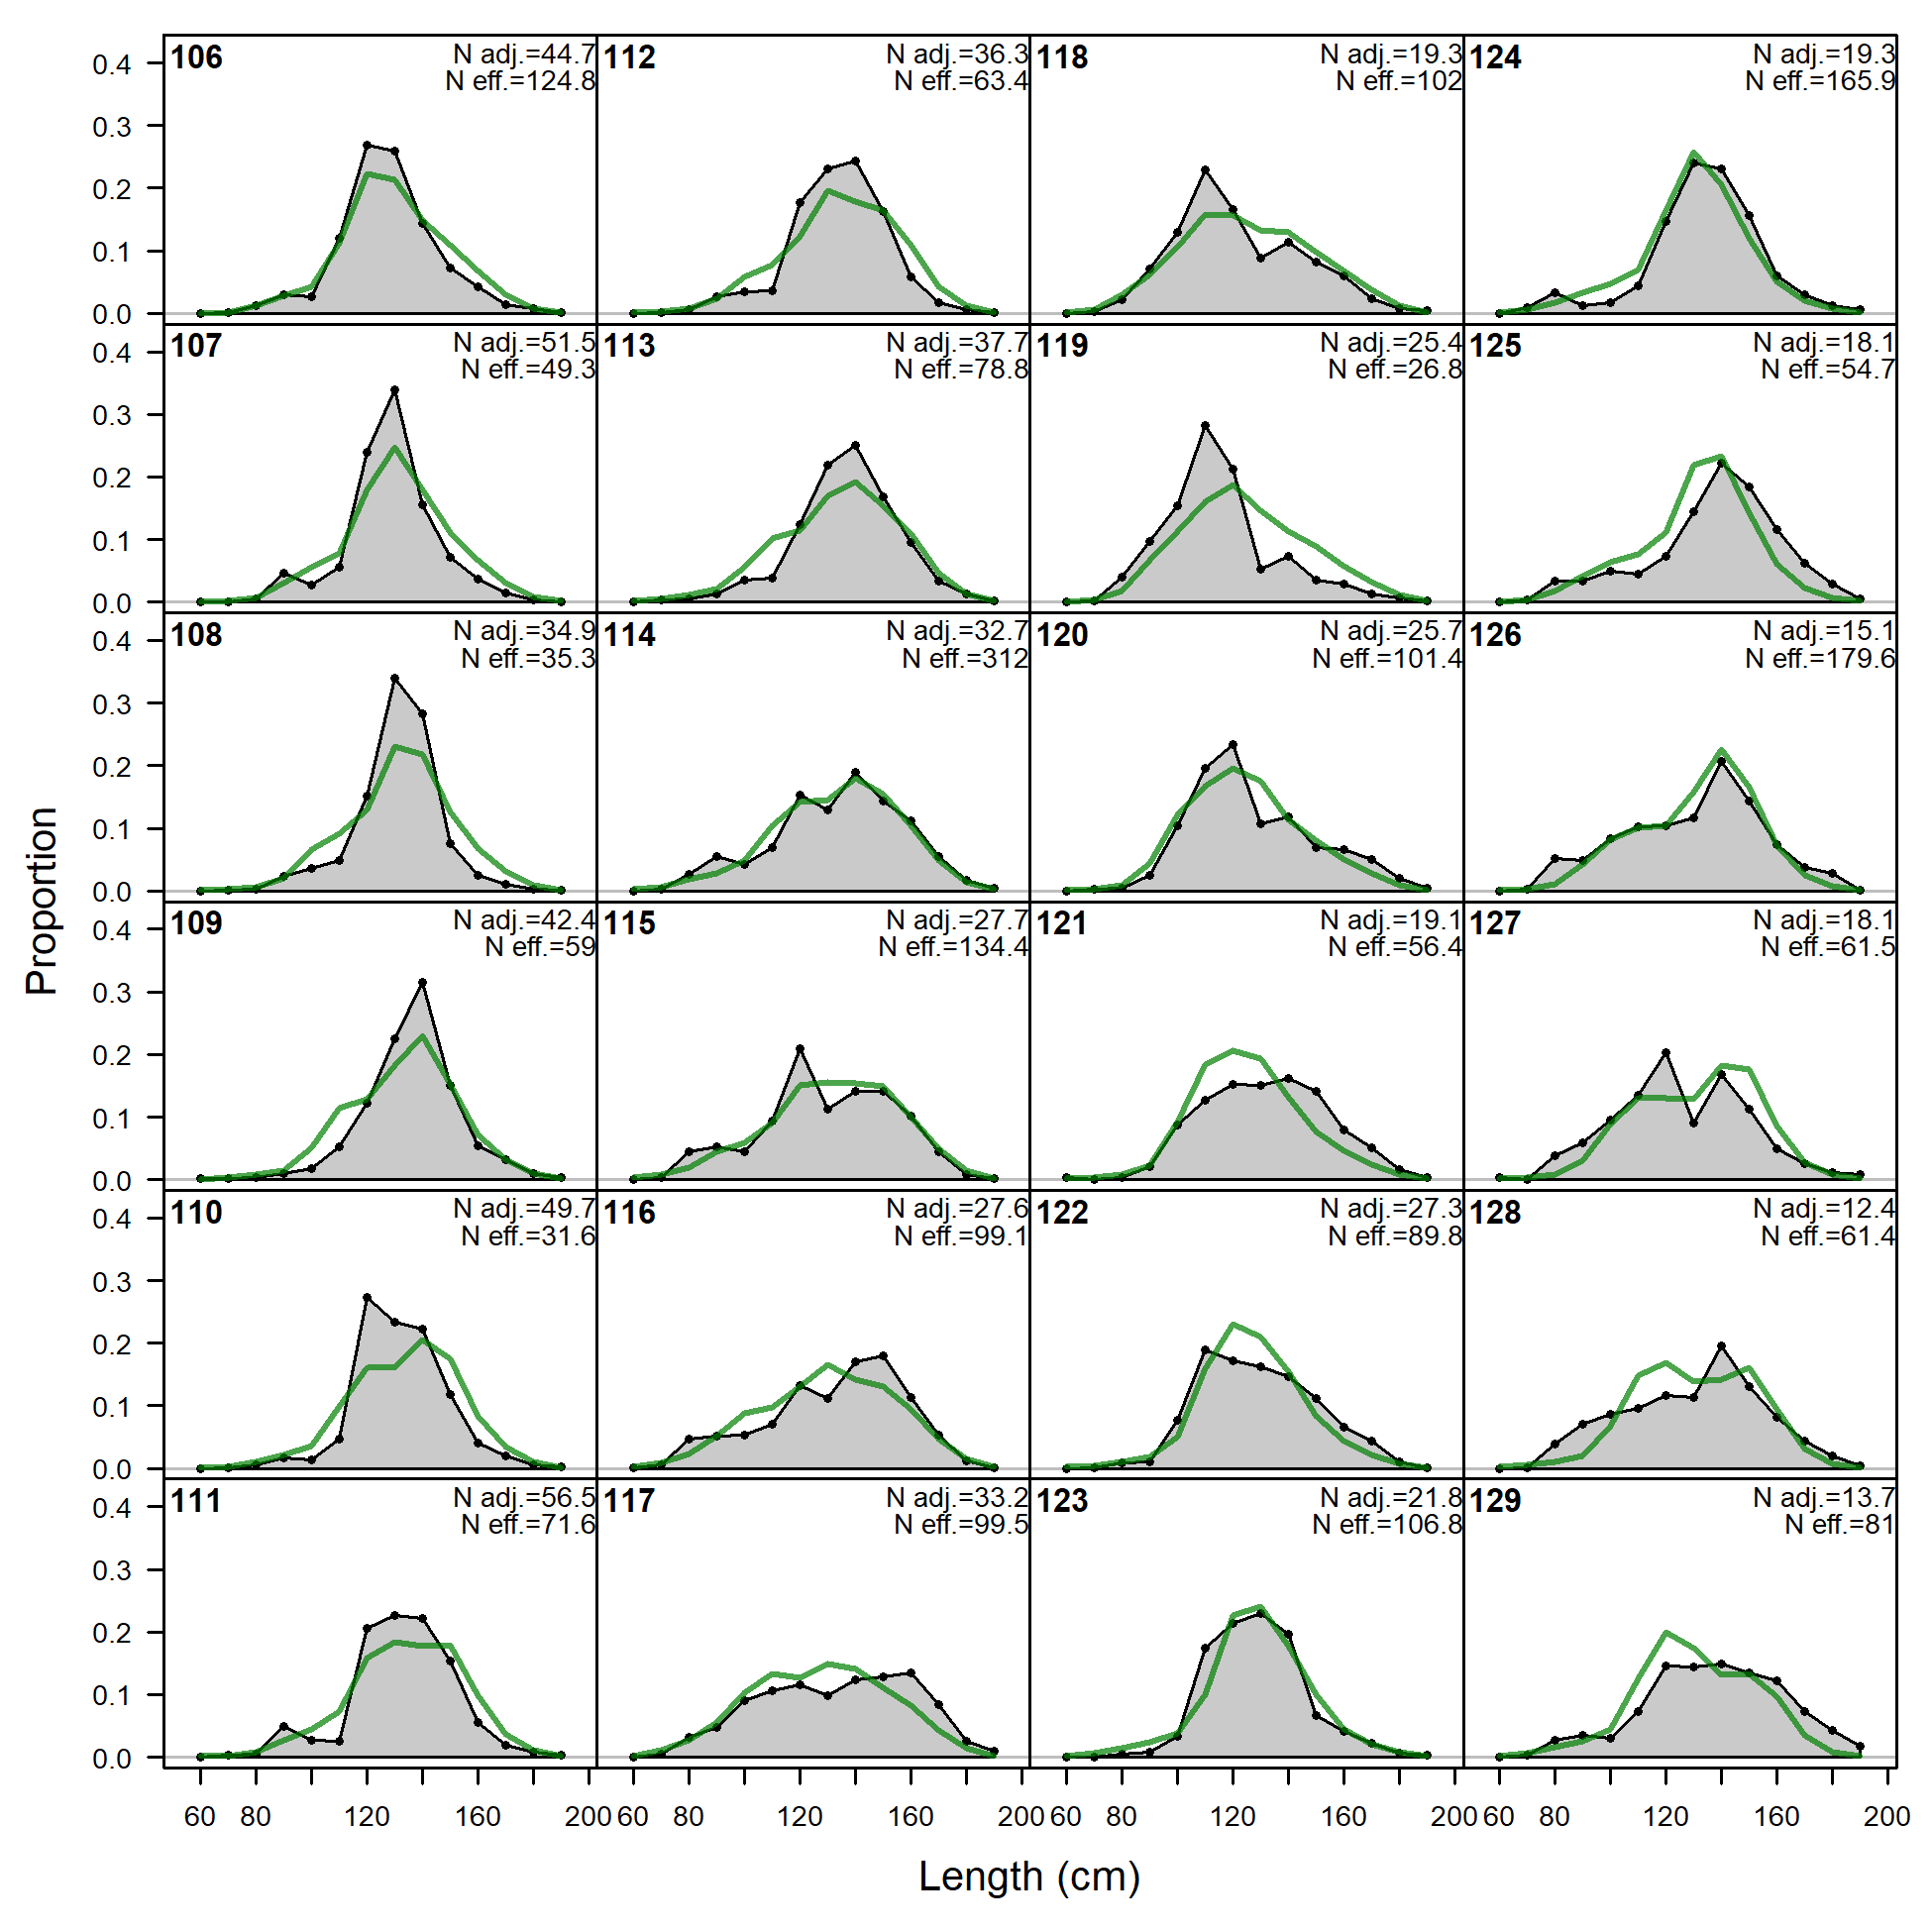
Size comps, whole catch, LL-n-A4 (plot 1 of 6).
'N adj.' is the input sample size after data-weighting adjustment. N eff. is the calculated effective sample size used in the McAllister-Ianelli tuning method. (plot 2 of 6) (plot 3 of 6)
file: comp_sizefit_flt4mkt0_page3.png
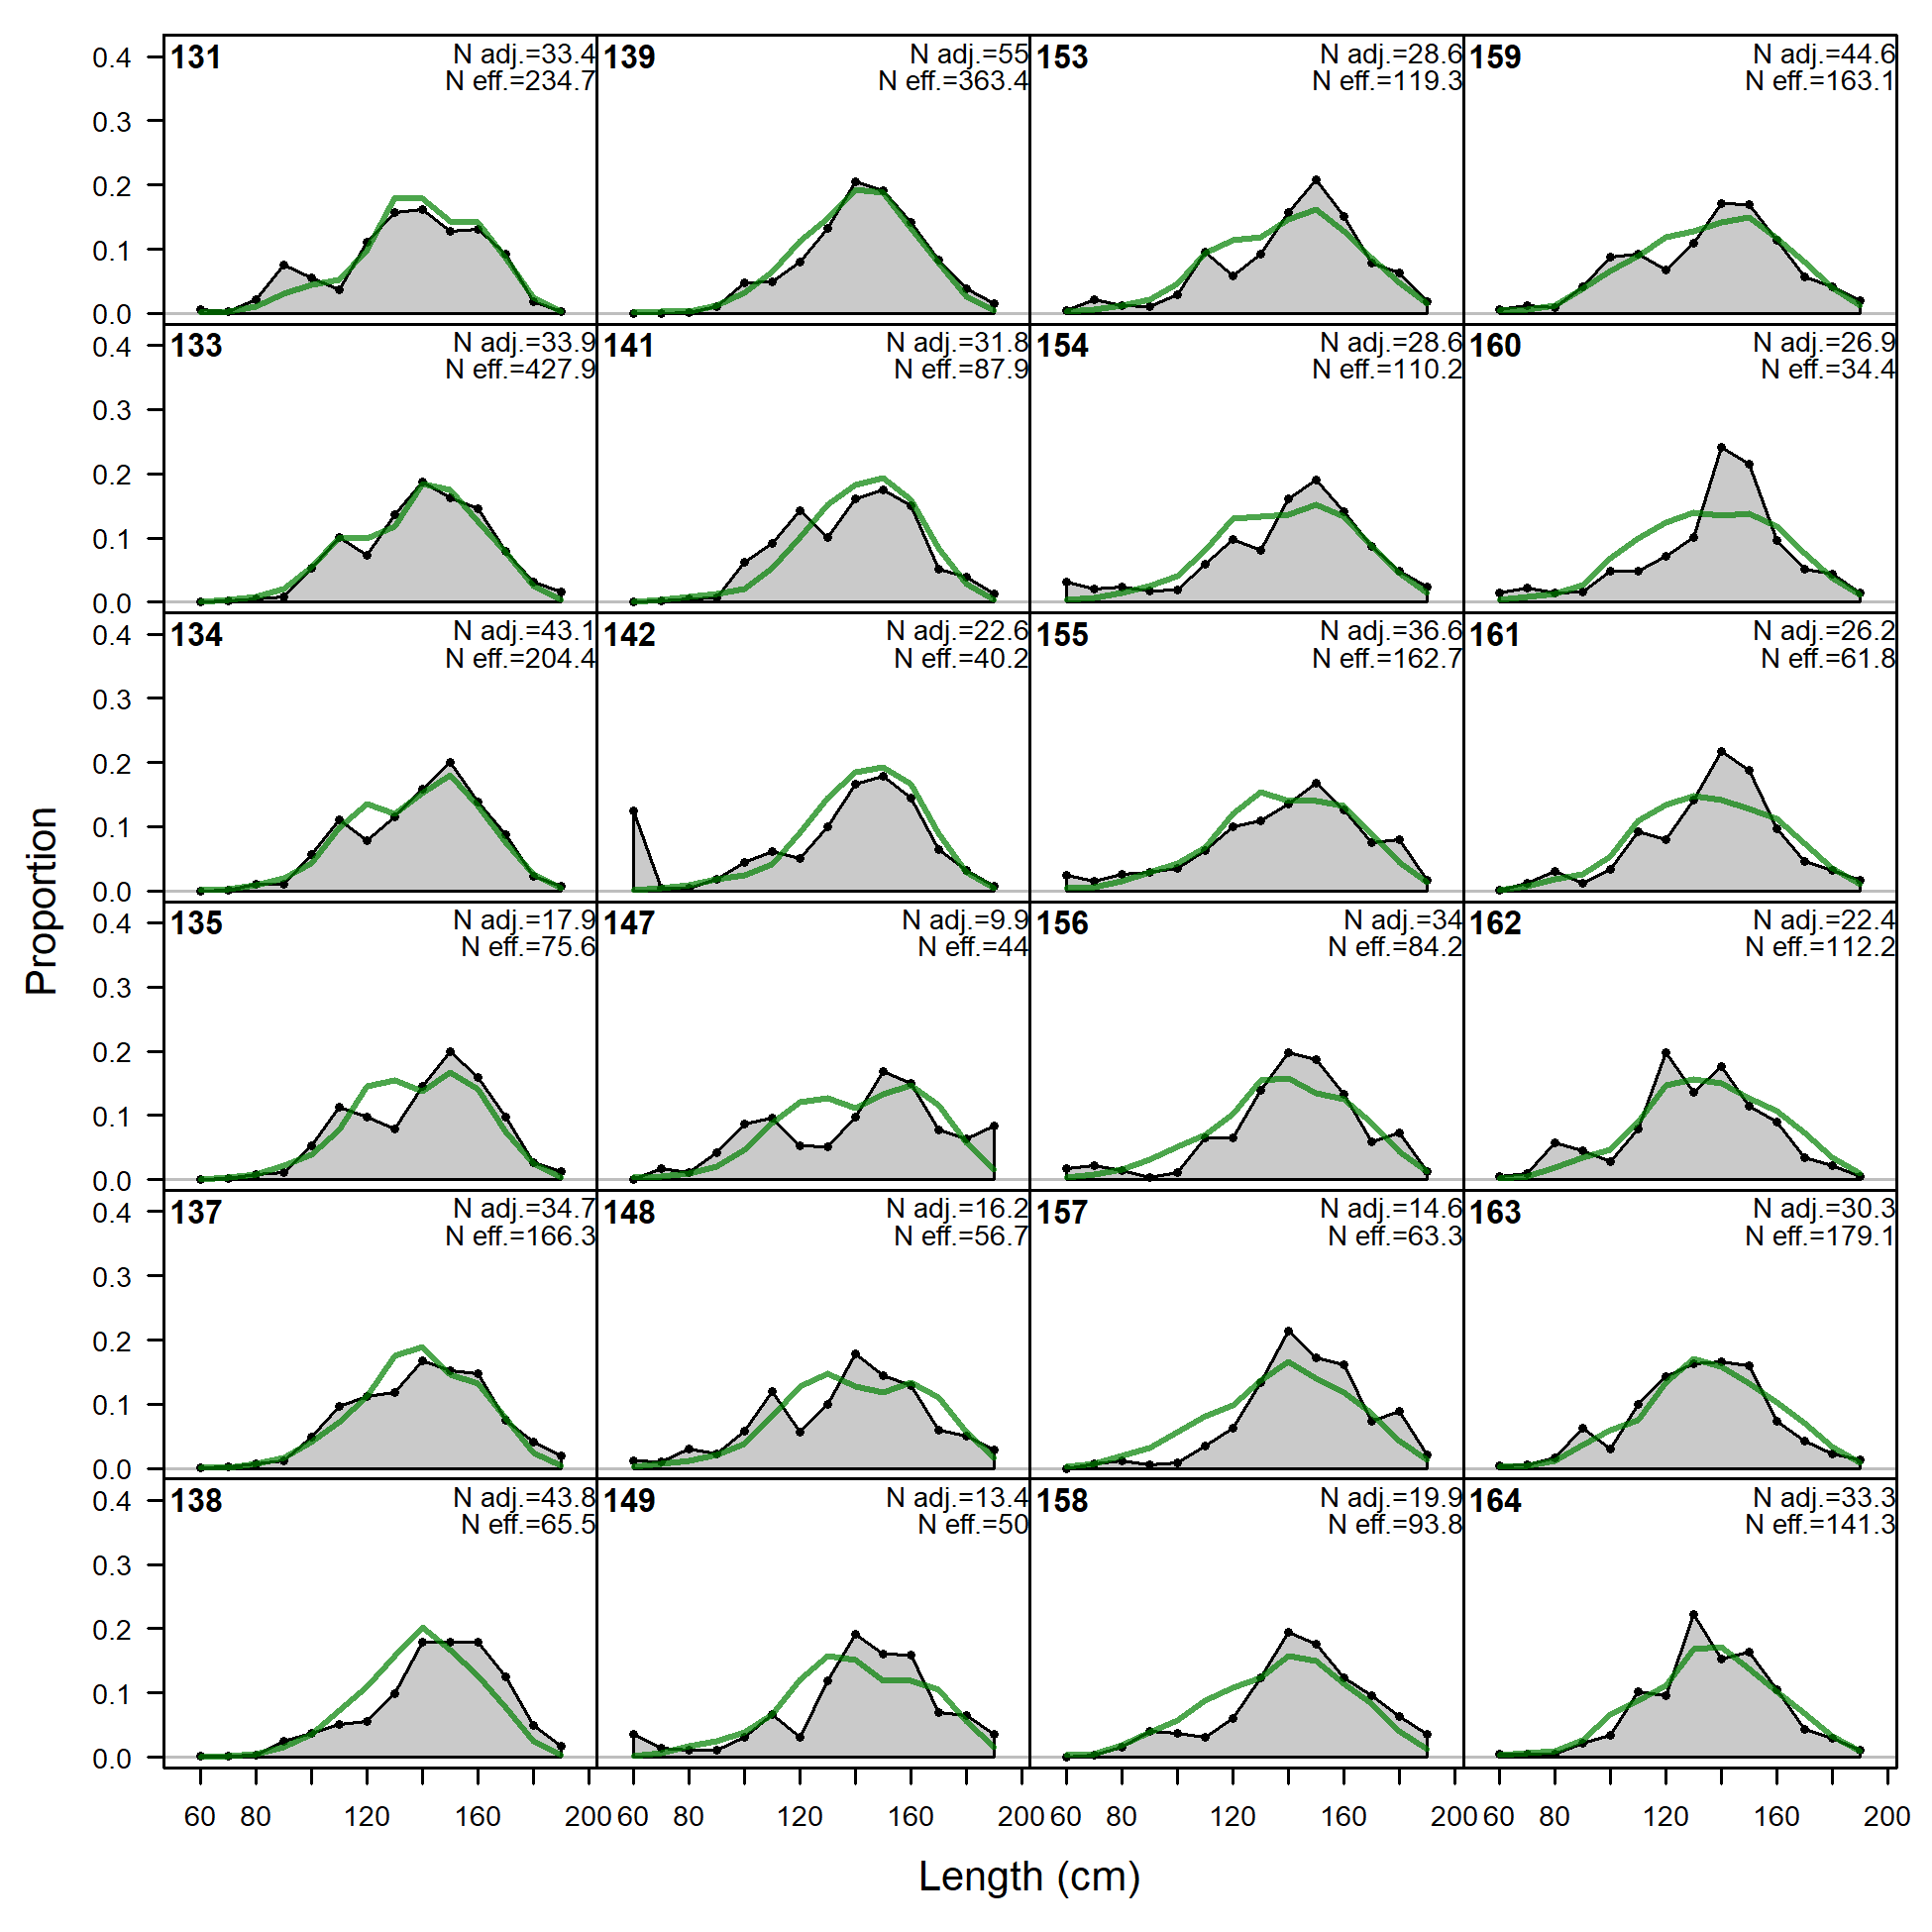
Size comps, whole catch, LL-n-A4 (plot 1 of 6).
'N adj.' is the input sample size after data-weighting adjustment. N eff. is the calculated effective sample size used in the McAllister-Ianelli tuning method. (plot 2 of 6) (plot 3 of 6) (plot 4 of 6)
file: comp_sizefit_flt4mkt0_page4.png
Size comps, whole catch, LL-n-A4 (plot 1 of 6).
'N adj.' is the input sample size after data-weighting adjustment. N eff. is the calculated effective sample size used in the McAllister-Ianelli tuning method. (plot 2 of 6) (plot 3 of 6) (plot 4 of 6) (plot 5 of 6)
file: comp_sizefit_flt4mkt0_page5.png
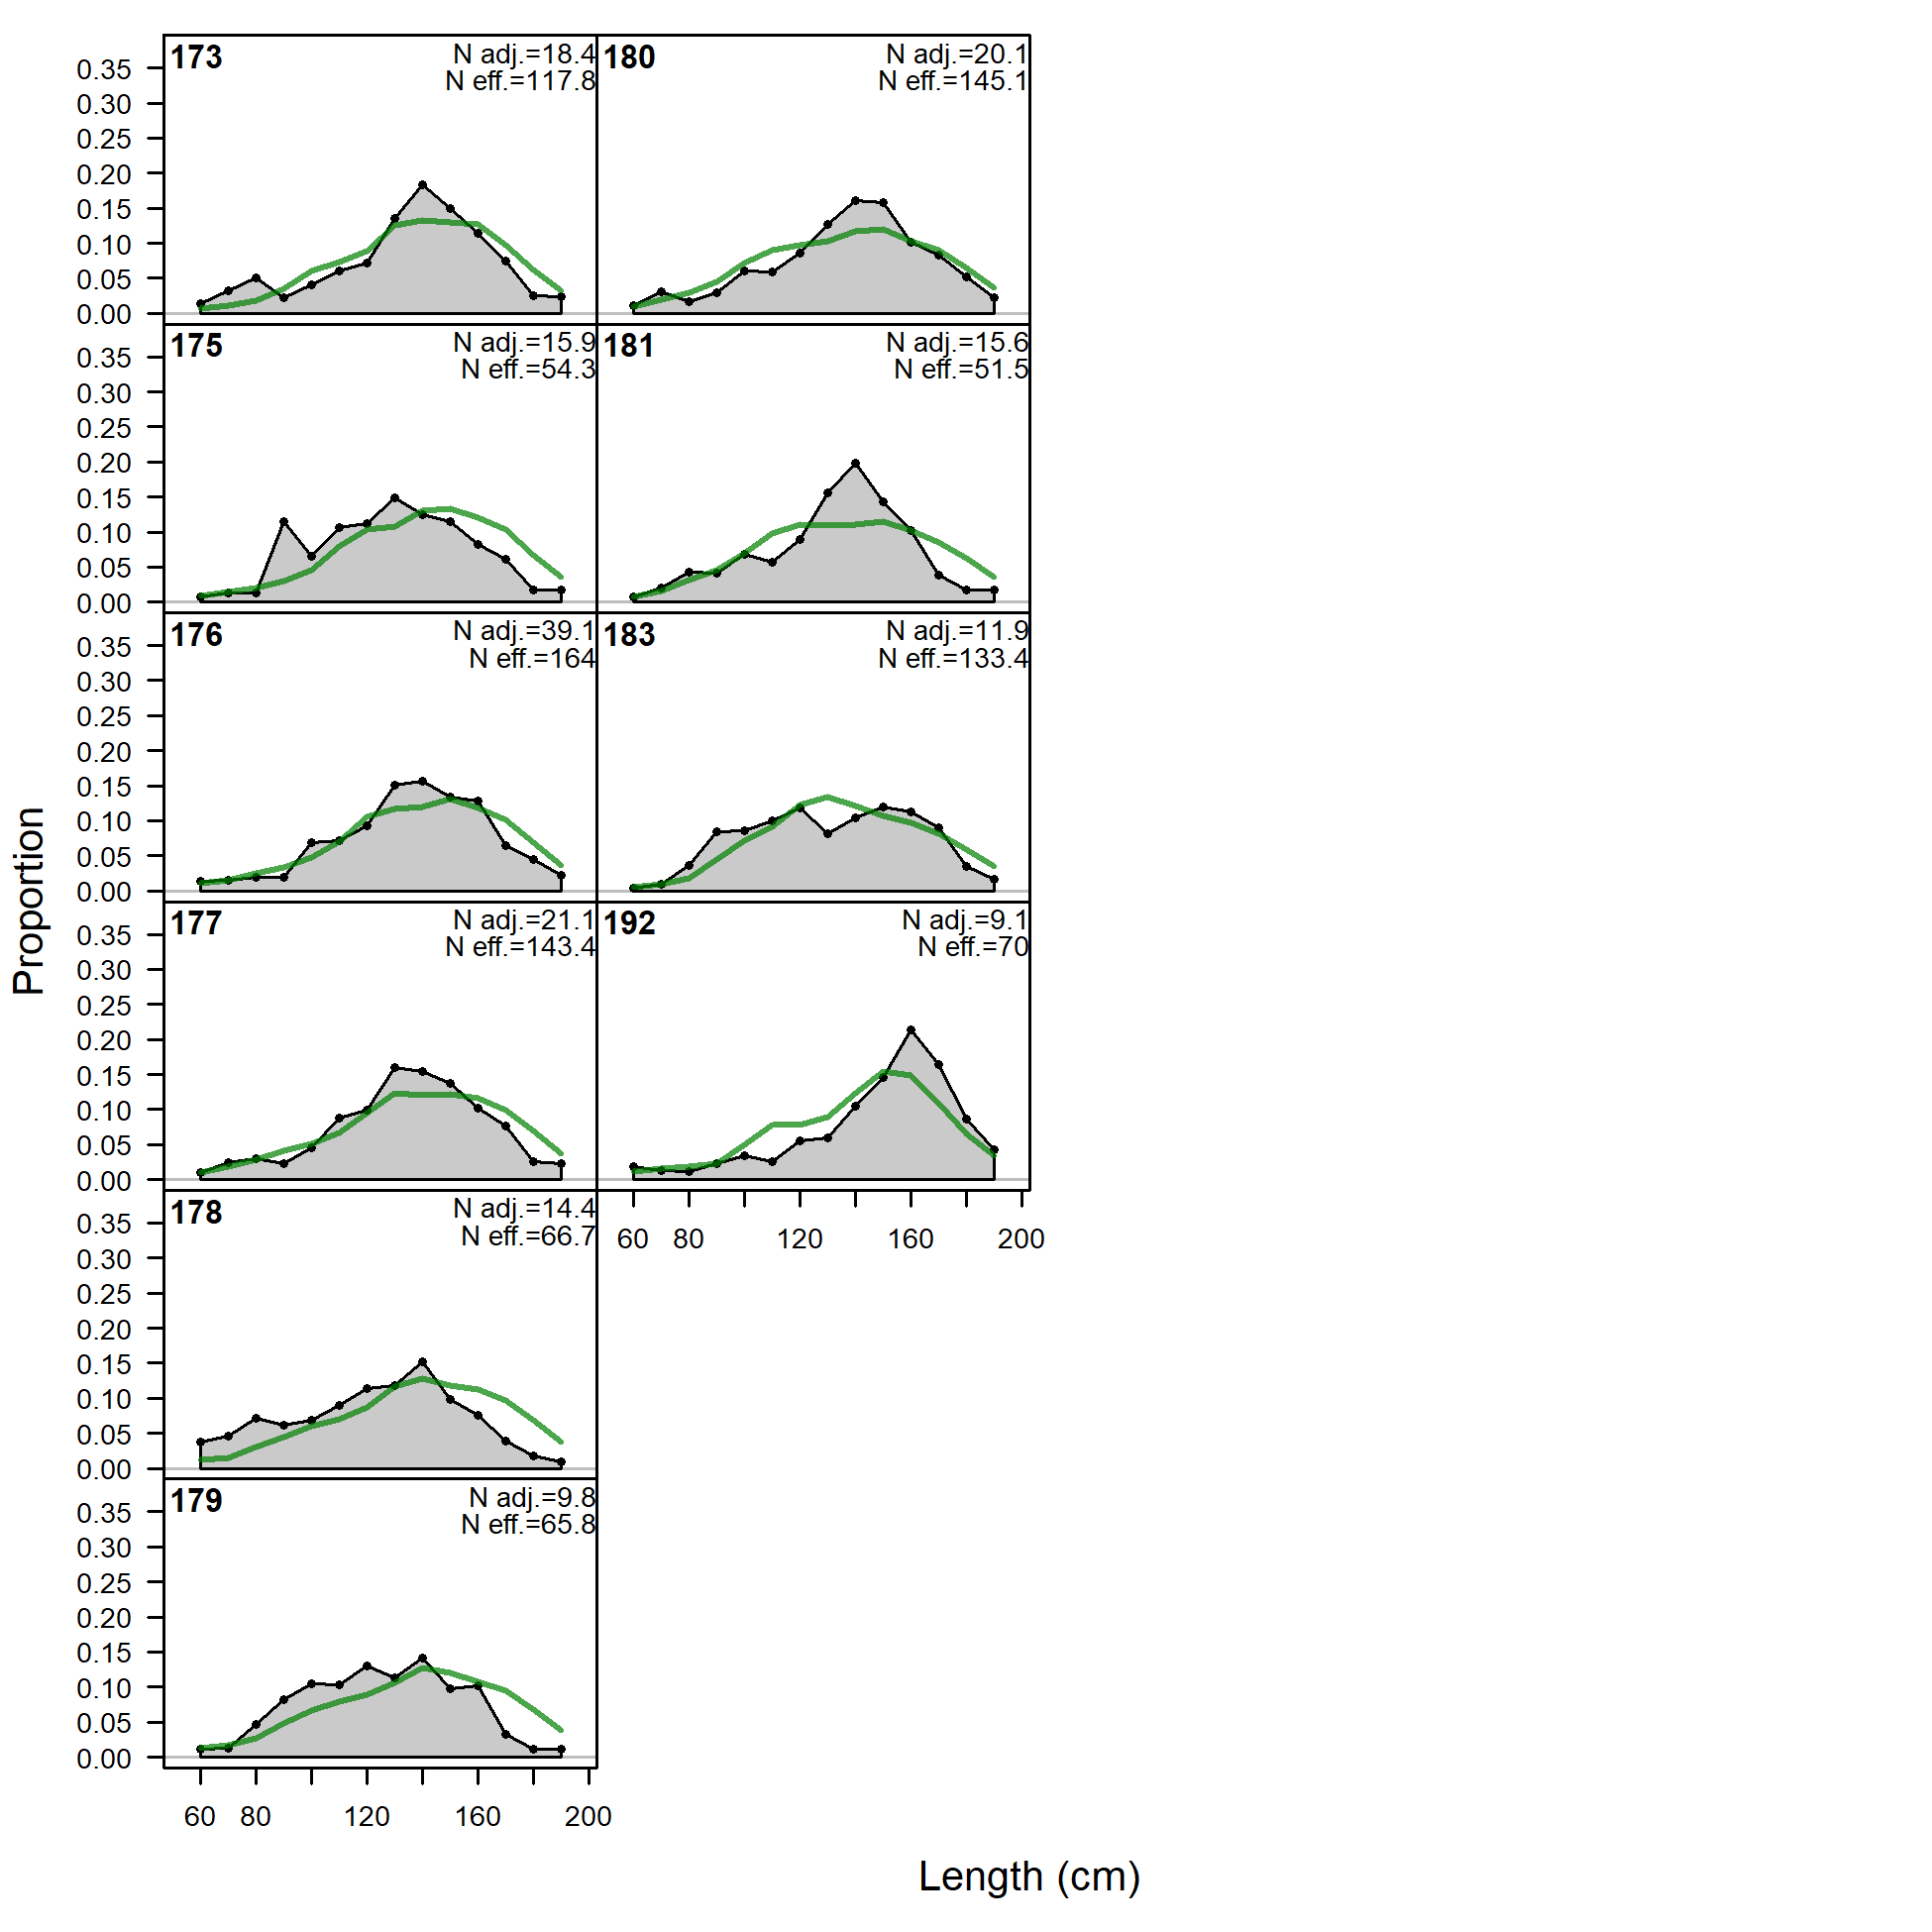
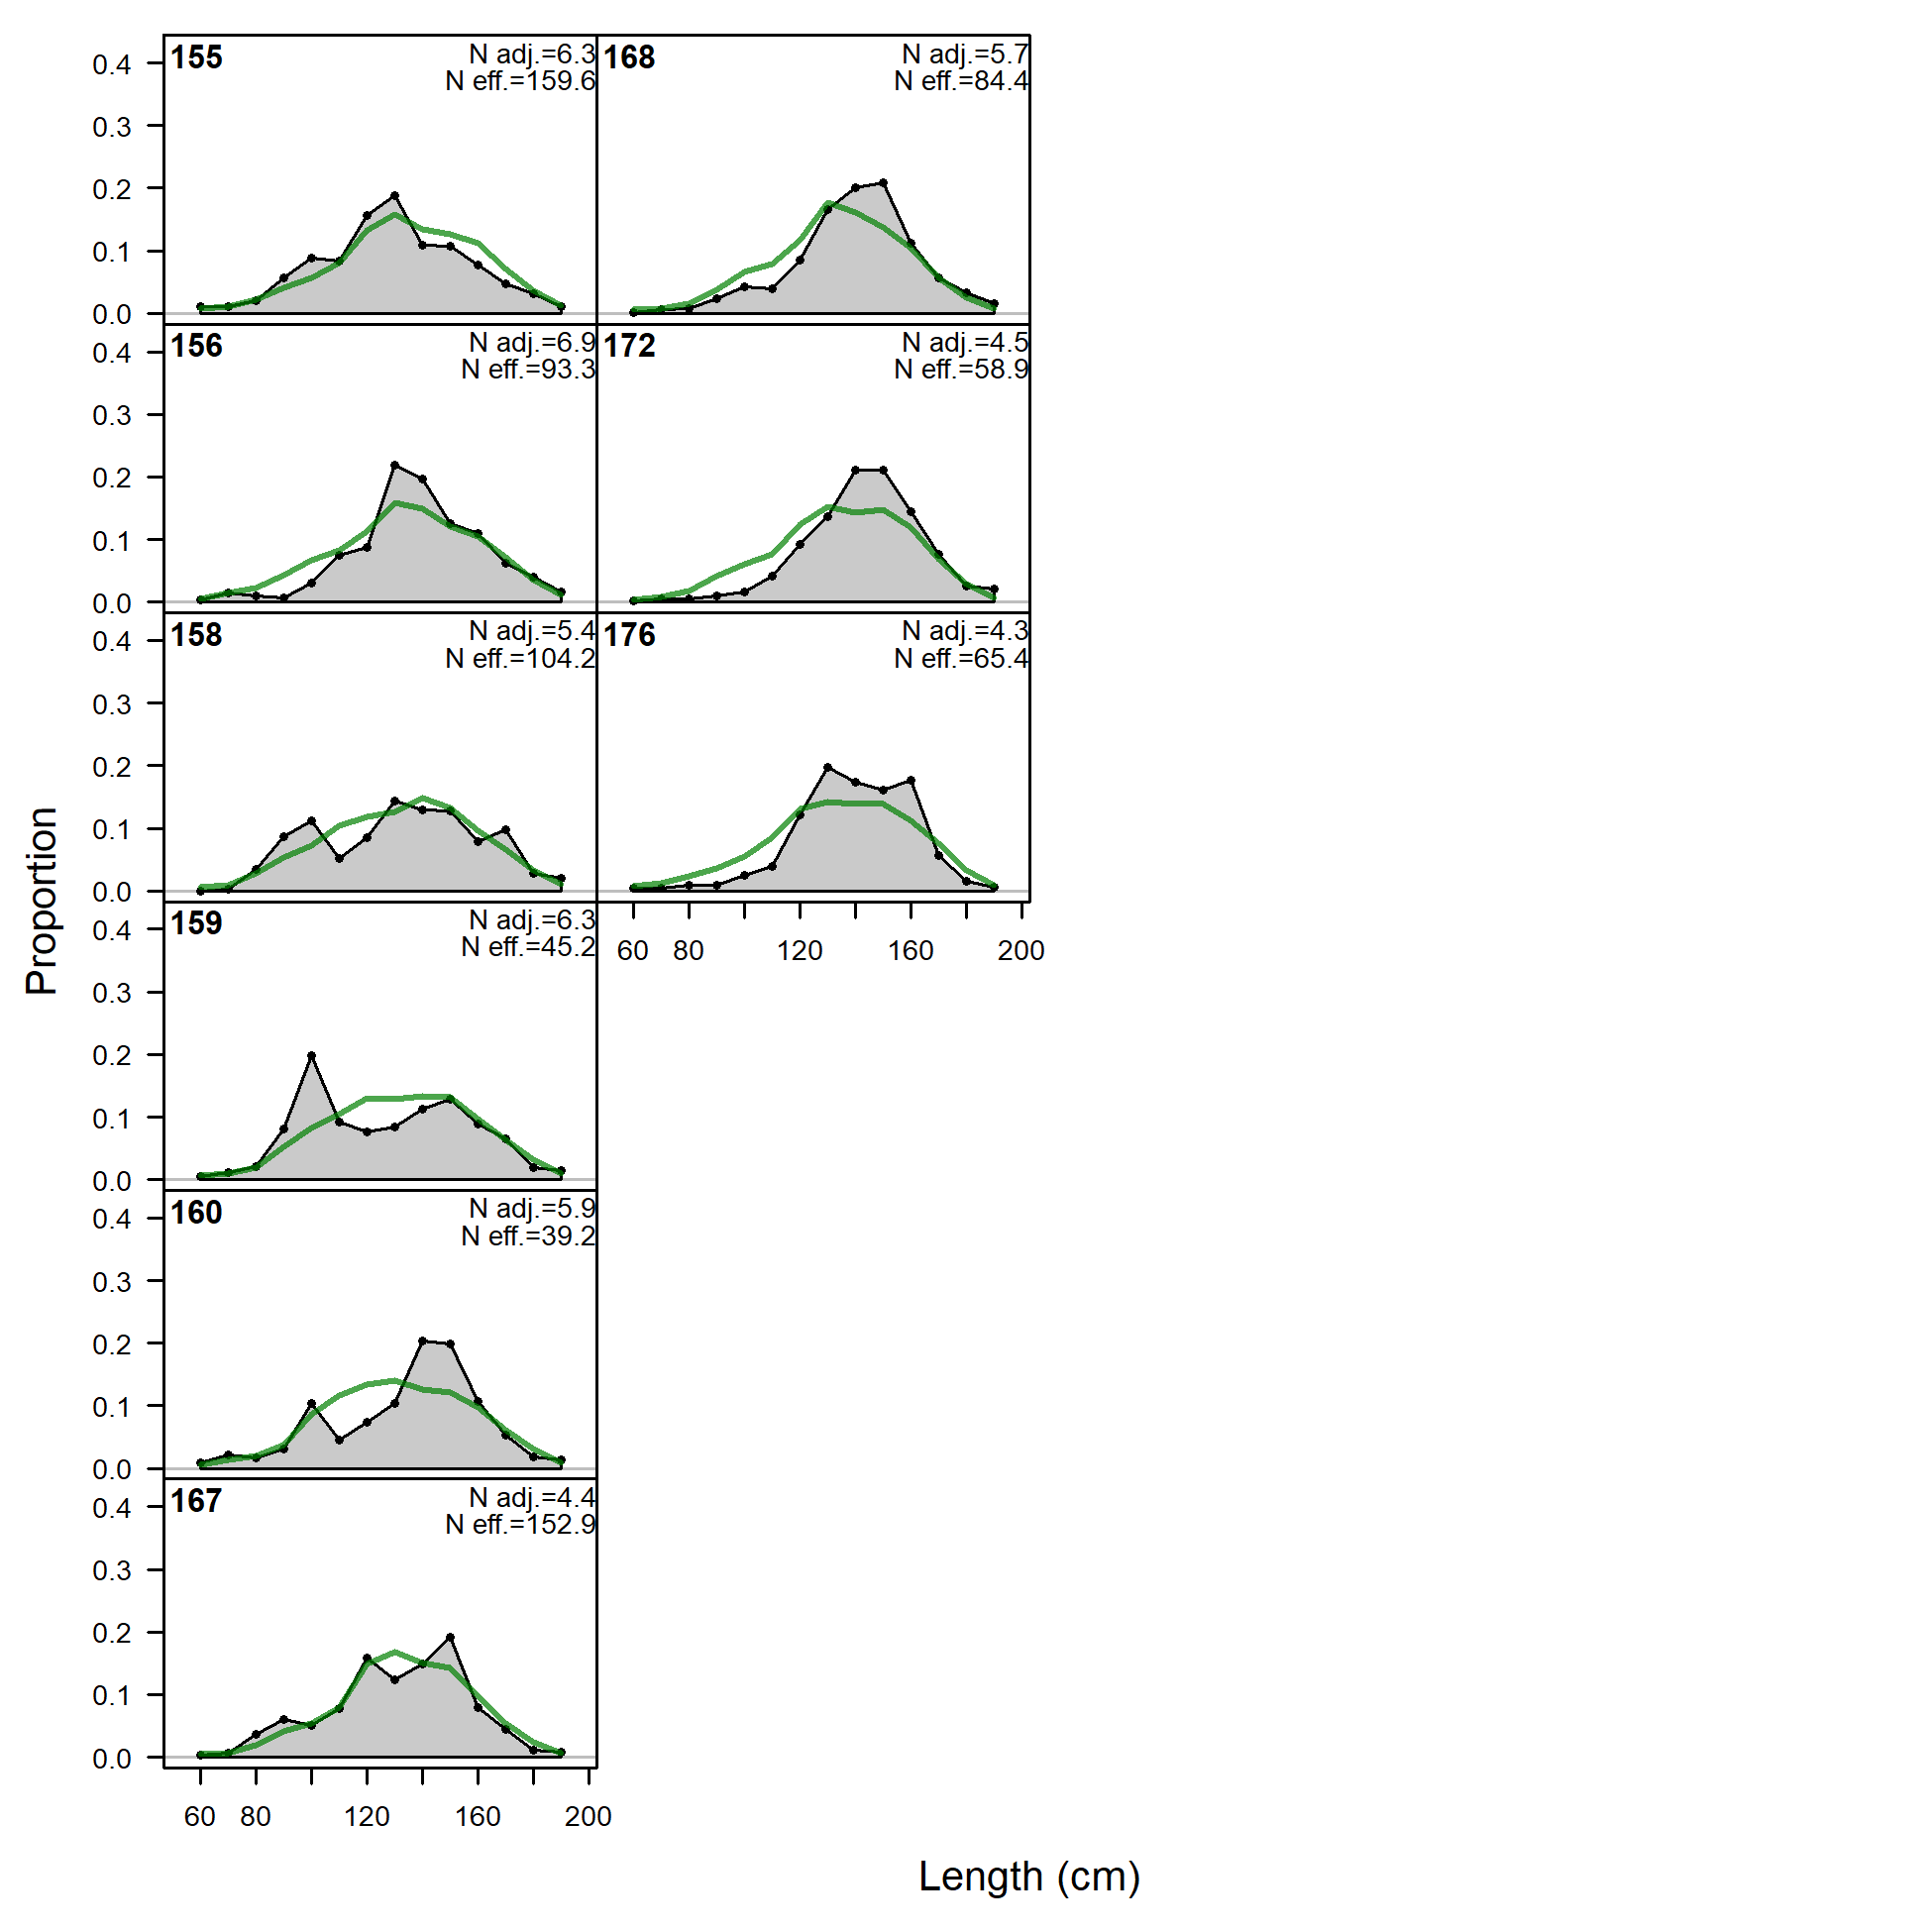
Size comps, whole catch, LL-n-A4 (plot 1 of 6).
'N adj.' is the input sample size after data-weighting adjustment. N eff. is the calculated effective sample size used in the McAllister-Ianelli tuning method. (plot 2 of 6) (plot 3 of 6) (plot 4 of 6) (plot 5 of 6) (plot 6 of 6)
file: comp_sizefit_flt4mkt0_page6.png
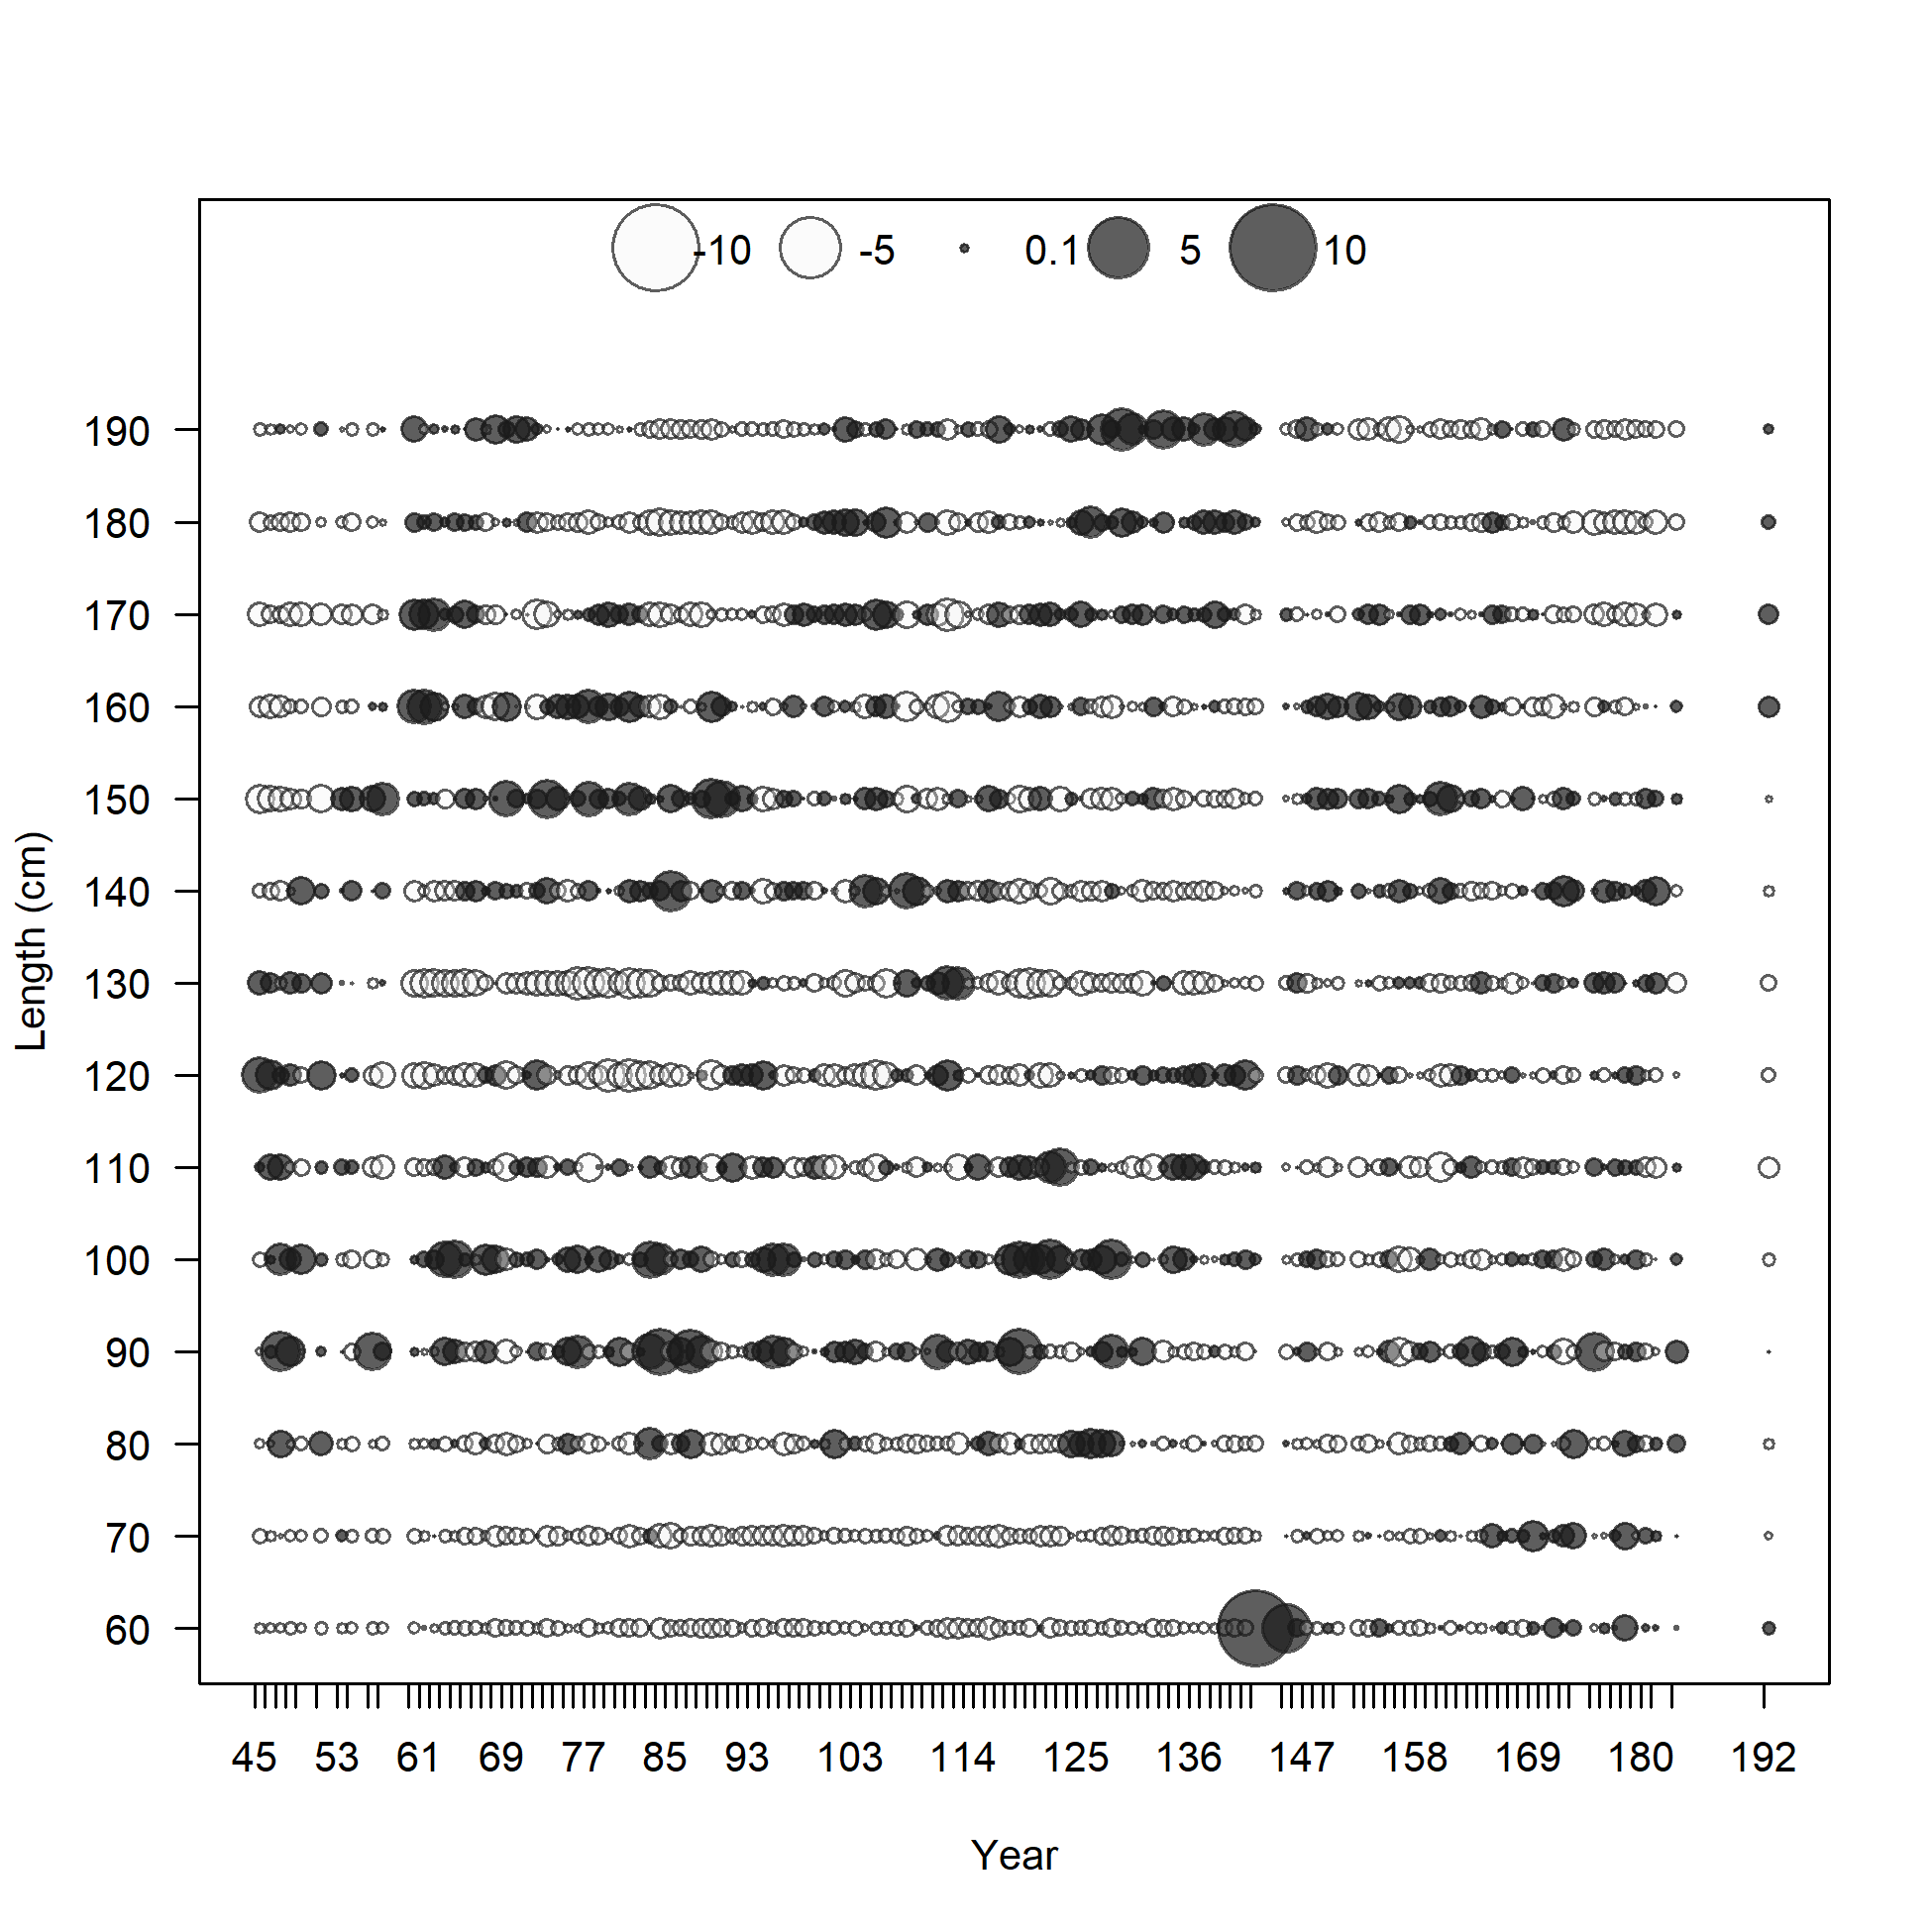
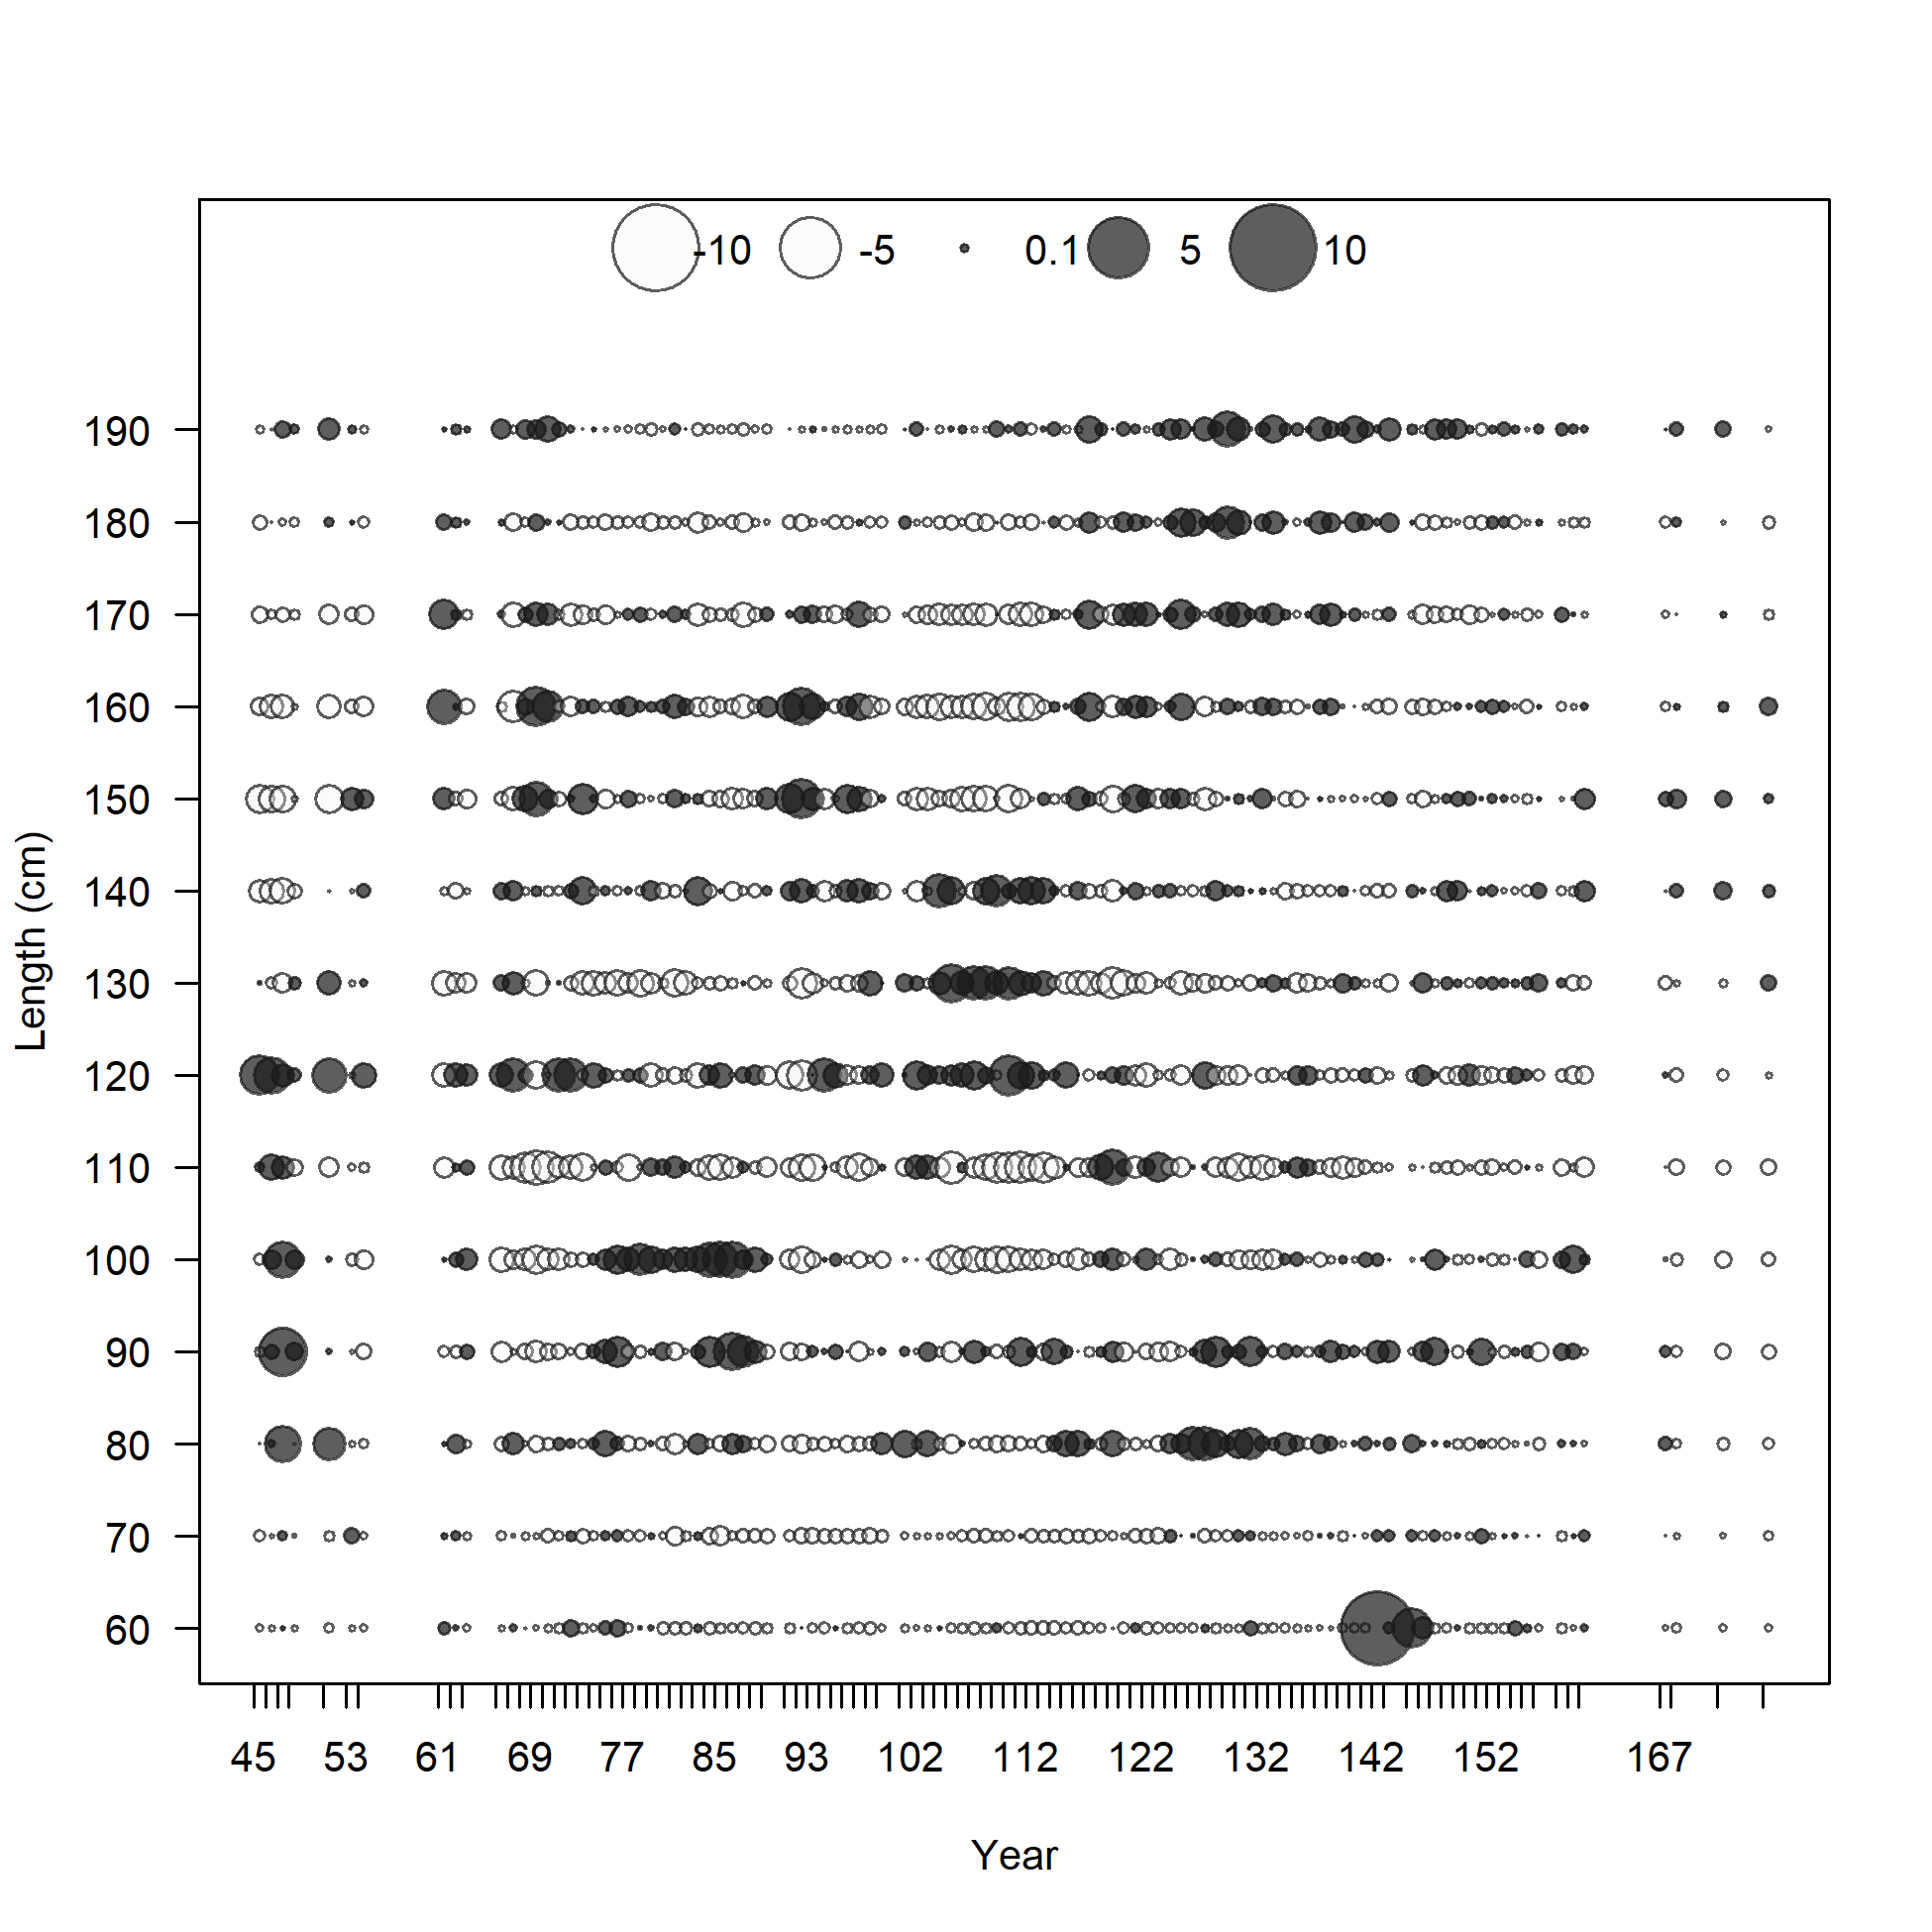
Pearson residuals, whole catch, LL-n-A4 (max=7.81) (plot 6 of 6)
Closed bubbles are positive residuals (observed > expected) and open bubbles are negative residuals (observed < expected).
file: comp_sizefit_residsflt4mkt0_page6.png
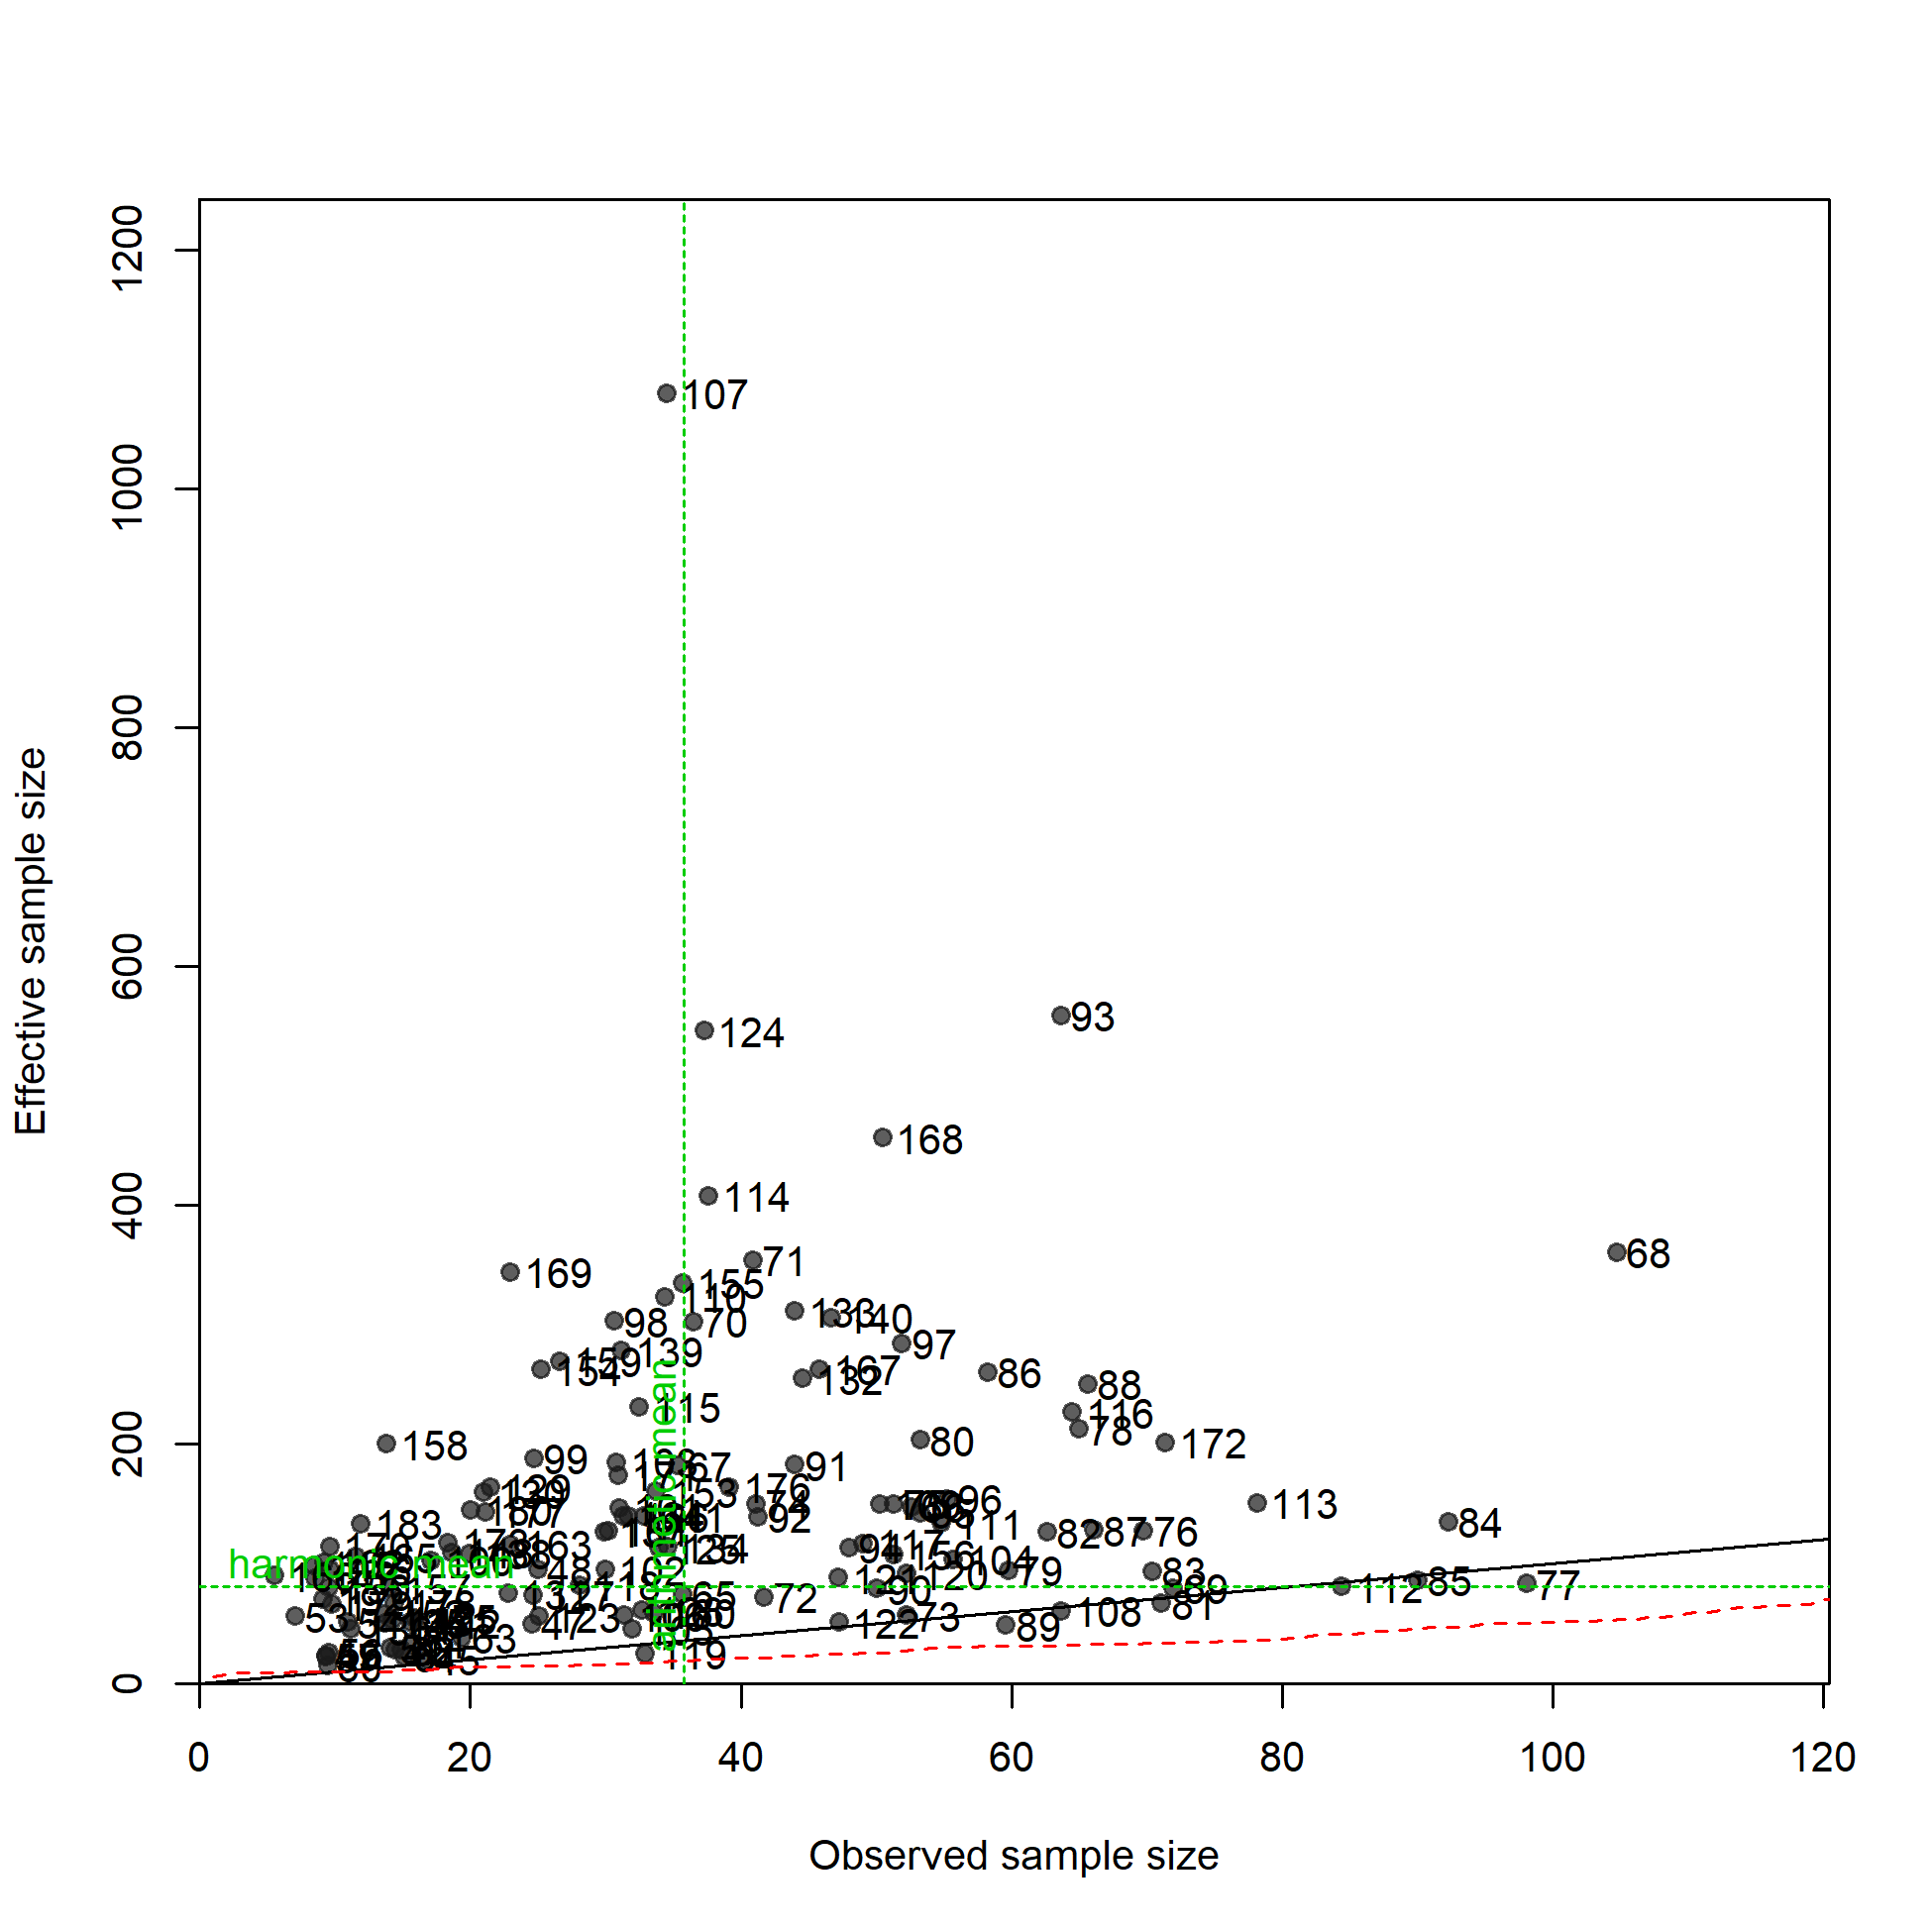
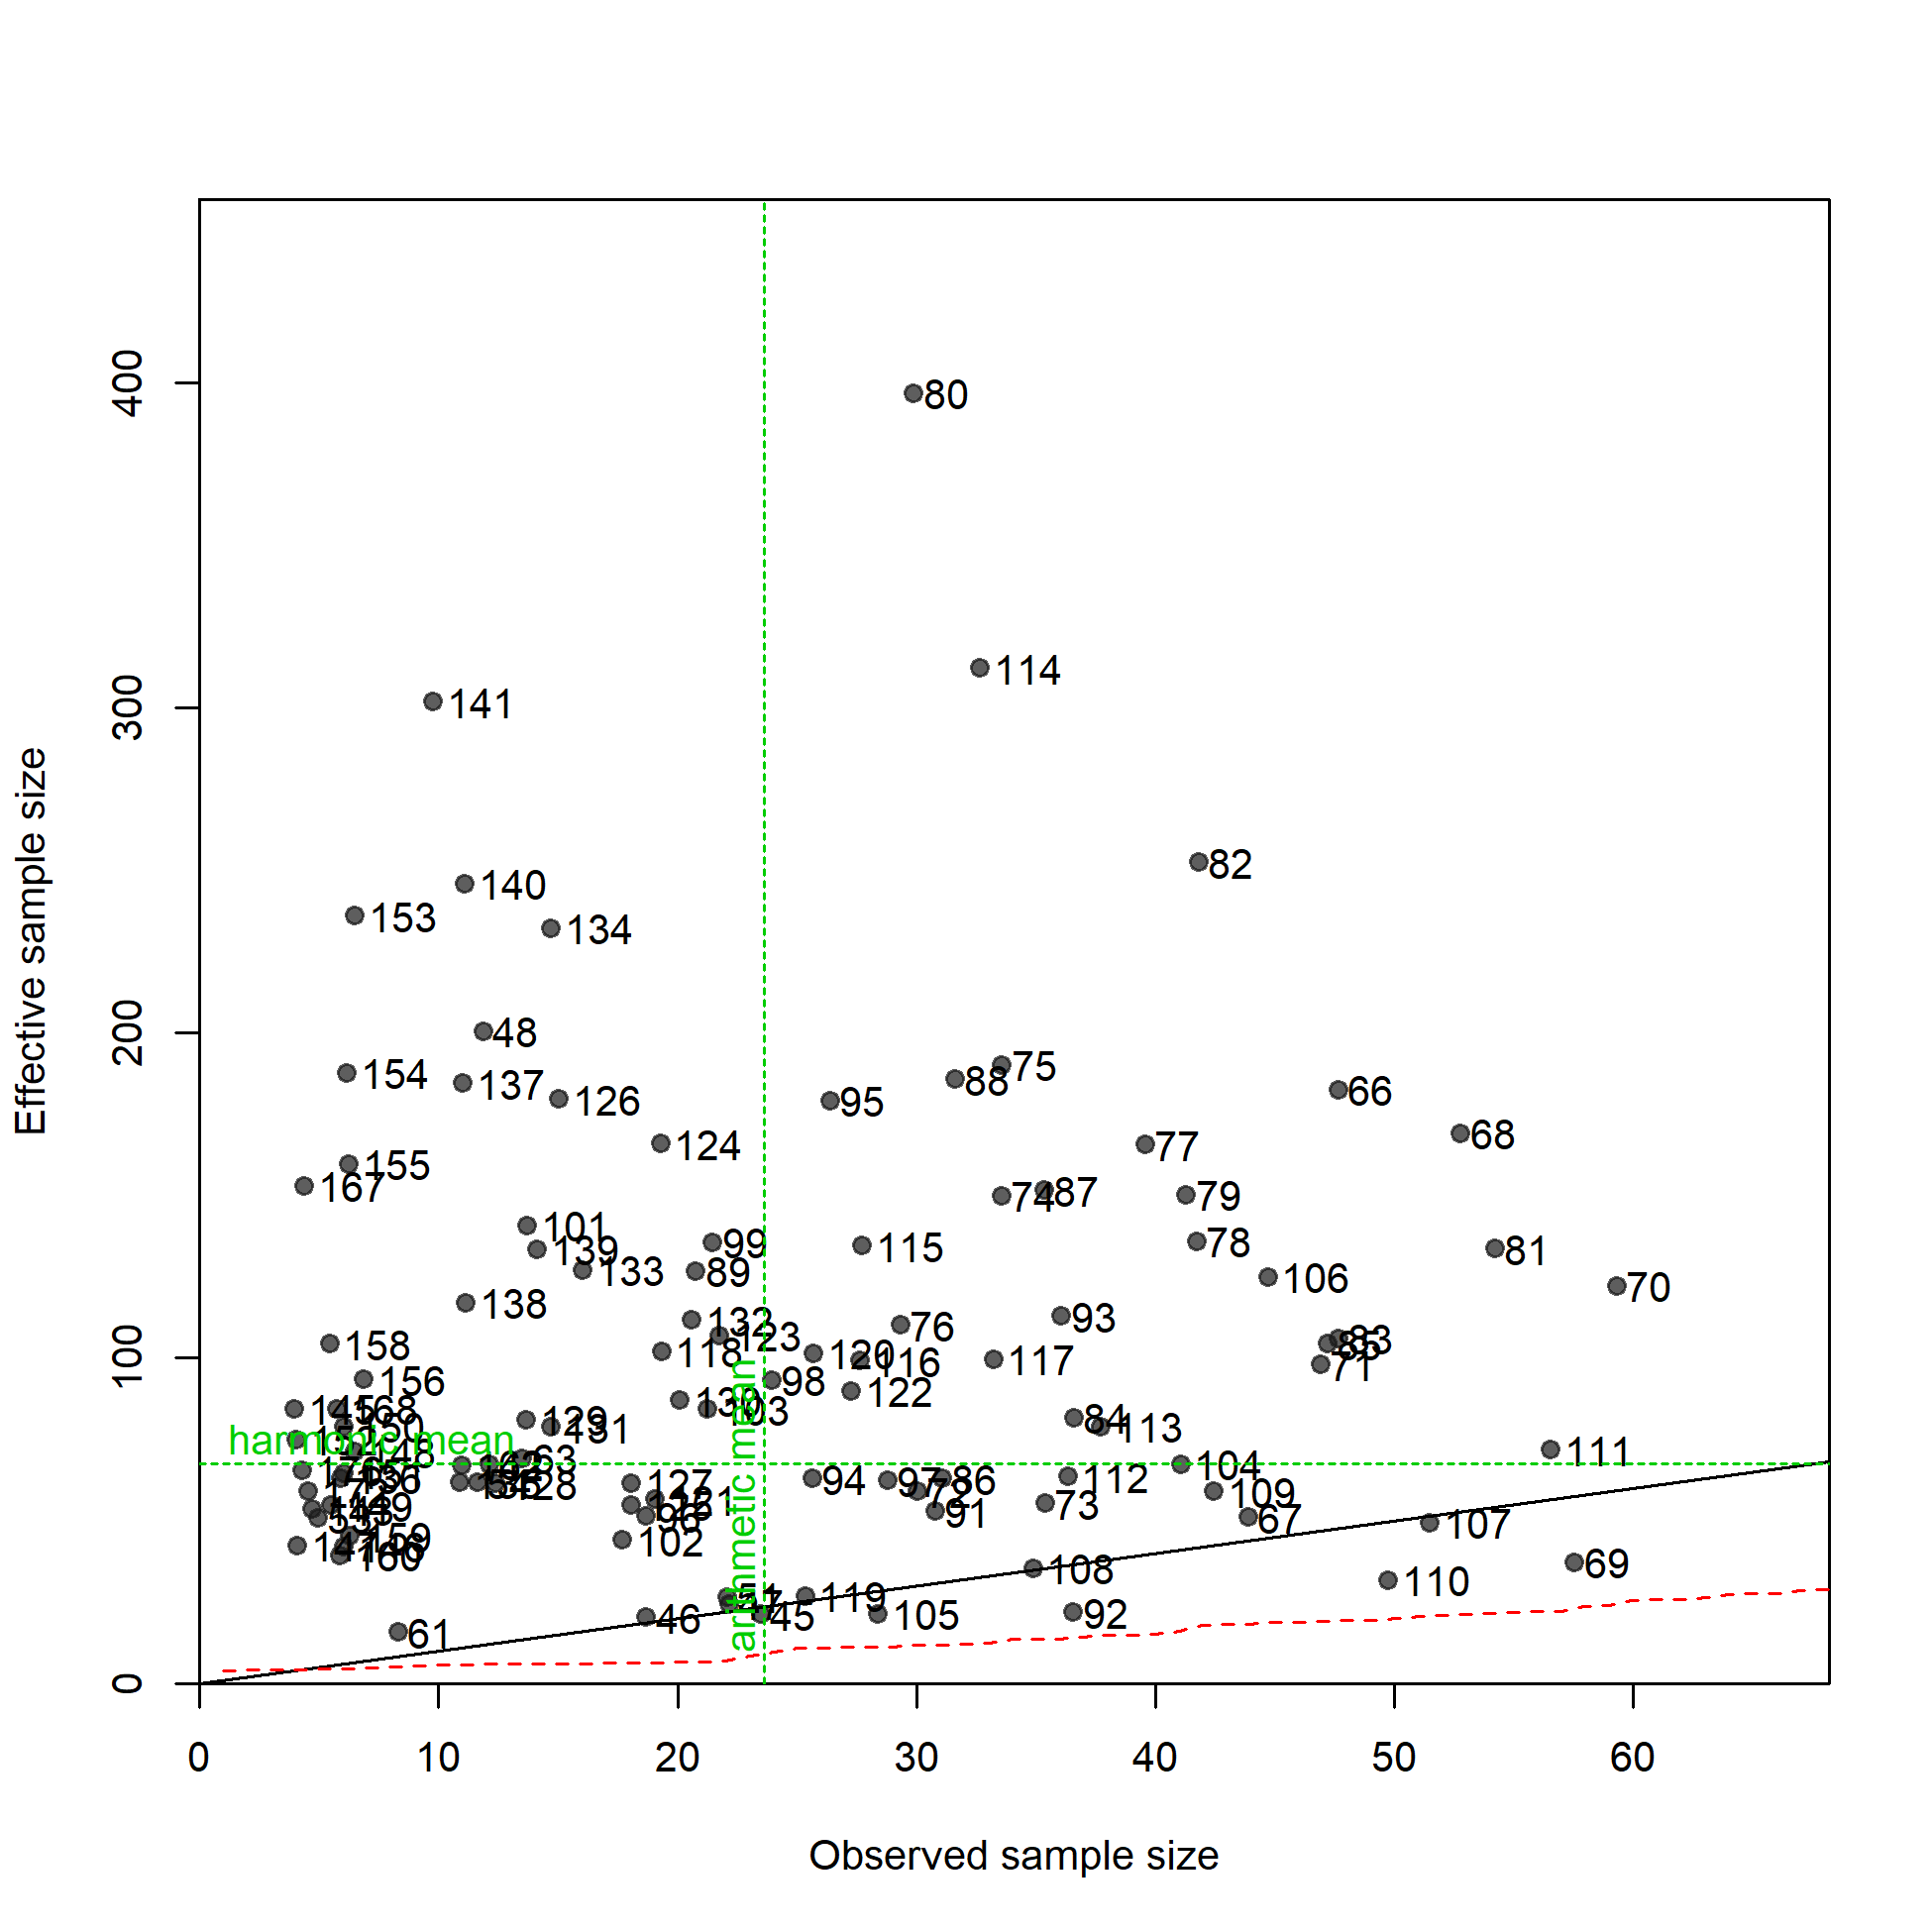
N-EffN comparison, Size comps, whole catch, LL-n-A4
file: comp_sizefit_sampsize_flt4mkt0.png
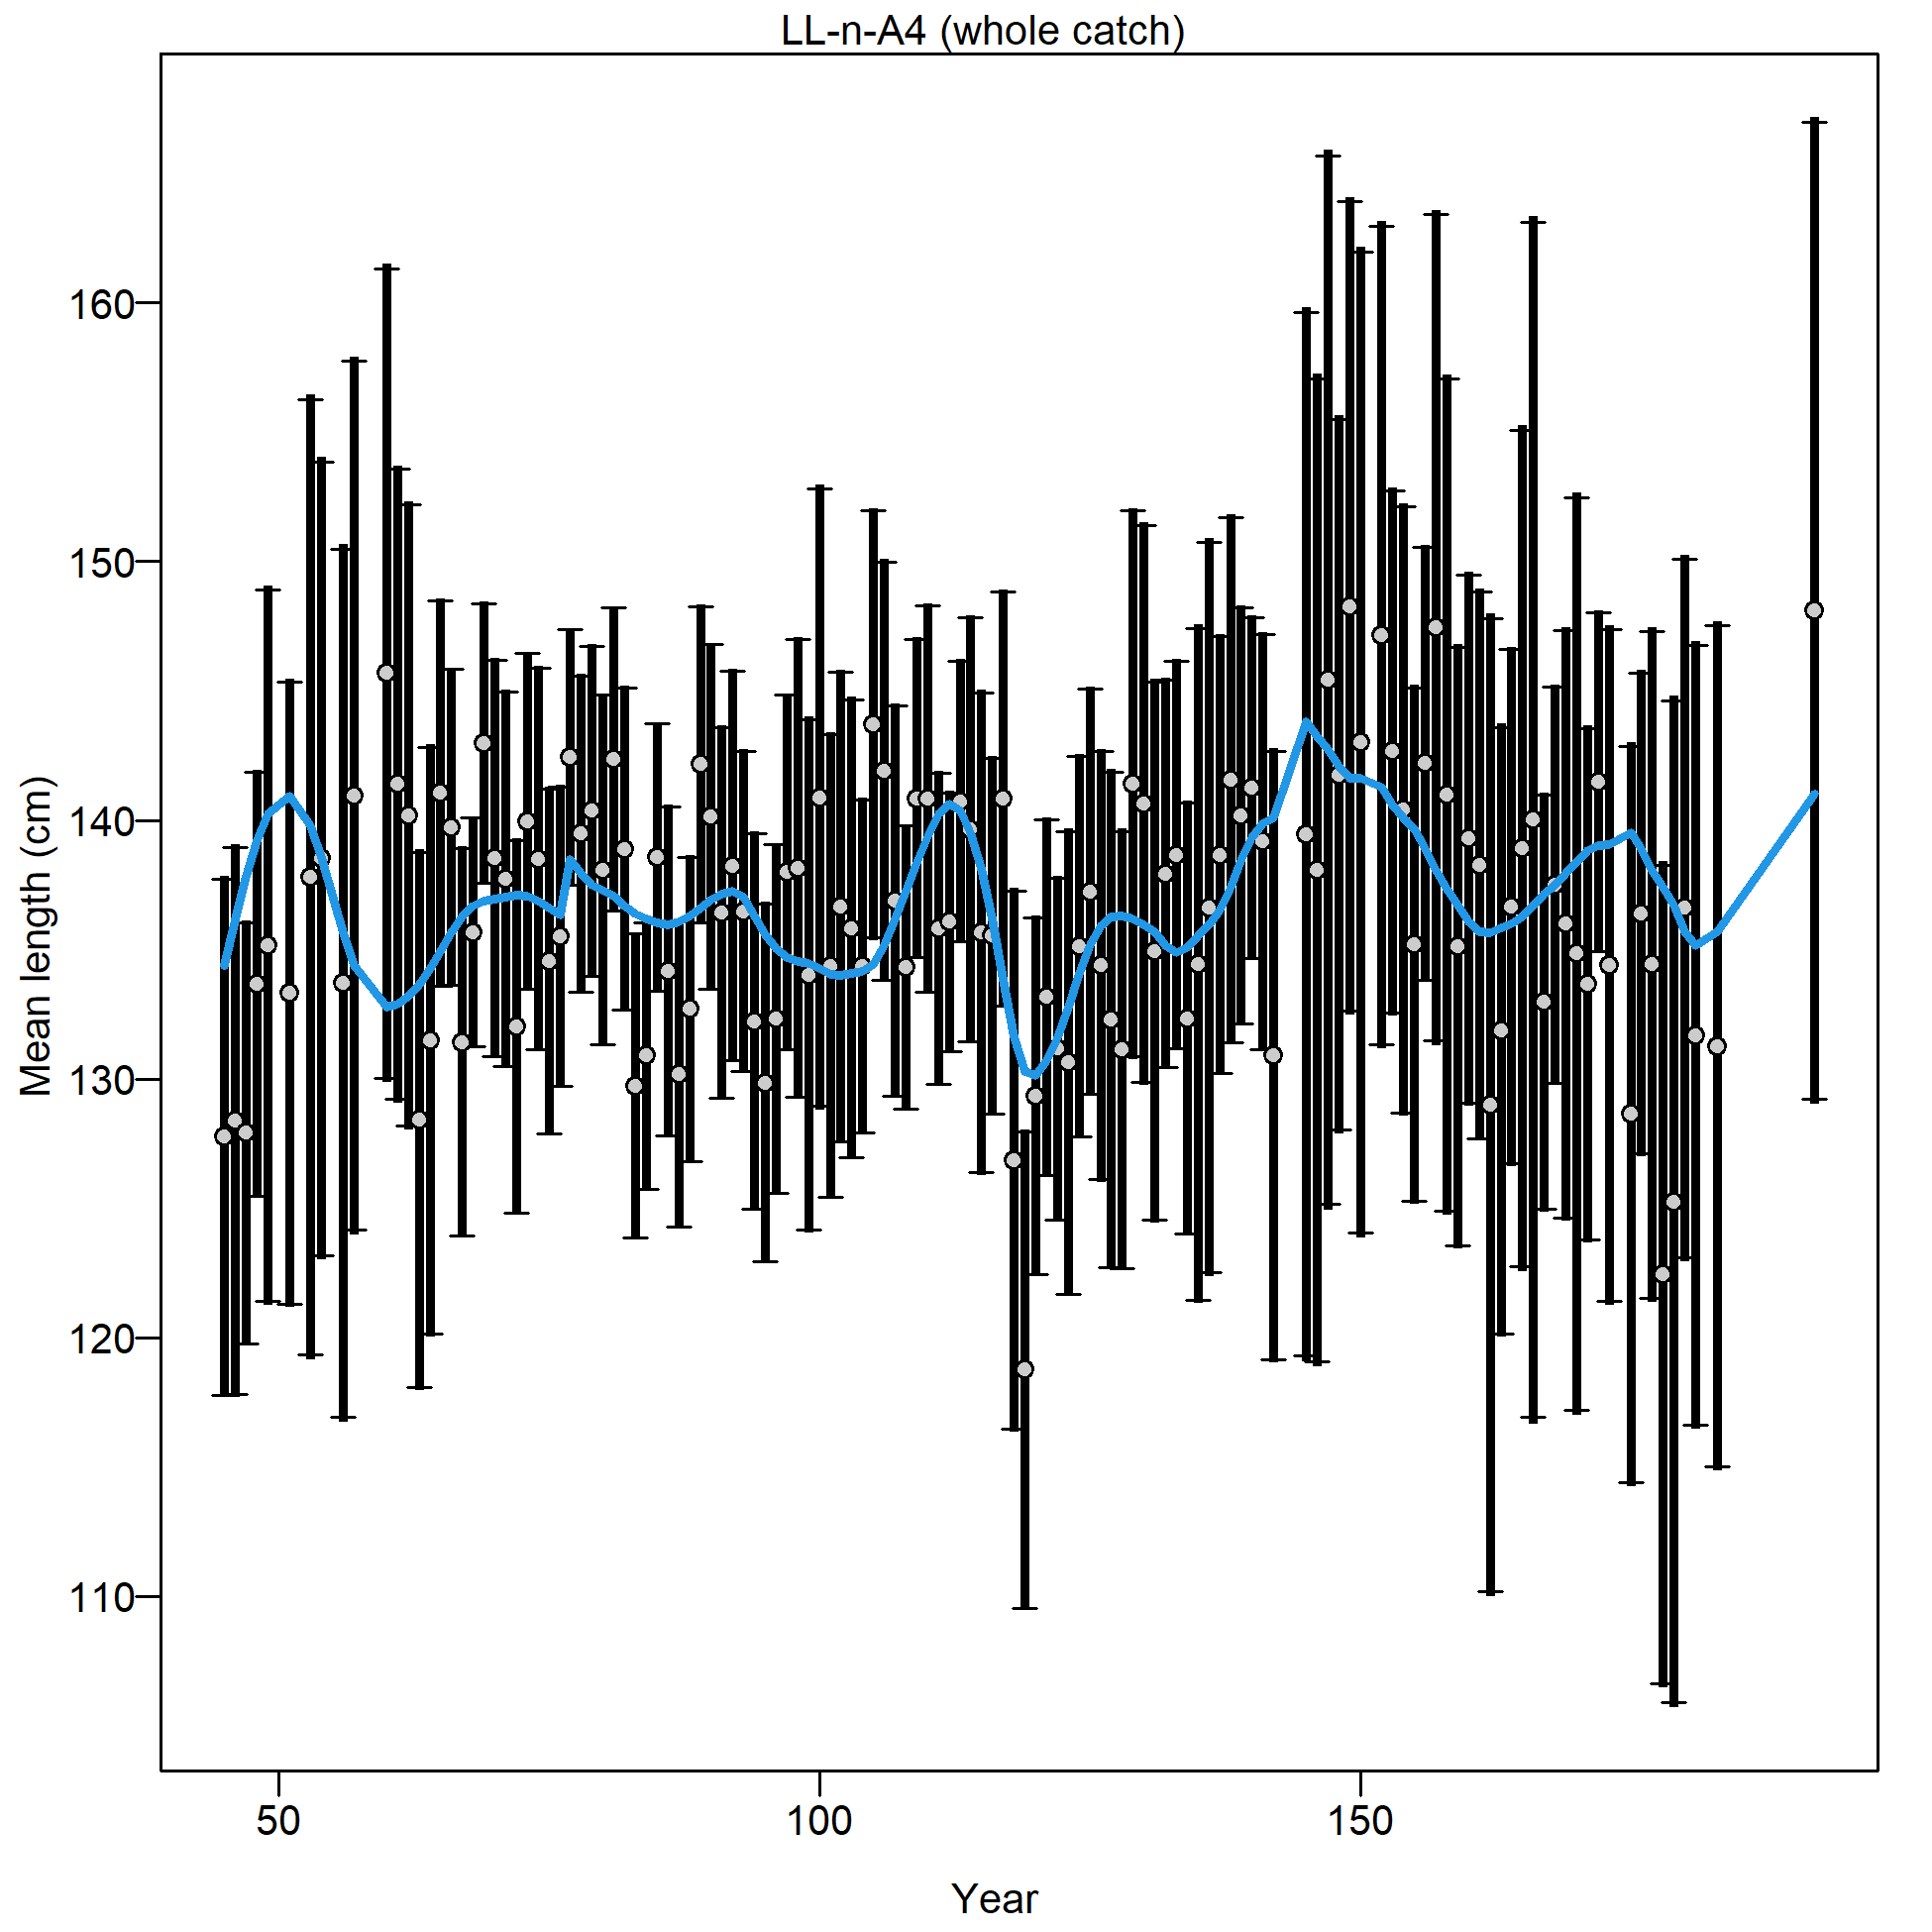
Mean size for LL-n-A4 with 95% confidence intervals based on current sample sizes.
Francis data weighting method TA1.8: thinner intervals (with capped ends) show result of further adjusting sample sizes based on suggested multiplier (with 95% interval) for size data from LL-n-A4:
1.0209 (0.8381-1.3473)
For more info, see Francis (2011).
file: comp_sizefit_data_weighting_TA1.8_LL-n-A4.png
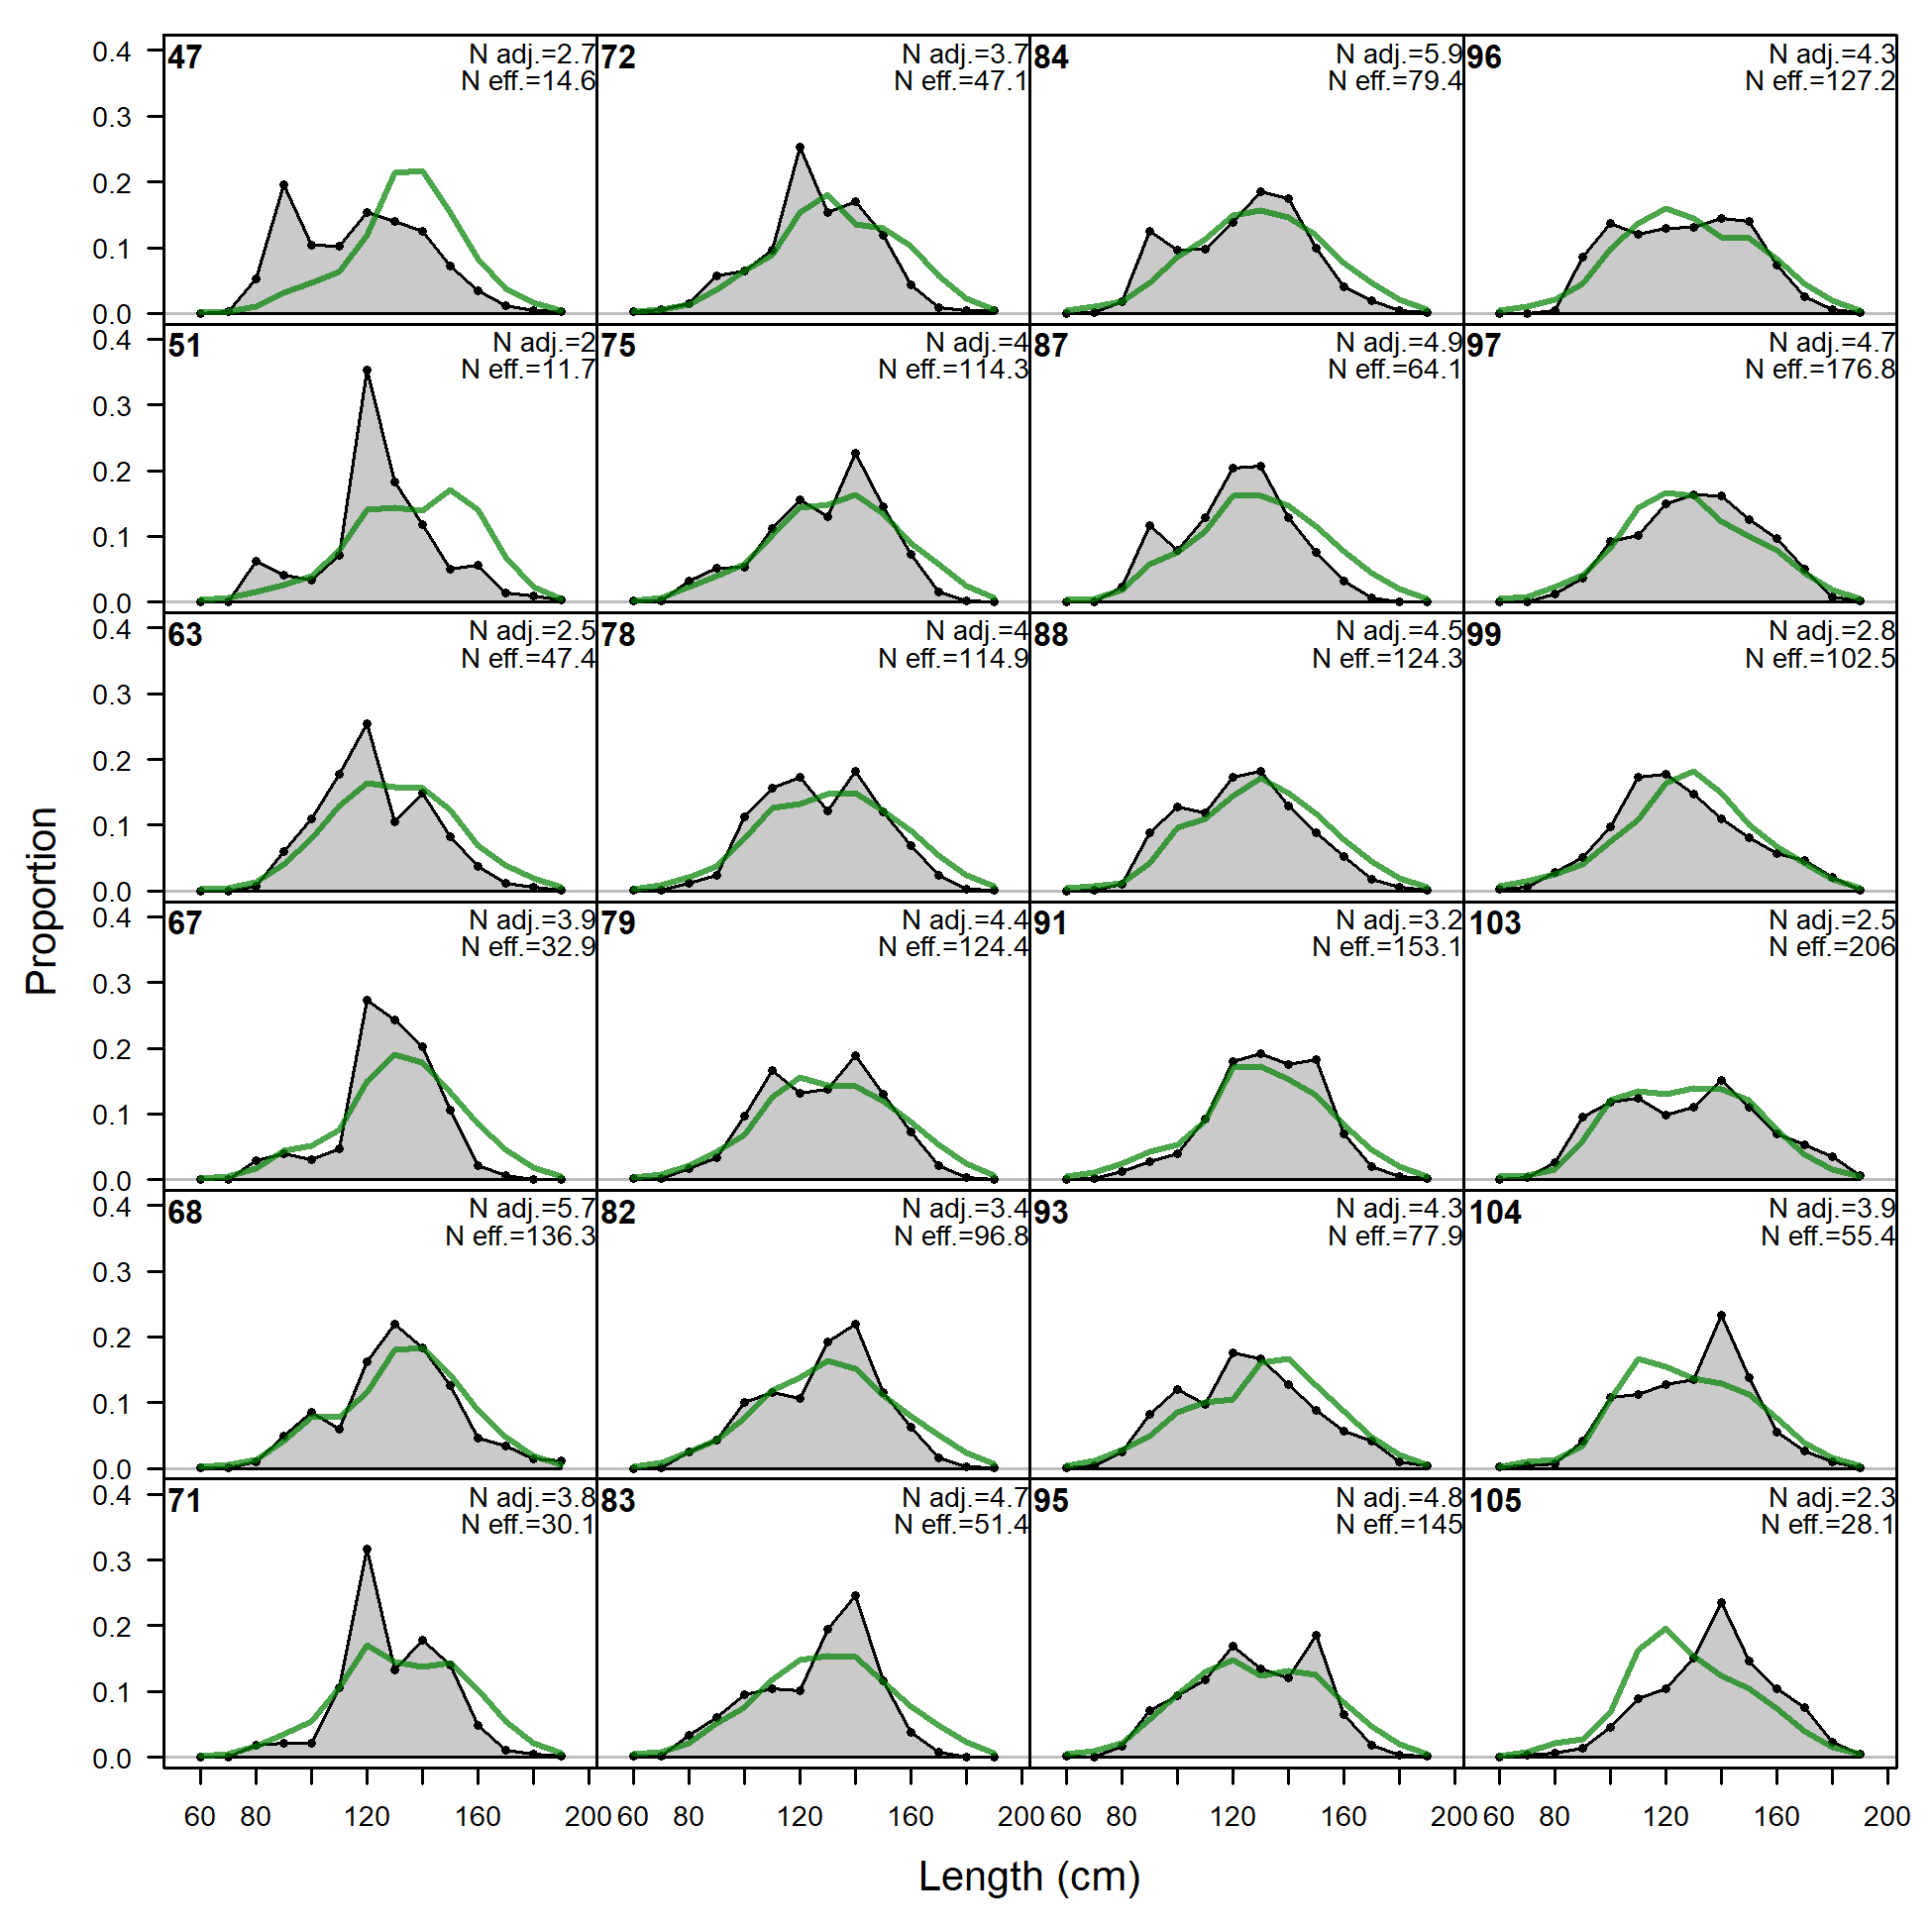
Size comps, whole catch, LL-n-A5 (plot 1 of 5).
'N adj.' is the input sample size after data-weighting adjustment. N eff. is the calculated effective sample size used in the McAllister-Ianelli tuning method.
file: comp_sizefit_flt5mkt0_page1.png
Size comps, whole catch, LL-n-A5 (plot 1 of 5).
'N adj.' is the input sample size after data-weighting adjustment. N eff. is the calculated effective sample size used in the McAllister-Ianelli tuning method. (plot 2 of 5)
file: comp_sizefit_flt5mkt0_page2.png
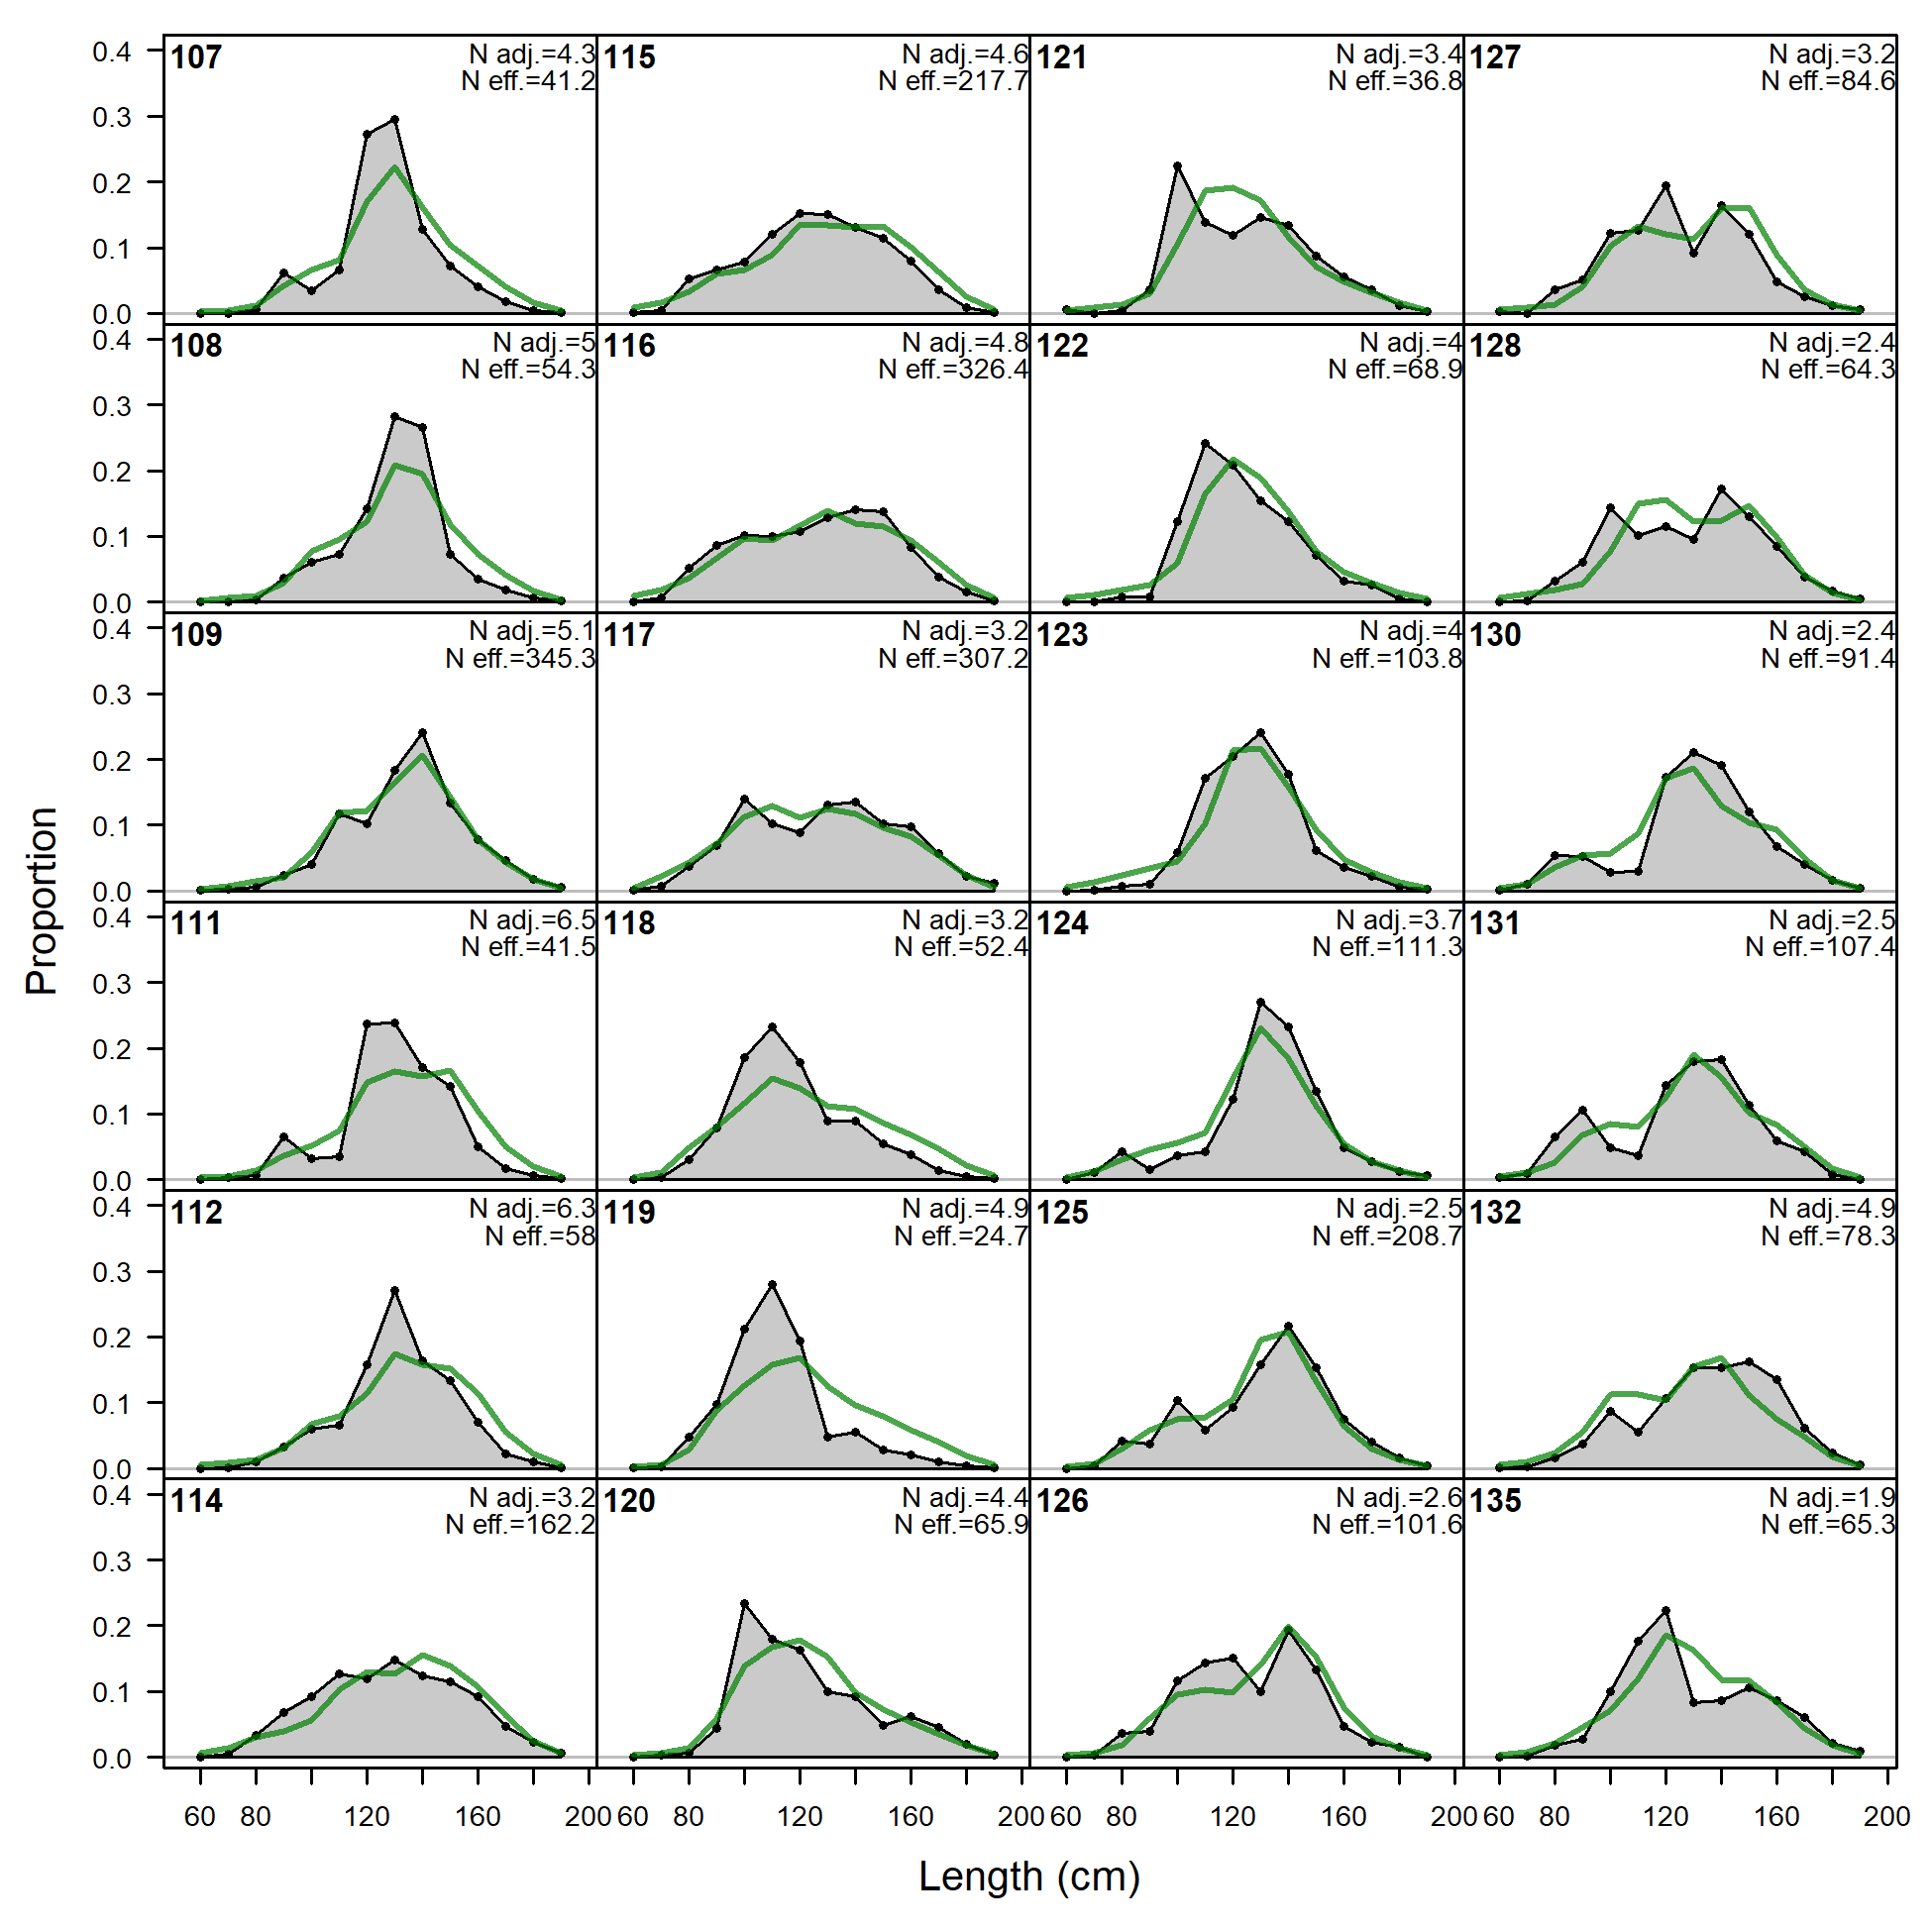
Size comps, whole catch, LL-n-A5 (plot 1 of 5).
'N adj.' is the input sample size after data-weighting adjustment. N eff. is the calculated effective sample size used in the McAllister-Ianelli tuning method. (plot 2 of 5) (plot 3 of 5)
file: comp_sizefit_flt5mkt0_page3.png
Size comps, whole catch, LL-n-A5 (plot 1 of 5).
'N adj.' is the input sample size after data-weighting adjustment. N eff. is the calculated effective sample size used in the McAllister-Ianelli tuning method. (plot 2 of 5) (plot 3 of 5) (plot 4 of 5)
file: comp_sizefit_flt5mkt0_page4.png
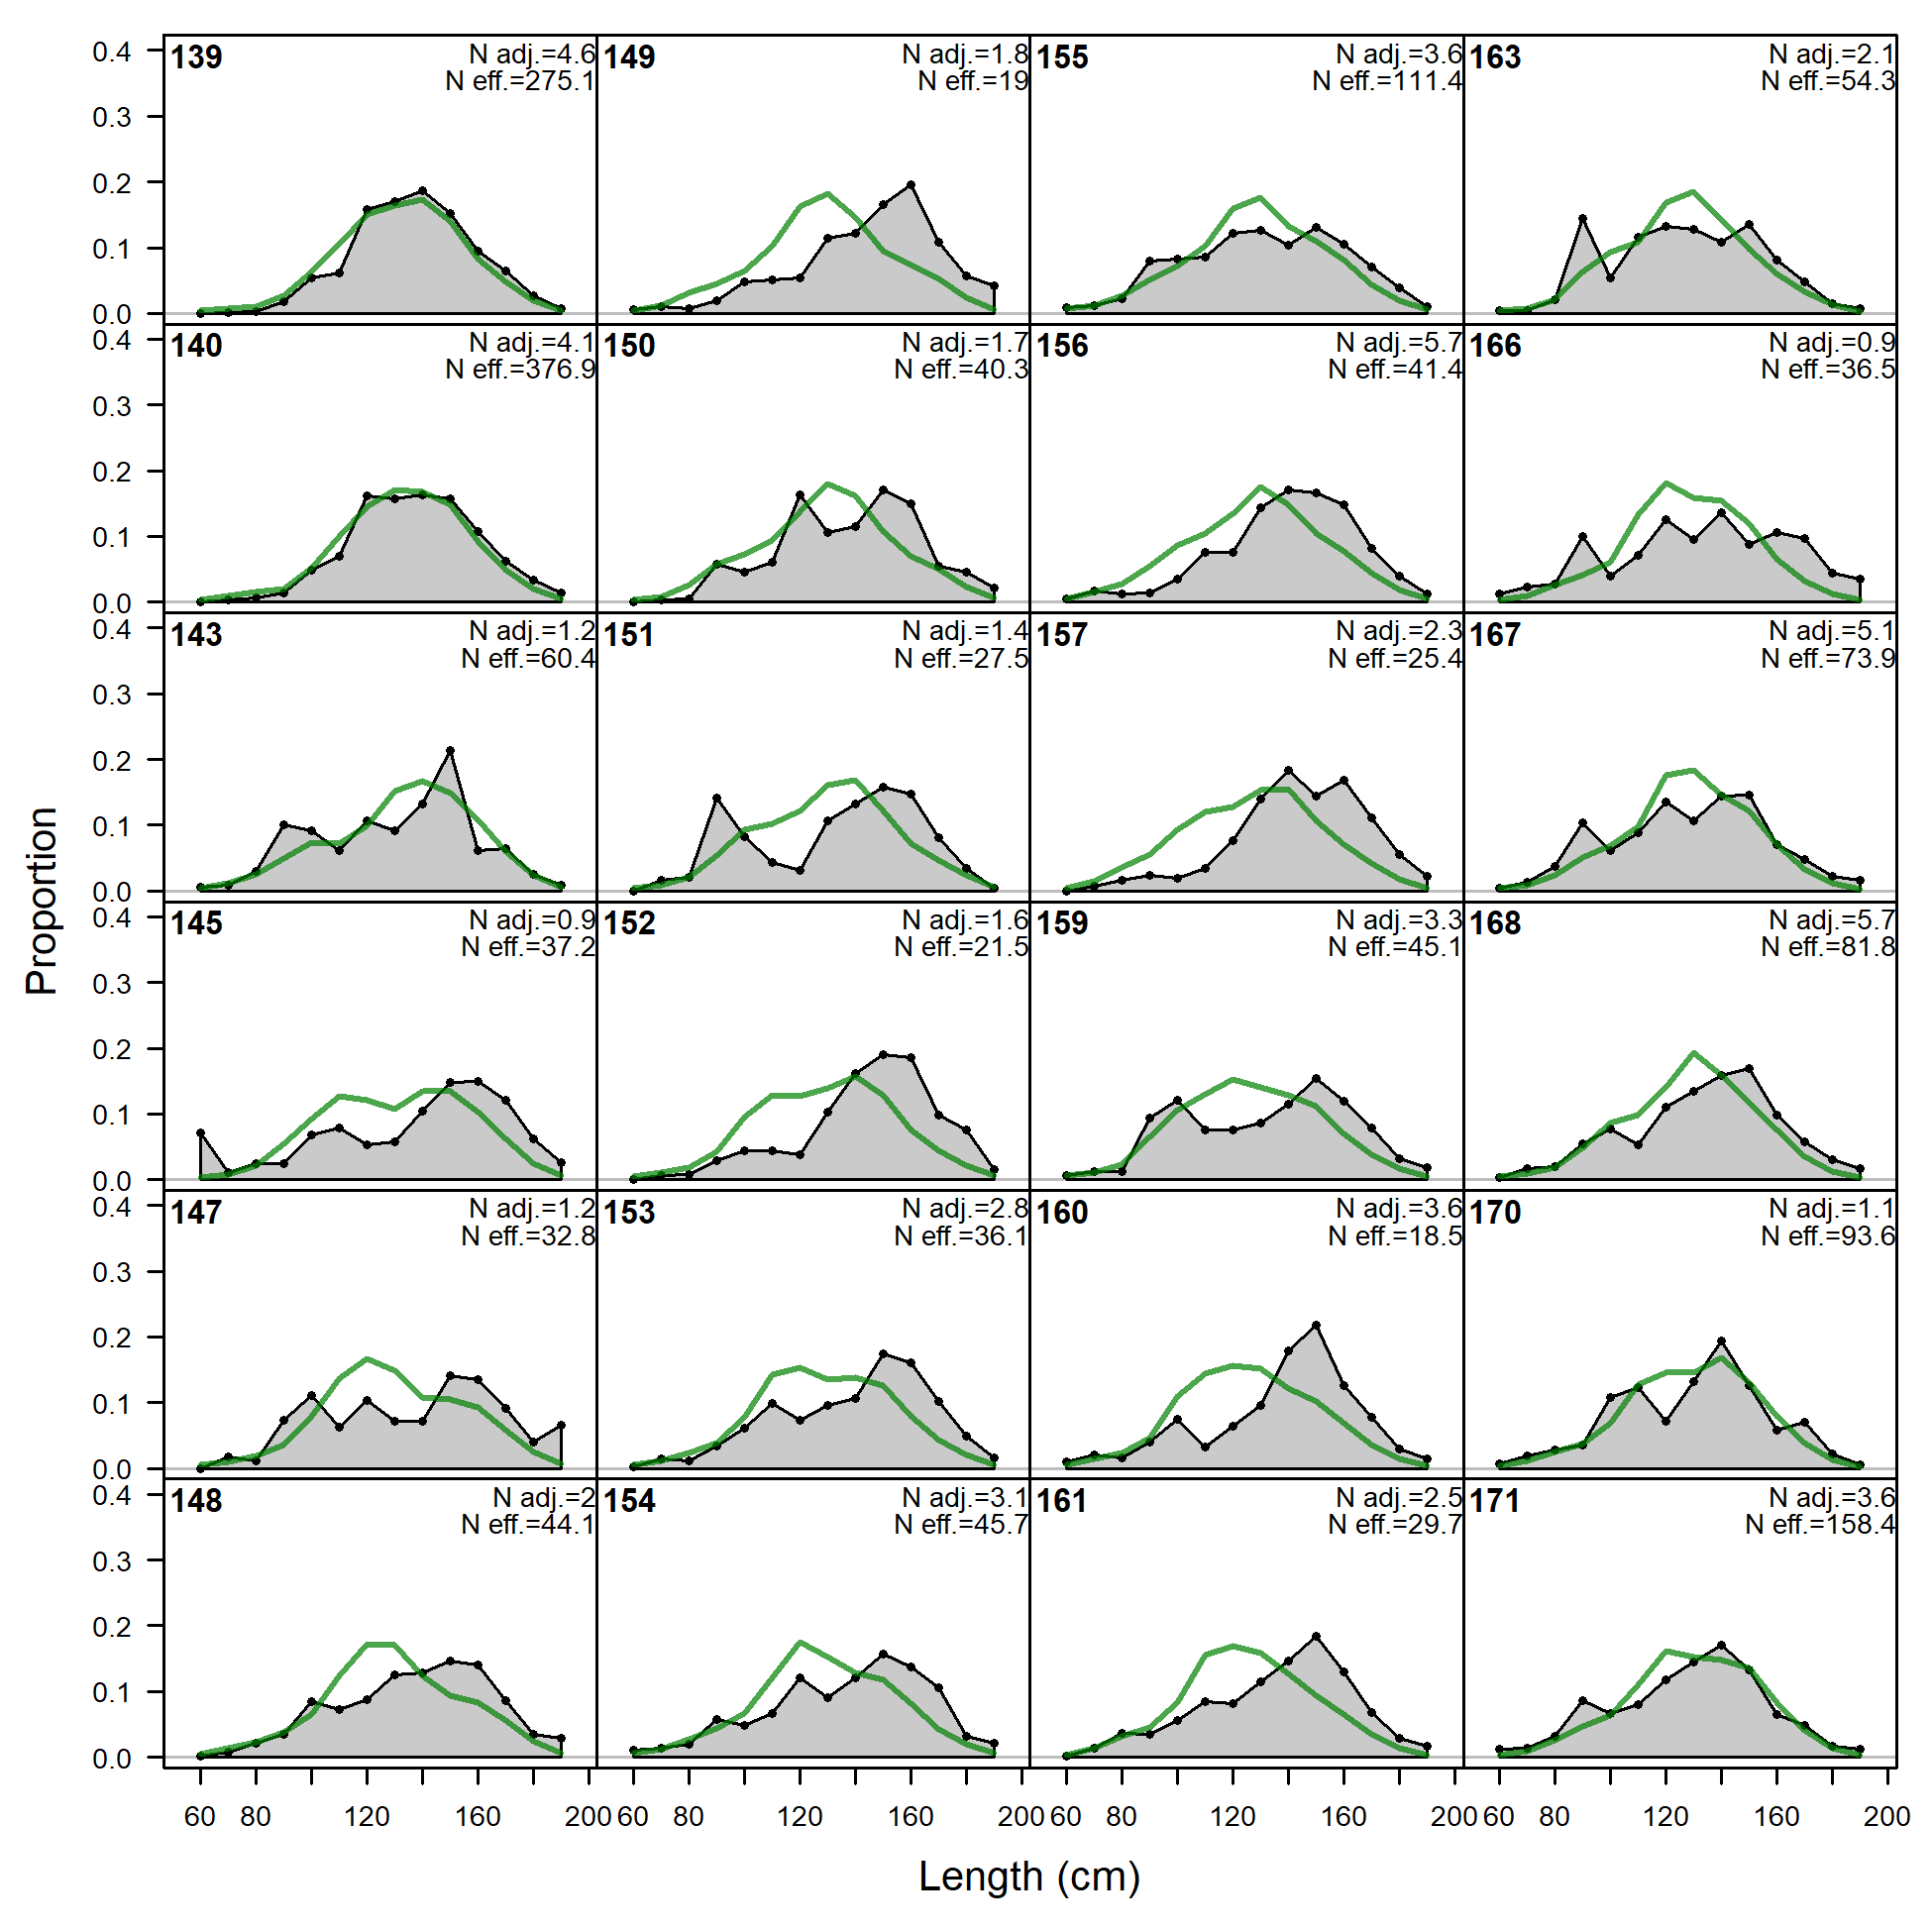
Size comps, whole catch, LL-n-A5 (plot 1 of 5).
'N adj.' is the input sample size after data-weighting adjustment. N eff. is the calculated effective sample size used in the McAllister-Ianelli tuning method. (plot 2 of 5) (plot 3 of 5) (plot 4 of 5) (plot 5 of 5)
file: comp_sizefit_flt5mkt0_page5.png
Pearson residuals, whole catch, LL-n-A5 (max=7.32) (plot 5 of 5)
Closed bubbles are positive residuals (observed > expected) and open bubbles are negative residuals (observed < expected).
file: comp_sizefit_residsflt5mkt0_page5.png
N-EffN comparison, Size comps, whole catch, LL-n-A5
file: comp_sizefit_sampsize_flt5mkt0.png
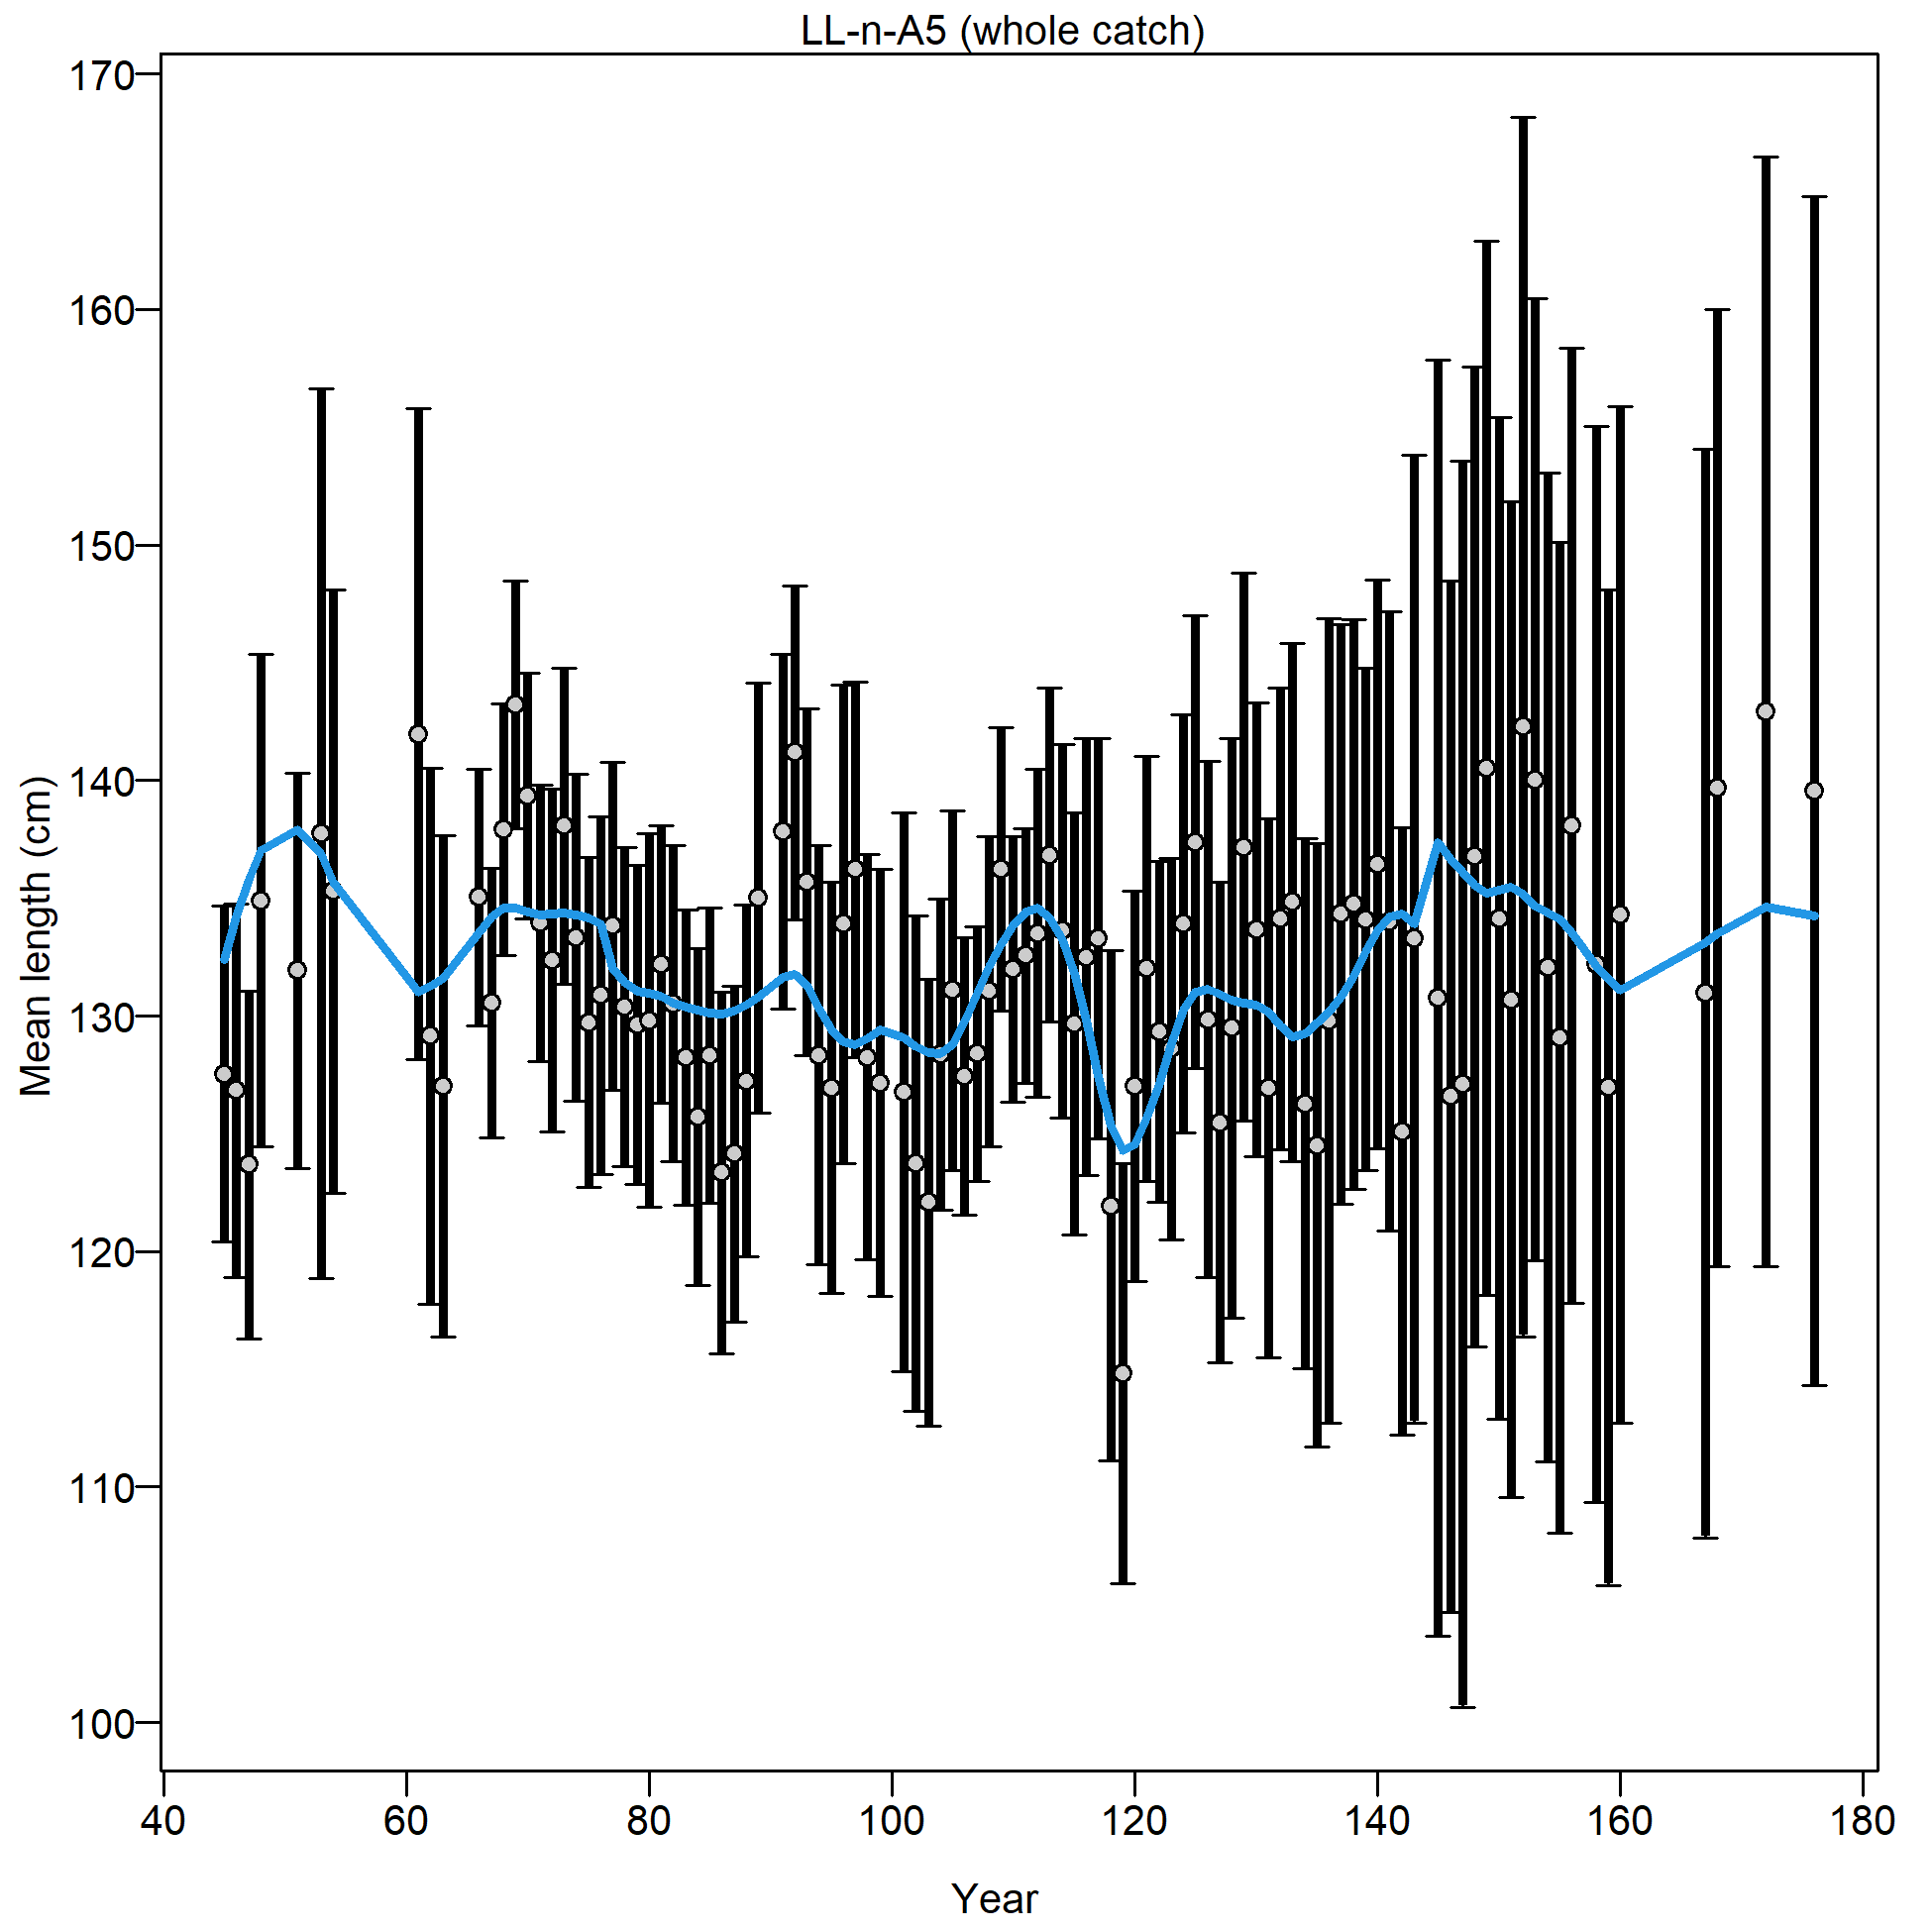
Mean size for LL-n-A5 with 95% confidence intervals based on current sample sizes.
Francis data weighting method TA1.8: thinner intervals (with capped ends) show result of further adjusting sample sizes based on suggested multiplier (with 95% interval) for size data from LL-n-A5:
0.9952 (0.7336-1.4328)
For more info, see Francis (2011).
file: comp_sizefit_data_weighting_TA1.8_LL-n-A5.png
Size comps, whole catch, LL-n-A6 (plot 1 of 4).
'N adj.' is the input sample size after data-weighting adjustment. N eff. is the calculated effective sample size used in the McAllister-Ianelli tuning method.
file: comp_sizefit_flt6mkt0_page1.png
Size comps, whole catch, LL-n-A6 (plot 1 of 4).
'N adj.' is the input sample size after data-weighting adjustment. N eff. is the calculated effective sample size used in the McAllister-Ianelli tuning method. (plot 2 of 4)
file: comp_sizefit_flt6mkt0_page2.png
Size comps, whole catch, LL-n-A6 (plot 1 of 4).
'N adj.' is the input sample size after data-weighting adjustment. N eff. is the calculated effective sample size used in the McAllister-Ianelli tuning method. (plot 2 of 4) (plot 3 of 4)
file: comp_sizefit_flt6mkt0_page3.png
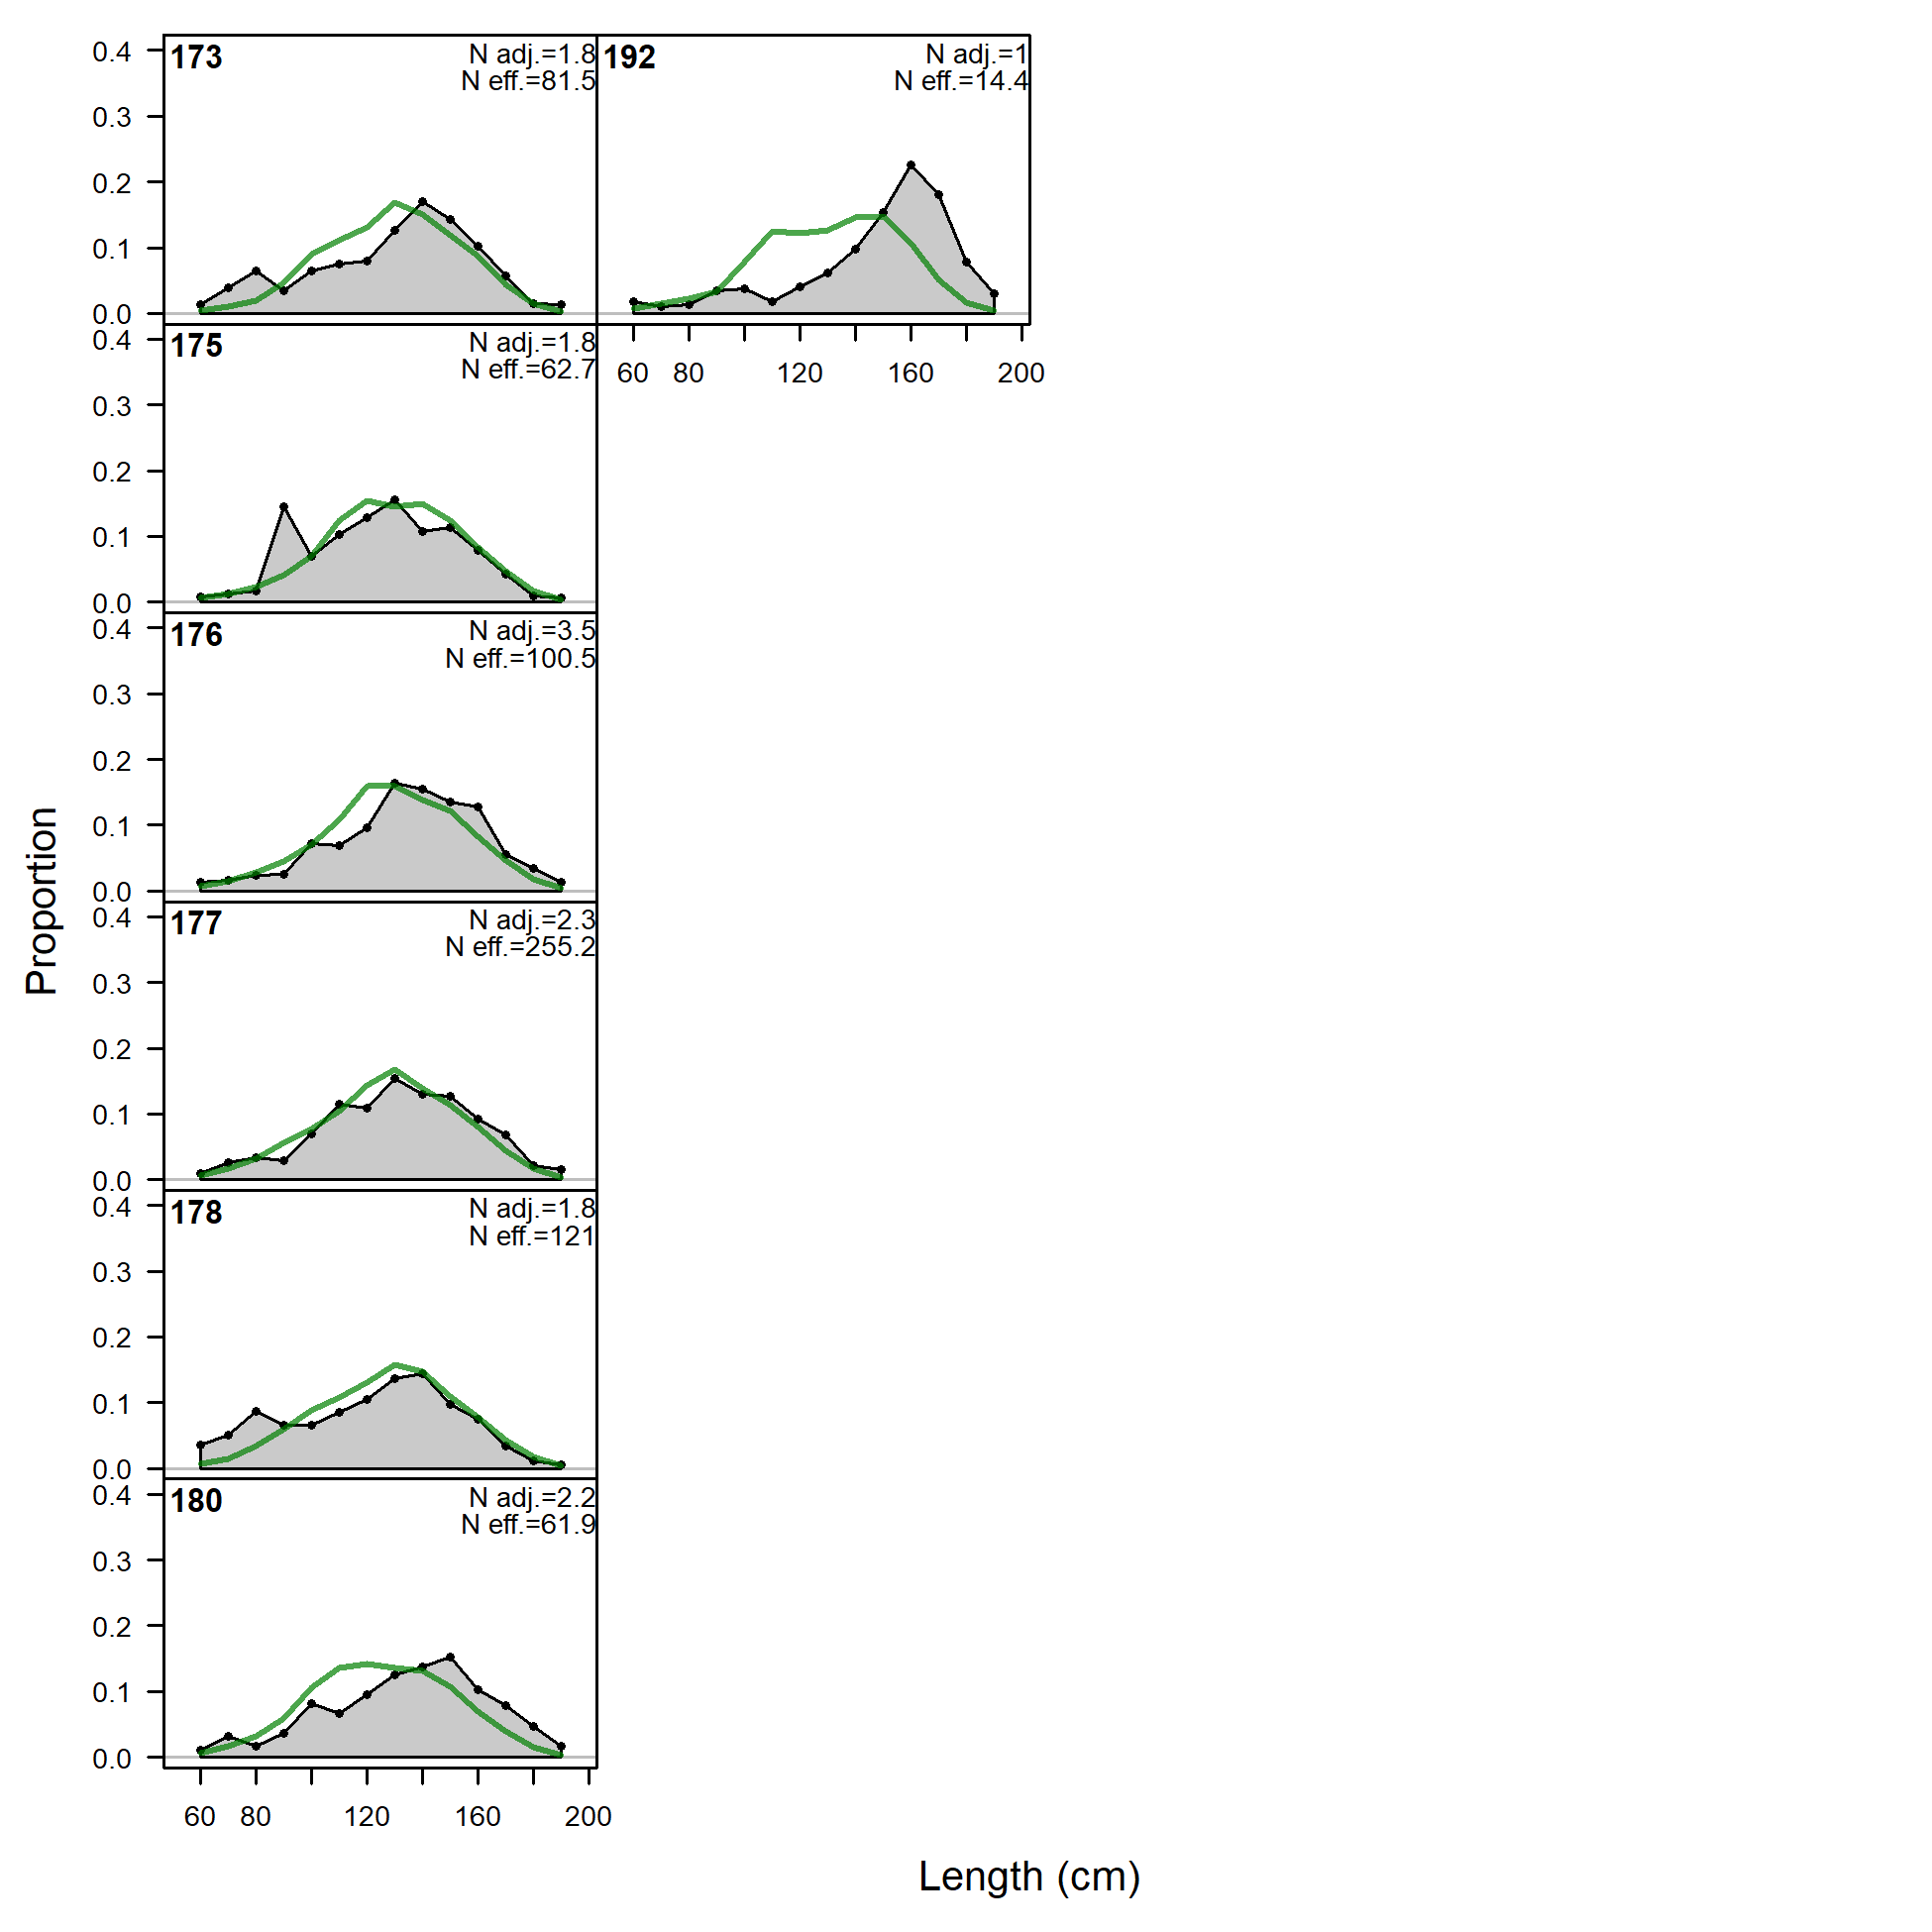
Size comps, whole catch, LL-n-A6 (plot 1 of 4).
'N adj.' is the input sample size after data-weighting adjustment. N eff. is the calculated effective sample size used in the McAllister-Ianelli tuning method. (plot 2 of 4) (plot 3 of 4) (plot 4 of 4)
file: comp_sizefit_flt6mkt0_page4.png
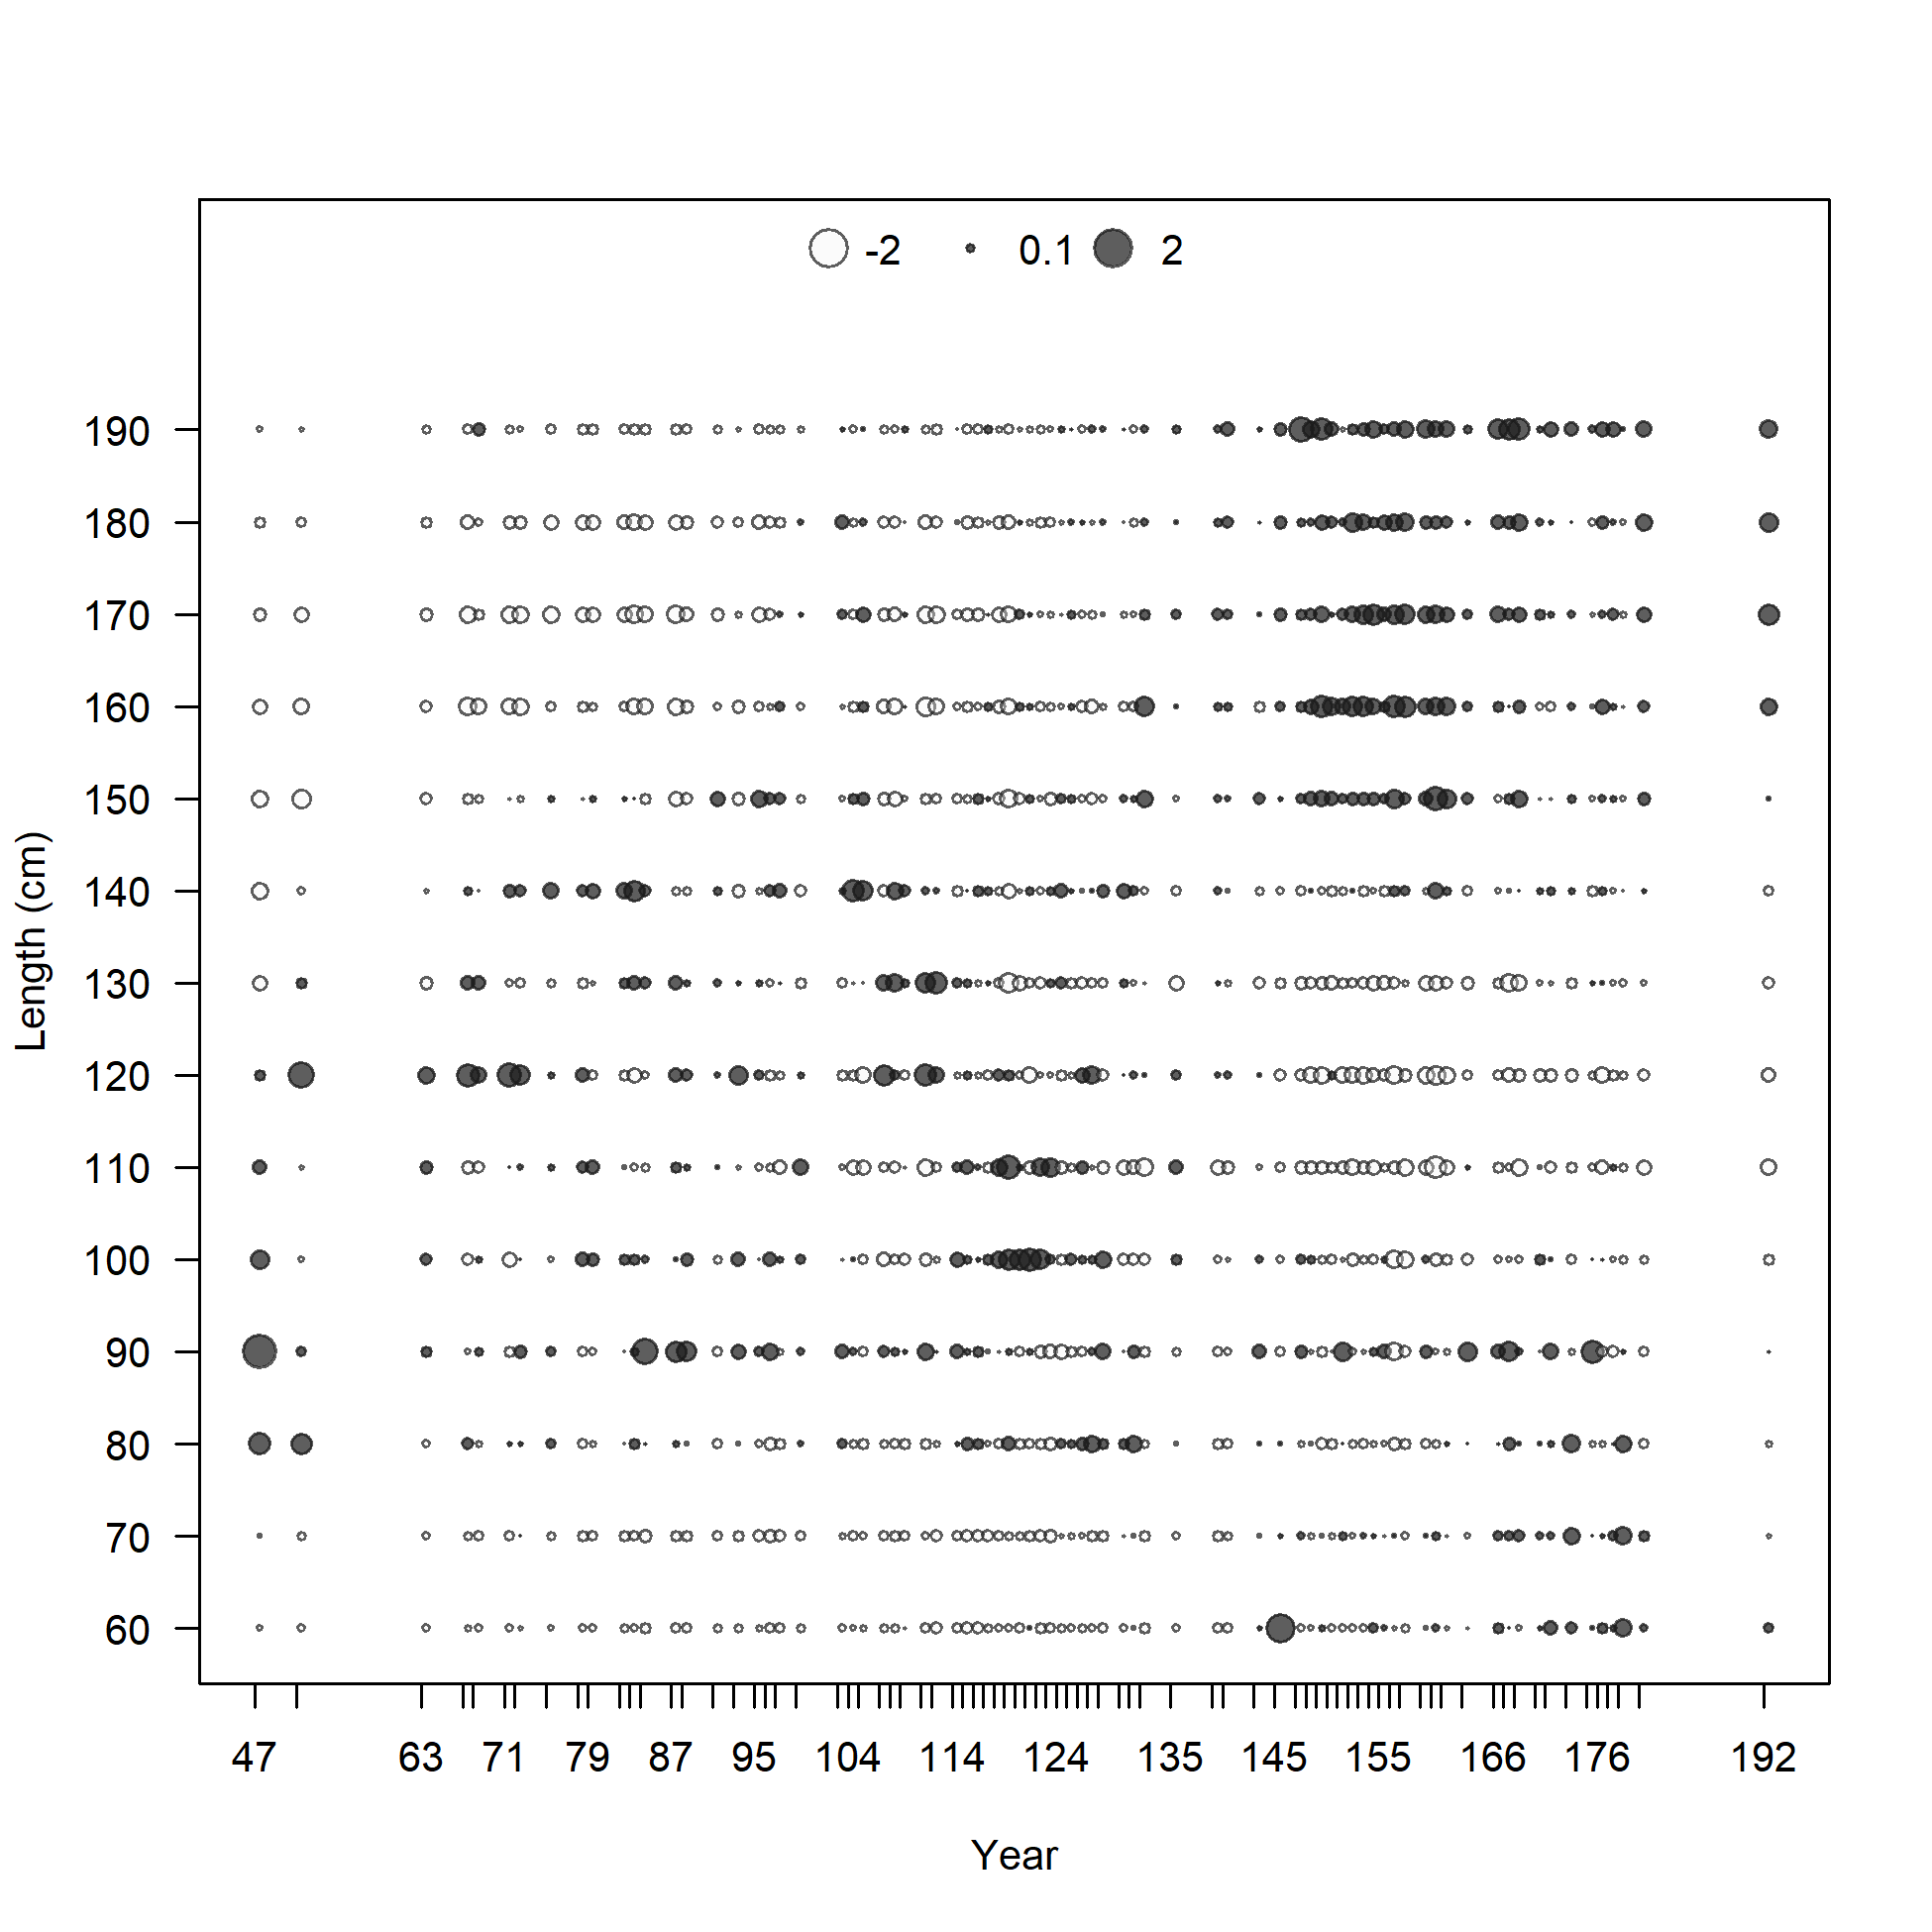
Pearson residuals, whole catch, LL-n-A6 (max=1.55) (plot 4 of 4)
Closed bubbles are positive residuals (observed > expected) and open bubbles are negative residuals (observed < expected).
file: comp_sizefit_residsflt6mkt0_page4.png
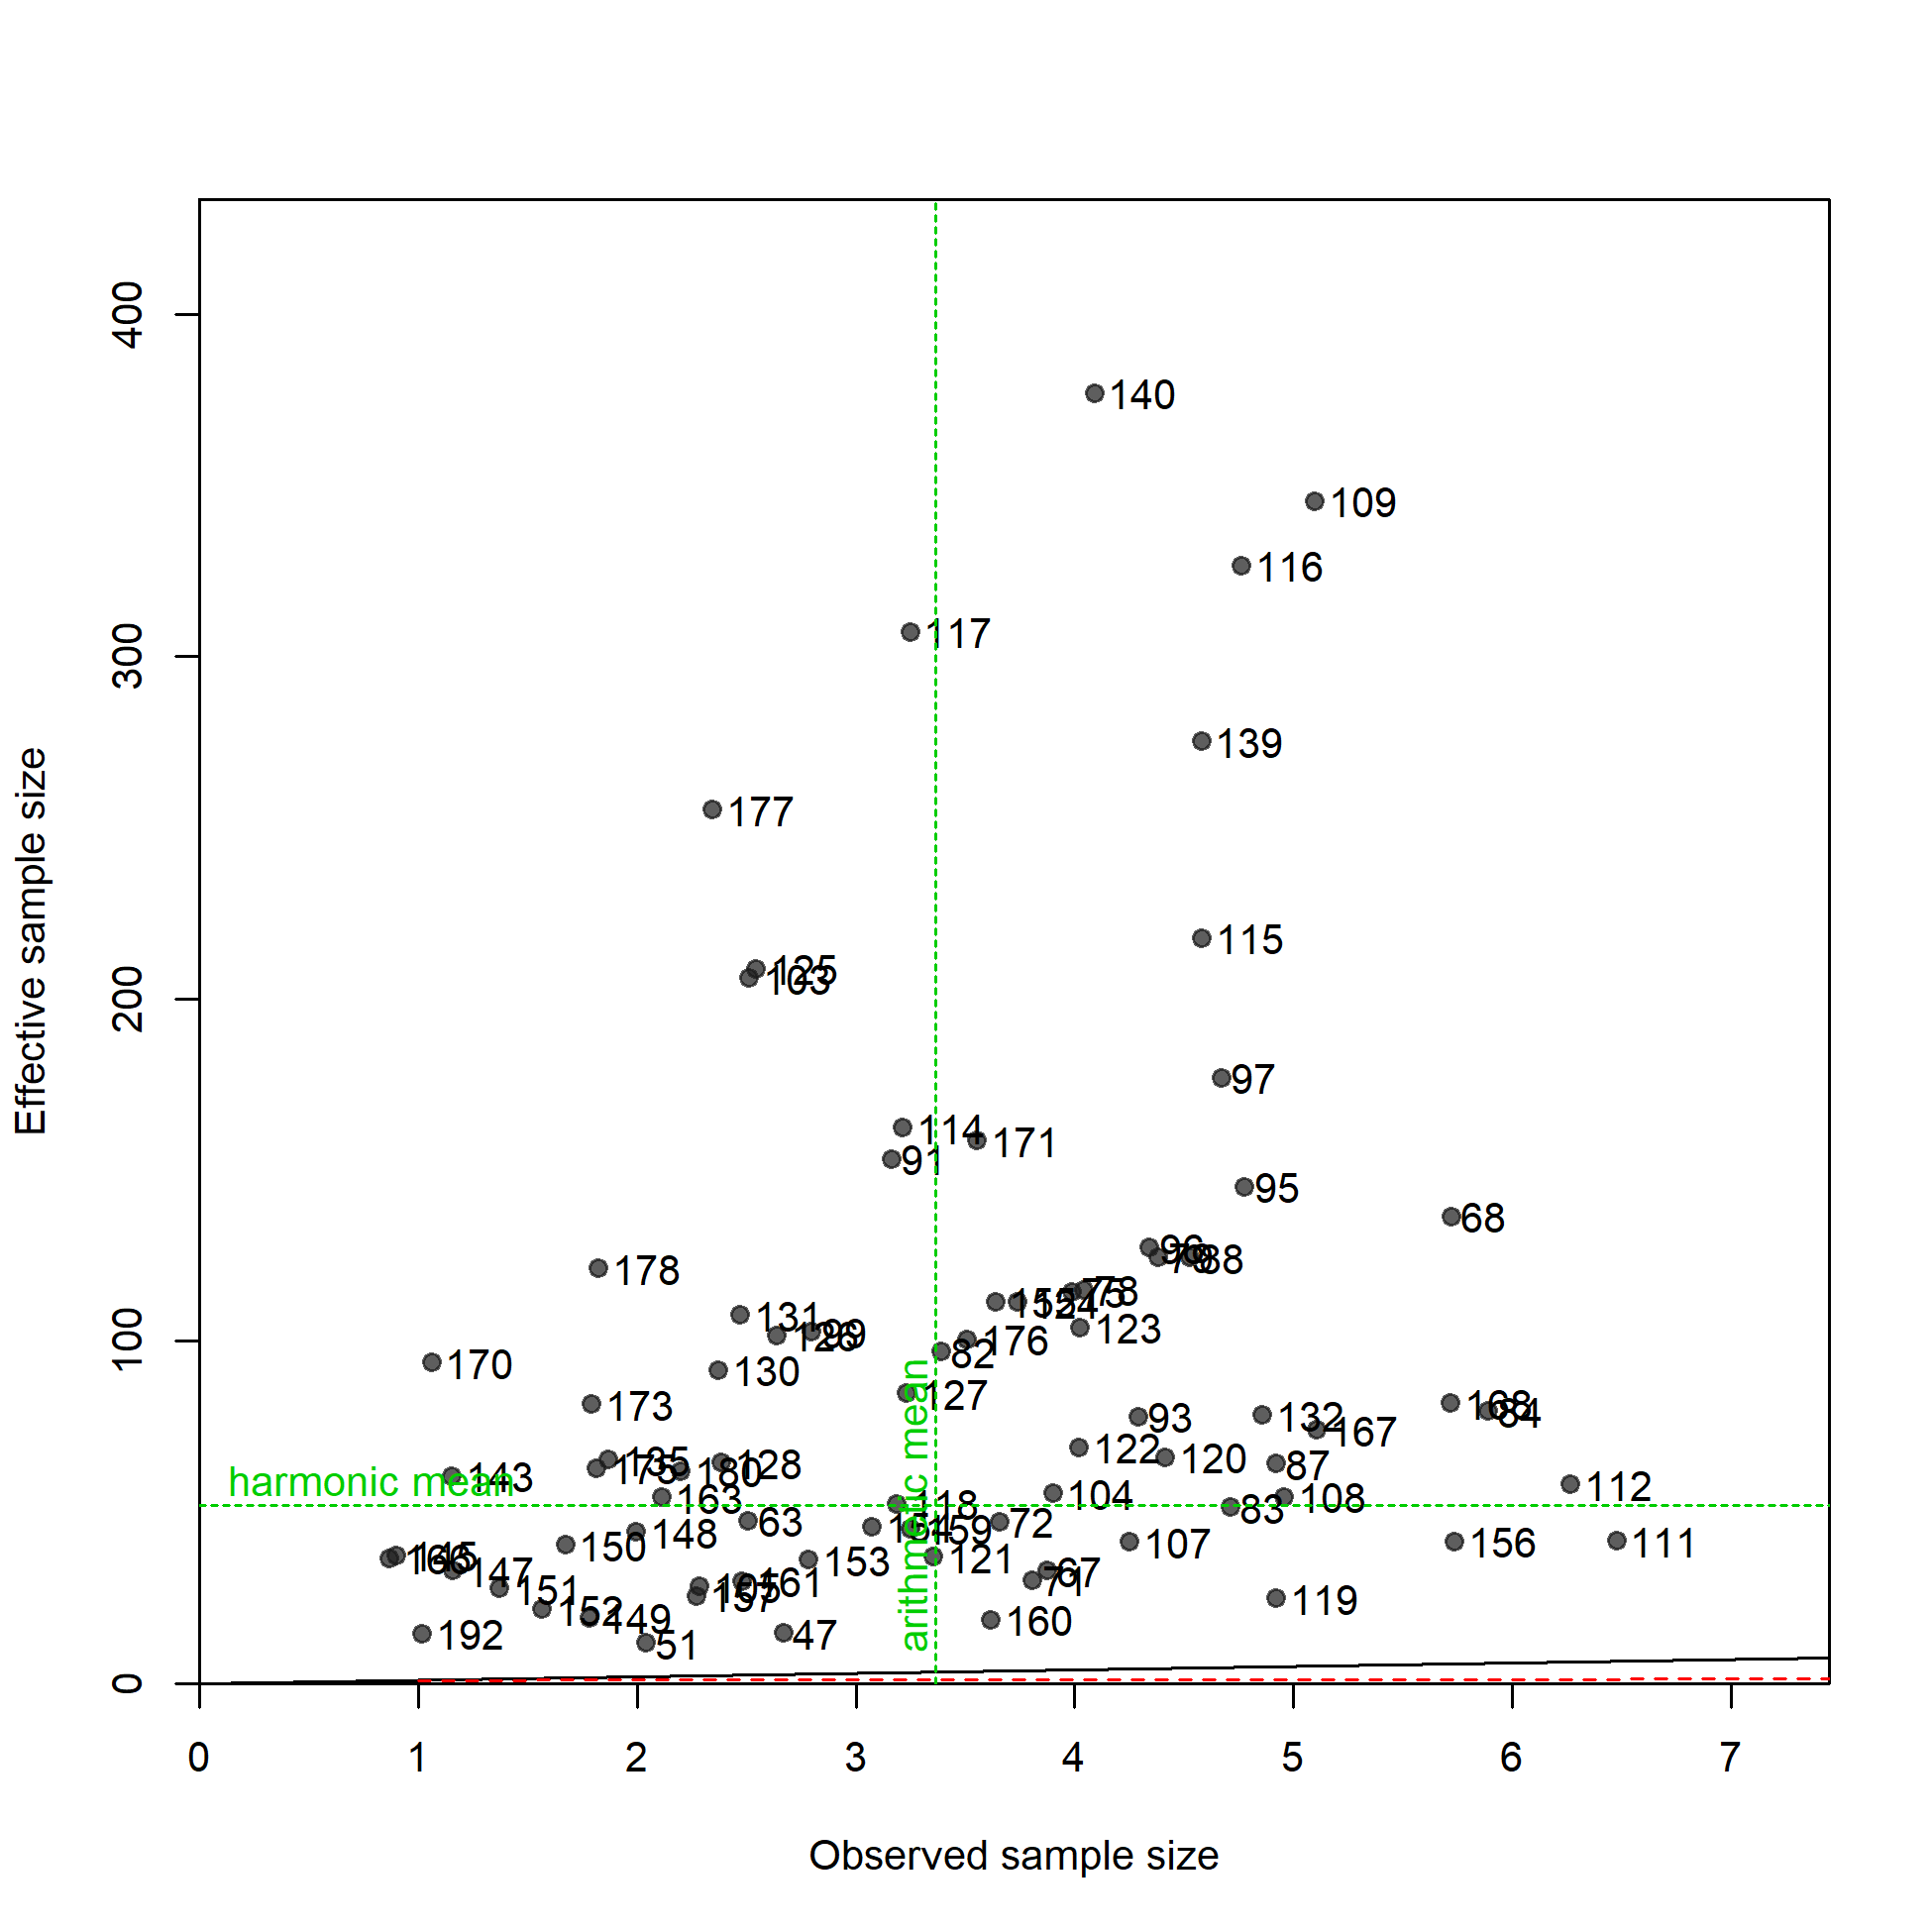
N-EffN comparison, Size comps, whole catch, LL-n-A6
file: comp_sizefit_sampsize_flt6mkt0.png
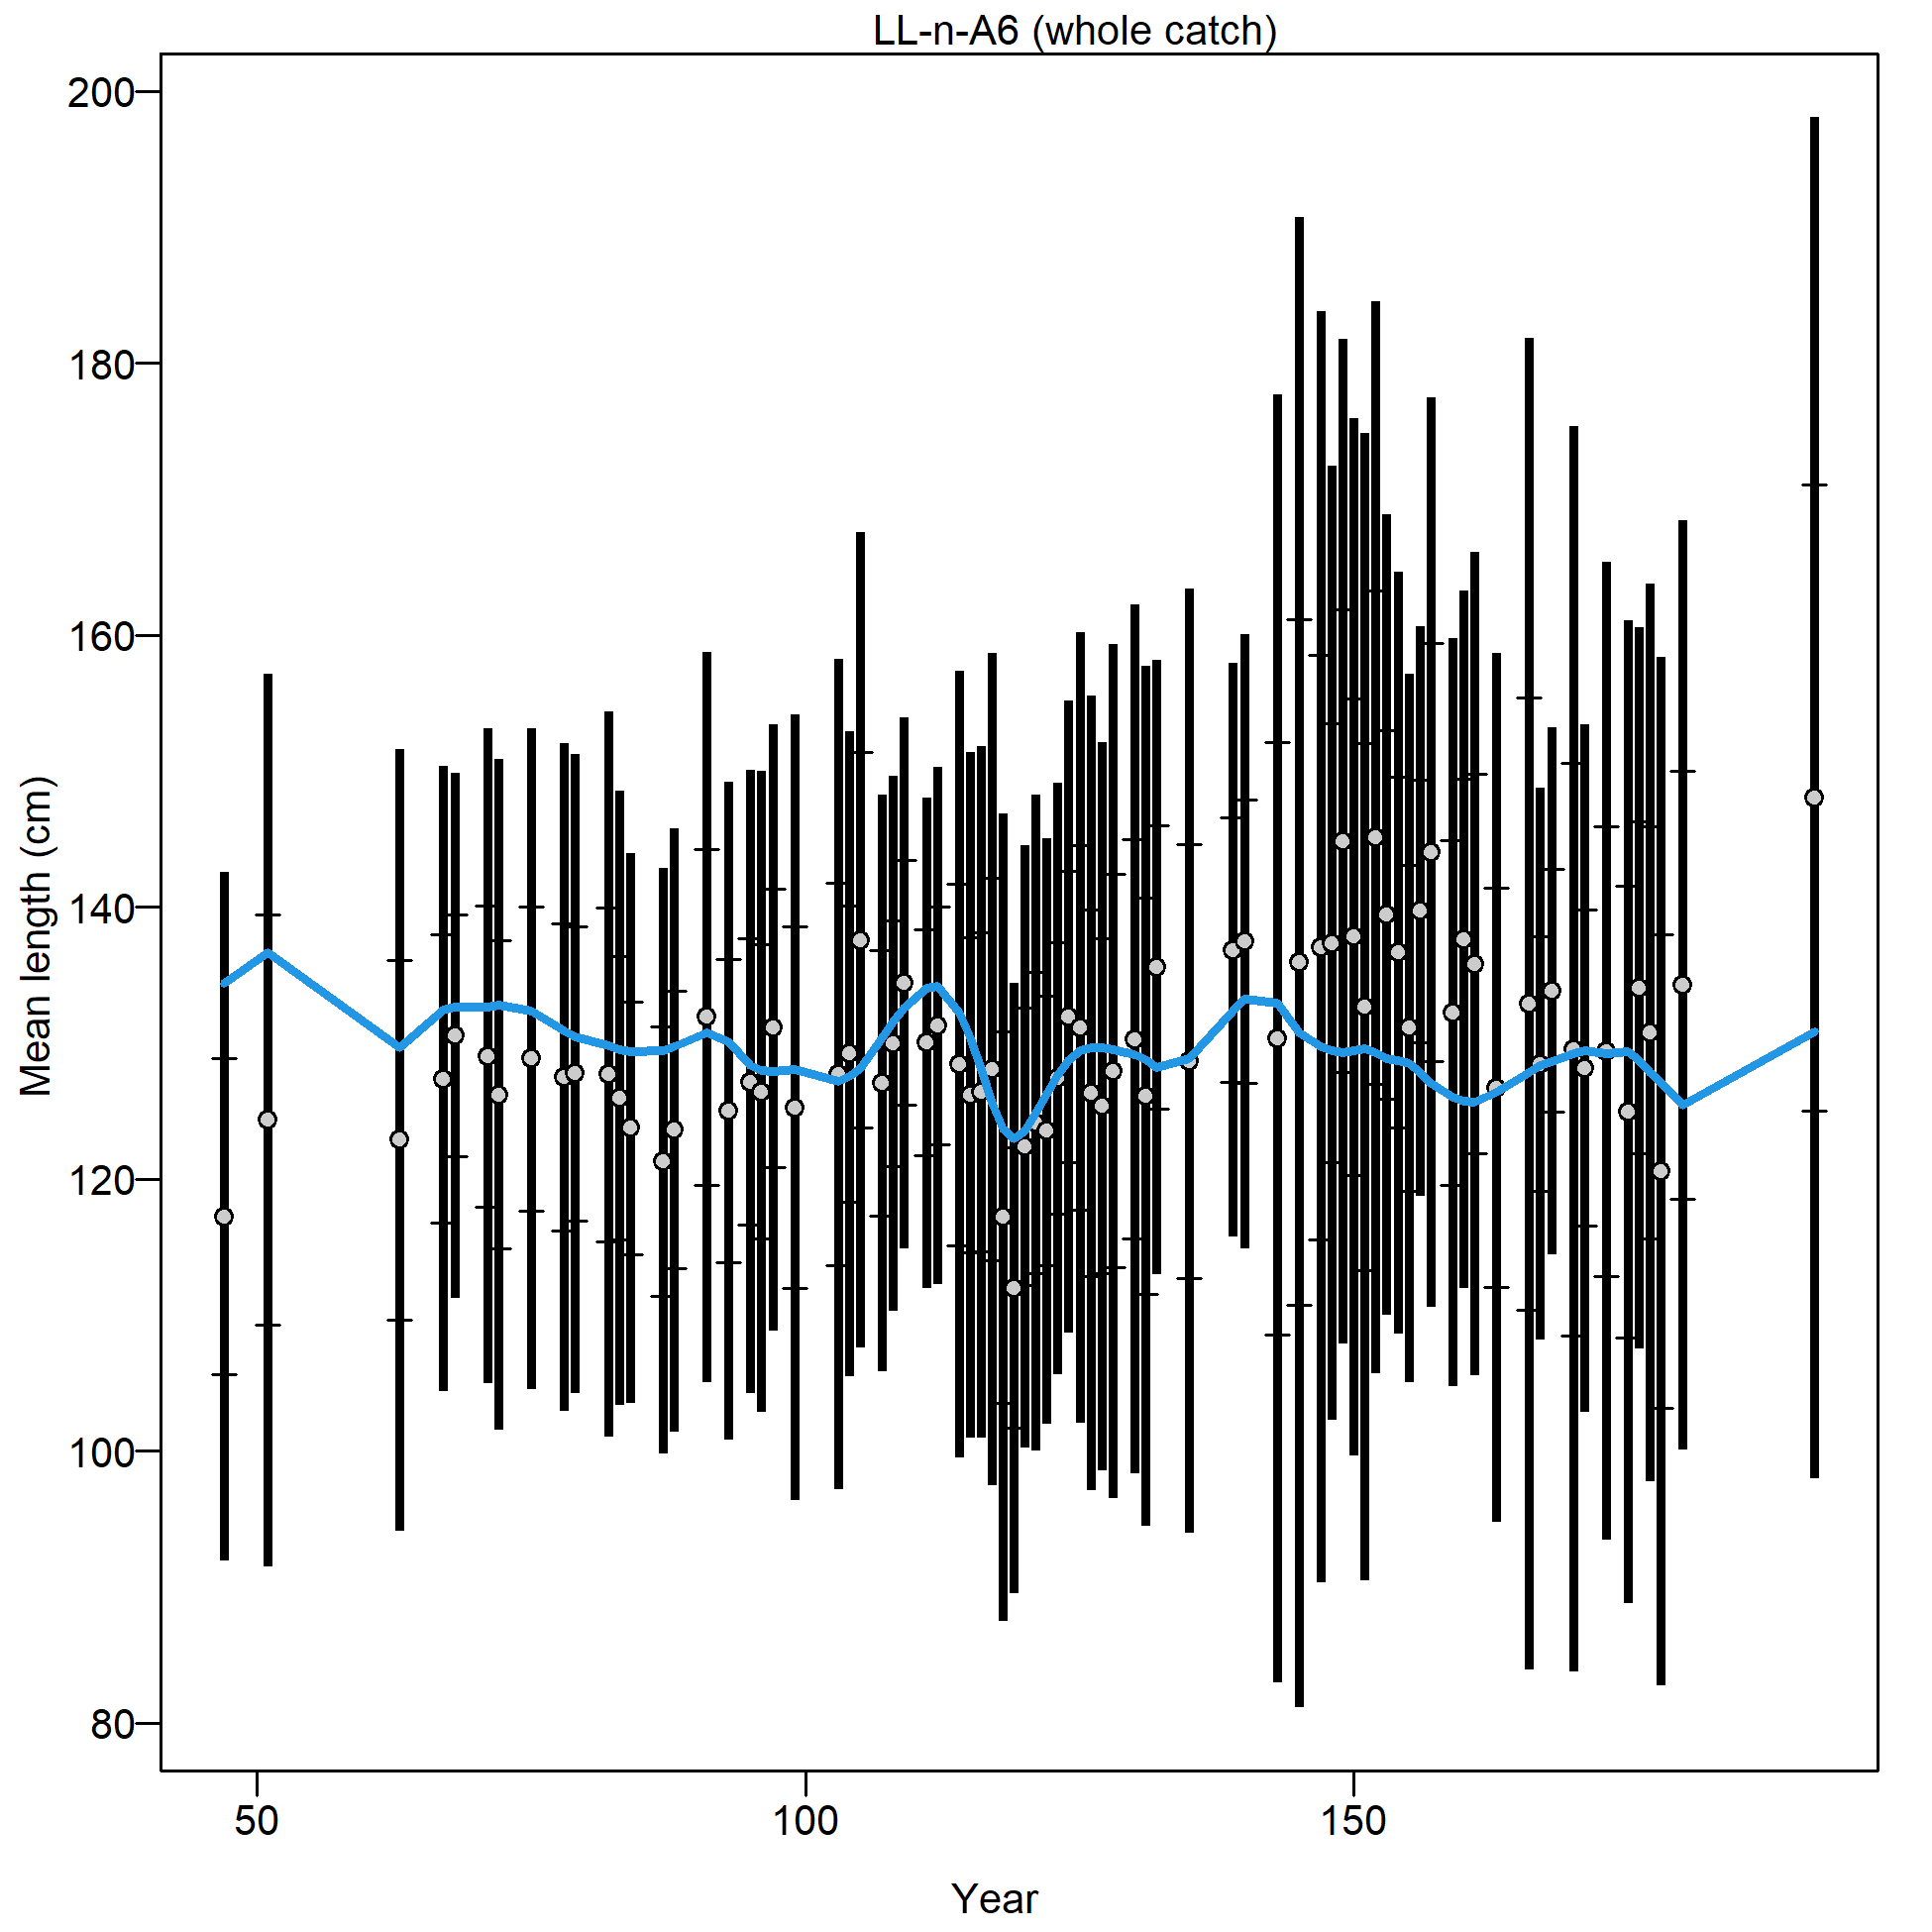
Mean size for LL-n-A6 with 95% confidence intervals based on current sample sizes.
Francis data weighting method TA1.8: thinner intervals (with capped ends) show result of further adjusting sample sizes based on suggested multiplier (with 95% interval) for size data from LL-n-A6:
4.7247 (3.5044-7.0914)
For more info, see Francis (2011).
file: comp_sizefit_data_weighting_TA1.8_LL-n-A6.png
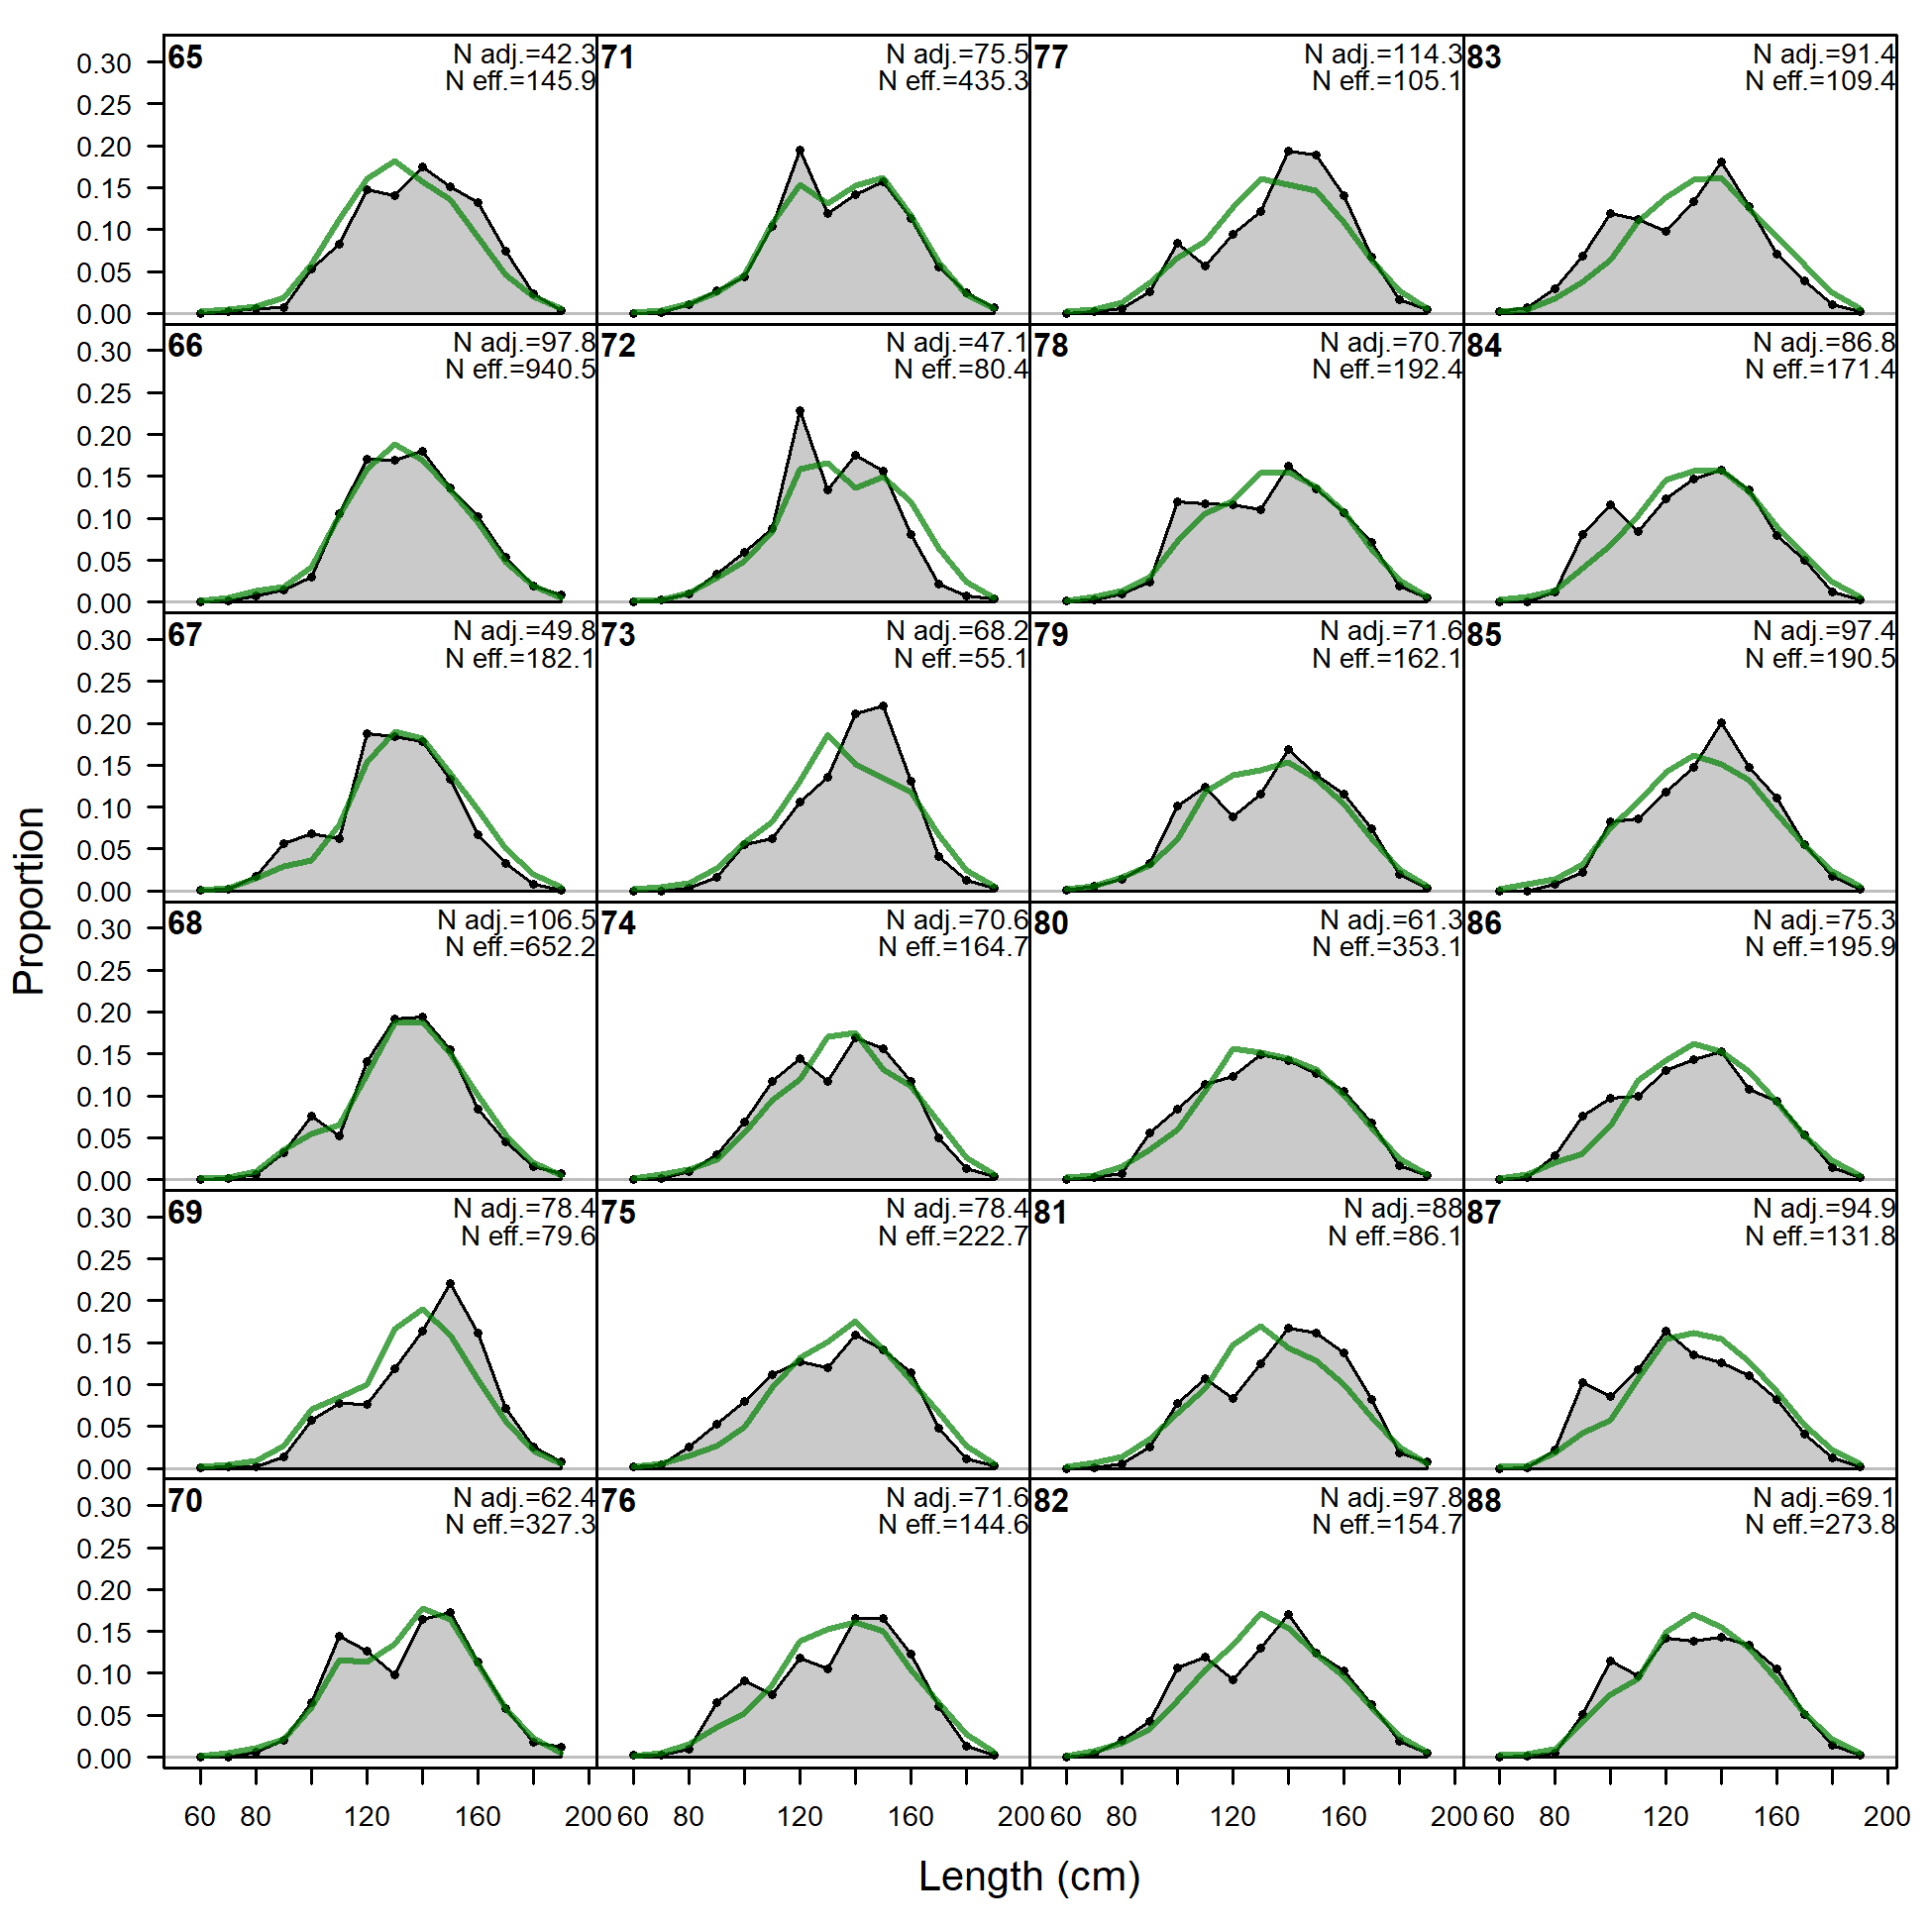
Size comps, whole catch, LL-n-A7 (plot 1 of 3).
'N adj.' is the input sample size after data-weighting adjustment. N eff. is the calculated effective sample size used in the McAllister-Ianelli tuning method.
file: comp_sizefit_flt7mkt0_page1.png
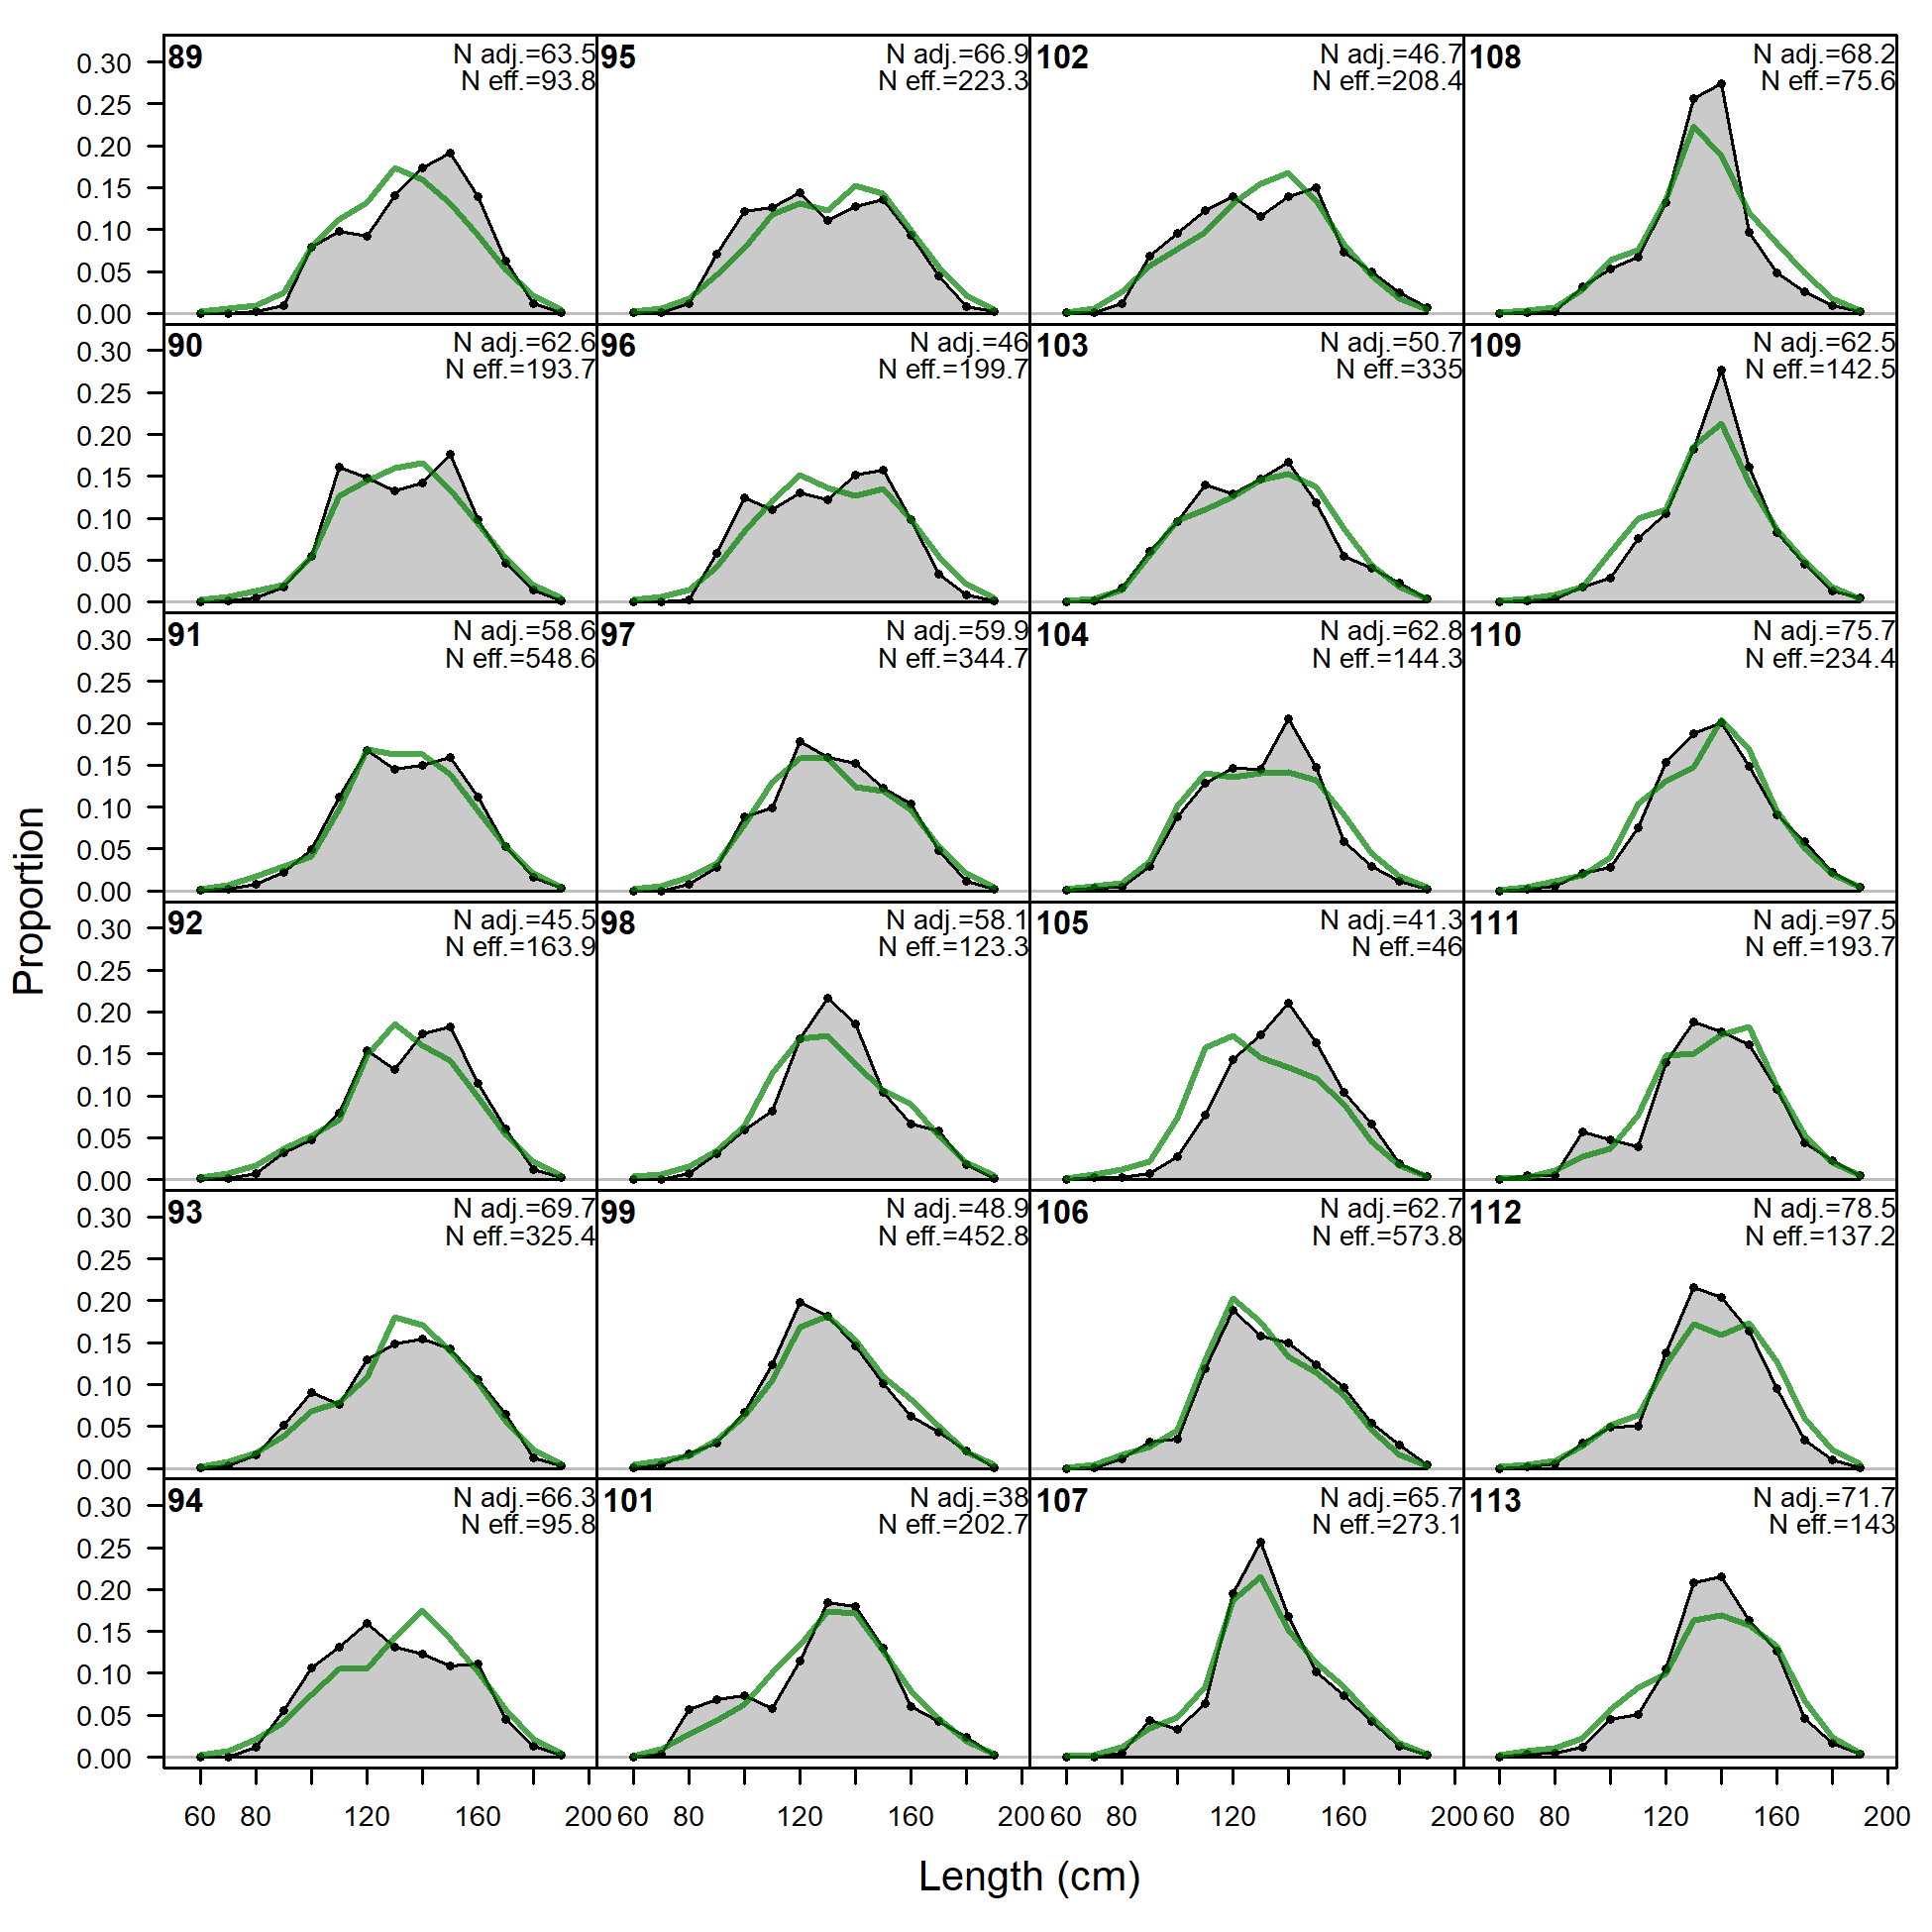
Size comps, whole catch, LL-n-A7 (plot 1 of 3).
'N adj.' is the input sample size after data-weighting adjustment. N eff. is the calculated effective sample size used in the McAllister-Ianelli tuning method. (plot 2 of 3)
file: comp_sizefit_flt7mkt0_page2.png
Size comps, whole catch, LL-n-A7 (plot 1 of 3).
'N adj.' is the input sample size after data-weighting adjustment. N eff. is the calculated effective sample size used in the McAllister-Ianelli tuning method. (plot 2 of 3) (plot 3 of 3)
file: comp_sizefit_flt7mkt0_page3.png
Pearson residuals, whole catch, LL-n-A7 (max=2.67) (plot 3 of 3)
Closed bubbles are positive residuals (observed > expected) and open bubbles are negative residuals (observed < expected).
file: comp_sizefit_residsflt7mkt0_page3.png
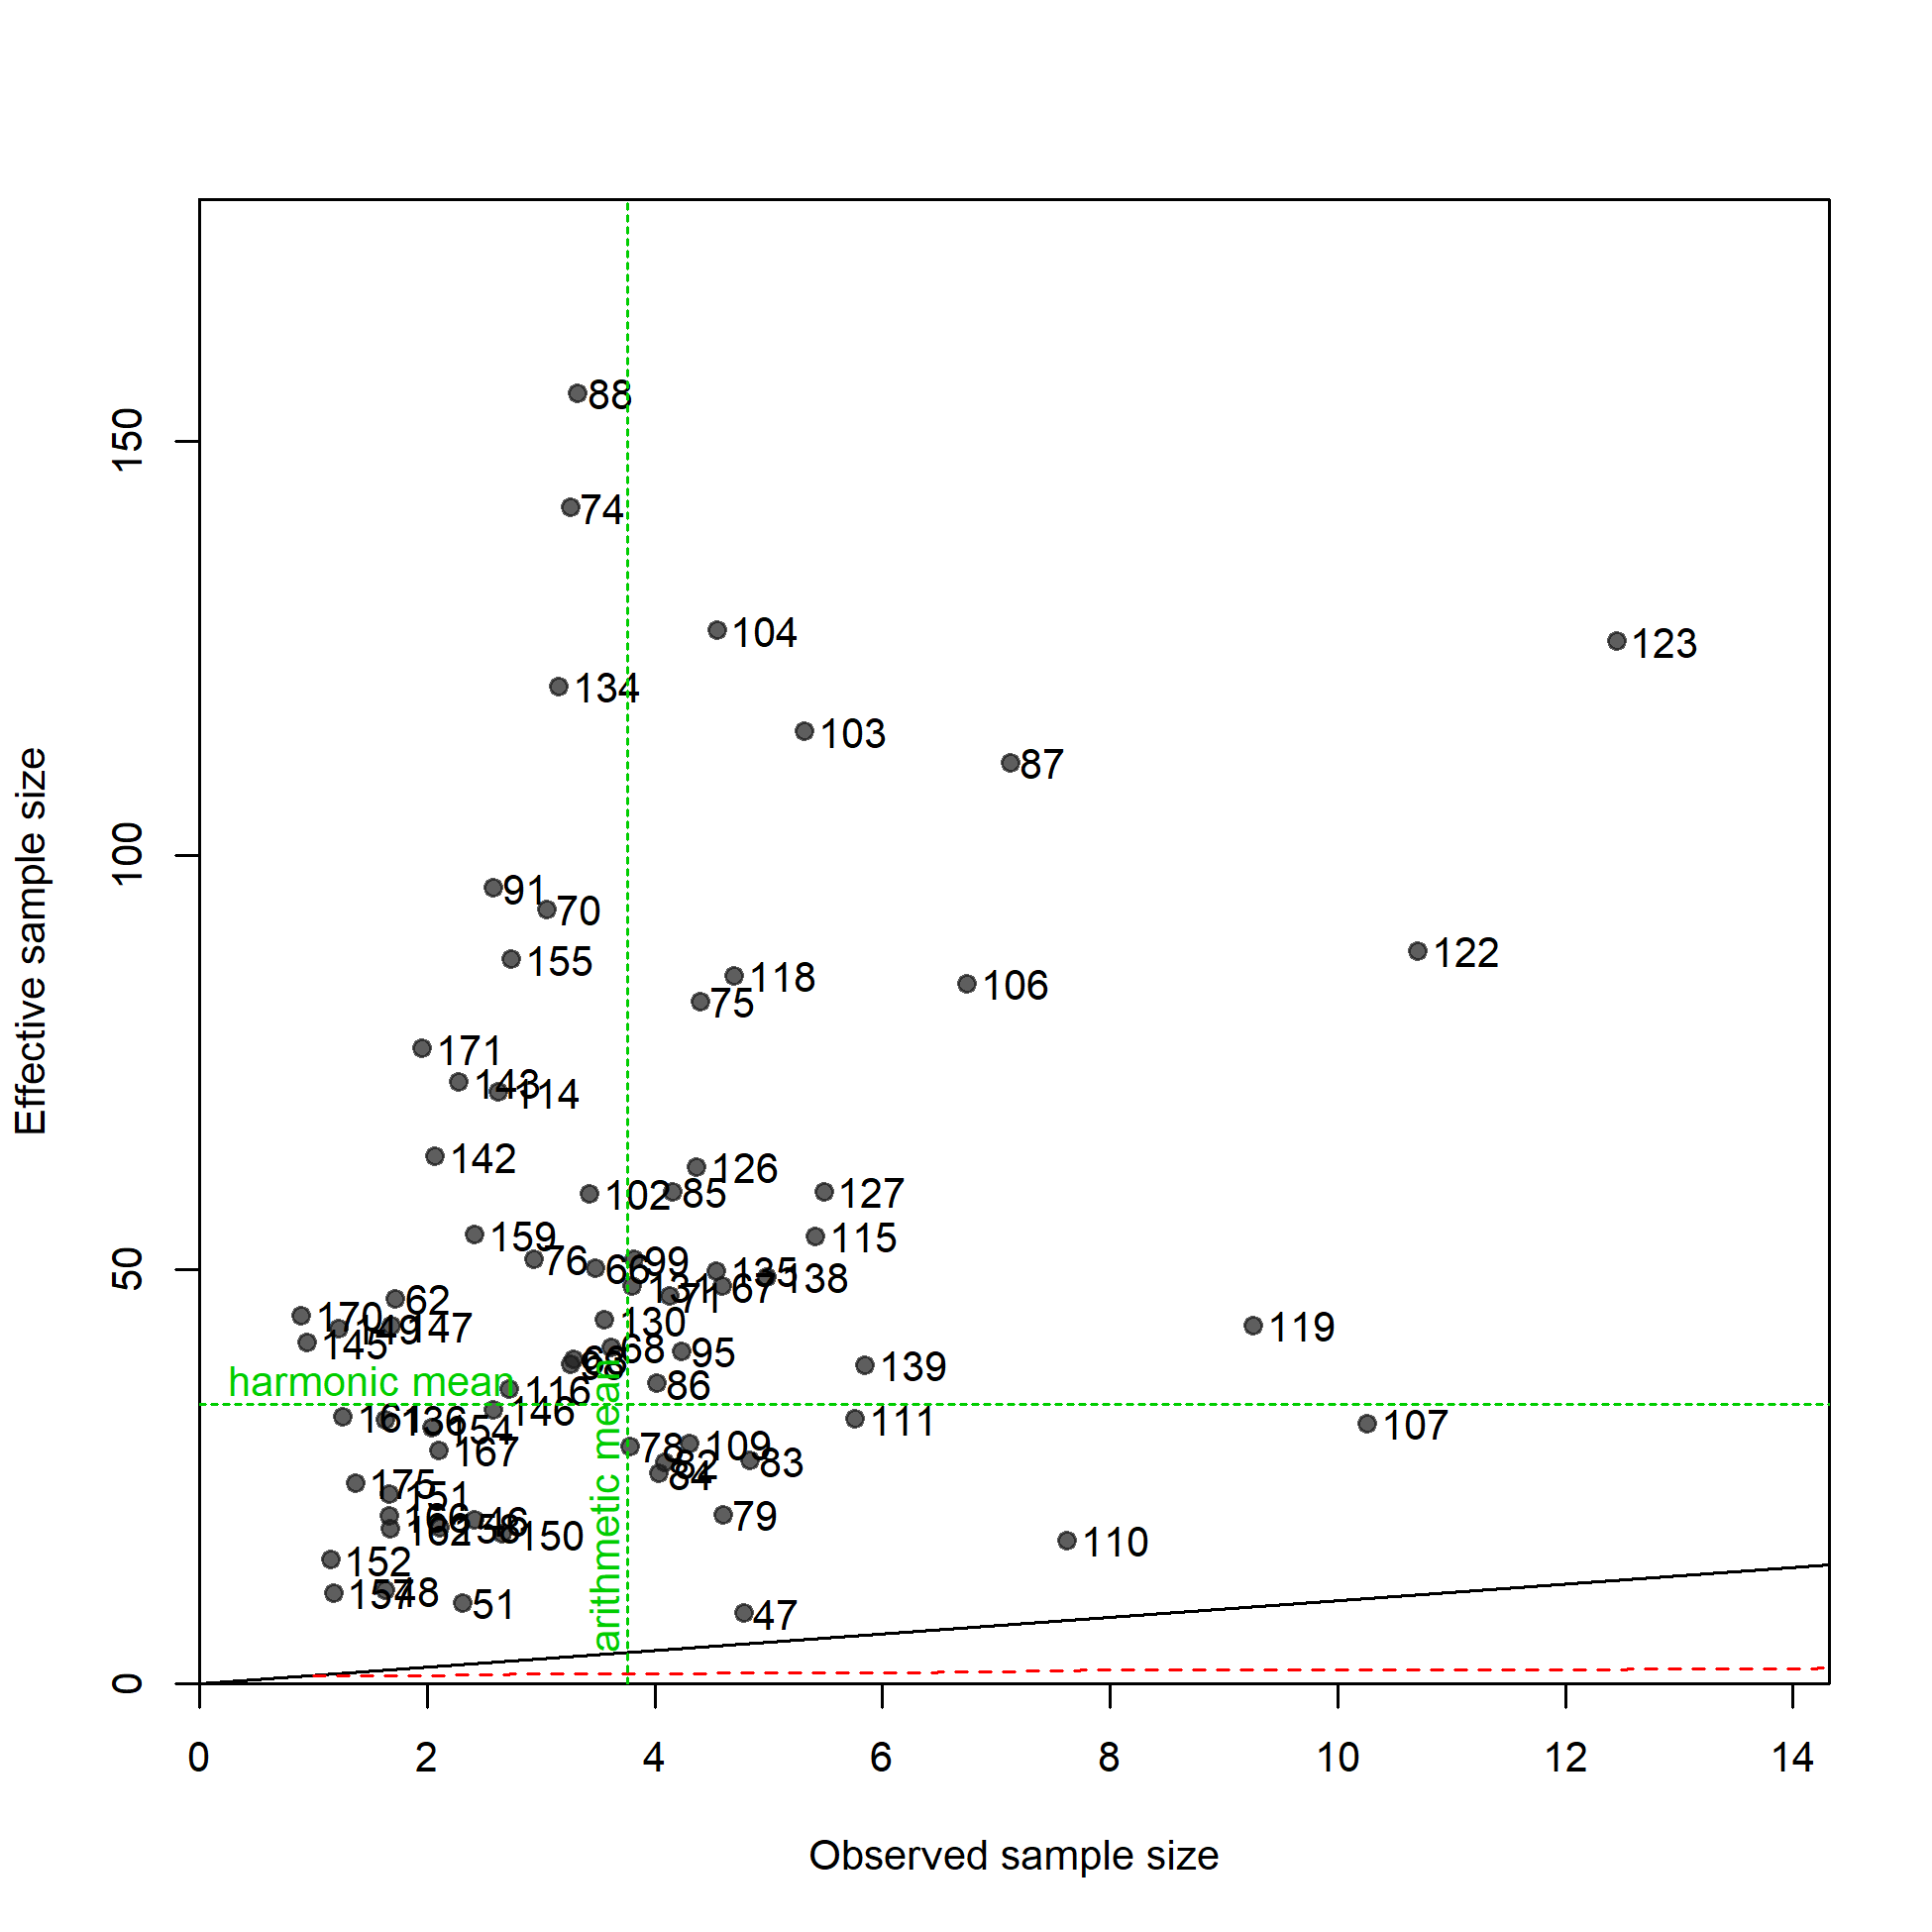
N-EffN comparison, Size comps, whole catch, LL-n-A7
file: comp_sizefit_sampsize_flt7mkt0.png
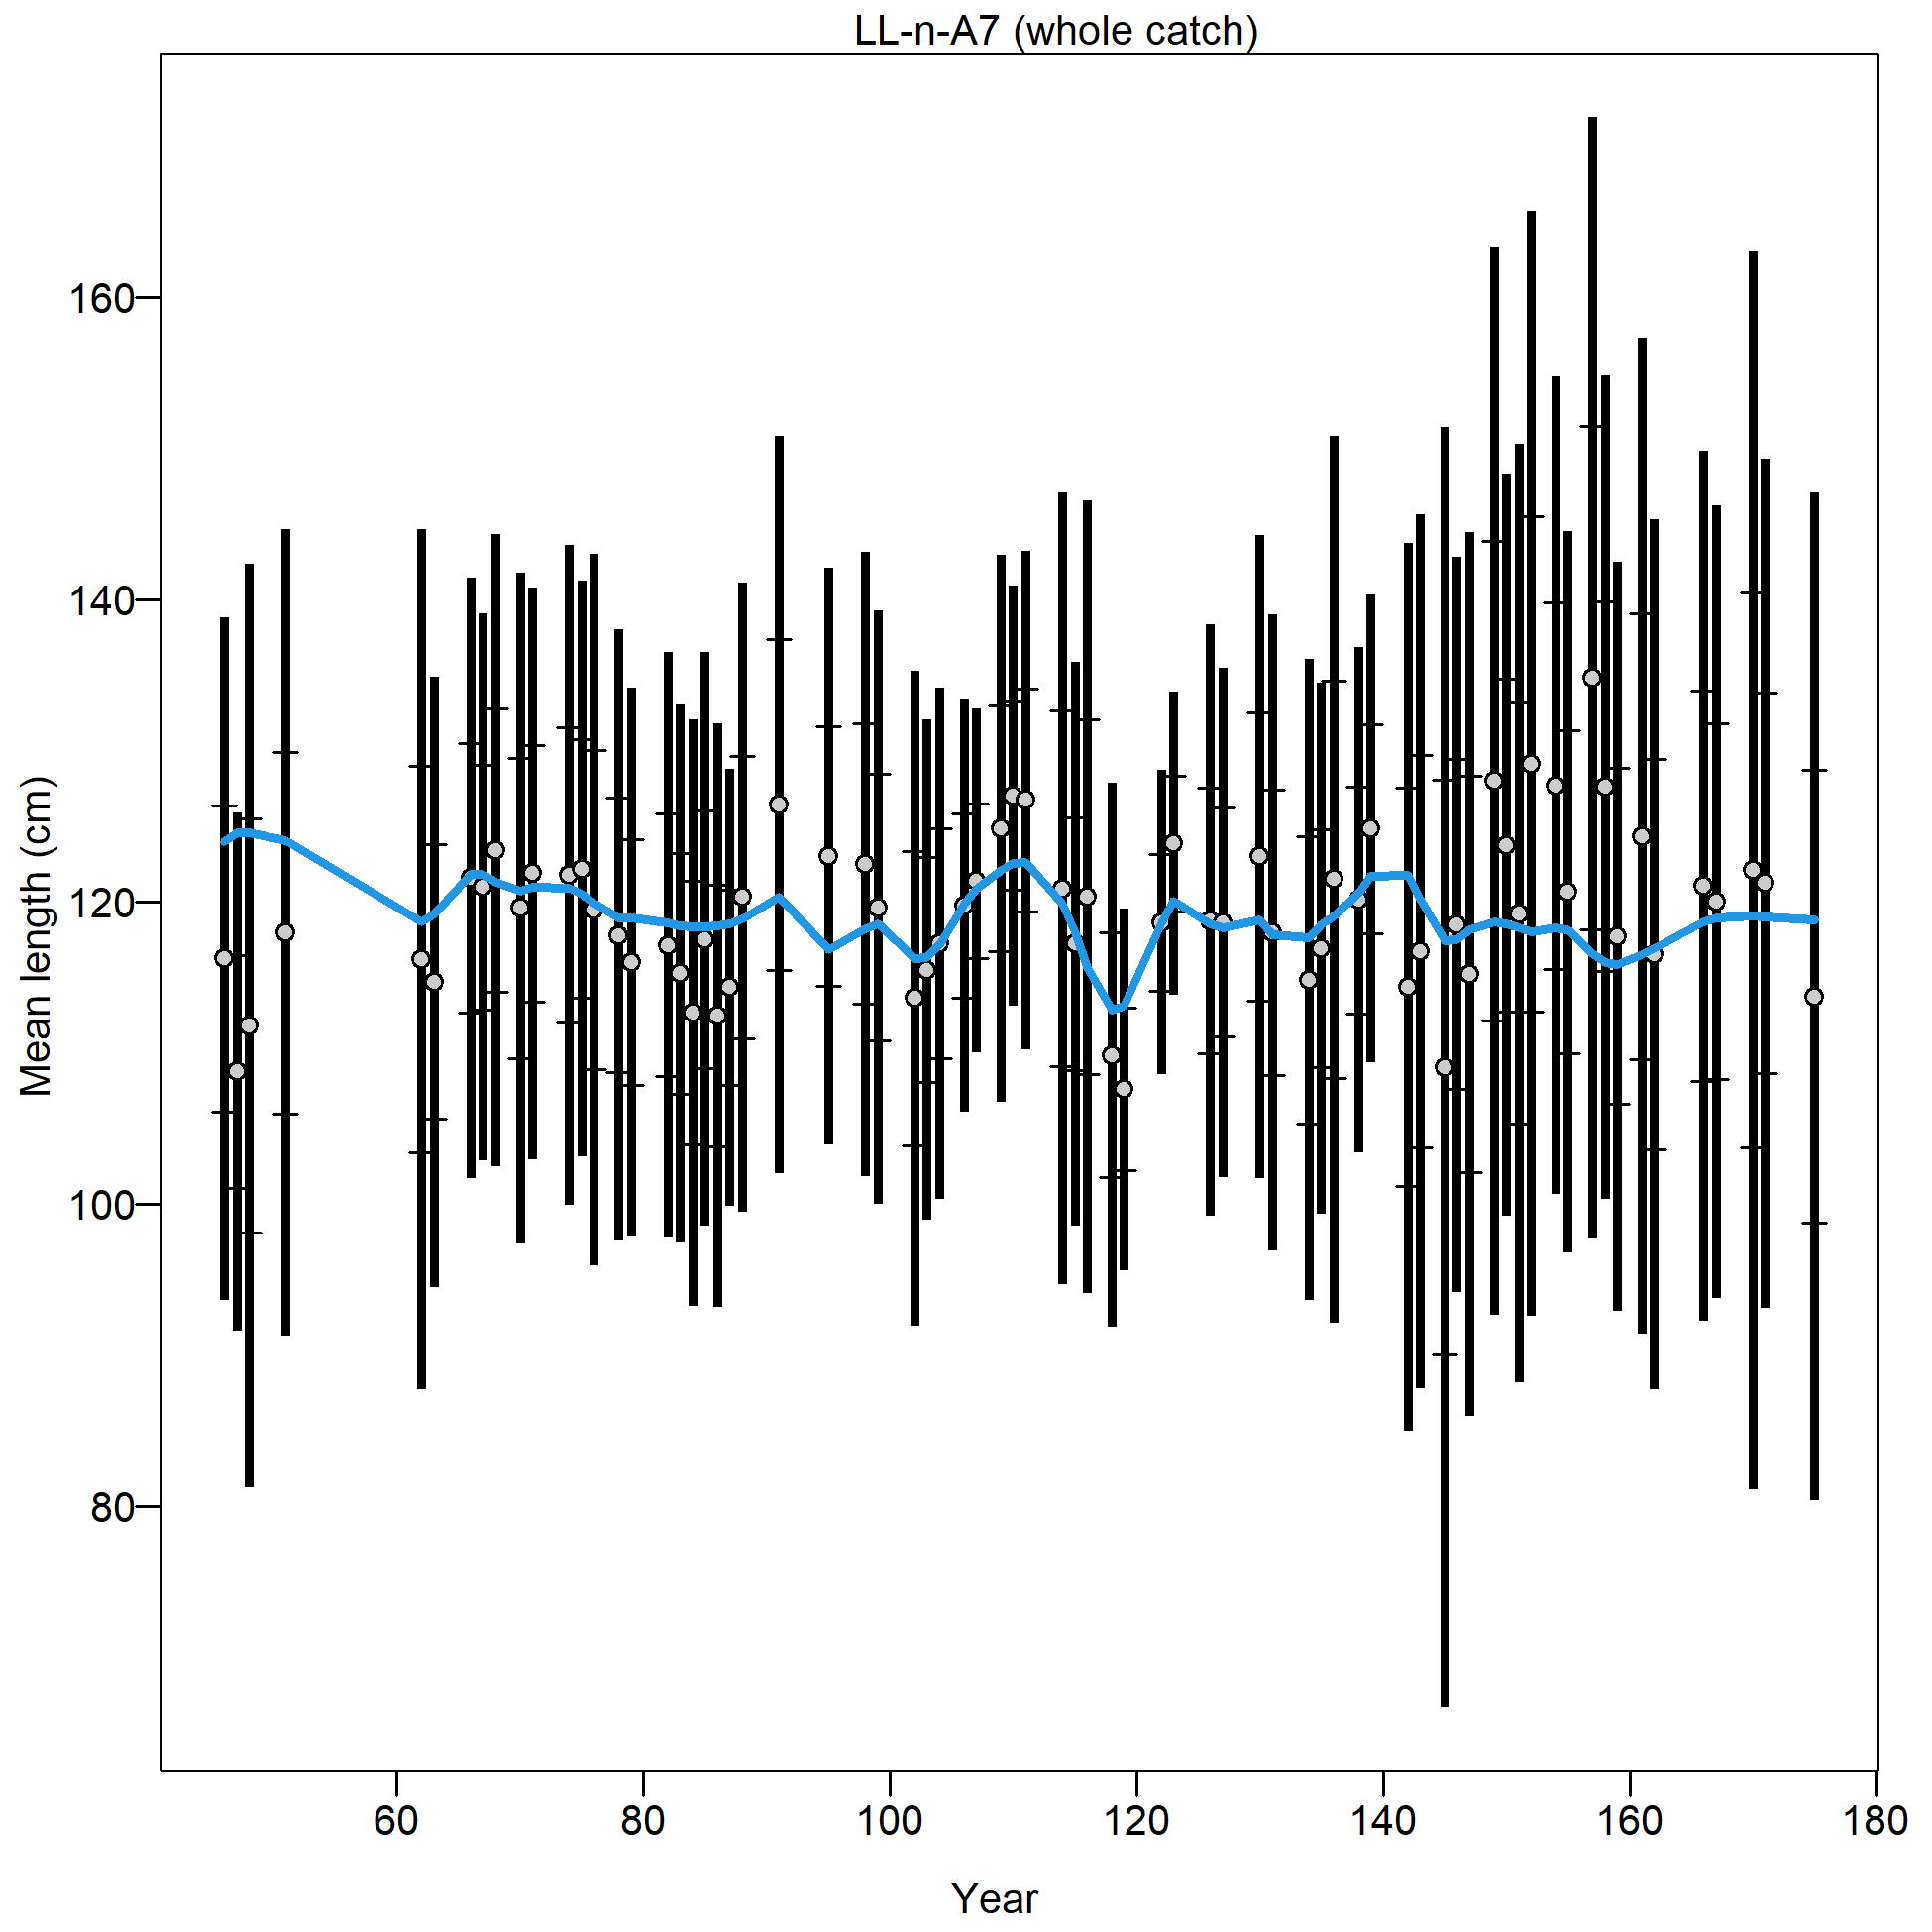
Mean size for LL-n-A7 with 95% confidence intervals based on current sample sizes.
Francis data weighting method TA1.8: thinner intervals (with capped ends) show result of further adjusting sample sizes based on suggested multiplier (with 95% interval) for size data from LL-n-A7:
4.9712 (3.1332-8.5451)
For more info, see Francis (2011).
file: comp_sizefit_data_weighting_TA1.8_LL-n-A7.png
Size comps, whole catch, LL-Survey (plot 1 of 4).
'N adj.' is the input sample size after data-weighting adjustment. N eff. is the calculated effective sample size used in the McAllister-Ianelli tuning method.
file: comp_sizefit_flt23mkt0_page1.png
Size comps, whole catch, LL-Survey (plot 1 of 4).
'N adj.' is the input sample size after data-weighting adjustment. N eff. is the calculated effective sample size used in the McAllister-Ianelli tuning method. (plot 2 of 4)
file: comp_sizefit_flt23mkt0_page2.png
Size comps, whole catch, LL-Survey (plot 1 of 4).
'N adj.' is the input sample size after data-weighting adjustment. N eff. is the calculated effective sample size used in the McAllister-Ianelli tuning method. (plot 2 of 4) (plot 3 of 4)
file: comp_sizefit_flt23mkt0_page3.png
Size comps, whole catch, LL-Survey (plot 1 of 4).
'N adj.' is the input sample size after data-weighting adjustment. N eff. is the calculated effective sample size used in the McAllister-Ianelli tuning method. (plot 2 of 4) (plot 3 of 4) (plot 4 of 4)
file: comp_sizefit_flt23mkt0_page4.png
Pearson residuals, whole catch, LL-Survey (max=3.04) (plot 4 of 4)
Closed bubbles are positive residuals (observed > expected) and open bubbles are negative residuals (observed < expected).
file: comp_sizefit_residsflt23mkt0_page4.png
N-EffN comparison, Size comps, whole catch, LL-Survey
file: comp_sizefit_sampsize_flt23mkt0.png
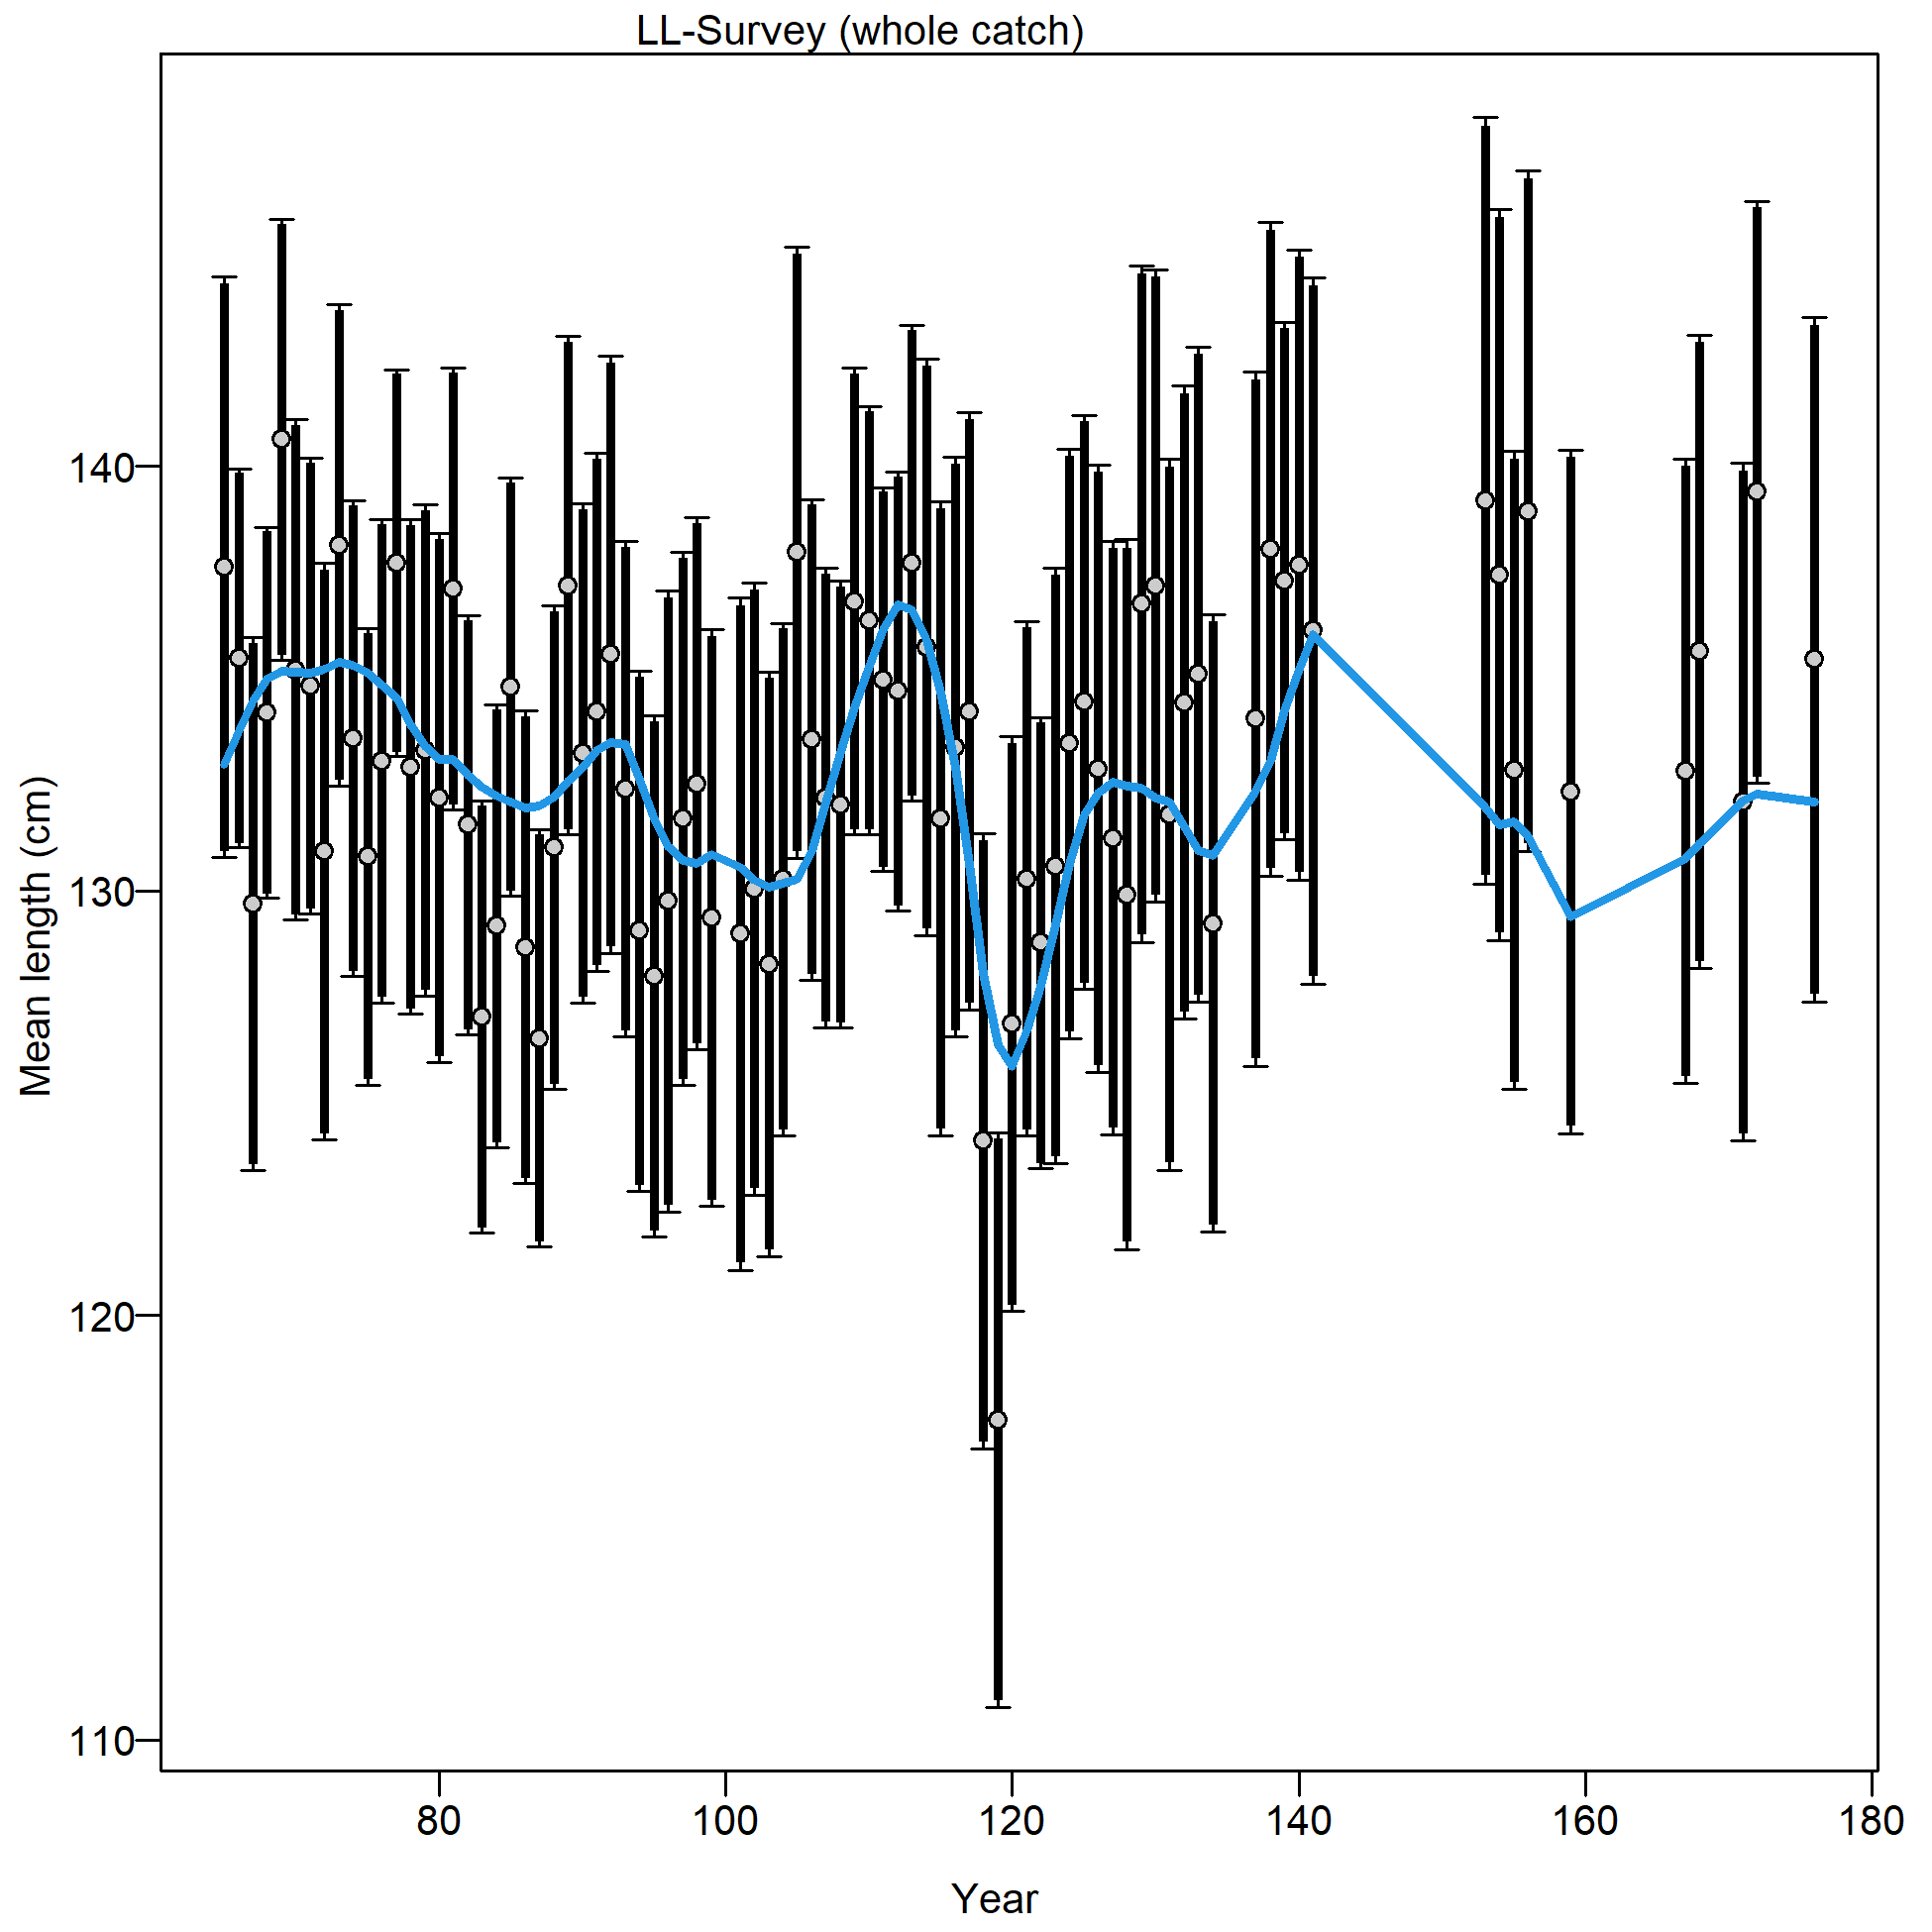
Mean size for LL-Survey with 95% confidence intervals based on current sample sizes.
Francis data weighting method TA1.8: thinner intervals (with capped ends) show result of further adjusting sample sizes based on suggested multiplier (with 95% interval) for size data from LL-Survey:
0.9551 (0.7294-1.3336)
For more info, see Francis (2011).
file: comp_sizefit_data_weighting_TA1.8_LL-Survey.png