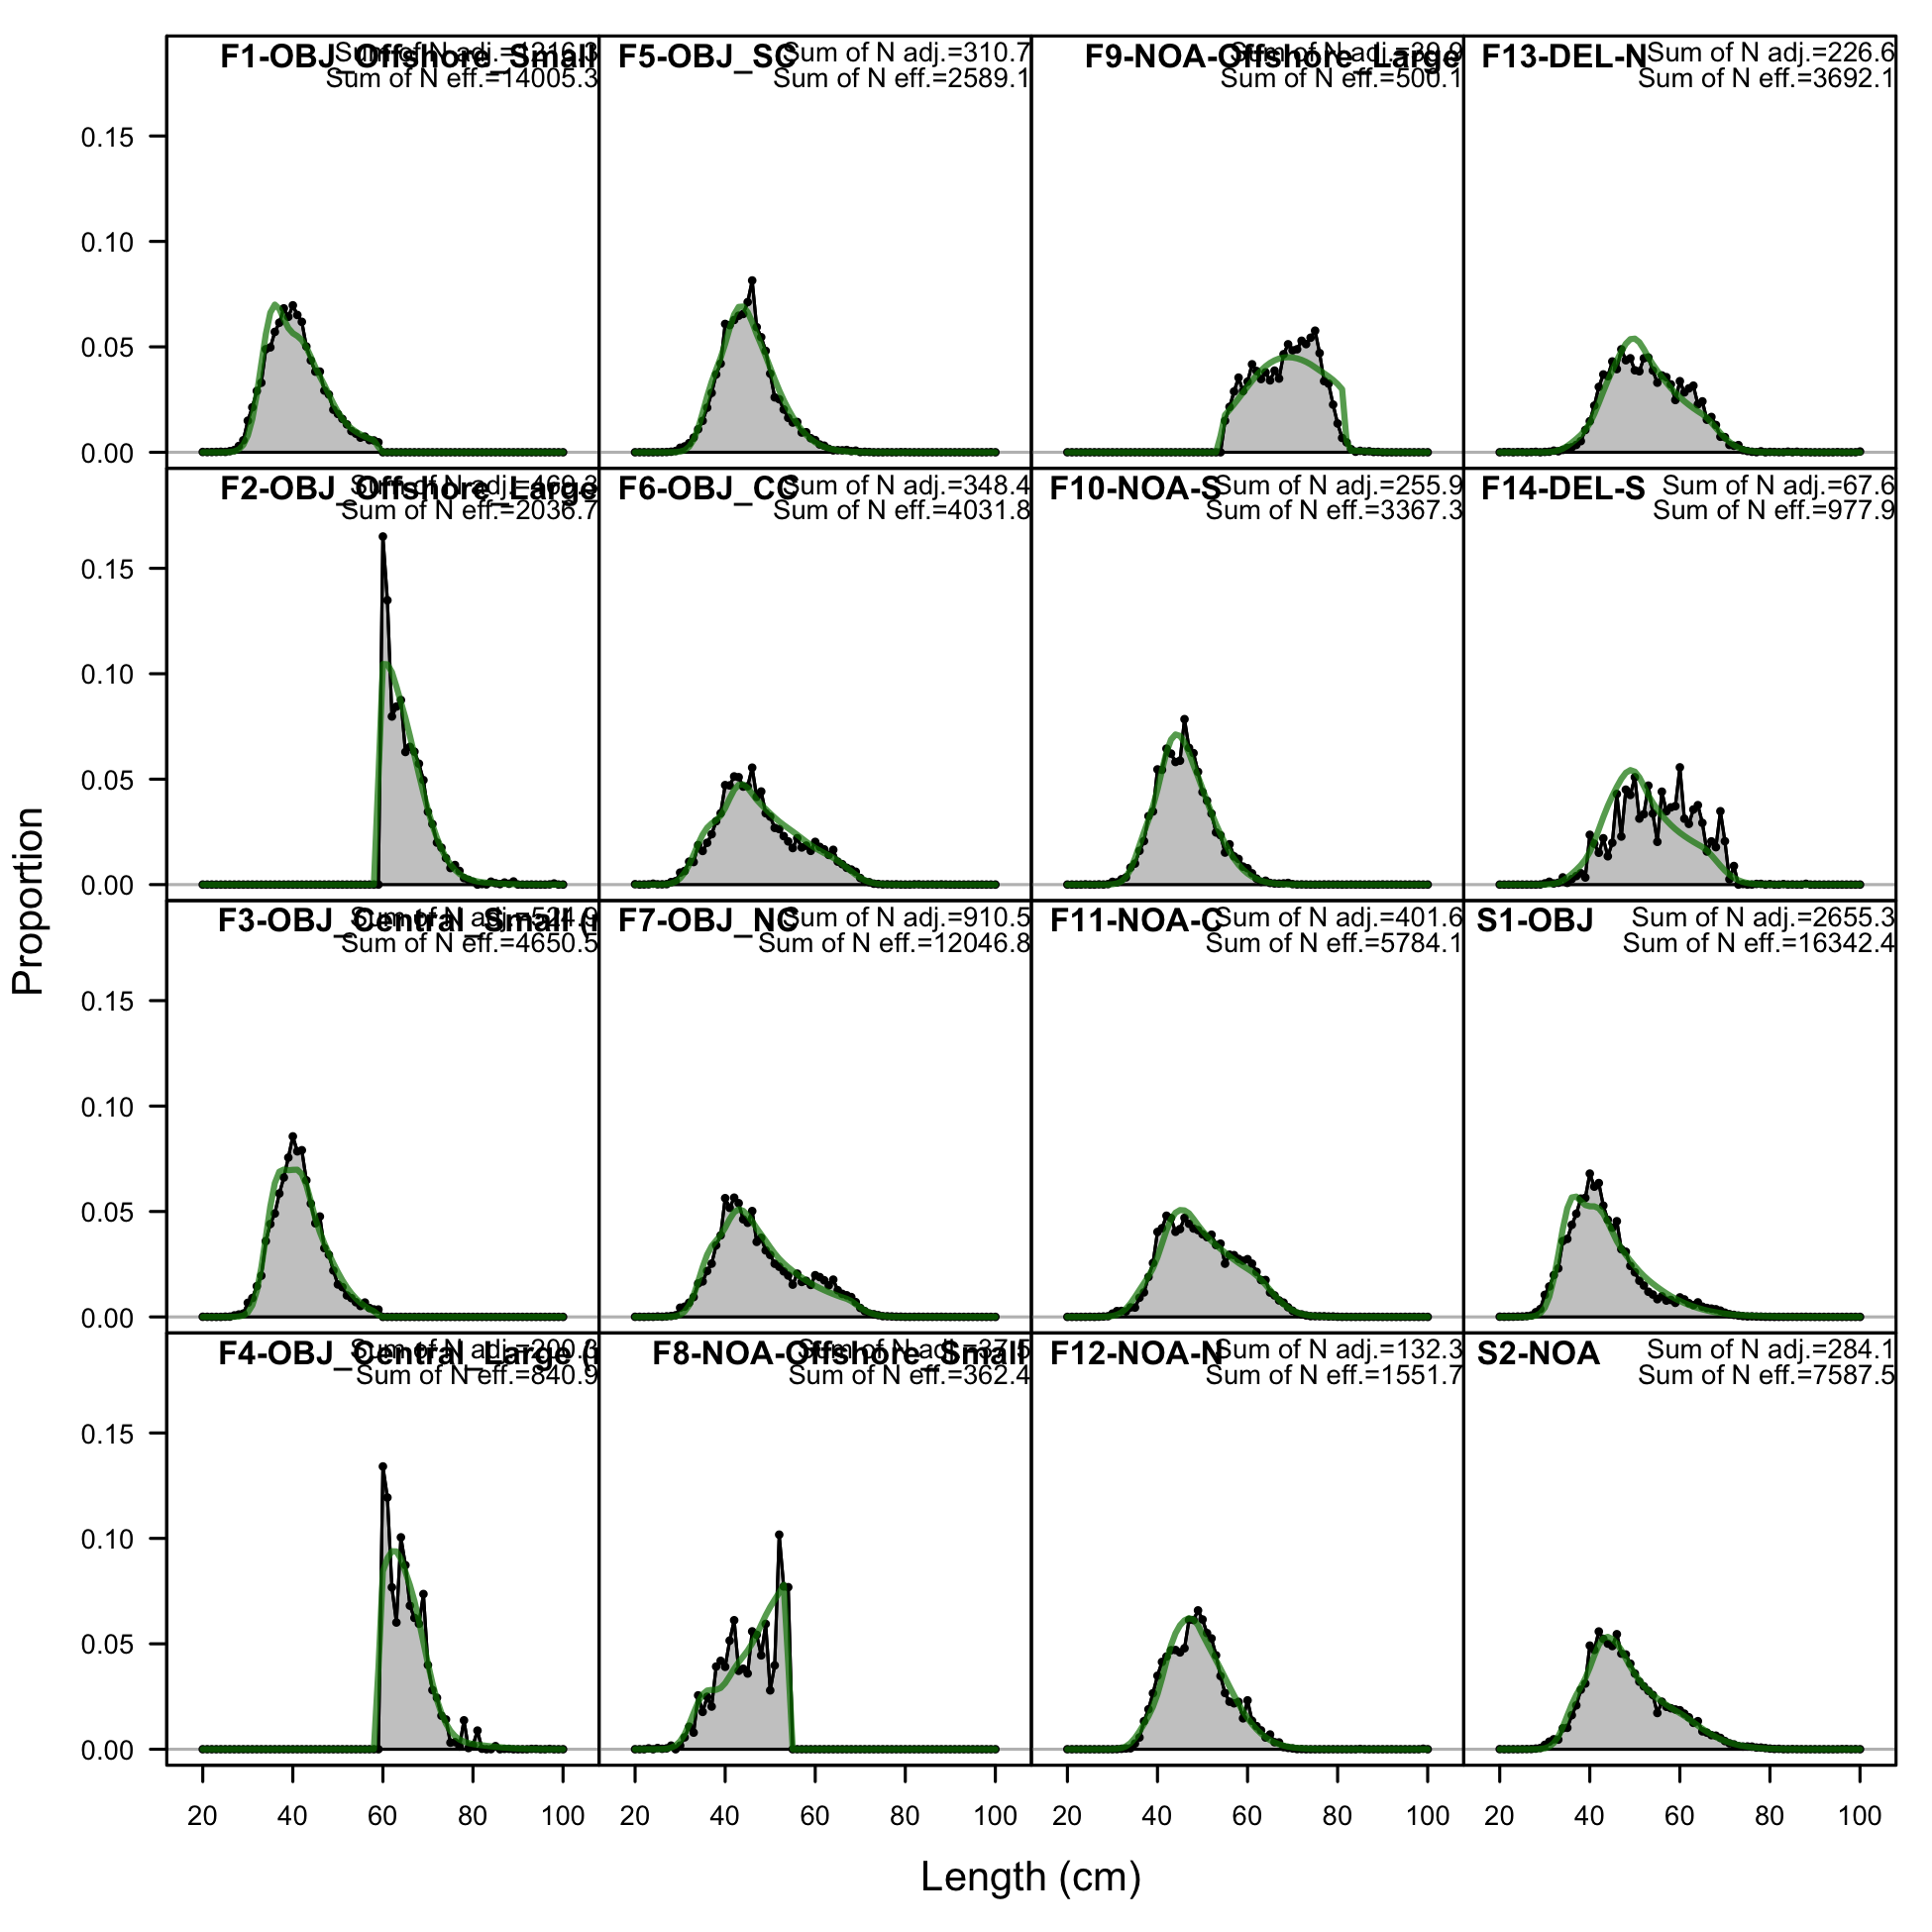
Length comps, aggregated across time by fleet.
Labels 'retained' and 'discard' indicate discarded or retained sampled for each fleet. Panels without this designation represent the whole catch.
file: comp_lenfit__aggregated_across_time.png
Length comps, aggregated across time by fleet.
Labels 'retained' and 'discard' indicate discarded or retained sampled for each fleet. Panels without this designation represent the whole catch.
file: comp_lenfit__aggregated_across_time.png
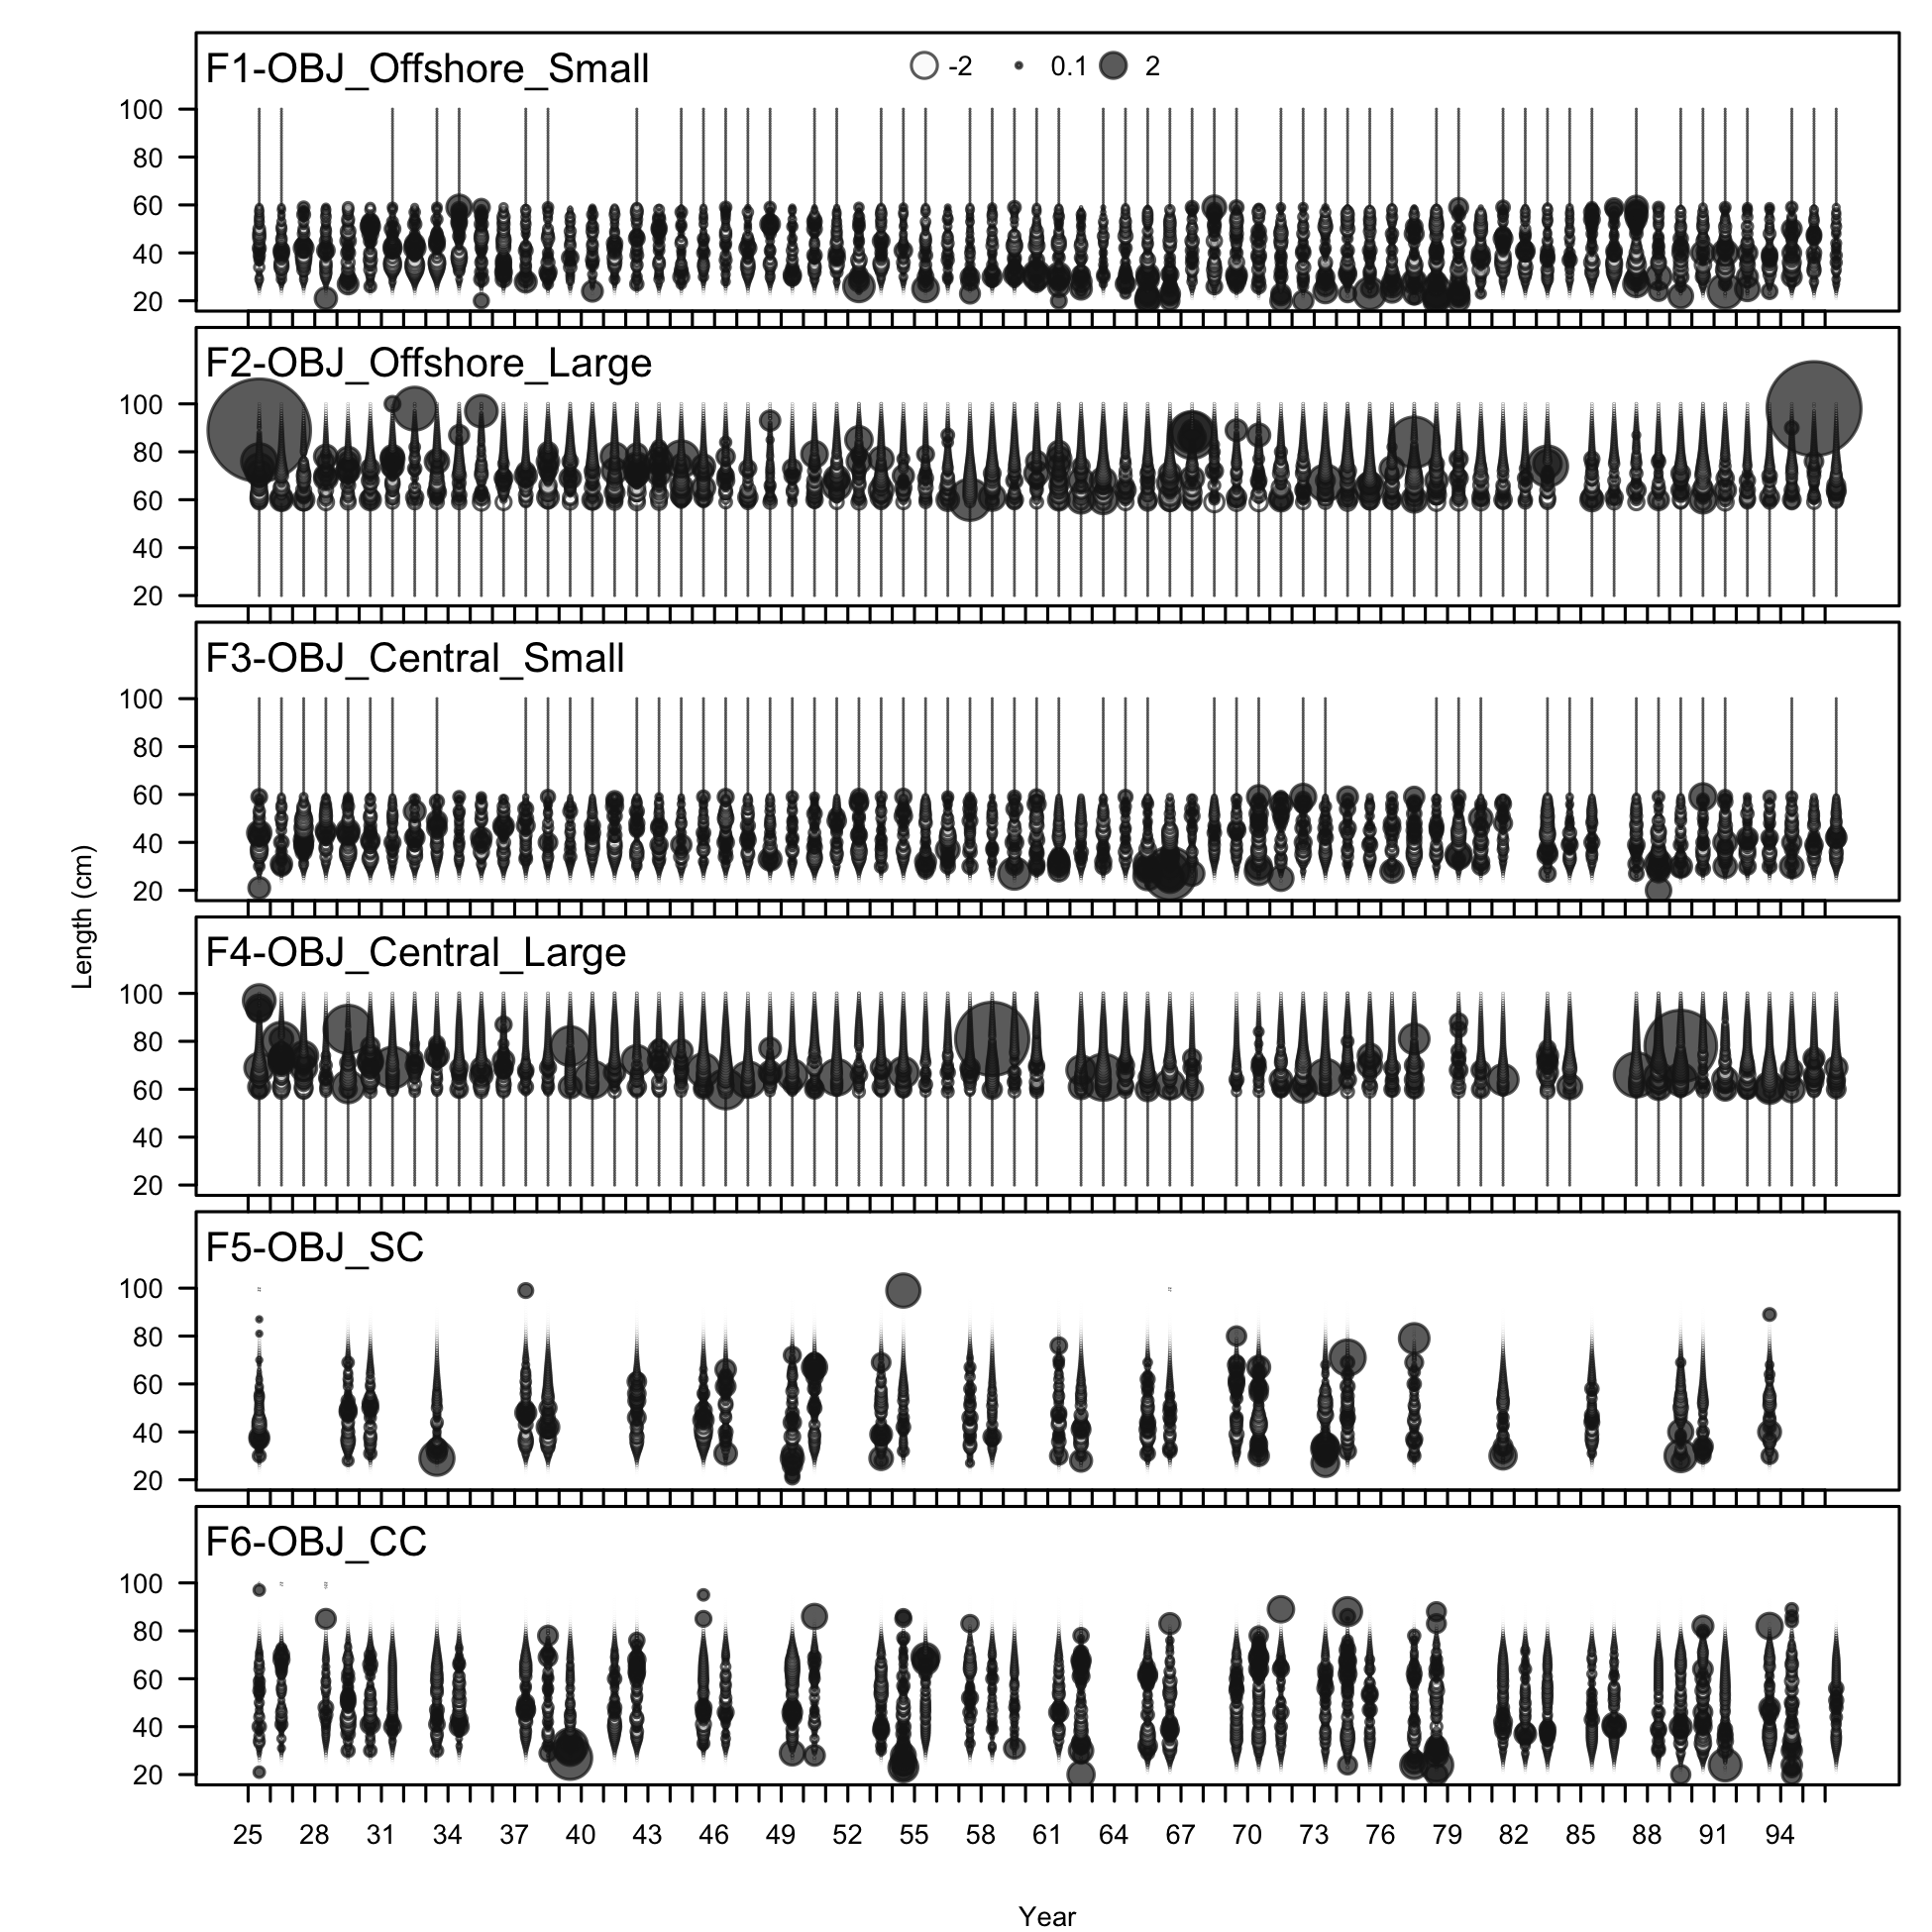
Pearson residuals, comparing across fleets (plot 1 of 3)
Closed bubbles are positive residuals (observed > expected) and open bubbles are negative residuals (observed < expected).
file: comp_lenfit__page1_multi-fleet_comparison.png
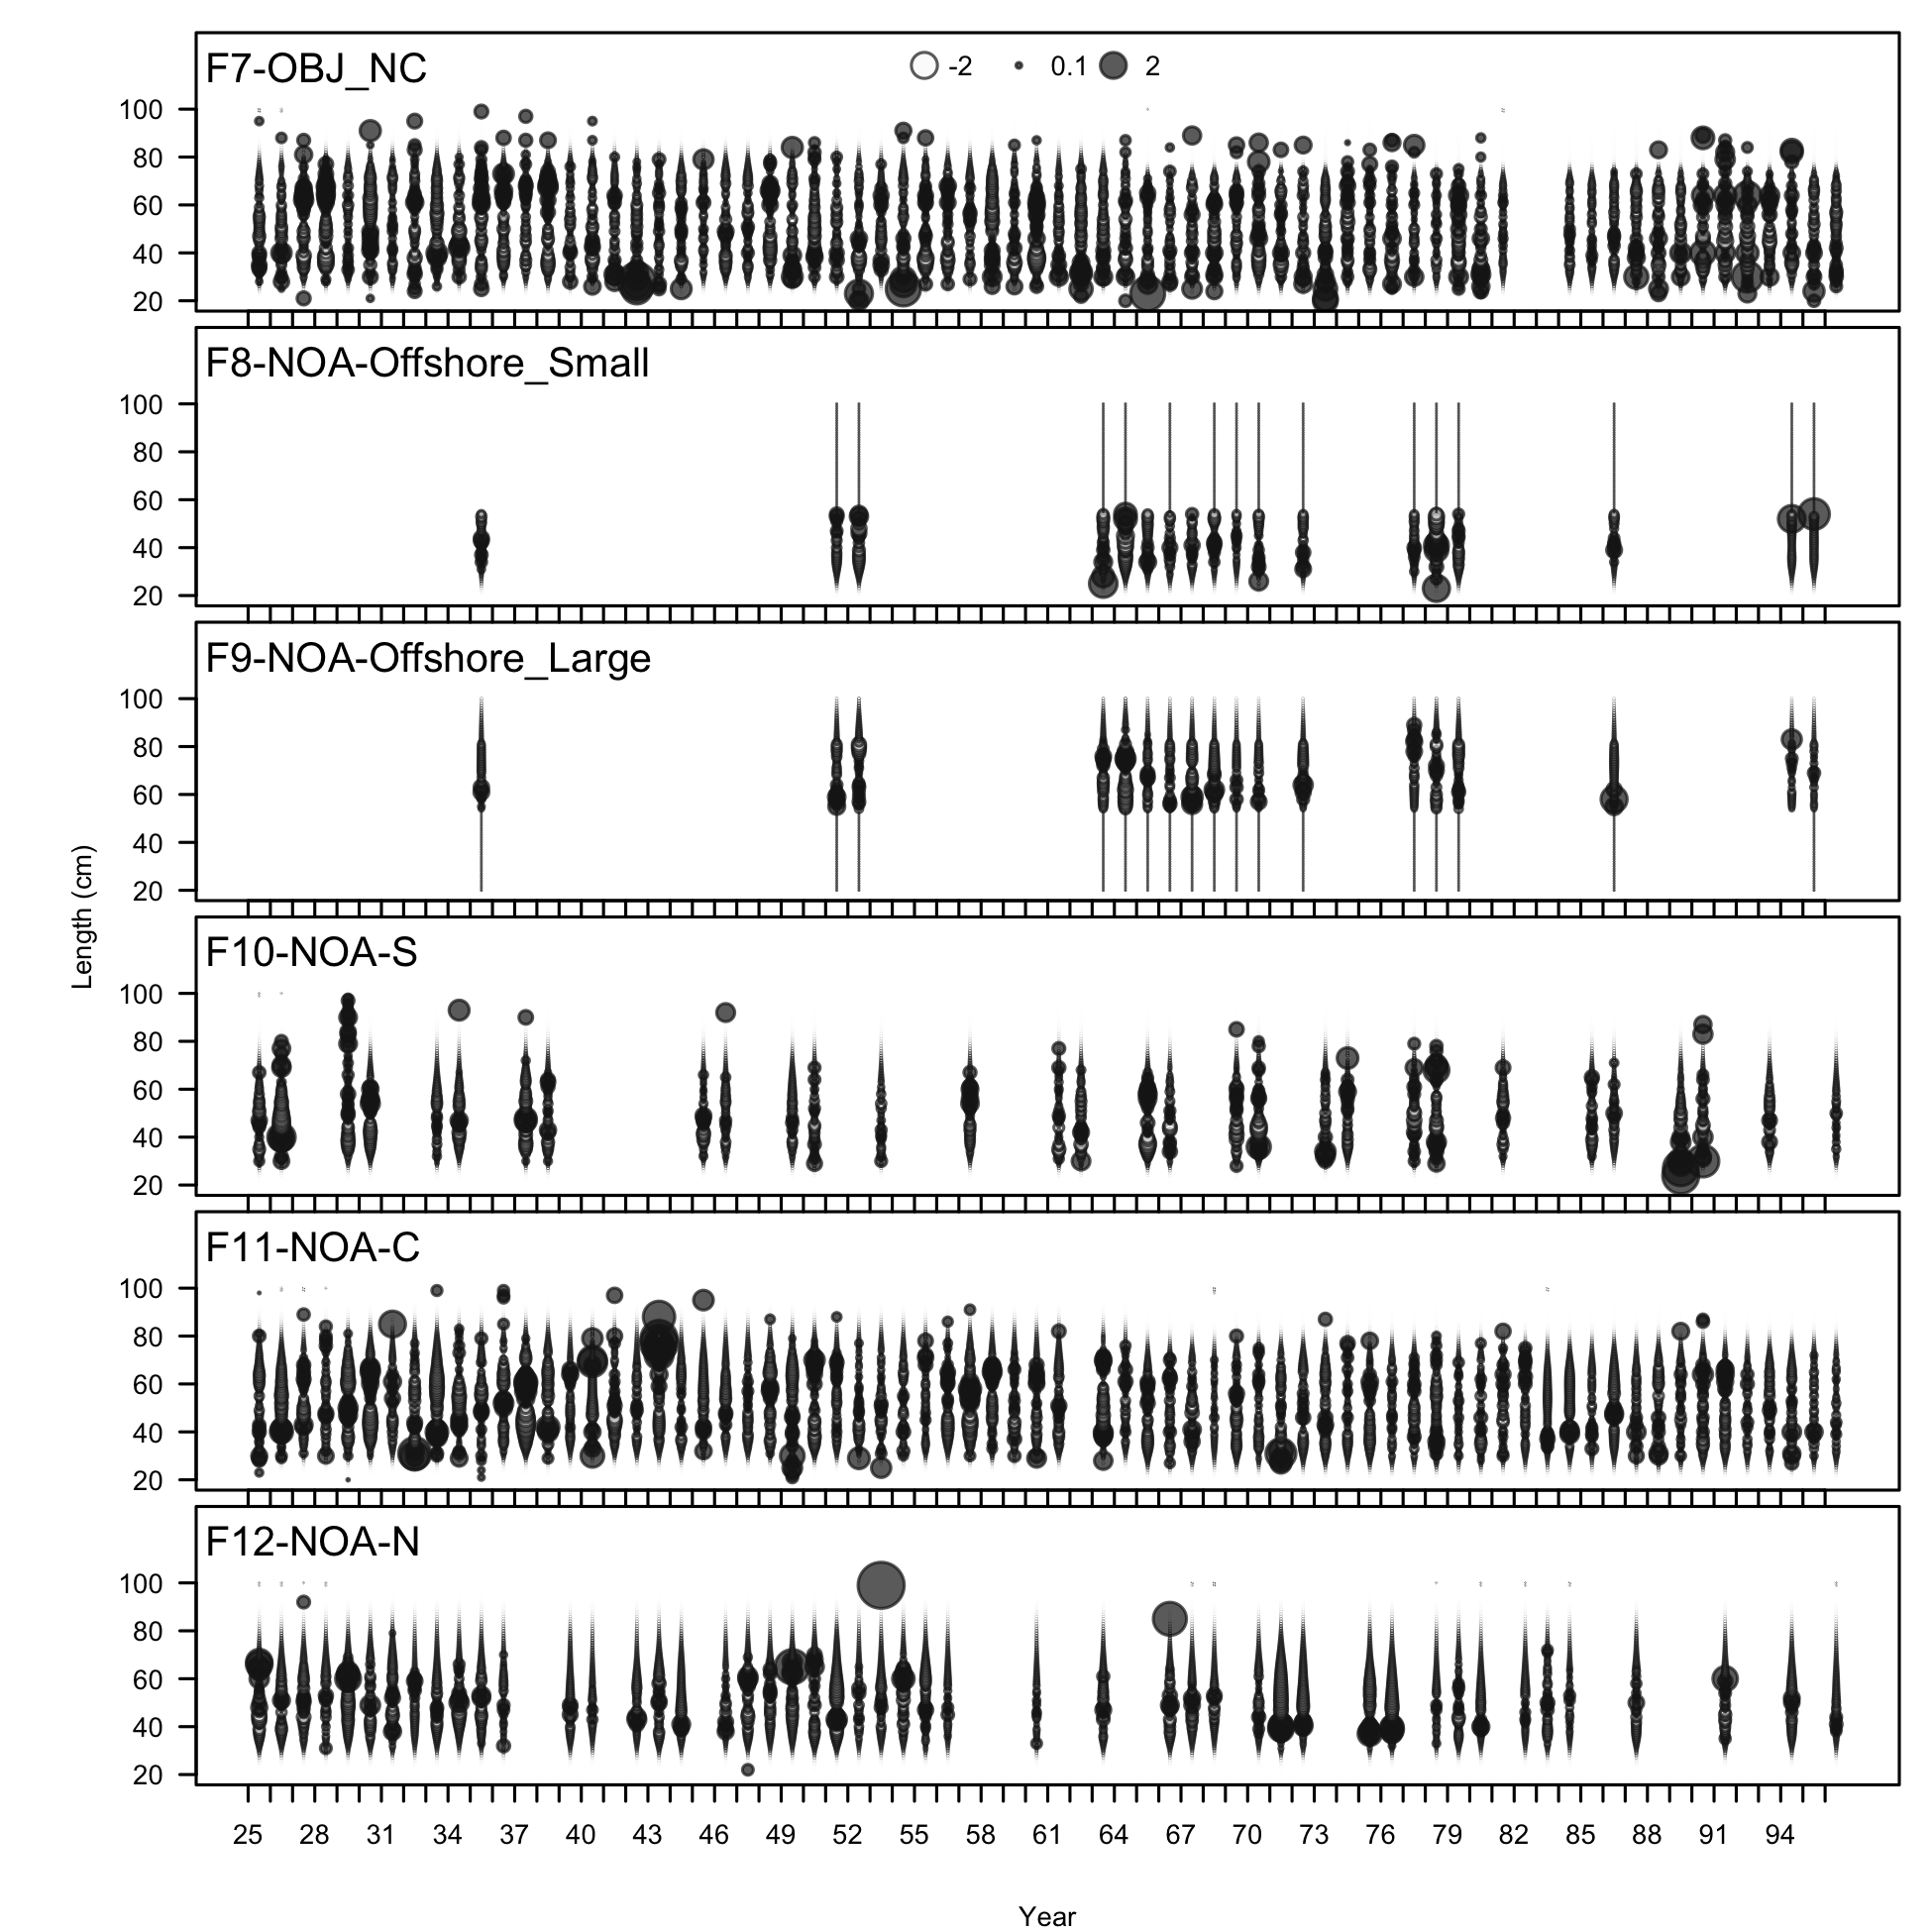
Pearson residuals, comparing across fleets (plot 2 of 3)
file: comp_lenfit__page2_multi-fleet_comparison.png
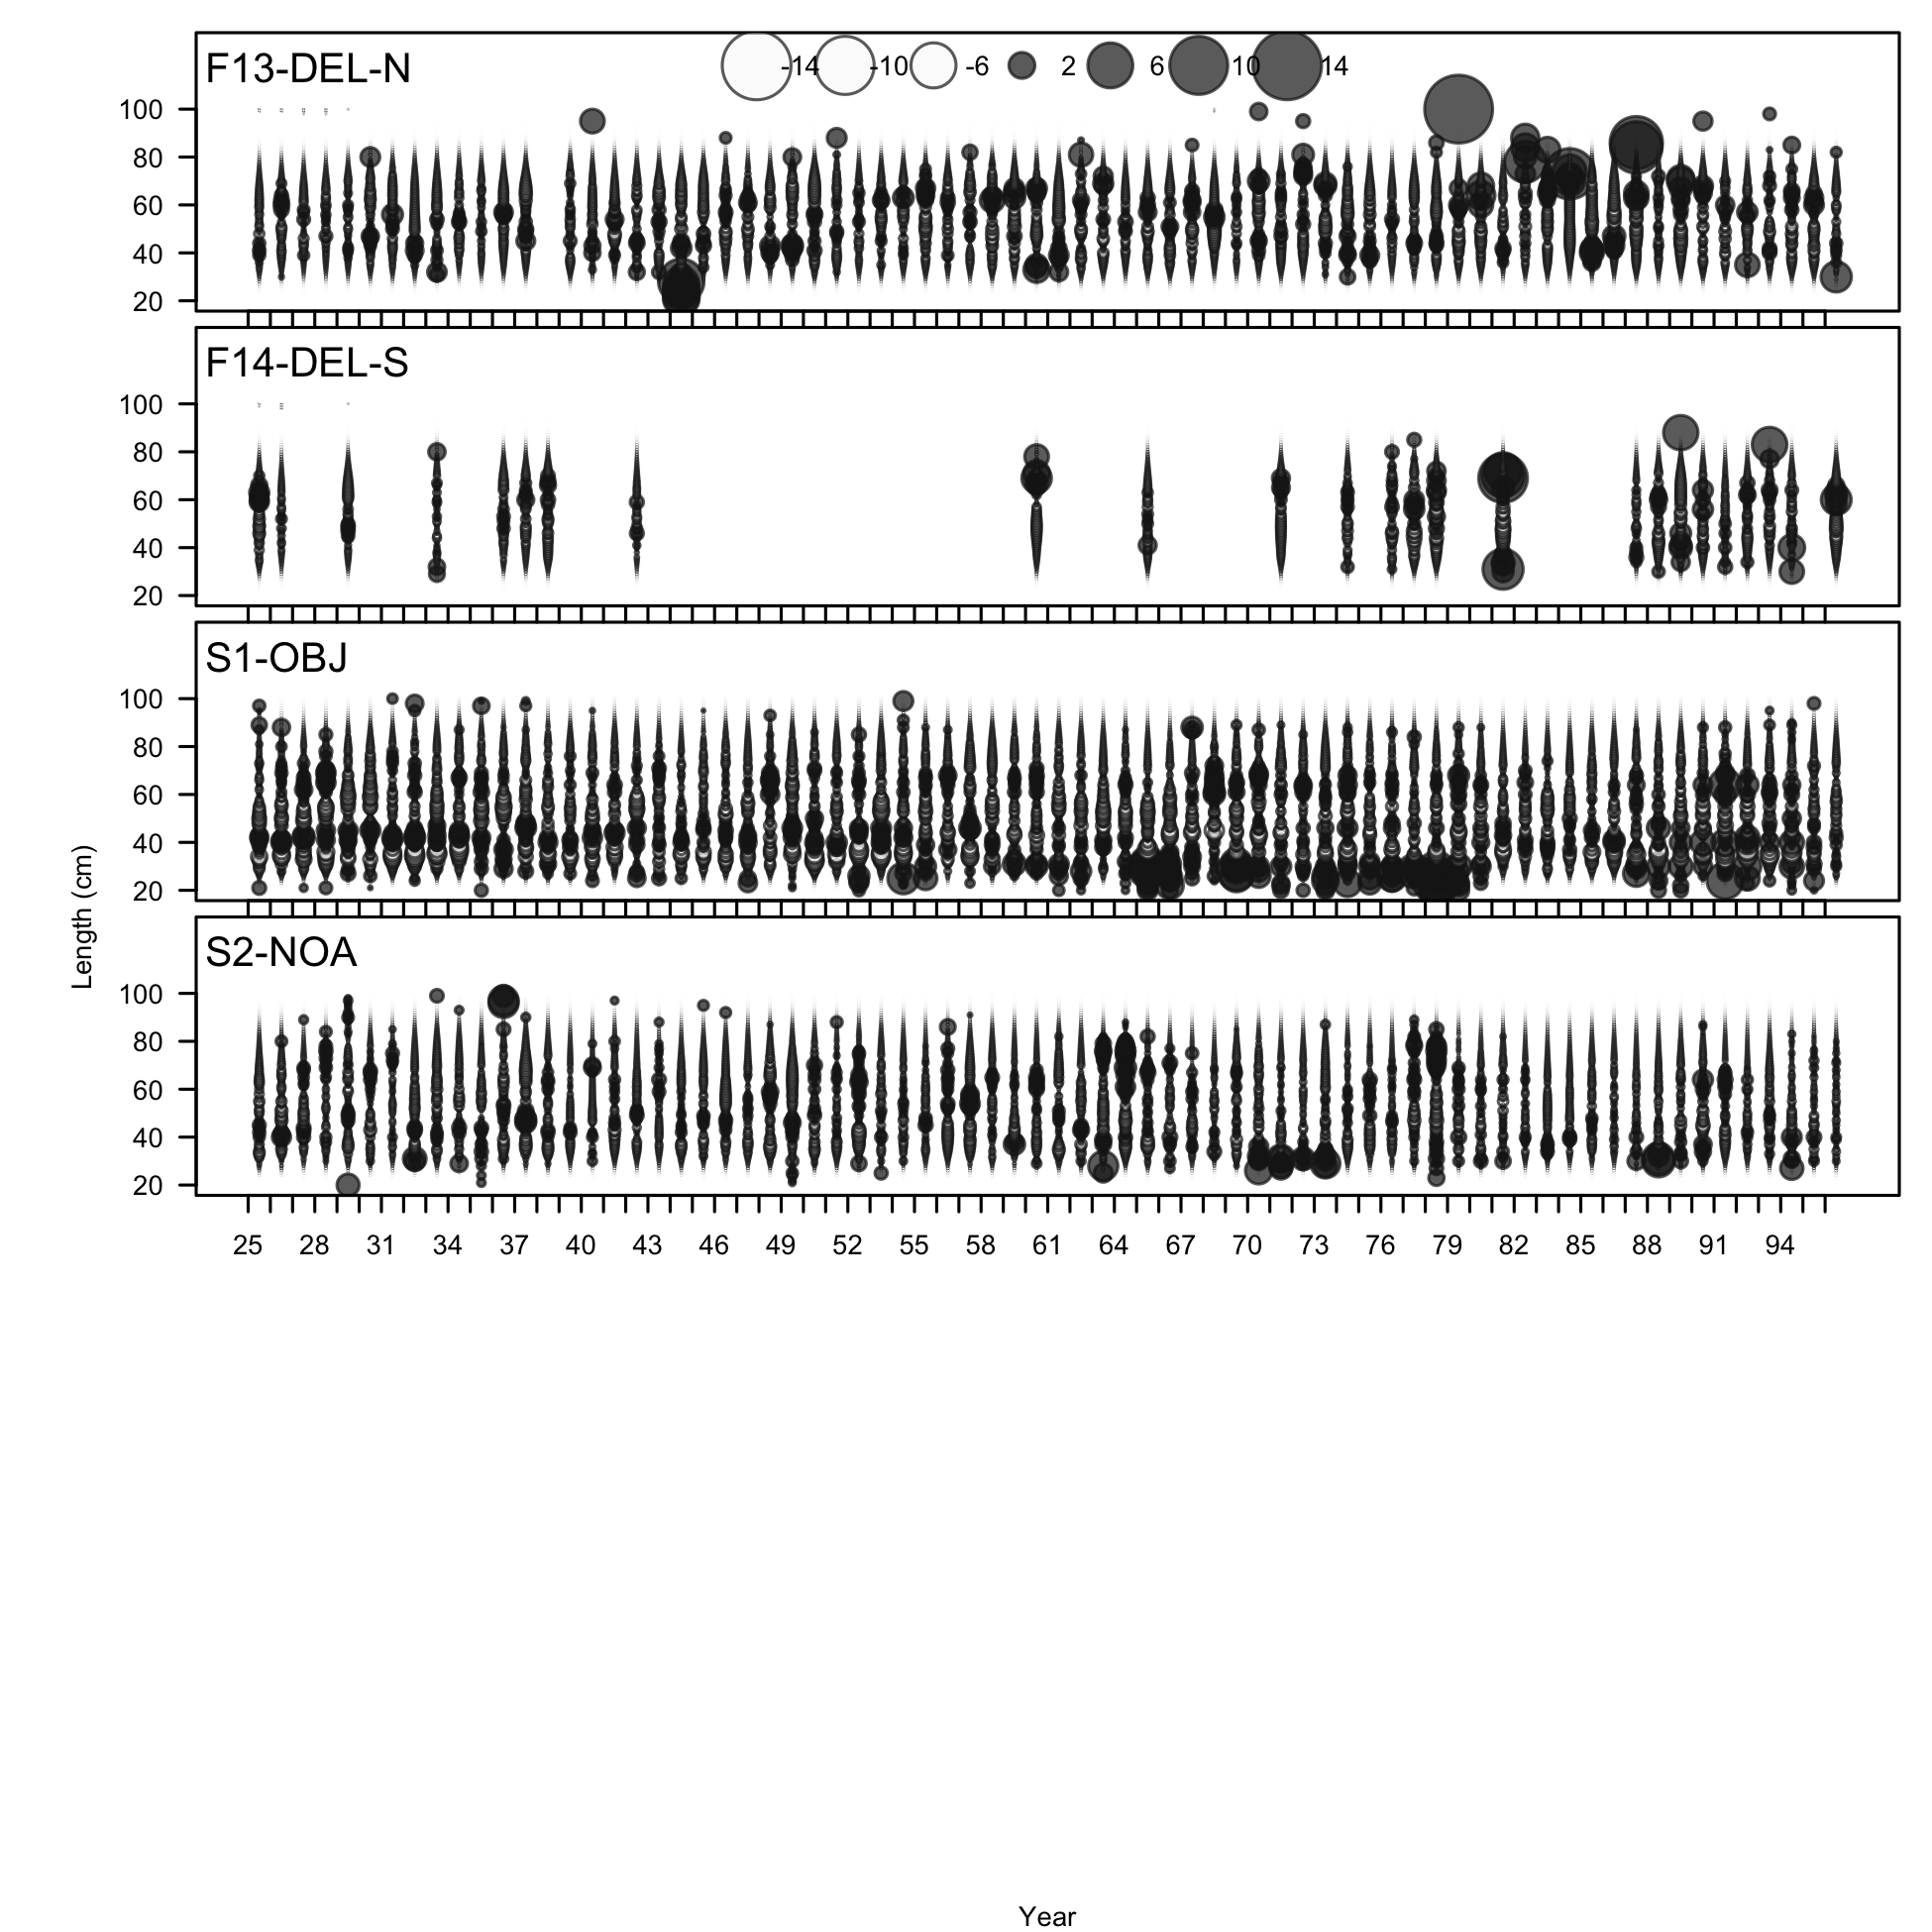
Pearson residuals, comparing across fleets (plot 3 of 3)
file: comp_lenfit__page3_multi-fleet_comparison.png
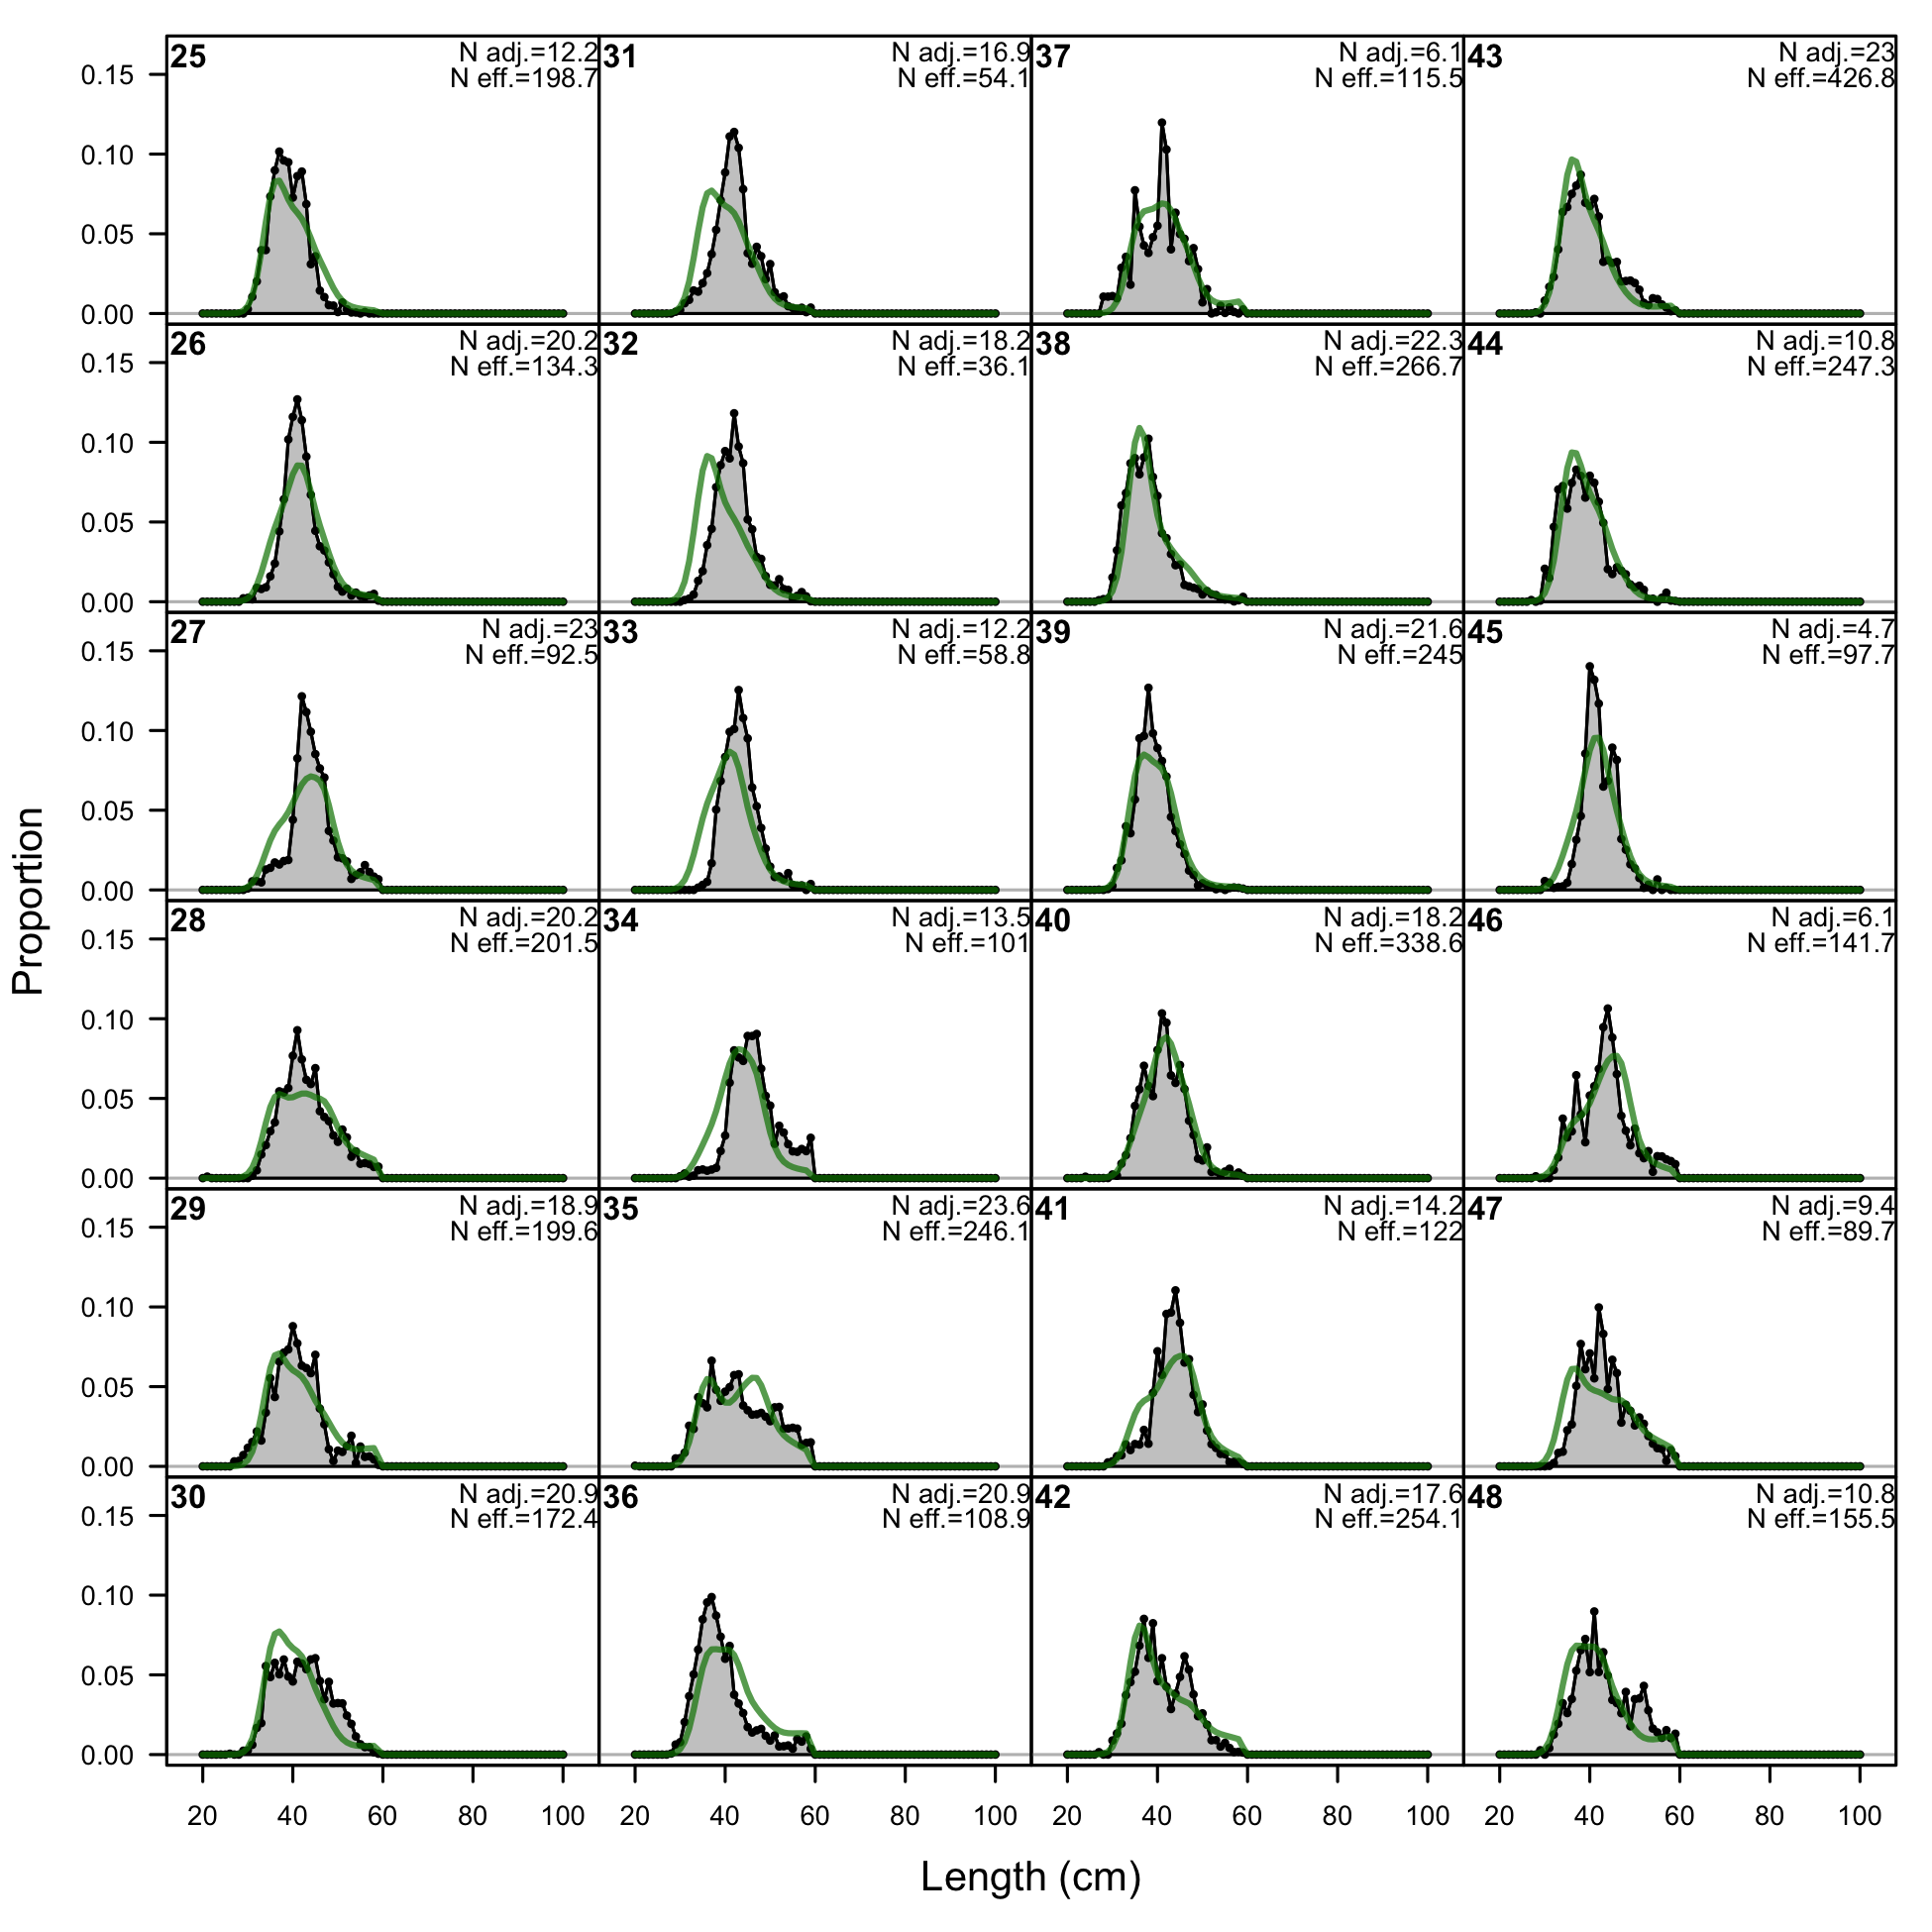
Length comps, retained, F1-OBJ_Offshore_Small (plot 1 of 3).
'N adj.' is the input sample size after data-weighting adjustment. N eff. is the calculated effective sample size used in the McAllister-Ianelli tuning method.
file: comp_lenfit_flt1mkt2_page1.png

Length comps, retained, F1-OBJ_Offshore_Small (plot 1 of 3).
'N adj.' is the input sample size after data-weighting adjustment. N eff. is the calculated effective sample size used in the McAllister-Ianelli tuning method. (plot 2 of 3)
file: comp_lenfit_flt1mkt2_page2.png

Length comps, retained, F1-OBJ_Offshore_Small (plot 1 of 3).
'N adj.' is the input sample size after data-weighting adjustment. N eff. is the calculated effective sample size used in the McAllister-Ianelli tuning method. (plot 2 of 3) (plot 3 of 3)
file: comp_lenfit_flt1mkt2_page3.png
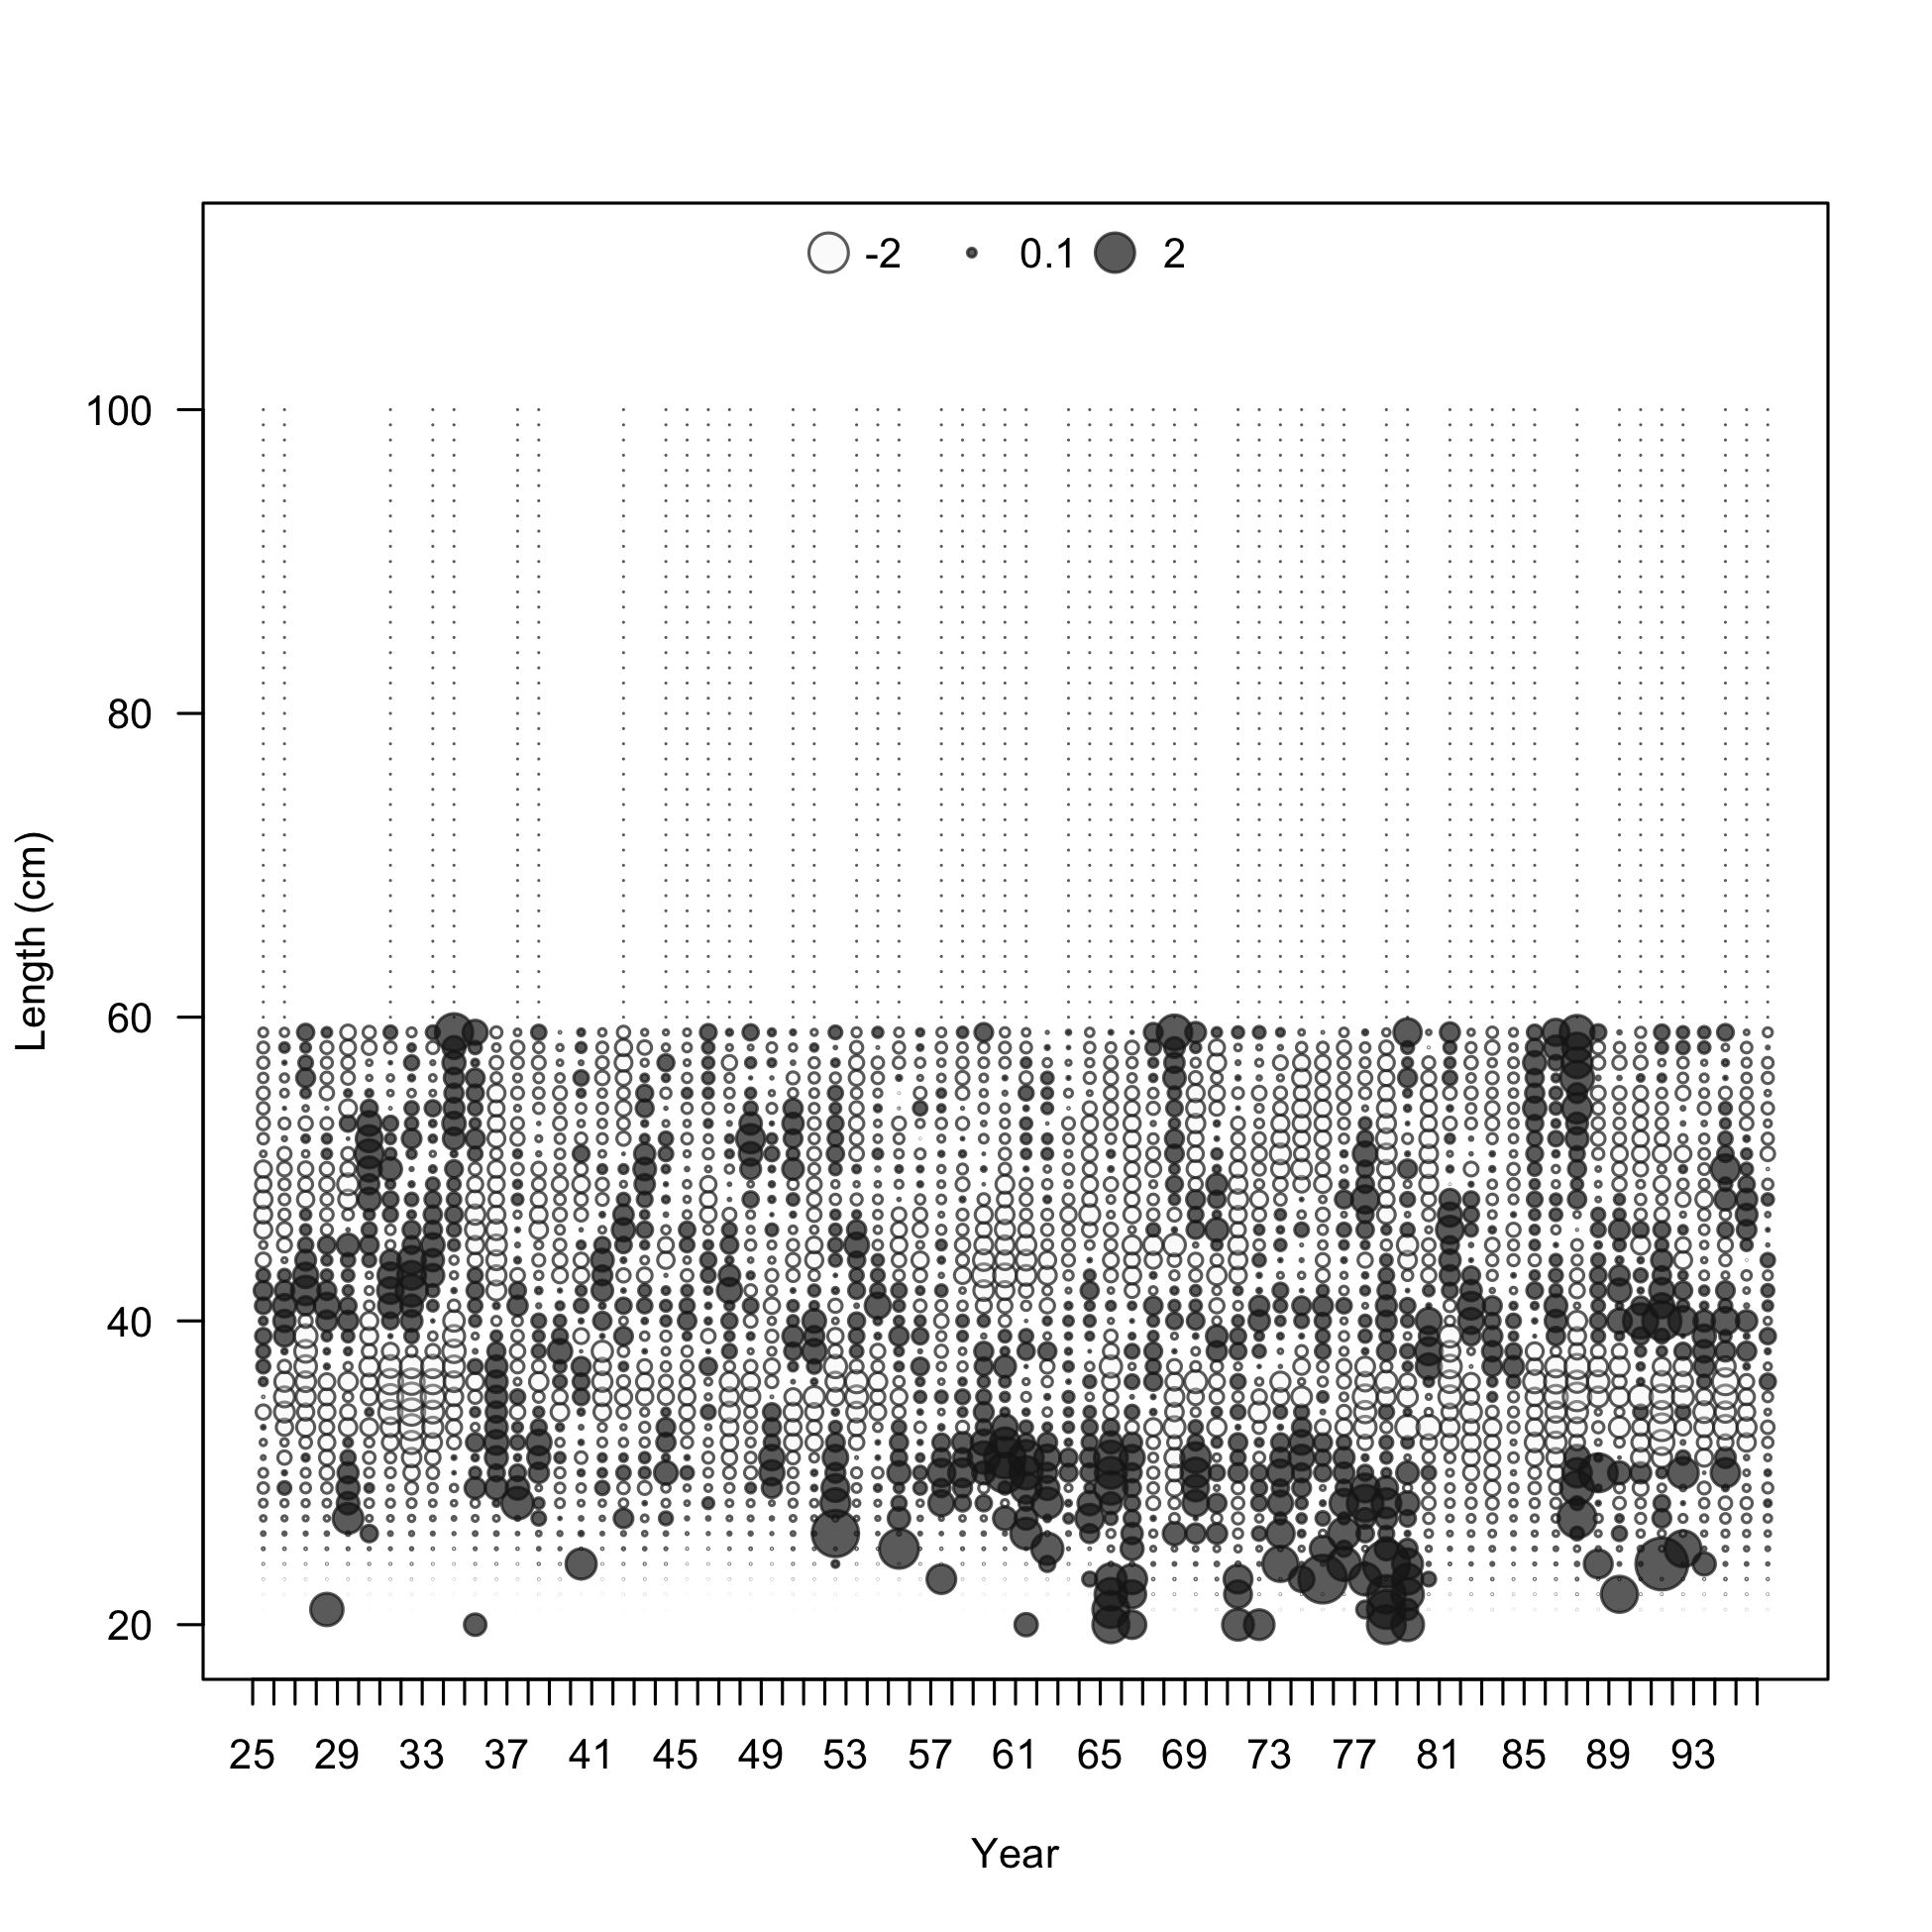
Pearson residuals, retained, F1-OBJ_Offshore_Small (max=3.49) (plot 3 of 3)
Closed bubbles are positive residuals (observed > expected) and open bubbles are negative residuals (observed < expected).
file: comp_lenfit_residsflt1mkt2_page3.png
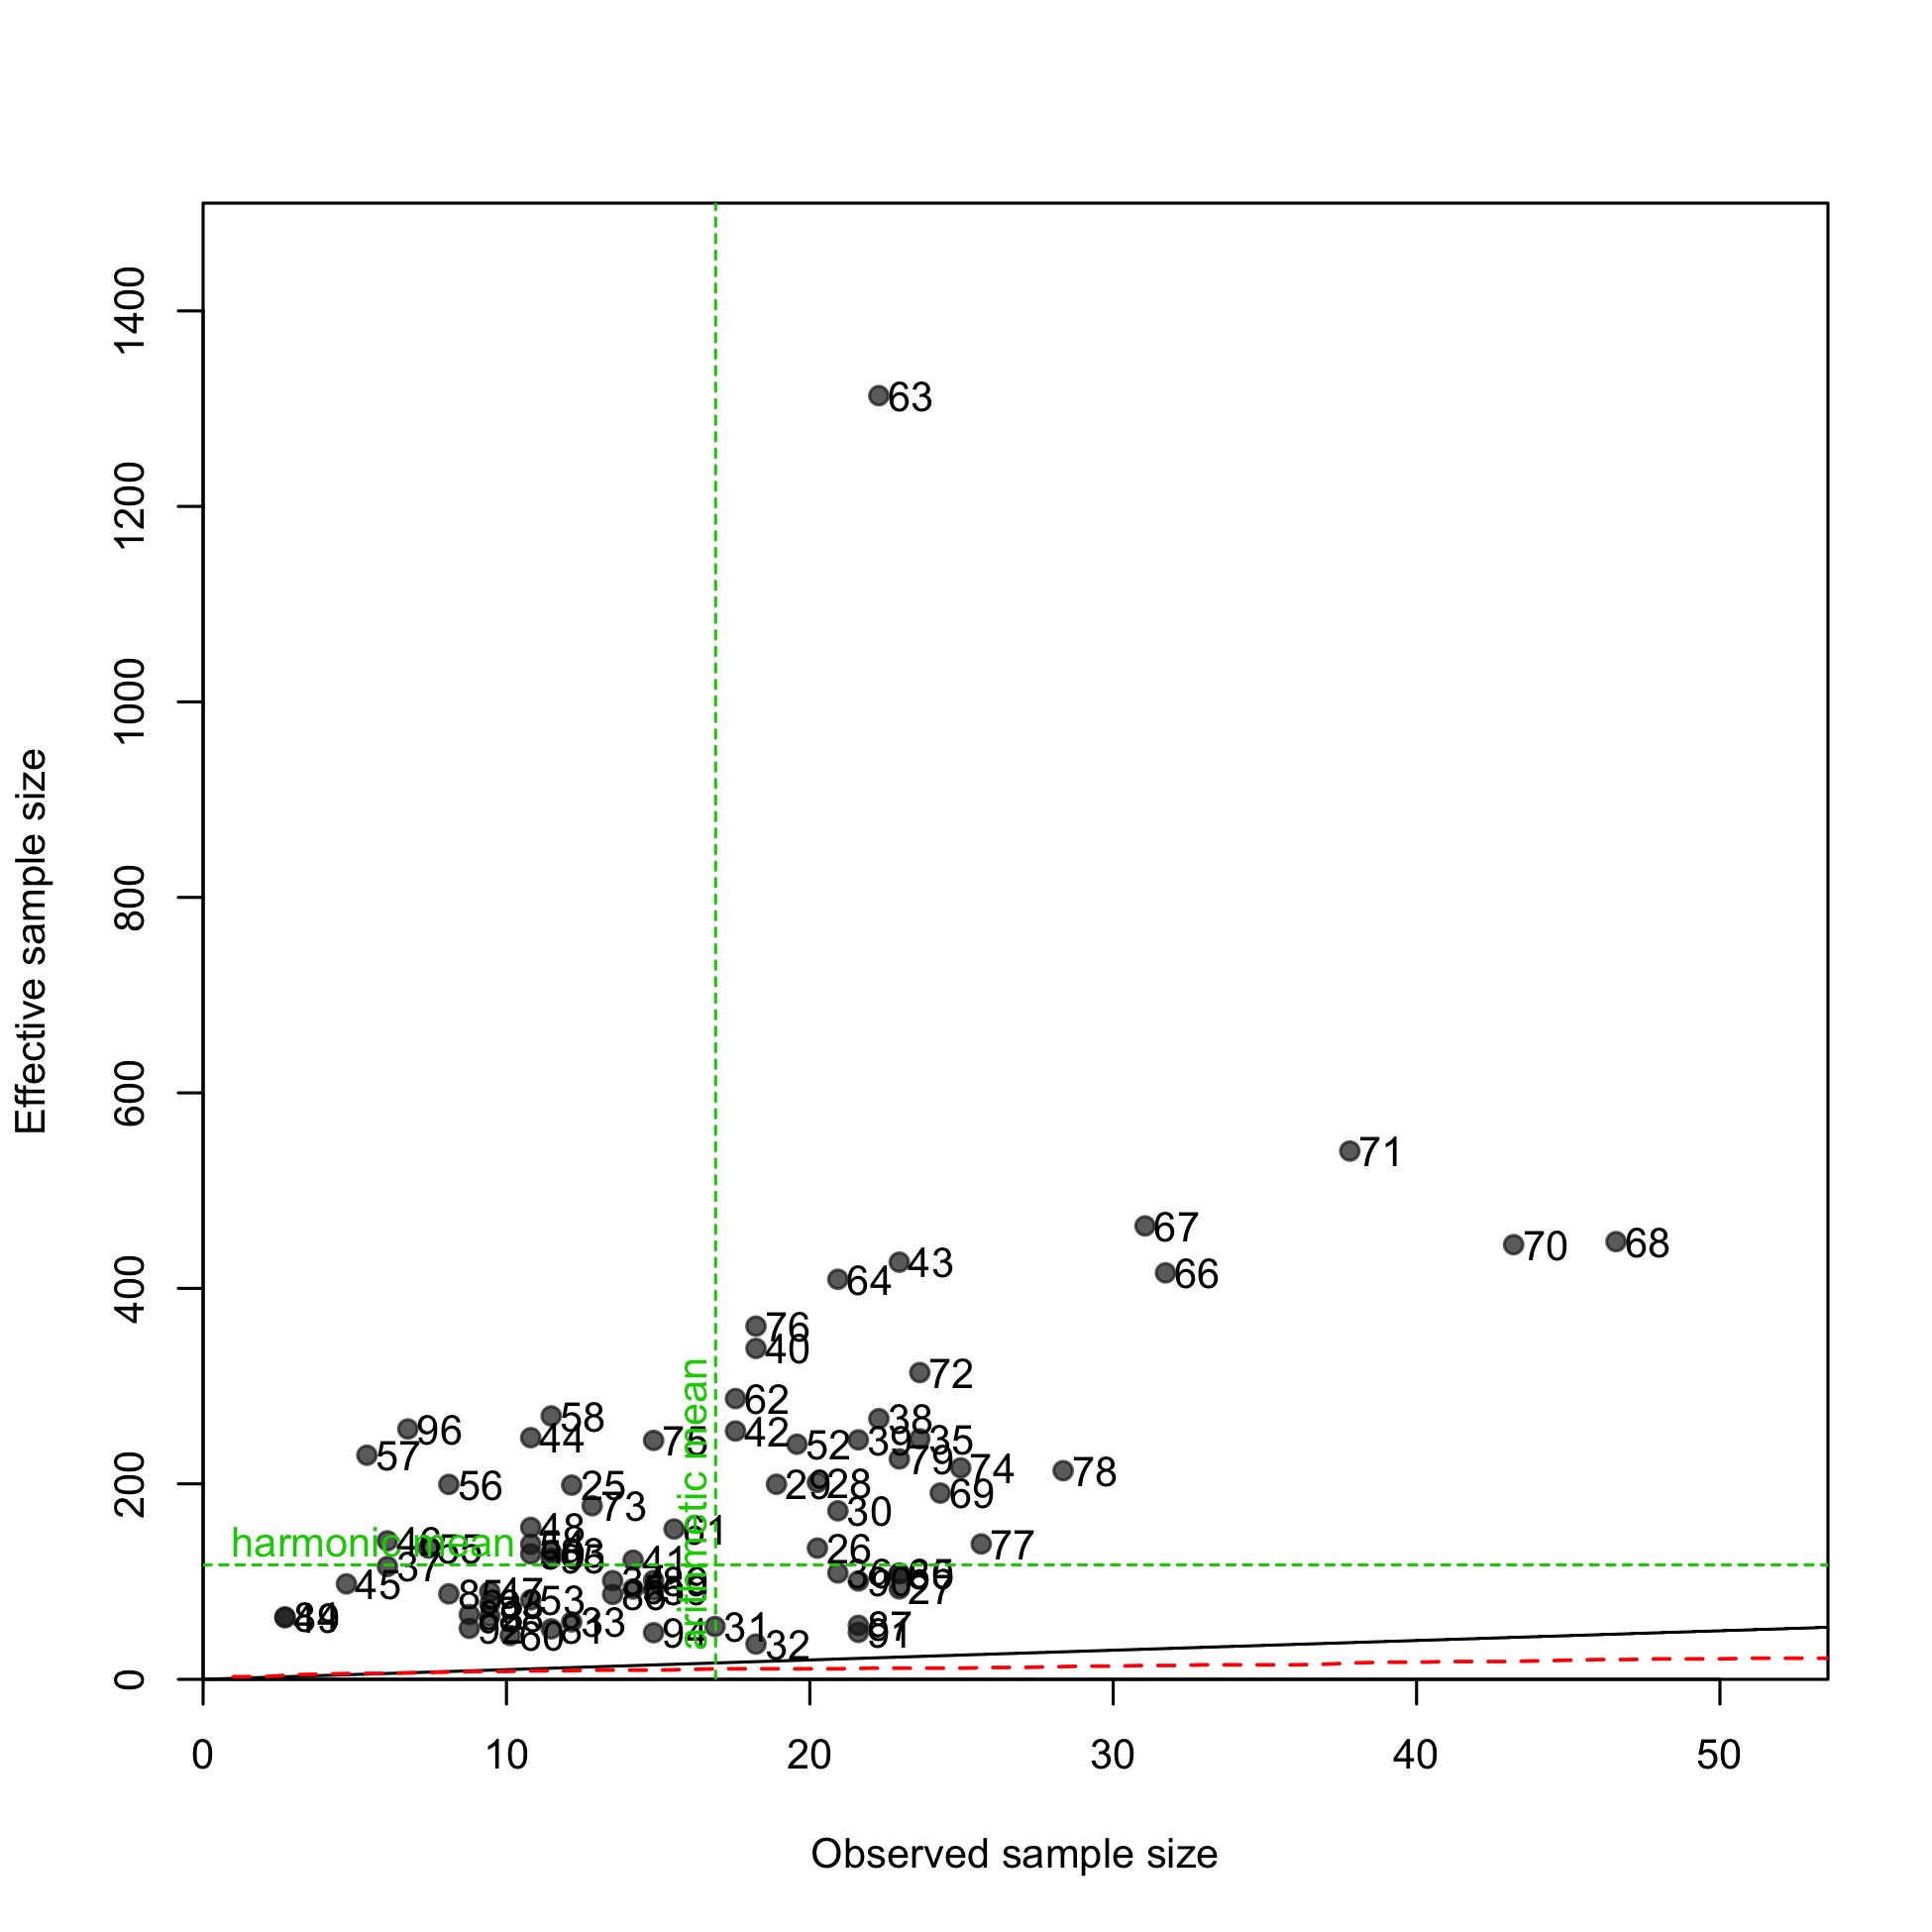
N-EffN comparison, Length comps, retained, F1-OBJ_Offshore_Small
file: comp_lenfit_sampsize_flt1mkt2.png

Mean length for F1-OBJ_Offshore_Small with 95% confidence intervals based on current sample sizes.
Francis data weighting method TA1.8: thinner intervals (with capped ends) show result of further adjusting sample sizes based on suggested multiplier (with 95% interval) for len data from F1-OBJ_Offshore_Small:
1.1606 (0.9044-1.6689)
For more info, see Francis (2011).
file: comp_lenfit_data_weighting_TA1.8_F1-OBJ_Offshore_Small.png
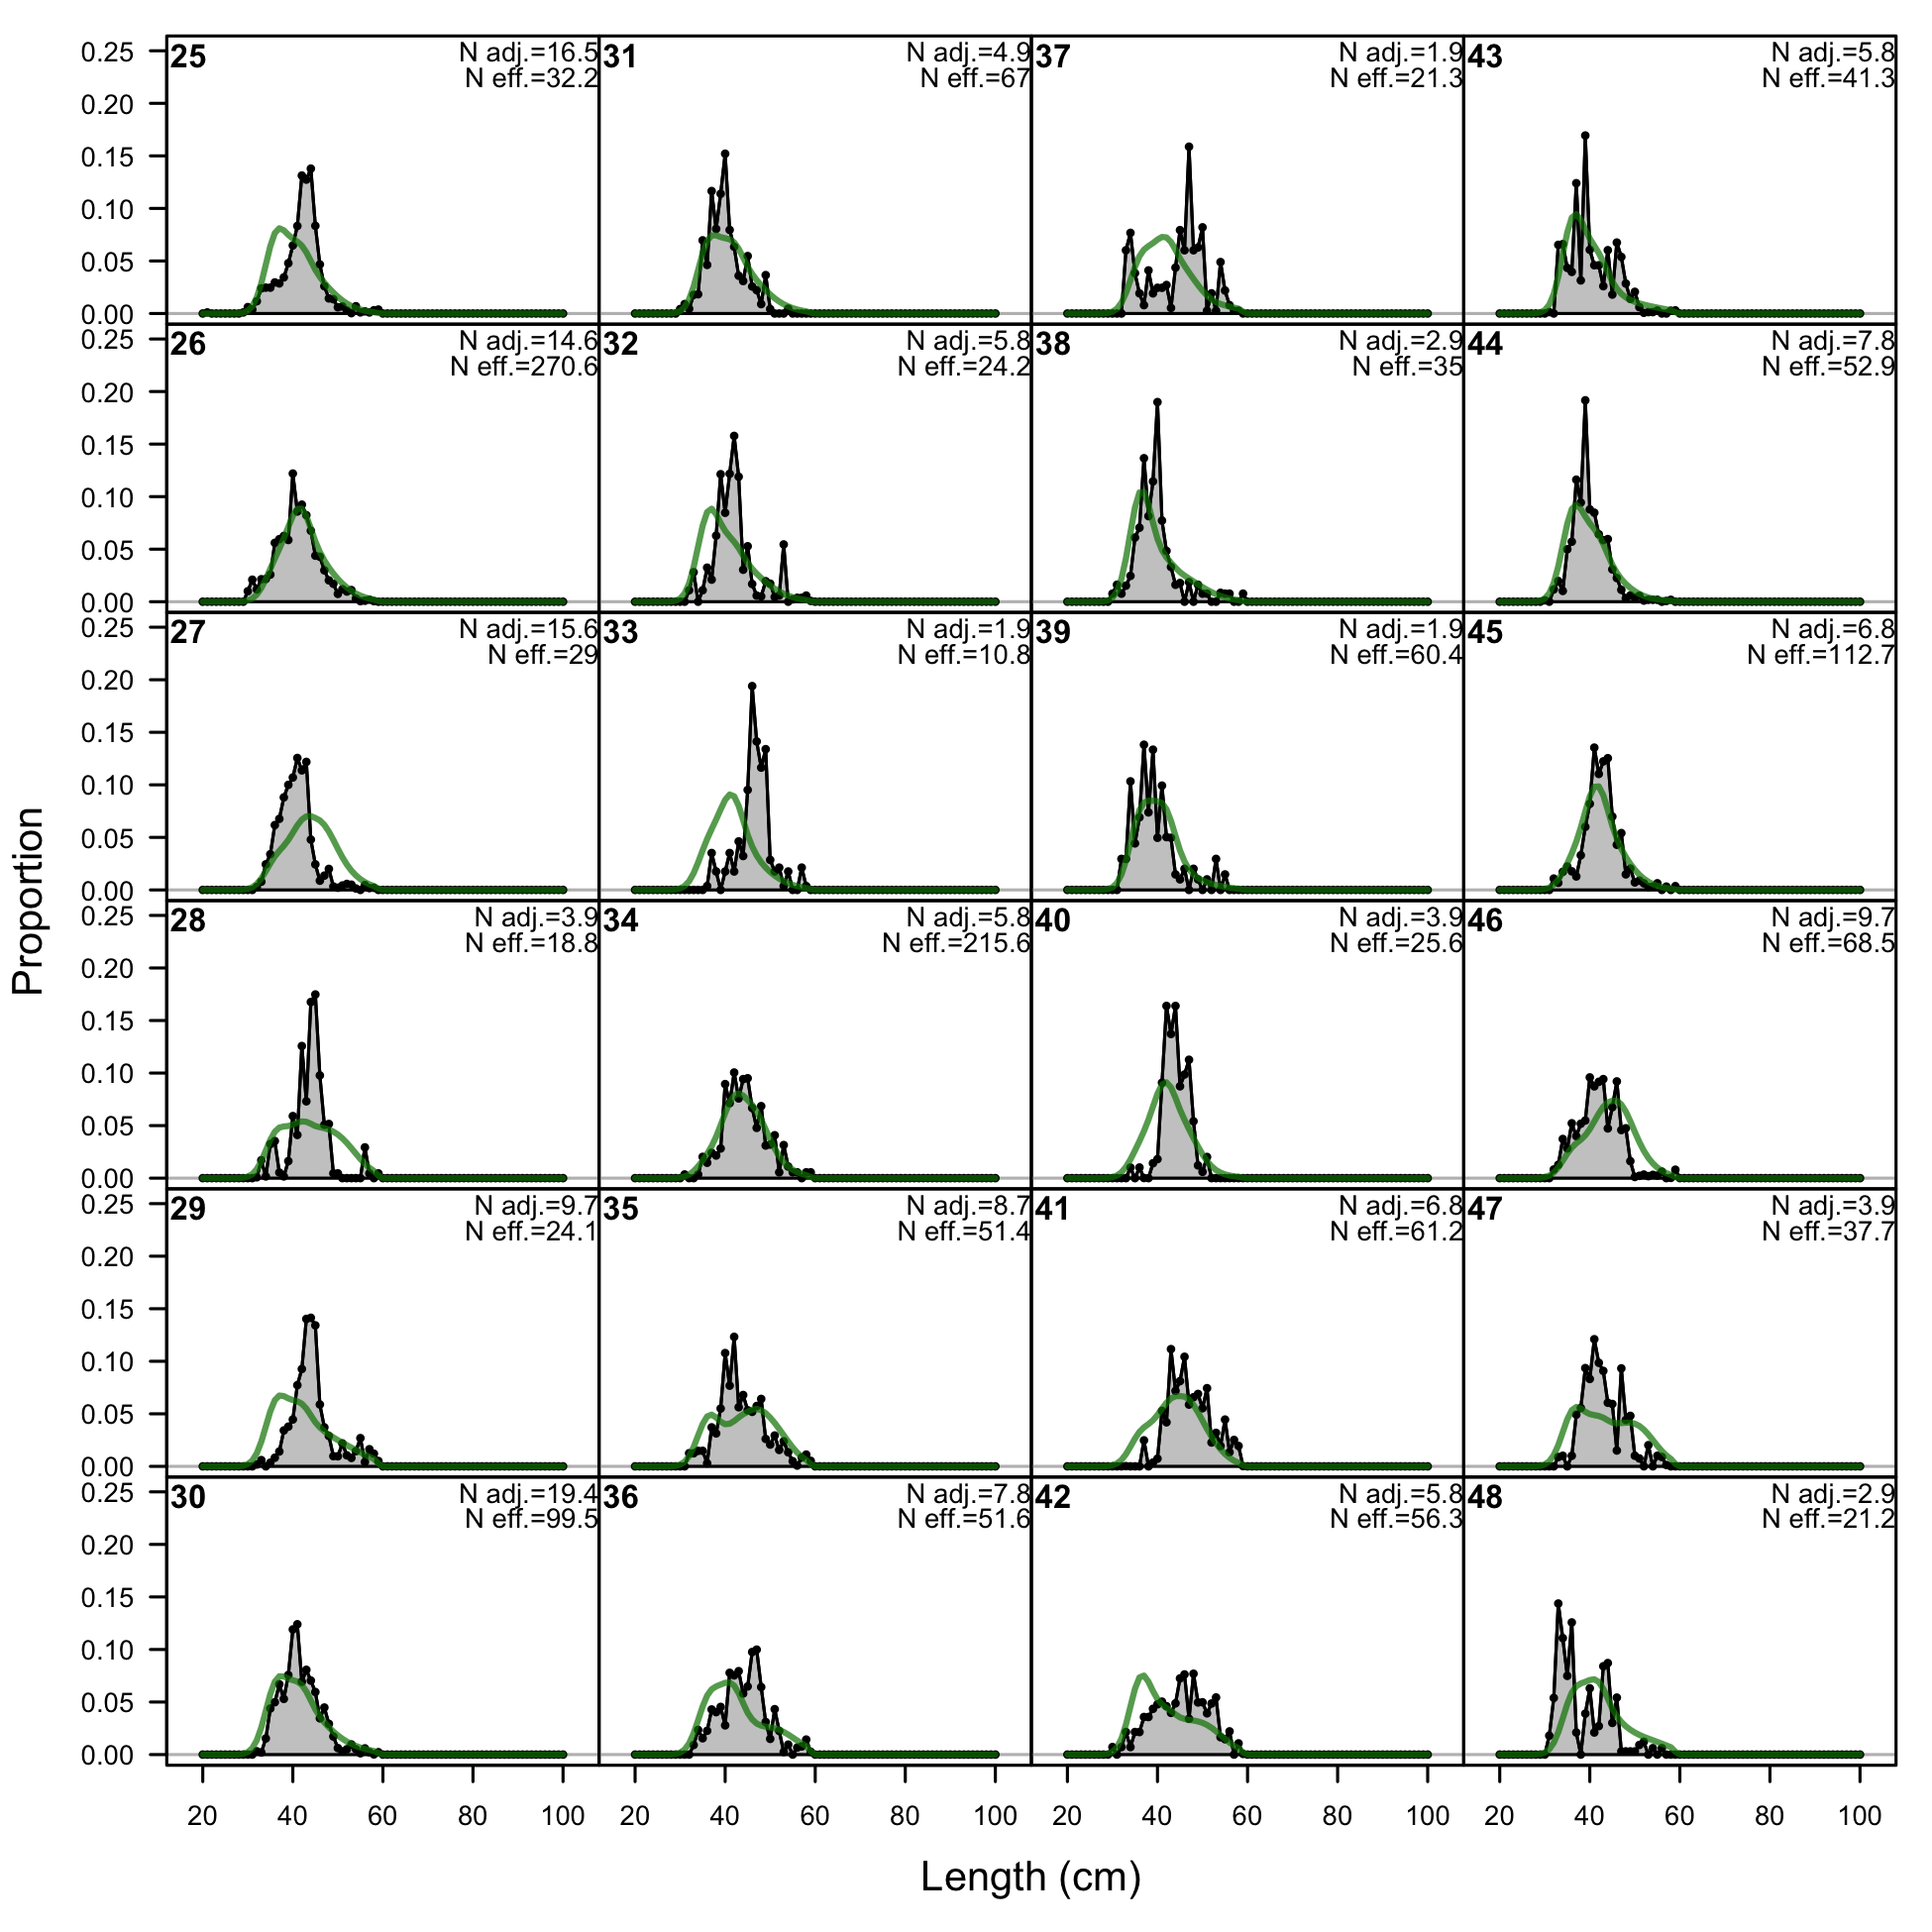
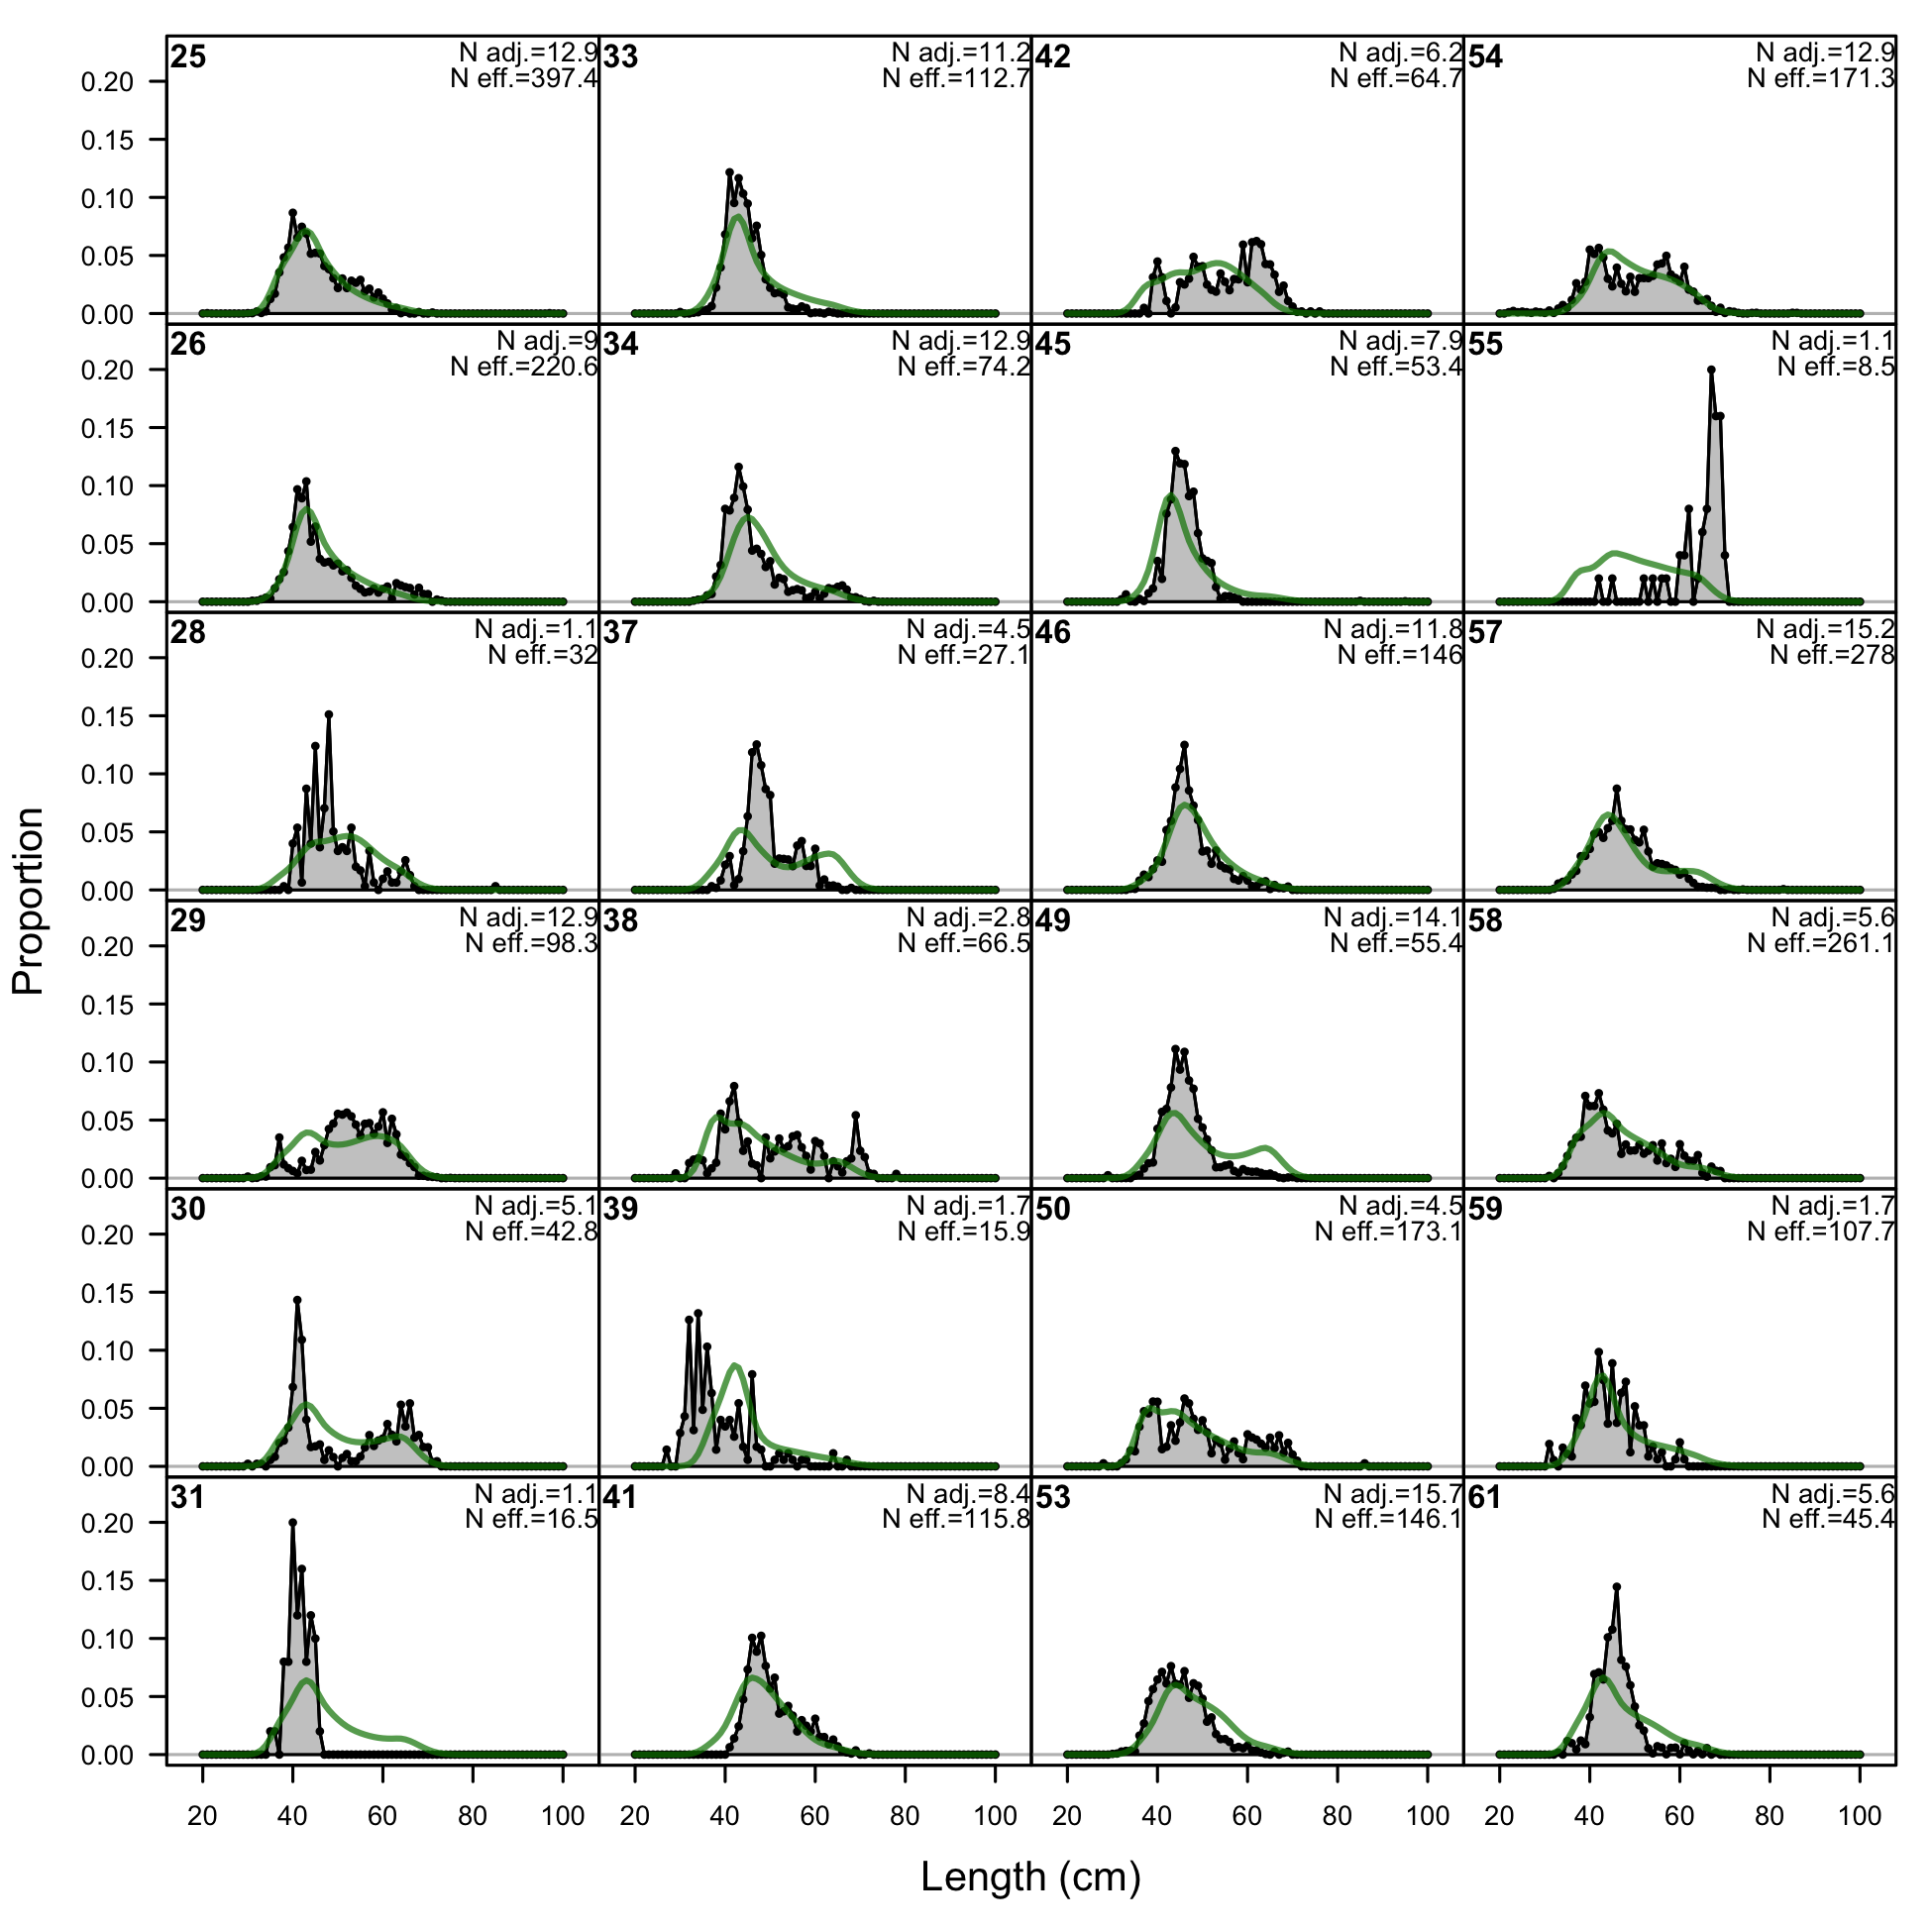
Length comps, retained, F2-OBJ_Offshore_Large (plot 1 of 3).
'N adj.' is the input sample size after data-weighting adjustment. N eff. is the calculated effective sample size used in the McAllister-Ianelli tuning method.
file: comp_lenfit_flt2mkt2_page1.png
Length comps, retained, F2-OBJ_Offshore_Large (plot 1 of 3).
'N adj.' is the input sample size after data-weighting adjustment. N eff. is the calculated effective sample size used in the McAllister-Ianelli tuning method. (plot 2 of 3)
file: comp_lenfit_flt2mkt2_page2.png
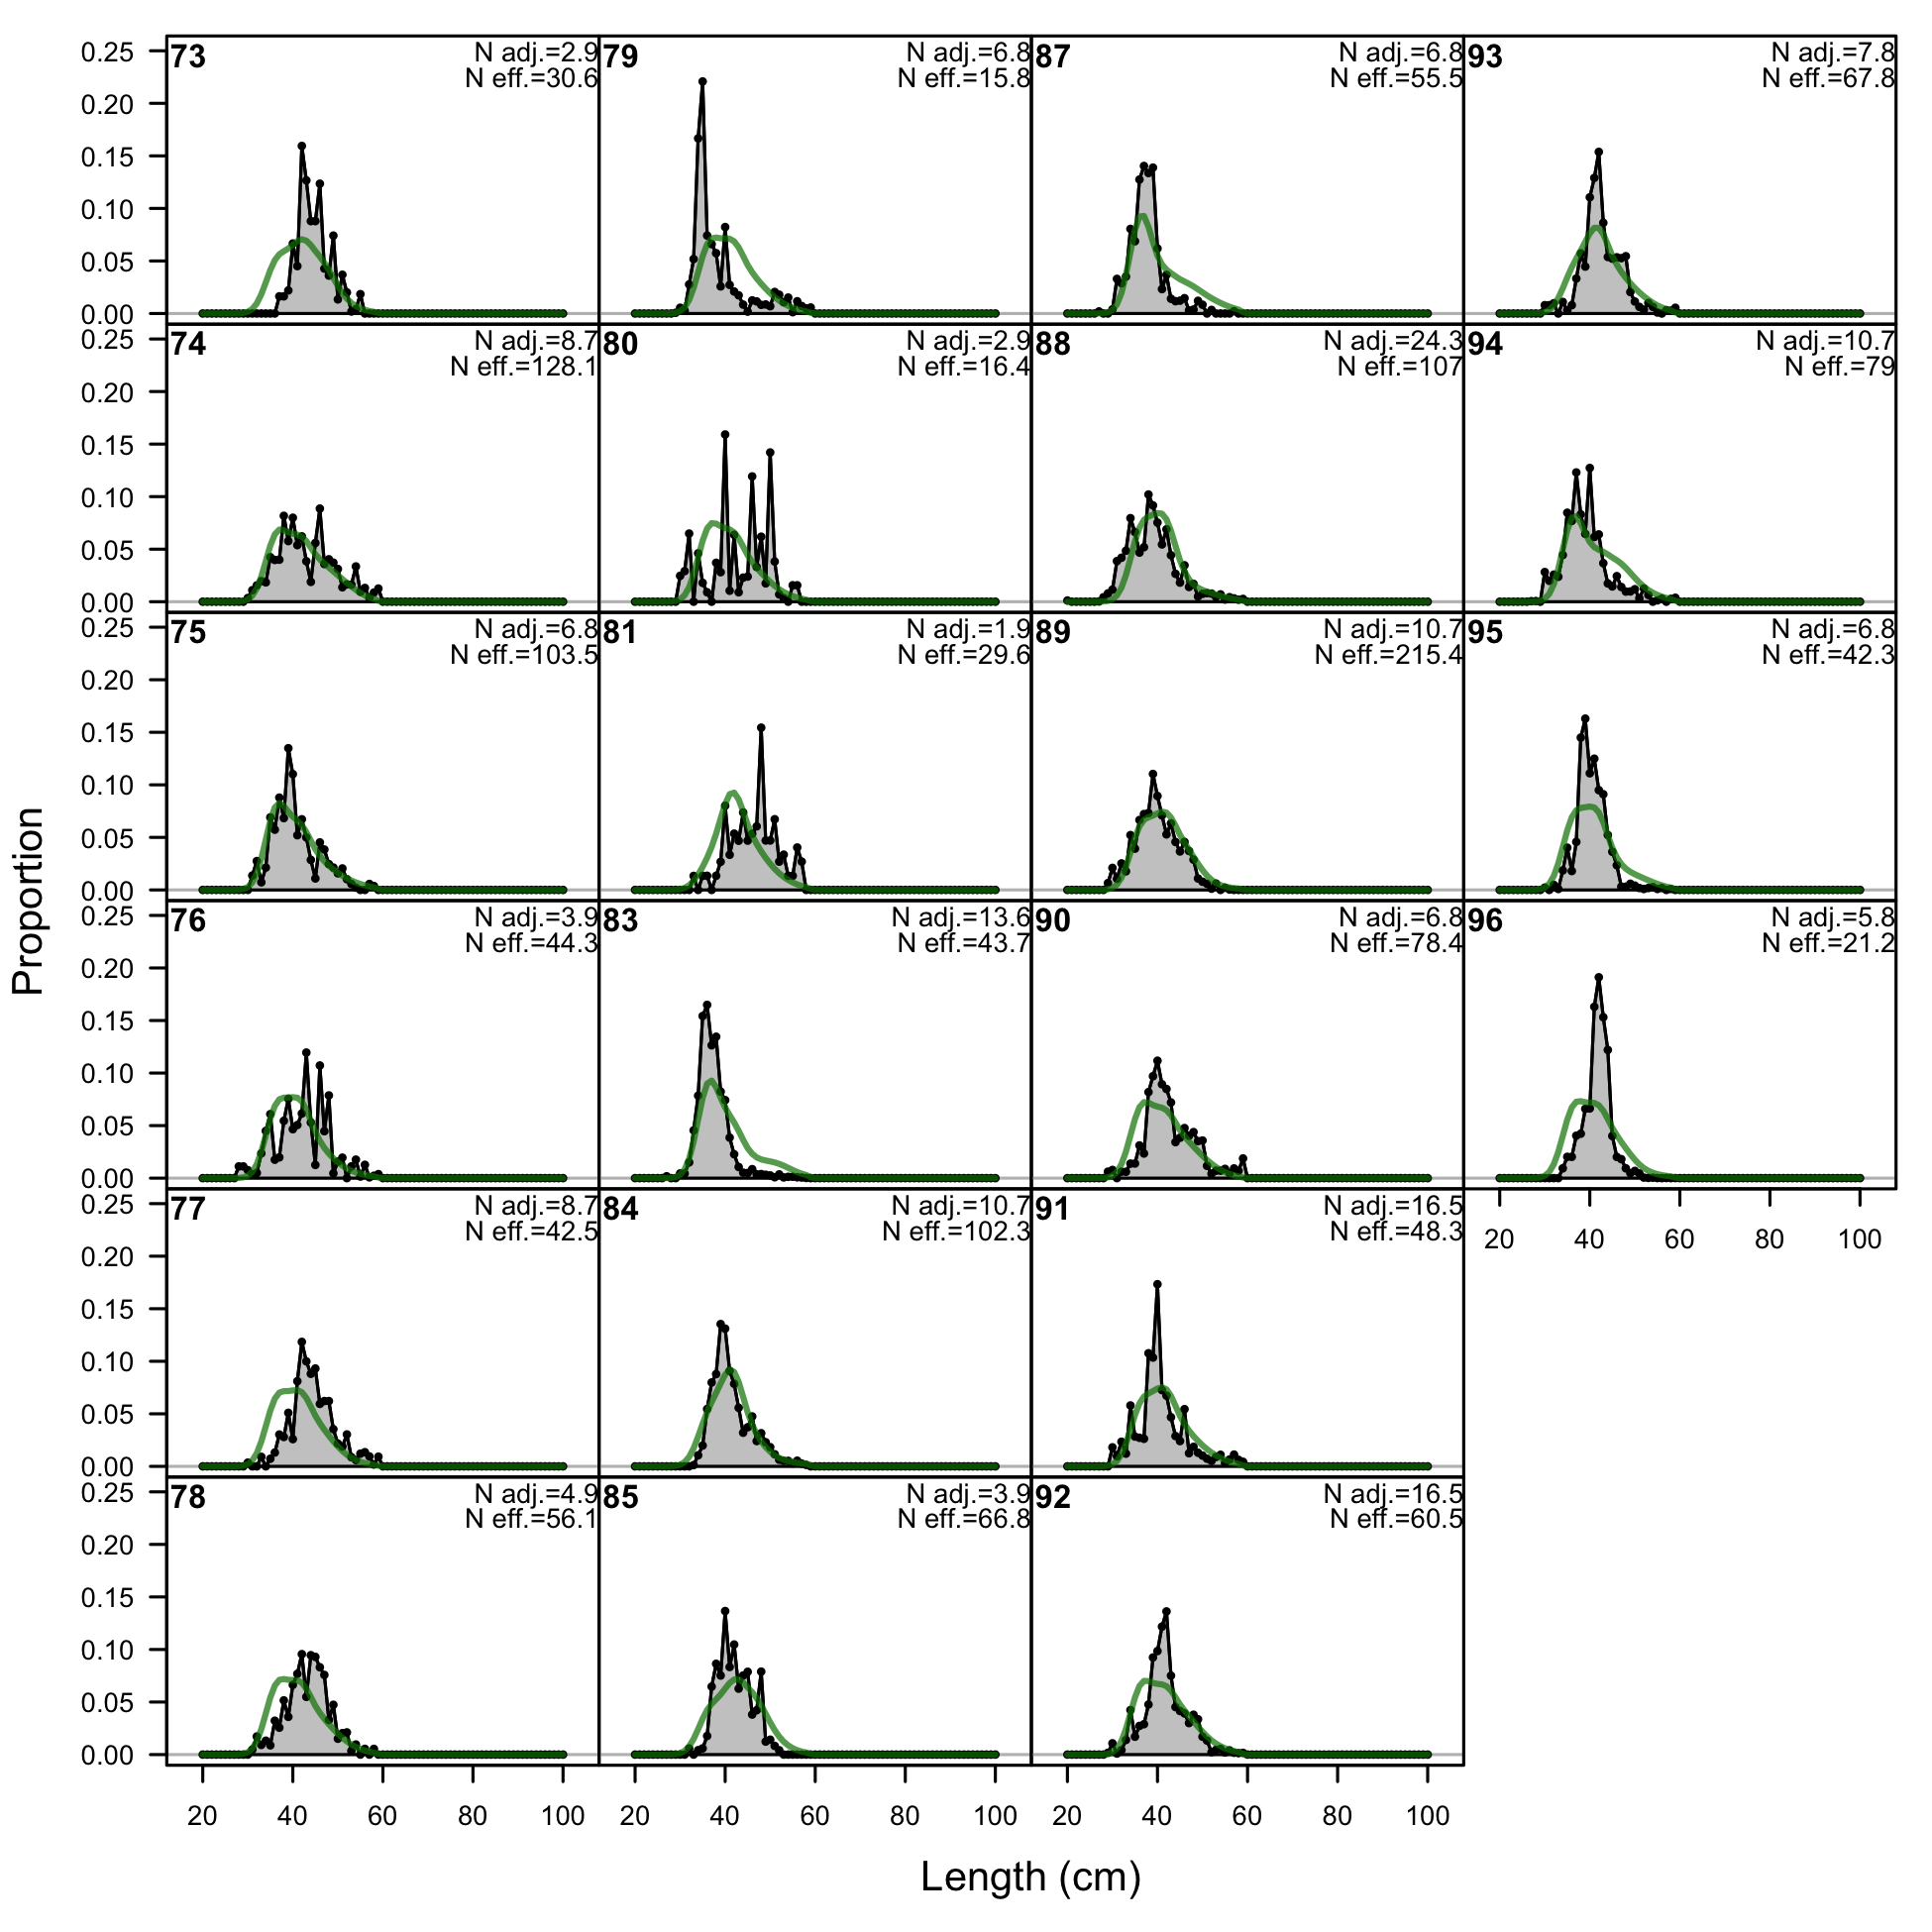
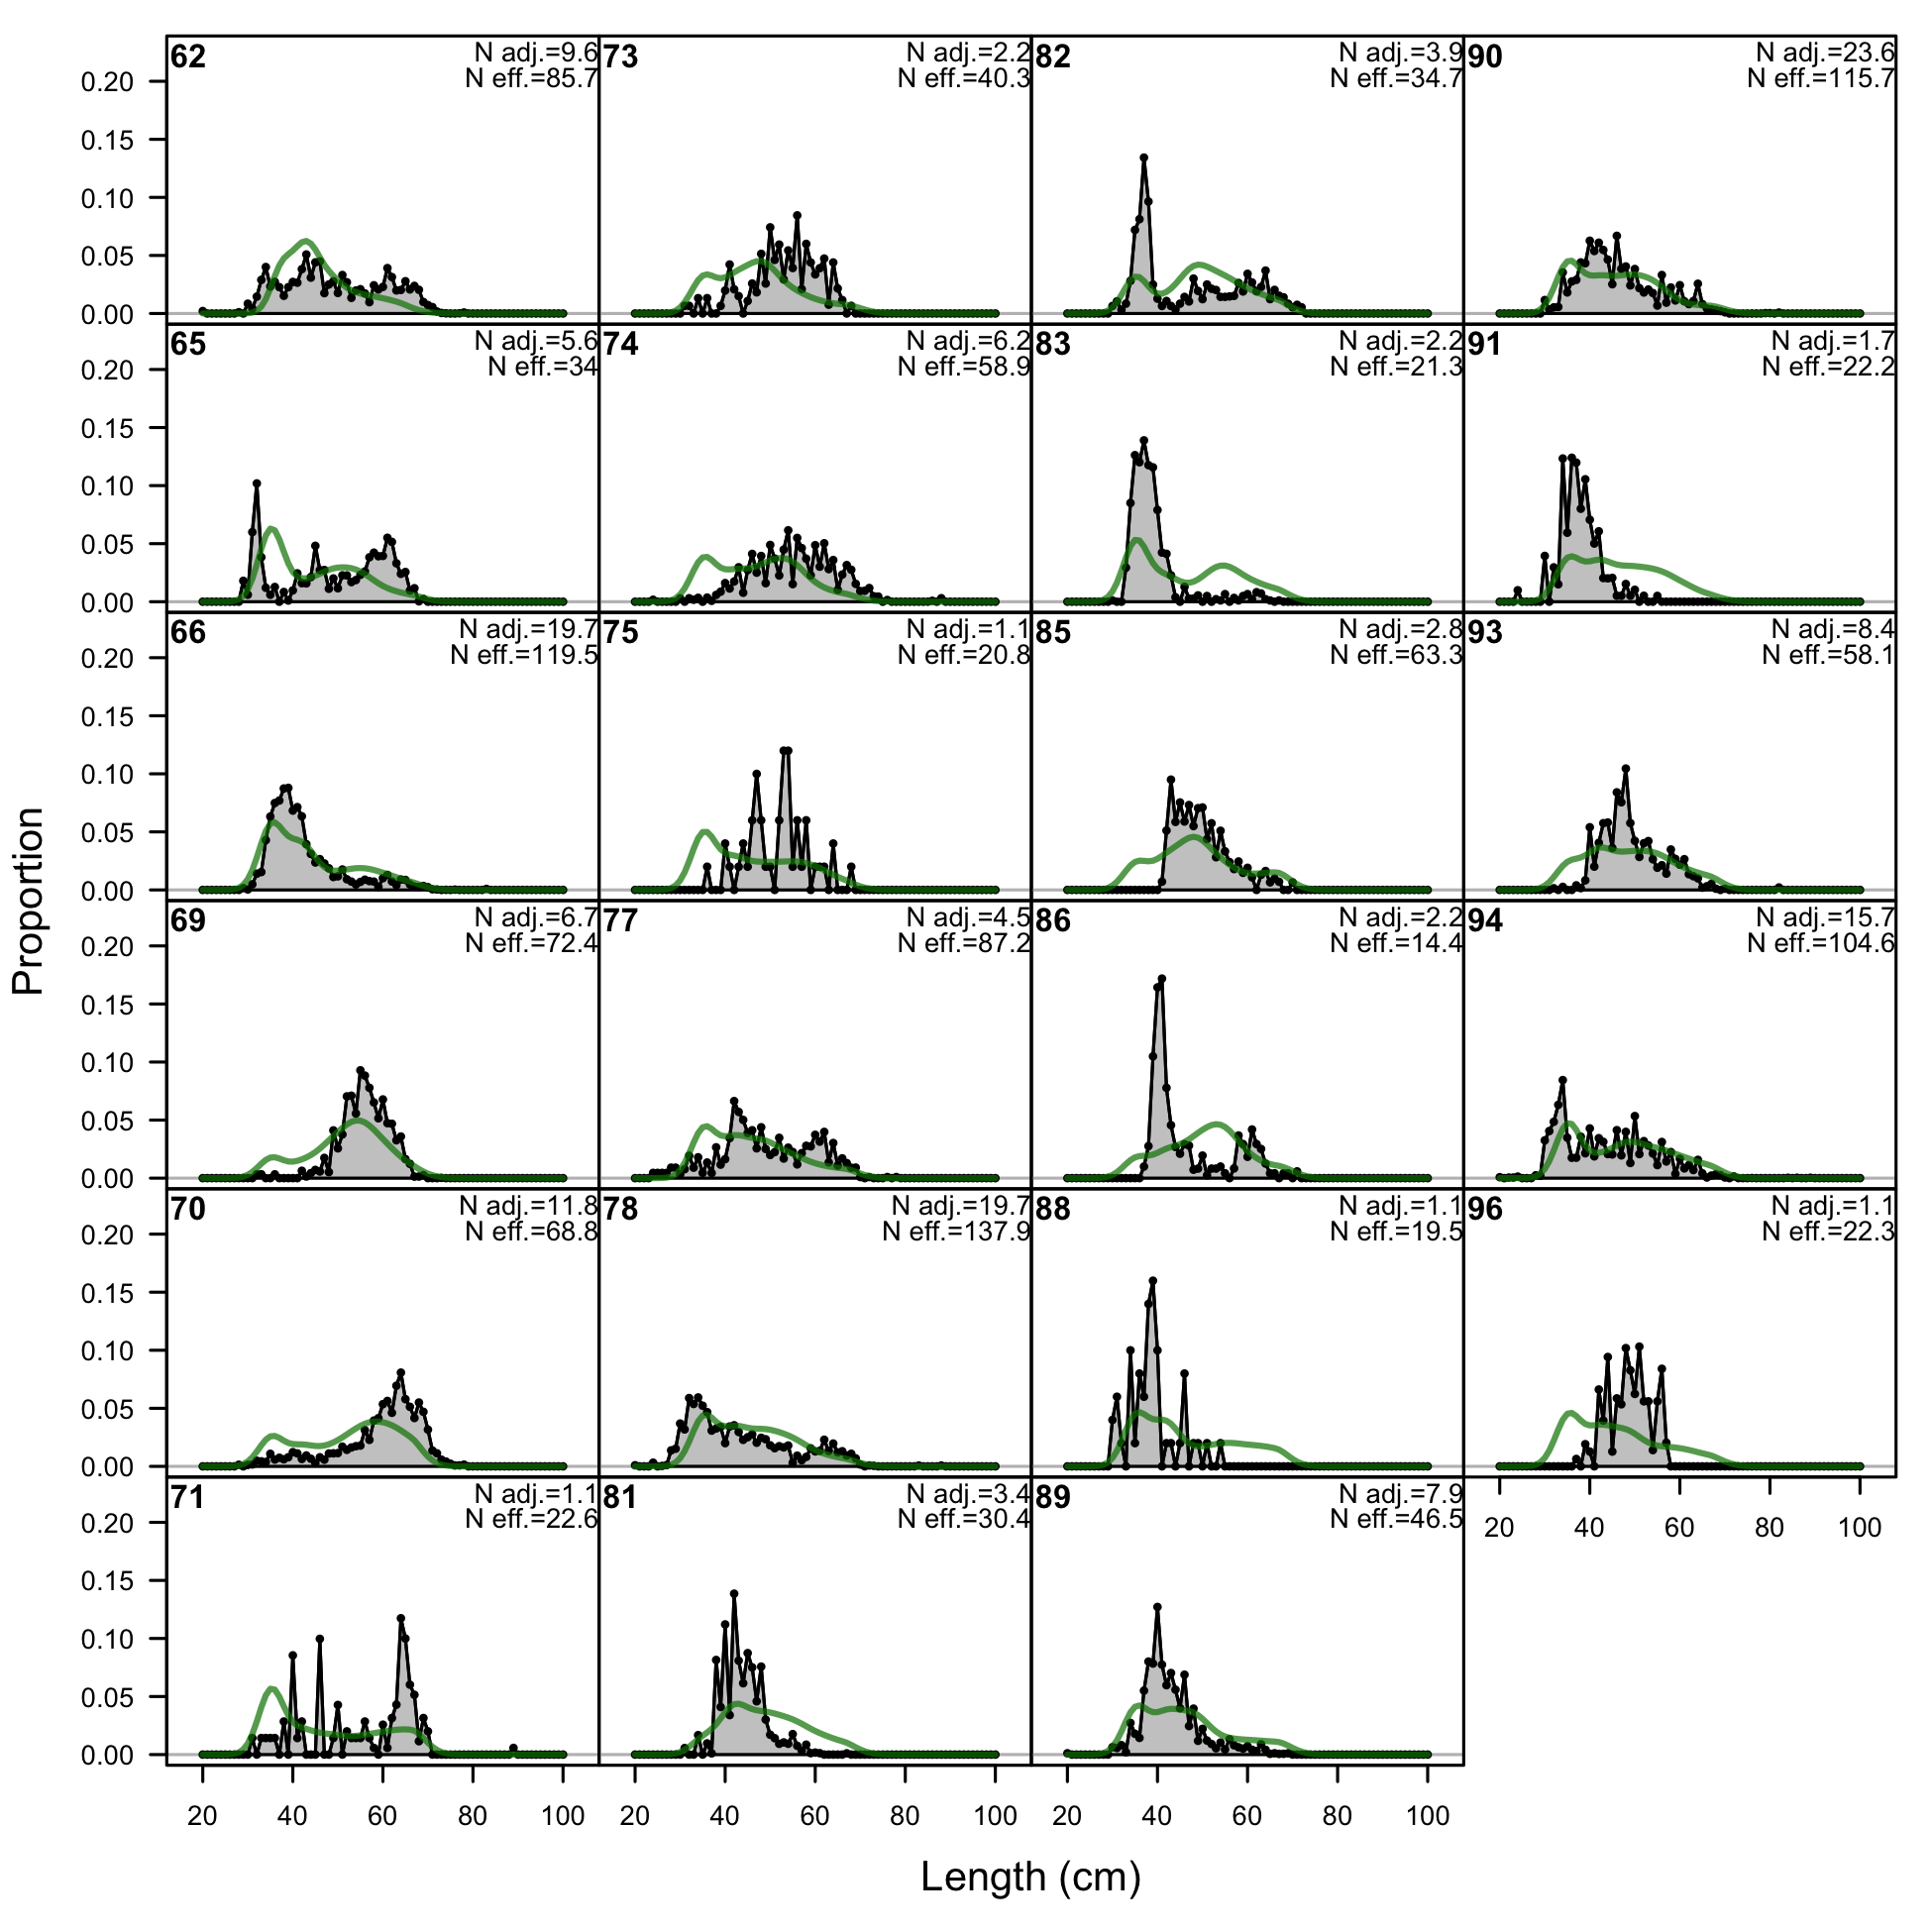
Length comps, retained, F2-OBJ_Offshore_Large (plot 1 of 3).
'N adj.' is the input sample size after data-weighting adjustment. N eff. is the calculated effective sample size used in the McAllister-Ianelli tuning method. (plot 2 of 3) (plot 3 of 3)
file: comp_lenfit_flt2mkt2_page3.png
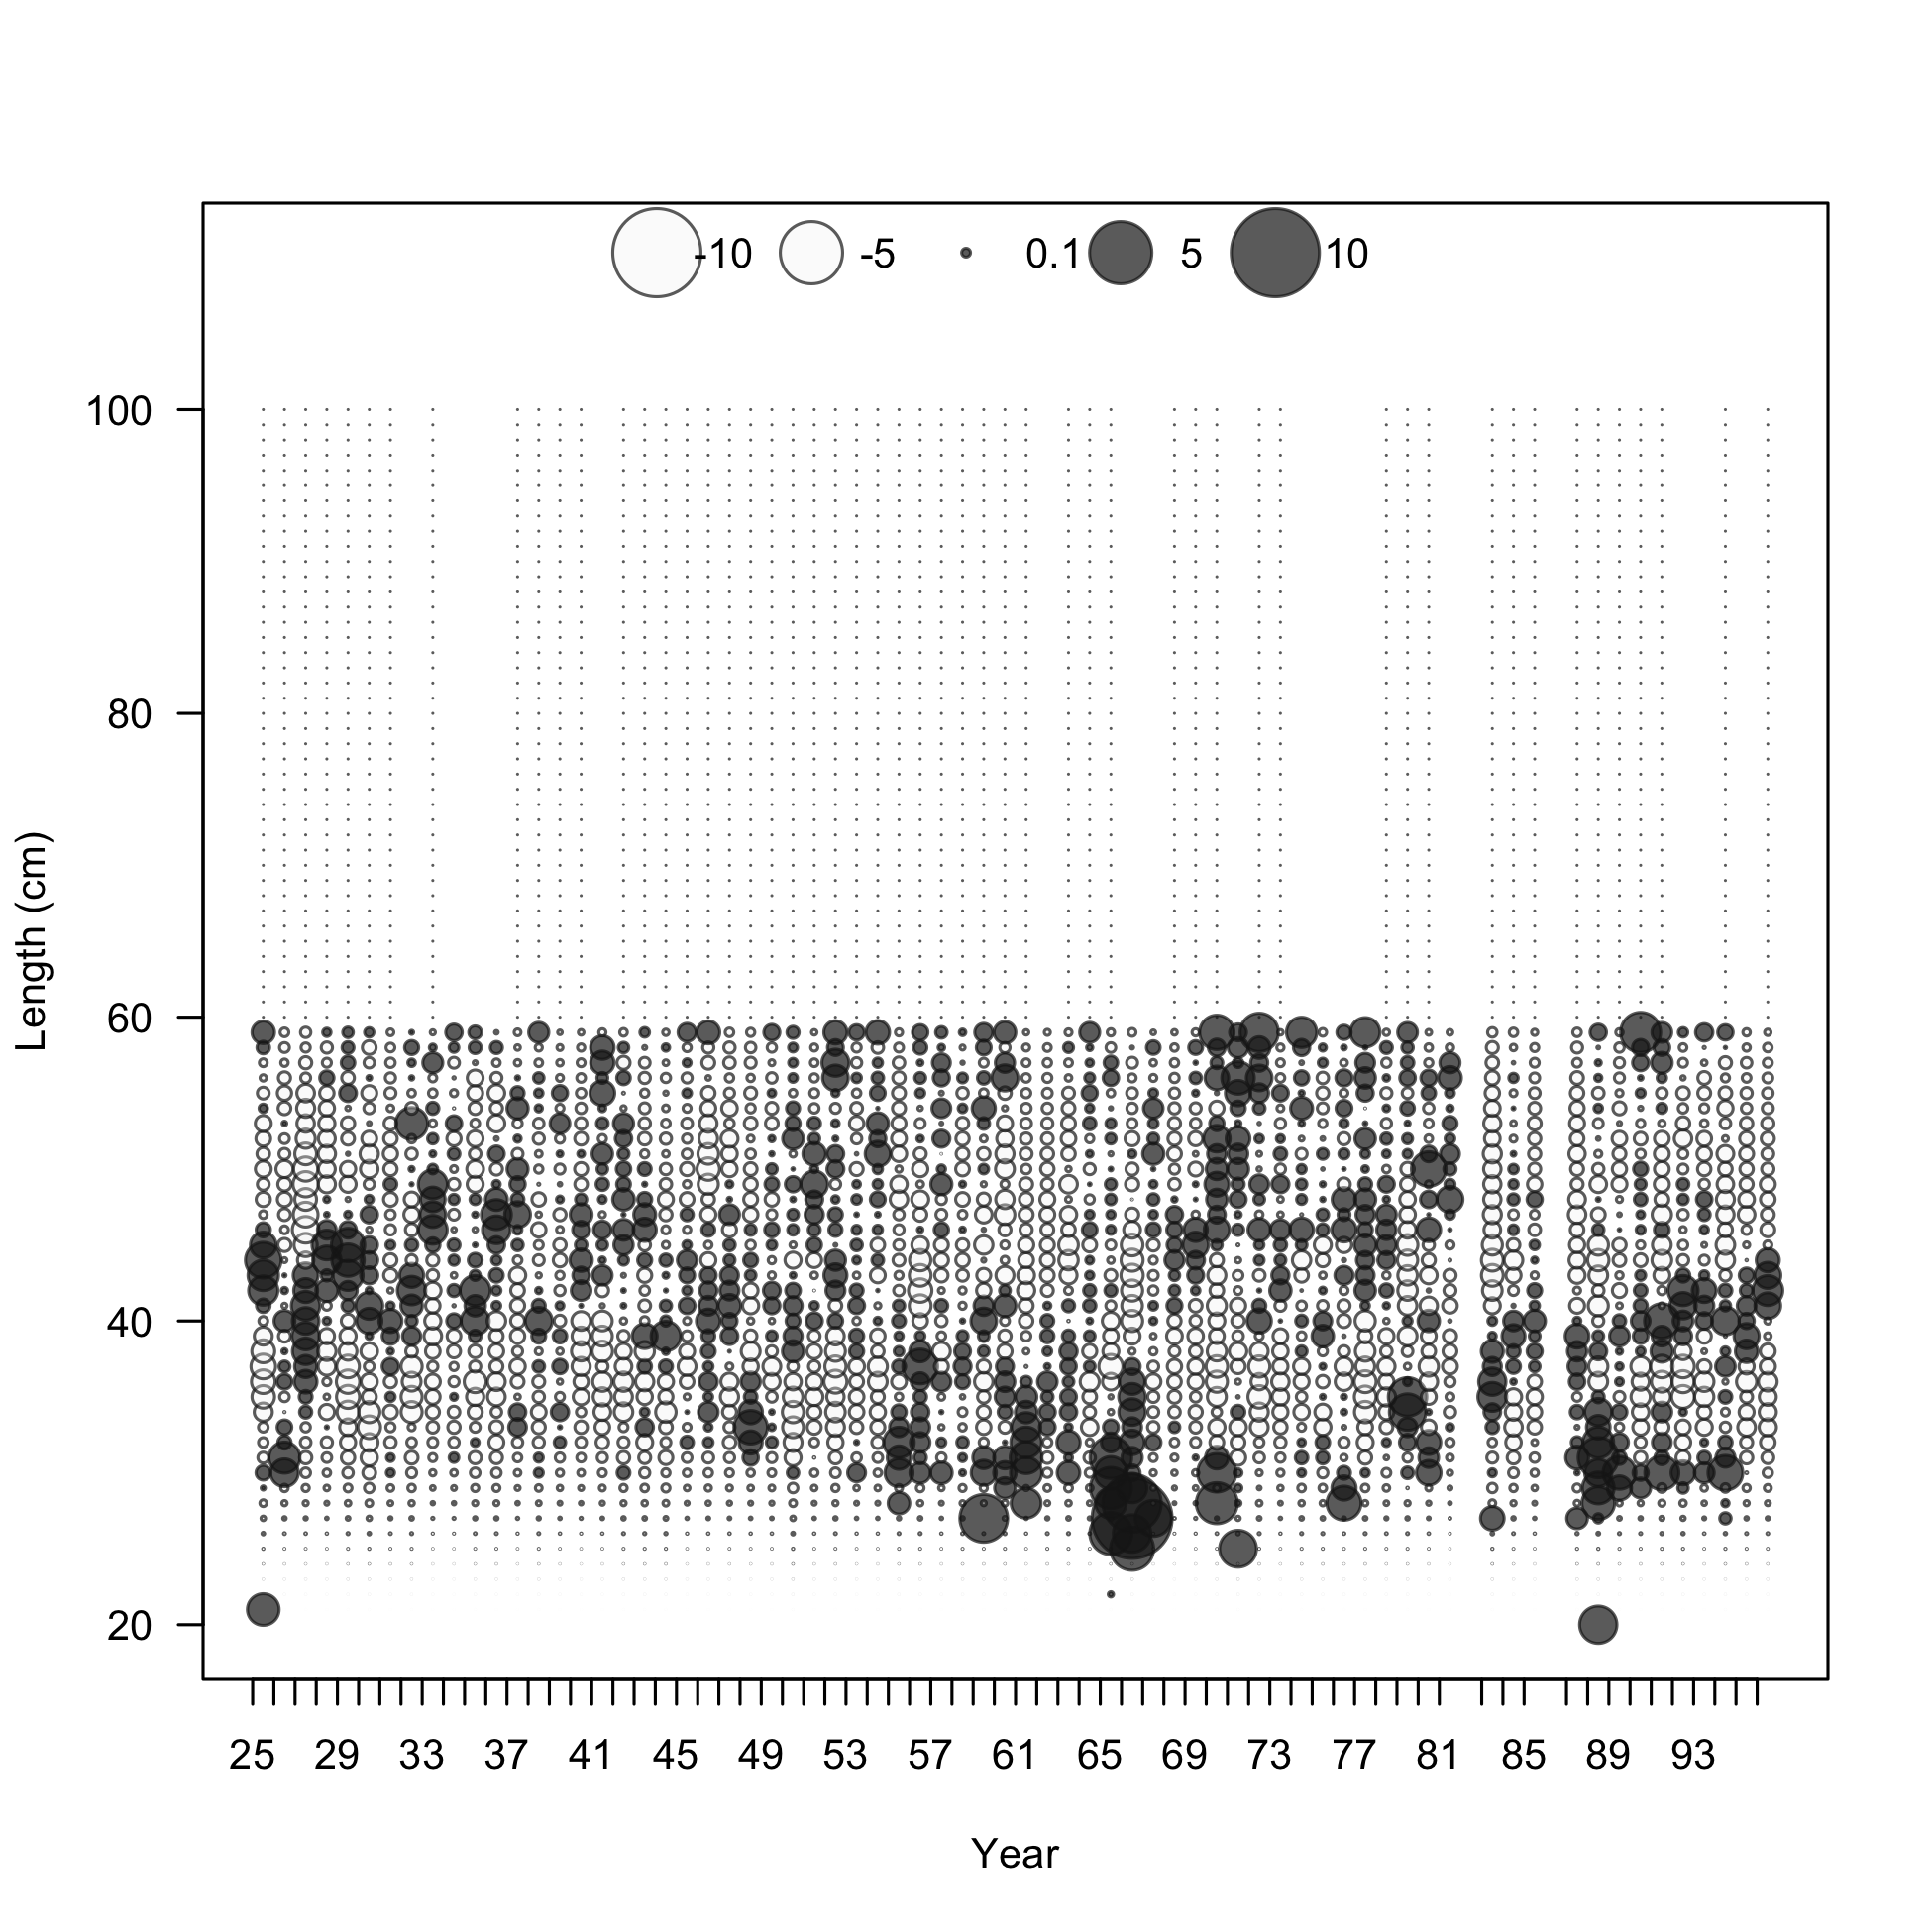
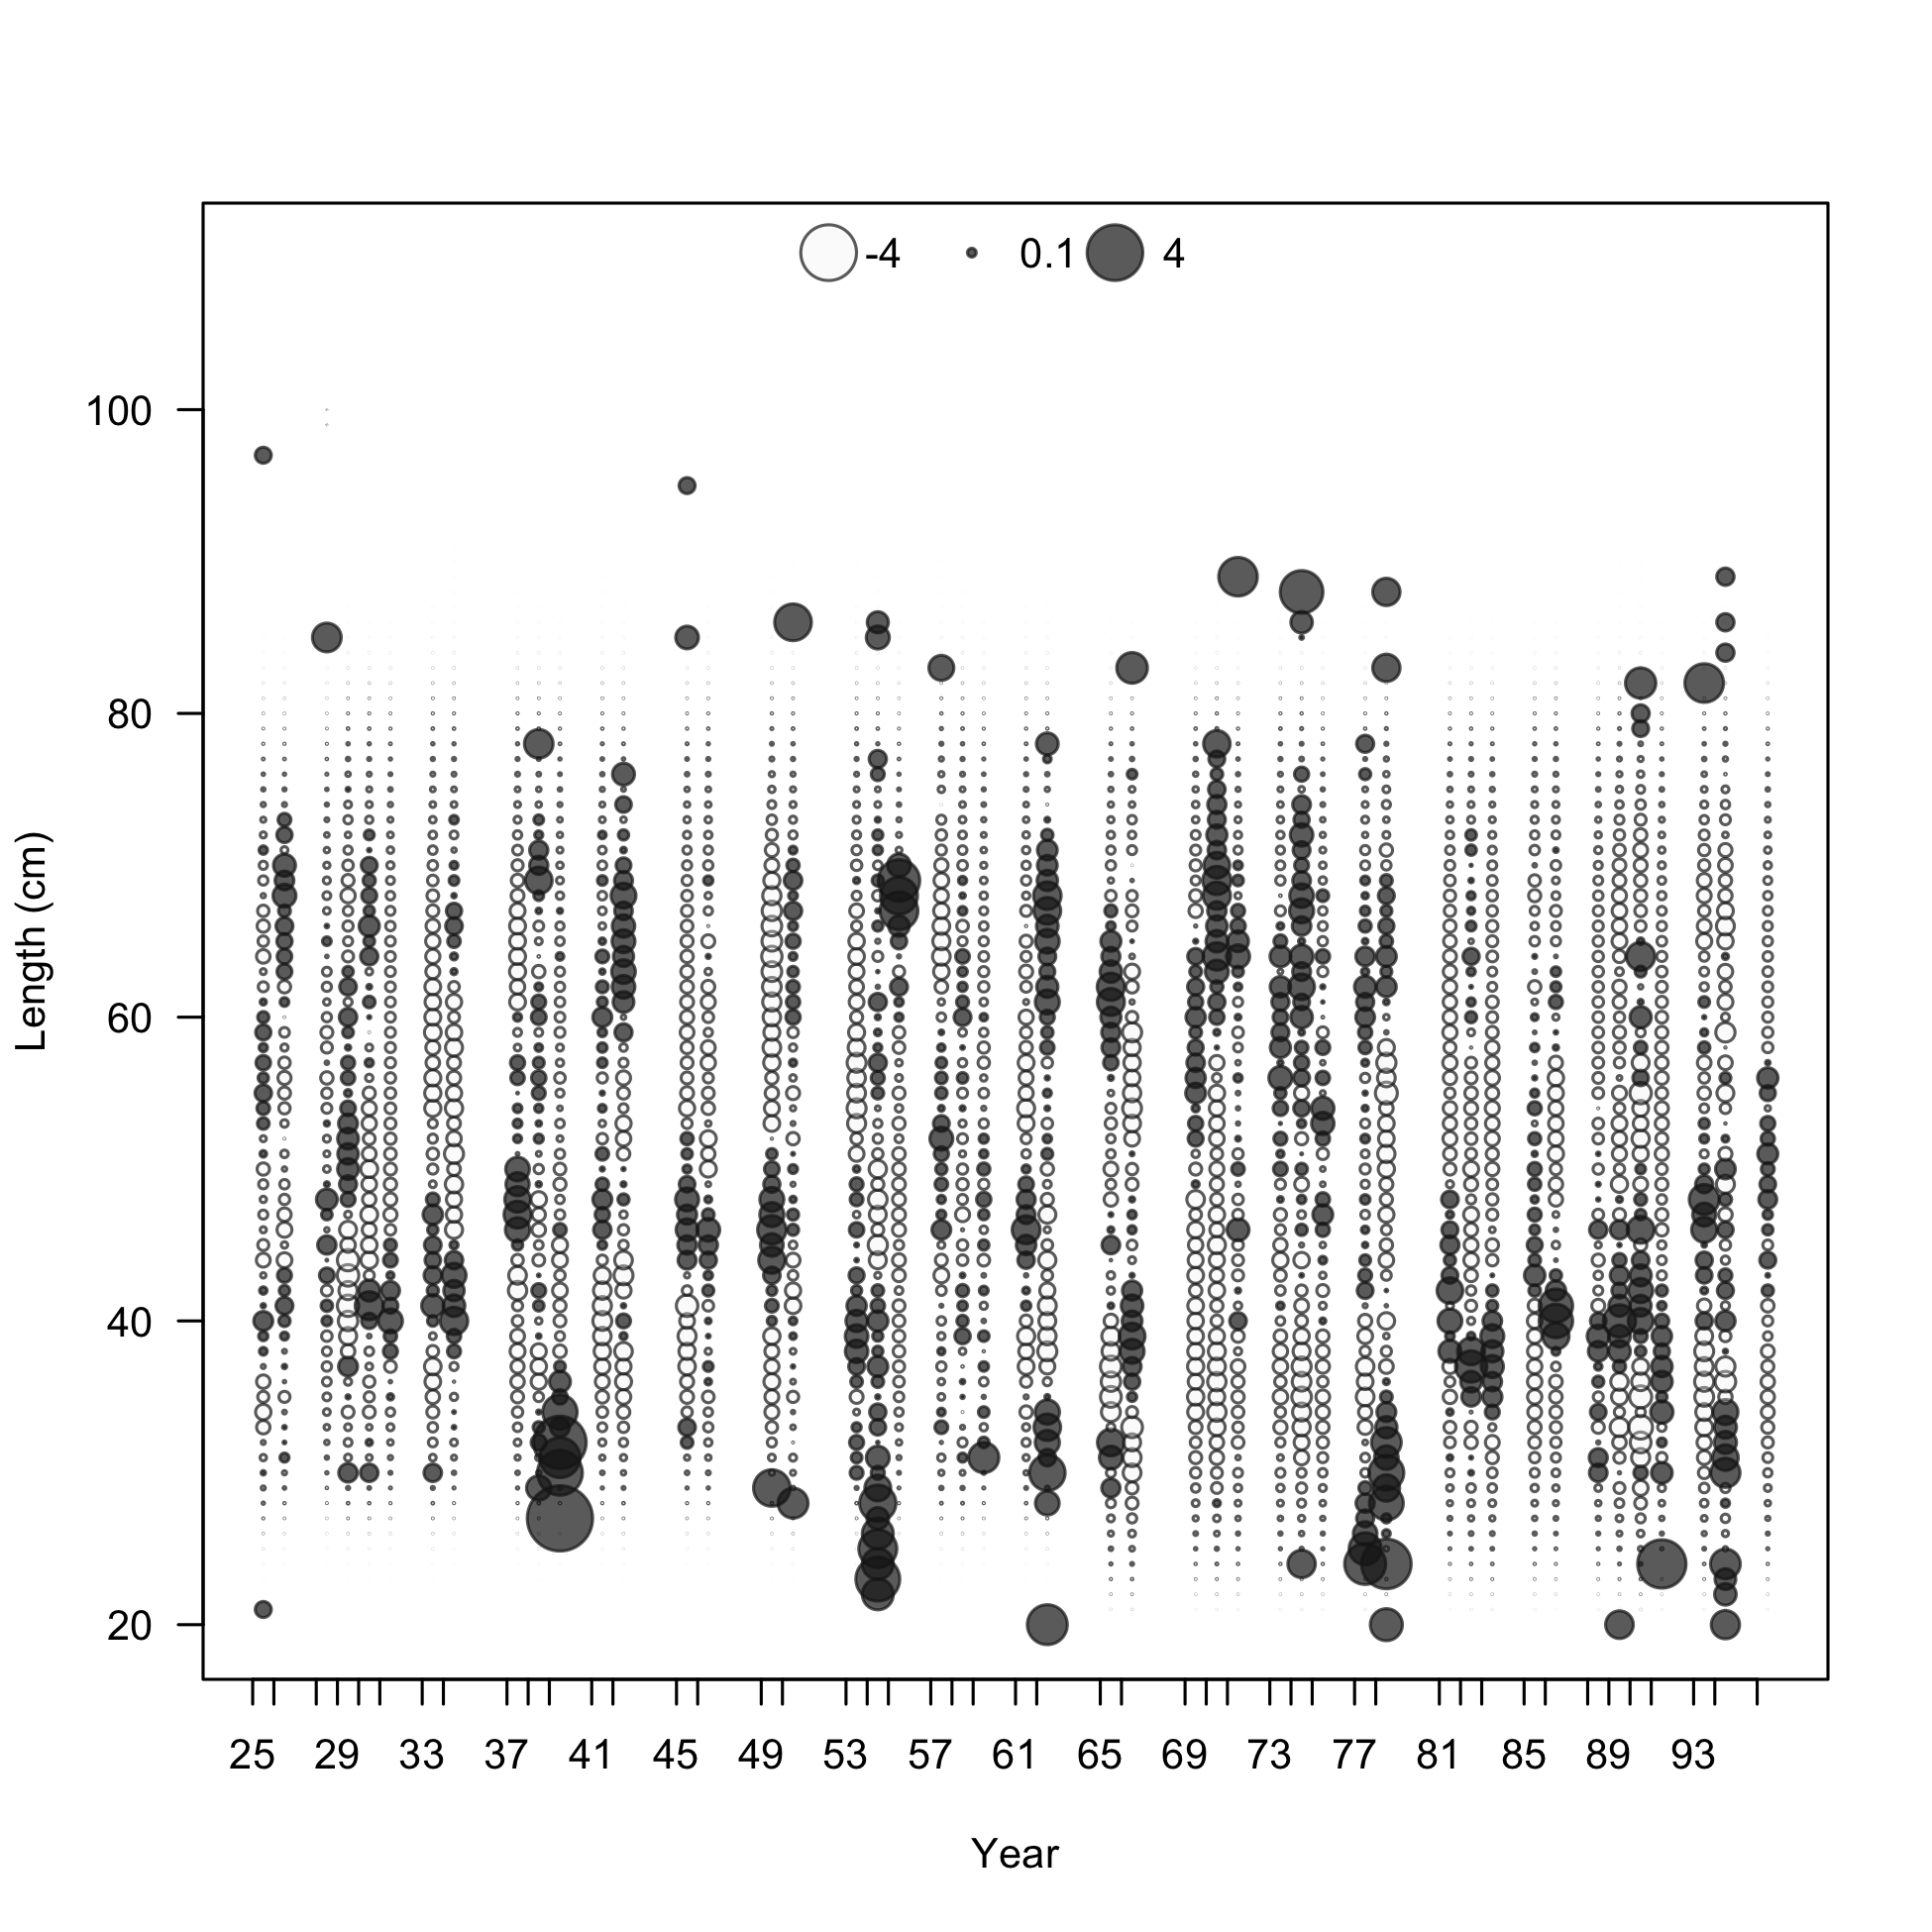
Pearson residuals, retained, F2-OBJ_Offshore_Large (max=31.12) (plot 3 of 3)
Closed bubbles are positive residuals (observed > expected) and open bubbles are negative residuals (observed < expected).
file: comp_lenfit_residsflt2mkt2_page3.png
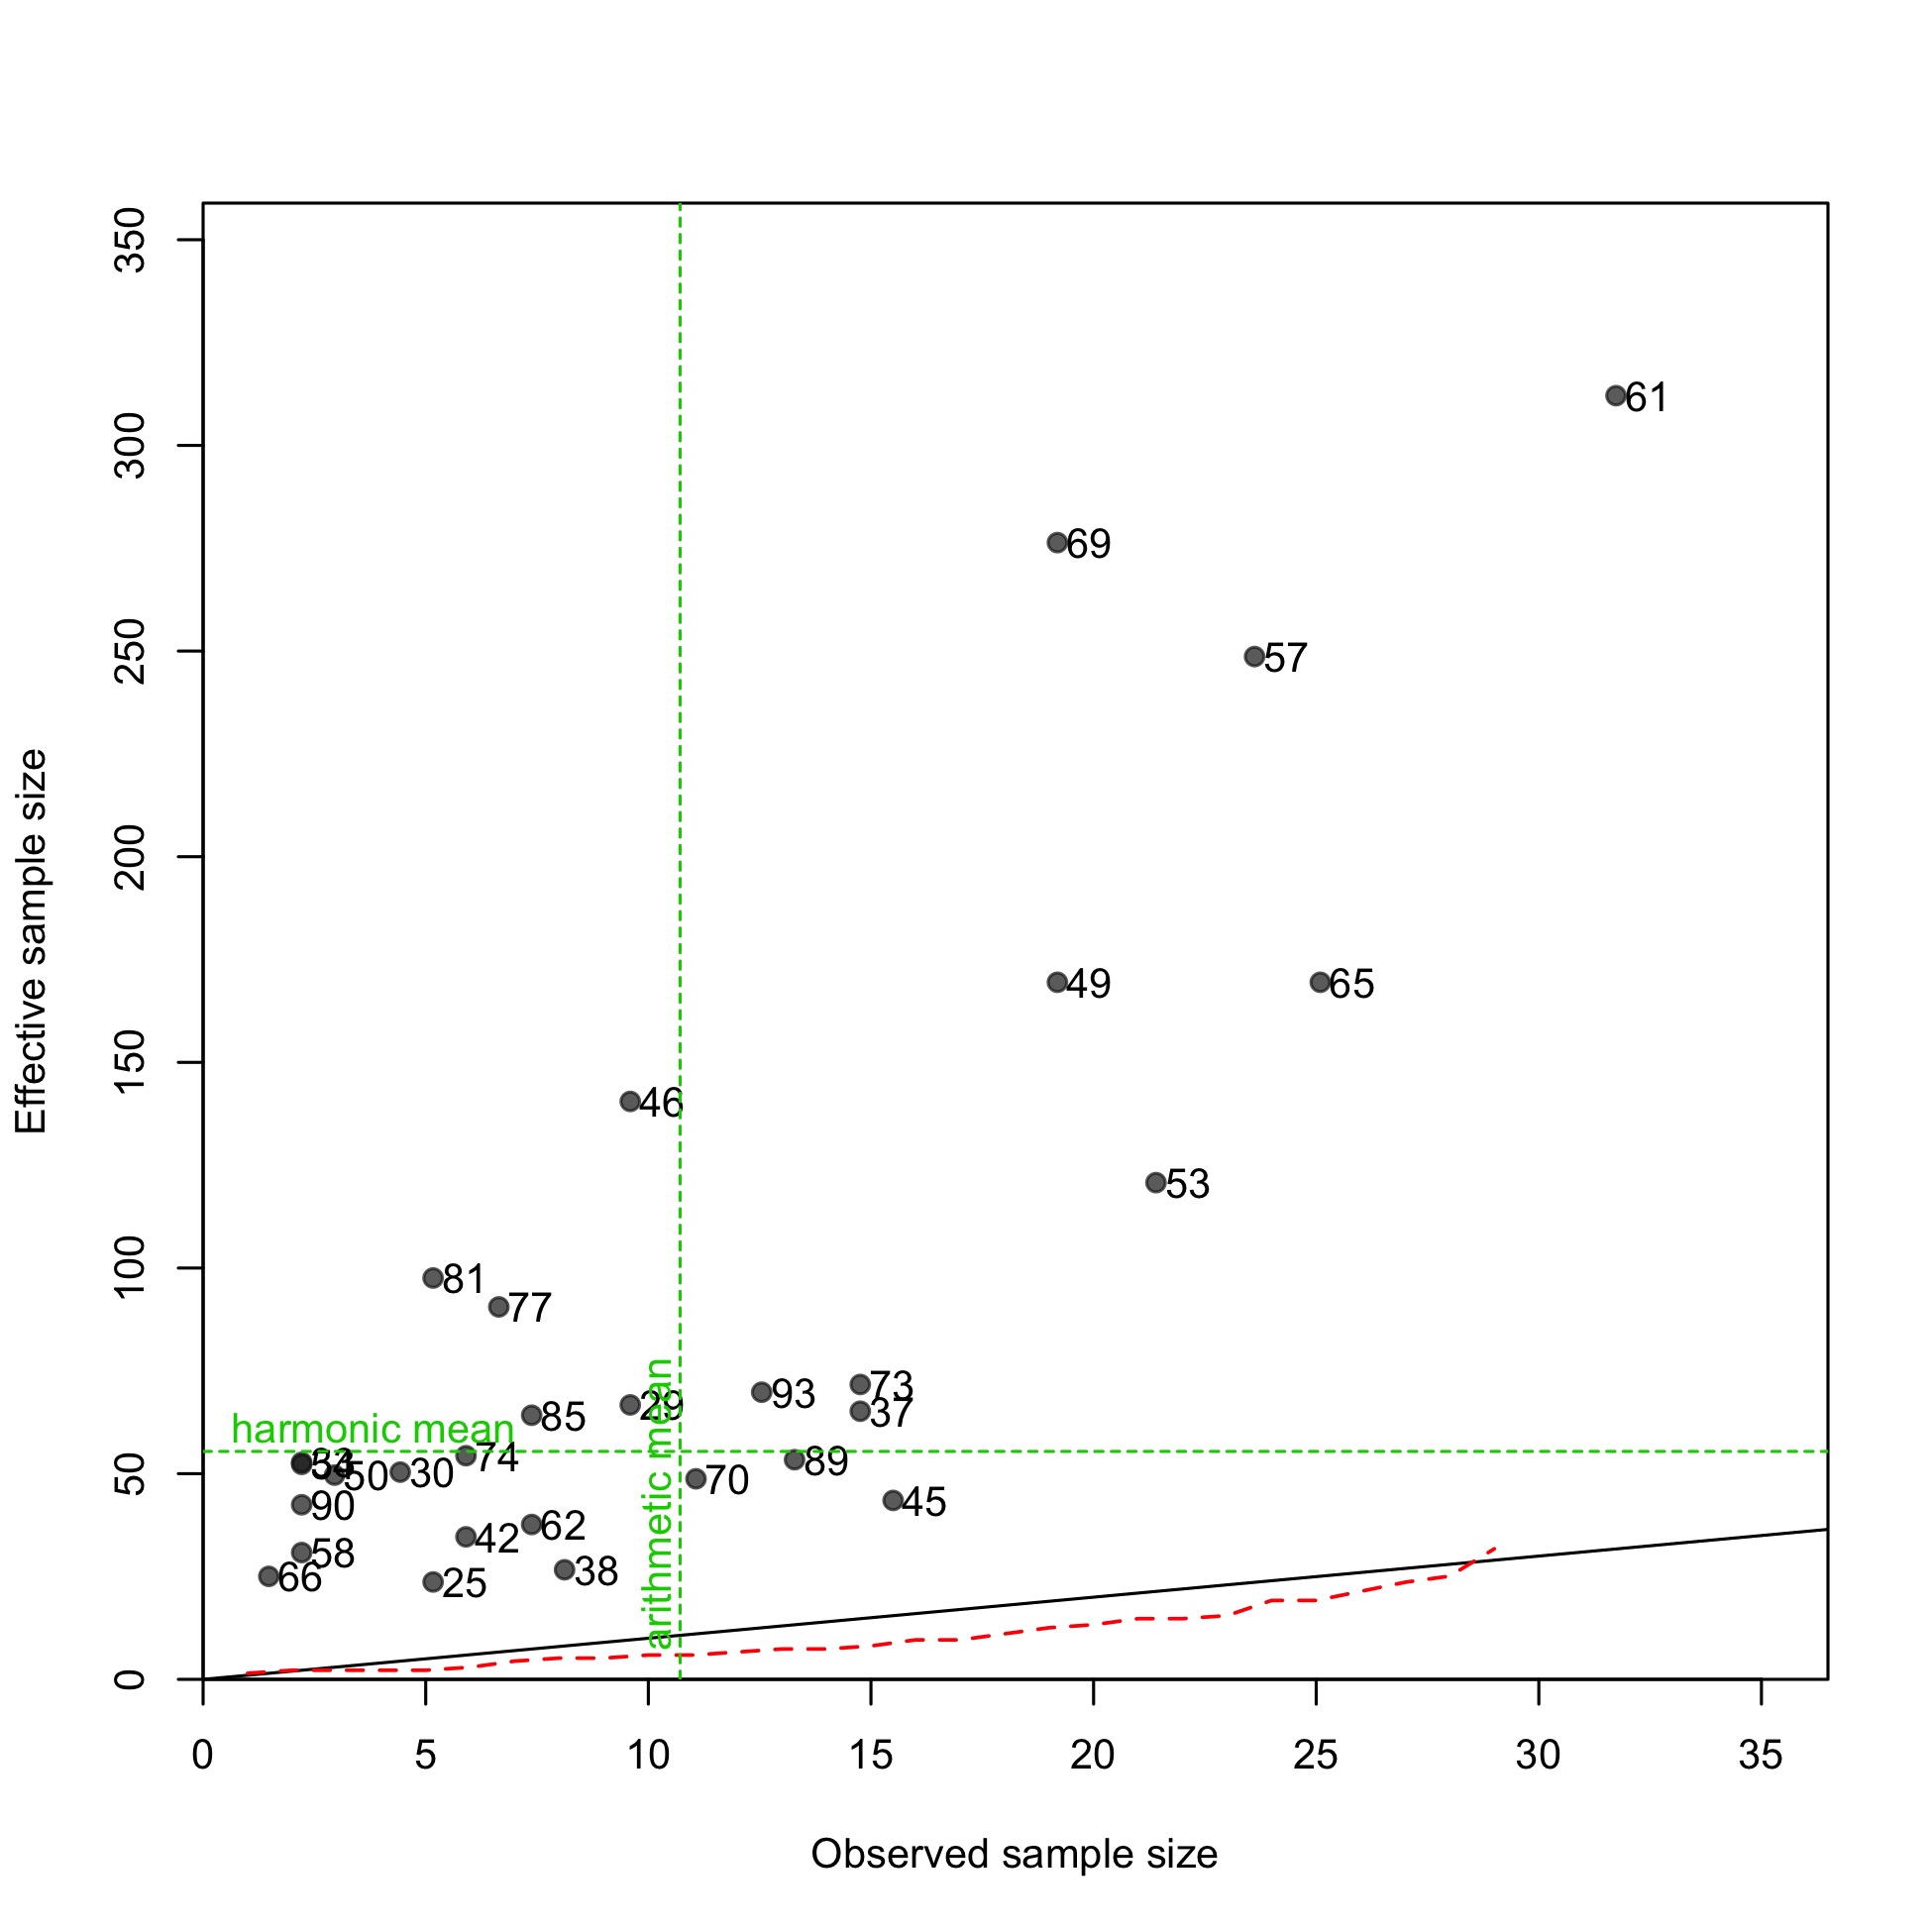
N-EffN comparison, Length comps, retained, F2-OBJ_Offshore_Large
file: comp_lenfit_sampsize_flt2mkt2.png
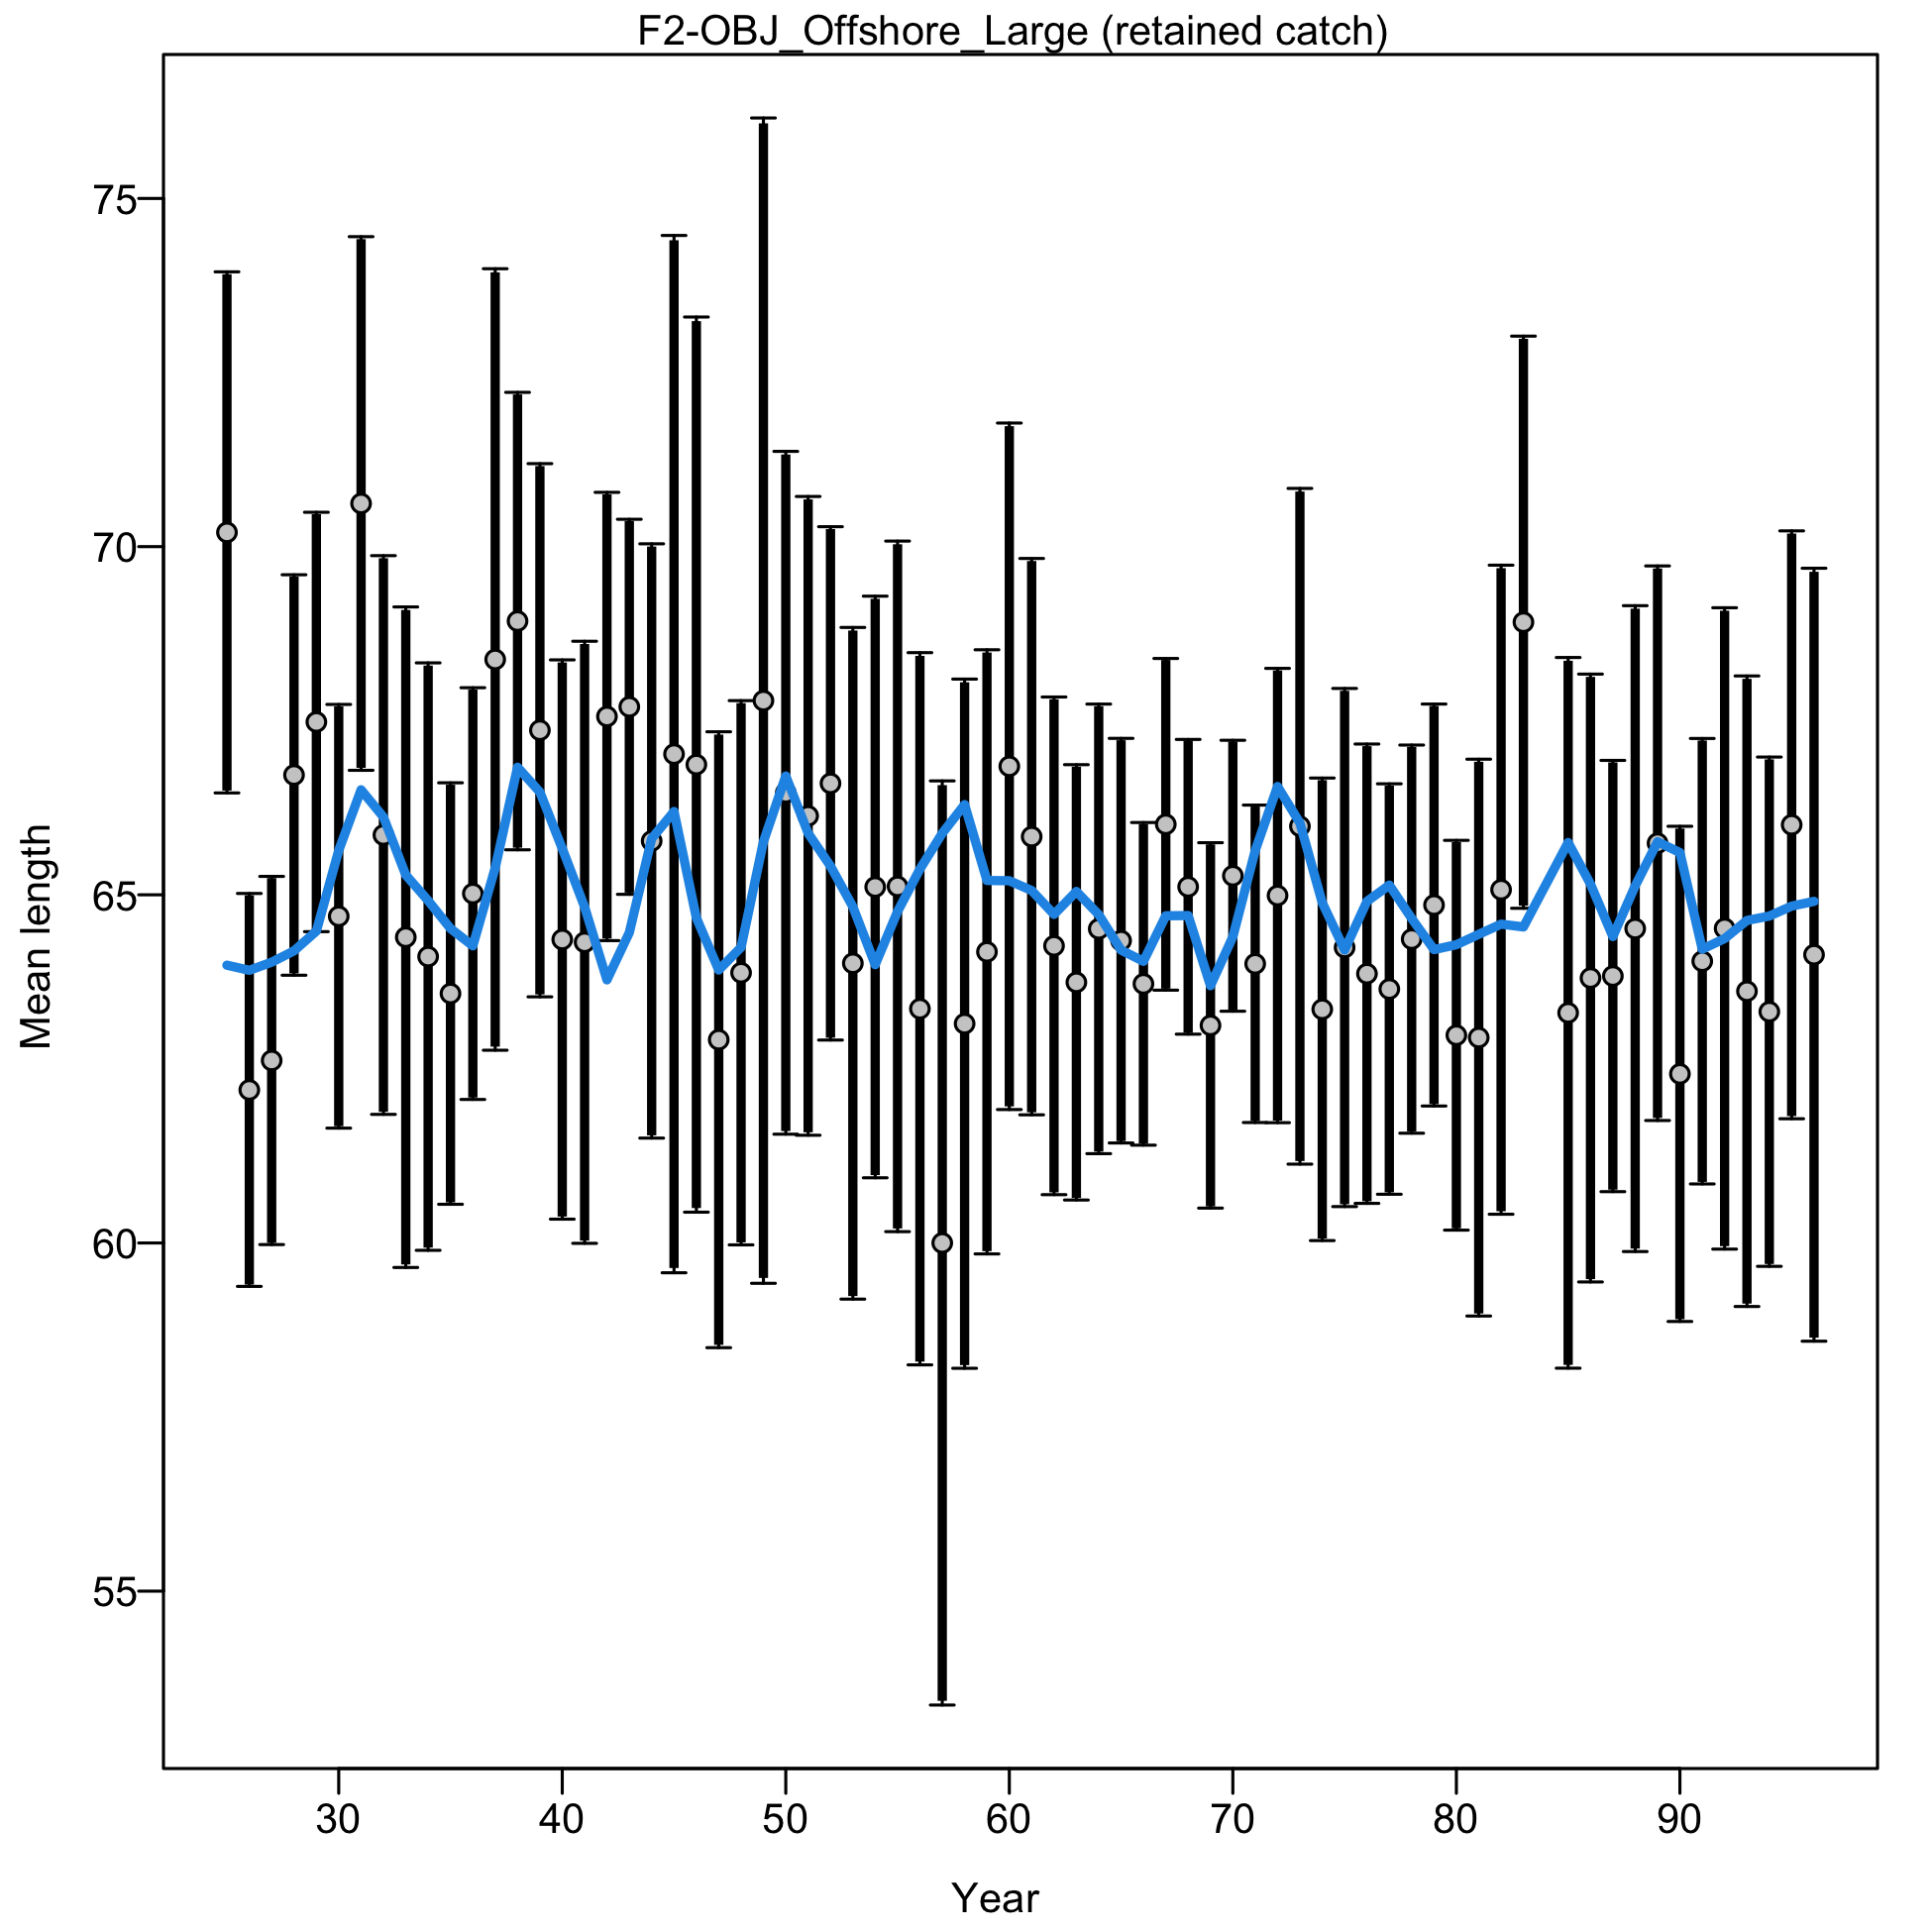
Mean length for F2-OBJ_Offshore_Large with 95% confidence intervals based on current sample sizes.
Francis data weighting method TA1.8: thinner intervals (with capped ends) show result of further adjusting sample sizes based on suggested multiplier (with 95% interval) for len data from F2-OBJ_Offshore_Large:
0.9817 (0.7093-1.6304)
For more info, see Francis (2011).
file: comp_lenfit_data_weighting_TA1.8_F2-OBJ_Offshore_Large.png
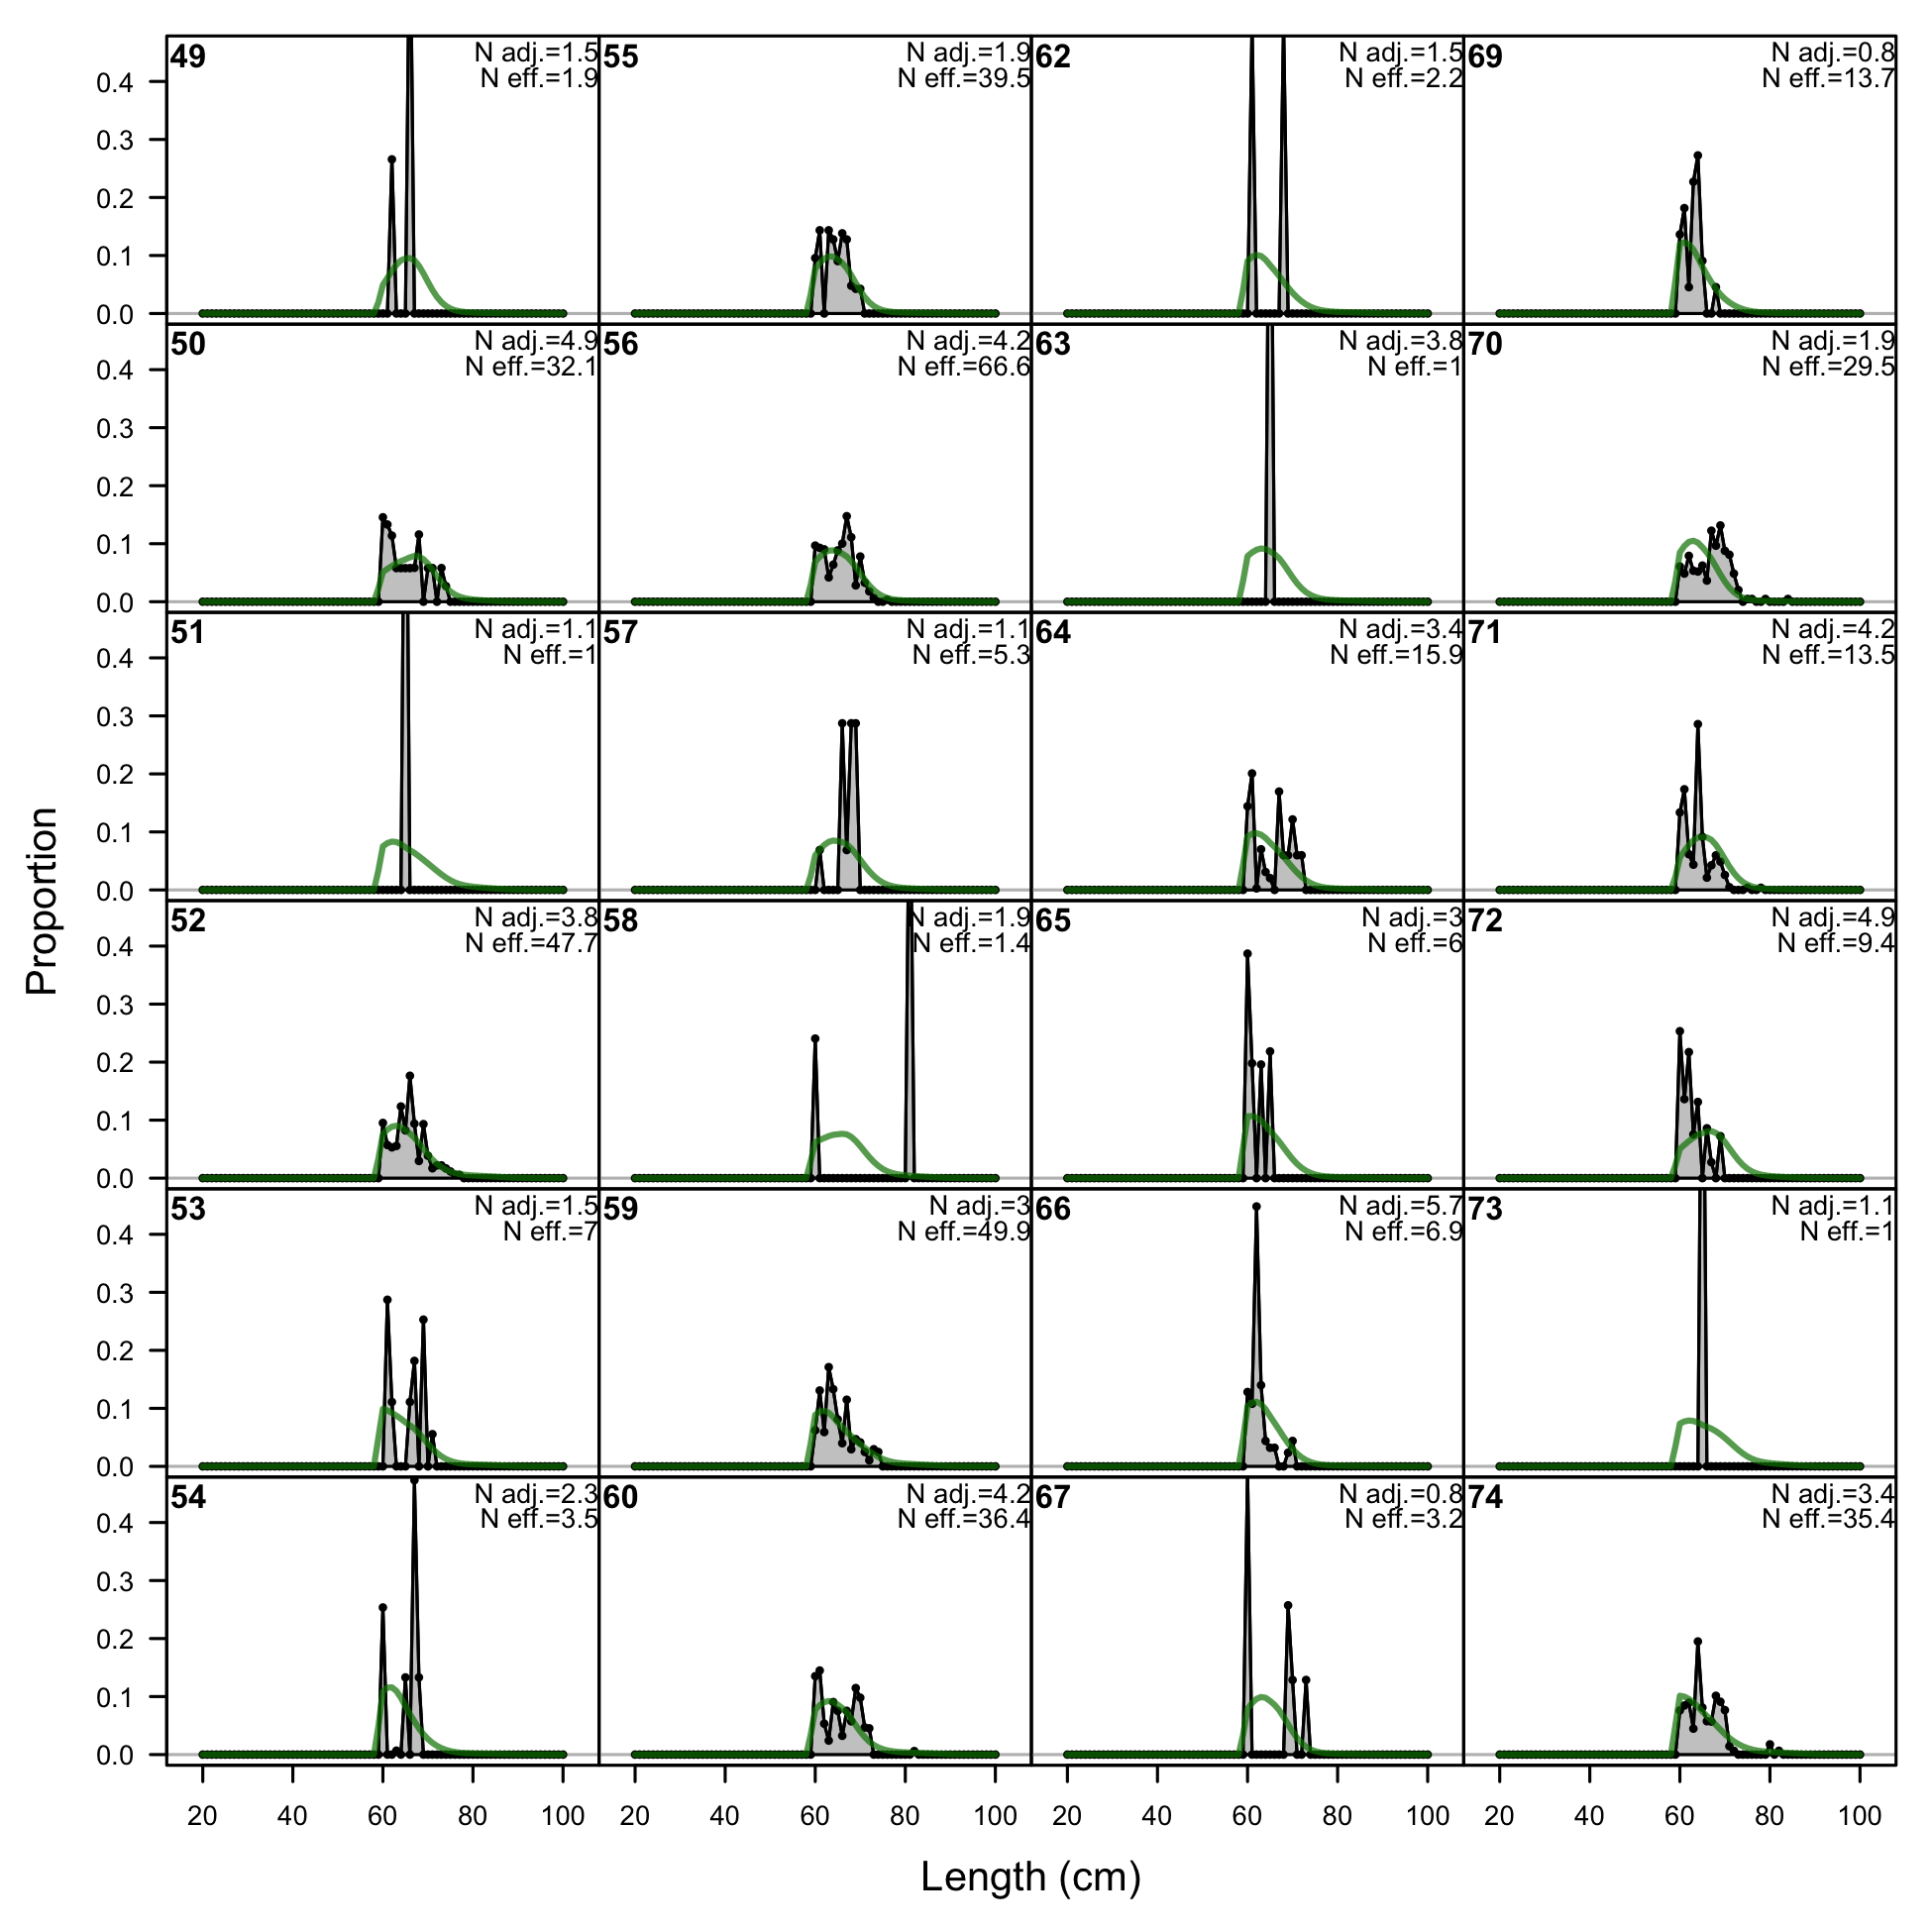
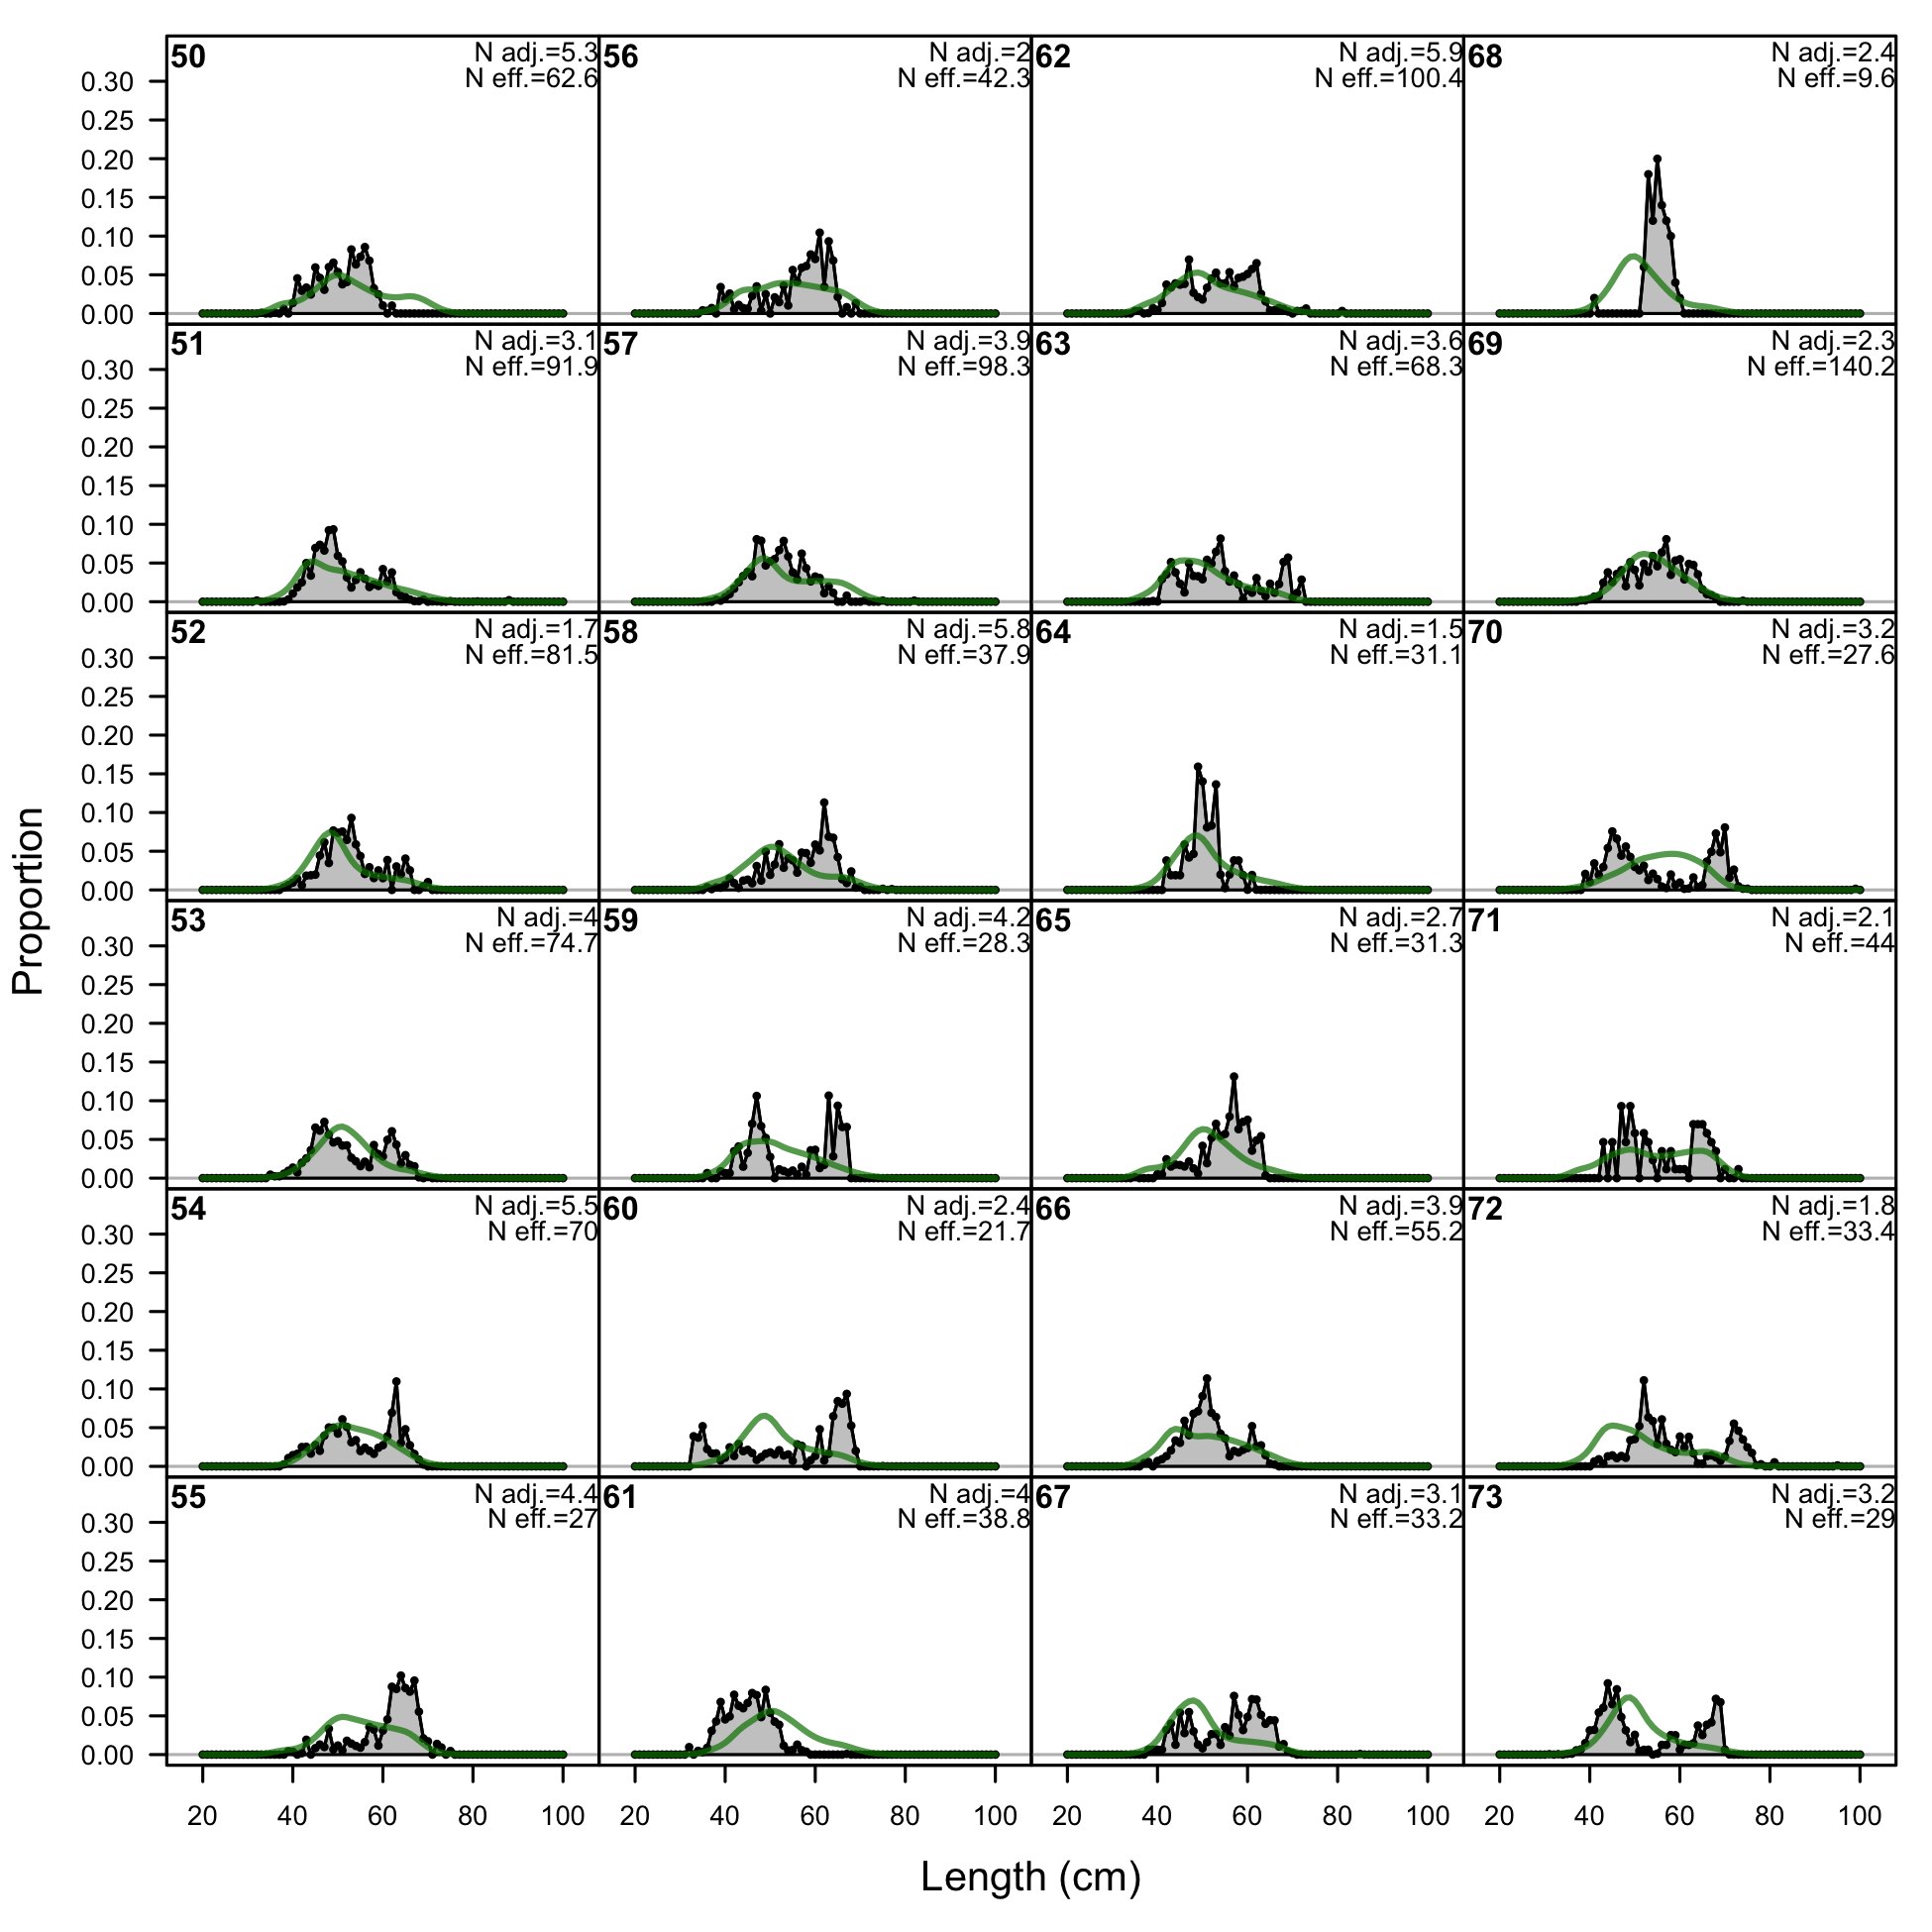
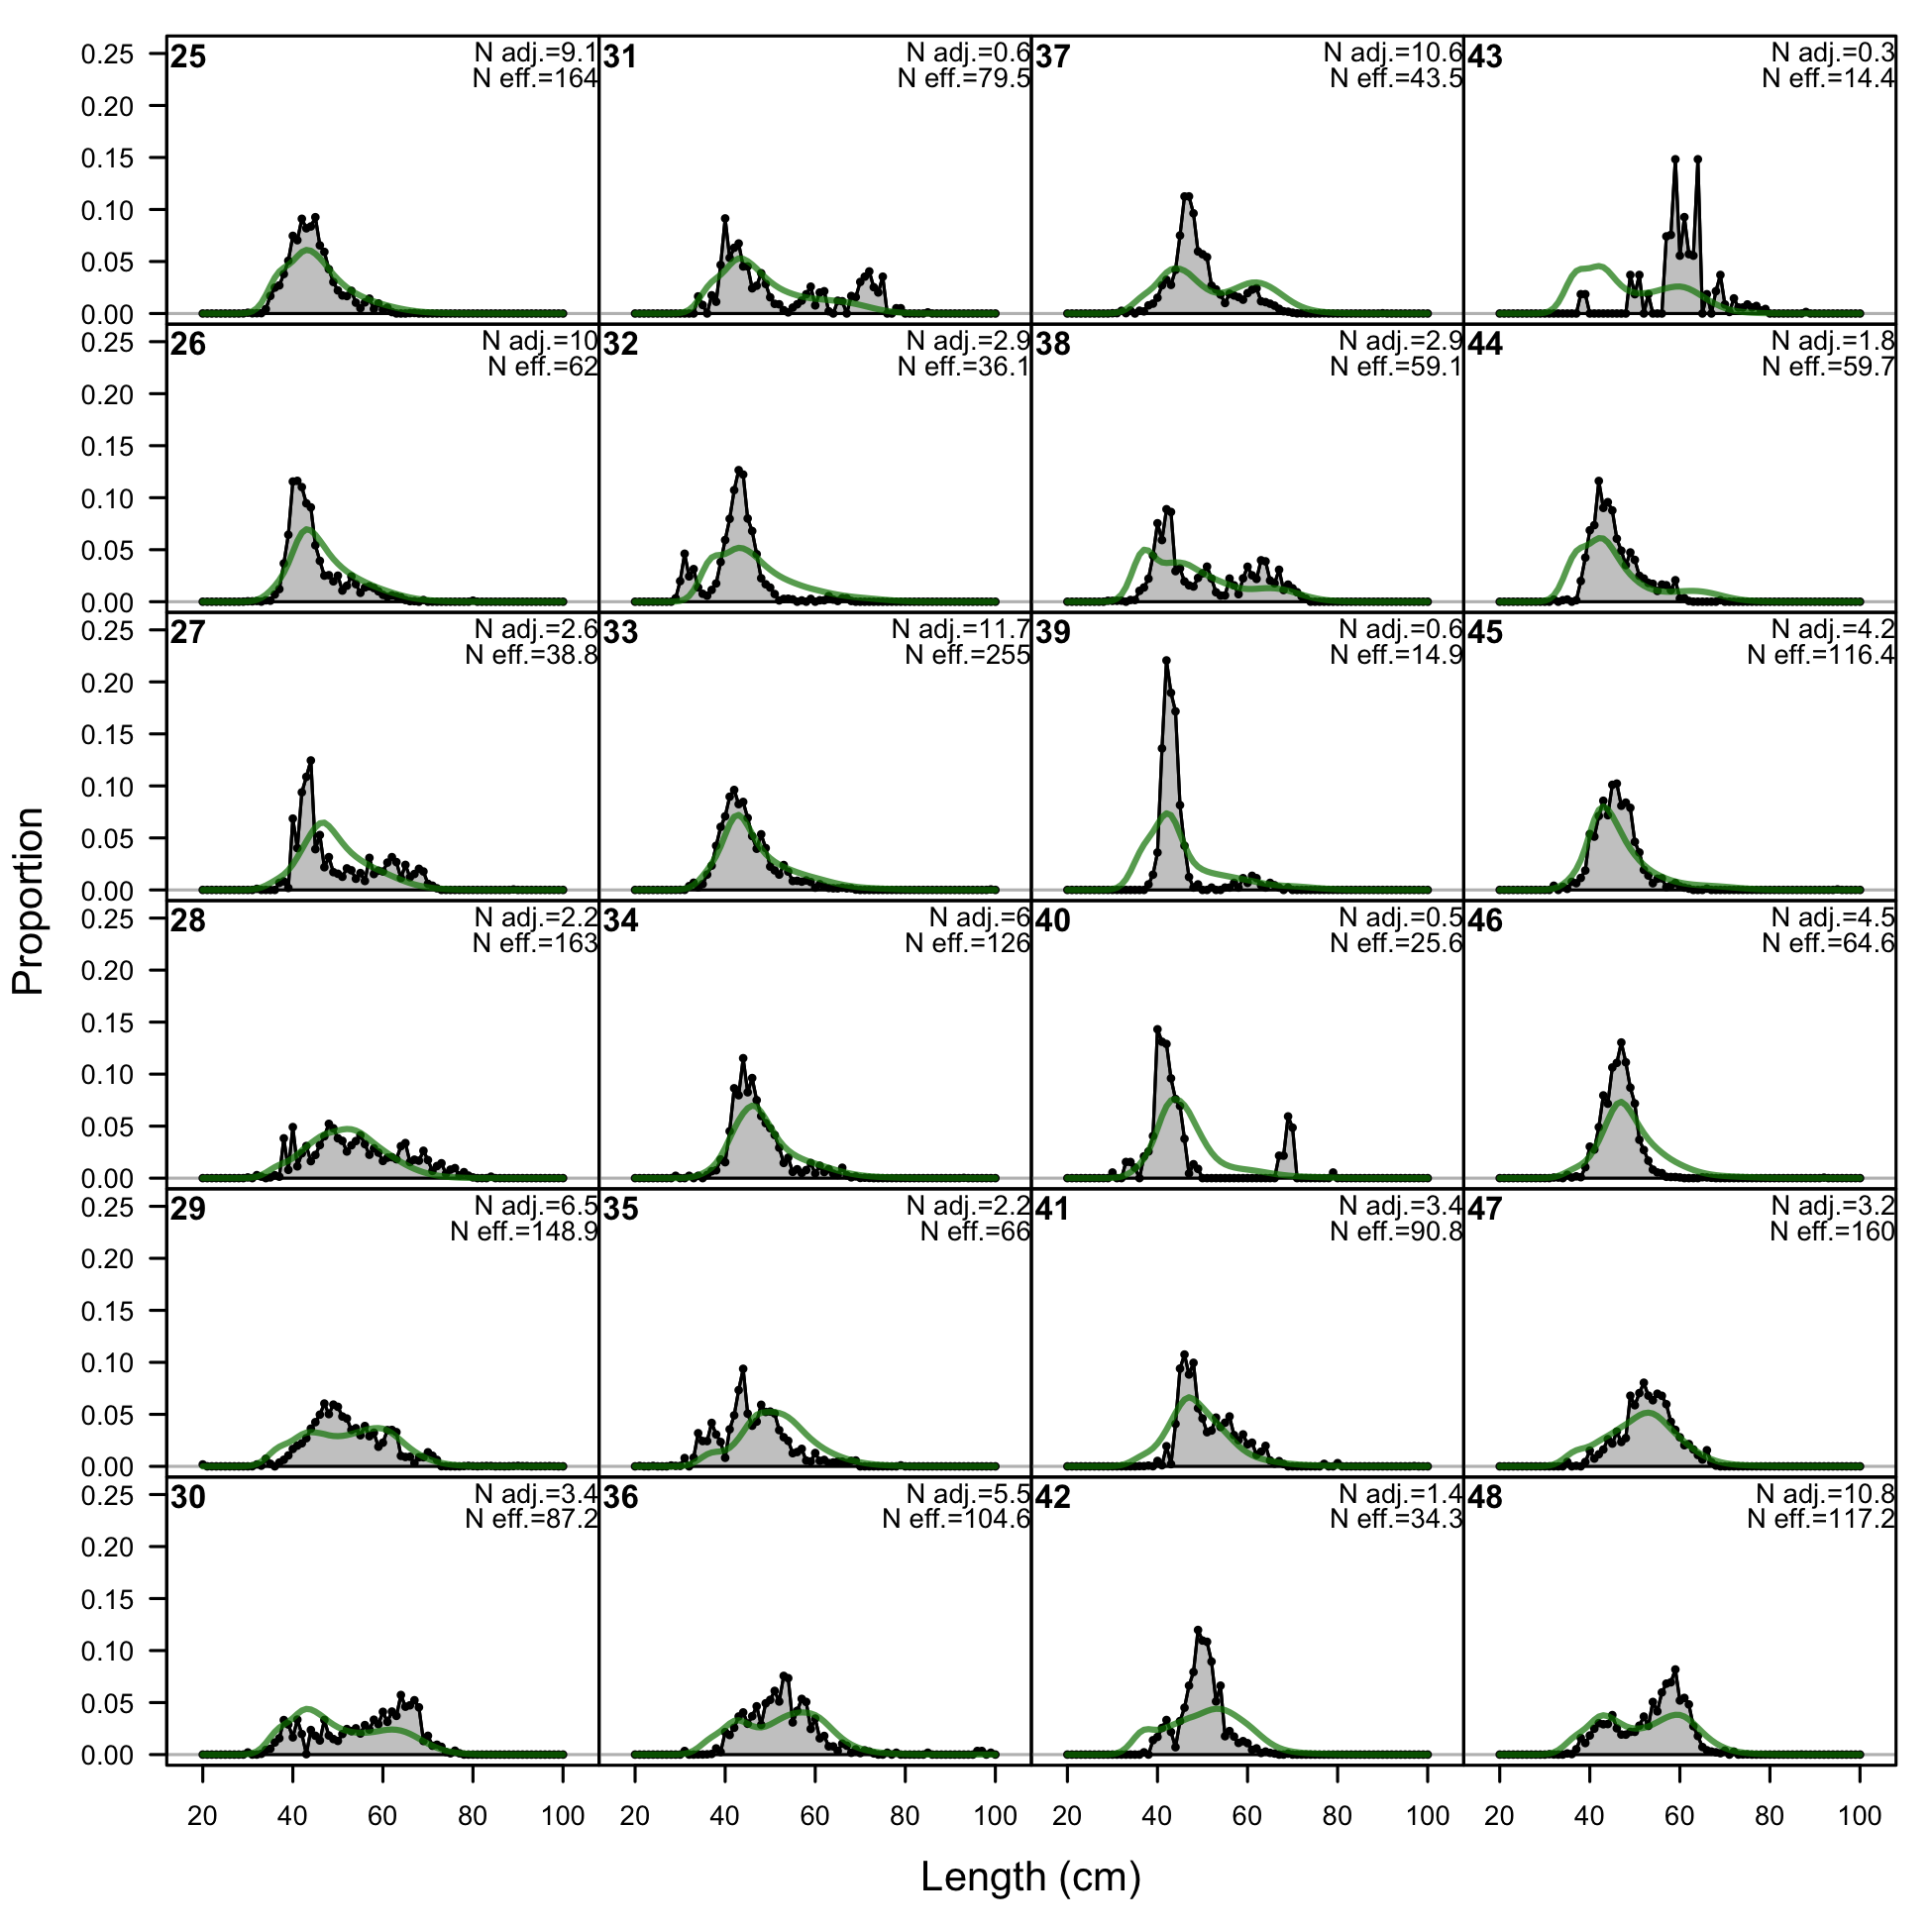
Length comps, retained, F3-OBJ_Central_Small (plot 1 of 3).
'N adj.' is the input sample size after data-weighting adjustment. N eff. is the calculated effective sample size used in the McAllister-Ianelli tuning method.
file: comp_lenfit_flt3mkt2_page1.png

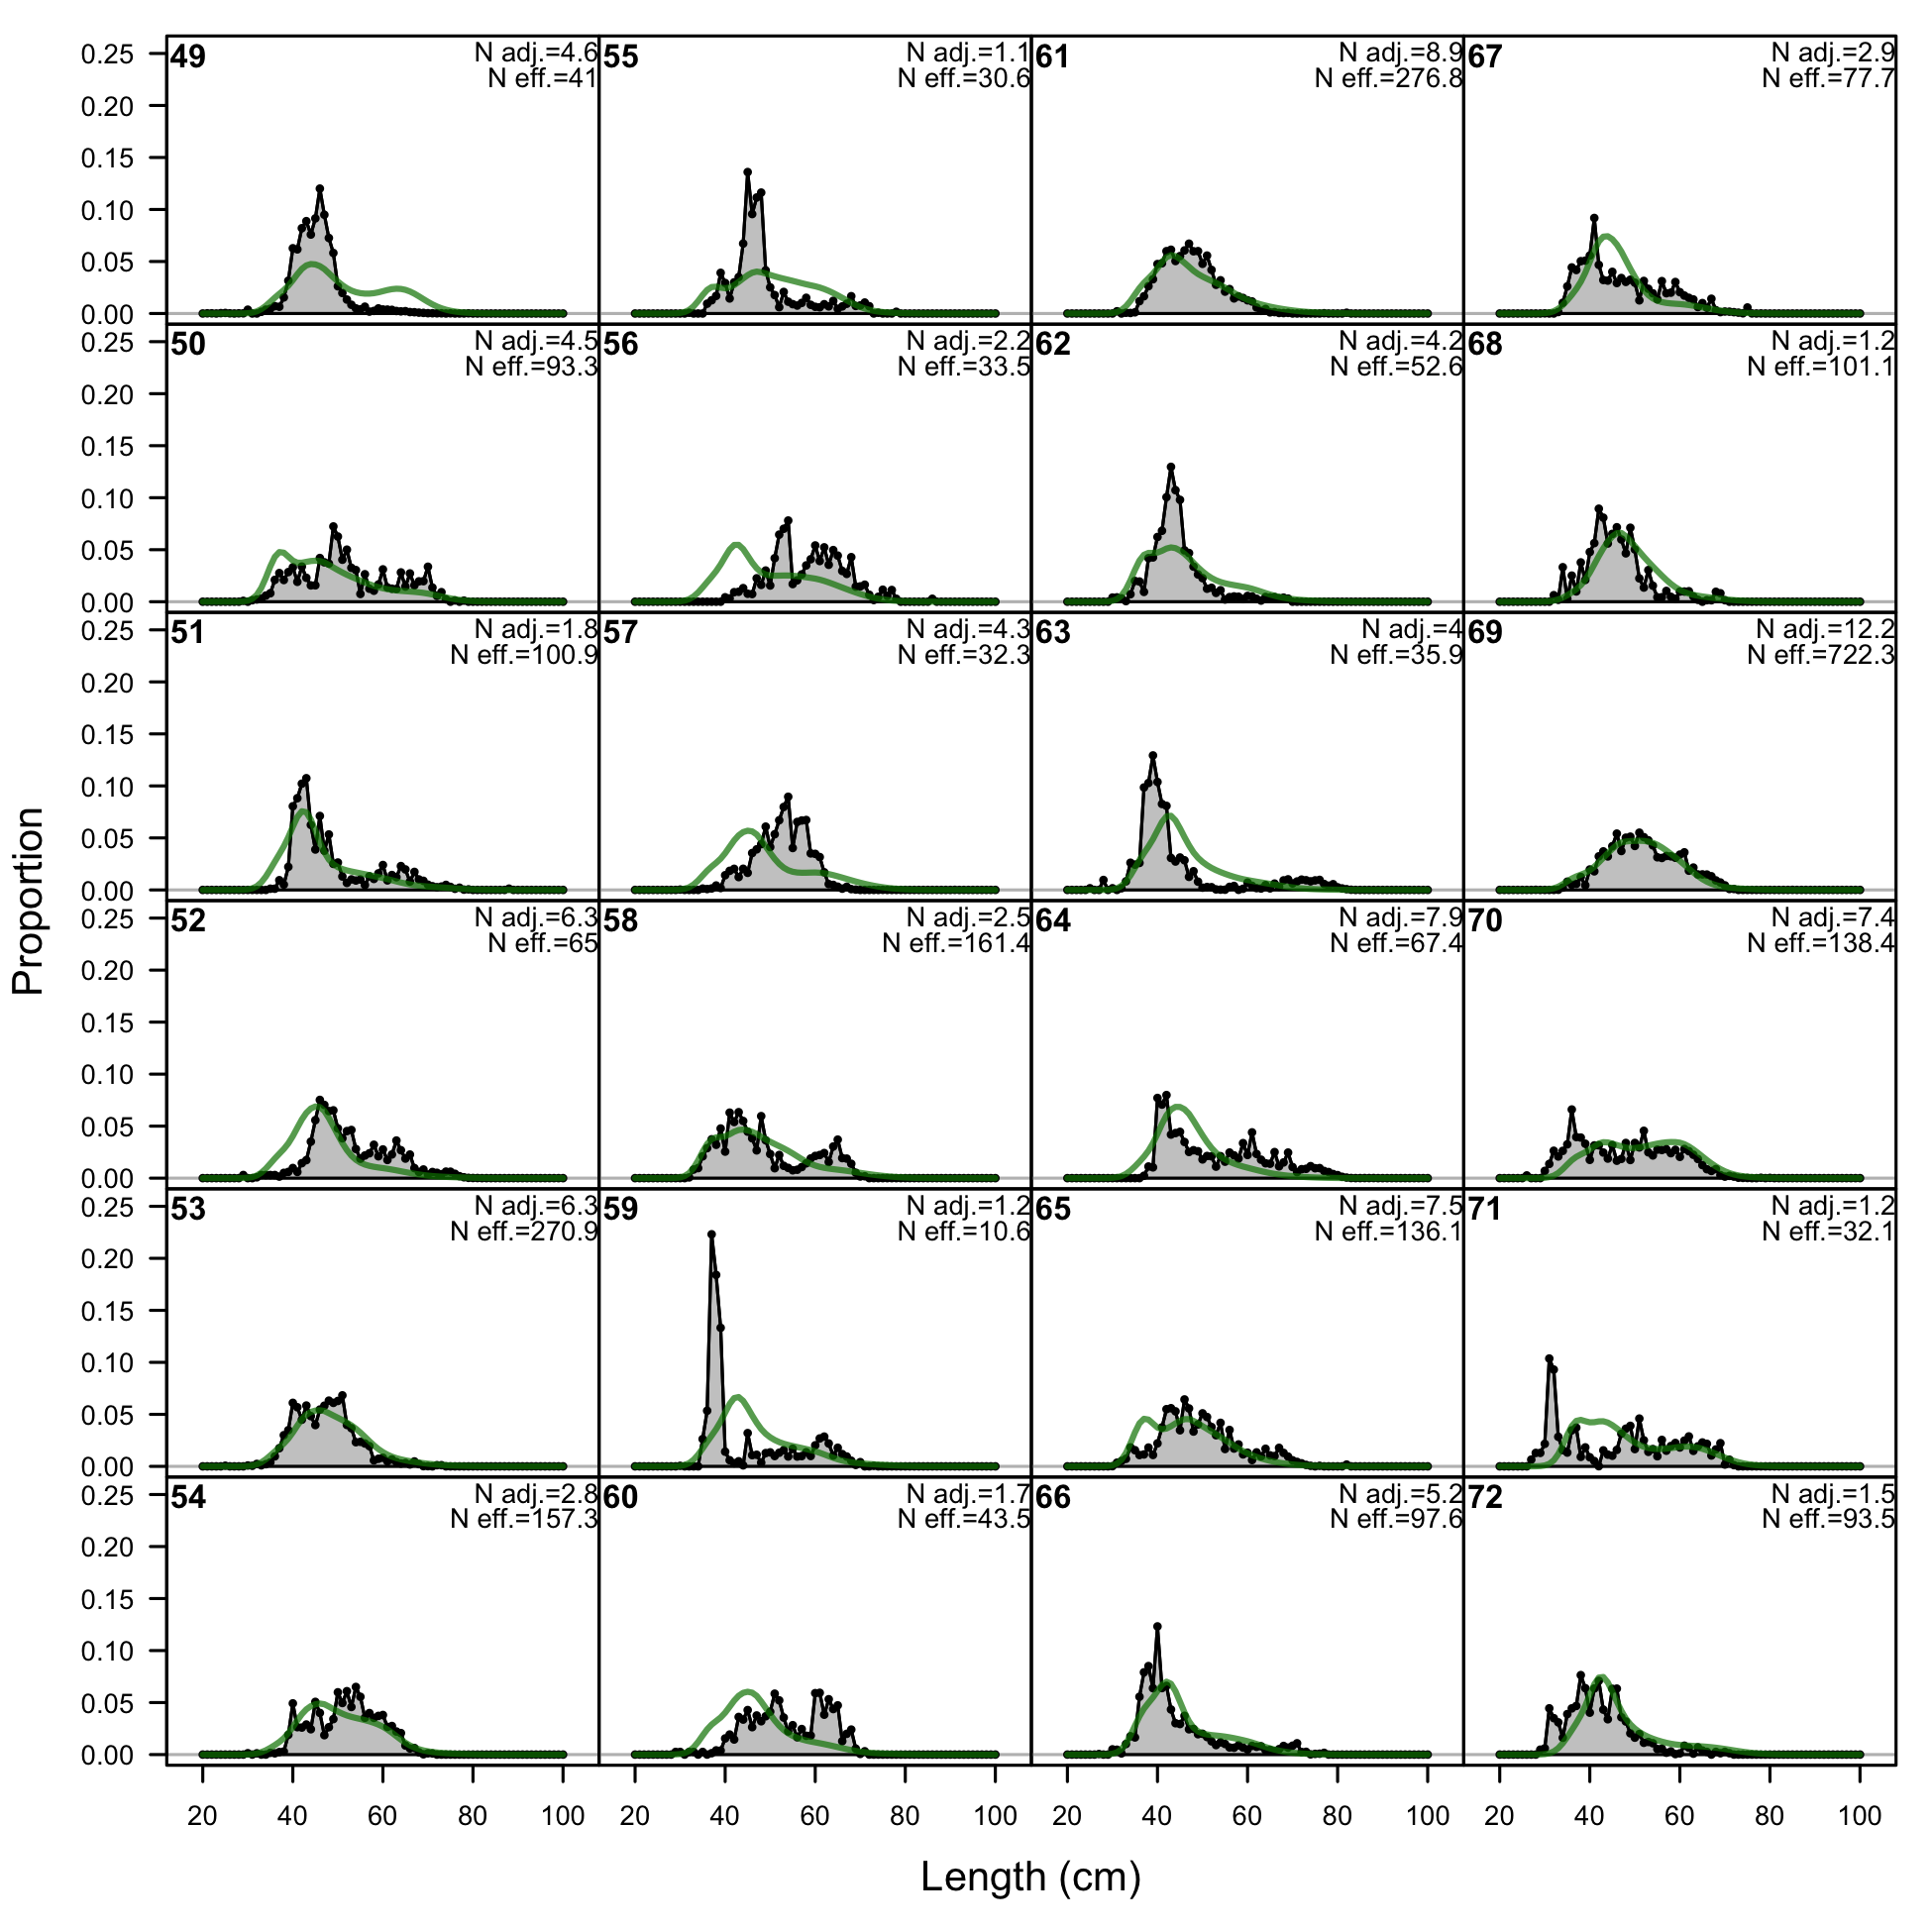
Length comps, retained, F3-OBJ_Central_Small (plot 1 of 3).
'N adj.' is the input sample size after data-weighting adjustment. N eff. is the calculated effective sample size used in the McAllister-Ianelli tuning method. (plot 2 of 3)
file: comp_lenfit_flt3mkt2_page2.png
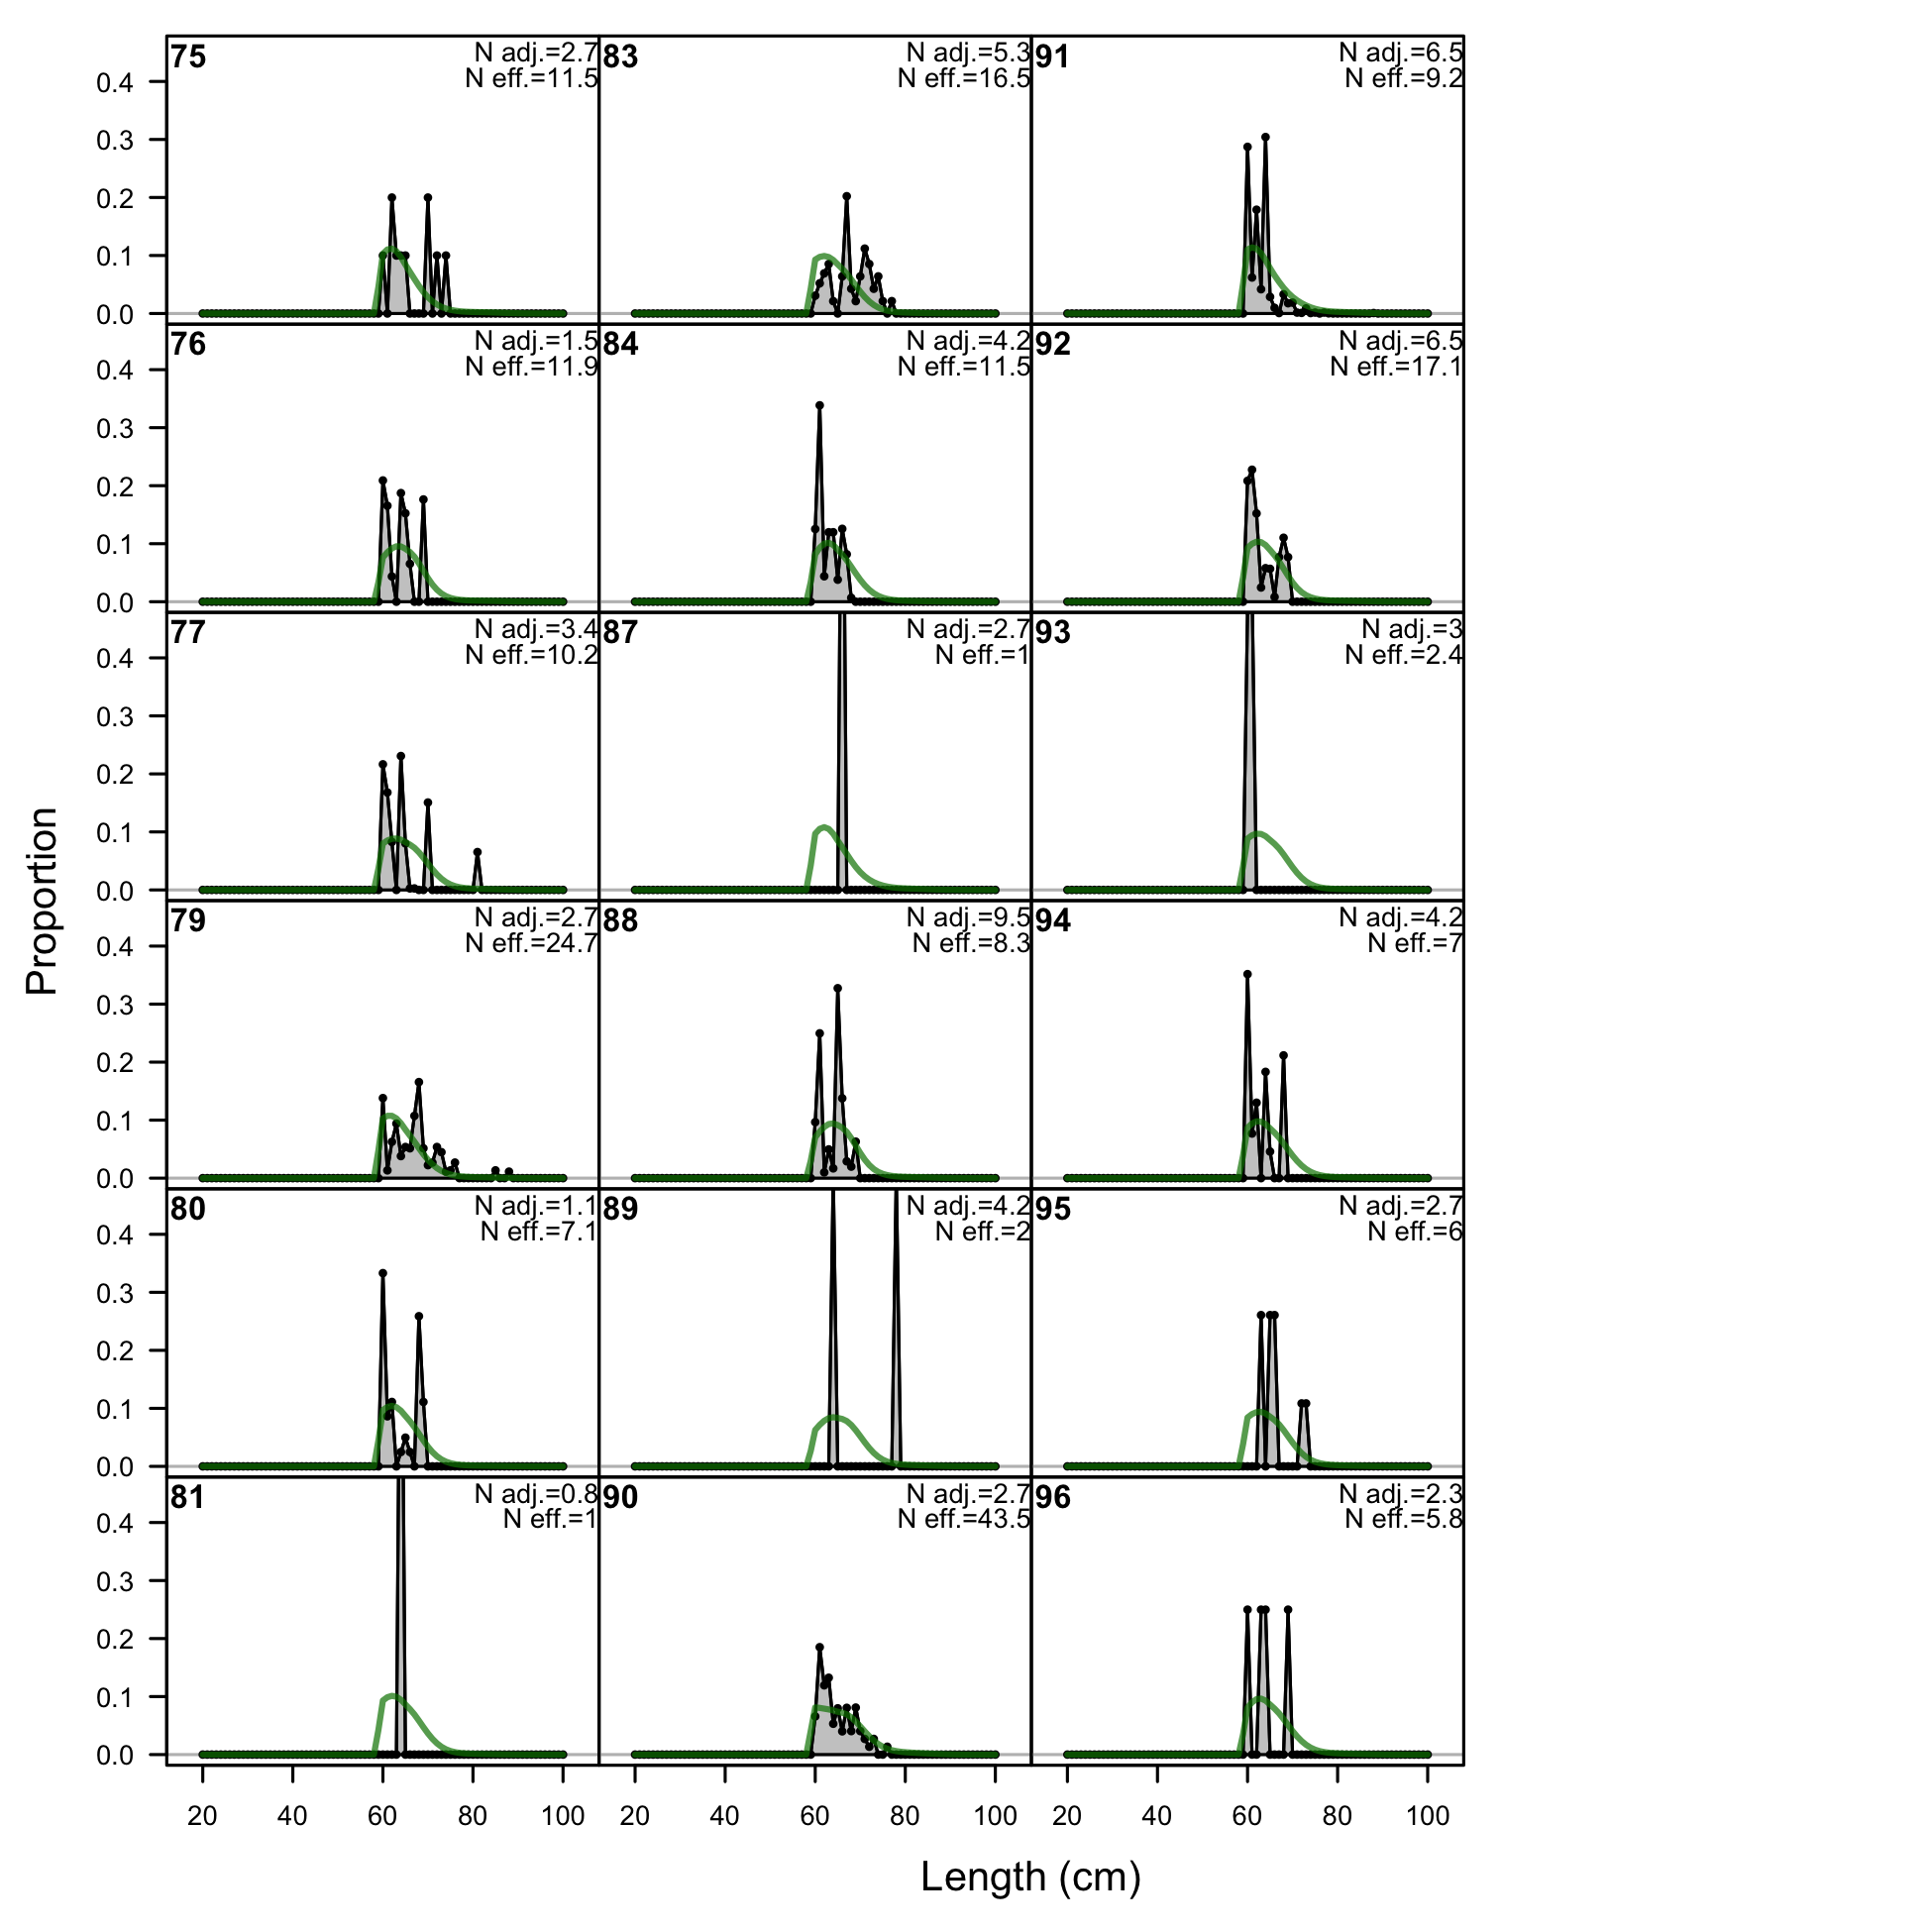
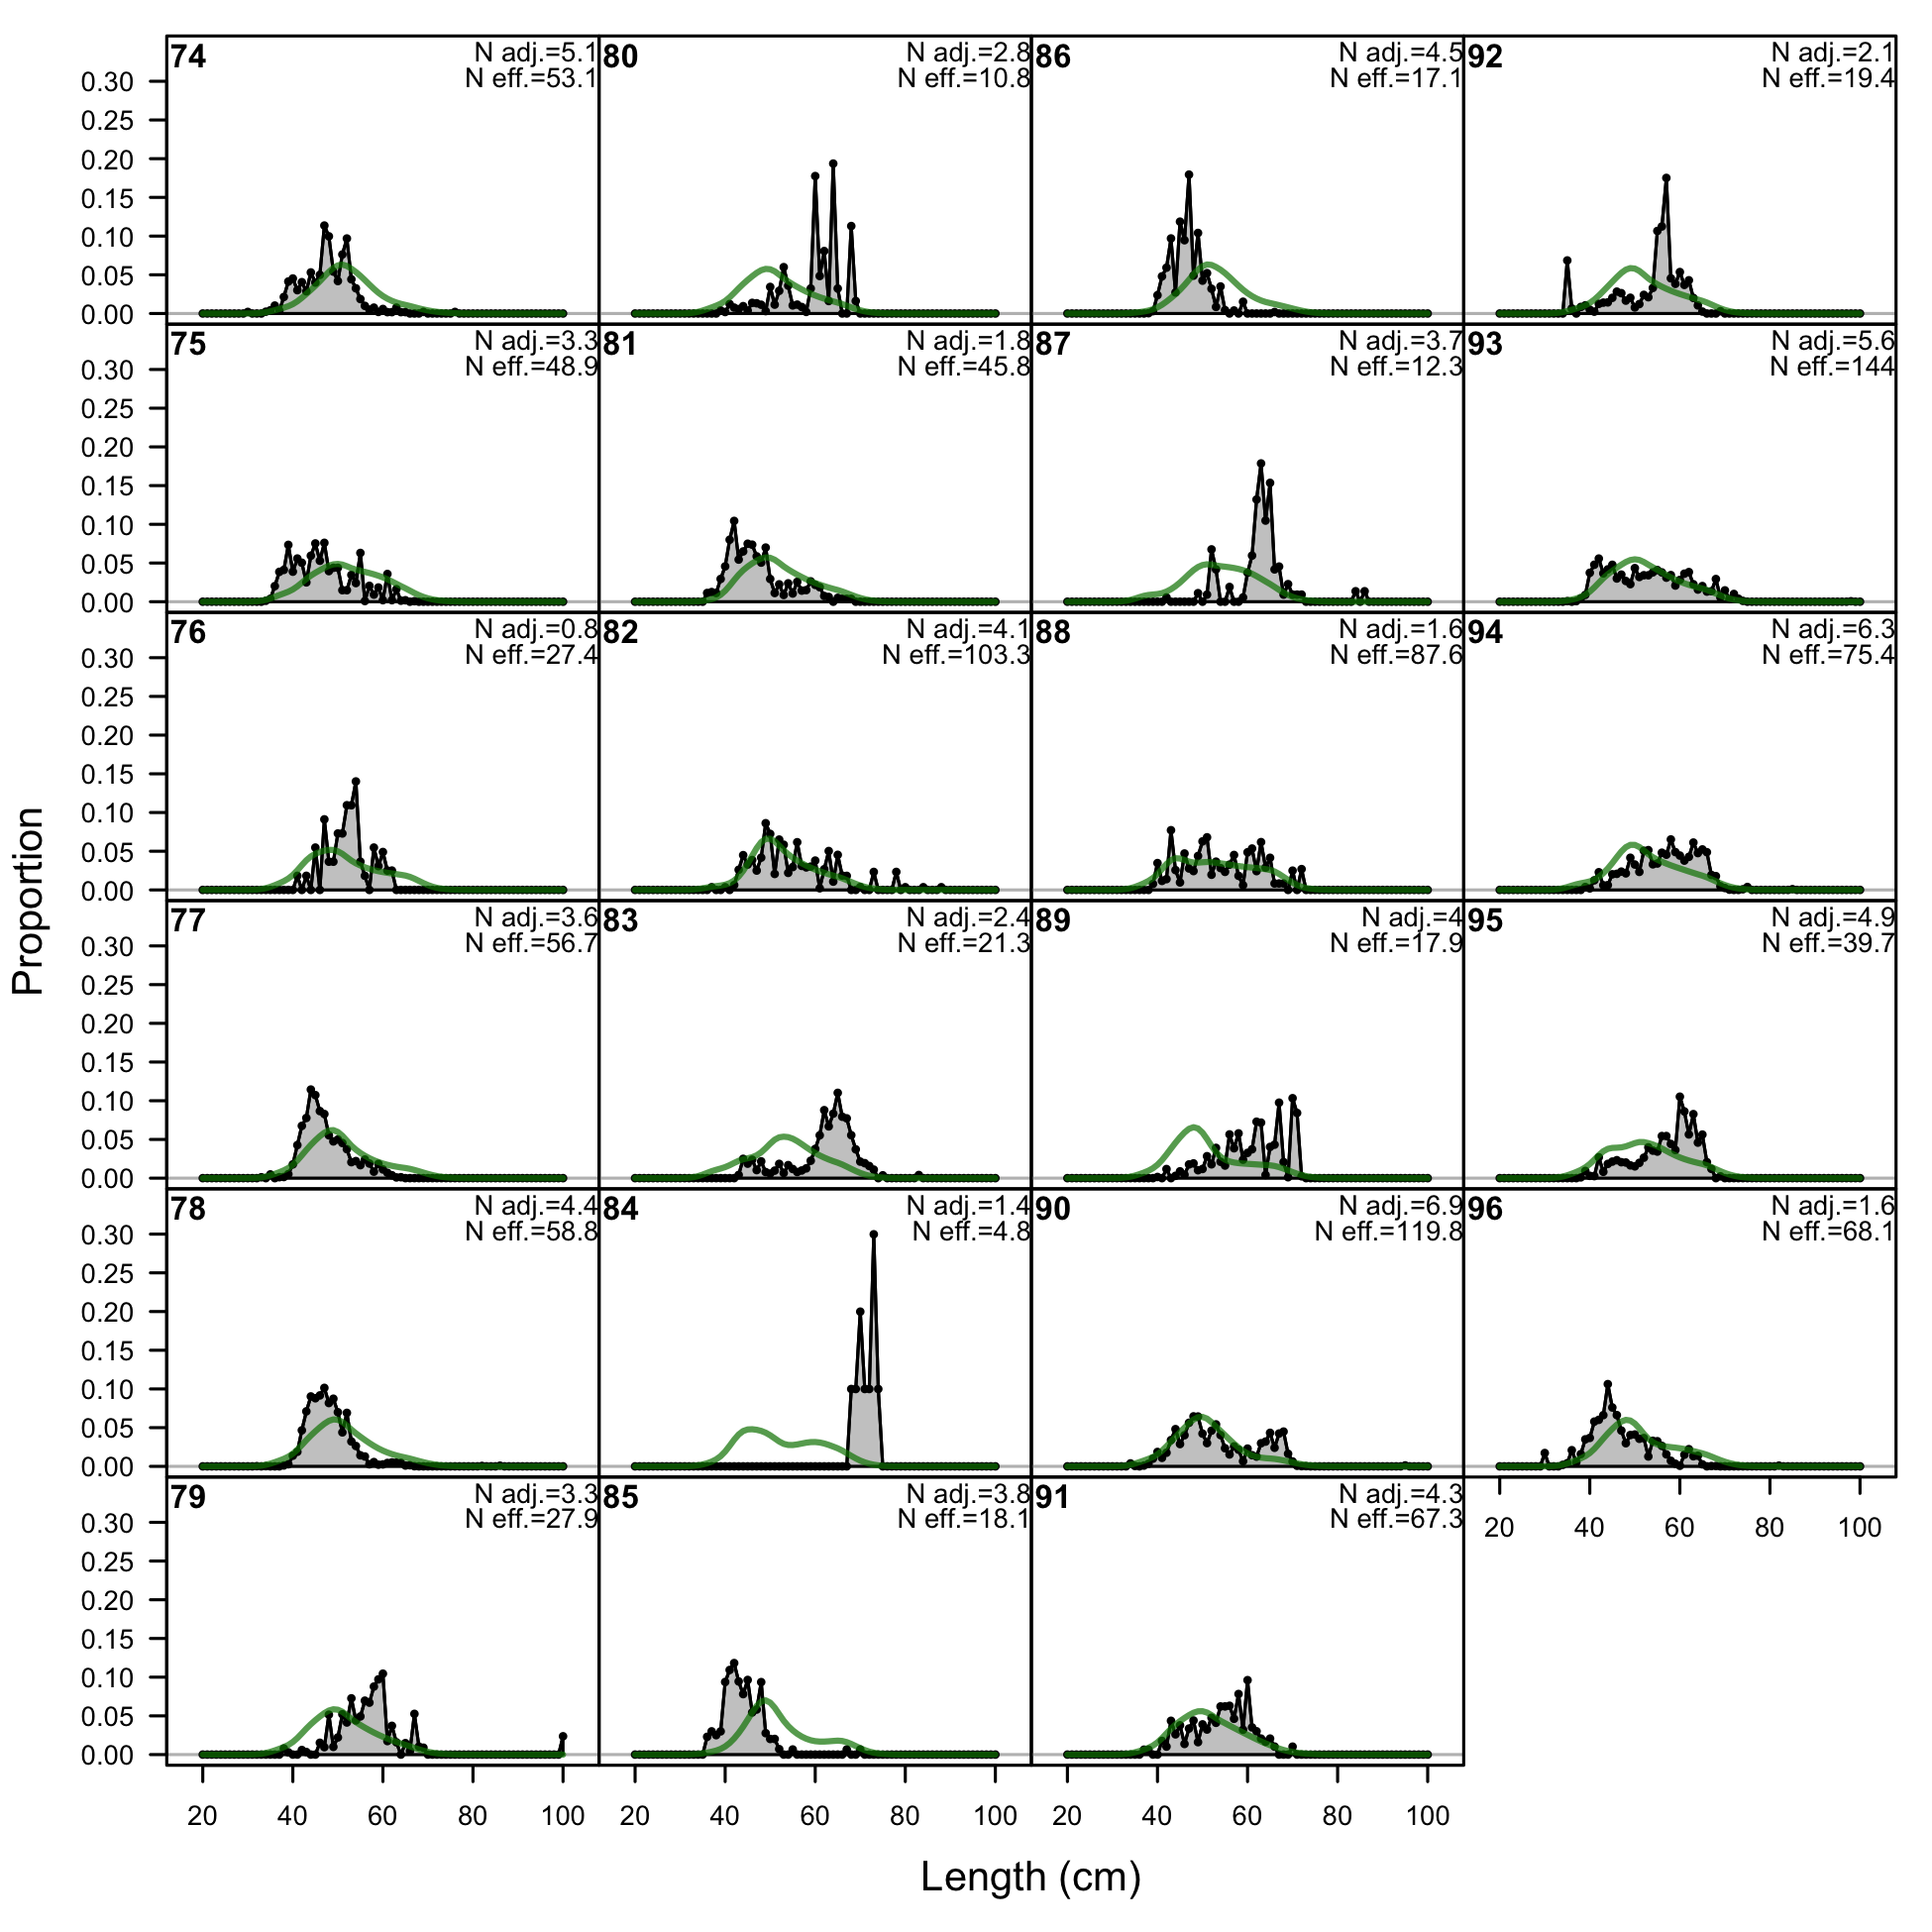
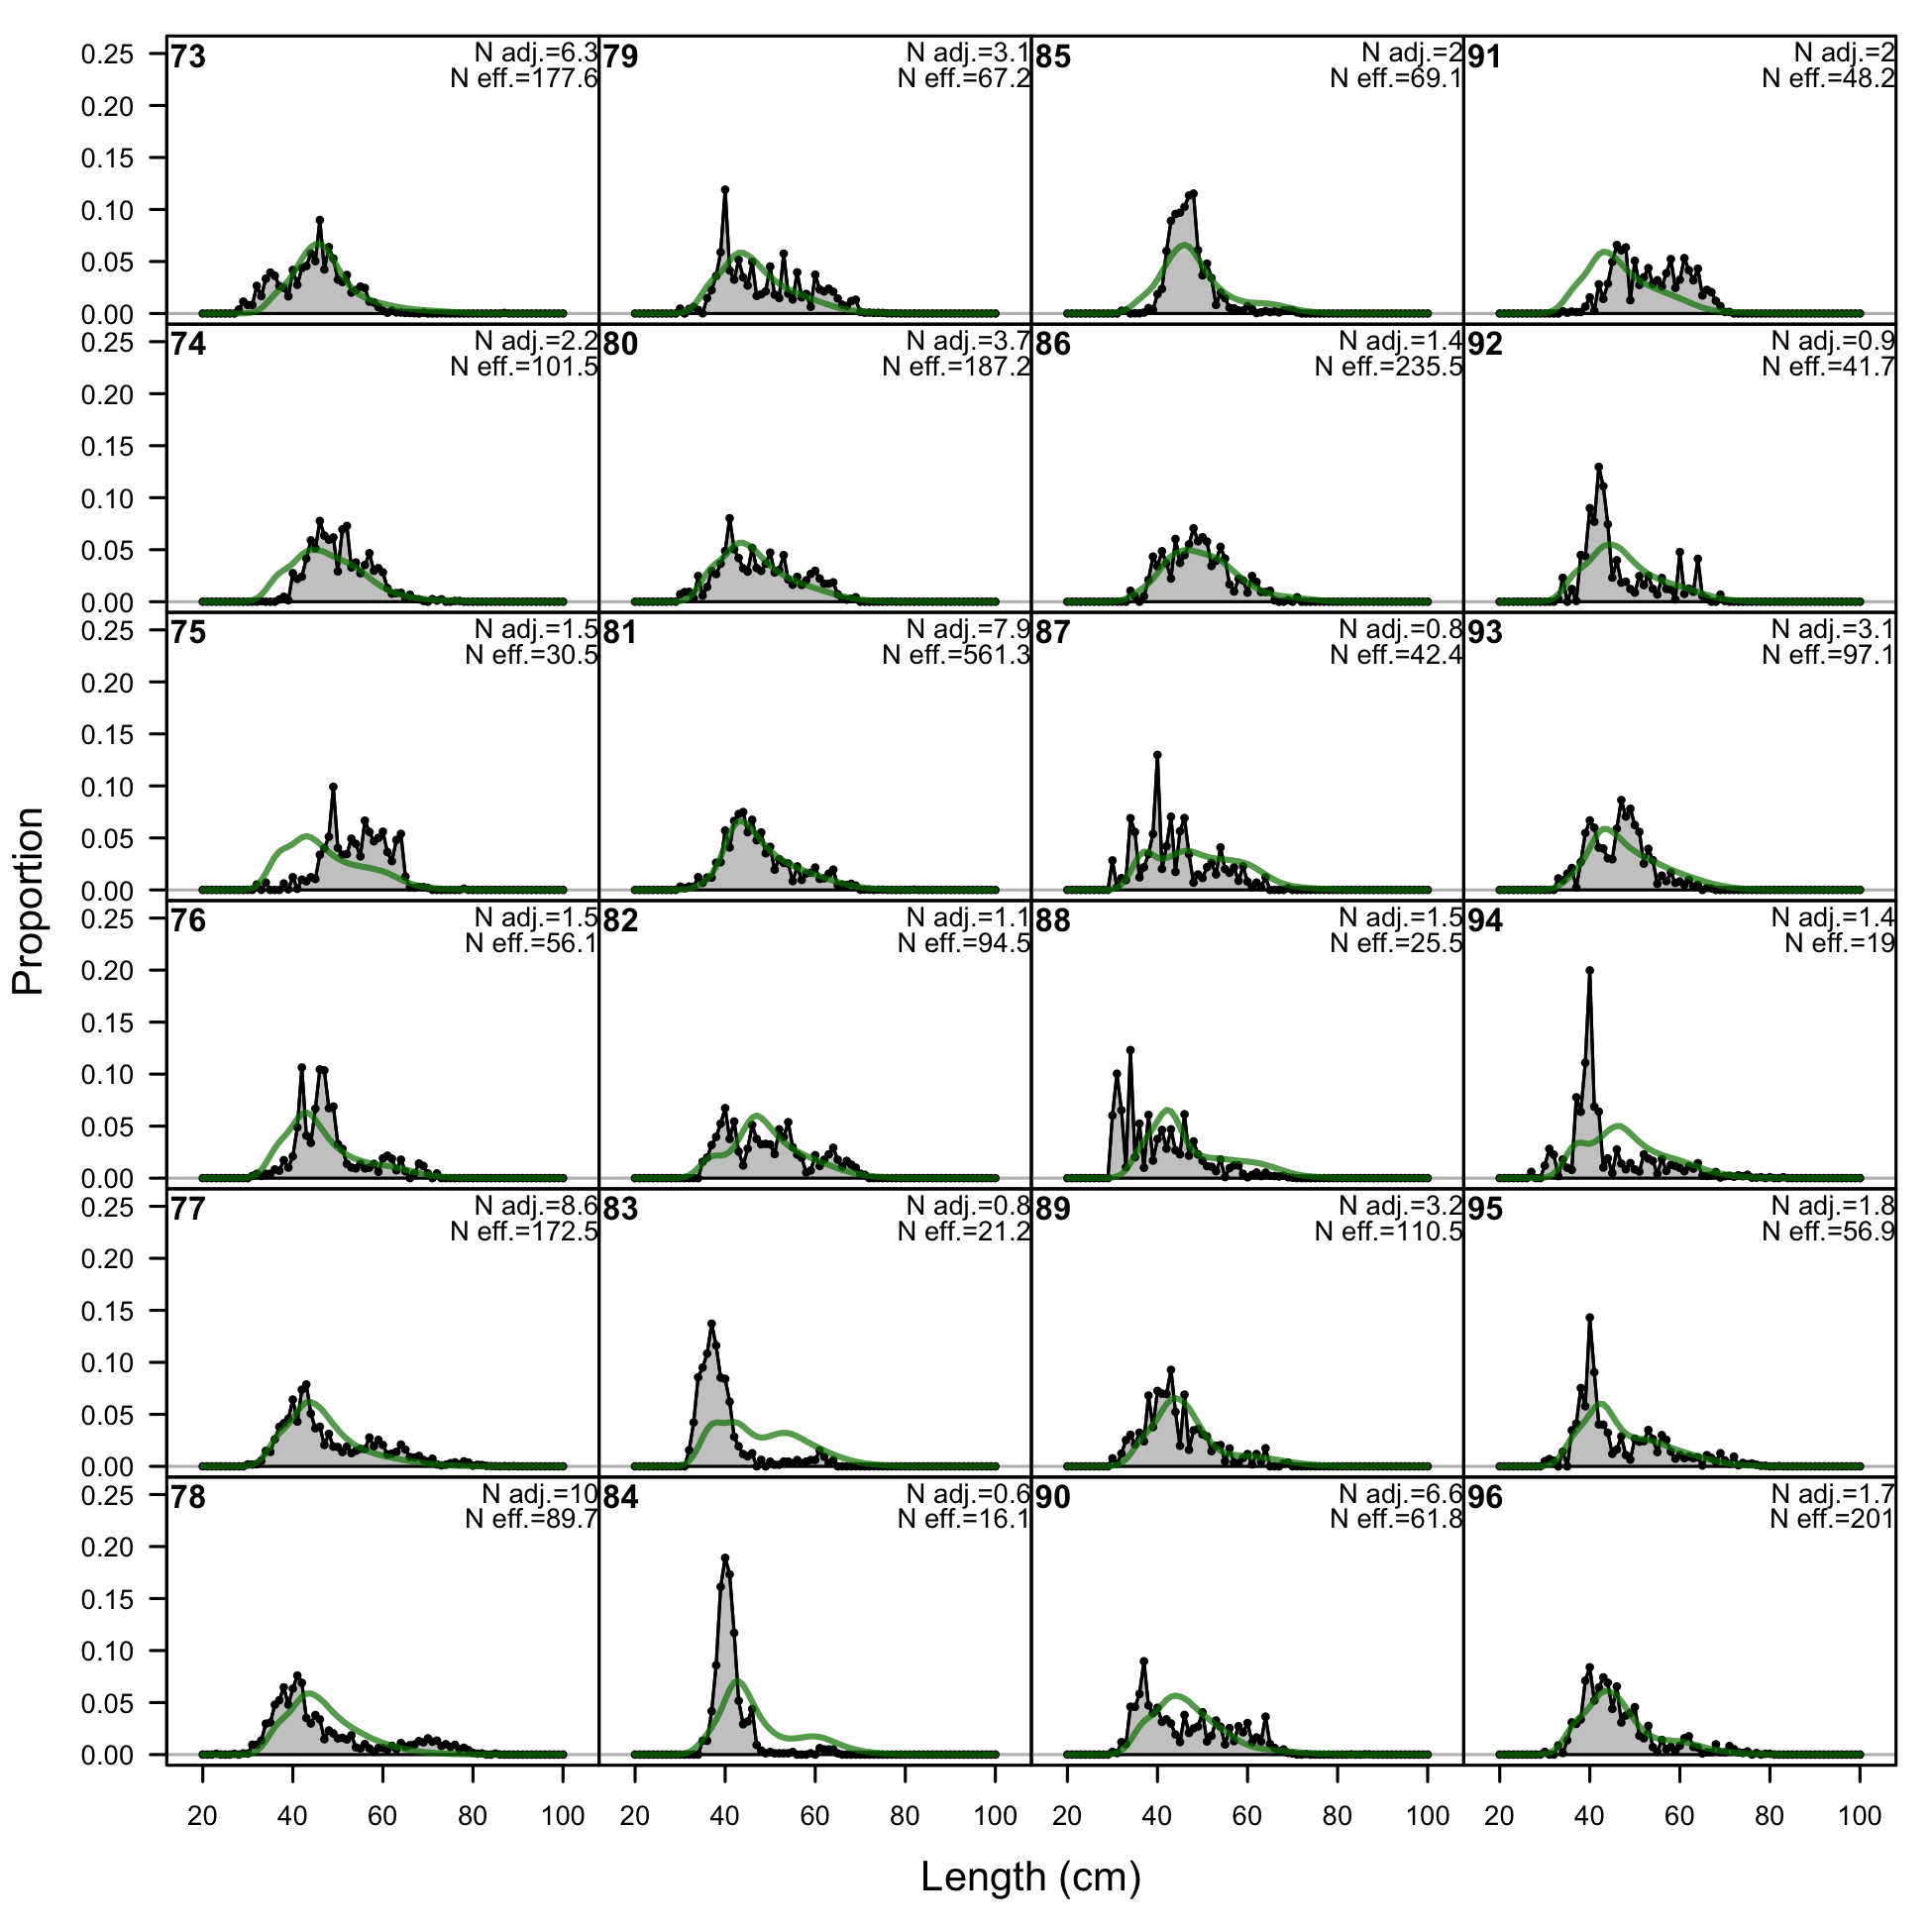
Length comps, retained, F3-OBJ_Central_Small (plot 1 of 3).
'N adj.' is the input sample size after data-weighting adjustment. N eff. is the calculated effective sample size used in the McAllister-Ianelli tuning method. (plot 2 of 3) (plot 3 of 3)
file: comp_lenfit_flt3mkt2_page3.png
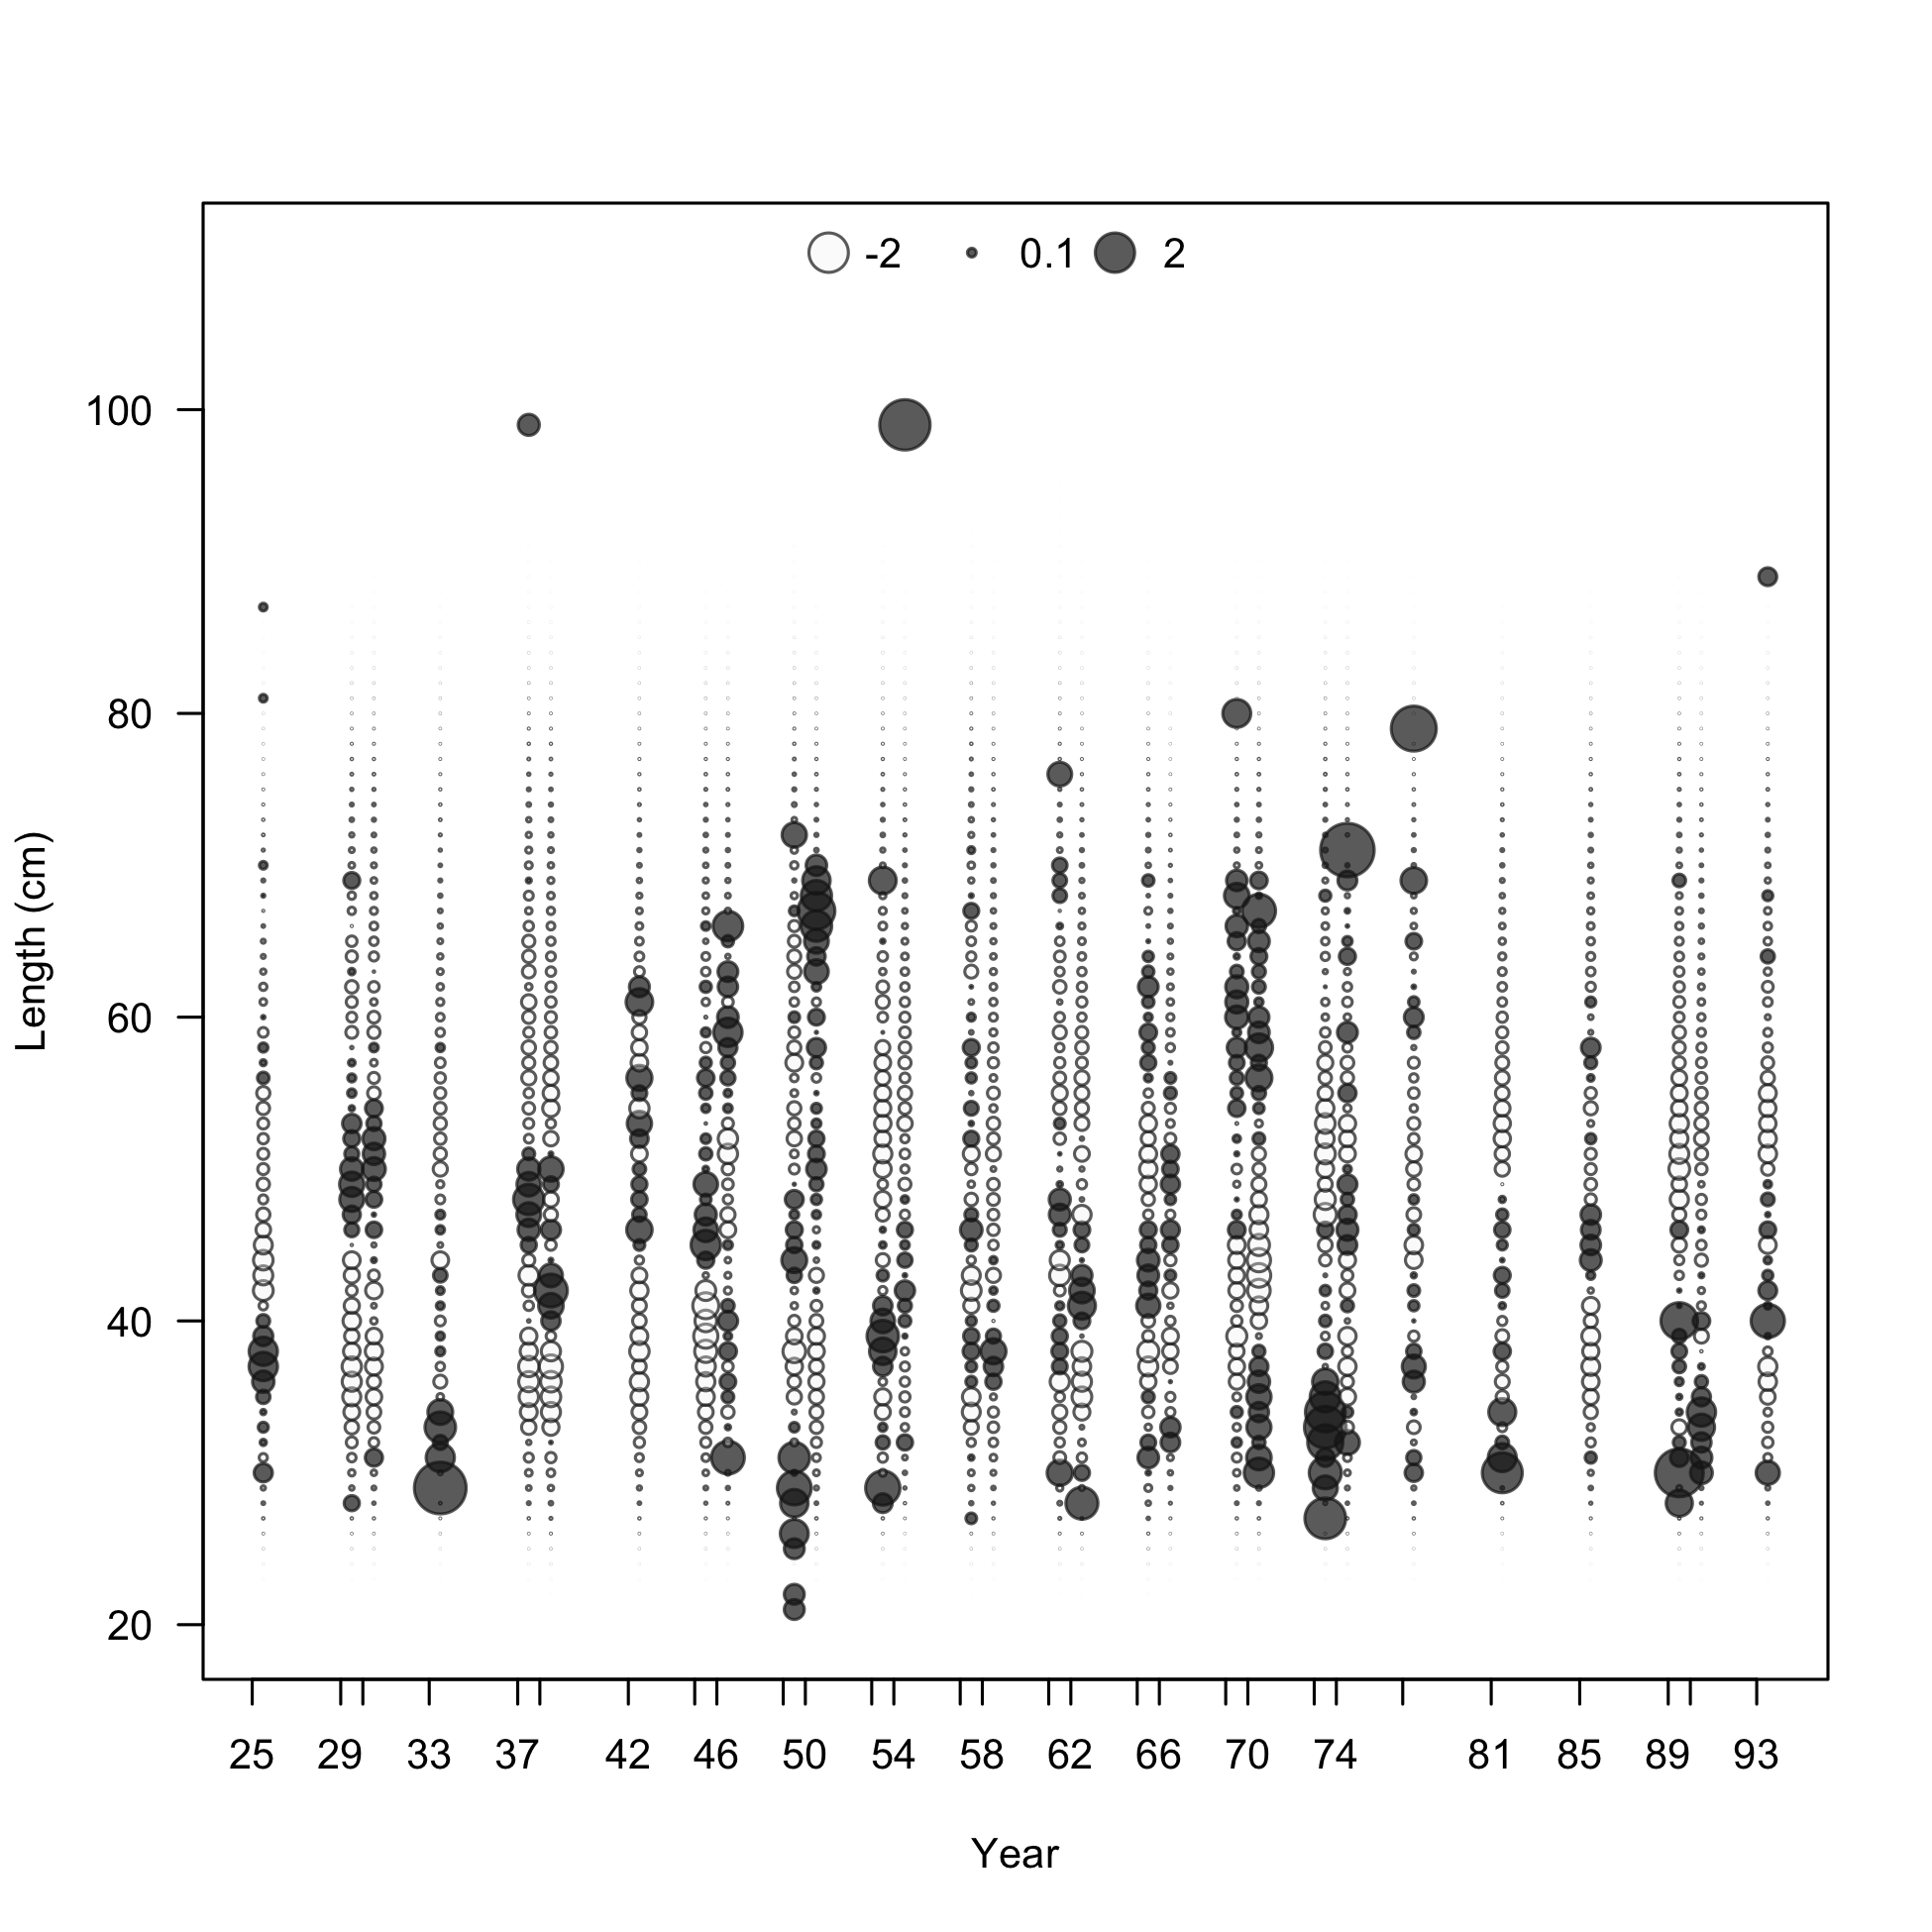
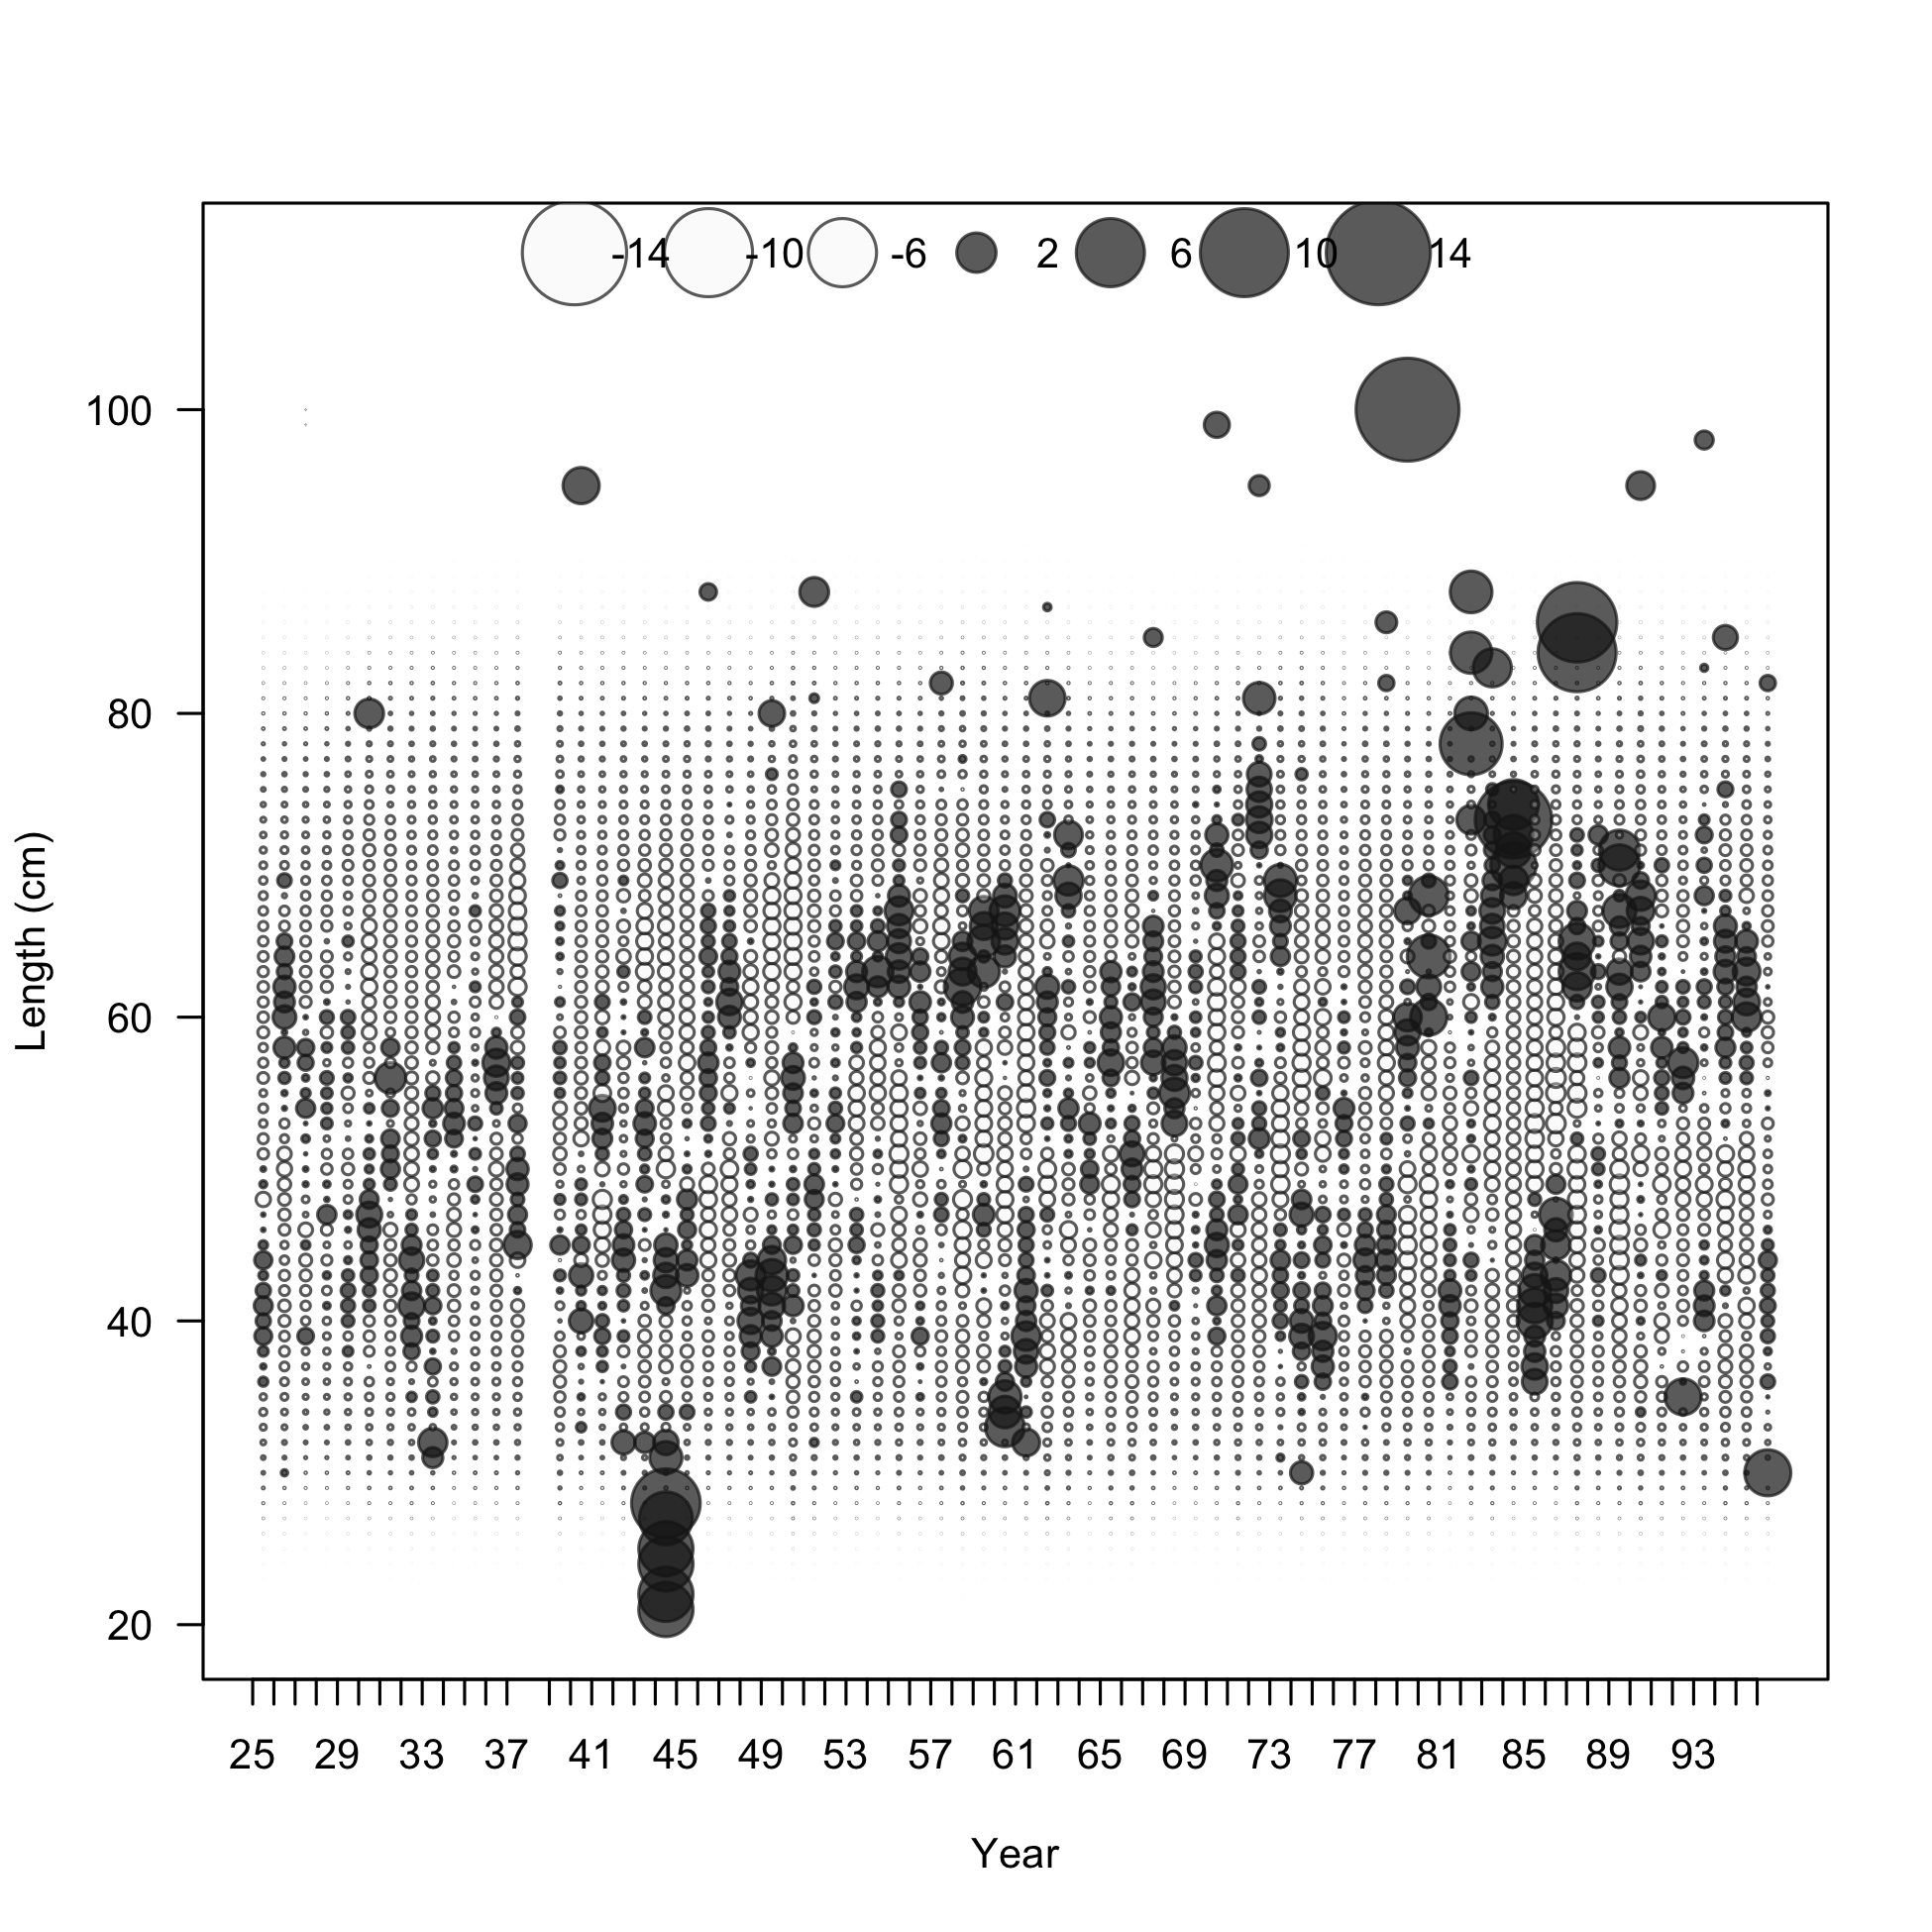
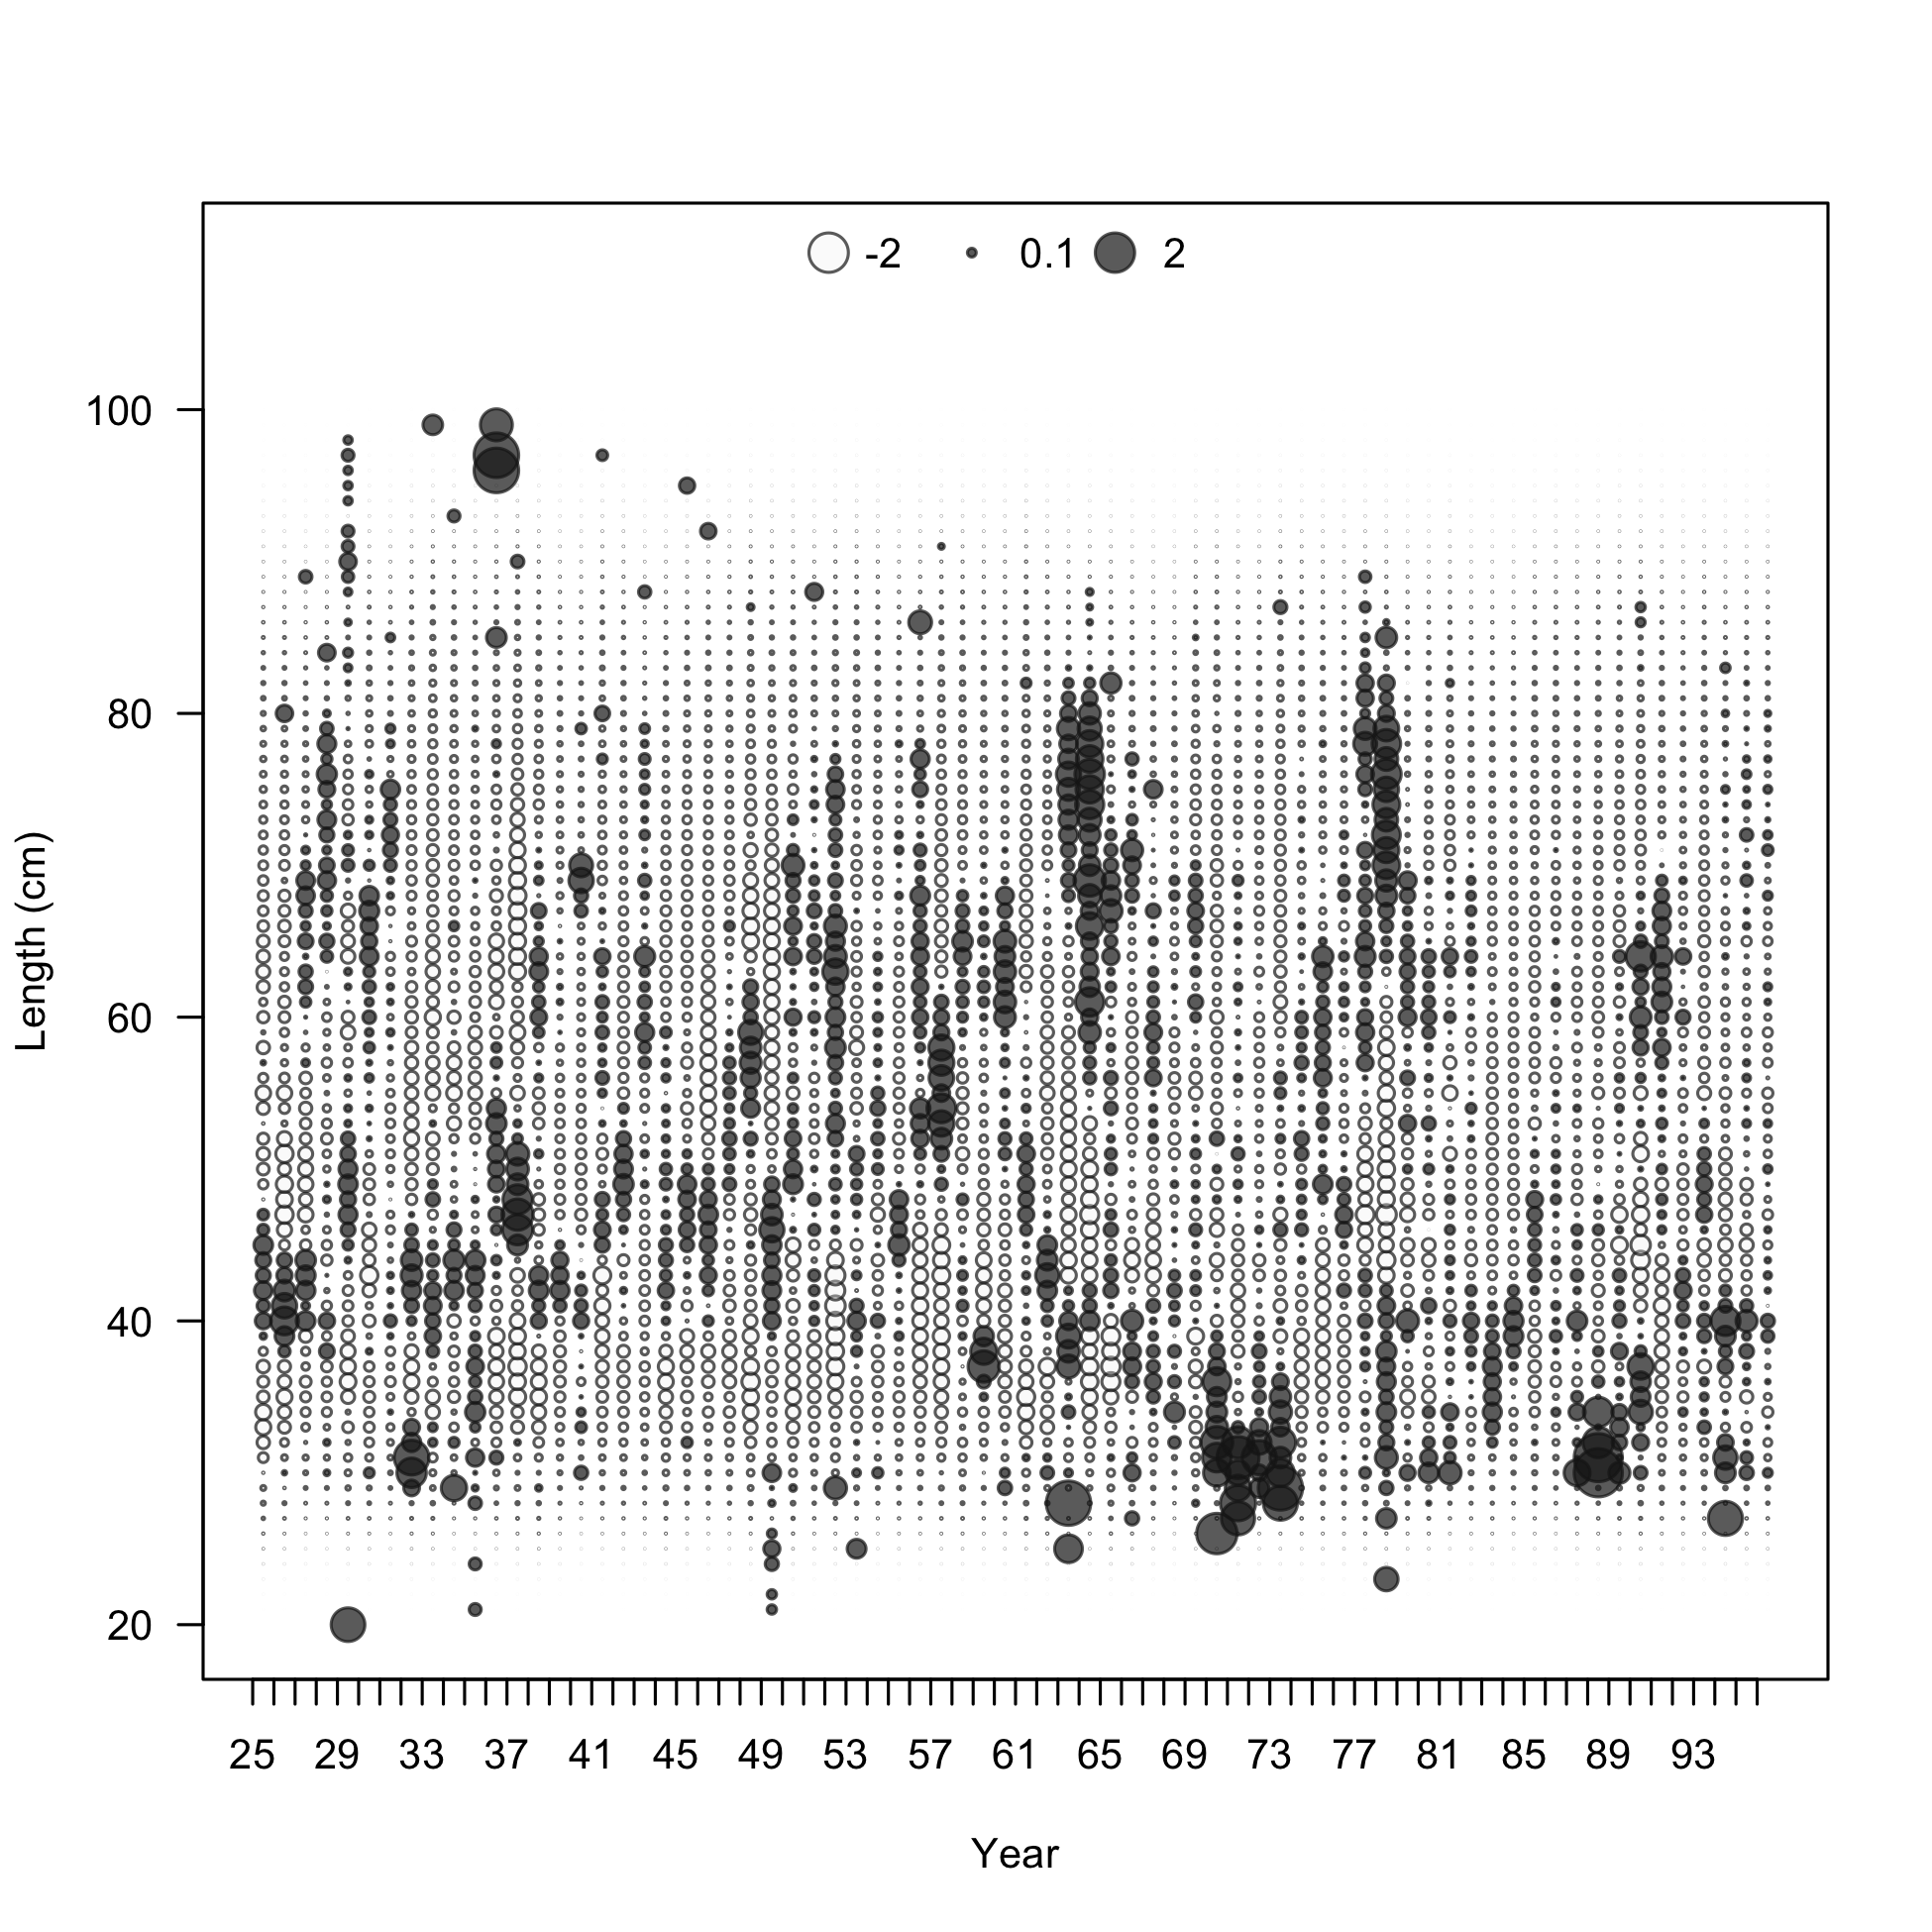
Pearson residuals, retained, F3-OBJ_Central_Small (max=8.24) (plot 3 of 3)
Closed bubbles are positive residuals (observed > expected) and open bubbles are negative residuals (observed < expected).
file: comp_lenfit_residsflt3mkt2_page3.png
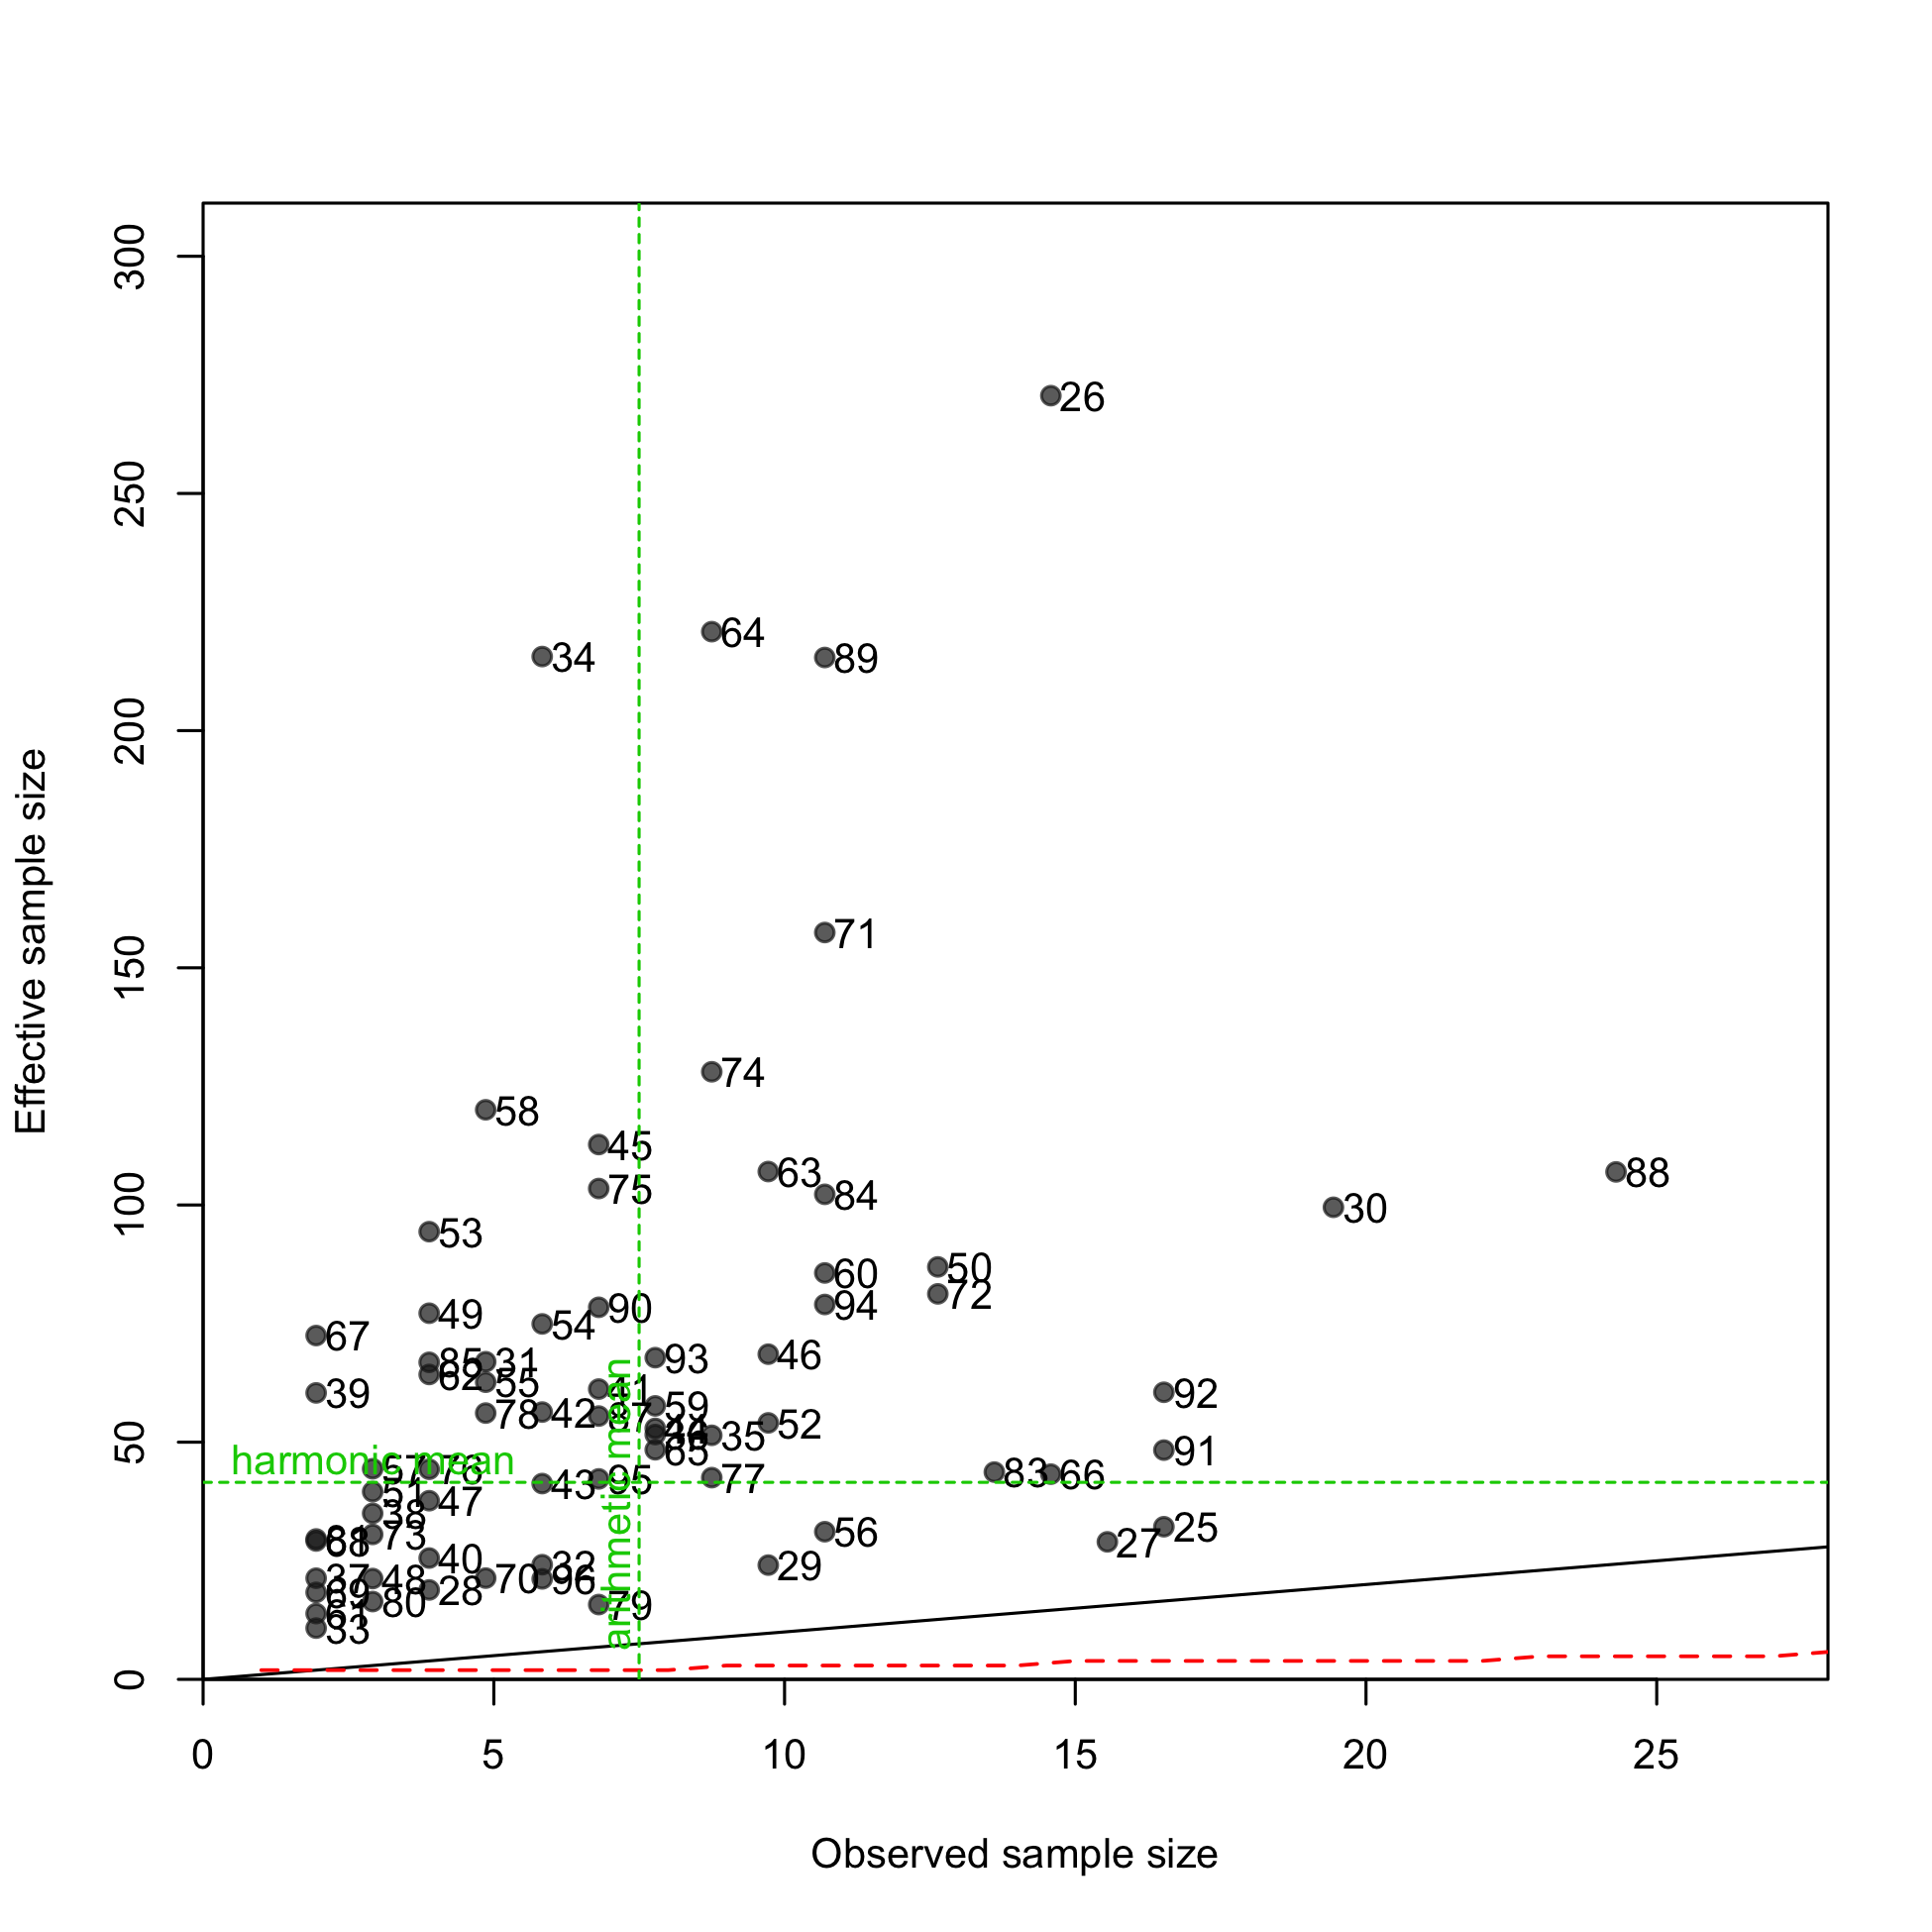
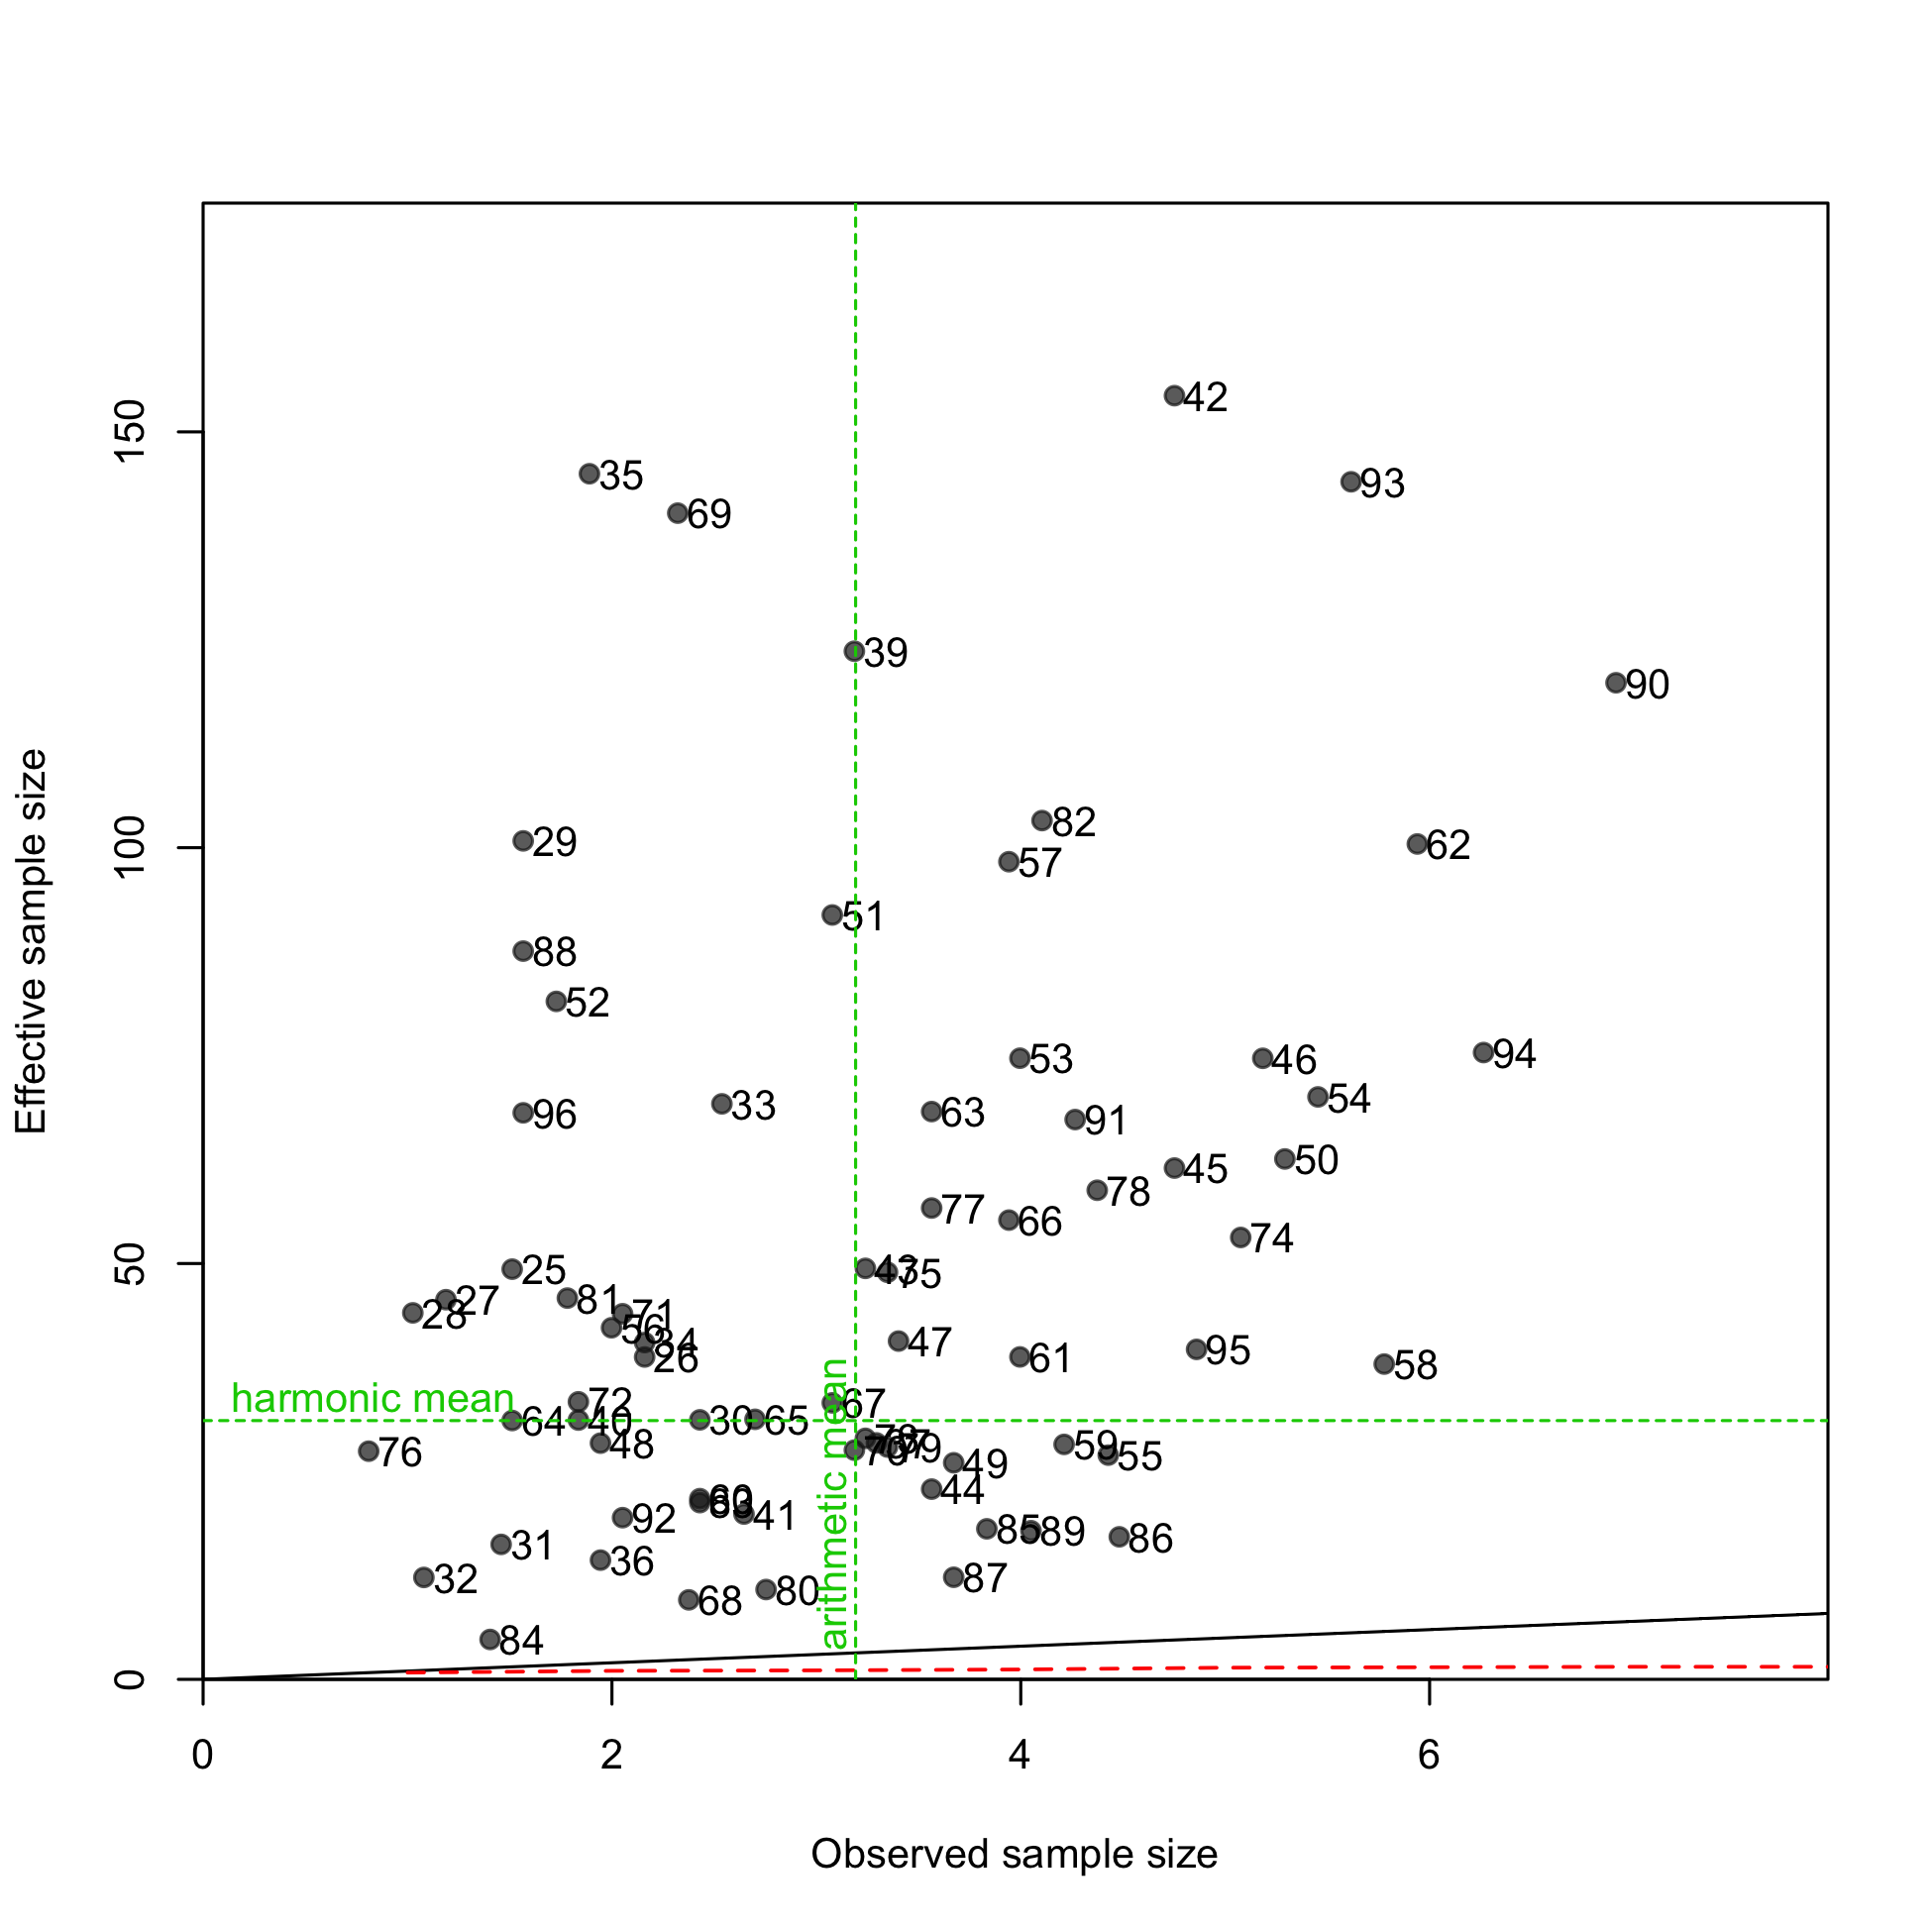
N-EffN comparison, Length comps, retained, F3-OBJ_Central_Small
file: comp_lenfit_sampsize_flt3mkt2.png
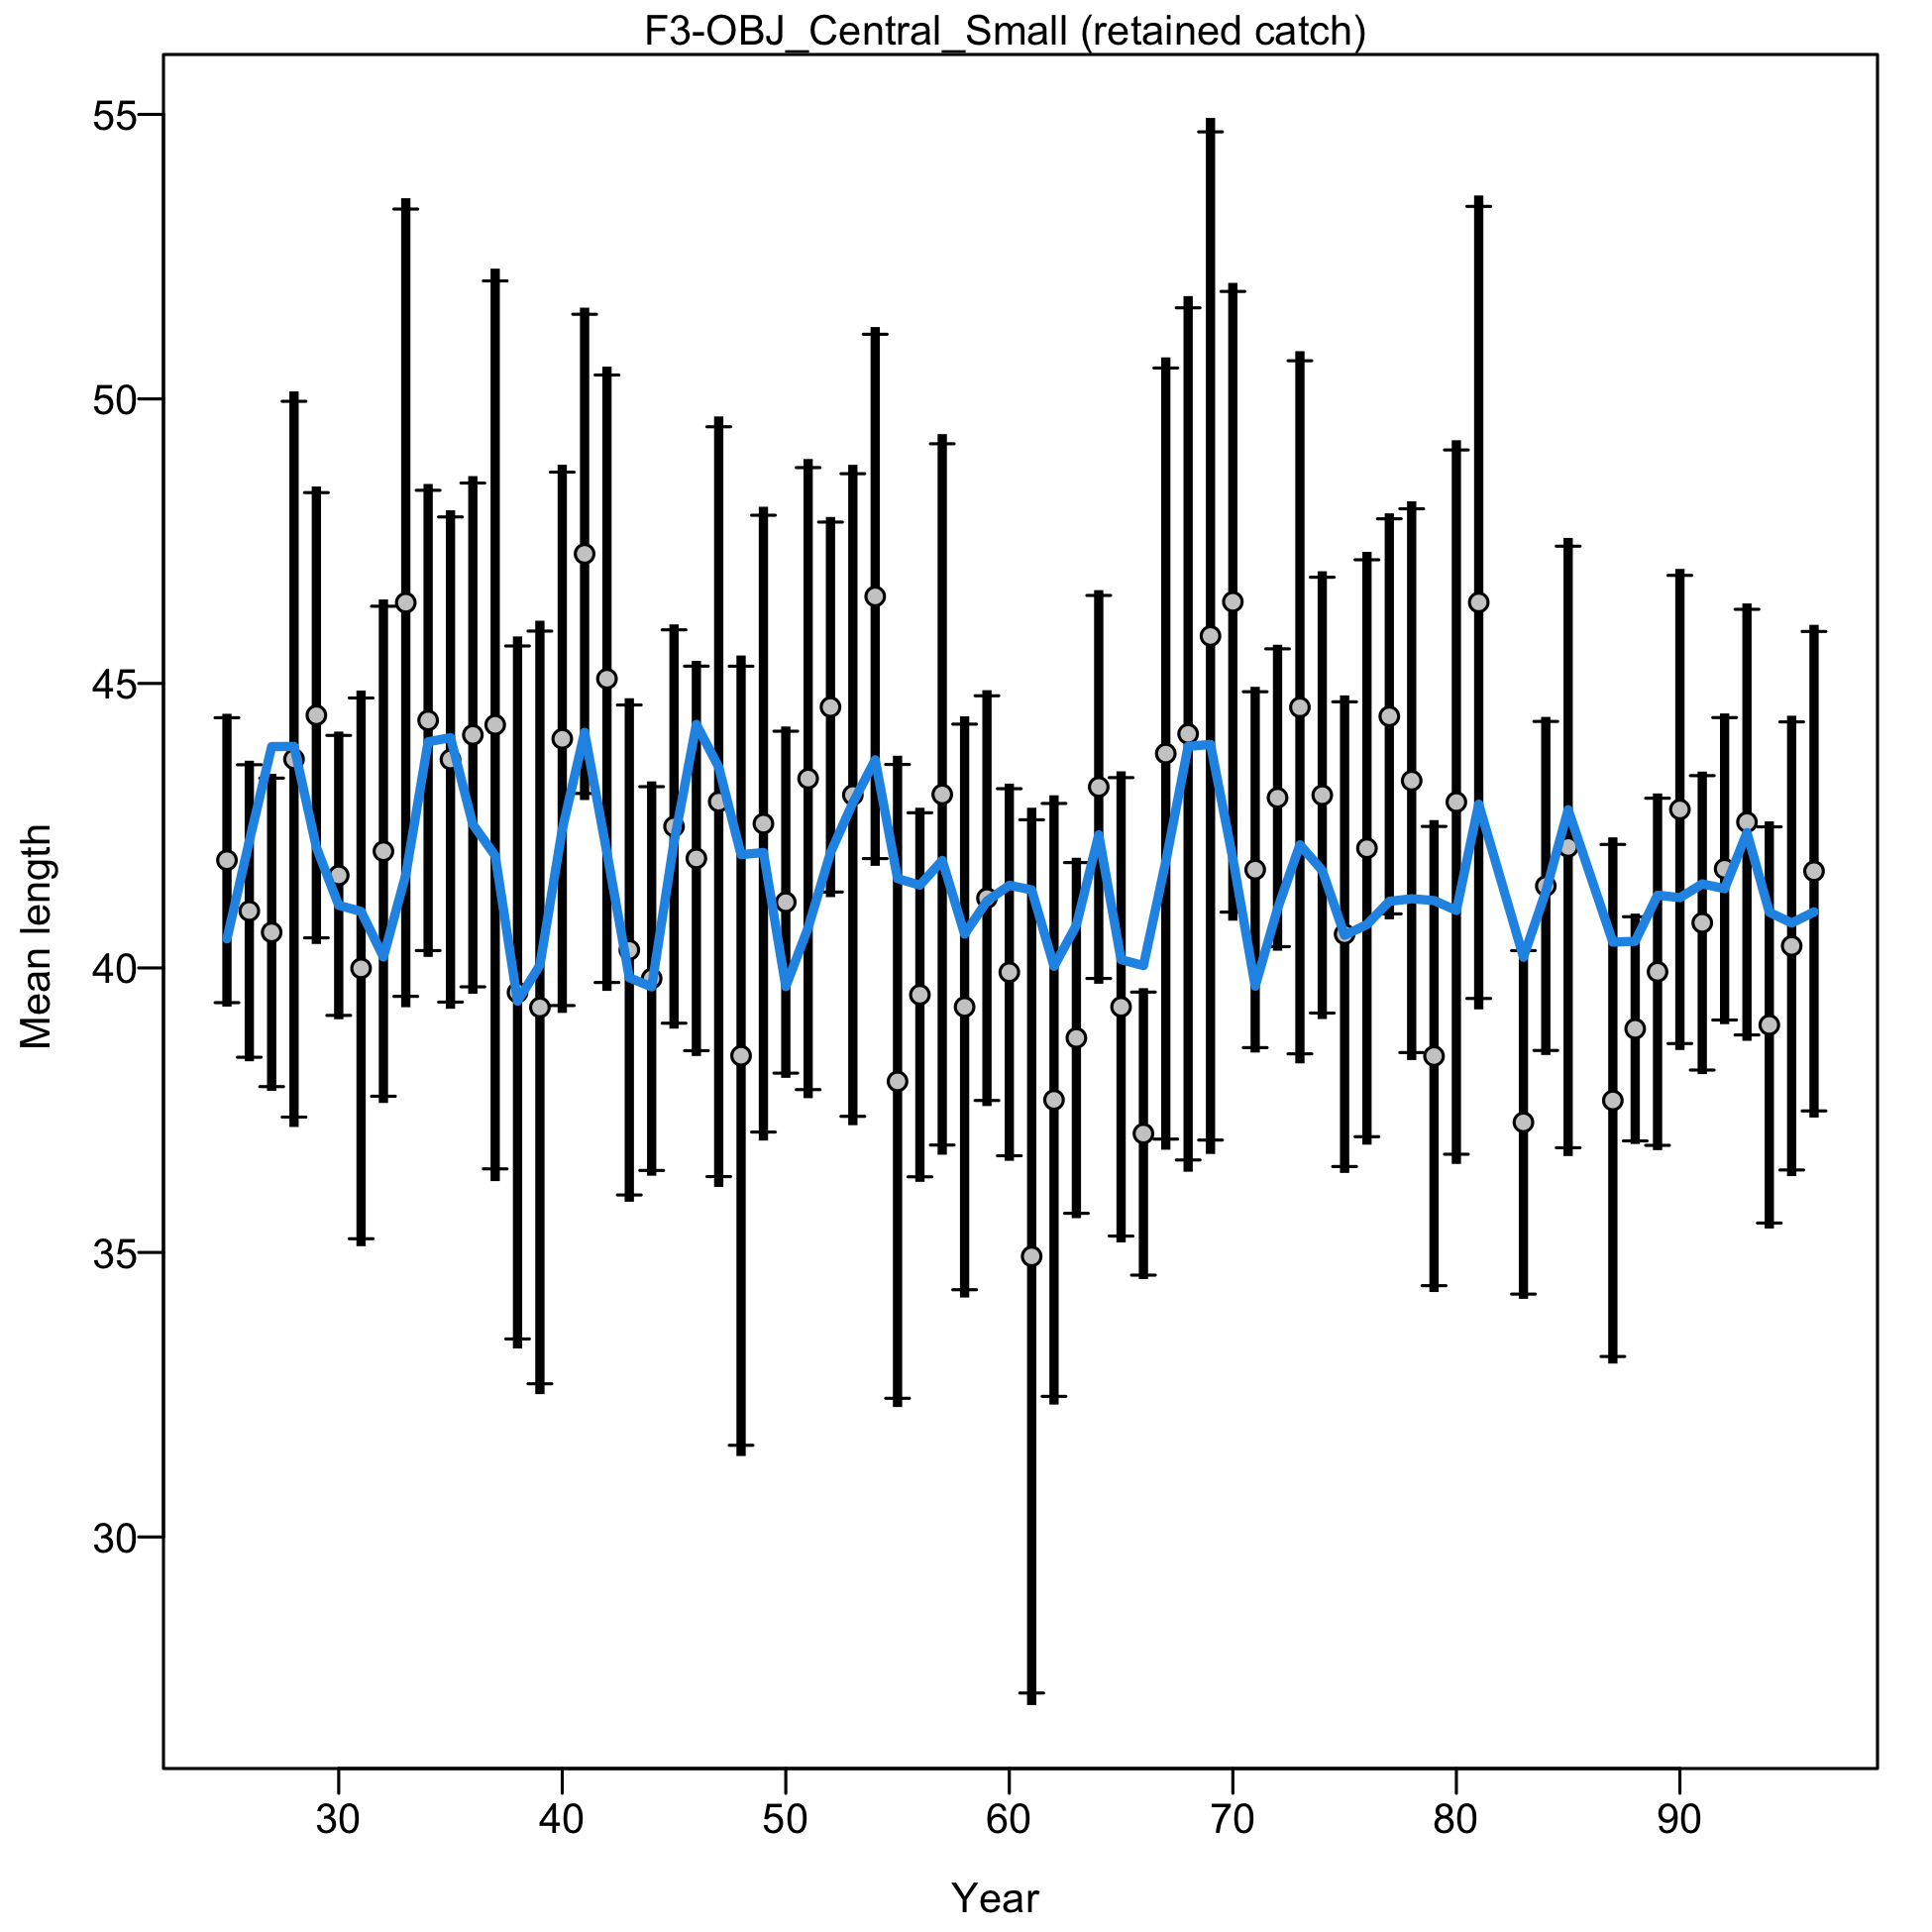
Mean length for F3-OBJ_Central_Small with 95% confidence intervals based on current sample sizes.
Francis data weighting method TA1.8: thinner intervals (with capped ends) show result of further adjusting sample sizes based on suggested multiplier (with 95% interval) for len data from F3-OBJ_Central_Small:
1.0559 (0.8249-1.4864)
For more info, see Francis (2011).
file: comp_lenfit_data_weighting_TA1.8_F3-OBJ_Central_Small.png

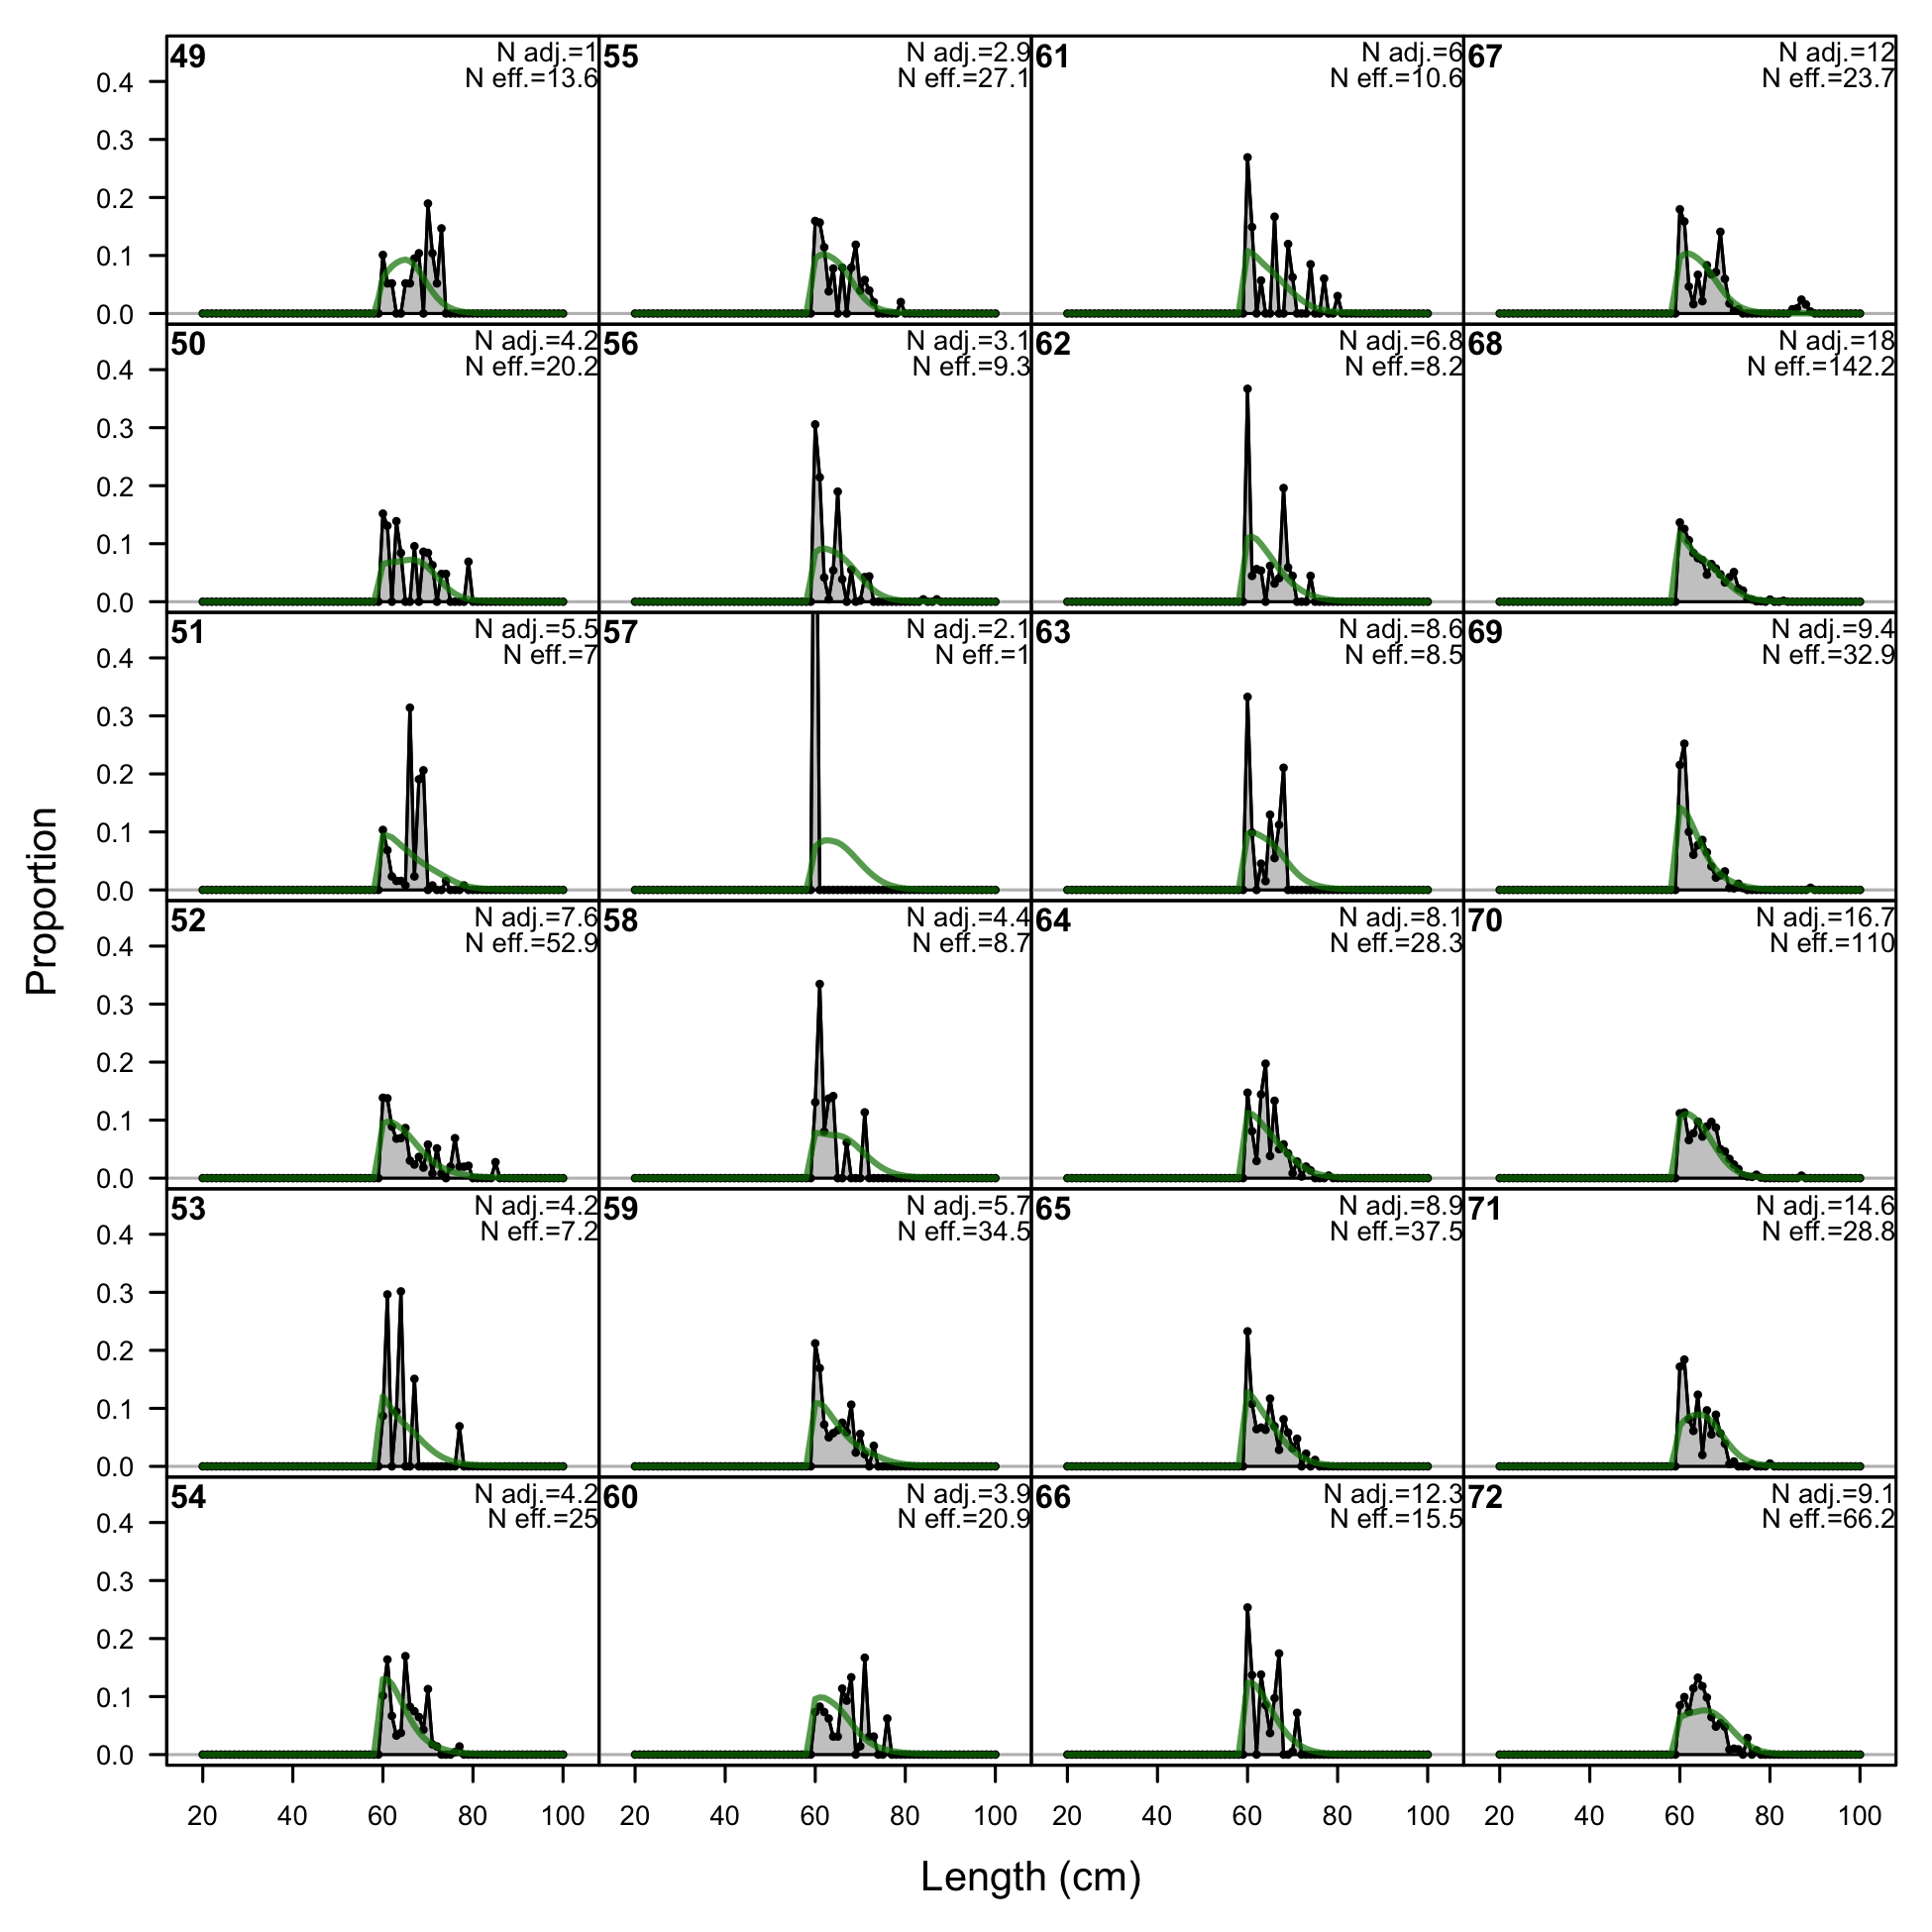
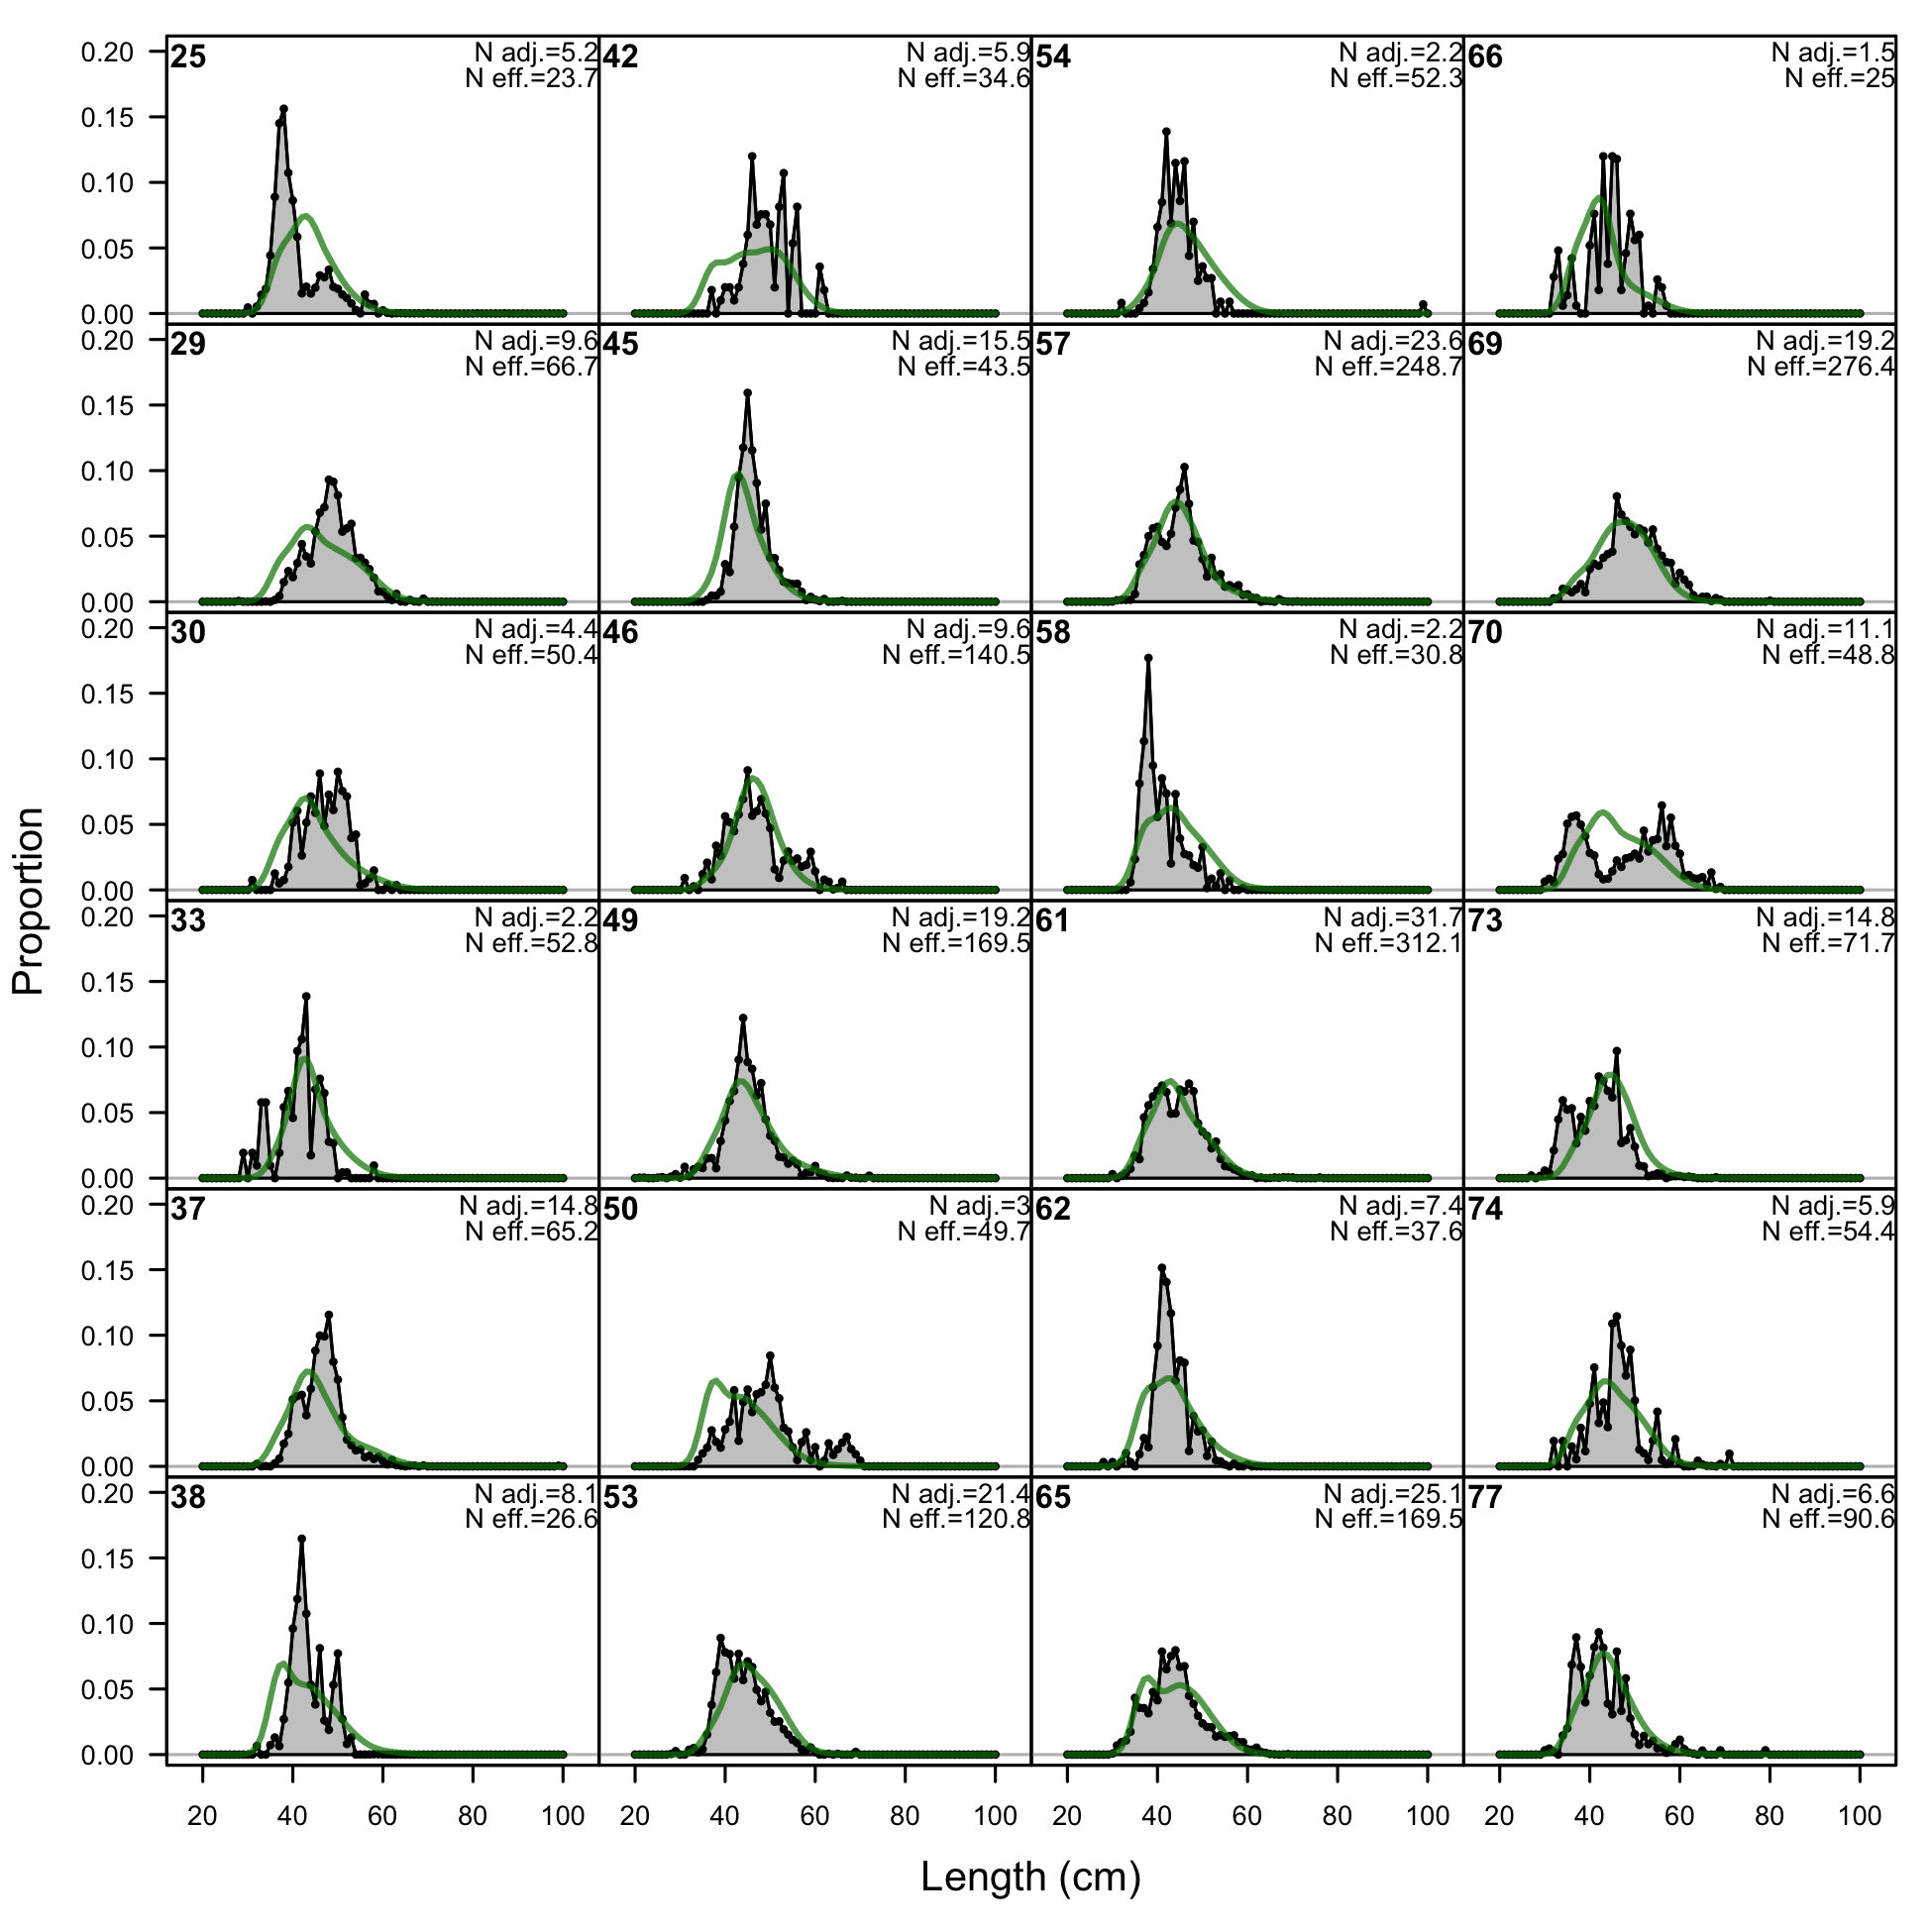
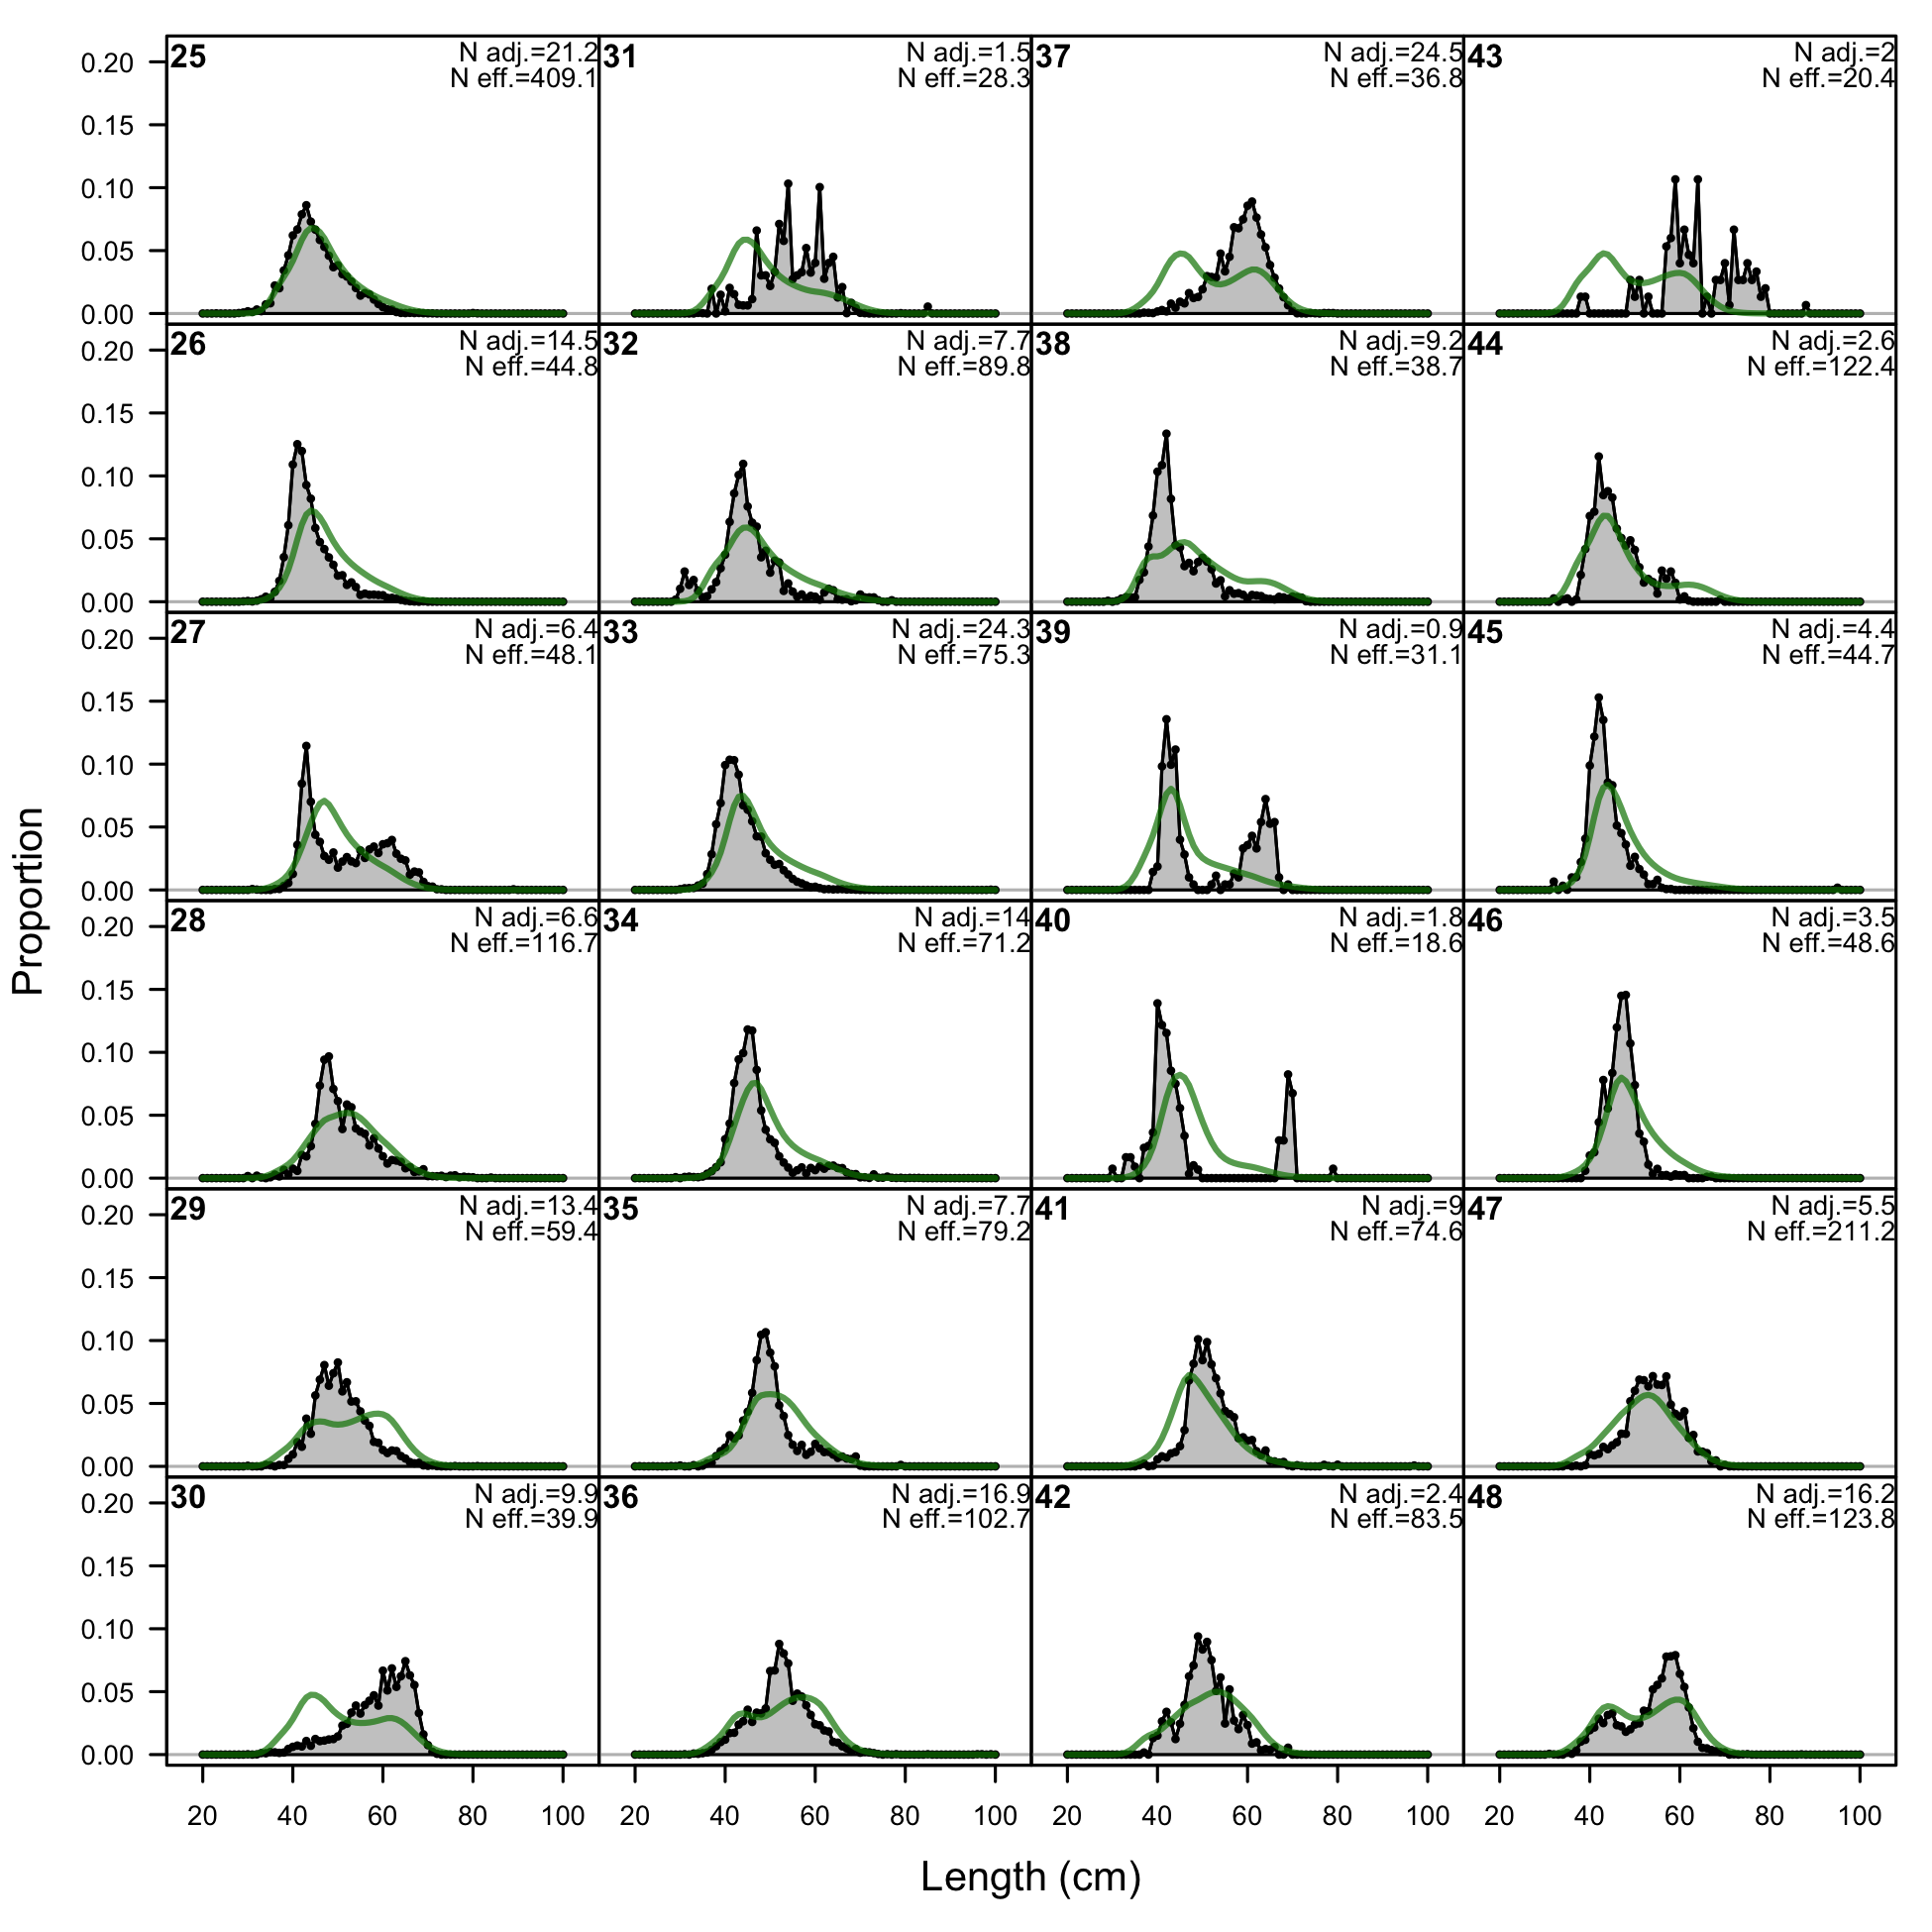
Length comps, retained, F4-OBJ_Central_Large (plot 1 of 3).
'N adj.' is the input sample size after data-weighting adjustment. N eff. is the calculated effective sample size used in the McAllister-Ianelli tuning method.
file: comp_lenfit_flt4mkt2_page1.png
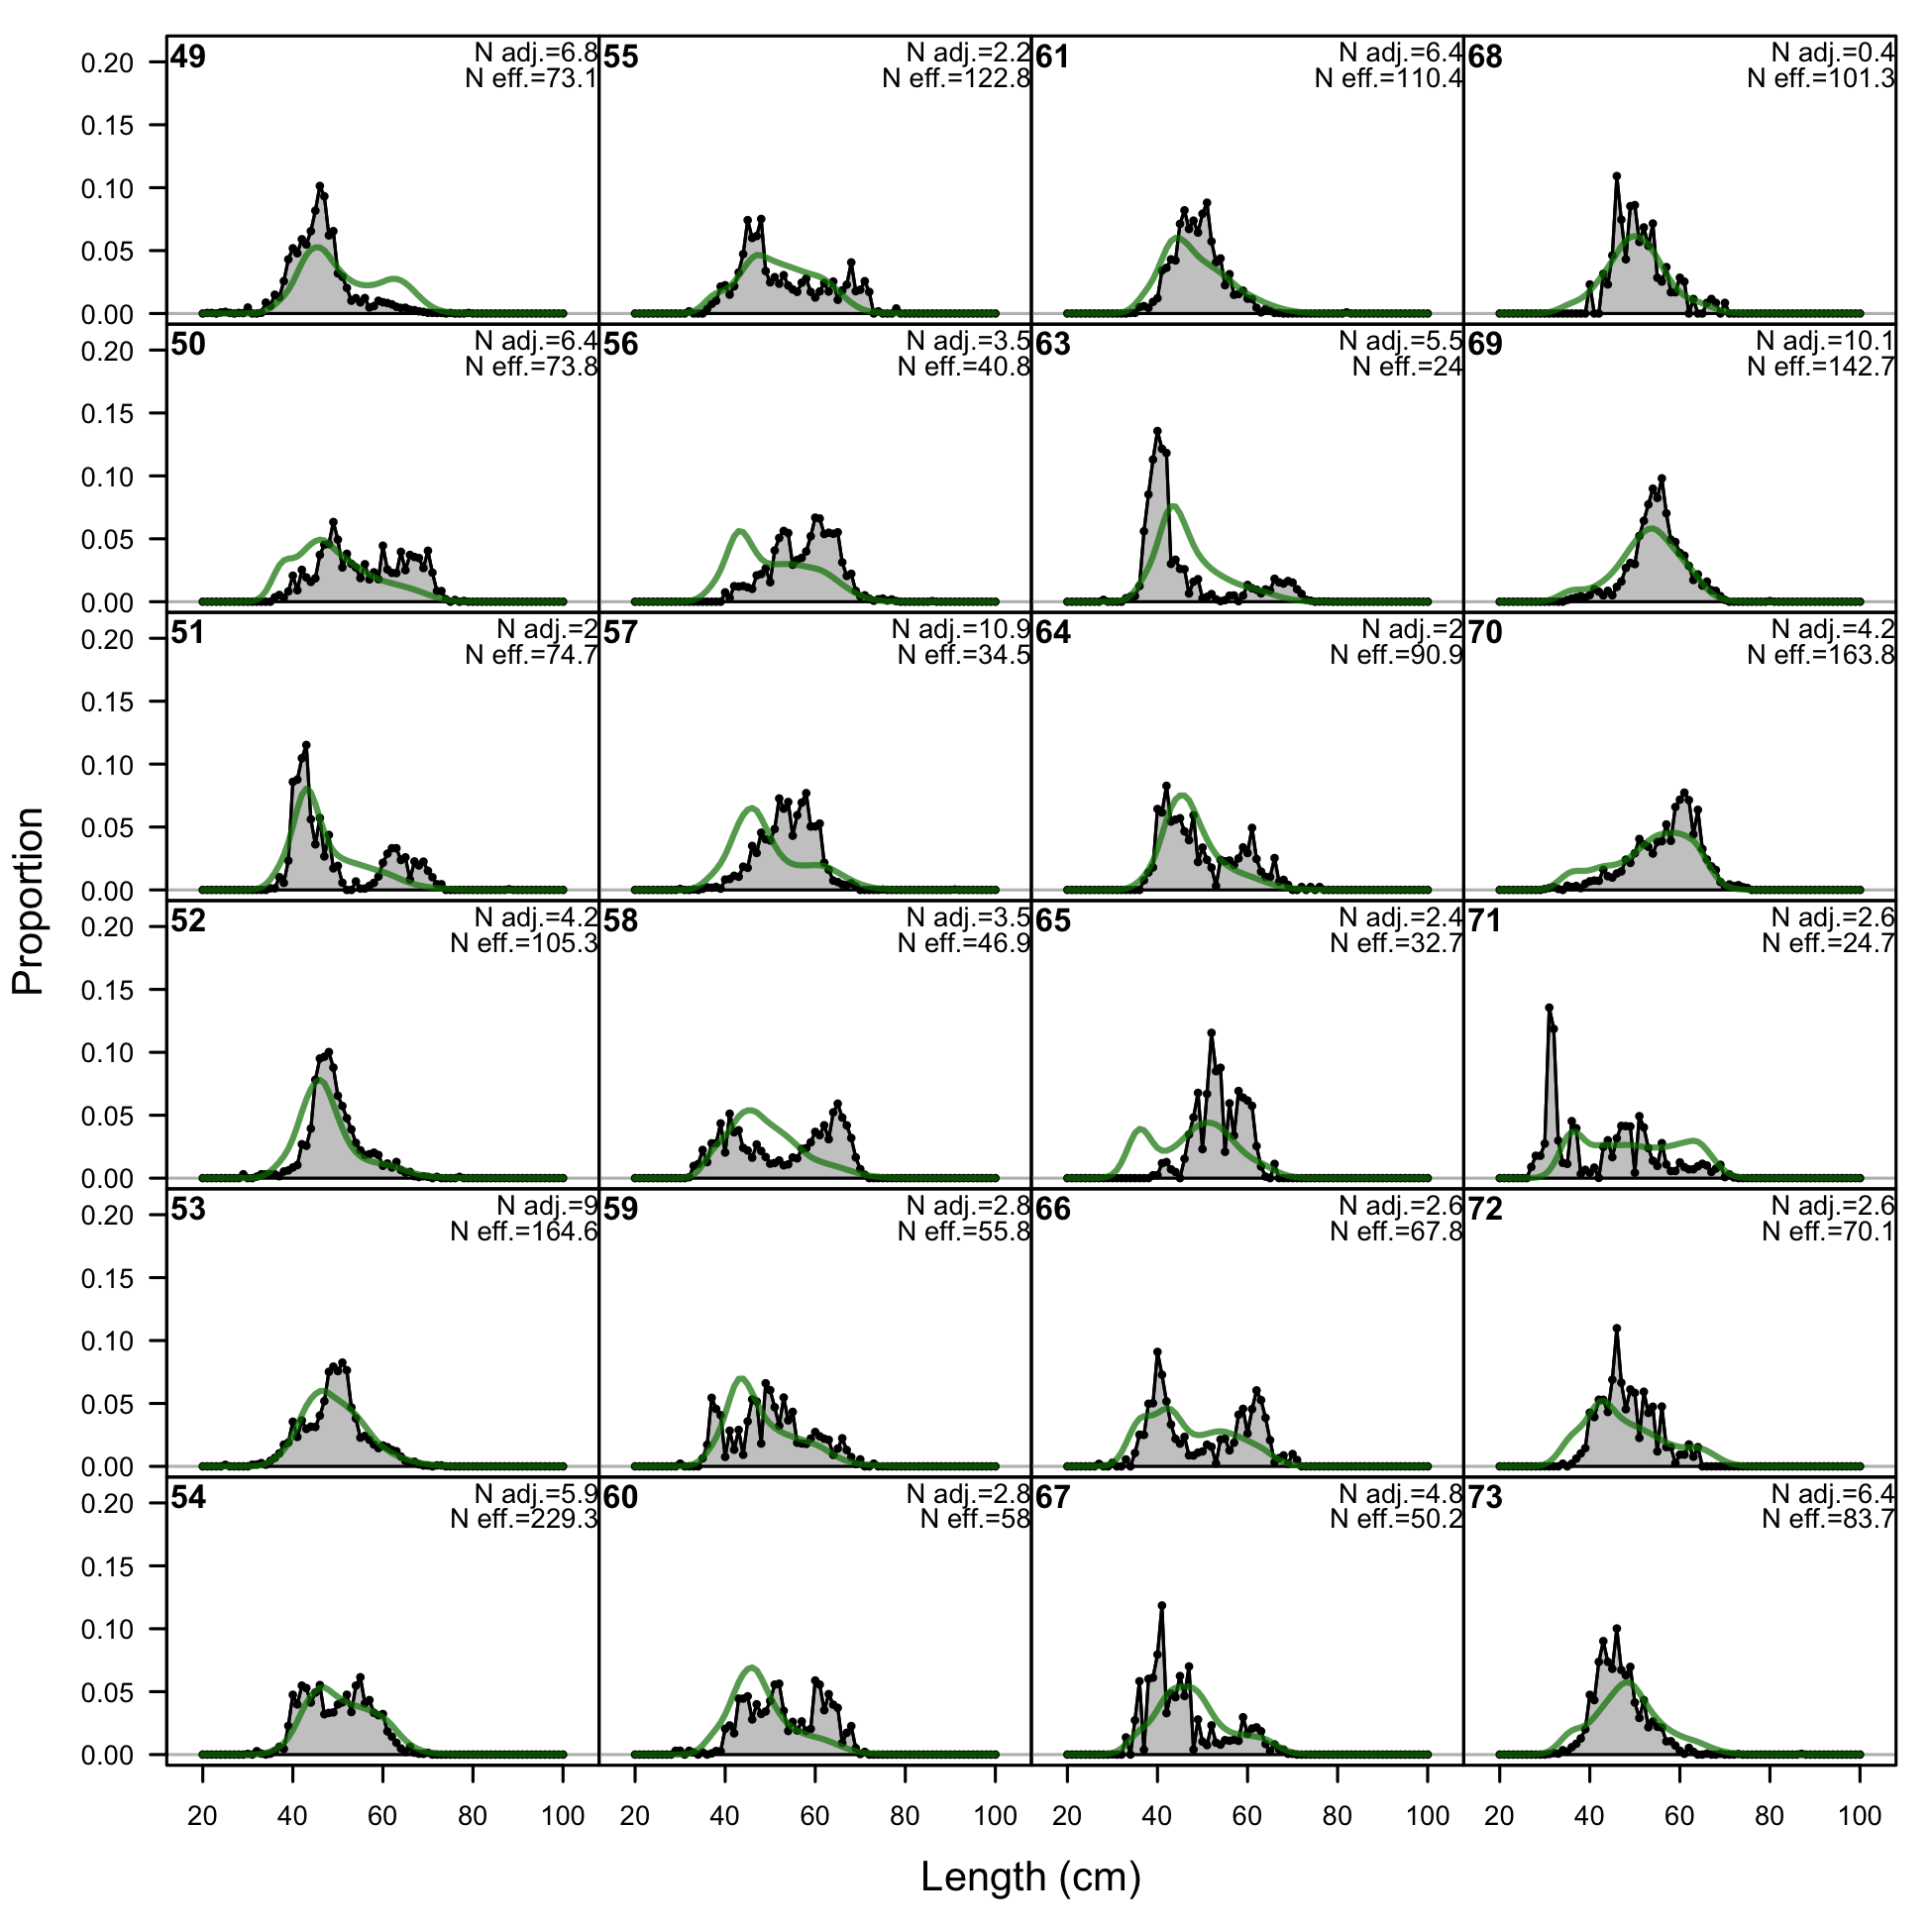
Length comps, retained, F4-OBJ_Central_Large (plot 1 of 3).
'N adj.' is the input sample size after data-weighting adjustment. N eff. is the calculated effective sample size used in the McAllister-Ianelli tuning method. (plot 2 of 3)
file: comp_lenfit_flt4mkt2_page2.png
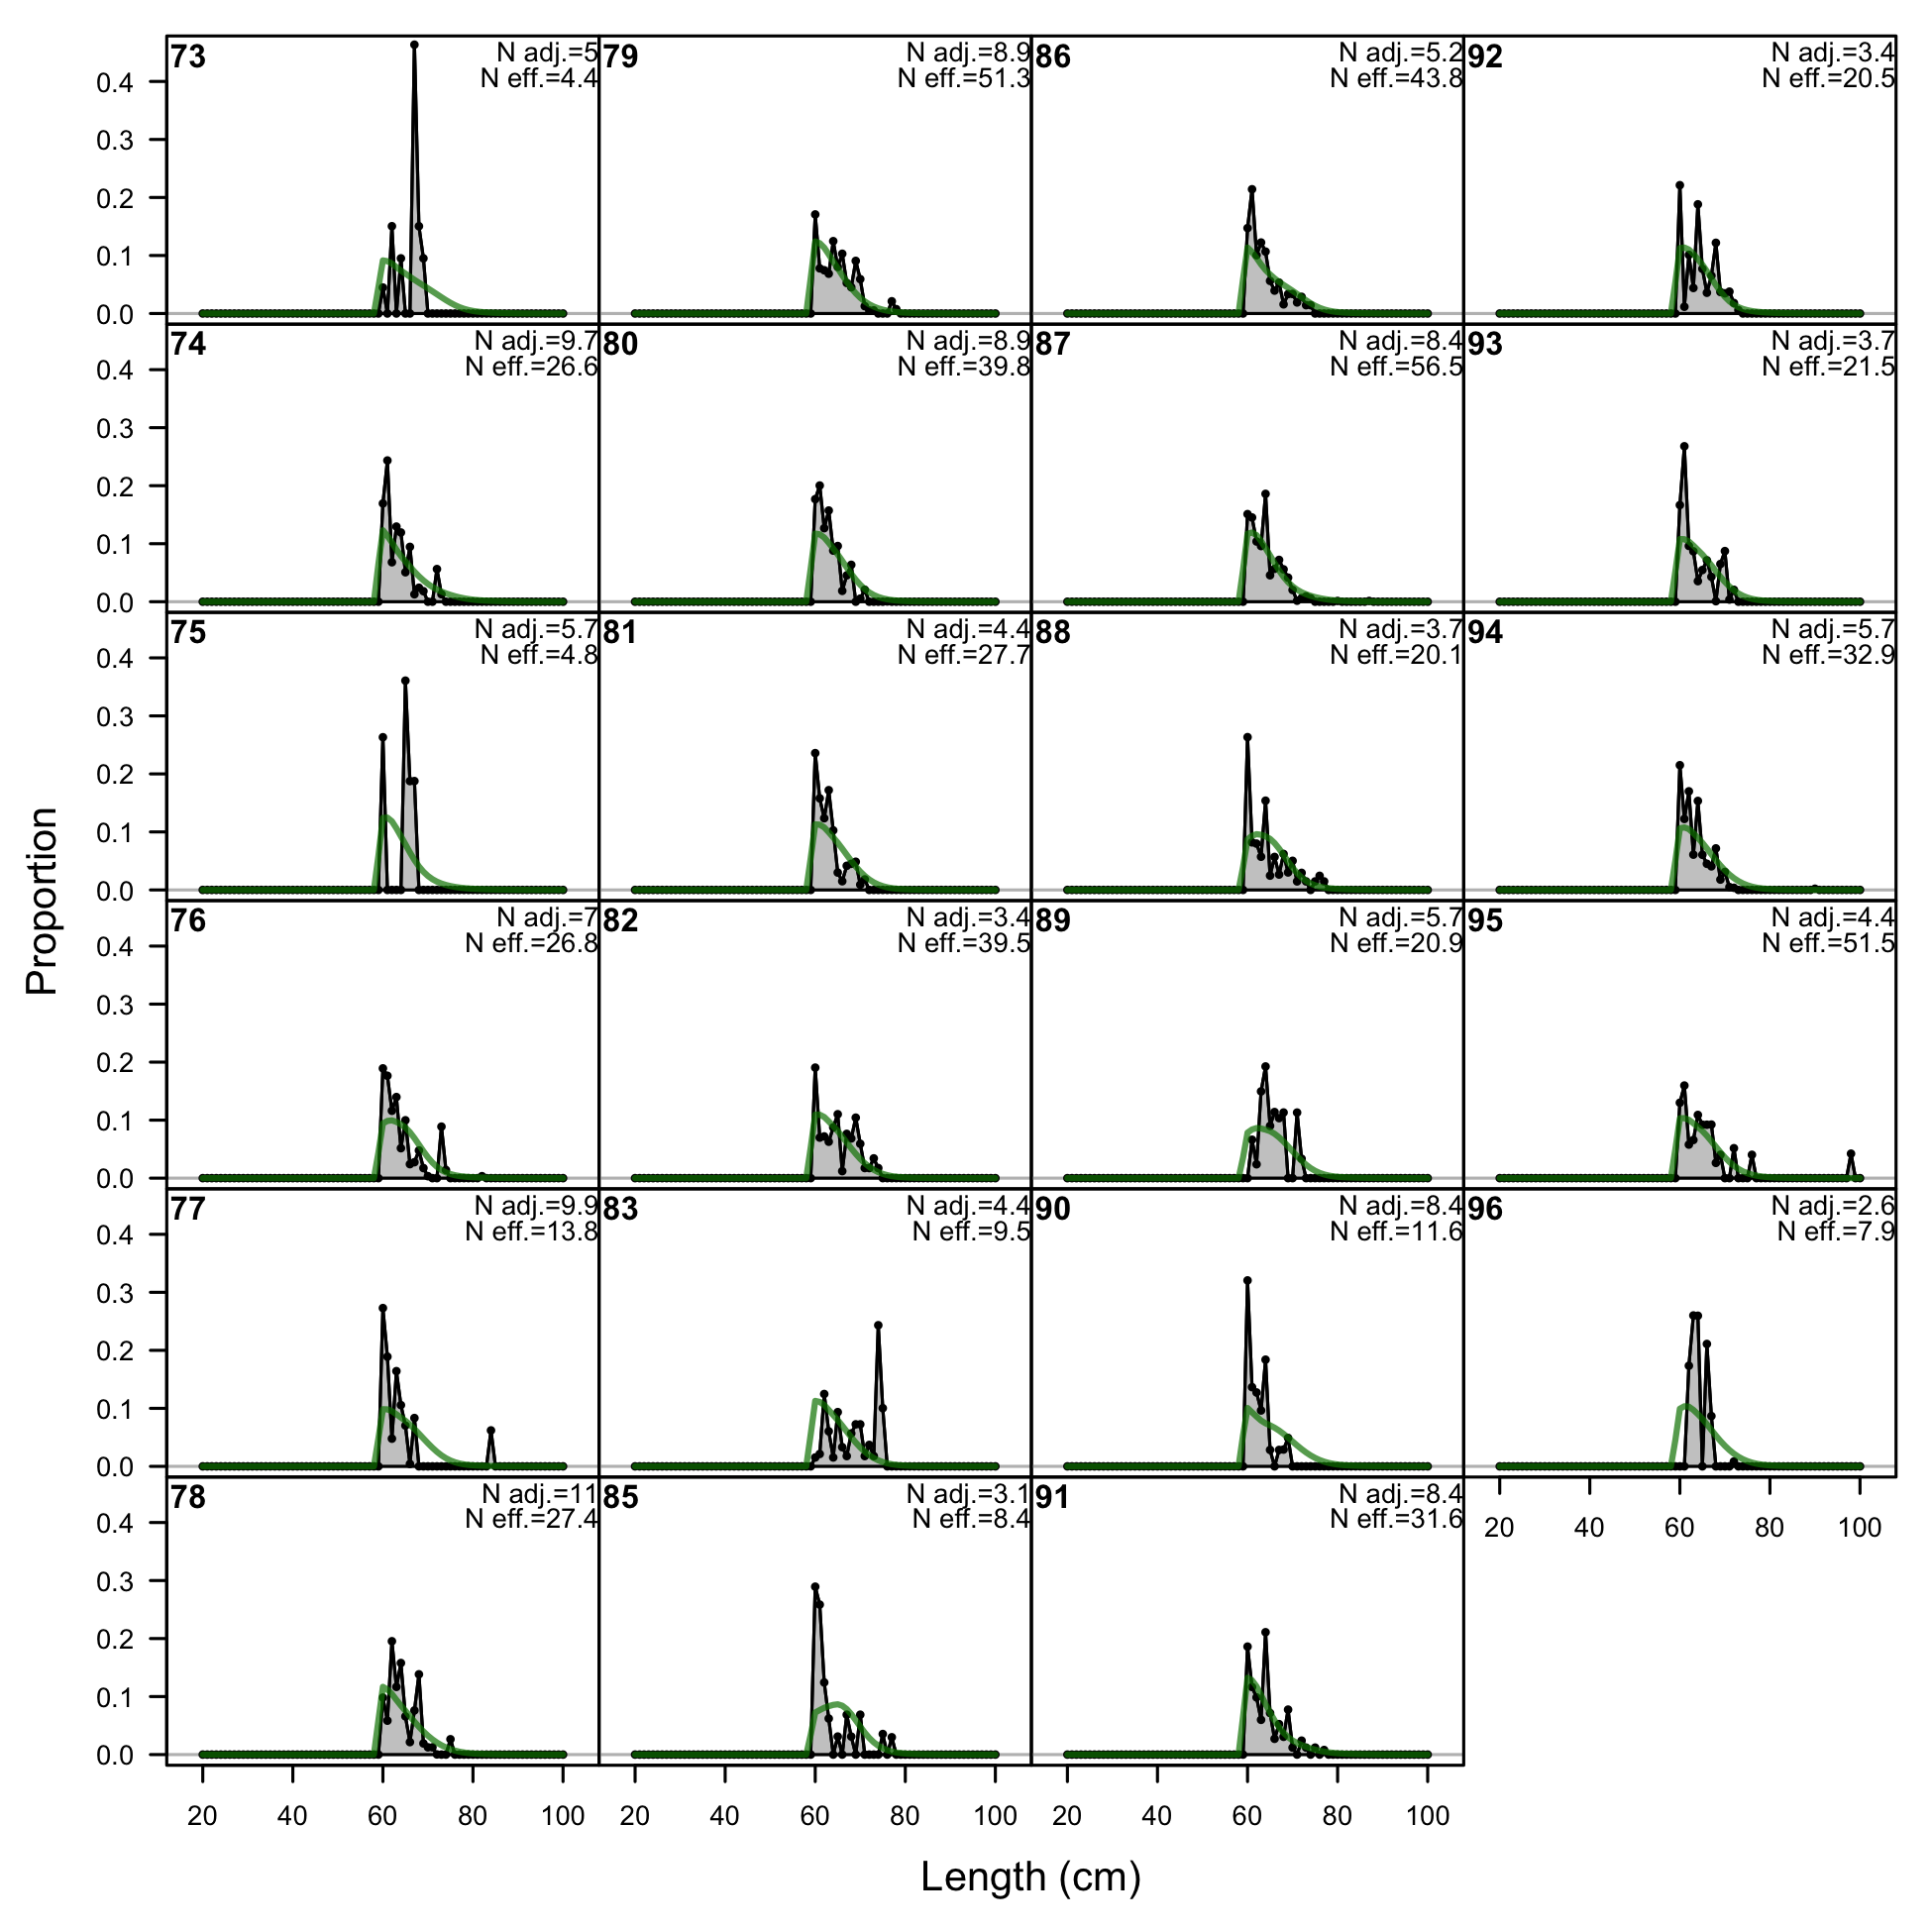
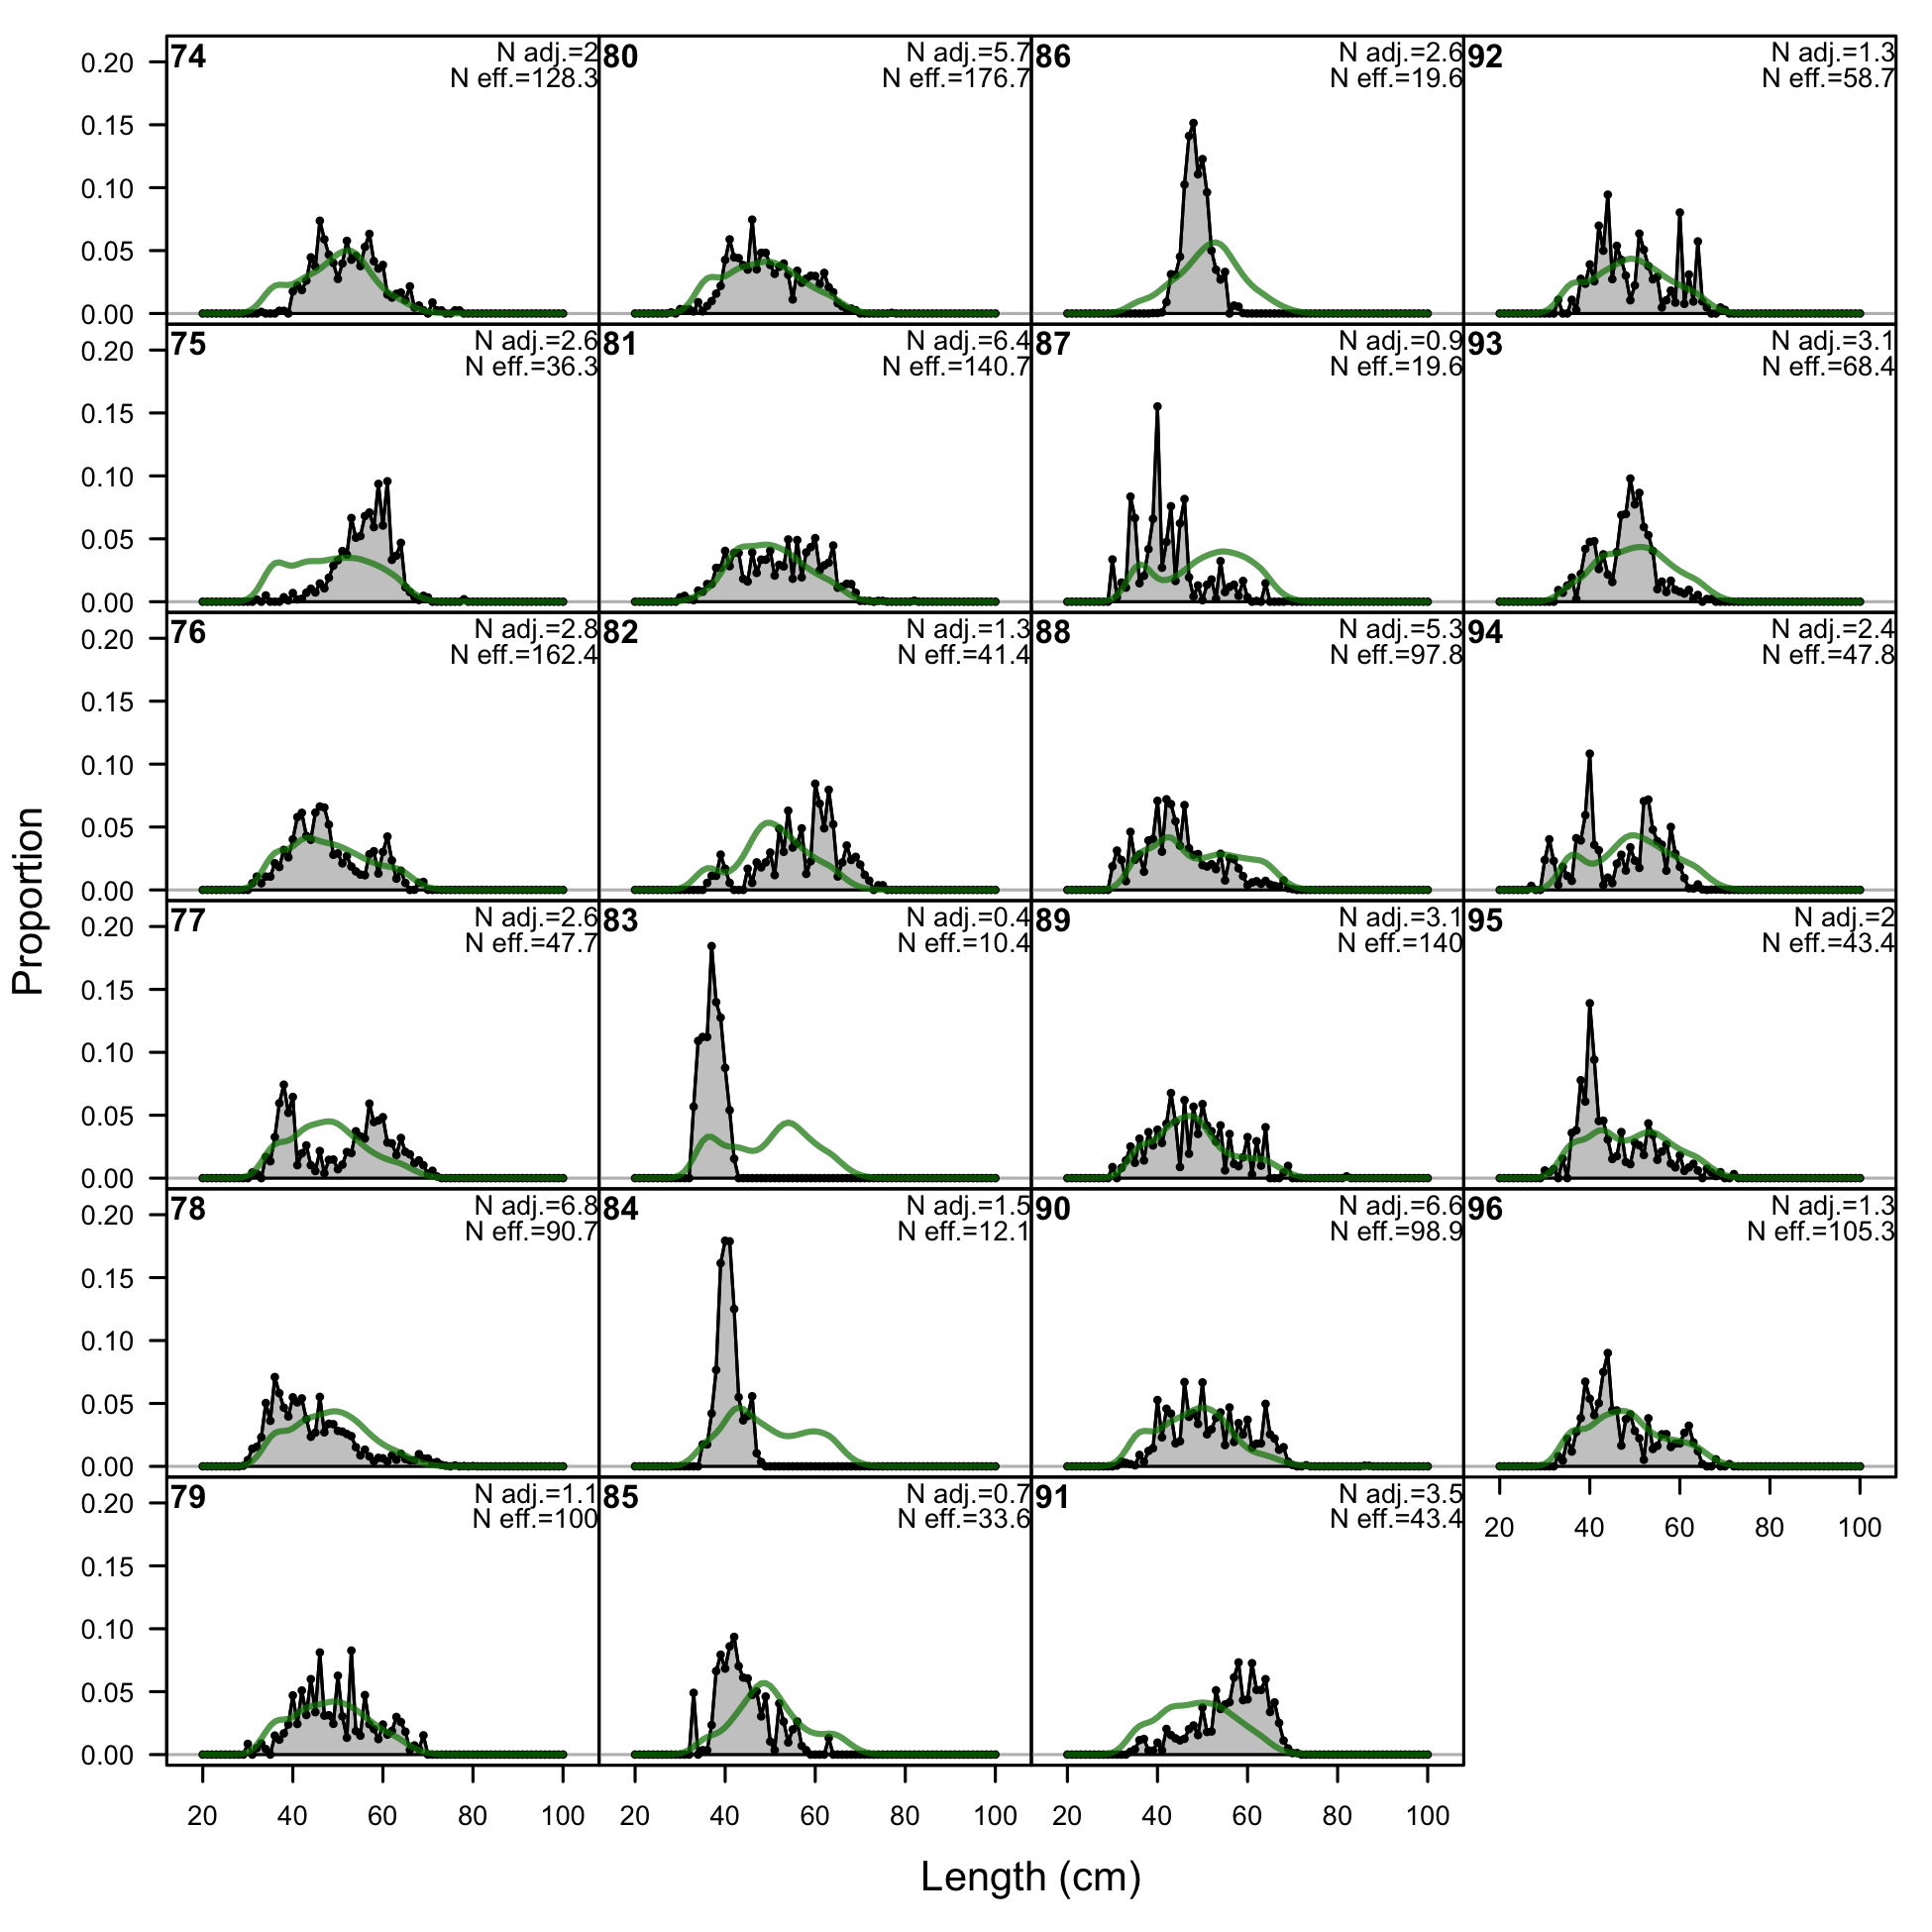
Length comps, retained, F4-OBJ_Central_Large (plot 1 of 3).
'N adj.' is the input sample size after data-weighting adjustment. N eff. is the calculated effective sample size used in the McAllister-Ianelli tuning method. (plot 2 of 3) (plot 3 of 3)
file: comp_lenfit_flt4mkt2_page3.png
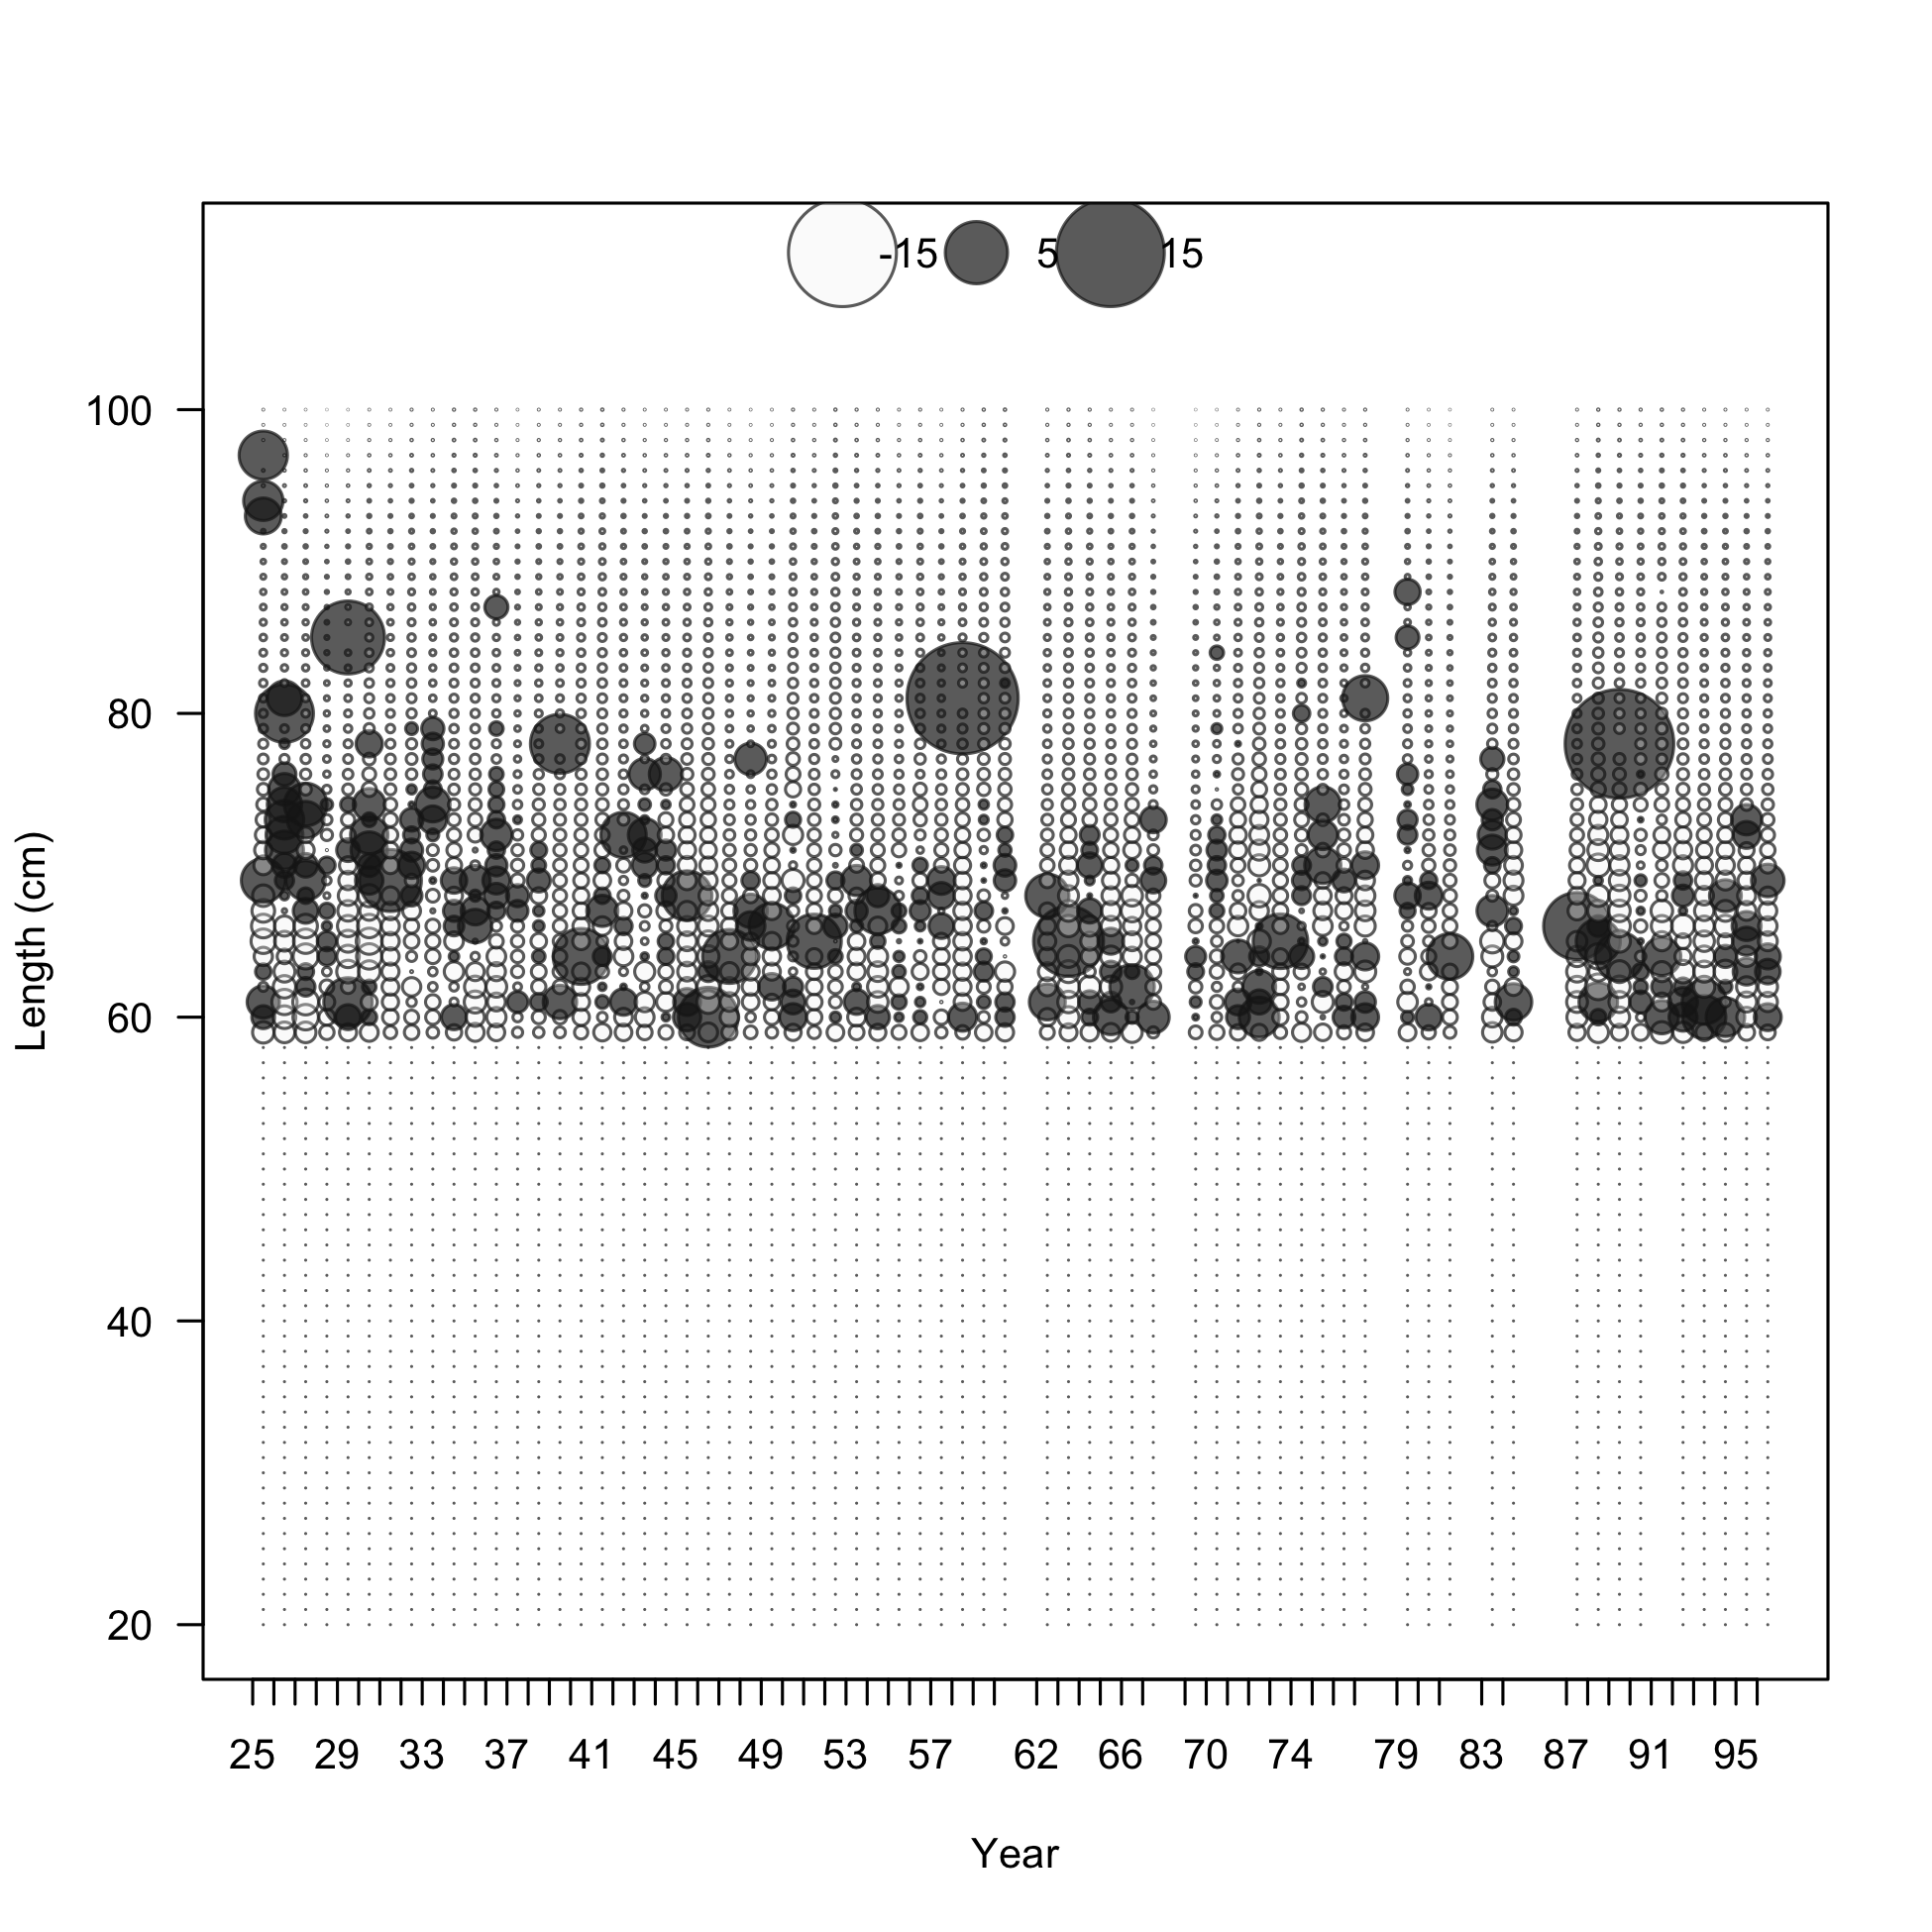
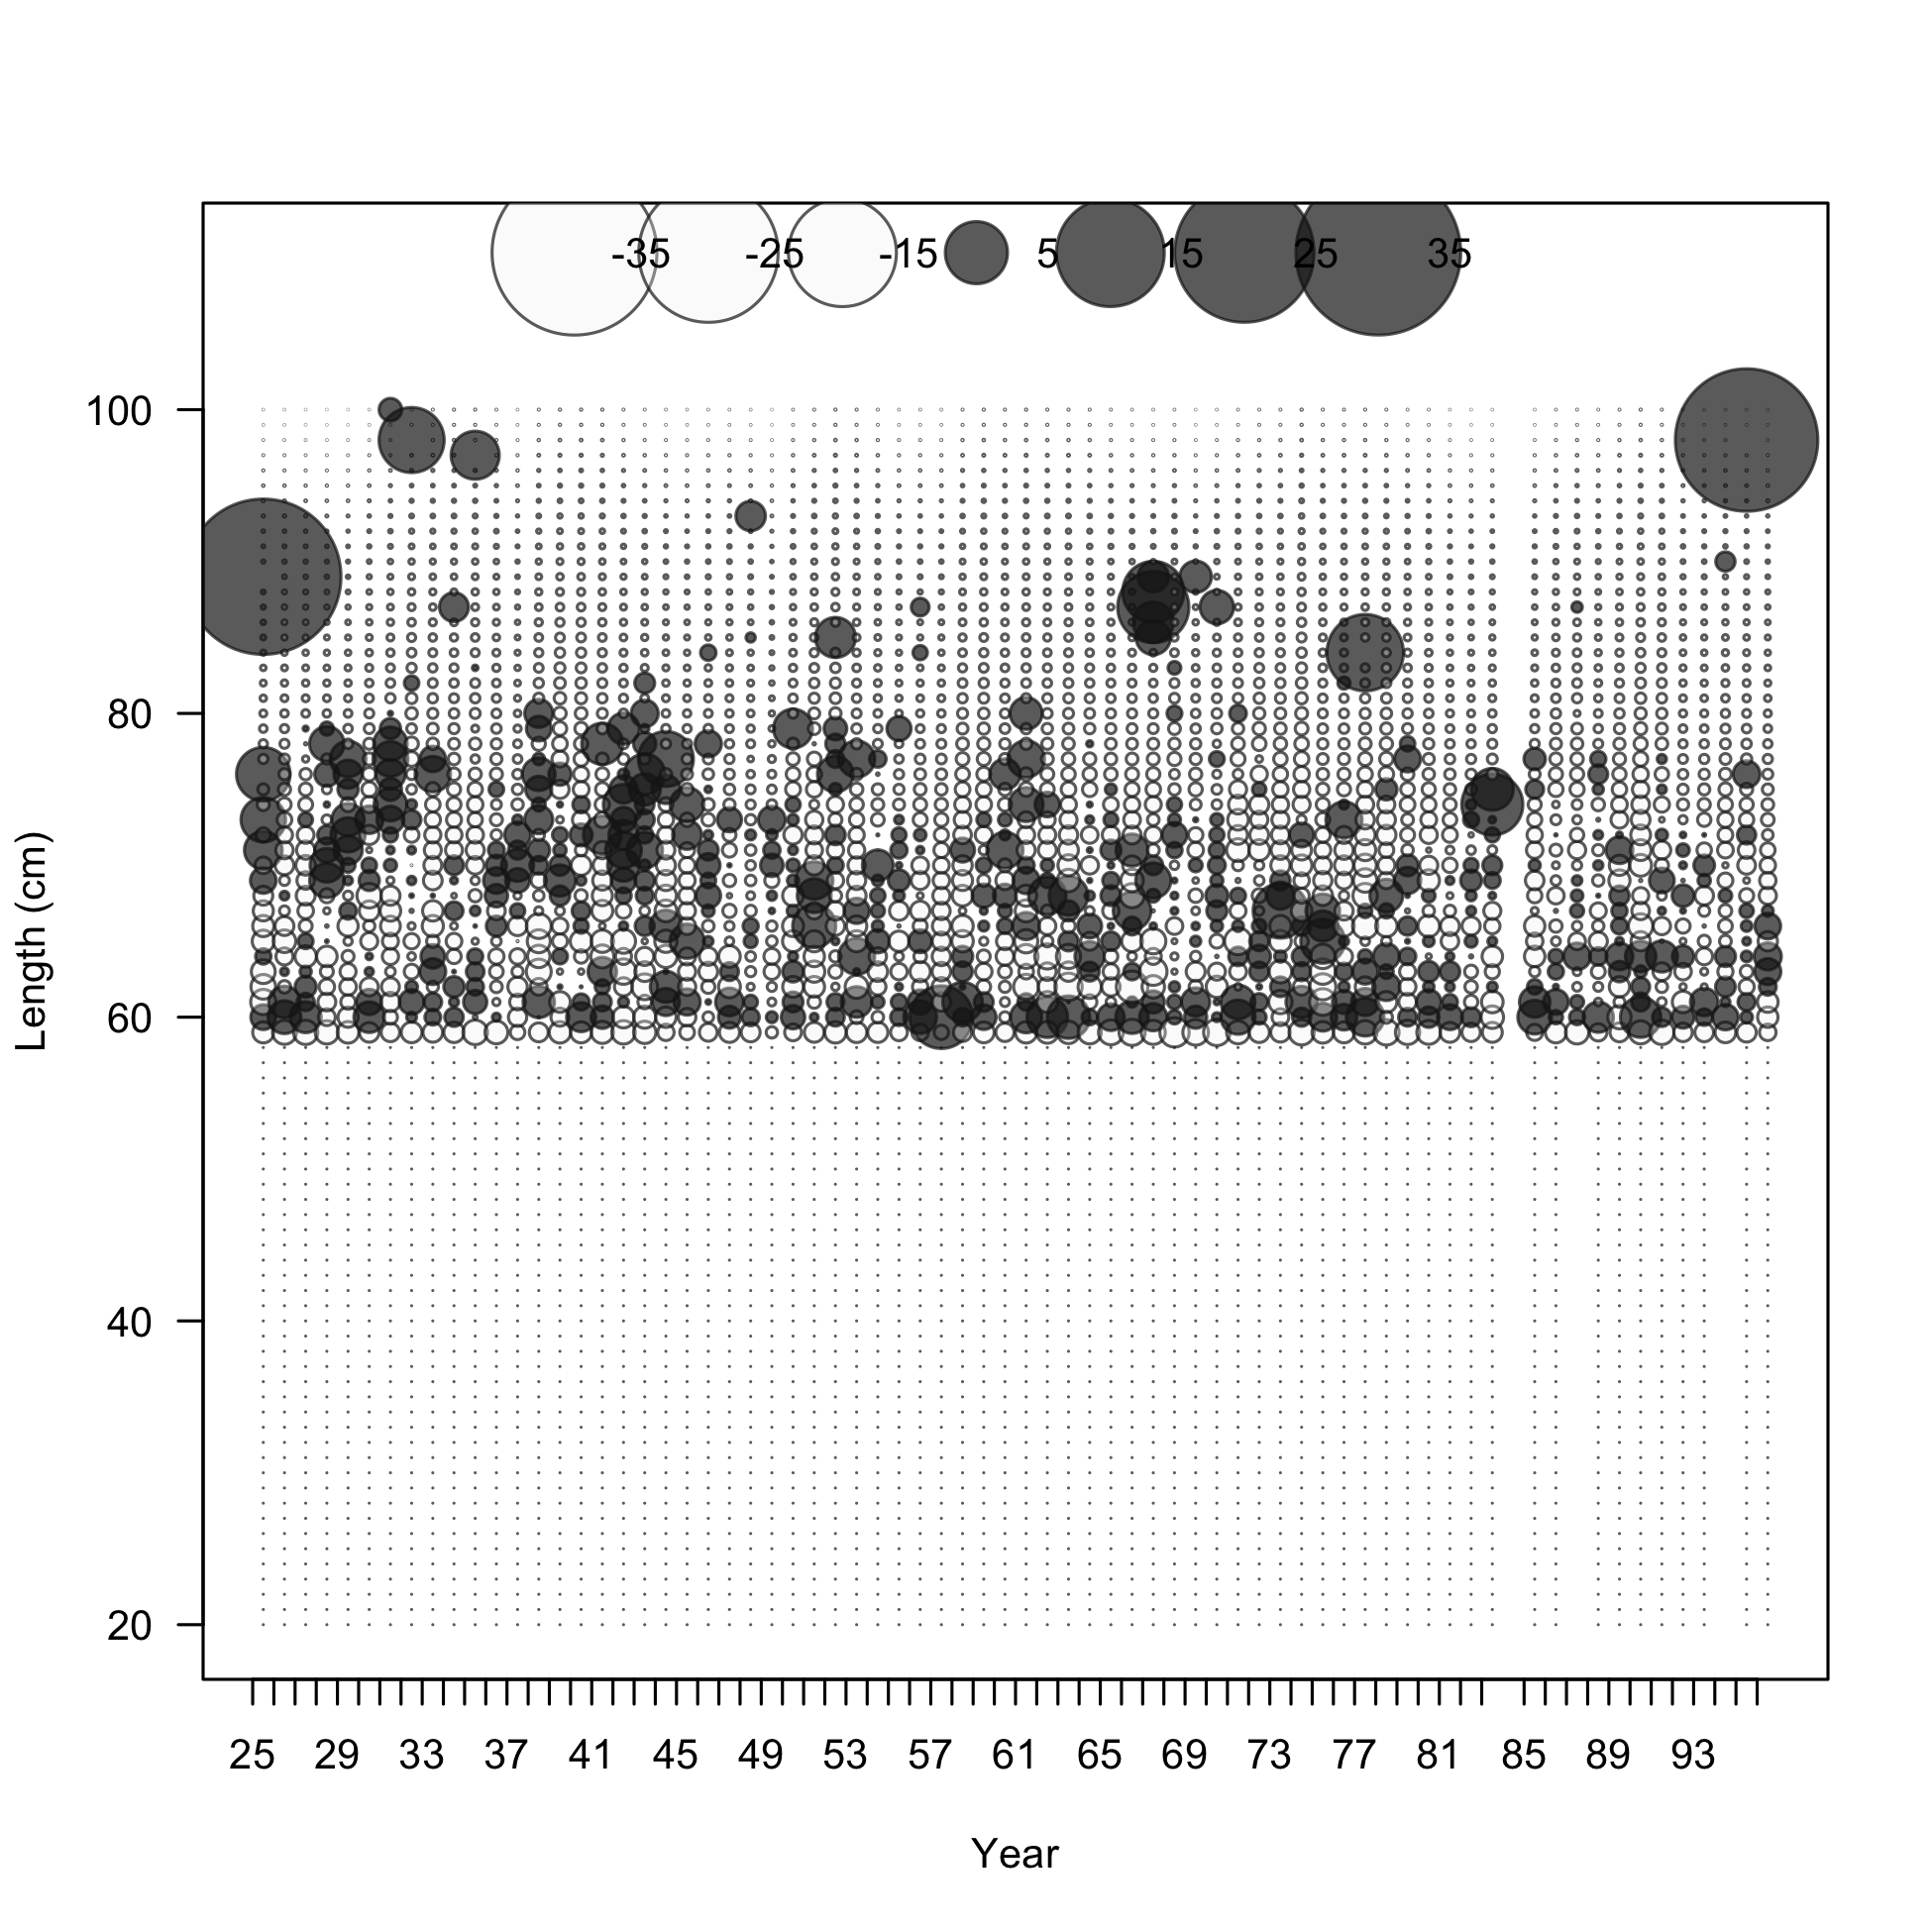
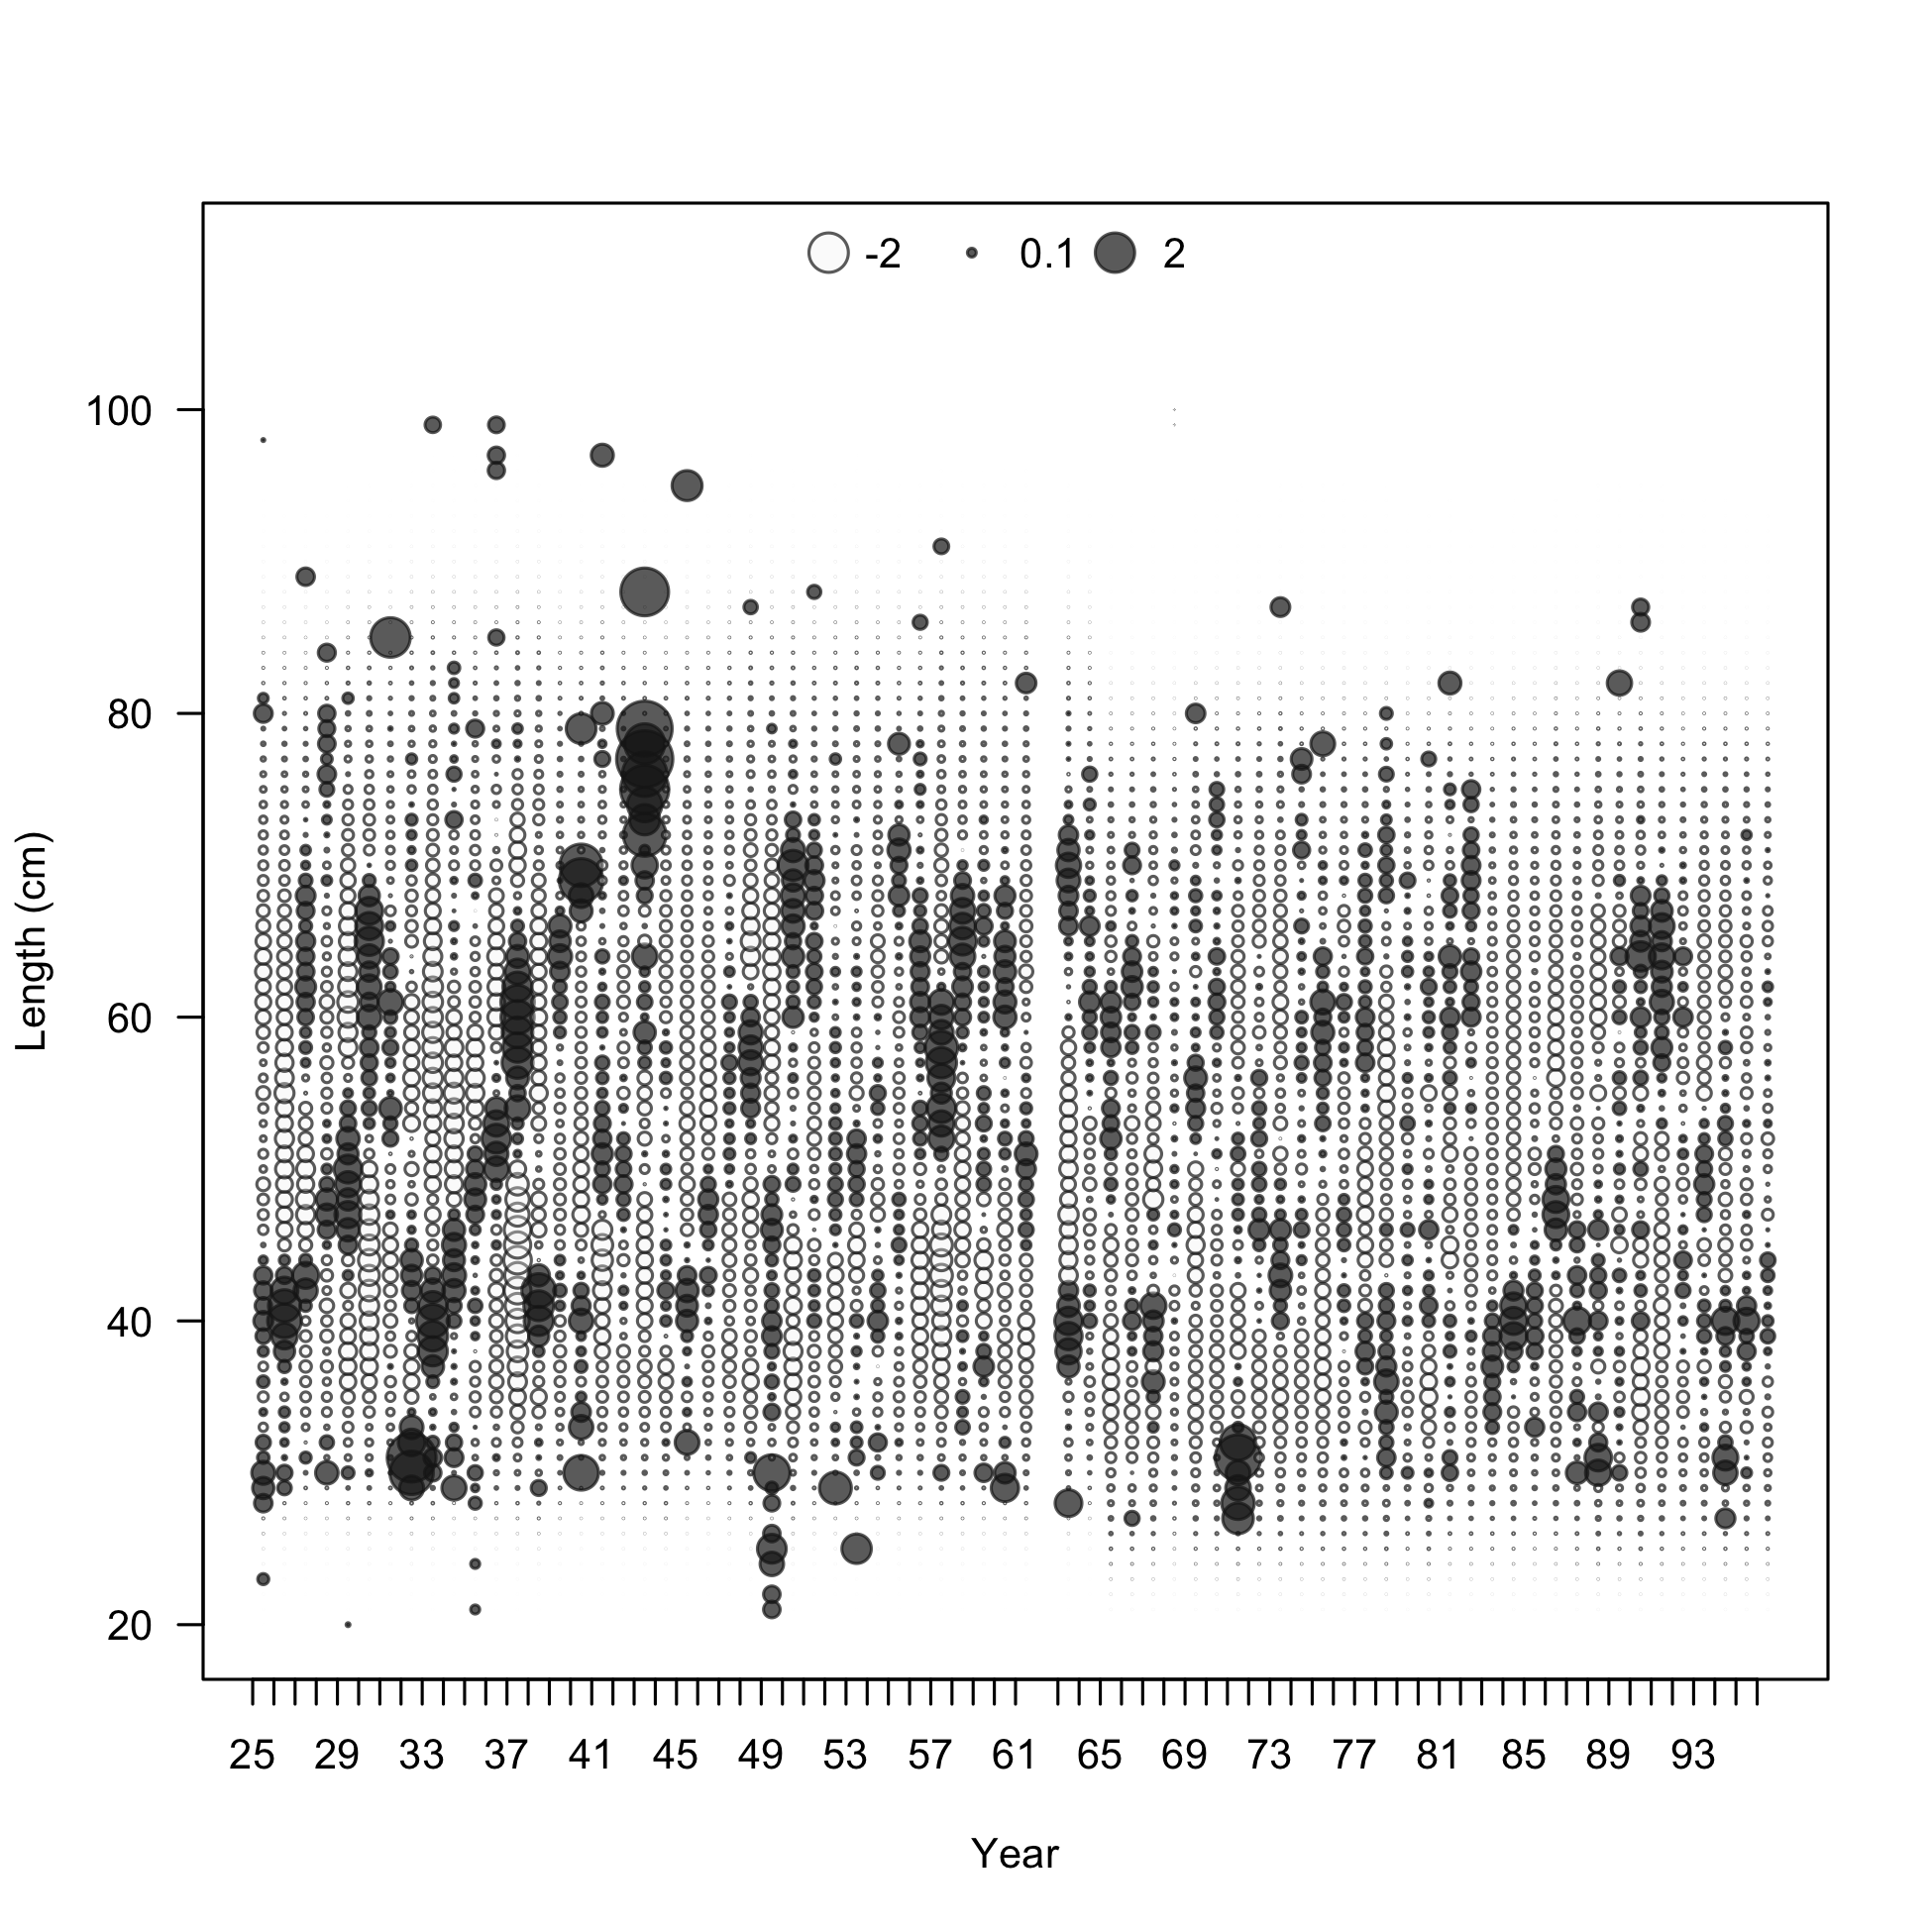
Pearson residuals, retained, F4-OBJ_Central_Large (max=15.94) (plot 3 of 3)
Closed bubbles are positive residuals (observed > expected) and open bubbles are negative residuals (observed < expected).
file: comp_lenfit_residsflt4mkt2_page3.png

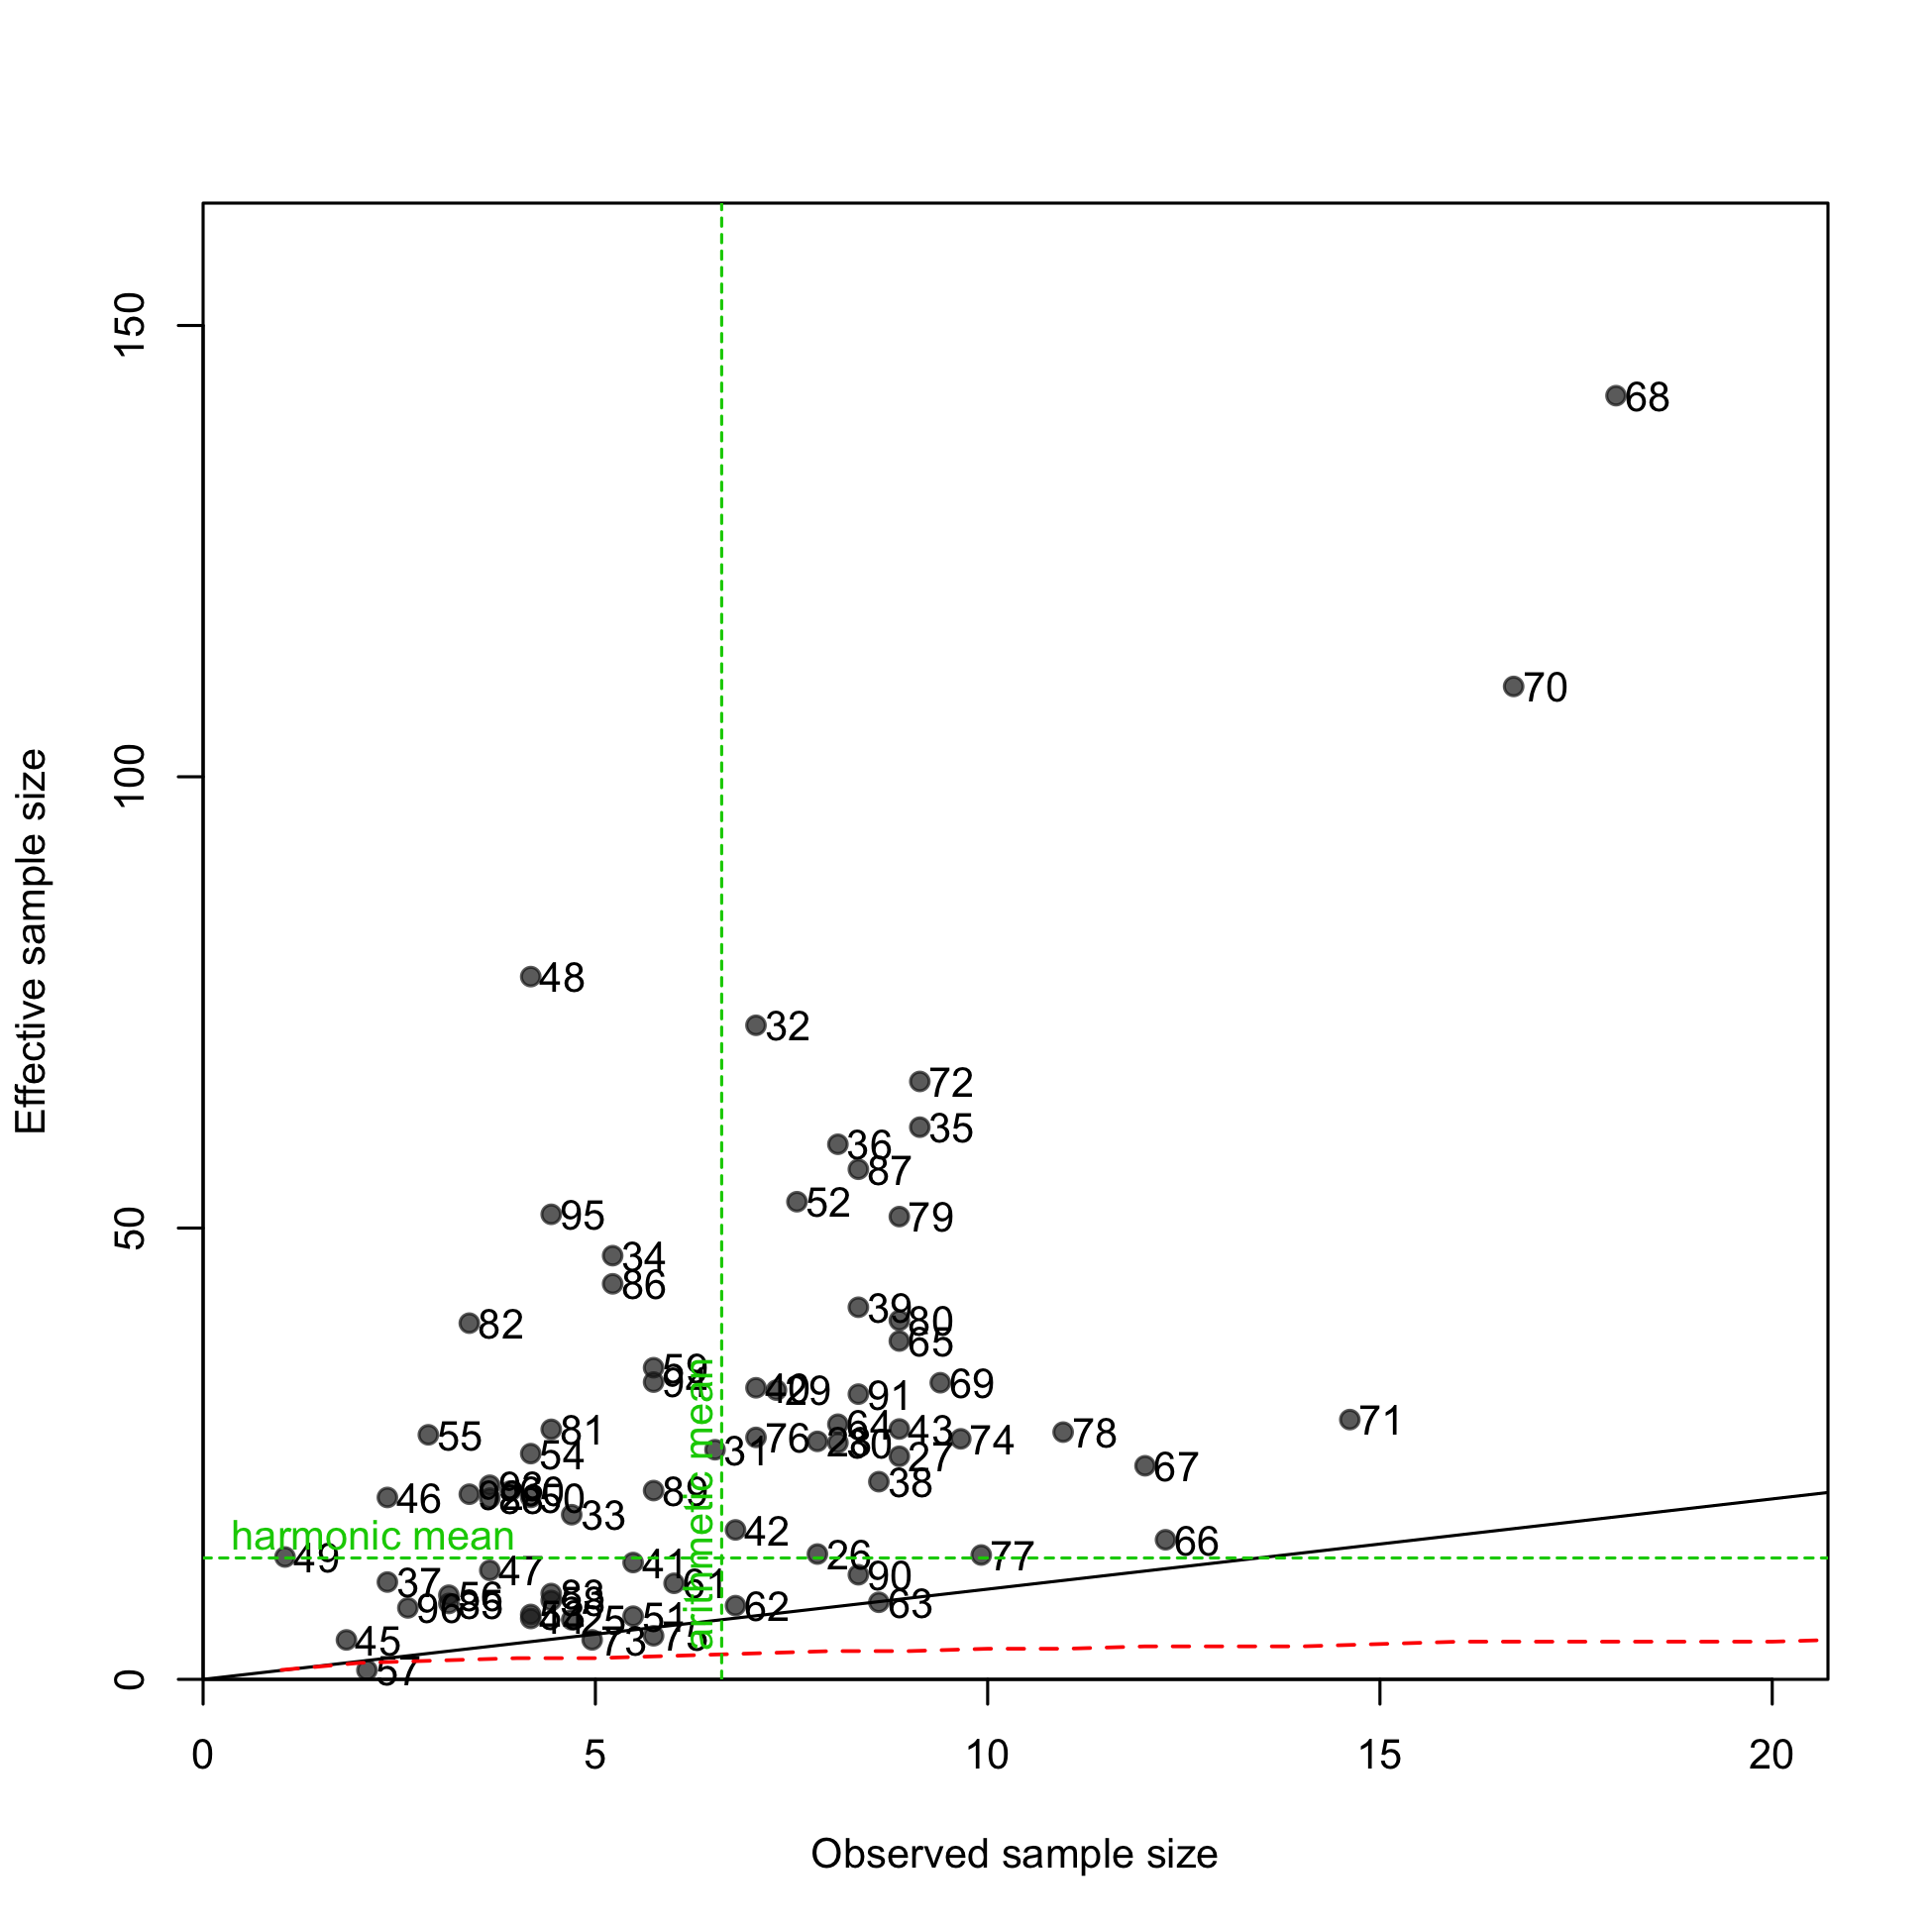
N-EffN comparison, Length comps, retained, F4-OBJ_Central_Large
file: comp_lenfit_sampsize_flt4mkt2.png
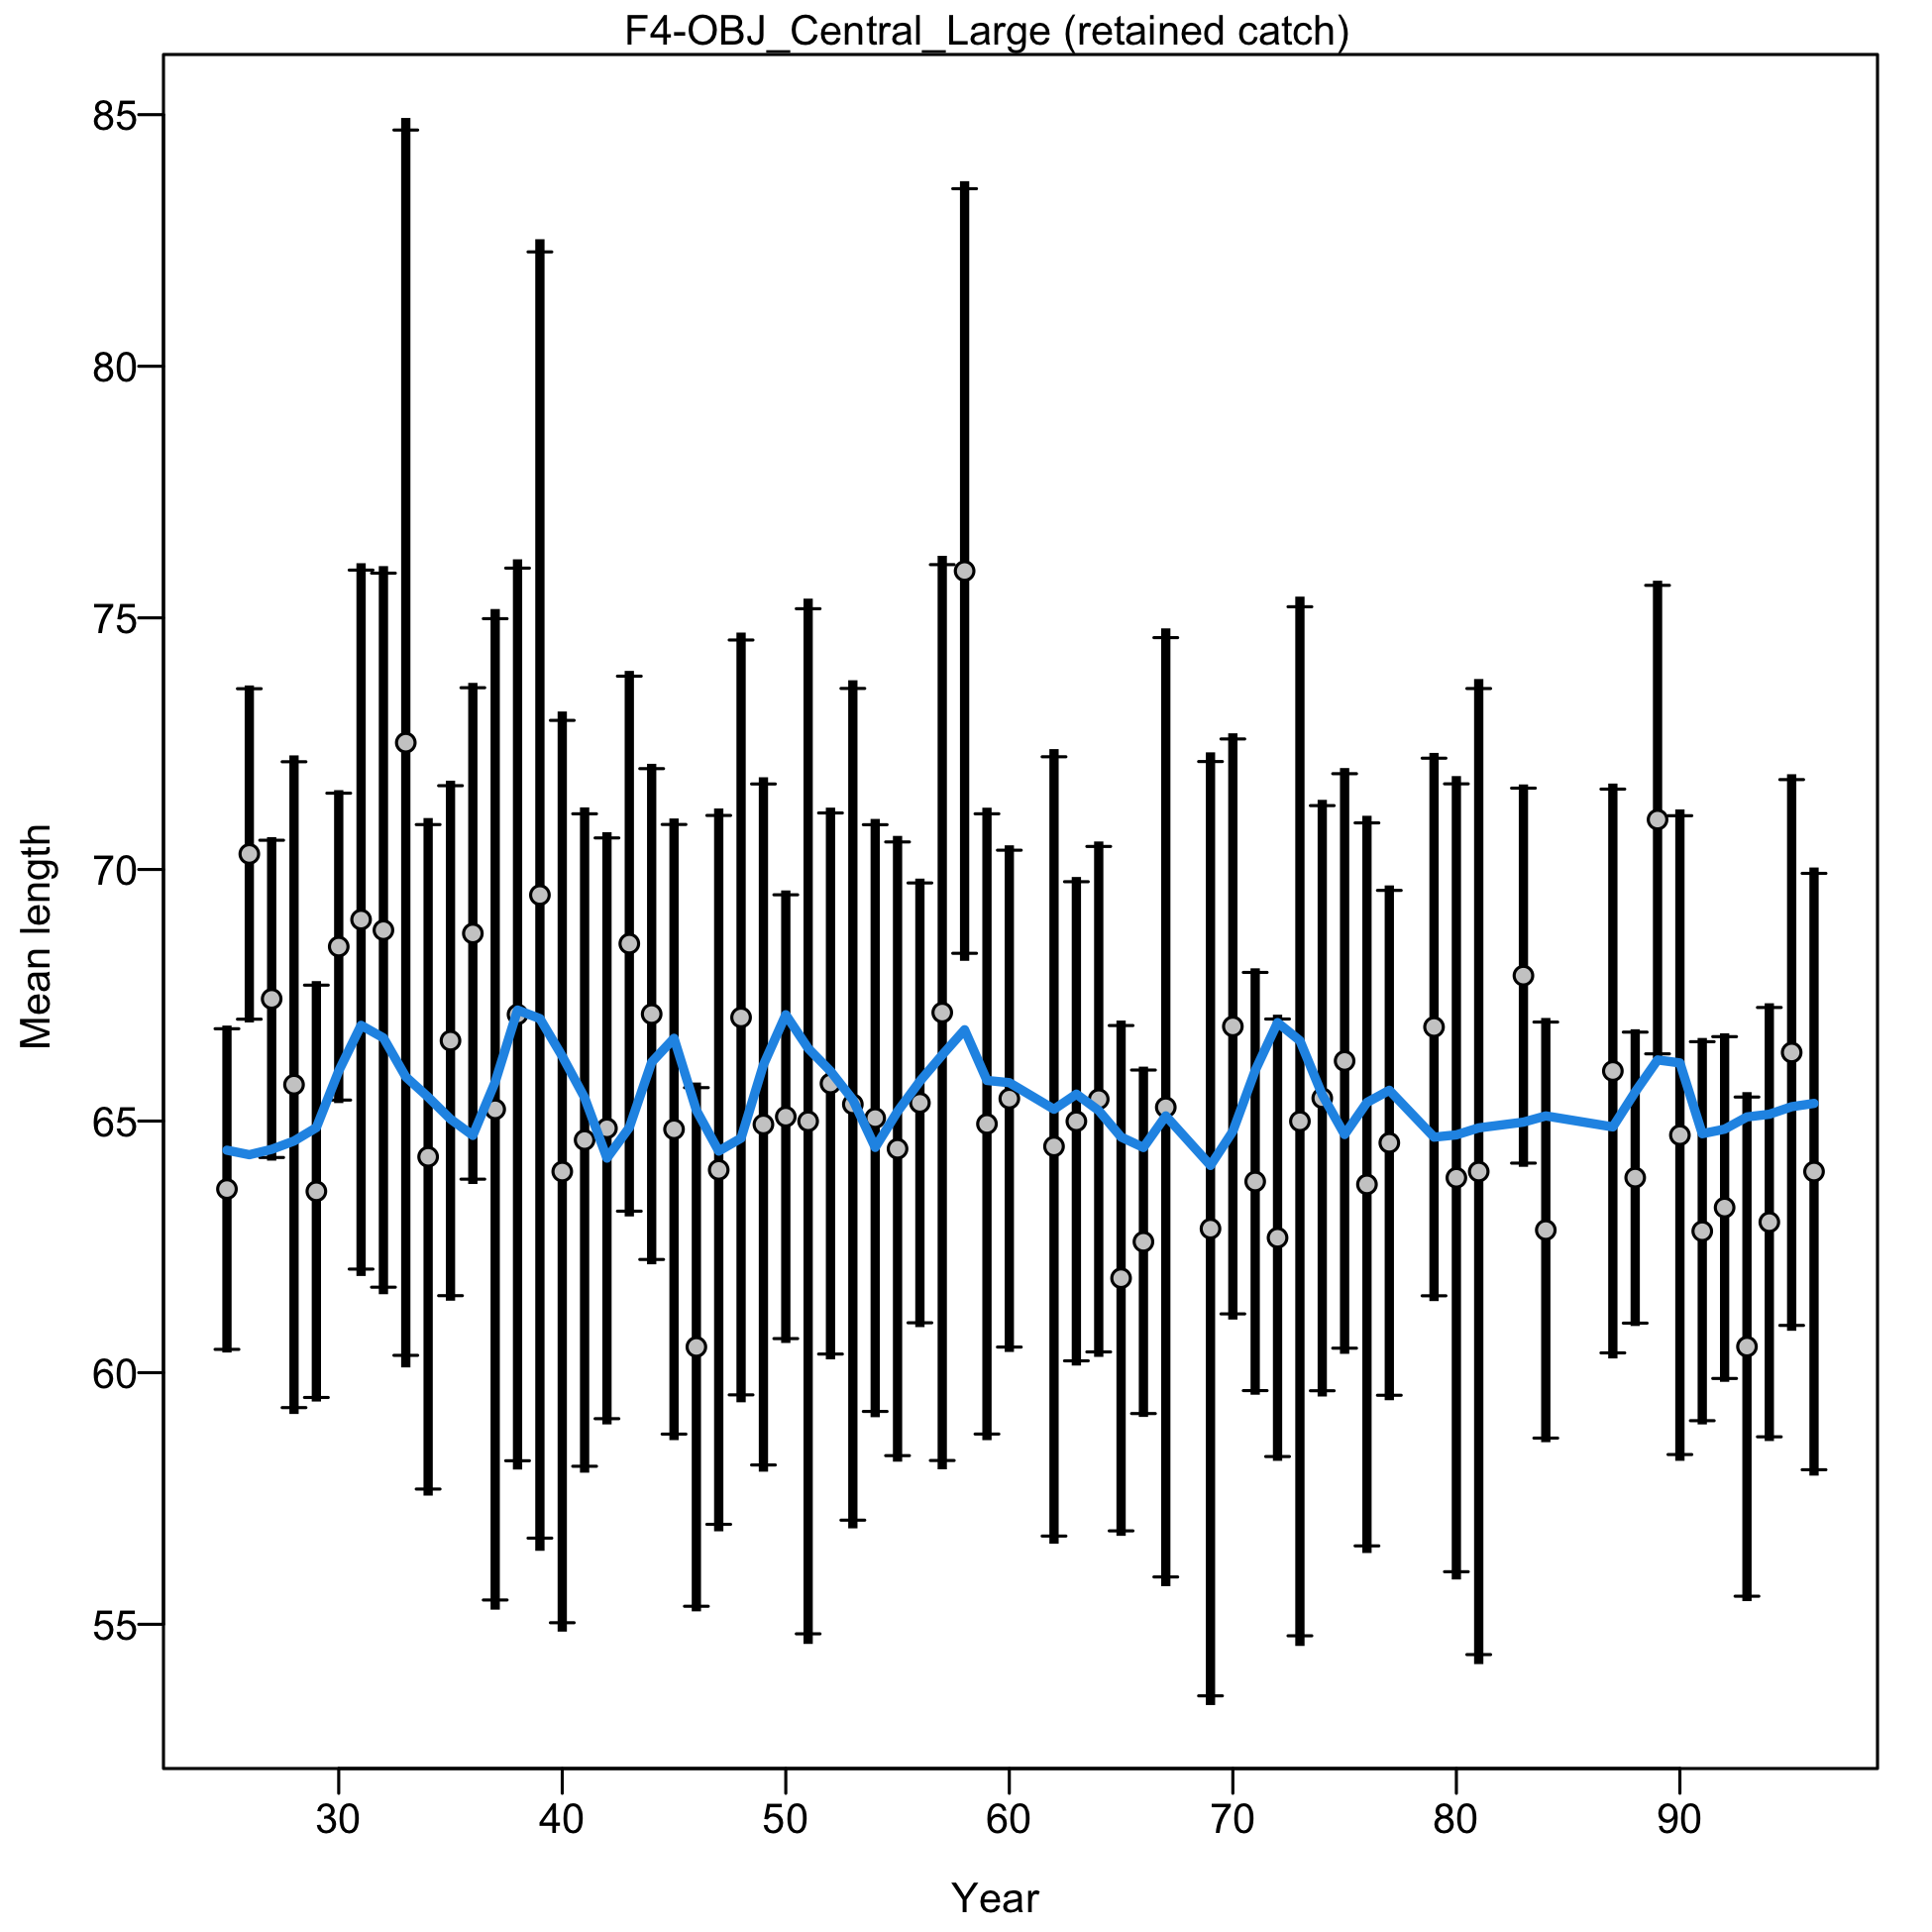
Mean length for F4-OBJ_Central_Large with 95% confidence intervals based on current sample sizes.
Francis data weighting method TA1.8: thinner intervals (with capped ends) show result of further adjusting sample sizes based on suggested multiplier (with 95% interval) for len data from F4-OBJ_Central_Large:
1.0398 (0.6898-1.7969)
For more info, see Francis (2011).
file: comp_lenfit_data_weighting_TA1.8_F4-OBJ_Central_Large.png
Length comps, whole catch, F5-OBJ_SC (plot 1 of 2).
'N adj.' is the input sample size after data-weighting adjustment. N eff. is the calculated effective sample size used in the McAllister-Ianelli tuning method.
file: comp_lenfit_flt5mkt0_page1.png

Length comps, whole catch, F5-OBJ_SC (plot 1 of 2).
'N adj.' is the input sample size after data-weighting adjustment. N eff. is the calculated effective sample size used in the McAllister-Ianelli tuning method. (plot 2 of 2)
file: comp_lenfit_flt5mkt0_page2.png
Pearson residuals, whole catch, F5-OBJ_SC (max=3.7) (plot 2 of 2)
Closed bubbles are positive residuals (observed > expected) and open bubbles are negative residuals (observed < expected).
file: comp_lenfit_residsflt5mkt0_page2.png
N-EffN comparison, Length comps, whole catch, F5-OBJ_SC
file: comp_lenfit_sampsize_flt5mkt0.png

Mean length for F5-OBJ_SC with 95% confidence intervals based on current sample sizes.
Francis data weighting method TA1.8: thinner intervals (with capped ends) show result of further adjusting sample sizes based on suggested multiplier (with 95% interval) for len data from F5-OBJ_SC:
1.0588 (0.7277-1.9788)
For more info, see Francis (2011).
file: comp_lenfit_data_weighting_TA1.8_F5-OBJ_SC.png
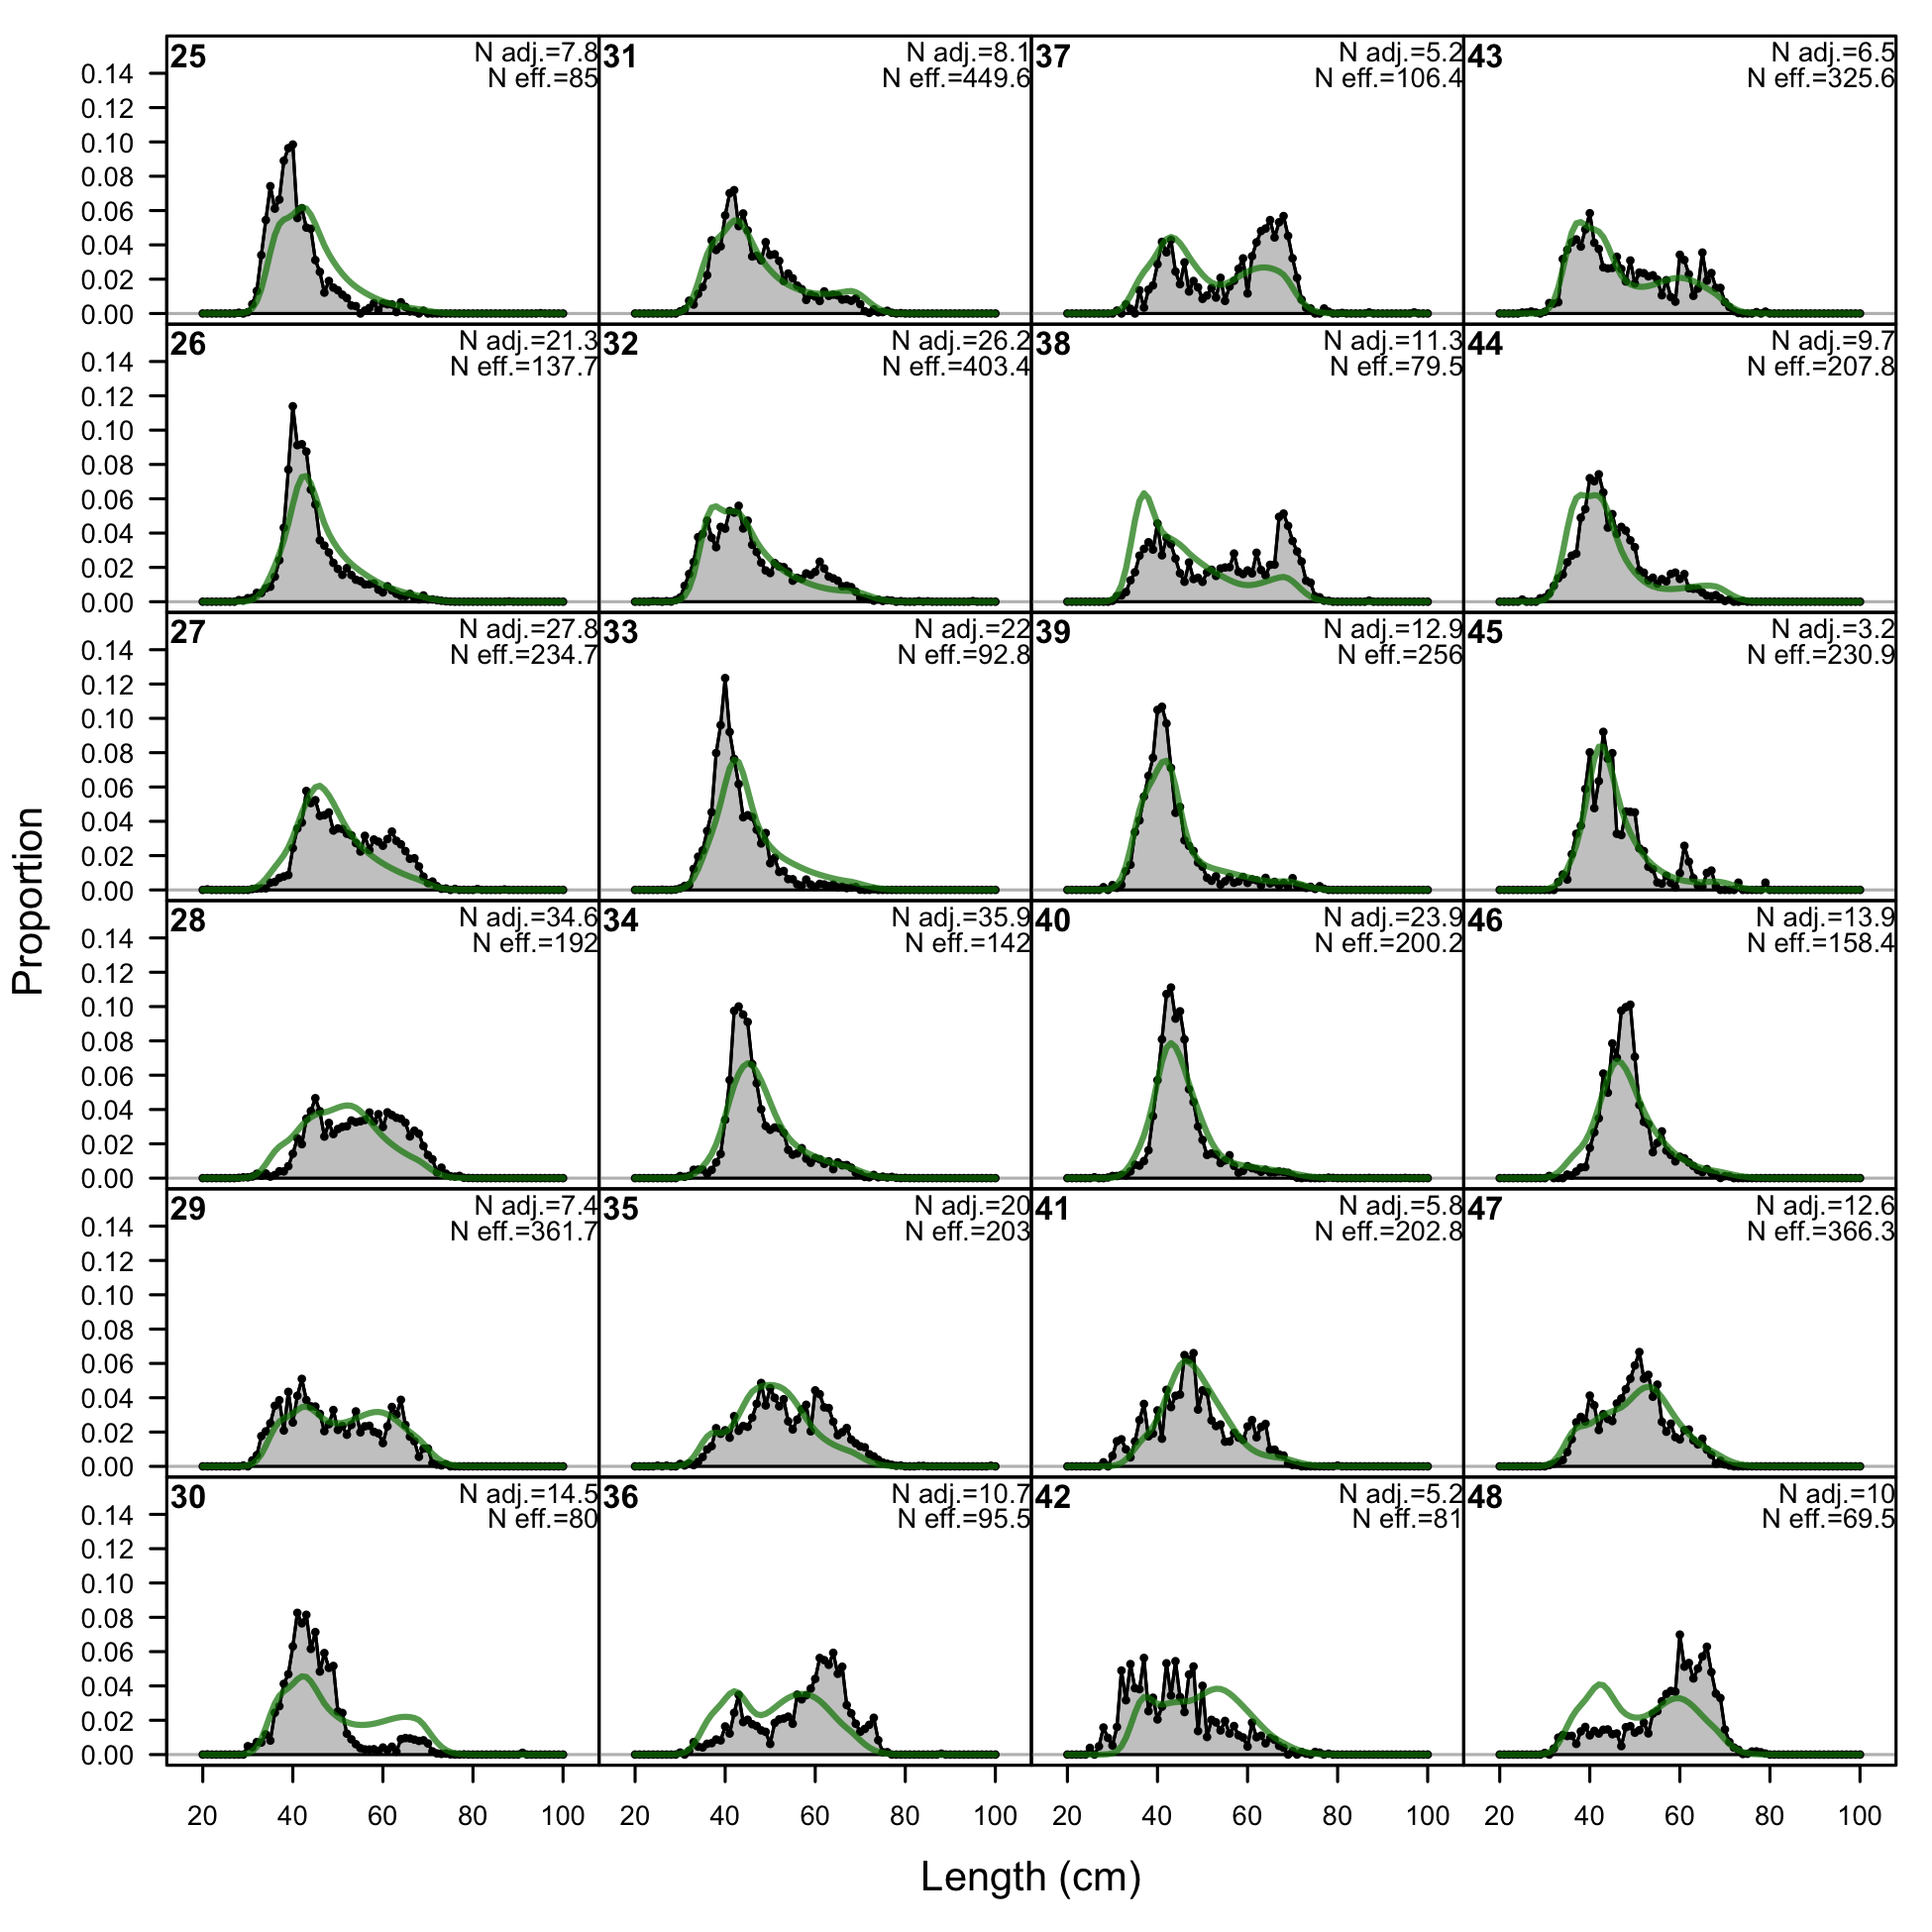
Length comps, whole catch, F6-OBJ_CC (plot 1 of 2).
'N adj.' is the input sample size after data-weighting adjustment. N eff. is the calculated effective sample size used in the McAllister-Ianelli tuning method.
file: comp_lenfit_flt6mkt0_page1.png
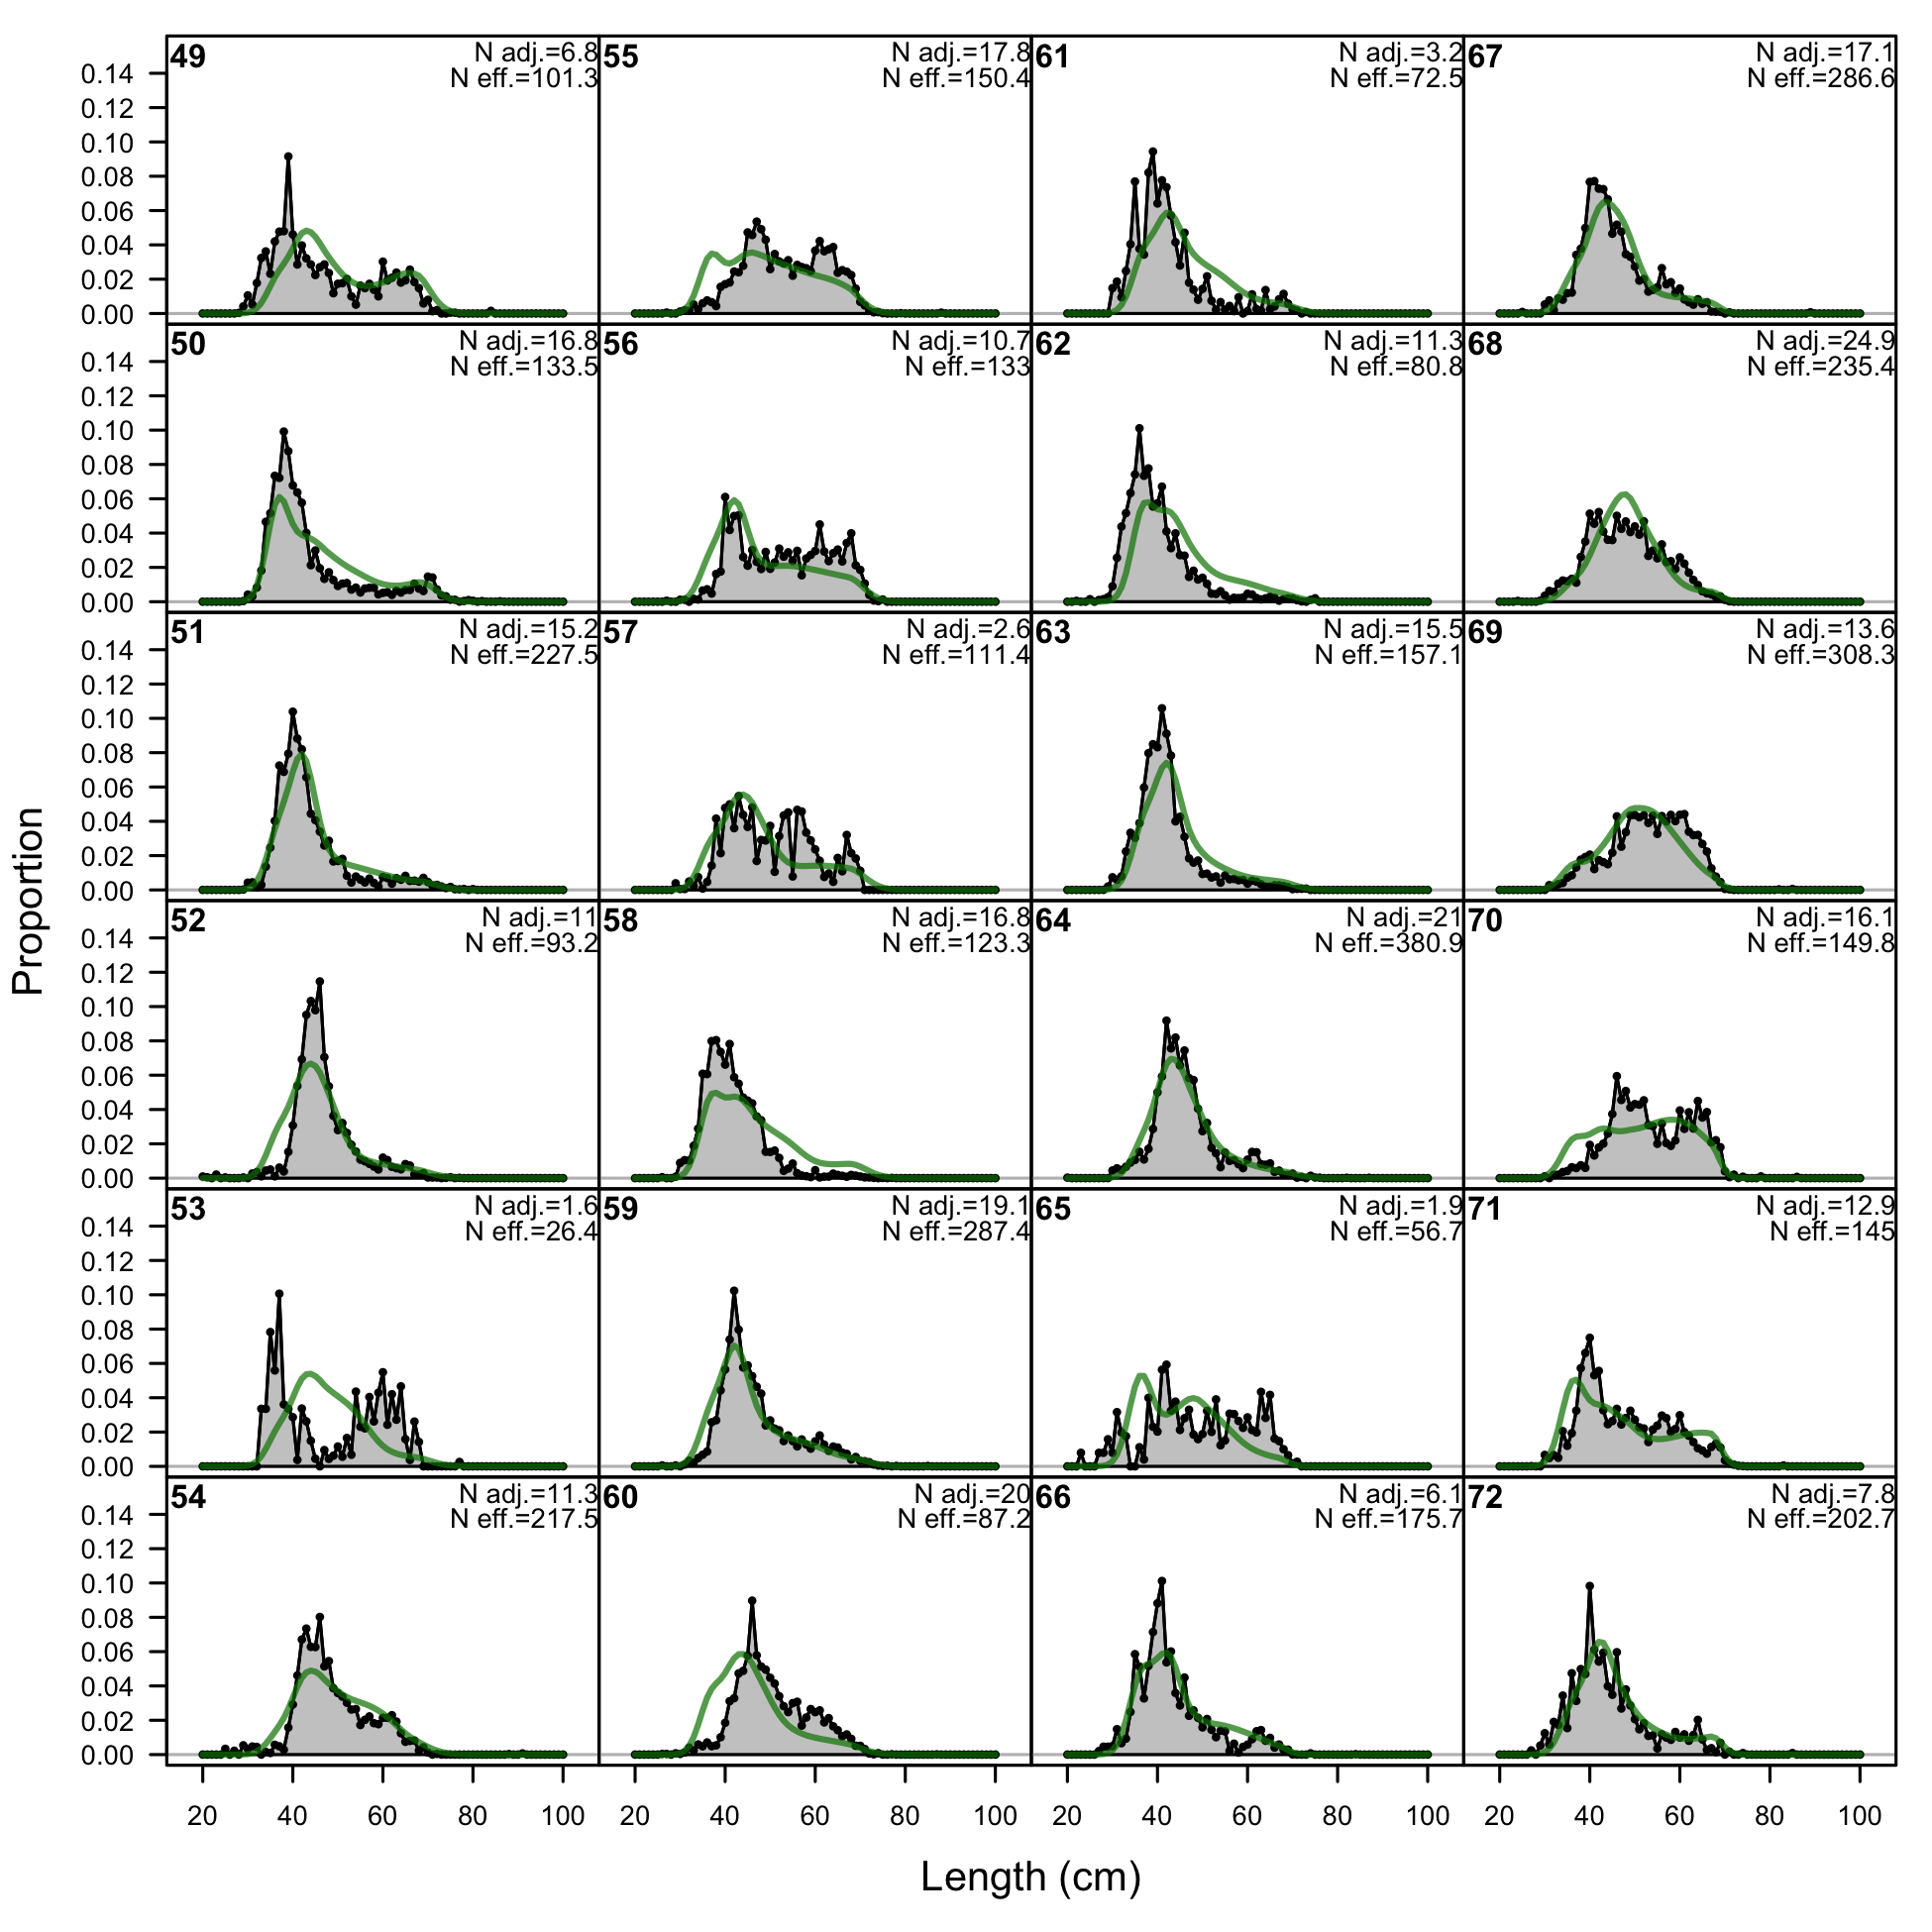
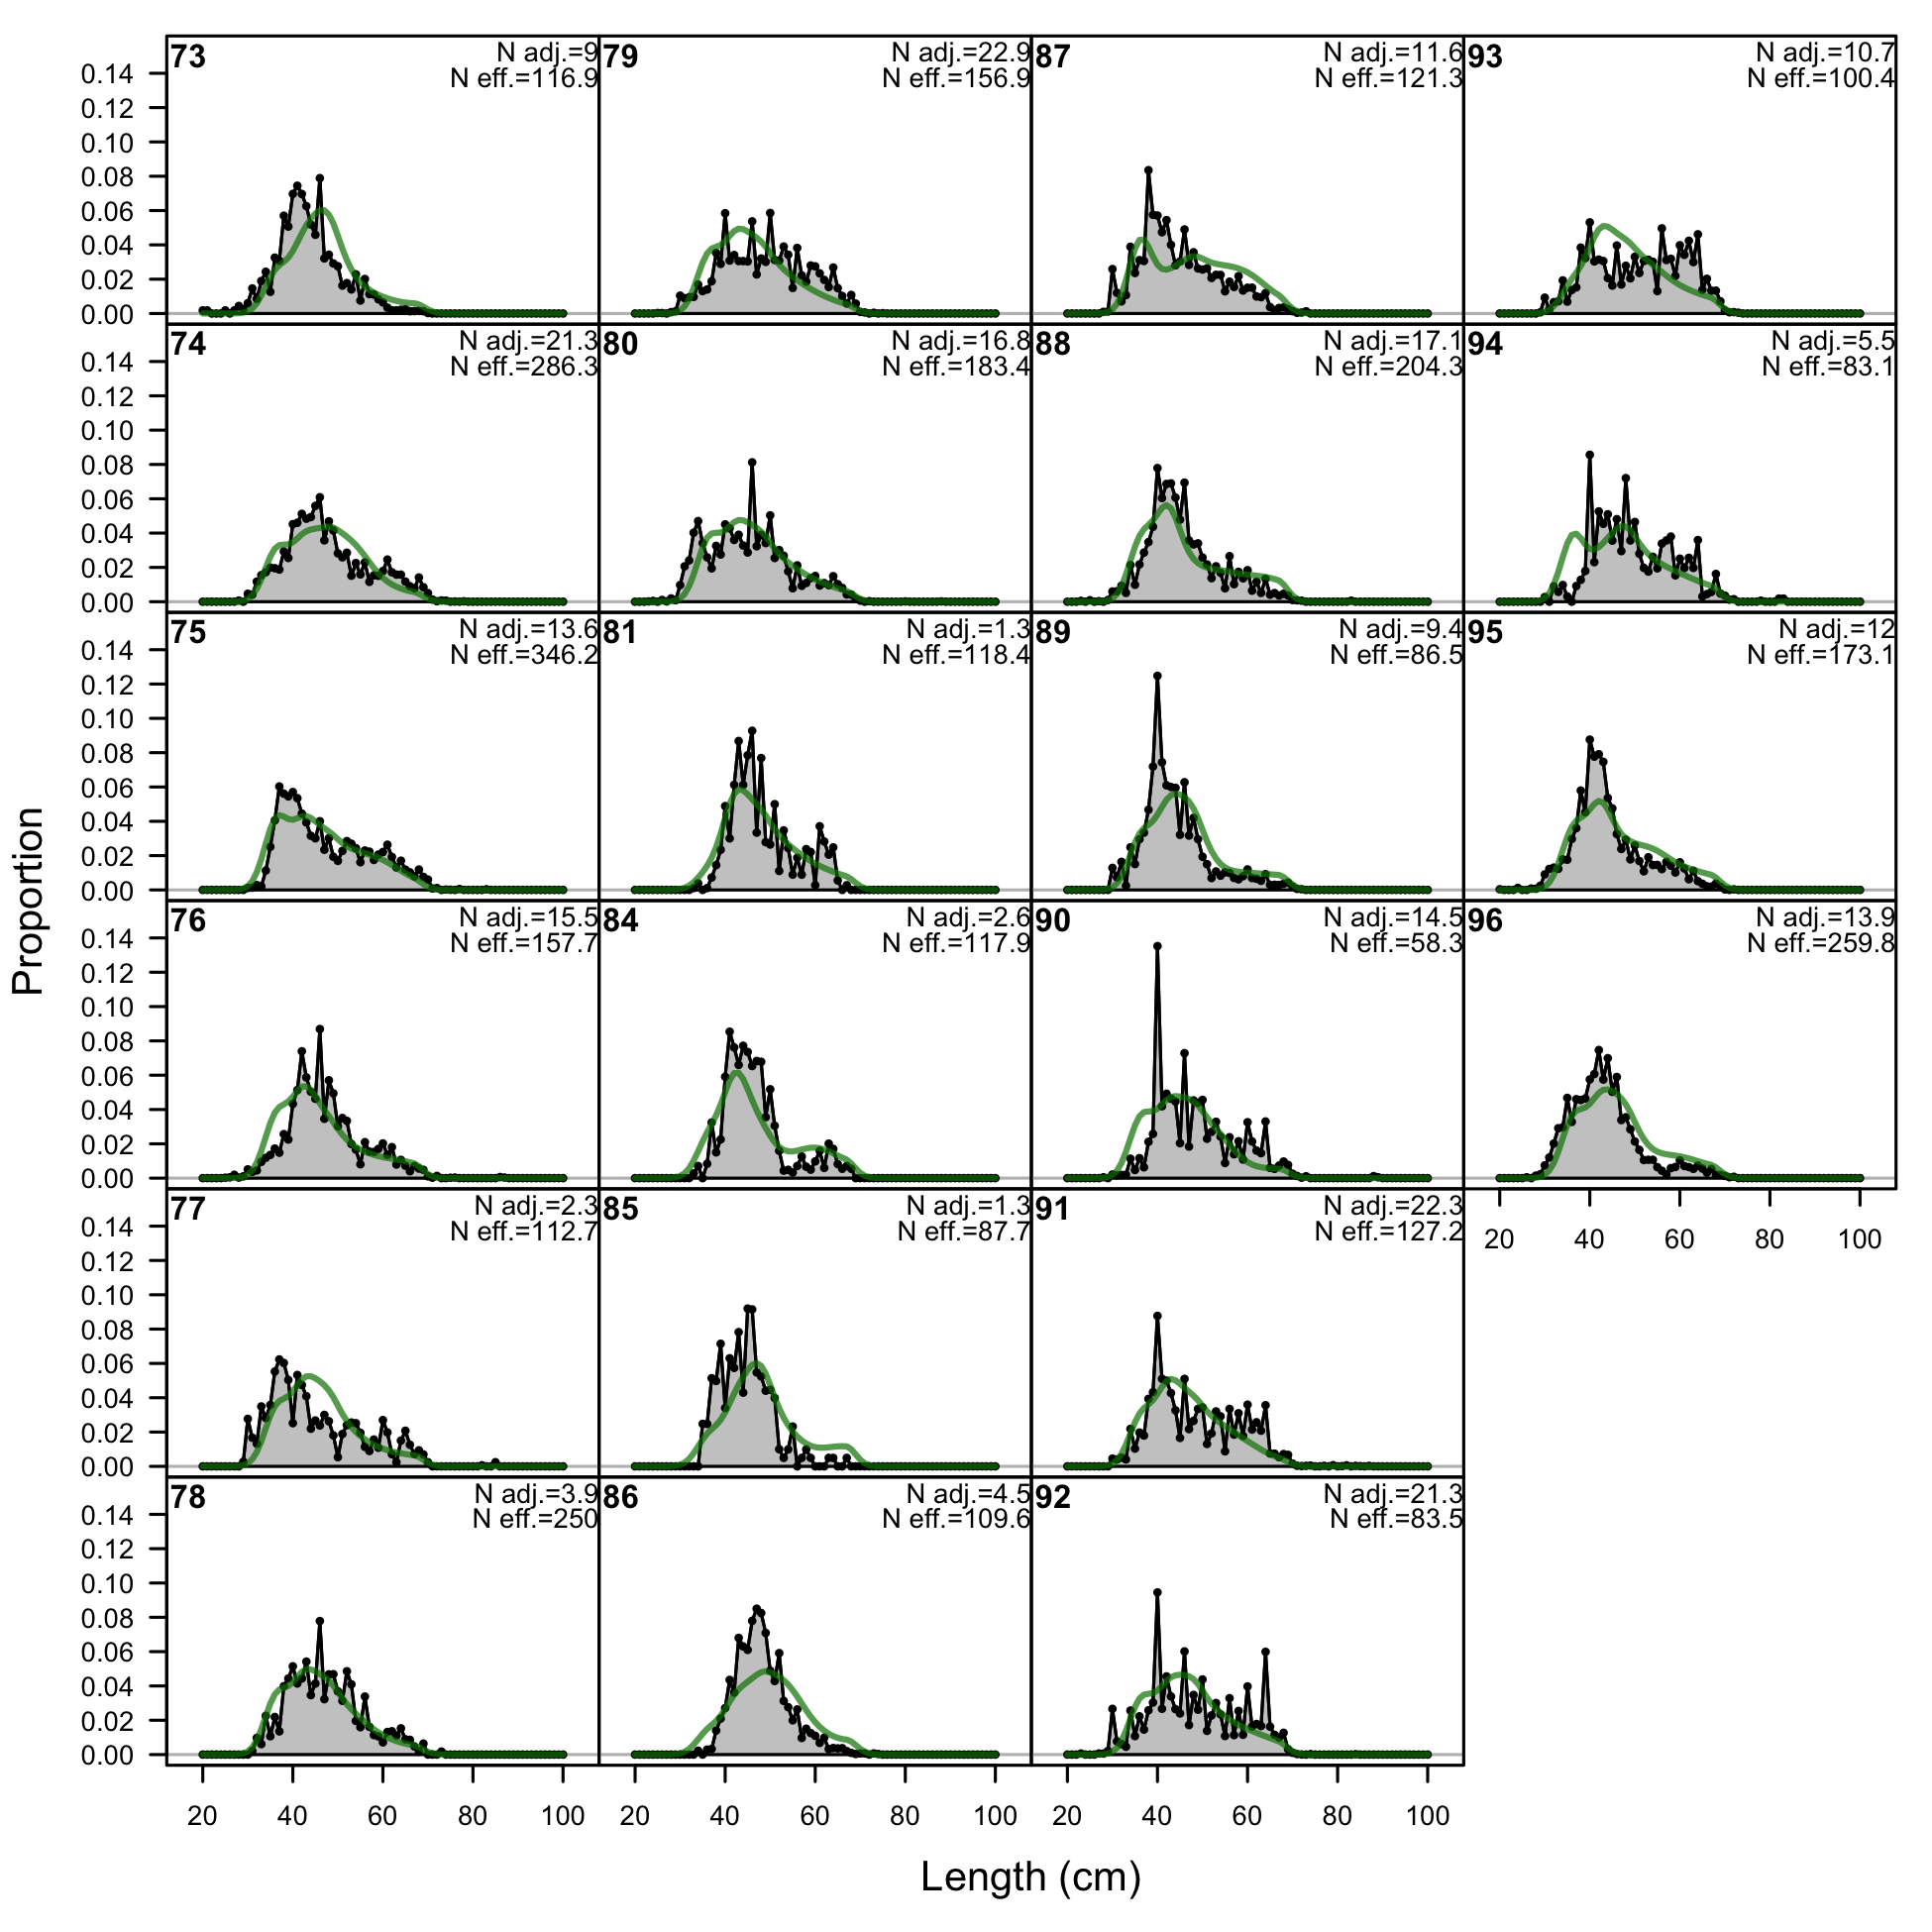
Length comps, whole catch, F6-OBJ_CC (plot 1 of 2).
'N adj.' is the input sample size after data-weighting adjustment. N eff. is the calculated effective sample size used in the McAllister-Ianelli tuning method. (plot 2 of 2)
file: comp_lenfit_flt6mkt0_page2.png
Pearson residuals, whole catch, F6-OBJ_CC (max=5.51) (plot 2 of 2)
Closed bubbles are positive residuals (observed > expected) and open bubbles are negative residuals (observed < expected).
file: comp_lenfit_residsflt6mkt0_page2.png

N-EffN comparison, Length comps, whole catch, F6-OBJ_CC
file: comp_lenfit_sampsize_flt6mkt0.png
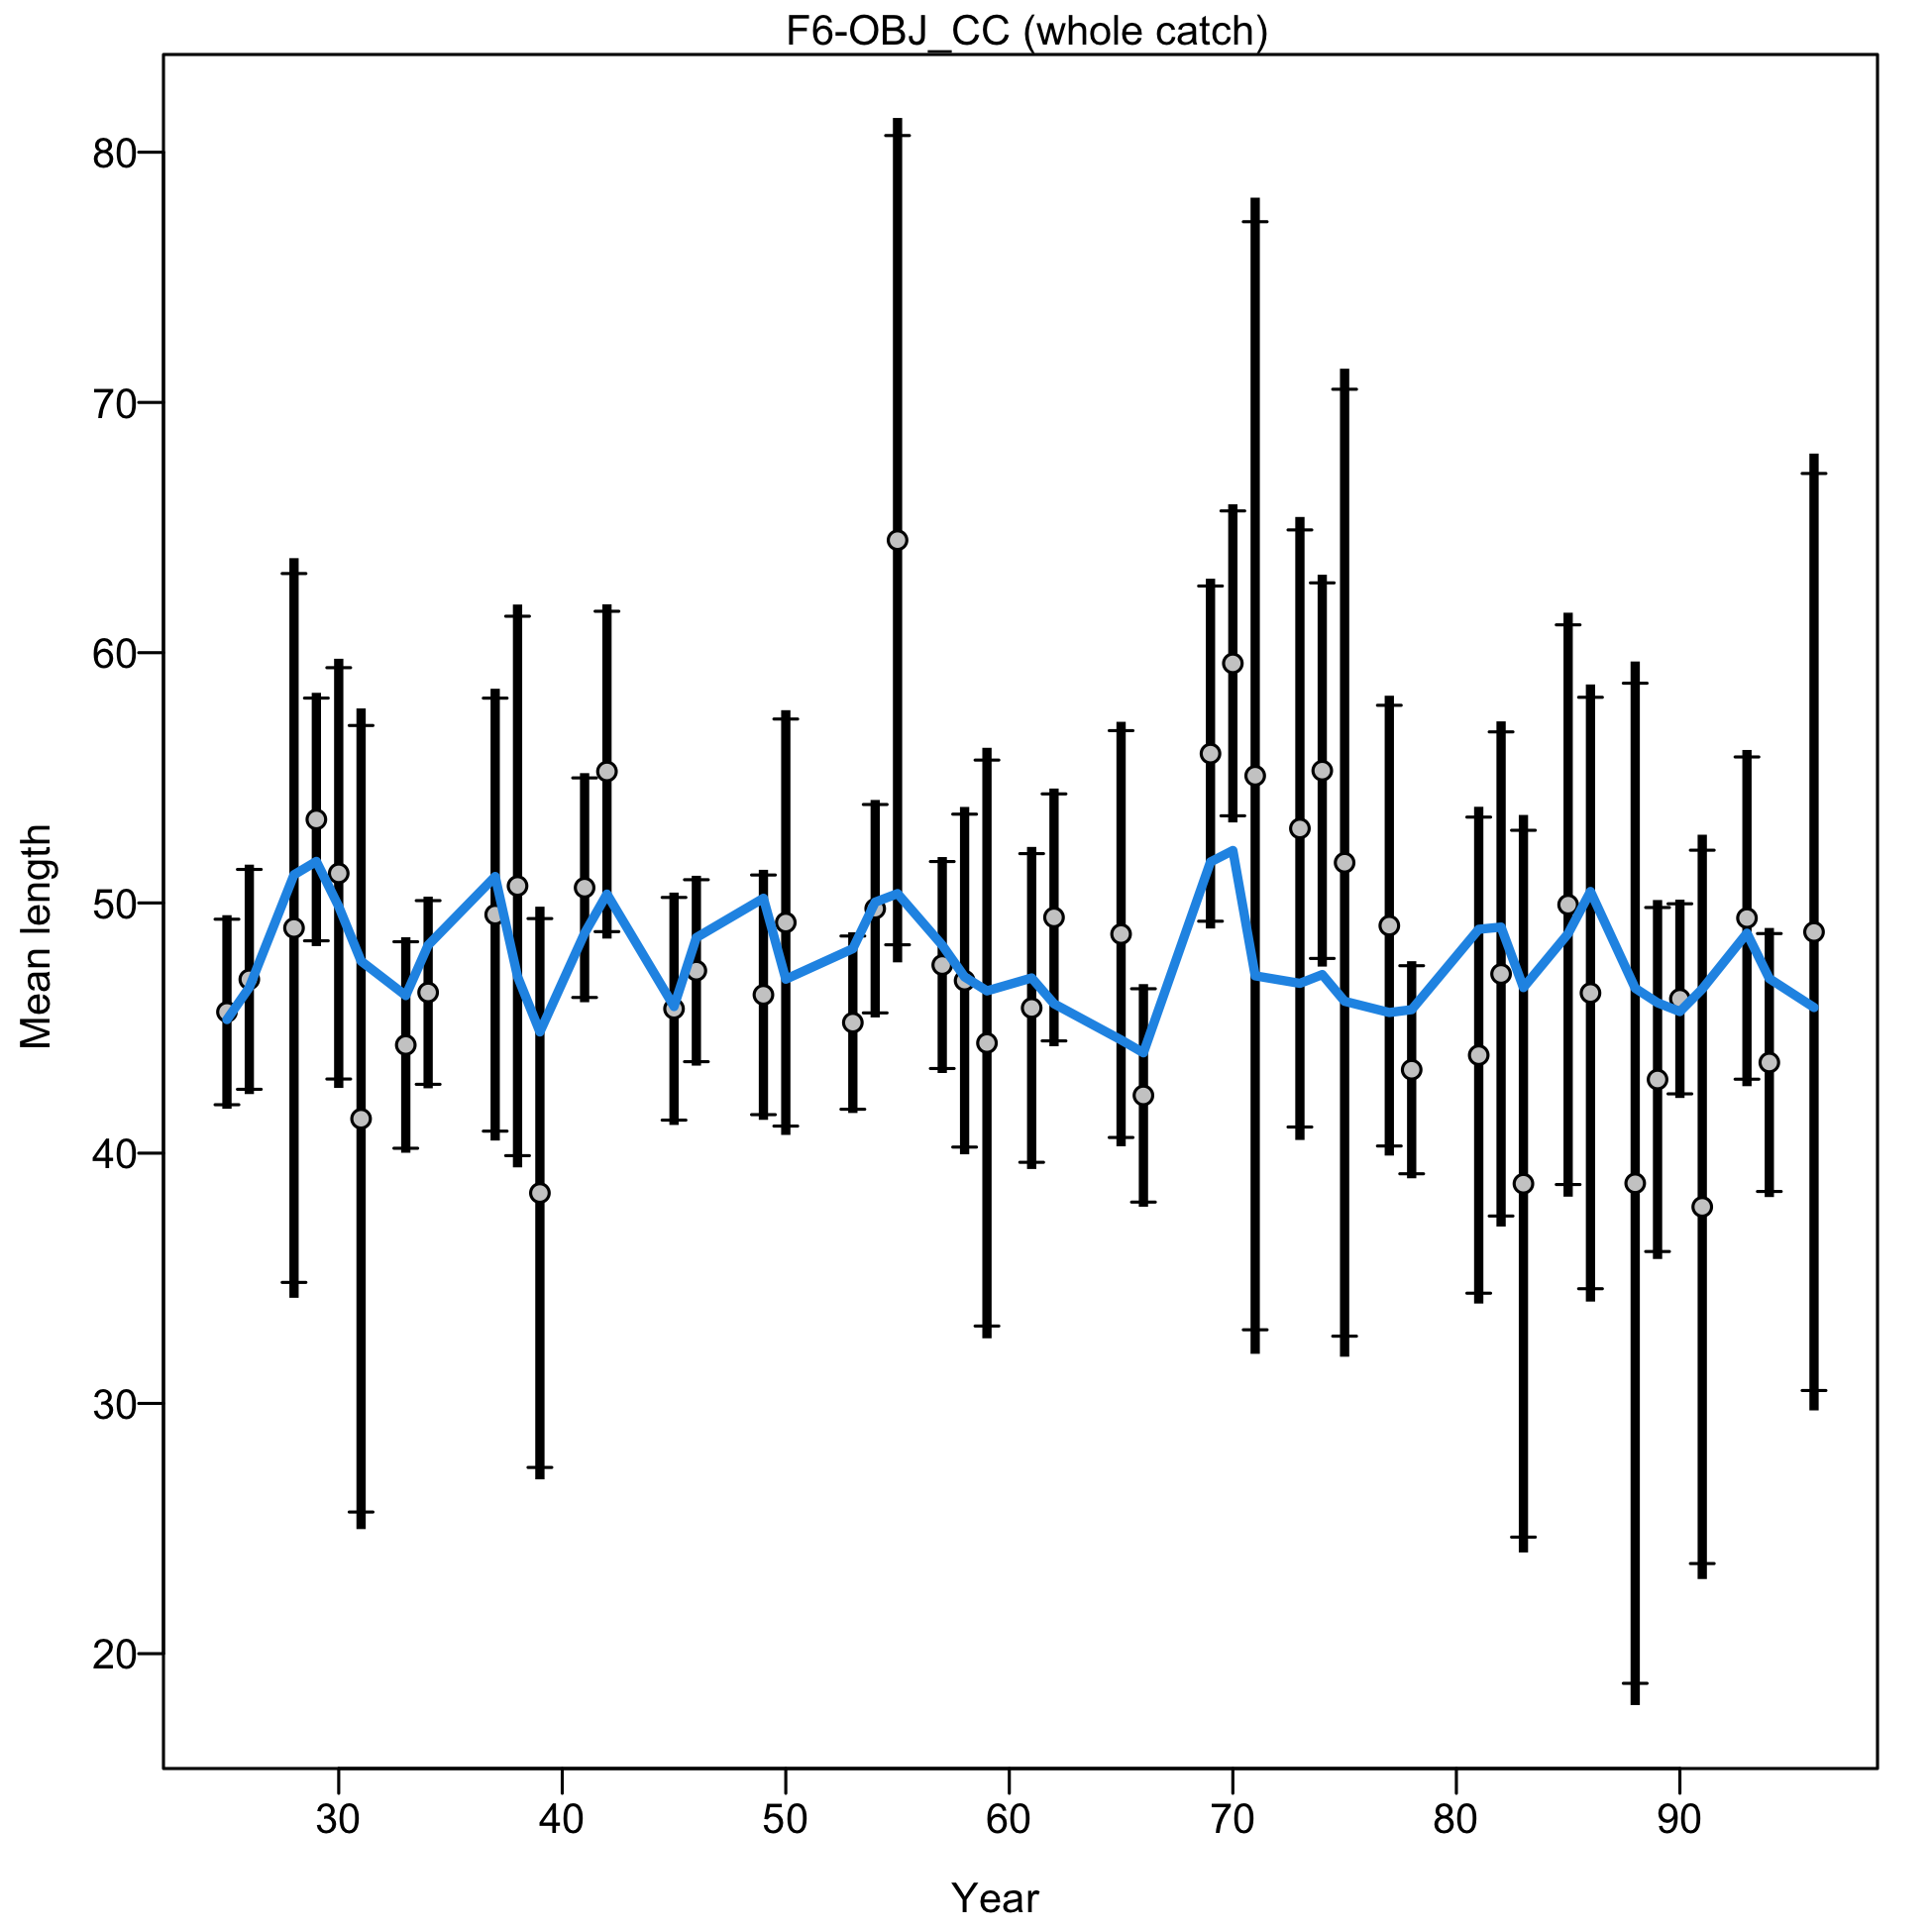
Mean length for F6-OBJ_CC with 95% confidence intervals based on current sample sizes.
Francis data weighting method TA1.8: thinner intervals (with capped ends) show result of further adjusting sample sizes based on suggested multiplier (with 95% interval) for len data from F6-OBJ_CC:
1.0887 (0.8193-1.6733)
For more info, see Francis (2011).
file: comp_lenfit_data_weighting_TA1.8_F6-OBJ_CC.png
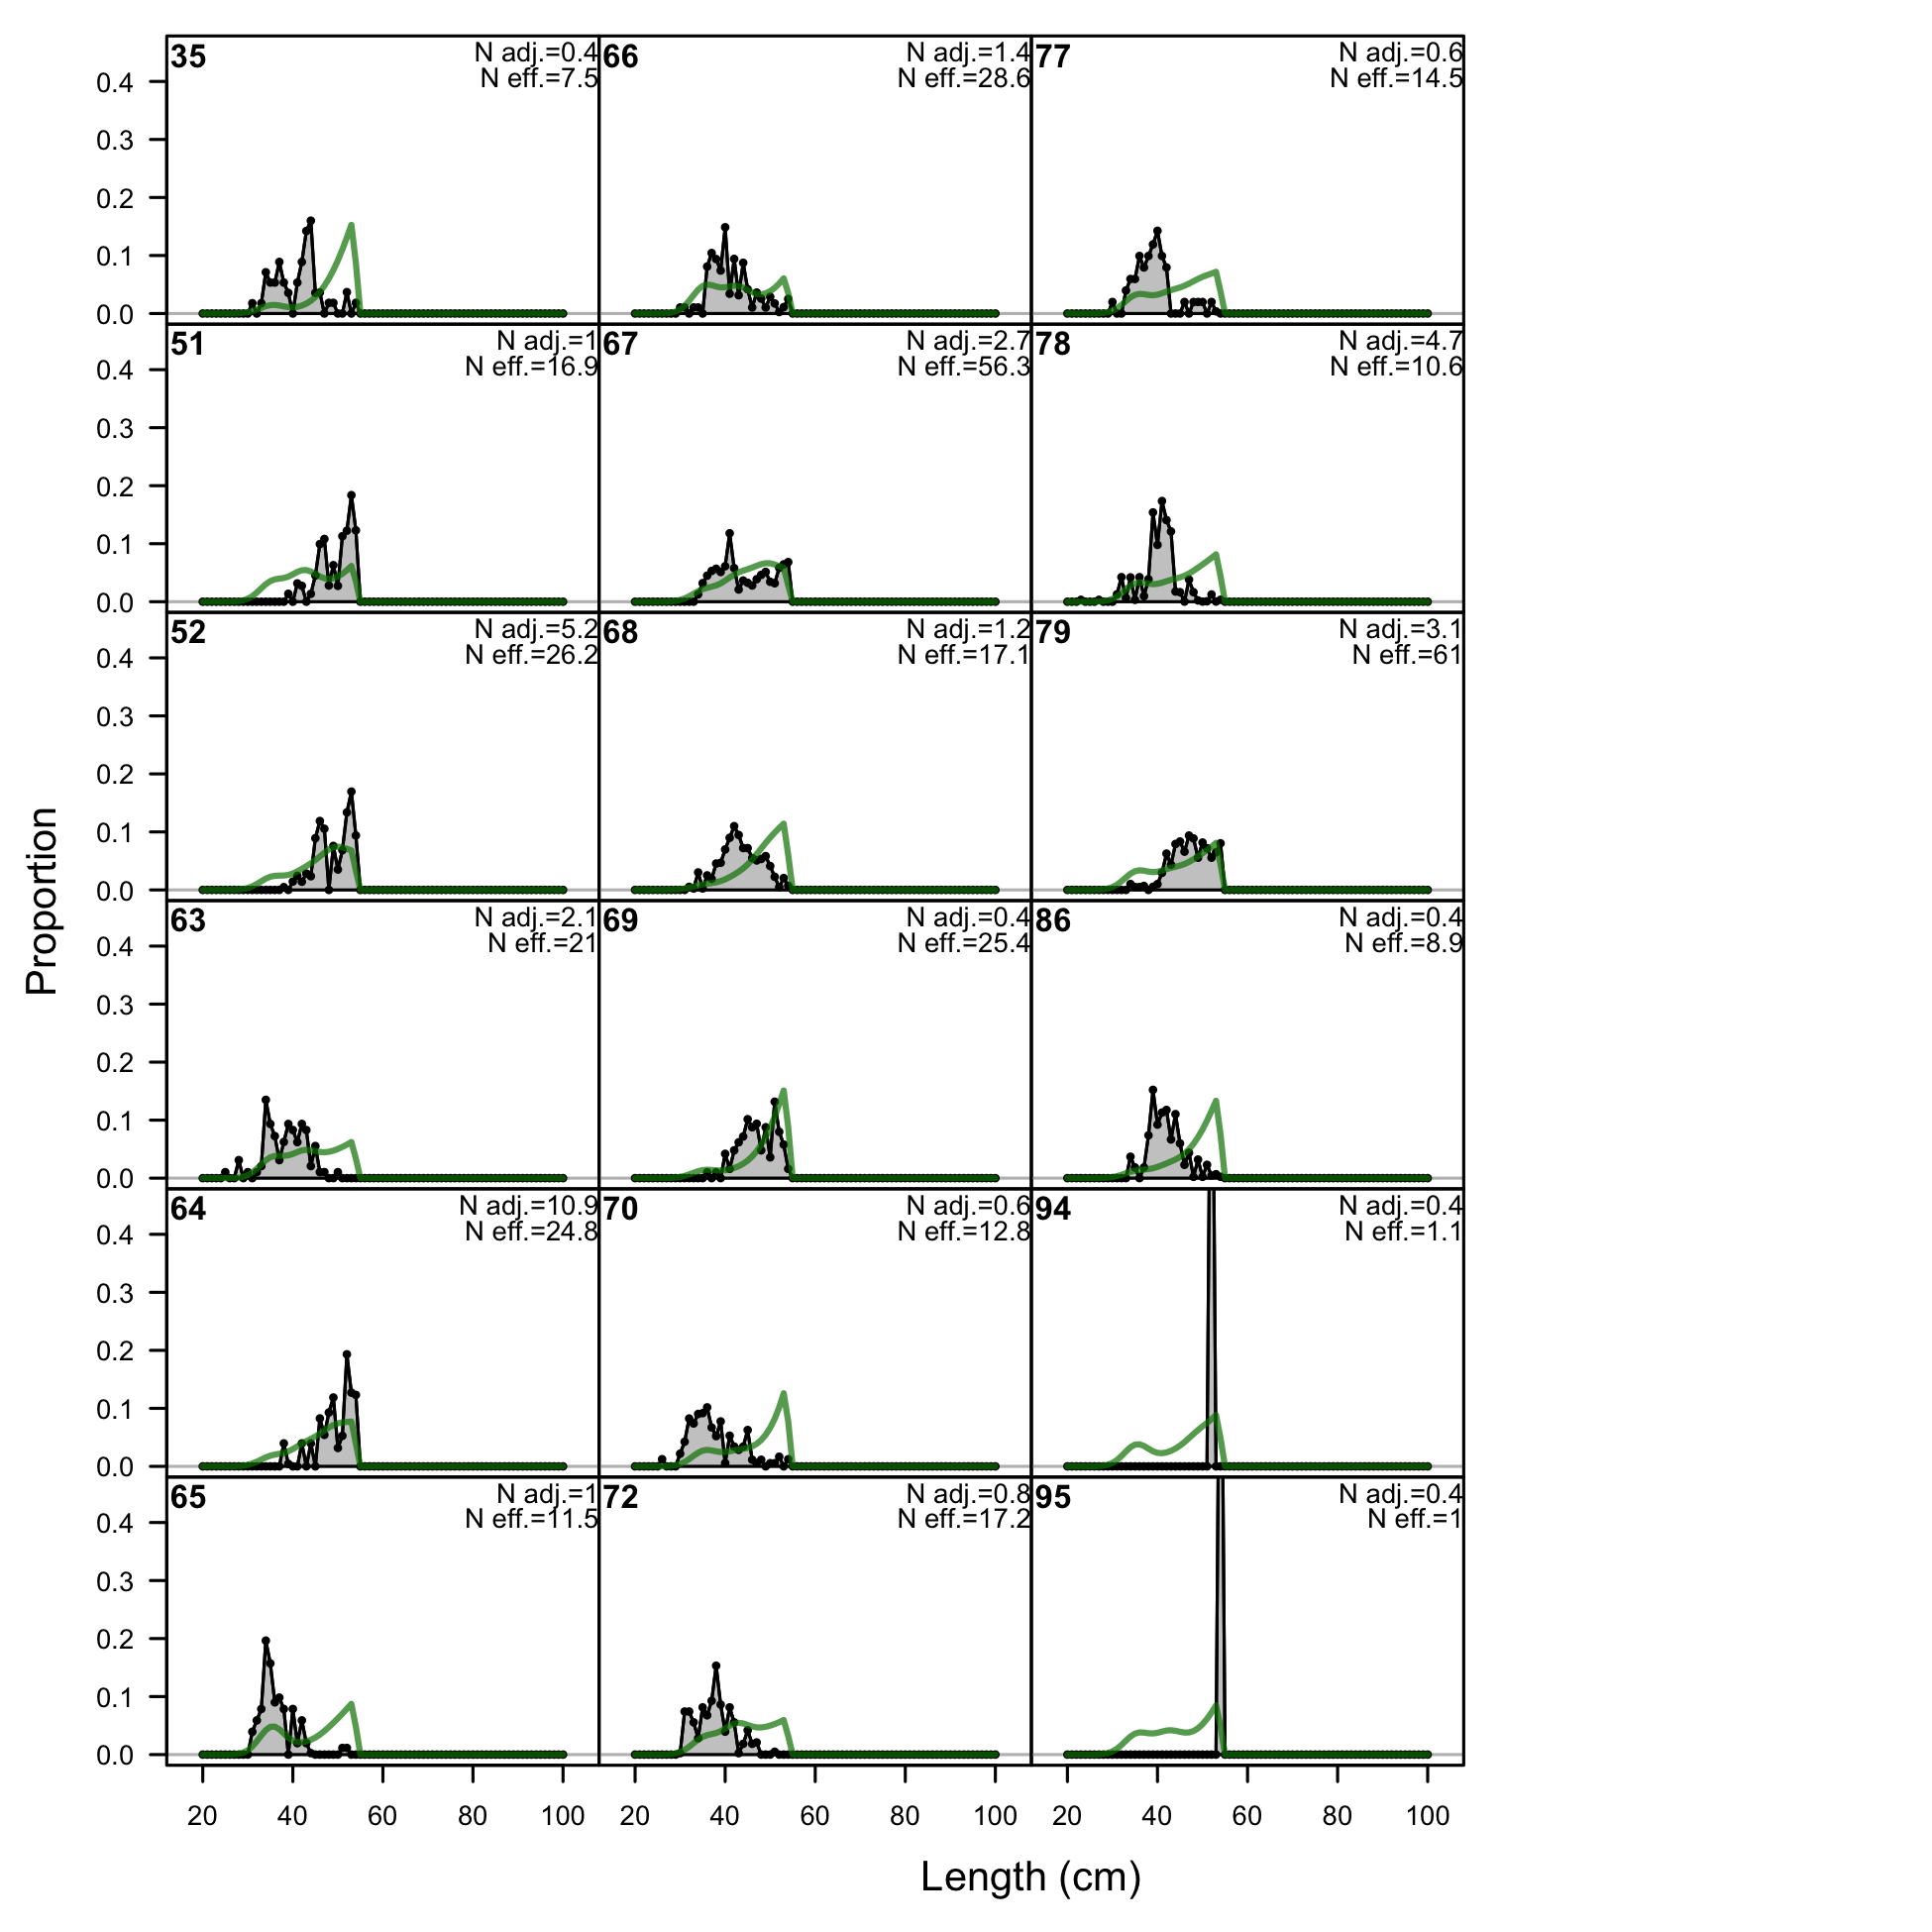
Length comps, whole catch, F7-OBJ_NC (plot 1 of 3).
'N adj.' is the input sample size after data-weighting adjustment. N eff. is the calculated effective sample size used in the McAllister-Ianelli tuning method.
file: comp_lenfit_flt7mkt0_page1.png
Length comps, whole catch, F7-OBJ_NC (plot 1 of 3).
'N adj.' is the input sample size after data-weighting adjustment. N eff. is the calculated effective sample size used in the McAllister-Ianelli tuning method. (plot 2 of 3)
file: comp_lenfit_flt7mkt0_page2.png
Length comps, whole catch, F7-OBJ_NC (plot 1 of 3).
'N adj.' is the input sample size after data-weighting adjustment. N eff. is the calculated effective sample size used in the McAllister-Ianelli tuning method. (plot 2 of 3) (plot 3 of 3)
file: comp_lenfit_flt7mkt0_page3.png
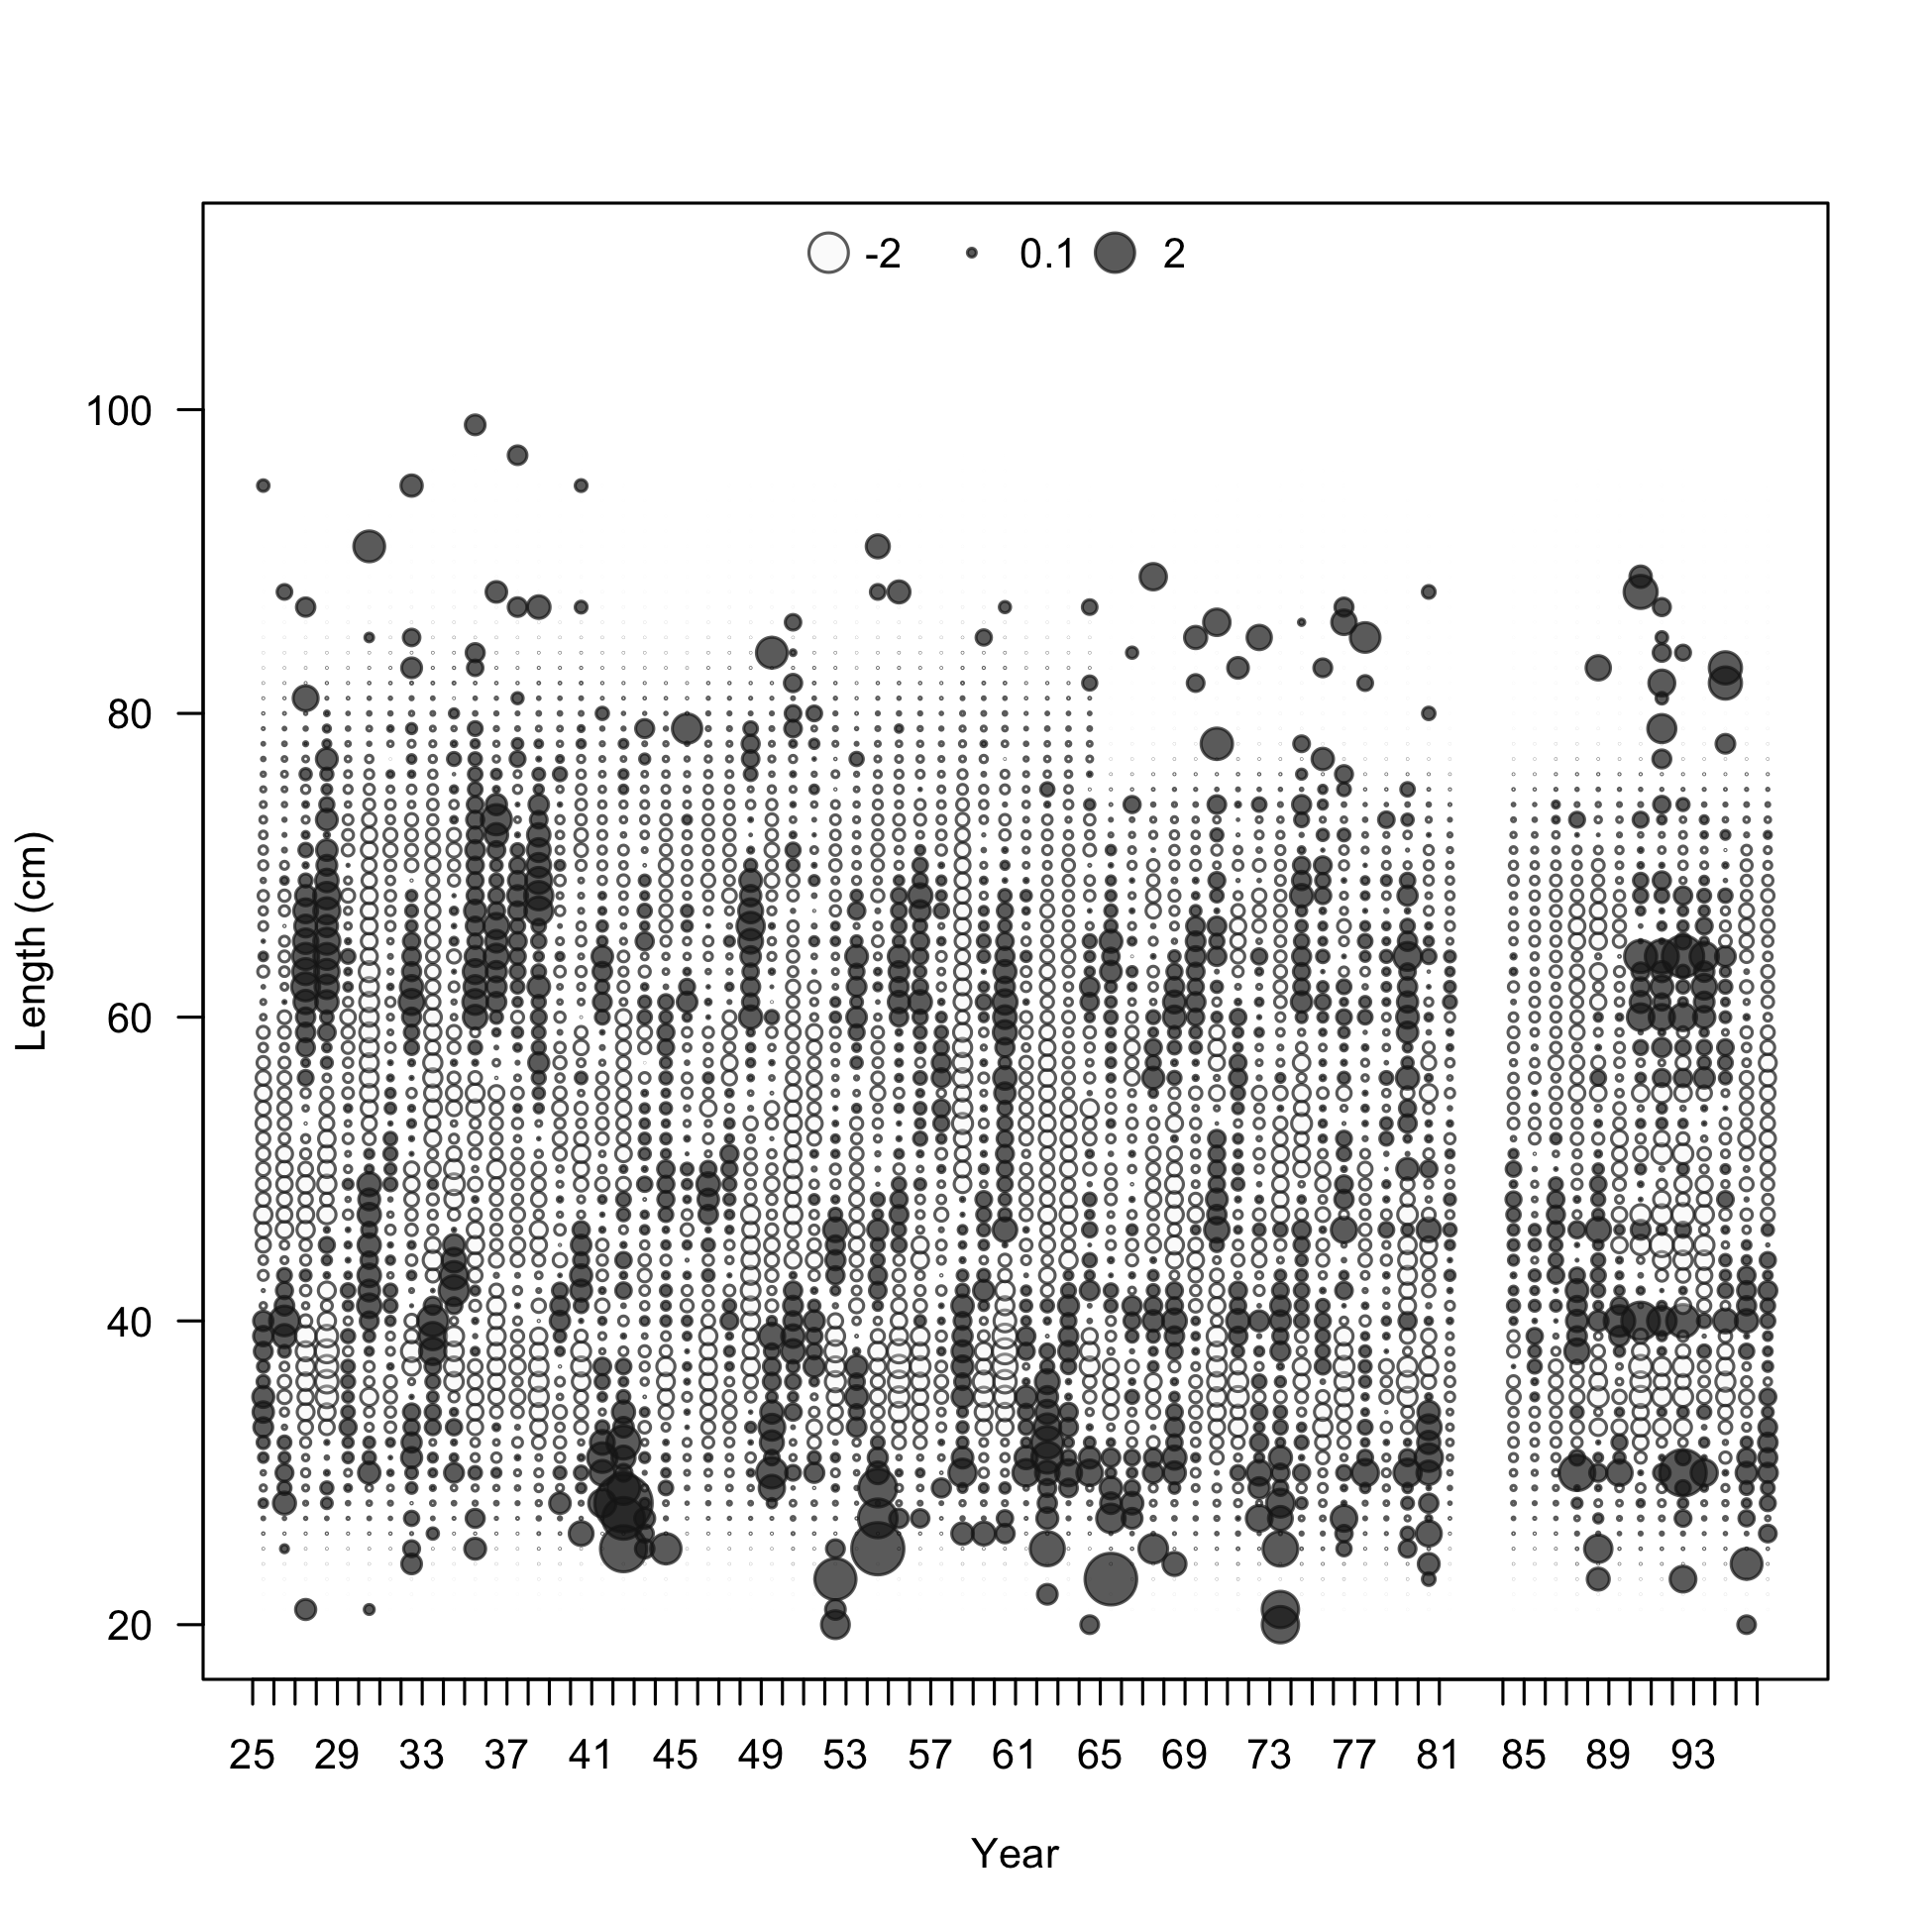
Pearson residuals, whole catch, F7-OBJ_NC (max=4.26) (plot 3 of 3)
Closed bubbles are positive residuals (observed > expected) and open bubbles are negative residuals (observed < expected).
file: comp_lenfit_residsflt7mkt0_page3.png
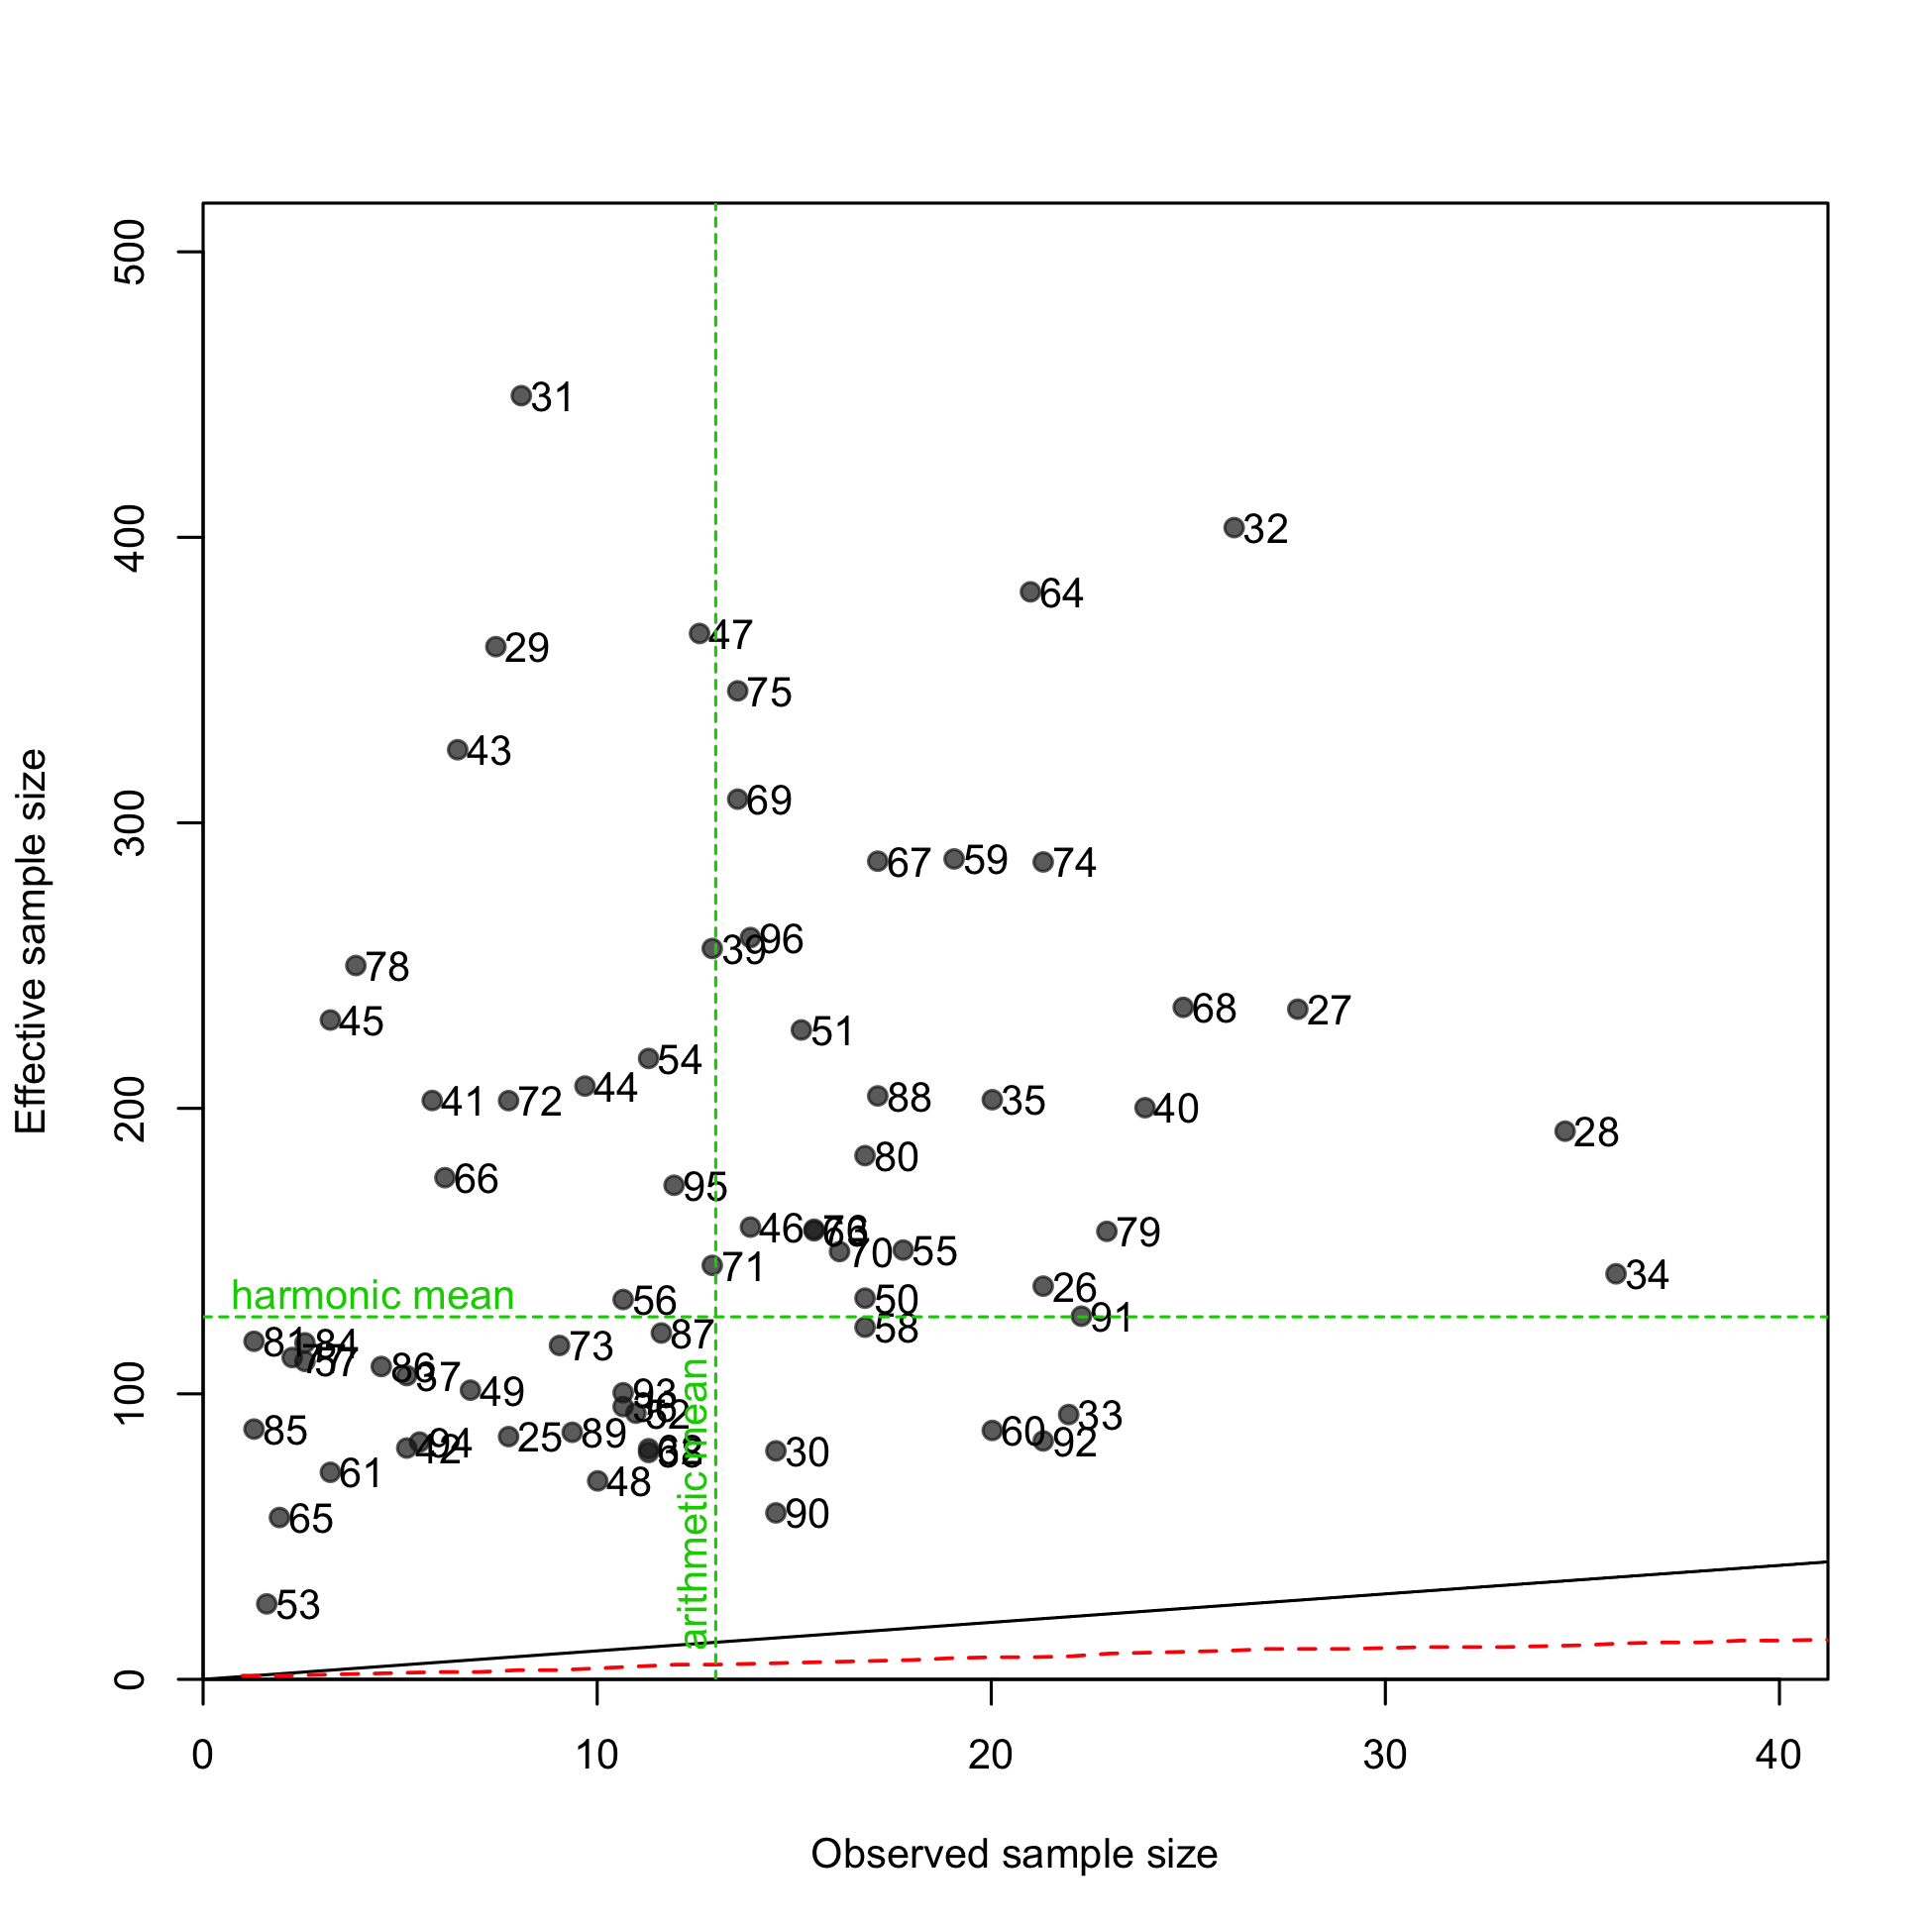
N-EffN comparison, Length comps, whole catch, F7-OBJ_NC
file: comp_lenfit_sampsize_flt7mkt0.png
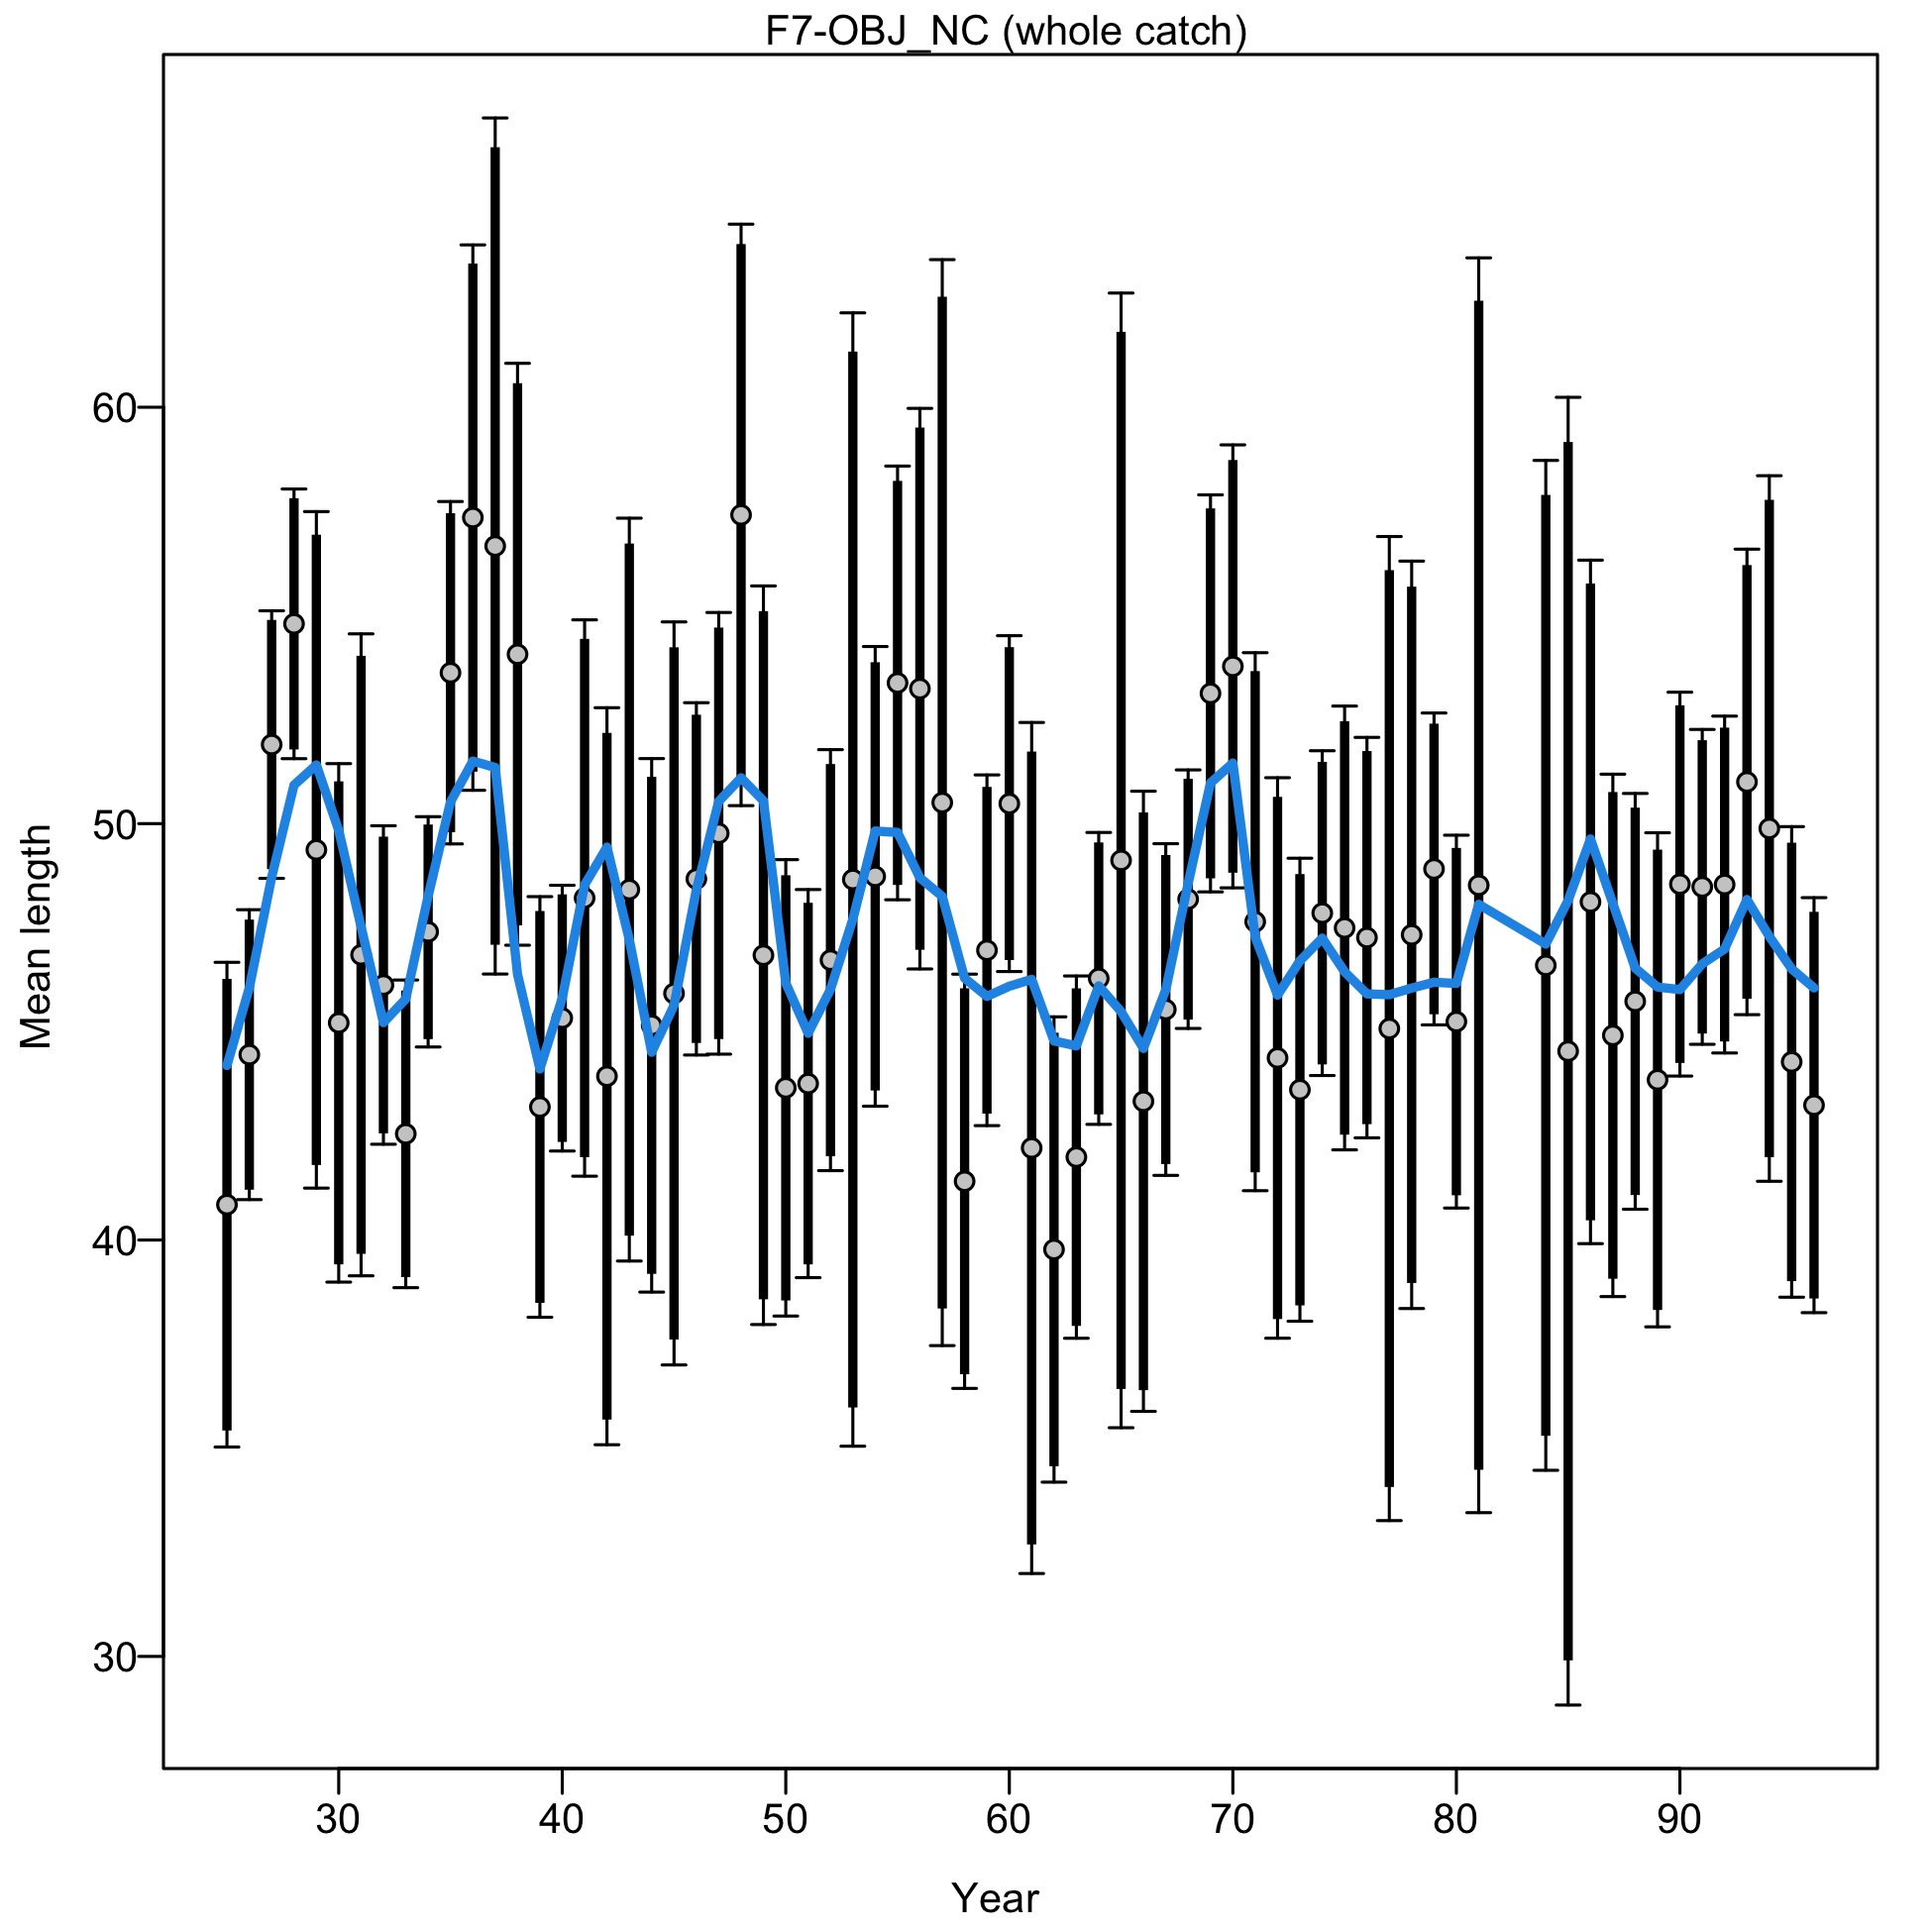
Mean length for F7-OBJ_NC with 95% confidence intervals based on current sample sizes.
Francis data weighting method TA1.8: thinner intervals (with capped ends) show result of further adjusting sample sizes based on suggested multiplier (with 95% interval) for len data from F7-OBJ_NC:
0.868 (0.6729-1.2731)
For more info, see Francis (2011).
file: comp_lenfit_data_weighting_TA1.8_F7-OBJ_NC.png
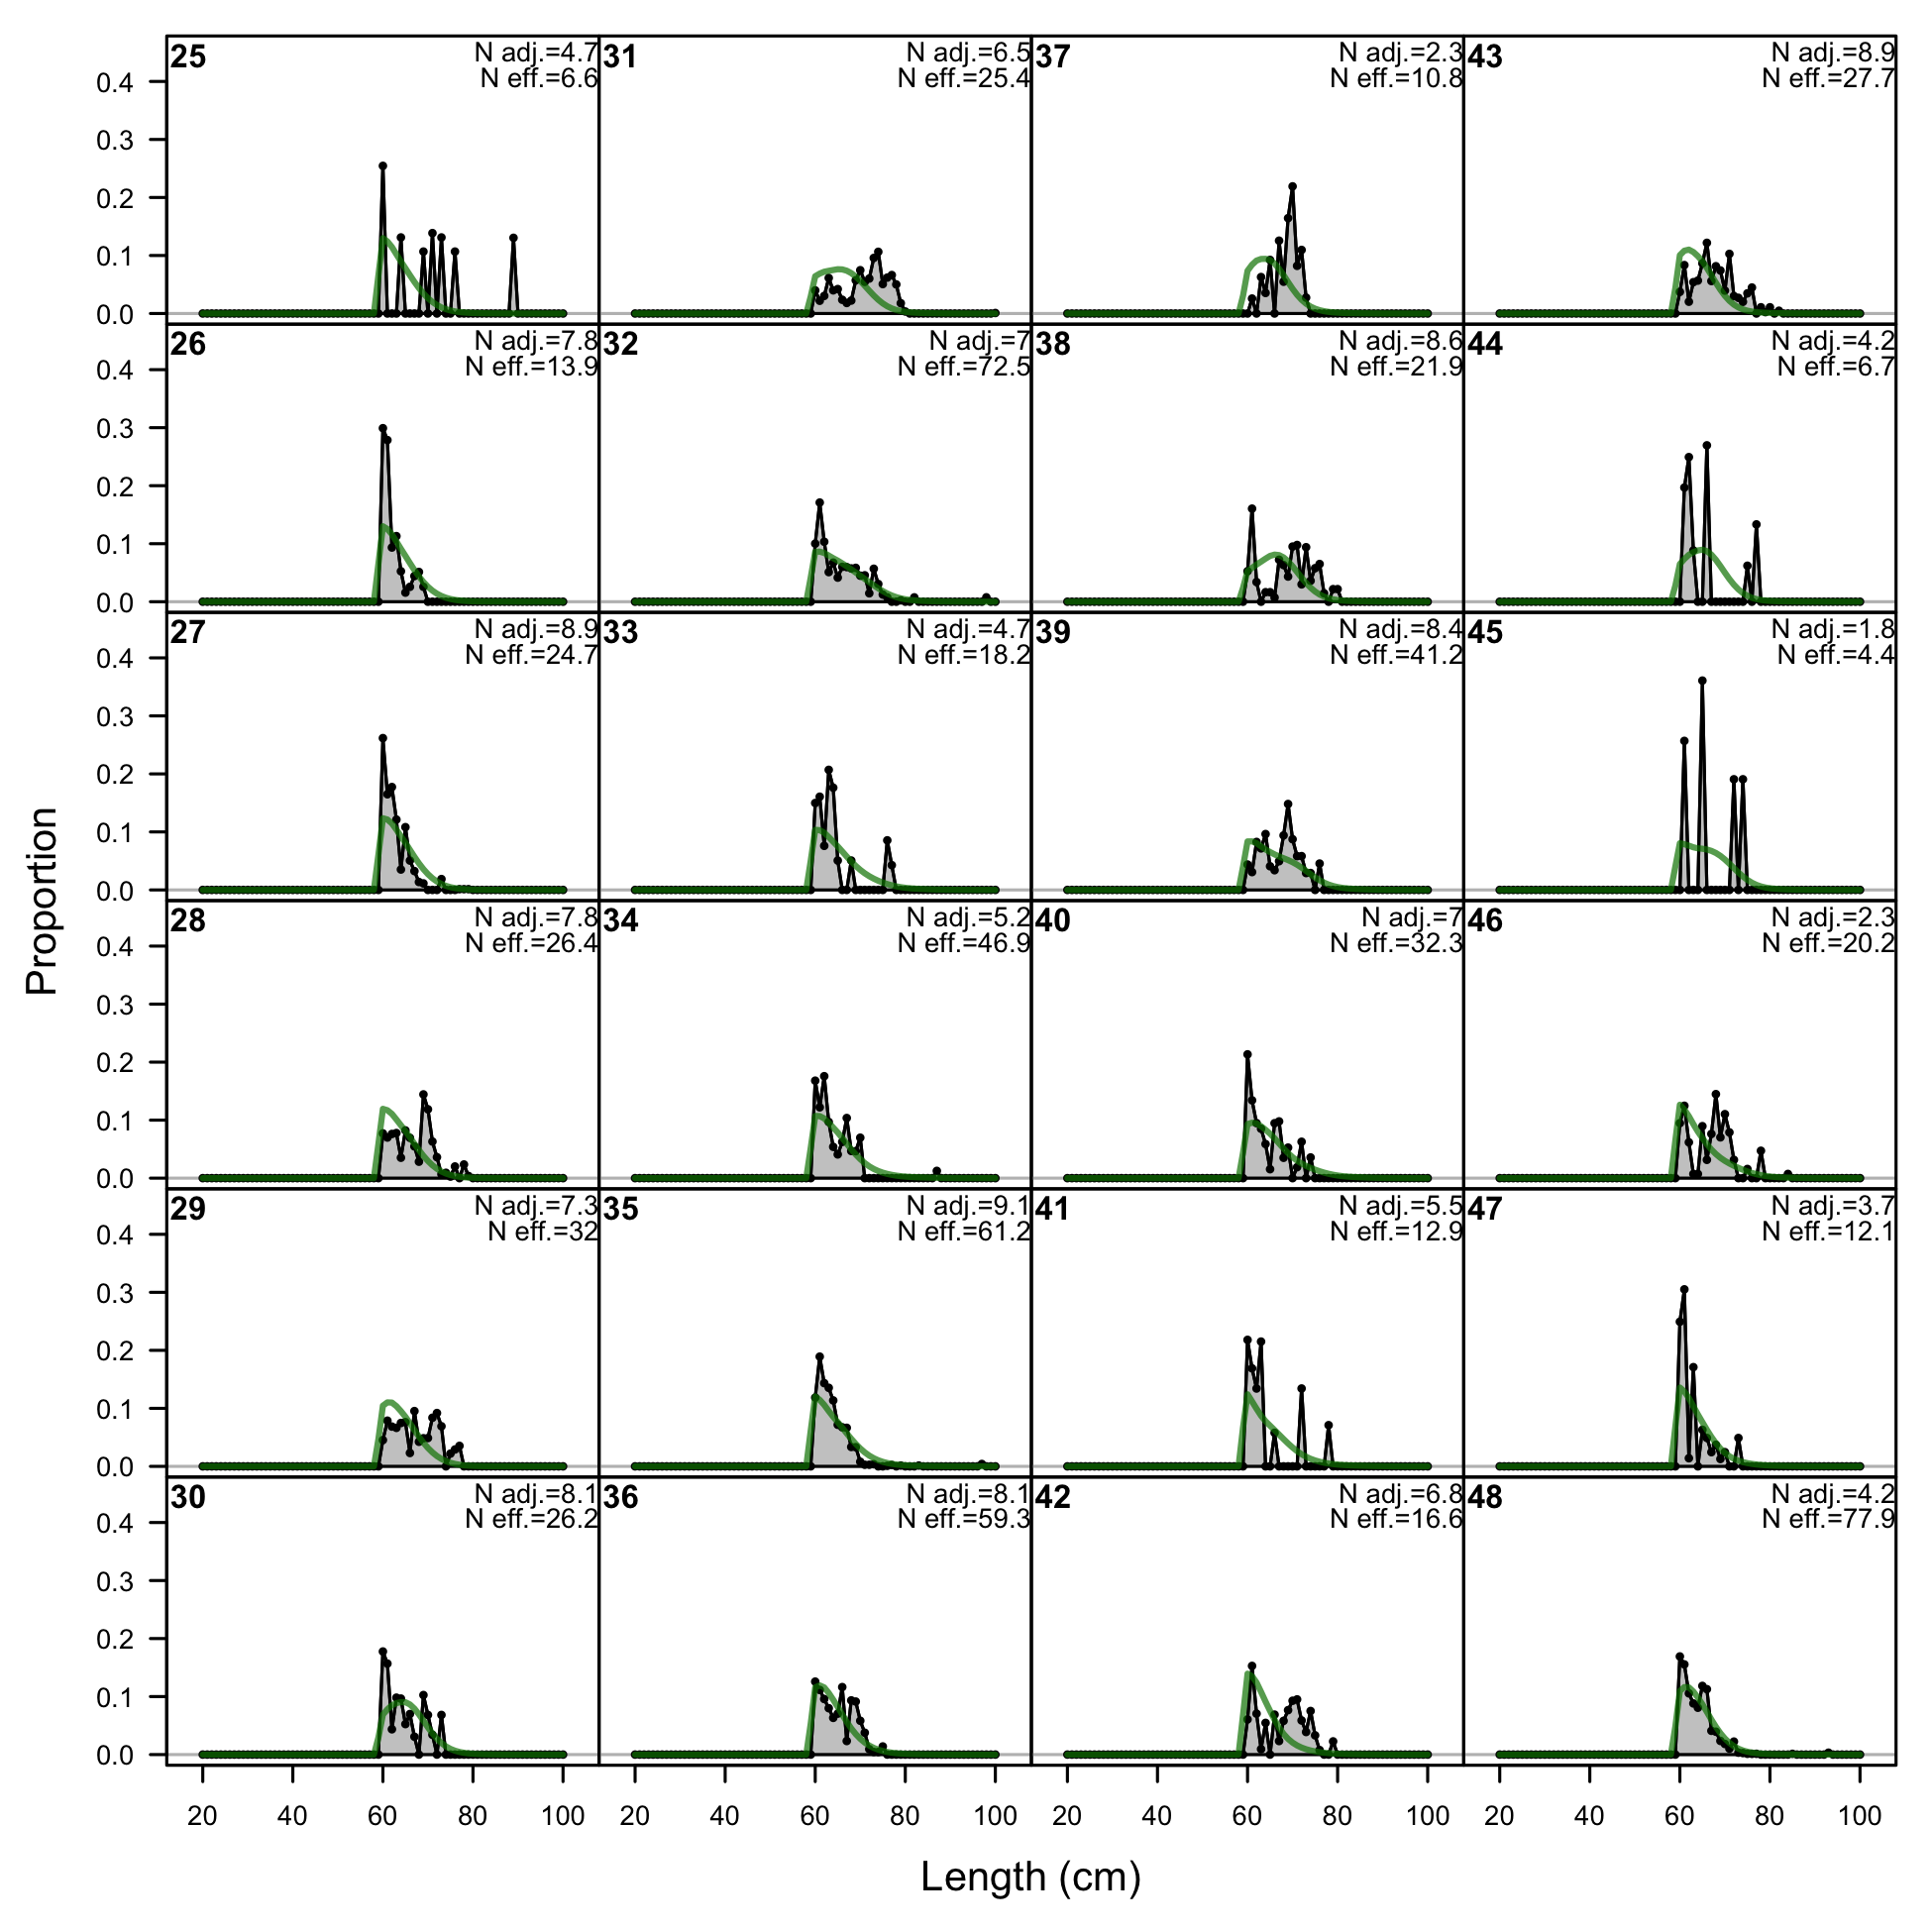
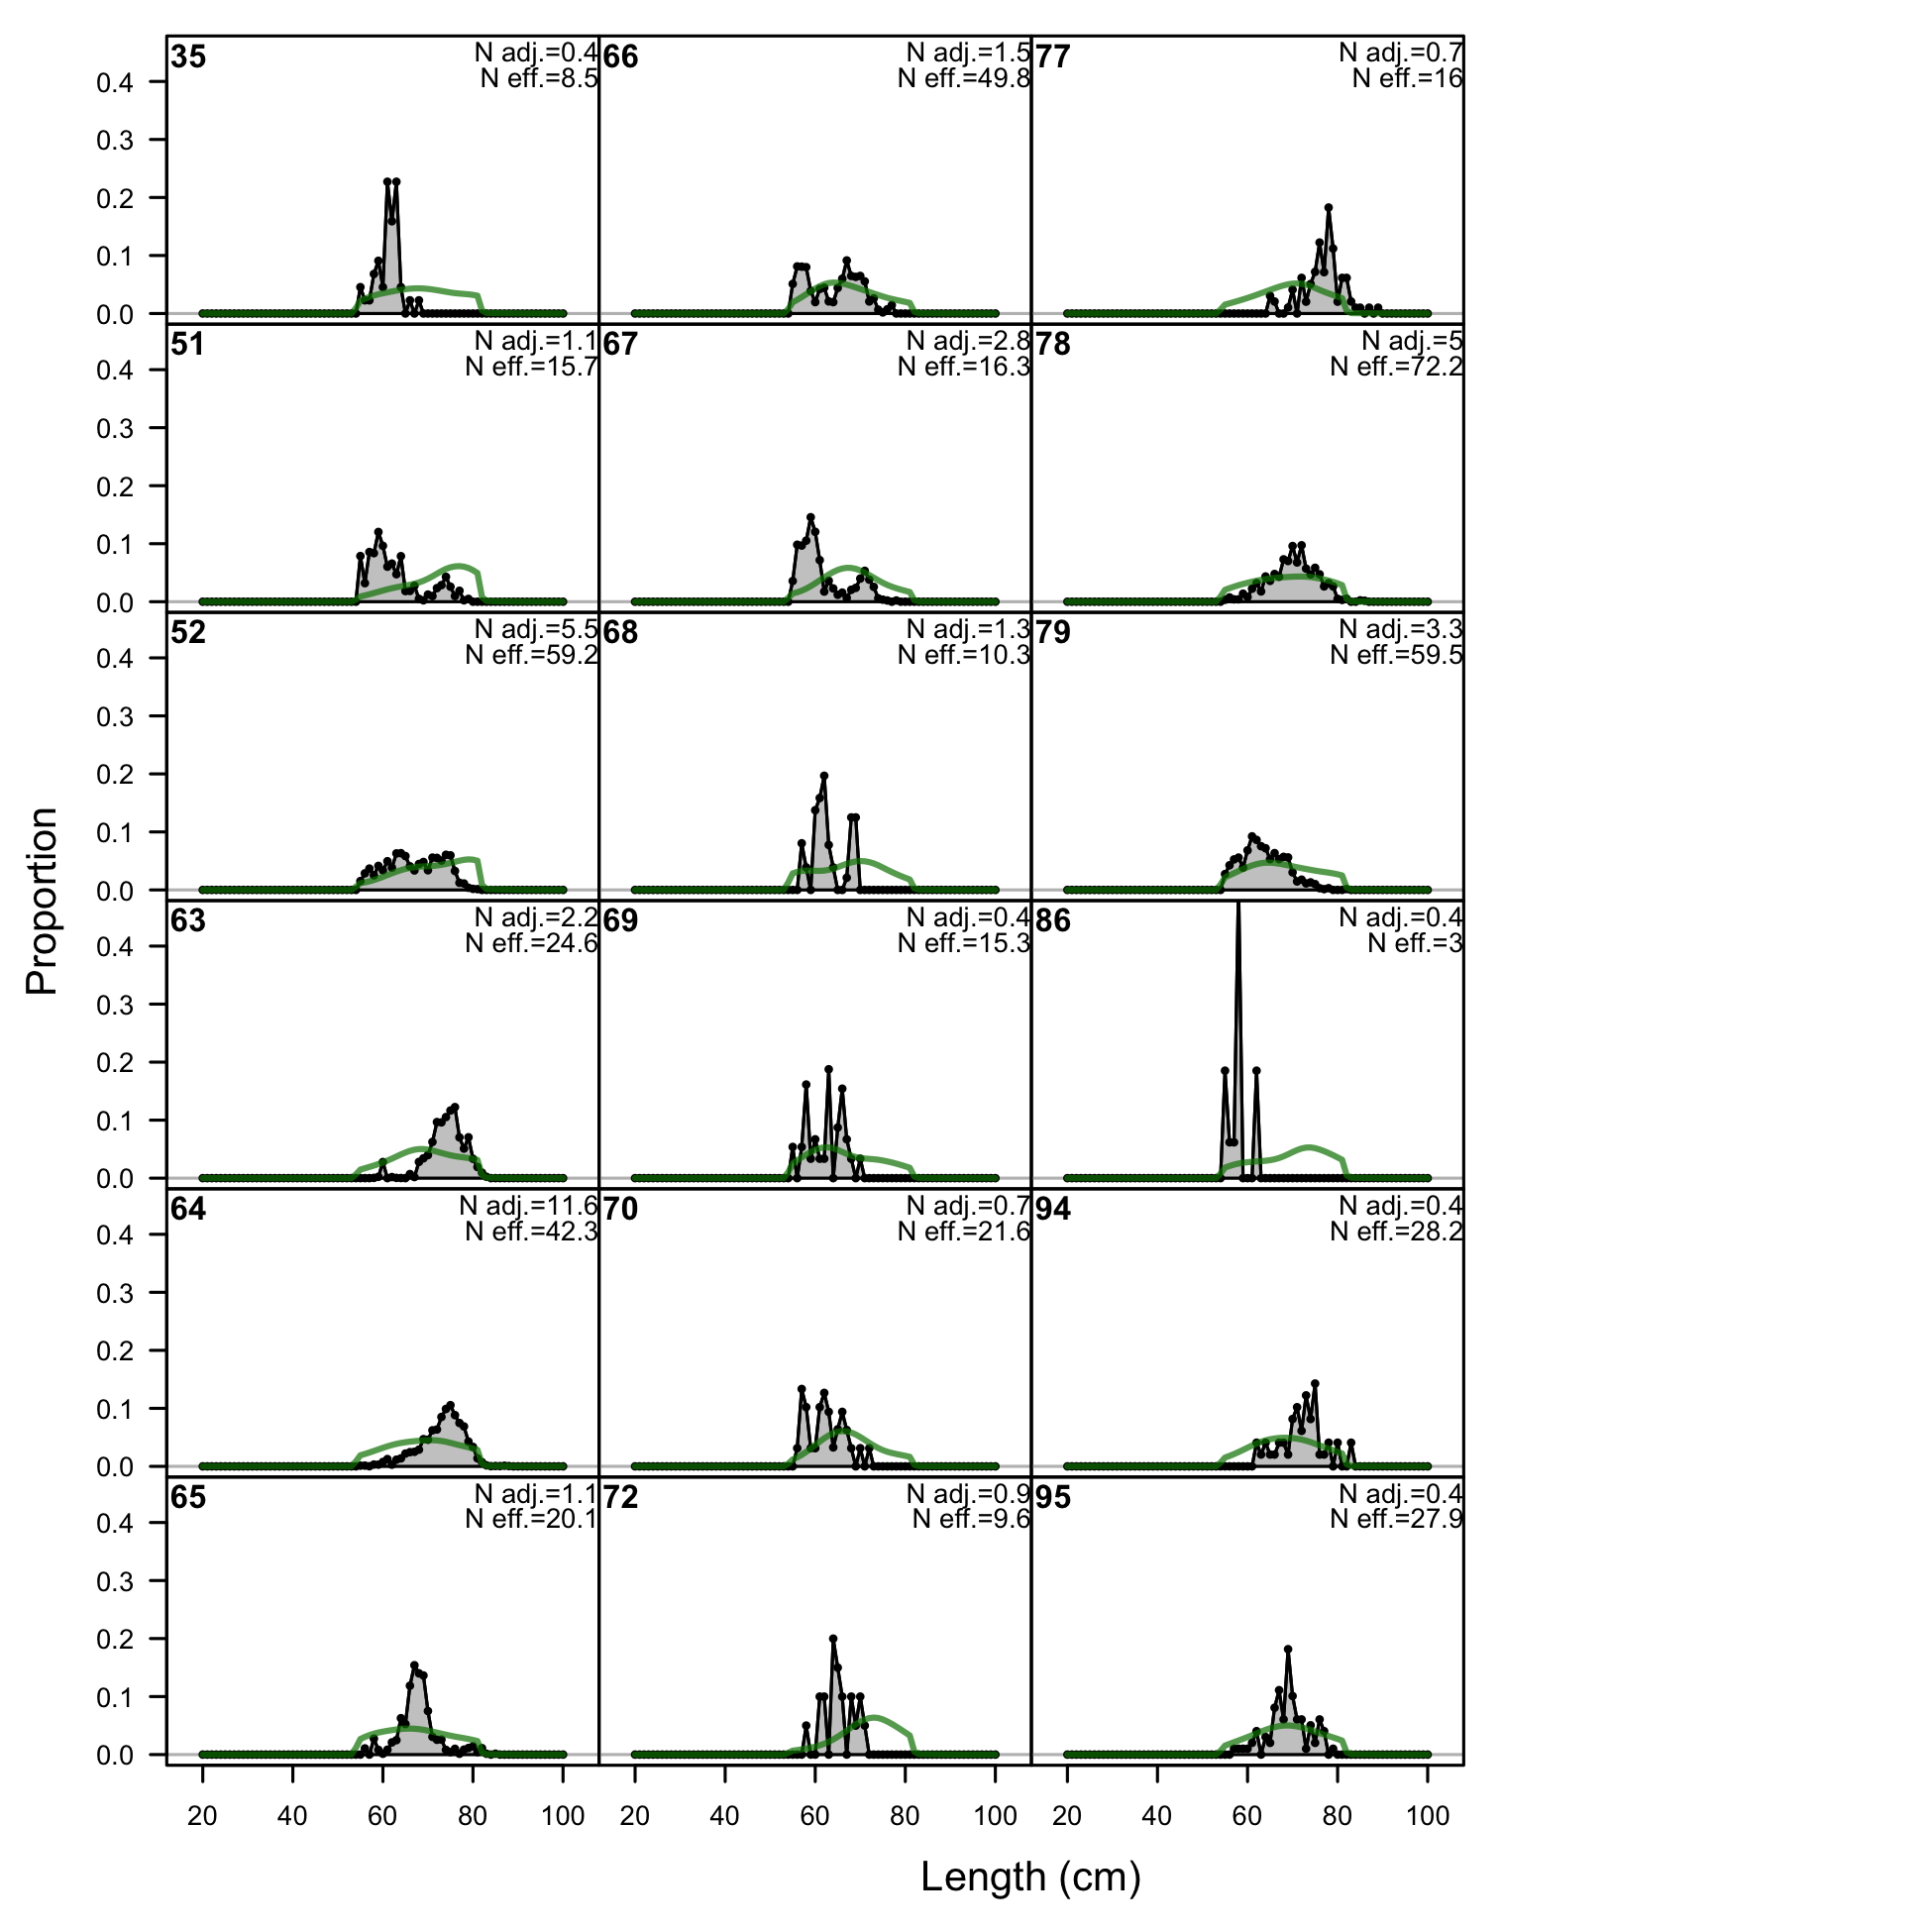
Length comps, retained, F8-NOA-Offshore_Small.
'N adj.' is the input sample size after data-weighting adjustment. N eff. is the calculated effective sample size used in the McAllister-Ianelli tuning method.
file: comp_lenfit_flt8mkt2.png
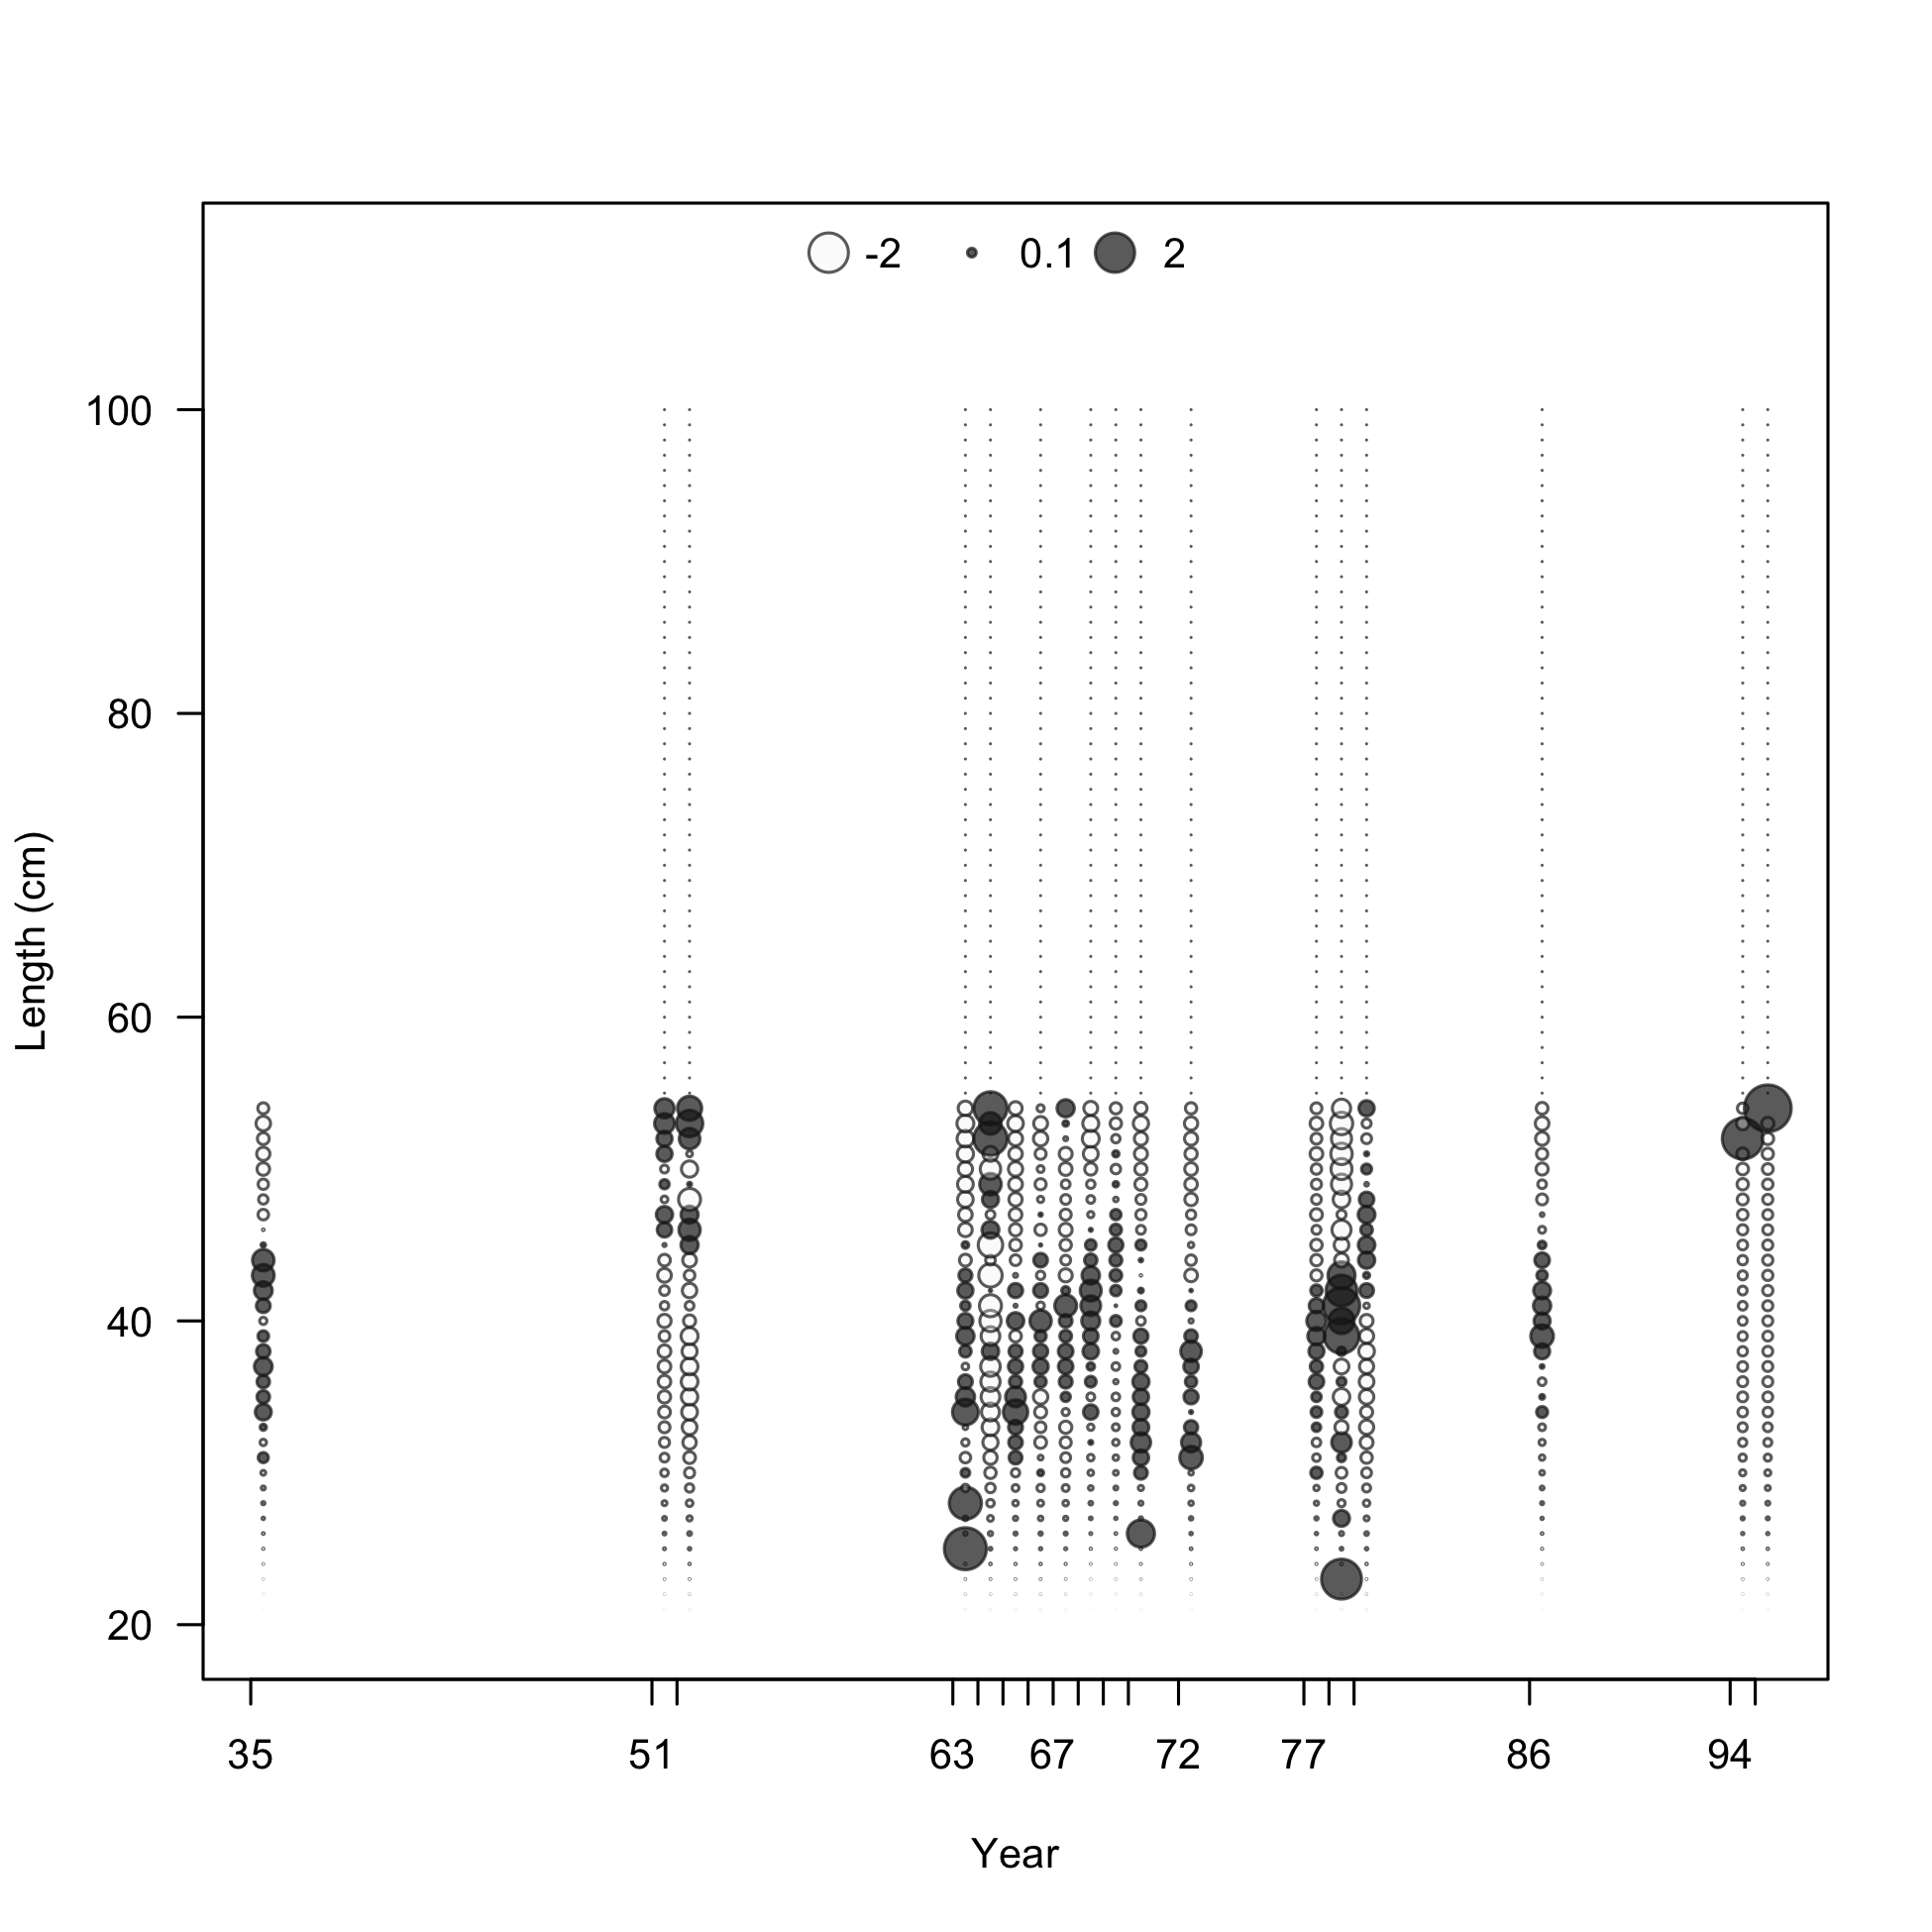
Pearson residuals, retained, F8-NOA-Offshore_Small (max=2.84)
Closed bubbles are positive residuals (observed > expected) and open bubbles are negative residuals (observed < expected).
file: comp_lenfit_residsflt8mkt2.png
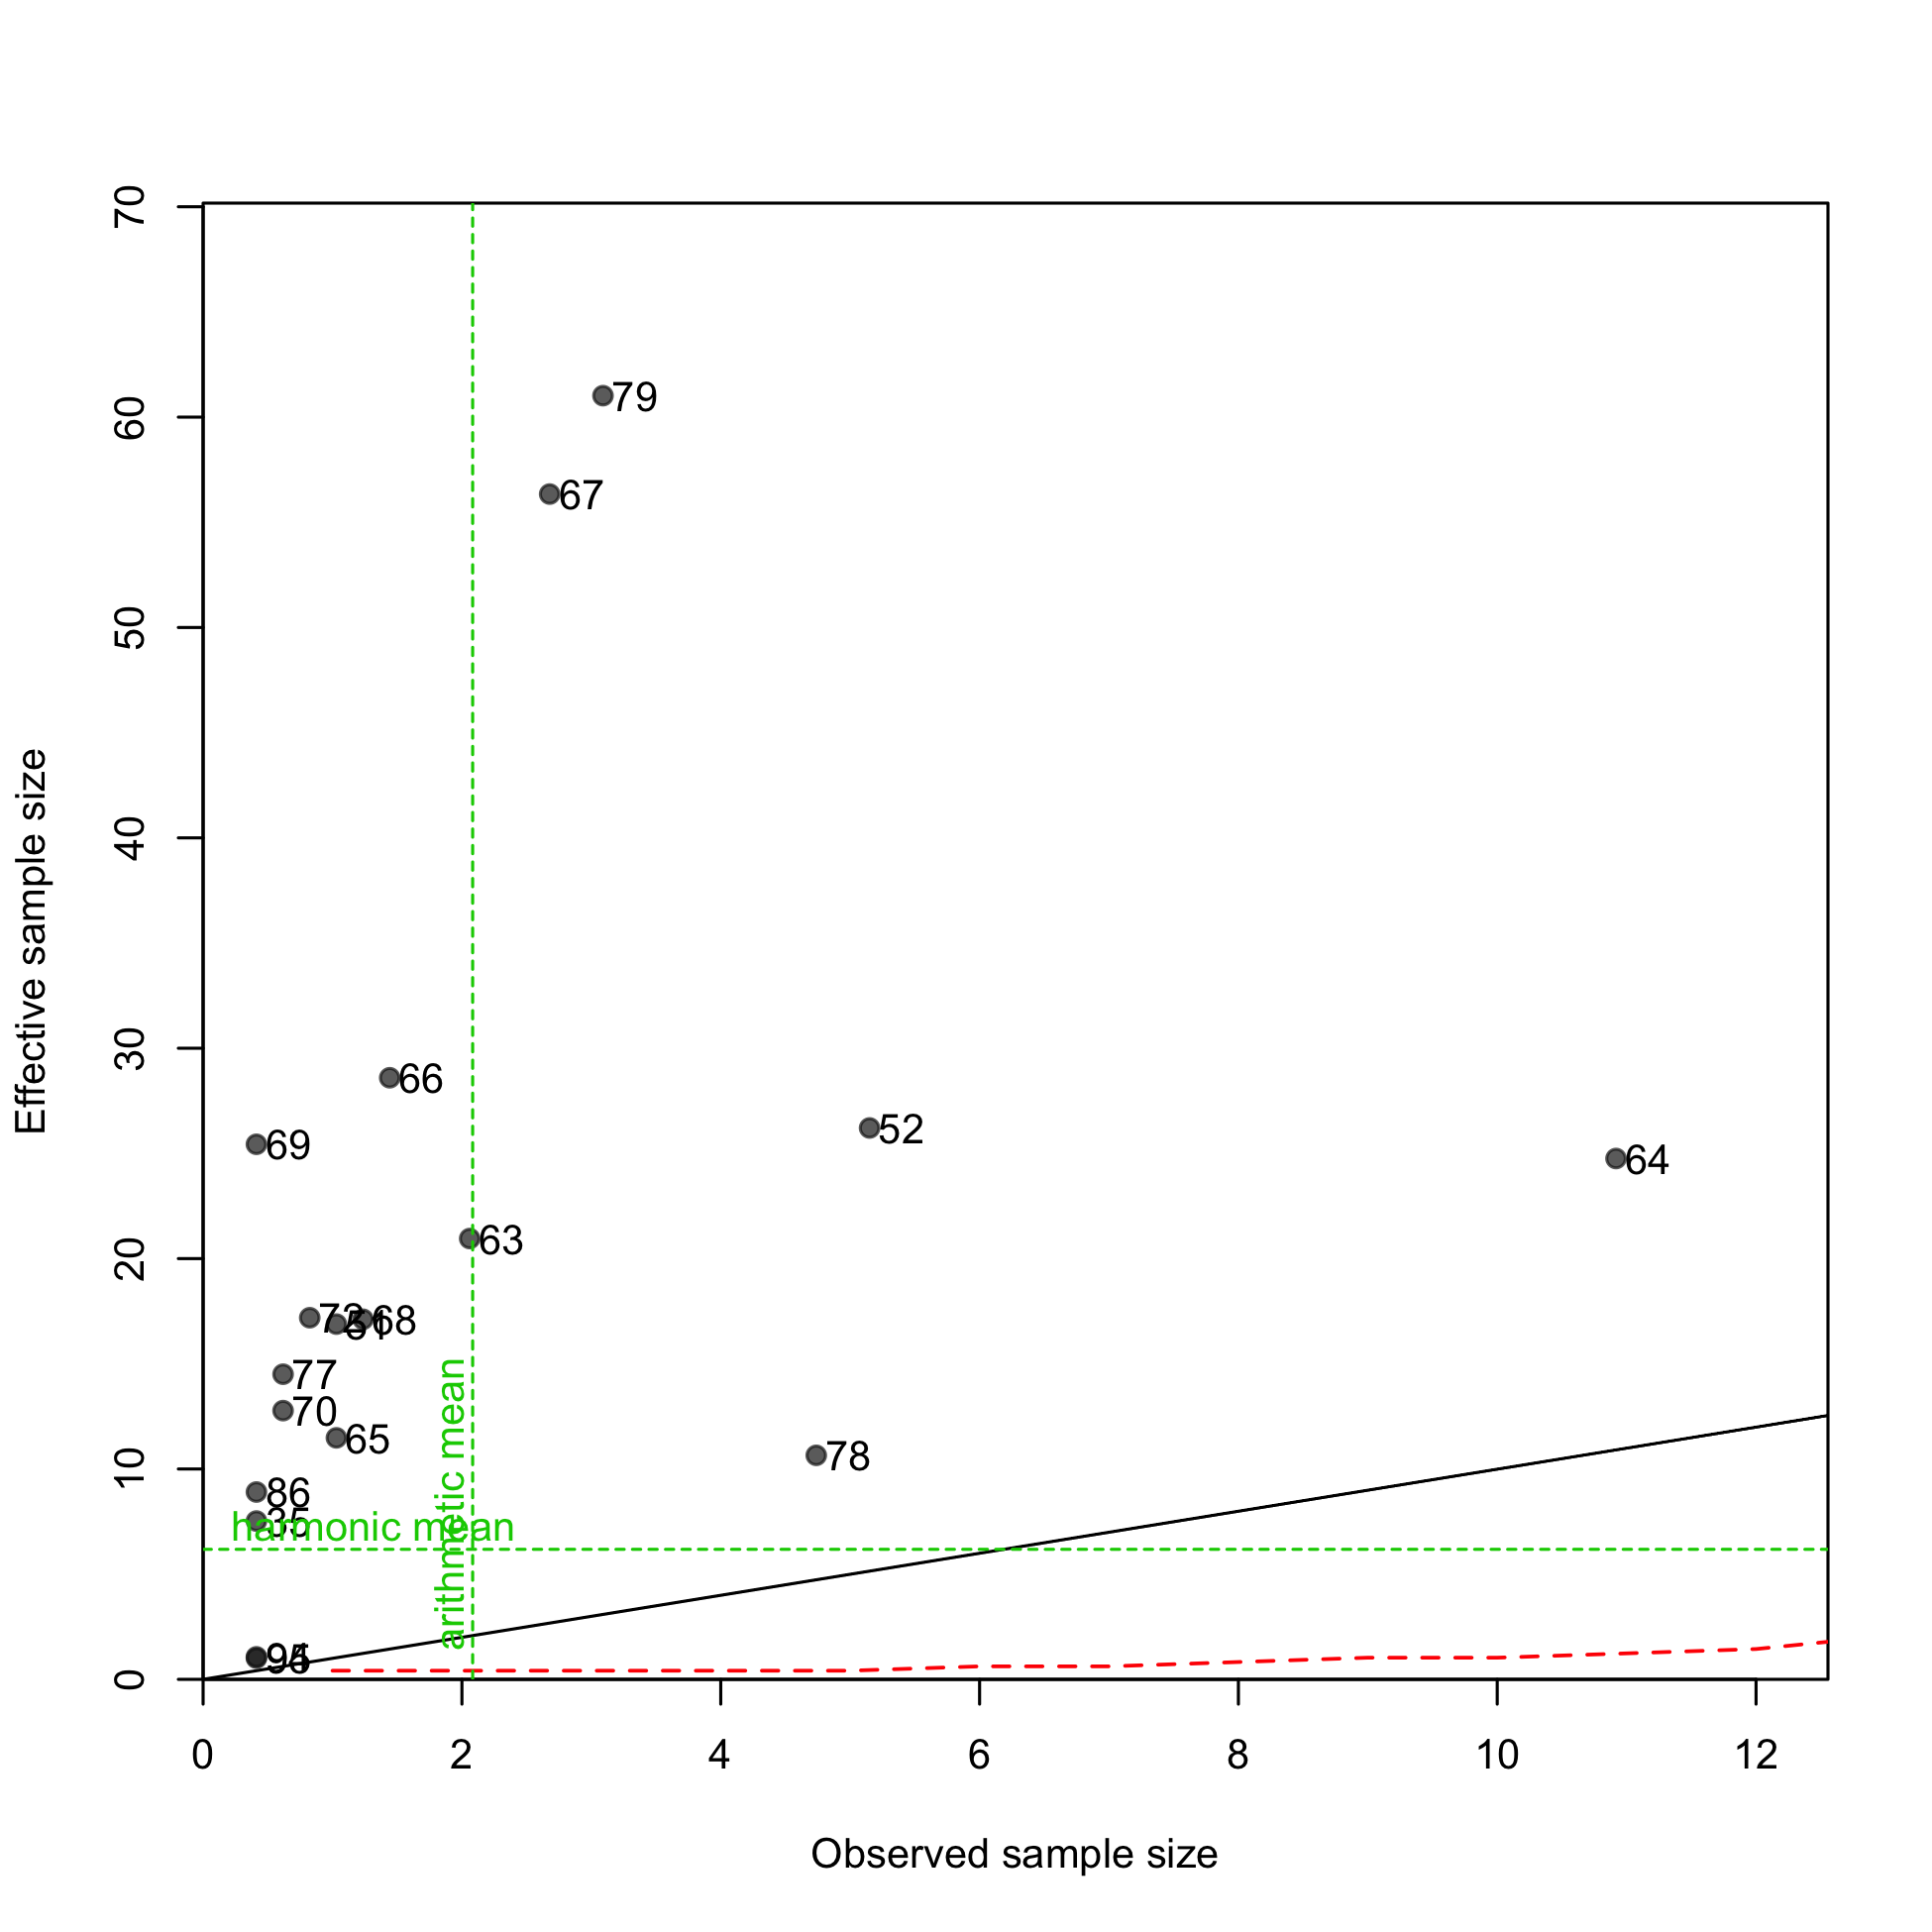
N-EffN comparison, Length comps, retained, F8-NOA-Offshore_Small
file: comp_lenfit_sampsize_flt8mkt2.png
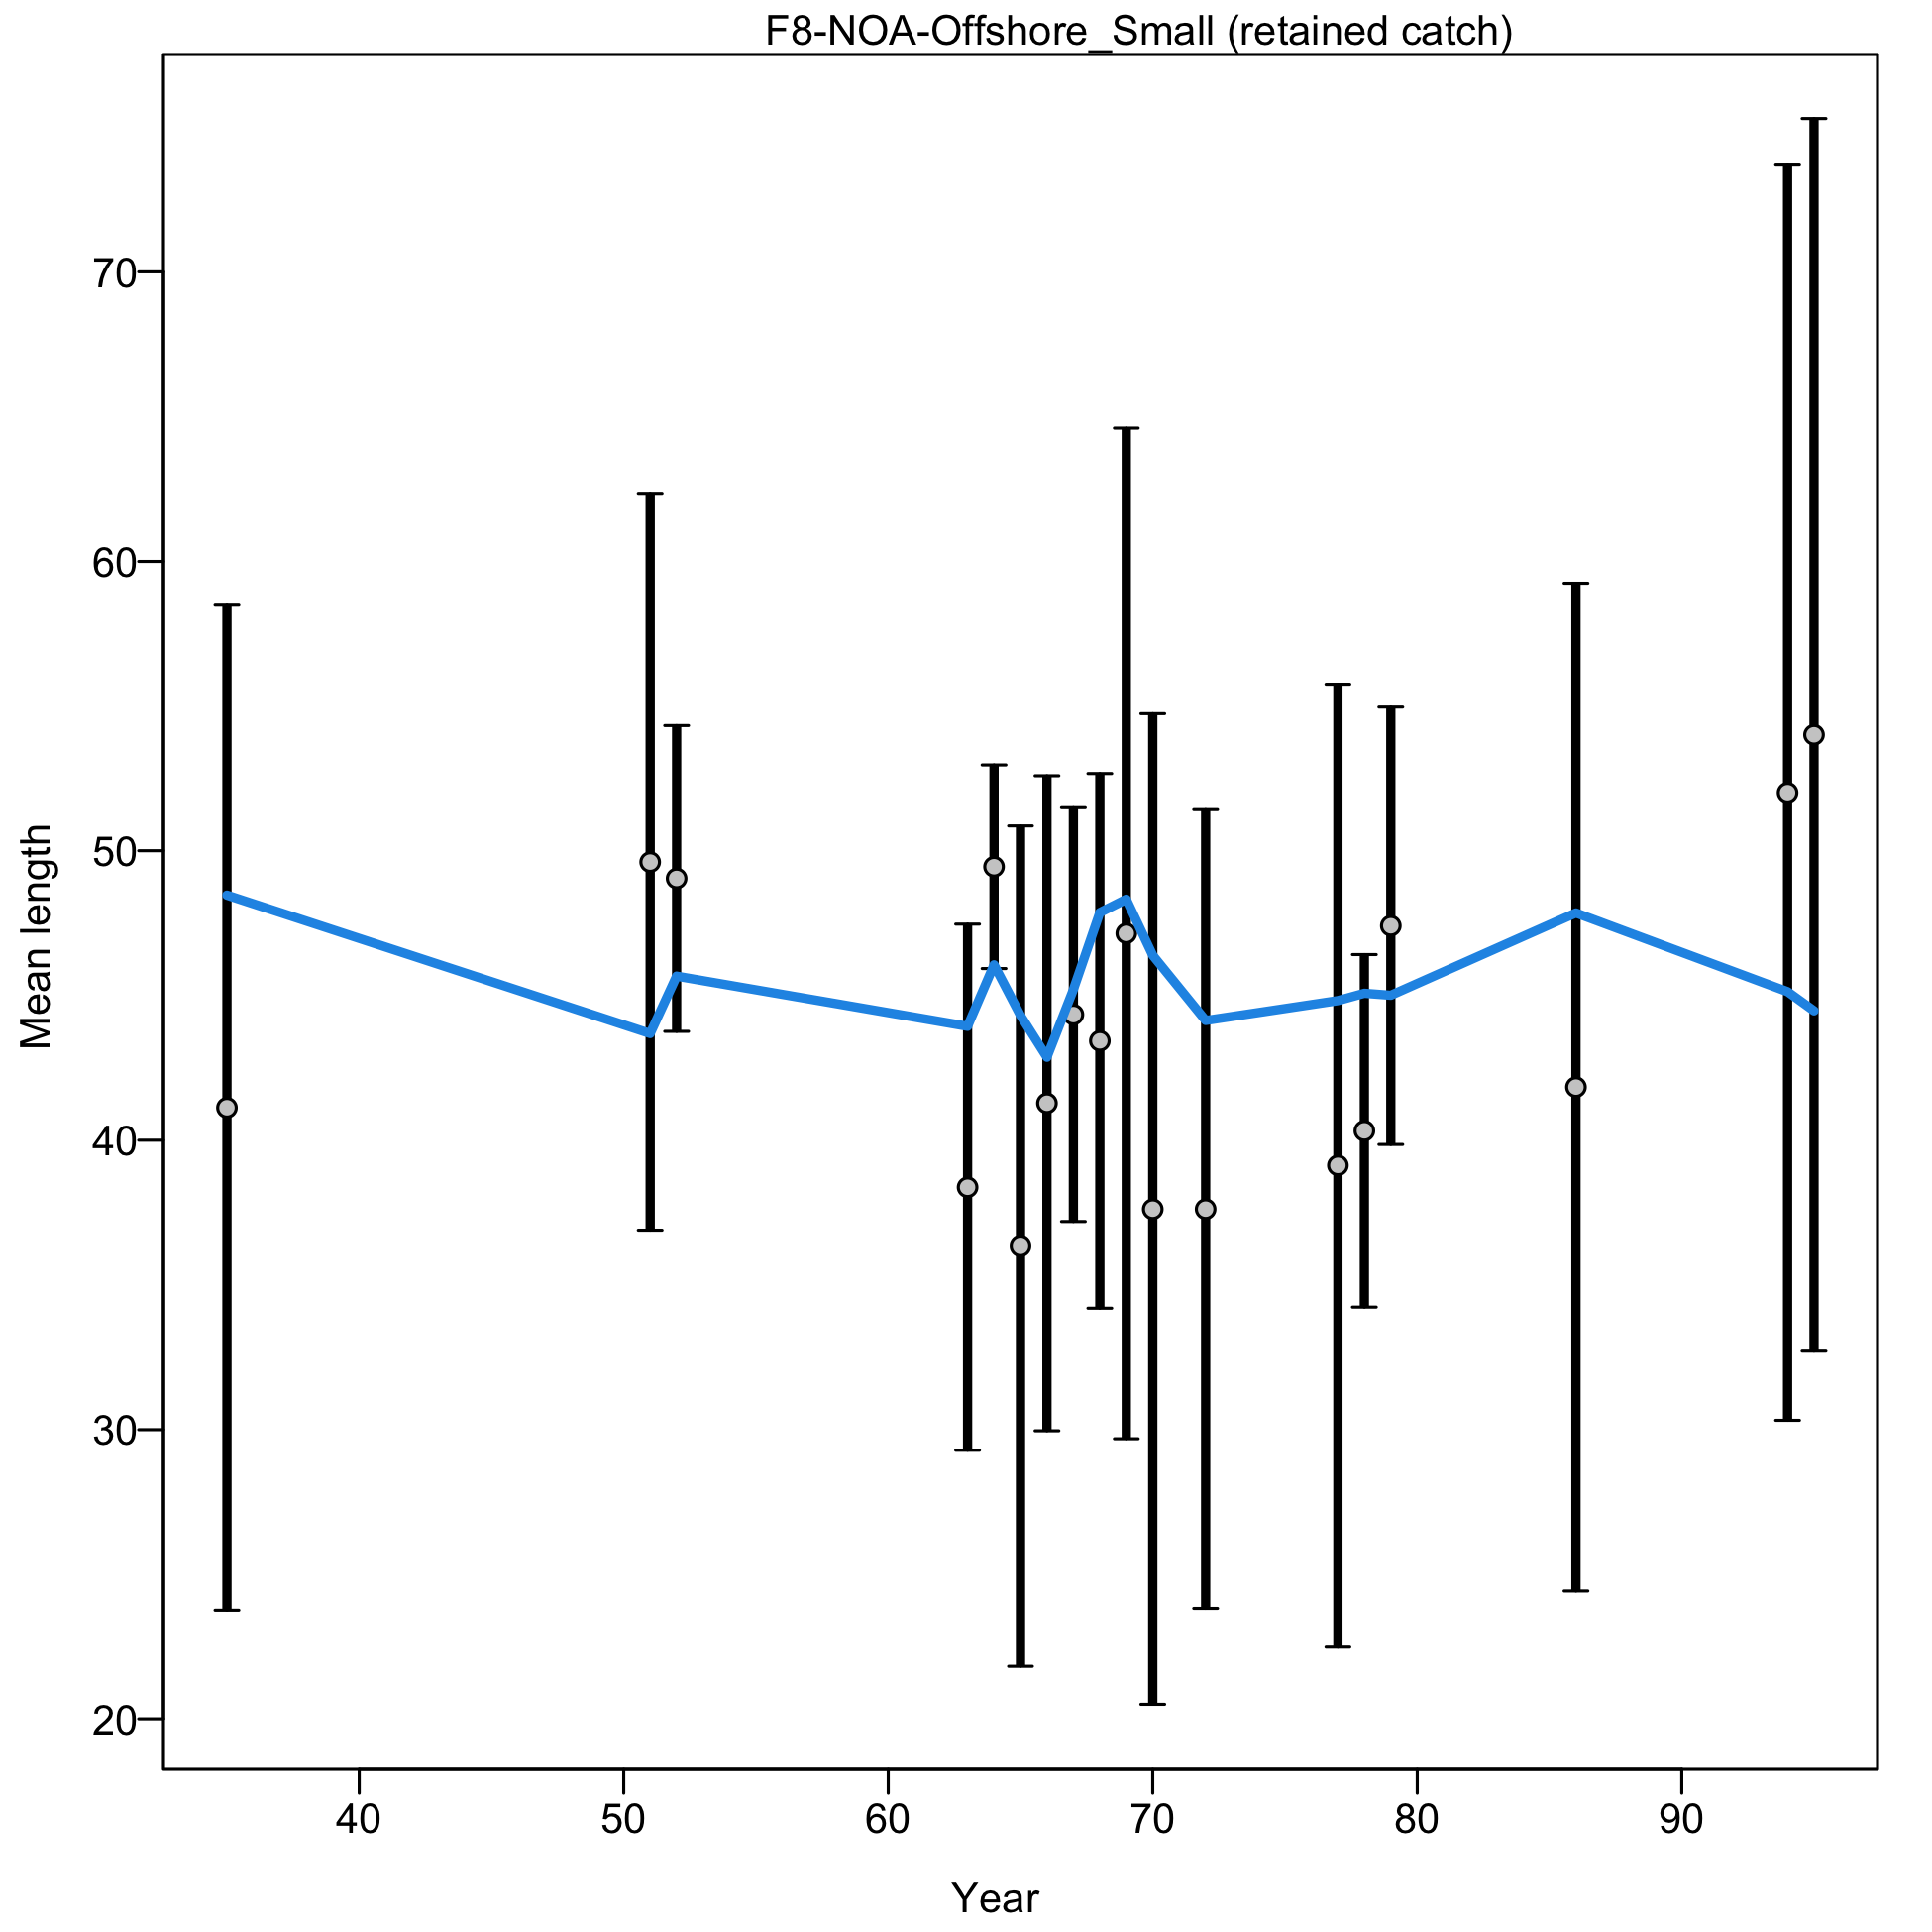
Mean length for F8-NOA-Offshore_Small with 95% confidence intervals based on current sample sizes.
Francis data weighting method TA1.8: thinner intervals (with capped ends) show result of further adjusting sample sizes based on suggested multiplier (with 95% interval) for len data from F8-NOA-Offshore_Small:
1.0018 (0.6647-2.1786)
For more info, see Francis (2011).
file: comp_lenfit_data_weighting_TA1.8_F8-NOA-Offshore_Small.png
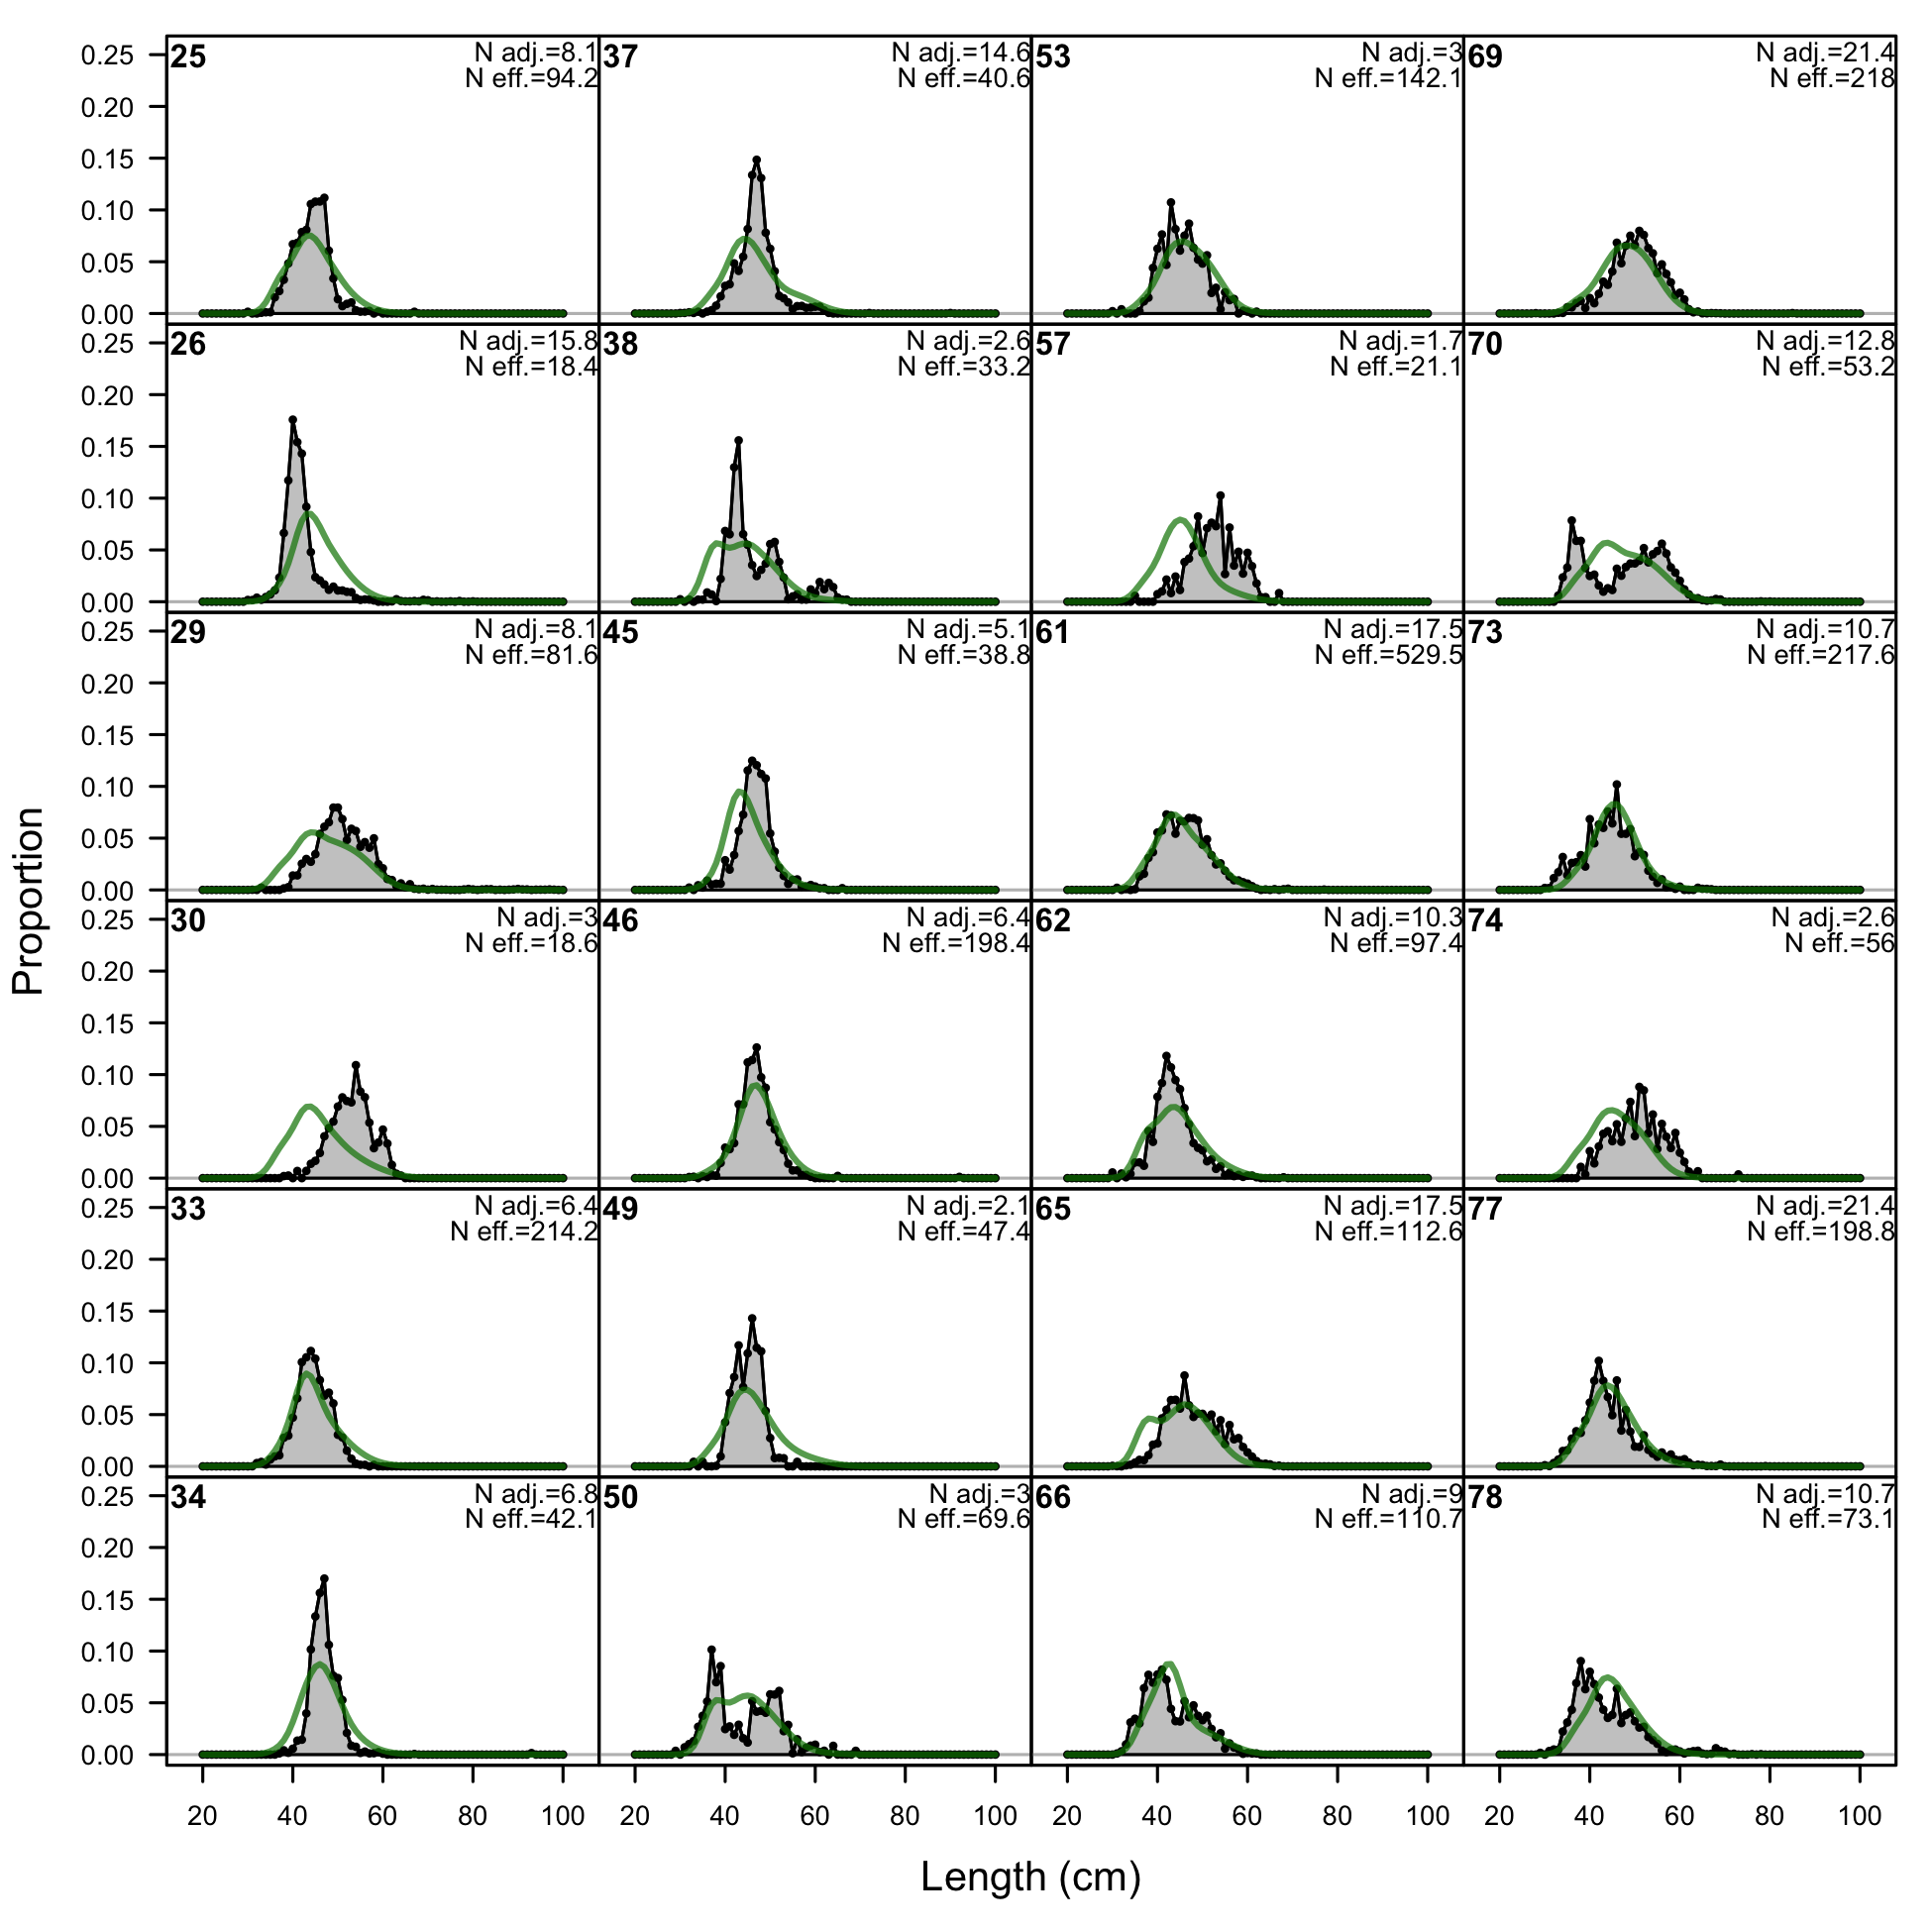
Length comps, retained, F9-NOA-Offshore_Large.
'N adj.' is the input sample size after data-weighting adjustment. N eff. is the calculated effective sample size used in the McAllister-Ianelli tuning method.
file: comp_lenfit_flt9mkt2.png
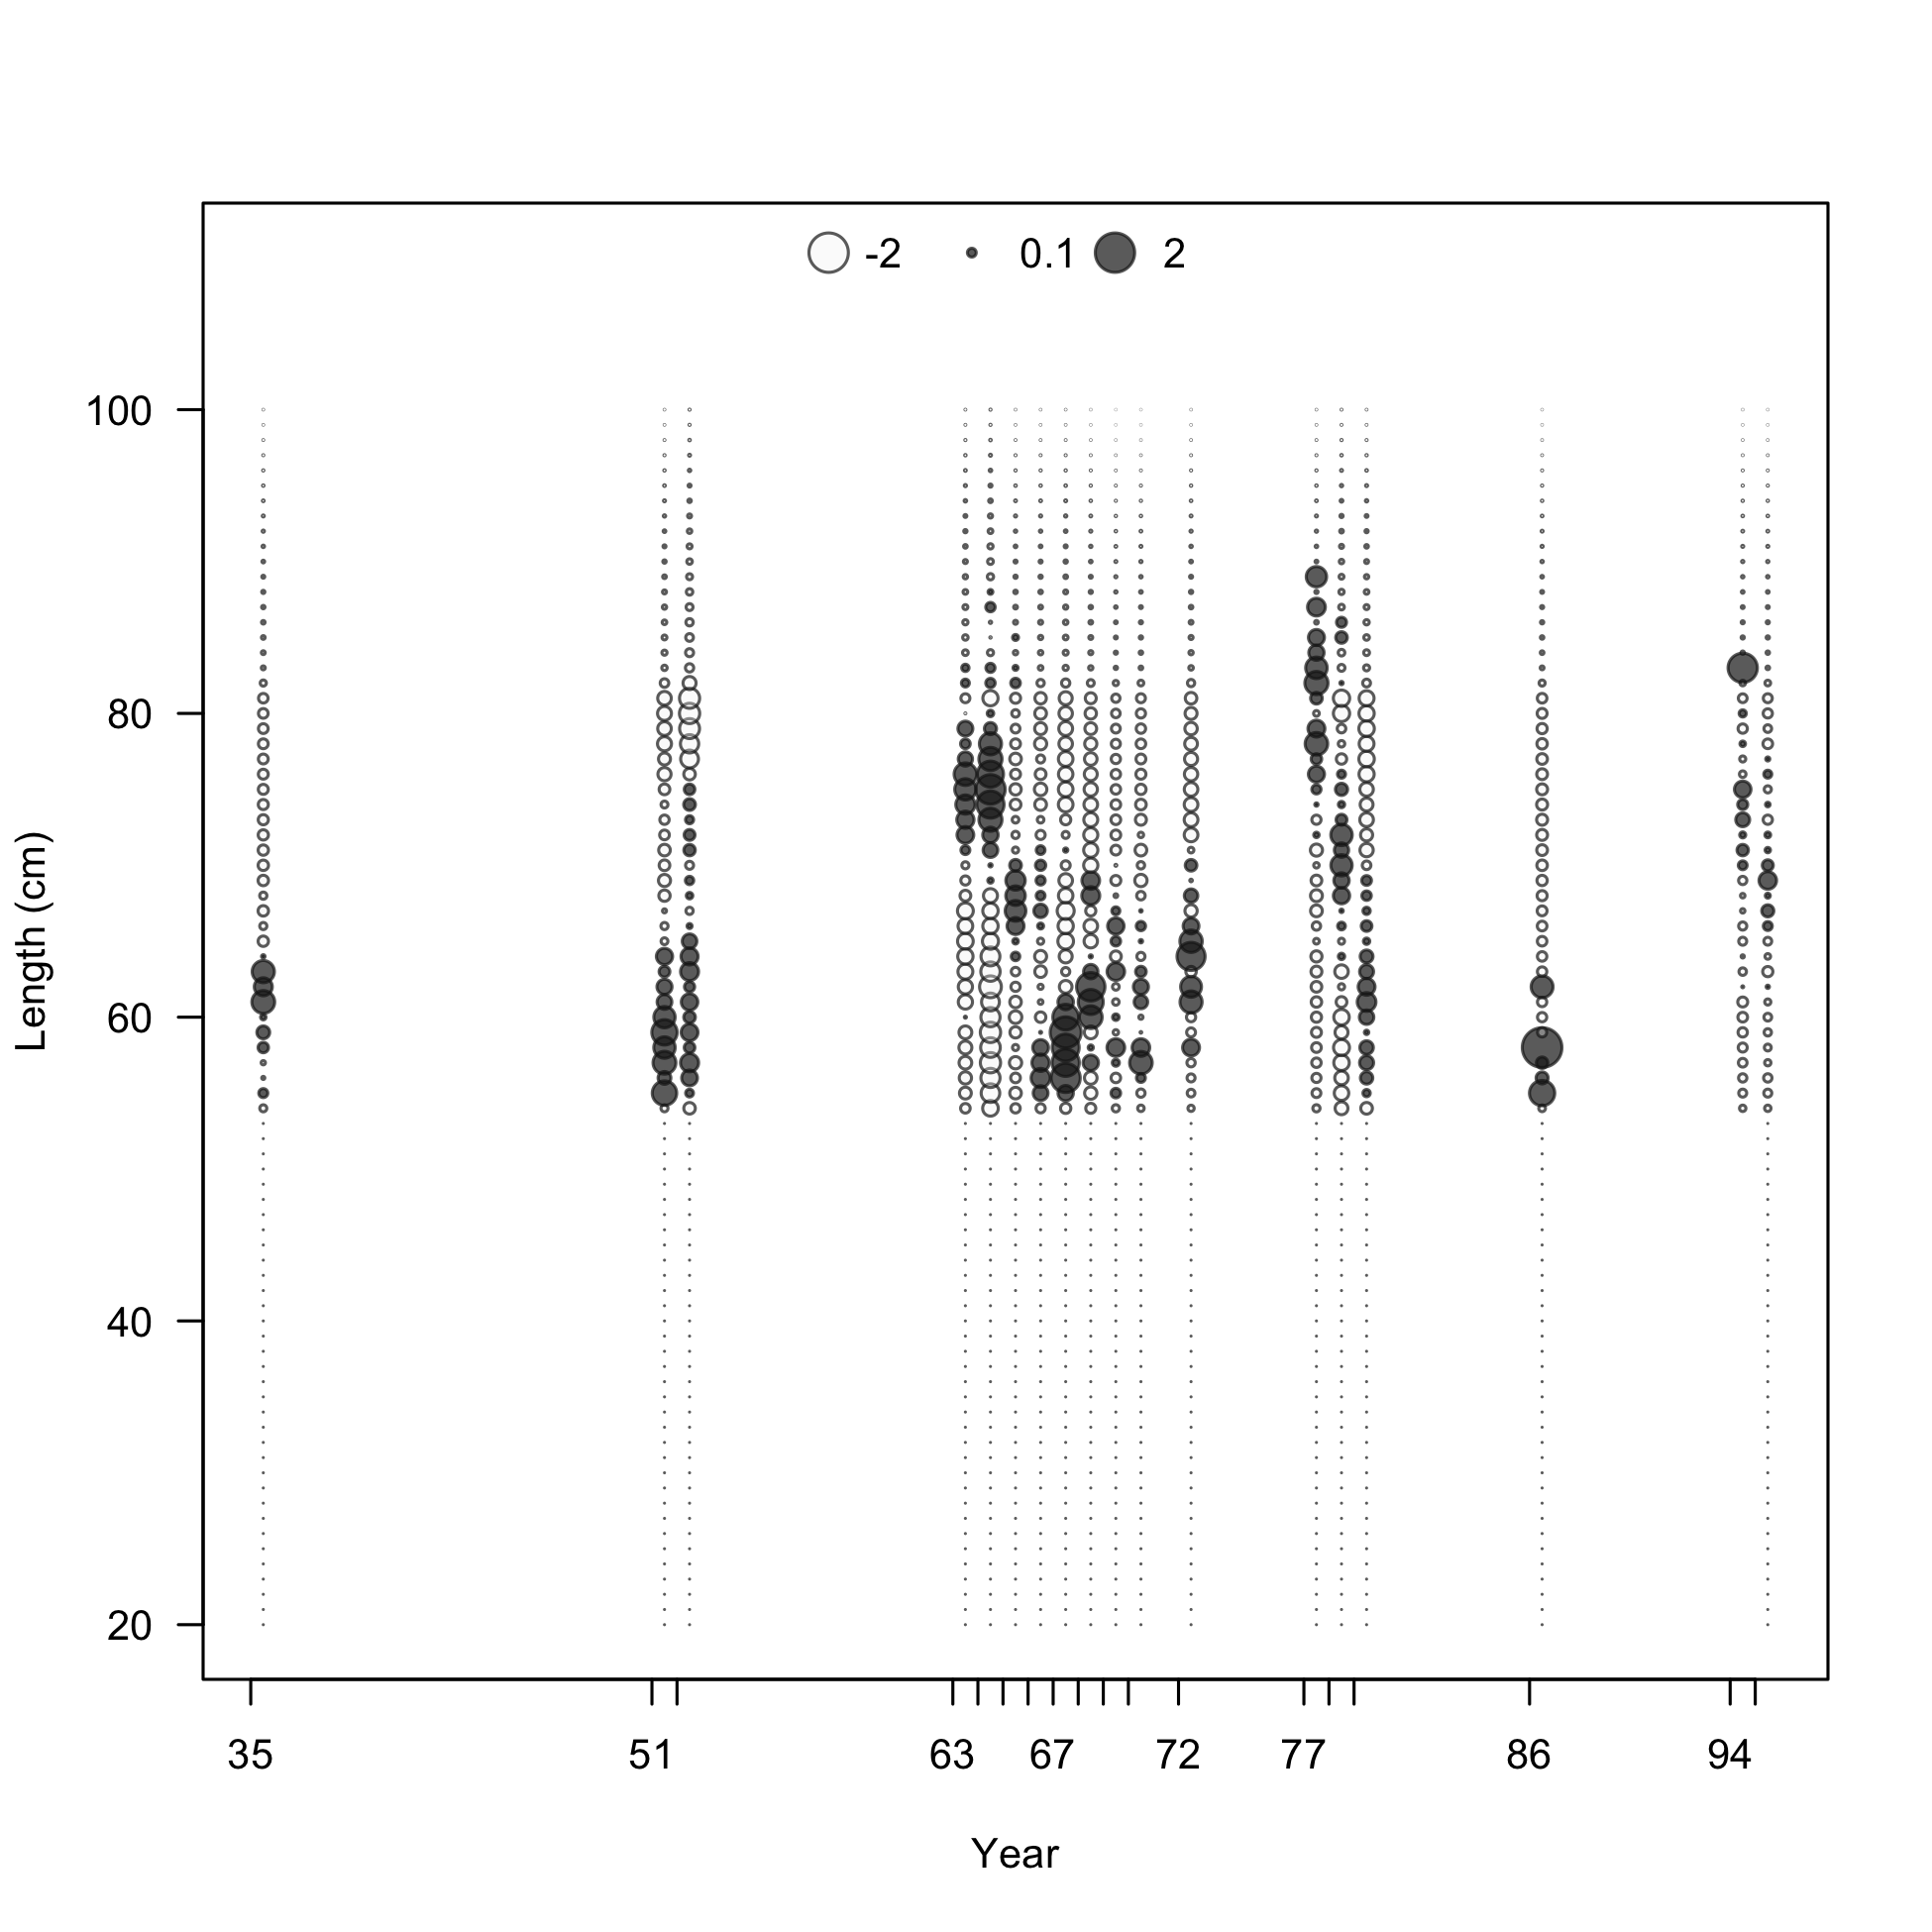
Pearson residuals, retained, F9-NOA-Offshore_Large (max=2.03)
Closed bubbles are positive residuals (observed > expected) and open bubbles are negative residuals (observed < expected).
file: comp_lenfit_residsflt9mkt2.png
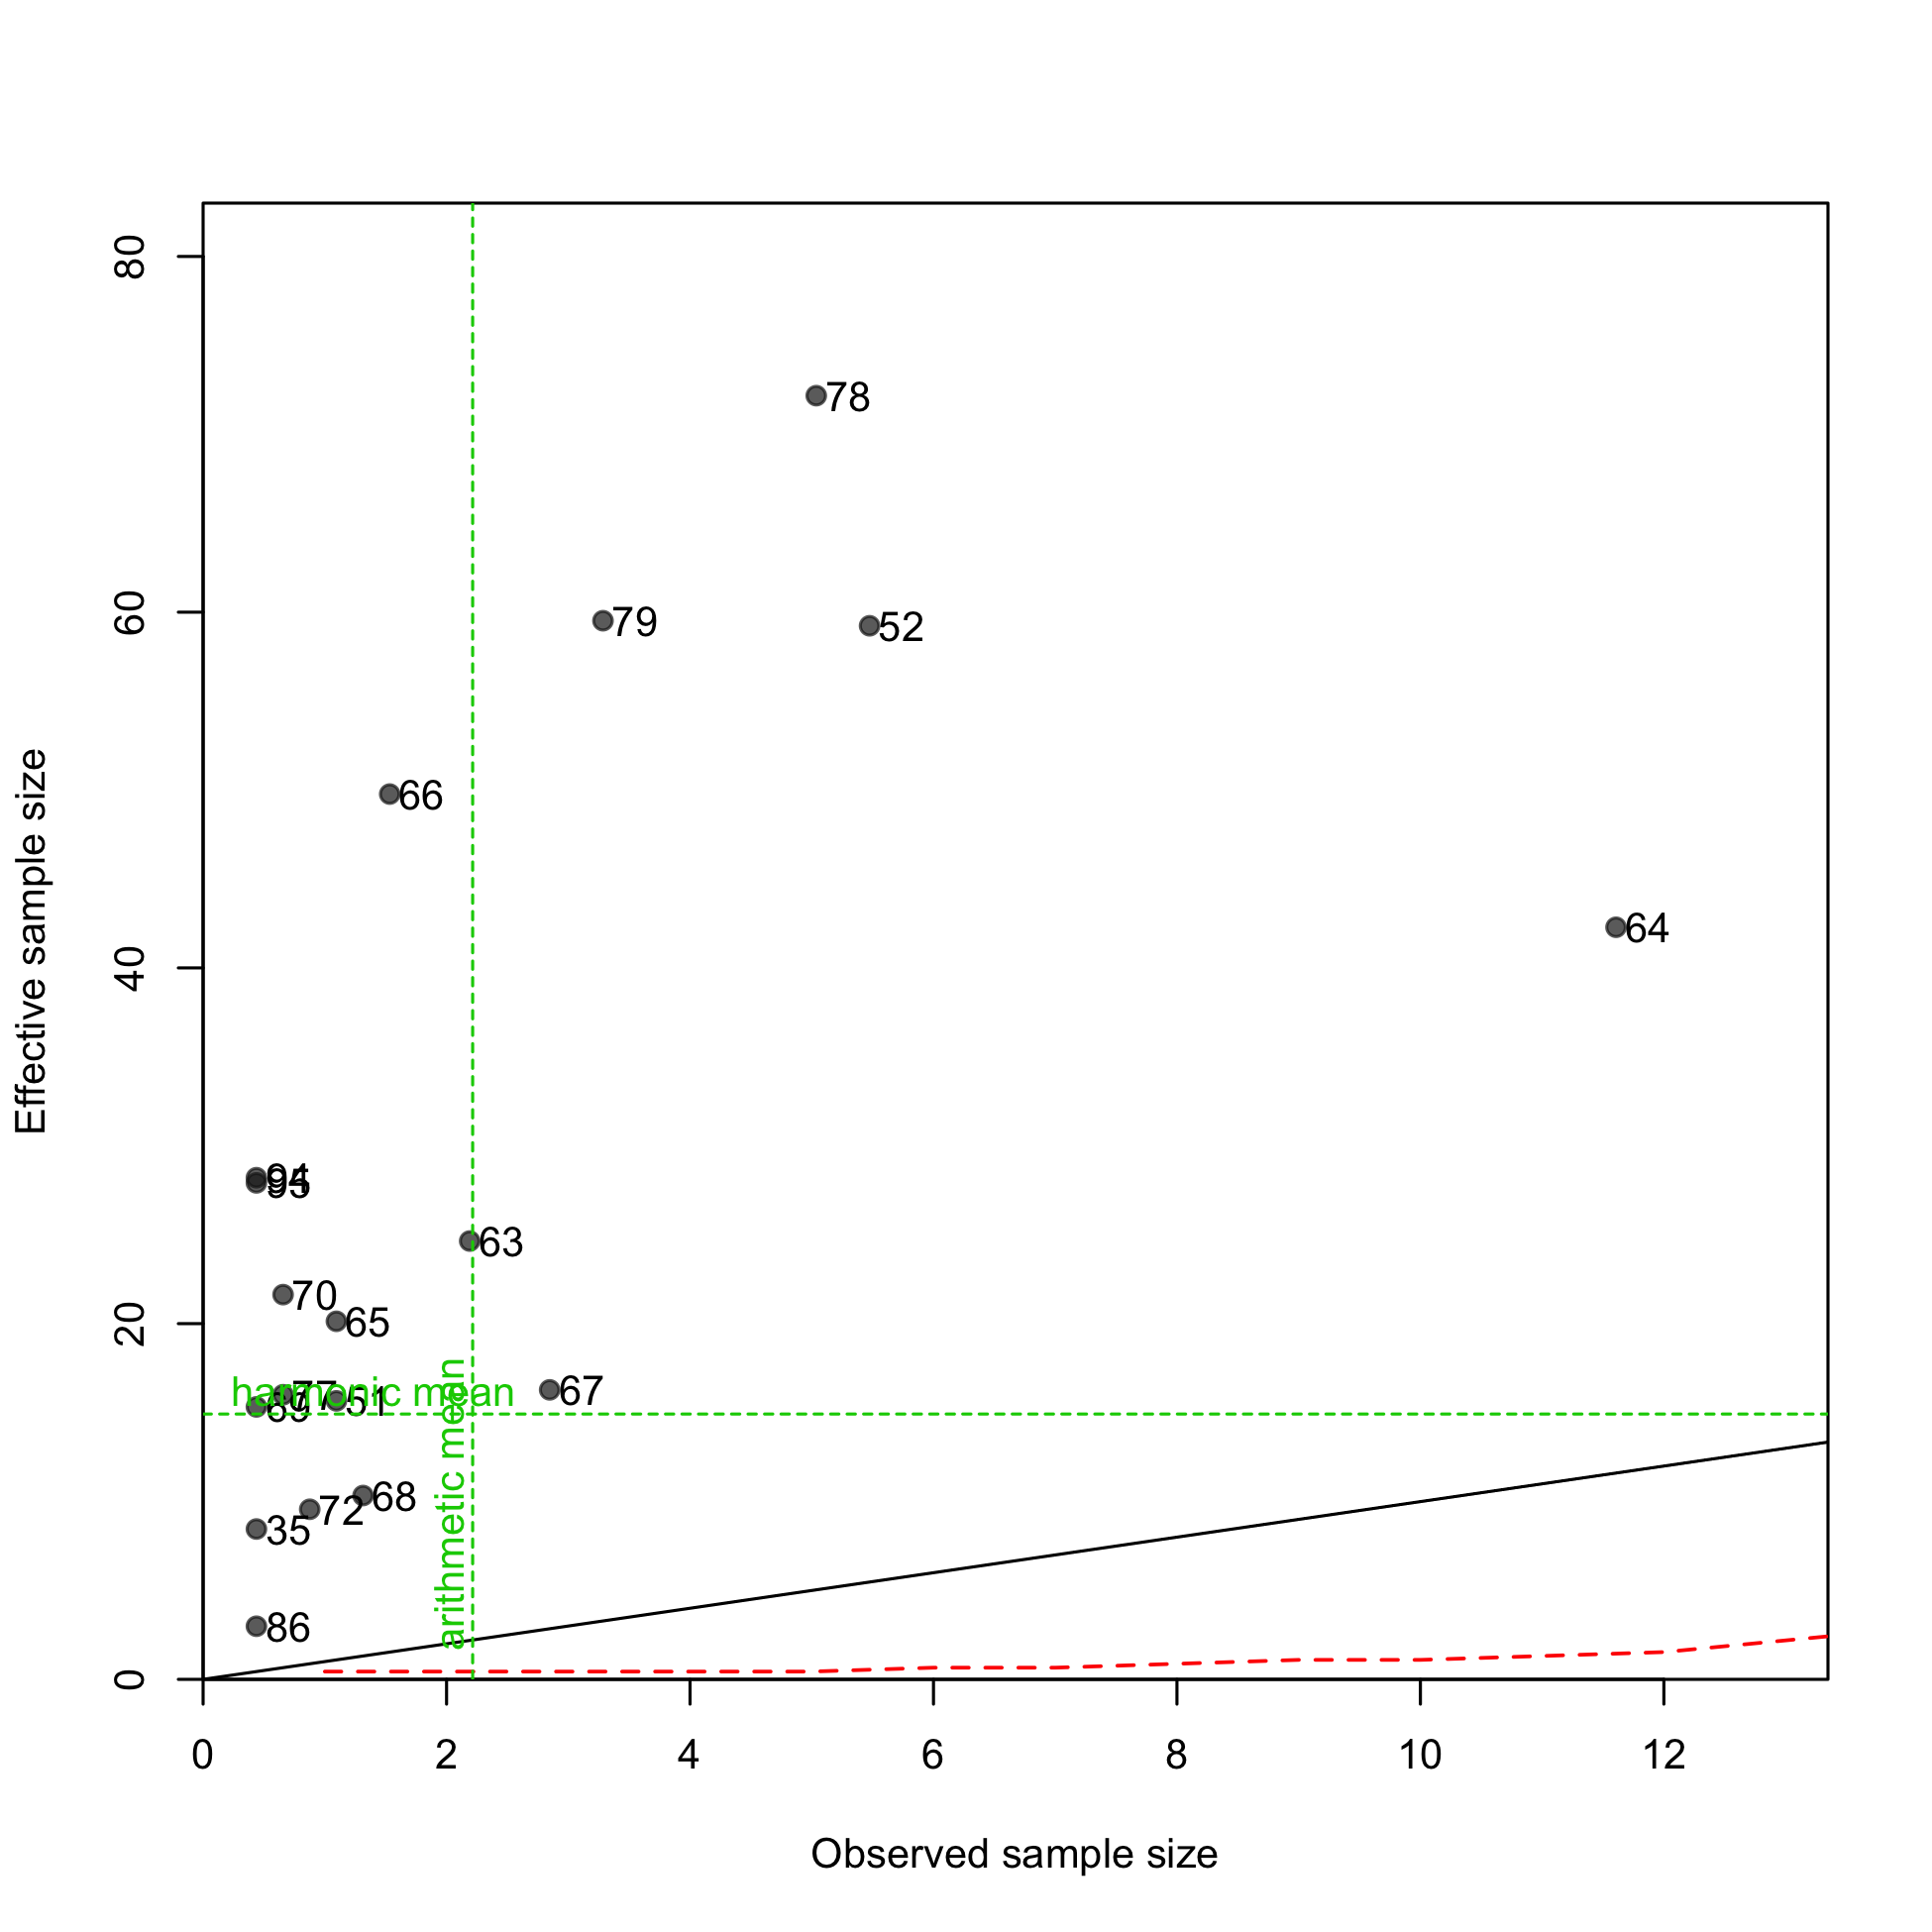
N-EffN comparison, Length comps, retained, F9-NOA-Offshore_Large
file: comp_lenfit_sampsize_flt9mkt2.png
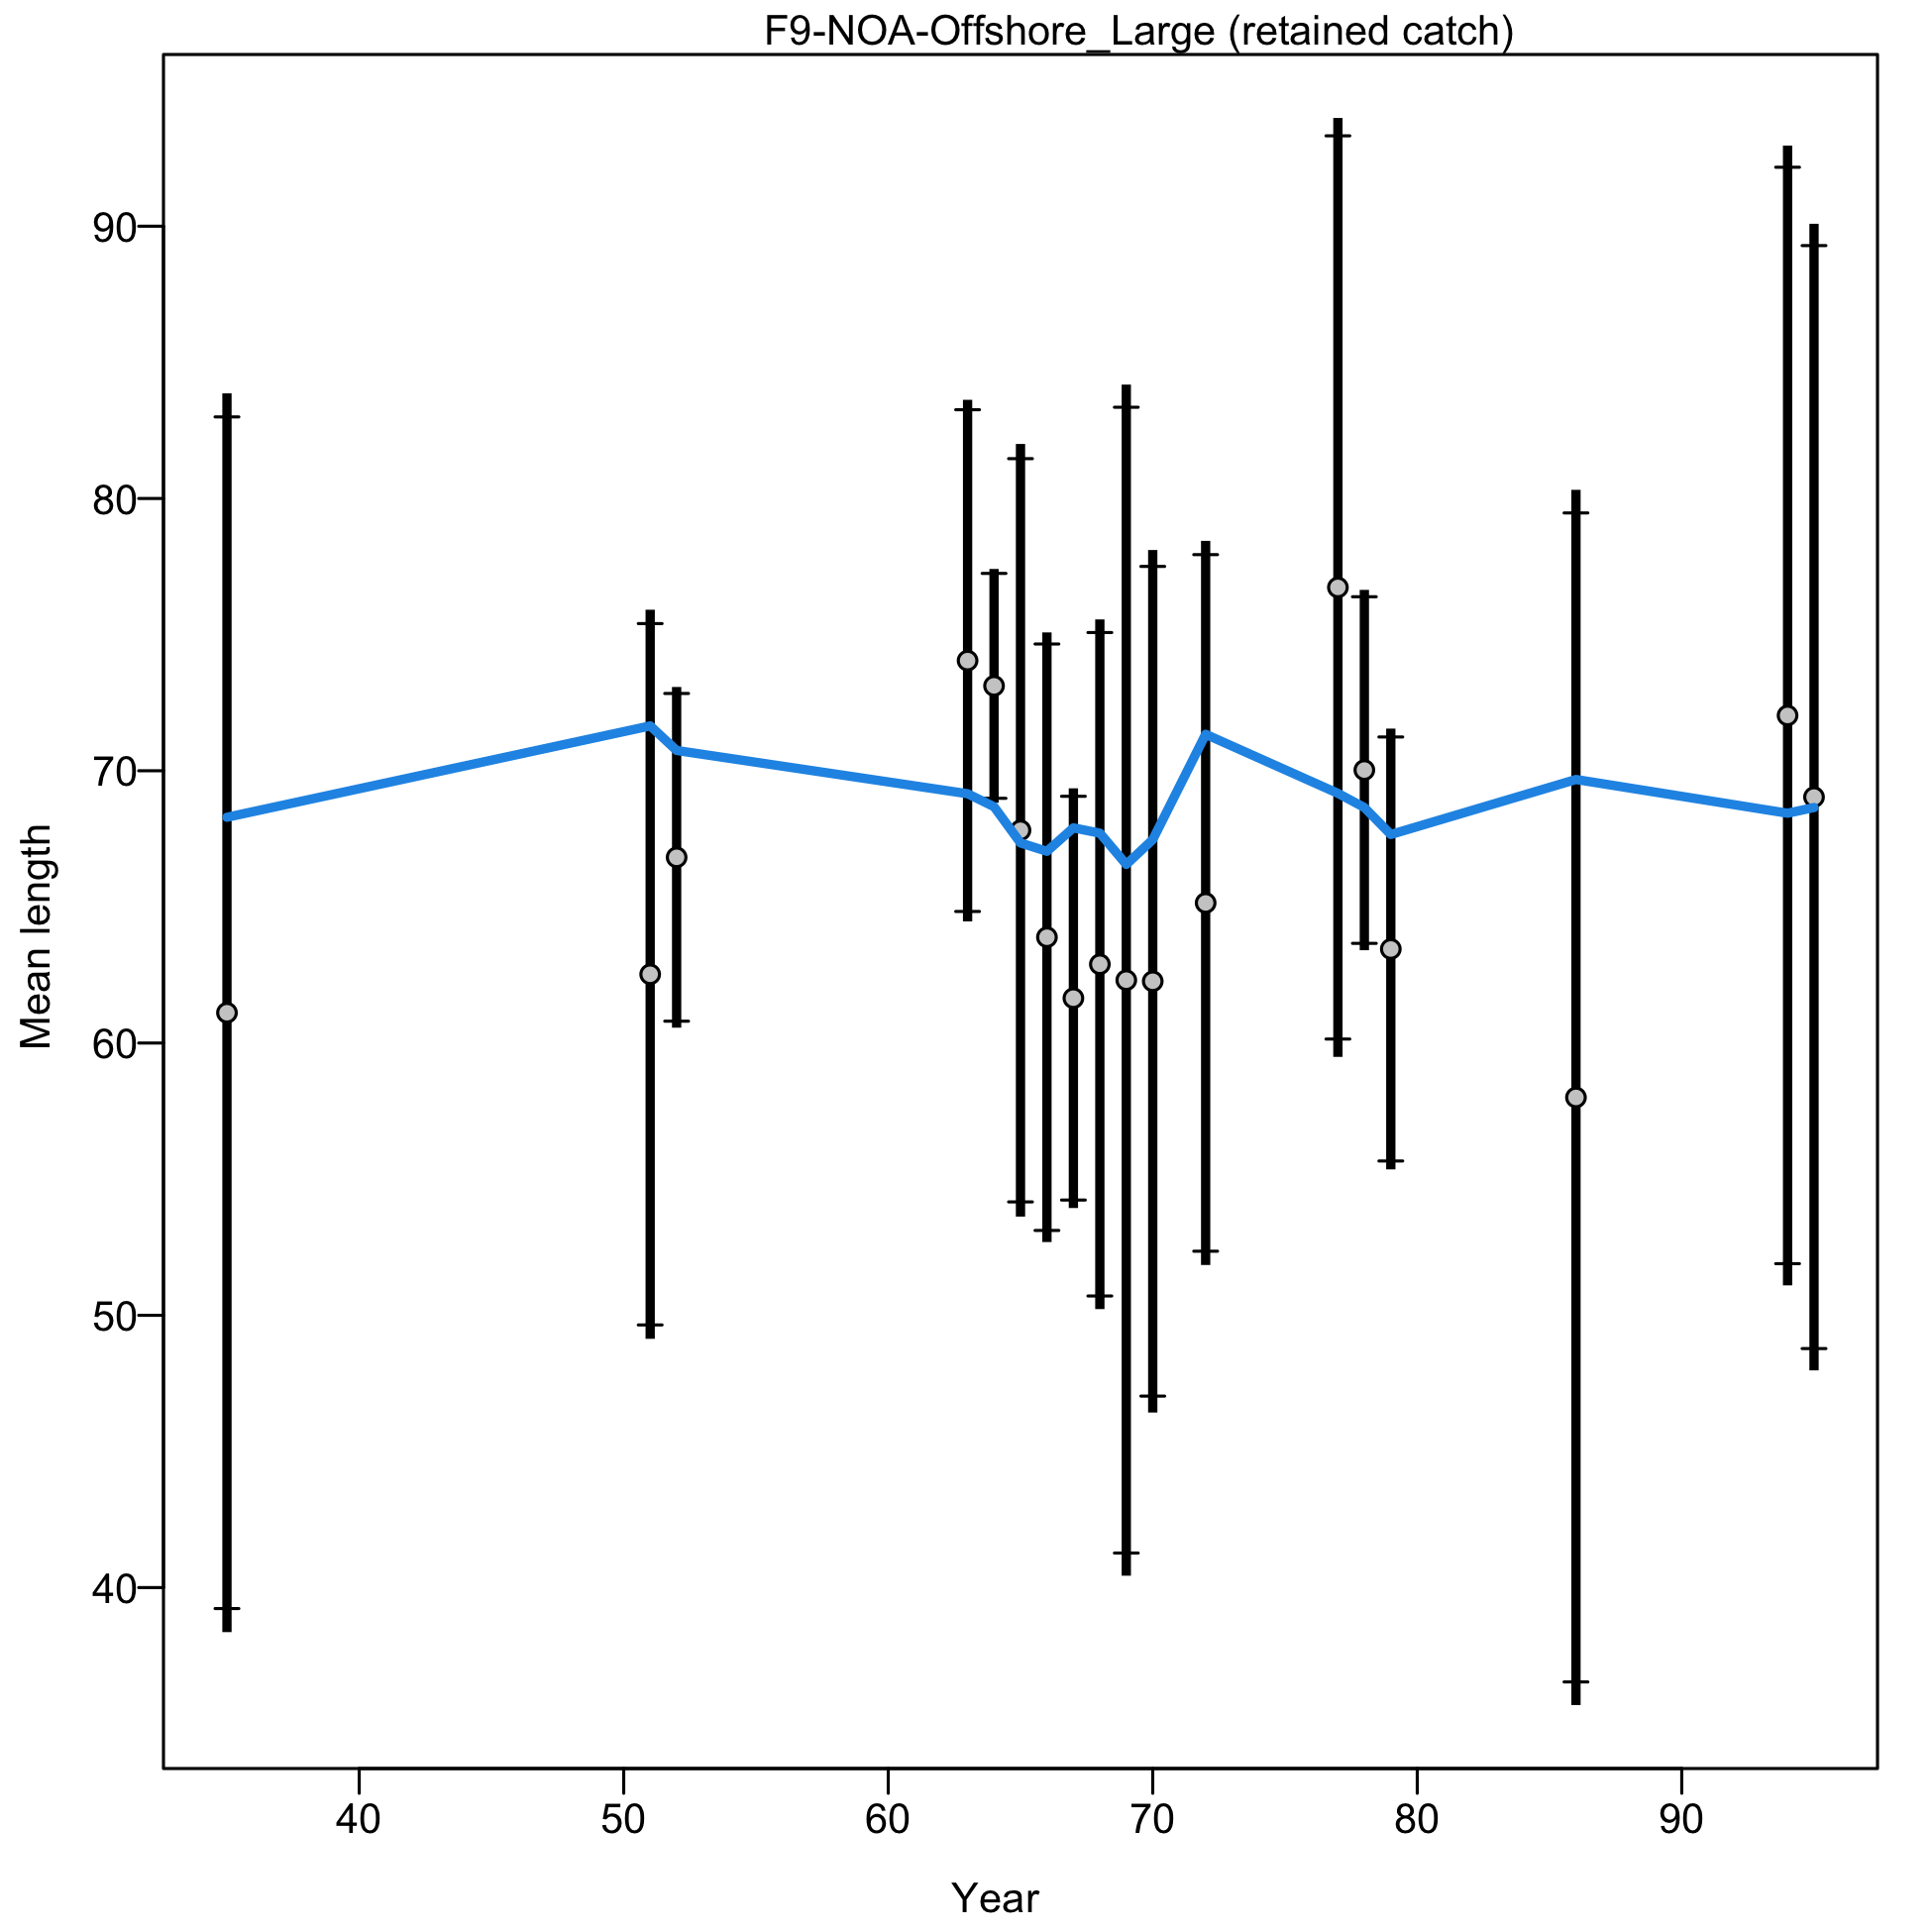
Mean length for F9-NOA-Offshore_Large with 95% confidence intervals based on current sample sizes.
Francis data weighting method TA1.8: thinner intervals (with capped ends) show result of further adjusting sample sizes based on suggested multiplier (with 95% interval) for len data from F9-NOA-Offshore_Large:
1.0806 (0.6716-2.5889)
For more info, see Francis (2011).
file: comp_lenfit_data_weighting_TA1.8_F9-NOA-Offshore_Large.png
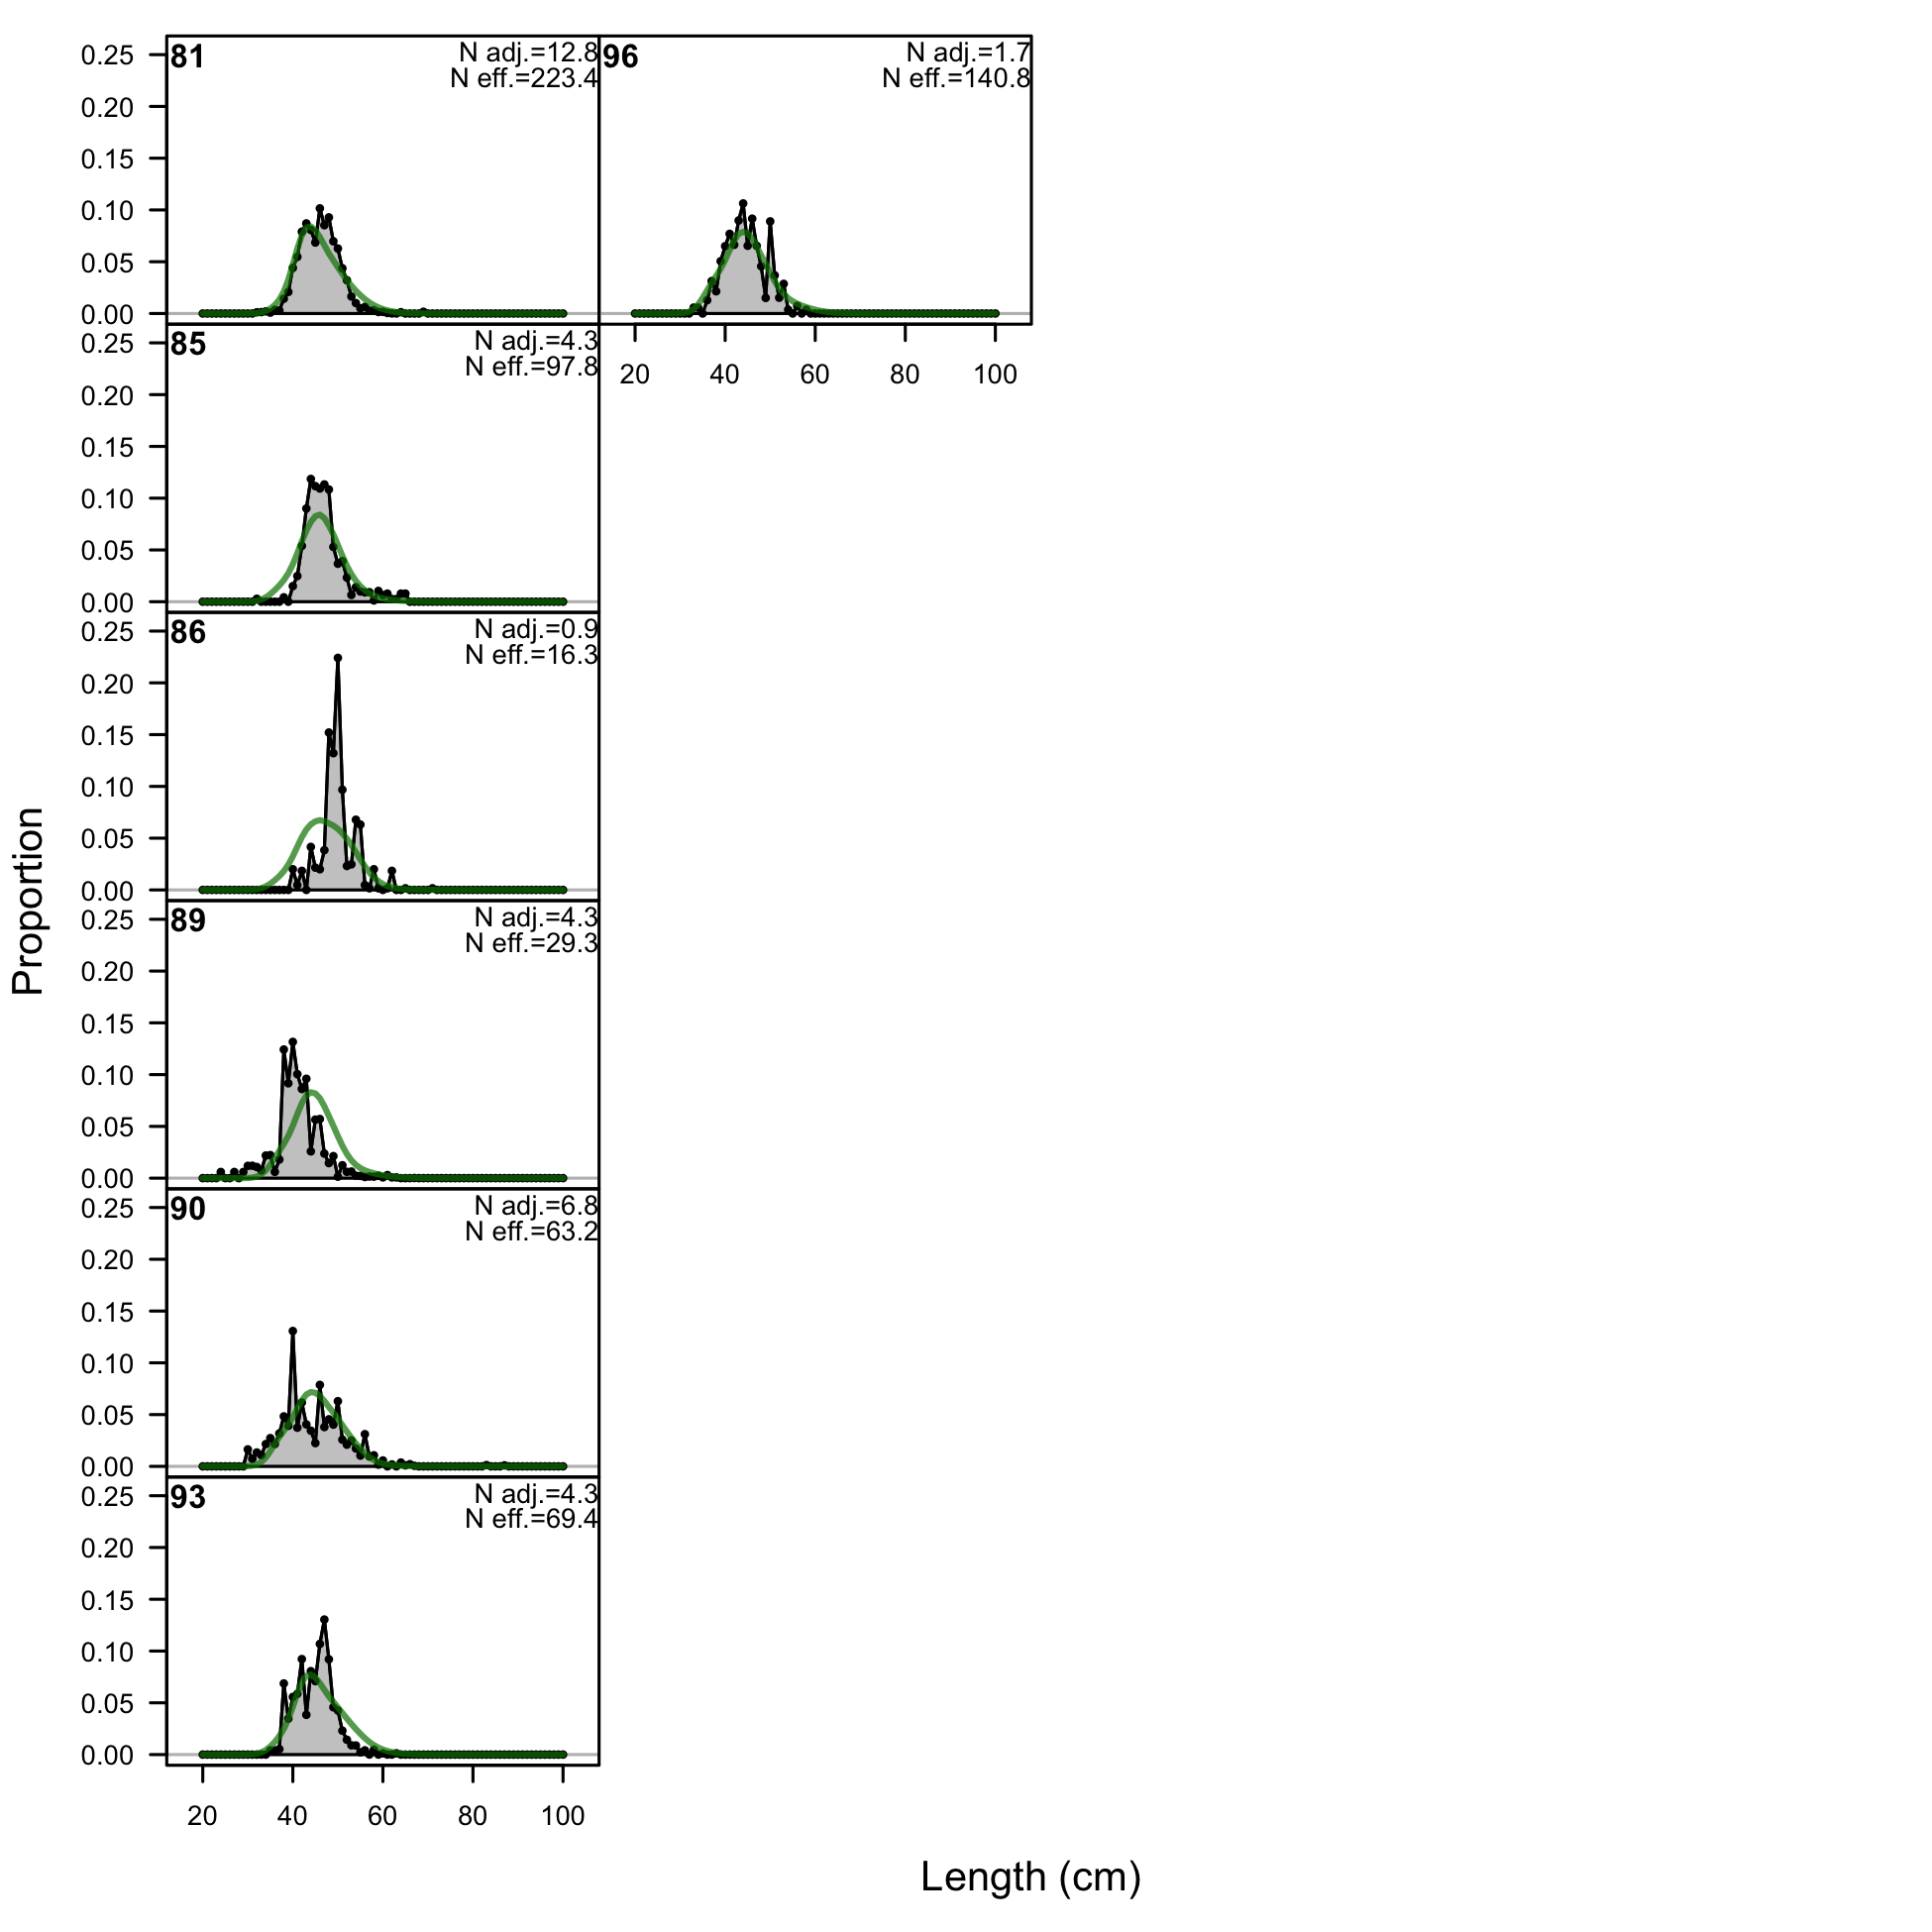
Length comps, whole catch, F10-NOA-S (plot 1 of 2).
'N adj.' is the input sample size after data-weighting adjustment. N eff. is the calculated effective sample size used in the McAllister-Ianelli tuning method.
file: comp_lenfit_flt10mkt0_page1.png
Length comps, whole catch, F10-NOA-S (plot 1 of 2).
'N adj.' is the input sample size after data-weighting adjustment. N eff. is the calculated effective sample size used in the McAllister-Ianelli tuning method. (plot 2 of 2)
file: comp_lenfit_flt10mkt0_page2.png
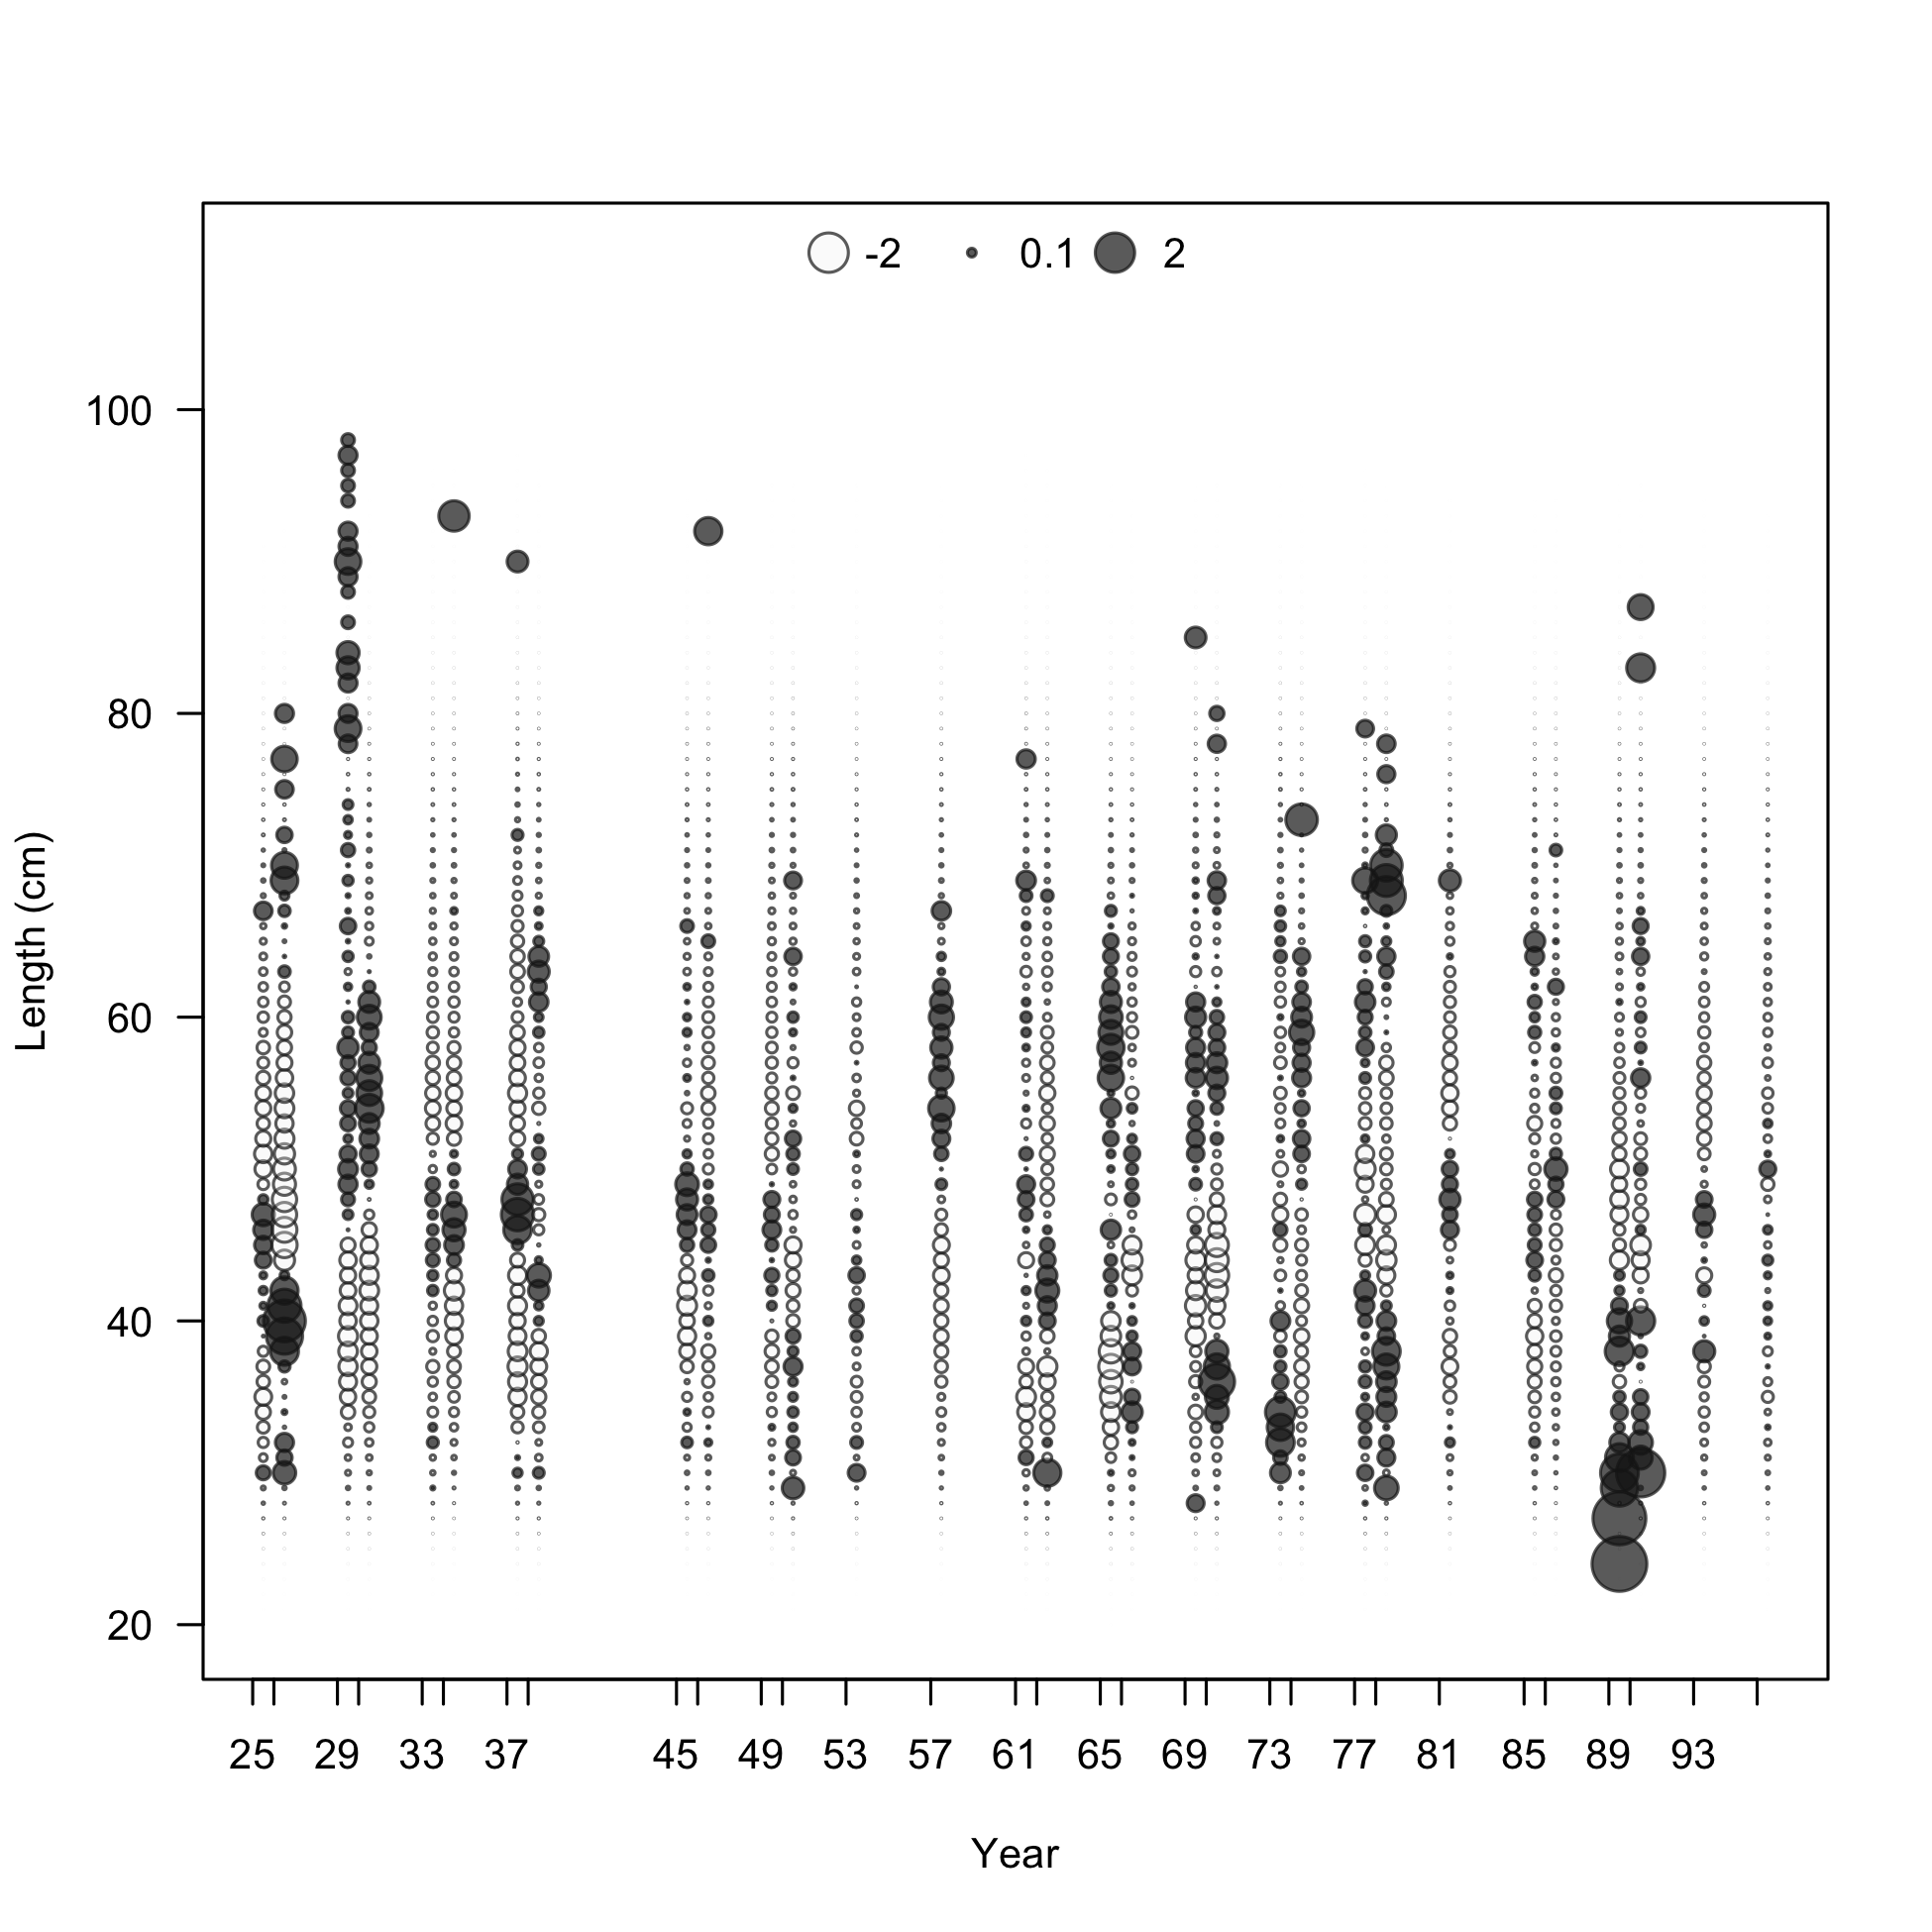
Pearson residuals, whole catch, F10-NOA-S (max=3.88) (plot 2 of 2)
Closed bubbles are positive residuals (observed > expected) and open bubbles are negative residuals (observed < expected).
file: comp_lenfit_residsflt10mkt0_page2.png
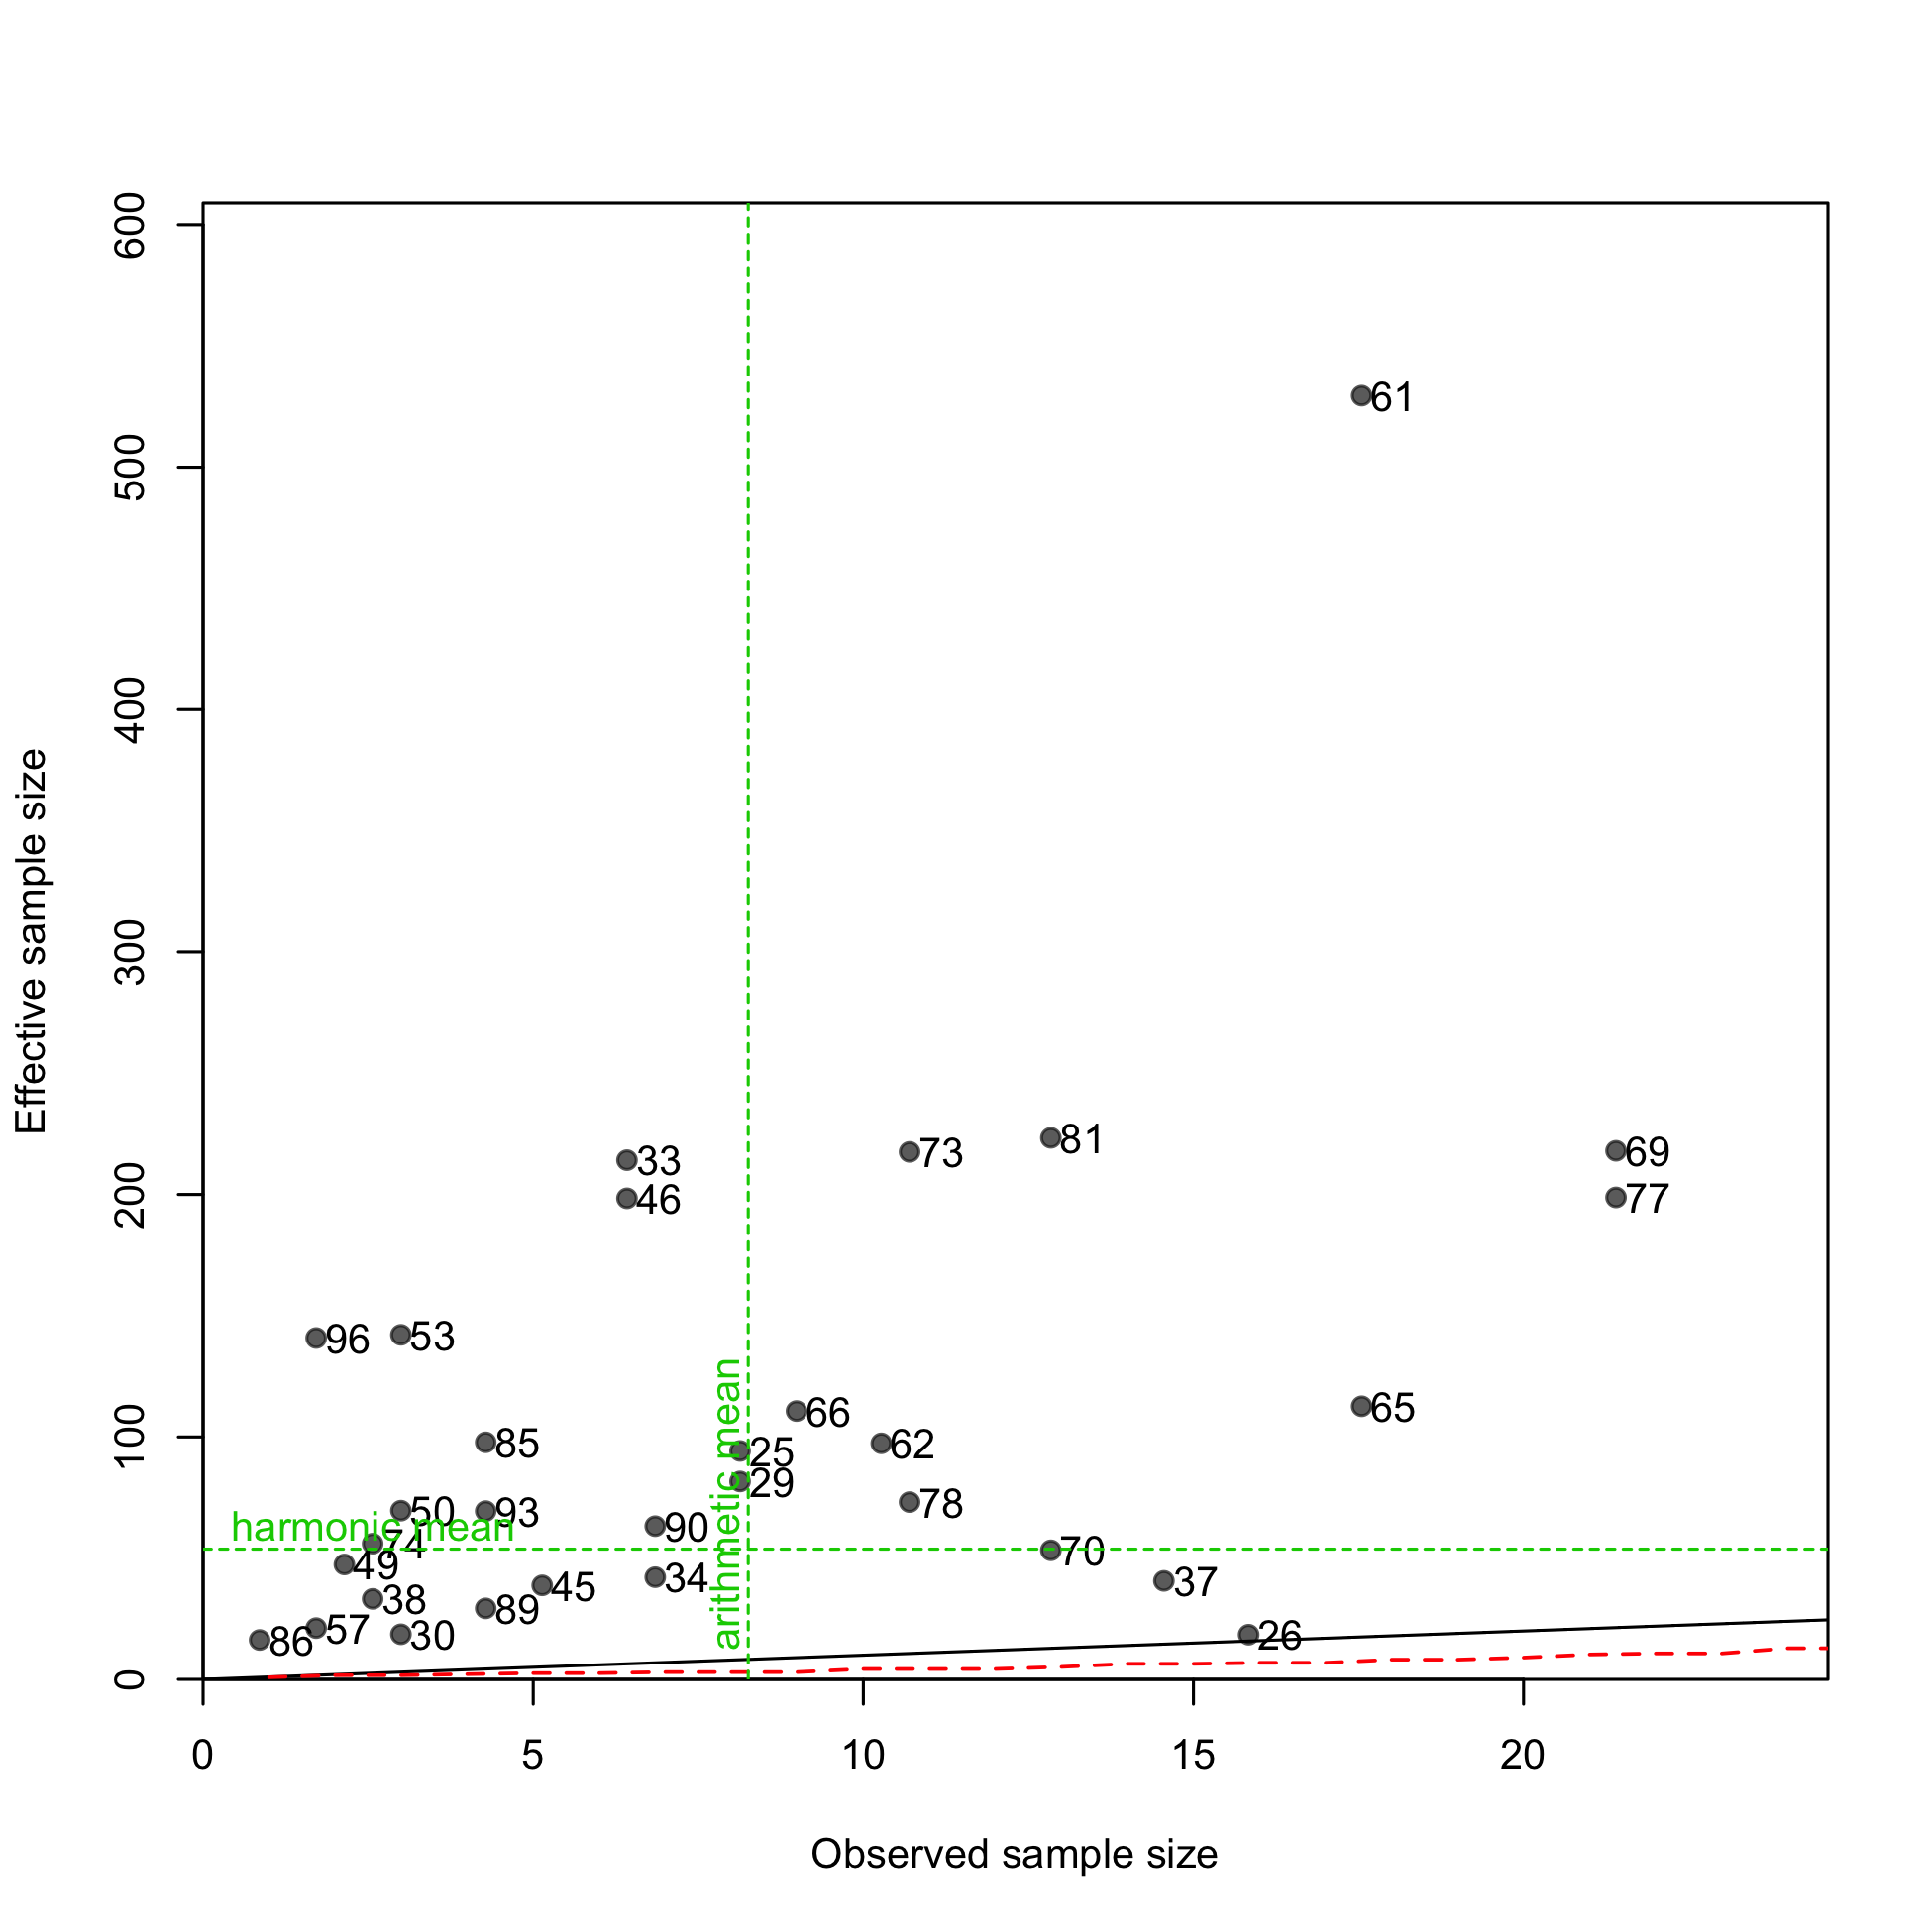
N-EffN comparison, Length comps, whole catch, F10-NOA-S
file: comp_lenfit_sampsize_flt10mkt0.png
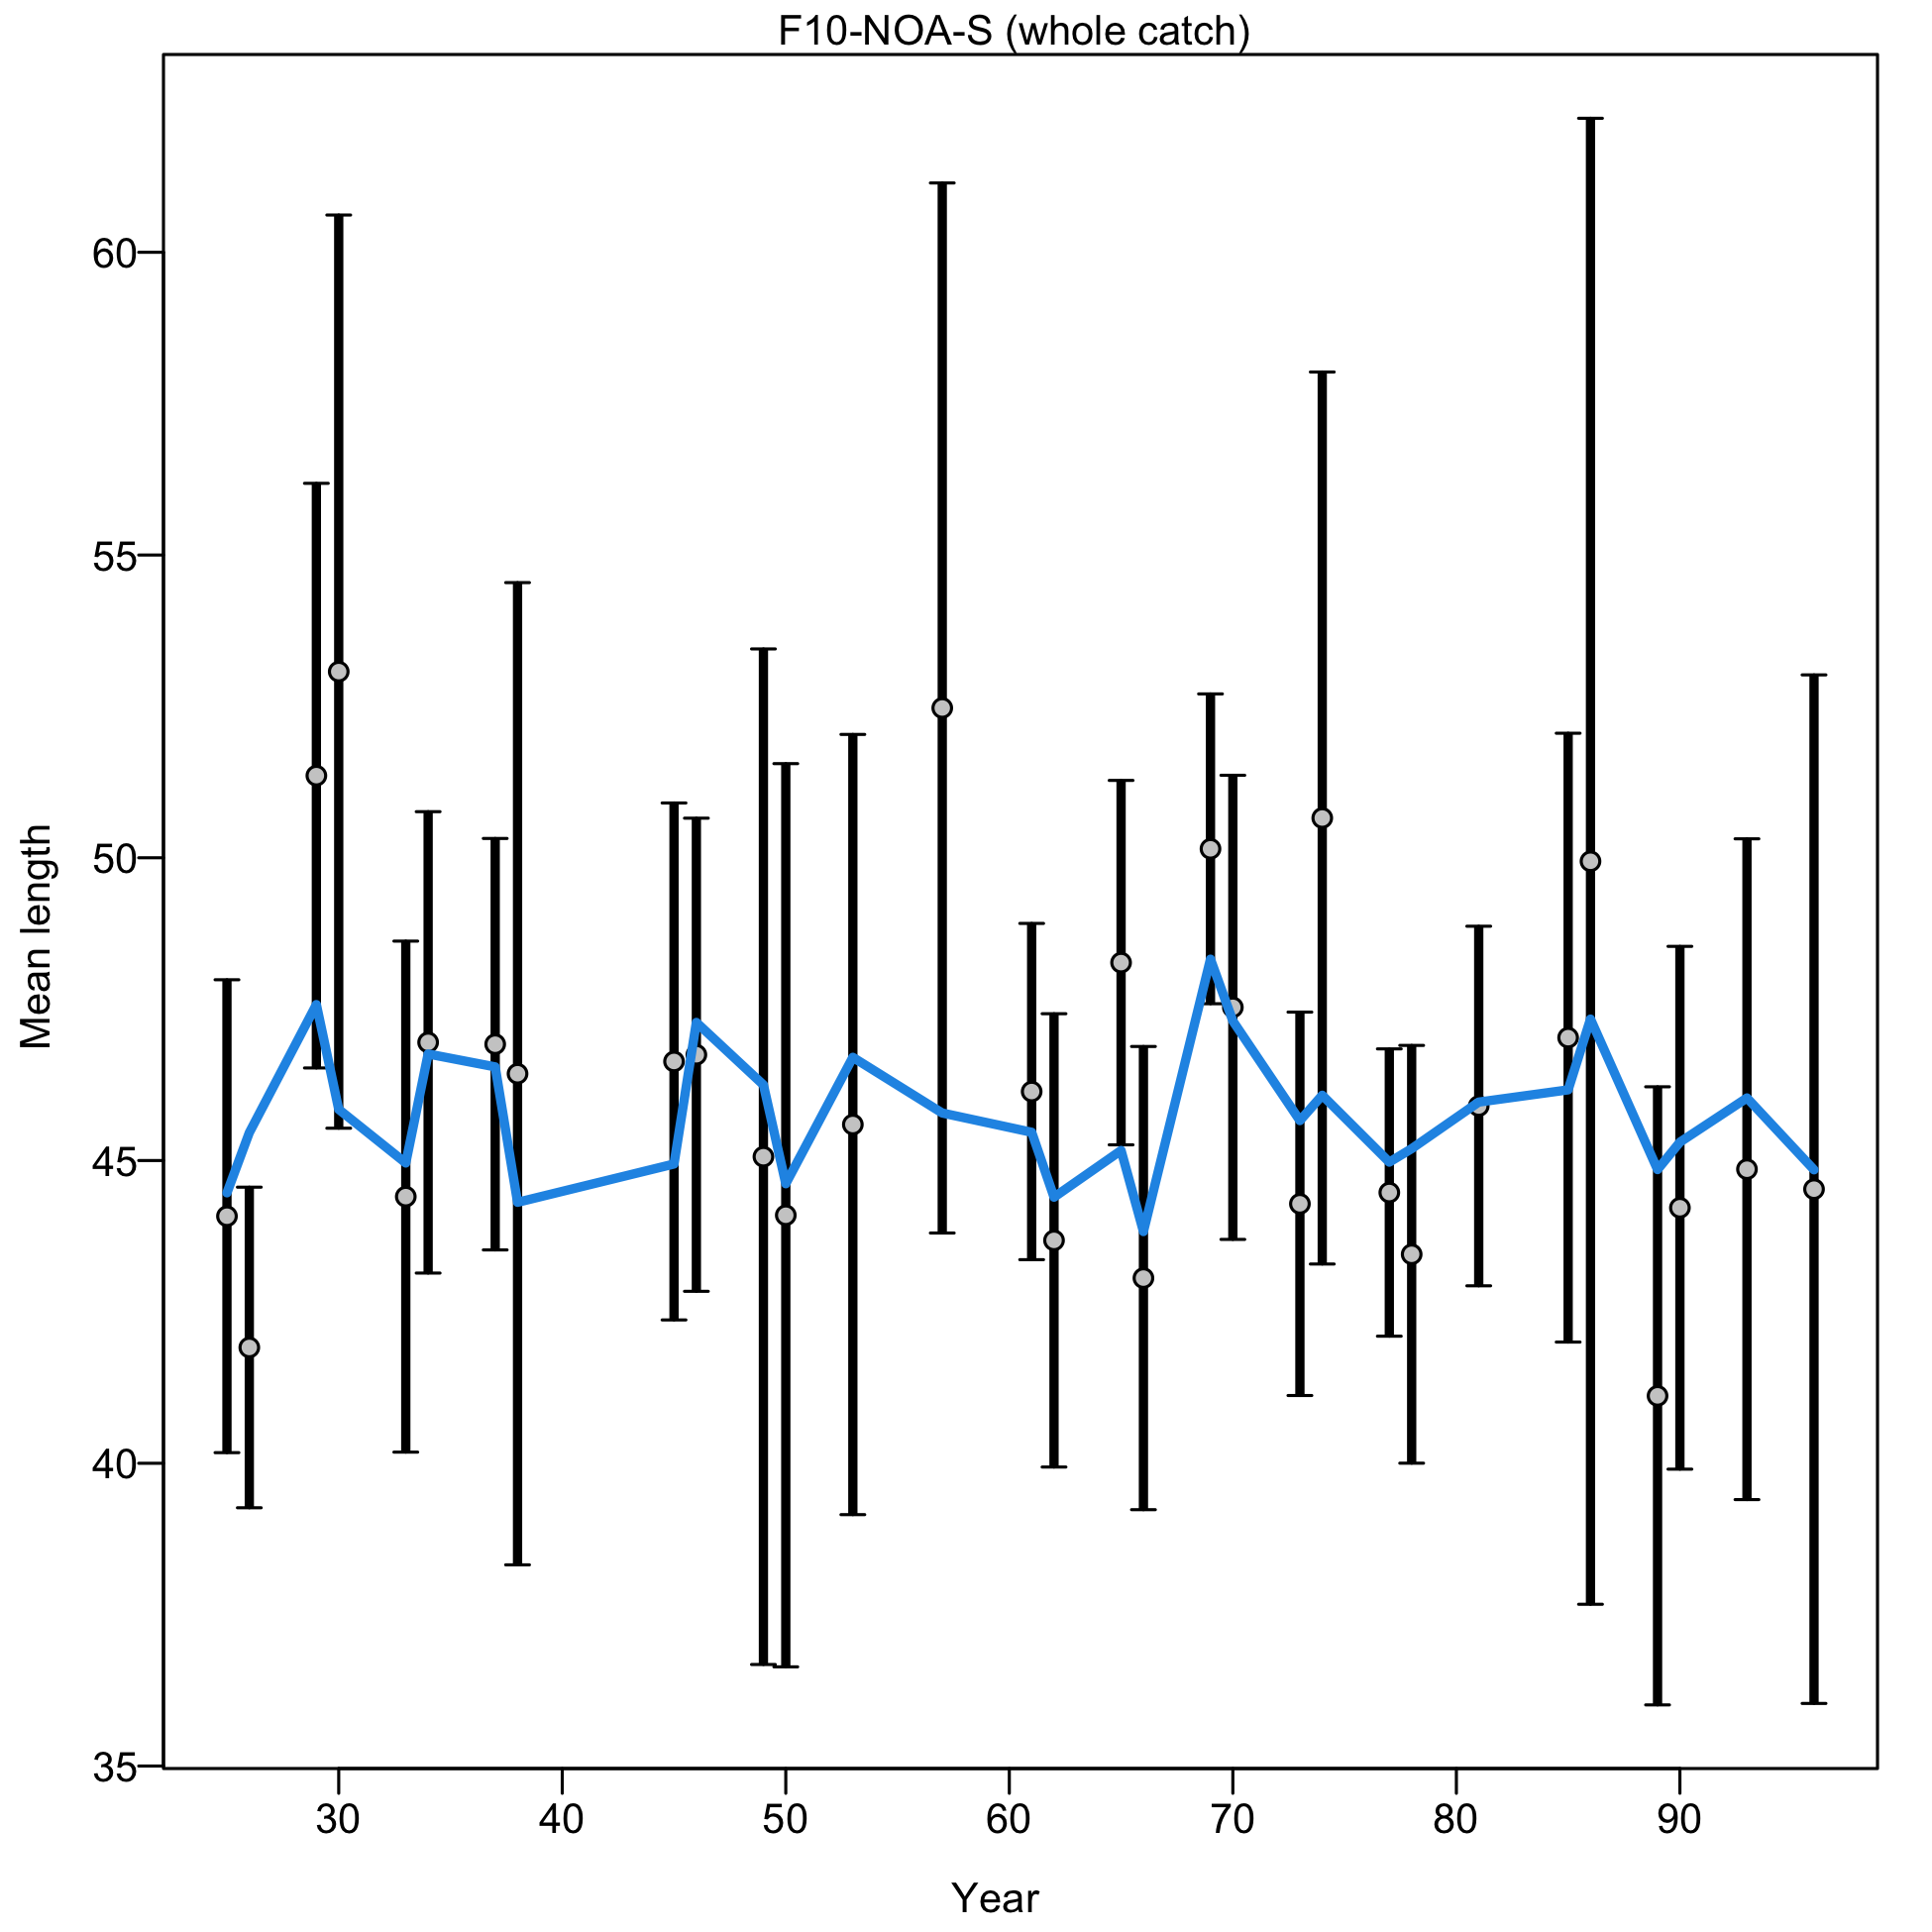
Mean length for F10-NOA-S with 95% confidence intervals based on current sample sizes.
Francis data weighting method TA1.8: thinner intervals (with capped ends) show result of further adjusting sample sizes based on suggested multiplier (with 95% interval) for len data from F10-NOA-S:
1.0009 (0.6387-2.0702)
For more info, see Francis (2011).
file: comp_lenfit_data_weighting_TA1.8_F10-NOA-S.png
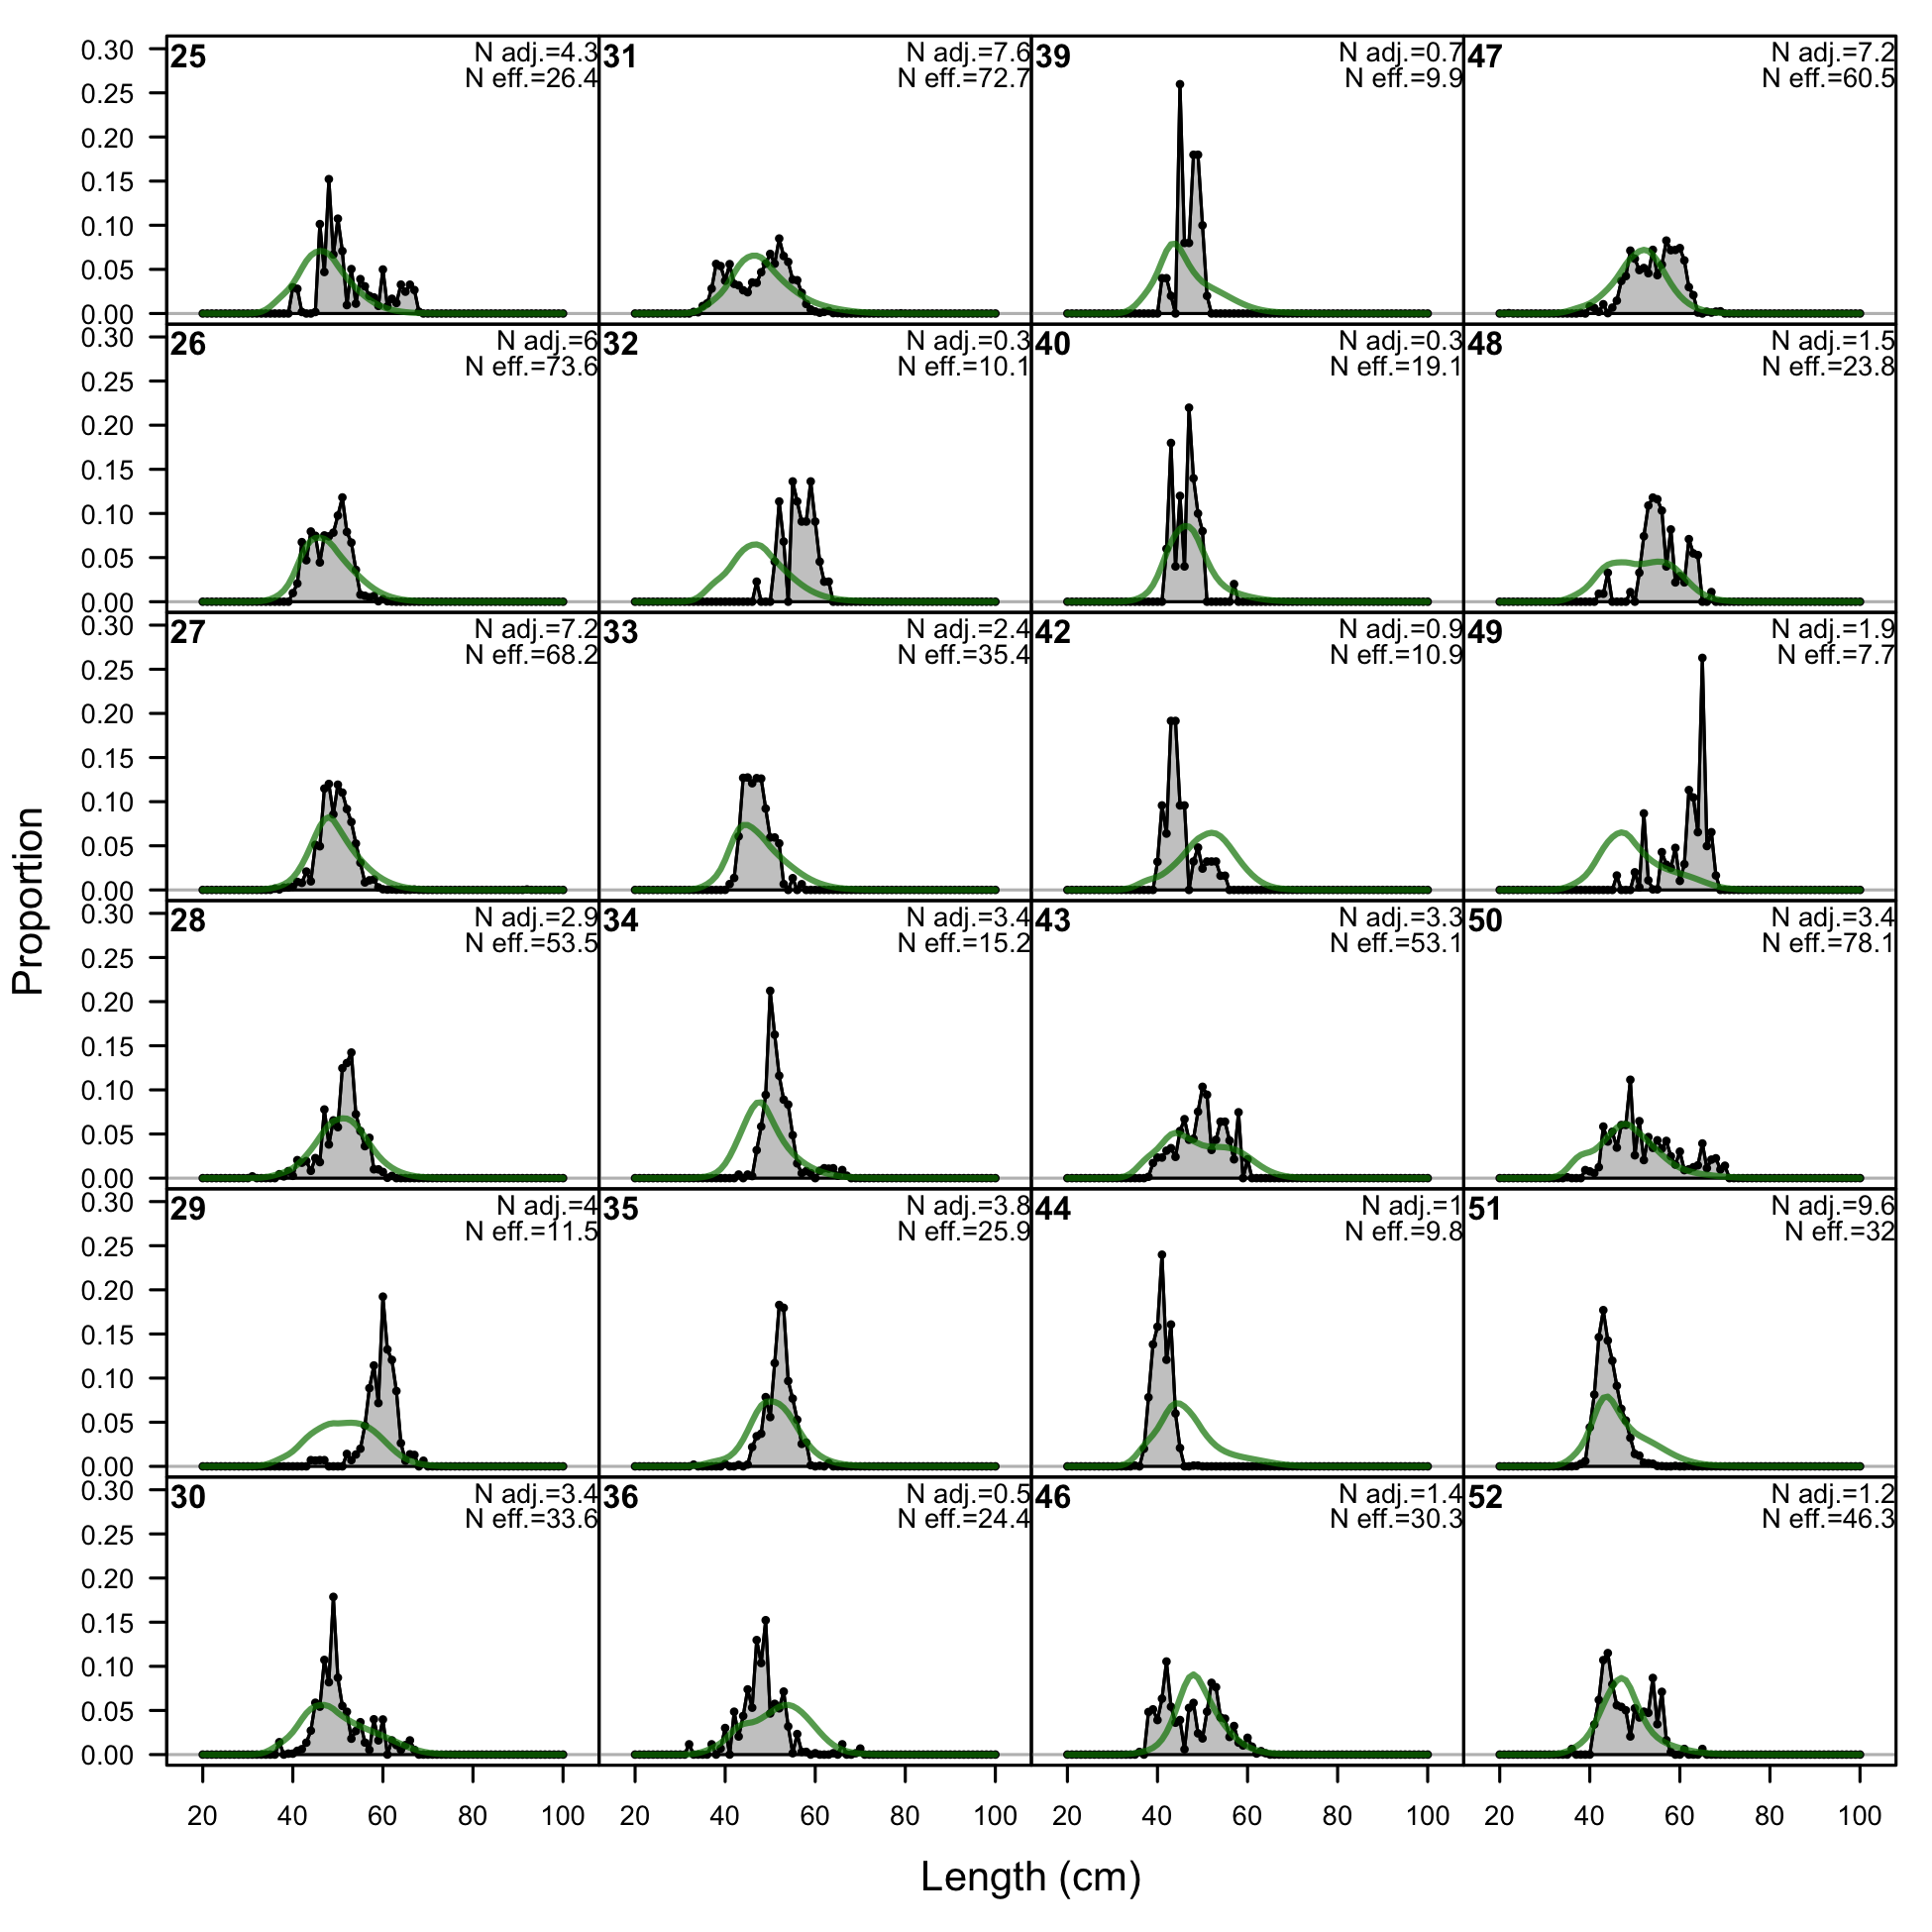
Length comps, whole catch, F11-NOA-C (plot 1 of 3).
'N adj.' is the input sample size after data-weighting adjustment. N eff. is the calculated effective sample size used in the McAllister-Ianelli tuning method.
file: comp_lenfit_flt11mkt0_page1.png
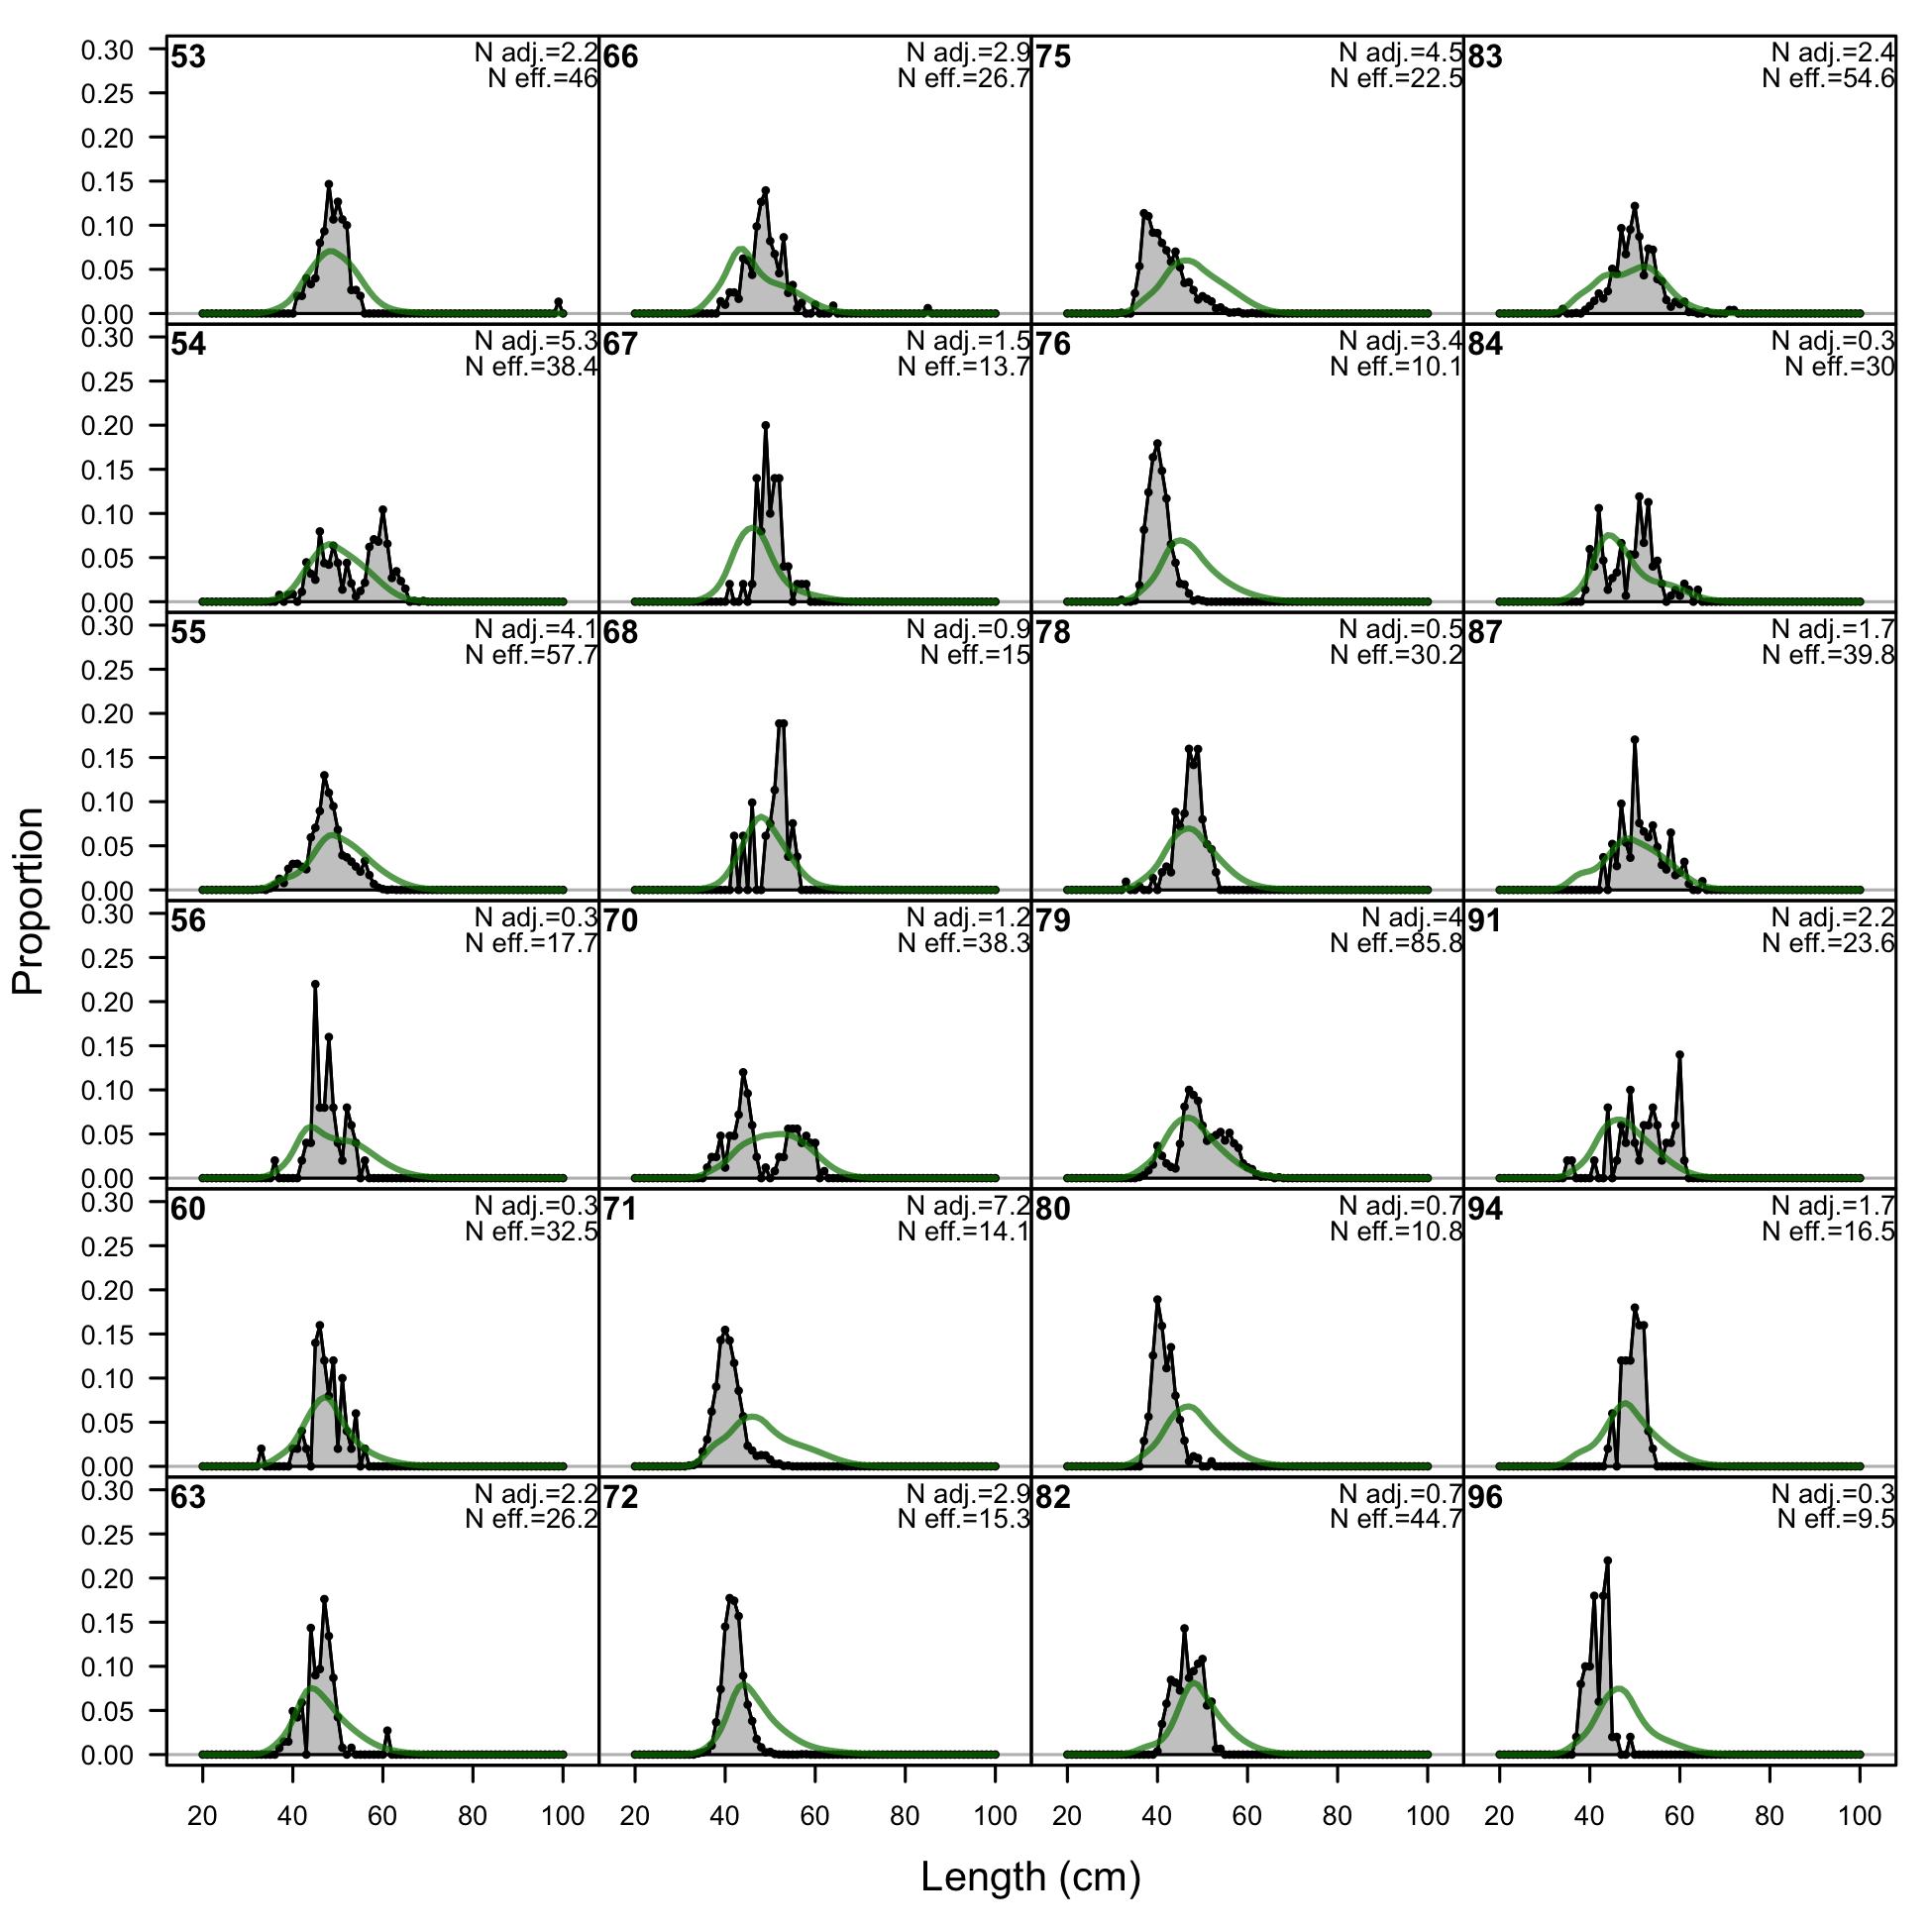
Length comps, whole catch, F11-NOA-C (plot 1 of 3).
'N adj.' is the input sample size after data-weighting adjustment. N eff. is the calculated effective sample size used in the McAllister-Ianelli tuning method. (plot 2 of 3)
file: comp_lenfit_flt11mkt0_page2.png
Length comps, whole catch, F11-NOA-C (plot 1 of 3).
'N adj.' is the input sample size after data-weighting adjustment. N eff. is the calculated effective sample size used in the McAllister-Ianelli tuning method. (plot 2 of 3) (plot 3 of 3)
file: comp_lenfit_flt11mkt0_page3.png
Pearson residuals, whole catch, F11-NOA-C (max=4.09) (plot 3 of 3)
Closed bubbles are positive residuals (observed > expected) and open bubbles are negative residuals (observed < expected).
file: comp_lenfit_residsflt11mkt0_page3.png
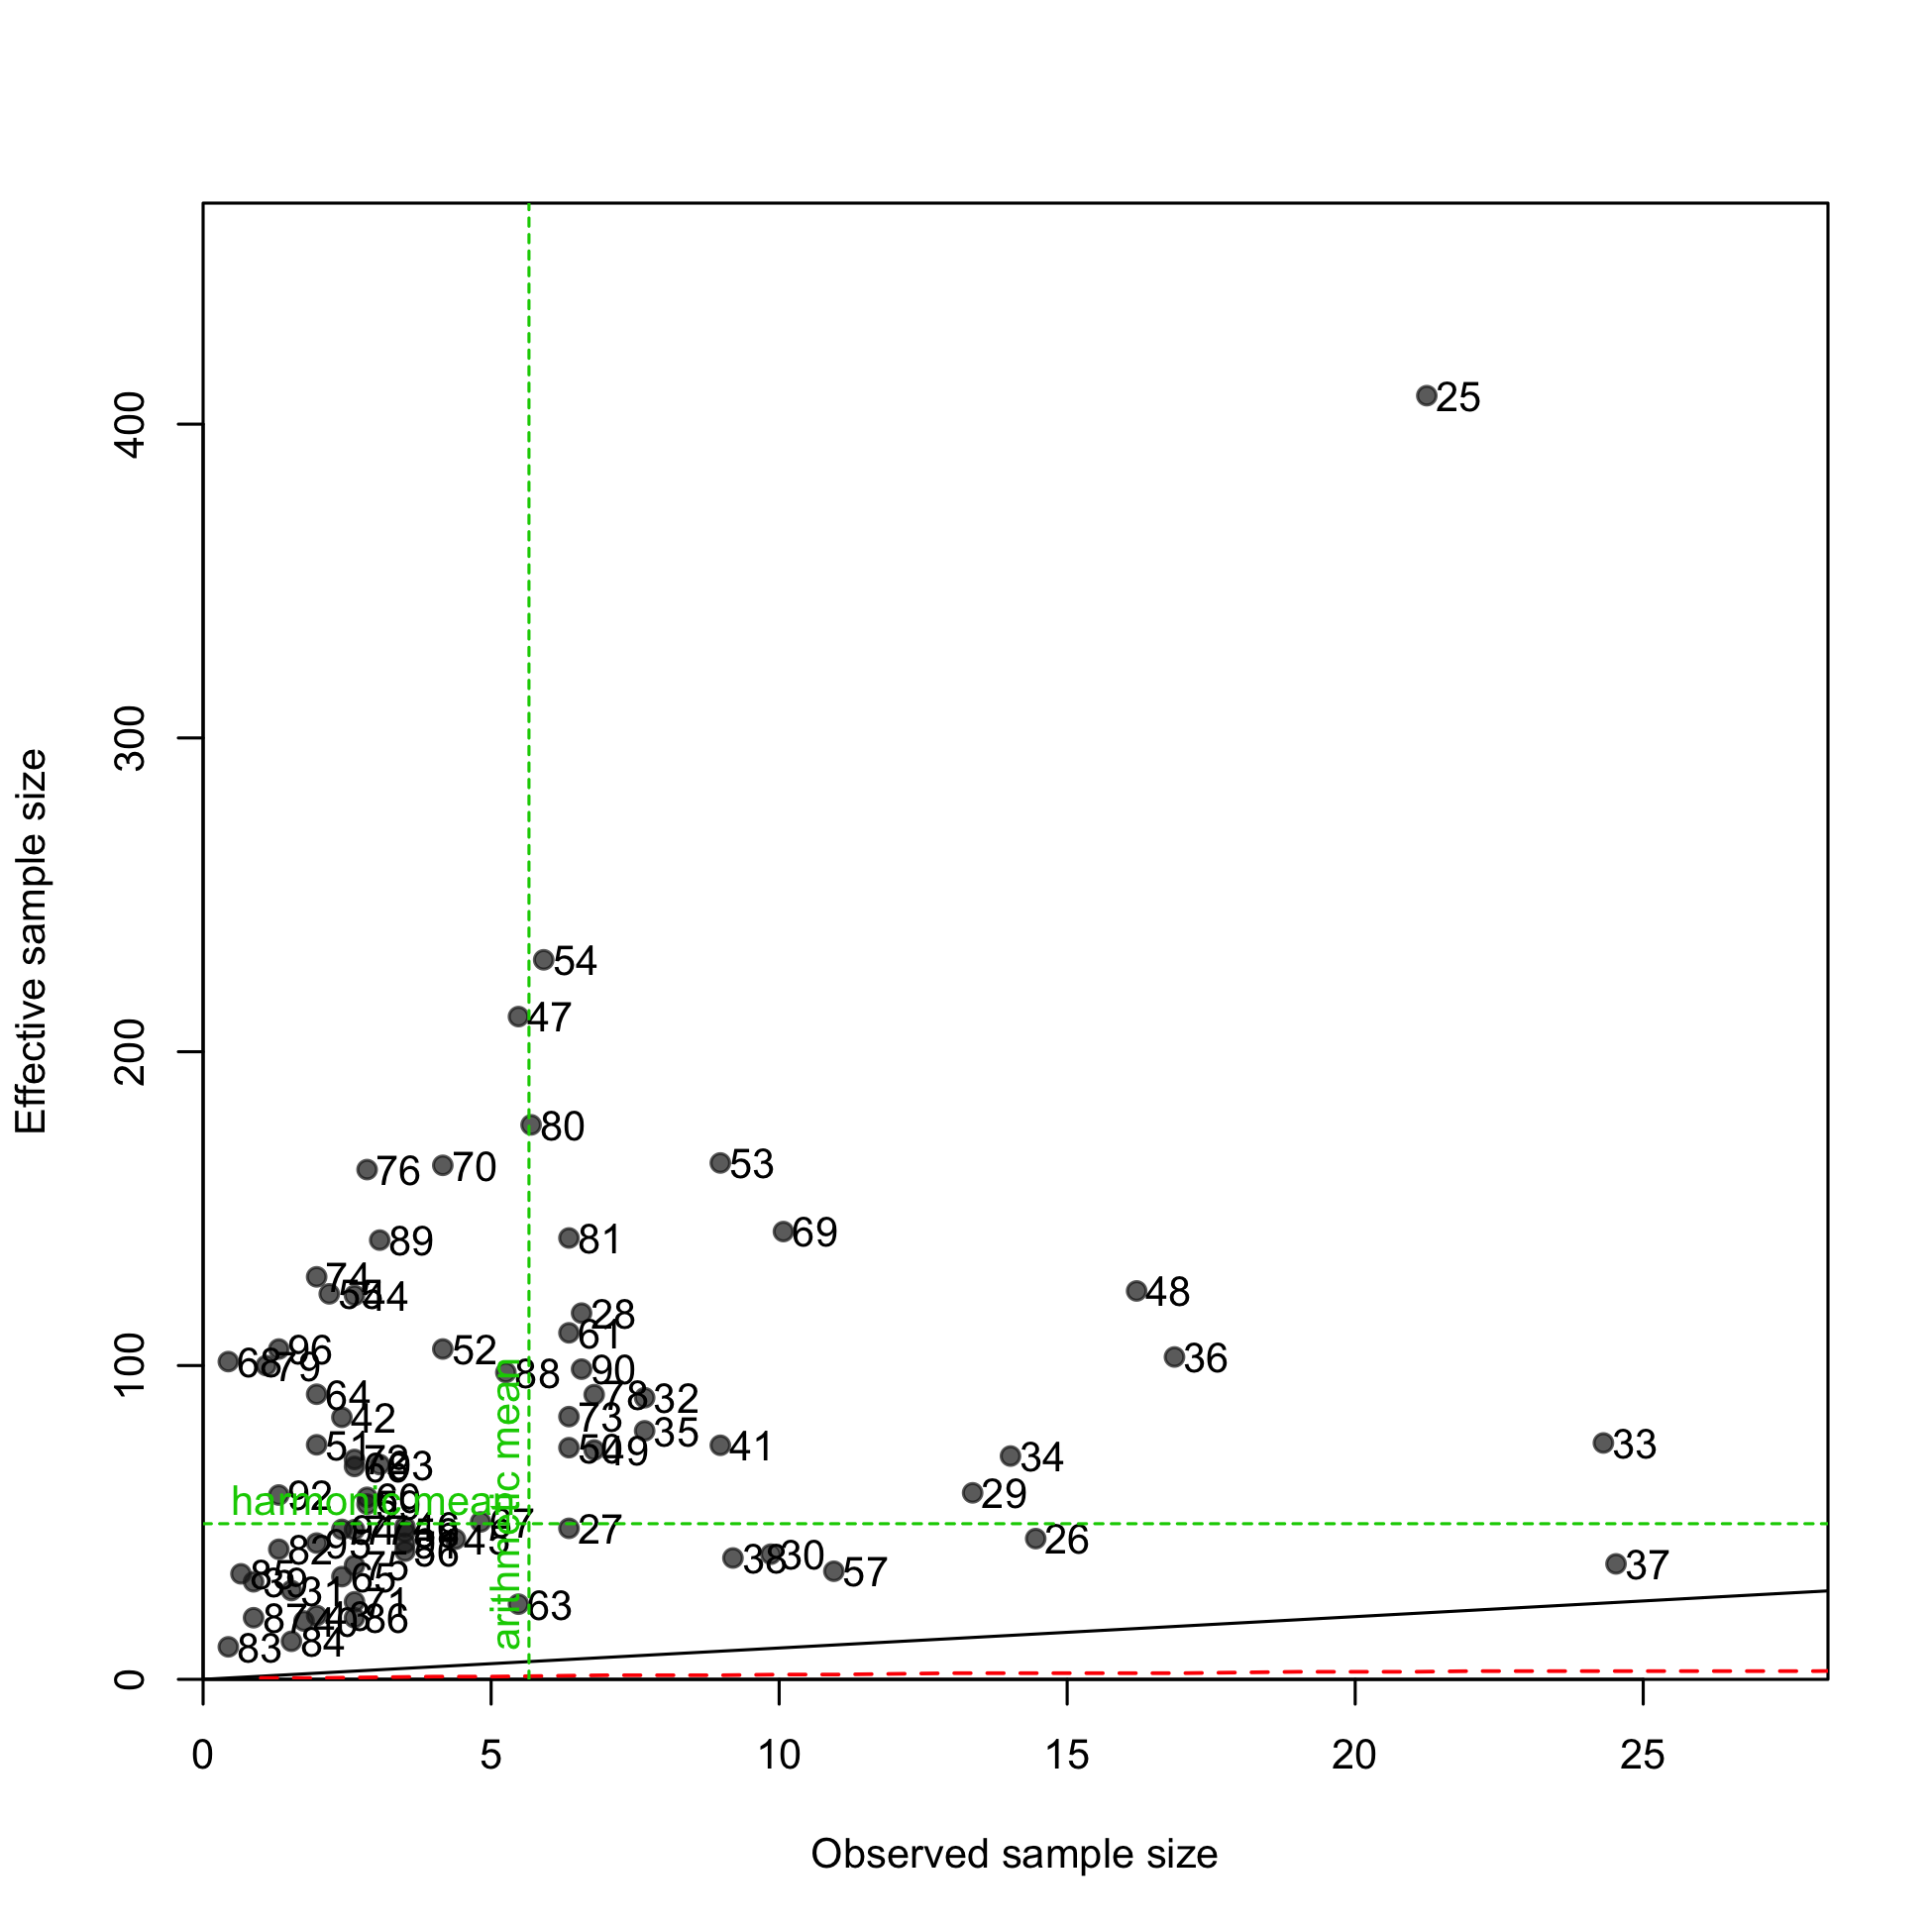
N-EffN comparison, Length comps, whole catch, F11-NOA-C
file: comp_lenfit_sampsize_flt11mkt0.png
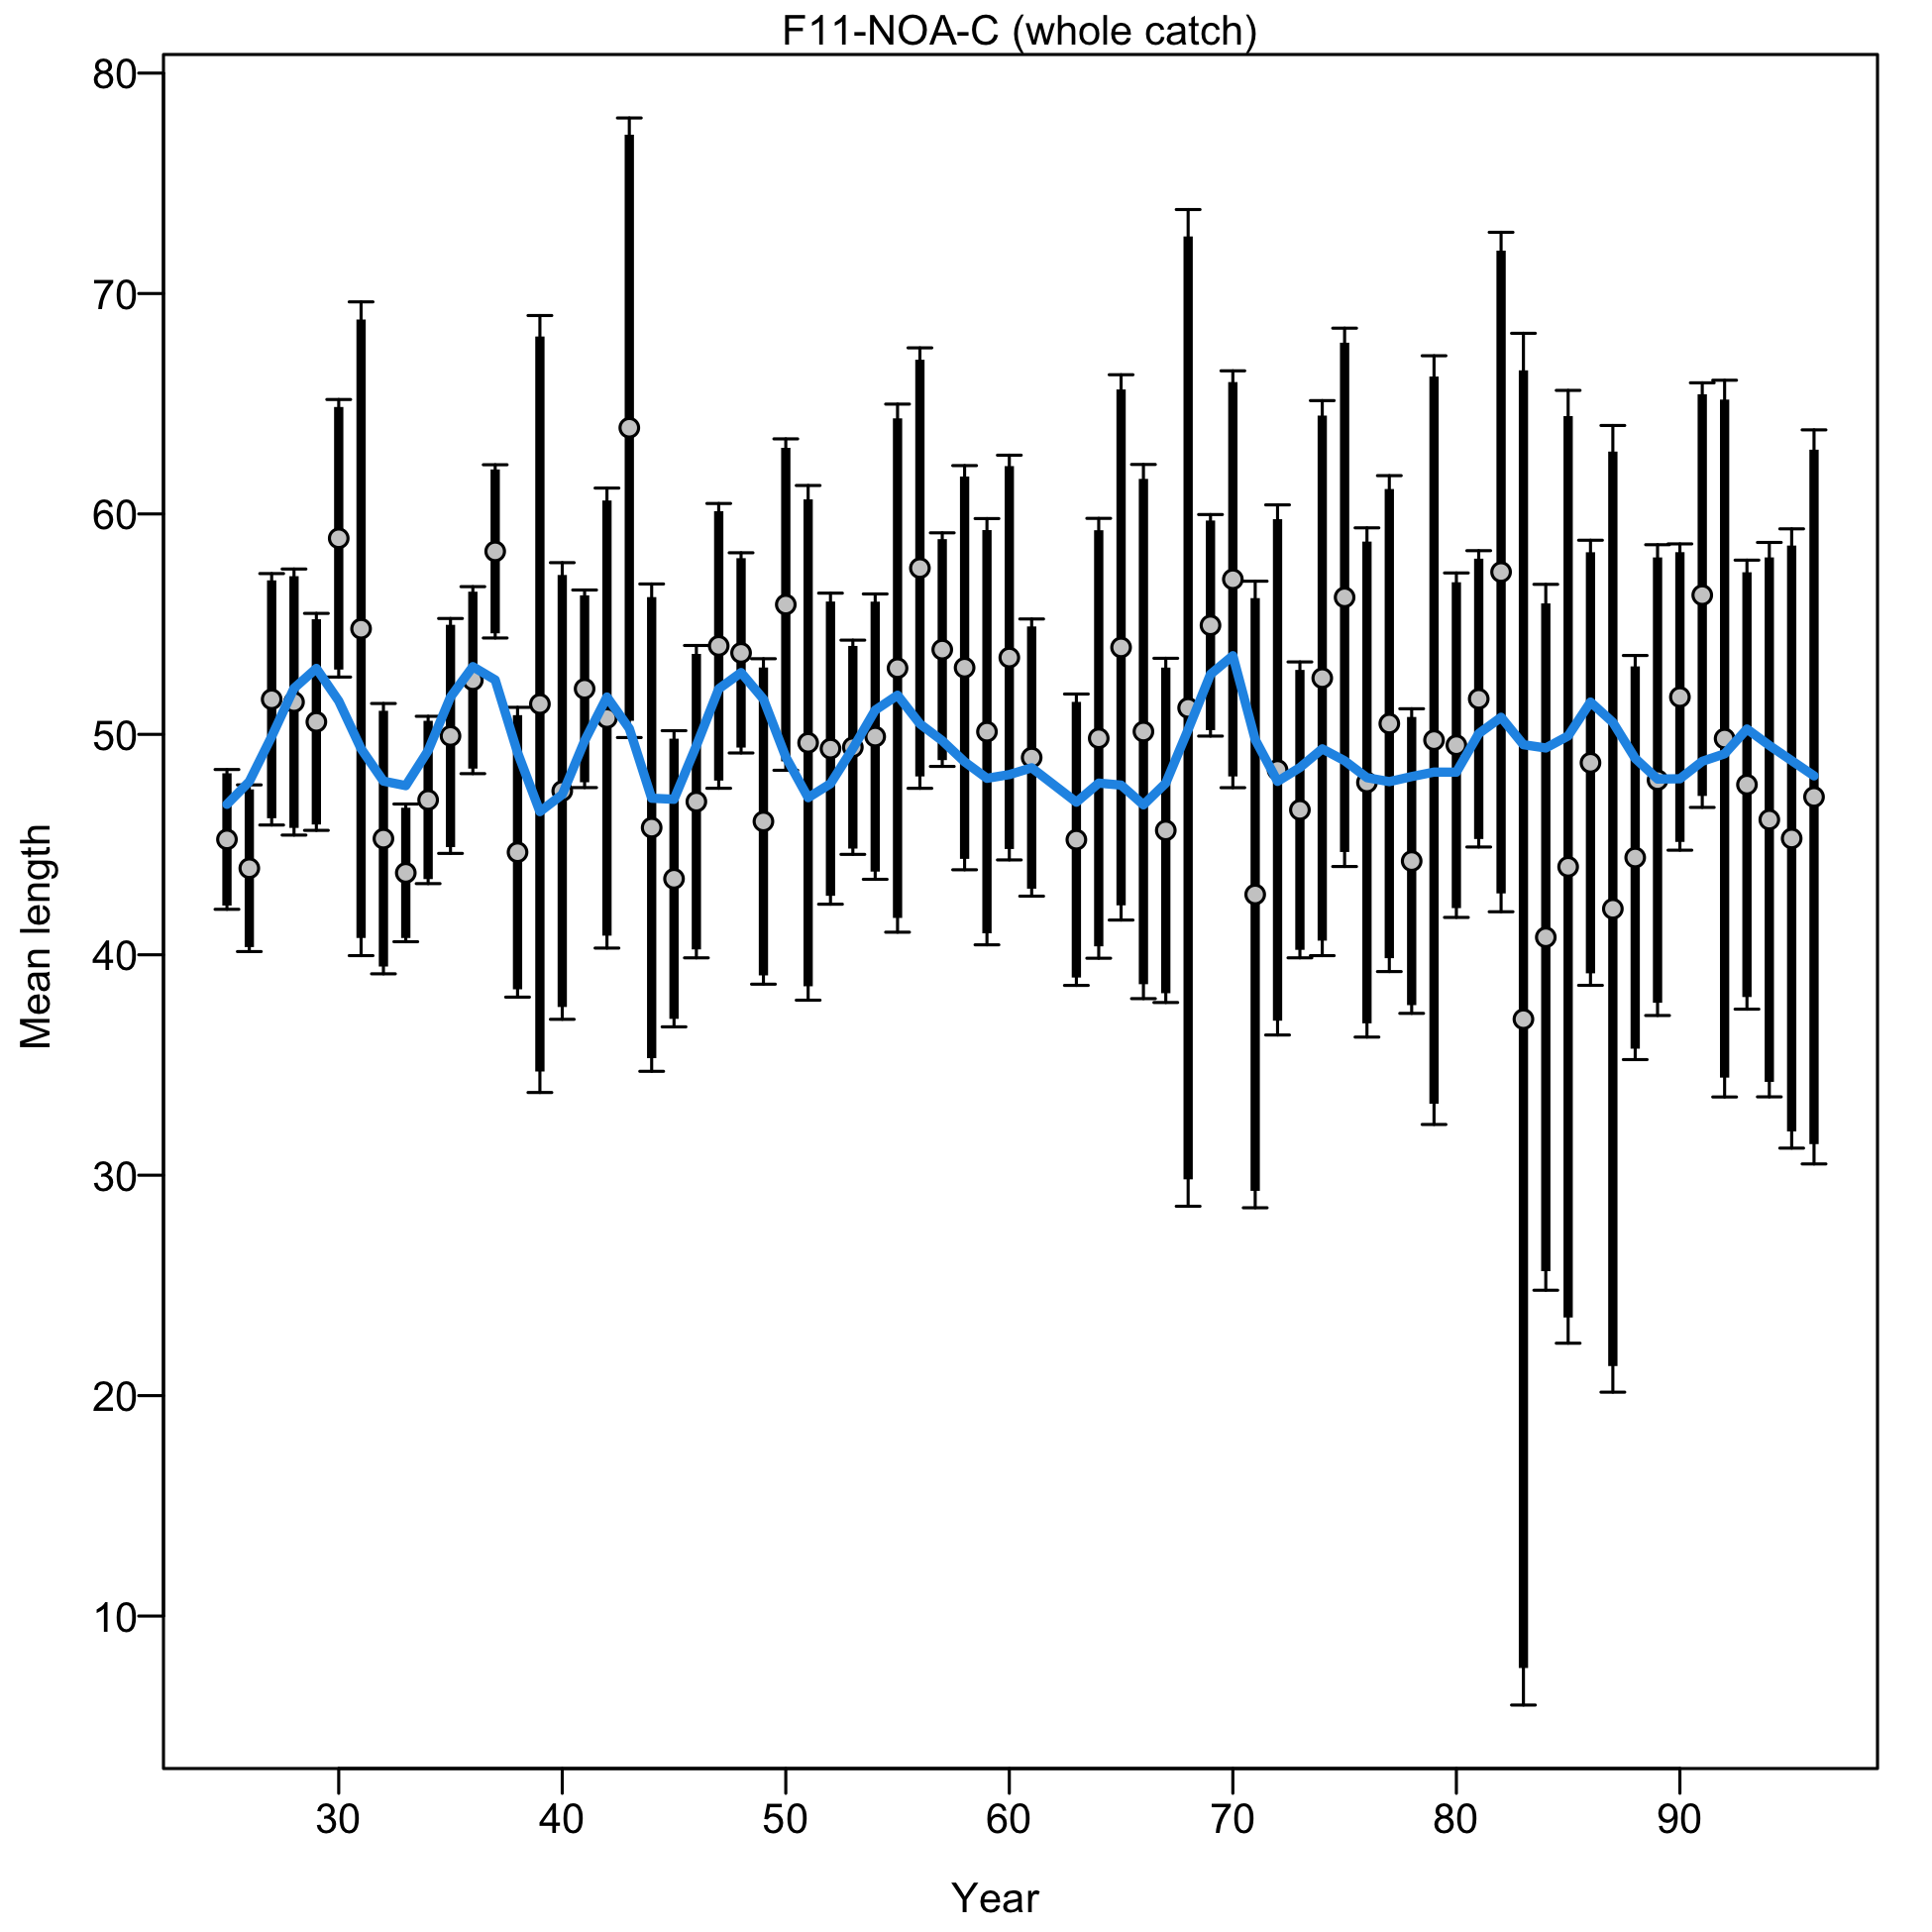
Mean length for F11-NOA-C with 95% confidence intervals based on current sample sizes.
Francis data weighting method TA1.8: thinner intervals (with capped ends) show result of further adjusting sample sizes based on suggested multiplier (with 95% interval) for len data from F11-NOA-C:
0.8949 (0.656-1.4056)
For more info, see Francis (2011).
file: comp_lenfit_data_weighting_TA1.8_F11-NOA-C.png
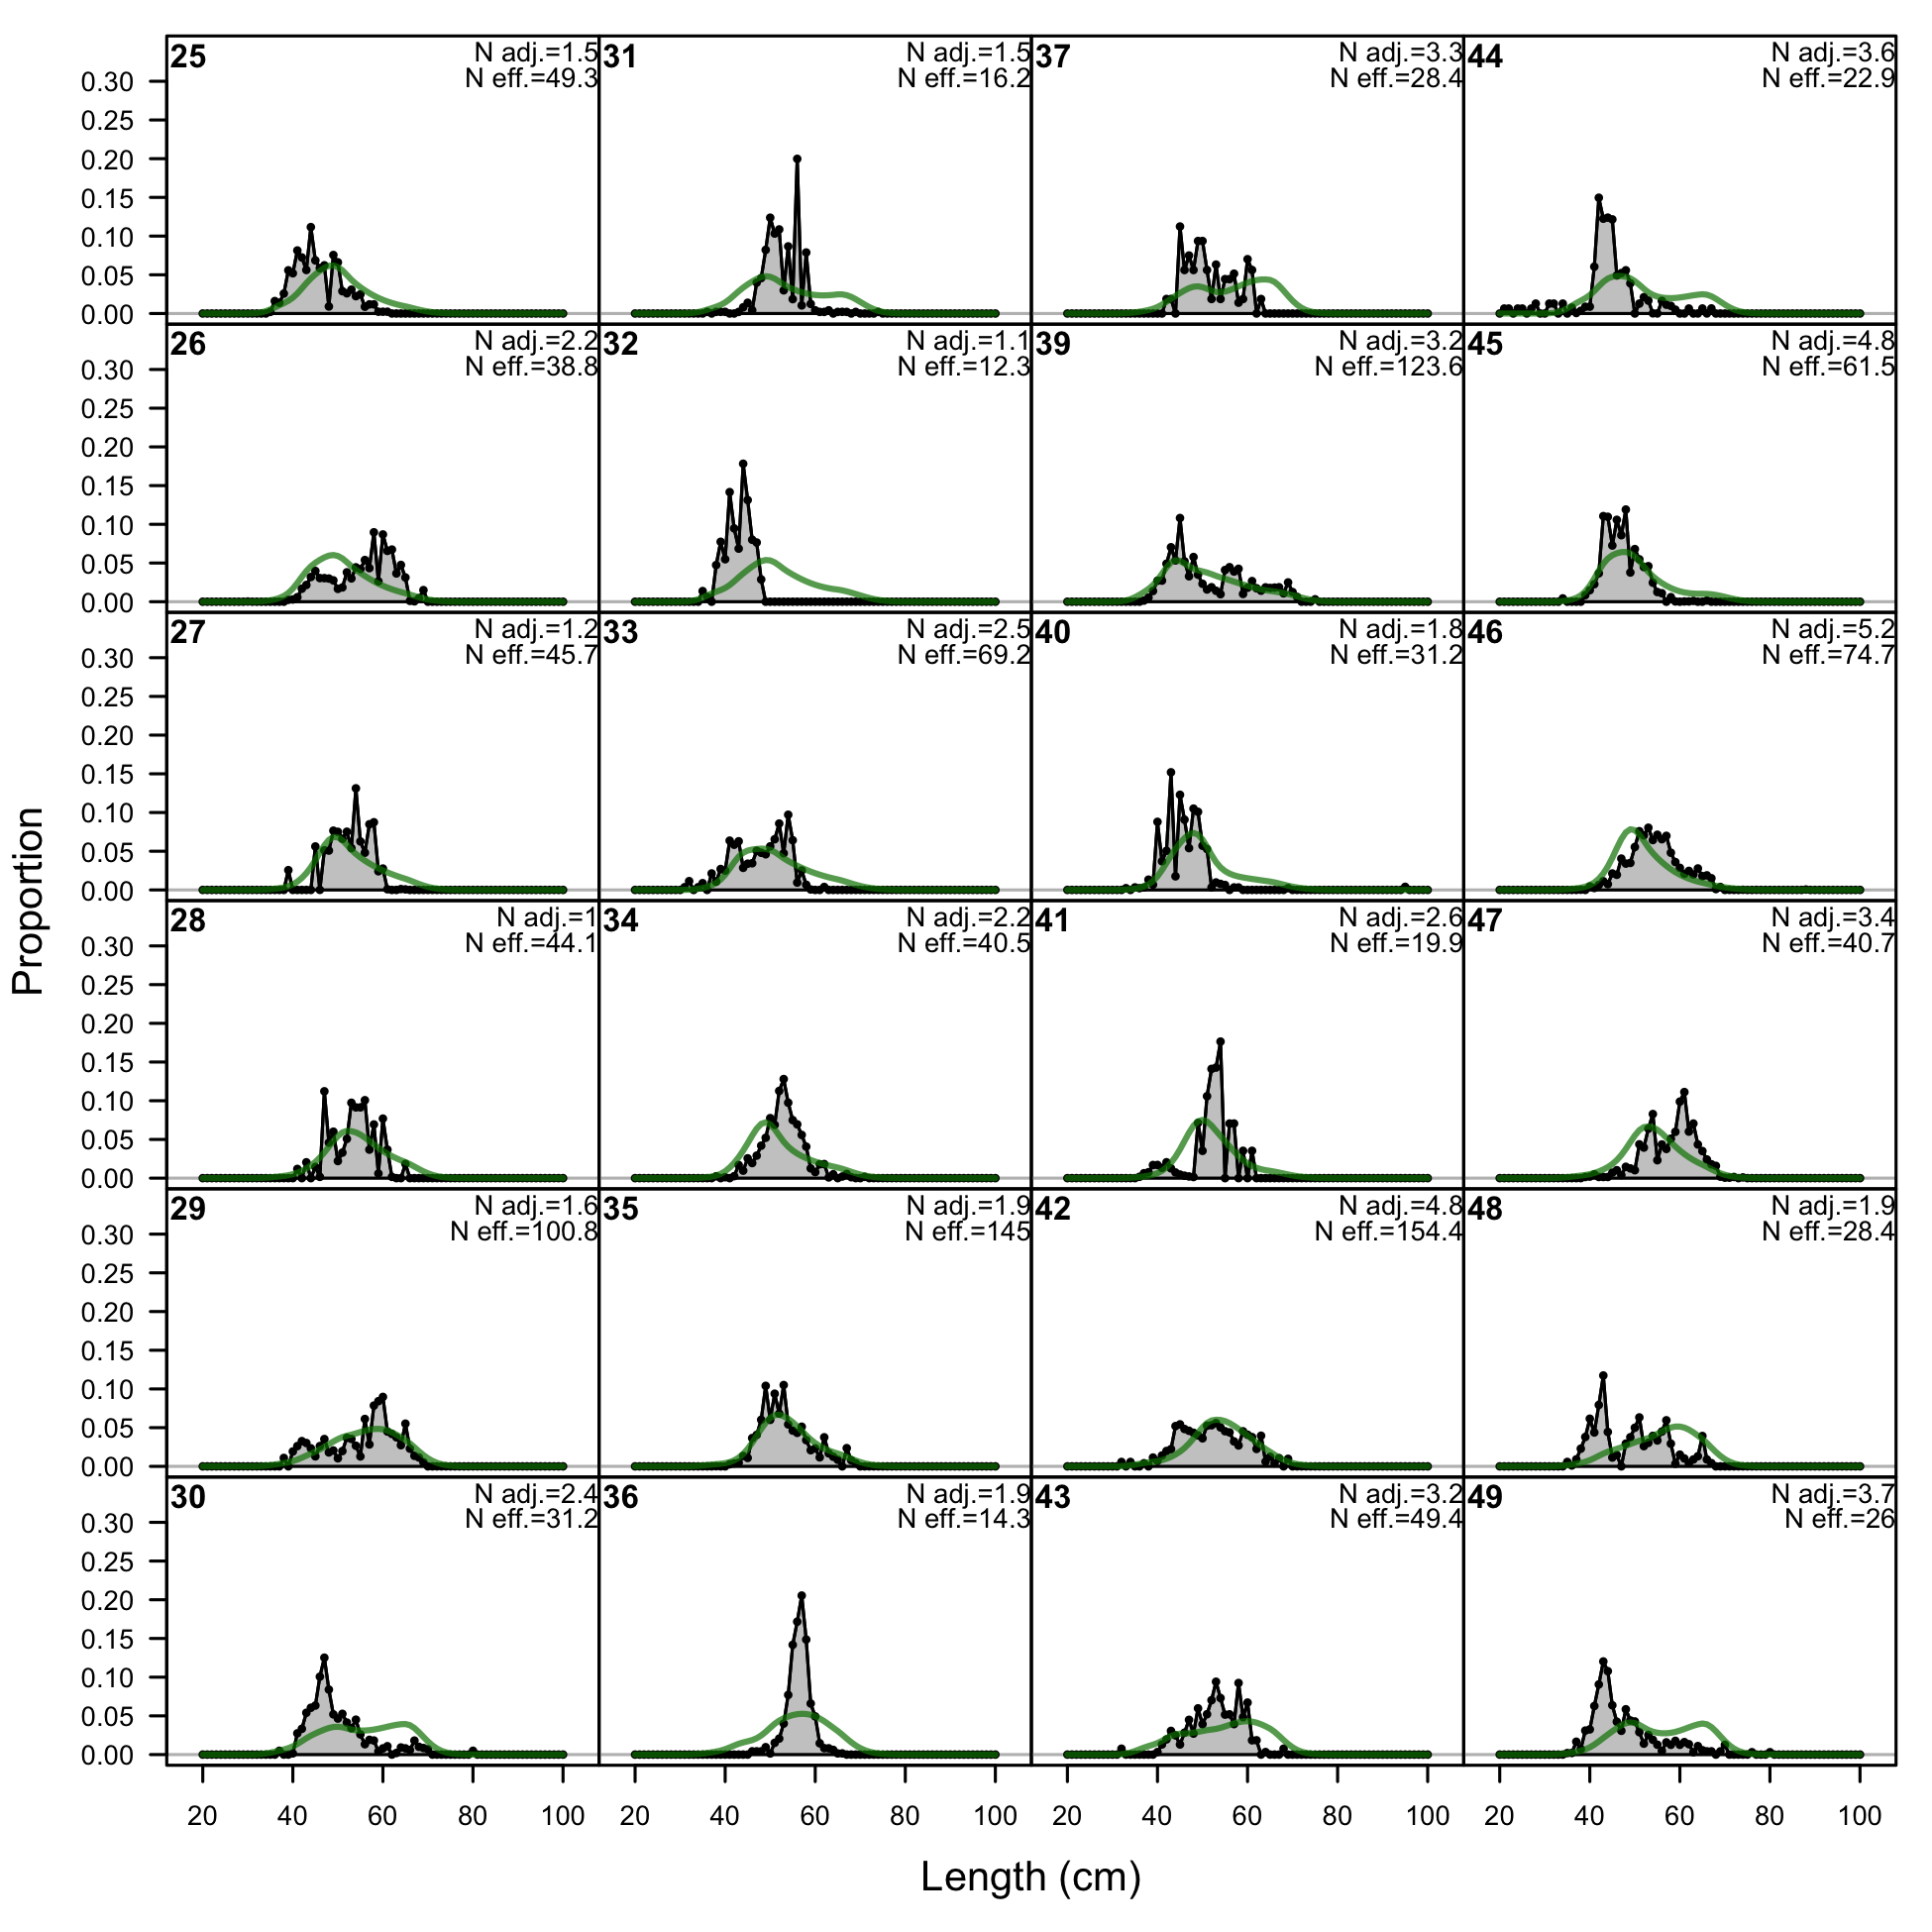
Length comps, whole catch, F12-NOA-N (plot 1 of 2).
'N adj.' is the input sample size after data-weighting adjustment. N eff. is the calculated effective sample size used in the McAllister-Ianelli tuning method.
file: comp_lenfit_flt12mkt0_page1.png
Length comps, whole catch, F12-NOA-N (plot 1 of 2).
'N adj.' is the input sample size after data-weighting adjustment. N eff. is the calculated effective sample size used in the McAllister-Ianelli tuning method. (plot 2 of 2)
file: comp_lenfit_flt12mkt0_page2.png
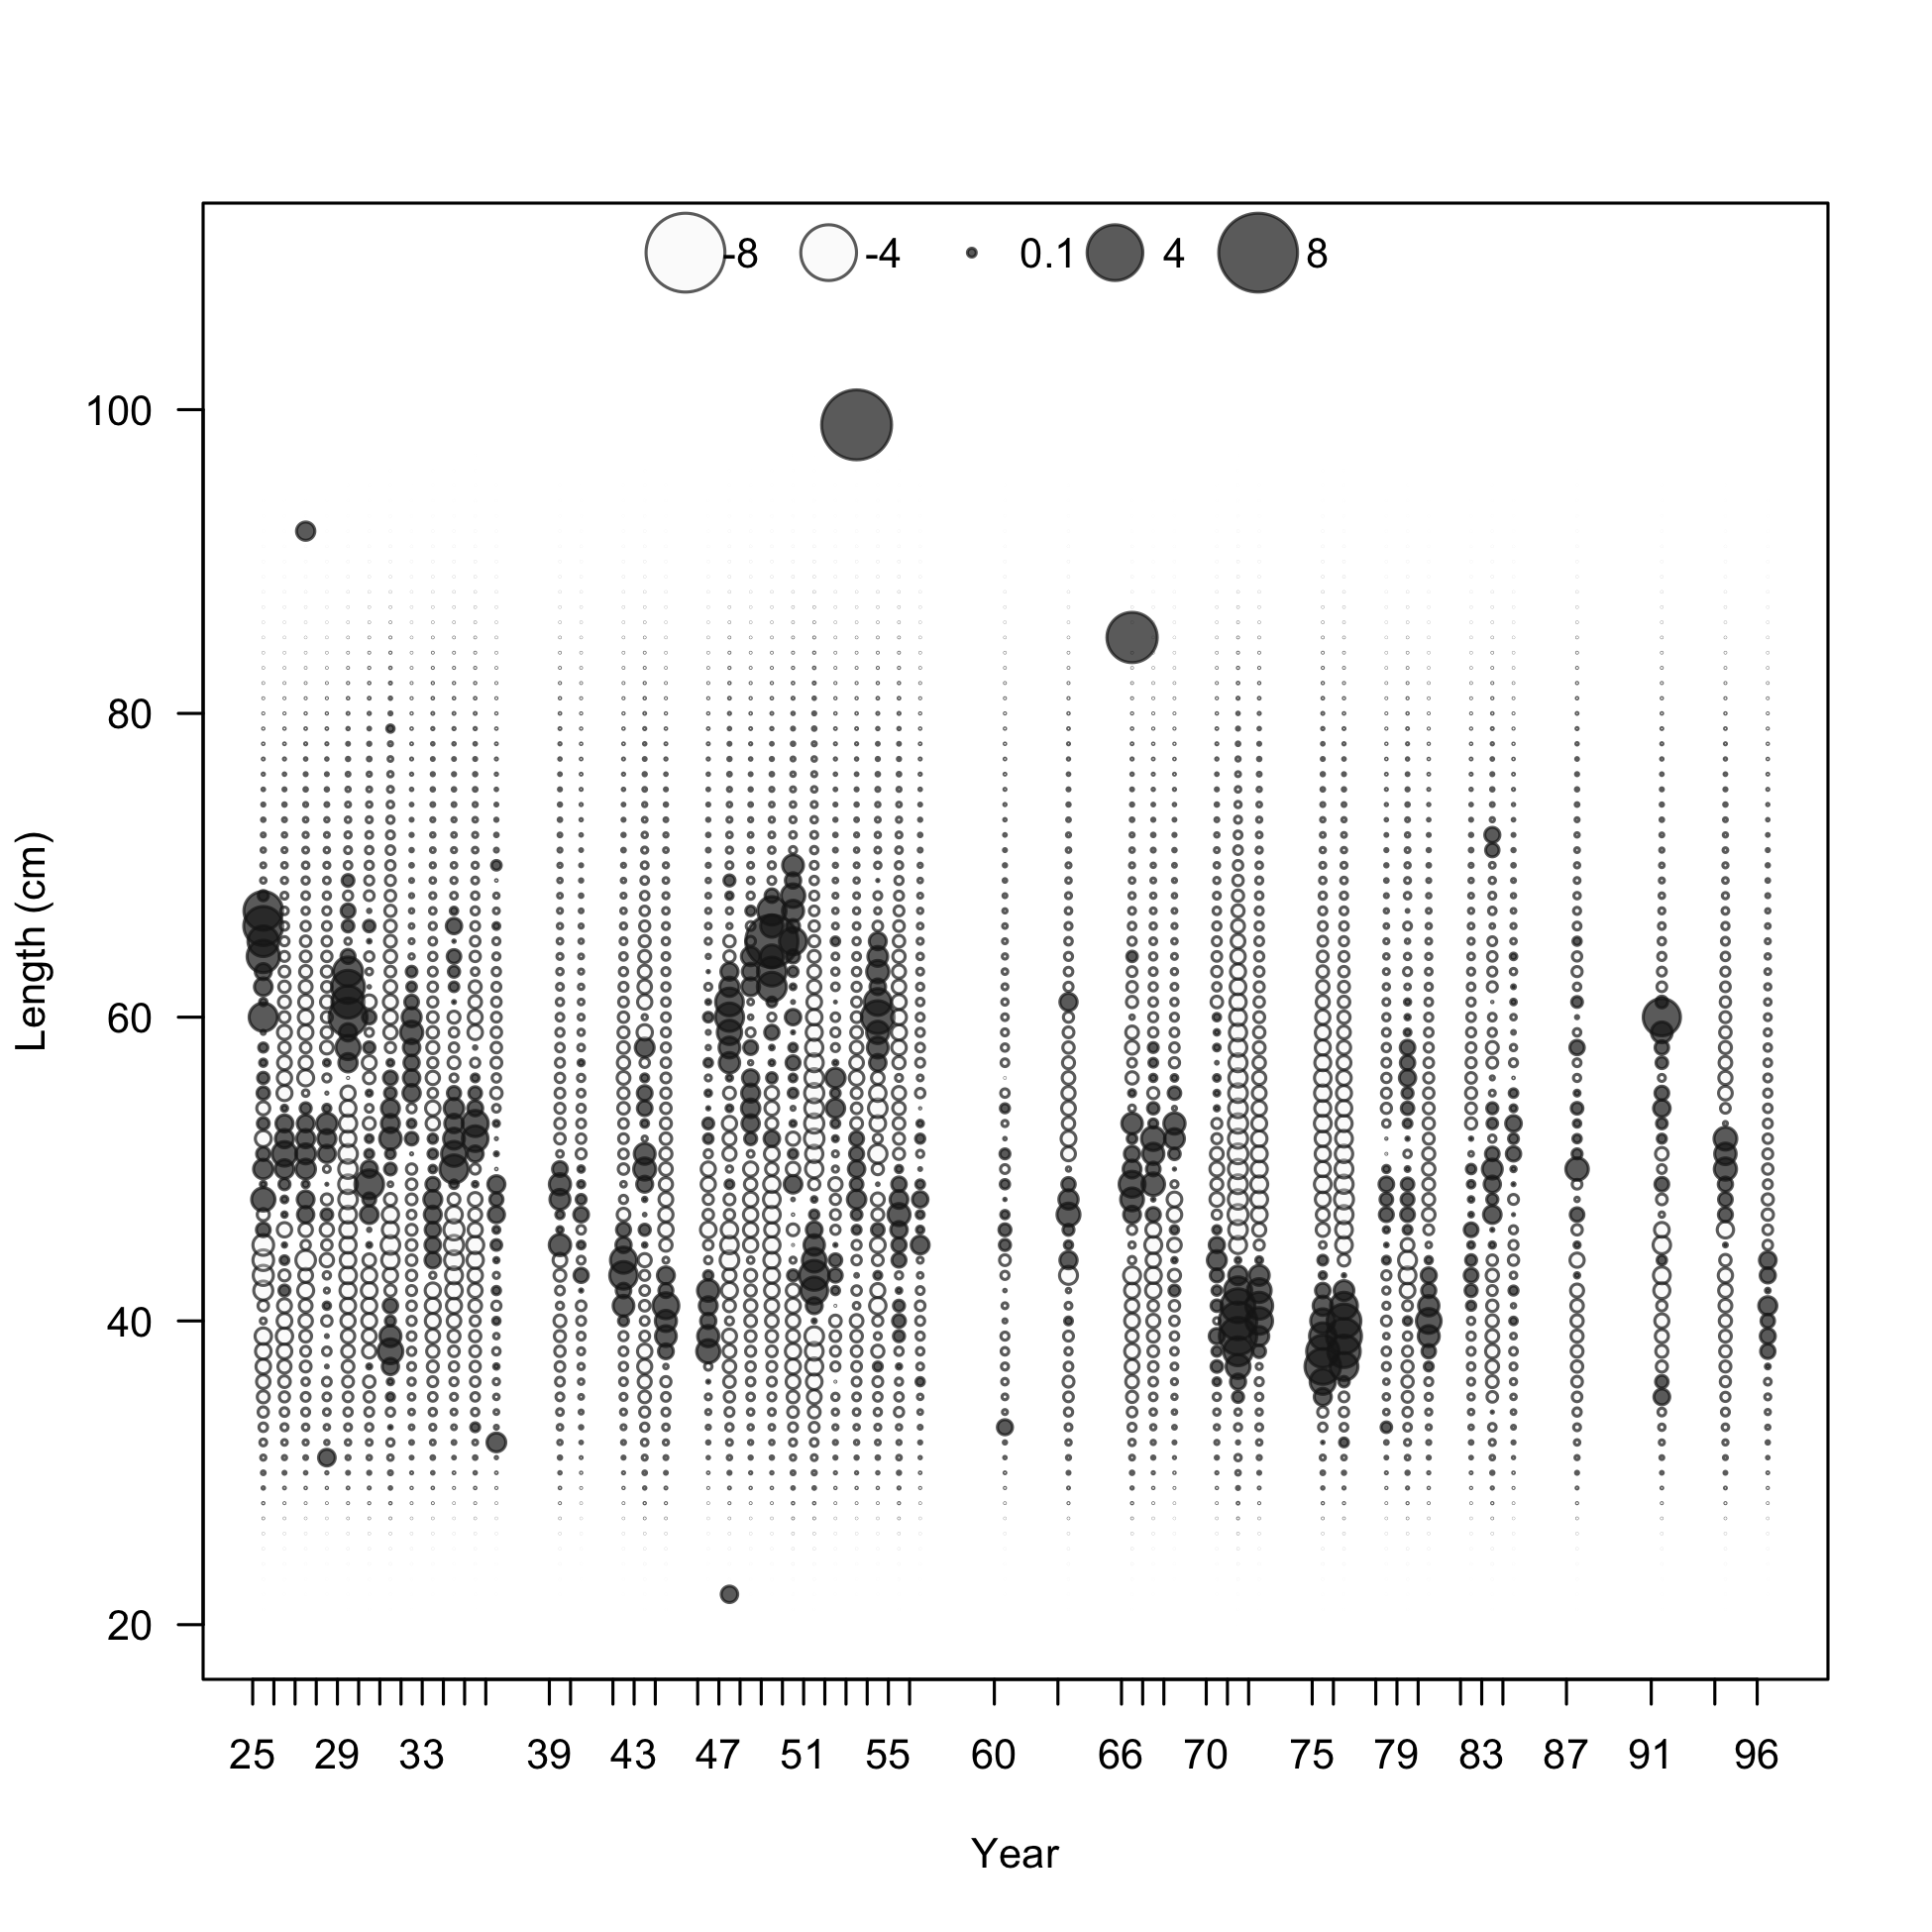
Pearson residuals, whole catch, F12-NOA-N (max=6.3) (plot 2 of 2)
Closed bubbles are positive residuals (observed > expected) and open bubbles are negative residuals (observed < expected).
file: comp_lenfit_residsflt12mkt0_page2.png
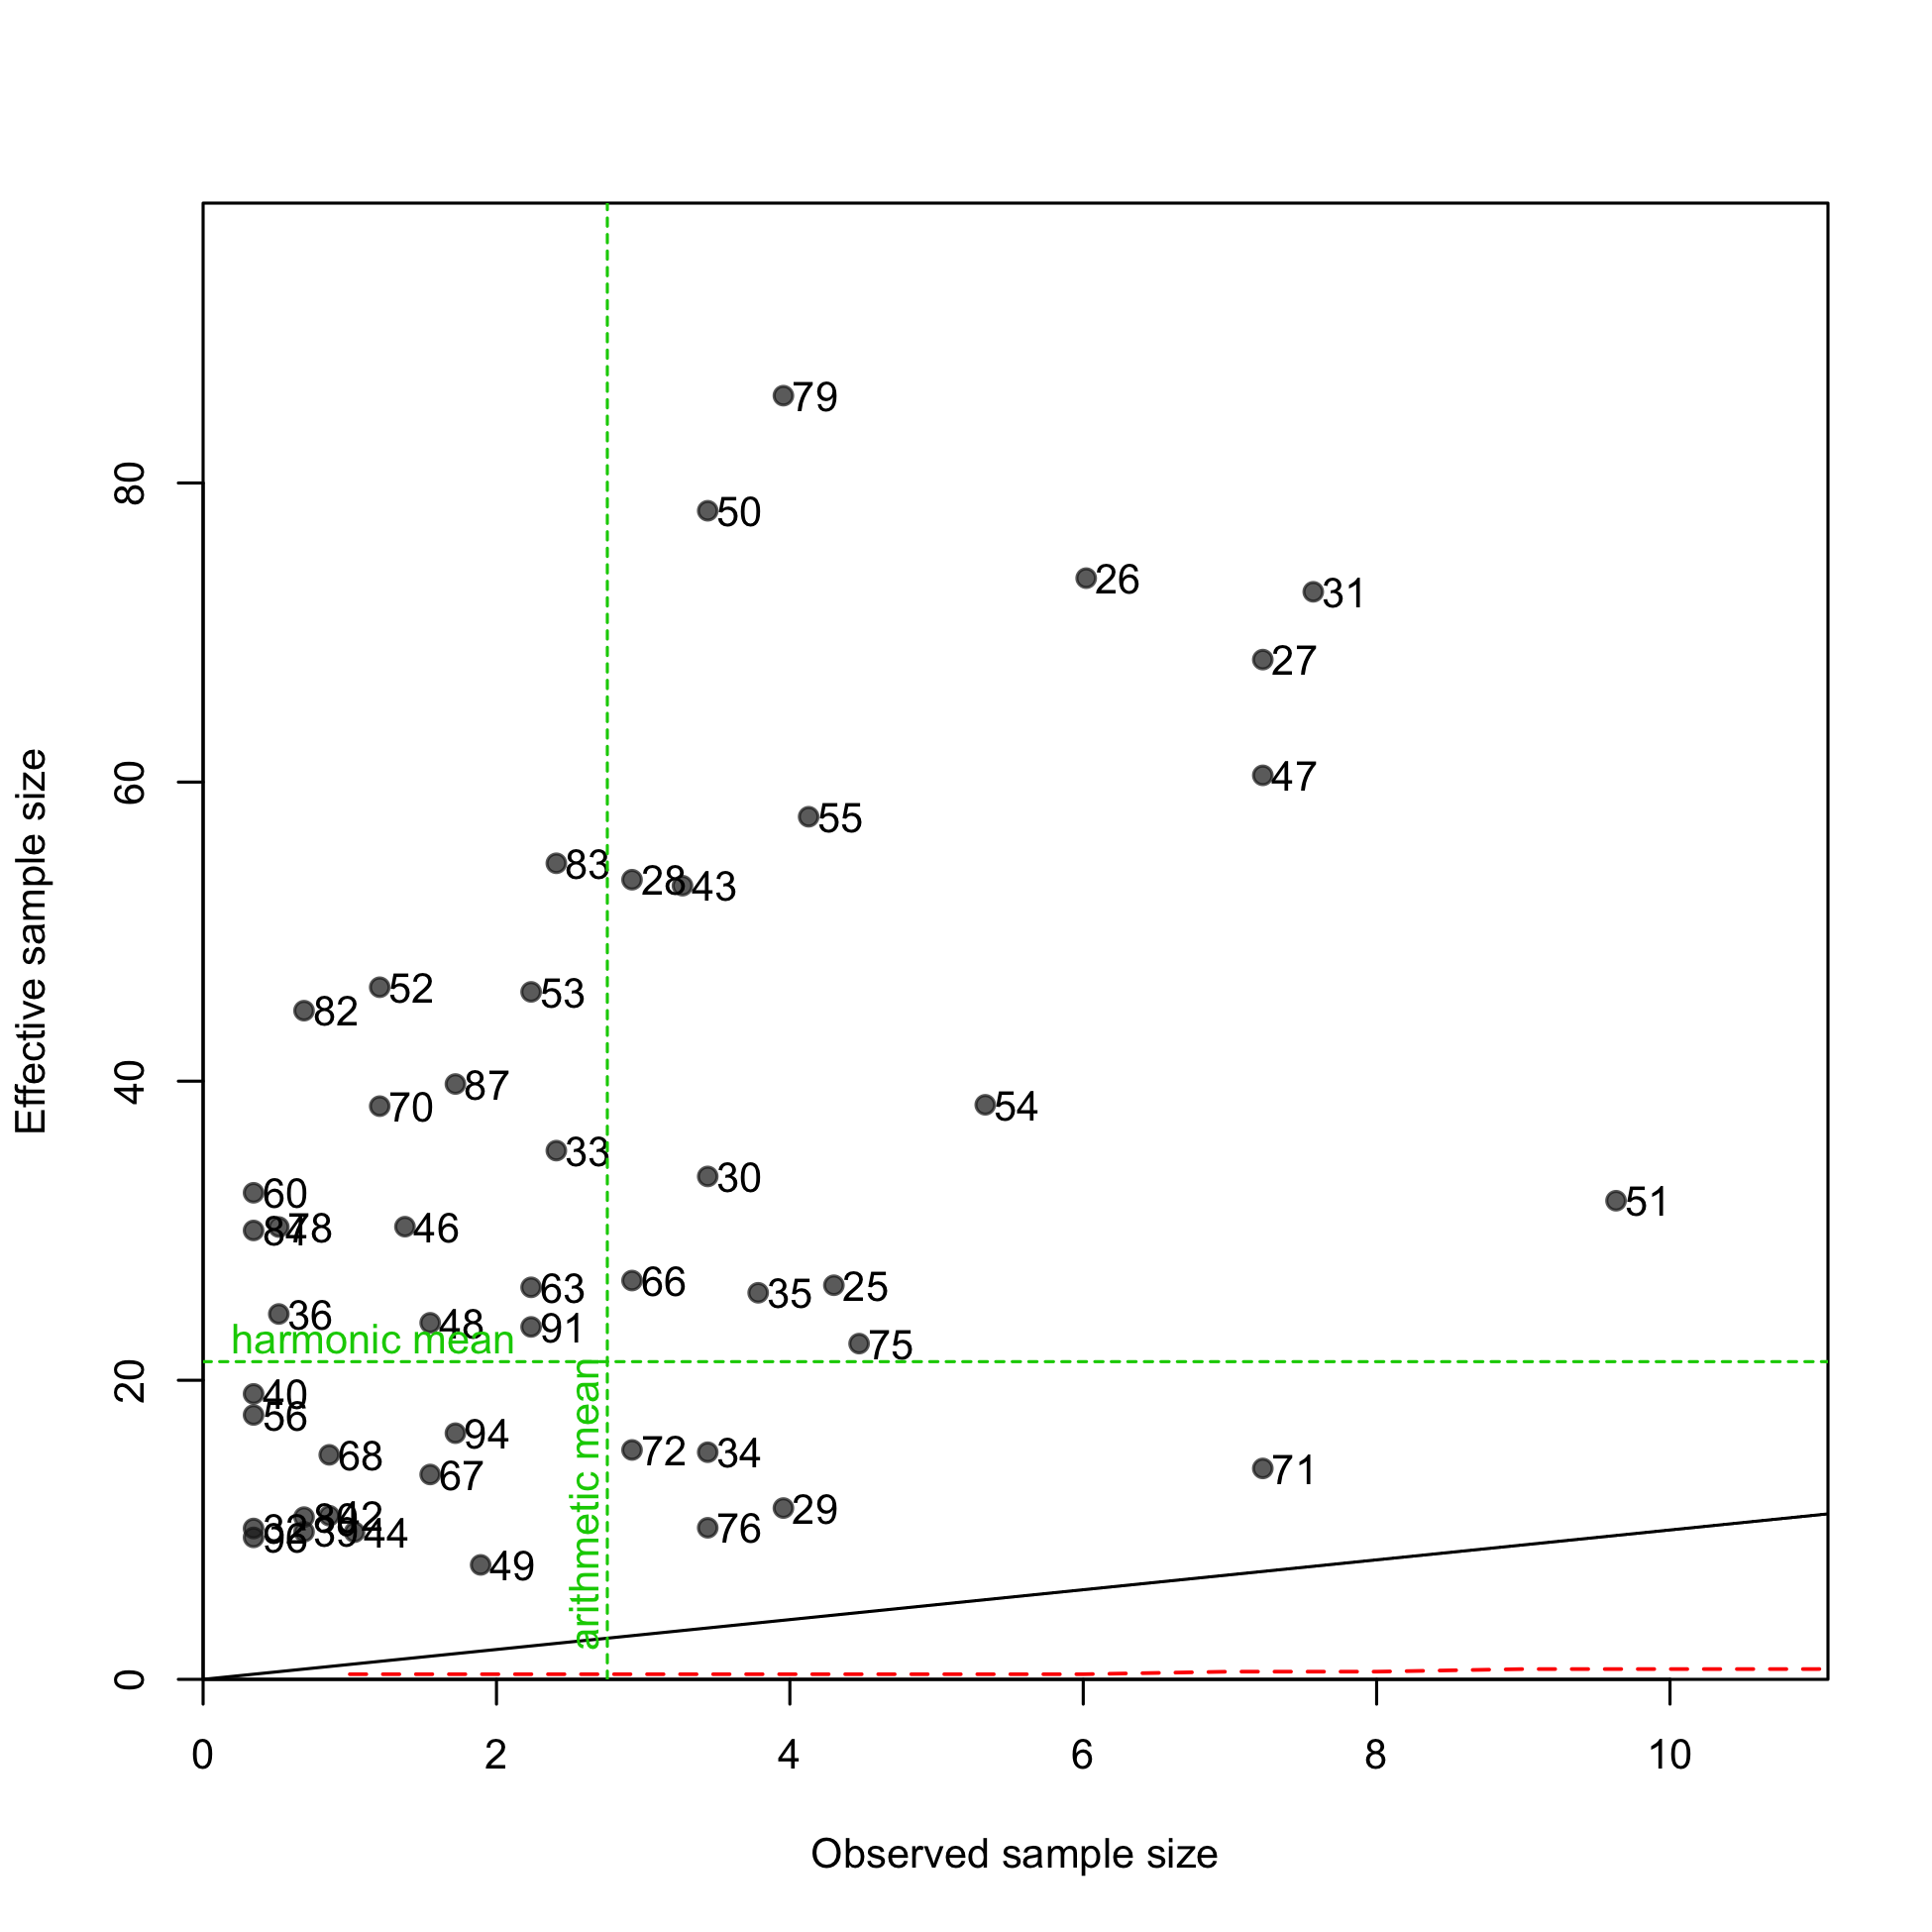
N-EffN comparison, Length comps, whole catch, F12-NOA-N
file: comp_lenfit_sampsize_flt12mkt0.png
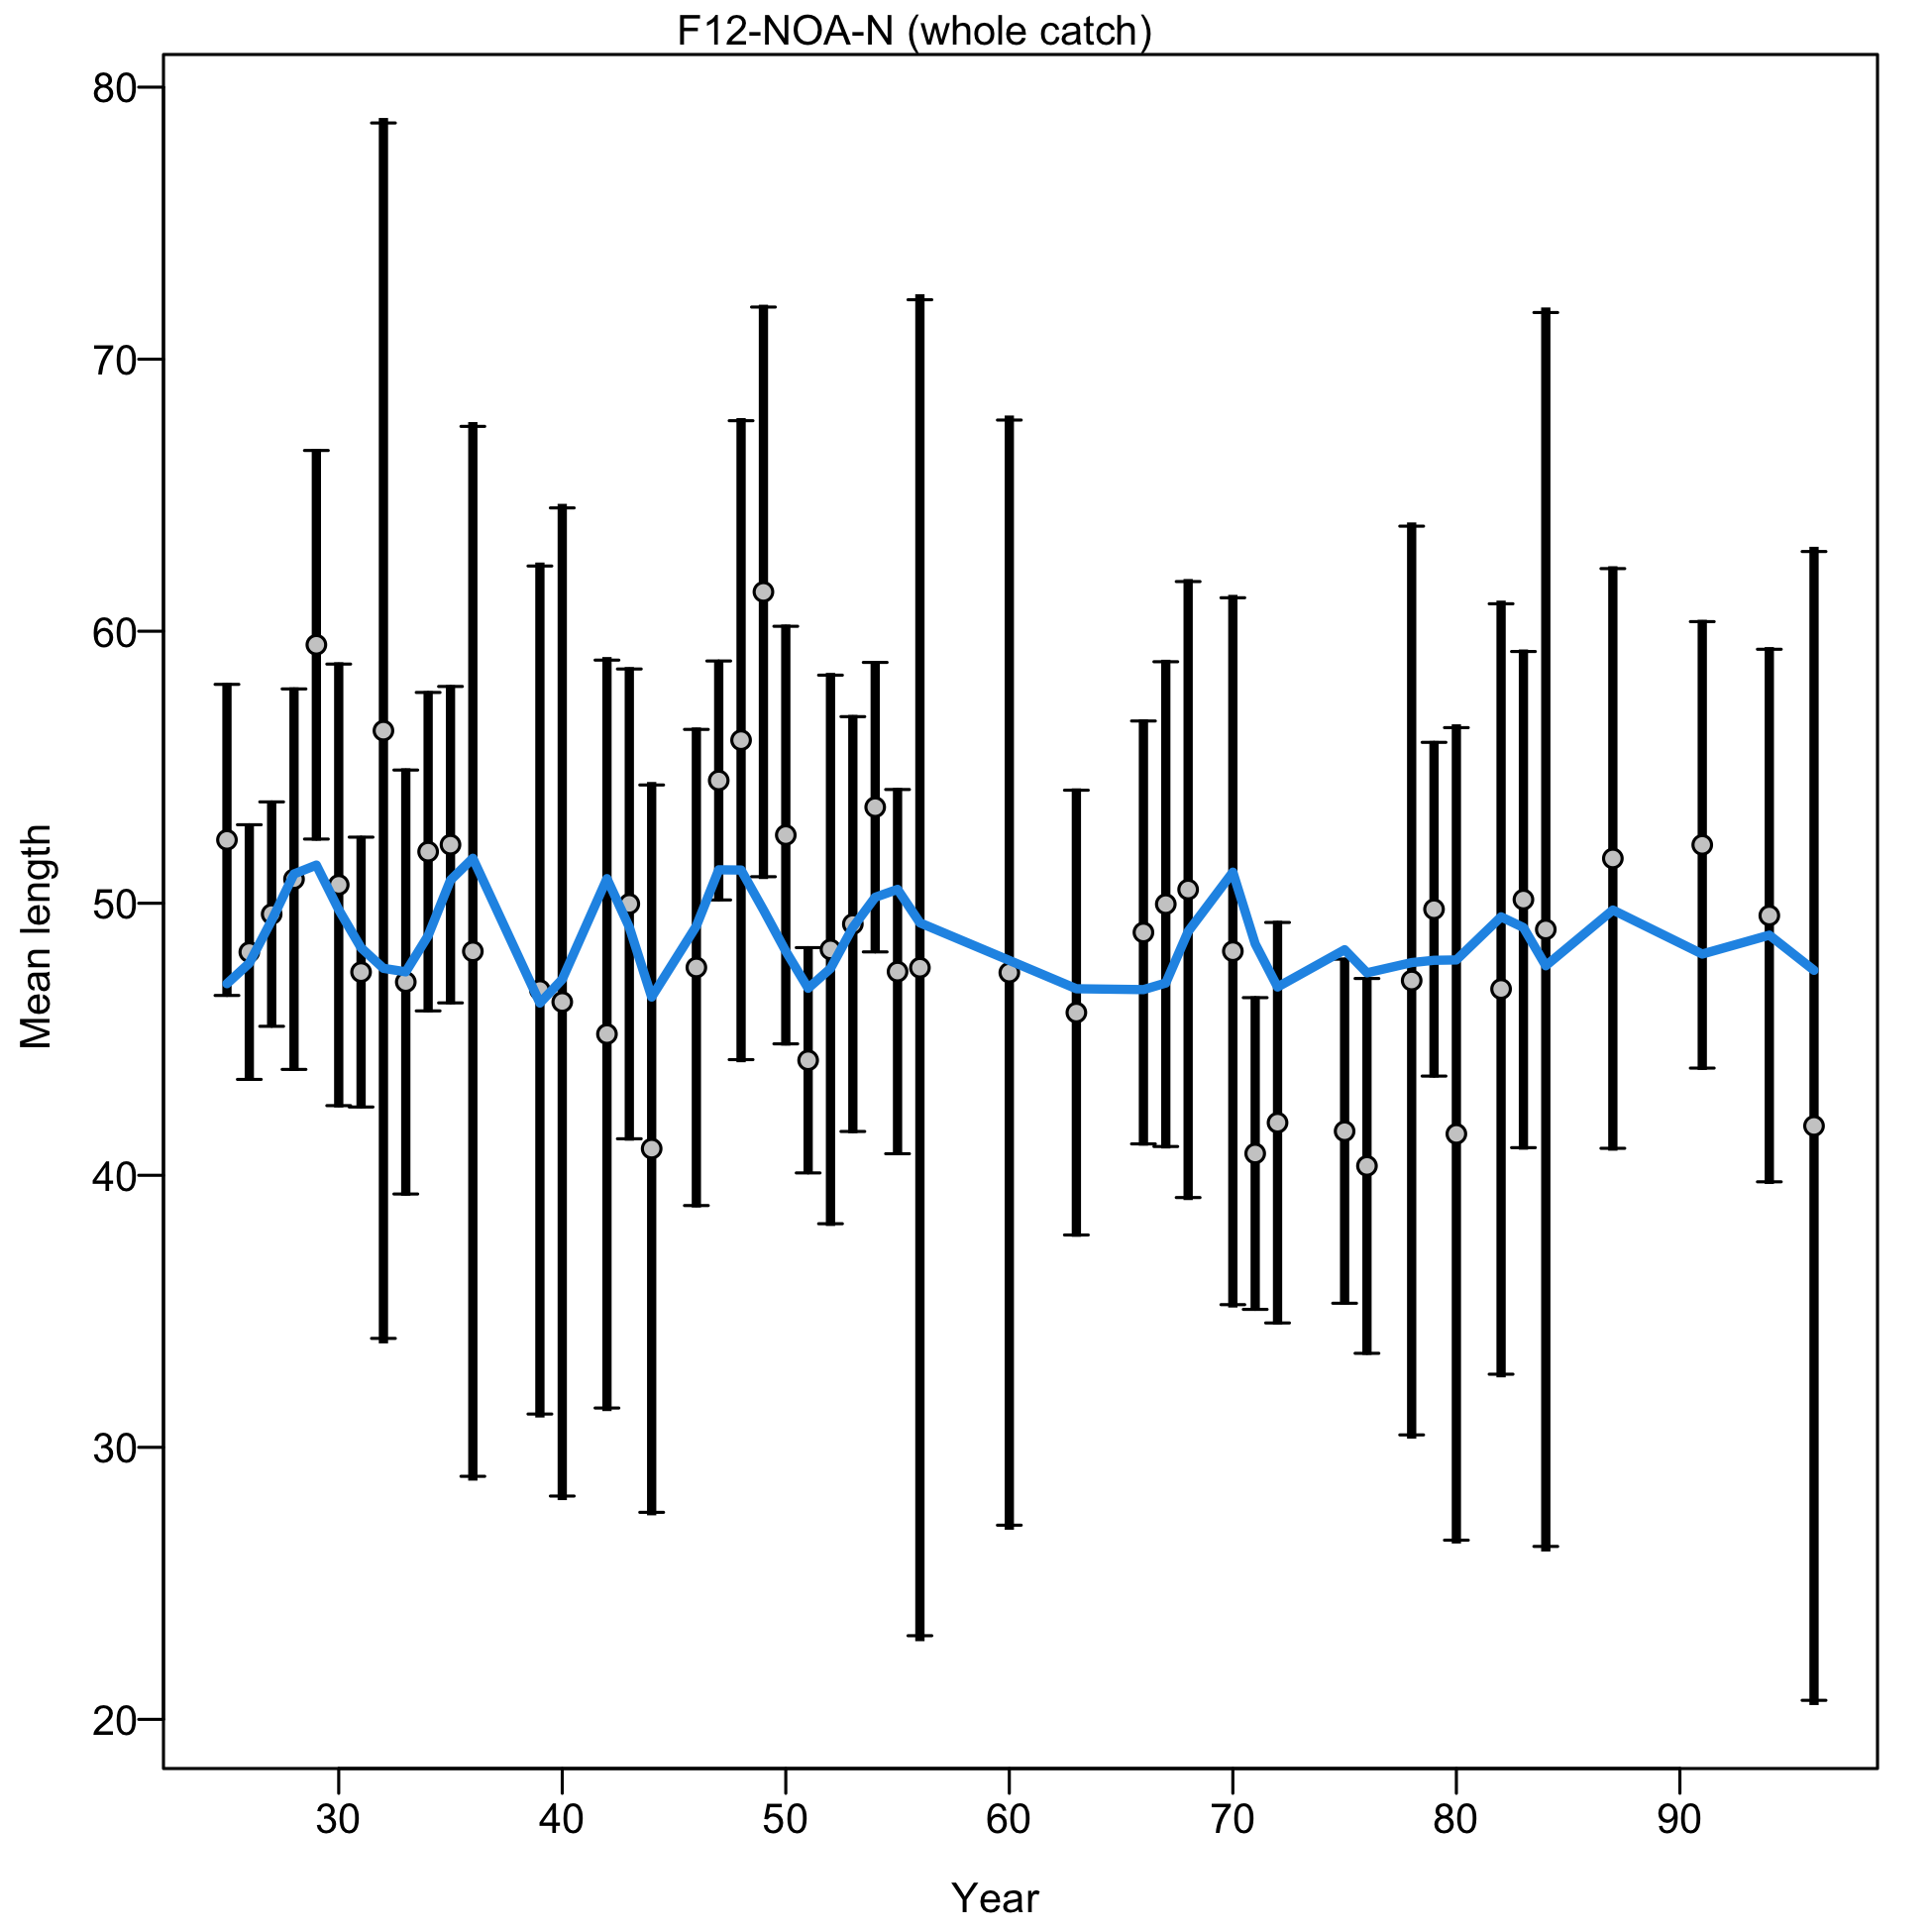
Mean length for F12-NOA-N with 95% confidence intervals based on current sample sizes.
Francis data weighting method TA1.8: thinner intervals (with capped ends) show result of further adjusting sample sizes based on suggested multiplier (with 95% interval) for len data from F12-NOA-N:
1.0165 (0.6704-1.7741)
For more info, see Francis (2011).
file: comp_lenfit_data_weighting_TA1.8_F12-NOA-N.png
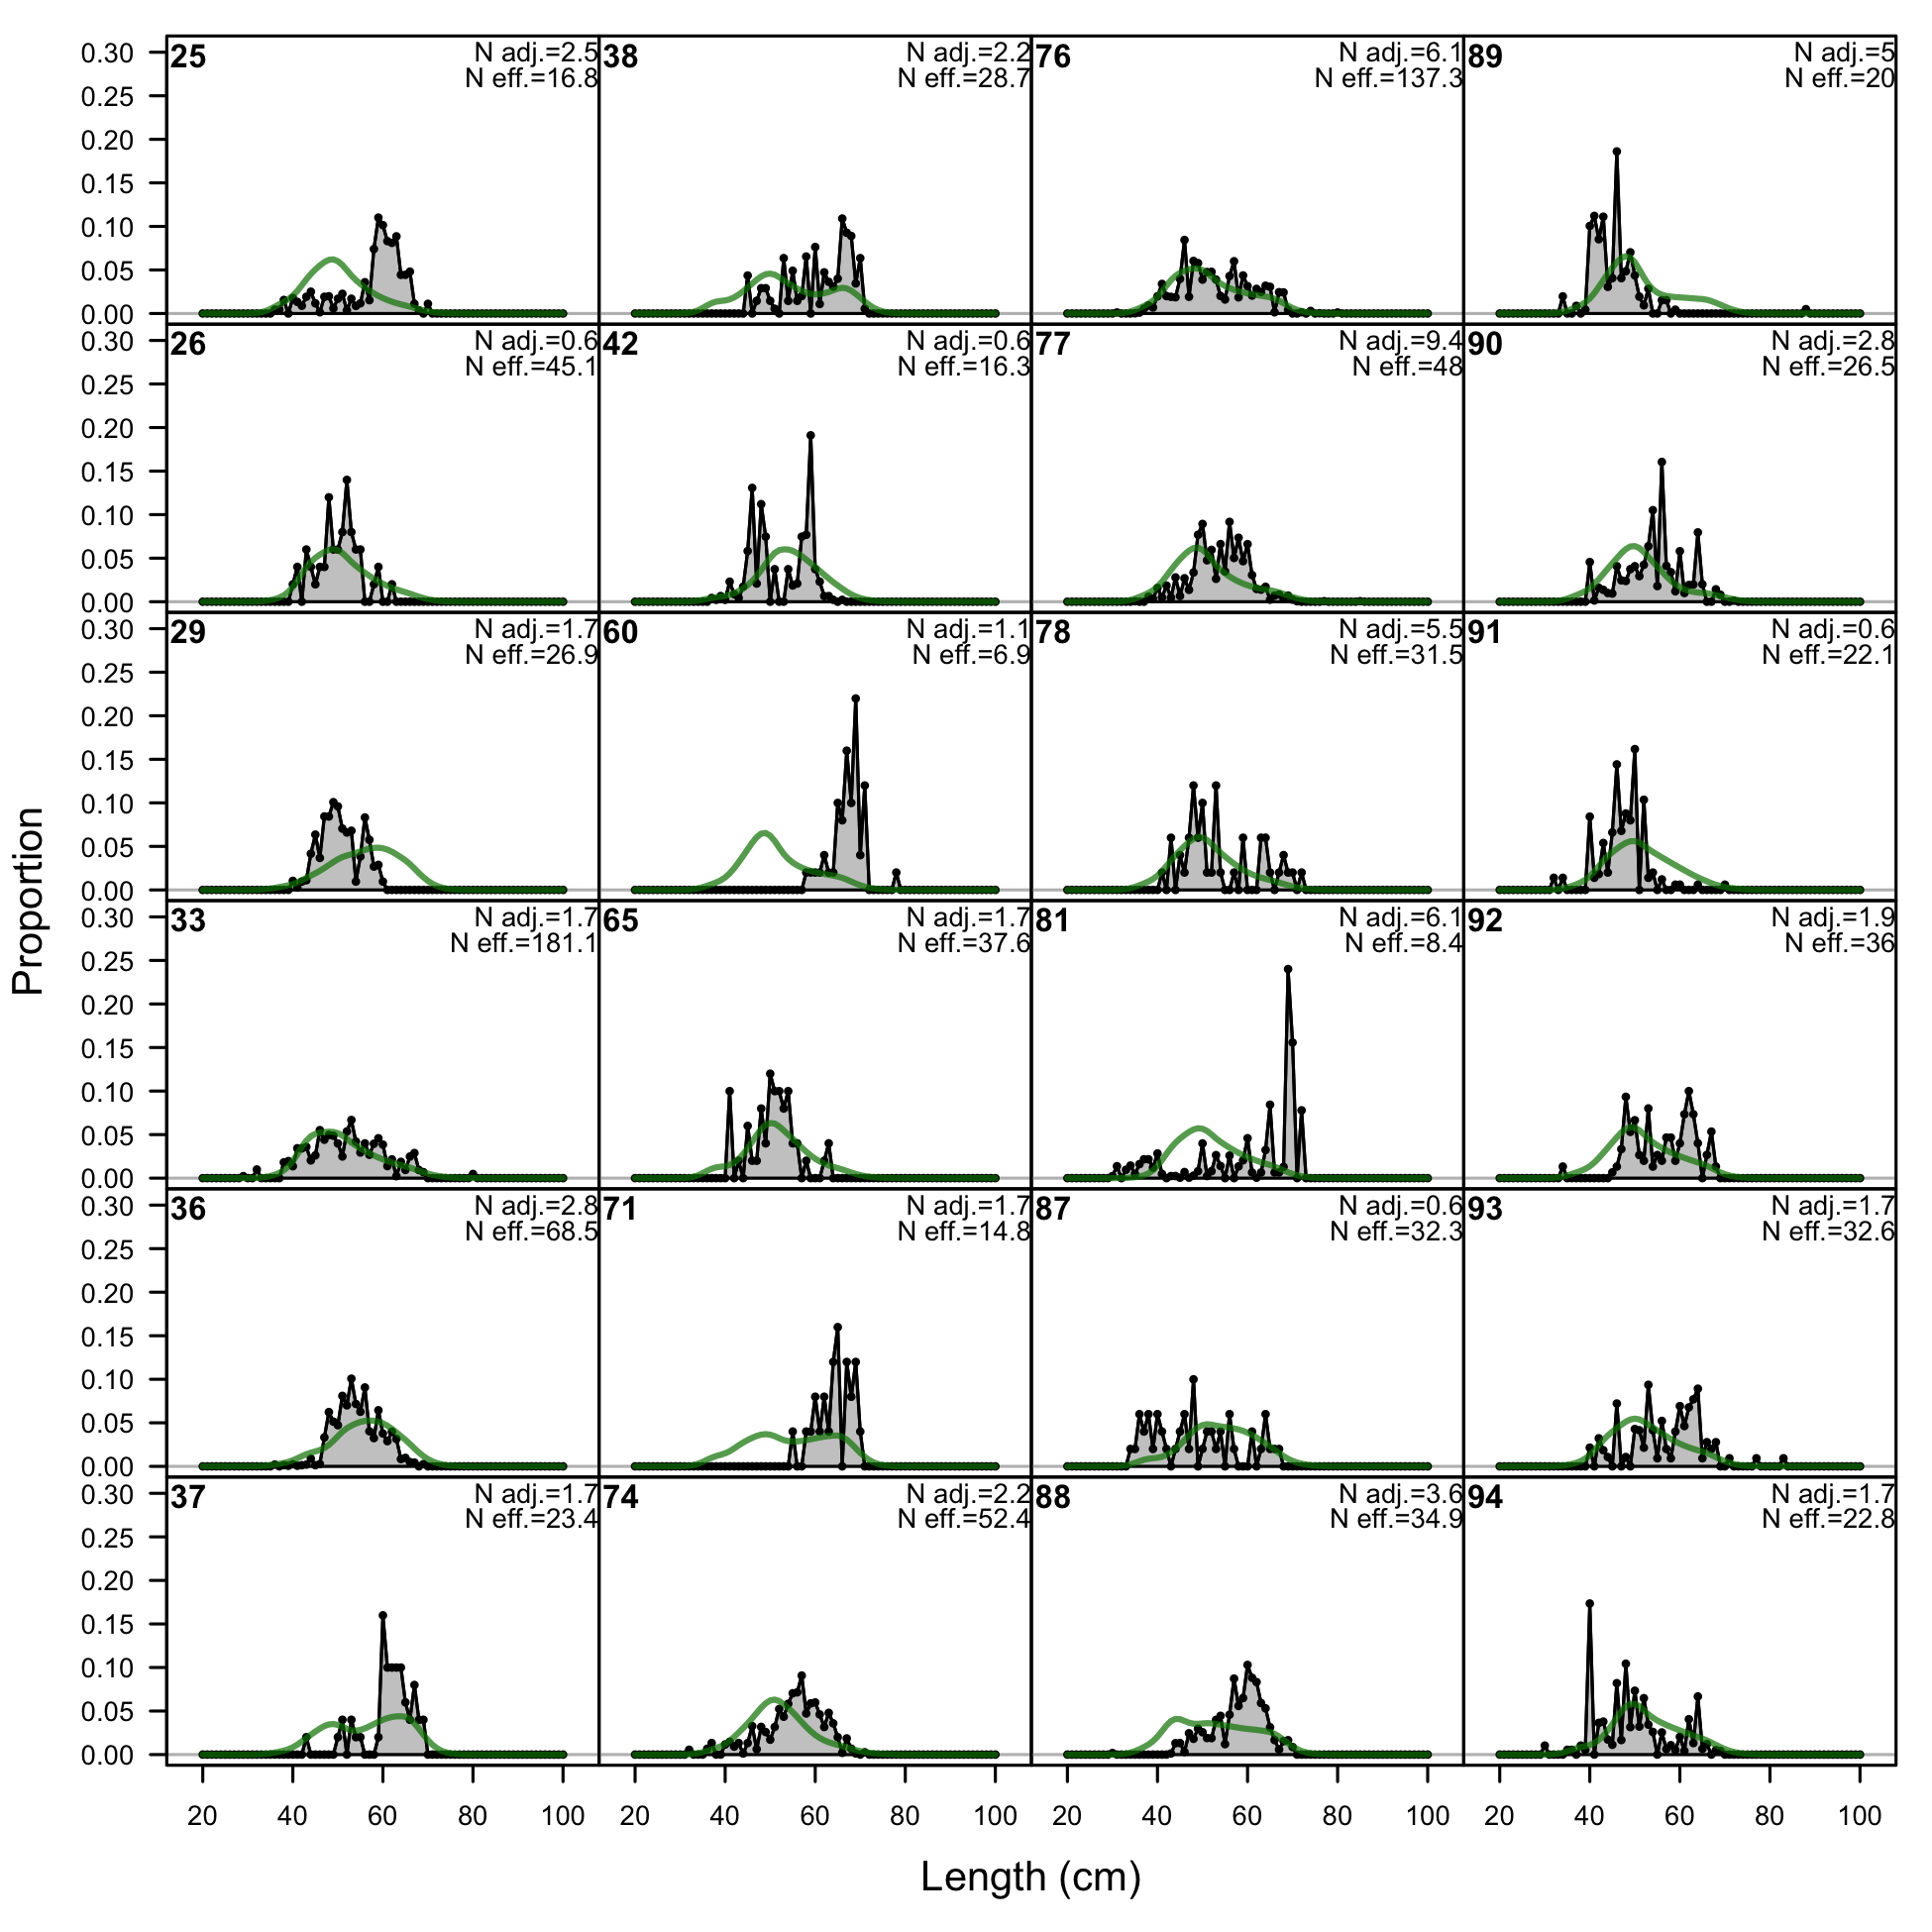
Length comps, whole catch, F13-DEL-N (plot 1 of 3).
'N adj.' is the input sample size after data-weighting adjustment. N eff. is the calculated effective sample size used in the McAllister-Ianelli tuning method.
file: comp_lenfit_flt13mkt0_page1.png
Length comps, whole catch, F13-DEL-N (plot 1 of 3).
'N adj.' is the input sample size after data-weighting adjustment. N eff. is the calculated effective sample size used in the McAllister-Ianelli tuning method. (plot 2 of 3)
file: comp_lenfit_flt13mkt0_page2.png
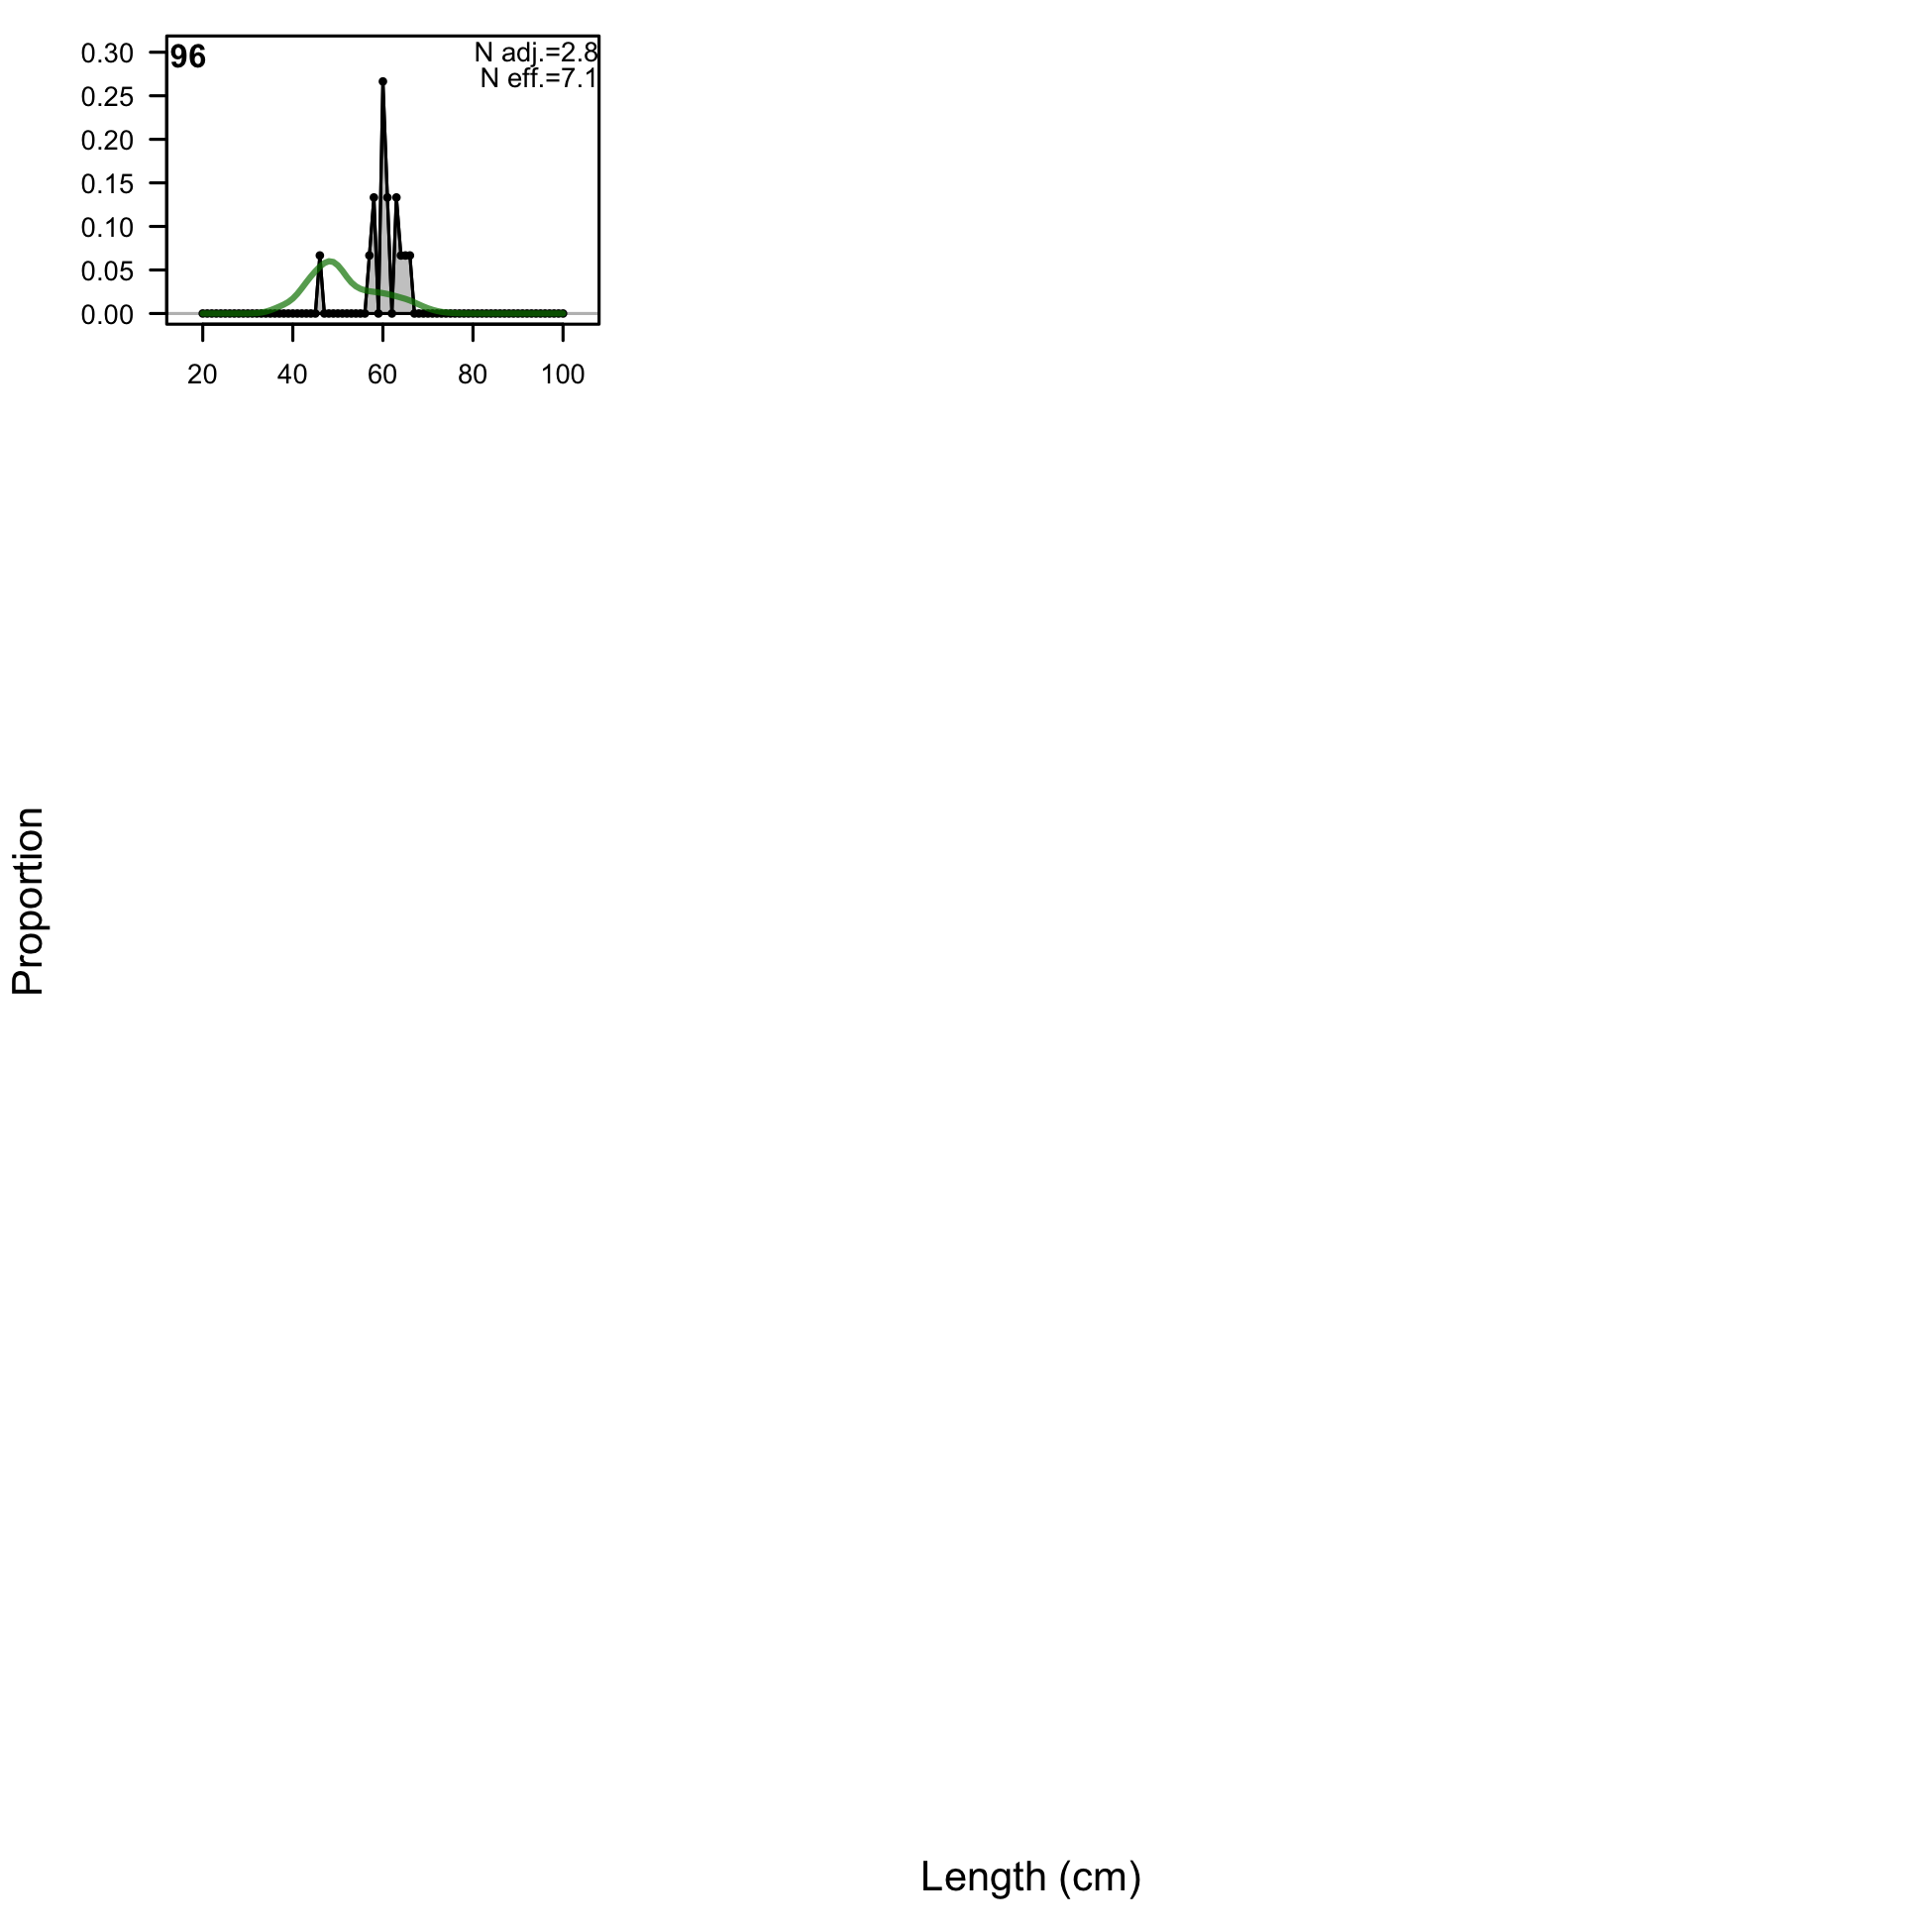
Length comps, whole catch, F13-DEL-N (plot 1 of 3).
'N adj.' is the input sample size after data-weighting adjustment. N eff. is the calculated effective sample size used in the McAllister-Ianelli tuning method. (plot 2 of 3) (plot 3 of 3)
file: comp_lenfit_flt13mkt0_page3.png
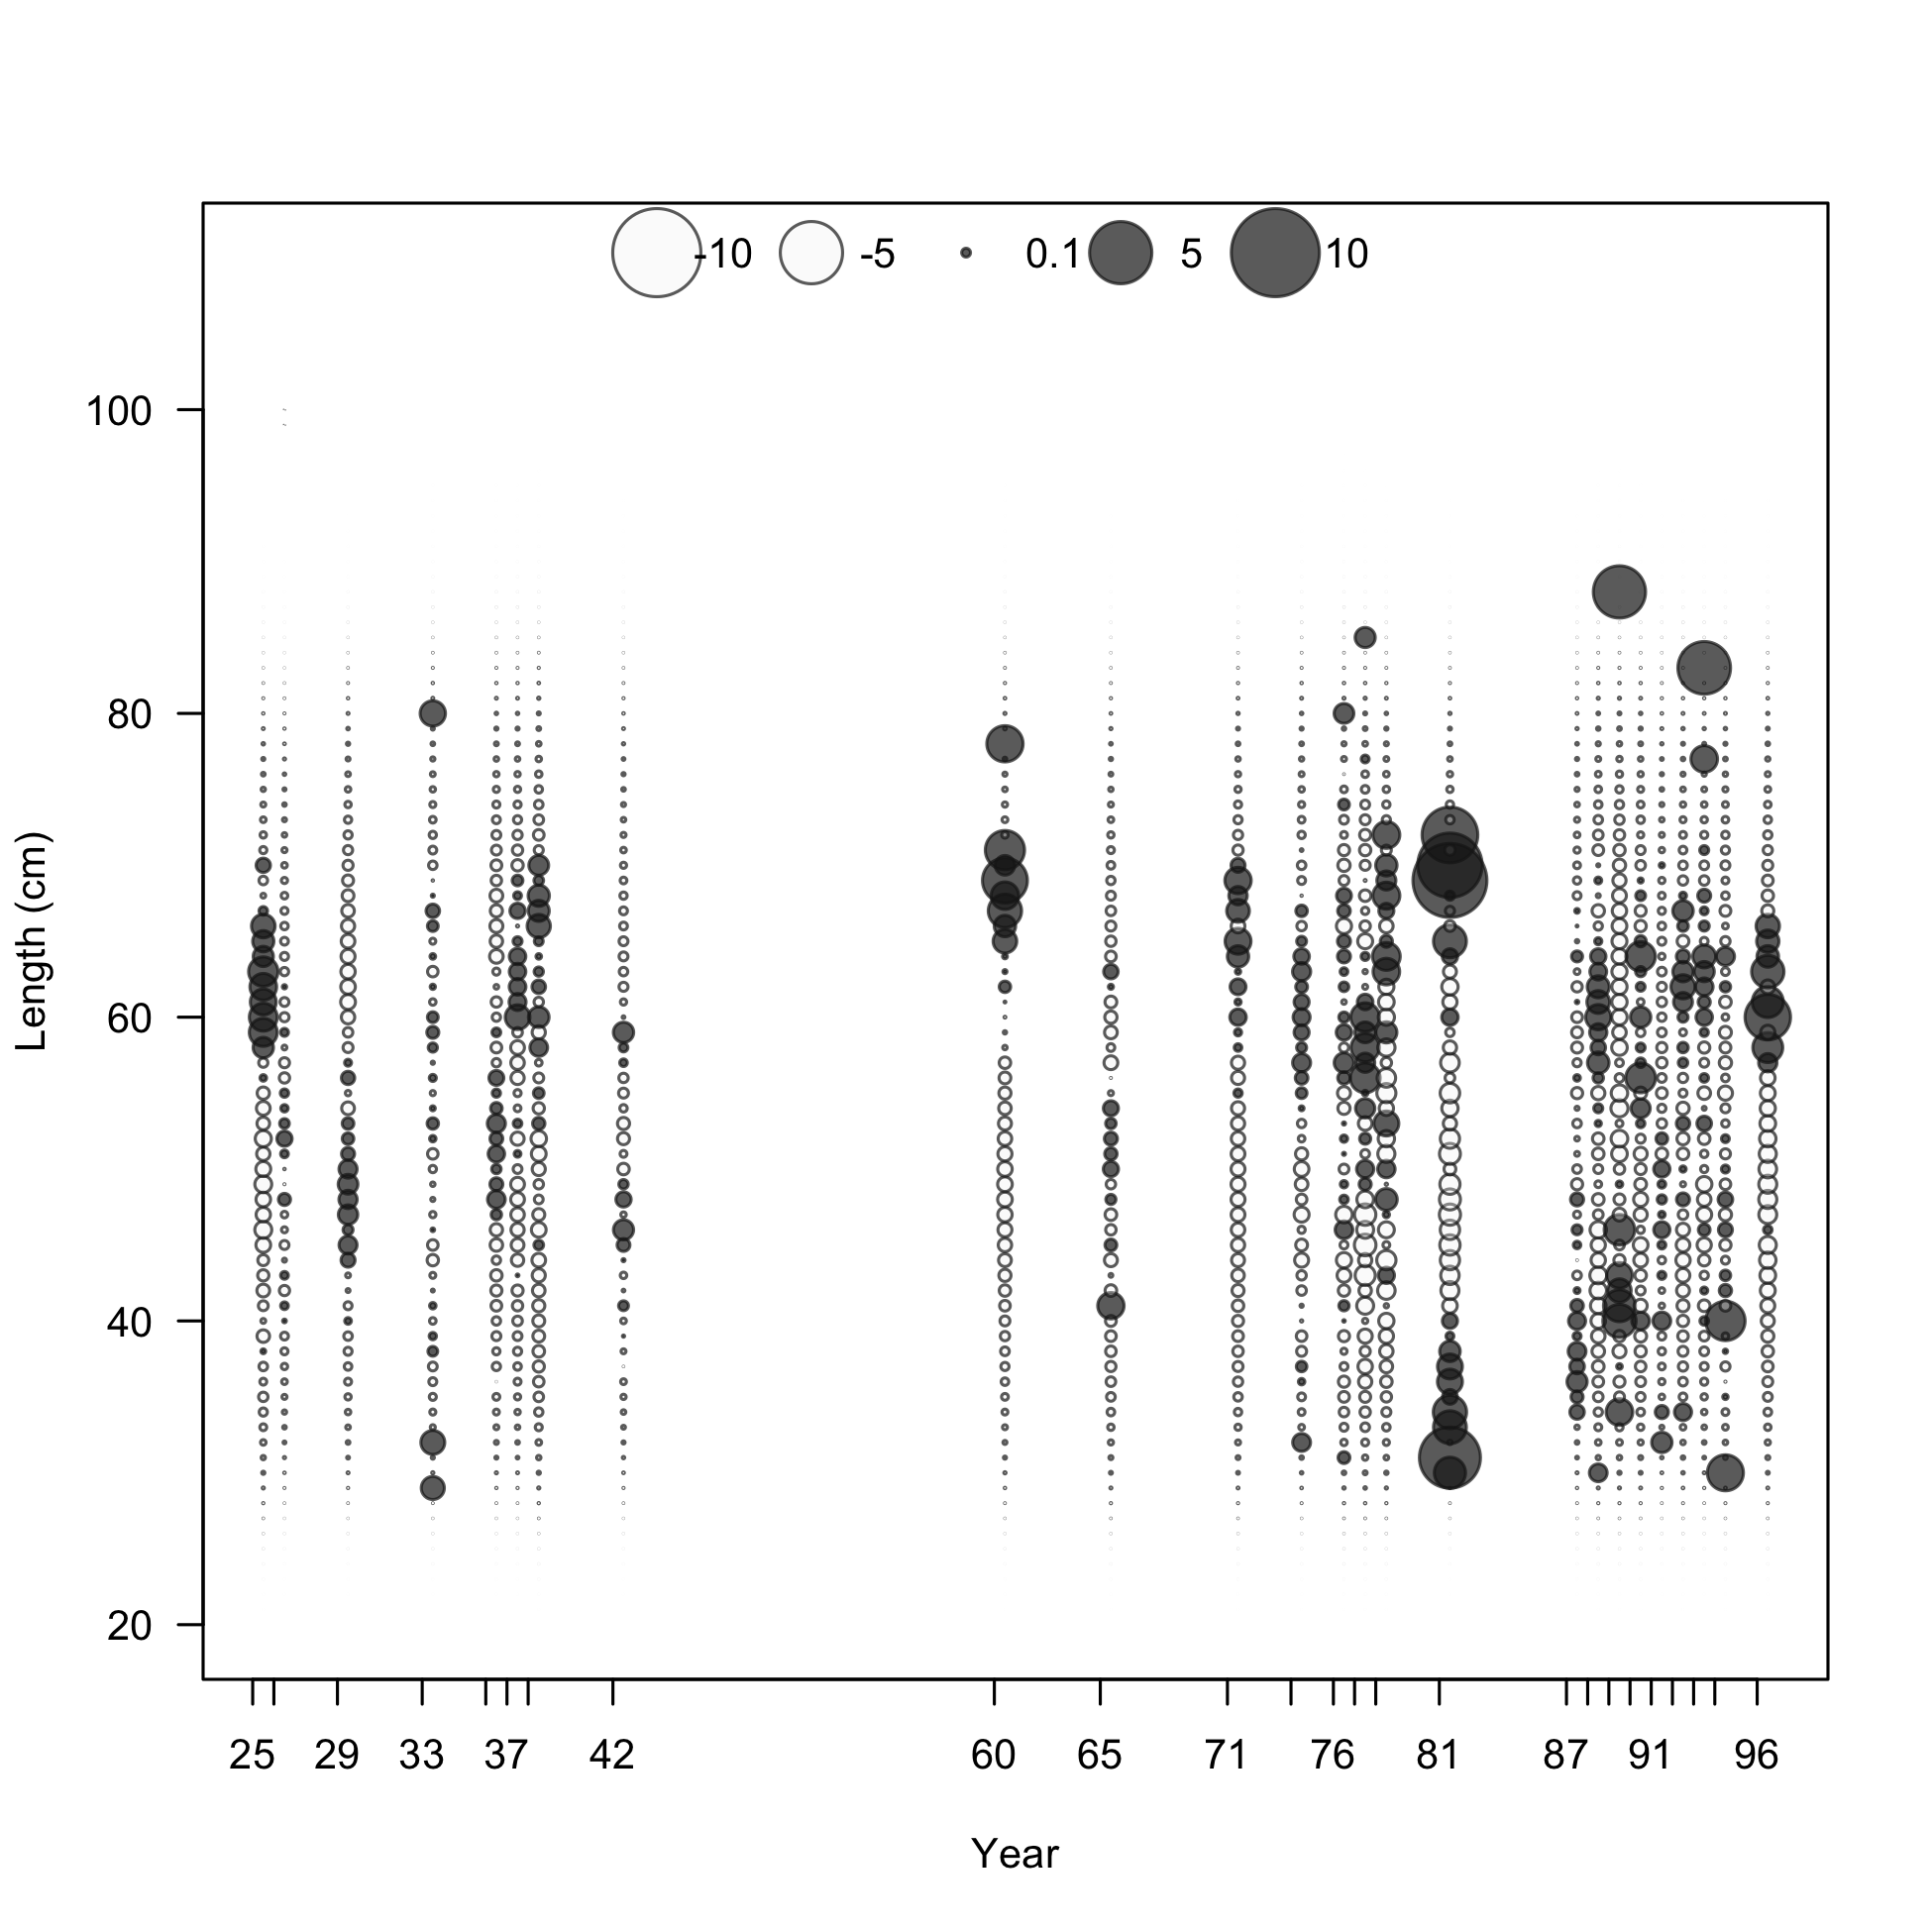
Pearson residuals, whole catch, F13-DEL-N (max=13.67) (plot 3 of 3)
Closed bubbles are positive residuals (observed > expected) and open bubbles are negative residuals (observed < expected).
file: comp_lenfit_residsflt13mkt0_page3.png
N-EffN comparison, Length comps, whole catch, F13-DEL-N
file: comp_lenfit_sampsize_flt13mkt0.png
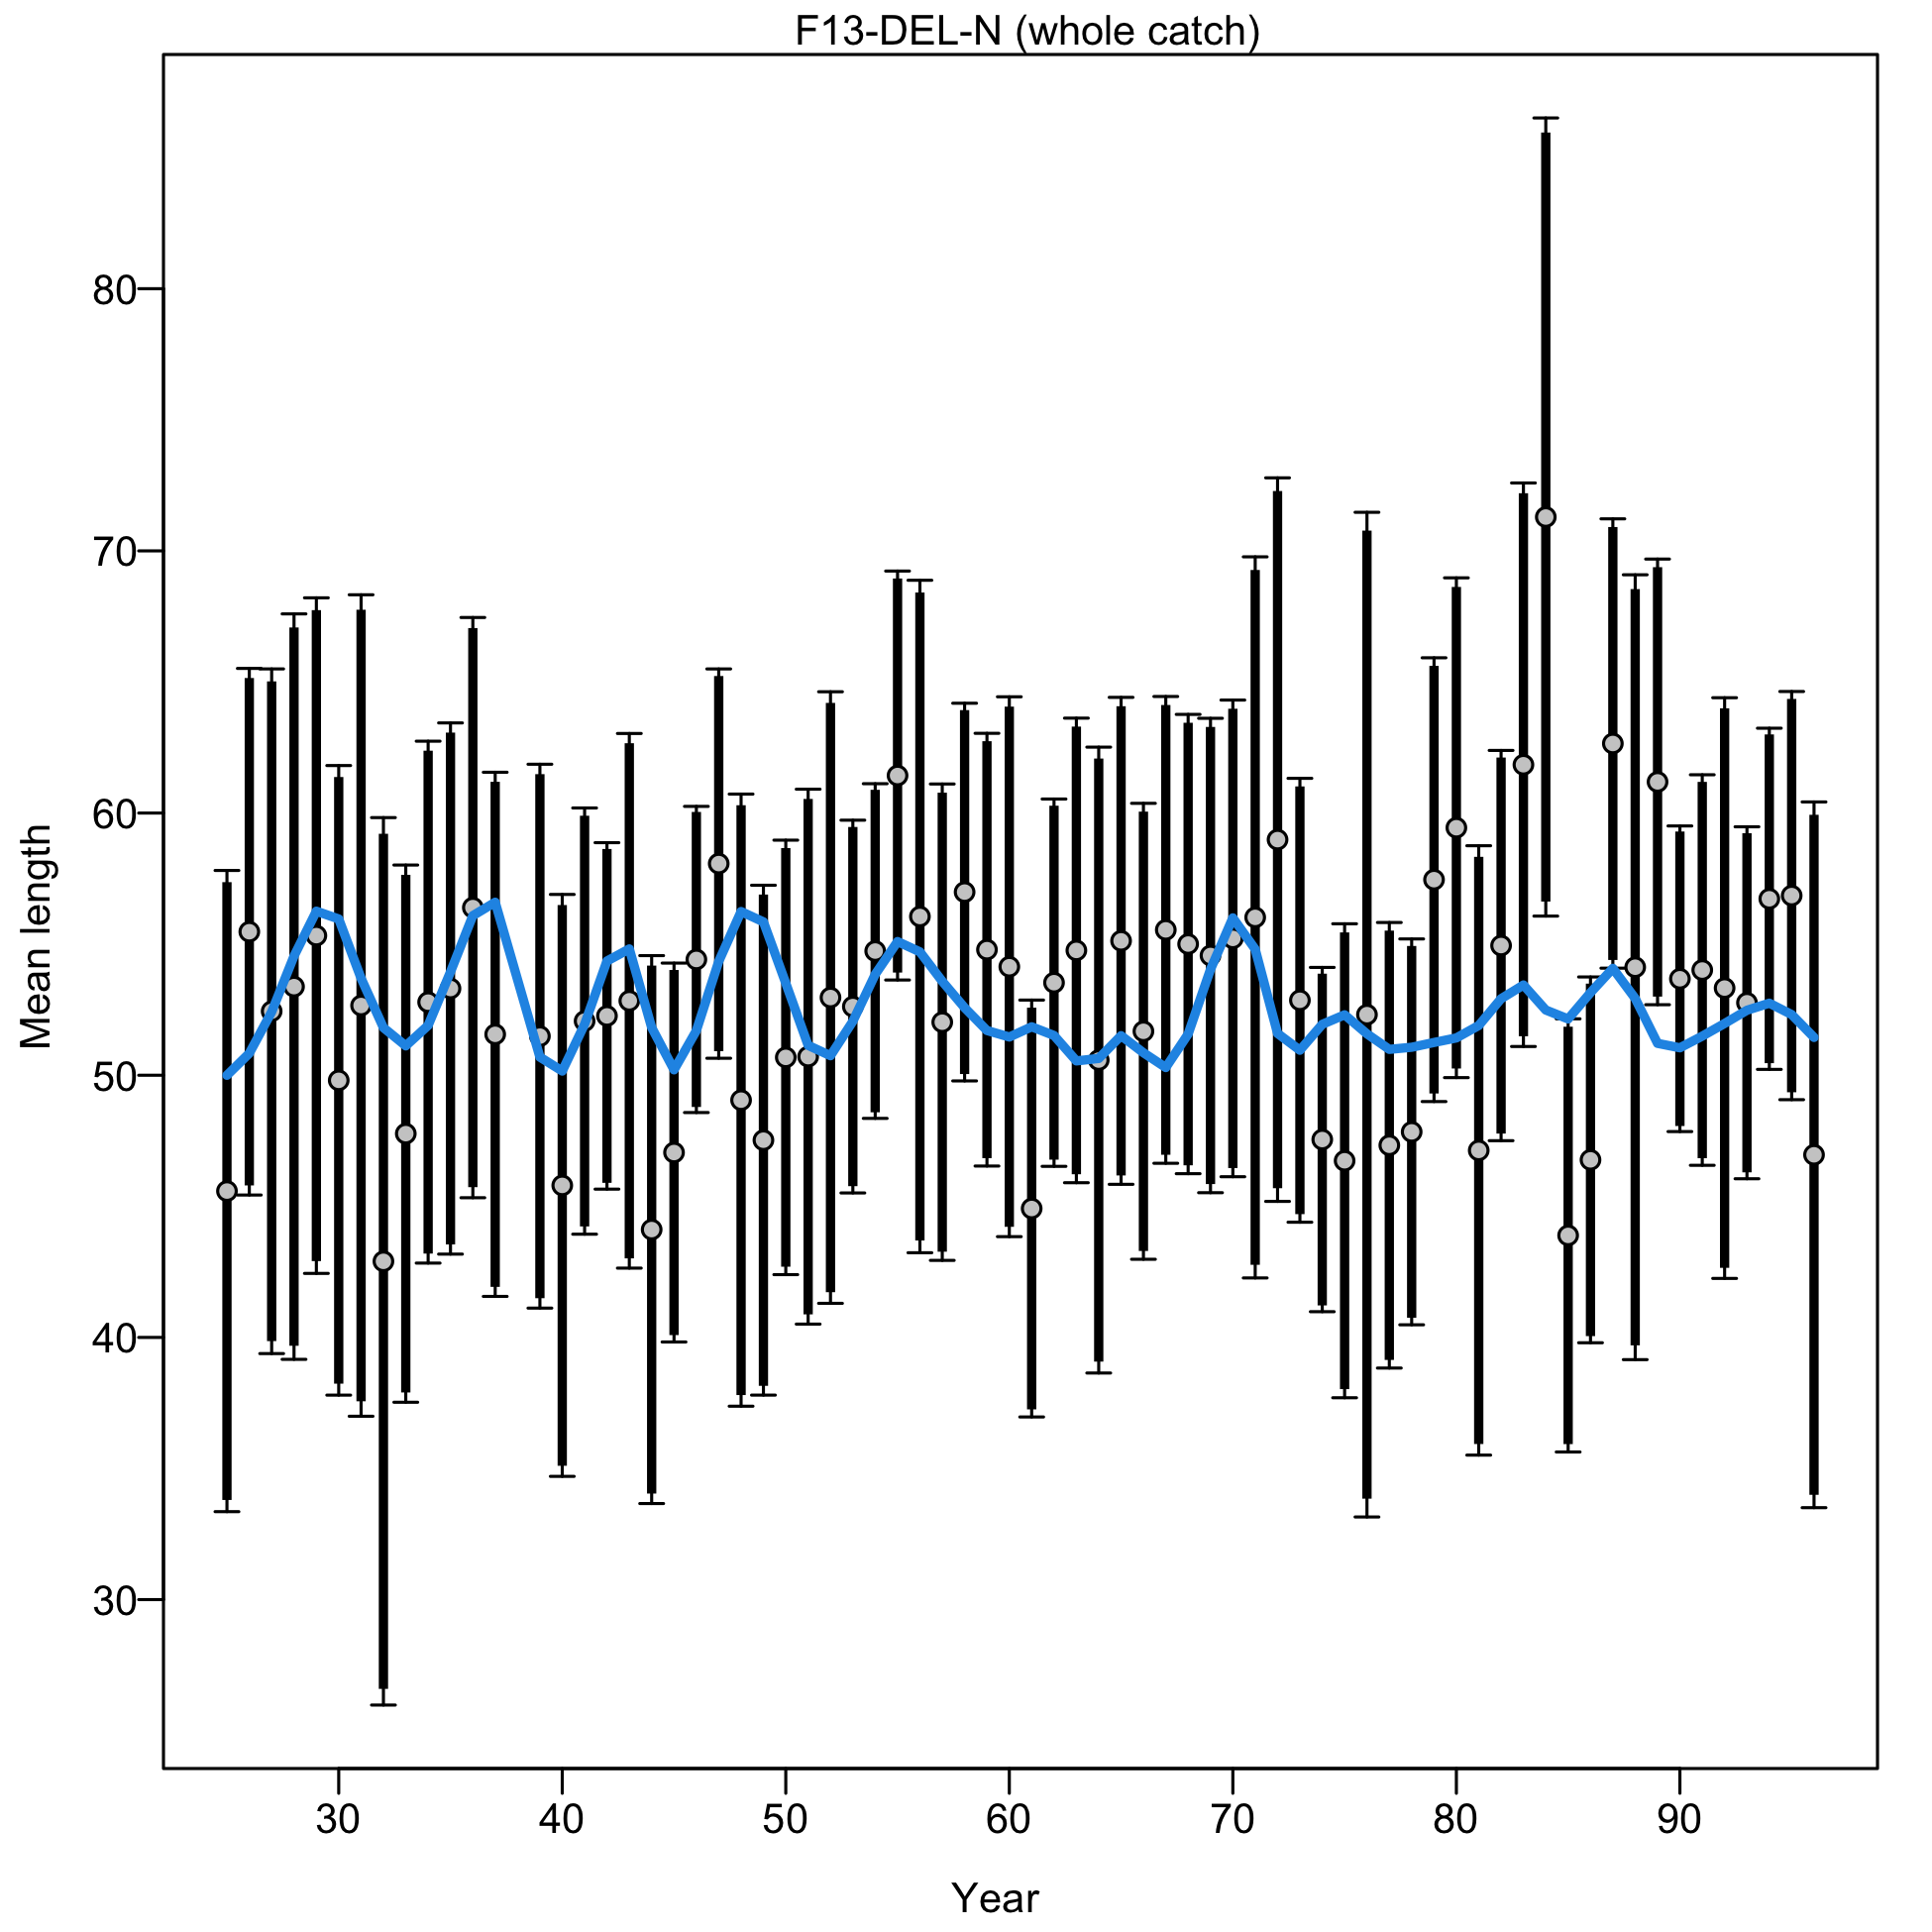
Mean length for F13-DEL-N with 95% confidence intervals based on current sample sizes.
Francis data weighting method TA1.8: thinner intervals (with capped ends) show result of further adjusting sample sizes based on suggested multiplier (with 95% interval) for len data from F13-DEL-N:
0.9284 (0.6993-1.3029)
For more info, see Francis (2011).
file: comp_lenfit_data_weighting_TA1.8_F13-DEL-N.png
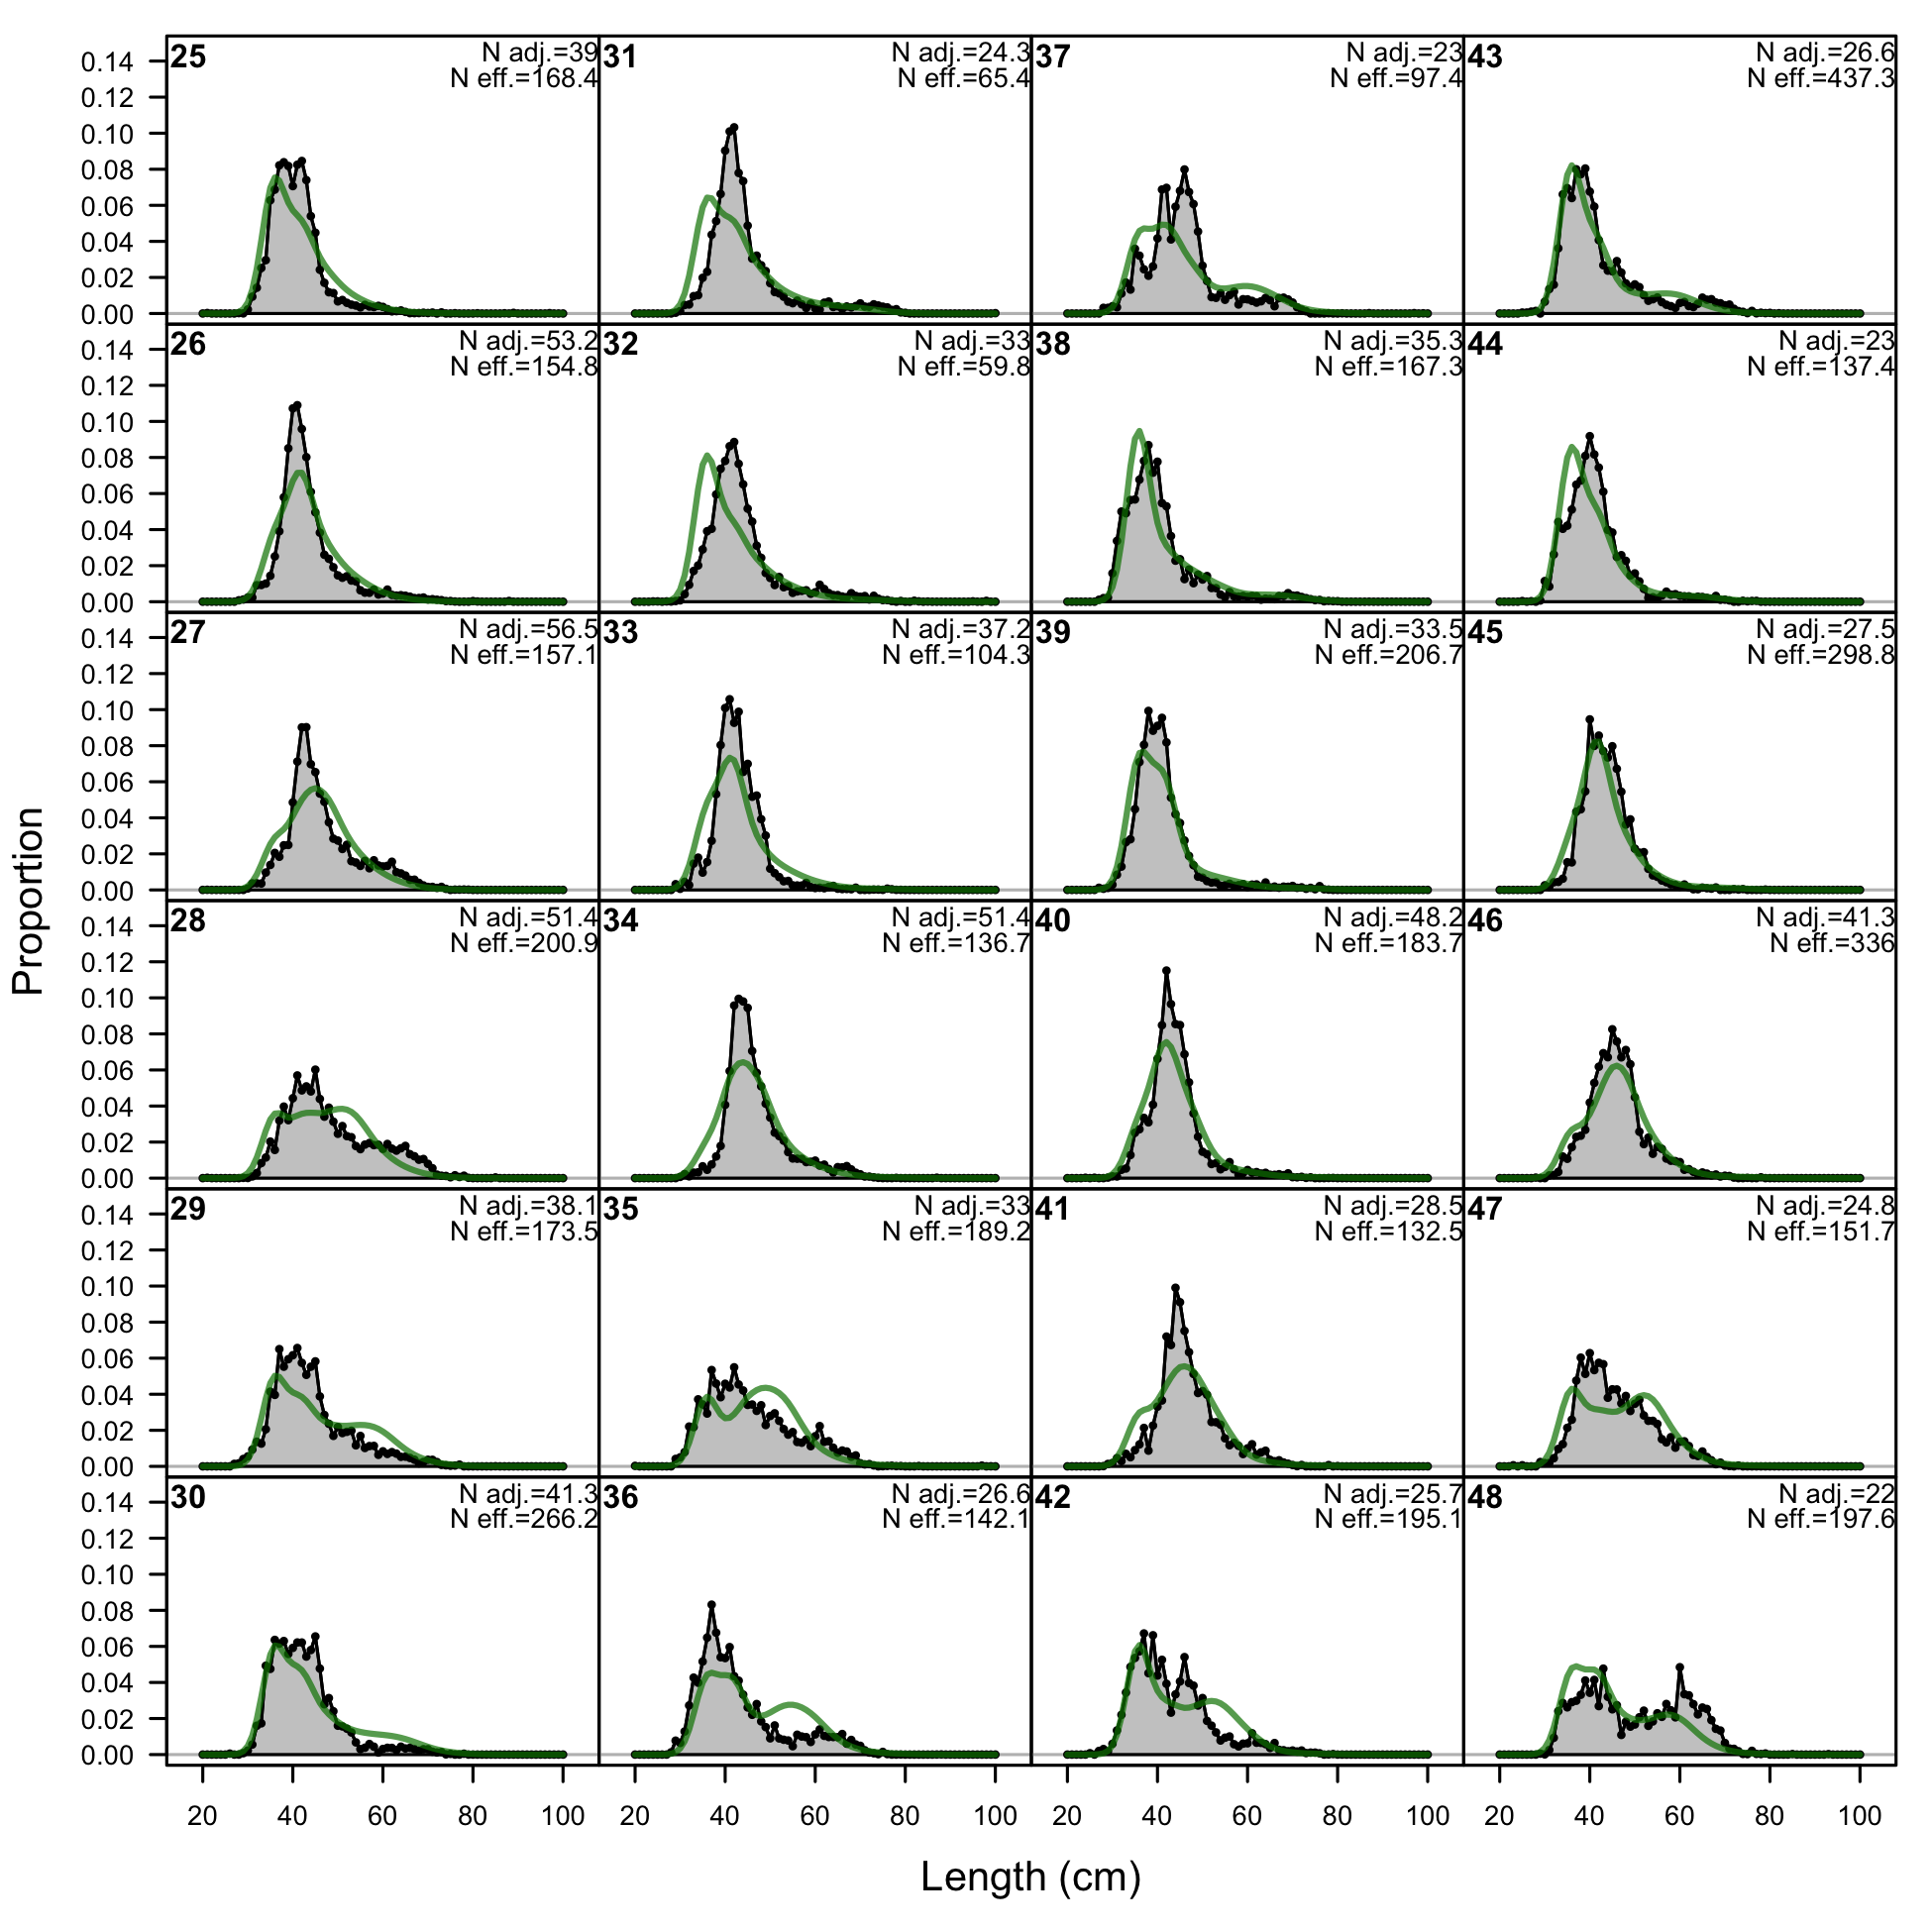
Length comps, whole catch, F14-DEL-S (plot 1 of 2).
'N adj.' is the input sample size after data-weighting adjustment. N eff. is the calculated effective sample size used in the McAllister-Ianelli tuning method.
file: comp_lenfit_flt14mkt0_page1.png
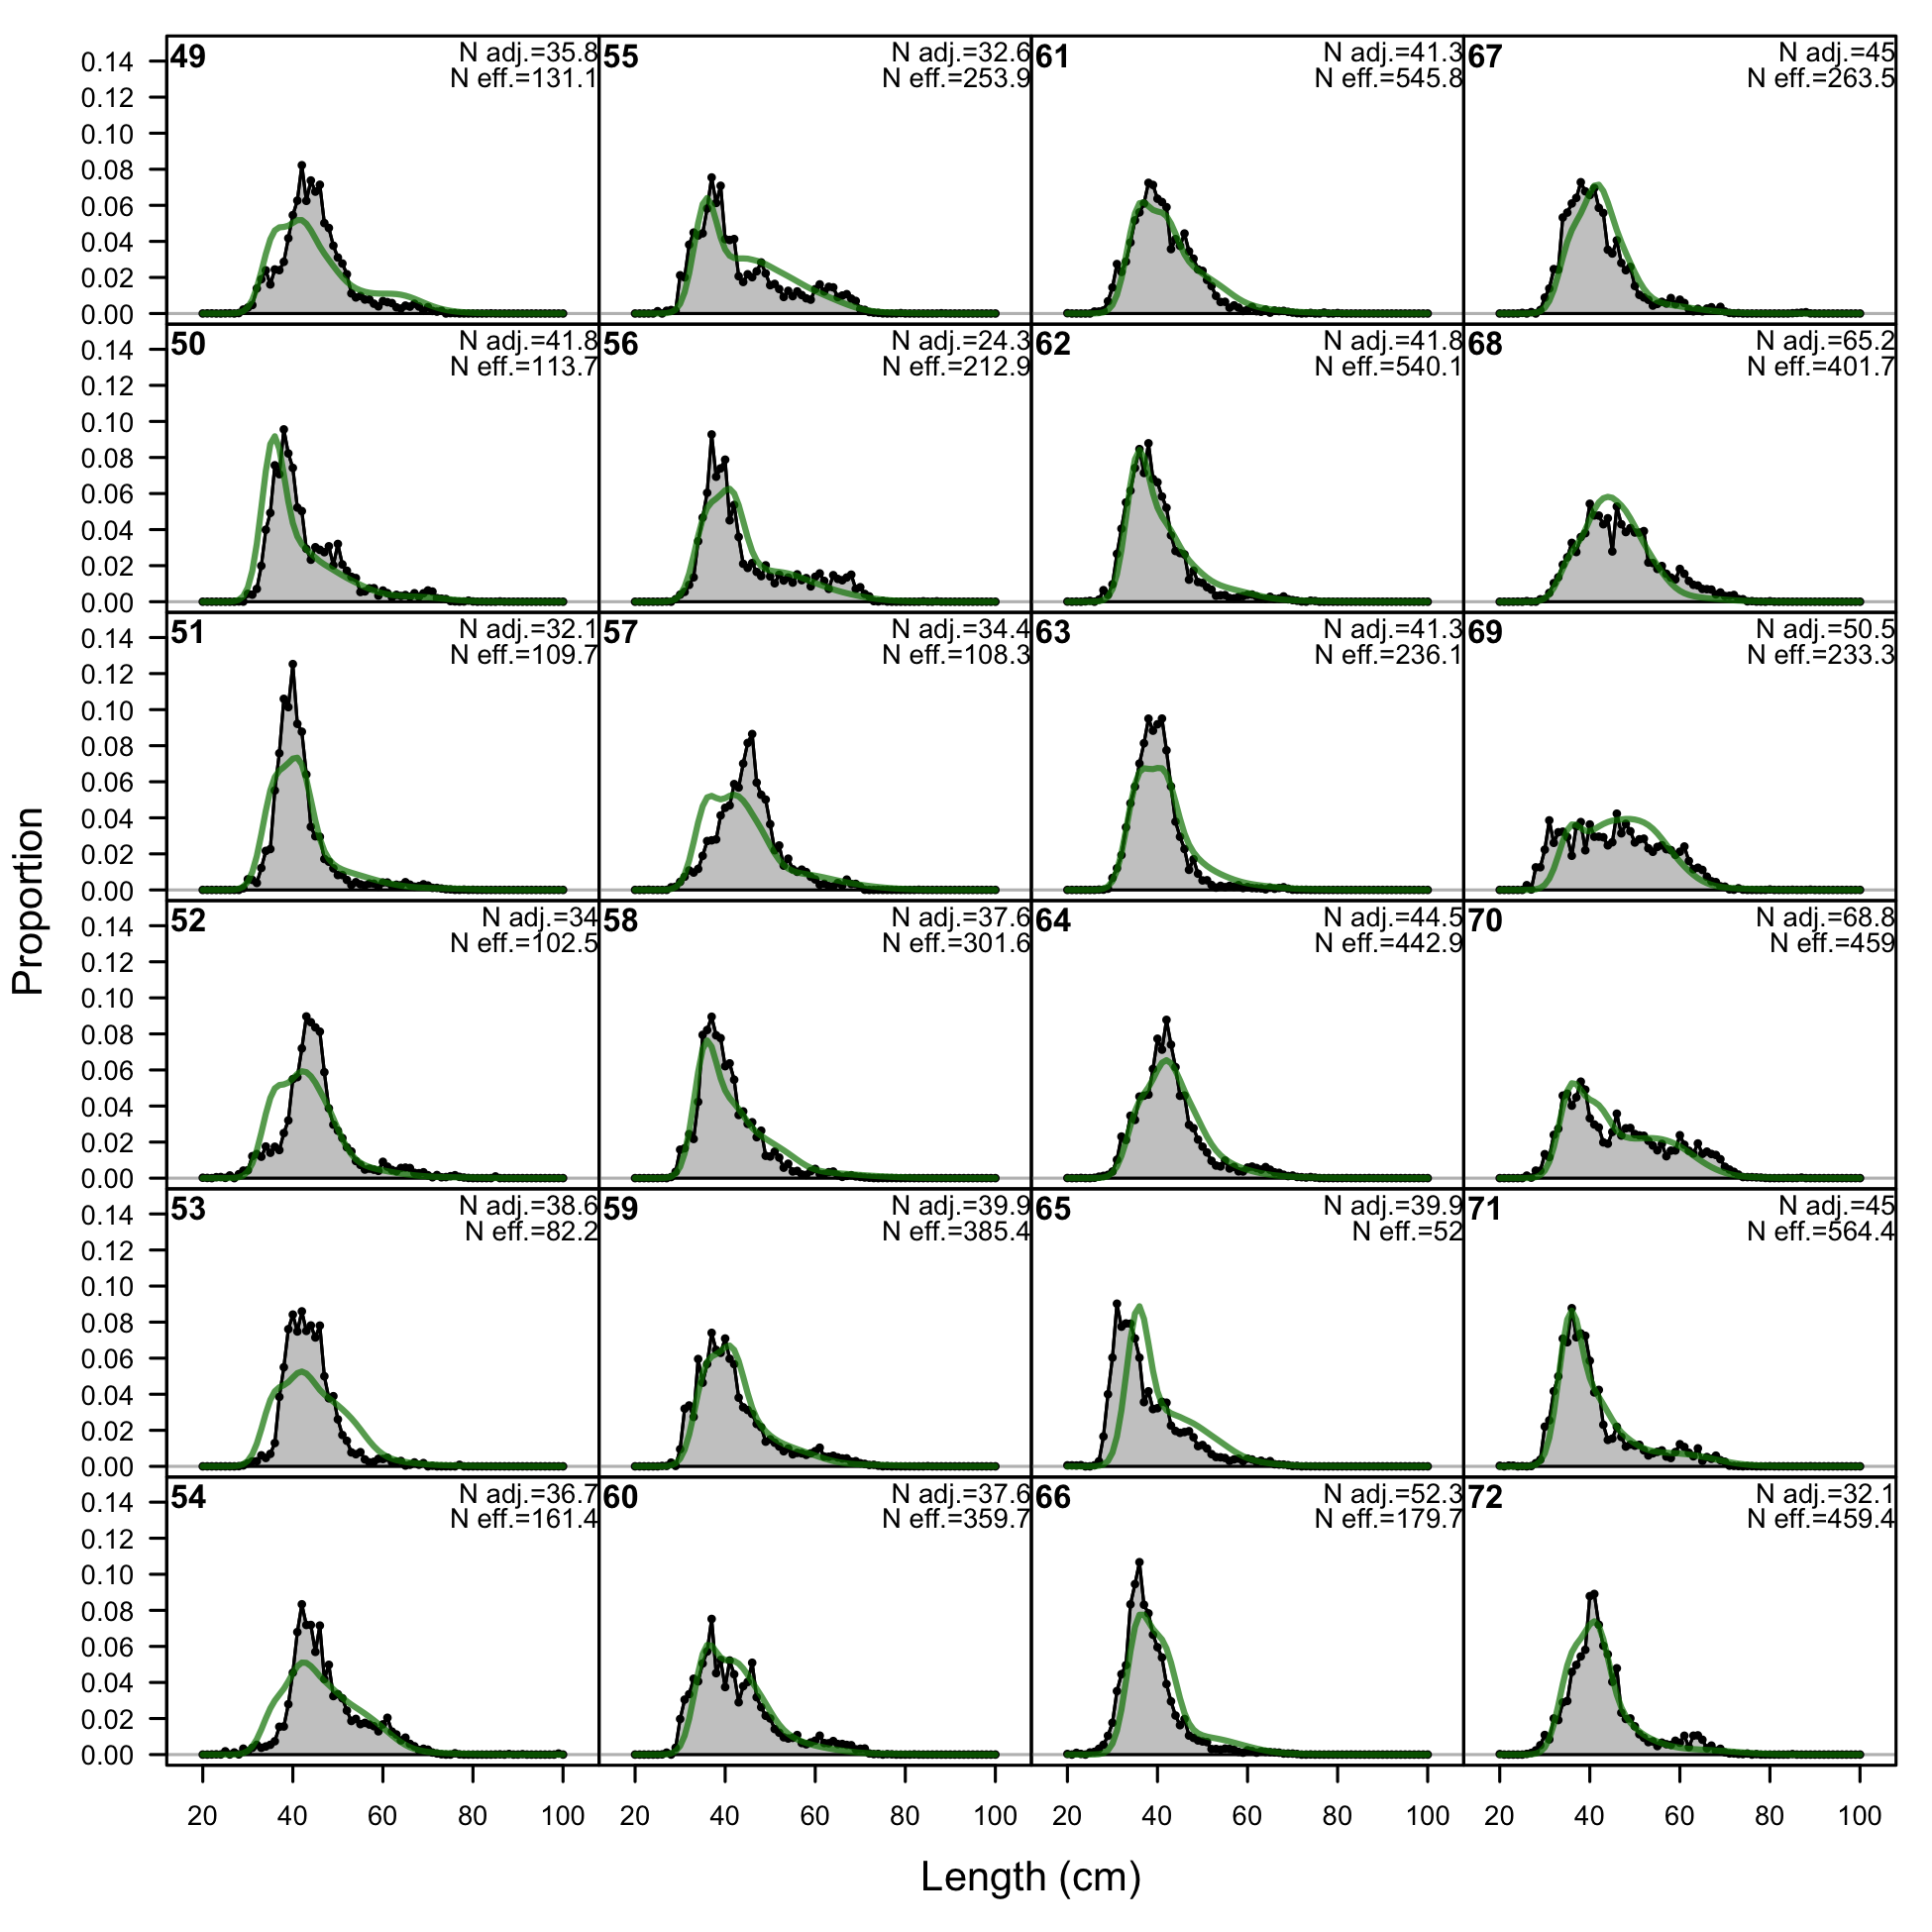
Length comps, whole catch, F14-DEL-S (plot 1 of 2).
'N adj.' is the input sample size after data-weighting adjustment. N eff. is the calculated effective sample size used in the McAllister-Ianelli tuning method. (plot 2 of 2)
file: comp_lenfit_flt14mkt0_page2.png
Pearson residuals, whole catch, F14-DEL-S (max=7.05) (plot 2 of 2)
Closed bubbles are positive residuals (observed > expected) and open bubbles are negative residuals (observed < expected).
file: comp_lenfit_residsflt14mkt0_page2.png
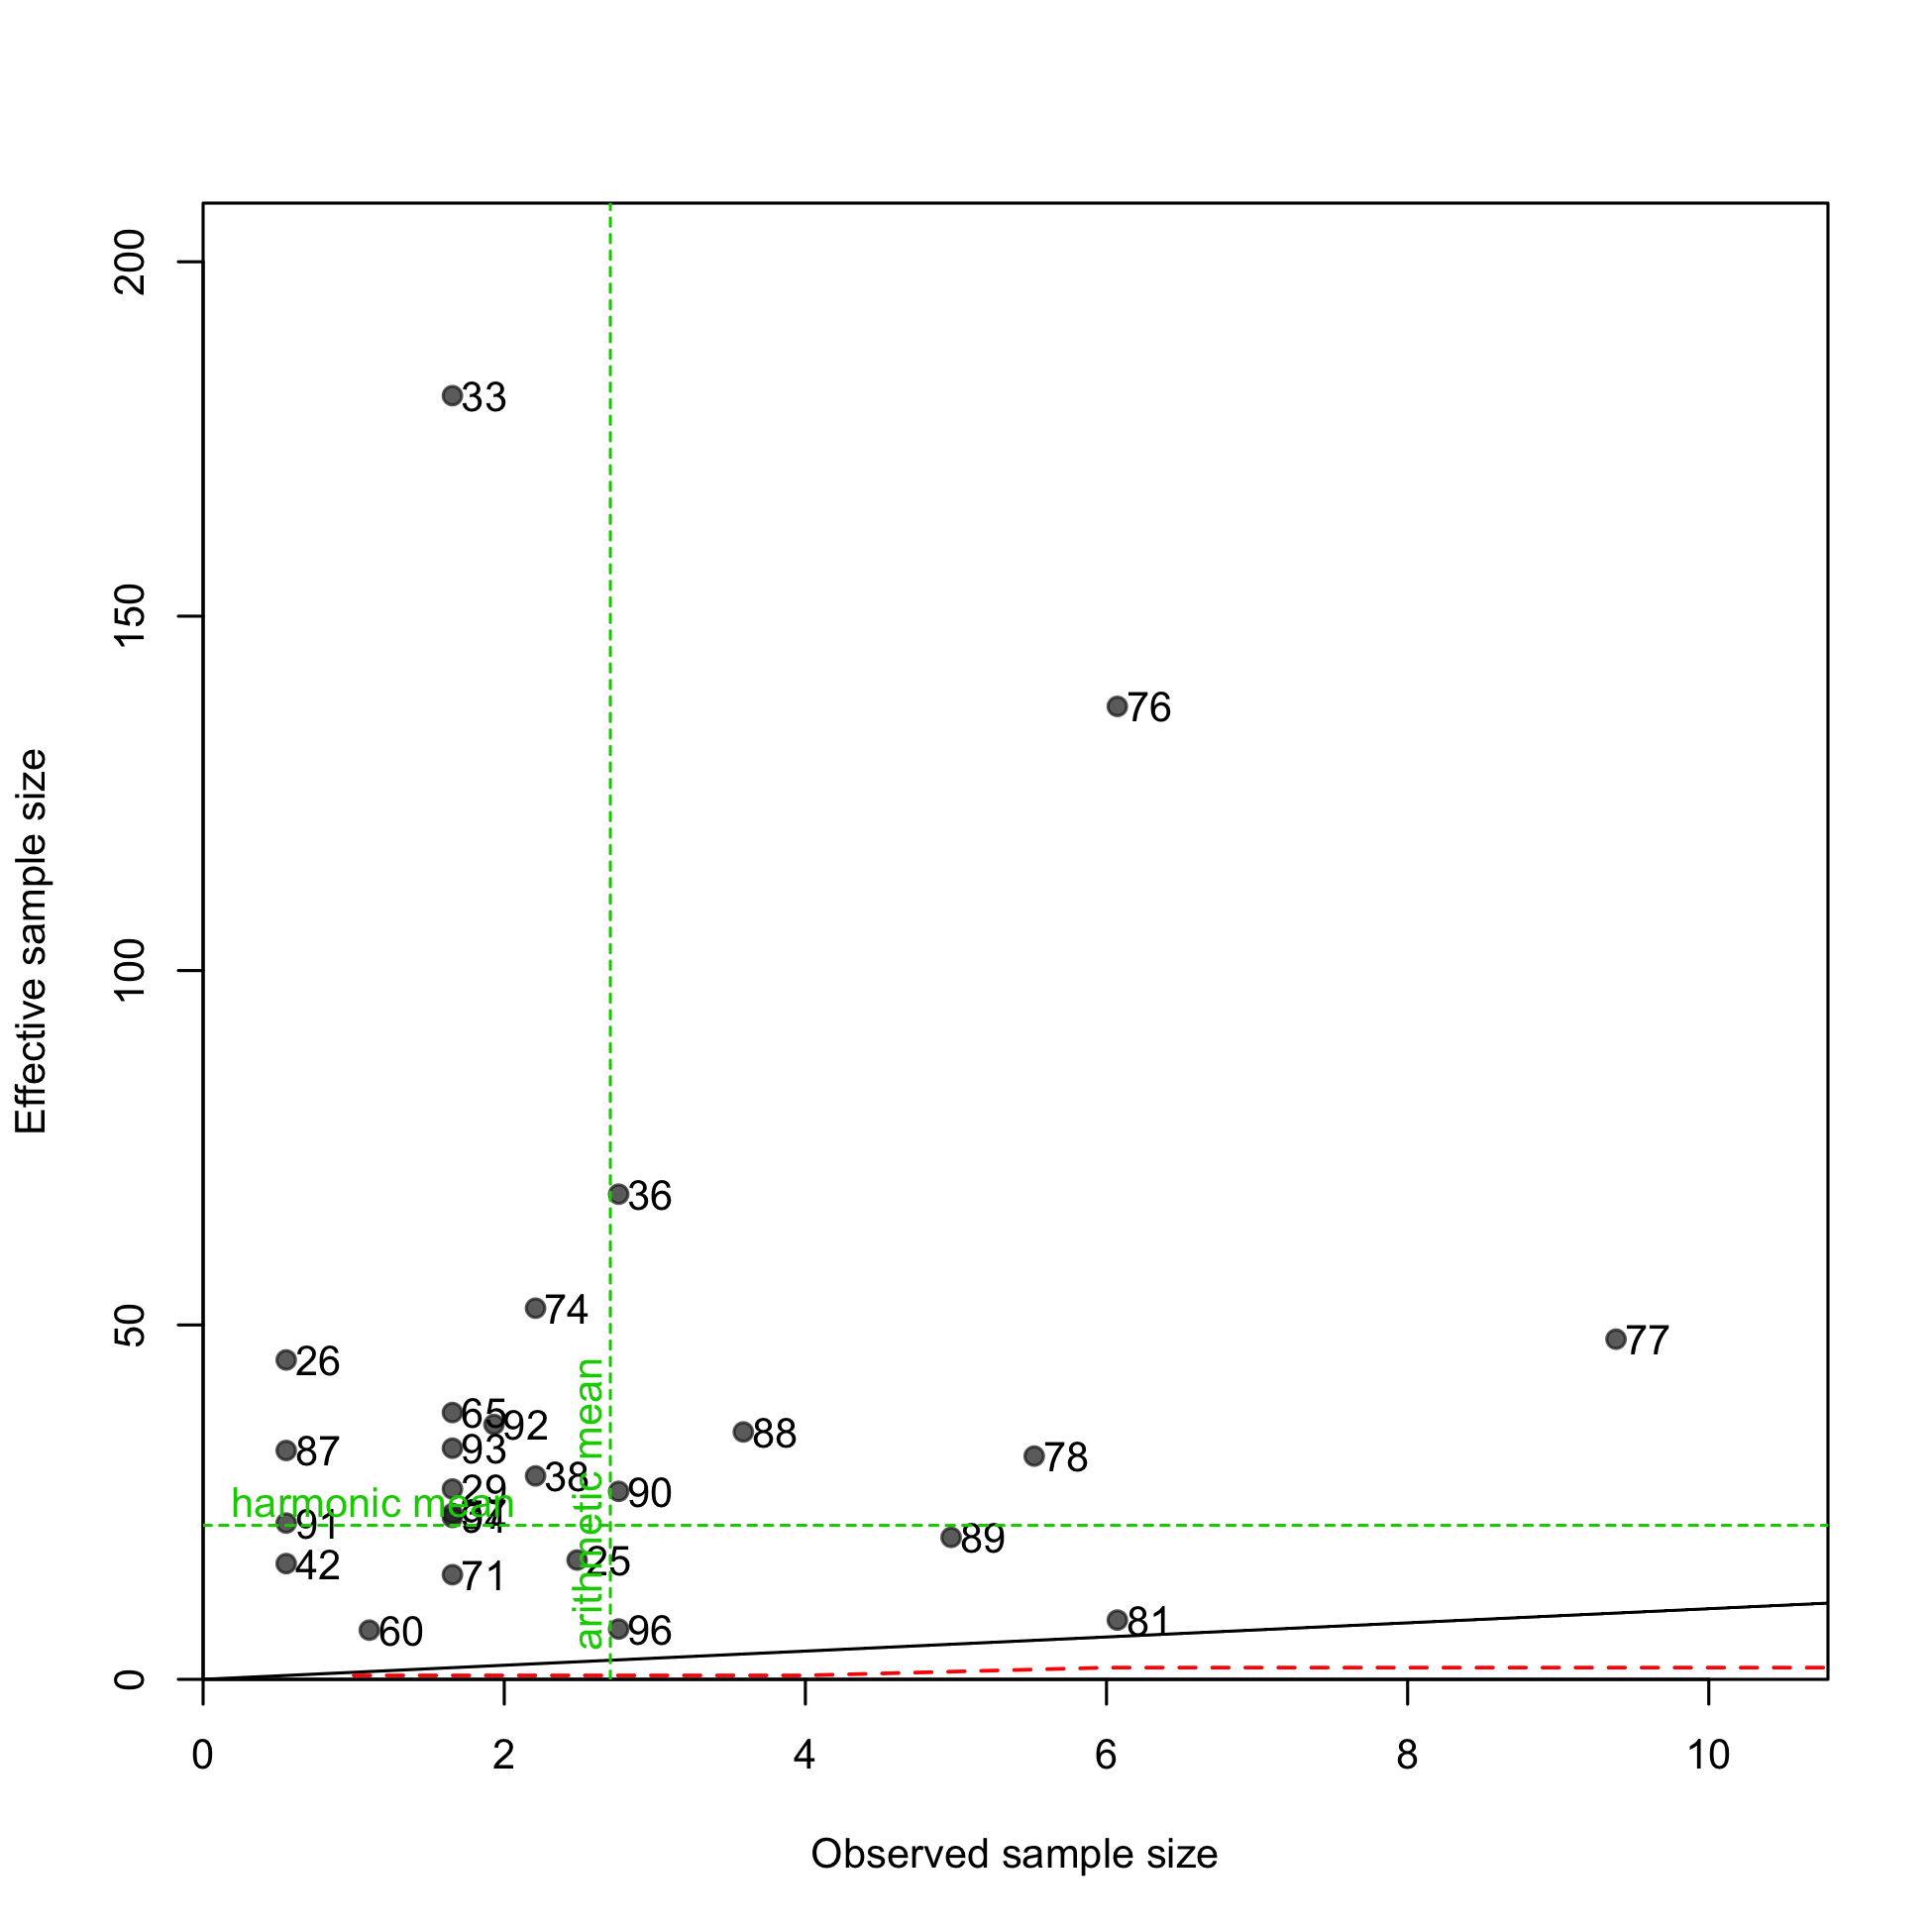
N-EffN comparison, Length comps, whole catch, F14-DEL-S
file: comp_lenfit_sampsize_flt14mkt0.png
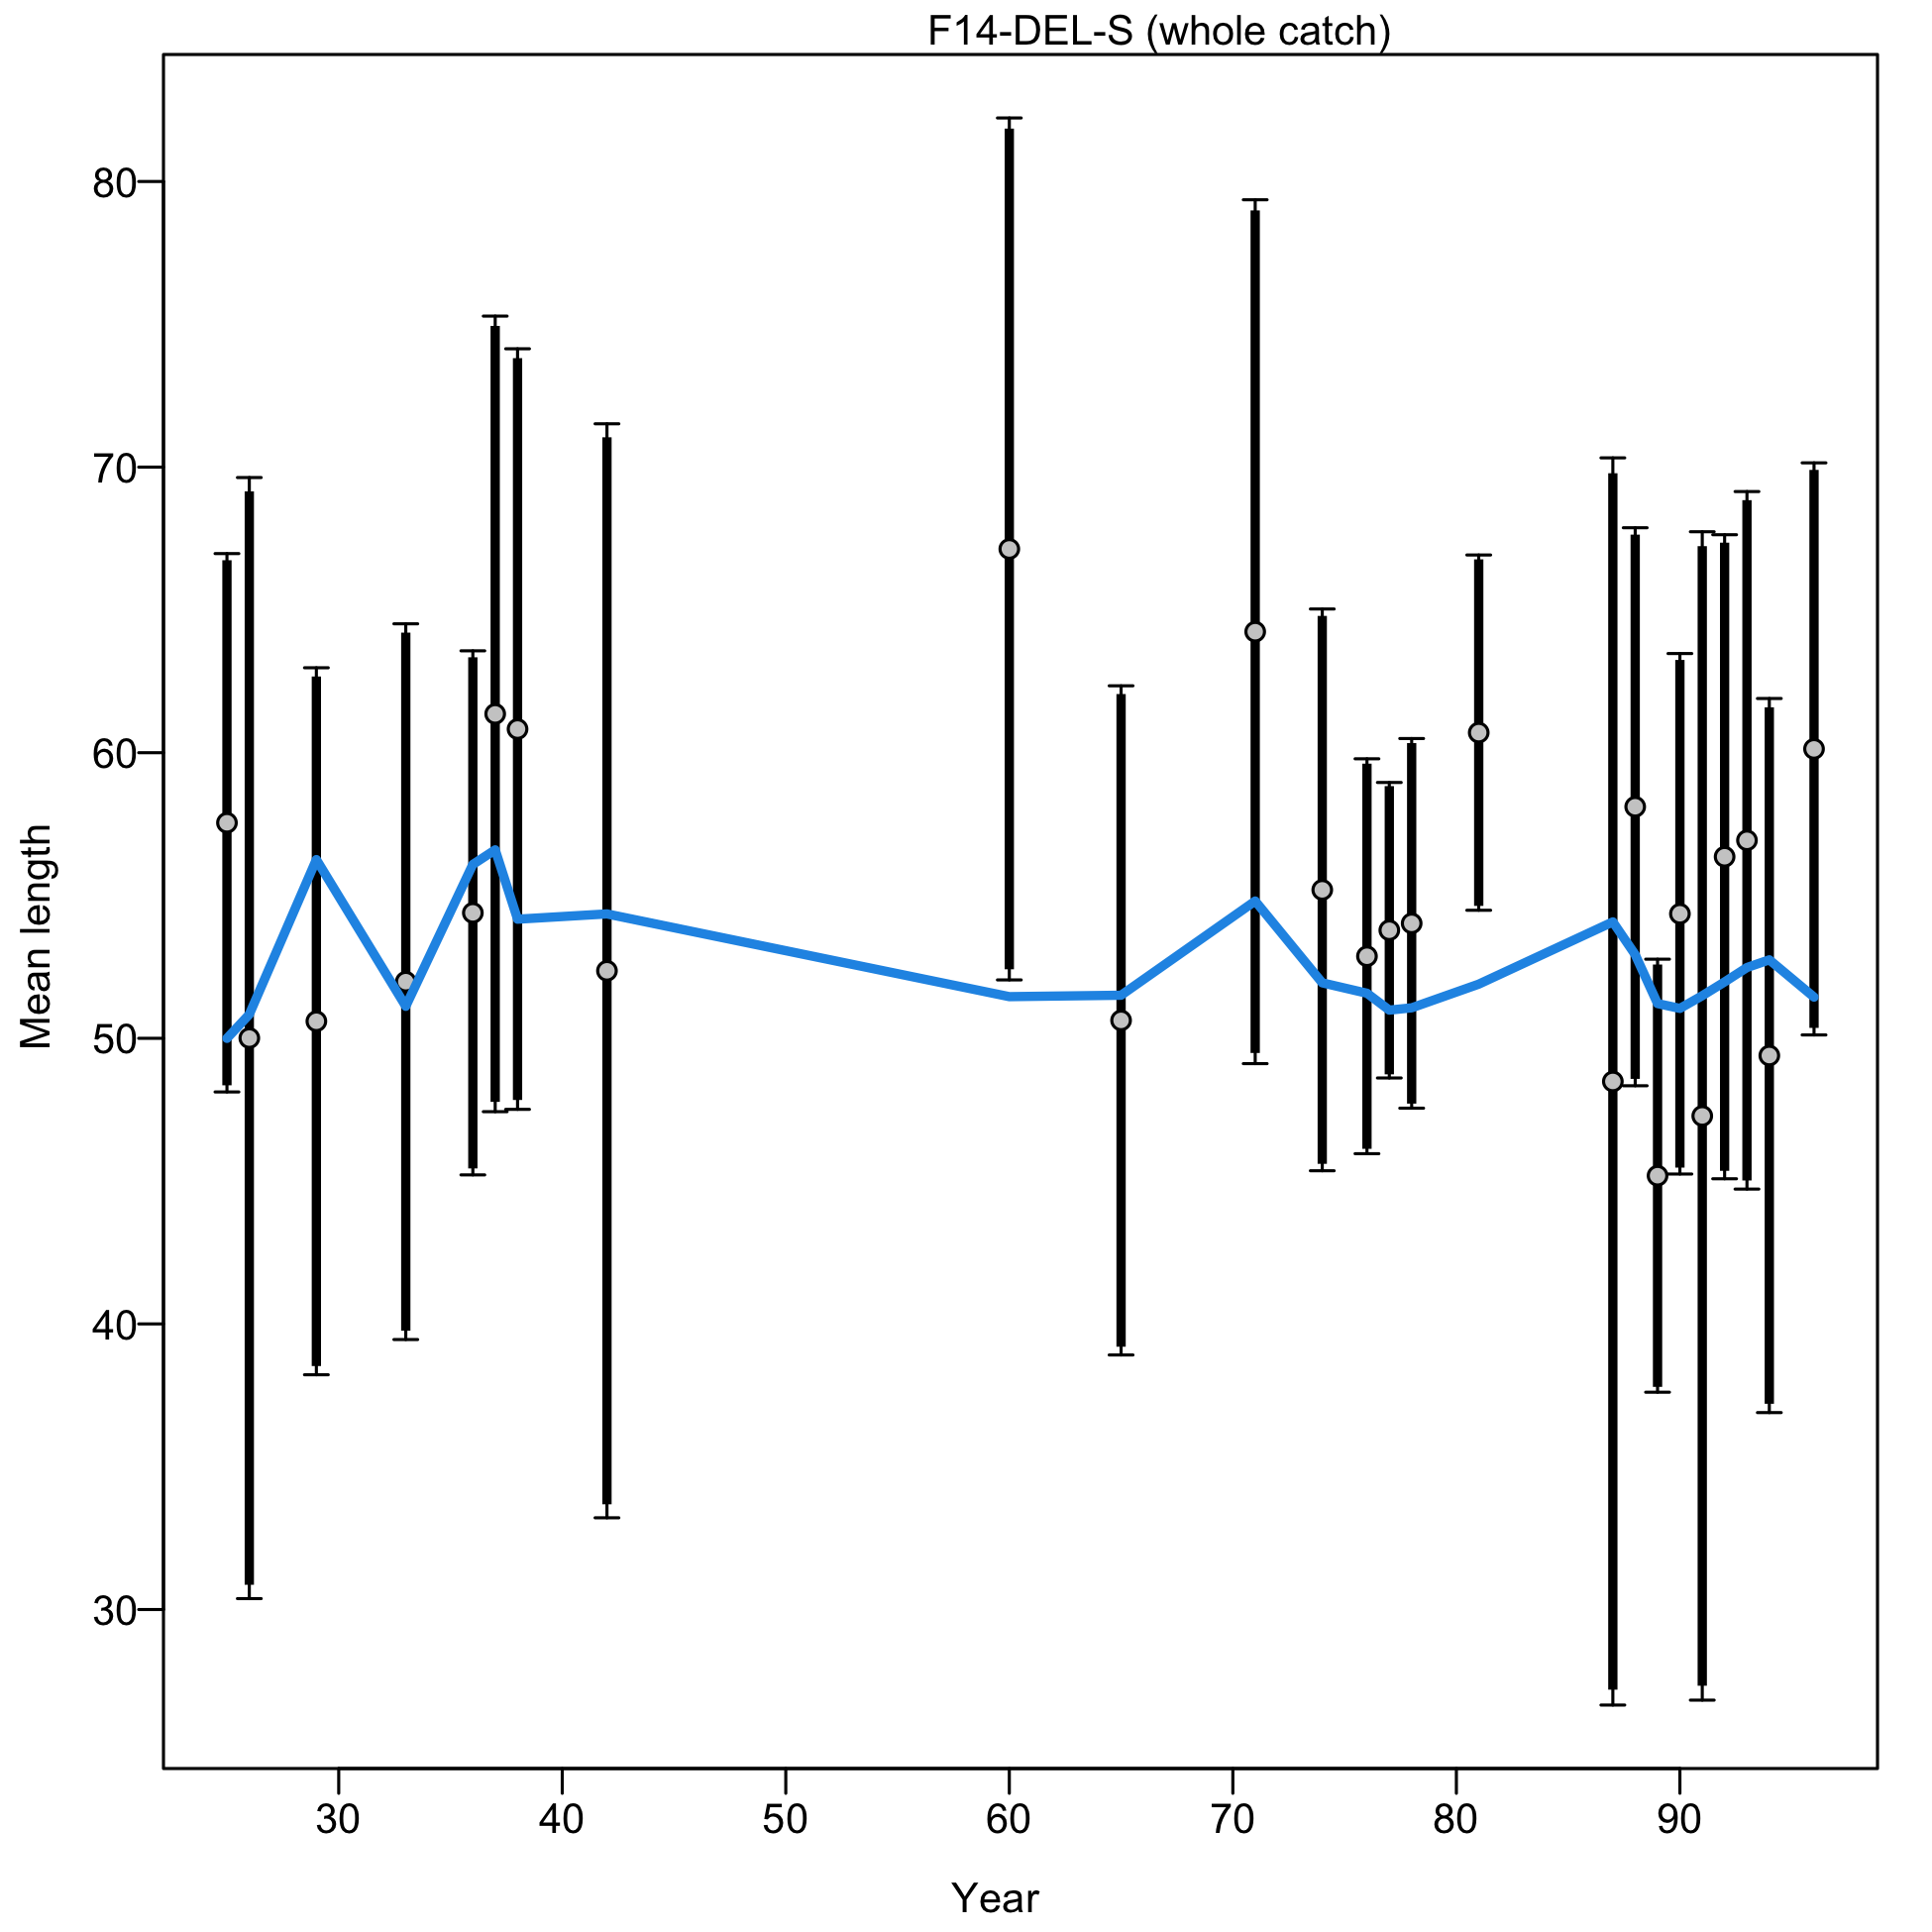
Mean length for F14-DEL-S with 95% confidence intervals based on current sample sizes.
Francis data weighting method TA1.8: thinner intervals (with capped ends) show result of further adjusting sample sizes based on suggested multiplier (with 95% interval) for len data from F14-DEL-S:
0.9513 (0.6287-1.9423)
For more info, see Francis (2011).
file: comp_lenfit_data_weighting_TA1.8_F14-DEL-S.png
Length comps, whole catch, S1-OBJ (plot 1 of 3).
'N adj.' is the input sample size after data-weighting adjustment. N eff. is the calculated effective sample size used in the McAllister-Ianelli tuning method.
file: comp_lenfit_flt17mkt0_page1.png
Length comps, whole catch, S1-OBJ (plot 1 of 3).
'N adj.' is the input sample size after data-weighting adjustment. N eff. is the calculated effective sample size used in the McAllister-Ianelli tuning method. (plot 2 of 3)
file: comp_lenfit_flt17mkt0_page2.png
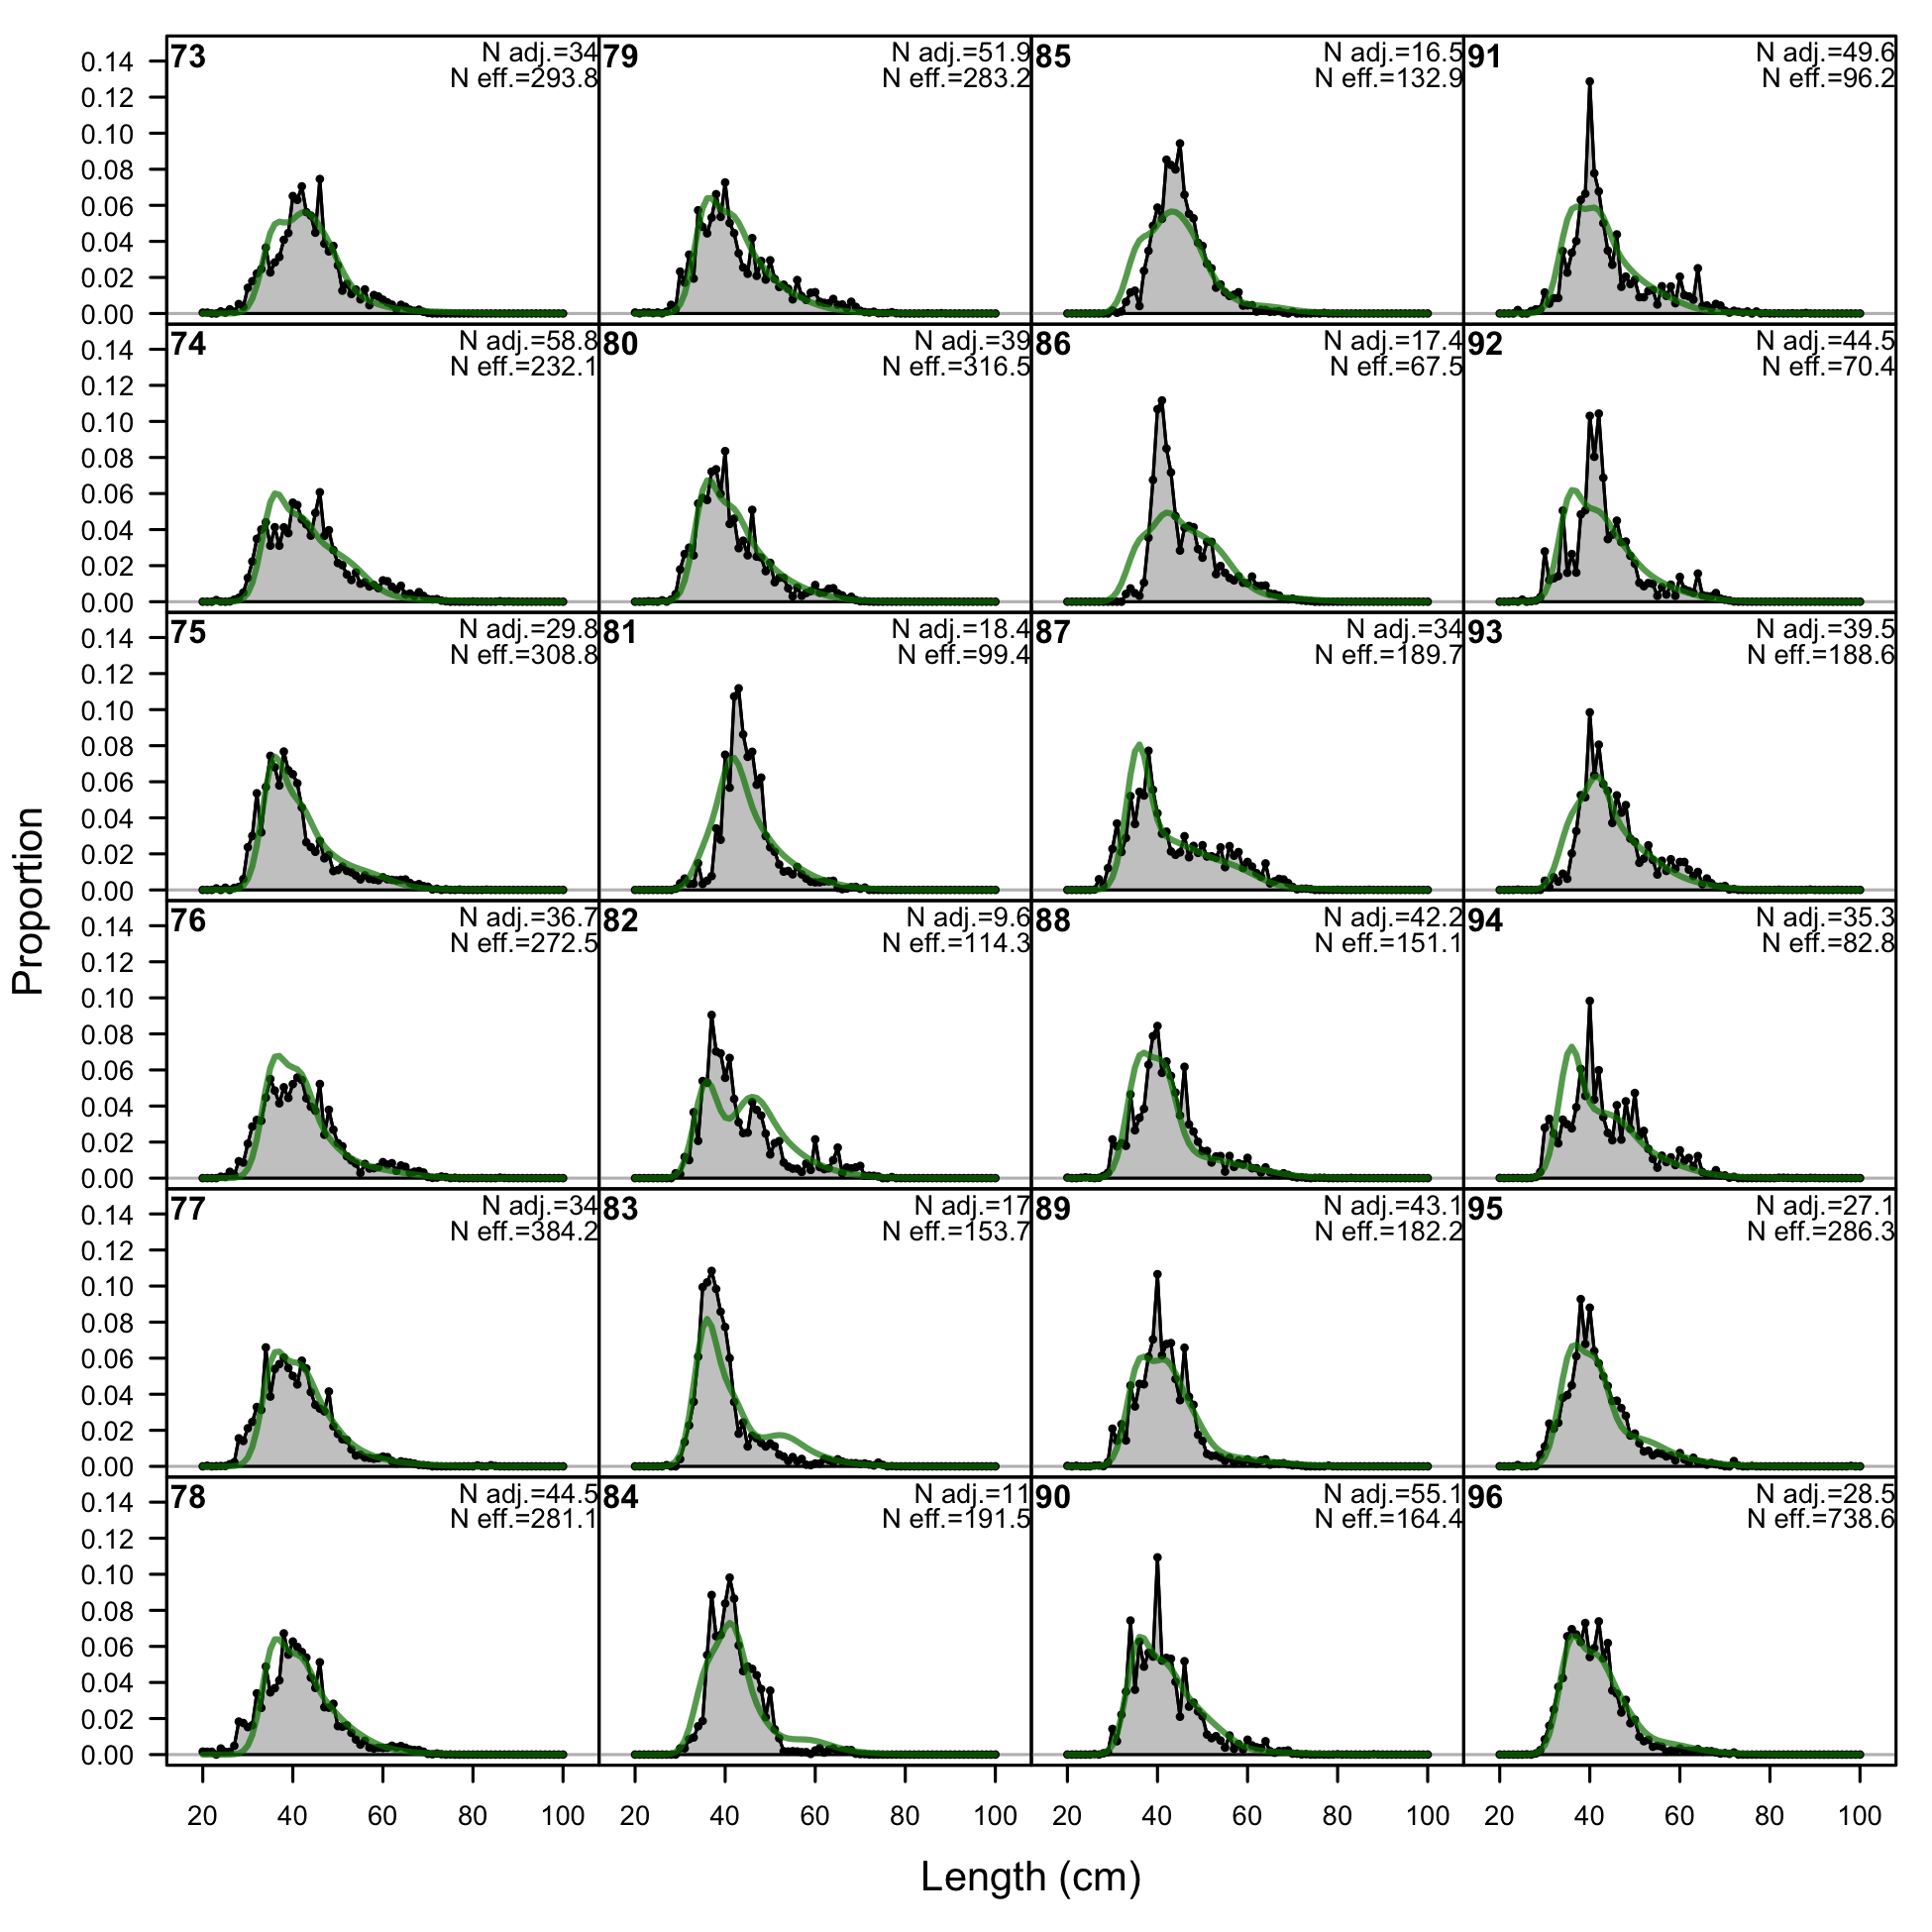
Length comps, whole catch, S1-OBJ (plot 1 of 3).
'N adj.' is the input sample size after data-weighting adjustment. N eff. is the calculated effective sample size used in the McAllister-Ianelli tuning method. (plot 2 of 3) (plot 3 of 3)
file: comp_lenfit_flt17mkt0_page3.png
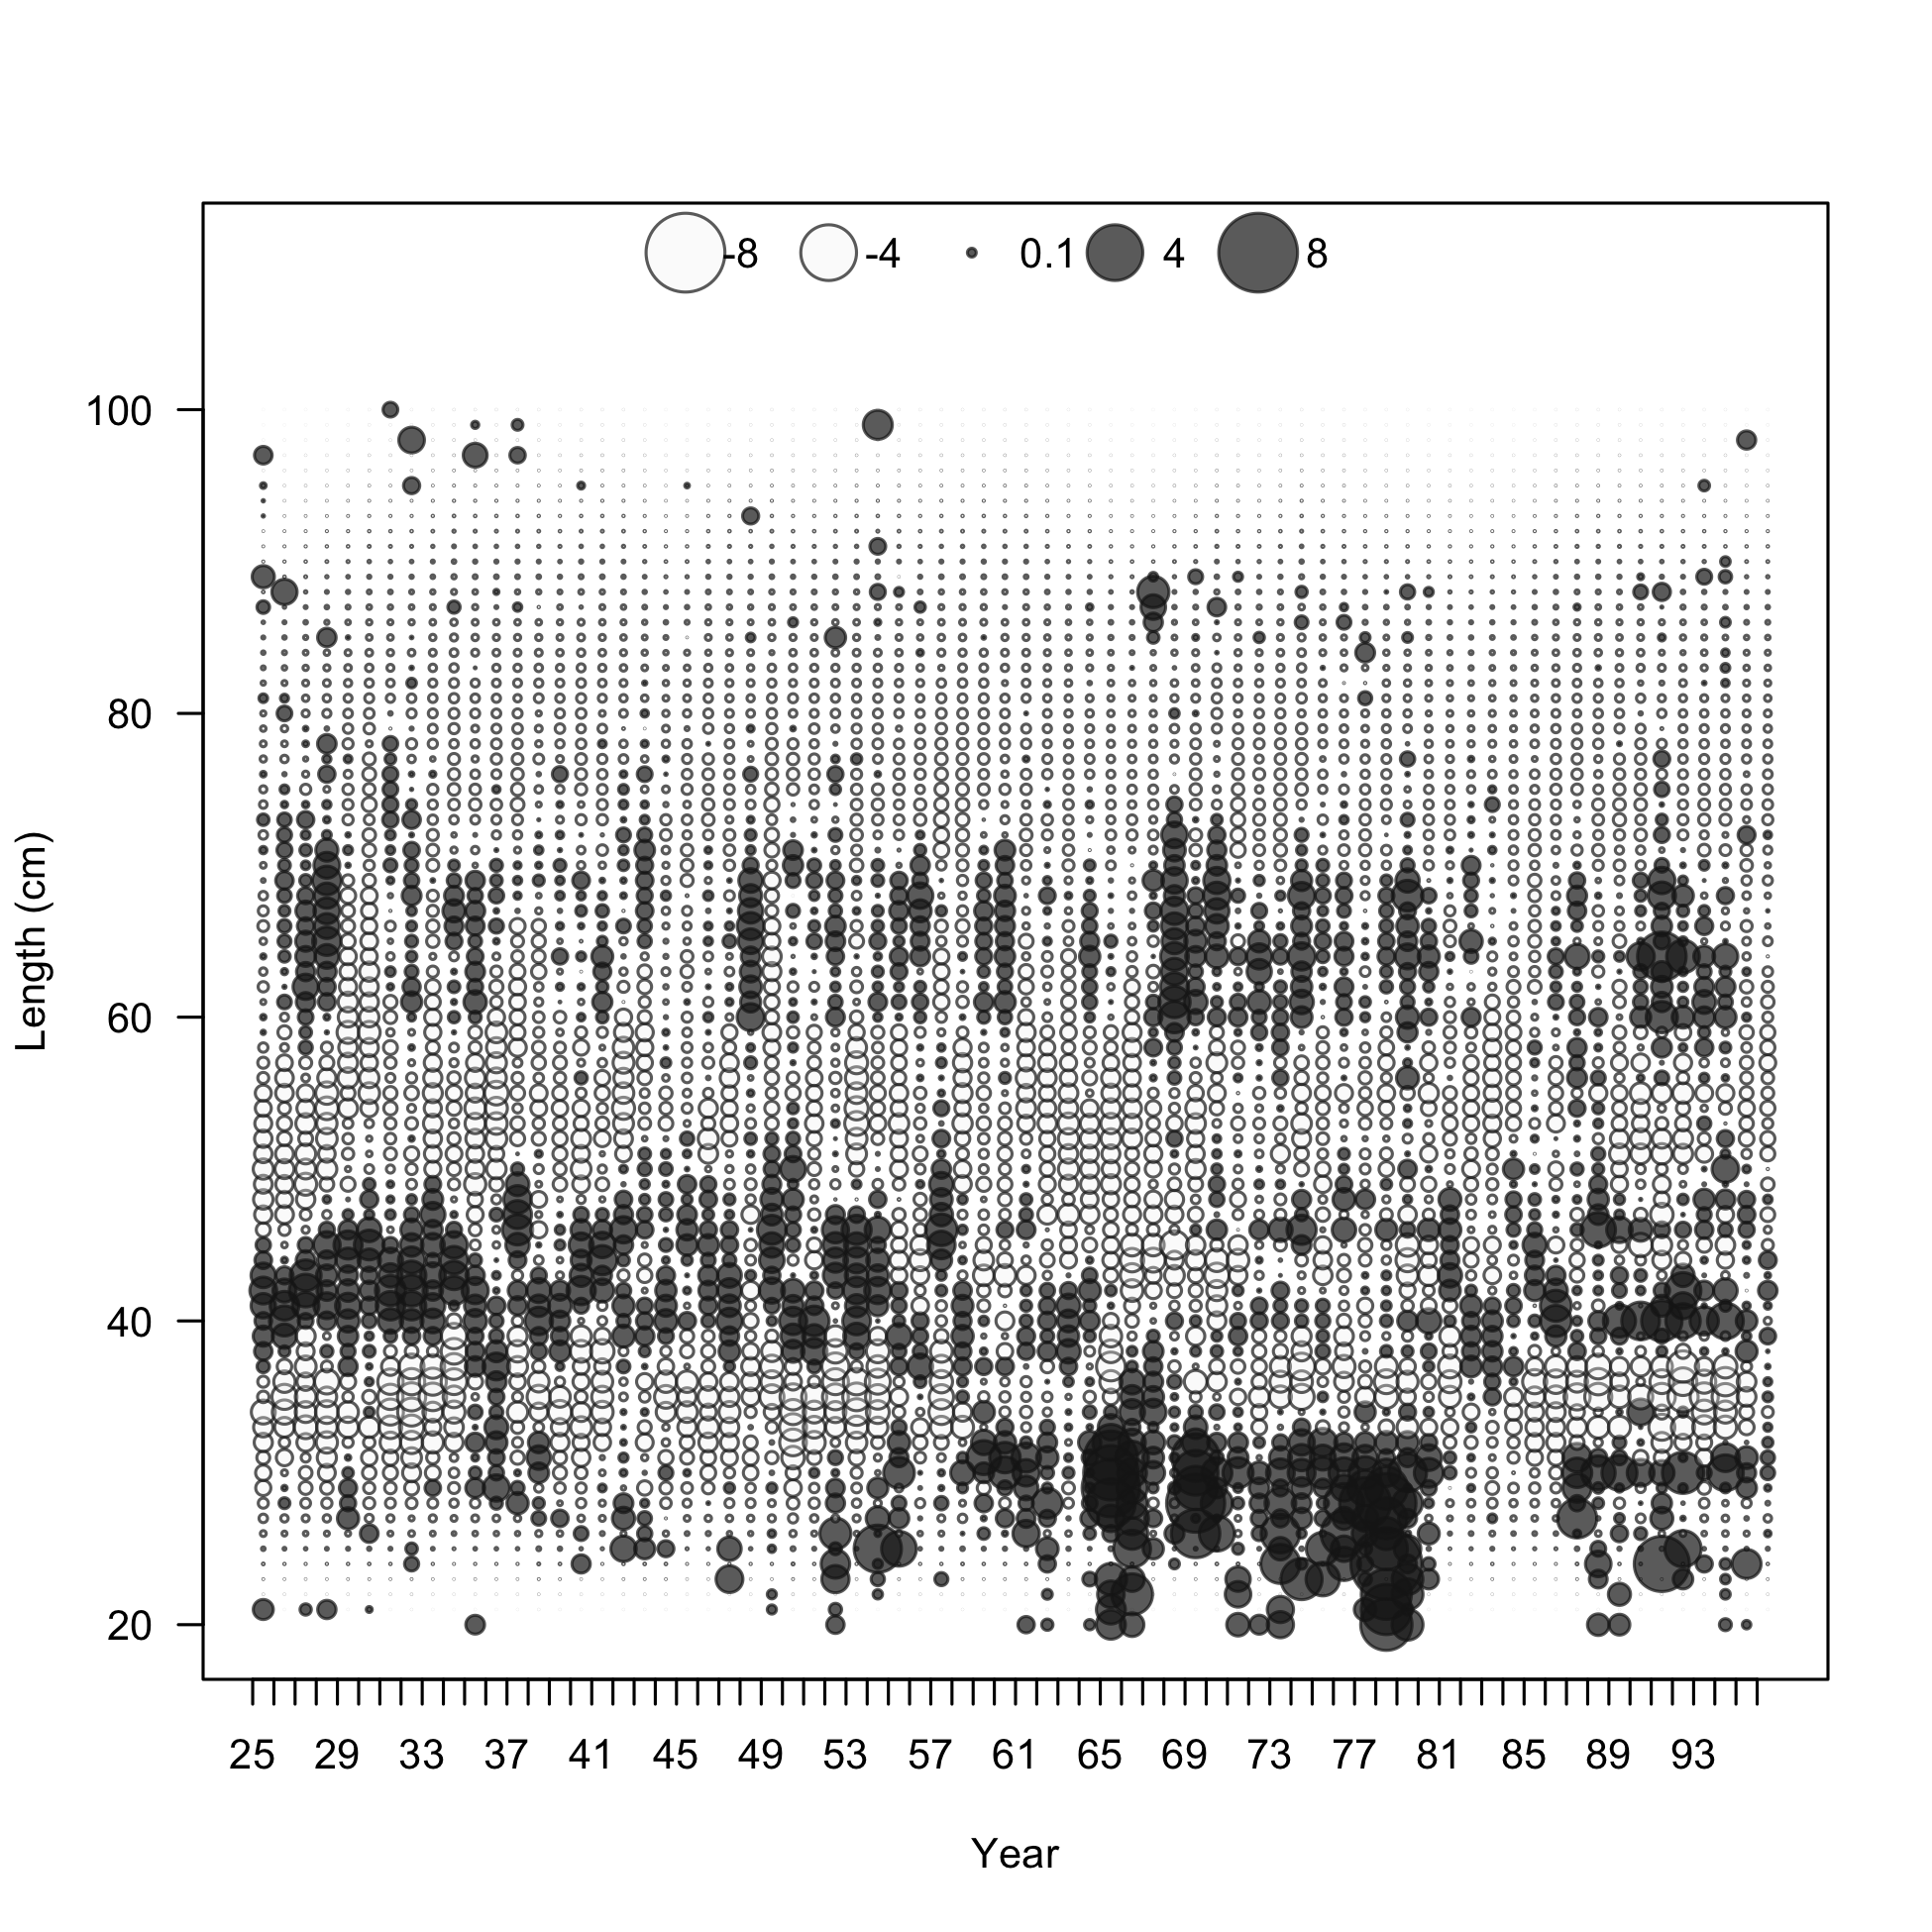
Pearson residuals, whole catch, S1-OBJ (max=6.53) (plot 3 of 3)
Closed bubbles are positive residuals (observed > expected) and open bubbles are negative residuals (observed < expected).
file: comp_lenfit_residsflt17mkt0_page3.png
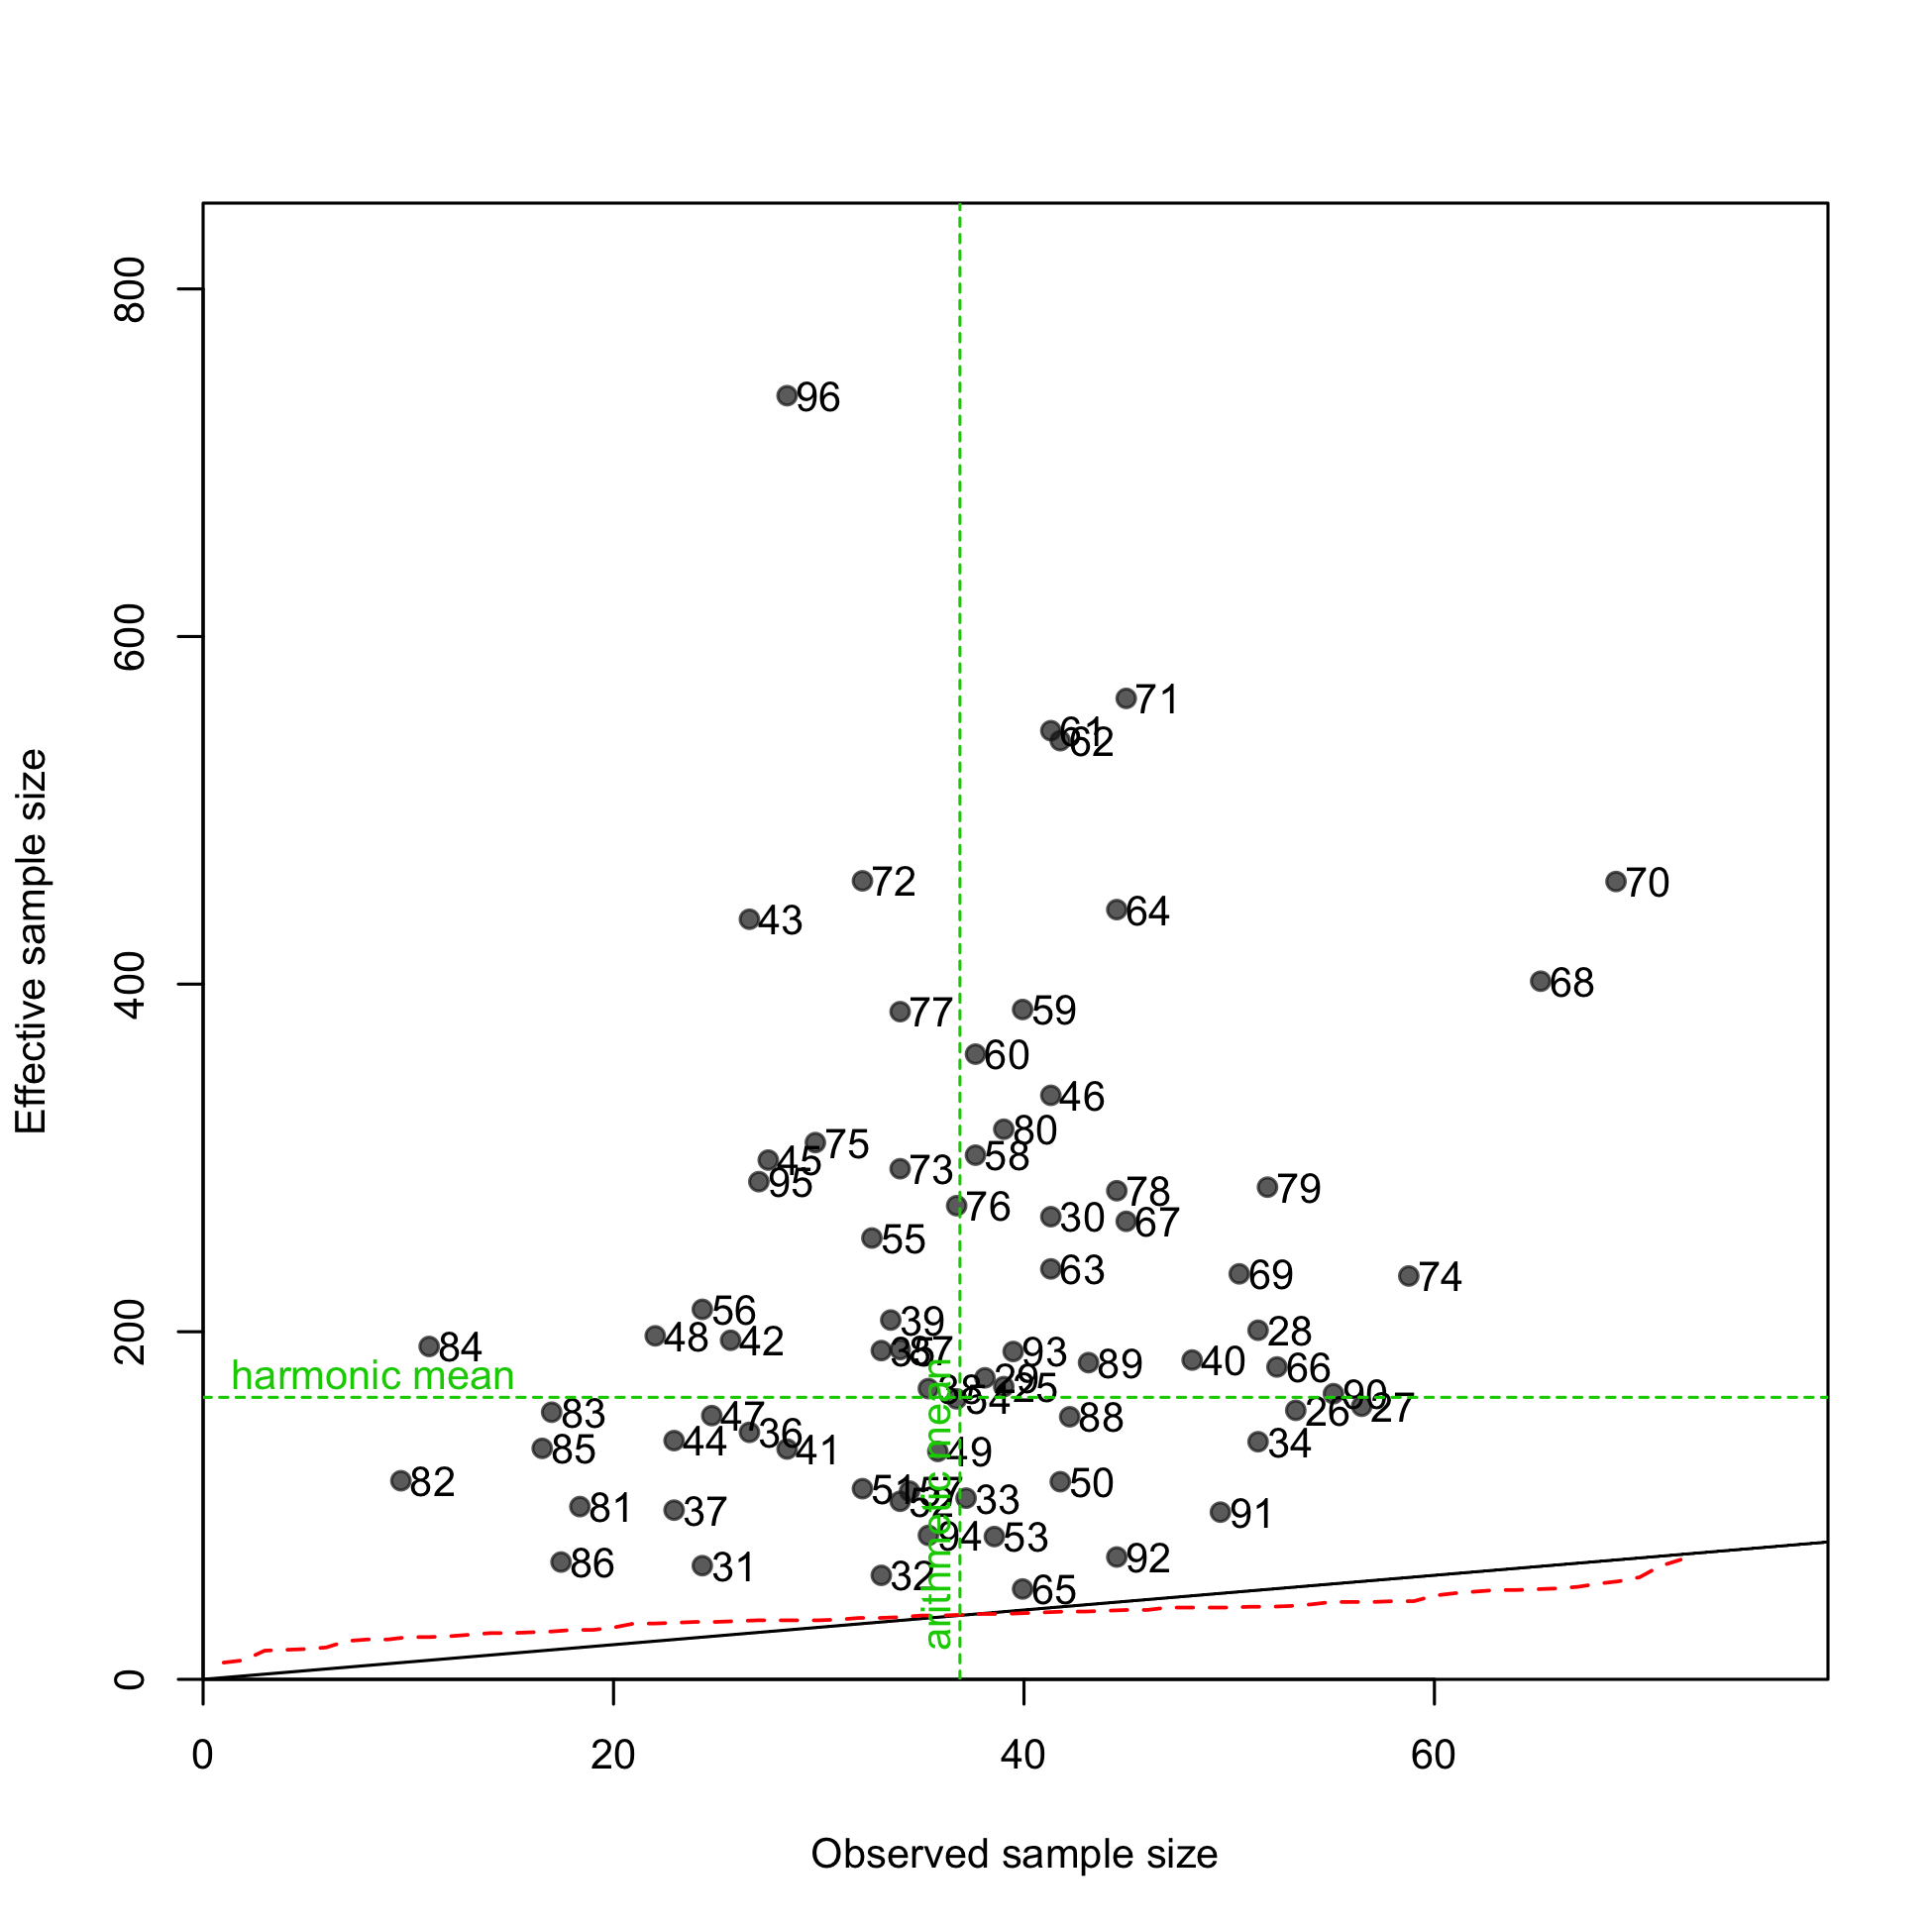
N-EffN comparison, Length comps, whole catch, S1-OBJ
file: comp_lenfit_sampsize_flt17mkt0.png
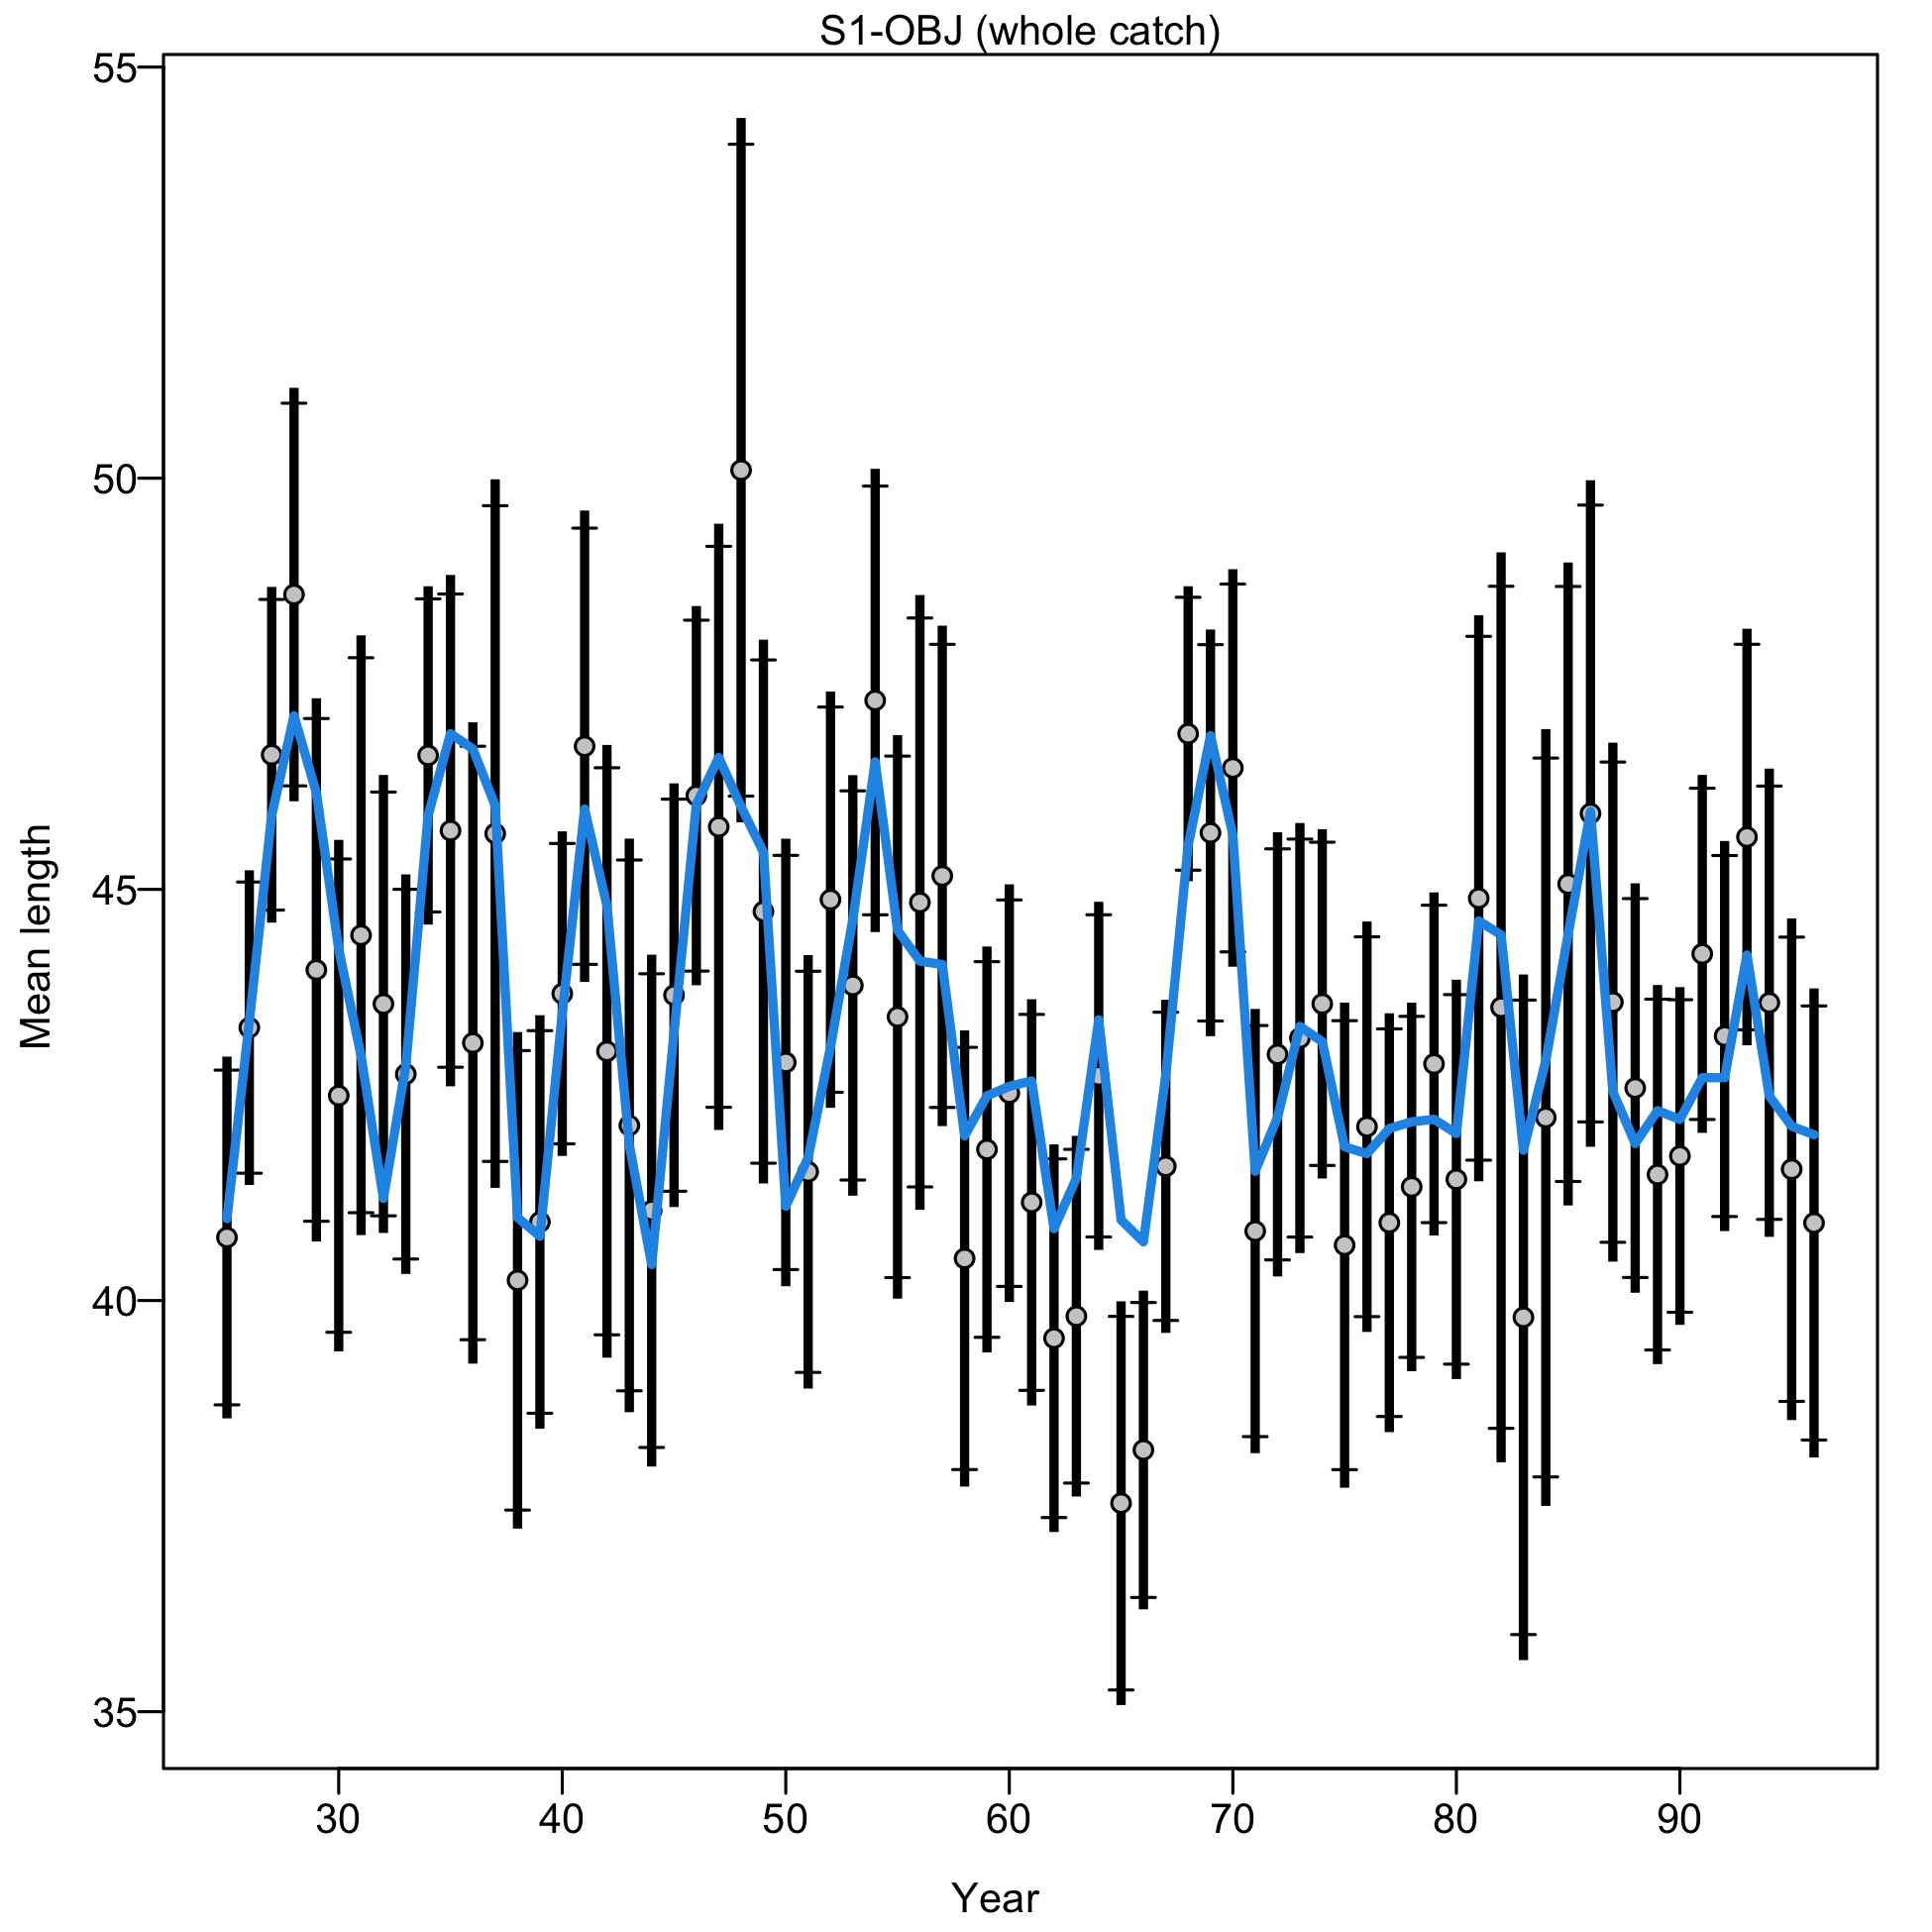
Mean length for S1-OBJ with 95% confidence intervals based on current sample sizes.
Francis data weighting method TA1.8: thinner intervals (with capped ends) show result of further adjusting sample sizes based on suggested multiplier (with 95% interval) for len data from S1-OBJ:
1.1677 (0.8366-1.7542)
For more info, see Francis (2011).
file: comp_lenfit_data_weighting_TA1.8_S1-OBJ.png
Length comps, whole catch, S2-NOA (plot 1 of 3).
'N adj.' is the input sample size after data-weighting adjustment. N eff. is the calculated effective sample size used in the McAllister-Ianelli tuning method.
file: comp_lenfit_flt18mkt0_page1.png
Length comps, whole catch, S2-NOA (plot 1 of 3).
'N adj.' is the input sample size after data-weighting adjustment. N eff. is the calculated effective sample size used in the McAllister-Ianelli tuning method. (plot 2 of 3)
file: comp_lenfit_flt18mkt0_page2.png
Length comps, whole catch, S2-NOA (plot 1 of 3).
'N adj.' is the input sample size after data-weighting adjustment. N eff. is the calculated effective sample size used in the McAllister-Ianelli tuning method. (plot 2 of 3) (plot 3 of 3)
file: comp_lenfit_flt18mkt0_page3.png
Pearson residuals, whole catch, S2-NOA (max=3) (plot 3 of 3)
Closed bubbles are positive residuals (observed > expected) and open bubbles are negative residuals (observed < expected).
file: comp_lenfit_residsflt18mkt0_page3.png
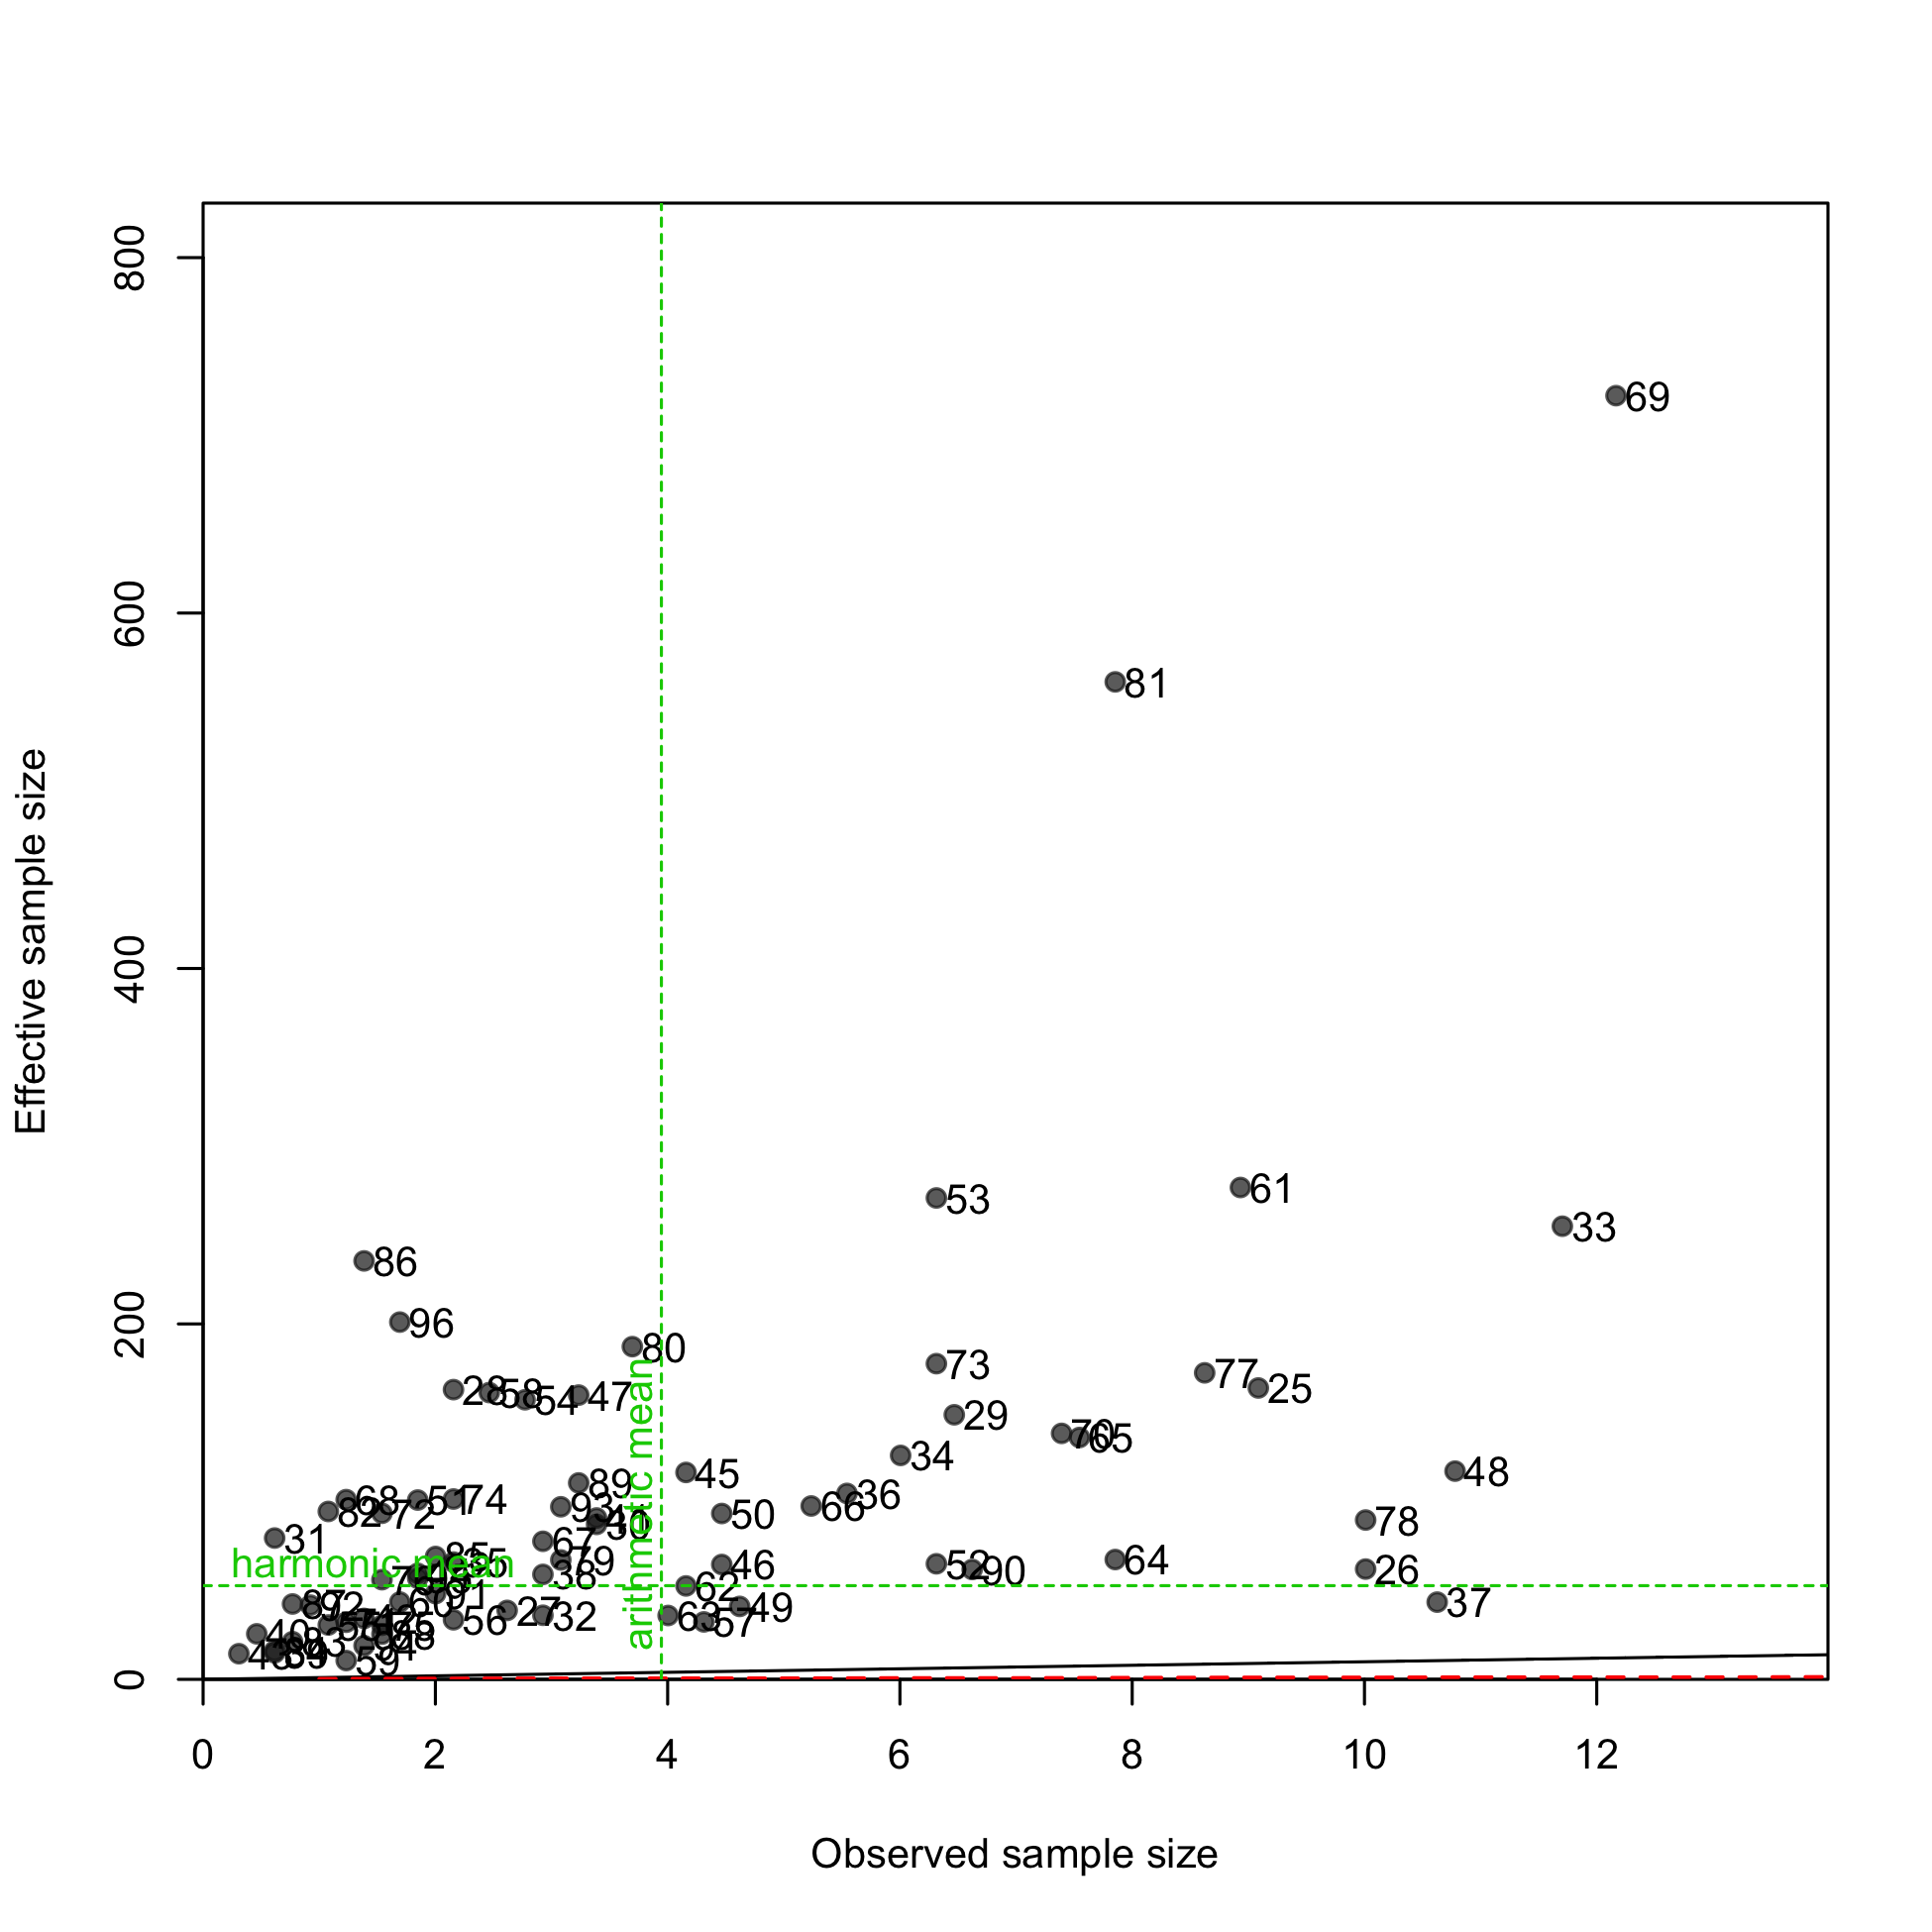
N-EffN comparison, Length comps, whole catch, S2-NOA
file: comp_lenfit_sampsize_flt18mkt0.png
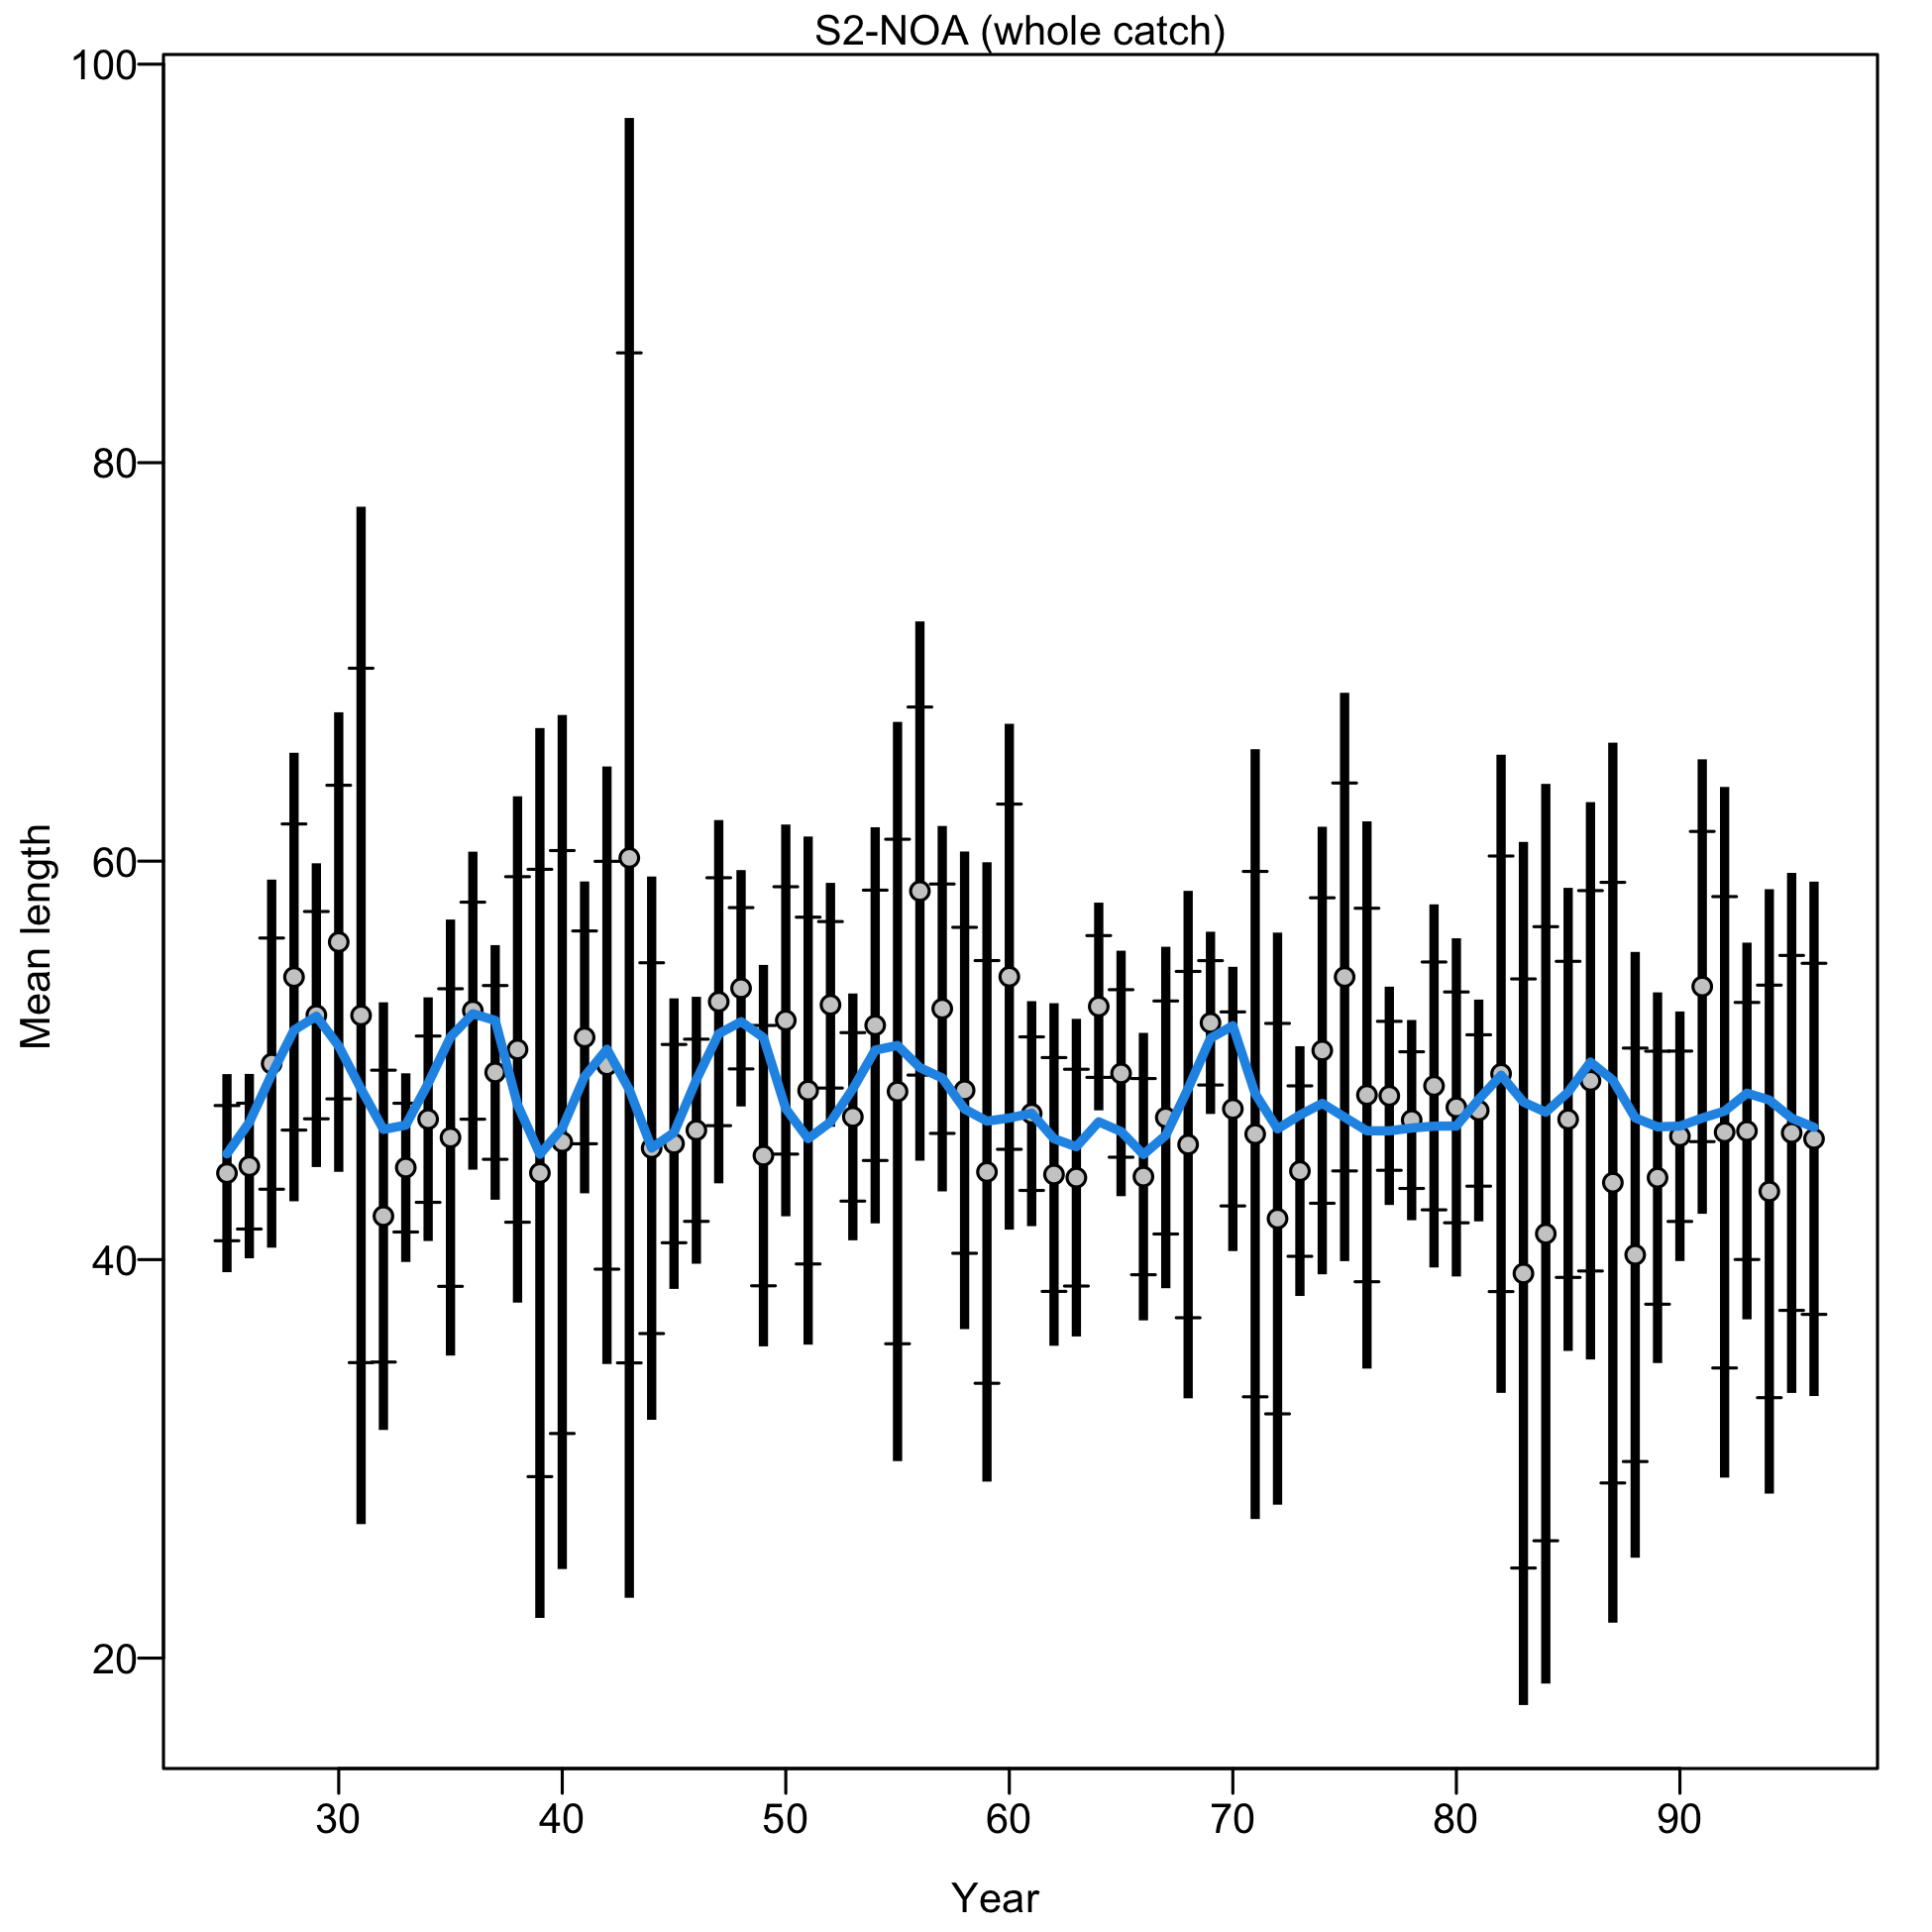
Mean length for S2-NOA with 95% confidence intervals based on current sample sizes.
Francis data weighting method TA1.8: thinner intervals (with capped ends) show result of further adjusting sample sizes based on suggested multiplier (with 95% interval) for len data from S2-NOA:
2.1467 (1.4881-3.3393)
For more info, see Francis (2011).
file: comp_lenfit_data_weighting_TA1.8_S2-NOA.png